Embed Size (px)
Citation preview
One-step holographic grating inscription in polymers
Simon Kibbena, Michael Koerdta, Javier Garcia-Monrealb, Stanislav A. Kolpakovb, Steve
Darenc, Faina Solomon-Tsvetkovc, Thomas Seefelda, Frank Vollertsena
aBIAS - Bremer Institut fuer angewandte Strahltechnik, Klagenfurter Strasse 2, Bremen,
Germany;bUniversitat de Valencia - Departamento de Optica, Calle Doctor Moliner 50, Burjassot, Spain;
cDaren Laboratories and Scientific Consultant, Hamazmerah 13, Ness-Ziona, Israel
ABSTRACT
Volume holographic gratings have recently attracted interest as wavelength-selective devices, for applicationssuch as wavelength stabilizers for laser diode sources. These thick gratings are usually produced using variousphotosensitive materials like photo-thermo-refractive glass and specially prepared polymers. These materialsoften require two or more process steps for production of volume holographic gratings. In this study severalcopolymers with MethylMethAcrylate as base material with different crosslinkers and initiators are compared.Unlike commercially available PMMA, the polymers have a glass transition temperature up to 155 ◦C, whichenables the use on higher laser powers. The refractive index of the polymer is modified using 325-nm radiation.The polymers were not sensitized by peroxidation prior to irradiation, and after the irradiation process, nodevelopment was needed. A refractive index change is expected to be due to the repolymerisation of residualmonomers. The gratings were recorded with both a Lloyd mirror setup and the well-known phase mask method.The gratings produced have a calculated refractive index variation in the range of 10−5. The reflection character-istics were measured with a modified Michelson Interferometer and a tunable laser source. Volume holographicgratings with extremely narrow bandwidth and angular selectivity can be produced on some of the polymers.The production cost of the gratings is low and they can be used for multiple applications such as wavelengthtuning and wavelength selection of diode lasers at high power levels.
Keywords: volume holographic grating, PMMA, HeCd-Laser,
1. INTRODUCTION
For many years, numerous publications have dealt with holographic diffraction gratings, and these gratings haverecently attracted interest because of their applications, e.g. fine-tuning of the emitted wavelength of a laserdiode, spectral beam combining of laser diodes with little shift in their wavelengths etc. The gratings alsoare usable as free-space optical components for wavelength division multiplexing and related applications intelecommunication technologies.
Usually these gratings are produced in Photo-Thermo-Refractive glass (PTR), a special composition of silicateglass with silver, cerium and other elements. These glasses normally are illuminated with coherent UV-radiationforming an interference pattern inside the PTR glass.1 The UV-photons indirectly lead to the conversion ofthe silver ions to neutral atoms, comparable to the processes in classical photograph films. By this method, arefractive index modulation of about 10−6 can be achieved. A development at elevated temperatures then leadsto a higher refractive index change inside the PTR glass in the range of 10−4. Due to the elevated temperatures,the silver atoms cause a structural change (crystal growth) inside the PTR glass which is responsible for thehigher refractive index difference.
With polymers, the mechanisms are different. Polymers can be modified by photons matching the bondingenergy between the atoms. Thereby the bond either is excited, or at higher energies the bond may be broken. Thiswas first shown in 1960 by Todd who demonstrated the modifiability of thin organic films using γ-rays, followed
Further author information: (Send correspondence to S. Kibben, M. Koerdt)S. Kibben: E-mail: [email protected], Telephone: +49 (0) 421 218 5066M. Koerdt: E-mail: [email protected], Telephone: +49 (0) 421 218 5044
by Rao, who used x-rays.2, 3 Five years later, Tomlinson et al. published some results where they presented amodification of the refractive index of ∆n = 3 · 10−3 with the UV-laserline of a HeCd laser (λ = 325 nm).4
These refractive index changes only occured in PMMA-samples where the monomers were peroxidised priorto polymerization, and an annealing procedure (≈ 100 ◦C) of the polymer made it impossible to subsequentlymodify the polymers refractive index.
In this paper we report grating inscription in the volume in special PMMA-crosslinker copolymers with aglass transition temperature up to Tg = 155 ◦C. The polymers are irradiated as delivered without any treatmentprior to or after the irradiation.
2. EXPERIMENTAL
2.1 Preparation of polymers
The polymers used in the experiments all were produced by Daren Laboratories and Scientific Consultants, Ness-Ziona, Israel. The transparent acrylic plates about 2.5 mm thick were prepared by heating methyl methacrylate(MMA) and a cross-linking comonomer between two parallel plates separated by a rubber gasket. Prior to thepolymerization, the monomer solution was purified by passing it through a plug of basic alumina followed byfiltration via a 0.45 µm filter. The concentration of the initiator and the heating regime were achieved by trialand error and were a function of the mass of the plate; the larger the mass, the more gradual the heating.After removal from the mold, the plates were annealed for one hour at 130 ◦C and allowed to cool slowly toroom temperature. The samples afterwards were cut into pieces of 5 x 25 mm using a classical milling machine.During the cutting process, the samples were cooled using distilled water. During all handling of the polymersonly distilled water was used to clean the samples as is was assumed that ethanol and other solvents have influenceon the polymer behavior. In order to assure an identical water content for every sample each sample was keptfor at least one week in air at room temperature to allow an outgassing of the water. The systematical gratingrecording experiments described in chapter 2.2 were carried out using the polymer 2-07-136-1. For analyzingthe behavior of the polymer under different conditions, the polymer 2-07-136-2 was used. For observing thewavelength-dependent diffraction efficiency the polymer 2-07-88-2 was selected. The polymers are listed in table1. The polymers are of the same composition but from different lots with slight differences in their attenuationcoefficient arising from slight changes of the heating regime used to polymerize the monomers. This does notaffect the processes taking place inside the polymers, bus as the achieved ∆n over the energy is slightly different,no direct comparison is possible. More specific data of the polymers, especially about the behavior under Excimerlaser irradiation with a wavelength of λ = 248 nm, can be found in.5
Table 1. List of the polymers used in the experimentsType Absorption in glass transition refractive
mm−1 at 325 nm temperature index nD2-07-88-2 0.0446 155 ◦C 1,4921 - 1,49262-07-136-1 0.0053 155 ◦C 1,4951 - 1,49542-07-136-2 0.0066 155 ◦C 1,4929 - 1,4932
2.2 Grating inscription setup
Gratings were inscribed using a Lloyd-mirror setup and the well-known phase mask method. For both inscriptionsetups a Kimmon HeCd-Laser Model 5552R-F emitting at 325 nm was used to modify the polymers. The UV-beam of the HeCd-Laser has ≈ 10 cm coherence length. The radiation was spatially filtered using a NewportUV-lens with a magnification of 27 and a 5 µm pinhole which was placed slightly behind the focus of the lens.This was done in order to achieve a subpression of the pignose mode of the lasertube. Behind the pinhole alens with 50 mm focal length was placed on axis with its focus in the plane of the pinhole. All side lobes of theappearing airy pattern were then cut away using an iris diaphragm. The power density behind the diaphragmwas 3.5 mW/cm2 and could be adjusted by slight changes of the distance between the UV-lens and the pinhole.The spatially filtered and collimated beam with a diameter of 12 mm was then either direted to the phase maskwith suppressed zero order or to the Lloyd mirror setup.
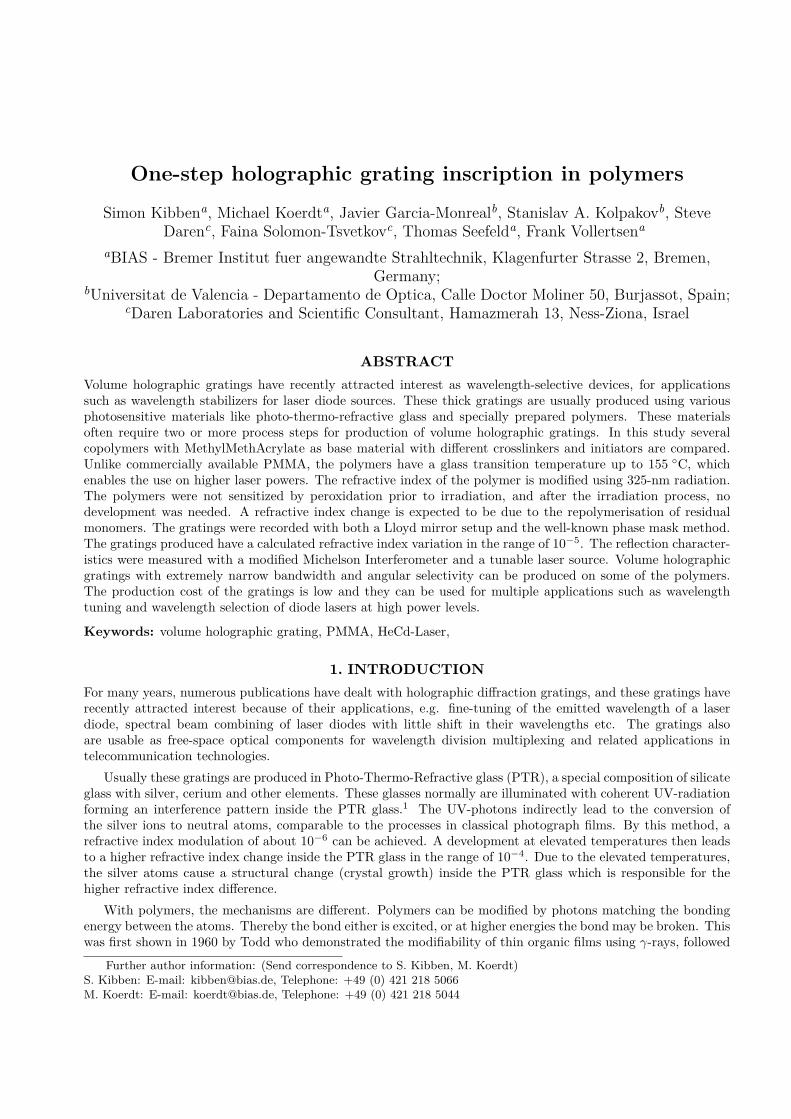
The Lloyd mirror setup for generating gratings by self-interference basically consisted of an equilateral fusedsilica prism with two sides broadband AR-coated for the UV range and a mirror placed parallel to the uncoatedsurface of the prism (see figure 1). Each sample was put between the uncoated prism surface and the mirror.The prism was used in order to achieve angles of 60◦ to 80◦ to the normal of the sample inside the sample. Toavoid total internal reflection at the interfaces, an index matching liquid form Cargille Labs (Acrylic matchingliquid code 5032) was used. The whole optical setup was placed on a rotational stage with angular accuracyof ≈ 0.005◦ to be able to alter the angle of incidence of the UV radiation, and in order to possibly readjustthe angle in dependence of the refractive index of the bulk polymer. Also it was possible to alter the inscribedgrating period.
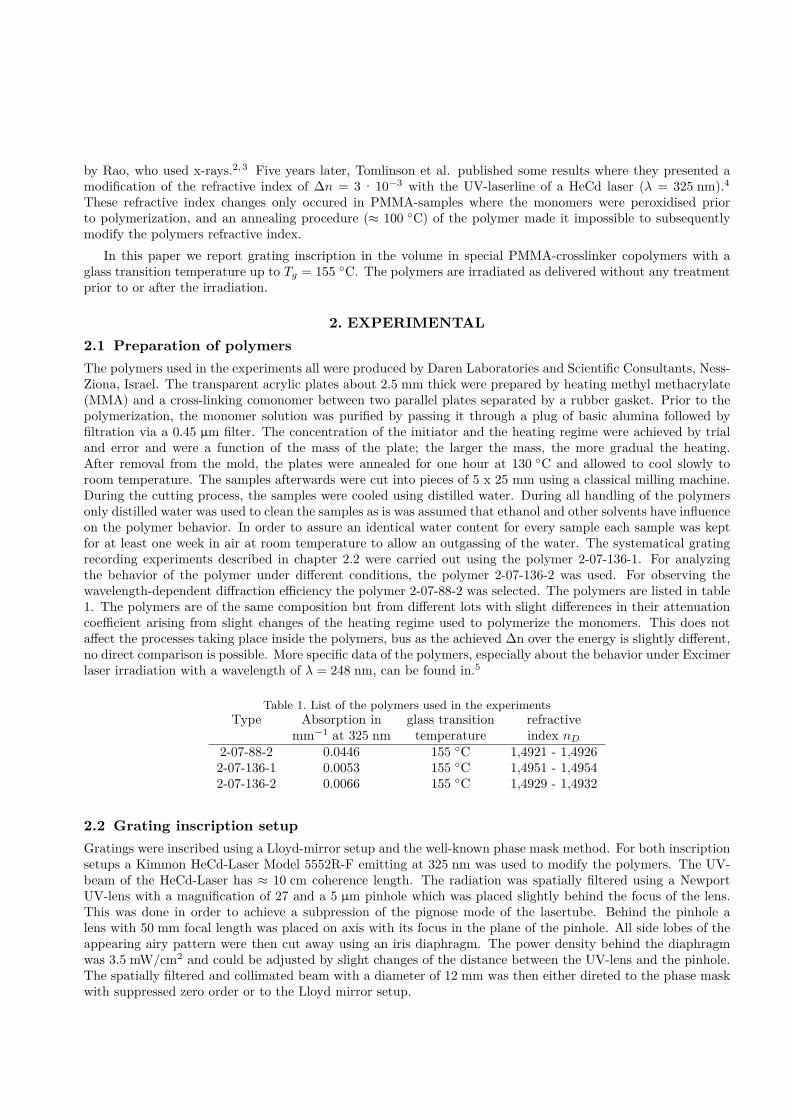
The phase mask inscription method is depicted in figure 2. The phase mask and the attached sample wereplaced in the collimated beam of the HeCd-laser, the beam entered the phase mask normal to the surface.
With both inscription methods, five gratings were recorded in the polymer 2-07-136-1. The gratings wereproduced with different total fluences. The fluence applied to each sample was calculated from the powerdensity behind the spatial filter measured at the beginning and at the end of an experiment and the duration ofinscription. The different optical paths of both inscription methods were not taken into account, as the differentpaths will not lead to a linear correlation between the absolutely absorbed energy.
All five gratings produced with the Lloyd-mirror setup were designed to reflect 808 nm light at normalincidence. Here the incident angle of the UV radiation could be varied, which was slightly corrected for eachsample depending on the refractive index of the samples at 325 nm. Each sample was produced with differentfluences.
The five gratings produced with the phase mask all had an exact free-space grating period of 271.615 nm,which is defined by the grating period of 543.23 nm. The grating period was selected to form a grating reflectingat 808 nm for normal incidence in a material with a refractive index of 1.4874. These gratings also were producedusing different fluences.
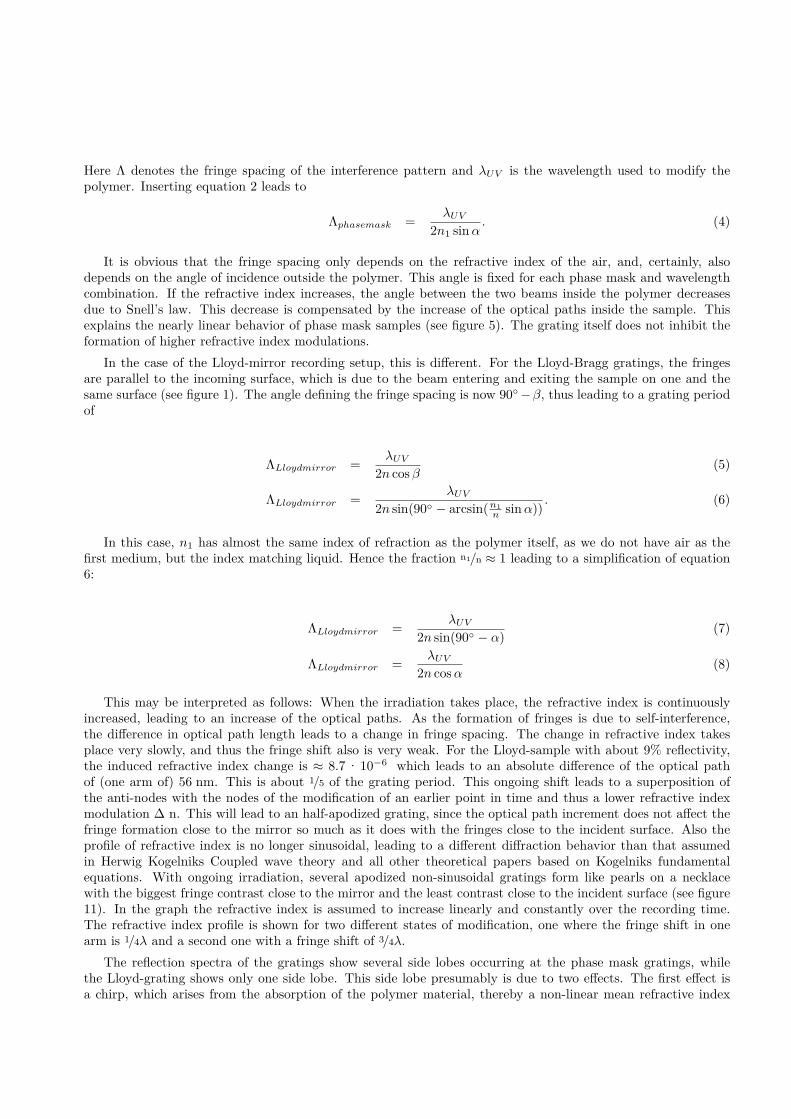
In order to gain knowledge about the UV-induced processes in this PMMA-crosslinker copolymer, threesamples were treated differently prior to a simple plane irradiation with the collimated UV-beam. The beamwas directed to enter the sample perpendicular to the surface, and behind the sample the transmitted lightwas focused onto a detector using a biconvex lens. The detected power was recorded continuously to allow for acomparison of the three time-dependent transmission graphs. The first sample was used as delivered. The secondsample was stored in a vacuum of 3 · 10−4 mbar for about 96 h at a temperature of 70 ◦C. This treatment wasintended to allow all residual monomers, which did not polymerize during the preparation, to diffuse out of thesample. The third sample received the same vacuum treatment as the second one, but afterwards this sample
to detector
indexmatchingliquid
prismincomingbeam
sample
Figure 1. Sketch of the Lloyd-mirror inscription setup,which was placed on a rotational stage to adjust the angleof the incoming beam
incoming beam
phase mask
sample
Figure 2. Schematic diagram of the phase mask inscrip-tion setup
was kept in a pure oxygen atmosphere with a pressure of 4 bar at an elevated temperature for 96 h to allow O2
molecules to fill the free volume of the polymer.
Prior to the characterization every sample was stored for at least 200 h at room temperature in air to allowthe out-diffusion of the reaction products to take place.
After the characterization of the samples, the sample with best diffraction efficiency from both productionmethods was put onto a heating plate at a temperature of 115 ◦C for 24 h in air. Afterwards the sample againwas characterized.
2.3 Characterization of gratings
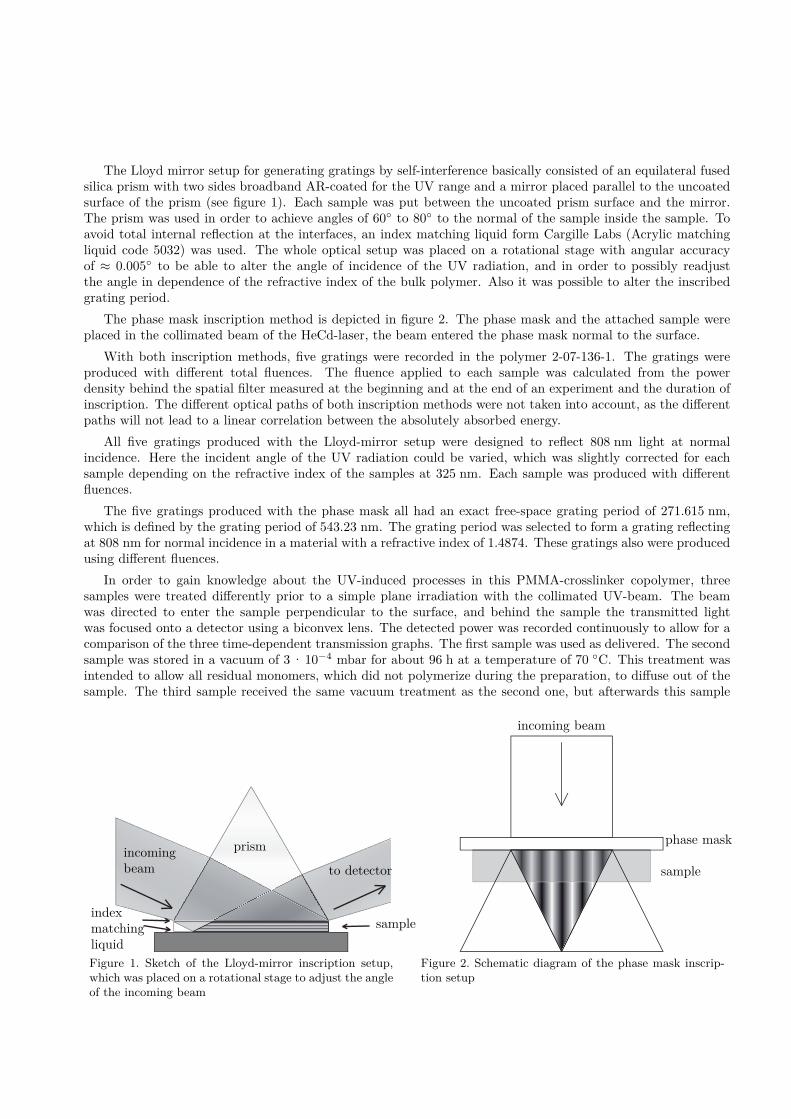
To characterize the gratings two different setups were used. The first one was used to pre-characterize allgratings in order to estimate the normal wavelength reflectance of the samples. It basically consisted of two lowpower laser sources and a rotational stage with a sample holder mounted. The setup is depicted in figure 3.The laser sources used were a frequency-doubled Nd:YAG laser emitting at 532 nm and a HeNe-Laser with itsstandard 632.8 nm wavelength in the red spectrum. Due to refraction at the interface of the samples and thesample geometry, the gratings produced with the phase mask could be characterized best using the Nd:YAGlaser in transmission, and the reflectance of the gratings manufactured with the Lloyd-mirror setup only couldbe observed with the HeNe-Laser.
ΦΦ
reference beam reference beam
diffracted beam diffracted beam
rotational stage rotational stage
detectordetector
transmittedbeam
transmittedbeam
Figure 3. Here the simple setup to pre-characterize the gratings is depicted. Both cases, for analyzing a Lloyd bragggrating (left) and for analyzing a phase mask grating (right) and are shown.
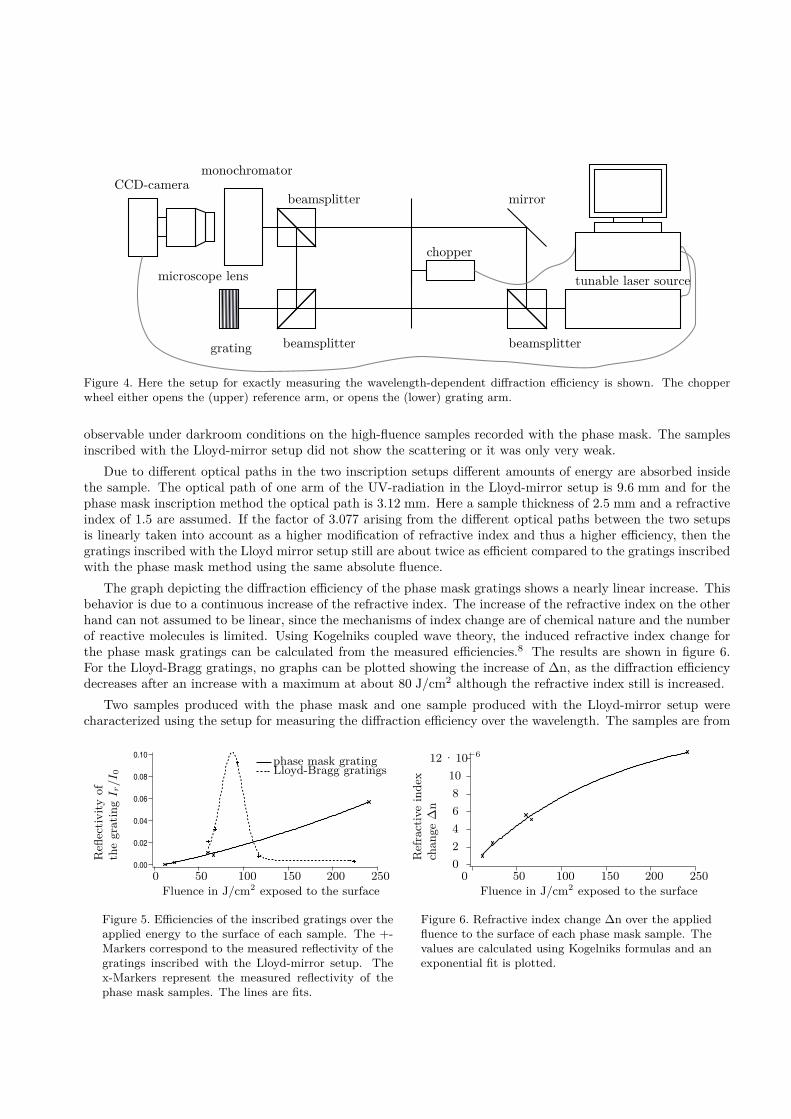
The second setup was used to exactly characterize the efficiency of the grating over the wavelength spec-trum. The setup is illustrated in figure 4. In order to perform the Bragg grating characterization, an Orielmonochromator with attached CCD camera was used. The beam of a tunable laser source was separated in thefirst beam splitter. The beam splitter separated the incoming light into the reference arm and the grating arm.A computer guided chopper wheel was used to select one of these two arms. By continuously switching from onearm to the other, a quasi-simultaneous measurement of wavelength of the tunable laser and reflectivity of thegrating at this wavelength was possible. By inserting the reference arm and the computer guided chopper wheel,the measurement became robust without a dependence from the intensity of a reflected beam. The device wascalibrated using Newport Kr/Ne calibration lamps and showed a good linearity and temporal stability.
3. RESULTS
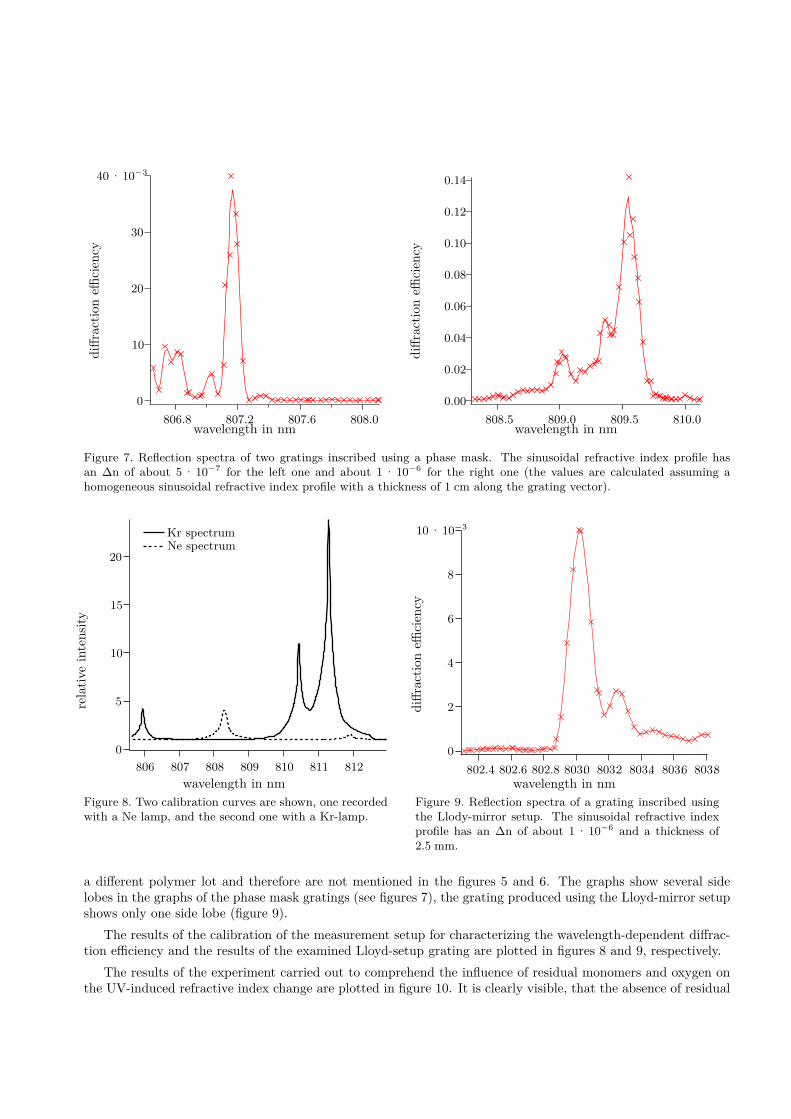
The diffraction efficiencies of all gratings were obtained using the pre-characterization setup, where the samplewas placed on a rotational stage. The data were acquired taking into account the power of the referencebeam, the reflected power, the transmitted power and the diffracted power. The results are shown in figure 5.The axis of abscissa represents the fluence in [J/cm2] which passed the surface of the sample. Neither of thegratings, which were stored at a temperature of 115 ◦C for 24 h showed a measurable increase or decrease of thediffraction efficiency during the second characterization. While the measurements were performed, scatteringrings as observed by Moran and Kaminov and explained by Forshaw appeared.6, 7 These scattering rings were
beamsplitter beamsplitter
beamsplitter
grating
mirror
tunable laser source
monochromator
chopper
CCD-camera
microscope lens
Figure 4. Here the setup for exactly measuring the wavelength-dependent diffraction efficiency is shown. The chopperwheel either opens the (upper) reference arm, or opens the (lower) grating arm.
observable under darkroom conditions on the high-fluence samples recorded with the phase mask. The samplesinscribed with the Lloyd-mirror setup did not show the scattering or it was only very weak.
Due to different optical paths in the two inscription setups different amounts of energy are absorbed insidethe sample. The optical path of one arm of the UV-radiation in the Lloyd-mirror setup is 9.6 mm and for thephase mask inscription method the optical path is 3.12 mm. Here a sample thickness of 2.5 mm and a refractiveindex of 1.5 are assumed. If the factor of 3.077 arising from the different optical paths between the two setupsis linearly taken into account as a higher modification of refractive index and thus a higher efficiency, then thegratings inscribed with the Lloyd mirror setup still are about twice as efficient compared to the gratings inscribedwith the phase mask method using the same absolute fluence.
The graph depicting the diffraction efficiency of the phase mask gratings shows a nearly linear increase. Thisbehavior is due to a continuous increase of the refractive index. The increase of the refractive index on the otherhand can not assumed to be linear, since the mechanisms of index change are of chemical nature and the numberof reactive molecules is limited. Using Kogelniks coupled wave theory, the induced refractive index change forthe phase mask gratings can be calculated from the measured efficiencies.8 The results are shown in figure 6.For the Lloyd-Bragg gratings, no graphs can be plotted showing the increase of ∆n, as the diffraction efficiencydecreases after an increase with a maximum at about 80 J/cm2 although the refractive index still is increased.
Two samples produced with the phase mask and one sample produced with the Lloyd-mirror setup werecharacterized using the setup for measuring the diffraction efficiency over the wavelength. The samples are from
0.10
0.08
0.06
0.04
0.02
0.00
Fluence in J/cm2 exposed to the surface
Refl
ecti
vit
yof
the
gra
tin
gI r/I 0
0 50 100 150 200 250
Lloyd-Bragg gratingsphase mask grating
Figure 5. Efficiencies of the inscribed gratings over theapplied energy to the surface of each sample. The +-Markers correspond to the measured reflectivity of thegratings inscribed with the Lloyd-mirror setup. Thex-Markers represent the measured reflectivity of thephase mask samples. The lines are fits.
Fluence in J/cm2 exposed to the surface
Ref
ract
ive
ind
exch
an
ge
∆n
50 100 150 200 25000
2
4
6
8
10
12 · 10−6
Figure 6. Refractive index change ∆n over the appliedfluence to the surface of each phase mask sample. Thevalues are calculated using Kogelniks formulas and anexponential fit is plotted.
diff
ract
ion
effici
ency
wavelength in nm
0
10
20
30
40 · 10−3
806.8 807.2 807.6 808.0diff
ract
ion
effici
ency
wavelength in nm
0.00
0.02
0.04
0.06
0.08
0.10
0.12
0.14
808.5 809.0 809.5 810.0
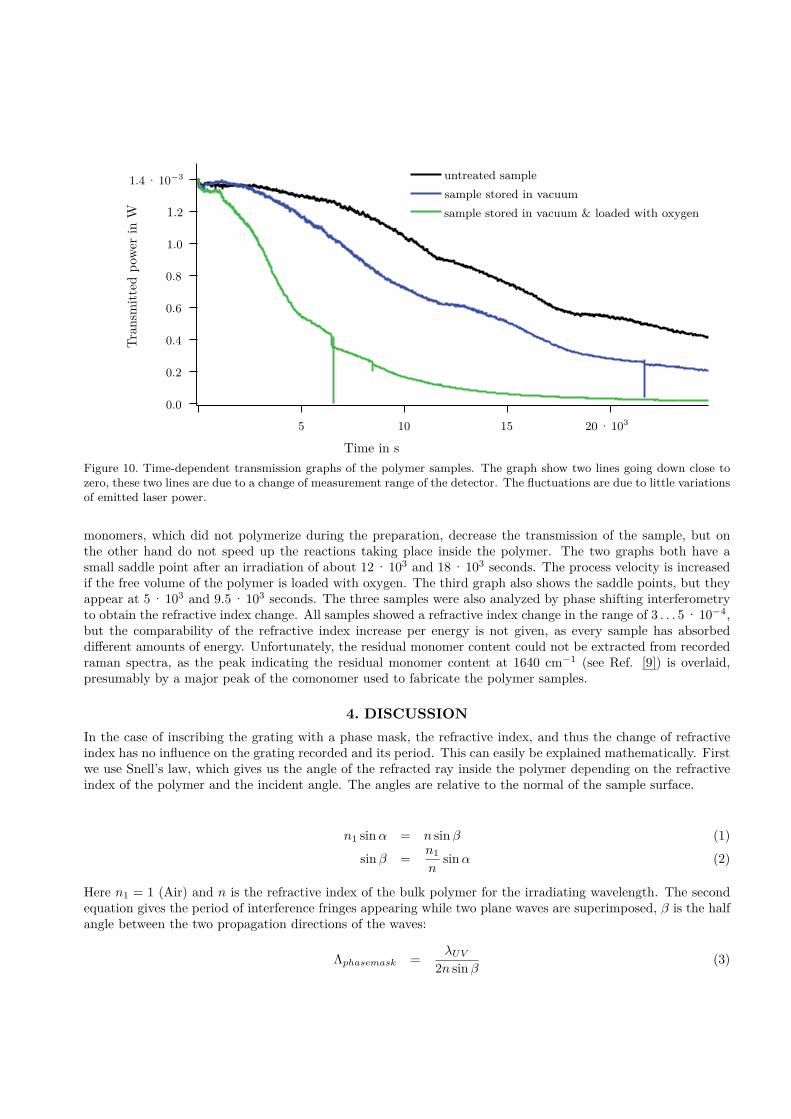
Figure 7. Reflection spectra of two gratings inscribed using a phase mask. The sinusoidal refractive index profile hasan ∆n of about 5 · 10−7 for the left one and about 1 · 10−6 for the right one (the values are calculated assuming ahomogeneous sinusoidal refractive index profile with a thickness of 1 cm along the grating vector).
rela
tive
inte
nsi
ty
wavelength in nm
Kr spectrumNe spectrum
0
5
10
15
20
806 807 808 809 810 811 812
Figure 8. Two calibration curves are shown, one recordedwith a Ne lamp, and the second one with a Kr-lamp.
diff
ract
ion
effici
ency
wavelength in nm0
0
2
2
4
4
6
6
8
8
10 · 10−3
802.4 802.6 802.8 803. 803. 803. 803. 803.
Figure 9. Reflection spectra of a grating inscribed usingthe Llody-mirror setup. The sinusoidal refractive indexprofile has an ∆n of about 1 · 10−6 and a thickness of2.5 mm.
a different polymer lot and therefore are not mentioned in the figures 5 and 6. The graphs show several sidelobes in the graphs of the phase mask gratings (see figures 7), the grating produced using the Lloyd-mirror setupshows only one side lobe (figure 9).
The results of the calibration of the measurement setup for characterizing the wavelength-dependent diffrac-tion efficiency and the results of the examined Lloyd-setup grating are plotted in figures 8 and 9, respectively.
The results of the experiment carried out to comprehend the influence of residual monomers and oxygen onthe UV-induced refractive index change are plotted in figure 10. It is clearly visible, that the absence of residual
Tra
nsm
itte
dp
ower
inW
untreated sample
sample stored in vacuum
sample stored in vacuum & loaded with oxygen
5 10 15 20 · 103
0.0
0.2
0.4
0.6
0.8
1.0
1.2
1.4 · 10−3
Time in s
Figure 10. Time-dependent transmission graphs of the polymer samples. The graph show two lines going down close tozero, these two lines are due to a change of measurement range of the detector. The fluctuations are due to little variationsof emitted laser power.
monomers, which did not polymerize during the preparation, decrease the transmission of the sample, but onthe other hand do not speed up the reactions taking place inside the polymer. The two graphs both have asmall saddle point after an irradiation of about 12 · 103 and 18 · 103 seconds. The process velocity is increasedif the free volume of the polymer is loaded with oxygen. The third graph also shows the saddle points, but theyappear at 5 · 103 and 9.5 · 103 seconds. The three samples were also analyzed by phase shifting interferometryto obtain the refractive index change. All samples showed a refractive index change in the range of 3 . . . 5 · 10−4,but the comparability of the refractive index increase per energy is not given, as every sample has absorbeddifferent amounts of energy. Unfortunately, the residual monomer content could not be extracted from recordedraman spectra, as the peak indicating the residual monomer content at 1640 cm−1 (see Ref. [9]) is overlaid,presumably by a major peak of the comonomer used to fabricate the polymer samples.
4. DISCUSSION
In the case of inscribing the grating with a phase mask, the refractive index, and thus the change of refractiveindex has no influence on the grating recorded and its period. This can easily be explained mathematically. Firstwe use Snell’s law, which gives us the angle of the refracted ray inside the polymer depending on the refractiveindex of the polymer and the incident angle. The angles are relative to the normal of the sample surface.
n1 sinα = n sin β (1)
sin β =n1
nsinα (2)
Here n1 = 1 (Air) and n is the refractive index of the bulk polymer for the irradiating wavelength. The secondequation gives the period of interference fringes appearing while two plane waves are superimposed, β is the halfangle between the two propagation directions of the waves:
Λphasemask =λUV
2n sin β(3)
Here Λ denotes the fringe spacing of the interference pattern and λUV is the wavelength used to modify thepolymer. Inserting equation 2 leads to
Λphasemask =λUV
2n1 sinα. (4)
It is obvious that the fringe spacing only depends on the refractive index of the air, and, certainly, alsodepends on the angle of incidence outside the polymer. This angle is fixed for each phase mask and wavelengthcombination. If the refractive index increases, the angle between the two beams inside the polymer decreasesdue to Snell’s law. This decrease is compensated by the increase of the optical paths inside the sample. Thisexplains the nearly linear behavior of phase mask samples (see figure 5). The grating itself does not inhibit theformation of higher refractive index modulations.
In the case of the Lloyd-mirror recording setup, this is different. For the Lloyd-Bragg gratings, the fringesare parallel to the incoming surface, which is due to the beam entering and exiting the sample on one and thesame surface (see figure 1). The angle defining the fringe spacing is now 90◦−β, thus leading to a grating periodof
ΛLloydmirror =λUV
2n cosβ(5)
ΛLloydmirror =λUV
2n sin(90◦ − arcsin(n1
nsinα))
. (6)
In this case, n1 has almost the same index of refraction as the polymer itself, as we do not have air as thefirst medium, but the index matching liquid. Hence the fraction n1/n ≈ 1 leading to a simplification of equation6:
ΛLloydmirror =λUV
2n sin(90◦ − α)(7)
ΛLloydmirror =λUV
2n cosα(8)
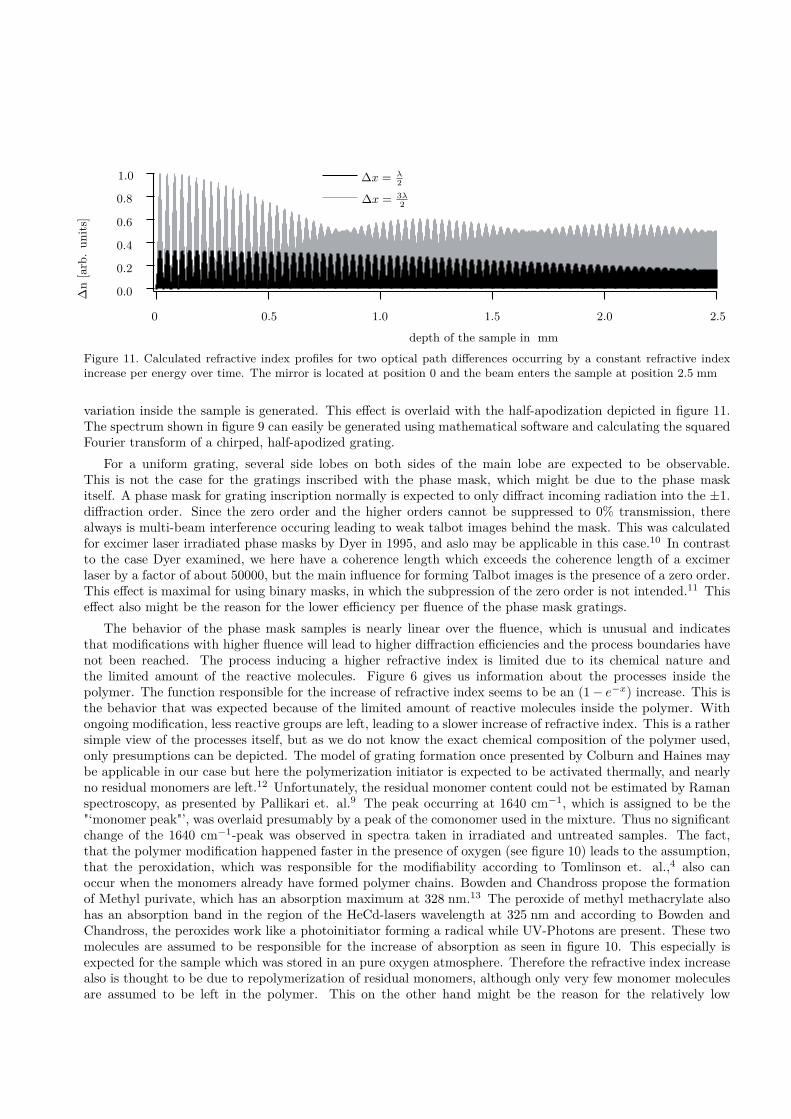
This may be interpreted as follows: When the irradiation takes place, the refractive index is continuouslyincreased, leading to an increase of the optical paths. As the formation of fringes is due to self-interference,the difference in optical path length leads to a change in fringe spacing. The change in refractive index takesplace very slowly, and thus the fringe shift also is very weak. For the Lloyd-sample with about 9% reflectivity,the induced refractive index change is ≈ 8.7 · 10−6 which leads to an absolute difference of the optical pathof (one arm of) 56 nm. This is about 1/5 of the grating period. This ongoing shift leads to a superposition ofthe anti-nodes with the nodes of the modification of an earlier point in time and thus a lower refractive indexmodulation ∆ n. This will lead to an half-apodized grating, since the optical path increment does not affect thefringe formation close to the mirror so much as it does with the fringes close to the incident surface. Also theprofile of refractive index is no longer sinusoidal, leading to a different diffraction behavior than that assumedin Herwig Kogelniks Coupled wave theory and all other theoretical papers based on Kogelniks fundamentalequations. With ongoing irradiation, several apodized non-sinusoidal gratings form like pearls on a necklacewith the biggest fringe contrast close to the mirror and the least contrast close to the incident surface (see figure11). In the graph the refractive index is assumed to increase linearly and constantly over the recording time.The refractive index profile is shown for two different states of modification, one where the fringe shift in onearm is 1/4λ and a second one with a fringe shift of 3/4λ.
The reflection spectra of the gratings show several side lobes occurring at the phase mask gratings, whilethe Lloyd-grating shows only one side lobe. This side lobe presumably is due to two effects. The first effect isa chirp, which arises from the absorption of the polymer material, thereby a non-linear mean refractive index
∆n
[arb
.u
nit
s]
depth of the sample in mm
0.0
0.2
0.4
0.6
0.8
1.0
0 0.5 1.0 1.5 2.0 2.5
∆x = λ
2
∆x = 3λ
2
Figure 11. Calculated refractive index profiles for two optical path differences occurring by a constant refractive indexincrease per energy over time. The mirror is located at position 0 and the beam enters the sample at position 2.5 mm
variation inside the sample is generated. This effect is overlaid with the half-apodization depicted in figure 11.The spectrum shown in figure 9 can easily be generated using mathematical software and calculating the squaredFourier transform of a chirped, half-apodized grating.
For a uniform grating, several side lobes on both sides of the main lobe are expected to be observable.This is not the case for the gratings inscribed with the phase mask, which might be due to the phase maskitself. A phase mask for grating inscription normally is expected to only diffract incoming radiation into the ±1.diffraction order. Since the zero order and the higher orders cannot be suppressed to 0% transmission, therealways is multi-beam interference occuring leading to weak talbot images behind the mask. This was calculatedfor excimer laser irradiated phase masks by Dyer in 1995, and aslo may be applicable in this case.10 In contrastto the case Dyer examined, we here have a coherence length which exceeds the coherence length of a excimerlaser by a factor of about 50000, but the main influence for forming Talbot images is the presence of a zero order.This effect is maximal for using binary masks, in which the subpression of the zero order is not intended.11 Thiseffect also might be the reason for the lower efficiency per fluence of the phase mask gratings.
The behavior of the phase mask samples is nearly linear over the fluence, which is unusual and indicatesthat modifications with higher fluence will lead to higher diffraction efficiencies and the process boundaries havenot been reached. The process inducing a higher refractive index is limited due to its chemical nature andthe limited amount of the reactive molecules. Figure 6 gives us information about the processes inside thepolymer. The function responsible for the increase of refractive index seems to be an (1− e−x) increase. This isthe behavior that was expected because of the limited amount of reactive molecules inside the polymer. Withongoing modification, less reactive groups are left, leading to a slower increase of refractive index. This is a rathersimple view of the processes itself, but as we do not know the exact chemical composition of the polymer used,only presumptions can be depicted. The model of grating formation once presented by Colburn and Haines maybe applicable in our case but here the polymerization initiator is expected to be activated thermally, and nearlyno residual monomers are left.12 Unfortunately, the residual monomer content could not be estimated by Ramanspectroscopy, as presented by Pallikari et. al.9 The peak occurring at 1640 cm−1, which is assigned to be the"‘monomer peak"’, was overlaid presumably by a peak of the comonomer used in the mixture. Thus no significantchange of the 1640 cm−1-peak was observed in spectra taken in irradiated and untreated samples. The fact,that the polymer modification happened faster in the presence of oxygen (see figure 10) leads to the assumption,that the peroxidation, which was responsible for the modifiability according to Tomlinson et. al.,4 also canoccur when the monomers already have formed polymer chains. Bowden and Chandross propose the formationof Methyl purivate, which has an absorption maximum at 328 nm.13 The peroxide of methyl methacrylate alsohas an absorption band in the region of the HeCd-lasers wavelength at 325 nm and according to Bowden andChandross, the peroxides work like a photoinitiator forming a radical while UV-Photons are present. These twomolecules are assumed to be responsible for the increase of absorption as seen in figure 10. This especially isexpected for the sample which was stored in an pure oxygen atmosphere. Therefore the refractive index increasealso is thought to be due to repolymerization of residual monomers, although only very few monomer moleculesare assumed to be left in the polymer. This on the other hand might be the reason for the relatively low
refractive index changes observed by phase shifting holography and calculated from the diffraction efficiencies ofthe gratings produced.
5. CONCLUSION
The recording of holographic gratings with near-UV light of λ = 325 nm has been shown in a PMMA-copolymercomposite with a high glass transition temperature of Tg = 155 ◦C. No peroxidation of the monomers wasnecessary prior to hologram recording. This enables a broader application field where until now only glassescould be used. The polymer was capable of recording gratings with spatial frequencies of 3690 mm−1 and adiffraction efficiency of 14% was observed. As the calculated refractive index variations did not reach a threshold,presumably gratings with higher diffraction efficiency can be recorded in the polymer. Gratings have found tobe stable at an elevated temperature of 115 ◦C and did not show a measurable loss in diffraction efficiency after24 hours at 115 ◦C. The process of refractive index increase is concluded to be due to the conversion of residualmonomer.
ACKNOWLEDGMENTS
We gratefully acknowledge the financial support by the European Commission in the framework of the Bright-Light project with the project number COOP-CT-2006-032482.
REFERENCES
[1] O. M. Efimov, L. B. Glebov, L. N. Glebova, K. C. Richardson, and V. I. Smirnov, “High-efficiency bragggratings in photothermorefractive glass,” Applied Optics 38 No.4, pp. 619–627, 1999.
[2] A. Todd, “The mechanism of radiation-induced changes in vinyl polymers,” Journal of Polymer Science 42,pp. 223–247, 1960.
[3] N. V. Rao, “Organische folien als registrierschichten für korpuskular- und röntgenstrahlen,” Zeitschrift für
angewandte Physik 19, pp. 352–360, 1965.
[4] W. J. Tomlinson, I. P. Kaminow, E. A. Chandross, R. L. Fork, and W. T. Silfvast, “Photoinduces refractiveindex increase in poly(methylmethacrylate) and its applications,” Applied Physics Letters 16, pp. 486–489,1970.
[5] M. Koerdt, “Fabrication and characterization of waveguide and grating structures induced by ultraviolet ra-diation in polymers with a shortened writing process,” in SPIE conference series, presented at the Photonics
West 2009, p. to be published, 2009.
[6] J. M. Moran and I. P. Kaminow, “Properties of holographic gratings photoinduced in polymethyl methacry-late,” Applied Optics 12(8), pp. 1964–1970, 1973.
[7] M. R. B. Forshaw, “Explanation of the two-ring diffraction phenomenon observed by moran and kaminov,”Applied Optics 13(1), p. 2, 1974.
[8] H. Kogelnik, “Coupled wave theory for thick hologram gratings,” The Bell System Technical Journal 48(9),pp. 2909–2947, 1969.
[9] F. Pallikari, G. Chondrokoukis, M. Rebelakis, and Y. Kotsalas, “Raman spectroscopy: A technique forestimating extent of polymerization in pmma,” Mat. Sci. Innovat. 4, pp. 89–92, 2001.
[10] P. E. Dyer, R. J. Farley, and R. Giedl, “Analysis of grating formation with excimer laser irradiated phasemasks,” Optics Communications 115(3 - 4), pp. 327–334, 1995.
[11] J. Maria, V. Malyarchuk, J. White, and J. A. Rogers, “Experimental and computational studies of phaseshift lithography with binary elastomeric masks,” Journal of Vacuum Science & Technology B 24, pp. 828–835, 2006.
[12] W. S. Colburn and K. A. Haines, “Volume hologram formation in photopolymer materials,” Applied Op-
tics 10(7), pp. 1636–1641, 1971.
[13] M. J. Bowden and E. A. Chandross, “Mechanism of refractive index increase in photosensitized poly(methylmethacrytate),” Polymer Engineering and Science 14, pp. 494–497, 1974.


