Embed Size (px)
Citation preview
978-1-4244-4605-6/09/$25.00 ©2009 IEEE
Advantages and Restrictions of Holographic Subsurface Radars
Experimental evaluation
V.V. Razevig, S.I. Ivashov, I.A. Vasiliev, A.V. Zhuravlev
Remote Sensing Laboratory, Bauman Moscow State Technical
University, Moscow, Russia [email protected]
T. Bechtel Department of Earth &
Environment, Franklin & Marshall College,
Pennsylvania, USA [email protected]
L. Capineri Department of Electronics and
Telecommunications, University of Florence, Italy
Abstract—Holographic subsurface radars (HSR) are not in common usage now; possibly because of the historical view amongst radar practitioners that high attenuation of electromagnetic waves in most media of interest will not allow sufficient depth of penetration. It is true that the fundamental physics of HSR prevent the possibility to change receiver amplification with time (i.e. depth) to adapt to lossy media (as is possible with impulse subsurface radar or ISR). However, use of HSR for surveying of shallow subsurface objects, defects, or inhomogeneities is an increasingly proven area of application. In this case HSR can record images with higher resolution than is possible for ISR images. This paper presents experiments with HSR imaging in media with different degrees of attenuation, and illustrates the principle of HSR through an optical analogy.
Keywords - holographic subsurface radar, impulse subsurface radar, attenuation of electromagnetic waves, lossy medium, optical analogy
I. INTRODUCTION In their early days of development (1970s and 1980s),
subsurface radars were considered an electromagnetic technique for detection of subsurface objects at depths of a few meters. This was a result of the frequency range of 100-500 MHz, which was accessible at the time [1, 2]. Depth resolution in this band was restricted to 0.5-1 m, and the main media under consideration at that time were soils and glacial ice. It was these applications that gave the name of Ground Penetrating Radar (GPR) to this early type of radar. The abbreviation is still in wide use (e.g. in the title of this conference) despite the fact that modern subsurface radars have much wider areas of application, deserving of the more accurate name of surface-penetrating radar [3].
All types of GPR can be divided into three types in accordance with the type of emitted signal [3]:
• Time-domain impulse radars • Frequency-modulated continuous-wave radars • Holographic radars.
The last type of subsurface radar is the topic of this work. Holographic subsurface radar differs from the two other types of GPR in the requirement for plan-view scanning of a surface to record subsurface radar holograms. In this sense HSR is analogous to the optical hologram technology first proposed
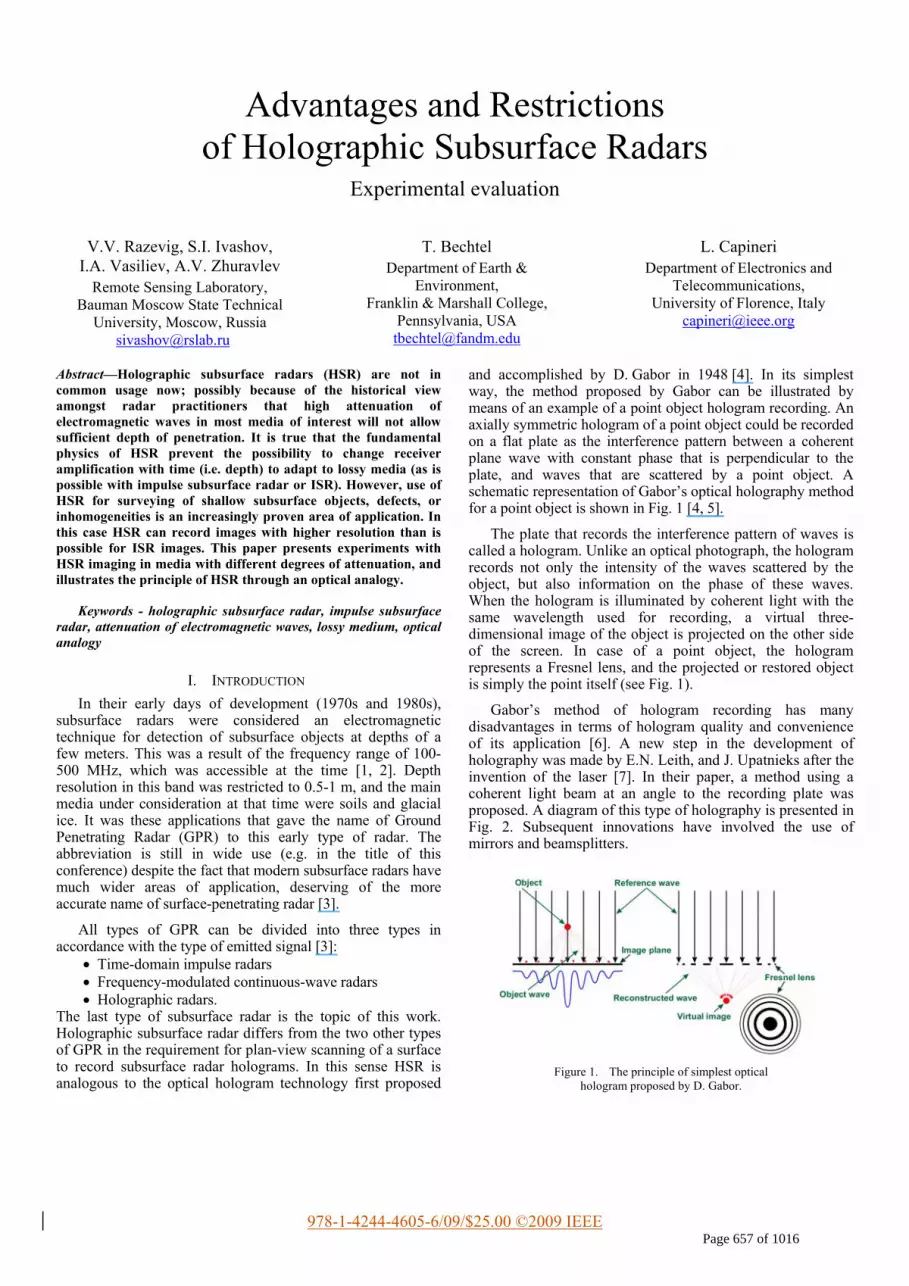
and accomplished by D. Gabor in 1948 [4]. In its simplest way, the method proposed by Gabor can be illustrated by means of an example of a point object hologram recording. An axially symmetric hologram of a point object could be recorded on a flat plate as the interference pattern between a coherent plane wave with constant phase that is perpendicular to the plate, and waves that are scattered by a point object. A schematic representation of Gabor’s optical holography method for a point object is shown in Fig. 1 [4, 5].
The plate that records the interference pattern of waves is called a hologram. Unlike an optical photograph, the hologram records not only the intensity of the waves scattered by the object, but also information on the phase of these waves. When the hologram is illuminated by coherent light with the same wavelength used for recording, a virtual three-dimensional image of the object is projected on the other side of the screen. In case of a point object, the hologram represents a Fresnel lens, and the projected or restored object is simply the point itself (see Fig. 1).
Gabor’s method of hologram recording has many disadvantages in terms of hologram quality and convenience of its application [6]. A new step in the development of holography was made by E.N. Leith, and J. Upatnieks after the invention of the laser [7]. In their paper, a method using a coherent light beam at an angle to the recording plate was proposed. A diagram of this type of holography is presented in Fig. 2. Subsequent innovations have involved the use of mirrors and beamsplitters.
Figure 1. The principle of simplest optical
hologram proposed by D. Gabor.
Page 657 of 1016

Figure 2. Diagram of optical hologram with an inclined light beam.
While the experimental configuration of Leith and Upatnieks using an inclined reference wave is the basis for modern optical holography, it is scarcely possible to implement this for subsurface radar because of the high level of attenuation for electromagnetic waves in most media of interest (lossy media).
Nevertheless, holographic technology has found vast applications in radiolocation. For example, holographic radars have been designed for detection of weapons concealed on human bodies in airports [8]. Radar holography in the atmosphere or outer space also has many features in common with optical holography because of the absence or very low level of electromagnetic attenuation and dispersion in these media.
The main difference between optical holography and subsurface radar holography is the relative dimensions of the recording systems in the two cases. For optical holography, a size-to-wavelength ratio of d/λ ≅ 106 applies (where λ is wavelength and d is a representative dimension of the system). The same parameter for HSR is equal to only a few units. Thus, propagation of light rays as in Figs. 1 and 2, which obeys the laws of geometrical optics, cannot be simply applied for HSR implementation. So, it is possible to construct only a rough analogy between processes in optical holography and HSR. Nevertheless, the analogy is critical for understanding of the physical processes of HSR and for interpretation of HSR holograms.
Subsurface holographic radars are designed for surveying heterogeneous media with relatively high levels of attenuation, and sometimes with high dispersion also. The latter property may have great influence on the recording of multi-frequency holograms. As experiments have shown, all of these factors degrade the quality of microwave holograms, and in many cases make it impossible to record holograms themselves. Theoretical explanations of the influence of media properties
on the quality of subsurface holograms have recently been discussed by N. Chubinsky (2009) [6]. Attenuation within media and heterogeneities on the surface and within media restrict the maximal effective depth of penetration for HSR [9]. It is important to stress that ISR has a distinct advantage over HSR in terms of effective penetration depth due to the possibility to apply time-varying gain in a stroboscopic receiver to selectively amplify deeper reflections that have longer time-of-flight. Since time-of-flight is irrelevant to HSR, the main application of HSR is related to shallow depths.
At the shallow depths where it is applicable, the main advantage of HSR is the ability to record images that have higher resolution in the plane of search (or plan-view) in comparison with ISR. High plan-view resolution at shallow depths is extremely important for many applications, including: • Landmine detection [10, 11] • Searching for hidden bugging devices [5] • Diagnostics of building details and constructions [12, 13] • Diagnostics of composite materials [14, 15].
The simplest way to design holographic subsurface radar is to use a coupling signal between the transmitter and receiver antennae as the reference signal [6]. The main problem is the need to design an antenna appliance that could guarantee the independence of the phase of this reference signal from properties of the sounding surface and heterogeneities in the medium. To achieve this goal, all HSR antennae of the RASCAN type described below are placed in an open waveguide.
II. RADAR DESCRIPTION The specific HSR used for the experiments described in
this study is a RASCAN-4/4000. The RASCAN type radar has been produced in lots for many years, and has three modifications, each with a different set of discrete scanning wavelengths. Specifications for these radars are presented in Table 1.
TABLE 1
Parameter Rascan-4/2000 Rascan-4/4000 Rascan-4/7000
Frequency range, GHz 1.6 - 2.0 3.6 - 4.0 6.4 - 6.8
Number of operating frequencies 5
Number of recording signal polarizations 2
Emitting power, W 6·10-3 (*)
Sensitivity of the receiver, W 10-9
Resolution in the plane of sounding at shallow depths, cm
4 2 1.5
Maximal sounding depth (depends on medium permittivity), cm
35 20 15
( ) Low emitting power guarantees full safety for personnel while using RASCAN radars, Russian sanitary certificate # 77.01.09.650.П.041358.10.05, October 19, 2005.
Page 658 of 1016
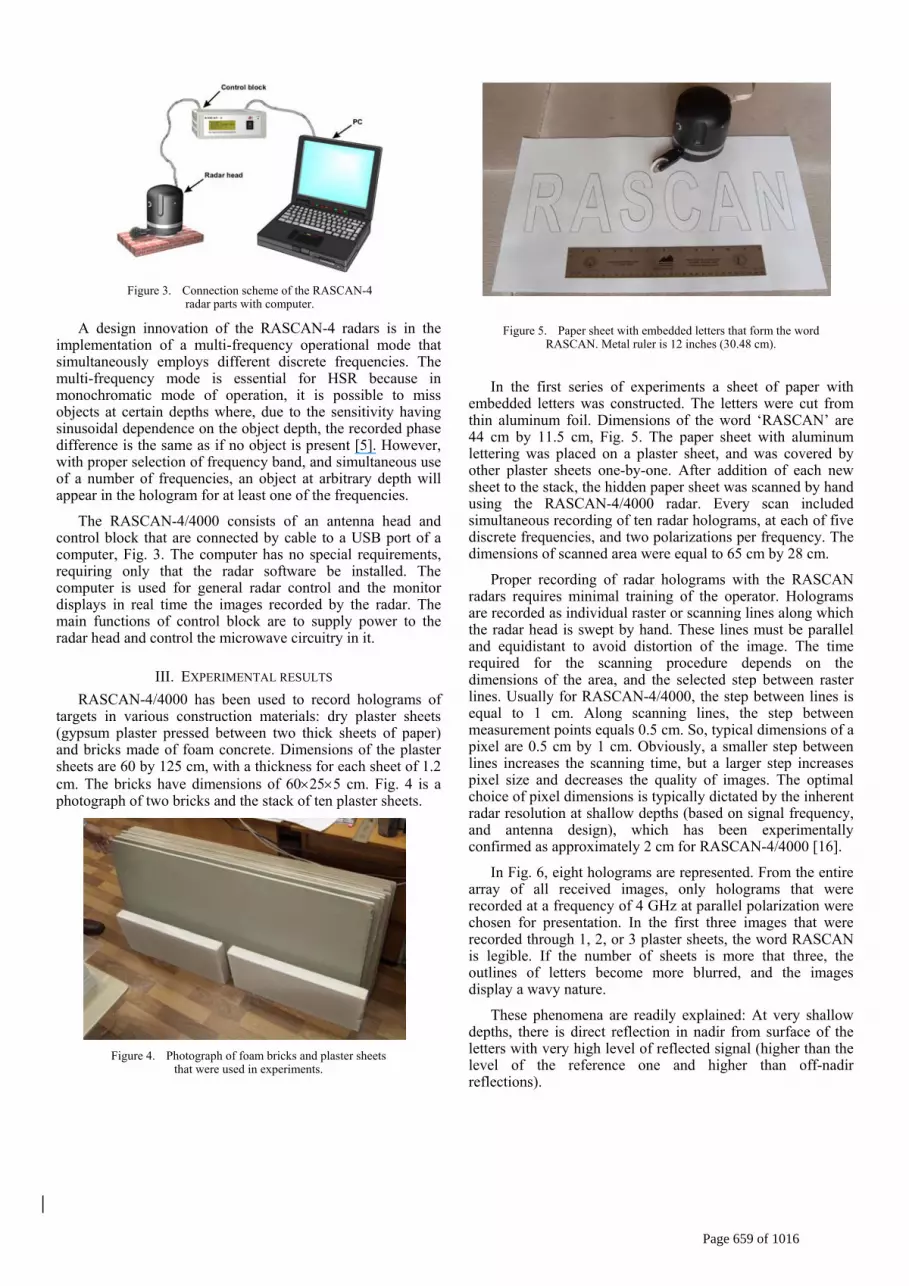
Figure 3. Connection scheme of the RASCAN-4
radar parts with computer.
A design innovation of the RASCAN-4 radars is in the implementation of a multi-frequency operational mode that simultaneously employs different discrete frequencies. The multi-frequency mode is essential for HSR because in monochromatic mode of operation, it is possible to miss objects at certain depths where, due to the sensitivity having sinusoidal dependence on the object depth, the recorded phase difference is the same as if no object is present [5]. However, with proper selection of frequency band, and simultaneous use of a number of frequencies, an object at arbitrary depth will appear in the hologram for at least one of the frequencies.
The RASCAN-4/4000 consists of an antenna head and control block that are connected by cable to a USB port of a computer, Fig. 3. The computer has no special requirements, requiring only that the radar software be installed. The computer is used for general radar control and the monitor displays in real time the images recorded by the radar. The main functions of control block are to supply power to the radar head and control the microwave circuitry in it.
III. EXPERIMENTAL RESULTS RASCAN-4/4000 has been used to record holograms of
targets in various construction materials: dry plaster sheets (gypsum plaster pressed between two thick sheets of paper) and bricks made of foam concrete. Dimensions of the plaster sheets are 60 by 125 cm, with a thickness for each sheet of 1.2 cm. The bricks have dimensions of 60×25×5 cm. Fig. 4 is a photograph of two bricks and the stack of ten plaster sheets.
Figure 4. Photograph of foam bricks and plaster sheets
that were used in experiments.
Figure 5. Paper sheet with embedded letters that form the word RASCAN. Metal ruler is 12 inches (30.48 cm).
In the first series of experiments a sheet of paper with embedded letters was constructed. The letters were cut from thin aluminum foil. Dimensions of the word ‘RASCAN’ are 44 cm by 11.5 cm, Fig. 5. The paper sheet with aluminum lettering was placed on a plaster sheet, and was covered by other plaster sheets one-by-one. After addition of each new sheet to the stack, the hidden paper sheet was scanned by hand using the RASCAN-4/4000 radar. Every scan included simultaneous recording of ten radar holograms, at each of five discrete frequencies, and two polarizations per frequency. The dimensions of scanned area were equal to 65 cm by 28 cm.
Proper recording of radar holograms with the RASCAN radars requires minimal training of the operator. Holograms are recorded as individual raster or scanning lines along which the radar head is swept by hand. These lines must be parallel and equidistant to avoid distortion of the image. The time required for the scanning procedure depends on the dimensions of the area, and the selected step between raster lines. Usually for RASCAN-4/4000, the step between lines is equal to 1 cm. Along scanning lines, the step between measurement points equals 0.5 cm. So, typical dimensions of a pixel are 0.5 cm by 1 cm. Obviously, a smaller step between lines increases the scanning time, but a larger step increases pixel size and decreases the quality of images. The optimal choice of pixel dimensions is typically dictated by the inherent radar resolution at shallow depths (based on signal frequency, and antenna design), which has been experimentally confirmed as approximately 2 cm for RASCAN-4/4000 [16].
In Fig. 6, eight holograms are represented. From the entire array of all received images, only holograms that were recorded at a frequency of 4 GHz at parallel polarization were chosen for presentation. In the first three images that were recorded through 1, 2, or 3 plaster sheets, the word RASCAN is legible. If the number of sheets is more that three, the outlines of letters become more blurred, and the images display a wavy nature.
These phenomena are readily explained: At very shallow depths, there is direct reflection in nadir from surface of the letters with very high level of reflected signal (higher than the level of the reference one and higher than off-nadir reflections).
Page 659 of 1016

HSR holograms Number of sheetsover word
1
2
3
4
5
6
7
8
Figure 6. RASCAN holograms recorded through the stack of plaster sheets. Depth is 1.2 cm per sheet.
With more sheets over the word, the radar antenna records reflections from letters on inclined angles (off-nadir) at a signal level that is comparable with the reference signal. In this case, the wavy nature of radar images is clearly visible. The RASCAN image recorded through 8 sheets (about 10 cm depth) resembles the optical hologram that was presented by D. Gabor in his classic work [4]. His hologram is presented in Fig. 7 c). These pictures (Figs. 6 and 7) give clear qualitative comparison between two types of holograms: optical and radar ones.
The main distinction between optical and radar holograms is the number of Fresnel zones that could be visible. Typical optical hologram may have 104 to 105 diffraction lines [6]. HSR holograms have only a few lines. As mentioned above, this is explained by the fact that the system dimension to wavelength relation (d/λ) is much larger for an optical hologram than for an HSR one.
Figure 7. Gabor’s hologram [4]:
a) Original micrograph b) Micrograph, directly photographed through the same
optical system which is used for the reconstruction d) c) Interference diagram d) Reconstruction of the original; the letters have again
become legible.
In this paper, the matter of reconstruction of holograms recorded by subsurface radar is intentionally omitted. The task of radar hologram reconstruction requires special consideration of medium attenuation and wavelength that is comparable with the size of the system.
There is no direct analogy between the mathematical models of optical and HSR hologram reconstruction. The simplest model for reconstruction of point objects from HSR holograms has been proposed in [17]. For recording and reconstruction of optical holograms, the assumption that the transmission medium is clear and homogeneous is implied and is valid. This is not the case for HSR, making the task of reconstruction very different, and much more difficult (or impossible) for all but the simplest objects (e.g. point targets).
Experiments with RASCAN-4/4000 have demonstrated that the main factors that deteriorate the quality of HSR holograms are related to attenuation and inhomogeneity within the medium in which the electromagnetic wave propagates. Frequently, the level of moisture is the main influence on both of these factors. In contrast to water vapor or humidity, which is transparent in the visible spectrum (fog and rain are not included in consideration), the moisture in soils or construction materials drastically changes their complex permittivity ε [3]. Water itself has an anomalously high real part of permittivity ε′w = 81 that changes with frequency. The main influence of ε′ is on the velocity of an electromagnetic wave in medium that is inversely proportional to √ε′. The imaginary part of permittivity ε′′ is proportional to conductivity of the media. Moisture commonly contains dissolved salts in soils and construction materials, and this increases their conductivity and attenuation. This effect depends on the composition of the medium, with concrete and clay representing examples of media that have high levels of conductivity and attenuation in moist conditions.
Page 660 of 1016

Fig. 8 demonstrates the influence of moisture inhomogeneity on recording holograms and the ability to detect subsurface targets. Holograms in Fig. 8 a) and b) were recorded on the surface of a stack of two foam concrete bricks. In both cases the radar scanned the same area with dimensions of 40 cm by 18 cm. The step of data recording for these experiments is equal to 0.5 cm.
The upper brick has a high level of moisture variation that is visible as the dark versus light contrast pattern in Fig. 8 a). For the next scan, a wire was placed under first brick, Fig. 8 b). The holograms have almost the same appearance, despite the presence of the wire. Because of the moisture variation in the top brick, the wire is almost invisible in this image. The bottom image Fig. 8 c) is a result of the subtraction of two previous pictures a) and b). In this image, with the static moisture variation removed, it is now possible to observe the position of the wire. Unfortunately, this method cannot be used in any real environment for practical applications because there is only one image every time (with or without the known or suspected object in the medium under consideration).
To be correct it is impossible to subtract the holograms because of their non-linear nature. But at high medium attenuation the radar records images that have a weak link to holograms themselves. Thus this operation is possible with some reservations.
Another problem in the use of HSR is the high attenuation of electromagnetic waves in most media that are commonly encountered in practical applications (concrete for example). It is interesting to compare holograms that were recorded for media with high and low levels of attenuation, as in Fig. 9.
a
b
c
Figure 8. Influence of moisture inhomogeneity on recording holograms:
a) Hologram of two bricks without wire between them
b) Hologram of bricks with wire between them c) Result of the subtraction holograms a) and b).
Fig. 9 a) represents a radar hologram of 51mm rocket (Italian-made ARF/8-M3 SNIA) in dry sand [5] which has a relatively low level of attenuation. The waviness of the image is clearly visible, and it is possible to count several concentric diffraction lines in it. An image of a ferroconcrete wall recorded by HSR is given in Fig. 9 b). Concrete has a higher level of electromagnetic wave attenuation in comparison with dry sand [3], so the waviness is not apparent, and the HSR image is reminiscent of an X-ray image.
The influence of attenuation on the quality of holographic radar images has been theoretically investigated in [6]. The main conclusion of that paper is that the number of diffraction lines diminishes with increasing attenuation in the medium. At some level of attenuation, the hologram would have only the first Fresnel zone or just a portion of it.
This effect has a simple physical explanation. HSR must receive signal on inclined angles (off-nadir) from the object to form the diffraction lines. Since at inclined angles the path from the transmitter to the object is longer than in nadir, the overall attenuation will be higher, and the object could be invisible. If there is enough reflected signal level only in nadir, the image resembles a grey-scale picture as in Fig. 9 b). In this case, the holographic nature of the image is not directly apparent, as it is in Fig.9 a).
To demonstrate this effect graphically, a wire has been scanned perpendicularly in different conditions. The level of signal A along a scanning line is presented in Fig. 10 for three cases:
1. The wire is placed in the stack of 8 dry plaster sheets under the fourth sheet; overall thickness of 4 sheets equals 5 cm
2. The wire is placed between two dry foam concrete bricks; brick thickness also equals 5 cm
3. The wire is placed between two wet bricks.
a
b
Figure 9. Influence of medium attenuation level on character of recording holograms:
b) Radar hologram of 50mm rocket in dry sand [5] c) Hologram of a part of ferroconcrete wall [18].
Page 661 of 1016
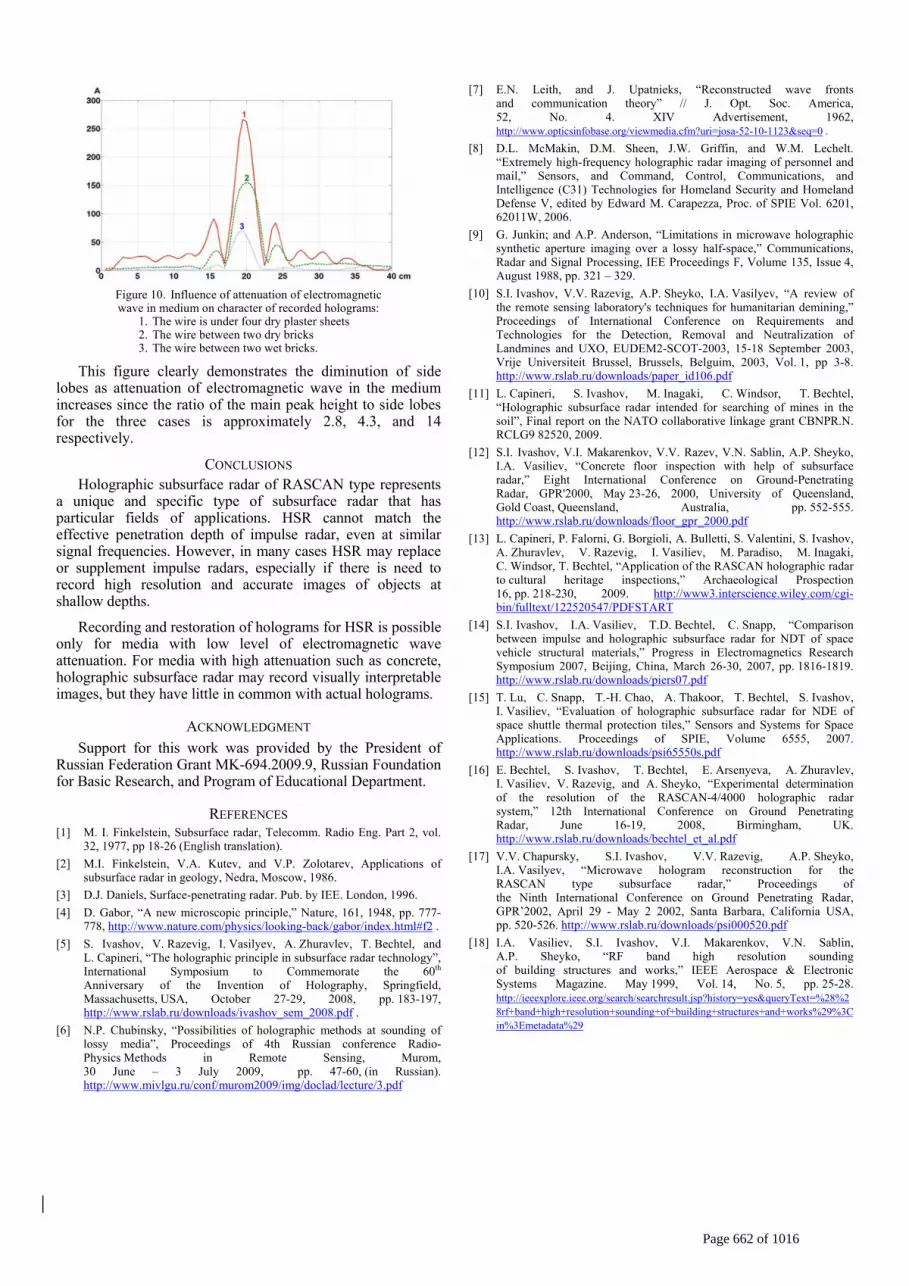
Figure 10. Influence of attenuation of electromagnetic wave in medium on character of recorded holograms:
1. The wire is under four dry plaster sheets 2. The wire between two dry bricks 3. The wire between two wet bricks.
This figure clearly demonstrates the diminution of side lobes as attenuation of electromagnetic wave in the medium increases since the ratio of the main peak height to side lobes for the three cases is approximately 2.8, 4.3, and 14 respectively.
CONCLUSIONS Holographic subsurface radar of RASCAN type represents
a unique and specific type of subsurface radar that has particular fields of applications. HSR cannot match the effective penetration depth of impulse radar, even at similar signal frequencies. However, in many cases HSR may replace or supplement impulse radars, especially if there is need to record high resolution and accurate images of objects at shallow depths.
Recording and restoration of holograms for HSR is possible only for media with low level of electromagnetic wave attenuation. For media with high attenuation such as concrete, holographic subsurface radar may record visually interpretable images, but they have little in common with actual holograms.
ACKNOWLEDGMENT Support for this work was provided by the President of
Russian Federation Grant MK-694.2009.9, Russian Foundation for Basic Research, and Program of Educational Department.
REFERENCES [1] M. I. Finkelstein, Subsurface radar, Telecomm. Radio Eng. Part 2, vol.
32, 1977, pp 18-26 (English translation). [2] M.I. Finkelstein, V.A. Kutev, and V.P. Zolotarev, Applications of
subsurface radar in geology, Nedra, Moscow, 1986. [3] D.J. Daniels, Surface-penetrating radar. Pub. by IEE. London, 1996. [4] D. Gabor, “A new microscopic principle,” Nature, 161, 1948, pp. 777-
778, http://www.nature.com/physics/looking-back/gabor/index.html#f2 . [5] S. Ivashov, V. Razevig, I. Vasilyev, A. Zhuravlev, T. Bechtel, and
L. Capineri, “The holographic principle in subsurface radar technology”, International Symposium to Commemorate the 60th
Anniversary of the Invention of Holography, Springfield, Massachusetts, USA, October 27-29, 2008, pp. 183-197, http://www.rslab.ru/downloads/ivashov_sem_2008.pdf .
[6] N.P. Chubinsky, “Possibilities of holographic methods at sounding of lossy media”, Proceedings of 4th Russian conference Radio-Physics Methods in Remote Sensing, Murom, 30 June – 3 July 2009, pp. 47-60, (in Russian). http://www.mivlgu.ru/conf/murom2009/img/doclad/lecture/3.pdf
[7] E.N. Leith, and J. Upatnieks, “Reconstructed wave fronts and communication theory” // J. Opt. Soc. America, 52, No. 4. XIV Advertisement, 1962, http://www.opticsinfobase.org/viewmedia.cfm?uri=josa-52-10-1123&seq=0 .
[8] D.L. McMakin, D.M. Sheen, J.W. Griffin, and W.M. Lechelt. “Extremely high-frequency holographic radar imaging of personnel and mail,” Sensors, and Command, Control, Communications, and Intelligence (C31) Technologies for Homeland Security and Homeland Defense V, edited by Edward M. Carapezza, Proc. of SPIE Vol. 6201, 62011W, 2006.
[9] G. Junkin; and A.P. Anderson, “Limitations in microwave holographic synthetic aperture imaging over a lossy half-space,” Communications, Radar and Signal Processing, IEE Proceedings F, Volume 135, Issue 4, August 1988, pp. 321 – 329.
[10] S.I. Ivashov, V.V. Razevig, A.P. Sheyko, I.A. Vasilyev, “A review of the remote sensing laboratory's techniques for humanitarian demining,” Proceedings of International Conference on Requirements and Technologies for the Detection, Removal and Neutralization of Landmines and UXO, EUDEM2-SCOT-2003, 15-18 September 2003, Vrije Universiteit Brussel, Brussels, Belguim, 2003, Vol. 1, pp 3-8. http://www.rslab.ru/downloads/paper_id106.pdf
[11] L. Capineri, S. Ivashov, M. Inagaki, C. Windsor, T. Bechtel, “Holographic subsurface radar intended for searching of mines in the soil”, Final report on the NATO collaborative linkage grant CBNPR.N. RCLG9 82520, 2009.
[12] S.I. Ivashov, V.I. Makarenkov, V.V. Razev, V.N. Sablin, A.P. Sheyko, I.A. Vasiliev, “Concrete floor inspection with help of subsurface radar,” Eight International Conference on Ground-Penetrating Radar, GPR'2000, May 23-26, 2000, University of Queensland, Gold Coast, Queensland, Australia, pp. 552-555. http://www.rslab.ru/downloads/floor_gpr_2000.pdf
[13] L. Capineri, P. Falorni, G. Borgioli, A. Bulletti, S. Valentini, S. Ivashov, A. Zhuravlev, V. Razevig, I. Vasiliev, M. Paradiso, M. Inagaki, C. Windsor, T. Bechtel, “Application of the RASCAN holographic radar to cultural heritage inspections,” Archaeological Prospection 16, pp. 218-230, 2009. http://www3.interscience.wiley.com/cgi-bin/fulltext/122520547/PDFSTART
[14] S.I. Ivashov, I.A. Vasiliev, T.D. Bechtel, C. Snapp, “Comparison between impulse and holographic subsurface radar for NDT of space vehicle structural materials,” Progress in Electromagnetics Research Symposium 2007, Beijing, China, March 26-30, 2007, pp. 1816-1819. http://www.rslab.ru/downloads/piers07.pdf
[15] T. Lu, C. Snapp, T.-H. Chao, A. Thakoor, T. Bechtel, S. Ivashov, I. Vasiliev, “Evaluation of holographic subsurface radar for NDE of space shuttle thermal protection tiles,” Sensors and Systems for Space Applications. Proceedings of SPIE, Volume 6555, 2007. http://www.rslab.ru/downloads/psi65550s.pdf
[16] E. Bechtel, S. Ivashov, T. Bechtel, E. Arsenyeva, A. Zhuravlev, I. Vasiliev, V. Razevig, and A. Sheyko, “Experimental determination of the resolution of the RASCAN-4/4000 holographic radar system,” 12th International Conference on Ground Penetrating Radar, June 16-19, 2008, Birmingham, UK. http://www.rslab.ru/downloads/bechtel_et_al.pdf
[17] V.V. Chapursky, S.I. Ivashov, V.V. Razevig, A.P. Sheyko, I.A. Vasilyev, “Microwave hologram reconstruction for the RASCAN type subsurface radar,” Proceedings of the Ninth International Conference on Ground Penetrating Radar, GPR’2002, April 29 - May 2 2002, Santa Barbara, California USA, pp. 520-526. http://www.rslab.ru/downloads/psi000520.pdf
[18] I.A. Vasiliev, S.I. Ivashov, V.I. Makarenkov, V.N. Sablin, A.P. Sheyko, “RF band high resolution sounding of building structures and works,” IEEE Aerospace & Electronic Systems Magazine. May 1999, Vol. 14, No. 5, pp. 25-28. http://ieeexplore.ieee.org/search/searchresult.jsp?history=yes&queryText=%28%28rf+band+high+resolution+sounding+of+building+structures+and+works%29%3Cin%3Emetadata%29
Page 662 of 1016


