Embed Size (px)
Citation preview

The Agricultural Research Council of Norway, Institute of Aquaculture Research; Norwegian Food Research Institute, AS-NLH, Norway
Predicting carcass composition of rainbow trout by near-infrared reflectance spectroscopy
By B. GJERDE and H. MARTENS
Ms. received 1. 10. 86
Introduction
A major problem in breeding for improved carcass composition is the lack of simple and reliable methods to predict such traits.
Standard methods, such as the Kjeldahl method for determination of crude protein, as well as various solvent fat extraction methods and ovendrying for the determination of moisture, are slow and costly.
Rapid methods used in the determination of fat content in fish are reported by several authors (BLIGH and DYER 1959; WISTRIECH et al. 1960; ANKORION et al. 1967; KORN and MACEDO 1973). However, these methods are all more or less modifications of standard methods in which various chemicals are involved, and often requiring trained technicians.
Measurement instruments used in chemistry are now frequently based on observations of a multivariate spectrum. The most common are the spectrophotometers that measure trans- mission, absorption or reflection of light at several wavelengths for each chemical mixture or object. The measured spectra are used to predict the mixture’s chemical composition. Thus, quick, inexpencive readings taken from an instrument can replace standard analyses proce- dures. Various calibration techniques for such multivariate wavelength instruments are described by MARTENS (1985).
Near-infrared spectroscopy (NIR) has successfully been used to predict protein and oil concentrations in corn, soybean and oat seed meals (HYMOWITZ et al. 1974), forage quality in various plant species preserved either in frozen form or as hay or silage (NORRIS et al. 1976), and the chemical composition of tobacco (MCCLURE et al. 1977). Recently the NIR-techni- que has been applied in the prediction of the chemical composition of beef and pork meat (KRUGGEL et al. 1981; MARTENS et al. 1981; LANZA 1983) and the body composition in mice (EISEN et al. 1984).
This study was conducted to evaluate the usefulness of NIR to predict the water, fat and protein concentration of freezedried rainbow trout meat.
Material
Rainbow trout (Salmo gairdneri) hatched in April, 1978, at the Institute of Aquaculture Research, Sunndalsara, were used. In May, 1979, they were transferred to a floating net cage in the sea at the F11 fish farm. Here the fish were fed to excess on commercially produceddry pelleted food. In September, 1980, 83 fish were randomly sampled and slaughtered. The average gutted body weight was 3.28 kg with a standard deviation of .45 kg.
U.S. Copyright Clearance Center Code Statement: 0044-3581 /87/0401-0137 $ 2.50/0 J. Anim. Breed. Genet. 104 (1987) 137-148 0 1987 Verlag Paul Parey, Hamburg und Berlin ISSN 0044-3581

138 B. Gjerde and H. Martens
Methods
From each fish a 1.5-2 cm thick cross section slice was taken from its middle part just anterior to the base point of the dorsal fin. Each slice was skinned and deboned and then freeze dried, ground and stored at - 25" C until NIR-measurements and chemical analyses could be performed.
NIR-measuremen ts
The NIR-measurements were recorded on a commercial Technicon Infralyzer 400, equip- ped with 19 standard fixed wavelength bandpass filters. The wavelength of each filter is given in Table 5.
After thawing the samples to room temperature the NIR-reflectance spectra (NIR- variables), obtained as log (I/RAi) (Ri1 = reflectance at wavelength i) were read directly from a freeze-dried subsample (about 8 cm3) from each slice in a standard measuring cup.
Chemical analyses
The following chemical analyses were performed on a freezedried subsample of each skinned and deboned slice: water (Yo), determined by keeping the samples in an oven at 105" C for 8 hours; fat (%), determined by ether extraction after HCI hydrolysis; protein (YO), calcu- lated as N x 6.25, where N is total nitrogen measured by the macro Kjeldahl method.
The weight of each skinned and deboned slice of meat was recorded before and after freeze drying. Thus the water, fat and protein percentages in the raw meat could be calcu- lated.
Sources of errors in prediction
An error component due to sampling obviously arises when subsamples of meat are collected for chemical analysis. A second error component is the result of inaccuracy in the chemical analyses. To estimate the joint error component of these two sources, two independent subsamples of freeze-dried meat from each of 30 fish were chemically analysed.
A further component of sampling error results when subsamples of meat are collected for NIR-measurements. Taking NIR-measurements on different days for example, may also be the source of another error component. A third error component may be the result of a reading error when using the NIR-instrument. The relative importance of these three error components were investigated by the following procedure. Subsamples of freezedried meat from each of 30 fish were analysed on two succeeding days. O n each day two independent subsamples were collected from each fish. Two replicate NIR-measurements were per- formed on each subsample. From one day to the next the samples were frozen and thawed to room temperature.
Statistical analyses
O n e of the observations for water percentage and another for fat percentage were defined to be outliers. The complete records containing these observations were deleted from the further analyses.
The remaining records were randomly divided into two subsets, data set I (n = 41) and data set I1 (n = 40) Predictors were estimated on the first subset, and the resulting equations applied on the second, and vice versa.
The prediction methods evaluated in this study are linear regression analysis (LR) and principal component regression analysis (PCR).

Carcass composition of rainbow trout by near-infrared reflectance spectroscopy 139
Three different sets of independent variables were used. The NIR-reflectance spectra obtained as log (l/Rxi), the first derivative of log (1/RLi) and the second derivative of log (1/ RLJ. All three variables were used in the linear regression analysis method, while only the log (I/RLj) variable was used in the principal component regression method.
The mathematical transformation of the data to the first and second derivative was done to reduce systematic errors due to variation in e. g. particle size, sample temperature and sample compaction. Matematically, taking derivatives break intercorrelation between the readings at different wavelengths and makes LR more stable.
The first derivatives of log (l/Rh;) were approximated by taking the differences of the log (1/RAi) values between adjacent wavelengths. Thus 18 new first derivative variables were obtained. The first of these variables was d, = log (1/Rh2) - log (l/RAl), the second variable was d, = log (l/Ru) - log (l/Rzl) and variable 18 was dls = log (1/Rh19) - log (l/Rklg).
The second derivatives of log (l/Rhi) were approximated by taking the differences between the first derivative adjacent values. Thus 17 new second derivative variables were obtained. The first of these variables was d: = dz - d,, the second variable was d: = d, - dz and variable 17 was di7 = dlg - d17.
The analysis of the records by both linear regression and by principal component regres- sion is described in the paper by GJERDE (1987).
The residual standard erros of estimate (SEE) was used to evaluate models (1) and (4) in GJERDE (1987). SEE is the square root of the mean square error of the model. To be defined as the best model, all partial regression coefficients in a given model had to be significantly different from zero at the 5
(1) the square root of the mean square of prediction (RMSP)
level. T o estimate the accuracy in prediction the following measures were calculated:
RMSP = (Y-?lf(Y-?)/n,
(2) the correlation (r) between the observed and the predicted values. (3) the bias in prediction as
Bias = l/nl’(Y-?)
where I is a nxl vector of 1’s. Y and ? are vectors of observed and predicted water, fat or protein percentages, respec-
tively, and n is the number of fish predicted. RMSP expresses both discrepancies and bias in prediction, while the correlation is
unaffected by the bias. SEE and RMSP are both expressed relative to the standard deviations (SD) of the observed. values.
As a measure of the joint error component due to sampling and inaccuracy in the chemical analyses, the intraclass correlation was calculated for each chemically analysed component.
The relative importance of the three error components associated with the NIR-measure- ments were analysed in a nested model including fish, day within fish, subsample within day and fish and a residual as random effects. The predicted water, fat or protein percentages based on the NIR-measurements mentioned above were used as dependent variables. O n e of the best equations developed for each component was used as predictor.
The expected mean squares of this nested model used for interpretation are as follows:
The intraclass correlations for day (rd), subsample (r,) and instrument reading (rNIR) were calculated as:

140 B. Gjerde and H . Martens
Source Expectation of mean square
0 2 + 2 0 2 + 40; + 8 0 ' f Fish
Dayifish
Error 0 2
a 2 + 2 a i + 40;
Subsample/day/fish 0 2 + 20;
Results Observed composition
Table 1 shows that data set I and 11 are very similar as far as mean values and standard deviations for each trait studied are concerned.
Table 1 . Means (X) and standard deviations (SD) of the components of the freeze dried and raw meat
Data set I (n=41) Data set. II (n=40) - - ComPone*t____________- x S.D. X S.D.
Water, % 3.3 2 .16 2 .9 2 . 0 0
Freeze dried meat
Fat, % 4 1 . 7 4 . 1 6 4 1 . 6 4 . 1 5
Protein, % 5 4 . 8 4 . 4 1 5 4 . 9 4 . 0 1
Raw meat Water, % 6 4 . 4 1 . 8 1 6 5 . 2 1 . 8 3
Fat, % 1 5 . 2 2 . 2 8 1 4 . 4 2 . 0 0
Protein, % 1 9 . 9 1 . 0 2 20 .0 0 . 9 7
Reflectance spectra
Figure 1 shows the plots of the log of the reciprocal of reflectance and its second derivative of two meat samples with different chemical composite. The difference in levels between the log (i/R) spectra of the two samples appears to be only partly a results of different chemical composition. Thus, in the total data, the correlations between the log (1 iR) values at diffe- rent wavelengths and the water percentage varied between -.01 and -.36, between .59 and .66 for fat the percentage and between -.61 and -75 for the protein percentage.
The coefficients of variation of log (1/R) were very similar and varied from 10 to 15 for the different wavelengths, but were very different and varied from 6 to 87 for the first derivative of log (1/R) and from 6 to 1406 for the second derivative of log (l/R).
The correlations between the log (1/R) values at different wavelengths were all very high and varied between .85 and .99. The correlations between the first derivative spectra of log (1/R) and between the second derivative spectra of log (1/R) were in general lower and much more variable. However, the quotient of the largest and the smallest eigenvalue for each of the three spectra was larger than lo6. This shows that also the first and the second derivative spetra of log (1/R) are highly multicollinear.
The largest eigenvalue of the covariance matrix for log (1/R) explains about 97% of the variation probably due to light scattering effects. The second largest explains 2% of the variation.

Carcass composition of rainbow trout by near-infrared reflectance spcctroscom
- 6 - $
L
9 4 - -2 a 2 -
b P
'1,
< 0 -
c
'a
- 2 -
s - 4 -
- 6 4
141
- I I I I I I I I 1
16 -
1 4 -
1 2 -
10 -
8 -
6 -
Water Fat Protein % "4 % -
- I5 463 516 ---- 39 350- 1 4
Estimation of predictors
The relative standard error of estimates (SEE/SD) for the best models are listed in Table 2. The ranking of methods with respect to SEE/SD values was LR, LRd, PCR and LRdZ for all three components. Water percentage resulted in the lowest SEE/SD values of all methods used, while protein percentage led to the highest values.
Table 2. Relative standard error of estimate (SEE/SD) for the three linear regression methods (LR, LRd and LRd*) and the principal component regression method (PCR). Mean values of data set I and
11. Mean number of variables entered are given in parentheses'
Method
Component LR LRd LRd PCR Water . 2 4 ( 7 ) . 2 5 ( 7 ) .28 (5) .26 ( 9 )
Fat .25 (7) . 3 0 ( 6 ) .33 (7) . 2 8 ( 7 )
Protein . 3 1 ( 8 ) . 3 4 ( 7 ) .38 ( 7 ) .35 ( 7 )
Means that were nct whole numbers are rounded off upwards.
142
100
90 ' 8 0 - < 2 70- ' 60- 3 9 50
$ 40- crl $ 30-
B. Gjerde and H. Martens
-
-
-
100
.90 s -(u .80 ' . 70 -
. @ -
\ .50-
$ .YO-
4, 0
2 2
30
- L R ............. L Rd
---__ LRdZ --- PCR
- - -
-
I I I I I [ 1
2 4 6 8 10 f2 No o f predlcfors
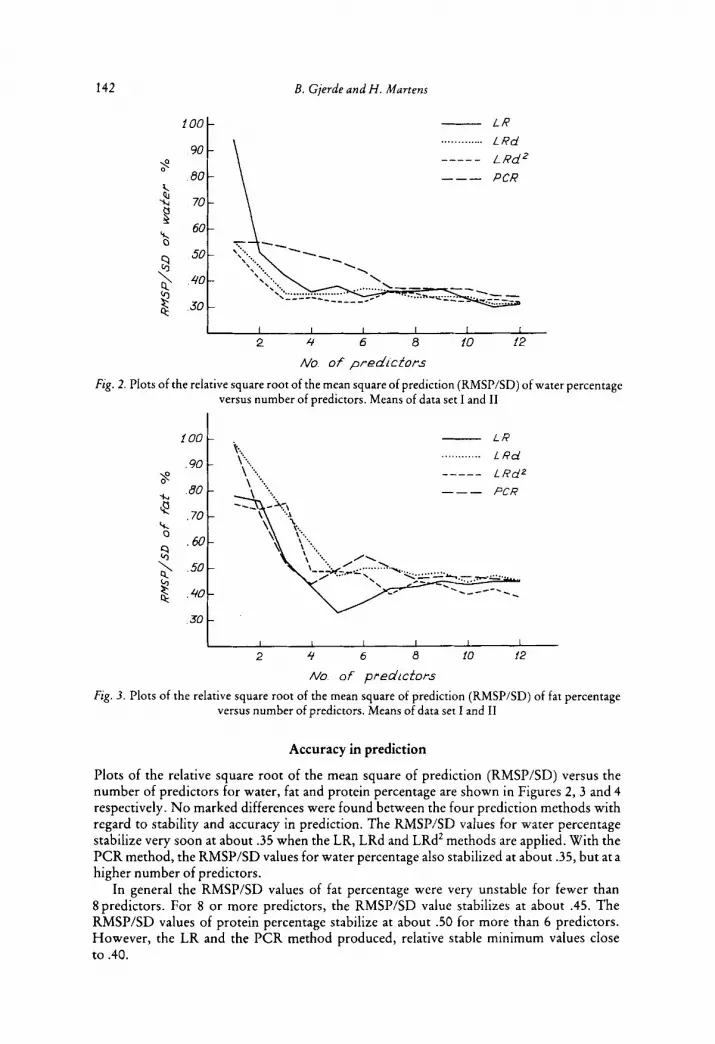
Fig. 2. Plots of the relative square root of the mean square of prediction (RMSP/SD) of water percentage versus number of predictors. Means of data set I and I1
- L R ............ L R d I...
\'.. .. \ ..... --__- L Rd2 \ ..... --- PCR
I I I 1 I I I 2 4 6 8 10 12
No o f predictors Fig. 3. Plots of the relative square root of the mean square of prediction (RMSP/SD) of fat percentage
versus number of predictors. Means of data set I and I1
Accuracy in prediction
Plots of the relative square root of the mean square of prediction (RMSP/SD) versus the number of predictors for water, fat and protein percentage are shown in Figures 2, 3 and 4 respectively. No marked differences were found between the four prediction methods with regard to stability and accuracy in prediction. The RMSP/SD values for water percentage stabilize very soon at about .35 when the LR, LRd and LRdZ methods are applied. With the PCR method, the RMSP/SD values for water percentage also stabilized at about .35, but at a higher number of predictors.
In general the RMSP/SD values of fat percentage were very unstable for fewer than 8predictors. For 8 or more predictors, the RMSP/SD value stabilizes at about .45. The RMSP/SD values of protein percentage stabilize at about .50 for more than 6 predictors. However, the LR and the PCR method produced, relative stable minimum values close to .40.
Carcass composirion of rainbow trout by near-infrared reflectance spectroscopy 143
- L R
L Rd LRdz
. . , . . . . , , . . . . -----
\ 0
80 -
70 -
60 -
50 -
40 -
.30 -
I I I I I I I
2 4 6 8 10 12
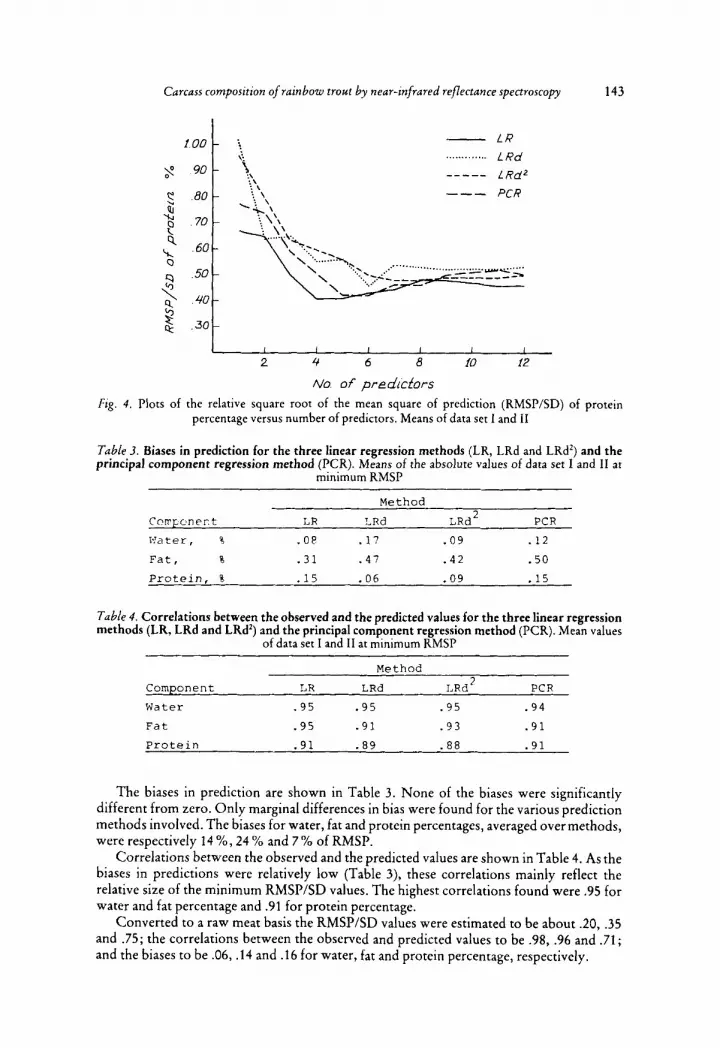
NO of predictors Fig. 4. Plots of the relative square root of the mean square of prediction (RMSP/SD) of protein
percentage versus number of predictors. Means of data set I and 11
Table 3. Biases in prediction for the three linear regression methods (LR, LRd and LRdZ) and the principal component regression method (PCR). Means of the absolute values of data set I and I1 at
minimum RMSP
Method
CorrFoner t LR LRd LRd2 PCR Fater, S . o e .l? . 0 9 .12
F a t , % - 3 1 .4? .42 . s o Protein, % . 1 5 .06 - 0 9 , 1 5
Table 4. Correlations between the observed and the predicted values for the three linear regression methods (LR, LRd and LRd') and the principal component regression method (PCR). Mean values
of data set I and I1 at minimum RMSP
Method
PCR 7 Component L R LRd LRd
Water - 9 5 . 9 5 .95 . 9 4
F a t - 9 5 . 9 1 . 9 3 . 9 1
Protein .91 . 8 9 . 8 a . 9 1
The biases in prediction are shown in Table 3. None of the biases were significantly different from zero. Only marginal differences in bias were found for the various prediction methods involved. The biases for water, fat and protein percentages, averaged over methods, were respectively 14 YO, 24 YO and 7% of RMSP.
Correlations between the observed and the predicted values are shown in Table 4. As the biases in predictions were relatively low (Table 3), these correlations mainly reflect the relative size of the minimum RMSPISD values. The highest correlations found were .95 for water and fat percentage and .91 for protein percentage.
Converted to a raw meat basis the RMSP/SD values were estimated to be about .20, .35 and .75; the correlations between the observed and predicted values to be .98, .96 and .71; and the biases to be .06, .14 and .16 for water, fat and protein percentage, respectively.
144 B. Gjerde and H. Martens
Selection of predictors
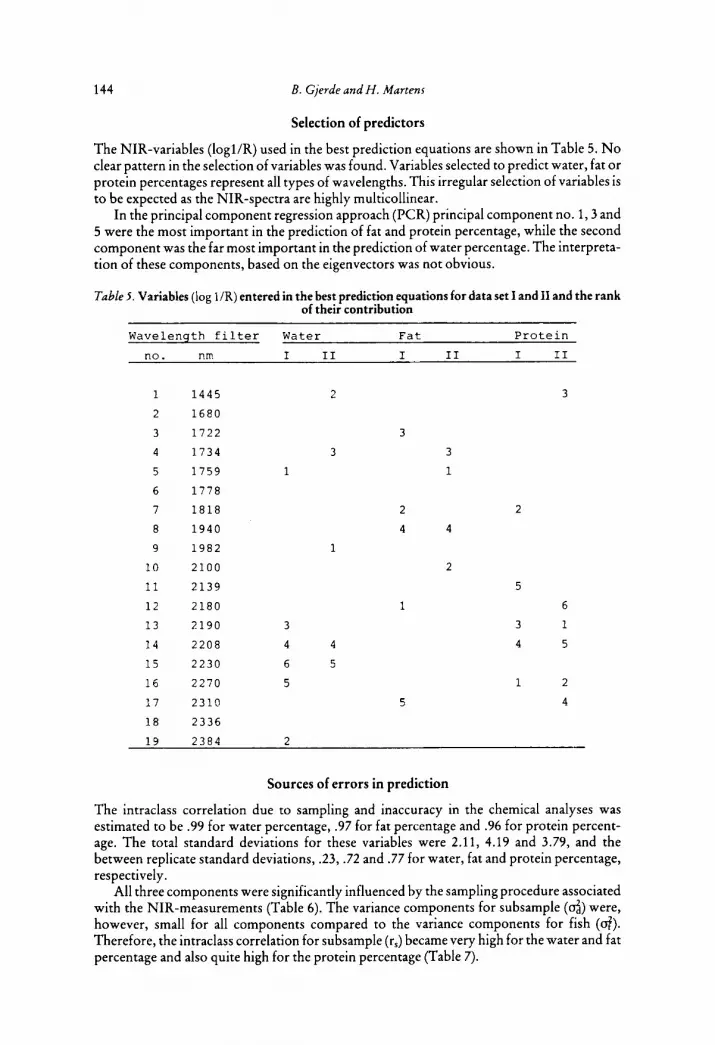
The NIR-variables (logl/R) used in the best prediction equations are shown in Table 5. No clear pattern in the selection of variables was found. Variables selected to predict water, fat o r protein percentages represent all types of wavelengths. This irregular selection of variables is to be expected as the NIR-spectra are highly multicollinear.
In the principal component regression approach (PCR) principal component no. 1 ,3 and 5 were the most important in the prediction of fat and protein percentage, while the second component was the far most important in the prediction of water percentage. The interpreta- tion of these components, based on the eigenvectors was not obvious.
Table 5. Variables (log 1/R) entered in the best prediction equations for data set I and I1 and the rank of their contribution
W a v e l e n g t h f i l t e r Water F a t P r o t e i n
no . n.m. I I1 I I1 I I1
1
2
3
4
5
6
7
8
9
10
11
1 2
1 3
1 4
1 5
1 6
17
18
1 4 4 5 2
1 6 8 0
1 7 2 2
1 7 3 4 3
1 7 5 9
1 7 7 8
1 8 1 8
1 9 4 0
1 9 8 2
2 1 0 0
2 1 3 9
2 1 8 0
2 1 9 0 3
2 2 0 8 4 4
2 2 3 0 6 5
2 2 7 0 5 2 3 1 0
2 3 3 6
I
1
3
3
1
2 4 4
2
1
5
3
2
5
6
3 1
4 5
1 2
4
1 9 2 3 8 4 2
Sources of errors in prediction
The intraclass correlation due to sampling and inaccuracy in the chemical analyses was estimated to be .99 for water percentage, .97 for fat percentage and .96 for protein percent- age. The total standard deviations for these variables were 2.11, 4.19 and 3.79, and the between replicate standard deviations, .23, .72 and .77 for water, fat and protein percentage, respectively.
All three components were significantly influenced by the sampling procedure associated with the NIR-measurements (Table 6) . The variance components for subsample (4) were, however, small for all components compared to the variance components for fish (of). Therefore, the intraclass correlation for subsample (r,) became very high for the water and fat percentage and also quite high for the protein percentage (Table 7).

Carcass composition of rainbow trout by near-infrared reflectance spectroscopy
Table 6. Analyses of variance for NIR-predicted water, fat and protein percentages Mean s q u a r e s
S o u r c e D . F . Water ( % ) F a t ( % ) P r o t e i n ( % )
F i s h 2 9 3 7 . 2 4 * * * 1 ? 9 . 5 2 * * * ? 3 6 . 0 5 * * *
Day/ f i s h 3 0 . 4 4 . 8 8 3 . 1 2
Subsampleidaylfish 60 . 5 2 * * * .68*** 3 . 7 3 * * *
E r r o r 1 2 0 . 0 6 . 1 6 . 5 3
T o t a l 2 3 9 4 . 8 8 1 6 . 5 6 1 8 . 6 6
* * * P<O.OOl
145
Table 7. Intraclass correlations for day (rd), subsample (r,) and instrument reading (rNIR) based on the analyses of variance in Table 6
r ‘d ‘NIR C o m p o n e n t
Water . 9 4 . 9 4 . 9 9
F a t . 9 7 . 9 7 . 9 9
P r o t e i n . 8 9 - 8 9 - 9 7
None of the three chemical components were significantly influenced by variation due to day (Table 6). This indicates that samples analyzed on different days are comparable.
The intraclass correlation for instrument reading (rNIR) was high for all three components (Table 7). This indicates that the repeated reflectance spectra of a given sample are very similar. The deviation from the ideal correlation of 1.00 is likely to be caused by disturbance in the meat samples when the cup containing the sample were drawnlpushed outhnto the machine between each reading.
Discussion
The square root of the mean square of prediction (RMSP) was estimated at about 35 % of the observed standard deviations for water percentage, at about 45 YO for fat percentage and at about 50 % for protein percentage. The correlation between the observed and predicted values was at best .95 for water and fat percentage and .91 for protein percentage. Converted to a raw meat basis the correlation was even higher for water and fat percentage (.98), while it was much lower for protein percentage (.69). These results clearly illustrate the potential of near-infrared reflectance spectroscopy as a tool in the prediction of carcass composition of rainbow trout.
In considering the SEE/SD and the RMSP/SD values, it must be noted that their limit is not zero since the observed chemical reference data can not be without error. Their limit is equal to the quotient of the between replicate standard deviation and the total standard deviation of the observed chemical analyses. This quotient was estimated to be .11, .17 and .2O for water, fat and protein percentage, respectively.
By also including the square root of the between subsample component of the NIR- predicted values (a,) these quotients were estimated to be .25, .21 and 3 5 . These figures compare reasonably well with the SEE/SD values (Table 2) while the RMSP/SD values are much higher. This is likely the result of estimating predictors on an independent set of data.
Therefore, chemical analyses and NIR-measurements of independent subsamples are likely to reduce the residual error variation for all components, particularly for protein. Improvements might also be obtained by increasing the number of fish evaluated and thereby increasing the accuracy of the predictors.
146 B. Gjerde and H. Martens
Previous studies indicate that second derivative spectra of log (1/R) give better accuracy in prediction than log(l/R) spectra. (NORRIS et al. 1976; Lanza, 1983; MCCLURE et al. 1984 as reported by EISEN et al. 1984). However, in the present study the second derivative spectra of log (1/R) showed the highest SEE/SD values, while in the prediction no marked differences between the four prediction methods evaluated could be detected.
The results obtained in the present study compare reasonably well with recent studies where NIR is applied to meat or meat products. LANZA (1983) reported SEP/SD (SEP = standard error of prediction) values of .06 and .51 for fat and protein percentage, respec- tively, of raw pork meat; and .09 and .51 of raw beef meat. The SEP values are RMSP values corrected for bias. The coefficients of correlation between the observed and predicted fat and protein percentages were estimated to be .99 and .87, respectively, both for the pork and the beef meat. EISEN et al. (1984) reported RMSP/SD values of .29 and .38 and coefficients of correlation of .96 and .94 for fat and protein percentage of mice respectively, when calcu- lated on a dry matter basis. These results and results from the present study strongly indicate that NIR is not as suitable for protein as it is for fat percentage.
Conclusions
It can be concluded that near-infrared reflectance spectroscopy makes it possible to predict carcass composition on rainbow trout with high accuracy. Improvements are likely to be achieved by chemical analyses and NIR-measurements of independent subsamples.
The present data do not discriminate between the four prediction methods evaluated. Compared to standard methods of chemical analyses, the capacity of N I R is high. An
untrained person can perform the NIR-measurements of about 50 samples in an hour. The predicted values for each sample are immediately shown on a screen or can be stored directly on magnetic tape. This makes NIR an interesting tool in a breeding program for rainbow trout.
However, a great deal of work is needed to prepare the samples prior to the NIR- measurements. Therefore, it would be of great advantage if the method could be applied to raw fish meat as has been done successfully for raw pork and beef meat (LANZA 1983).
Summary
Near-infrared reflectance spectroscopy (NIR) was used to predict water, fat, and protein percentage of meat from 81 rainbow trout.
Prediction equations were developed based on NIR-data and chemical reference data obtained from a freeze-dried samde of meat from a 1.5-2 cm thick cross section slice of meat immediatelv anterior to the base point of tfie dorsal fin.
The NIR-data were obtained as loe (l/Rl;) for 19 different waveleneths (R = reflectance of wavelength hi), and approximated to fiys; anh’second derivatives of log r1 / R j . Linear regression analysis and principal component regression analysis were evaluated as prediction methods.
The s uare root of the mean square of prediction was estimated to be about 35 % of the observed standard jeviation for water percenta e, at about 45 YO for fat percentage and at about 50% for protein percentage. The correlation between t i e observed and predicted values was, at best, .95 for water and fat
ercentages and .91 for protein percentage. Converted to a raw meat basis the correlations were even Eigher for water and fat percentages (.98), while it was quite much lower for protein percentage (.69).
The present data do not discriminate between the three types of independent variables used, nor between the two prediction methods evaluated. Both methods roduce values with low bias.
It can be concluded that NIR makes it possible to predict tRe carcass composition of rainbow trout with high accuracy. Compared to ordinary chemical analyses methods, the capacity of NIR is high. This makes NIR an interesting tool in a breeding program for rainbow trout. It would be of even greater advantage if the method could be applied to raw fish meat.
Carcass composition of rainbow trout by near-infrared reflectance spectroscopy 147
Zusammenfassung Schatzung der Schlachtkorperzusammensetzung von Regen bogenforellen
durcb infrarote Reflektanzspektroskopie Infrarotnahe Reflektanzspektroskopie (NIR) wurde zur Schatzung des Wasser-, Fett- und Proteinge- halts von Fleisch bei 81 Regenbogenforellen verwendet. Schatzungsgleichungen wurden auf der Basis der NIR-Ergebnisse entwickelt und Ergebnisse der chemischen Untersuchung von einem gefrierge- trockneten Fleischstuck von etwa 1% bis 2 cm Dicke (von vor der Ruckenflosse). Die NIR-Ergebnisse wurden als log (1 /RLJ fur 19 verschiedene Wellenlangen (Rk, = Reflektanz der Wellenlange hi) berechnet und approximiert an die erste und zweite Ableitung von log (l/RA,). Lineare Regressionsanalyse und Hauptkomponentenregressionsanalyse wurden als Schatzun smethoden verwendet.
Die Wurzel des Mittelquadrates der Schatzung wurde auf etwa 35 Yo der beobachteten Standardab- weichung des Wasseranteils, auf etwa 45% des Fettanteils und auf etwa 5 0 % des Proteinanteils geschatzt. Die Korrelation zwischen beobachteten und geschatzten Werten war im besten Fall 0,95 fur Wasser- und Fett-, und 0,91 fur Proteinanteil. Bei Umwandlung auf Rohfleischbasis waren die Korrela- tionen fur Wasser und Fett hoher (0,98), aber um einiges niedriger bei Proteinanteil(O,69). Die gegen- wartige Untersuchung unterscheidet nicht zwischen den drei Typen von unabhangigen Variablen und auch nicht zwischen den beiden Schatzun smethoden. Beide Methoden haben geringe Verzerrungen ergeben. Es kann geschlossen werden, d a f N I R es moglich rnacht, die Schlachtkorperzusammenset- zung von Regenbogenforellen mit hoher Genauigkeit vorauszusa en Im Vergleich zu gewohnlichen chemischen Analysernethoden ist die Kapazitat von NIR hoch, so an er em interessantes Hilfsmittel in einem Zuchtprogramm fur Regenbogenforellen darstellt. Es wurde von noch grogerem Wert sein, wenn es auf rohes Fischfleisch angewendet werden konnte.
j, ’ : . ‘
Resume Estimation de la composition de la carcasse de truites irisies moyennant
fa spectroscopie de riflectance infra-rouge La spectroscopie de reflectance infra-rouge (NIR) etait utilisee pour I’estimation du porcentage d’eau, de graisse et de proteine de viande de 81 truites iristes.
Des equations d’estimation ktaient develop ees basant sur les dates N I R et des resultats d’une analyse chimique d’un morceau de viande congek a sec epais d’environ 1,5 i 2 crn. pris immediatement devant la na eoire dorsale.
Les res4tats N I R etaient obtenus comme log (1/R) pour 19 longueurs d’ondes differentes (R = reflectance de la longueur d’onde i) et approximes a la premiere et seconde derivation de log (l/R). L’analyse de regression lineaire et I’analyse de regression de la composante principale Ctaient utilisees comme methodes esrimatives.
La racine du carri rnoyen de I’estimation etait estimee aux environs de 35% de la deviation standard observee pour pourcenta e d’eau, aux environs de 45% pour ourcentage de graisse et aux environs de 50% pour pourcentage f e protiine. La correlation entre vacurs observees et estimtes etait, dans le rneilleur des cas, 0,95 our pourcentage d’eau et de graisse et 0,91 pour pourcentage de protiine. Changkes sur une base viande crue, les correlations etaient plus elevies pour eau et graisse (0,98), mais nettement plus basses pour ourcentage de proteine (0,69). L’examen present ne discerne pas entre les trois types de variables in&pendantes et non plus entre les deux methodes estimatives. Les deux methodes produisent des valeurs a biais bas.
O n en conclut que N I R facilite I’estimation de la composition de la carcasse de truites irisees avec grande precision. Comparee aux methodes usuelles d’analyses chimiques, la capacite de N I R est elevee. Ceci rend N I R interessant dans un programme d’elevage pour truites irisees. II serait d’un plus grand avantage si la methode etait appliquke sur viande crue.
Resumen
Estimacion de la composicidn de la canal de truchas Arc0 iris mediante espectroscopia de reflectancia in frarroja
La espectroscopia de reflectancia infrarroja (NIR) fue utilizada para la estimacion del porcentaje de agua, de grasa y de proteinas del musculo de 81 truchas Arc0 iris. Las ecuaciones de estimacion fueron desarrolladas basandose en datos N I R y en 10s resultados de un analisis quimico de una muestra muscular congelada en seco de aproximadamente 1,5 a 2 cm. de grosor, tomado inmediatamente por encima de la espina dorsal. Los resultados N I R fueron obtenidos como log (1/R) para 19 longitudes de onda diferentes (R = reflectancia de la longitud de onda i) y a roximados a la primera y segunda derivadas del log (l/R). El analisis de regresion lineal y el anal?& de regresion de la componente principal fueron utilizados corno metodos estimativos. La raiz del cuadrado medio de la estimacion fue estimado alrededor del35% de la desviacion estandar observada para porcentaje de agua, alrededor del

148 B. Gjerde and H. Martens
50% para el porcentaje de proteinas y alrededor del45% para el porcentaje de grasa. La correlaci6n entre valores observados y estimados fue, en el mejor de 10s casos, 0,95 para porcentaje de agua y de grasa y 0,91 para porcentaje de proteinas. Realizado el experiment0 sobre una base de tejido crudo, las correla- ciones fueron mas elevadas para agua y rasa (0,98), pero netamente mas bajas para el porcentaje de proteinas (0,69). El presente examen no cfistingue entre 10s tres tipos de variables independientes y no mas entre 10s dos metodos de estimaci6n. Los dos mktados producen valores de bajo sesgo. Se puede concluir con que NIR facilita la estimation de la composici6n de la canal de truchas Arco iris con gran presici6n. Comparado con otros mitodos usuales de andlisis quimico, la capacida de NIR es elevada. La utilizaci6n de NIR seria interesante en un rograma de cria para truchas Arc0 iris. Presentaria una mayor ventaja si el metodo fuera aplicado sotre tejido crudo.
References
ANKORION, J.; MOAV, R. and WOHLFART, G., 1967: A “modified method” for rapid determination of fat contents in fish. Bamiogeh, 19: 46-49.
BLIGH, E. G. and DYER, W. J., 1959: A rapid method of total lipid extraction and purification. Can. J. Biochem. Physiol. 37: 91 1-917.
EISEN, E. J.; BANDY, T. R.; MCCLURE, W. F. and HORSTGEN-SCHWARK, G., 1984. Estimating body composition in mice by nearinfrared spectrophotometry. J. Anim. Sci., 58: 1181-1 190.
GJERDE, B., 1987: Predicting carcass composition of rainbow trout by computerized tomography. Z. Anim. Breed. Gen. see enclosed proof Kap. 106
HYMOWITZ, T.; DUDLEY, J. W.; COLLINS, F. I. AND BROWN, C. M., 1974: Estimation of protein and oil concentration in corn, soybean and oat seed by near-infrared light reflectance. Crop. Sci., 14:
KORN, S. and MACEDO, D., 1973: Determination of fat content in fish with a nontoxic, noninflammable solvent. J. Fish. Res. Board Can. 30: 1880-1881.
KRUGGEL, W. G.; FIELD, R. A.; RILEY, M. L.; RADLOFF, H. D. and HORTON, K. M., 1981: Near- infrared reflectance determination of fat, protein and moisture in fresh meat. J. Assoc. Off. Anal. Chem., 64: 692-696.
LANZA, E., 1983: Determination of moisture, protein, fat and calories in raw pork and beef by near- infrared spectroscopy. J. Food Sci., 48: 471474.
MARTENS, H., 1985: Multivariate calibration. Quantitative interpretation of non-selective chemical data. Dr. techn.-thesis. Technical University of Norway, Trondheim 1985.
MARTENS, H., BAKKER, E, A. and HILDRUM, K. I., 1981 : Application of near-infrared reflectance spectrometry in the analysis of meat products. In: Proceedings of 27th European Meeting of Meat Research Workers, Wien, Austria, August 24.-28., 0. Prandl, Ed. (1981), pp. 561-564.
MCCLURE, W. F., NORRIS, K. H. and WEEKS, W. W., 1977: Rapid spectro hotometric analysis of the chemical composition of tobacco. Part 1: Total reducing sugars. Beitr. Xbakforsch., 9: 13-18.
NORRIS, K. H . ; BARNES, R. F.; MOORE, J. E. and SHENK, J. S., 1976: Predicting forage quality by infrared reflectance spectroscopy. J. Anim. Sci., 43: 889-897.
WISTRIECH, H. E.; THOMPSON, J. E. and KARMAS, E., 1960: Rapid method for moisture and fat determination in biological materials. Anal. Chem. 32: 1054.
71 3-71 5.
Authors’addresses: B. GJERDE, The Agriculture Research Couned of Norway, Institute of Aquaculture Reseach, N-1432 AS-NLH, Norway. H. MARTENS, Norwegian Computing Cen- ter, Blindern, N-0314 Oslo 3, Norway


