Embed Size (px)
Citation preview
C O V I D - 1 9 C O M M U N I T Y I M P A C T S U R V E Y : R A C E
P O P U L A T I O N S P O T L I G H T S & D I S C R I M I N A T I O N
P r e s e n t e d b y : W . W . S a n o u r i U r s p r u n g P h D C o - A u t h o r s : G l o r y S o n g M P H , E l i z a b e t h B e a t r i z P h D , R o b e r t
L i e b o w i t z P h D , V e r a M o u r a d i a n P h D , A l l i s o n G u a r i n o M P H , B e a t r i z P a z o s M P H , C a r o l i n e S t a c k M P H , L a u r e n C a r d o s o P h D , L i s a
A r s e n a u l t P H D , & W . W . S a n o u r i U r s p r u n g P h D
R e s u l t s a s o f J u n e 8 , 2 0 2 1
Massachuse t t s Depa r tmen t o f Pub l i c Hea l t h
2
This webinar is meant to be watched after you have already seen the CCIS Introduction Webinar.
The introduction contains important background information explaining how to interpret these results,
how we did the survey, and how to frame these findings with a racial justice lens so that we can all
turn the CCIS data into action!
Visit http://mass.gov/covidsurvey for more!
R E M I N D E R
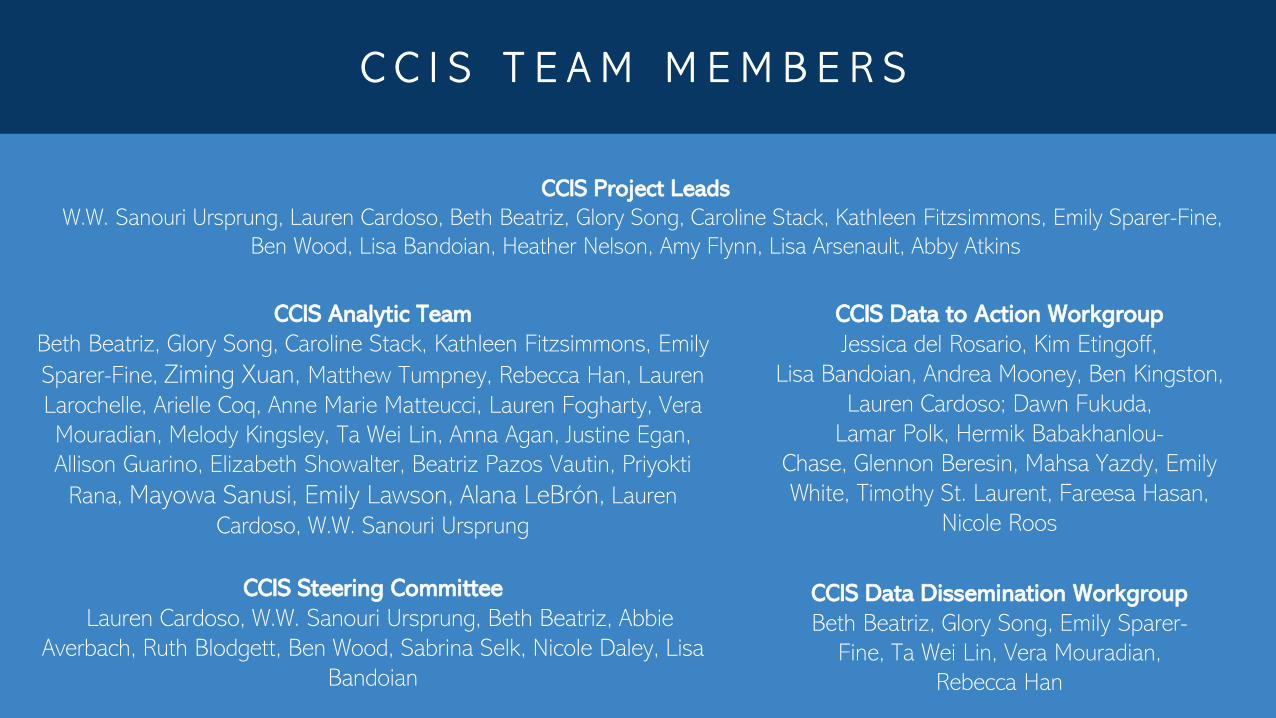
C C I S T E A M M E M B E R S
CCIS Steering CommitteeLauren Cardoso, W.W. Sanouri Ursprung, Beth Beatriz, Abbie
Averbach, Ruth Blodgett, Ben Wood, Sabrina Selk, Nicole Daley, Lisa Bandoian
CCIS Project LeadsW.W. Sanouri Ursprung, Lauren Cardoso, Beth Beatriz, Glory Song, Caroline Stack, Kathleen Fitzsimmons, Emily Sparer-Fine,
Ben Wood, Lisa Bandoian, Heather Nelson, Amy Flynn, Lisa Arsenault, Abby Atkins
CCIS Analytic TeamBeth Beatriz, Glory Song, Caroline Stack, Kathleen Fitzsimmons, Emily Sparer-Fine, Ziming Xuan, Matthew Tumpney, Rebecca Han, Lauren Larochelle, Arielle Coq, Anne Marie Matteucci, Lauren Fogharty, Vera Mouradian, Melody Kingsley, Ta Wei Lin, Anna Agan, Justine Egan, Allison Guarino, Elizabeth Showalter, Beatriz Pazos Vautin, Priyokti
Rana, Mayowa Sanusi, Emily Lawson, Alana LeBrón, Lauren Cardoso, W.W. Sanouri Ursprung
CCIS Data to Action WorkgroupJessica del Rosario, Kim Etingoff,
Lisa Bandoian, Andrea Mooney, Ben Kingston, Lauren Cardoso; Dawn Fukuda,
Lamar Polk, Hermik Babakhanlou-Chase, Glennon Beresin, Mahsa Yazdy, Emily White, Timothy St. Laurent, Fareesa Hasan,
Nicole Roos
CCIS Data Dissemination WorkgroupBeth Beatriz, Glory Song, Emily Sparer-
Fine, Ta Wei Lin, Vera Mouradian, Rebecca Han
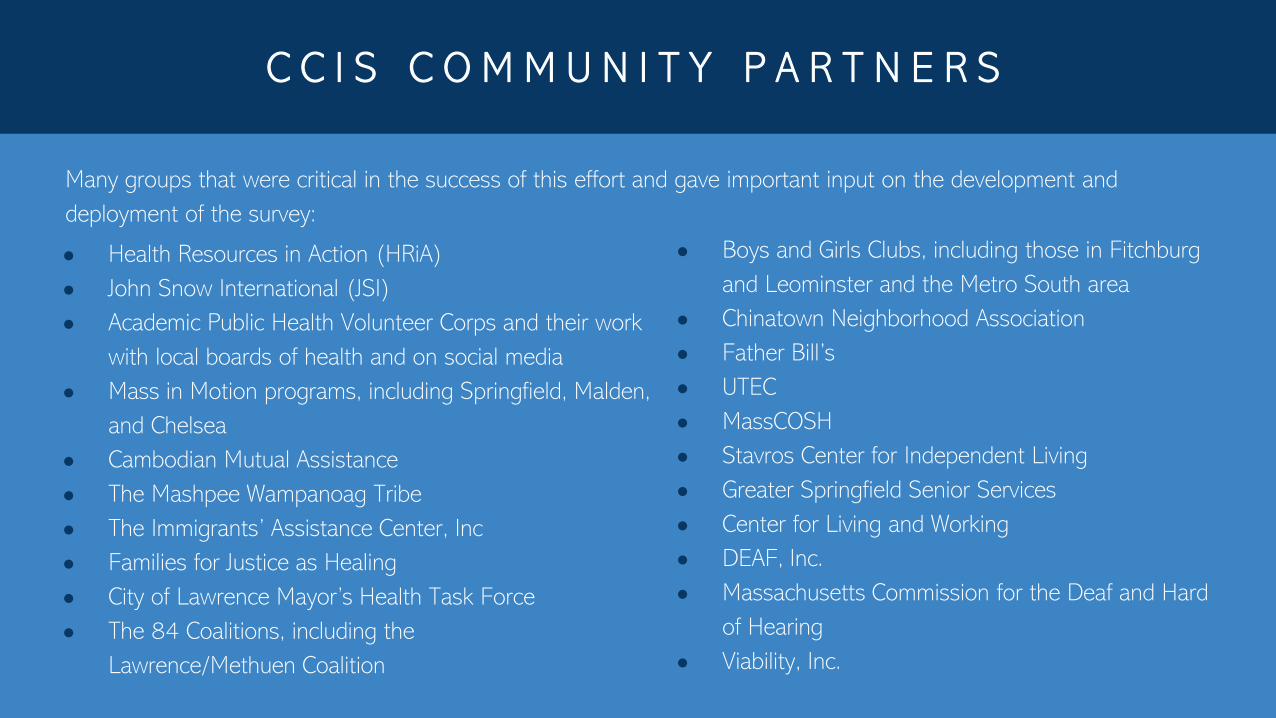
C C I S C O M M U N I T Y P A R T N E R S
● Health Resources in Action (HRiA)● John Snow International (JSI)● Academic Public Health Volunteer Corps and their work
with local boards of health and on social media● Mass in Motion programs, including Springfield, Malden,
and Chelsea● Cambodian Mutual Assistance● The Mashpee Wampanoag Tribe● The Immigrants’ Assistance Center, Inc● Families for Justice as Healing● City of Lawrence Mayor’s Health Task Force● The 84 Coalitions, including the
Lawrence/Methuen Coalition
● Boys and Girls Clubs, including those in Fitchburg and Leominster and the Metro South area
● Chinatown Neighborhood Association● Father Bill’s● UTEC● MassCOSH● Stavros Center for Independent Living● Greater Springfield Senior Services● Center for Living and Working● DEAF, Inc.● Massachusetts Commission for the Deaf and Hard
of Hearing● Viability, Inc.
Many groups that were critical in the success of this effort and gave important input on the development and deployment of the survey:

P U R P O S E A N D I N T E N T
3.10.21 release
R A C E & D I S C R I M I N A T I O N
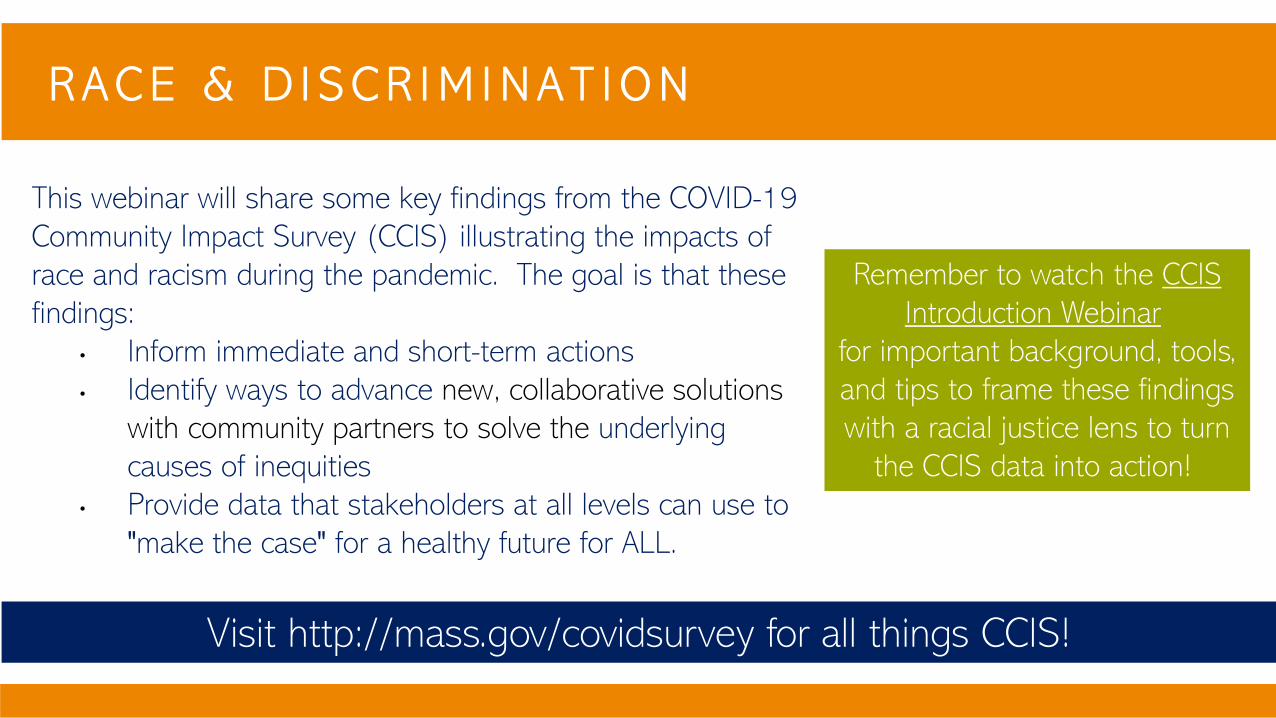
This webinar will share some key findings from the COVID-19 Community Impact Survey (CCIS) illustrating the impacts of race and racism during the pandemic. The goal is that these findings:
• Inform immediate and short-term actions • Identify ways to advance new, collaborative solutions
with community partners to solve the underlying causes of inequities
• Provide data that stakeholders at all levels can use to "make the case" for a healthy future for ALL.
Remember to watch the CCIS Introduction Webinar
for important background, tools, and tips to frame these findings with a racial justice lens to turn
the CCIS data into action!
Visit http://mass.gov/covidsurvey for all things CCIS!
F R A M I N G M A T T E R S : h o w t o r e a d t h e s e f i n d i n g s w i t h a
r a c i a l j u s t i c e l e n s
3.10.21 release
8
Racism is…
-David Wellman, Portraits of White Racism
A system of advantage based on race.
9
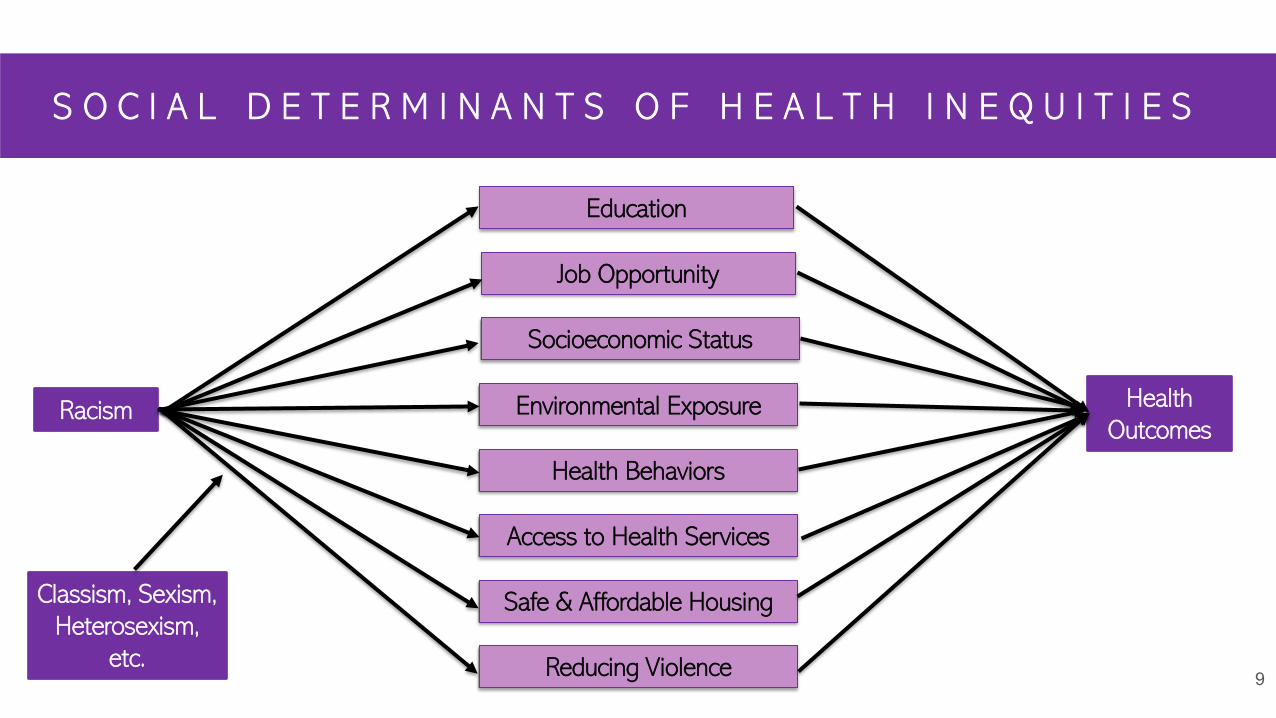
S O C I A L D E T E R M I N A N T S O F H E A L T H I N E Q U I T I E S
Racism Health Outcomes
Education
Job Opportunity
Socioeconomic Status
Environmental Exposure
Health Behaviors
Access to Health Services
Safe & Affordable Housing
Reducing Violence
Classism, Sexism, Heterosexism,
etc.
10
U N D E R S T A N D I N G F R A M E S
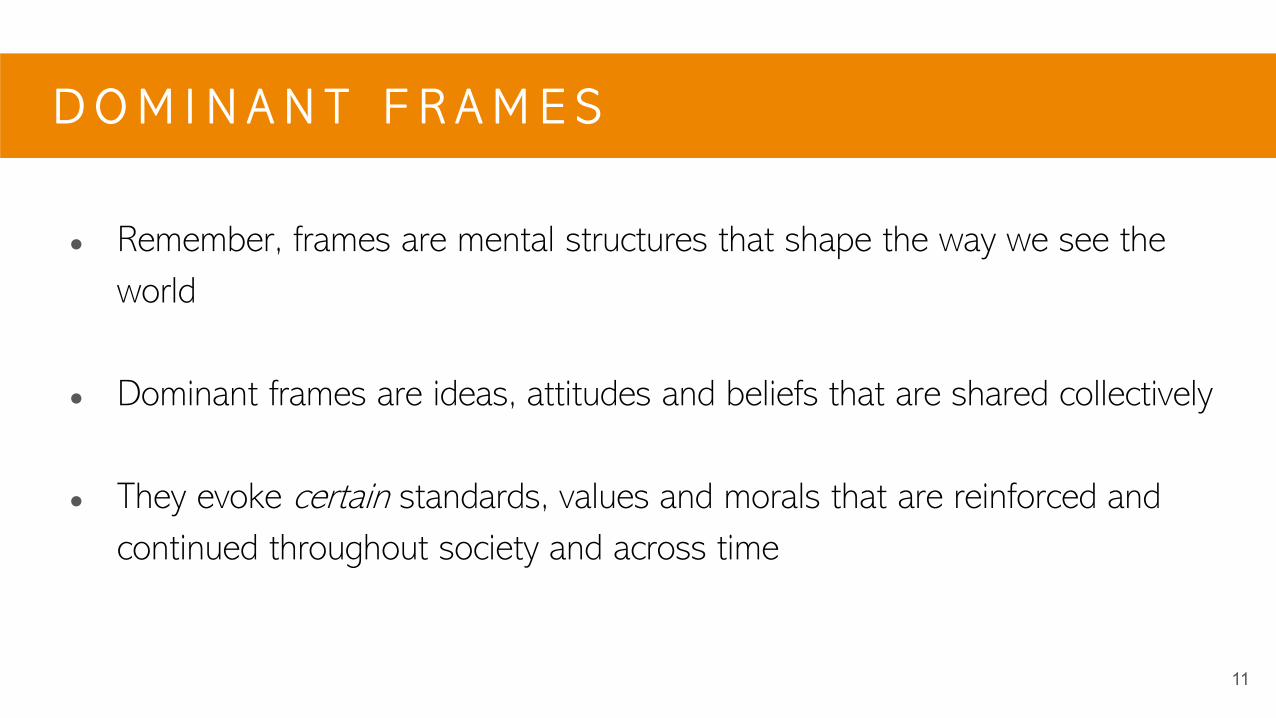
● Remember, frames are mental structures that shape the way we see the world
● Dominant frames are ideas, attitudes and beliefs that are shared collectively
● They evoke certain standards, values and morals that are reinforced and continued throughout society and across time
11
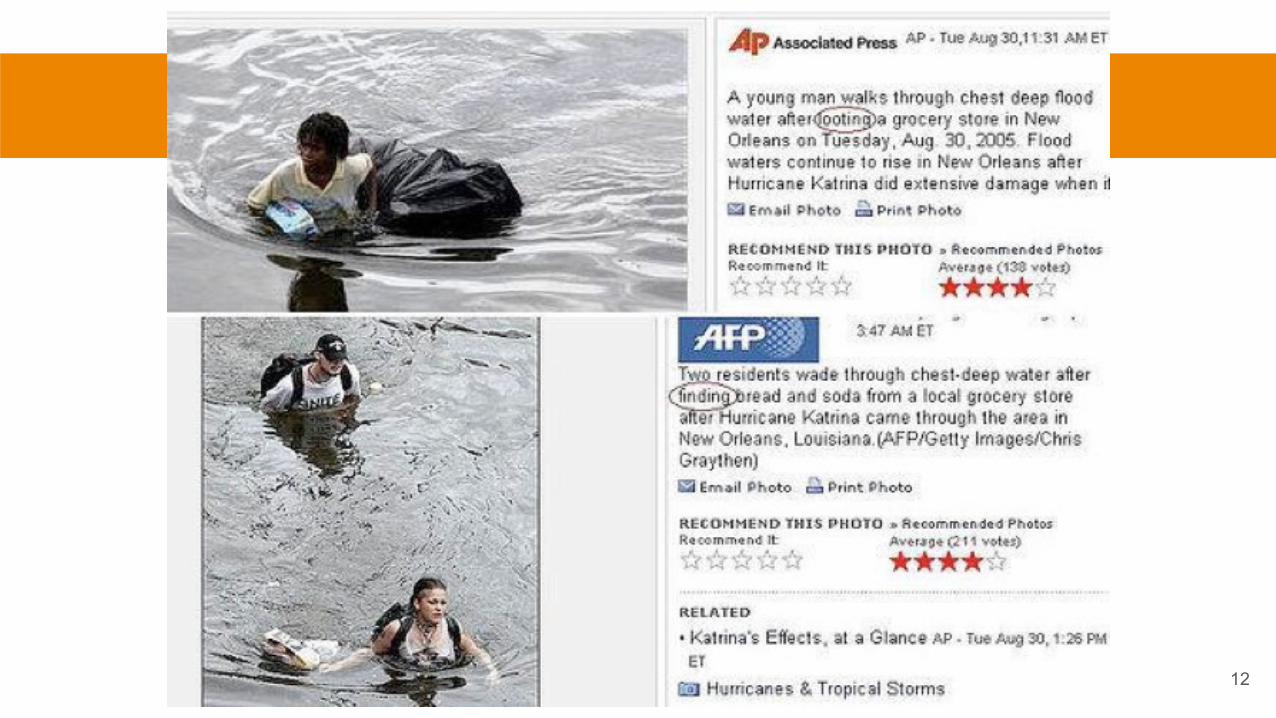
D O M I N A N T F R A M E S
12

13
R E F R A M I N G
14
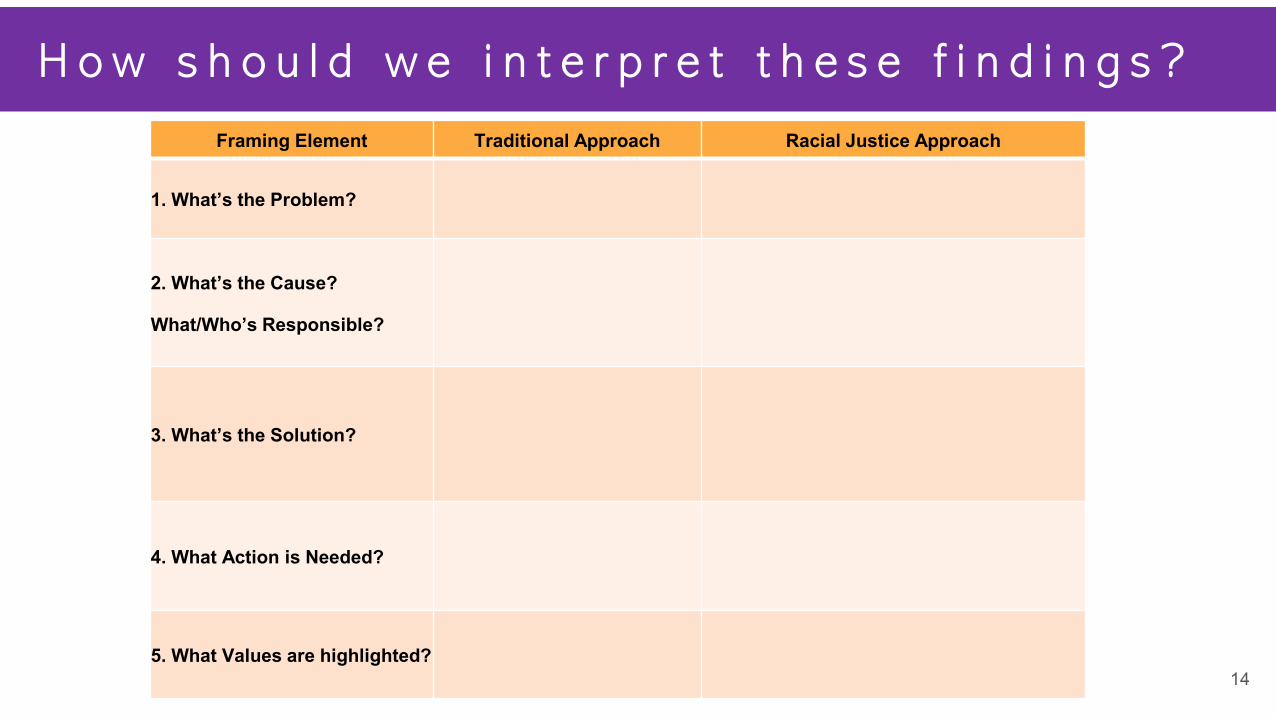
Framing Element Traditional Approach Racial Justice Approach
1. What’s the Problem?
2. What’s the Cause?
What/Who’s Responsible?
3. What’s the Solution?
4. What Action is Needed?
5. What Values are highlighted?
H o w s h o u l d w e i n t e r p r e t t h e s e f i n d i n g s ?
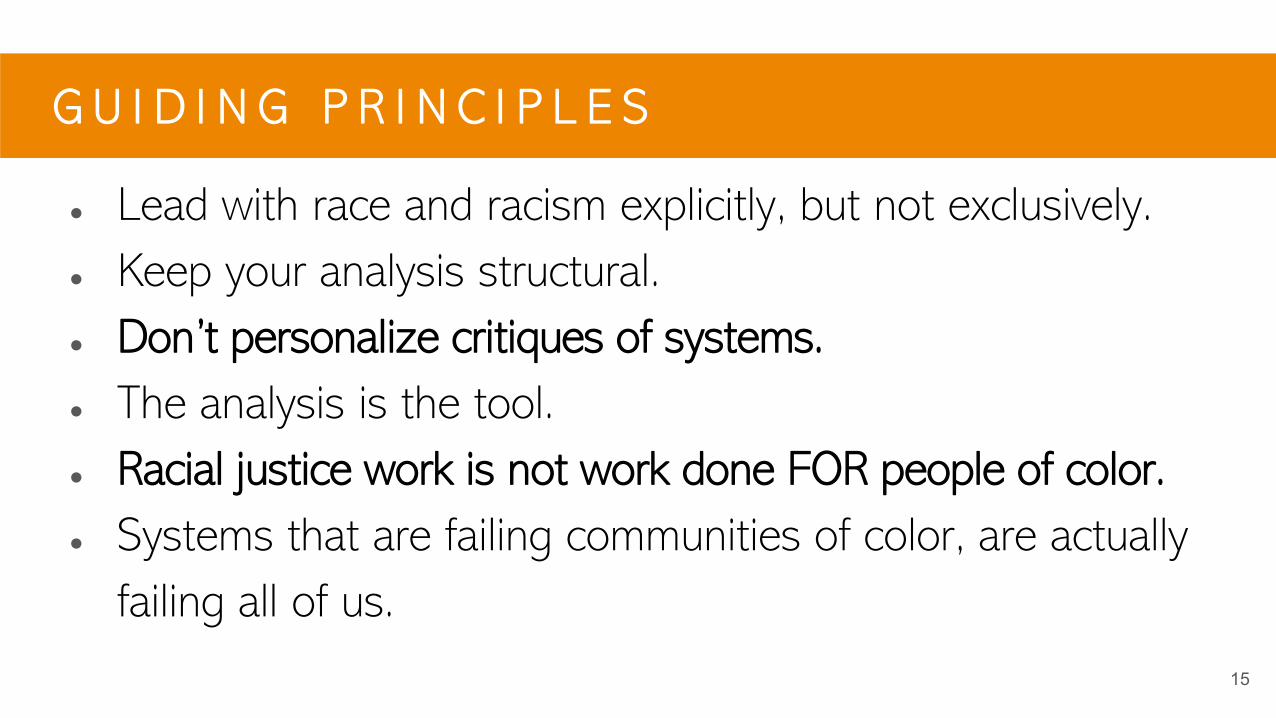
● Lead with race and racism explicitly, but not exclusively.● Keep your analysis structural.● Don’t personalize critiques of systems.● The analysis is the tool.● Racial justice work is not work done FOR people of color.● Systems that are failing communities of color, are actually
failing all of us.
15
G U I D I N G P R I N C I P L E S
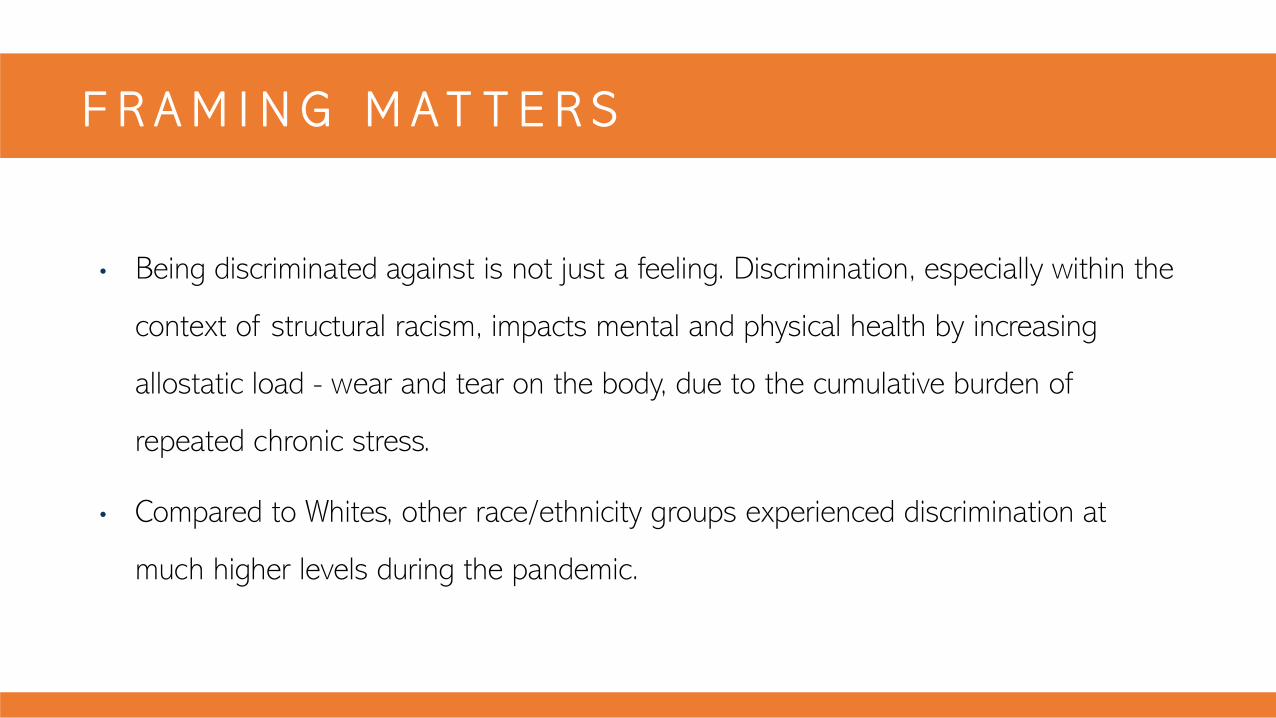
• Being discriminated against is not just a feeling. Discrimination, especially within the
context of structural racism, impacts mental and physical health by increasing
allostatic load - wear and tear on the body, due to the cumulative burden of
repeated chronic stress.
• Compared to Whites, other race/ethnicity groups experienced discrimination at
much higher levels during the pandemic.
F R A M I N G M A T T E R S
D I S C R I M I N A T I O NR o b e r t L i e b o w i t z P h D
V e r a M o u r a d i a n P h DG l o r y S o n g M P H
E l i z a b e t h B e a t r i z P h DC a r o l i n e S t a c k M P HL i s a A r s e n a u l t P H D
L a u r e n C a r d o s o P h DW. W . S a n o u r i U r s p r u n g P h D
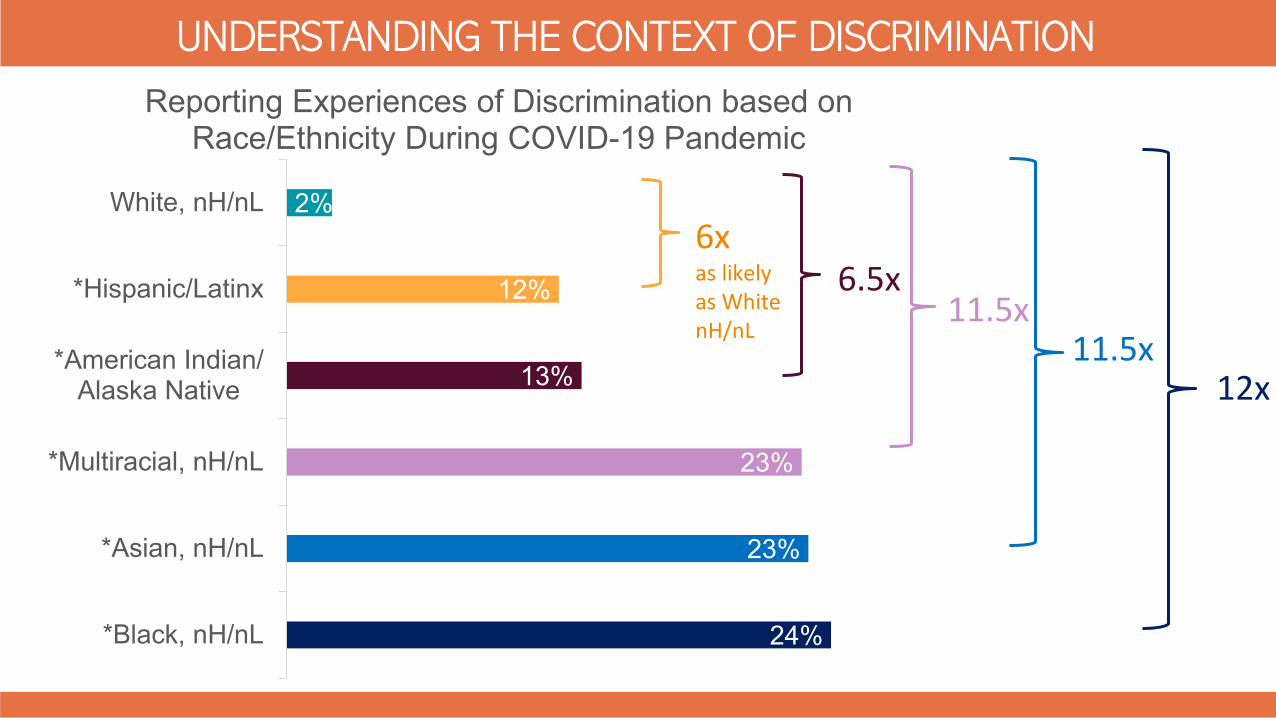
UNDERSTANDING THE CONTEXT OF DISCRIMINATION
24%
23%
23%
13%
12%
2%
*Black, nH/nL
*Asian, nH/nL
*Multiracial, nH/nL
*American Indian/Alaska Native
*Hispanic/Latinx
White, nH/nL
Reporting Experiences of Discrimination based on Race/Ethnicity During COVID-19 Pandemic
6x as likely as White nH/nL
11.5x6.5x
11.5x12x
5%
24%23%
23%14%
12%2%
19%9%
6%4%
9%5%
13%3%
12%4%
8%2%
10%5%
9%5%
9%5%
6%5%
6%5%
9%8%
8%7%
5%4%
9%5%
5%4%
0% 5% 10% 15% 20% 25%ALL RESPONDENTS
*BLACK NH*ASIAN NH
*MULTIRACIAL*AMERICAN INDIAN/ALASKA NATIVE
*HISPANICWHITE NH
*QUESTIONING/NOT SURE*NONBINARY, GENDERQUEER, NOT EXCLUSIVELY M/F
MALE*FEMALE
*OF TRANS EXPERIENCENOT OF TRANS EXPERIENCE
*SPEAKS LANGUAGE OTHER THAN ENGLISHONLY ENGLISH
LESS THAN HSGRADUATE DEGREE
LESS THAN $35K*GREATER THAN $150K
*COGNITIVE DISABILITYNO COGNITIVE DISABILITY
*SELF-CARE/INDIVIDUAL LIVING DISABILITYNO SELF-CARE/INDIVIDUAL LIVING DISABILITY
*BLIND/PEOPLE WITH VISION IMPAIRMENT NOT BLIND
*MOBILITY DISABILITYNO MOBILITY DISABILITY
*DEAF/HARD OF HEARING NOT DEAF
*QUESTIONING OR NOT SURE*BI/PANSEXUAL
*QUEER*ASEXUAL
GAY OR LESBIANSTRAIGHT
SUFFOLK COUNTYESSEX COUNTY
HAMPDEN COUNTY NORFOLK COUNTY
20
DISCRIMINATION DEMOGRAPHICS
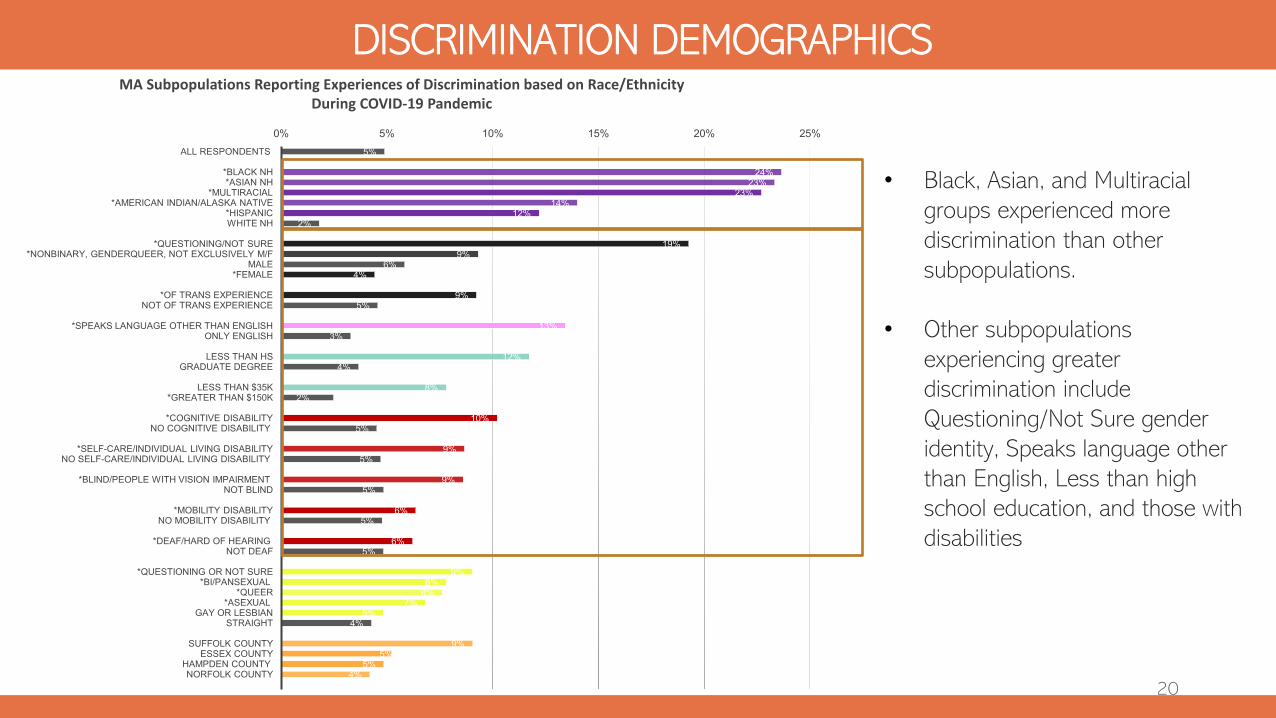
• Black, Asian, and Multiracial groups experienced more discrimination than other subpopulations.
• Other subpopulations experiencing greater discrimination include Questioning/Not Sure gender identity, Speaks language other than English, Less than high school education, and those with disabilities
MA Subpopulations Reporting Experiences of Discrimination based on Race/Ethnicity During COVID-19 Pandemic
21
DISCRIMINATION HOT SPOTS
Preliminary data – 3.19.21 - Not for external distribution
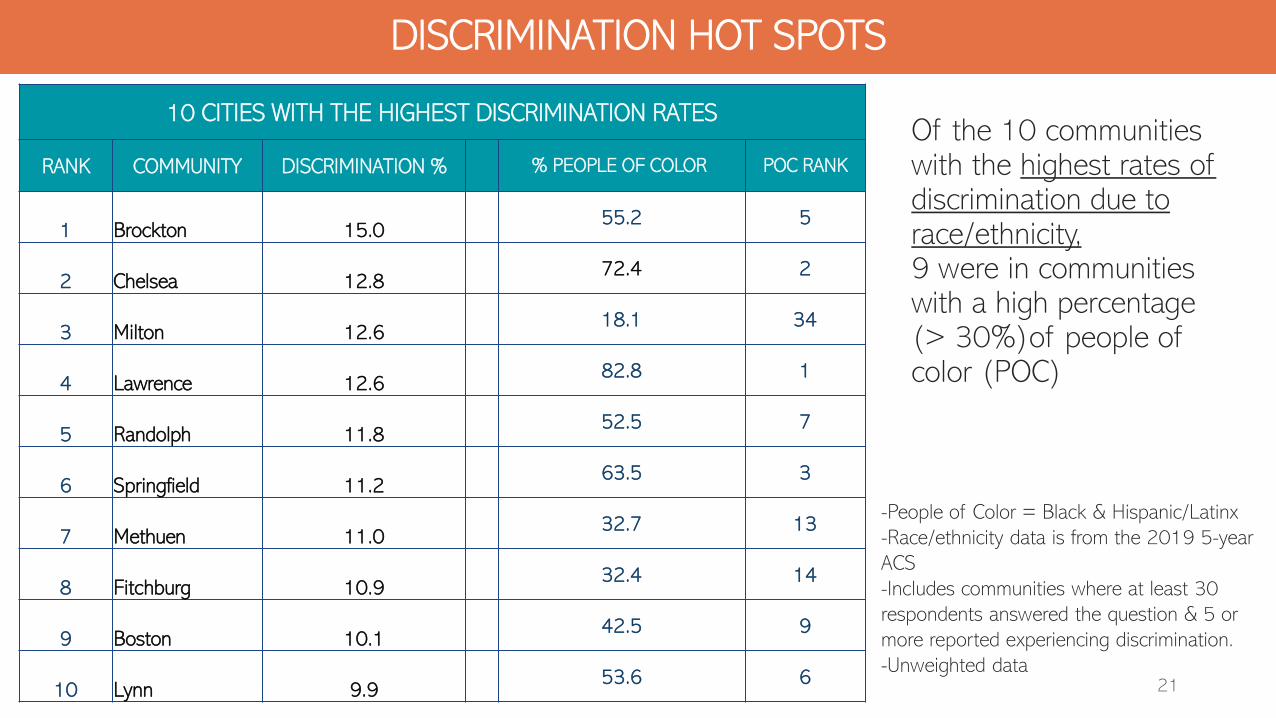
10 CITIES WITH THE HIGHEST DISCRIMINATION RATES
RANK COMMUNITY DISCRIMINATION % % PEOPLE OF COLOR POC RANK
1 Brockton 15.055.2 5
2 Chelsea 12.872.4 2
3 Milton 12.618.1 34
4 Lawrence 12.682.8 1
5 Randolph 11.852.5 7
6 Springfield 11.263.5 3
7 Methuen 11.032.7 13
8 Fitchburg 10.932.4 14
9 Boston 10.142.5 9
10 Lynn 9.953.6 6
Of the 10 communities with the highest rates of discrimination due to race/ethnicity,9 were in communities with a high percentage (> 30%)of people of color (POC)
-People of Color = Black & Hispanic/Latinx-Race/ethnicity data is from the 2019 5-year ACS-Includes communities where at least 30 respondents answered the question & 5 or more reported experiencing discrimination.-Unweighted data
W i t h i n t h e c o n t e x t o f s t r u c t u r a l r a c i s m , d i s c r i m i n a t i o n i s p e r v a s i v e i n i n s t i t u t i o n s , o r g a n i z a t i o n s , b u s i n e s s e s , i n p u b l i c i n t e r p e r s o n a l e n c o u n t e r s , a n d i n s y s t e m s l i k e
p o l i c i n g a n d s e c u r i t y . U n d e r s t a n d i n g t h i s w i d e s p r e a d m a n i f e s t a t i o n i s c r u c i a l t o p r e v e n t i n g i t .
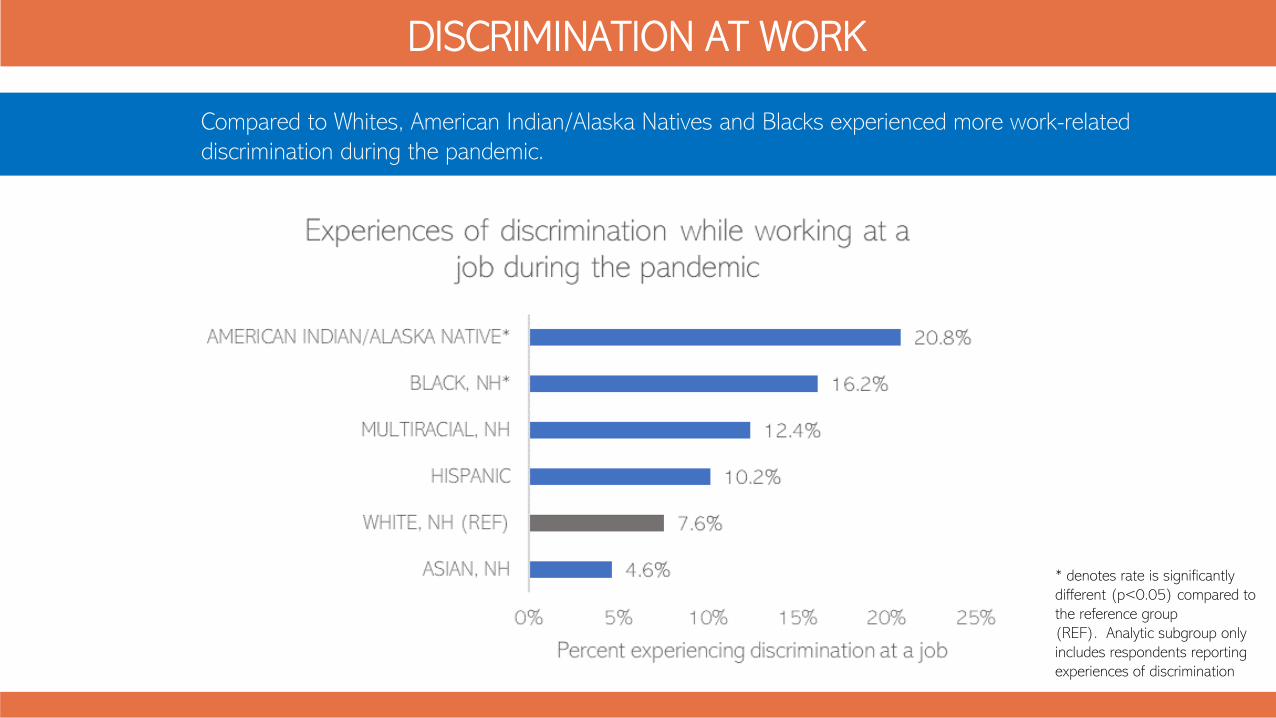
DISCRIMINATION AT WORK
Compared to Whites, American Indian/Alaska Natives and Blacks experienced more work-related discrimination during the pandemic.
* denotes rate is significantly different (p<0.05) compared to the reference group (REF). Analytic subgroup only includes respondents reporting experiences of discrimination
* denotes rate is significantly different (p<0.05) compared to the reference group (REF), which includes all race/ethnicities due to small counts.<NOTE: Analytic subgroup only includes respondents reporting experiences of discrimination 0.0
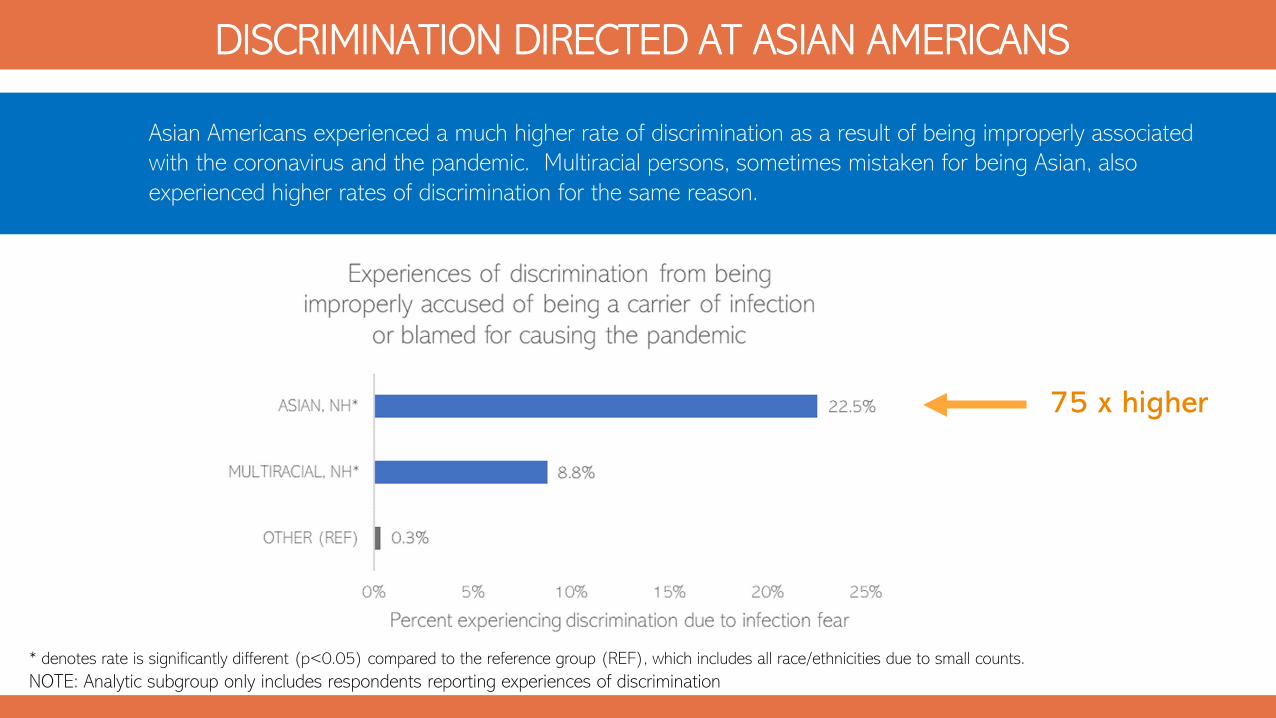
DISCRIMINATION DIRECTED AT ASIAN AMERICANS
Asian Americans experienced a much higher rate of discrimination as a result of being improperly associated with the coronavirus and the pandemic. Multiracial persons, sometimes mistaken for being Asian, also experienced higher rates of discrimination for the same reason.
75 x higher
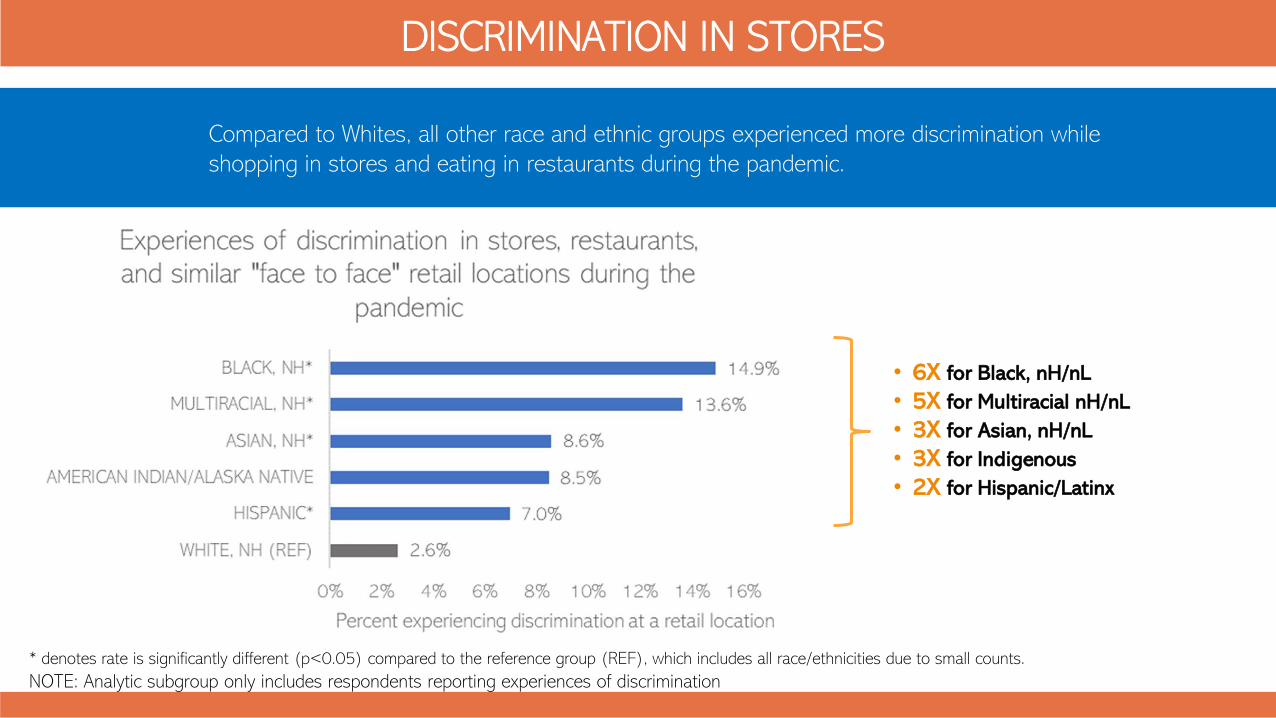
DISCRIMINATION IN STORES
Compared to Whites, all other race and ethnic groups experienced more discrimination while shopping in stores and eating in restaurants during the pandemic.
* denotes rate is significantly different (p<0.05) compared to the reference group (REF), which includes all race/ethnicities due to small counts.<NOTE: Analytic subgroup only includes respondents reporting experiences of discrimination 0.0
• 6X for Black, nH/nL• 5X for Multiracial nH/nL• 3X for Asian, nH/nL• 3X for Indigenous • 2X for Hispanic/Latinx
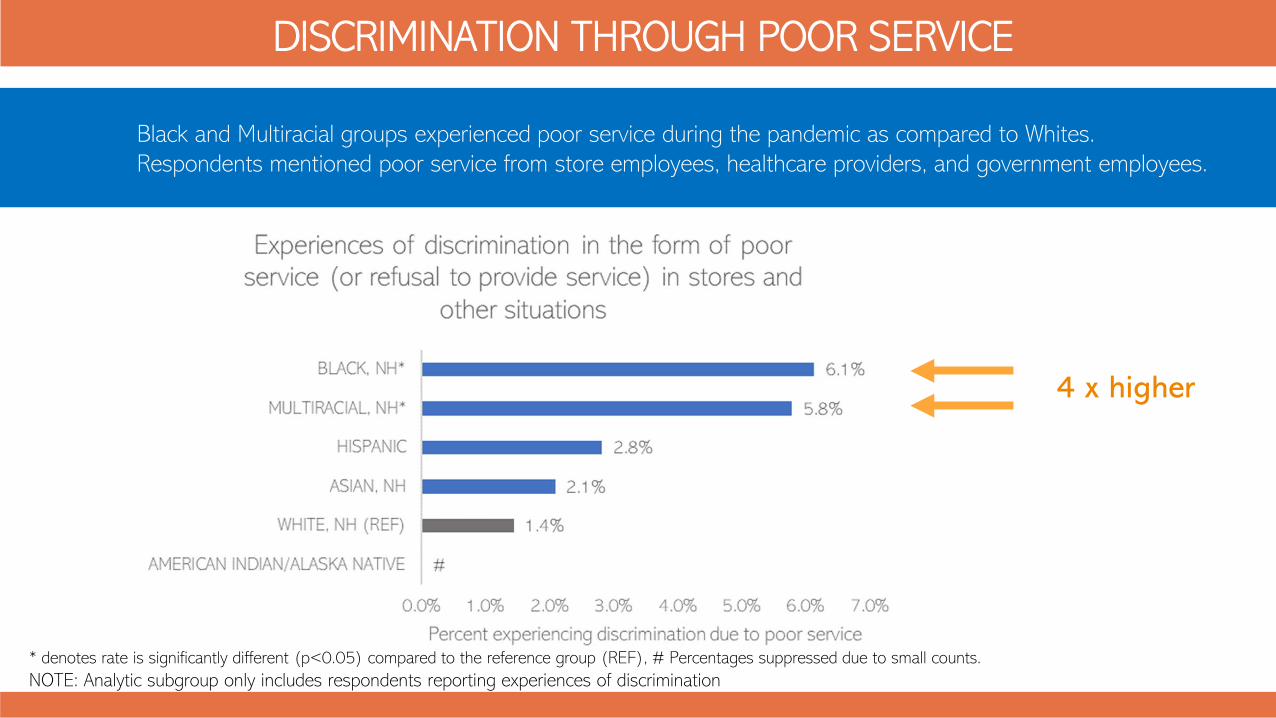
DISCRIMINATION THROUGH POOR SERVICE
Black and Multiracial groups experienced poor service during the pandemic as compared to Whites. Respondents mentioned poor service from store employees, healthcare providers, and government employees.
* denotes rate is significantly different (p<0.05) compared to the reference group (REF), # Percentages suppressed due to small counts. NOTE: Analytic subgroup only includes respondents reporting experiences of discrimination 0.0
4 x higher
* denotes rate is significantly different (p<0.05) compared to the reference group (REF). The reference group combines White, Asian, and Other race groups for the purposes of this analysis due to small numbers. Analytic subgroup only includes respondents reporting experiences of discrimination..
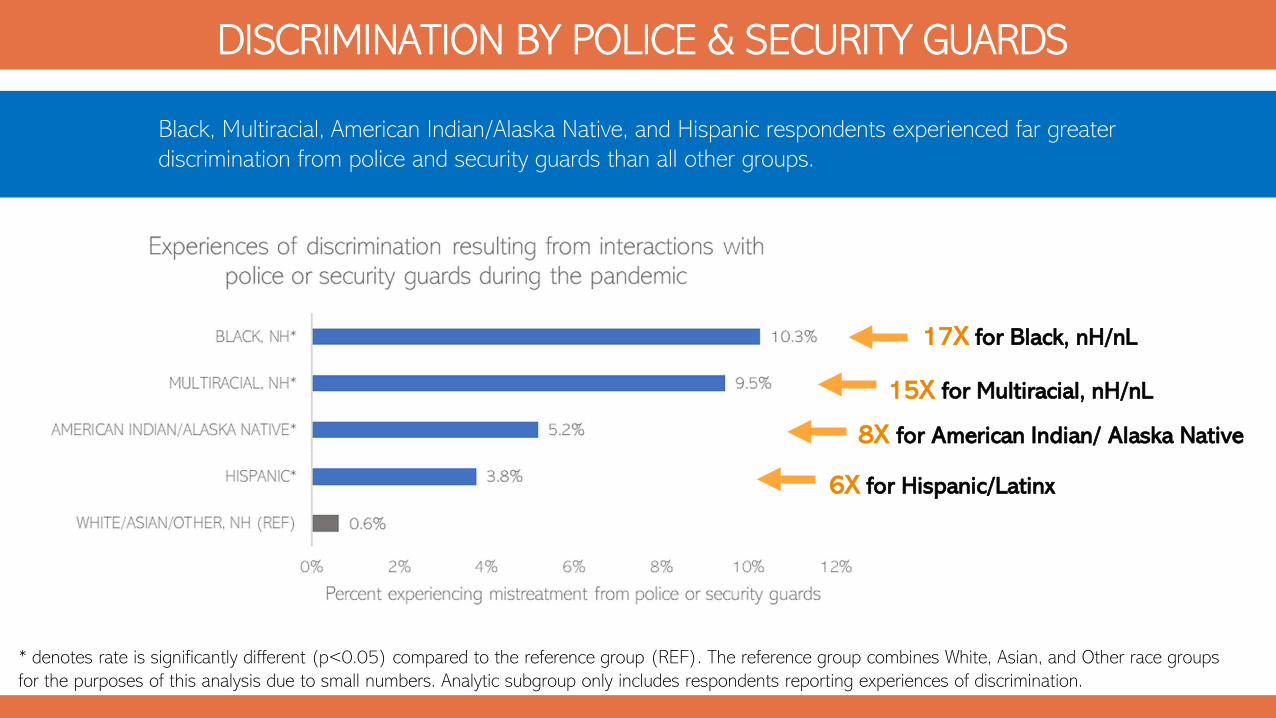
DISCRIMINATION BY POLICE & SECURITY GUARDS
Black, Multiracial, American Indian/Alaska Native, and Hispanic respondents experienced far greater discrimination from police and security guards than all other groups.
17X for Black, nH/nL
15X for Multiracial, nH/nL
8X for American Indian/ Alaska Native
6X for Hispanic/Latinx
D i s c r i m i n a t i o n h a s r e a l a n d l a s t i n g h e a l t h i m p a c t s .
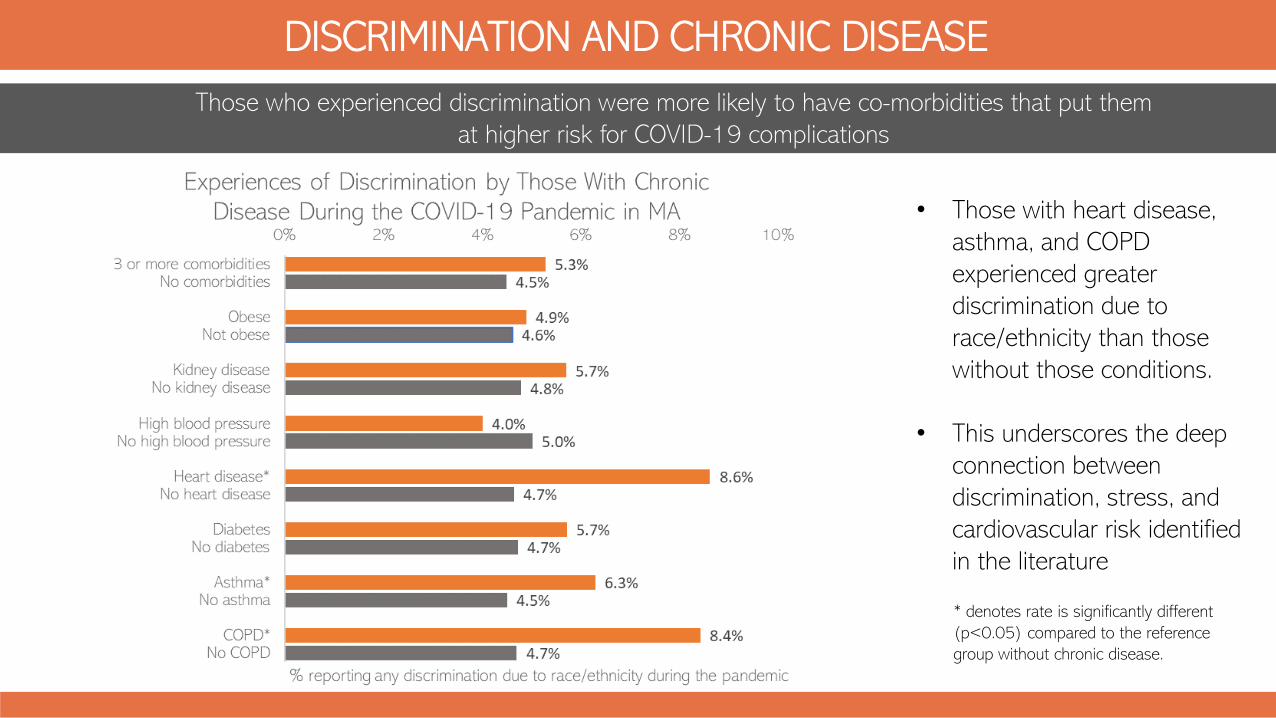
DISCRIMINATION AND CHRONIC DISEASE
• Those with heart disease, asthma, and COPD experienced greater discrimination due to race/ethnicity than those without those conditions.
• This underscores the deep connection between discrimination, stress, and cardiovascular risk identified in the literature
* denotes rate is significantly different (p<0.05) compared to the reference group without chronic disease.
Those who experienced discrimination were more likely to have co-morbidities that put them at higher risk for COVID-19 complications
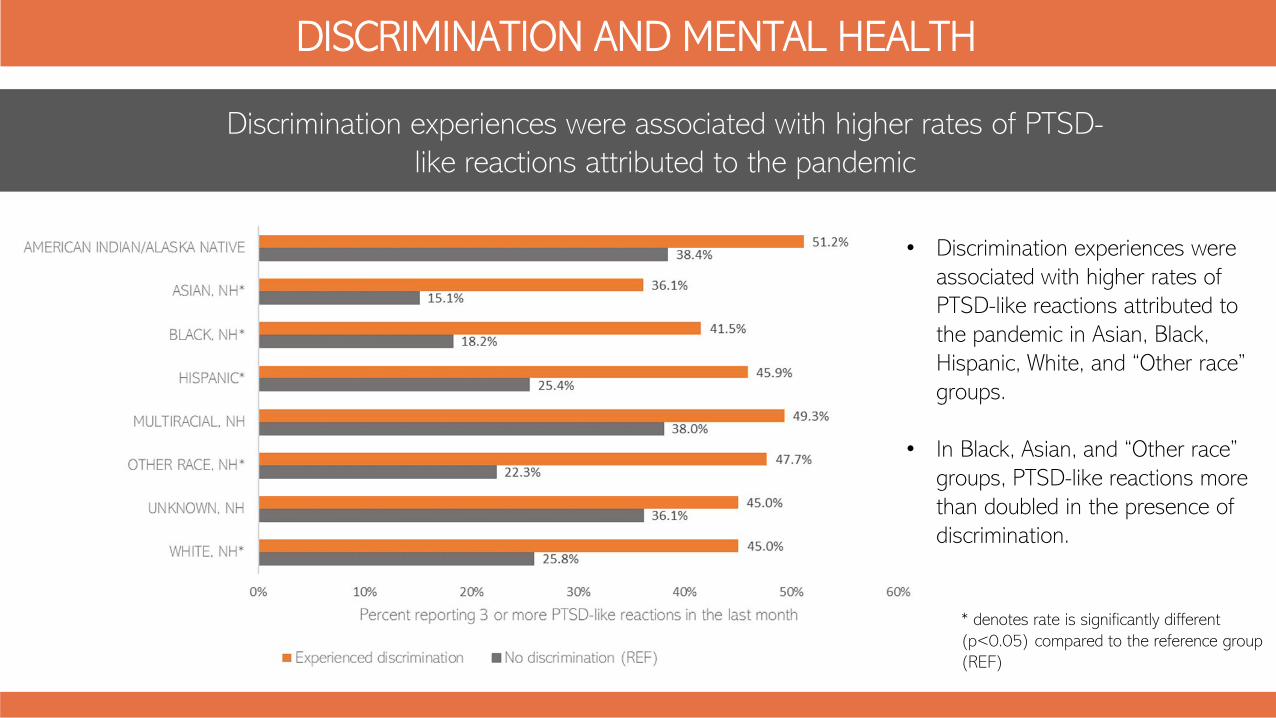
DISCRIMINATION AND MENTAL HEALTH
* denotes rate is significantly different (p<0.05) compared to the reference group (REF)
Discrimination experiences were associated with higher rates of PTSD-like reactions attributed to the pandemic
• Discrimination experiences were associated with higher rates of PTSD-like reactions attributed to the pandemic in Asian, Black, Hispanic, White, and “Other race” groups.
• In Black, Asian, and “Other race” groups, PTSD-like reactions more than doubled in the presence of discrimination.
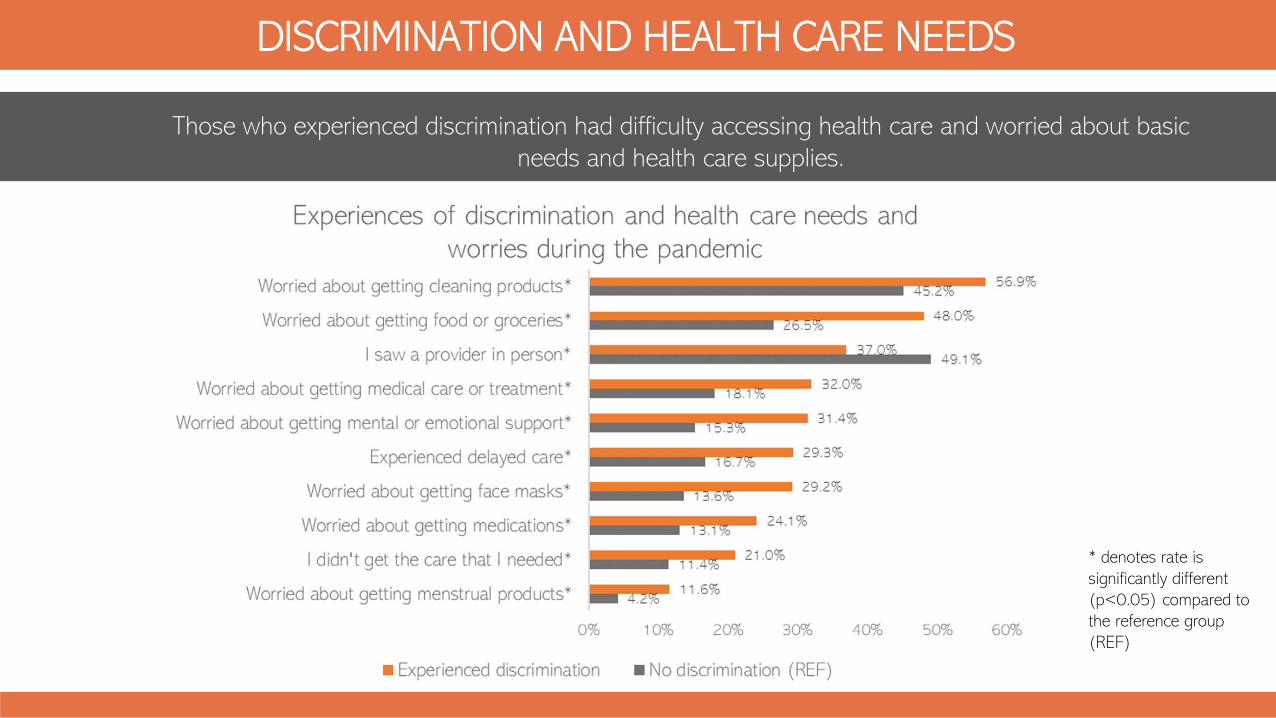
DISCRIMINATION AND HEALTH CARE NEEDS
Those who experienced discrimination had difficulty accessing health care and worried about basic needs and health care supplies.
* denotes rate is significantly different (p<0.05) compared to the reference group (REF)
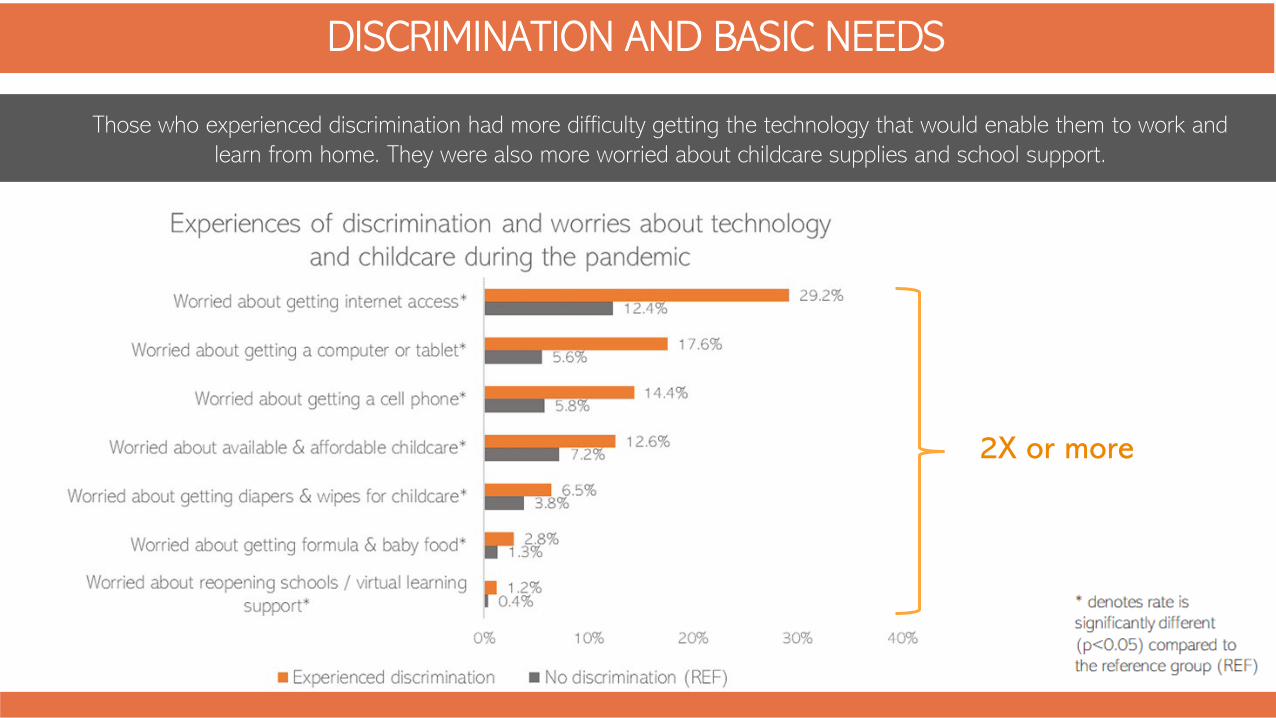
DISCRIMINATION AND BASIC NEEDS
Those who experienced discrimination had more difficulty getting the technology that would enable them to work and learn from home. They were also more worried about childcare supplies and school support.
2X or more
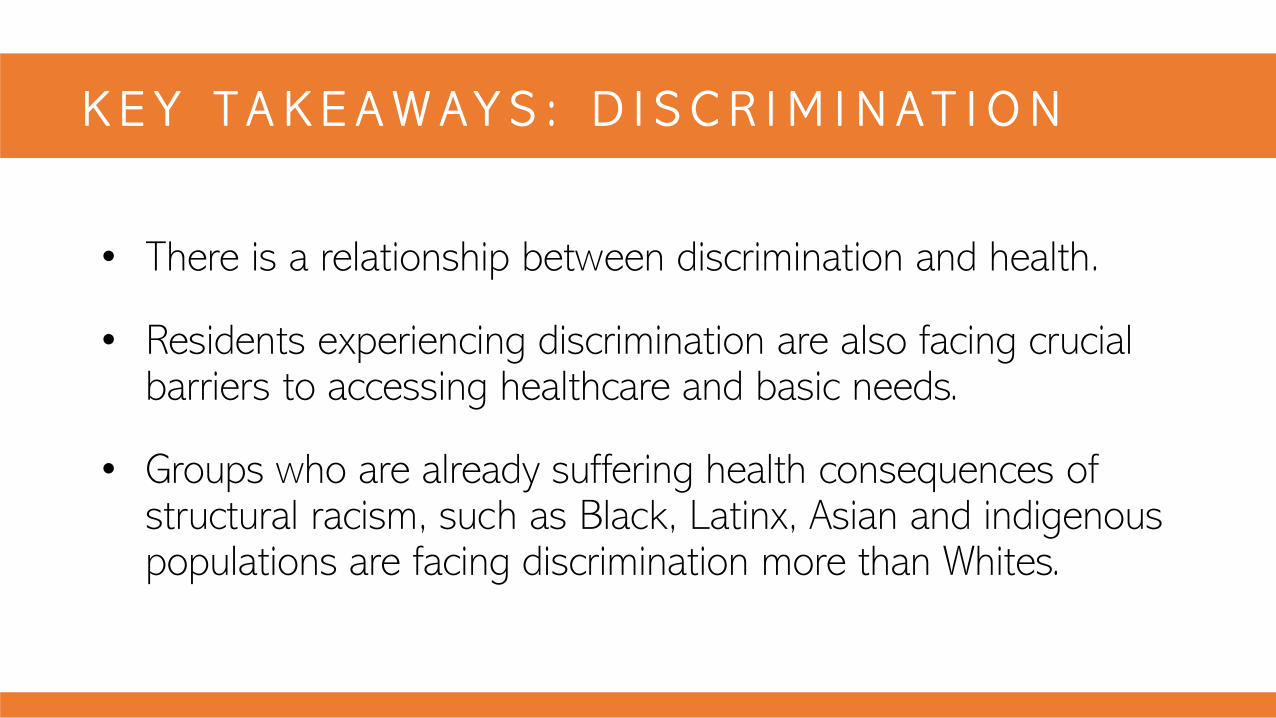
• There is a relationship between discrimination and health.
• Residents experiencing discrimination are also facing crucial barriers to accessing healthcare and basic needs.
• Groups who are already suffering health consequences of structural racism, such as Black, Latinx, Asian and indigenous populations are facing discrimination more than Whites.
K E Y T A K E A W A Y S : D I S C R I M I N A T I O N
P O P U L A T I O N S P O T L I G H T :A S I A N A M E R I C A N R E S I D E N T S
“ I n t he popu l a r imag i na t i on , As i an Ame r i c ans a r e a l l h i gh -a ch i e v i ng p ro f e ss i ona l s . Bu t i n r ea l i t y , t h i s i s t he mos t economica l l y d i v i ded g roup i n t he coun t r y , a t enuous a l l i a n ce o f peop l e w i t h r oo t s f r om
Sou th As i a t o Eas t As i a t o t he Pac i f i c I s l ands , f r om t e ch m i l l i ona i r e s t o se r v i ce i ndus t r y l abo re r s . How do we speak hones t l y abou t t he
As i an Ame r i c an cond i t i on—i f su ch a t h i ng e x i s t s? ”
- - C a t h y P a r k H o n g , M i n o r F e e l i n g s : A n A s i a n A m e r i c a n R e c k o n i n g
A A P I I N M A S S A C H U S E T T S
Chinese35%
Asian Indian23%
Vietnamese12%
Cambodian7%
Korean5%
Filipino3%
Pakistani3%
Japanese2%
Taiwanese1%
Other Asian9%
US Census 2016
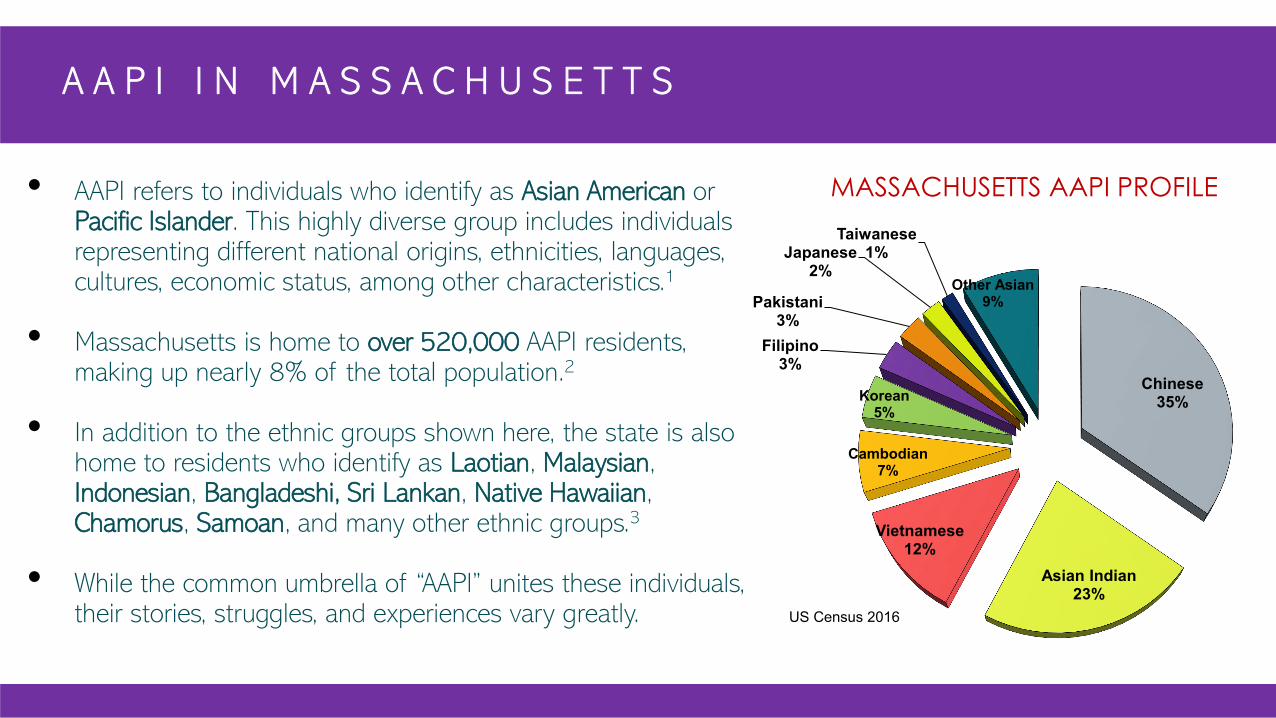
• AAPI refers to individuals who identify as Asian American or Pacific Islander. This highly diverse group includes individuals representing different national origins, ethnicities, languages, cultures, economic status, among other characteristics.1
• Massachusetts is home to over 520,000 AAPI residents, making up nearly 8% of the total population.2
• In addition to the ethnic groups shown here, the state is also home to residents who identify as Laotian, Malaysian, Indonesian, Bangladeshi, Sri Lankan, Native Hawaiian, Chamorus, Samoan, and many other ethnic groups.3
• While the common umbrella of “AAPI” unites these individuals, their stories, struggles, and experiences vary greatly.
MASSACHUSETTS AAPI PROFILE
R E A C H I N G T H E A A P I C O M M U N I T I E S O N C C I S
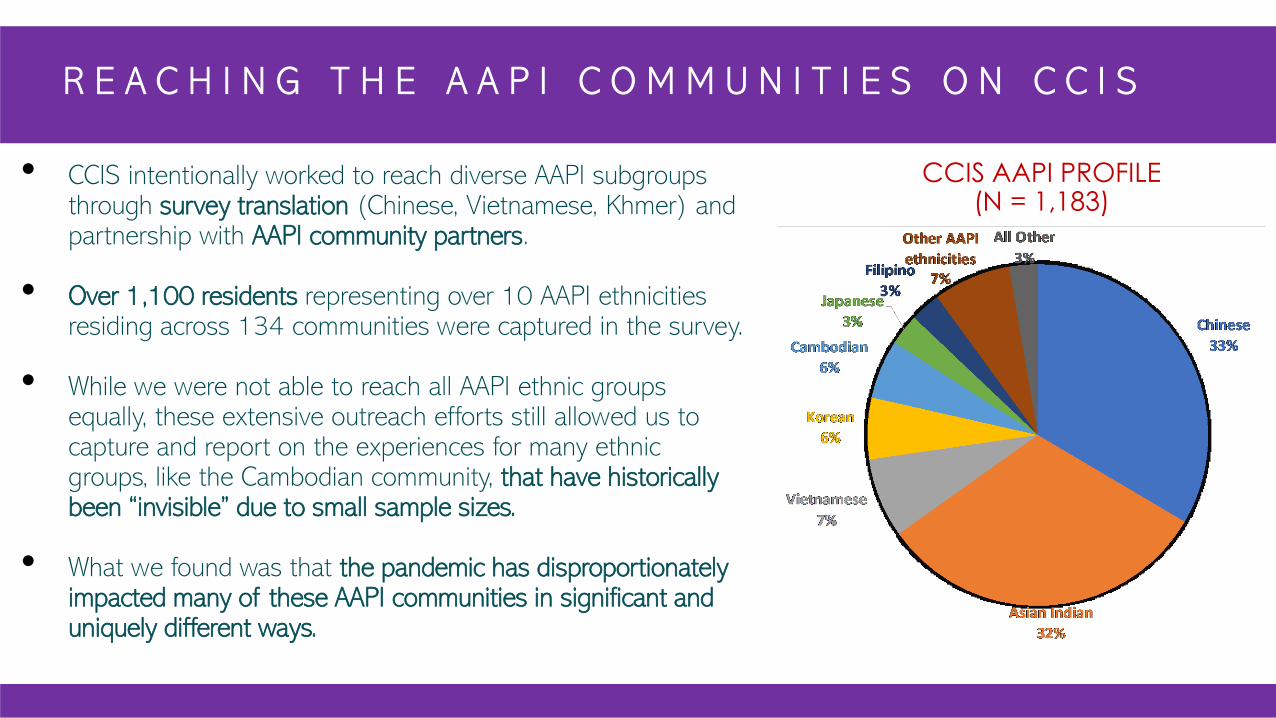
• CCIS intentionally worked to reach diverse AAPI subgroups through survey translation (Chinese, Vietnamese, Khmer) and partnership with AAPI community partners.
• Over 1,100 residents representing over 10 AAPI ethnicities residing across 134 communities were captured in the survey.
• While we were not able to reach all AAPI ethnic groups equally, these extensive outreach efforts still allowed us to capture and report on the experiences for many ethnic groups, like the Cambodian community, that have historically been “invisible” due to small sample sizes.
• What we found was that the pandemic has disproportionately impacted many of these AAPI communities in significant and uniquely different ways.
CCIS AAPI PROFILE(N = 1,183)
Despite the common belief that the AAPI community is a
monolith, the data shows us that the stories, struggles, and
experiences of these individuals vary greatly, especially during the
pandemic.
F R A M I N G M A T T E R S
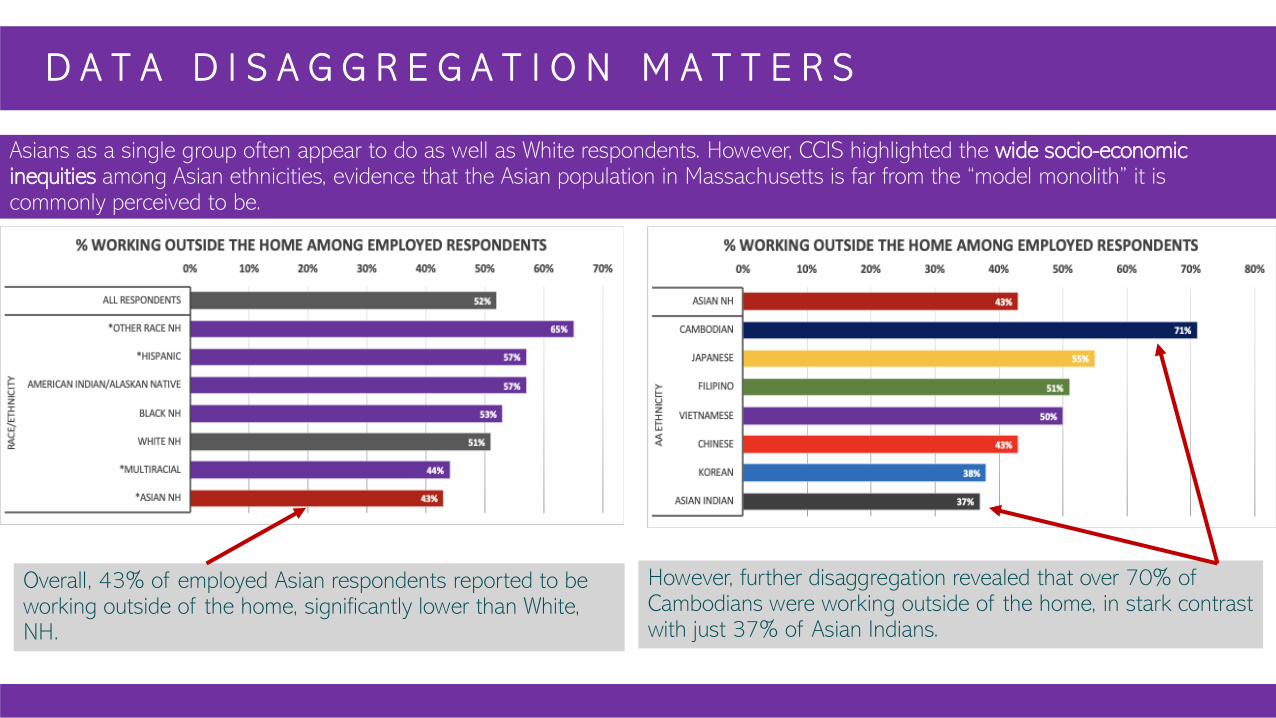
Overall, 43% of employed Asian respondents reported to be working outside of the home, significantly lower than White, NH.
However, further disaggregation revealed that over 70% of Cambodians were working outside of the home, in stark contrast with just 37% of Asian Indians.
Asians as a single group often appear to do as well as White respondents. However, CCIS highlighted the wide socio-economic inequities among Asian ethnicities, evidence that the Asian population in Massachusetts is far from the “model monolith” it is commonly perceived to be.
D A T A D I S A G G R E G A T I O N M A T T E R S
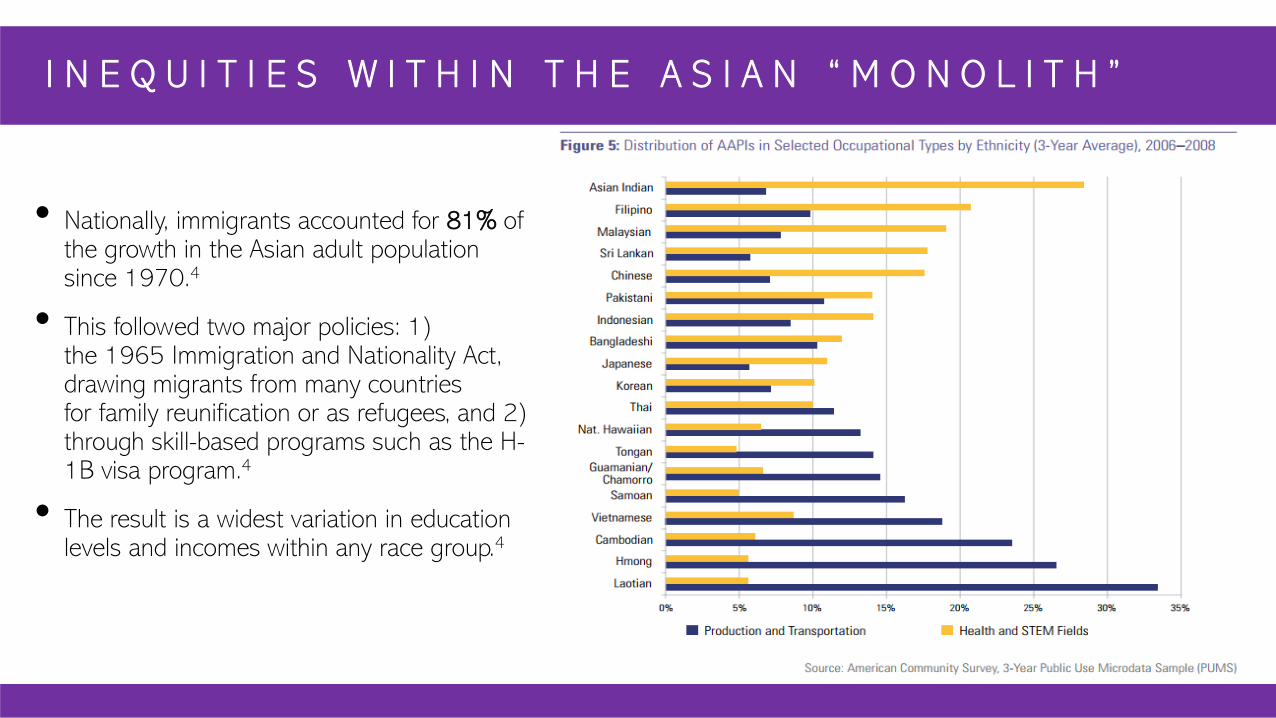
I N E Q U I T I E S W I T H I N T H E A S I A N “ M O N O L I T H ”
• Nationally, immigrants accounted for 81% of the growth in the Asian adult population since 1970.4
• This followed two major policies: 1) the 1965 Immigration and Nationality Act, drawing migrants from many countries for family reunification or as refugees, and 2) through skill-based programs such as the H-1B visa program.4
• The result is a widest variation in education levels and incomes within any race group.4
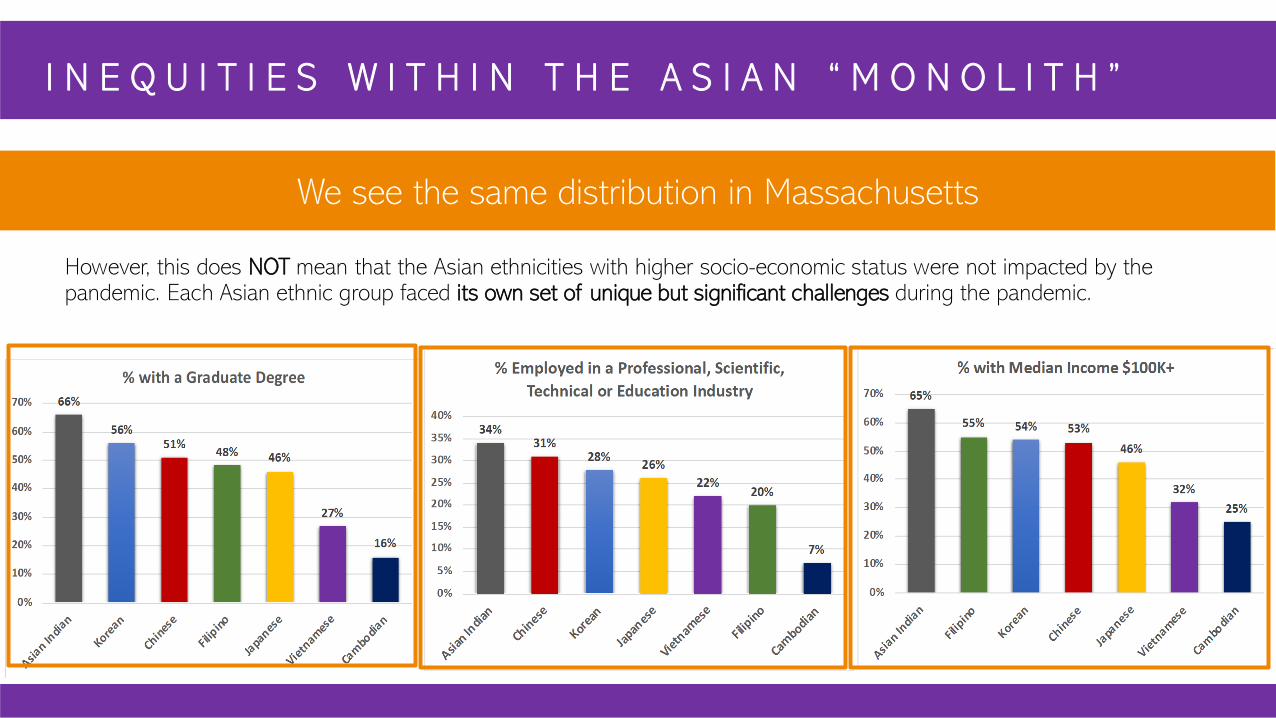
I N E Q U I T I E S W I T H I N T H E A S I A N “ M O N O L I T H ”
We see the same distribution in Massachusetts
However, this does NOT mean that the Asian ethnicities with higher socio-economic status were not impacted by the pandemic. Each Asian ethnic group faced its own set of unique but significant challenges during the pandemic.

Spot l ight on Cambodian Amer icans
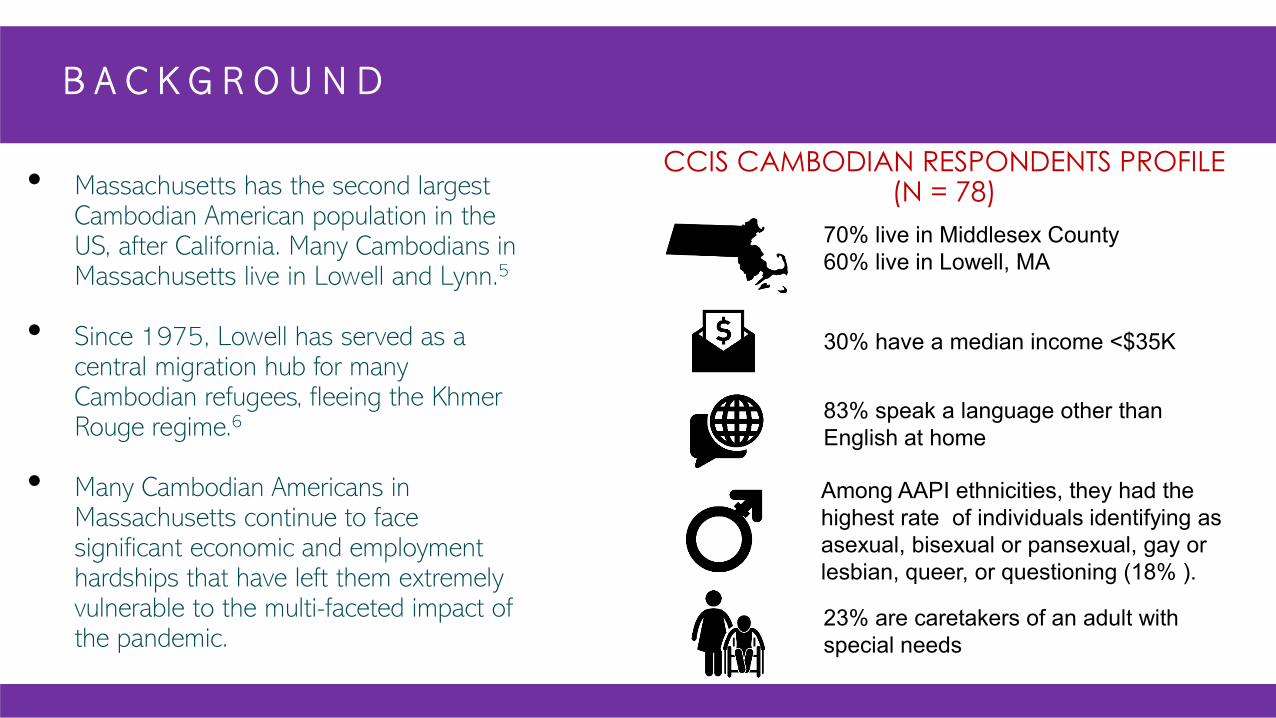
B A C K G R O U N D
• Massachusetts has the second largest Cambodian American population in the US, after California. Many Cambodians in Massachusetts live in Lowell and Lynn.5
• Since 1975, Lowell has served as a central migration hub for many Cambodian refugees, fleeing the Khmer Rouge regime.6
• Many Cambodian Americans in Massachusetts continue to face significant economic and employment hardships that have left them extremely vulnerable to the multi-faceted impact of the pandemic.
CCIS CAMBODIAN RESPONDENTS PROFILE (N = 78)
70% live in Middlesex County60% live in Lowell, MA
30% have a median income <$35K
23% are caretakers of an adult with special needs
83% speak a language other than English at home
Among AAPI ethnicities, they had the highest rate of individuals identifying as asexual, bisexual or pansexual, gay or lesbian, queer, or questioning (18% ).
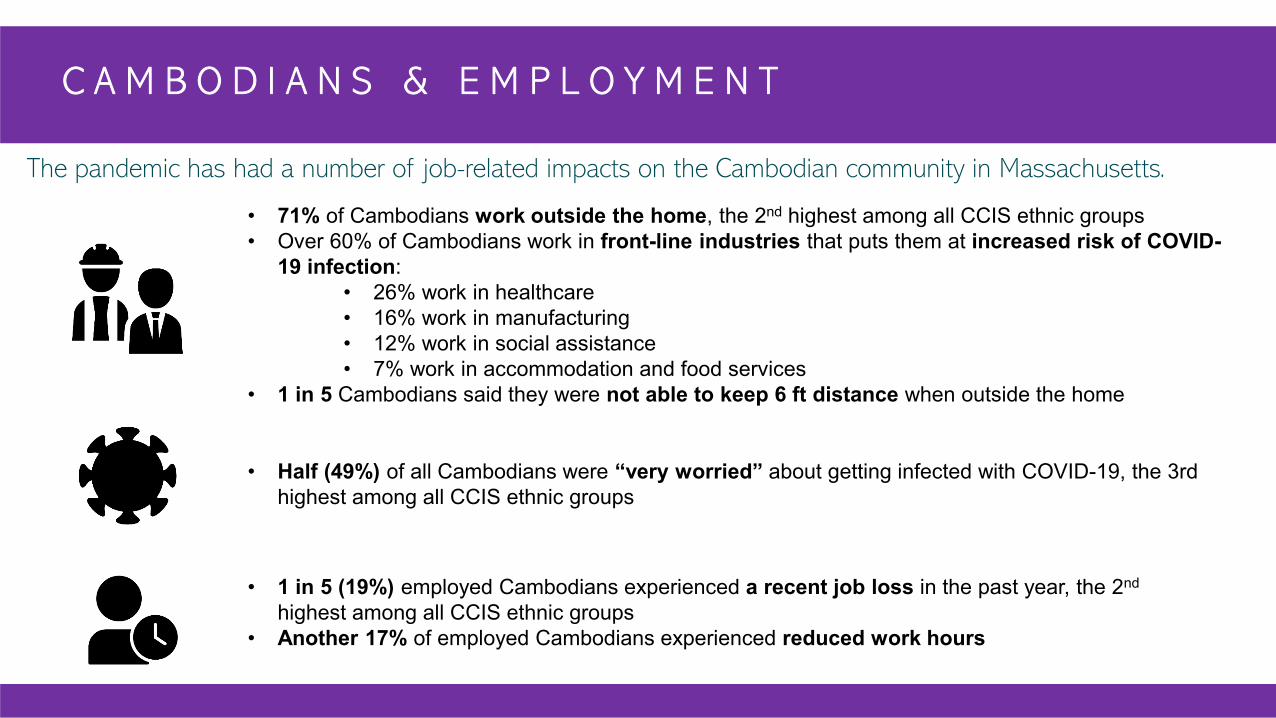
C A M B O D I A N S & E M P L O Y M E N T
The pandemic has had a number of job-related impacts on the Cambodian community in Massachusetts.
• 71% of Cambodians work outside the home, the 2nd highest among all CCIS ethnic groups• Over 60% of Cambodians work in front-line industries that puts them at increased risk of COVID-
19 infection:• 26% work in healthcare• 16% work in manufacturing• 12% work in social assistance• 7% work in accommodation and food services
• 1 in 5 Cambodians said they were not able to keep 6 ft distance when outside the home
• Half (49%) of all Cambodians were “very worried” about getting infected with COVID-19, the 3rd highest among all CCIS ethnic groups
• 1 in 5 (19%) employed Cambodians experienced a recent job loss in the past year, the 2nd
highest among all CCIS ethnic groups• Another 17% of employed Cambodians experienced reduced work hours
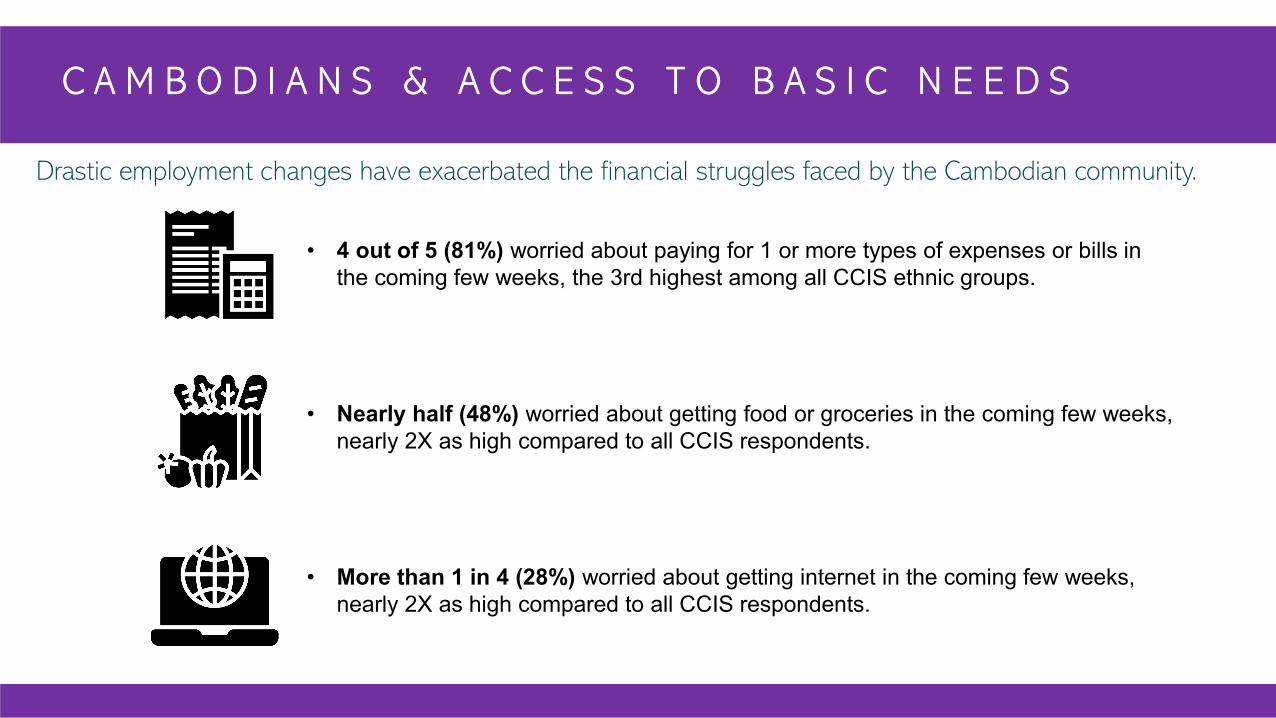
C A M B O D I A N S & A C C E S S T O B A S I C N E E D S
Drastic employment changes have exacerbated the financial struggles faced by the Cambodian community.
• 4 out of 5 (81%) worried about paying for 1 or more types of expenses or bills in the coming few weeks, the 3rd highest among all CCIS ethnic groups.
• Nearly half (48%) worried about getting food or groceries in the coming few weeks, nearly 2X as high compared to all CCIS respondents.
• More than 1 in 4 (28%) worried about getting internet in the coming few weeks, nearly 2X as high compared to all CCIS respondents.
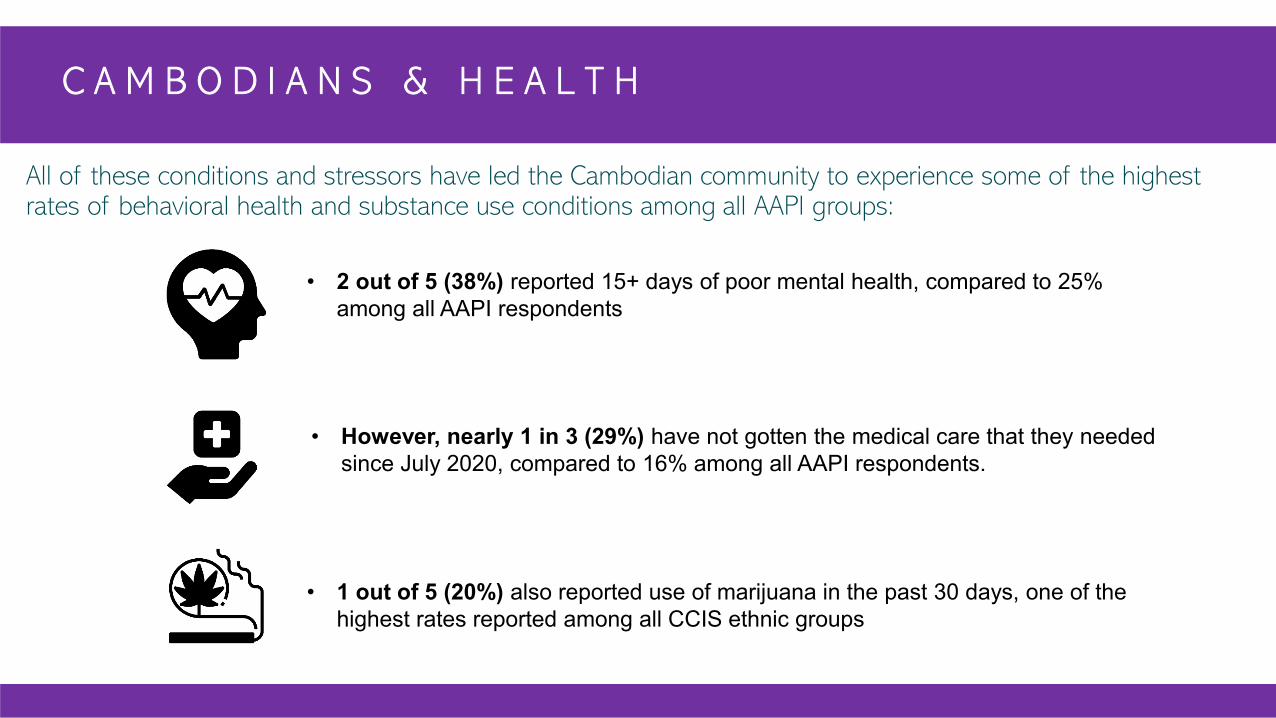
C A M B O D I A N S & H E A L T H
All of these conditions and stressors have led the Cambodian community to experience some of the highest rates of behavioral health and substance use conditions among all AAPI groups:
• 2 out of 5 (38%) reported 15+ days of poor mental health, compared to 25% among all AAPI respondents
• 1 out of 5 (20%) also reported use of marijuana in the past 30 days, one of the highest rates reported among all CCIS ethnic groups
• However, nearly 1 in 3 (29%) have not gotten the medical care that they needed since July 2020, compared to 16% among all AAPI respondents.

Spot l ight on Vietnamese Amer icans
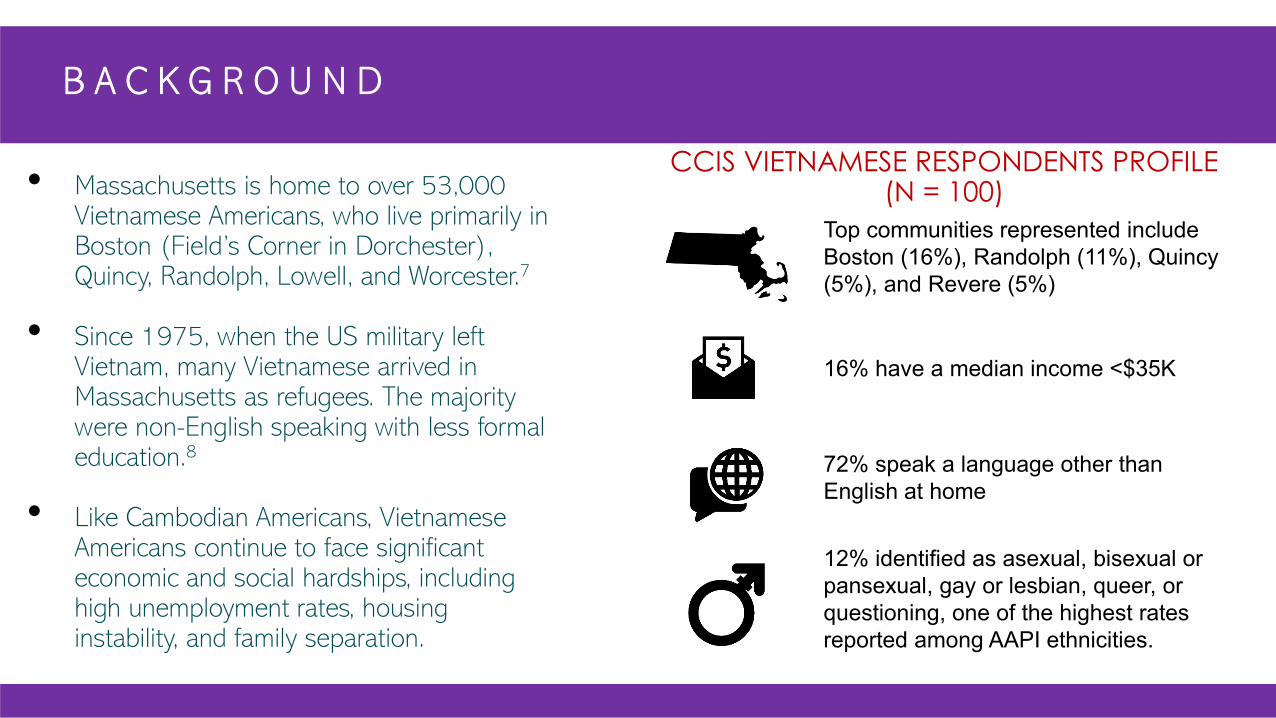
B A C K G R O U N D
• Massachusetts is home to over 53,000 Vietnamese Americans, who live primarily in Boston (Field’s Corner in Dorchester), Quincy, Randolph, Lowell, and Worcester.7
• Since 1975, when the US military left Vietnam, many Vietnamese arrived in Massachusetts as refugees. The majority were non-English speaking with less formal education.8
• Like Cambodian Americans, Vietnamese Americans continue to face significant economic and social hardships, including high unemployment rates, housing instability, and family separation.
CCIS VIETNAMESE RESPONDENTS PROFILE(N = 100)
Top communities represented include Boston (16%), Randolph (11%), Quincy (5%), and Revere (5%)
16% have a median income <$35K
12% identified as asexual, bisexual or pansexual, gay or lesbian, queer, or questioning, one of the highest rates reported among AAPI ethnicities.
72% speak a language other than English at home
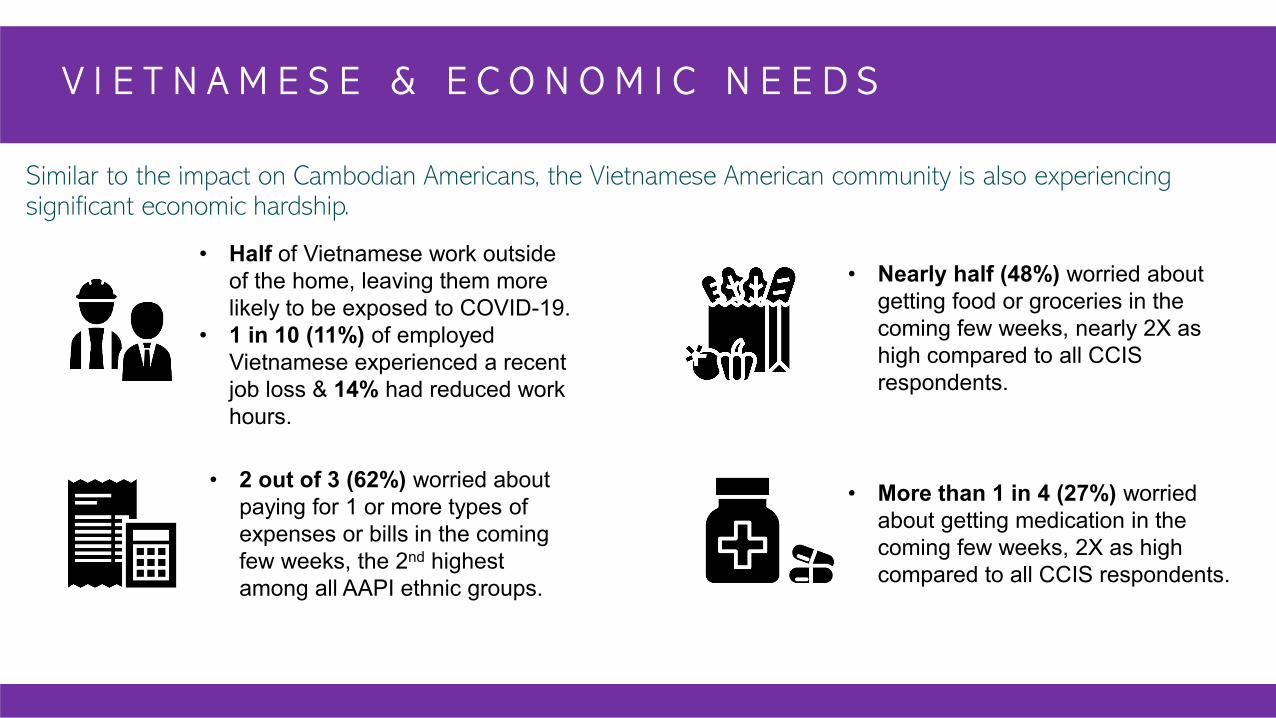
V I E T N A M E S E & E C O N O M I C N E E D S
Similar to the impact on Cambodian Americans, the Vietnamese American community is also experiencing significant economic hardship.
• Half of Vietnamese work outside of the home, leaving them more likely to be exposed to COVID-19.
• 1 in 10 (11%) of employed Vietnamese experienced a recent job loss & 14% had reduced work hours.
• 2 out of 3 (62%) worried about paying for 1 or more types of expenses or bills in the coming few weeks, the 2nd highest among all AAPI ethnic groups.
• Nearly half (48%) worried about getting food or groceries in the coming few weeks, nearly 2X as high compared to all CCIS respondents.
• More than 1 in 4 (27%) worried about getting medication in the coming few weeks, 2X as high compared to all CCIS respondents.

Spot l ight on East As ian Amer icans
B A C K G R O U N D
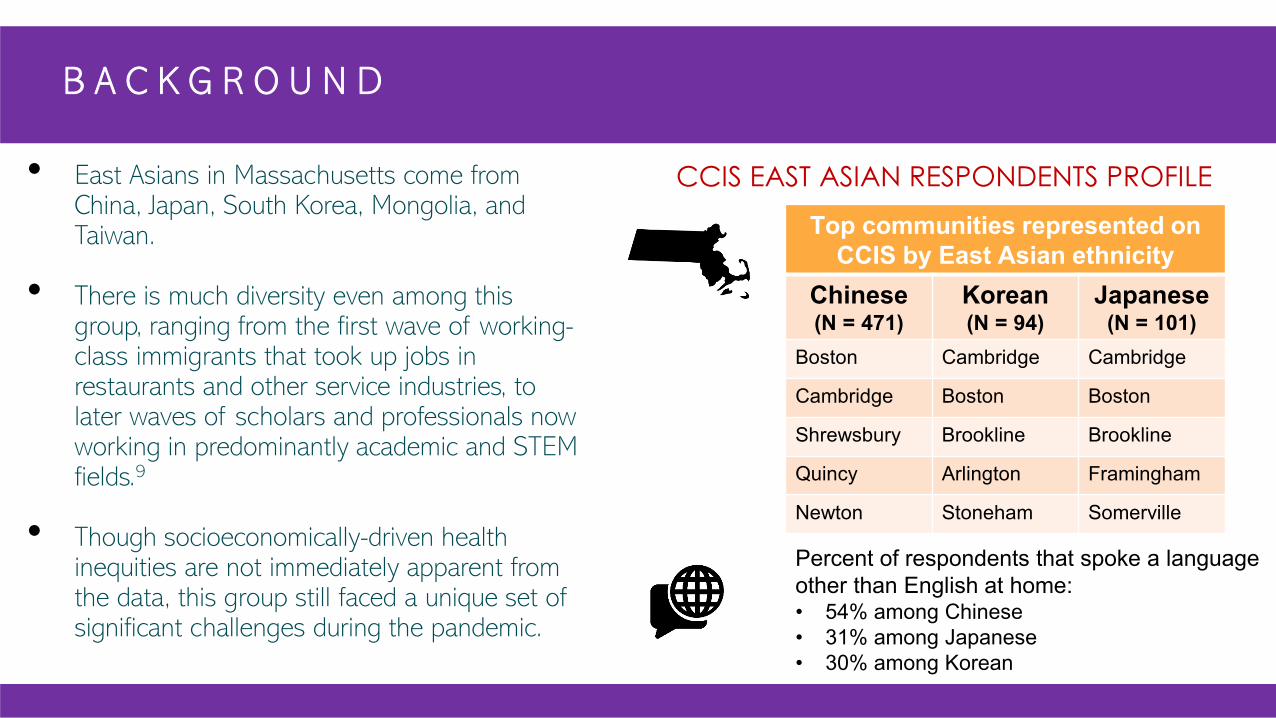
• East Asians in Massachusetts come from China, Japan, South Korea, Mongolia, and Taiwan.
• There is much diversity even among this group, ranging from the first wave of working-class immigrants that took up jobs in restaurants and other service industries, to later waves of scholars and professionals now working in predominantly academic and STEM fields.9
• Though socioeconomically-driven health inequities are not immediately apparent from the data, this group still faced a unique set of significant challenges during the pandemic.
CCIS EAST ASIAN RESPONDENTS PROFILE
30% have a median income <$35K
Percent of respondents that spoke a language other than English at home:• 54% among Chinese• 31% among Japanese• 30% among Korean
Top communities represented on CCIS by East Asian ethnicity
Chinese (N = 471)
Korean(N = 94)
Japanese(N = 101)
Boston Cambridge Cambridge
Cambridge Boston Boston
Shrewsbury Brookline Brookline
Quincy Arlington Framingham
Newton Stoneham Somerville
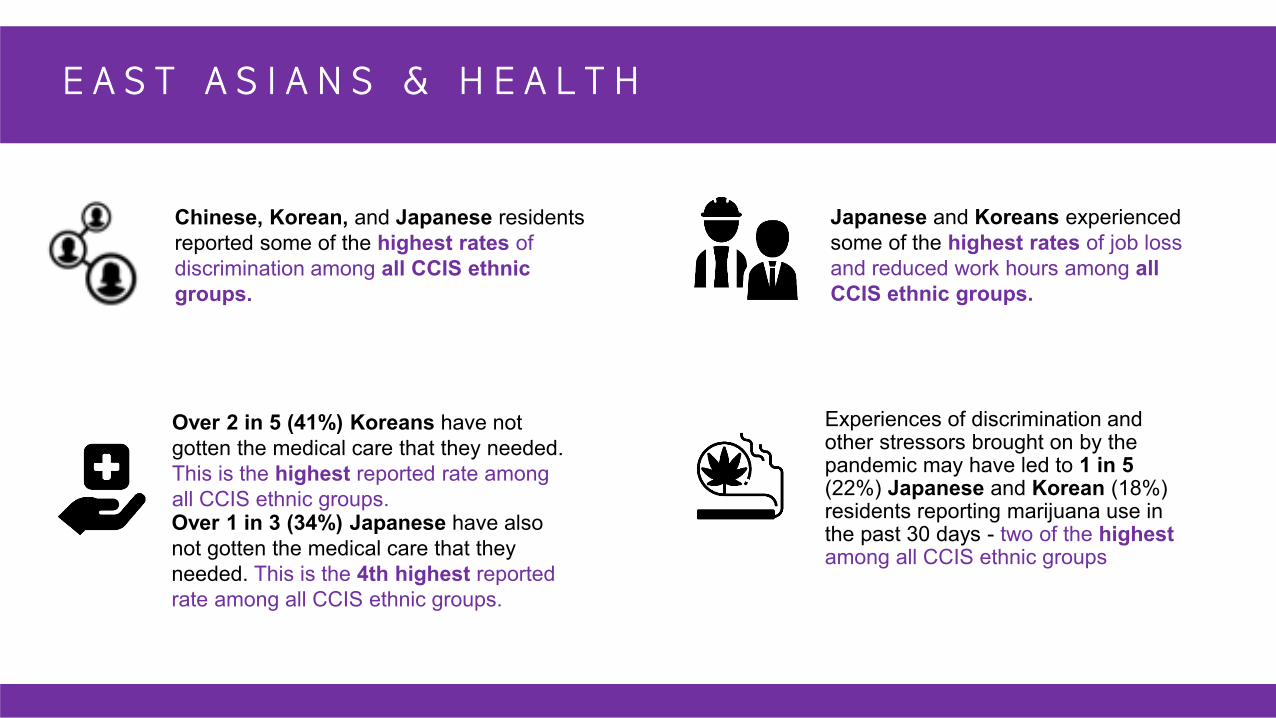
E A S T A S I A N S & H E A L T H
Experiences of discrimination and other stressors brought on by the pandemic may have led to 1 in 5 (22%) Japanese and Korean (18%) residents reporting marijuana use in the past 30 days - two of the highestamong all CCIS ethnic groups
Over 1 in 3 (34%) Japanese have also not gotten the medical care that they needed. This is the 4th highest reported rate among all CCIS ethnic groups.
Over 2 in 5 (41%) Koreans have not gotten the medical care that they needed. This is the highest reported rate among all CCIS ethnic groups.
Japanese and Koreans experienced some of the highest rates of job loss and reduced work hours among all CCIS ethnic groups.
Chinese, Korean, and Japanese residentsreported some of the highest rates of discrimination among all CCIS ethnic groups.

Spot l ight on Indian Amer icans
B A C K G R O U N D
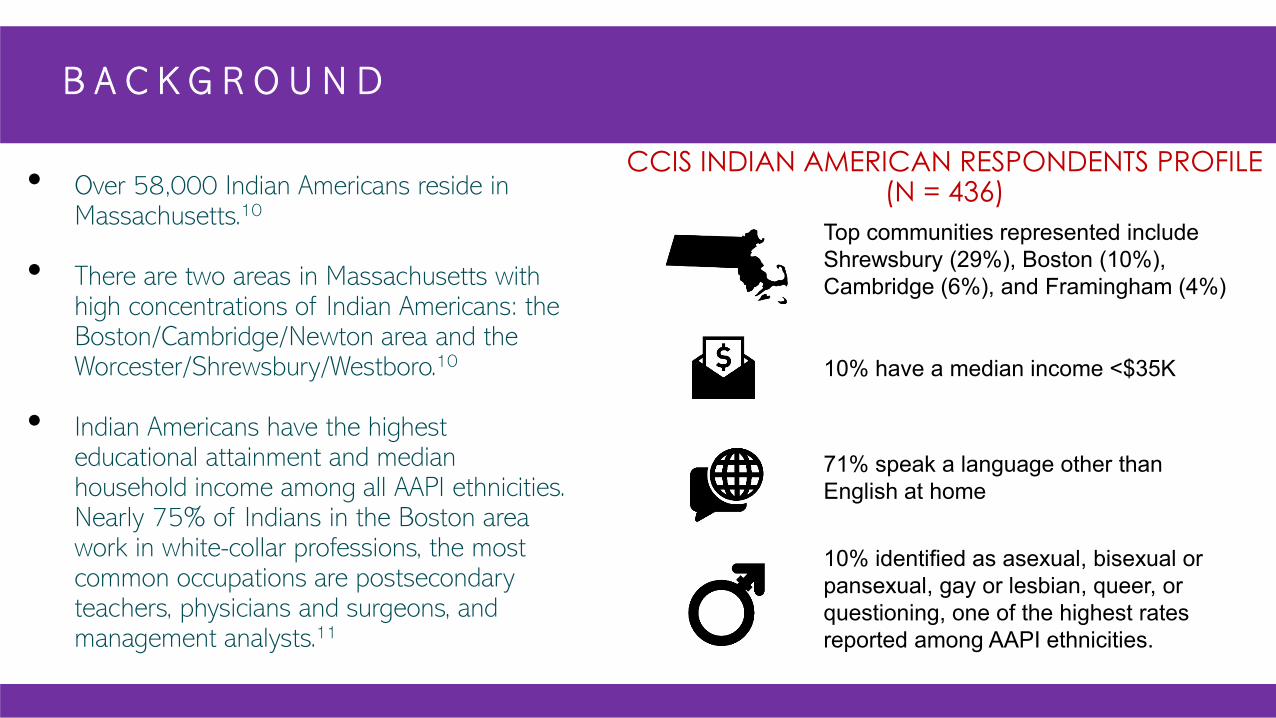
• Over 58,000 Indian Americans reside in Massachusetts.10
• There are two areas in Massachusetts with high concentrations of Indian Americans: the Boston/Cambridge/Newton area and the Worcester/Shrewsbury/Westboro.10
• Indian Americans have the highest educational attainment and median household income among all AAPI ethnicities. Nearly 75% of Indians in the Boston area work in white-collar professions, the most common occupations are postsecondary teachers, physicians and surgeons, and management analysts.11
CCIS INDIAN AMERICAN RESPONDENTS PROFILE(N = 436)
Top communities represented include Shrewsbury (29%), Boston (10%), Cambridge (6%), and Framingham (4%)
10% have a median income <$35K
10% identified as asexual, bisexual or pansexual, gay or lesbian, queer, or questioning, one of the highest rates reported among AAPI ethnicities.
71% speak a language other than English at home
I N D I A N A M E R I C A N S
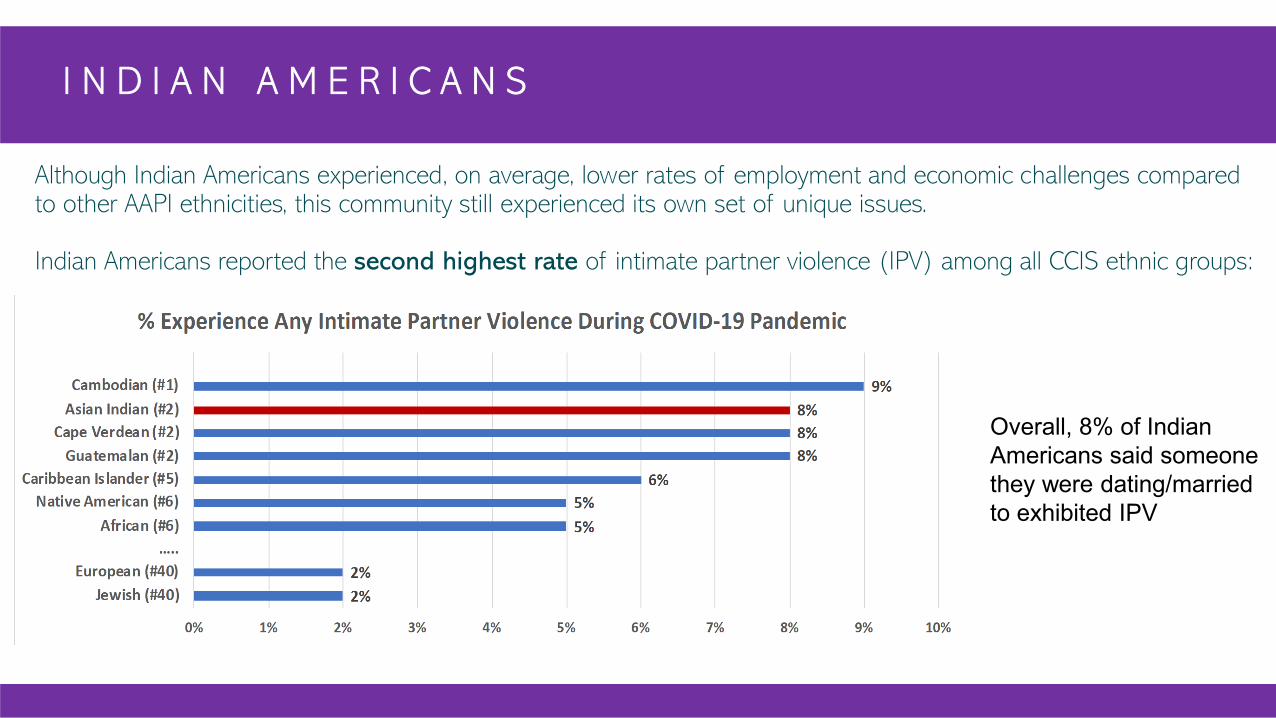
Although Indian Americans experienced, on average, lower rates of employment and economic challenges compared to other AAPI ethnicities, this community still experienced its own set of unique issues.
Indian Americans reported the second highest rate of intimate partner violence (IPV) among all CCIS ethnic groups:
Overall, 8% of Indian Americans said someone they were dating/married to exhibited IPV
Exper iences of Discr iminat ion
A N T I - A S I A N S E N T I M E N T S
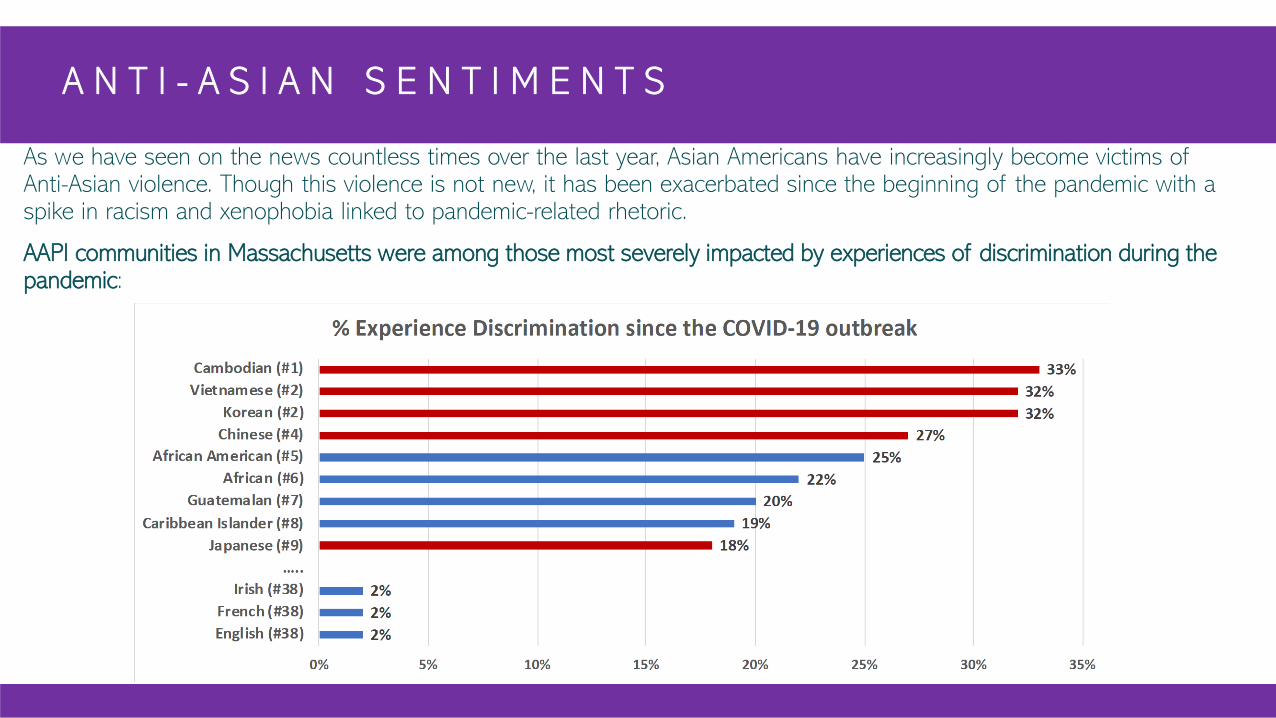
As we have seen on the news countless times over the last year, Asian Americans have increasingly become victims of Anti-Asian violence. Though this violence is not new, it has been exacerbated since the beginning of the pandemic with a spike in racism and xenophobia linked to pandemic-related rhetoric.
AAPI communities in Massachusetts were among those most severely impacted by experiences of discrimination during the pandemic:
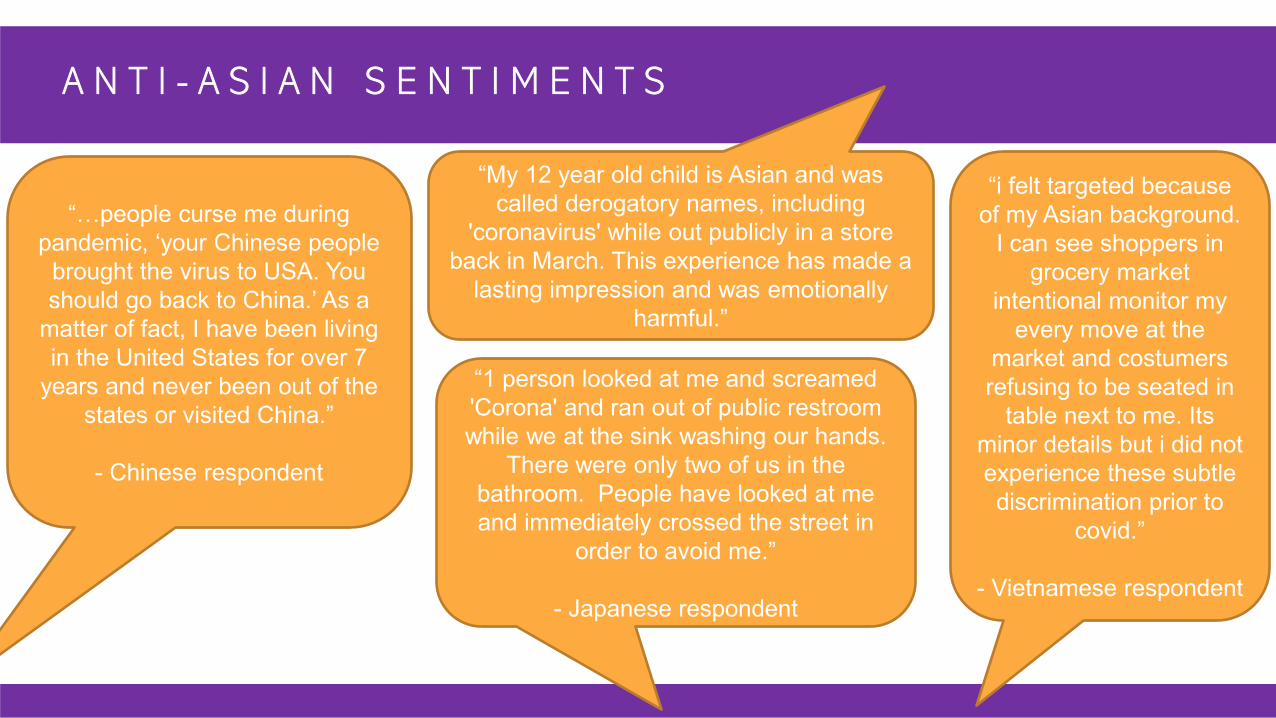
A N T I - A S I A N S E N T I M E N T S
“…people curse me during pandemic, ‘your Chinese people
brought the virus to USA. You should go back to China.’ As a
matter of fact, I have been living in the United States for over 7
years and never been out of the states or visited China.”
- Chinese respondent
“1 person looked at me and screamed 'Corona' and ran out of public restroom while we at the sink washing our hands.
There were only two of us in the bathroom. People have looked at me and immediately crossed the street in
order to avoid me.”
- Japanese respondent
“My 12 year old child is Asian and was called derogatory names, including
'coronavirus' while out publicly in a store back in March. This experience has made a
lasting impression and was emotionally harmful.”
“i felt targeted because of my Asian background.
I can see shoppers in grocery market
intentional monitor my every move at the
market and costumers refusing to be seated in
table next to me. Its minor details but i did not experience these subtle discrimination prior to
covid.”
- Vietnamese respondent
L I M I T A T I O N S
While CCIS was successful in reaching many traditionally hard to reach AAPI ethnicities, we were not able to reach all AAPI ethnicities in sufficient sample sizes in order to report out on
their experiences. These include other Southeast Asian ethnicities like Hmong, Malaysian, Thai, Indonesian; other Central Asian ethnicities like Sri Lankan, Bangladeshi; and the Native Hawaiian
and Pacific Islander ethnicities, like Chamorus and Samoan.
The absence of CCIS data on these populations does NOT mean they are not being adversely impacted by the pandemic. In fact, national data and information would suggest that each of these ethnic groups is experiencing their own set of unique challenges during the pandemic.
While the common umbrella of "AAPI" unites this community, we must be nuanced
when addressing the experiences and needs of Asian Americans/Pacific Islanders
during the pandemic.
● Data Disaggregation matters.
● Each ethnicity is being impacted by the pandemic differently. We must understand
their stories in order to understand their experiences.
● AAPI communities in Massachusetts were among those most severely impacted by
experiences of discrimination during the pandemic.
K E Y T A K E A W A Y S : A A P I R E S I D E N T S
P O P U L A T I O N S P O T L I G H T : A M E R I C A N I N D I A N A N D A L A S K A
N A T I V E R E S I D E N T S
Despite their high rates of need, indigenous residents and
their data are often ”invisible” - many report their American
Indian or Alaska Native (AI/AN) identity in combination with
other race categories and get categorized into other groups.
This yields very low aggregate numbers, which makes
understanding and quantifying their needs difficult.
F R A M I N G M A T T E R S
“Because Na t i v e Ame r i c an s a re o f t en “ i nv i s i b l e , ” i n t h e da t a so a re t he i r s t r ugg l e s. . . ”
A I / A N I N M A S S A C H U S E T T S
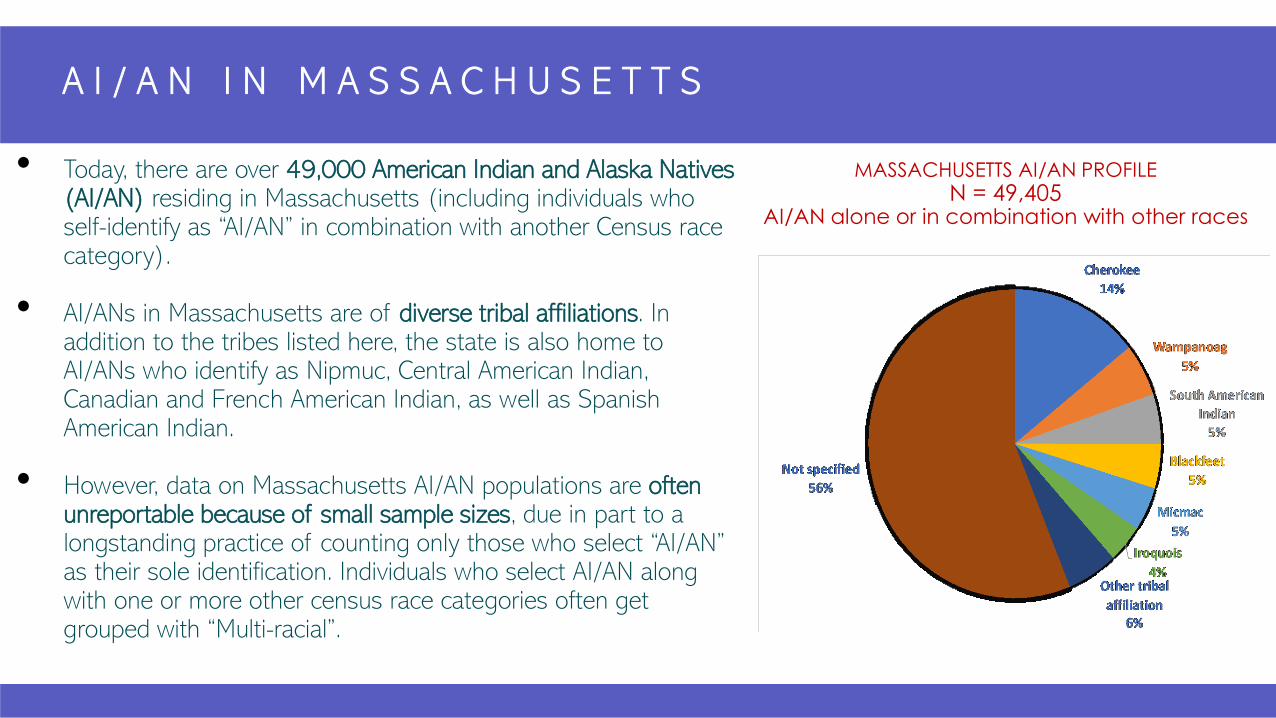
• Today, there are over 49,000 American Indian and Alaska Natives (AI/AN) residing in Massachusetts (including individuals who self-identify as “AI/AN” in combination with another Census race category).
• AI/ANs in Massachusetts are of diverse tribal affiliations. In addition to the tribes listed here, the state is also home to AI/ANs who identify as Nipmuc, Central American Indian, Canadian and French American Indian, as well as Spanish American Indian.
• However, data on Massachusetts AI/AN populations are often unreportable because of small sample sizes, due in part to a longstanding practice of counting only those who select “AI/AN” as their sole identification. Individuals who select AI/AN along with one or more other census race categories often get grouped with “Multi-racial”.
MASSACHUSETTS AI/AN PROFILEN = 49,405
AI/AN alone or in combination with other races
R E A C H I N G T H E A I / A N C O M M U N I T Y O N C C I S
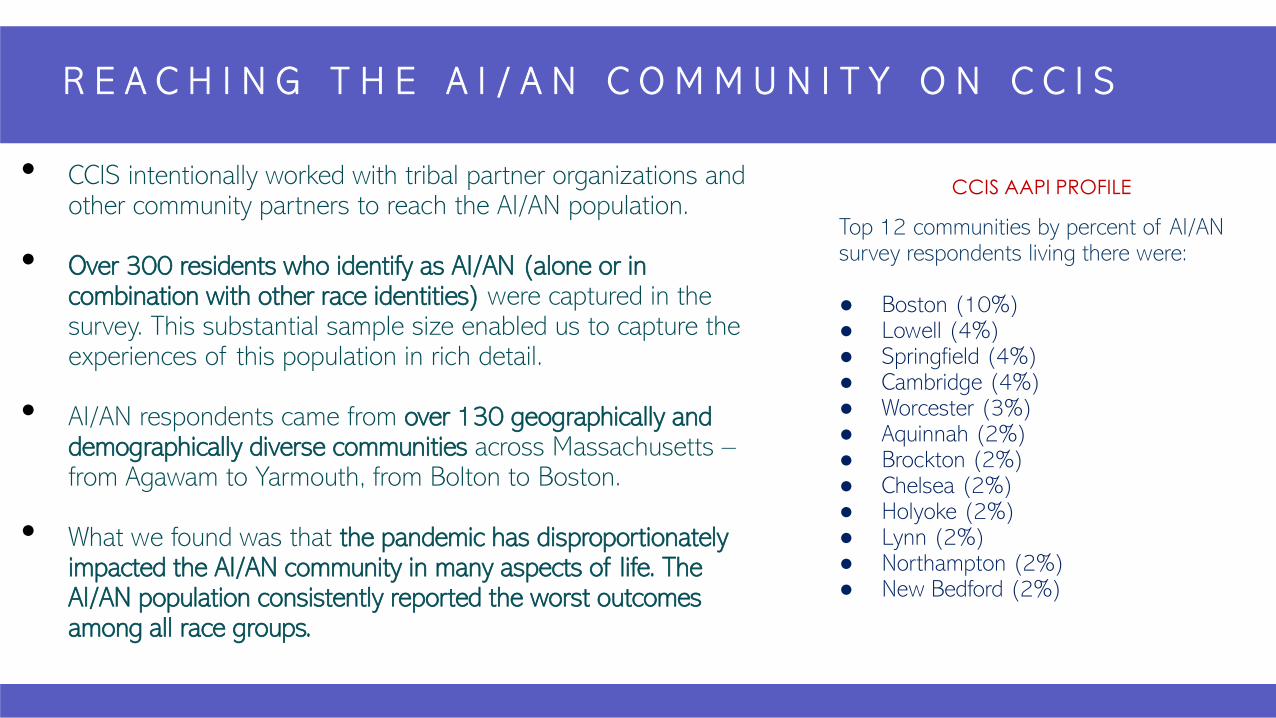
• CCIS intentionally worked with tribal partner organizations and other community partners to reach the AI/AN population.
• Over 300 residents who identify as AI/AN (alone or in combination with other race identities) were captured in the survey. This substantial sample size enabled us to capture the experiences of this population in rich detail.
• AI/AN respondents came from over 130 geographically and demographically diverse communities across Massachusetts –from Agawam to Yarmouth, from Bolton to Boston.
• What we found was that the pandemic has disproportionately impacted the AI/AN community in many aspects of life. The AI/AN population consistently reported the worst outcomes among all race groups.
CCIS AAPI PROFILE
Top 12 communities by percent of AI/AN survey respondents living there were:
● Boston (10%)● Lowell (4%)● Springfield (4%)● Cambridge (4%)● Worcester (3%)● Aquinnah (2%)● Brockton (2%)● Chelsea (2%)● Holyoke (2%)● Lynn (2%)● Northampton (2%)● New Bedford (2%)
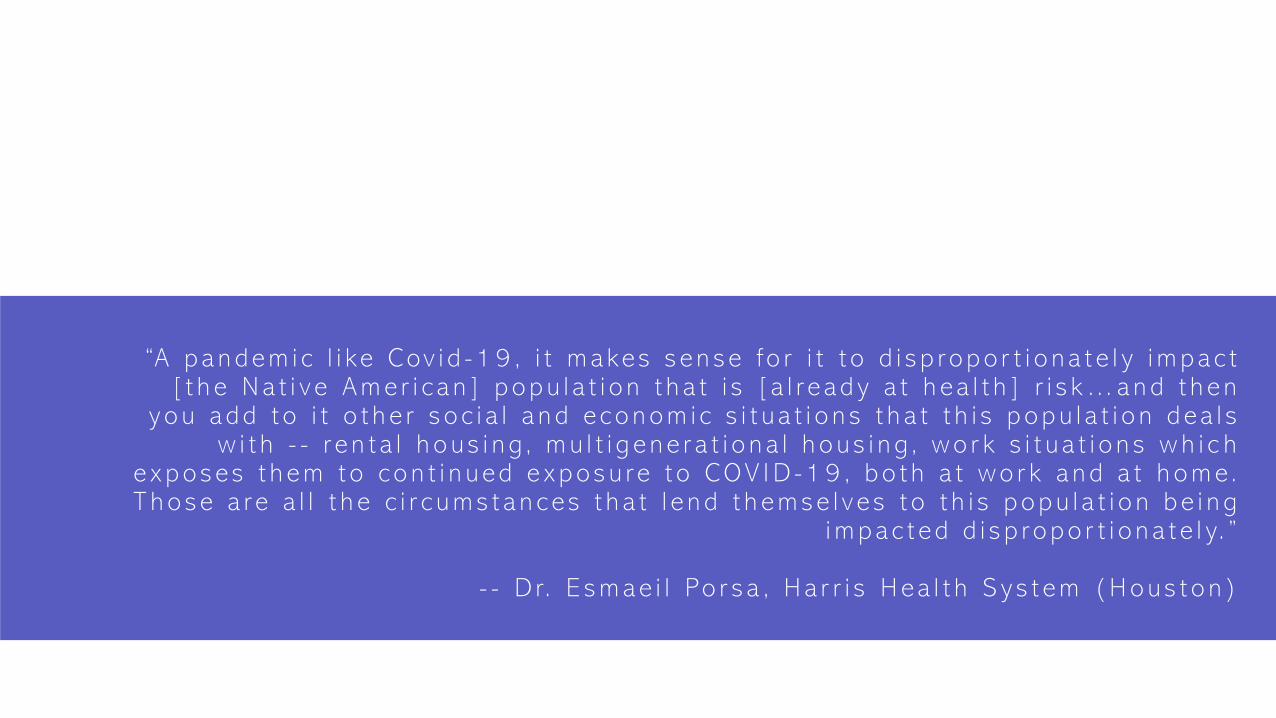
“A p a n d e m i c l i k e C ov i d - 1 9 , i t m a ke s s e n s e f o r i t t o d i s p r o p o r t i o n a t e l y i m p a c t [ t h e N a t i v e A m e r i c a n ] p o p u l a t i o n t h a t i s [ a l r e a d y a t h e a l t h ] r i s k … a n d t h e n
y o u a d d t o i t o t h e r s o c i a l a n d e c o n o m i c s i t u a t i o n s t h a t t h i s p o p u l a t i o n d e a l s w i t h - - r e n t a l h o u s i n g , m u l t i g e n e r a t i o n a l h o u s i n g , w o r k s i t u a t i o n s w h i c h
e x p o s e s t h e m t o c o n t i n u e d e x p o s u r e t o C OV I D - 1 9 , b o t h a t w o r k a n d a t h o m e . T h o s e a r e a l l t h e c i r c u m s t a n c e s t h a t l e n d t h e m s e l v e s t o t h i s p o p u l a t i o n b e i n g
i m p a c t e d d i s p r o p o r t i o n a t e l y. ”
- - D r. E s m a e i l Po r s a , H a r r i s H e a l t h S y s t e m ( H o u s t o n )
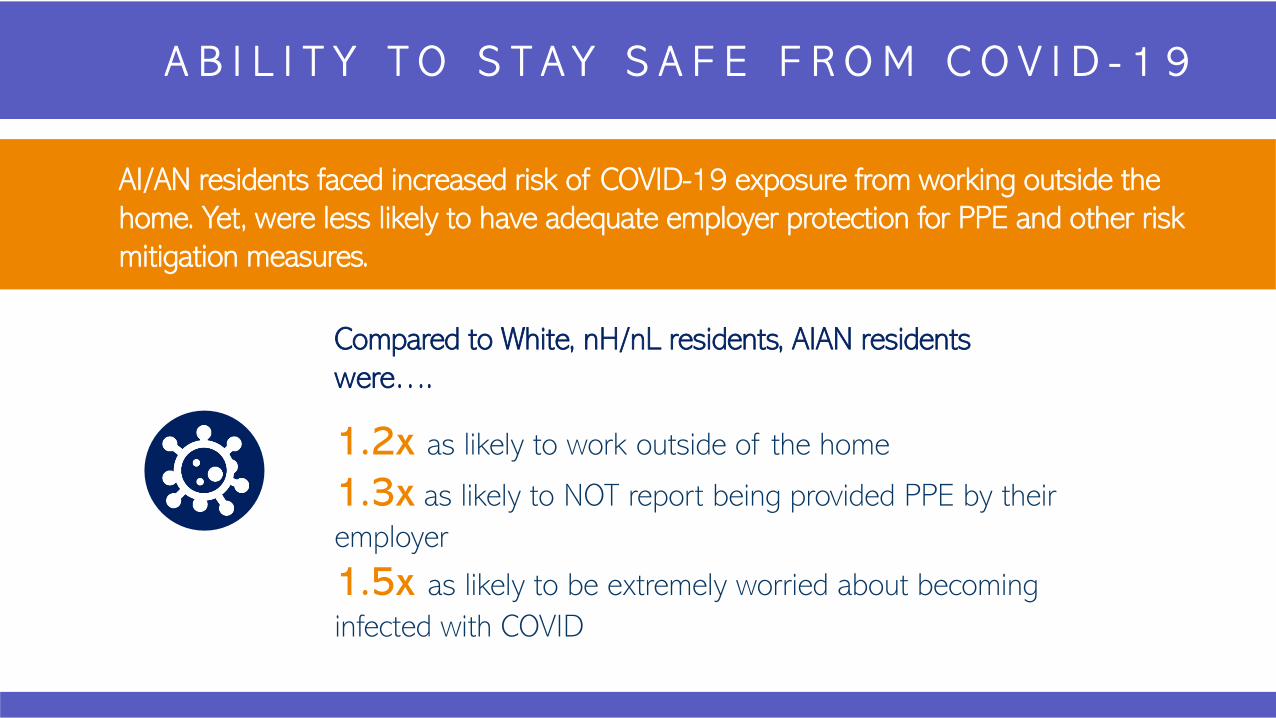
AI/AN residents faced increased risk of COVID-19 exposure from working outside the home. Yet, were less likely to have adequate employer protection for PPE and other risk mitigation measures.
A B I L I T Y T O S T A Y S A F E F R O M C O V I D - 1 9
1.2x as likely to work outside of the home
1.3x as likely to NOT report being provided PPE by their employer
1.5x as likely to be extremely worried about becoming infected with COVID
Compared to White, nH/nL residents, AIAN residents were….
“ S i n c e C O V I D - 1 9 e m e r g e d , m a n y n o n - p r o f i t o r g a n i z a t i o n s … a r e i n a s t a t e o f c r i s i s a s t h e v i r u s t a k e s h o l d t h r o u g h o u t t h e s t a t e a n d a c r o s s t h e c o u n t r y . W e a r e a l l
e x p e r i e n c i n g a s t e a d y i n c r e a s e i n d e m a n d f r o m [ N a t i v e A m e r i c a n ] f a m i l i e s a n d e l d e r s w h o a r e s t i l l s t r u g g l i n g t o p u t f o o d o n t h e t a b l e d u e t o a d e c r e a s e i n i n c o m e , c o n t i n u e d
j o b l o s s a n d l i t t l e a c c e s s t o s c h o o l - s p o n s o r e d m e a l s f o r t h e i r c h i l d r e n . W e h a v e a l s o r e c e i v e d n u m e r o u s r e q u e s t s f o r a s s i s t a n c e w i t h h o u s e h o l d s u p p l i e s , s a f e t y s u p p l i e s ,
d i a p e r s & f o r m u l a , e l e c t r i c b i l l s , h e a t i n g b i l l s , c a r i n s u r a n c e , c a r r e p a i r s , g a s o l i n e f o r v e h i c l e s , e t c . A s b u s i n e s s e s s l o w l y o p e n , t h e n u m b e r o f r e q u e s t s f o r a s s i s t a n c e s t i l l
c o m e i n . ”
- - M a s s a c h u s e t t s C e n t e r f o r N a t i v e A m e r i c a n A w a r e n e s s ( M C N A A )
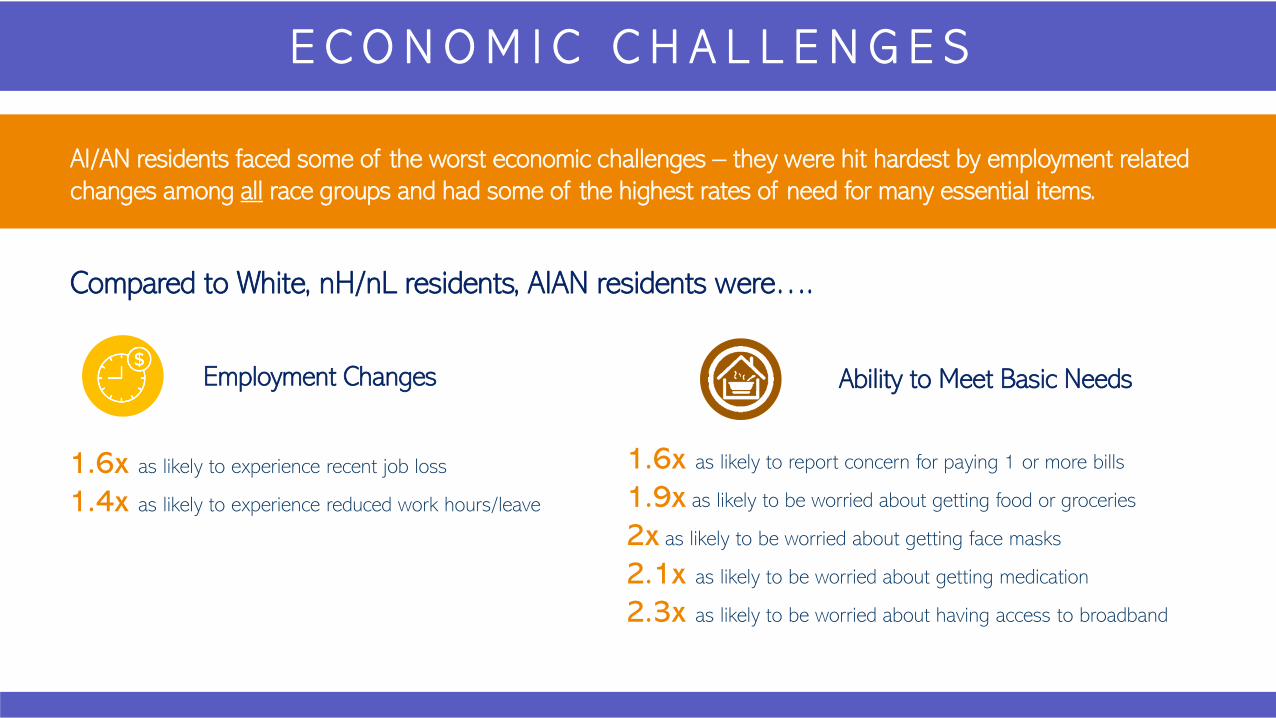
E C O N O M I C C H A L L E N G E S
1.6x as likely to report concern for paying 1 or more bills
1.9x as likely to be worried about getting food or groceries
2x as likely to be worried about getting face masks
2.1x as likely to be worried about getting medication
2.3x as likely to be worried about having access to broadband
Ability to Meet Basic Needs
1.6x as likely to experience recent job loss
1.4x as likely to experience reduced work hours/leave
Employment Changes
Compared to White, nH/nL, AI/AN residents were….
AI/AN residents faced some of the worst economic challenges – they were hit hardest by employment related changes among all race groups and had some of the highest rates of need for many essential items.
Compared to White, nH/nL residents, AIAN residents were….
“ S o w e h a v e e n t i r e h i s t o r i c a l a n d [ s o c i o - ] e c o n o m i c c i r c u m s t a n c e s t h a t i n c l u d e r a c i s m a n d m a r g i n a l i z a t i o n , q u i t e f r a n k l y, t h a t l e a d t o h i g h
p r e v a l e n c e o f m e n t a l h e a l t h a n d b e h a v i o r a l h e a l t h c o n c e r n s , h i g h e r r a t e s o f d e p r e s s i o n , h i g h e r r a t e s o f [ p o s t - t r a u m a t i c s t r e s s d i s o r d e r ] , h i g h e r r a t e s o f
s u b s t a n c e a b u s e , a n d h i g h e r r a t e s o f s u i c i d e …
a n d t h i s i s o n l y w h e r e w e a r e a s a b a s e l i n e … p r i o r t o C O V I D - 1 9 . ”
- - D o n a l d W a r n eA s s o c i a t e D e a n o f D i v e r s i t y , E q u i t y a n d I n c l u s i o n
U n i v e r s i t y o f N o r t h D a k o t a S c h o o l o f M e d i c i n e & H e a l t h S c i e n c e s
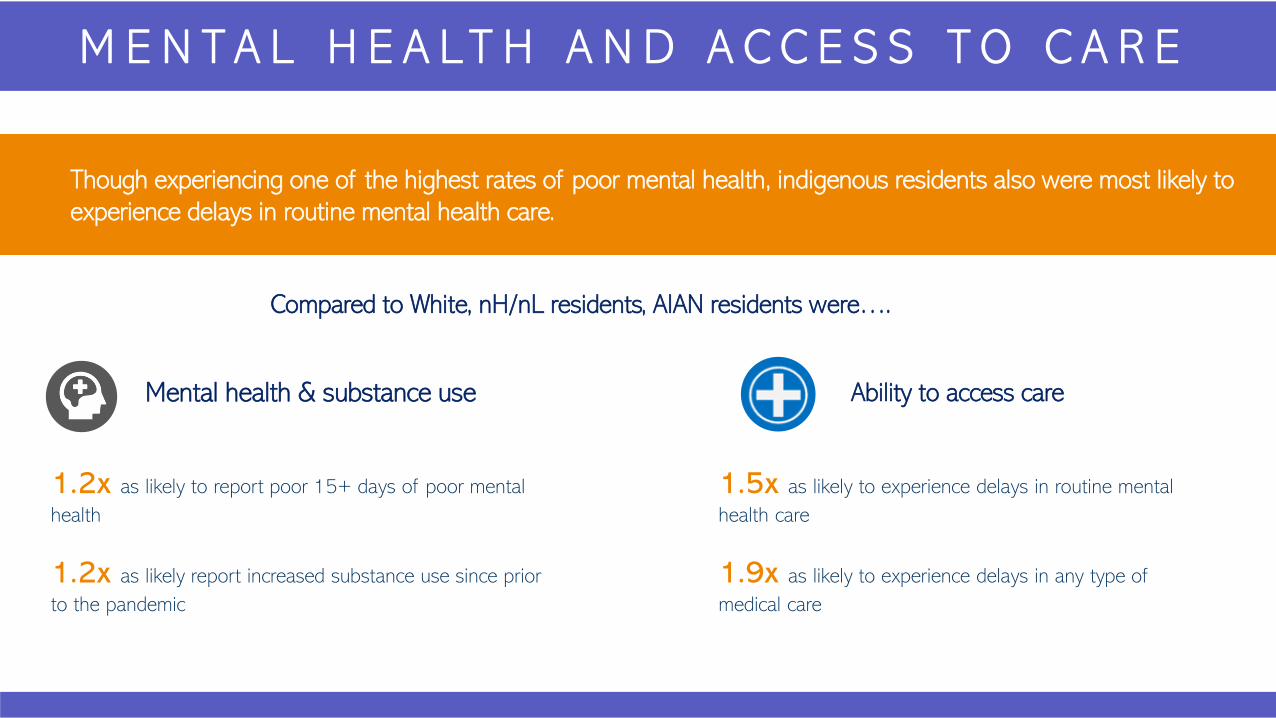
M E N T A L H E A LT H A N D A C C E S S T O C A R E
1.5x as likely to experience delays in routine mental health care
1.9x as likely to experience delays in any type of medical care
Mental health & substance use
Compared to White, nH/nL, AI/AN residents were….Though experiencing one of the highest rates of poor mental health, indigenous residents also were most likely to experience delays in routine mental health care.
Compared to White, nH/nL residents, AIAN residents were….
Ability to access care
1.2x as likely to report poor 15+ days of poor mental health
1.2x as likely report increased substance use since prior to the pandemic
“ J u s t b e c a u s e w e h a v e a s m a l l p o p u l a t i o n s i z e r e l a t i v e t o t h e l a r g e r p o p u l a t i o n d o e s n ’ t m e a n t h a t w e n e e d l e s s r e s o u r c e s … i t m e a n s w e n e e d
t h o s e r e s o u r c e s e v e n m o r e . ”
- - R a q u e l H a l s e y E x e c u t i v e D i r e c t o r, N o r t h A m e r i c a n I n d i a n C e n t e r i n B o s t o n
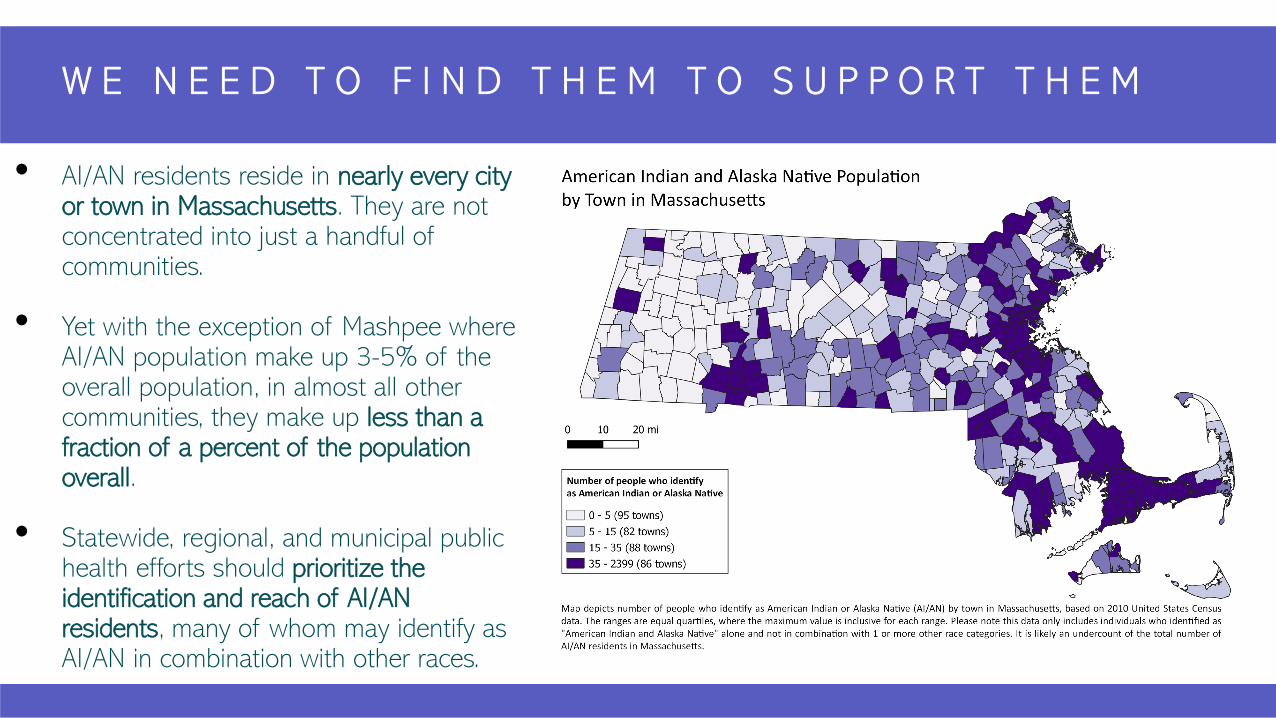
W E N E E D T O F I N D T H E M T O S U P P O R T T H E M
• AI/AN residents reside in nearly every city or town in Massachusetts. They are not concentrated into just a handful of communities.
• Yet with the exception of Mashpee where AI/AN population make up 3-5% of the overall population, in almost all other communities, they make up less than a fraction of a percent of the population overall.
• Statewide, regional, and municipal public health efforts should prioritize the identification and reach of AI/AN residents, many of whom may identify as AI/AN in combination with other races.
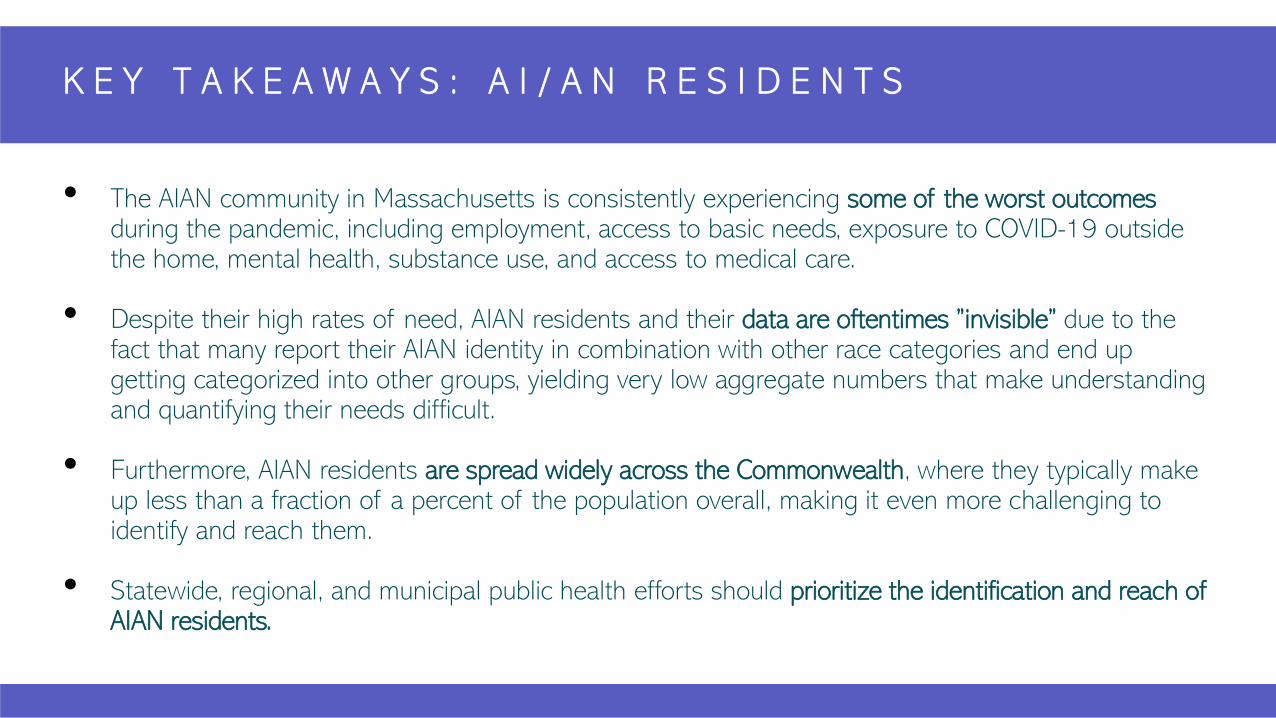
K E Y T A K E A W A Y S : A I / A N R E S I D E N T S
• The AIAN community in Massachusetts is consistently experiencing some of the worst outcomes during the pandemic, including employment, access to basic needs, exposure to COVID-19 outside the home, mental health, substance use, and access to medical care.
• Despite their high rates of need, AIAN residents and their data are oftentimes ”invisible” due to the fact that many report their AIAN identity in combination with other race categories and end up getting categorized into other groups, yielding very low aggregate numbers that make understanding and quantifying their needs difficult.
• Furthermore, AIAN residents are spread widely across the Commonwealth, where they typically make up less than a fraction of a percent of the population overall, making it even more challenging to identify and reach them.
• Statewide, regional, and municipal public health efforts should prioritize the identification and reach of AIAN residents.
P O P U L A T I O N S P O T L I G H T : H I S P A N I C / L A T I N X R E S I D E N T S
While much emphasis is placed on the personal responsibility of masking and social distancing, and
the increased morbidity and mortality of COVID-19 experienced by Hispanic/Latinx groups, less
emphasis is placed on the structural drivers of these, including lack of workplace protections against
COVID-19, and the importance of work in order to meet expenses for basic needs.
• In addition to being disproportionally impacted by COVID cases and deaths,
Latinx respondents facing significant employment/work related stressors while also struggling to
meet basic needs.
• The above stressors were associated with an increase in mental health concerns and substance
use.
F R A M I N G M A T T E R S
“ I j u s t n e e d m e n t a l h e a l t h d a y s f r o m w o r k t o r e c o u p m y e n e r g y a n d h e l p m y k i d s w i t h
t h e i r o n l i n e s t u d i e s . [ I t ’ s ] s t r e s s f u l . ”
- L a t i n x p a r e n t r e s p o n d e n t
B A C K G R O U N D
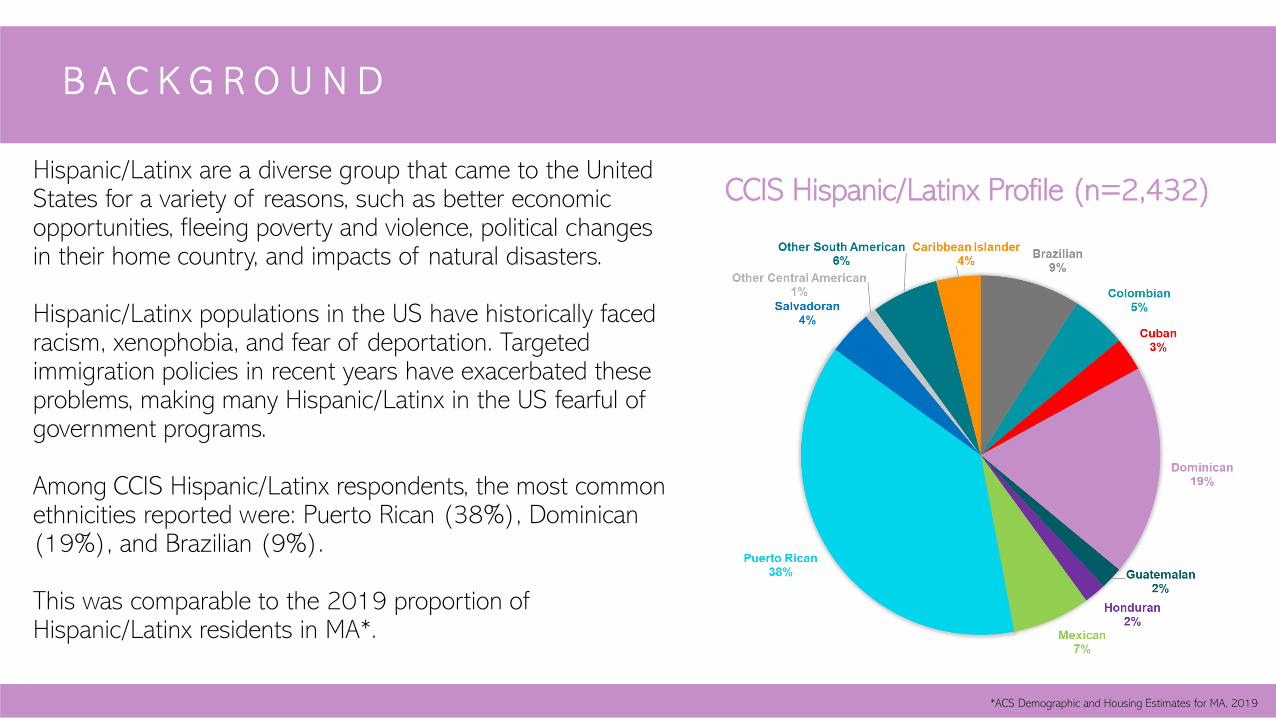
Hispanic/Latinx are a diverse group that came to the United States for a variety of reasons, such as better economic opportunities, fleeing poverty and violence, political changes in their home country, and impacts of natural disasters.
Hispanic/Latinx populations in the US have historically faced racism, xenophobia, and fear of deportation. Targeted immigration policies in recent years have exacerbated these problems, making many Hispanic/Latinx in the US fearful of government programs.
Among CCIS Hispanic/Latinx respondents, the most common ethnicities reported were: Puerto Rican (38%), Dominican (19%), and Brazilian (9%).
This was comparable to the 2019 proportion of Hispanic/Latinx residents in MA*.
CCIS Hispanic/Latinx Profile (n=2,432)
*ACS Demographic and Housing Estimates for MA, 2019
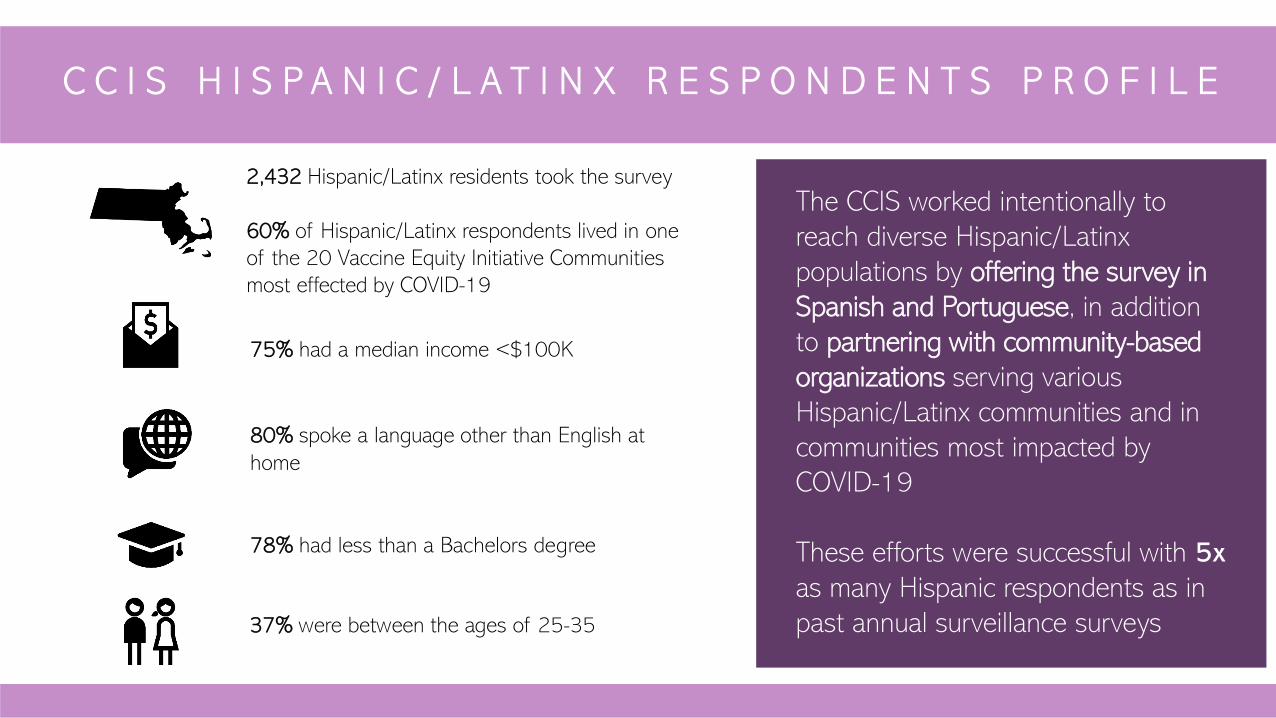
C C I S H I S P A N I C / L A T I N X R E S P O N D E N T S P R O F I L E
The CCIS worked intentionally to reach diverse Hispanic/Latinx populations by offering the survey in Spanish and Portuguese, in addition to partnering with community-based organizations serving various Hispanic/Latinx communities and in communities most impacted by COVID-19
These efforts were successful with 5xas many Hispanic respondents as in past annual surveillance surveys
2,432 Hispanic/Latinx residents took the survey
60% of Hispanic/Latinx respondents lived in one of the 20 Vaccine Equity Initiative Communities most effected by COVID-19
75% had a median income <$100K
80% spoke a language other than English athome
78% had less than a Bachelors degree
37% were between the ages of 25-35
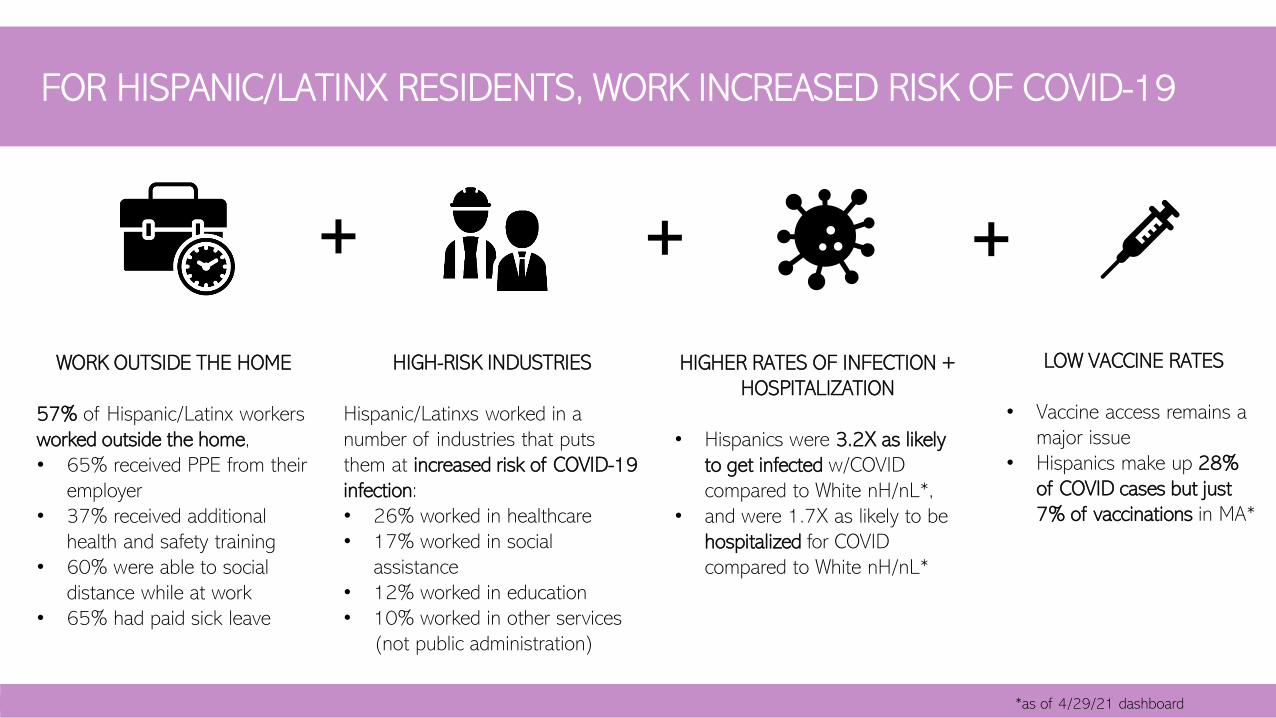
FOR HISPANIC/LATINX RESIDENTS, WORK INCREASED RISK OF COVID-19
HIGH-RISK INDUSTRIES
Hispanic/Latinxs worked in a number of industries that puts them at increased risk of COVID-19 infection:• 26% worked in healthcare• 17% worked in social
assistance• 12% worked in education• 10% worked in other services
(not public administration)
*as of 4/29/21 dashboard
WORK OUTSIDE THE HOME
57% of Hispanic/Latinx workers worked outside the home, • 65% received PPE from their
employer• 37% received additional
health and safety training• 60% were able to social
distance while at work• 65% had paid sick leave
HIGHER RATES OF INFECTION + HOSPITALIZATION
• Hispanics were 3.2X as likely to get infected w/COVID compared to White nH/nL*,
• and were 1.7X as likely to be hospitalized for COVID compared to White nH/nL*
LOW VACCINE RATES
• Vaccine access remains a major issue
• Hispanics make up 28% of COVID cases but just 7% of vaccinations in MA*
+ + +
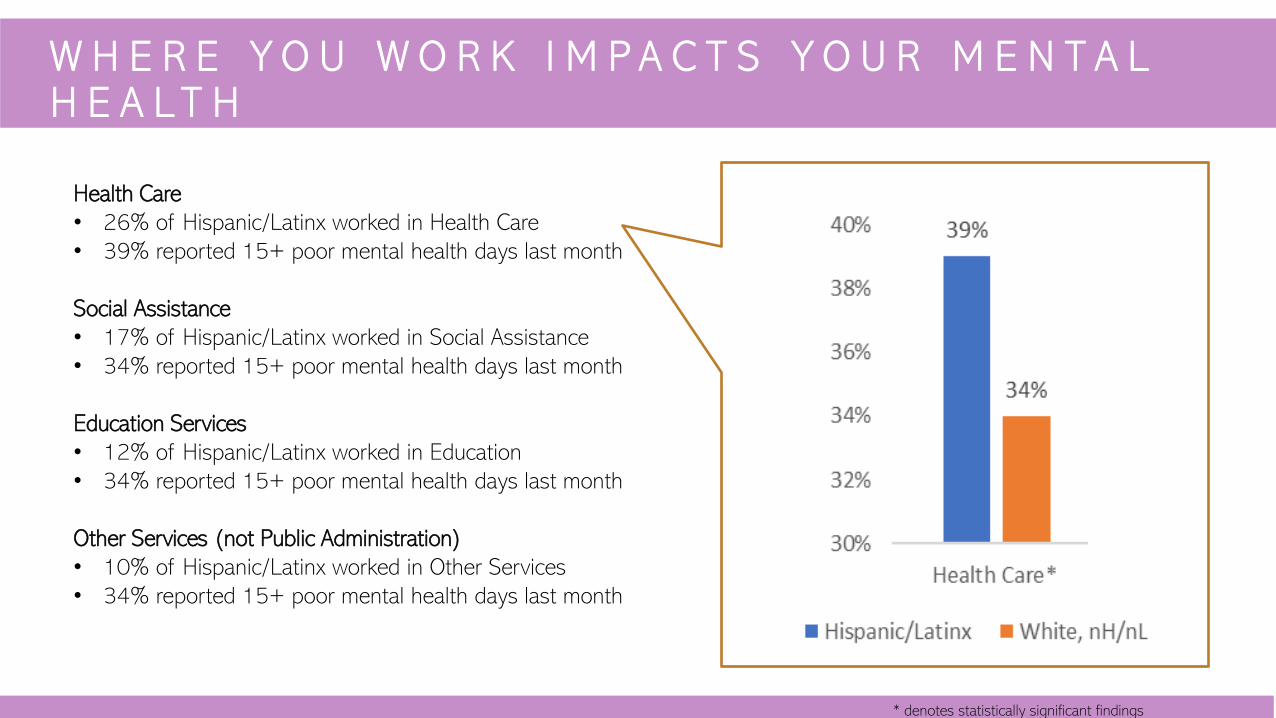
W H E R E Y O U W O R K I M P A C T S Y O U R M E N T A L H E A L T H
Health Care• 26% of Hispanic/Latinx worked in Health Care• 39% reported 15+ poor mental health days last month
Social Assistance• 17% of Hispanic/Latinx worked in Social Assistance• 34% reported 15+ poor mental health days last month
Education Services• 12% of Hispanic/Latinx worked in Education• 34% reported 15+ poor mental health days last month
Other Services (not Public Administration)• 10% of Hispanic/Latinx worked in Other Services• 34% reported 15+ poor mental health days last month
* denotes statistically significant findings
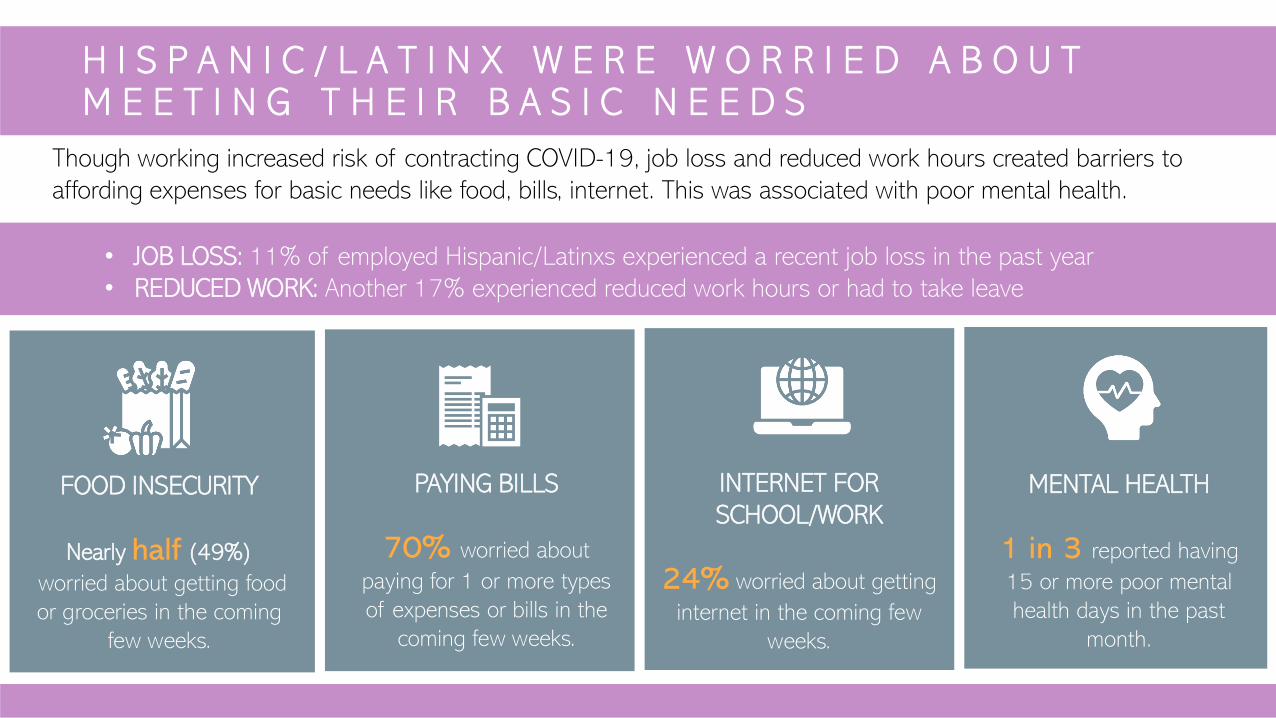
H I S P A N I C / L A T I N X W E R E W O R R I E D A B O U T M E E T I N G T H E I R B A S I C N E E D S
PAYING BILLS
70% worried about paying for 1 or more types of expenses or bills in the
coming few weeks.
FOOD INSECURITY
Nearly half (49%)worried about getting food or groceries in the coming
few weeks.
INTERNET FOR SCHOOL/WORK
24% worried about getting internet in the coming few
weeks.
MENTAL HEALTH
1 in 3 reported having 15 or more poor mental health days in the past
month.
Though working increased risk of contracting COVID-19, job loss and reduced work hours created barriers to affording expenses for basic needs like food, bills, internet. This was associated with poor mental health.
• JOB LOSS: 11% of employed Hispanic/Latinxs experienced a recent job loss in the past year• REDUCED WORK: Another 17% experienced reduced work hours or had to take leave
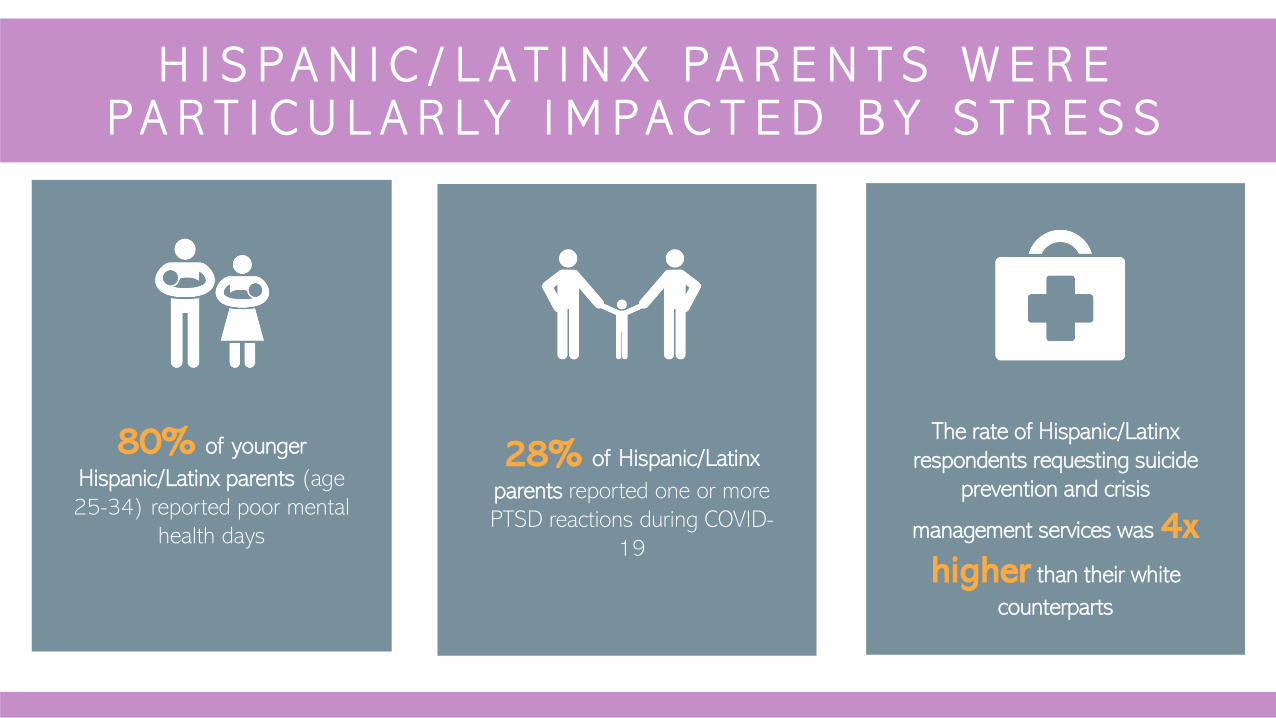
H I S P A N I C / L A T I N X P A R E N T S W E R E P A R T I C U L A R LY I M P A C T E D B Y S T R E S S
The rate of Hispanic/Latinx respondents requesting suicide
prevention and crisis
management services was 4xhigher than their white
counterparts
80% of younger Hispanic/Latinx parents (age 25-34) reported poor mental
health days
28% of Hispanic/Latinx parents reported one or more PTSD reactions during COVID-
19
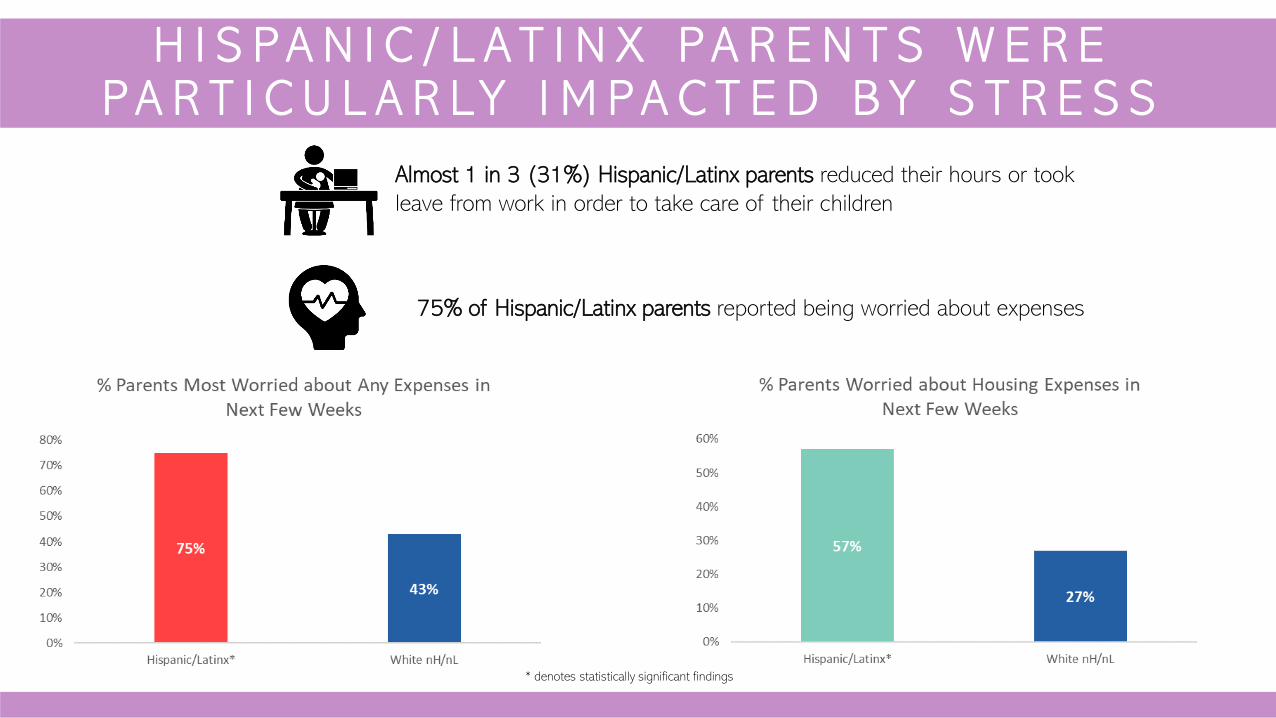
H I S P A N I C / L A T I N X P A R E N T S W E R E P A R T I C U L A R LY I M P A C T E D B Y S T R E S S
Almost 1 in 3 (31%) Hispanic/Latinx parents reduced their hours or took leave from work in order to take care of their children
75% of Hispanic/Latinx parents reported being worried about expenses
* denotes statistically significant findings
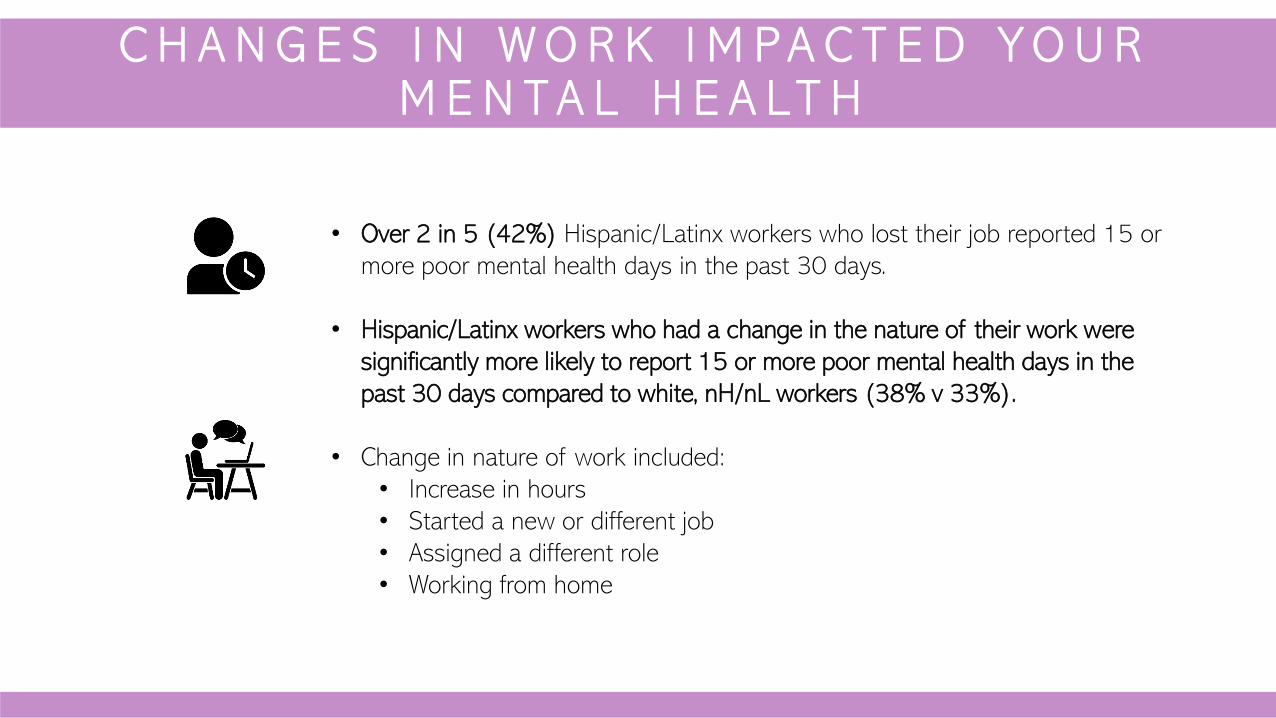
C H A N G E S I N W O R K I M P A C T E D Y O U R M E N T A L H E A LT H
• Over 2 in 5 (42%) Hispanic/Latinx workers who lost their job reported 15 or more poor mental health days in the past 30 days.
• Hispanic/Latinx workers who had a change in the nature of their work were significantly more likely to report 15 or more poor mental health days in the past 30 days compared to white, nH/nL workers (38% v 33%).
• Change in nature of work included:• Increase in hours• Started a new or different job• Assigned a different role• Working from home
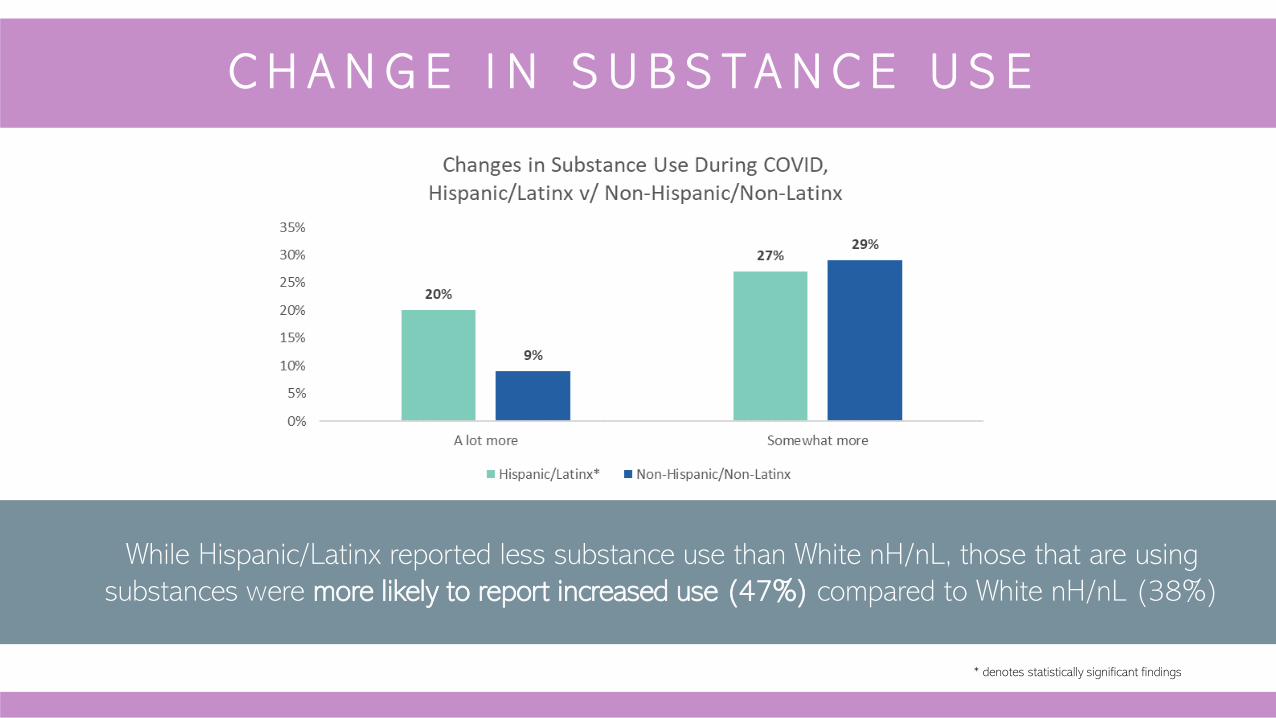
C H A N G E I N S U B S T A N C E U S E
While Hispanic/Latinx reported less substance use than White nH/nL, those that are using substances were more likely to report increased use (47%) compared to White nH/nL (38%)
* denotes statistically significant findings
Hispanic/Latinx groups – especially parents – are under
increased stress, and face barriers to affording basic needs,
which makes work even more crucial. Unfortunately, work is also
increasing this group's risks to COVID-19, by requiring them to
work outside the home, offering few opportunities for social
distancing, and providing inconsistent access to PPE.
K E Y T A K E A W A Y S : H I S P A N I C / L A T I N X R E S I D E N T S
P O P U L A T I O N S P O T L I G H T : B L A C K R E S I D E N T S
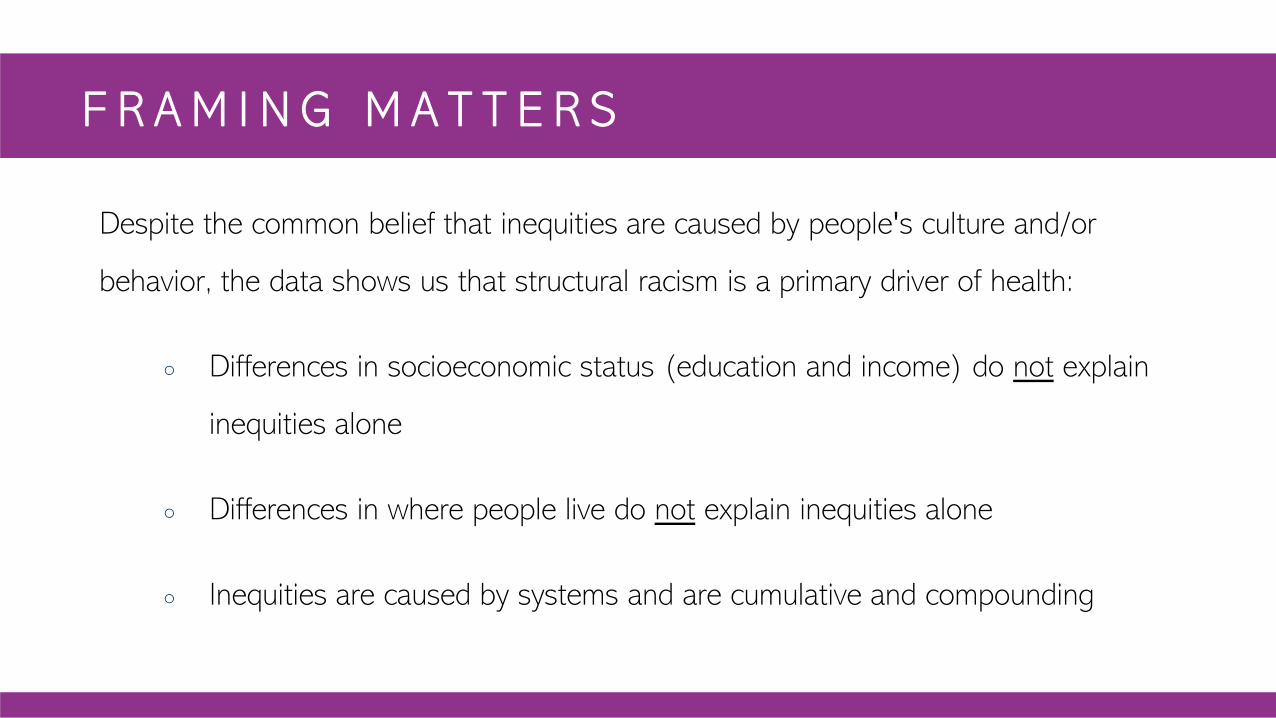
Despite the common belief that inequities are caused by people's culture and/or
behavior, the data shows us that structural racism is a primary driver of health:
○ Differences in socioeconomic status (education and income) do not explain
inequities alone
○ Differences in where people live do not explain inequities alone
○ Inequities are caused by systems and are cumulative and compounding
F R A M I N G M A T T E R S
Why are black people generally being infected and dying at higher rates than other racial groups? This is the question of the hour. And too many Americans are answering this new question in the
old, familiar way. They are blaming poverty, but refusing to recognize how racism distinguishes black poverty from white poverty, and makes black poverty more vulnerable to a lethal contagion.
- - I b r a m X . K e n d i , S t o p B l a m i n g B l a c k P e o p l e f o r D y i n g o f t h e C o r o n a v i r u s
B L A C K C O M M U N I T Y I N M A S S A C H U S E T T S
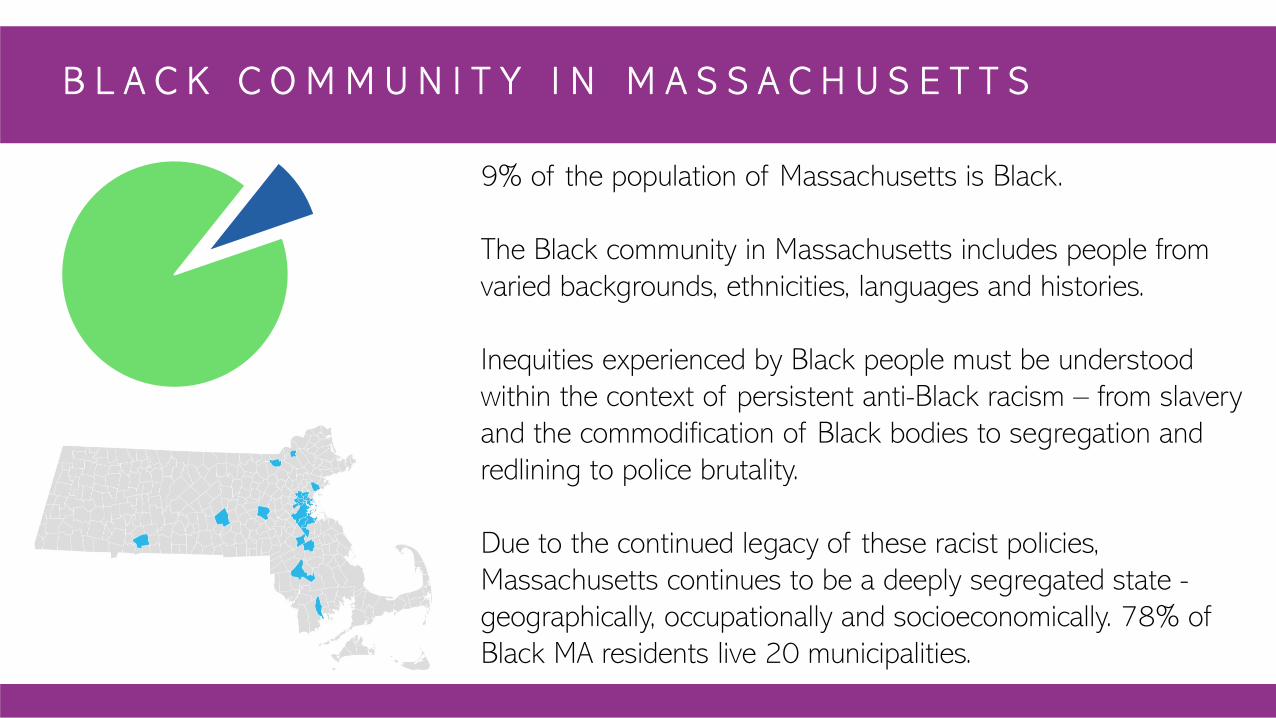
9% of the population of Massachusetts is Black.
The Black community in Massachusetts includes people from varied backgrounds, ethnicities, languages and histories.
Inequities experienced by Black people must be understood within the context of persistent anti-Black racism – from slavery and the commodification of Black bodies to segregation and redlining to police brutality.
Due to the continued legacy of these racist policies, Massachusetts continues to be a deeply segregated state -geographically, occupationally and socioeconomically. 78% of Black MA residents live 20 municipalities.
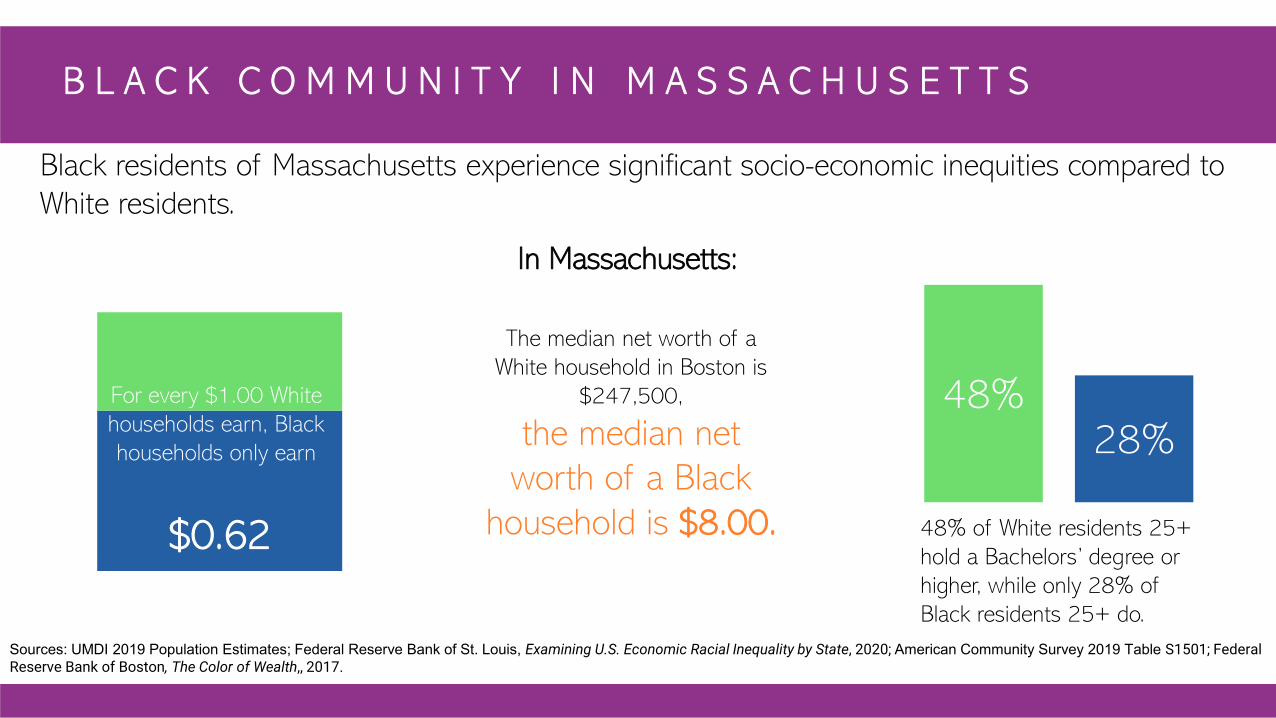
B L A C K C O M M U N I T Y I N M A S S A C H U S E T T S
Black residents of Massachusetts experience significant socio-economic inequities compared to White residents.
Sources: UMDI 2019 Population Estimates; Federal Reserve Bank of St. Louis, Examining U.S. Economic Racial Inequality by State, 2020; American Community Survey 2019 Table S1501; Federal Reserve Bank of Boston, The Color of Wealth,, 2017.
$0.62
For every $1.00 White households earn, Black households only earn
48%28%
In Massachusetts:
48% of White residents 25+ hold a Bachelors’ degree or higher, while only 28% of Black residents 25+ do.
The median net worth of a White household in Boston is
$247,500,
the median net worth of a Black
household is $8.00.
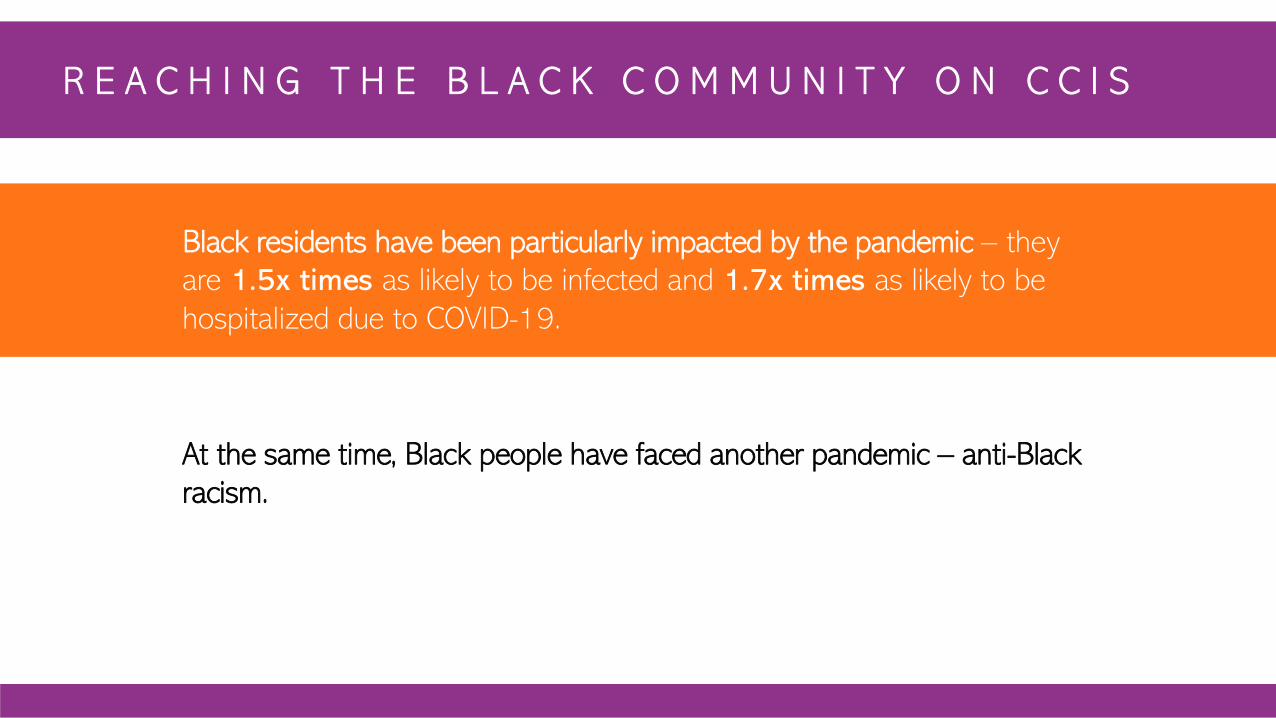
R E A C H I N G T H E B L A C K C O M M U N I T Y O N C C I S
Black residents have been particularly impacted by the pandemic – they are 1.5x times as likely to be infected and 1.7x times as likely to be hospitalized due to COVID-19.
At the same time, Black people have faced another pandemic – anti-Black racism.
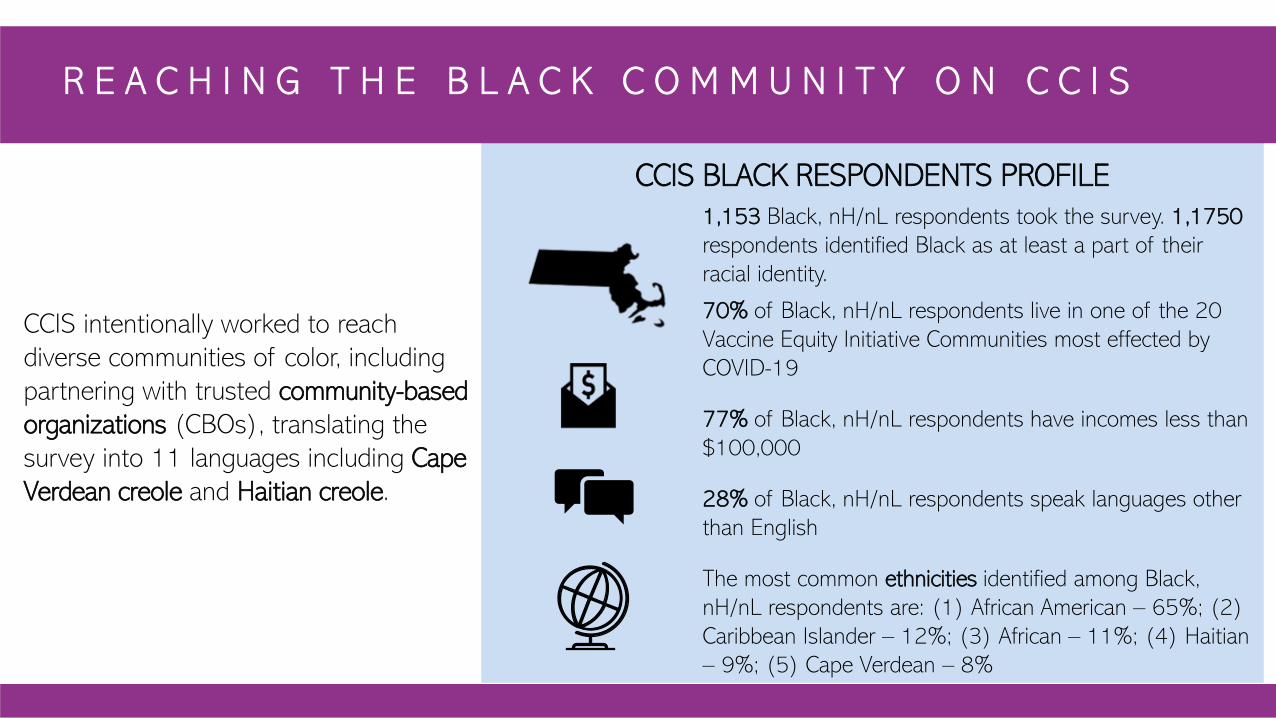
R E A C H I N G T H E B L A C K C O M M U N I T Y O N C C I S
CCIS intentionally worked to reach diverse communities of color, including partnering with trusted community-based organizations (CBOs), translating the survey into 11 languages including Cape Verdean creole and Haitian creole.
1,153 Black, nH/nL respondents took the survey. 1,1750respondents identified Black as at least a part of their racial identity.
70% of Black, nH/nL respondents live in one of the 20 Vaccine Equity Initiative Communities most effected by COVID-19
77% of Black, nH/nL respondents have incomes less than $100,000
28% of Black, nH/nL respondents speak languages other than English
The most common ethnicities identified among Black, nH/nL respondents are: (1) African American – 65%; (2) Caribbean Islander – 12%; (3) African – 11%; (4) Haitian – 9%; (5) Cape Verdean – 8%
CCIS BLACK RESPONDENTS PROFILE
EDUCATION, INCOME & INEQUITY
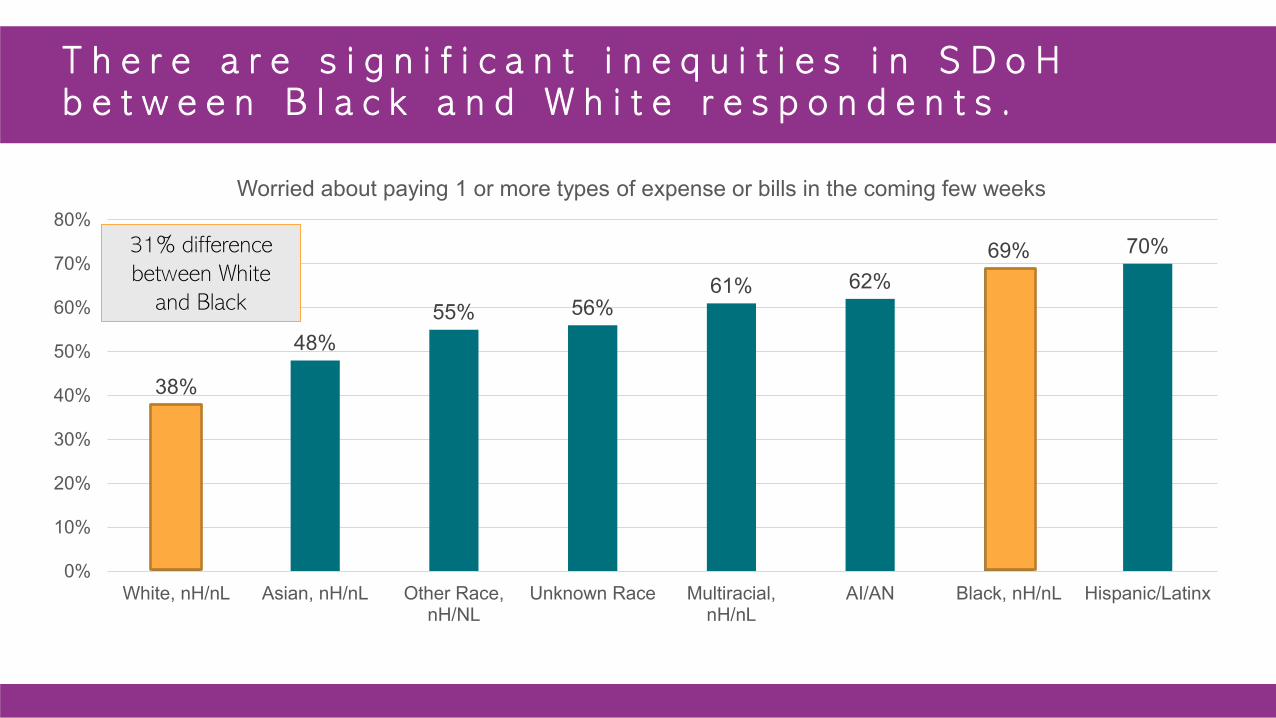
T h e r e a r e s i g n i f i c a n t i n e q u i t i e s i n S D o Hb e t w e e n B l a c k a n d W h i t e r e s p o n d e n t s .
38%
48%55% 56%
61% 62%69% 70%
0%
10%
20%
30%
40%
50%
60%
70%
80%
White, nH/nL Asian, nH/nL Other Race,nH/NL
Unknown Race Multiracial,nH/nL
AI/AN Black, nH/nL Hispanic/Latinx
Worried about paying 1 or more types of expense or bills in the coming few weeks
31% difference between White
and Black
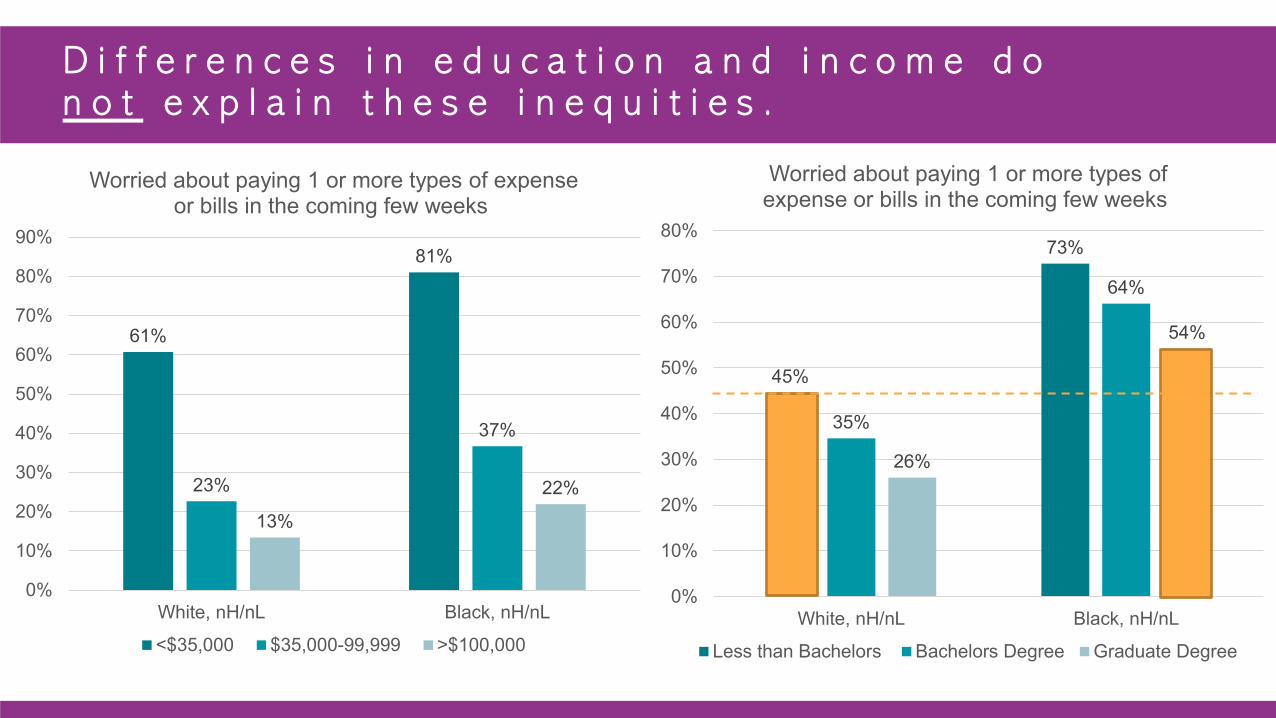
D i f f e r e n c e s i n e d u c a t i o n a n d i n c o m e d o n o t e x p l a i n t h e s e i n e q u i t i e s .
45%
73%
35%
64%
26%
54%
0%
10%
20%
30%
40%
50%
60%
70%
80%
White, nH/nL Black, nH/nL
Worried about paying 1 or more types of expense or bills in the coming few weeks
Less than Bachelors Bachelors Degree Graduate Degree
61%
81%
23%
37%
13%
22%
0%
10%
20%
30%
40%
50%
60%
70%
80%
90%
White, nH/nL Black, nH/nL
Worried about paying 1 or more types of expense or bills in the coming few weeks
<$35,000 $35,000-99,999 >$100,000
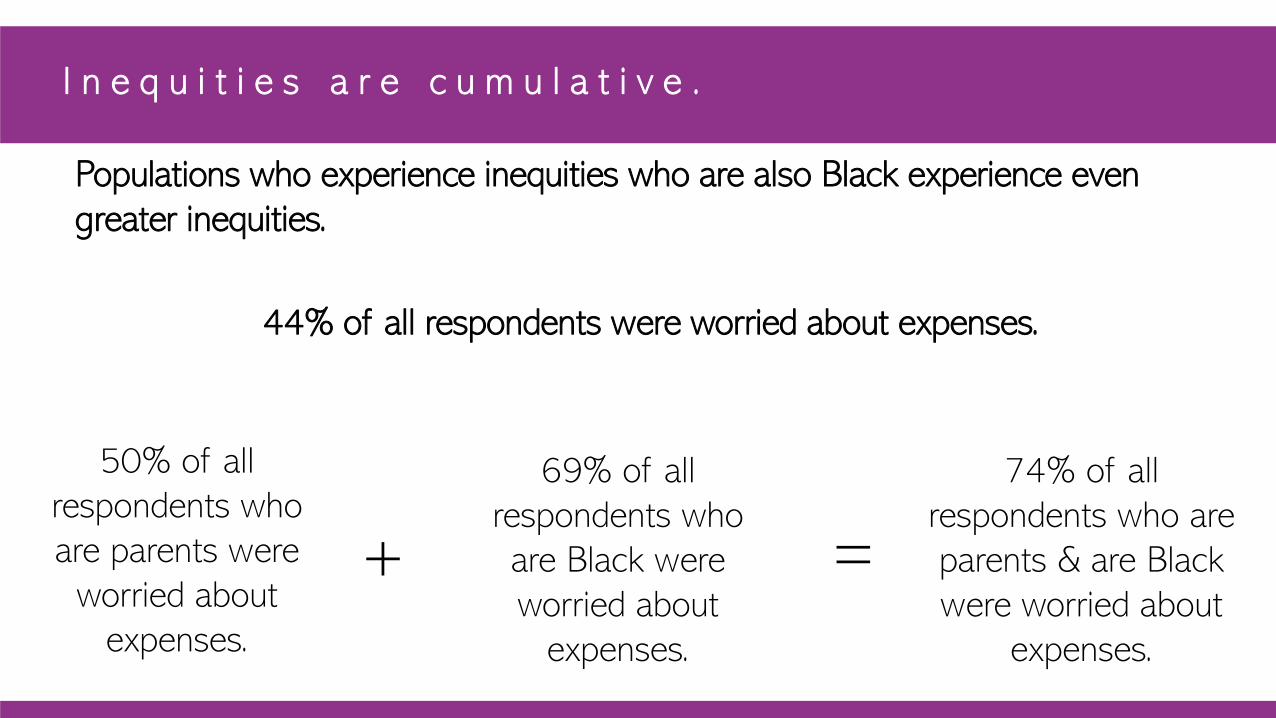
I n e q u i t i e s a r e c u m u l a t i v e .
Populations who experience inequities who are also Black experience even greater inequities.
44% of all respondents were worried about expenses.
69% of all respondents who are Black were worried about
expenses.
74% of all respondents who are parents & are Black were worried about
expenses.
+ =
50% of all respondents who are parents were
worried about expenses.

GEOGRAPHY & INEQUITY
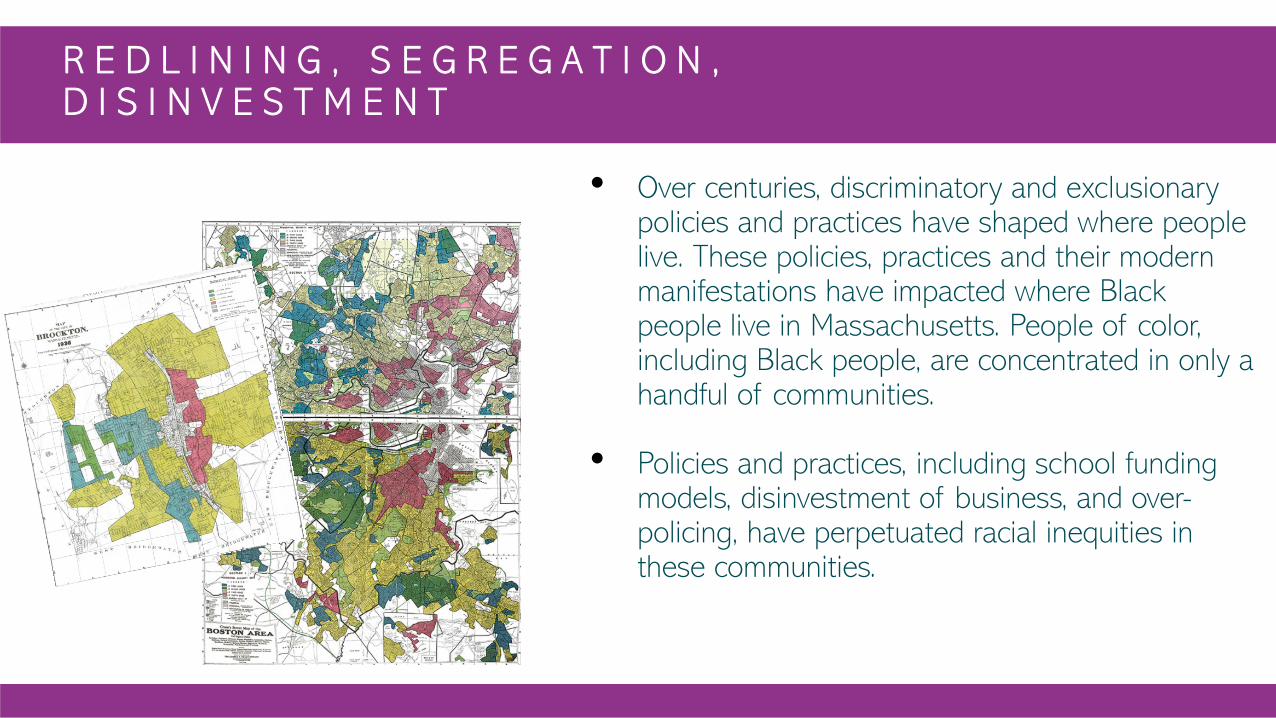
R E D L I N I N G , S E G R E G A T I O N , D I S I N V E S T M E N T
• Over centuries, discriminatory and exclusionary policies and practices have shaped where people live. These policies, practices and their modern manifestations have impacted where Black people live in Massachusetts. People of color, including Black people, are concentrated in only a handful of communities.
• Policies and practices, including school funding models, disinvestment of business, and over-policing, have perpetuated racial inequities in these communities.
S p o t l i g h t o n t h e 2 0 V a c c i n e E q u i t y I n i t i a t i v e C o m m u n i t i e s
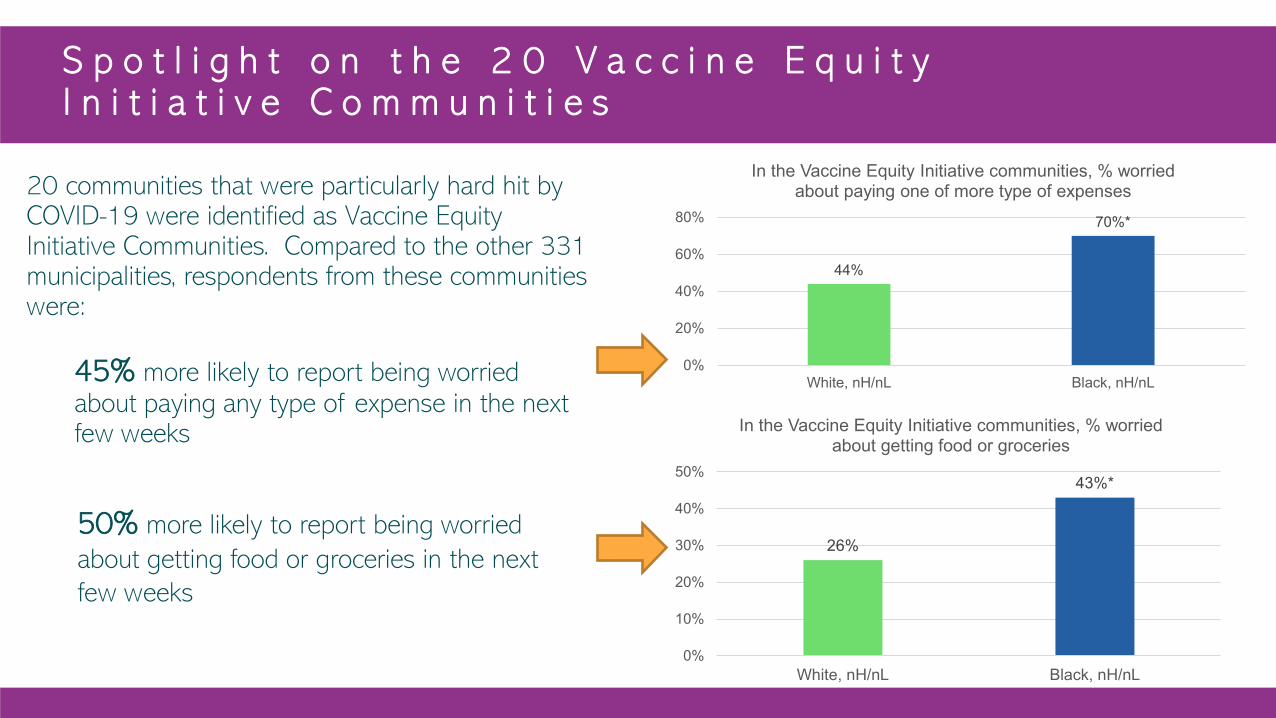
20 communities that were particularly hard hit by COVID-19 were identified as Vaccine Equity Initiative Communities. Compared to the other 331 municipalities, respondents from these communities were:
44%
70%*
0%
20%
40%
60%
80%
White, nH/nL Black, nH/nL
In the Vaccine Equity Initiative communities, % worried about paying one of more type of expenses
26%
43%*
0%
10%
20%
30%
40%
50%
White, nH/nL Black, nH/nL
In the Vaccine Equity Initiative communities, % worried about getting food or groceries
45% more likely to report being worried about paying any type of expense in the next few weeks
50% more likely to report being worried about getting food or groceries in the next few weeks

TWO HEALTH CRISES
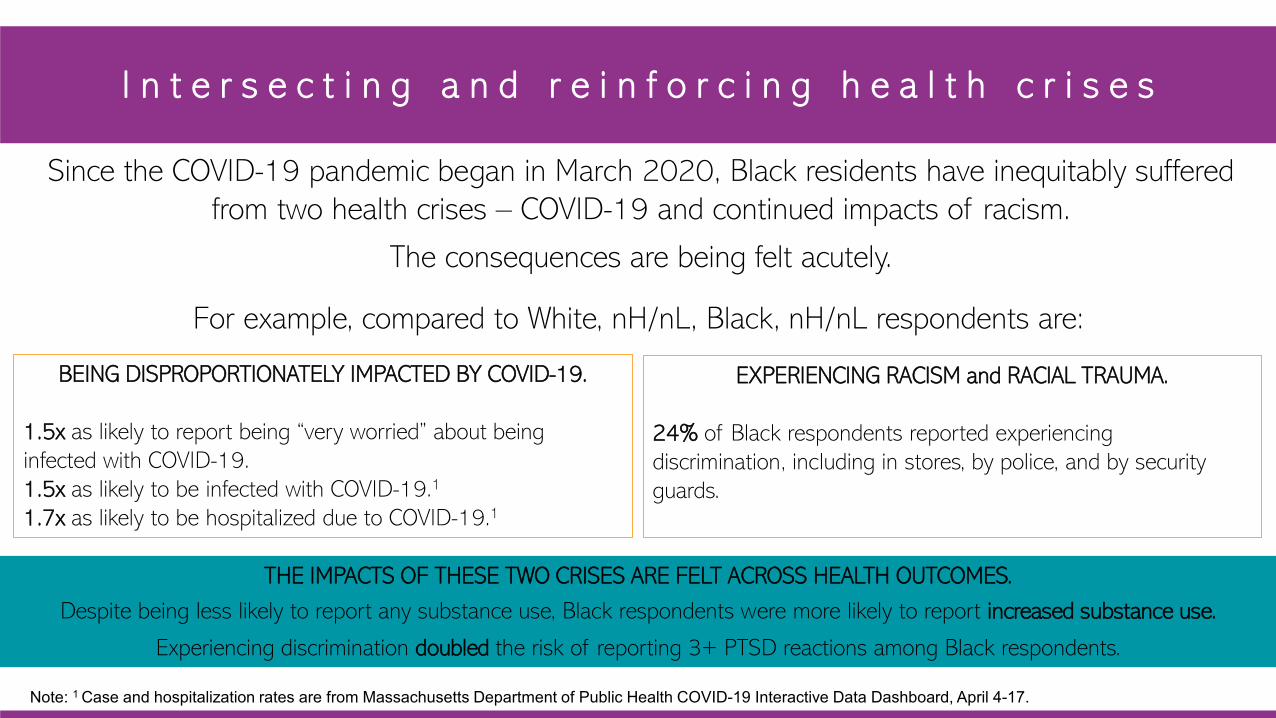
I n t e r s e c t i n g a n d r e i n f o r c i n g h e a l t h c r i s e s
Since the COVID-19 pandemic began in March 2020, Black residents have inequitably suffered from two health crises – COVID-19 and continued impacts of racism.
The consequences are being felt acutely.
For example, compared to White, nH/nL, Black, nH/nL respondents are:
BEING DISPROPORTIONATELY IMPACTED BY COVID-19.
1.5x as likely to report being “very worried” about being infected with COVID-19. 1.5x as likely to be infected with COVID-19.1
1.7x as likely to be hospitalized due to COVID-19.1
EXPERIENCING RACISM and RACIAL TRAUMA.
24% of Black respondents reported experiencing discrimination, including in stores, by police, and by security guards.
THE IMPACTS OF THESE TWO CRISES ARE FELT ACROSS HEALTH OUTCOMES.
Despite being less likely to report any substance use, Black respondents were more likely to report increased substance use.
Experiencing discrimination doubled the risk of reporting 3+ PTSD reactions among Black respondents.
Note: 1 Case and hospitalization rates are from Massachusetts Department of Public Health COVID-19 Interactive Data Dashboard, April 4-17.
To truly understand how Black populations have been impacted
by the pandemic, we must consider the multiple identities people
hold and the systems and structures they interact with.
Intersectionality matters.
K E Y T A K E A W A Y S : B L A C K R E S I D E N T S
111
R A C I A L J U S T I C E R E F R A M I N G A N D A C A L L T O A C T I O N
112
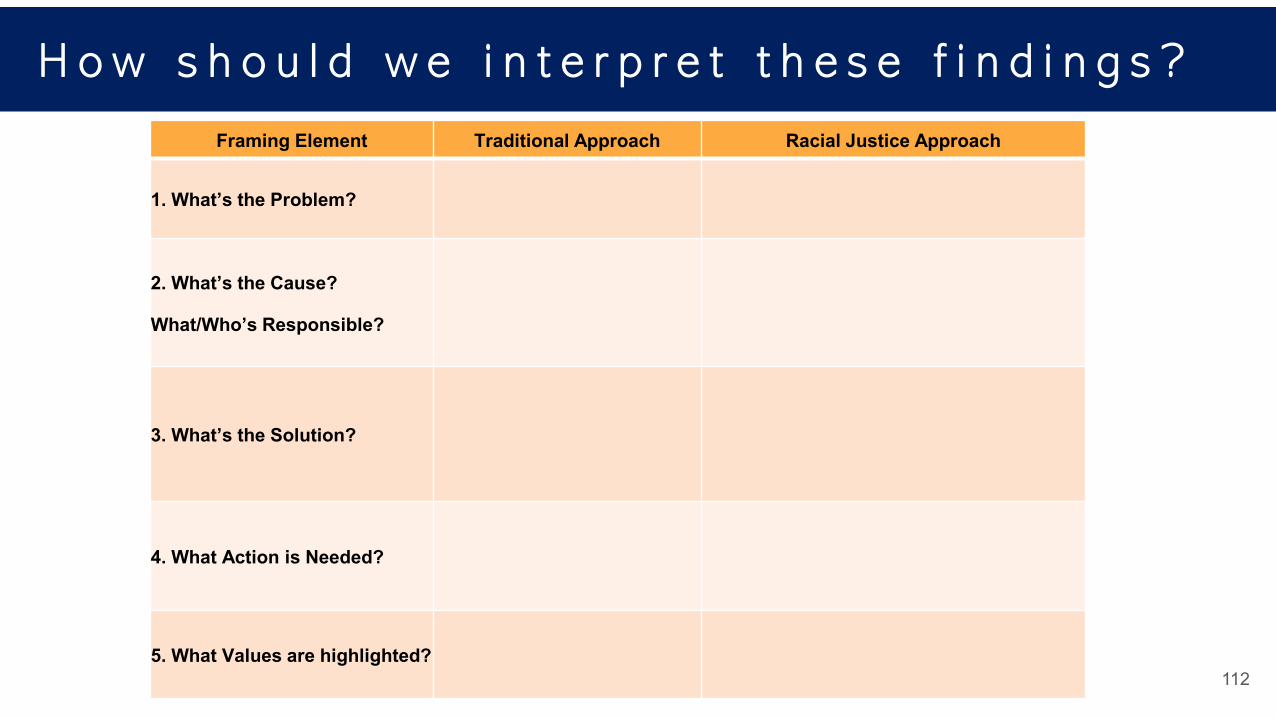
Framing Element Traditional Approach Racial Justice Approach
1. What’s the Problem?
2. What’s the Cause?
What/Who’s Responsible?
3. What’s the Solution?
4. What Action is Needed?
5. What Values are highlighted?
H o w s h o u l d w e i n t e r p r e t t h e s e f i n d i n g s ?
113
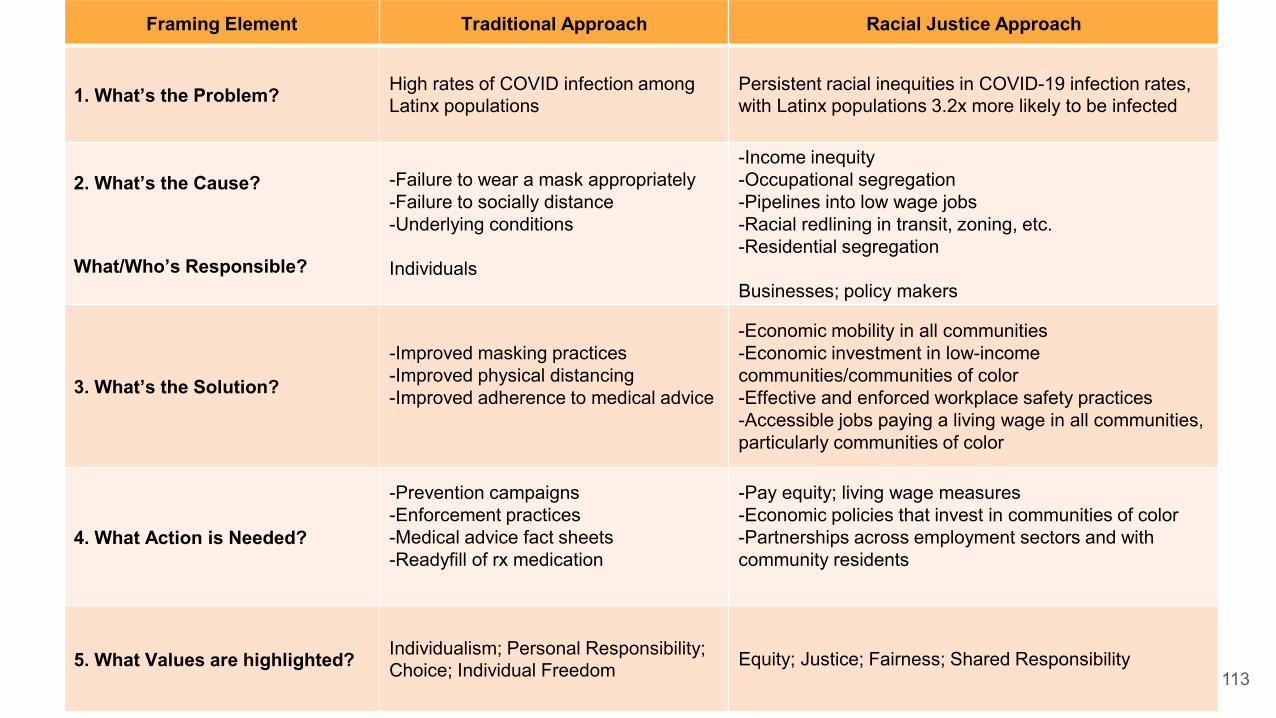
Framing Element Traditional Approach Racial Justice Approach
1. What’s the Problem? High rates of COVID infection among Latinx populations
Persistent racial inequities in COVID-19 infection rates, with Latinx populations 3.2x more likely to be infected
2. What’s the Cause?
What/Who’s Responsible?
-Failure to wear a mask appropriately-Failure to socially distance-Underlying conditions
Individuals
-Income inequity-Occupational segregation-Pipelines into low wage jobs-Racial redlining in transit, zoning, etc.-Residential segregation
Businesses; policy makers
3. What’s the Solution?
-Improved masking practices-Improved physical distancing-Improved adherence to medical advice
-Economic mobility in all communities-Economic investment in low-income communities/communities of color-Effective and enforced workplace safety practices-Accessible jobs paying a living wage in all communities, particularly communities of color
4. What Action is Needed?
-Prevention campaigns-Enforcement practices-Medical advice fact sheets-Readyfill of rx medication
-Pay equity; living wage measures-Economic policies that invest in communities of color-Partnerships across employment sectors and with community residents
5. What Values are highlighted? Individualism; Personal Responsibility; Choice; Individual Freedom Equity; Justice; Fairness; Shared Responsibility
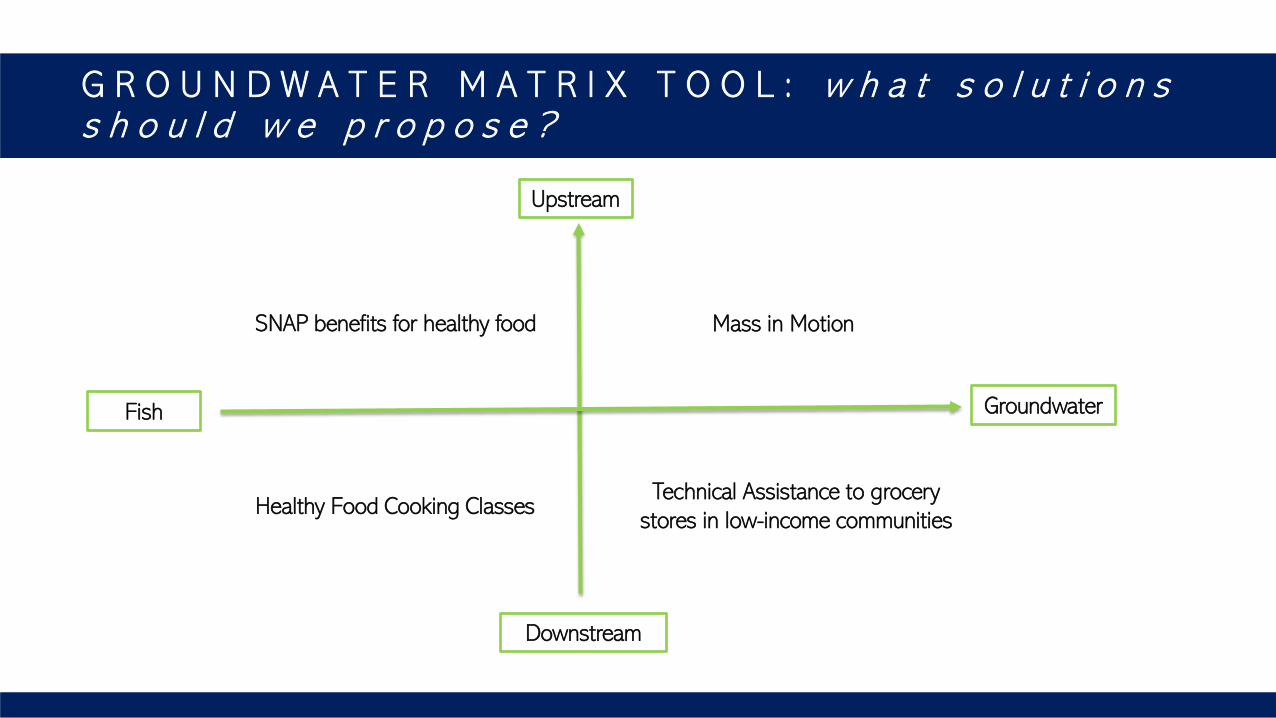
G R O U N D W A T E R M A T R I X T O O L : w h a t s o l u t i o n s s h o u l d w e p r o p o s e ?
Upstream
Downstream
Fish Groundwater
SNAP benefits for healthy food Mass in Motion
Healthy Food Cooking ClassesTechnical Assistance to grocery
stores in low-income communities
● Socio-economic differences do not explain racial inequities.
● Racial inequities look the same across systems.
● Inequities are caused by systems, regardless of people’s culture or behavior.
● Reliance on dominant framing prevents us from seeing real problems and developing real solutions.
F I N A L T A K E A W A Y S
“ W e w i l l n o t g o b a c k t o n o r m a l . N o r m a l n e v e r w a s . O u r p r e - c o r o n a e x i s t e n c e w a s n o t n o r m a l o t h e r t h a n
w e n o r m a l i z e d g r e e d , i n e q u i t y , e x h a u s t i o n , d e p l e t i o n , e x t r a c t i o n , d i s c o n n e c t i o n , c o n f u s i o n , r a g e , h o a r d i n g ,
h a t e a n d l a c k . W e s h o u l d n o t l o n g t o r e t u r n , m y f r i e n d s . W e a r e b e i n g g i v e n t h e o p p o r t u n i t y t o s t i t c h
a n e w g a r m e n t . O n e t h a t f i t s a l l o f h u m a n i t y a n d n a t u r e . ” - S o n y a R e n e e T a y l o r
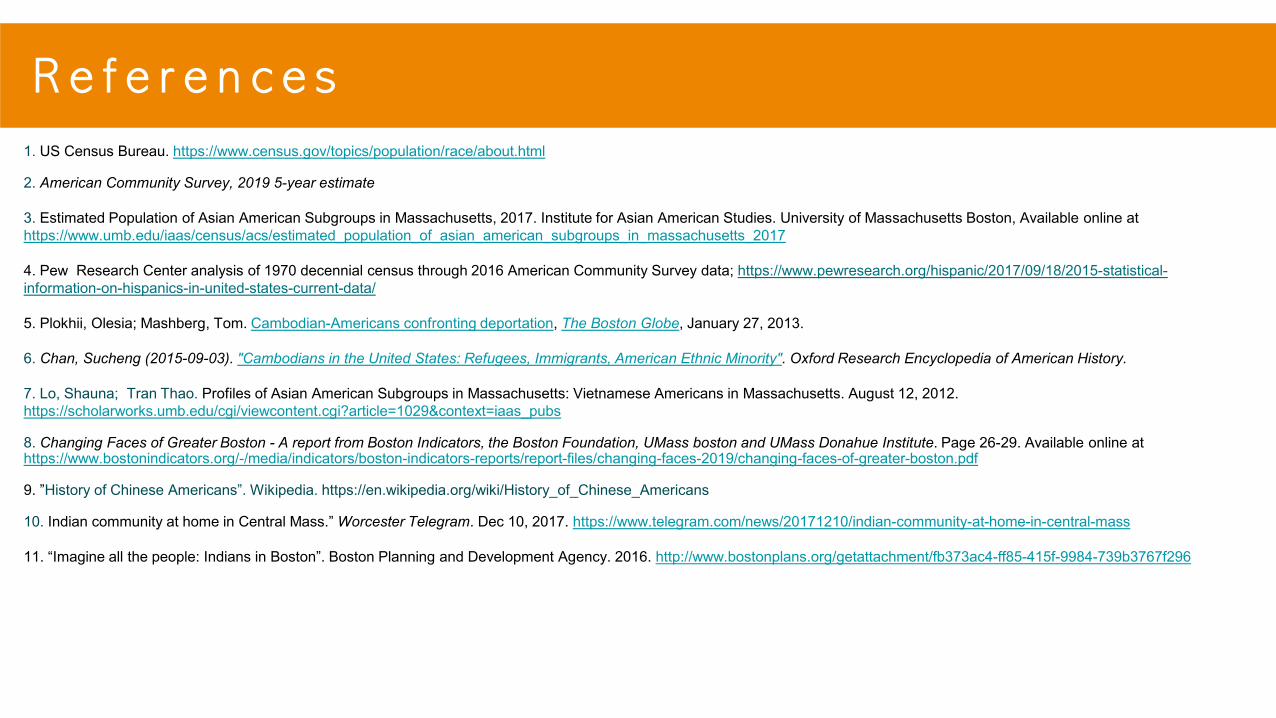
R e f e r e n c e s1. US Census Bureau. https://www.census.gov/topics/population/race/about.html
2. American Community Survey, 2019 5-year estimate
3. Estimated Population of Asian American Subgroups in Massachusetts, 2017. Institute for Asian American Studies. University of Massachusetts Boston, Available online at https://www.umb.edu/iaas/census/acs/estimated_population_of_asian_american_subgroups_in_massachusetts_2017
4. Pew Research Center analysis of 1970 decennial census through 2016 American Community Survey data; https://www.pewresearch.org/hispanic/2017/09/18/2015-statistical-information-on-hispanics-in-united-states-current-data/
5. Plokhii, Olesia; Mashberg, Tom. Cambodian-Americans confronting deportation, The Boston Globe, January 27, 2013.
6. Chan, Sucheng (2015-09-03). "Cambodians in the United States: Refugees, Immigrants, American Ethnic Minority". Oxford Research Encyclopedia of American History.
7. Lo, Shauna; Tran Thao. Profiles of Asian American Subgroups in Massachusetts: Vietnamese Americans in Massachusetts. August 12, 2012. https://scholarworks.umb.edu/cgi/viewcontent.cgi?article=1029&context=iaas_pubs
8. Changing Faces of Greater Boston - A report from Boston Indicators, the Boston Foundation, UMass boston and UMass Donahue Institute. Page 26-29. Available online at https://www.bostonindicators.org/-/media/indicators/boston-indicators-reports/report-files/changing-faces-2019/changing-faces-of-greater-boston.pdf
9. ”History of Chinese Americans”. Wikipedia. https://en.wikipedia.org/wiki/History_of_Chinese_Americans
10. Indian community at home in Central Mass.” Worcester Telegram. Dec 10, 2017. https://www.telegram.com/news/20171210/indian-community-at-home-in-central-mass
11. “Imagine all the people: Indians in Boston”. Boston Planning and Development Agency. 2016. http://www.bostonplans.org/getattachment/fb373ac4-ff85-415f-9984-739b3767f296
119
Visit http://mass.gov/covidsurvey for more information on how residents of Massachusetts have been impacted by the pandemic and how we can all
work together to turn these data into action!
WANT TO KNOW MORE?


