Embed Size (px)
Citation preview
PUBLIC DISCLOSURE
March 24, 2014
COMMUNITY REINVESTMENT ACT PERFORMANCE EVALUATION
THE CAPE COD FIVE CENTS SAVINGS BANK
CERT # 23287
532 MAIN STREET
HARWICH PORT, MASSACHUSETTS 02646
Division of Banks Federal Deposit Insurance Corporation
1000 Washington Street 350 Fifth Avenue, Suite 1200
Boston, Massachusetts 02118 New York, New York 10118
NOTE: This document is an evaluation of the institution’s record of meeting the credit
needs of its entire community, including low- and moderate-income
neighborhoods, consistent with safe and sound operations of the institution. This
evaluation is not, nor should it be construed as, an assessment of the financial
condition of this institution. The rating assigned to this institution does not
represent an analysis, conclusion or opinion of the Division of Banks or the
Federal Deposit Insurance Corporation concerning the safety and soundness of
this financial institution.

1
TABLE OF CONTENTS
I. General Information ................................................................................................................. 1
II. Institution Rating
A. Overall Rating ...................................................................................................................... 2
B. Performance Test Ratings Table .......................................................................................... 2
C. Summary of Major Factors Supporting Rating.................................................................... 3
III. Institution
A. Description of Institution ..................................................................................................... 4
B. Description of Assessment Area .......................................................................................... 5
C. Scope of Examination .......................................................................................................... 9
D. Conclusions with Respect to Performance Tests - Combined Areas ....................................
1. Lending Test ........................................................................................................10
2. Investment Test ....................................................................................................20
3. Service Test ..........................................................................................................22
E. Conclusions with Respect to Performance Tests – Barnstable MSA (Full-Scope) ........... 28
F. Conclusions with Respect to Performance Tests – Nantucket County (Full-Scope) ........ 41
IV. Appendices
A. Fair Lending (Division of Banks) .................................................................................... A-1
B. Loss of Affordable Housing (Division of Banks) ............................................................ B-1
C. General Definitions .......................................................................................................... C-1
D. Investment Definitions ..................................................................................................... D-1
E. Standard Public Evaluation Language ............................................................................. E-1
1
GENERAL INFORMATION
The Community Reinvestment Act (“CRA”) requires the Massachusetts Division of Banks
(“Division”) and the Federal Deposit Insurance Corporation (“FDIC”) to use their authority
when examining financial institutions subject to their supervision, to assess the institution's
record of meeting the credit needs of its community, including low- and moderate-income
neighborhoods, consistent with safe and sound operation of the institution. Upon conclusion of
such examination, the agencies must prepare a written evaluation of the institution's record of
meeting the credit needs of its assessment area.
This document is an evaluation of the CRA performance of The Cape Cod Five Cents Savings
Bank (“Cape Cod Five” or “the Bank”), prepared by the Division and the FDIC, the
institution's supervisory agencies, as of March 24, 2014. The agencies evaluate performance in
assessment area(s), as they are delineated by the institution, rather than individual branches.
This assessment area evaluation may include visits to some, but not necessarily all of the
institution’s branches. The Division and FDIC rate the CRA performance of an institution
consistent with the provisions set forth in 209 CMR 46.00 and in Appendix A to 12 CFR Part 345.
2
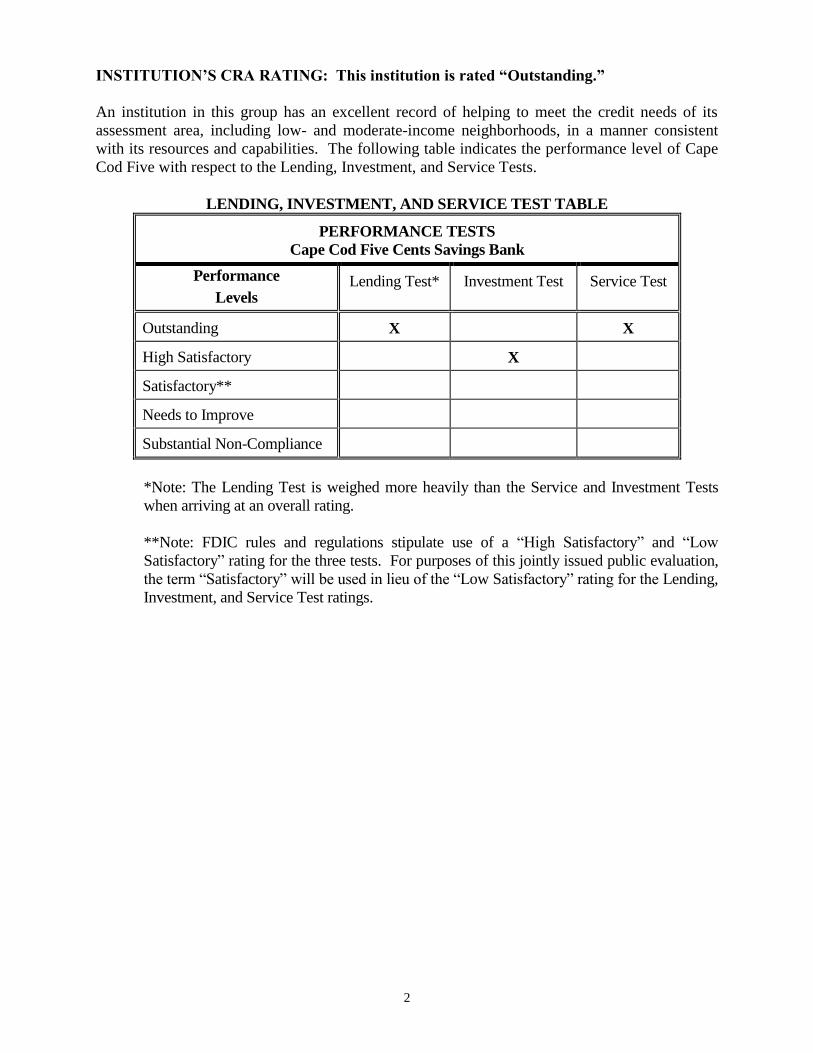
INSTITUTION’S CRA RATING: This institution is rated “Outstanding.”
An institution in this group has an excellent record of helping to meet the credit needs of its
assessment area, including low- and moderate-income neighborhoods, in a manner consistent
with its resources and capabilities. The following table indicates the performance level of Cape
Cod Five with respect to the Lending, Investment, and Service Tests.
LENDING, INVESTMENT, AND SERVICE TEST TABLE
PERFORMANCE TESTS
Cape Cod Five Cents Savings Bank
Performance
Levels Lending Test* Investment Test Service Test
Outstanding X X
High Satisfactory X
Satisfactory**
Needs to Improve
Substantial Non-Compliance
*Note: The Lending Test is weighed more heavily than the Service and Investment Tests
when arriving at an overall rating.
**Note: FDIC rules and regulations stipulate use of a “High Satisfactory” and “Low
Satisfactory” rating for the three tests. For purposes of this jointly issued public evaluation,
the term “Satisfactory” will be used in lieu of the “Low Satisfactory” rating for the Lending,
Investment, and Service Test ratings.
3
LENDING TEST
The Lending Test is rated “Outstanding” based on the following factors:
The lending activity reflects excellent responsiveness to the assessment area credit needs.
At 91.5 percent, a substantial majority of the home mortgage, small business, and small
farm loans were originated within the assessment area.
The geographic distribution of loans reflects good penetration throughout the assessment
area, particularly in low- and moderate-income census tracts.
The distribution of borrowers reflects excellent penetration among borrowers of different
income levels and businesses of different sizes.
The Bank exhibited an excellent record of serving the credit needs of the most
economically disadvantaged area(s) of its assessment area, low- and moderate- income
individuals, and very small businesses, consistent with safe and sound banking practices.
The Bank is a leader in making community development loans.
The Bank makes extensive use of innovative and flexible lending programs to serve
assessment area credit needs during the evaluation period.
INVESTMENT TEST
The Investment Test is rated “High Satisfactory” based on the following:
Qualified Investments – The level of qualified community development investments and the
degree of innovativeness and complexity of those investments are good considering the size and
financial condition of the Bank.
Qualified Donations – The Bank also demonstrated a commitment to the community by providing
a good level of qualified donations to community organizations. Overall, the Bank made qualified
donations totaling $1,088,221.
SERVICE TEST
The Service Test is rated “Outstanding” based on the following:
Retail Banking Services – Cape Cod Five’s delivery systems are readily accessible to all
portions of the assessment areas, including low- and moderate-income areas, and to individuals
of different income levels and businesses of different sizes. Banking services are available at any
time both online and via Automated Teller Machines (ATMs). In addition, branch hours are similar
to other local financial institutions and feature extended hours on select days.
Community Development Services – Cape Cod Five is a leader in providing community
development services. In addition, the Bank sponsors several educational seminars and programs
which promote affordable housing, provide community services targeted to low- and moderate-
income individuals, and promote economic development in their assessment areas.
4
PERFORMANCE CONTEXT
Description of Institution:
Incorporated in March 1855, Cape Cod Five is a state chartered mutual savings bank. Cape Cod
Five maintains its corporate headquarters at 532 Main Street in Harwich Port, Massachusetts.
The Bank offers products and services through its main office in Harwich Port and 15 full-
service branch offices located in Brewster, Centerville, Chatham, Dennis, Eastham, Falmouth,
Harwich, Hyannis, Mashpee, Nantucket (2 branches), Orleans, Sandwich, Wellfleet, and
Yarmouth. The Bank also operates a loan production office in Marion, a commercial and
residential lending office in Vineyard Haven on the island of Martha’s Vineyard, and a trust and
asset management facility and an operations center in Orleans. Based on 2010 Census data, of
the 16 branches, none are in low-income census tracts, 3 (18.8 percent) are in moderate-income
tracts, 10 (62.5 percent) are in middle-income tracts, and 3 (18.8 percent) are in upper-income
tracts.
The two branches on the island of Nantucket are the most recent additions to the branch network,
having opened since the prior CRA evaluation of September 17, 2010. ATMs are located in each
banking office. Remote ATMs are located at the Cape Cod Regional Technical High School,
Barnstable Village, and inside the Steamship Authority terminals in Hyannis, Nantucket, and
Woods Hole. All are available to the public. The Bank also offers online mortgage, equity loan,
and other banking services to its consumer and commercial customers.
The Cape Cod Five Cents Savings Bank is a subsidiary of Cape Cod Five Mutual Company, a
mutual holding company, the formation of which was approved by the Federal Reserve Bank of
Boston on March 5, 2012. The mutual holding company does not have any shareholders but is
the sole owner of the subsidiary bank by means of a single share of stock. With the
aforementioned change in legal structure, the Trustees remain Trustees of the Holding Company,
and are now also Directors of the Bank.
The Bank has three subsidiaries:
• SeaFive, Inc. is a securities corporation that was established for the purpose of buying,
selling, and holding investment securities to take advantage of favorable Massachusetts
tax provisions.
• C.F.H. is a real estate company formed to hold property purchased for future branch
expansion.
• Shallow Pond is an entity that was established to hold ORE property.
The Cape Cod Five Cents Savings Bank Charitable Foundation Trust is a private foundation that
was established in 1998 and is funded by the Bank to serve the charitable needs of the Cape Cod
Community. Foundation trustees are members of the Cape Cod Five Board, trustees,
corporators, and employees.
As of December 31, 2013, the Bank’s assets totaled $2.5 billion of which $2.0 billion or 80.3 percent
was in loans. Since the previous evaluation, dated September 17, 2010, the asset size of the
institution increased by approximately $543.5 million, or 27.0 percent.
The Bank’s ability to support the current lending levels is reflected in its average net-loan-to-
deposit ratio. For the period of September 30, 2010 through December 31, 2013, the Bank’s
average net loan-to-deposit ratio was 86.8 percent. The Bank’s quarterly loan-to-deposit ratios
5
have fluctuated from a low of 82.3 percent in September 2010 to a high of 95.0 percent in
December 2013. Net loans grew approximately 43.3 percent, while the Bank’s deposit base
increased 24.1 percent.
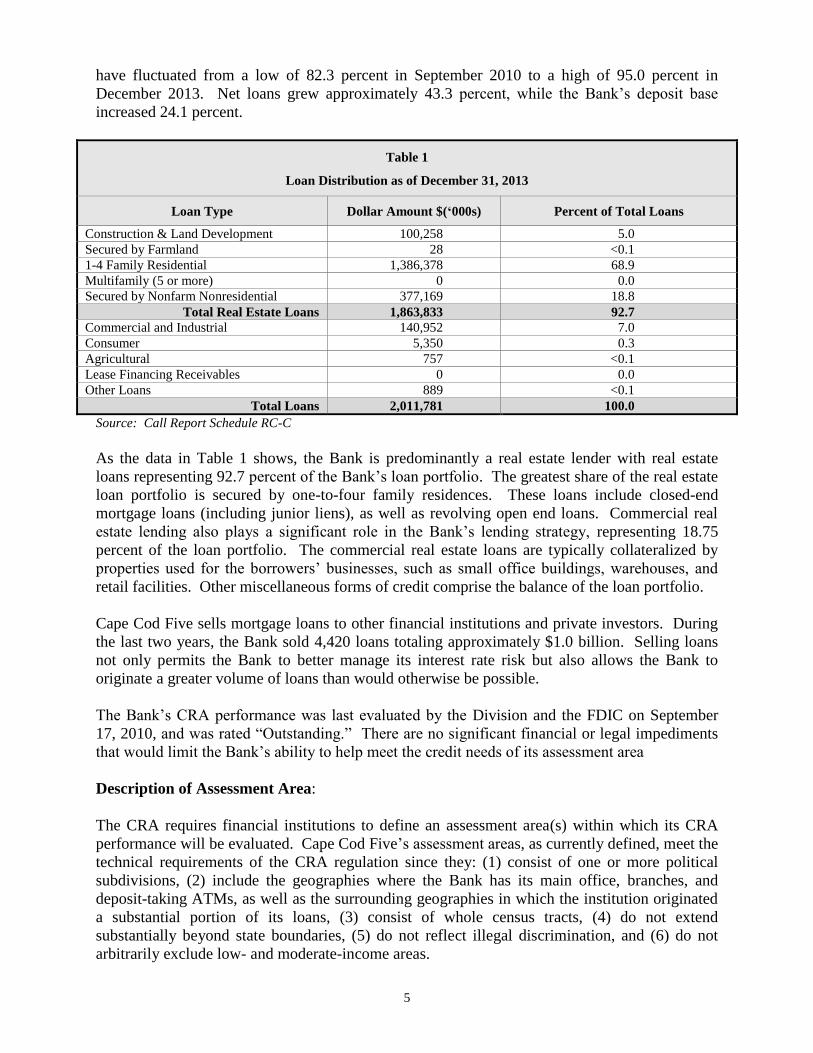
Table 1
Loan Distribution as of December 31, 2013
Loan Type Dollar Amount $(‘000s) Percent of Total Loans
Construction & Land Development 100,258 5.0
Secured by Farmland 28 <0.1
1-4 Family Residential 1,386,378 68.9
Multifamily (5 or more) 0 0.0
Secured by Nonfarm Nonresidential 377,169 18.8
Total Real Estate Loans 1,863,833 92.7
Commercial and Industrial 140,952 7.0
Consumer 5,350 0.3
Agricultural 757 <0.1
Lease Financing Receivables 0 0.0
Other Loans 889 <0.1
Total Loans 2,011,781 100.0
Source: Call Report Schedule RC-C
As the data in Table 1 shows, the Bank is predominantly a real estate lender with real estate
loans representing 92.7 percent of the Bank’s loan portfolio. The greatest share of the real estate
loan portfolio is secured by one-to-four family residences. These loans include closed-end
mortgage loans (including junior liens), as well as revolving open end loans. Commercial real
estate lending also plays a significant role in the Bank’s lending strategy, representing 18.75
percent of the loan portfolio. The commercial real estate loans are typically collateralized by
properties used for the borrowers’ businesses, such as small office buildings, warehouses, and
retail facilities. Other miscellaneous forms of credit comprise the balance of the loan portfolio.
Cape Cod Five sells mortgage loans to other financial institutions and private investors. During
the last two years, the Bank sold 4,420 loans totaling approximately $1.0 billion. Selling loans
not only permits the Bank to better manage its interest rate risk but also allows the Bank to
originate a greater volume of loans than would otherwise be possible.
The Bank’s CRA performance was last evaluated by the Division and the FDIC on September
17, 2010, and was rated “Outstanding.” There are no significant financial or legal impediments
that would limit the Bank’s ability to help meet the credit needs of its assessment area
Description of Assessment Area:
The CRA requires financial institutions to define an assessment area(s) within which its CRA
performance will be evaluated. Cape Cod Five’s assessment areas, as currently defined, meet the
technical requirements of the CRA regulation since they: (1) consist of one or more political
subdivisions, (2) include the geographies where the Bank has its main office, branches, and
deposit-taking ATMs, as well as the surrounding geographies in which the institution originated
a substantial portion of its loans, (3) consist of whole census tracts, (4) do not extend
substantially beyond state boundaries, (5) do not reflect illegal discrimination, and (6) do not
arbitrarily exclude low- and moderate-income areas.
6
In accordance with the CRA, the Bank has identified two assessment areas: the Barnstable
Metropolitan Statistical Area (MSA), and Nantucket County, which is located in the non-MSA
portion of Massachusetts. The Barnstable MSA contains all of the towns in Barnstable County
on Cape Cod. These Towns include: Barnstable, Bourne, Brewster, Chatham, Dennis, Eastham,
Falmouth, Harwich, Mashpee, Orleans, Provincetown, Sandwich, Truro, Wellfleet, and
Yarmouth. The Town of Barnstable consists of seven villages: Barnstable Village, Centerville,
Cotuit, Hyannis, Marston Mills, Osterville and West Barnstable. Only the Town of Nantucket is
located in Nantucket County, an island off of the coast of Massachusetts.
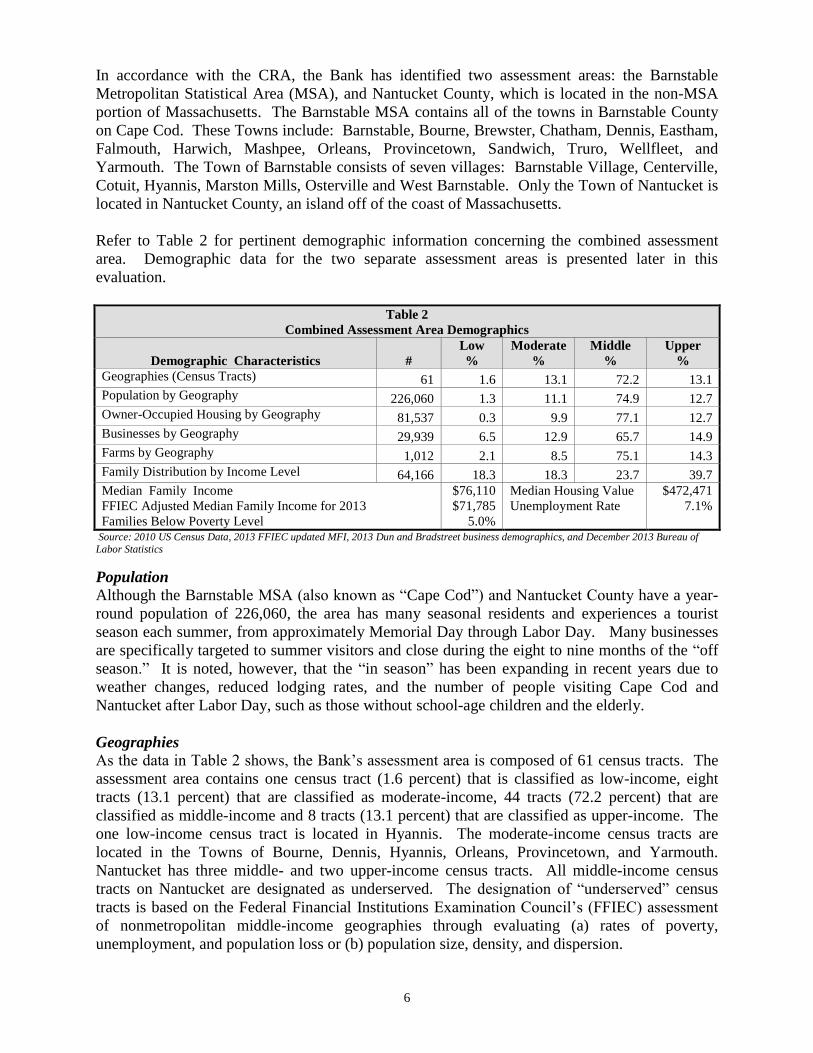
Refer to Table 2 for pertinent demographic information concerning the combined assessment
area. Demographic data for the two separate assessment areas is presented later in this
evaluation.
Table 2
Combined Assessment Area Demographics
Demographic Characteristics
#
Low
%
Moderate
%
Middle
%
Upper
%
Geographies (Census Tracts) 61 1.6 13.1 72.2 13.1
Population by Geography 226,060 1.3 11.1 74.9 12.7
Owner-Occupied Housing by Geography 81,537 0.3 9.9 77.1 12.7
Businesses by Geography 29,939 6.5 12.9 65.7 14.9
Farms by Geography 1,012 2.1 8.5 75.1 14.3
Family Distribution by Income Level 64,166 18.3 18.3 23.7 39.7
Median Family Income
FFIEC Adjusted Median Family Income for 2013
Families Below Poverty Level
$76,110
$71,785
5.0%
Median Housing Value
Unemployment Rate
$472,471
7.1%
Source: 2010 US Census Data, 2013 FFIEC updated MFI, 2013 Dun and Bradstreet business demographics, and December 2013 Bureau of
Labor Statistics
Population
Although the Barnstable MSA (also known as “Cape Cod”) and Nantucket County have a year-
round population of 226,060, the area has many seasonal residents and experiences a tourist
season each summer, from approximately Memorial Day through Labor Day. Many businesses
are specifically targeted to summer visitors and close during the eight to nine months of the “off
season.” It is noted, however, that the “in season” has been expanding in recent years due to
weather changes, reduced lodging rates, and the number of people visiting Cape Cod and
Nantucket after Labor Day, such as those without school-age children and the elderly.
Geographies
As the data in Table 2 shows, the Bank’s assessment area is composed of 61 census tracts. The
assessment area contains one census tract (1.6 percent) that is classified as low-income, eight
tracts (13.1 percent) that are classified as moderate-income, 44 tracts (72.2 percent) that are
classified as middle-income and 8 tracts (13.1 percent) that are classified as upper-income. The
one low-income census tract is located in Hyannis. The moderate-income census tracts are
located in the Towns of Bourne, Dennis, Hyannis, Orleans, Provincetown, and Yarmouth.
Nantucket has three middle- and two upper-income census tracts. All middle-income census
tracts on Nantucket are designated as underserved. The designation of “underserved” census
tracts is based on the Federal Financial Institutions Examination Council’s (FFIEC) assessment
of nonmetropolitan middle-income geographies through evaluating (a) rates of poverty,
unemployment, and population loss or (b) population size, density, and dispersion.
7
Housing
The assessment area consists of 170,164 total housing units, of which 81,537 or 47.9 percent are
owner-occupied, 20,250 or 11.9 percent are rental units and 68,377 or 40.2 percent are vacant units.
The large percentage of vacant units is mainly due to the fact that many properties are second homes,
owned primarily for seasonal purposes. Of the 81,535 owner-occupied housing units, 244 or 0.3
percent are in the low-income census tract, while 8,043 or 9.9 percent are in moderate-income census
tracts. The median housing value for the assessment area according to the 2010 U.S. Census was
$472,471, and the median age of the housing stock was 50 years. Considering the median housing
value throughout the combined assessment area, low-income families, particularly those with
incomes below the poverty threshold would likely have difficulty obtaining a home mortgage loan
under conventional underwriting standards. Throughout the combined assessment area, affordable
housing is a continual need, as local housing prices are inflated by the higher incomes of non-
resident, second homeowners. Affordable rental units are also difficult to find, as rental stock is
limited due to the premium placed on high-priced vacation rentals during the summer.
Unemployment
Recent figures from the Bureau of Labor Statistics (December 2013) indicate that three towns in the
Barnstable MSA have three of the top four highest unemployment rates in Massachusetts. These
towns include Provincetown at 24.7 percent, Truro at 14.8 percent and Wellfleet at 12.5 percent. As
a comparison, the unemployment rate statewide for Massachusetts is 7.1 percent. Slow job
growth has pushed the unemployment rate upward, placing it among the highest in the State.
Family Distribution and Poverty Rates
According to the 2010 U.S. Census, there are 64,166 families within the Bank’s combined
assessment area. Table 2 illustrates the composition of families by income level. Of note,
spanning all census tract income categories, there are 11,757 low-income families and 11,737
moderate-income families. Individually, the categories of low- and moderate-income each
represent 18.3 percent of assessment area families. A closer look at the families in the
assessment area reveals that 5.0 percent have incomes below the poverty level.
Business and Farm Data
Business data obtained from Dun & Bradstreet show that there were 29,939 businesses in the
assessment area in 2013, of which 74.4 percent had gross annual revenues (GARs) of $1 million or
less, 3.4 percent had GARs greater than $1 million, and the remaining 22.2 percent had unreported
revenues. Of total businesses in the assessment area, 6.5 percent are in the low-income census tract,
13.0 percent are in moderate-income census tracts, 65.7 percent are in middle-income tracts, and 14.9
percent are in upper-income tracts. The highest proportion of these business establishments are
engaged in the services industry (42.9 percent), due to the seasonal tourism industry. Businesses
involved in retail trade (13.8 percent), non-classifiable establishments (13.1 percent) and
construction (10.5 percent) make up a significant share of the establishments. Farms (consisting
of agriculture, forestry, and fishing) only account for 3.3 percent of all businesses. In terms of
employees, approximately 67.7 percent of the area’s businesses employ four or fewer people.
Included among the largest employers in the assessment area are Cape Cod Healthcare,
Hawthorne Motel, Woods Hole Oceanographic Institution, Air National Guard, and Nantucket
Airlines Administrative.

8
Of the 1,012 farms in the area, 96.8 percent had GARs of $1 million or less, 1.6 percent had GARs of
greater than $1 million, and 1.6 percent had unreported revenues. Of total farms, 2.1 percent are in
low-income census tracts, 8.5 percent are in moderate-income census tracts, 75.1 percent are in
middle-income census tracts, and 14.3 percent are in upper-income census tracts.
Competition
Cape Cod Five operates in a very competitive market area in terms of financial services. The
Bank competes for loans with many commercial banks, savings banks, credit unions, and other
mortgage lenders. Among the more prominent mortgage lenders competing with the Bank are
Wells Fargo Bank, NA, JPMorgan Chase Bank, US Bank, NA, and Cape Cod Co-operative
Bank. According to the 2012 HMDA market share report of the combined assessment area,
there were 455 lenders that originated or purchased one or more home mortgage loans.
According to the 2012 CRA market share report, 61 lenders originated or purchased one or more
small business loans in the combined assessment area. According to the FDIC deposit market
share report as of December 31, 2013, there were only 12 banks with one or more branches in the
combined assessment area. Out of these 12 banks, Cape Cod Five, TD Bank, NA, RBS Citizens
NA, Bank of America, NA, Sovereign Bank, NA, Rockland Trust Company, and Cape Cod Co-
operative Bank, all had 10 or more branches in the combined assessment area.
Community Contact Community contact interviews provide insight into how financial institutions are meeting the
specific credit needs of the communities within their assessment areas. During the CRA
evaluation, contacts were made at a local affordable housing authority and a community
development partnership. Both contacts indicated that there was a dire need for year-round
financial services, given the extreme fluctuations of business and population that occur annually
as a result of the seasonal travel.
Of note, both contacts specifically named Cape Cod Five in their descriptions of positive
experiences with local financial institutions. Both contacts indicated the Bank is active in local
initiatives. One contact indicated residents “strongly prefer locally-based services, including
banks,” regardless of whether they offer more favorable loan, deposit, or other product terms.
Both contacts also pointed out weaknesses of other financial institutions in the area. One contact
specifically indicated her organization, “… would not exist without the involvement of Cape Cod
Five.”
Both contacts indicated the area is rebounding from the recent recession, with local residents
strongly favoring relationships with local banks that have remained physically present with the
local population through the recession. Both contacts indicated financial education remains a
need within the assessment area, and noted Cape Cod Five (and others) are fulfilling the need,
but the need remains. As the area’s seasonal fluctuations result in seasonal housing needs,
unemployment, and other local challenges, both contacts were appreciative of the local impact of
banks that have a year-round commitment to the area.
9
SCOPE OF EXAMINATION
Large Bank CRA examination procedures were used to evaluate Cape Cod Five’s CRA
performance. The Large Bank CRA examination procedures evaluate the Bank’s CRA
performance pursuant to three tests: Lending, Investment, and Services. The CRA evaluation
considered activity from September 18, 2010, through March 24, 2014. Based on the volume
and composition of residential and small business loans, opening of branches, and deposits, both
the Barnstable MSA and the Nantucket non-MSA assessment area were reviewed using full-
scope procedures.
The analysis of loans included residential mortgages, small business, and small farm loans
originated between January 1, 2012, and December 31, 2013 within the combined assessment
areas. Since residential mortgage lending represents the Bank’s primary product line, as
reflected in both the December 2013 Call Report data and recent lending activities, more weight
is assigned to this loan type when arriving at Lending Test conclusions and ratings. Residential
mortgages include home purchase, home improvement, and refinances that were originated or
purchased during the period reviewed. Residential mortgage loan data is derived from the
Bank’s Loan Application Registers (LARs) maintained in accordance with the Home Mortgage
Disclosure Act (HMDA).
Small business loans include commercial real estate loans and commercial and industrial loans
with original balances of $1 million or less, while small farm loans include farm loans with
original balances of $500 thousand or less. Information concerning small business and farm
loans was derived from the CRA Loan Registers (LRs) submitted annually by the Bank to the
Federal Reserve Bank. While the Bank made eight small farm loans in 2012 and two in 2013,
the volume and dollar amount was nominal compared to residential and small business lending.
As such, small farm loans are presented only in the Lending Activity and Assessment Area
Concentration sections of this evaluation. Consumer loans were not analyzed as part of this
evaluation as these loans also do not constitute a substantial portion of the Bank’s loan portfolio
or recent lending activity.
In addition to the Lending Test, which includes an analysis of community development loans and
innovative and flexible lending practices, qualified investments and services were also reviewed.
These activities are evaluated from September 18, 2010 through March 24, 2014. Qualified
community development equity investments were also included regardless of investment date.
Investments made prior to September 18, 2010 were valued at the December 31, 2013 book
value.
10
CONCLUSIONS WITH RESPECT TO PERFORMANCE TESTS:
LENDING TEST
The Lending Test evaluates the institution’s record of helping to meet the credit needs of its
assessment area(s) by considering an institution’s home mortgage, small business, small farm
(where applicable), and community development lending. The institution’s lending performance
is evaluated pursuant to the following criteria: (1) the volume of lending activity; (2) the
proportion of lending within the assessment area(s); (3) the dispersion of loans and the number
and amount of loans in low-, moderate-, middle- and upper-income geographies in the
assessment area(s); (4) the distribution of loans among low-, moderate-, middle- and upper-
income borrowers and businesses of different sizes; (5) the volume of community development
lending; and (6) the use of innovative or flexible lending practices.
Cape Cod Five’s performance under the Lending Test is rated “Outstanding.”
LENDING ACTIVITY
Cape Cod Five’s lending activity reflects excellent responsiveness to the assessment area’s credit
needs. The Bank actively originates home mortgage, small business, and community
development loans in its combined assessment area.
Home Loans
In 2012, Cape Cod Five originated 3,148 home mortgage loans totaling $887.8 million in the
combined assessment area. Refinance and home purchase loans represented the primary focus of
the Bank’s home mortgage lending and comprised 63.1 percent and 27.3 percent, respectively, of
the total number of loans. The Bank’s first-time homebuyer programs and continued active
participation in the MassHousing programs have enabled the Bank to generate a substantial
number of home purchase loans. Home improvement loans accounted for the remaining 9.6
percent of total loans.
Market rank data by loan purpose for 2012 provides additional insight into the Bank’s volume of
residential lending. In 2012, Cape Cod Five ranked first among all HMDA reporting lenders that
originated or purchased home purchase, home improvement, or refinance loans in the combined
assessment area. The Bank had 861 home purchase originations for a 17.0 percent market share,
301 home improvement loans for a 34.6 percent market share, and 1,986 refinance originations
for a 12.4 percent market share.
In 2013, the total number of home loans inside the assessment area decreased by 21.3 percent
compared to the prior year. This decrease in the volume of lending was mainly due to rising
mortgage interest rates and the saturation of the market for refinance loans. In 2013, refinance
loans dropped to 46.2 percent of total loans, while home purchase loans and home improvement
loans increased to 42.2 percent and 11.6 percent, respectively.
Small Business and Small Farm Loans
In 2012, Cape Cod Five reported 288 small business loans totaling $47.6 million in the combined
assessment area. Small business loans are originated for a variety of business purposes such as
working capital, business expansion, equipment purchases, and the purchase or refinance of
commercial real estate. The Bank also originated seven small farm loans totaling $336,000, all
made to local fisheries. As the total count, amount, and proportion of the Bank’s portfolio from

11
small farm loans is negligible, small farm lending will only be considered in the assessment area
concentration section.
Market rank data for 2012 provides additional insight into the Bank’s volume of small business
lending. In 2012, Cape Cod Five tied for eighth in market share among the 61 reporting lenders
that originated or purchased small business loans in the Bank’s combined assessment area. All
of the lenders ranked equal or higher than Cape Cod Five were banks that offered business credit
cards and originated numerous extensions of credit in small dollar amounts, with most average
loan sizes below $9,000. When ranked by total dollar volume, Cape Cod Five’s small business
lending of nearly $48 million ranked first among the reporting lenders.
In 2013, the number of small business loans increased in both number and dollar amount
compared to the prior year. In total, the Bank originated 320 small business loans totaling $53.9
million in the combined assessment area. Conversely, the Bank originated only two small farm
loans totaling $70,000 in 2013.
ASSESSMENT AREA CONCENTRATION
This performance criterion determines what percentage of the Bank’s lending occurs within the
assessment area. The distribution of loans by number bears more weight on the Bank’s rating
than the distribution by dollar amount because the number of loans correlates more closely to the
number of individuals, families, or businesses that were able to obtain residential and/or small
business loans. The Bank originated a substantial majority of its home mortgages, small
business, and small farm loans, by number and dollar volume, inside its assessment area. Based
on a review of the home loan, small business and small farm loan data, 91.5 percent of the
Bank’s lending activity by number, and 89.9 percent by dollar amount occurred within the
assessment area during the evaluation period.
Refer to Table 3 for specific information concerning the distribution of loans inside and outside
the assessment area.
12
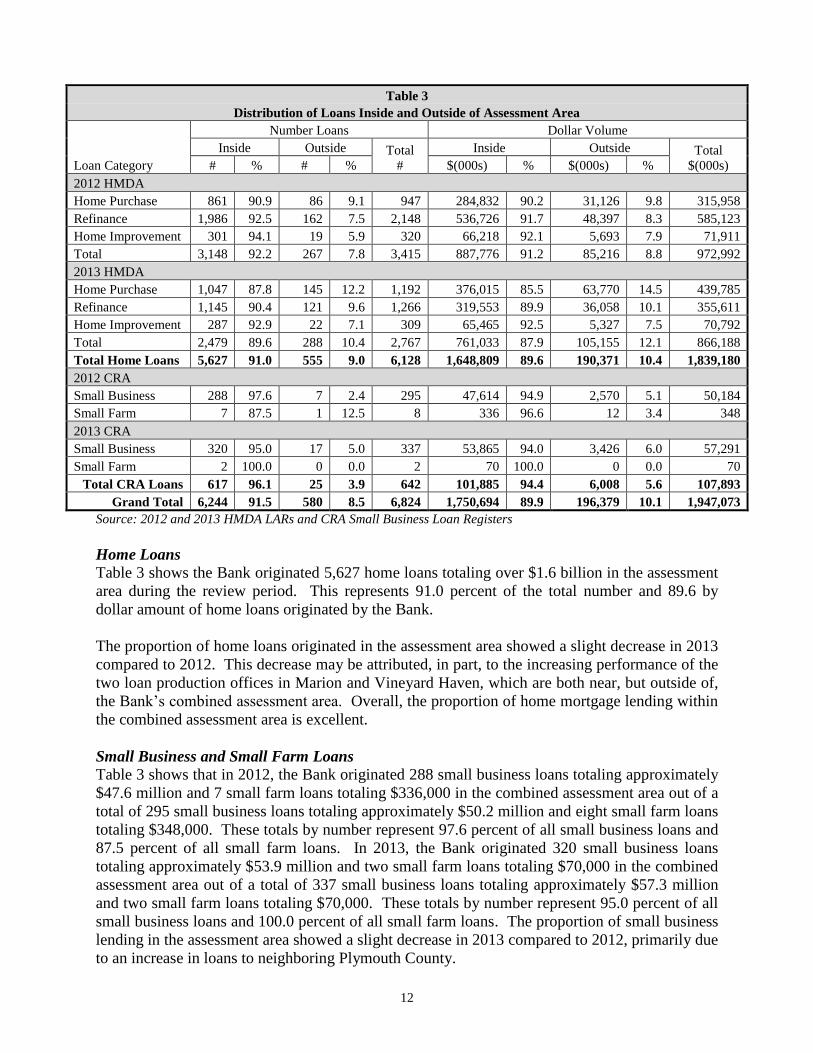
Table 3
Distribution of Loans Inside and Outside of Assessment Area
Loan Category
Number Loans Dollar Volume
Inside Outside Total
#
Inside Outside Total
$(000s) # % # % $(000s) % $(000s) %
2012 HMDA
Home Purchase 861 90.9 86 9.1 947 284,832 90.2 31,126 9.8 315,958
Refinance 1,986 92.5 162 7.5 2,148 536,726 91.7 48,397 8.3 585,123
Home Improvement 301 94.1 19 5.9 320 66,218 92.1 5,693 7.9 71,911
Total 3,148 92.2 267 7.8 3,415 887,776 91.2 85,216 8.8 972,992
2013 HMDA
Home Purchase 1,047 87.8 145 12.2 1,192 376,015 85.5 63,770 14.5 439,785
Refinance 1,145 90.4 121 9.6 1,266 319,553 89.9 36,058 10.1 355,611
Home Improvement 287 92.9 22 7.1 309 65,465 92.5 5,327 7.5 70,792
Total 2,479 89.6 288 10.4 2,767 761,033 87.9 105,155 12.1 866,188
Total Home Loans 5,627 91.0 555 9.0 6,128 1,648,809 89.6 190,371 10.4 1,839,180
2012 CRA
Small Business 288 97.6 7 2.4 295 47,614 94.9 2,570 5.1 50,184
Small Farm 7 87.5 1 12.5 8 336 96.6 12 3.4 348
2013 CRA
Small Business 320 95.0 17 5.0 337 53,865 94.0 3,426 6.0 57,291
Small Farm 2 100.0 0 0.0 2 70 100.0 0 0.0 70
Total CRA Loans 617 96.1 25 3.9 642 101,885 94.4 6,008 5.6 107,893
Grand Total 6,244 91.5 580 8.5 6,824 1,750,694 89.9 196,379 10.1 1,947,073
Source: 2012 and 2013 HMDA LARs and CRA Small Business Loan Registers
Home Loans
Table 3 shows the Bank originated 5,627 home loans totaling over $1.6 billion in the assessment
area during the review period. This represents 91.0 percent of the total number and 89.6 by
dollar amount of home loans originated by the Bank.
The proportion of home loans originated in the assessment area showed a slight decrease in 2013
compared to 2012. This decrease may be attributed, in part, to the increasing performance of the
two loan production offices in Marion and Vineyard Haven, which are both near, but outside of,
the Bank’s combined assessment area. Overall, the proportion of home mortgage lending within
the combined assessment area is excellent.
Small Business and Small Farm Loans
Table 3 shows that in 2012, the Bank originated 288 small business loans totaling approximately
$47.6 million and 7 small farm loans totaling $336,000 in the combined assessment area out of a
total of 295 small business loans totaling approximately $50.2 million and eight small farm loans
totaling $348,000. These totals by number represent 97.6 percent of all small business loans and
87.5 percent of all small farm loans. In 2013, the Bank originated 320 small business loans
totaling approximately $53.9 million and two small farm loans totaling $70,000 in the combined
assessment area out of a total of 337 small business loans totaling approximately $57.3 million
and two small farm loans totaling $70,000. These totals by number represent 95.0 percent of all
small business loans and 100.0 percent of all small farm loans. The proportion of small business
lending in the assessment area showed a slight decrease in 2013 compared to 2012, primarily due
to an increase in loans to neighboring Plymouth County.
13
GEOGRAPHIC DISTRIBUTION
The geographic distribution of loans was reviewed to determine how well Cape Cod Five has
addressed the credit needs throughout the assessment area, particularly in low- and moderate-
income geographies. Considering demographics, aggregate data, and performance context
factors, the geographic distribution of loans reflects good penetration throughout the combined
assessment area. The following sections discuss the Bank’s performance under this criterion by
loan purpose and type.
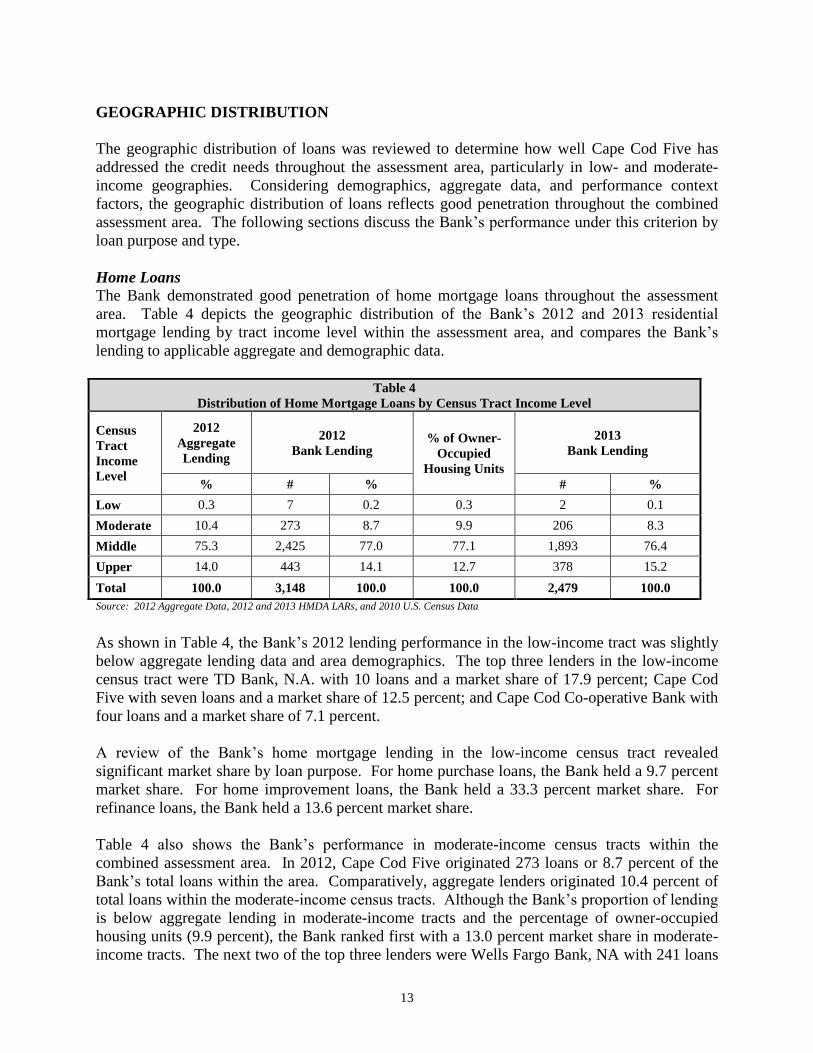
Home Loans
The Bank demonstrated good penetration of home mortgage loans throughout the assessment
area. Table 4 depicts the geographic distribution of the Bank’s 2012 and 2013 residential
mortgage lending by tract income level within the assessment area, and compares the Bank’s
lending to applicable aggregate and demographic data.
Table 4
Distribution of Home Mortgage Loans by Census Tract Income Level
Census
Tract
Income
Level
2012
Aggregate
Lending
2012
Bank Lending % of Owner-
Occupied
Housing Units
2013
Bank Lending
% # % # %
Low 0.3 7 0.2 0.3 2 0.1
Moderate 10.4 273 8.7 9.9 206 8.3
Middle 75.3 2,425 77.0 77.1 1,893 76.4
Upper 14.0 443 14.1 12.7 378 15.2
Total 100.0 3,148 100.0 100.0 2,479 100.0
Source: 2012 Aggregate Data, 2012 and 2013 HMDA LARs, and 2010 U.S. Census Data
As shown in Table 4, the Bank’s 2012 lending performance in the low-income tract was slightly
below aggregate lending data and area demographics. The top three lenders in the low-income
census tract were TD Bank, N.A. with 10 loans and a market share of 17.9 percent; Cape Cod
Five with seven loans and a market share of 12.5 percent; and Cape Cod Co-operative Bank with
four loans and a market share of 7.1 percent.
A review of the Bank’s home mortgage lending in the low-income census tract revealed
significant market share by loan purpose. For home purchase loans, the Bank held a 9.7 percent
market share. For home improvement loans, the Bank held a 33.3 percent market share. For
refinance loans, the Bank held a 13.6 percent market share.
Table 4 also shows the Bank’s performance in moderate-income census tracts within the
combined assessment area. In 2012, Cape Cod Five originated 273 loans or 8.7 percent of the
Bank’s total loans within the area. Comparatively, aggregate lenders originated 10.4 percent of
total loans within the moderate-income census tracts. Although the Bank’s proportion of lending
is below aggregate lending in moderate-income tracts and the percentage of owner-occupied
housing units (9.9 percent), the Bank ranked first with a 13.0 percent market share in moderate-
income tracts. The next two of the top three lenders were Wells Fargo Bank, NA with 241 loans

14
and a market share of 11.4 percent, and JP Morgan Chase Bank, NA with 139 loans and a market
share of 6.6 percent.
A review of the Bank’s home mortgage lending in moderate-income census tracts revealed a
strong performance for each loan purpose. For home purchase loans, the Bank held an 11.6
percent market share. For home improvement loans, the Bank held a 28.7 percent market share.
For refinance loans, the Bank held a 12.6 percent market share.
In 2013, the percentage of loans in all tract income levels was similar to the Bank’s 2012 lending
performance. When compared to 2010 Census demographics, the percentage of residential
mortgage lending in the low-income census tract (0.1 percent) is slightly below the percentage of
owner-occupied housing units (0.3 percent) located there. Similarly, in moderate-income census
tracts, the percentage of residential mortgage lending (8.3 percent) is below the percentage of
owner-occupied housing units (9.9 percent).
Small Business Loans
The distribution of the Bank’s small business loans reflects excellent penetration throughout the
assessment area, particularly within the moderate-income census tracts. Table 5 illustrates the
geographic distribution of the Bank’s small business loans within the combined assessment area,
as well as the aggregate lending performance in 2012 and the business demographics for 2013.
Table 5
Distribution of Small Business Loans by Census Tract Income Level
Census
Tract
Income
Level
2012
Aggregate
Lending
2012
Bank Small Business
Lending
% of Total
Businesses
(2013)
2013
Bank Small Business
Lending
% # % # %
Low 6.0 17 5.9 6.5 27 8.4
Moderate 13.0 42 14.6 13.0 44 13.8
Middle 60.8 184 63.9 65.6 200 62.5
Upper 13.1 45 15.6 14.9 49 15.3
N/A 7.1 0 0.0 0.0 0 0.0
Total 100.0 288 100.0 100.0 320 100.0
Source: 2012 Aggregate Data, 2012 and 2013 CRA LRs, and 2013 Dun and Bradstreet Business Demographic Data
In 2012, Cape Cod Five originated 17 small business loans or a 5.9 percent of total loans in the
low-income census tract. This performance ranked seventh in market share and was slightly below
the aggregate lending percentage of 6.0 percent. However, a closer review of other lenders in the
area revealed the Bank ranked first in the low-income census tract for banks with average loan sizes
greater than $9,000. The top six small business lenders in the combined area as well as in the one
low-income census tract in the area all had average loan sizes of $9,000 or less, indicating these are
primarily business credit card lenders. The top three small business lenders in the low-income
census tract were American Express, FSB (ranked first with 117 loans or a 30.7 percent market
share); Capital One NA (ranked second with 42 loans or a 11.0 percent market share); and
Capital One Bank USA, N.A. (ranked third with 30 loans or a 7.9 percent market share). Cape
Cod Five’s average loan size was $163,000. The only other top 10 lender with an average loan
size over $9,000 was TD Bank, N.A., which offers both small business credit cards as well as
small business loans.
15
The Bank’s performance in the low-income census tract increased in both percentage and
volume of loans from 2012 to 2013. The 8.4 percent lending exceeded the percentage of small
businesses located within the low-income census tract (6.5 percent) according to 2013
demographic data.
Regarding lending in moderate-income census tracts within the combined assessment area in
2012, the Bank originated 42 loans for a 5.1 percent market share. Similar to the market share
review in the low-income area, the Bank ranked seventh among lenders in moderate-income
areas, but ranked second of lenders having an average loan size greater than $9,000. The Bank’s
14.6 percent of total small business and small farm loans made in moderate-income census tracts
exceeds the aggregate percentage of 13.0 percent of loans made in the same areas.
In 2013, the Bank’s percentage of loans made in moderate-income census tracts (13.8 percent)
decreased slightly from 2012, although the volume increased by two loans. This proportion is
higher than the 13.0 percent of total small businesses within moderate-income census tracts in
the combined assessment area.
LENDING TO BORROWERS OF DIFFERENT INCOME LEVELS AND BUSINESSES
OF DIFFERENT SIZES
The distribution of loans by borrower income level and business revenues was reviewed to
determine Cape Cod Five’s level of addressing area credit needs, with the largest emphasis on
low- and moderate-income borrowers and businesses with GARs of $1 million or less. Overall,
the distribution of borrowers reflects excellent penetration of loans among retail customers of
different income levels and businesses of different sizes.
Home Loans
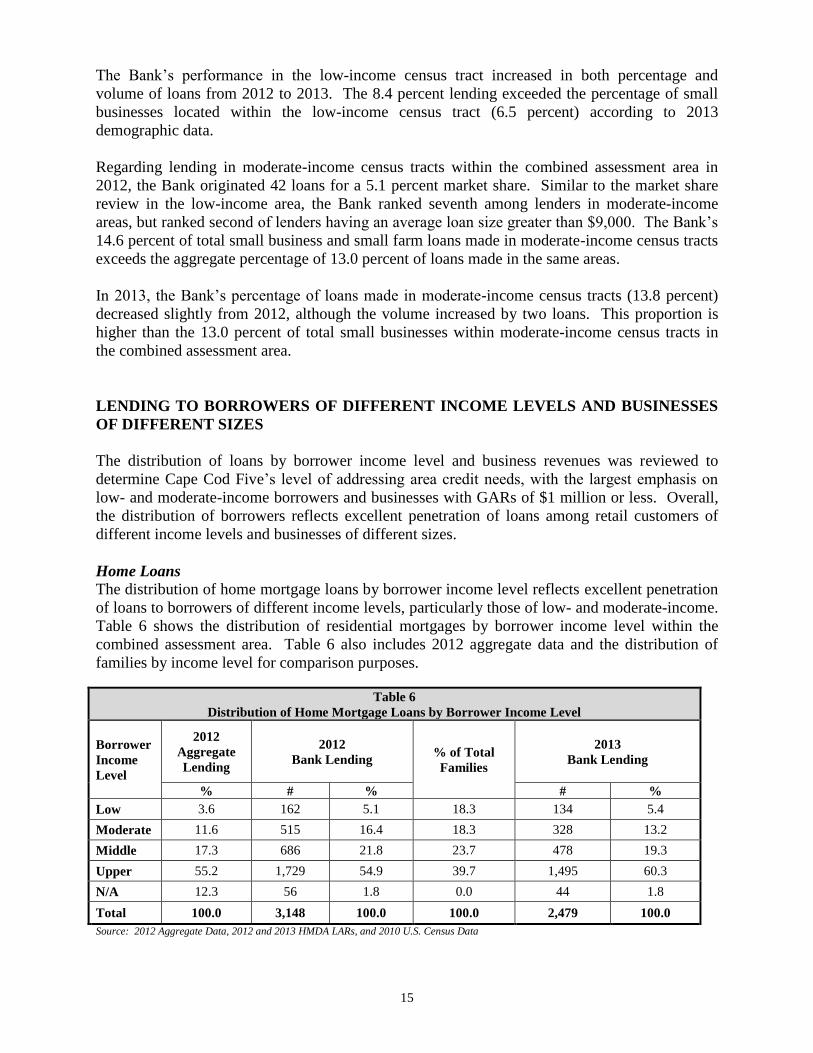
The distribution of home mortgage loans by borrower income level reflects excellent penetration
of loans to borrowers of different income levels, particularly those of low- and moderate-income.
Table 6 shows the distribution of residential mortgages by borrower income level within the
combined assessment area. Table 6 also includes 2012 aggregate data and the distribution of
families by income level for comparison purposes.
Table 6
Distribution of Home Mortgage Loans by Borrower Income Level
Borrower
Income
Level
2012
Aggregate
Lending
2012
Bank Lending % of Total
Families
2013
Bank Lending
% # % # %
Low 3.6 162 5.1 18.3 134 5.4
Moderate 11.6 515 16.4 18.3 328 13.2
Middle 17.3 686 21.8 23.7 478 19.3
Upper 55.2 1,729 54.9 39.7 1,495 60.3
N/A 12.3 56 1.8 0.0 44 1.8
Total 100.0 3,148 100.0 100.0 2,479 100.0
Source: 2012 Aggregate Data, 2012 and 2013 HMDA LARs, and 2010 U.S. Census Data
16
As shown in Table 6, Cape Cod Five’s lending performance in 2012 to both low- and moderate-
income borrowers significantly exceeded aggregate data. The aggregate market lenders
originated 3.6 percent of loans to low-income borrowers within the combined assessment area,
while the Bank originated 5.1 percent of its total loans to low-income borrowers. In addition, the
Bank held a 20.4 percent market share and ranked first among lenders in the combined
assessment area in lending to low-income borrowers. JPMorgan Chase Bank, NA was ranked
second with a 10.0 percent market share followed by Wells Fargo Bank, NA with a 5.7 percent
market share.
The Bank’s dominant overall market share of loans to low-income borrowers was also evident in
review by loan purpose. A review of the Bank’s home mortgage lending to low-income
borrowers revealed a strong performance for each loan purpose. For home purchase loans, the
Bank held an 18.7 percent market share. For home improvement loans, the Bank held a 42.9
percent market share. For refinance loans, the Bank held a 19.0 percent market share.
It is noted that lending to low-income borrowers was lower than the percentage of low-income
families (18.3 percent) in the area. However, for a significant portion of these low-income
families, qualifying for home mortgage loans is difficult, given the current economic
environment. According to 2010 U.S. Census data, 5.0 percent of all families in the combined
assessment area are below the poverty level and would have significant difficulty in seeking
home financing. In addition, home purchase prices in the area present an obstacle in achieving
homeownership for many low-income families.
The aggregate market lenders originated 11.6 percent of loans to moderate-income borrowers
within the combined assessment area in 2012. The Bank originated 16.4 percent of its total loans
to moderate-income borrowers. Although the Bank’s percentage of loans fell below the
percentage of total families in the assessment area (18.3 percent), their proportion of lending
exceeds the aggregate data. In addition, a review of the aggregate lending data revealed that the
Bank held a 20.1 percent market share and ranked first in lending to moderate-income borrowers.
Wells Fargo Bank, NA was ranked second with a 7.7 percent market share, followed by Cape
Cod Co-operative Bank with a 6.6 percent market share.
The dominant overall market share was also evident in review by loan purpose. A review of the
Bank’s home mortgage lending to moderate-income borrowers revealed a strong performance for
each loan purpose. For home purchase loans, the Bank held a 16.9 percent market share. For
home improvement loans, the Bank held a 44.8 percent market share. For refinance loans, the
Bank held an 18.9 percent market share.
Cape Cod Five’s lending volume decreased in 2013 both overall and to low- and moderate-
income borrowers. However, in 2013, the Bank maintained a similar proportion of lending to
low- and moderate-income borrowers. The Bank’s 134 loans to low-income borrowers
represented 5.4 percent of all loans in the combined assessment area, a slight rise from the 5.1
percent in 2012. The Bank’s 328 loans to moderate-income borrowers represented 13.2 percent
of total loans, which was a decrease from 16.4 percent in 2012. Although both low-income and
moderate-income percentages in 2013 fell below demographics, the lending performance for
both years is considered excellent when considering the similar proportions in 2012, the market
share in 2012, and the percentage of low-income families below the poverty level.
17
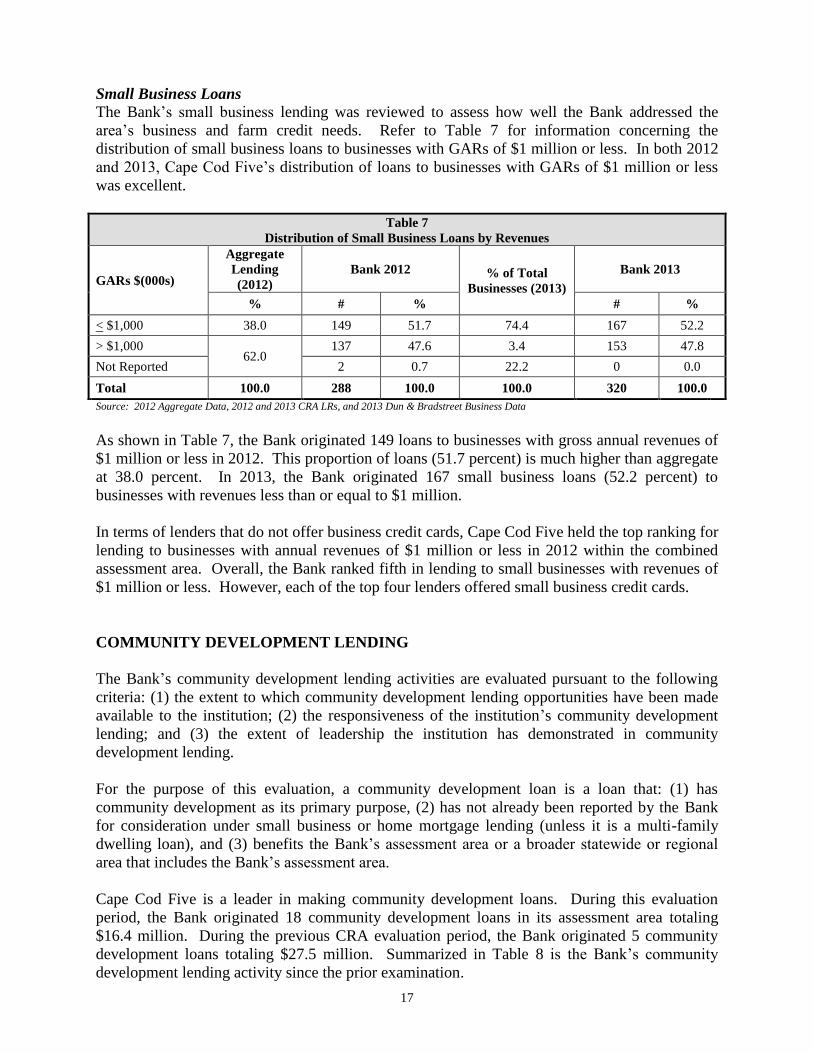
Small Business Loans
The Bank’s small business lending was reviewed to assess how well the Bank addressed the
area’s business and farm credit needs. Refer to Table 7 for information concerning the
distribution of small business loans to businesses with GARs of $1 million or less. In both 2012
and 2013, Cape Cod Five’s distribution of loans to businesses with GARs of $1 million or less
was excellent.
Table 7
Distribution of Small Business Loans by Revenues
GARs $(000s)
Aggregate
Lending
(2012)
Bank 2012 % of Total
Businesses (2013)
Bank 2013
% # % # %
< $1,000 38.0 149 51.7 74.4 167 52.2
> $1,000 62.0
137 47.6 3.4 153 47.8
Not Reported 2 0.7 22.2 0 0.0
Total 100.0 288 100.0 100.0 320 100.0
Source: 2012 Aggregate Data, 2012 and 2013 CRA LRs, and 2013 Dun & Bradstreet Business Data
As shown in Table 7, the Bank originated 149 loans to businesses with gross annual revenues of
$1 million or less in 2012. This proportion of loans (51.7 percent) is much higher than aggregate
at 38.0 percent. In 2013, the Bank originated 167 small business loans (52.2 percent) to
businesses with revenues less than or equal to $1 million.
In terms of lenders that do not offer business credit cards, Cape Cod Five held the top ranking for
lending to businesses with annual revenues of $1 million or less in 2012 within the combined
assessment area. Overall, the Bank ranked fifth in lending to small businesses with revenues of
$1 million or less. However, each of the top four lenders offered small business credit cards.
COMMUNITY DEVELOPMENT LENDING
The Bank’s community development lending activities are evaluated pursuant to the following
criteria: (1) the extent to which community development lending opportunities have been made
available to the institution; (2) the responsiveness of the institution’s community development
lending; and (3) the extent of leadership the institution has demonstrated in community
development lending.
For the purpose of this evaluation, a community development loan is a loan that: (1) has
community development as its primary purpose, (2) has not already been reported by the Bank
for consideration under small business or home mortgage lending (unless it is a multi-family
dwelling loan), and (3) benefits the Bank’s assessment area or a broader statewide or regional
area that includes the Bank’s assessment area.
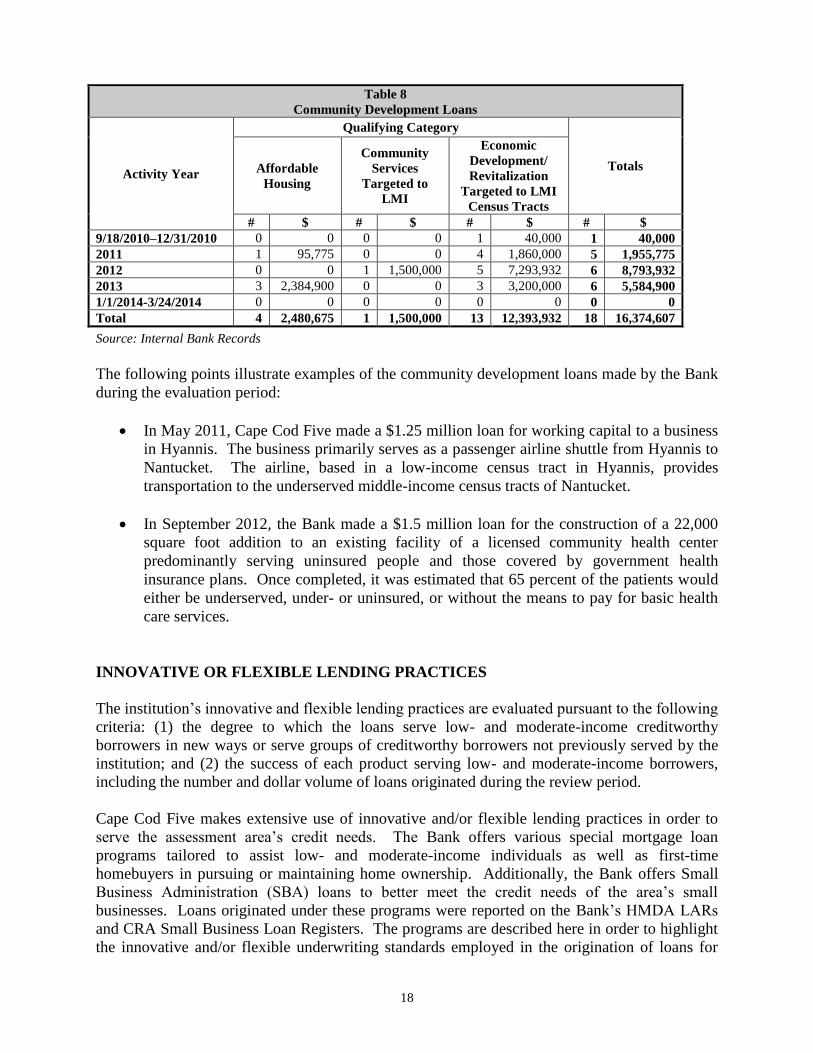
Cape Cod Five is a leader in making community development loans. During this evaluation
period, the Bank originated 18 community development loans in its assessment area totaling
$16.4 million. During the previous CRA evaluation period, the Bank originated 5 community
development loans totaling $27.5 million. Summarized in Table 8 is the Bank’s community
development lending activity since the prior examination.
18
Table 8
Community Development Loans
Activity Year
Qualifying Category
Totals Affordable
Housing
Community
Services
Targeted to
LMI
Economic
Development/
Revitalization
Targeted to LMI
Census Tracts
# $ # $ # $ # $
9/18/2010–12/31/2010 0 0 0 0 1 40,000 1 40,000
2011 1 95,775 0 0 4 1,860,000 5 1,955,775
2012 0 0 1 1,500,000 5 7,293,932 6 8,793,932
2013 3 2,384,900 0 0 3 3,200,000 6 5,584,900
1/1/2014-3/24/2014 0 0 0 0 0 0 0 0
Total 4 2,480,675 1 1,500,000 13 12,393,932 18 16,374,607
Source: Internal Bank Records
The following points illustrate examples of the community development loans made by the Bank
during the evaluation period:
In May 2011, Cape Cod Five made a $1.25 million loan for working capital to a business
in Hyannis. The business primarily serves as a passenger airline shuttle from Hyannis to
Nantucket. The airline, based in a low-income census tract in Hyannis, provides
transportation to the underserved middle-income census tracts of Nantucket.
In September 2012, the Bank made a $1.5 million loan for the construction of a 22,000
square foot addition to an existing facility of a licensed community health center
predominantly serving uninsured people and those covered by government health
insurance plans. Once completed, it was estimated that 65 percent of the patients would
either be underserved, under- or uninsured, or without the means to pay for basic health
care services.
INNOVATIVE OR FLEXIBLE LENDING PRACTICES
The institution’s innovative and flexible lending practices are evaluated pursuant to the following
criteria: (1) the degree to which the loans serve low- and moderate-income creditworthy
borrowers in new ways or serve groups of creditworthy borrowers not previously served by the
institution; and (2) the success of each product serving low- and moderate-income borrowers,
including the number and dollar volume of loans originated during the review period.
Cape Cod Five makes extensive use of innovative and/or flexible lending practices in order to
serve the assessment area’s credit needs. The Bank offers various special mortgage loan
programs tailored to assist low- and moderate-income individuals as well as first-time
homebuyers in pursuing or maintaining home ownership. Additionally, the Bank offers Small
Business Administration (SBA) loans to better meet the credit needs of the area’s small
businesses. Loans originated under these programs were reported on the Bank’s HMDA LARs
and CRA Small Business Loan Registers. The programs are described here in order to highlight
the innovative and/or flexible underwriting standards employed in the origination of loans for
19
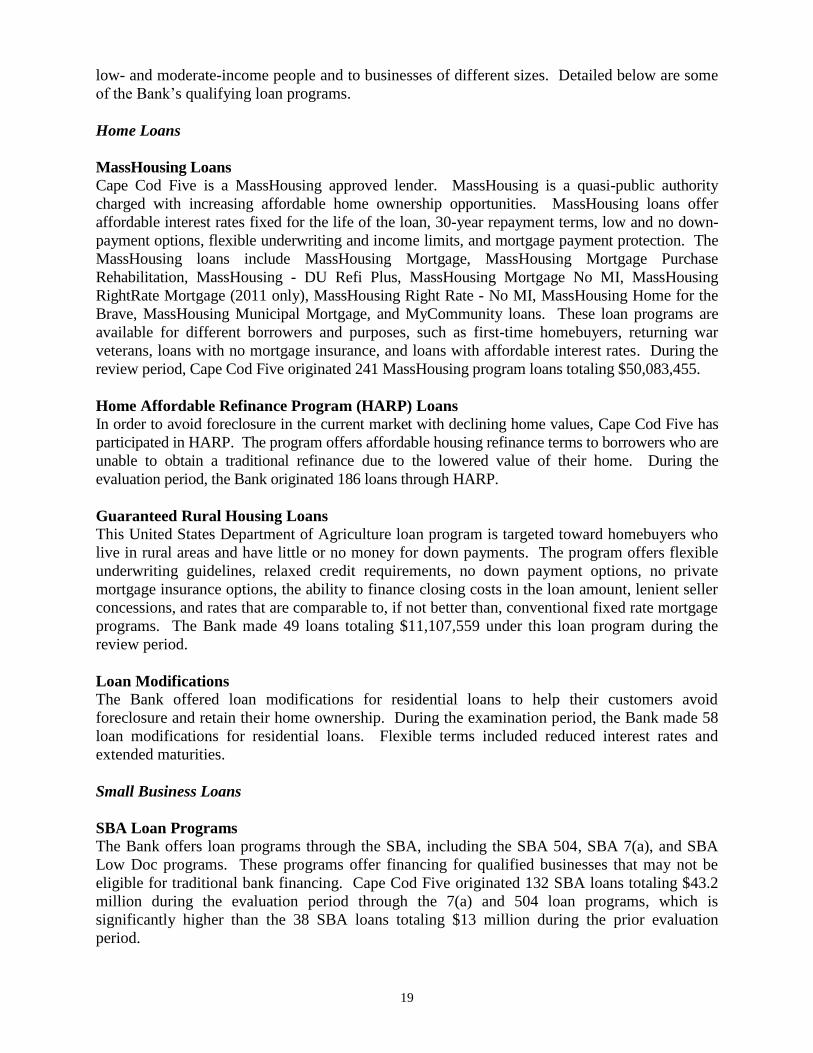
low- and moderate-income people and to businesses of different sizes. Detailed below are some
of the Bank’s qualifying loan programs.
Home Loans
MassHousing Loans
Cape Cod Five is a MassHousing approved lender. MassHousing is a quasi-public authority
charged with increasing affordable home ownership opportunities. MassHousing loans offer
affordable interest rates fixed for the life of the loan, 30-year repayment terms, low and no down-
payment options, flexible underwriting and income limits, and mortgage payment protection. The
MassHousing loans include MassHousing Mortgage, MassHousing Mortgage Purchase
Rehabilitation, MassHousing - DU Refi Plus, MassHousing Mortgage No MI, MassHousing
RightRate Mortgage (2011 only), MassHousing Right Rate - No MI, MassHousing Home for the
Brave, MassHousing Municipal Mortgage, and MyCommunity loans. These loan programs are
available for different borrowers and purposes, such as first-time homebuyers, returning war
veterans, loans with no mortgage insurance, and loans with affordable interest rates. During the
review period, Cape Cod Five originated 241 MassHousing program loans totaling $50,083,455.
Home Affordable Refinance Program (HARP) Loans
In order to avoid foreclosure in the current market with declining home values, Cape Cod Five has
participated in HARP. The program offers affordable housing refinance terms to borrowers who are
unable to obtain a traditional refinance due to the lowered value of their home. During the
evaluation period, the Bank originated 186 loans through HARP.
Guaranteed Rural Housing Loans
This United States Department of Agriculture loan program is targeted toward homebuyers who
live in rural areas and have little or no money for down payments. The program offers flexible
underwriting guidelines, relaxed credit requirements, no down payment options, no private
mortgage insurance options, the ability to finance closing costs in the loan amount, lenient seller
concessions, and rates that are comparable to, if not better than, conventional fixed rate mortgage
programs. The Bank made 49 loans totaling $11,107,559 under this loan program during the
review period.
Loan Modifications
The Bank offered loan modifications for residential loans to help their customers avoid
foreclosure and retain their home ownership. During the examination period, the Bank made 58
loan modifications for residential loans. Flexible terms included reduced interest rates and
extended maturities.
Small Business Loans
SBA Loan Programs
The Bank offers loan programs through the SBA, including the SBA 504, SBA 7(a), and SBA
Low Doc programs. These programs offer financing for qualified businesses that may not be
eligible for traditional bank financing. Cape Cod Five originated 132 SBA loans totaling $43.2
million during the evaluation period through the 7(a) and 504 loan programs, which is
significantly higher than the 38 SBA loans totaling $13 million during the prior evaluation
period.
20
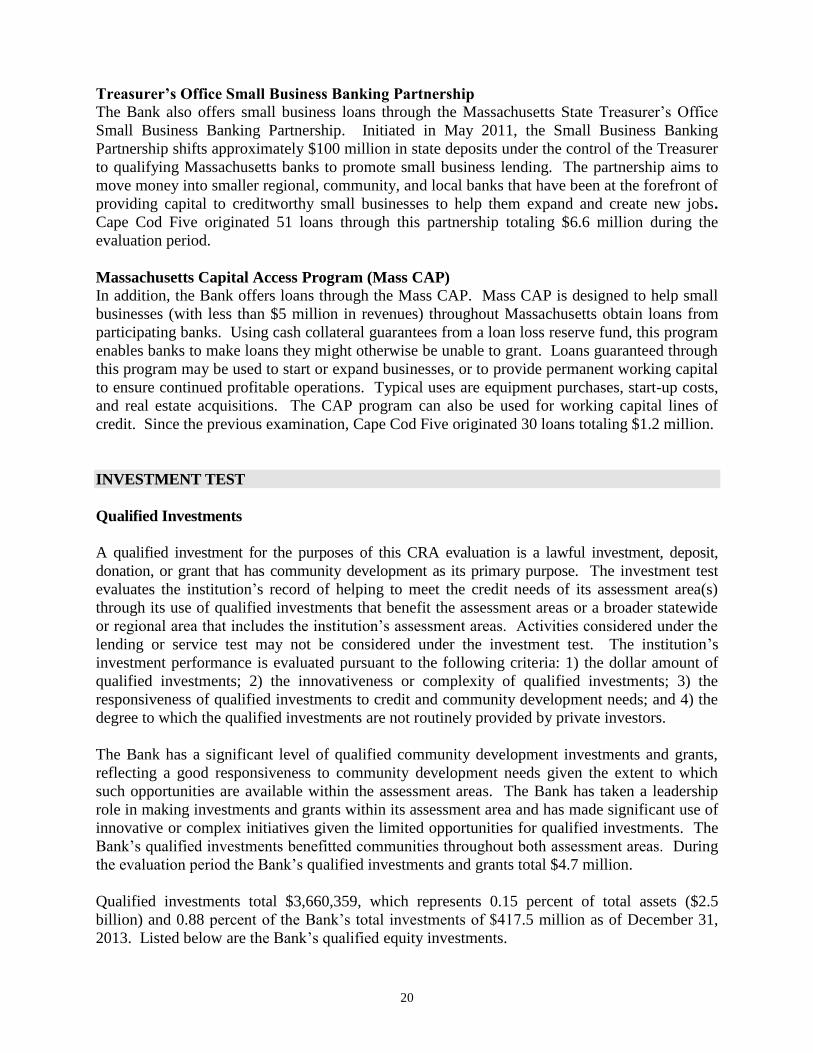
Treasurer’s Office Small Business Banking Partnership
The Bank also offers small business loans through the Massachusetts State Treasurer’s Office
Small Business Banking Partnership. Initiated in May 2011, the Small Business Banking
Partnership shifts approximately $100 million in state deposits under the control of the Treasurer
to qualifying Massachusetts banks to promote small business lending. The partnership aims to
move money into smaller regional, community, and local banks that have been at the forefront of
providing capital to creditworthy small businesses to help them expand and create new jobs.
Cape Cod Five originated 51 loans through this partnership totaling $6.6 million during the
evaluation period.
Massachusetts Capital Access Program (Mass CAP)
In addition, the Bank offers loans through the Mass CAP. Mass CAP is designed to help small
businesses (with less than $5 million in revenues) throughout Massachusetts obtain loans from
participating banks. Using cash collateral guarantees from a loan loss reserve fund, this program
enables banks to make loans they might otherwise be unable to grant. Loans guaranteed through
this program may be used to start or expand businesses, or to provide permanent working capital
to ensure continued profitable operations. Typical uses are equipment purchases, start-up costs,
and real estate acquisitions. The CAP program can also be used for working capital lines of
credit. Since the previous examination, Cape Cod Five originated 30 loans totaling $1.2 million.
INVESTMENT TEST
Qualified Investments
A qualified investment for the purposes of this CRA evaluation is a lawful investment, deposit,
donation, or grant that has community development as its primary purpose. The investment test
evaluates the institution’s record of helping to meet the credit needs of its assessment area(s)
through its use of qualified investments that benefit the assessment areas or a broader statewide
or regional area that includes the institution’s assessment areas. Activities considered under the
lending or service test may not be considered under the investment test. The institution’s
investment performance is evaluated pursuant to the following criteria: 1) the dollar amount of
qualified investments; 2) the innovativeness or complexity of qualified investments; 3) the
responsiveness of qualified investments to credit and community development needs; and 4) the
degree to which the qualified investments are not routinely provided by private investors.
The Bank has a significant level of qualified community development investments and grants,
reflecting a good responsiveness to community development needs given the extent to which
such opportunities are available within the assessment areas. The Bank has taken a leadership
role in making investments and grants within its assessment area and has made significant use of
innovative or complex initiatives given the limited opportunities for qualified investments. The
Bank’s qualified investments benefitted communities throughout both assessment areas. During
the evaluation period the Bank’s qualified investments and grants total $4.7 million.
Qualified investments total $3,660,359, which represents 0.15 percent of total assets ($2.5
billion) and 0.88 percent of the Bank’s total investments of $417.5 million as of December 31,
2013. Listed below are the Bank’s qualified equity investments.

21
Federal National Mortgage Association (FNMA) Mortgage Backed Securities
As of the date of this evaluation, the Bank held two qualified FNMA mortgage backed securities
purchased in a prior period. The underlying mortgages for both securities were made to low- and
moderate-income borrowers, and the current book value of the securities is $1,416,907. The
Bank purchased two additional FNMA mortgage backed securities during the evaluation period,
for a total investment amount of $2,243,452. These FNMA investments are collateralized by
loans to low- and moderate-income borrowers made within the Bank’s assessment area.
Charitable Contributions
The Bank made donations through its charitable foundation and directly through the institution. The
Cape Cod Five Cents Savings Bank Charitable Foundation Trust (“The Foundation”) was founded
in 1998, and is committed to serving the needs of the Cape and Island community. This private
foundation is funded entirely by the Bank. Trustees of the Foundation are a combination of the
Bank’s directors, trustees, corporators, and employees. The Foundation awards grants to local
non-profit organizations for the purpose of supporting specific programs, projects and services that
provide health and elder services, human needs, economic development, conservation and
environment, and youth and educational services.
Table 9
Community Development Grants and Donations
4Q2010 2011
2012 2013 1Q2014 Total
The Cape
Cod Five
Cents
Savings
Bank
Affordable
Housing
$500 $500 $2,150 $4,300 $0 $7,450
Community
Services
$5,500 $40,816 $40,800 $20,200 $19,125 $126,441
Economic
Development
$14,450 $13,350 $9,750 $16,000 $1,500 $55,050
Total $20,450 $54,666 $52,700 $40,500 $20,625 $188,941
The Cape
Cod Five
Cents
Savings
Charitable
Foundation
Trust
Affordable
Housing
$6,250 $37,750 $39,000 $44,400 $0 $127,400
Community
Services
$44,892 $168,125 $221,387 $201,800 $64,100 $700,304
Economic
Development
$808 $18,500 $33,773 $18,495 $0 $71,576
Total $51,950 $224,375 $294,160 $264,695 $64,100 $899,280
Grand Total $72,400 $279,041 $346,860 $305,195 $84,725 $1,088,221
Number of Organization
Benefiting from Donations 30 61 69 72 11 243
Source: Internal Bank Records
The total amount of qualified contributions between September 18, 2010 and March 24, 2014 was
$1,088,221. The $1,088,221 in donations provided by the Bank and the Foundation represents a
significant increase over the prior evaluation period when the total was $690,969. Specific
examples of the community development grants and donations are described in each of the
specific assessment area sections.

22
SERVICE TEST
The Service Test evaluates the institution’s record of helping to meet the credit needs of its
assessment area(s) by analyzing both the availability and effectiveness of the institution’s
systems for delivering retail banking services and the extent and innovativeness of its community
development services. The institution’s retail banking services are evaluated pursuant to the
following criteria: 1) the distribution of the institution’s branches among geographies of different
income levels; 2) the record of opening and closing branches, particularly branches located in
low- and moderate-income geographies or that primarily serve low- or moderate-income
individuals; 3) the availability and effectiveness of alternate systems for delivering retail banking
services; and 4) the range of services provided in low-, moderate-, middle-, and upper-income
geographies and the degree to which the services are tailored to meet the needs of those
geographies.
In addition, the institution’s community development services are evaluated pursuant to the
following criteria: 1) the extent of community development services offered and used; 2) the
innovativeness of community development services, including whether they serve low- and
moderate-income customers in new ways or serve groups of customers not previously served; 3)
the degree to which they serve low- and moderate-income areas or individuals; and 4) their
responsiveness to available opportunities for community development services.
Distribution of Branches
Cape Cod Five’s service delivery systems are readily accessible throughout its assessment area.
Banking services are available at any time both online and via ATMs. In addition, branch hours are
similar to other local financial institutions and feature extended hours on select days. The Bank’s
corporate headquarters is located in Harwich Port, a middle-income census tract. The Bank
currently operates 16 full-service branches located in the Towns of Brewster, Centerville,
Chatham, East Harwich, Eastham, Falmouth, Hyannis, Mashpee, Nantucket (2), Orleans,
Sandwich, South Dennis, South Yarmouth and Wellfleet. The Bank has an Operations Center
and a Trust and Asset Management Office located in Orleans, both located in a moderate-income
census tract. The Bank also has two loan production centers located in Marion, an upper-income
census tract, and Vineyard Haven, a middle-income census tract.
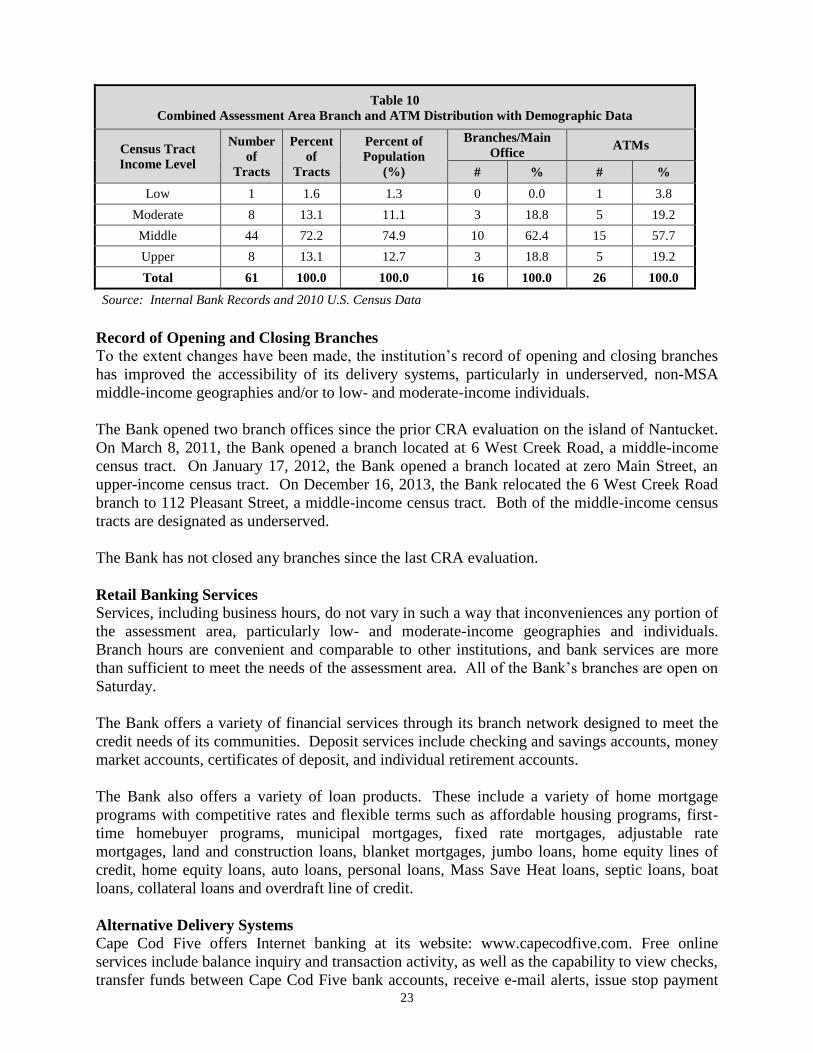
As the data shows in Table 10, there are no branches located in the low-income census tract and
three or 18.8 percent are located in moderate-income census tracts. In addition to having ATMs
at each branch office, the Bank has seven off-site ATM machines, located at 3239 Main Street in
Barnstable; Peterson’s Market in Yarmouth Port, inside the Steamship Authority terminals in
Hyannis, Woods Hole and Nantucket; Cape Cod Regional Technical High School in Harwich
and the Bank’s Operations Center in Orleans. The Steamship Authority in Hyannis is located in
a low-income census tract and the Bank’s Operations Center in Orleans is located in a moderate-
income census tract. The Technical High School and the Bank’s Operations Center have
restricted access to the ATMs. Of the 26 ATMs, 19 are linked to the SUM network providing
customers with free ATM access and 21 are deposit-taking ATMS. The five ATMs that are not
deposit taking are: the Cape Cod Technical High School, the Bank’s Operations Center in Orleans,
and all three of the Steamship Authority terminals.
23
Table 10
Combined Assessment Area Branch and ATM Distribution with Demographic Data
Census Tract
Income Level
Number
of
Tracts
Percent
of
Tracts
Percent of
Population
(%)
Branches/Main
Office ATMs
# % # %
Low 1 1.6 1.3 0 0.0 1 3.8
Moderate 8 13.1 11.1 3 18.8 5 19.2
Middle 44 72.2 74.9 10 62.4 15 57.7
Upper 8 13.1 12.7 3 18.8 5 19.2
Total 61 100.0 100.0 16 100.0 26 100.0
Source: Internal Bank Records and 2010 U.S. Census Data
Record of Opening and Closing Branches
To the extent changes have been made, the institution’s record of opening and closing branches
has improved the accessibility of its delivery systems, particularly in underserved, non-MSA
middle-income geographies and/or to low- and moderate-income individuals.
The Bank opened two branch offices since the prior CRA evaluation on the island of Nantucket.
On March 8, 2011, the Bank opened a branch located at 6 West Creek Road, a middle-income
census tract. On January 17, 2012, the Bank opened a branch located at zero Main Street, an
upper-income census tract. On December 16, 2013, the Bank relocated the 6 West Creek Road
branch to 112 Pleasant Street, a middle-income census tract. Both of the middle-income census
tracts are designated as underserved.
The Bank has not closed any branches since the last CRA evaluation.
Retail Banking Services
Services, including business hours, do not vary in such a way that inconveniences any portion of
the assessment area, particularly low- and moderate-income geographies and individuals.
Branch hours are convenient and comparable to other institutions, and bank services are more
than sufficient to meet the needs of the assessment area. All of the Bank’s branches are open on
Saturday.
The Bank offers a variety of financial services through its branch network designed to meet the
credit needs of its communities. Deposit services include checking and savings accounts, money
market accounts, certificates of deposit, and individual retirement accounts.
The Bank also offers a variety of loan products. These include a variety of home mortgage
programs with competitive rates and flexible terms such as affordable housing programs, first-
time homebuyer programs, municipal mortgages, fixed rate mortgages, adjustable rate
mortgages, land and construction loans, blanket mortgages, jumbo loans, home equity lines of
credit, home equity loans, auto loans, personal loans, Mass Save Heat loans, septic loans, boat
loans, collateral loans and overdraft line of credit.
Alternative Delivery Systems
Cape Cod Five offers Internet banking at its website: www.capecodfive.com. Free online
services include balance inquiry and transaction activity, as well as the capability to view checks,
transfer funds between Cape Cod Five bank accounts, receive e-mail alerts, issue stop payment
24
of checks, receive e-statements, and bill pay. The Bank also offers mobile banking with
capabilities such as balance inquiries, bill payment, transfers, transaction review and text alerts.
Community Development Services
Cape Cod Five is a leader among banks of its asset size in providing community development
services. The Bank offers services to low- and moderate-income residents within the assessment
areas and provided technical assistance to several community development organizations with a
community development purpose.
Specific examples of activities conducted and organizations that employees were involved in
during the evaluation period are described in the specific assessment area sections. All of the
services meet the definition of community development and also relate to the provision of
financial services as required by the regulation for consideration under CRA.
Educational Services and Seminars
Bank officers and employees have participated in seminars and other events sponsored by the
Bank during the evaluation period. These events provide opportunities for Bank representatives
to inform those in attendance about the products and services offered by the Bank and to gain
information about unmet credit needs in the assessment area.
In 2010, the Bank hosted a “Train the Trainer” seminar presented by the FDIC. The seminar
focused on providing presentation techniques to those individuals in the financial and social
service agencies that are engaged in presenting the FDIC’s “Money Smart” financial literacy
program to agencies contemplating its use.
In 2010, the Bank presented a workshop “Preventing Elder Financial Exploitation” to the Elder
Issues Committee, the Elder Services of Cape Cod and the Wellfleet Council of Aging.
In 2011, the Bank employed a full-time “Financial Education Officer”, who also holds a
professional Massachusetts Teacher’s license, to coordinate and facilitate educational programs
and events to students, (elementary through college), and adults (in organizations and the
community) throughout Cape Cod and the Islands. The Officer designs the curriculum for these
educational and training programs by utilizing pre-developed programs such as the FDIC’s
Money Smart Program as well as creating programs in-house. Some of the programs that have
been developed and presented are as follows:
Cape Cod and the Islands Professional Development Day Teacher Workshop. The
Financial Education Officer designed, organized and delivered a workshop for teachers
on the Cape and Islands providing guidance to participants on bringing a Credit for Life
Fair to their school.
Cape Cod Child Development Professional Development for Social Workers. The
FDIC Money Smart Program was introduced to social workers with the goal of having
them be able to assist their clients in addition to the Bank offering personal finance
classes to their client’s families.
Barnstable County Correctional Facility. A financial literacy program was designed
for inmates transitioning out of the Barnstable County Correctional Facility within the
next three to six months. A curriculum was designed to include: Establishing a Banking
25
Relationship, Savings Strategies and Budgeting; The Importance of Your Credit Score,
Responsible Uses of Credit and How to Repair and Apply for Credit.
In 2011, the Bank presented “Teach Children to Save” on savings and budgeting to six grade 6
classes at Harwich Middle School. Topics included setting goals, savings for a sunny day,
simple interest compared to compound interest, emergency funds, and investing.
In 2011, the Bank presented at Barnstable High School, three “Teens Need Time” which is a
grant funded program for at-risk teen students teaching personal finance skills. This is an 11
week series that explores such topics as needs versus wants, the importance of saving and
budgeting, how to build a relationship with a bank, how to analyze a paycheck, what information
to bring to a job interview, and identity theft.
In 2012, the Bank presented to freshman at the Dennis-Yarmouth Regional High School, eight
personal finance lessons educating the students on: needs versus wants, savings, savings
strategies, budgeting, identity theft, analyzing paychecks, and responsible uses of credit.
In partnership with the Nantucket Community School, the Bank presented two financial
workshops in 2012. The workshops addressed techniques on monthly budgeting; understanding
credit scores; handling credit report inaccuracies; and how to protect against identity theft.
In 2012 and 2013, the Bank, in partnership with Nantucket Housing, presented a homebuyer
education workshop to 45 attendees. Workshop topics included budgeting, credit, and the home
buying process.
In 2013, in conjunction with the Massachusetts State Treasury Financial Education Office and
the Massachusetts Literacy Trust Fund, the Bank presented a workshop entitled “Keeping Your
Money Safe and ID Theft.” The workshop was presented to assist households in building their
financial knowledge and improve their financial behavior.
In 2013, the Bank sponsored a workshop to the Mashpee Council on Aging on financial
exploitation, Internet banking and online safety.
In 2014, the Bank offered three workshops and a webinar on protecting against different types of
financially related fraud.
In 2014, the Bank partnered with Coastal Community Capital and presented an eight workshop
series for local small businesses using the FDIC and SBA Money Smart curriculum. This
program provides an introduction to day-to-day business organization and planning and is
written for entrepreneurs with limited or no prior formal business training. It offers practical
information that can be applied immediately while also preparing participants for more advanced
training.
During the examination period, the Bank co-sponsored 18 “Credit for Life Fairs” held at Dennis-
Yarmouth High School, Mashpee High School, Falmouth High School, Cape Cod Technical,
Nantucket High School, Sandwich High School, Upper Technical and Barnstable High School.
The Credit for Life Fair is a financial education opportunity for high school students
participating in an interactive fair in which they are given a salary and must visit vendors to
decide what lifestyle choices their budget allows them. Among other things they must decide
whether their budget permits them to own a house or if they should rent an apartment. At the end
26
of the fair they sit down with financial advisors who go over their choices and help them
understand the repercussions.
During the examination period, the Bank sponsored 22 first-time homebuyer seminars. Topics
included: the role of budgeting and credit in the home buying process; developing a budget,
budgeting as a renter versus budgeting as a homeowner, the importance of good credit, signs of
credit problems, pre-qualification versus pre-approval with a lender, different loan programs,
selecting a real estate broker, negotiating price and terms, home inspection, and applying for a
mortgage.
During the examination period, the Bank worked with the Cape Cod Child Development
Program organization to present a series of workshops for a teen parenting class on personal
finance. The Bank presented one evening per month with 10 young mothers aged 19 and under
for six sessions discussing lessons on the basics of banking, credit, managing and balancing
accounts, setting goals and identity theft.
Other Community Development Services
Interest on Lawyers’ Trust Accounts (IOLTA)
The Bank participates in the Interest on Lawyers’ Trust Accounts (IOLTA). IOLTA was
established in the United States in 1981. Lawyers place large client deposits, such as escrow
accounts, in interest bearing accounts, with the interest to be paid to the client. Deposits that
would individually be too small or too short-term to generate interest are pooled into IOLTA
accounts. Interest earned on the account is utilized to help fund improvements in the
administration of justice and delivery of legal services to low-income clients.
The Bank participates in the Massachusetts Community and Banking Council’s (MCBC) Basic
Banking in Massachusetts program. This statewide program is designed to offer low cost
checking and savings accounts to low- and moderate-income individuals.
In 2012, the Bank was recognized by the American Bankers Association (ABA) for its
outstanding financial education initiatives. The ABA Community Award was provided to 10
banks from a field of 200 nominations based on the innovation, creativity and effectiveness of its
approach in making a difference in its community.
The Bank is a founding and active member of the Massachusetts Financial Education
Collaborative. The Bank’s Financial Education Officer has co-chaired the K-16 Educational
Programs Groups and the Bank’s Training and Development Manager has chaired the Summit
Planning Committee for this group.
The Massachusetts Financial Education Collaborative (MFEC) is a coalition of professionals
from the public, private and non-profit sectors of the Commonwealth of Massachusetts that was
formed with the goal of improving the delivery and content of financial education throughout the
state. The Bank presented a workshop at the fifth annual MFEC Summit and provided a
snapshot of what a “Credit for Life Fair” looks like with over 150 Summit attendees visiting.
27
RESPONSE TO CRA COMPLAINTS
A review of FDIC records, as well as the Public File maintained by the Bank pursuant to the
Community Reinvestment Act, disclosed no complaints relating to the Bank’s CRA
performance.
FAIR LENDING OR OTHER ILLEGAL CREDIT PRACTICES REVIEW
The Bank’s compliance with the laws relating to discrimination and other illegal credit practices
was reviewed, including the Fair Housing Act and the Equal Credit Opportunity Act. No
evidence of discriminatory or other illegal credit practices inconsistent with helping to meet
community credit needs was identified.
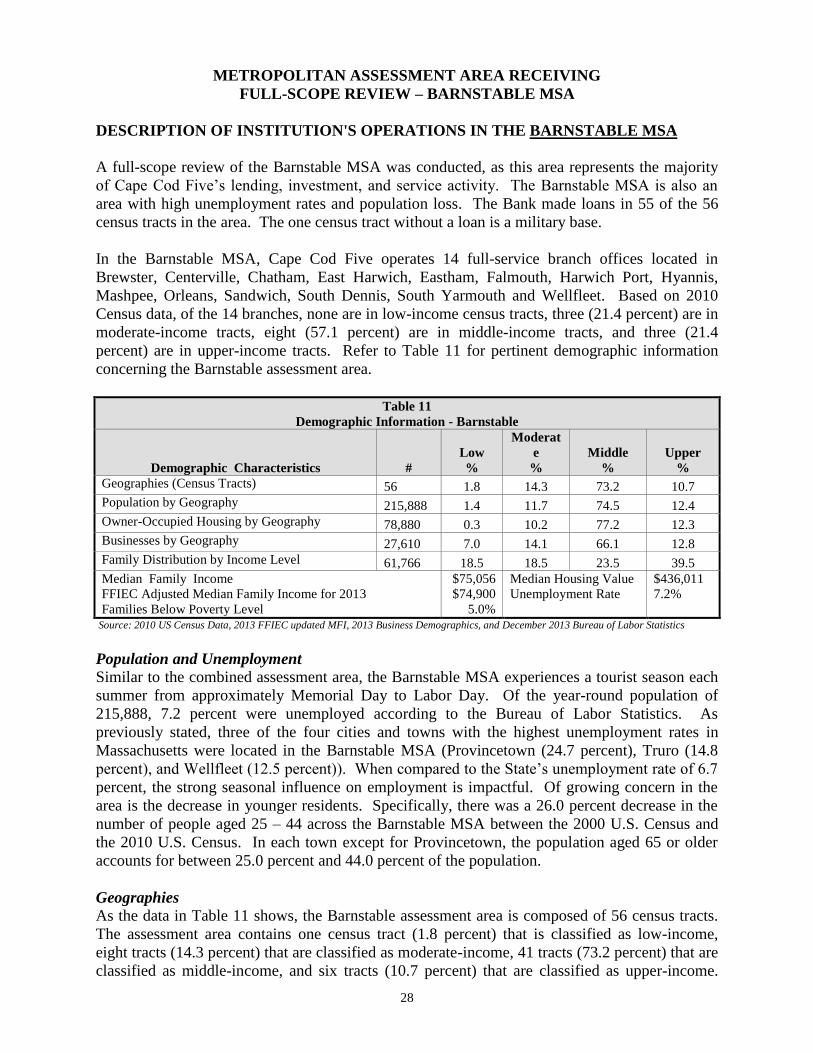
28
METROPOLITAN ASSESSMENT AREA RECEIVING
FULL-SCOPE REVIEW – BARNSTABLE MSA
DESCRIPTION OF INSTITUTION'S OPERATIONS IN THE BARNSTABLE MSA
A full-scope review of the Barnstable MSA was conducted, as this area represents the majority
of Cape Cod Five’s lending, investment, and service activity. The Barnstable MSA is also an
area with high unemployment rates and population loss. The Bank made loans in 55 of the 56
census tracts in the area. The one census tract without a loan is a military base.
In the Barnstable MSA, Cape Cod Five operates 14 full-service branch offices located in
Brewster, Centerville, Chatham, East Harwich, Eastham, Falmouth, Harwich Port, Hyannis,
Mashpee, Orleans, Sandwich, South Dennis, South Yarmouth and Wellfleet. Based on 2010
Census data, of the 14 branches, none are in low-income census tracts, three (21.4 percent) are in
moderate-income tracts, eight (57.1 percent) are in middle-income tracts, and three (21.4
percent) are in upper-income tracts. Refer to Table 11 for pertinent demographic information
concerning the Barnstable assessment area.
Table 11
Demographic Information - Barnstable
Demographic Characteristics
#
Low
%
Moderat
e
%
Middle
%
Upper
%
Geographies (Census Tracts) 56 1.8 14.3 73.2 10.7
Population by Geography 215,888 1.4 11.7 74.5 12.4
Owner-Occupied Housing by Geography 78,880 0.3 10.2 77.2 12.3
Businesses by Geography 27,610 7.0 14.1 66.1 12.8
Family Distribution by Income Level 61,766 18.5 18.5 23.5 39.5
Median Family Income
FFIEC Adjusted Median Family Income for 2013
Families Below Poverty Level
$75,056
$74,900
5.0%
Median Housing Value
Unemployment Rate
$436,011
7.2%
Source: 2010 US Census Data, 2013 FFIEC updated MFI, 2013 Business Demographics, and December 2013 Bureau of Labor Statistics
Population and Unemployment
Similar to the combined assessment area, the Barnstable MSA experiences a tourist season each
summer from approximately Memorial Day to Labor Day. Of the year-round population of
215,888, 7.2 percent were unemployed according to the Bureau of Labor Statistics. As
previously stated, three of the four cities and towns with the highest unemployment rates in
Massachusetts were located in the Barnstable MSA (Provincetown (24.7 percent), Truro (14.8
percent), and Wellfleet (12.5 percent)). When compared to the State’s unemployment rate of 6.7
percent, the strong seasonal influence on employment is impactful. Of growing concern in the
area is the decrease in younger residents. Specifically, there was a 26.0 percent decrease in the
number of people aged 25 – 44 across the Barnstable MSA between the 2000 U.S. Census and
the 2010 U.S. Census. In each town except for Provincetown, the population aged 65 or older
accounts for between 25.0 percent and 44.0 percent of the population.
Geographies
As the data in Table 11 shows, the Barnstable assessment area is composed of 56 census tracts.
The assessment area contains one census tract (1.8 percent) that is classified as low-income,
eight tracts (14.3 percent) that are classified as moderate-income, 41 tracts (73.2 percent) that are
classified as middle-income, and six tracts (10.7 percent) that are classified as upper-income.
29
The one low-income census tract is located in the Town of Hyannis. The moderate-income
census tracts are located in the Towns of Bourne, Dennis, Hyannis, Orleans, Provincetown, and
Yarmouth.
Housing
According to the 2010 U.S. Census, there were 158,838 total housing units, of which 78,880 or 49.7
percent are owner-occupied, 19,284 or 12.1 percent are occupied rental units and 60,674 or 38.2
percent are vacant units. The large percentage of vacant units is mainly due to the fact that many
properties are second homes, owned primarily for seasonal purposes. While the number of housing
units remains stable throughout the year, the population nearly doubles in the summer vacation
season, reducing the number of vacant units significantly (while increasing the cost of rental units).
Family Distribution and Poverty Rates
According to the 2010 U.S. Census, there were 61,766 families within the Barnstable assessment
area. Table 11 illustrates the breakout of families by income level. Of note, there were 11,447
low-income families and 11,425 moderate-income families within the Barnstable assessment
area.
Business Data
Similar to the combined assessment area, the 2013 Dun & Bradstreet business demographic data
show that there are 27,610 businesses in the Barnstable assessment area, of which 74.4 percent of
businesses have GARs of $1 million or less, 3.4 percent have GARs greater than $1 million, and the
remaining 22.2 percent have unreported revenues. Of total businesses in the assessment area, 7.0
percent are in the low-income census tract, 14.1 percent are in moderate-income census tracts, 66.1
percent are in middle-income tracts, and 12.8 percent are in upper-income tracts. The highest
proportion of all business establishments are engaged in the services industry (43.5 percent), due
to the seasonal tourism industry. Businesses involved in retail trade (13.7 percent), non-
classifiable establishments (13.1 percent) and construction (10.3 percent) make up a significant
share of the establishments. In terms of employees, approximately 67.7 percent of the area’s
businesses and farms employ four or fewer people.
Competition
Similar to the combined assessment area, Barnstable is also a very competitive market area in
terms of financial services. The Bank competes for loan volume with many commercial banks,
savings banks, credit unions, and other mortgage lenders that report transactions in the area.
Among the more prominent mortgage lenders competing with the Bank are Wells Fargo Bank,
NA, JPMorgan Chase Bank, US Bank, NA, and Cape Cod Co-operative Bank. According to the
2012 HMDA market share report for the Barnstable assessment area, there were 442 lenders that
originated or purchased one or more home mortgage loans. According to the 2012 CRA market
share report, 58 lenders originated or purchased one or more small business loans in the
Barnstable assessment area. According to the FDIC deposit market share report as of December
31, 2013, there were only 12 banks with one or more branches in the Barnstable assessment area.
Along with Cape Cod Five, TD Bank, NA, RBS Citizens NA, Bank of America, NA, Sovereign
Bank, NA, Rockland Trust Company, and Cape Cod Co-operative Bank all had 10 or more
branches in the Barnstable assessment area.
30
CONCLUSIONS WITH RESPECT TO PERFORMANCE TESTS:
LENDING TEST
LENDING ACTIVITY
Cape Cod Five’s lending activity reflects excellent responsiveness to the assessment area’s credit
needs. The Bank actively originates home mortgage, small business, and community
development loans in its Barnstable assessment area.
Home Loans
In 2012, Cape Cod Five originated 3,013 home mortgage loans totaling $807.5 million in the
Barnstable assessment area. Refinance and home purchase loans represented the primary focus
of the Bank’s home mortgage lending and comprised 63.4 percent and 27.2 percent, respectively,
of the total number of loans. The Bank’s first-time homebuyer programs and its continued active
participation in the MassHousing programs have permitted the Bank to generate a substantial
number of home purchase loans. Home improvement loans accounted for 9.4 percent of the
remaining number of loans.
Market rank data by loan purpose for 2012 provides additional insight into the Bank’s volume of
residential lending. In 2012, Cape Cod Five ranked first among all HMDA reporting lenders that
originated or purchased home purchase, home improvement, or refinance loans in the Barnstable
assessment area. The Bank had 821 home purchase originations for a 17.0 percent market share,
283 home improvement loans for a 34.1 percent market share, and 1,909 refinance originations
for a 13.5 percent market share.
In 2013, the total number of home loans inside the assessment area decreased 22.8 percent
compared to the prior year. This decrease in the volume of lending was mainly due to rising
mortgage interest rates and the saturation of the market for refinance loans. In 2013, refinance
loans were down to 46.4 percent of the loans, followed by the increased percentage of home
purchase loans of 41.8 percent and home improvement loans at 11.8 percent.
Small Business Loans
In 2012, Cape Cod Five reported 216 small business loans totaling $35.2 million in the
Barnstable assessment area. Market rank data for 2012 provides additional insight into the
Bank’s volume of small business lending. In 2012, Cape Cod Five ranked ninth among the 58
reporting lenders that originated or purchased one or more small business loan in the Barnstable
assessment area. All of the lenders ranked higher than Cape Cod Five were banks that offered
business credit cards that originated numerous credit lines in small dollar amounts, with most
average loan sizes below $9,000. When ranked by total dollar volume, Cape Cod Five’s small
business lending of $35.2 million ranked first among the reporting lenders.
In 2013, the number of Cape Cod Five small business loans increased in both number and dollar
amount compared to the prior year. In total, 241 small business loans totaling $40.6 million
were originated in the Barnstable assessment area.
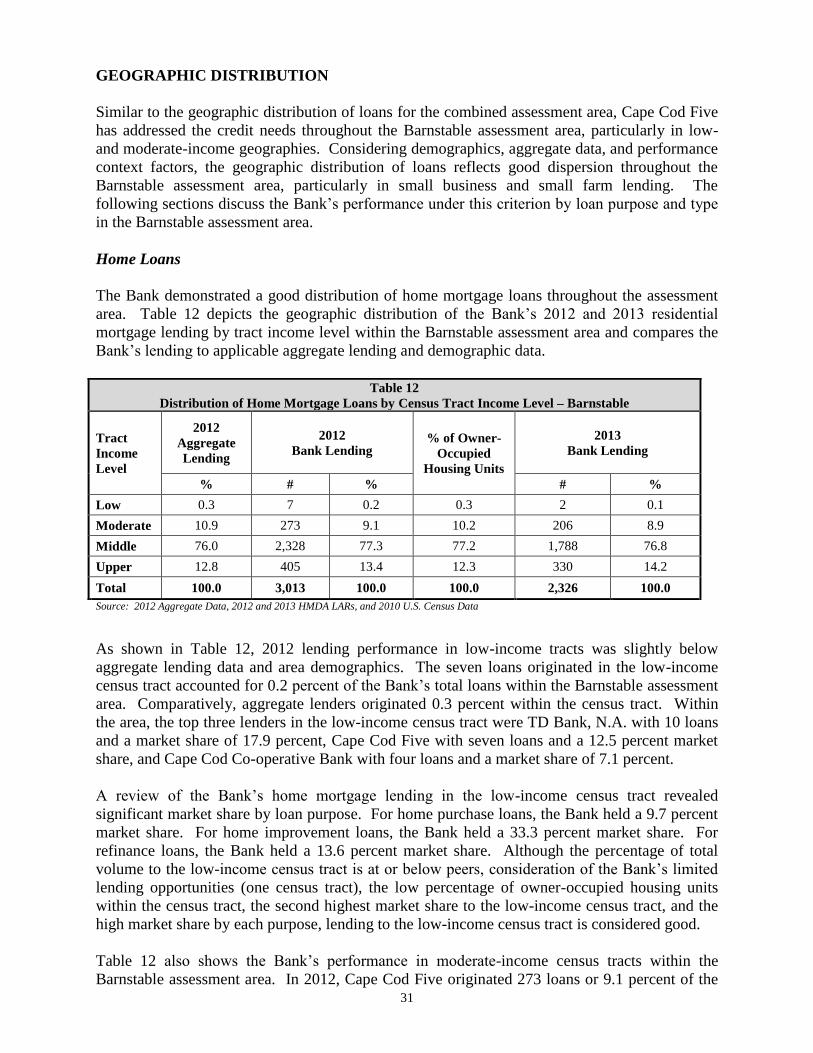
31
GEOGRAPHIC DISTRIBUTION
Similar to the geographic distribution of loans for the combined assessment area, Cape Cod Five
has addressed the credit needs throughout the Barnstable assessment area, particularly in low-
and moderate-income geographies. Considering demographics, aggregate data, and performance
context factors, the geographic distribution of loans reflects good dispersion throughout the
Barnstable assessment area, particularly in small business and small farm lending. The
following sections discuss the Bank’s performance under this criterion by loan purpose and type
in the Barnstable assessment area.
Home Loans
The Bank demonstrated a good distribution of home mortgage loans throughout the assessment
area. Table 12 depicts the geographic distribution of the Bank’s 2012 and 2013 residential
mortgage lending by tract income level within the Barnstable assessment area and compares the
Bank’s lending to applicable aggregate lending and demographic data.
Table 12
Distribution of Home Mortgage Loans by Census Tract Income Level – Barnstable
Tract
Income
Level
2012
Aggregate
Lending
2012
Bank Lending % of Owner-
Occupied
Housing Units
2013
Bank Lending
% # % # %
Low 0.3 7 0.2 0.3 2 0.1
Moderate 10.9 273 9.1 10.2 206 8.9
Middle 76.0 2,328 77.3 77.2 1,788 76.8
Upper 12.8 405 13.4 12.3 330 14.2
Total 100.0 3,013 100.0 100.0 2,326 100.0
Source: 2012 Aggregate Data, 2012 and 2013 HMDA LARs, and 2010 U.S. Census Data
As shown in Table 12, 2012 lending performance in low-income tracts was slightly below
aggregate lending data and area demographics. The seven loans originated in the low-income
census tract accounted for 0.2 percent of the Bank’s total loans within the Barnstable assessment
area. Comparatively, aggregate lenders originated 0.3 percent within the census tract. Within
the area, the top three lenders in the low-income census tract were TD Bank, N.A. with 10 loans
and a market share of 17.9 percent, Cape Cod Five with seven loans and a 12.5 percent market
share, and Cape Cod Co-operative Bank with four loans and a market share of 7.1 percent.
A review of the Bank’s home mortgage lending in the low-income census tract revealed
significant market share by loan purpose. For home purchase loans, the Bank held a 9.7 percent
market share. For home improvement loans, the Bank held a 33.3 percent market share. For
refinance loans, the Bank held a 13.6 percent market share. Although the percentage of total
volume to the low-income census tract is at or below peers, consideration of the Bank’s limited
lending opportunities (one census tract), the low percentage of owner-occupied housing units
within the census tract, the second highest market share to the low-income census tract, and the
high market share by each purpose, lending to the low-income census tract is considered good.
Table 12 also shows the Bank’s performance in moderate-income census tracts within the
Barnstable assessment area. In 2012, Cape Cod Five originated 273 loans or 9.1 percent of the
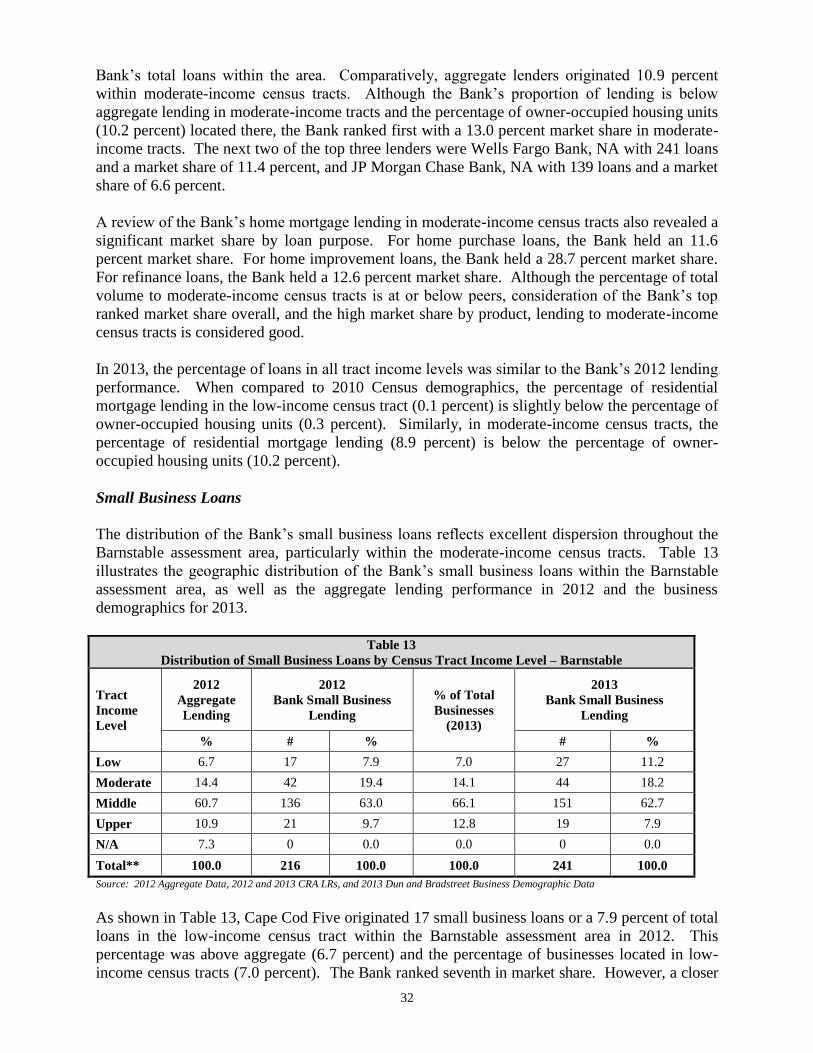
32
Bank’s total loans within the area. Comparatively, aggregate lenders originated 10.9 percent
within moderate-income census tracts. Although the Bank’s proportion of lending is below
aggregate lending in moderate-income tracts and the percentage of owner-occupied housing units
(10.2 percent) located there, the Bank ranked first with a 13.0 percent market share in moderate-
income tracts. The next two of the top three lenders were Wells Fargo Bank, NA with 241 loans
and a market share of 11.4 percent, and JP Morgan Chase Bank, NA with 139 loans and a market
share of 6.6 percent.
A review of the Bank’s home mortgage lending in moderate-income census tracts also revealed a
significant market share by loan purpose. For home purchase loans, the Bank held an 11.6
percent market share. For home improvement loans, the Bank held a 28.7 percent market share.
For refinance loans, the Bank held a 12.6 percent market share. Although the percentage of total
volume to moderate-income census tracts is at or below peers, consideration of the Bank’s top
ranked market share overall, and the high market share by product, lending to moderate-income
census tracts is considered good.
In 2013, the percentage of loans in all tract income levels was similar to the Bank’s 2012 lending
performance. When compared to 2010 Census demographics, the percentage of residential
mortgage lending in the low-income census tract (0.1 percent) is slightly below the percentage of
owner-occupied housing units (0.3 percent). Similarly, in moderate-income census tracts, the
percentage of residential mortgage lending (8.9 percent) is below the percentage of owner-
occupied housing units (10.2 percent).
Small Business Loans
The distribution of the Bank’s small business loans reflects excellent dispersion throughout the
Barnstable assessment area, particularly within the moderate-income census tracts. Table 13
illustrates the geographic distribution of the Bank’s small business loans within the Barnstable
assessment area, as well as the aggregate lending performance in 2012 and the business
demographics for 2013.
Table 13
Distribution of Small Business Loans by Census Tract Income Level – Barnstable
Tract
Income
Level
2012
Aggregate
Lending
2012
Bank Small Business
Lending
% of Total
Businesses
(2013)
2013
Bank Small Business
Lending
% # % # %
Low 6.7 17 7.9 7.0 27 11.2
Moderate 14.4 42 19.4 14.1 44 18.2
Middle 60.7 136 63.0 66.1 151 62.7
Upper 10.9 21 9.7 12.8 19 7.9
N/A 7.3 0 0.0 0.0 0 0.0
Total** 100.0 216 100.0 100.0 241 100.0
Source: 2012 Aggregate Data, 2012 and 2013 CRA LRs, and 2013 Dun and Bradstreet Business Demographic Data
As shown in Table 13, Cape Cod Five originated 17 small business loans or a 7.9 percent of total
loans in the low-income census tract within the Barnstable assessment area in 2012. This
percentage was above aggregate (6.7 percent) and the percentage of businesses located in low-
income census tracts (7.0 percent). The Bank ranked seventh in market share. However, a closer
33
review of other lenders in the area revealed the Bank ranked first in the low-income census tract for
banks with average loan sizes greater than $9,000. The top six small business lenders in the one
low-income census tract all had average loan sizes of $9,000. Cape Cod Five, however, had an
average loan size of $163,000. The top three small business lenders in the low-income tract were
American Express, FSB (ranked first with 117 loans or a 30.7 percent market share); Capital One
NA (ranked second with 42 loans or a 11.0 percent market share); and Capital One Bank USA,
N.A. (ranked third with 30 loans or a 7.9 percent market share). The only other top 10 lender
with an average loan size over $9,000 was TD Bank, N.A., which offers both small business
credit cards as well as small business loans.
The Bank’s performance in the low-income census tract increased in both percentage and
volume of loans from 2012 to 2013. In 2013, 11.2 percent of the Bank’s small business loans
were within the low-income tract as compared to 7.9 percent in 2012. The 11.2 percent lending
exceeded the percentage of small businesses in the low-income census tract (7.0 percent)
according to 2013 demographic data.
Regarding lending in moderate-income census tracts within the Barnstable assessment area in
2012, the Bank originated 42 loans for a 5.1 percent market share. Similar to the market share
review in the low-income tract, the Bank ranked seventh among lenders in moderate-income
areas, but ranked second of lenders that have an average loan size greater than $9,000. The
Bank’s performance in moderate-income census tracts exceeds the aggregate percentage of 14.4
percent.
In 2013, the Bank’s percentage of loans made in moderate-income census tracts (18.2 percent)
decreased slightly from 2012, although the volume of loans increased. The Bank’s performance
exceeded demographic data.
LENDING TO BORROWERS OF DIFFERENT INCOME LEVELS AND BUSINESSES
OF DIFFERENT SIZES
The distribution of loans by borrower income level and business revenues was reviewed to
determine Cape Cod Five’s level of addressing area credit needs, with the largest emphasis on
low- and moderate-income borrowers, and businesses with GARs of $1 million or less. The
distribution of borrowers reflects excellent penetration of loans among retail customers of
different income levels and adequate penetration of loans to business customers of different
sizes. The following sections discuss the Bank’s performance under this criterion by loan type
and purpose.
Home Loans
The distribution of home mortgage loans by borrower income level reflects excellent penetration
of loans to borrowers of different income levels, particularly those of low- and moderate-income.
Table 14 shows the distribution of residential mortgages by borrower income level within the
Barnstable assessment area. Table 14 also includes 2012 aggregate data and the distribution of
families by income level for comparison purposes.
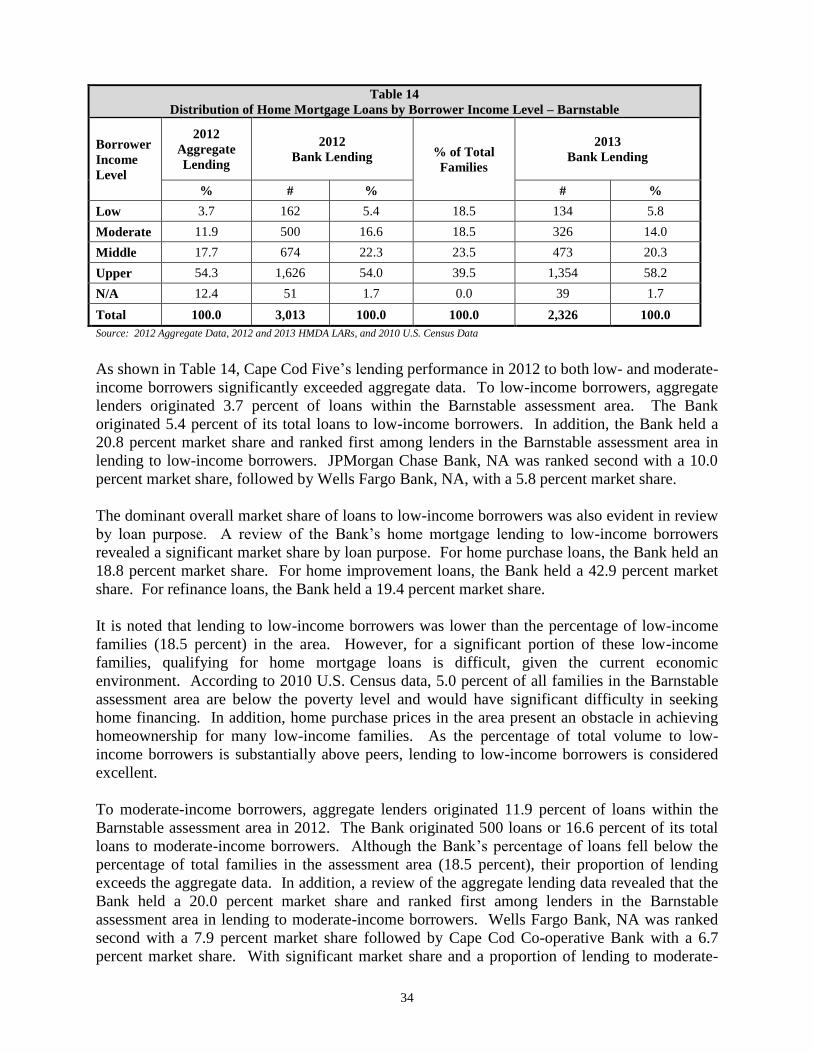
34
Table 14
Distribution of Home Mortgage Loans by Borrower Income Level – Barnstable
Borrower
Income
Level
2012
Aggregate
Lending
2012
Bank Lending % of Total
Families
2013
Bank Lending
% # % # %
Low 3.7 162 5.4 18.5 134 5.8
Moderate 11.9 500 16.6 18.5 326 14.0
Middle 17.7 674 22.3 23.5 473 20.3
Upper 54.3 1,626 54.0 39.5 1,354 58.2
N/A 12.4 51 1.7 0.0 39 1.7
Total 100.0 3,013 100.0 100.0 2,326 100.0
Source: 2012 Aggregate Data, 2012 and 2013 HMDA LARs, and 2010 U.S. Census Data
As shown in Table 14, Cape Cod Five’s lending performance in 2012 to both low- and moderate-
income borrowers significantly exceeded aggregate data. To low-income borrowers, aggregate
lenders originated 3.7 percent of loans within the Barnstable assessment area. The Bank
originated 5.4 percent of its total loans to low-income borrowers. In addition, the Bank held a
20.8 percent market share and ranked first among lenders in the Barnstable assessment area in
lending to low-income borrowers. JPMorgan Chase Bank, NA was ranked second with a 10.0
percent market share, followed by Wells Fargo Bank, NA, with a 5.8 percent market share.
The dominant overall market share of loans to low-income borrowers was also evident in review
by loan purpose. A review of the Bank’s home mortgage lending to low-income borrowers
revealed a significant market share by loan purpose. For home purchase loans, the Bank held an
18.8 percent market share. For home improvement loans, the Bank held a 42.9 percent market
share. For refinance loans, the Bank held a 19.4 percent market share.
It is noted that lending to low-income borrowers was lower than the percentage of low-income
families (18.5 percent) in the area. However, for a significant portion of these low-income
families, qualifying for home mortgage loans is difficult, given the current economic
environment. According to 2010 U.S. Census data, 5.0 percent of all families in the Barnstable
assessment area are below the poverty level and would have significant difficulty in seeking
home financing. In addition, home purchase prices in the area present an obstacle in achieving
homeownership for many low-income families. As the percentage of total volume to low-
income borrowers is substantially above peers, lending to low-income borrowers is considered
excellent.
To moderate-income borrowers, aggregate lenders originated 11.9 percent of loans within the
Barnstable assessment area in 2012. The Bank originated 500 loans or 16.6 percent of its total
loans to moderate-income borrowers. Although the Bank’s percentage of loans fell below the
percentage of total families in the assessment area (18.5 percent), their proportion of lending
exceeds the aggregate data. In addition, a review of the aggregate lending data revealed that the
Bank held a 20.0 percent market share and ranked first among lenders in the Barnstable
assessment area in lending to moderate-income borrowers. Wells Fargo Bank, NA was ranked
second with a 7.9 percent market share followed by Cape Cod Co-operative Bank with a 6.7
percent market share. With significant market share and a proportion of lending to moderate-
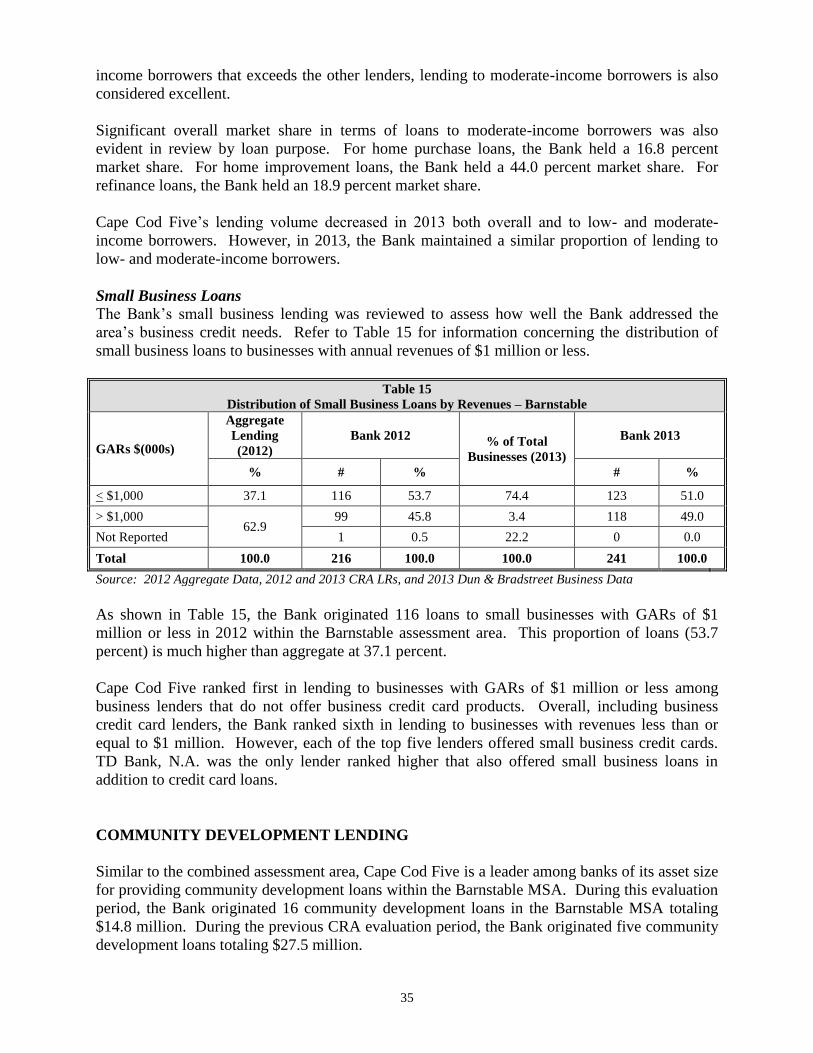
35
income borrowers that exceeds the other lenders, lending to moderate-income borrowers is also
considered excellent.
Significant overall market share in terms of loans to moderate-income borrowers was also
evident in review by loan purpose. For home purchase loans, the Bank held a 16.8 percent
market share. For home improvement loans, the Bank held a 44.0 percent market share. For
refinance loans, the Bank held an 18.9 percent market share.
Cape Cod Five’s lending volume decreased in 2013 both overall and to low- and moderate-
income borrowers. However, in 2013, the Bank maintained a similar proportion of lending to
low- and moderate-income borrowers.
Small Business Loans
The Bank’s small business lending was reviewed to assess how well the Bank addressed the
area’s business credit needs. Refer to Table 15 for information concerning the distribution of
small business loans to businesses with annual revenues of $1 million or less.
Table 15
Distribution of Small Business Loans by Revenues – Barnstable
GARs $(000s)
Aggregate
Lending
(2012)
Bank 2012 % of Total
Businesses (2013)
Bank 2013
% # % # %
< $1,000 37.1 116 53.7 74.4 123 51.0
> $1,000 62.9
99 45.8 3.4 118 49.0
Not Reported 1 0.5 22.2 0 0.0
Total 100.0 216 100.0 100.0 241 100.0
Source: 2012 Aggregate Data, 2012 and 2013 CRA LRs, and 2013 Dun & Bradstreet Business Data
As shown in Table 15, the Bank originated 116 loans to small businesses with GARs of $1
million or less in 2012 within the Barnstable assessment area. This proportion of loans (53.7
percent) is much higher than aggregate at 37.1 percent.
Cape Cod Five ranked first in lending to businesses with GARs of $1 million or less among
business lenders that do not offer business credit card products. Overall, including business
credit card lenders, the Bank ranked sixth in lending to businesses with revenues less than or
equal to $1 million. However, each of the top five lenders offered small business credit cards.
TD Bank, N.A. was the only lender ranked higher that also offered small business loans in
addition to credit card loans.
COMMUNITY DEVELOPMENT LENDING
Similar to the combined assessment area, Cape Cod Five is a leader among banks of its asset size
for providing community development loans within the Barnstable MSA. During this evaluation
period, the Bank originated 16 community development loans in the Barnstable MSA totaling
$14.8 million. During the previous CRA evaluation period, the Bank originated five community
development loans totaling $27.5 million.
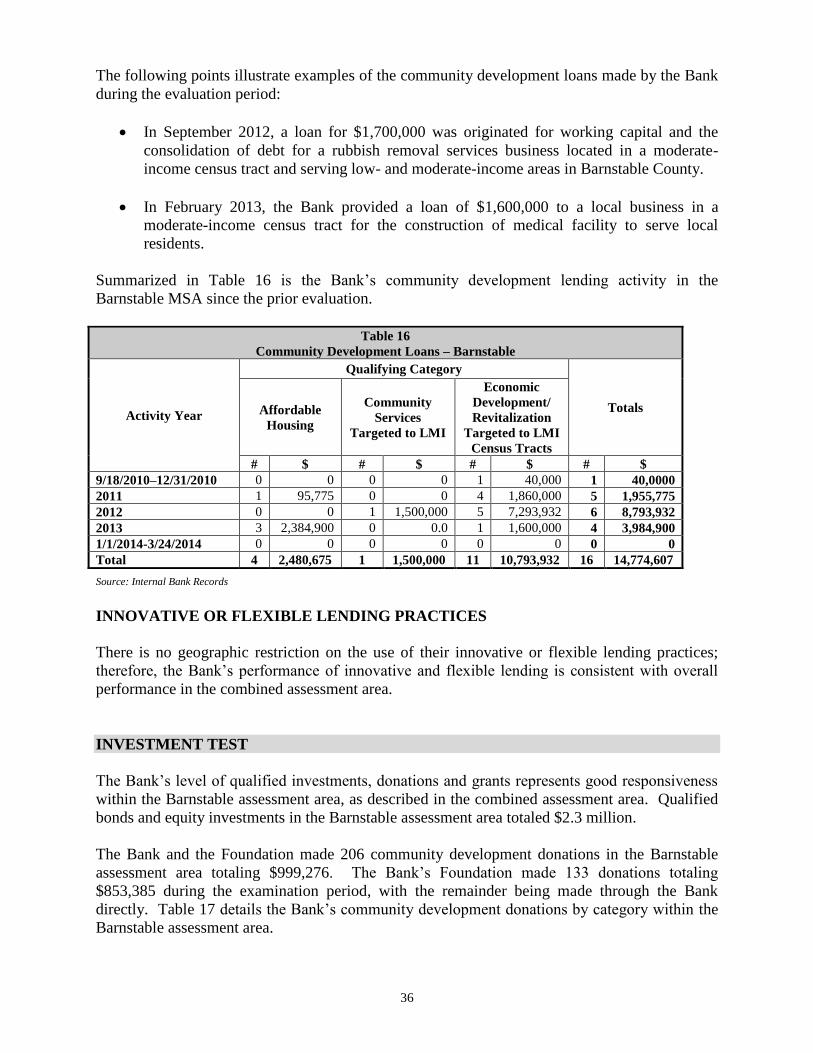
36
The following points illustrate examples of the community development loans made by the Bank
during the evaluation period:
In September 2012, a loan for $1,700,000 was originated for working capital and the
consolidation of debt for a rubbish removal services business located in a moderate-
income census tract and serving low- and moderate-income areas in Barnstable County.
In February 2013, the Bank provided a loan of $1,600,000 to a local business in a
moderate-income census tract for the construction of medical facility to serve local
residents.
Summarized in Table 16 is the Bank’s community development lending activity in the
Barnstable MSA since the prior evaluation.
Table 16
Community Development Loans – Barnstable
Activity Year
Qualifying Category
Totals Affordable
Housing
Community
Services
Targeted to LMI
Economic
Development/
Revitalization
Targeted to LMI
Census Tracts
# $ # $ # $ # $
9/18/2010–12/31/2010 0 0 0 0 1 40,000 1 40,0000
2011 1 95,775 0 0 4 1,860,000 5 1,955,775
2012 0 0 1 1,500,000 5 7,293,932 6 8,793,932
2013 3 2,384,900 0 0.0 1 1,600,000 4 3,984,900
1/1/2014-3/24/2014 0 0 0 0 0 0 0 0
Total 4 2,480,675 1 1,500,000 11 10,793,932 16 14,774,607
Source: Internal Bank Records
INNOVATIVE OR FLEXIBLE LENDING PRACTICES
There is no geographic restriction on the use of their innovative or flexible lending practices;
therefore, the Bank’s performance of innovative and flexible lending is consistent with overall
performance in the combined assessment area.
INVESTMENT TEST
The Bank’s level of qualified investments, donations and grants represents good responsiveness
within the Barnstable assessment area, as described in the combined assessment area. Qualified
bonds and equity investments in the Barnstable assessment area totaled $2.3 million.
The Bank and the Foundation made 206 community development donations in the Barnstable
assessment area totaling $999,276. The Bank’s Foundation made 133 donations totaling
$853,385 during the examination period, with the remainder being made through the Bank
directly. Table 17 details the Bank’s community development donations by category within the
Barnstable assessment area.
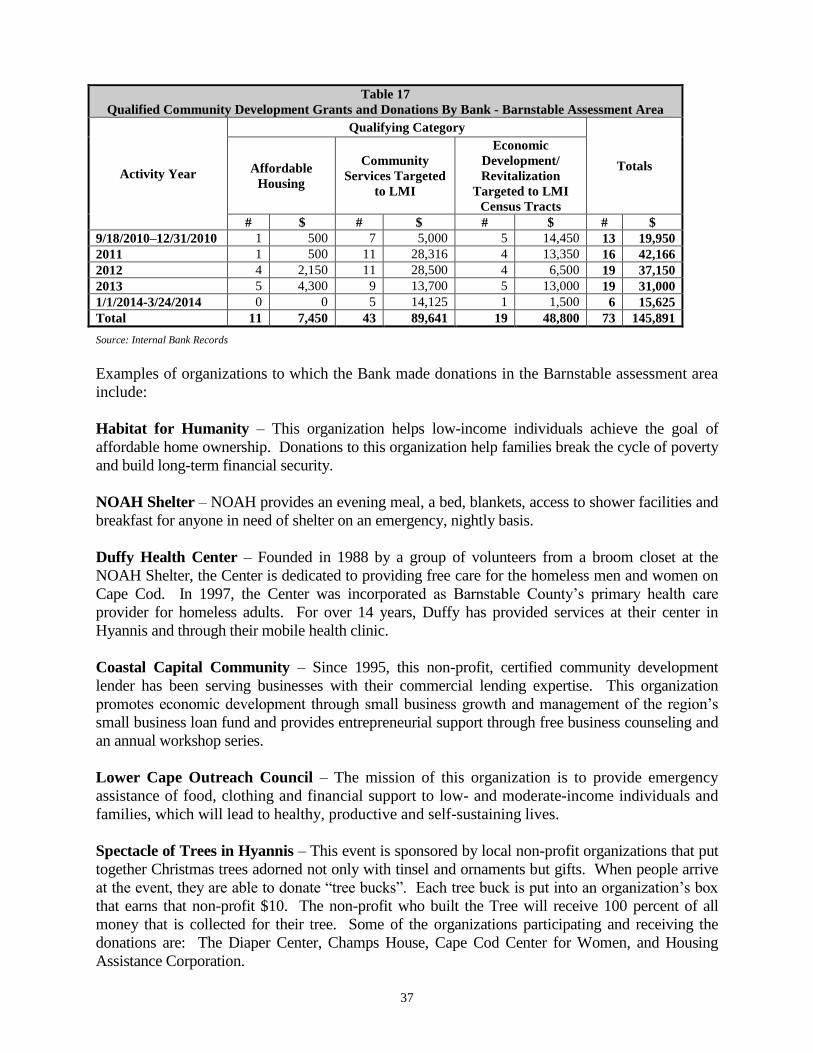
37
Table 17
Qualified Community Development Grants and Donations By Bank - Barnstable Assessment Area
Activity Year
Qualifying Category
Totals Affordable
Housing
Community
Services Targeted
to LMI
Economic
Development/
Revitalization
Targeted to LMI
Census Tracts
# $ # $ # $ # $
9/18/2010–12/31/2010 1 500 7 5,000 5 14,450 13 19,950
2011 1 500 11 28,316 4 13,350 16 42,166
2012 4 2,150 11 28,500 4 6,500 19 37,150
2013 5 4,300 9 13,700 5 13,000 19 31,000
1/1/2014-3/24/2014 0 0 5 14,125 1 1,500 6 15,625
Total 11 7,450 43 89,641 19 48,800 73 145,891
Source: Internal Bank Records
Examples of organizations to which the Bank made donations in the Barnstable assessment area
include:
Habitat for Humanity – This organization helps low-income individuals achieve the goal of
affordable home ownership. Donations to this organization help families break the cycle of poverty
and build long-term financial security.
NOAH Shelter – NOAH provides an evening meal, a bed, blankets, access to shower facilities and
breakfast for anyone in need of shelter on an emergency, nightly basis.
Duffy Health Center – Founded in 1988 by a group of volunteers from a broom closet at the
NOAH Shelter, the Center is dedicated to providing free care for the homeless men and women on
Cape Cod. In 1997, the Center was incorporated as Barnstable County’s primary health care
provider for homeless adults. For over 14 years, Duffy has provided services at their center in
Hyannis and through their mobile health clinic.
Coastal Capital Community – Since 1995, this non-profit, certified community development
lender has been serving businesses with their commercial lending expertise. This organization
promotes economic development through small business growth and management of the region’s
small business loan fund and provides entrepreneurial support through free business counseling and
an annual workshop series.
Lower Cape Outreach Council – The mission of this organization is to provide emergency
assistance of food, clothing and financial support to low- and moderate-income individuals and
families, which will lead to healthy, productive and self-sustaining lives.
Spectacle of Trees in Hyannis – This event is sponsored by local non-profit organizations that put
together Christmas trees adorned not only with tinsel and ornaments but gifts. When people arrive
at the event, they are able to donate “tree bucks”. Each tree buck is put into an organization’s box
that earns that non-profit $10. The non-profit who built the Tree will receive 100 percent of all
money that is collected for their tree. Some of the organizations participating and receiving the
donations are: The Diaper Center, Champs House, Cape Cod Center for Women, and Housing
Assistance Corporation.
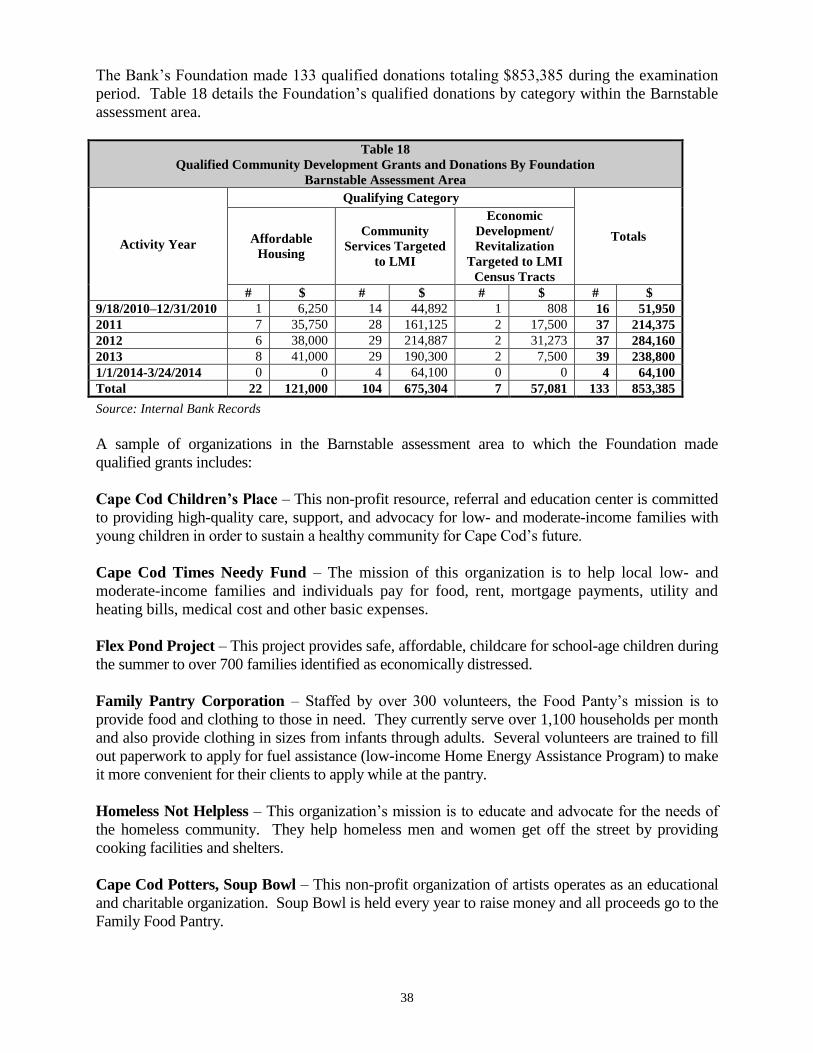
38
The Bank’s Foundation made 133 qualified donations totaling $853,385 during the examination
period. Table 18 details the Foundation’s qualified donations by category within the Barnstable
assessment area.
Table 18
Qualified Community Development Grants and Donations By Foundation
Barnstable Assessment Area
Activity Year
Qualifying Category
Totals Affordable
Housing
Community
Services Targeted
to LMI
Economic
Development/
Revitalization
Targeted to LMI
Census Tracts
# $ # $ # $ # $
9/18/2010–12/31/2010 1 6,250 14 44,892 1 808 16 51,950
2011 7 35,750 28 161,125 2 17,500 37 214,375
2012 6 38,000 29 214,887 2 31,273 37 284,160
2013 8 41,000 29 190,300 2 7,500 39 238,800
1/1/2014-3/24/2014 0 0 4 64,100 0 0 4 64,100
Total 22 121,000 104 675,304 7 57,081 133 853,385
Source: Internal Bank Records
A sample of organizations in the Barnstable assessment area to which the Foundation made
qualified grants includes:
Cape Cod Children’s Place – This non-profit resource, referral and education center is committed
to providing high-quality care, support, and advocacy for low- and moderate-income families with
young children in order to sustain a healthy community for Cape Cod’s future.
Cape Cod Times Needy Fund – The mission of this organization is to help local low- and
moderate-income families and individuals pay for food, rent, mortgage payments, utility and
heating bills, medical cost and other basic expenses.
Flex Pond Project – This project provides safe, affordable, childcare for school-age children during
the summer to over 700 families identified as economically distressed.
Family Pantry Corporation – Staffed by over 300 volunteers, the Food Panty’s mission is to
provide food and clothing to those in need. They currently serve over 1,100 households per month
and also provide clothing in sizes from infants through adults. Several volunteers are trained to fill
out paperwork to apply for fuel assistance (low-income Home Energy Assistance Program) to make
it more convenient for their clients to apply while at the pantry.
Homeless Not Helpless – This organization’s mission is to educate and advocate for the needs of
the homeless community. They help homeless men and women get off the street by providing
cooking facilities and shelters.
Cape Cod Potters, Soup Bowl – This non-profit organization of artists operates as an educational
and charitable organization. Soup Bowl is held every year to raise money and all proceeds go to the
Family Food Pantry.
39
Champ Homes – The organization provides supportive, low-cost housing, which is targeted toward
at-risk and low- and moderate-income individuals. Champ Homes operates seven such group
homes.
Robert F. Kennedy Children’s Action Corps – Founded June 25, 1969, this private, non-profit
organization operates a diverse range of programs focused on helping low- and moderate-income
children and adolescents develop self-esteem and become contributing members of society. The
organization also provides children and families with educational and skill building services and
collaborate with state and child welfare agencies.
Community Action Committee of Cape Cod and the Islands (CACCI) – CACCI is a private
non-profit agency dedicated to helping low-income individuals and families living on the Cape and
Islands attain and or retain their self-sufficiency by providing child care assistance information
(referrals and vouchers), access to health care, self-sufficiency support, shelter from domestic
violence, support for seniors to age at home and financial assistance to foreclosed homeowners.
South Coastal Counties Legal Services (SCCLS) – SCCLS is a non-profit charitable
corporation whose attorneys and paralegals represent poor and elderly clients with high priority
legal problems. They also provide group representation and community education.
Recovery Without Walls – This non-profit organization is entirely dependent on contributions
and volunteers who provide safety, support and structure to low- and moderate-income women
following substance abuse treatment. The organization also provides financial assistance with
rent, medication, legal fees as well as job placement and educational opportunities.
Community Connections – Since its inception in 1984, this organization has been providing
supportive services and treatment to help individuals meet their personal goals of recovery. The
programs are for adults in need and most come with histories of violence and victimization,
incarceration, and homelessness.
SERVICE TEST
Cape Cod Five’s service delivery systems are readily accessible throughout its assessment area.
The Bank’s corporate headquarters is located in Harwich Port, a middle-income census tract.
The Bank currently operates 14 full-service branches in this assessment area. There are no
branches located in the low-income census tract and three or 18.8 percent are located in
moderate-income census tracts, Hyannis, Orleans and South Dennis. In addition to having
ATMs at each branch office, the Bank has six off-site ATMs. The Steamship Authority in
Hyannis is located in a low-income census tract, and the Bank’s Operations Center in Orleans is
located in a moderate-income census tract.
The Bank is a leader in providing community development services in the Barnstable assessment
area. The following are examples of the Bank’s community development services in the
Barnstable assessment area.
MassHousing Home Ownership – The purpose of MassHousing is to provide home ownership
and rental housing opportunities for residents with low-and moderate-incomes who are under-
served by conventional housing markets. The Residential and Consumer Lending Officer is a
Committee Member.
40
SEED Corporation – This non-profit economic organization was established in 1982 to
improve the economy of the region by helping small businesses get started, and to grow and
create jobs. Their primary role is to assist and support small businesses during their start-up
phase to help secure traditional financing; and promote the expansion of existing businesses by
working with lending institutions and the SBA to provide the best possible financing package. A
Commercial Loan Officer is on the Loan Review Committee. A Regional Manager and
Commercial Loan Officer is a member of this organization, and another Commercial Loan
Officer is a Board Member as well as a member of the Loan Committee.
Elder Services of Cape Cod and the Islands (ESCCI) – ESCCI is a private, non-profit
community-based organization dedicated to serving older adults in the Cape and Island areas.
They are a federally designated Area Agency on Aging (AAA) and the state designated Aging
Services Access Point (ASAP) as well as the Aging and Disability Resource Consortium
(ADRC) for the three county areas. Since 1972, ESCCI has been a central source of information
and services enabling elders to enhance their quality of life and maintain their independence. A
Senior Wealth Management Officer is an Elder Abuse Consultant. The Director of Community
Relations is on the Money Management Advisory Board.
The Cape Cod Community Development Partnership (CDP) – CDP’s mission is to nurture
the lower Cape region by promoting environmental and economic sustainability, expanding
opportunities for low- and moderate-income residents and preserving cultural and historic
character. Their primary goal for housing development is to increase the availability of
attractive, quality affordable homes for low- to moderate-income families from Harwich to
Provincetown. A Commercial Loan Officer was the Board President and is now the Treasurer.
An Investment Services Officer is on the Board of Directors. A Commercial Loan Officer is on
the Credit Committee.
WE CAN – This non-profit organization provides a supportive environment in which low- and
moderate-income women can find the assistance they need to improve their lives by providing
legal help and information; financial resources and food due to job loss; help finding work and/or
stable housing; and assistance due to foreclosure. The Director of Loan Servicing is a Volunteer
for financial counseling. The Chief Human Resource Manager is an Advisor on job searches. A
Branch Manager provides financial assistance to clients.
Habitat for Humanity of Cape Cod – This organization helps low-income individuals achieve
the goal of affordable home ownership. A Commercial Loan Officer is the Chairman of the
Credit Review Committee. A Portfolio Loan Officer is a member of the Credit Committee.
The Falmouth Economic Development and Industrial Corporation (Falmouth EDIC) – The
mission of the Falmouth EDIC is to increase business and industrial investment; expand
opportunities to own, manage and operate commercial and industrial enterprises; provide funding
assistance; and increase job opportunities in the Town of Falmouth. The Regional
Manager/Commercial Loan Officer is the Treasurer.
Harwich Ecumenical Council for the Homeless, Inc. (HECH) – HECH was founded in 1990
to address the crisis of homelessness in Harwich and its surrounding towns. This organization
has developed programs in homelessness prevention, mortgage foreclosure prevention, child
care, and youth counseling. The Bank’s Director of Community Lending is the Director and is a
member of the Finance Committee.
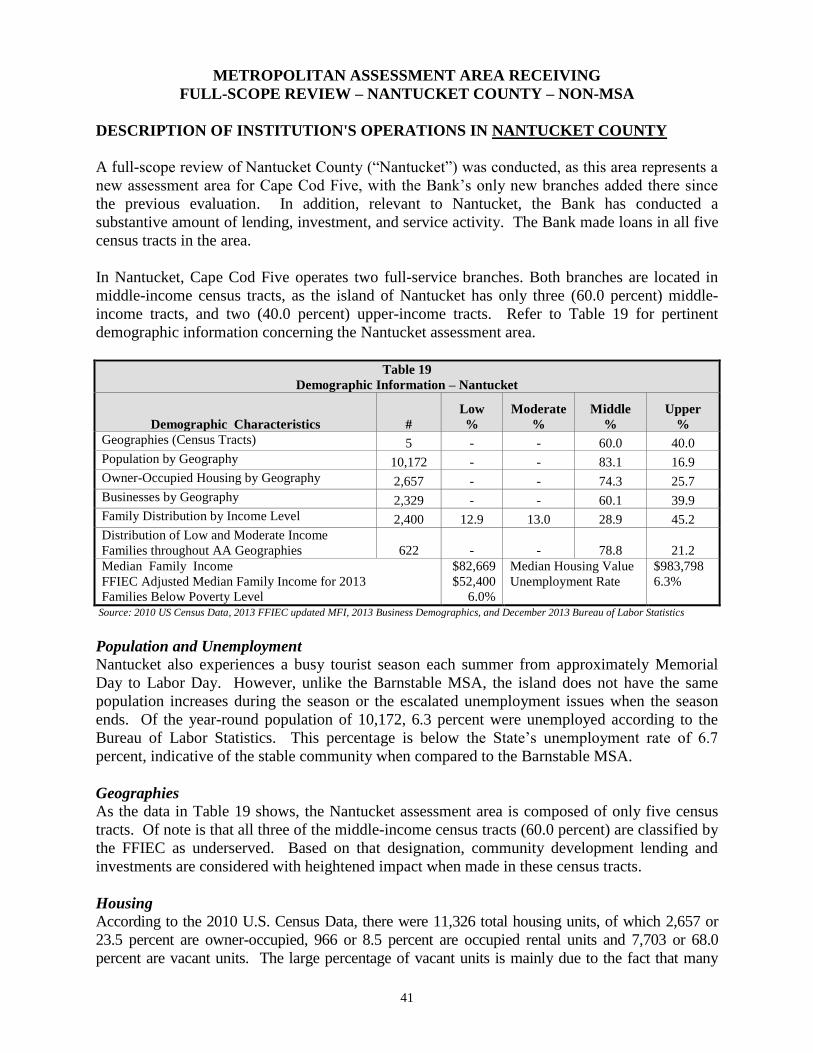
41
METROPOLITAN ASSESSMENT AREA RECEIVING
FULL-SCOPE REVIEW – NANTUCKET COUNTY – NON-MSA
DESCRIPTION OF INSTITUTION'S OPERATIONS IN NANTUCKET COUNTY
A full-scope review of Nantucket County (“Nantucket”) was conducted, as this area represents a
new assessment area for Cape Cod Five, with the Bank’s only new branches added there since
the previous evaluation. In addition, relevant to Nantucket, the Bank has conducted a
substantive amount of lending, investment, and service activity. The Bank made loans in all five
census tracts in the area.
In Nantucket, Cape Cod Five operates two full-service branches. Both branches are located in
middle-income census tracts, as the island of Nantucket has only three (60.0 percent) middle-
income tracts, and two (40.0 percent) upper-income tracts. Refer to Table 19 for pertinent
demographic information concerning the Nantucket assessment area.
Table 19
Demographic Information – Nantucket
Demographic Characteristics
#
Low
%
Moderate
%
Middle
%
Upper
%
Geographies (Census Tracts) 5 - - 60.0 40.0
Population by Geography 10,172 - - 83.1 16.9
Owner-Occupied Housing by Geography 2,657 - - 74.3 25.7
Businesses by Geography 2,329 - - 60.1 39.9
Family Distribution by Income Level 2,400 12.9 13.0 28.9 45.2
Distribution of Low and Moderate Income
Families throughout AA Geographies 622 - - 78.8 21.2
Median Family Income
FFIEC Adjusted Median Family Income for 2013
Families Below Poverty Level
$82,669
$52,400
6.0%
Median Housing Value
Unemployment Rate
$983,798
6.3%
Source: 2010 US Census Data, 2013 FFIEC updated MFI, 2013 Business Demographics, and December 2013 Bureau of Labor Statistics
Population and Unemployment
Nantucket also experiences a busy tourist season each summer from approximately Memorial
Day to Labor Day. However, unlike the Barnstable MSA, the island does not have the same
population increases during the season or the escalated unemployment issues when the season
ends. Of the year-round population of 10,172, 6.3 percent were unemployed according to the
Bureau of Labor Statistics. This percentage is below the State’s unemployment rate of 6.7
percent, indicative of the stable community when compared to the Barnstable MSA.
Geographies
As the data in Table 19 shows, the Nantucket assessment area is composed of only five census
tracts. Of note is that all three of the middle-income census tracts (60.0 percent) are classified by
the FFIEC as underserved. Based on that designation, community development lending and
investments are considered with heightened impact when made in these census tracts.
Housing
According to the 2010 U.S. Census Data, there were 11,326 total housing units, of which 2,657 or
23.5 percent are owner-occupied, 966 or 8.5 percent are occupied rental units and 7,703 or 68.0
percent are vacant units. The large percentage of vacant units is mainly due to the fact that many

42
properties are second homes, owned primarily for seasonal purposes. As the median housing value is
almost $1 million, the availability of affordable housing is a constant concern for island residents.
Family Distribution and Poverty Rates
According to the 2010 U.S. Census, there were 2,400 families within the Nantucket assessment
area. Table 19 illustrates the breakout of families by income level. Similar to the Barnstable
MSA, there were an almost equal number of low- and moderate-income families. According to
the 2010 U.S. Census, there were 310 low-income families and 312 moderate-income families.
Business Data
Dun & Bradstreet business demographic data for 2013 show that there are 2,329 businesses, of which
74.2 percent of businesses have GARs of $1 million or less, 3.7 percent have GARs greater than $1
million, and the remaining 22.1 percent have unreported revenues. The highest proportion of all
business establishments are engaged in the services industry (36.1 percent), due to the seasonal
tourism industry. Businesses involved in retail trade (15.7 percent), non-classifiable
establishments (14.2 percent) and construction (13.3 percent) make up a significant share of the
remaining establishments.
Competition
As indicated by the community contact, there are only four main banks on the island of
Nantucket. However, a review of the 2012 HMDA market share report indicates there were 120
lenders that originated one or more home mortgage loans in the Nantucket assessment area. As
Cape Cod Five competes for loan volume with commercial banks, savings banks, credit unions,
and other mortgage lenders that report transactions in the area, Nantucket is still seen as highly
competitive. Among the more prominent mortgage lenders competing with the Bank are
Sovereign Bank, N.A., Wells Fargo Bank, NA, JPMorgan Chase Bank NA, Bank of America,
N.A., and TD Bank N.A.. According to the 2012 CRA market share report, 30 lenders
originated one or more loans on Nantucket. According to the FDIC deposit market share report
as of December 31, 2013; there were only seven banks with one or more offices or branches on
Nantucket.
CONCLUSIONS WITH RESPECT TO PERFORMANCE TESTS:
LENDING TEST
LENDING ACTIVITY
Cape Cod Five’s lending activity reflects excellent responsiveness to the assessment area’s credit
needs. The Bank actively originates home mortgage, small business, and community
development loans in its Nantucket assessment area.
Home Loans
In 2012, Cape Cod Five originated 135 home mortgage loans totaling $80.2 million in the
Nantucket assessment area. Although the Bank opened both of its branches after the last
examination, this lending resulted in the highest ranking market share of 13.7 percent. Refinance
and home purchase loans represented the primary focus of the Bank’s home mortgage lending
and comprised 57.0 percent and 29.6 percent, respectively, of the total number of loans. The
Bank’s first-time homebuyer programs and its continued active participation in the MassHousing
programs had less of an impact on Nantucket, but still permitted the Bank to generate several
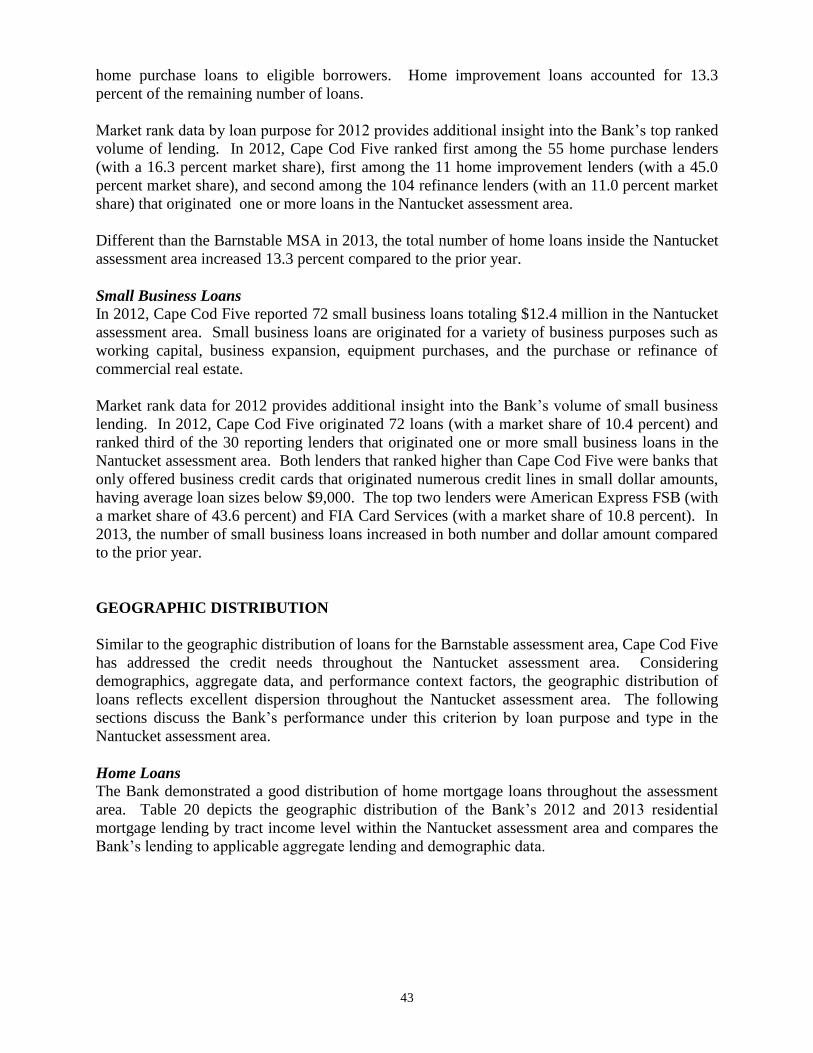
43
home purchase loans to eligible borrowers. Home improvement loans accounted for 13.3
percent of the remaining number of loans.
Market rank data by loan purpose for 2012 provides additional insight into the Bank’s top ranked
volume of lending. In 2012, Cape Cod Five ranked first among the 55 home purchase lenders
(with a 16.3 percent market share), first among the 11 home improvement lenders (with a 45.0
percent market share), and second among the 104 refinance lenders (with an 11.0 percent market
share) that originated one or more loans in the Nantucket assessment area.
Different than the Barnstable MSA in 2013, the total number of home loans inside the Nantucket
assessment area increased 13.3 percent compared to the prior year.
Small Business Loans
In 2012, Cape Cod Five reported 72 small business loans totaling $12.4 million in the Nantucket
assessment area. Small business loans are originated for a variety of business purposes such as
working capital, business expansion, equipment purchases, and the purchase or refinance of
commercial real estate.
Market rank data for 2012 provides additional insight into the Bank’s volume of small business
lending. In 2012, Cape Cod Five originated 72 loans (with a market share of 10.4 percent) and
ranked third of the 30 reporting lenders that originated one or more small business loans in the
Nantucket assessment area. Both lenders that ranked higher than Cape Cod Five were banks that
only offered business credit cards that originated numerous credit lines in small dollar amounts,
having average loan sizes below $9,000. The top two lenders were American Express FSB (with
a market share of 43.6 percent) and FIA Card Services (with a market share of 10.8 percent). In
2013, the number of small business loans increased in both number and dollar amount compared
to the prior year.
GEOGRAPHIC DISTRIBUTION
Similar to the geographic distribution of loans for the Barnstable assessment area, Cape Cod Five
has addressed the credit needs throughout the Nantucket assessment area. Considering
demographics, aggregate data, and performance context factors, the geographic distribution of
loans reflects excellent dispersion throughout the Nantucket assessment area. The following
sections discuss the Bank’s performance under this criterion by loan purpose and type in the
Nantucket assessment area.
Home Loans
The Bank demonstrated a good distribution of home mortgage loans throughout the assessment
area. Table 20 depicts the geographic distribution of the Bank’s 2012 and 2013 residential
mortgage lending by tract income level within the Nantucket assessment area and compares the
Bank’s lending to applicable aggregate lending and demographic data.
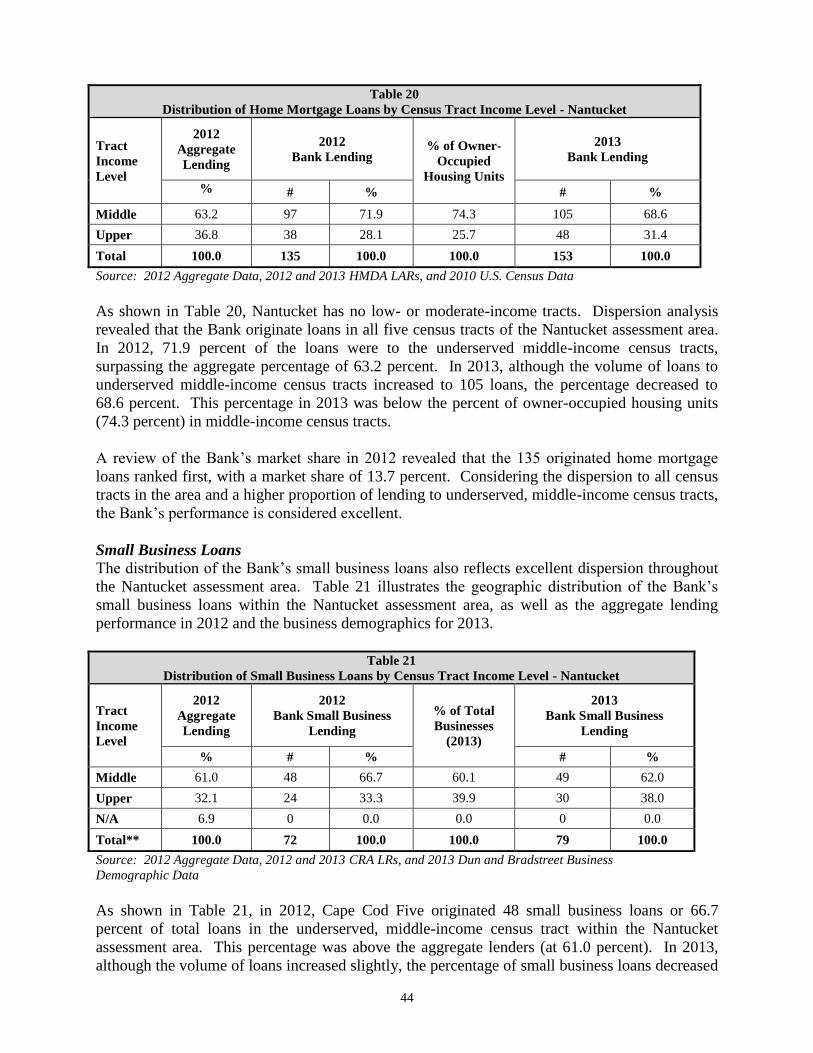
44
Table 20
Distribution of Home Mortgage Loans by Census Tract Income Level - Nantucket
Tract
Income
Level
2012
Aggregate
Lending
2012
Bank Lending % of Owner-
Occupied
Housing Units
2013
Bank Lending
% # % # %
Middle 63.2 97 71.9 74.3 105 68.6
Upper 36.8 38 28.1 25.7 48 31.4
Total 100.0 135 100.0 100.0 153 100.0
Source: 2012 Aggregate Data, 2012 and 2013 HMDA LARs, and 2010 U.S. Census Data
As shown in Table 20, Nantucket has no low- or moderate-income tracts. Dispersion analysis
revealed that the Bank originate loans in all five census tracts of the Nantucket assessment area.
In 2012, 71.9 percent of the loans were to the underserved middle-income census tracts,
surpassing the aggregate percentage of 63.2 percent. In 2013, although the volume of loans to
underserved middle-income census tracts increased to 105 loans, the percentage decreased to
68.6 percent. This percentage in 2013 was below the percent of owner-occupied housing units
(74.3 percent) in middle-income census tracts.
A review of the Bank’s market share in 2012 revealed that the 135 originated home mortgage
loans ranked first, with a market share of 13.7 percent. Considering the dispersion to all census
tracts in the area and a higher proportion of lending to underserved, middle-income census tracts,
the Bank’s performance is considered excellent.
Small Business Loans
The distribution of the Bank’s small business loans also reflects excellent dispersion throughout
the Nantucket assessment area. Table 21 illustrates the geographic distribution of the Bank’s
small business loans within the Nantucket assessment area, as well as the aggregate lending
performance in 2012 and the business demographics for 2013.
Table 21
Distribution of Small Business Loans by Census Tract Income Level - Nantucket
Tract
Income
Level
2012
Aggregate
Lending
2012
Bank Small Business
Lending
% of Total
Businesses
(2013)
2013
Bank Small Business
Lending
% # % # %
Middle 61.0 48 66.7 60.1 49 62.0
Upper 32.1 24 33.3 39.9 30 38.0
N/A 6.9 0 0.0 0.0 0 0.0
Total** 100.0 72 100.0 100.0 79 100.0
Source: 2012 Aggregate Data, 2012 and 2013 CRA LRs, and 2013 Dun and Bradstreet Business
Demographic Data
As shown in Table 21, in 2012, Cape Cod Five originated 48 small business loans or 66.7
percent of total loans in the underserved, middle-income census tract within the Nantucket
assessment area. This percentage was above the aggregate lenders (at 61.0 percent). In 2013,
although the volume of loans increased slightly, the percentage of small business loans decreased
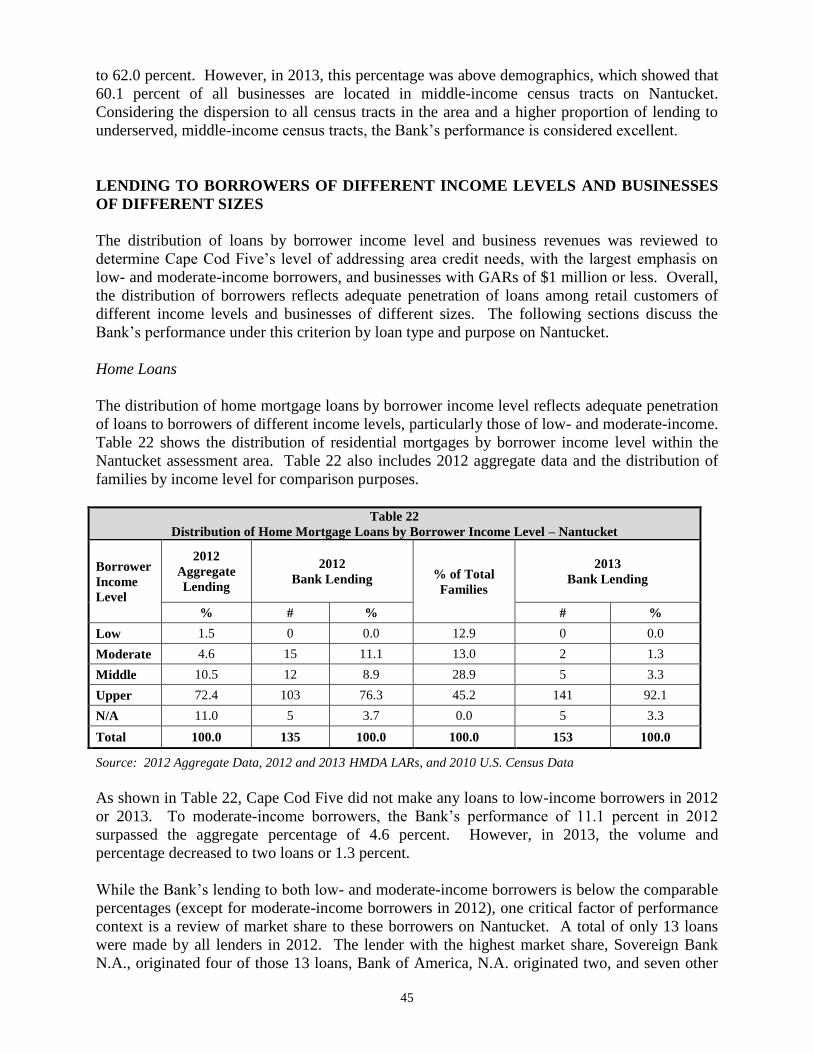
45
to 62.0 percent. However, in 2013, this percentage was above demographics, which showed that
60.1 percent of all businesses are located in middle-income census tracts on Nantucket.
Considering the dispersion to all census tracts in the area and a higher proportion of lending to
underserved, middle-income census tracts, the Bank’s performance is considered excellent.
LENDING TO BORROWERS OF DIFFERENT INCOME LEVELS AND BUSINESSES
OF DIFFERENT SIZES
The distribution of loans by borrower income level and business revenues was reviewed to
determine Cape Cod Five’s level of addressing area credit needs, with the largest emphasis on
low- and moderate-income borrowers, and businesses with GARs of $1 million or less. Overall,
the distribution of borrowers reflects adequate penetration of loans among retail customers of
different income levels and businesses of different sizes. The following sections discuss the
Bank’s performance under this criterion by loan type and purpose on Nantucket.
Home Loans
The distribution of home mortgage loans by borrower income level reflects adequate penetration
of loans to borrowers of different income levels, particularly those of low- and moderate-income.
Table 22 shows the distribution of residential mortgages by borrower income level within the
Nantucket assessment area. Table 22 also includes 2012 aggregate data and the distribution of
families by income level for comparison purposes.
Table 22
Distribution of Home Mortgage Loans by Borrower Income Level – Nantucket
Borrower
Income
Level
2012
Aggregate
Lending
2012
Bank Lending % of Total
Families
2013
Bank Lending
% # % # %
Low 1.5 0 0.0 12.9 0 0.0
Moderate 4.6 15 11.1 13.0 2 1.3
Middle 10.5 12 8.9 28.9 5 3.3
Upper 72.4 103 76.3 45.2 141 92.1
N/A 11.0 5 3.7 0.0 5 3.3
Total 100.0 135 100.0 100.0 153 100.0
Source: 2012 Aggregate Data, 2012 and 2013 HMDA LARs, and 2010 U.S. Census Data
As shown in Table 22, Cape Cod Five did not make any loans to low-income borrowers in 2012
or 2013. To moderate-income borrowers, the Bank’s performance of 11.1 percent in 2012
surpassed the aggregate percentage of 4.6 percent. However, in 2013, the volume and
percentage decreased to two loans or 1.3 percent.
While the Bank’s lending to both low- and moderate-income borrowers is below the comparable
percentages (except for moderate-income borrowers in 2012), one critical factor of performance
context is a review of market share to these borrowers on Nantucket. A total of only 13 loans
were made by all lenders in 2012. The lender with the highest market share, Sovereign Bank
N.A., originated four of those 13 loans, Bank of America, N.A. originated two, and seven other
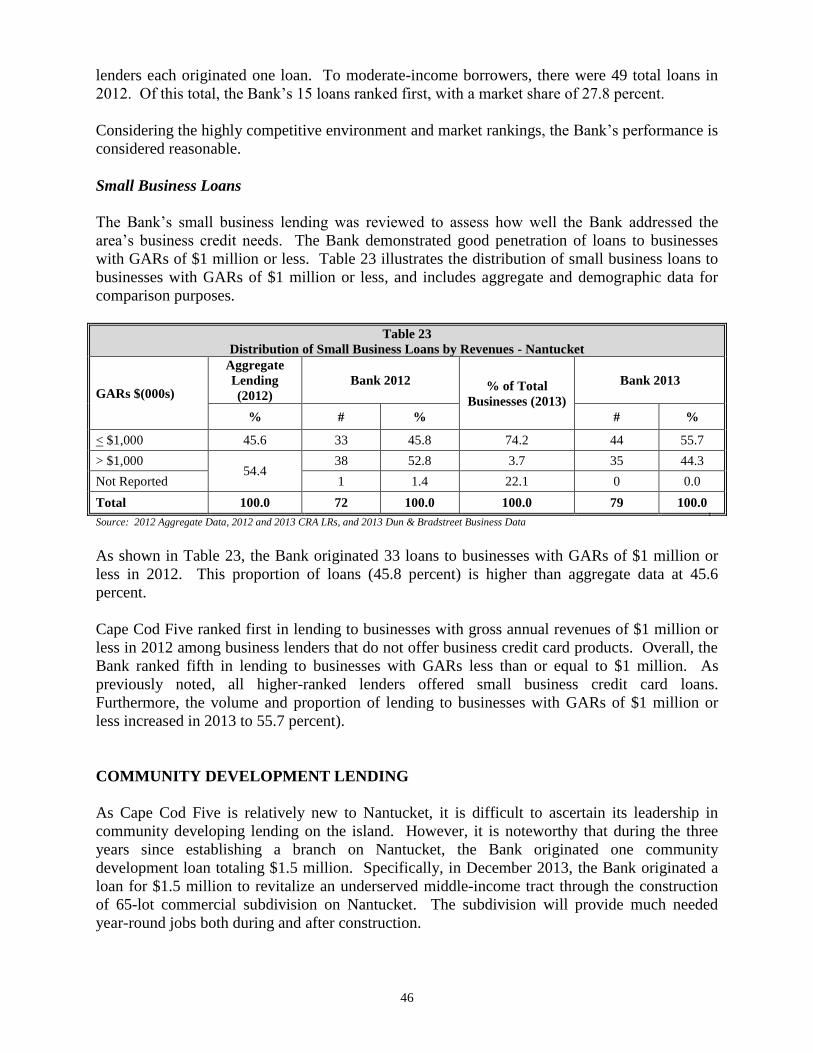
46
lenders each originated one loan. To moderate-income borrowers, there were 49 total loans in
2012. Of this total, the Bank’s 15 loans ranked first, with a market share of 27.8 percent.
Considering the highly competitive environment and market rankings, the Bank’s performance is
considered reasonable.
Small Business Loans
The Bank’s small business lending was reviewed to assess how well the Bank addressed the
area’s business credit needs. The Bank demonstrated good penetration of loans to businesses
with GARs of $1 million or less. Table 23 illustrates the distribution of small business loans to
businesses with GARs of $1 million or less, and includes aggregate and demographic data for
comparison purposes.
Table 23
Distribution of Small Business Loans by Revenues - Nantucket
GARs $(000s)
Aggregate
Lending
(2012)
Bank 2012 % of Total
Businesses (2013)
Bank 2013
% # % # %
< $1,000 45.6 33 45.8 74.2 44 55.7
> $1,000 54.4
38 52.8 3.7 35 44.3
Not Reported 1 1.4 22.1 0 0.0
Total 100.0 72 100.0 100.0 79 100.0
Source: 2012 Aggregate Data, 2012 and 2013 CRA LRs, and 2013 Dun & Bradstreet Business Data
As shown in Table 23, the Bank originated 33 loans to businesses with GARs of $1 million or
less in 2012. This proportion of loans (45.8 percent) is higher than aggregate data at 45.6
percent.
Cape Cod Five ranked first in lending to businesses with gross annual revenues of $1 million or
less in 2012 among business lenders that do not offer business credit card products. Overall, the
Bank ranked fifth in lending to businesses with GARs less than or equal to $1 million. As
previously noted, all higher-ranked lenders offered small business credit card loans.
Furthermore, the volume and proportion of lending to businesses with GARs of $1 million or
less increased in 2013 to 55.7 percent).
COMMUNITY DEVELOPMENT LENDING
As Cape Cod Five is relatively new to Nantucket, it is difficult to ascertain its leadership in
community developing lending on the island. However, it is noteworthy that during the three
years since establishing a branch on Nantucket, the Bank originated one community
development loan totaling $1.5 million. Specifically, in December 2013, the Bank originated a
loan for $1.5 million to revitalize an underserved middle-income tract through the construction
of 65-lot commercial subdivision on Nantucket. The subdivision will provide much needed
year-round jobs both during and after construction.
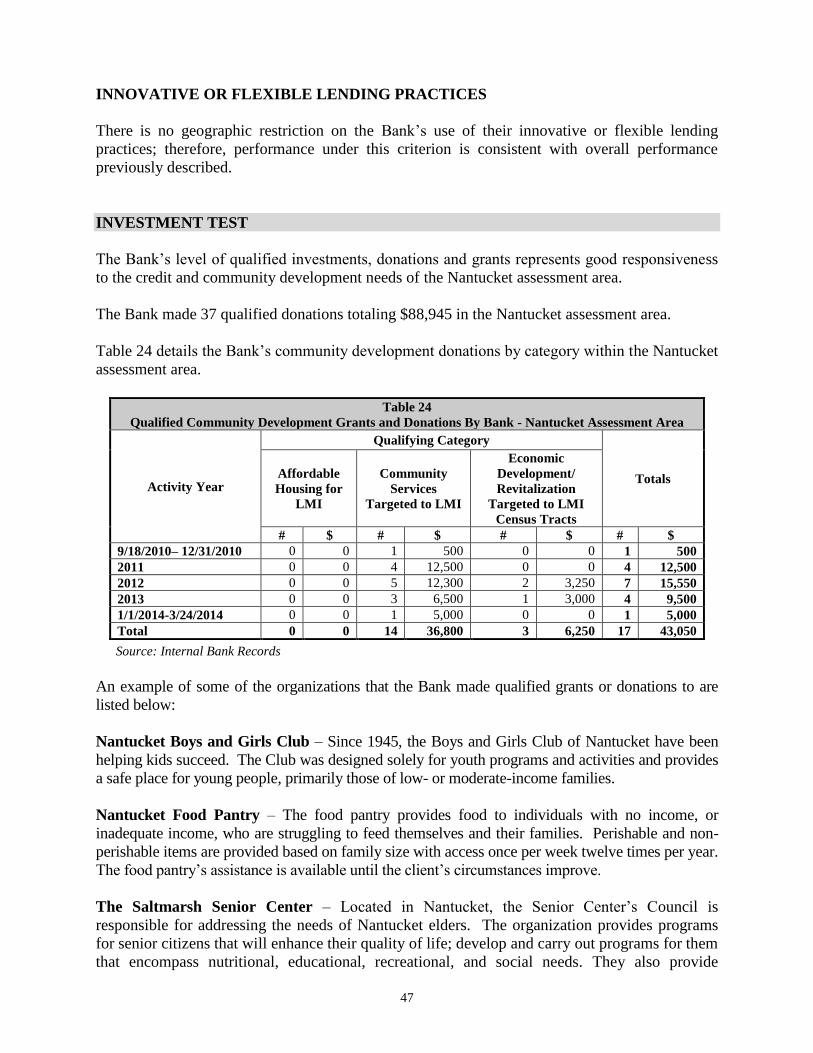
47
INNOVATIVE OR FLEXIBLE LENDING PRACTICES
There is no geographic restriction on the Bank’s use of their innovative or flexible lending
practices; therefore, performance under this criterion is consistent with overall performance
previously described.
INVESTMENT TEST
The Bank’s level of qualified investments, donations and grants represents good responsiveness
to the credit and community development needs of the Nantucket assessment area.
The Bank made 37 qualified donations totaling $88,945 in the Nantucket assessment area.
Table 24 details the Bank’s community development donations by category within the Nantucket
assessment area.
Source: Internal Bank Records
An example of some of the organizations that the Bank made qualified grants or donations to are
listed below:
Nantucket Boys and Girls Club – Since 1945, the Boys and Girls Club of Nantucket have been
helping kids succeed. The Club was designed solely for youth programs and activities and provides
a safe place for young people, primarily those of low- or moderate-income families.
Nantucket Food Pantry – The food pantry provides food to individuals with no income, or
inadequate income, who are struggling to feed themselves and their families. Perishable and non-
perishable items are provided based on family size with access once per week twelve times per year.
The food pantry’s assistance is available until the client’s circumstances improve.
The Saltmarsh Senior Center – Located in Nantucket, the Senior Center’s Council is
responsible for addressing the needs of Nantucket elders. The organization provides programs
for senior citizens that will enhance their quality of life; develop and carry out programs for them
that encompass nutritional, educational, recreational, and social needs. They also provide
Table 24
Qualified Community Development Grants and Donations By Bank - Nantucket Assessment Area
Activity Year
Qualifying Category
Totals Affordable
Housing for
LMI
Community
Services
Targeted to LMI
Economic
Development/
Revitalization
Targeted to LMI
Census Tracts
# $ # $ # $ # $
9/18/2010– 12/31/2010 0 0 1 500 0 0 1 500
2011 0 0 4 12,500 0 0 4 12,500
2012 0 0 5 12,300 2 3,250 7 15,550
2013 0 0 3 6,500 1 3,000 4 9,500
1/1/2014-3/24/2014 0 0 1 5,000 0 0 1 5,000
Total 0 0 14 36,800 3 6,250 17 43,050
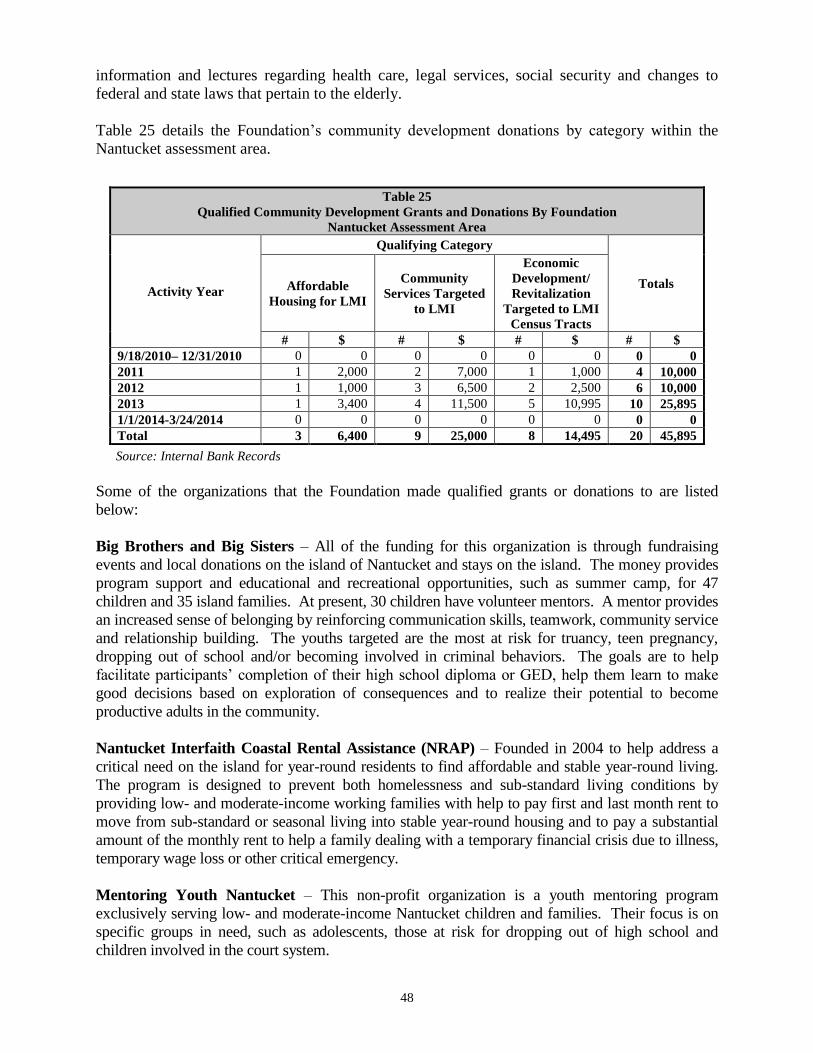
48
information and lectures regarding health care, legal services, social security and changes to
federal and state laws that pertain to the elderly.
Table 25 details the Foundation’s community development donations by category within the
Nantucket assessment area.
Source: Internal Bank Records
Some of the organizations that the Foundation made qualified grants or donations to are listed
below:
Big Brothers and Big Sisters – All of the funding for this organization is through fundraising
events and local donations on the island of Nantucket and stays on the island. The money provides
program support and educational and recreational opportunities, such as summer camp, for 47
children and 35 island families. At present, 30 children have volunteer mentors. A mentor provides
an increased sense of belonging by reinforcing communication skills, teamwork, community service
and relationship building. The youths targeted are the most at risk for truancy, teen pregnancy,
dropping out of school and/or becoming involved in criminal behaviors. The goals are to help
facilitate participants’ completion of their high school diploma or GED, help them learn to make
good decisions based on exploration of consequences and to realize their potential to become
productive adults in the community.
Nantucket Interfaith Coastal Rental Assistance (NRAP) – Founded in 2004 to help address a
critical need on the island for year-round residents to find affordable and stable year-round living.
The program is designed to prevent both homelessness and sub-standard living conditions by
providing low- and moderate-income working families with help to pay first and last month rent to
move from sub-standard or seasonal living into stable year-round housing and to pay a substantial
amount of the monthly rent to help a family dealing with a temporary financial crisis due to illness,
temporary wage loss or other critical emergency.
Mentoring Youth Nantucket – This non-profit organization is a youth mentoring program
exclusively serving low- and moderate-income Nantucket children and families. Their focus is on
specific groups in need, such as adolescents, those at risk for dropping out of high school and
children involved in the court system.
Table 25
Qualified Community Development Grants and Donations By Foundation
Nantucket Assessment Area
Activity Year
Qualifying Category
Totals Affordable
Housing for LMI
Community
Services Targeted
to LMI
Economic
Development/
Revitalization
Targeted to LMI
Census Tracts
# $ # $ # $ # $
9/18/2010– 12/31/2010 0 0 0 0 0 0 0 0
2011 1 2,000 2 7,000 1 1,000 4 10,000
2012 1 1,000 3 6,500 2 2,500 6 10,000
2013 1 3,400 4 11,500 5 10,995 10 25,895
1/1/2014-3/24/2014 0 0 0 0 0 0 0 0
Total 3 6,400 9 25,000 8 14,495 20 45,895
49
SERVICE TEST
The Bank operates two full-service branches located on the island of Nantucket. In addition to
having ATMs at each branch office, the Bank has one off-site ATM inside the Steamship
Authority terminal in Nantucket.
The Bank provides effective community development services in the Nantucket assessment area
as described below.
Sustainable Nantucket – This company is a 501(c)3 non-profit organization that is cultivating a
healthy Nantucket by building a more locally-based and self-reliant food system on-island, and a
strong local economy. These efforts include expanding agricultural demand and production;
increasing access to local food for the community, through our farmers market and in our
restaurants and schools; and educating our community about sustainability. A Branch Manager
is on the Board of Directors to help revitalize this underserved area.
Nantucket Chamber of Commerce – The mission of the Chamber of Commerce is to foster
Nantucket’s economic vitality, while respecting the island’s unique quality of life. For over 75
years, they have been dedicated to promoting the interest of the business community by serving
the needs of their members with benefits including workshops, networking opportunities,
marketing opportunities, local initiatives and legislative advocacy. A Branch Manager is an
Ambassador.
Town of Nantucket, Capital Programs Committee – This Committee works on Nantucket’s
capital improvement plan for projects to strengthen public safety initiatives, update
infrastructure, and address some of the town’s most pressing needs. The Committee reviews and
recommends spending for large scale municipal projects and has been meeting to try to develop a
ten year plan for sewer and wastewater improvements. The Regional Relationship Manager has
been the Vice Chairman and is now Chairman.
Nantucket Community Services, Inc. – Established in 1983, this organization offers urban and
city planning which is a technical and political process concerned with the use of land and design
of the urban environment, including transportation networks to guide and ensure the orderly
development of the community. A Commercial Loan Officer is the President and is on the
Board of Directors.
The Cape and Islands Workforce Investment Board (C&I WIB) - C&I WIB is a regional,
private sector-led agency responsible for overseeing all publicly funded vocational education and
training programs. The WIB is organized as a private non-profit 501 c (3) corporation, formed to
carry out the mandates of the federal Workforce Investment Act of 1998. The chief role of the
WIB is to ensure that public sector investments in education and training match up with local
private sector needs. To meet this role, the WIB guides the formation of a regional workforce
development system, serving as a major link between the region’s economic development
agencies, training providers, educational institutions, and employers. The WIB develops a
blueprint that analyzes the needs and gaps in the local labor market, the types of training that are
needed, and the size and characteristics of the population to be served. A Commercial Loan
Officer and Regional Manager has been the Treasurer and is currently the Chairman of this
organization.
A-1
APPENDIX A
Fair Lending Policies and Practices
The Division of Banks provides comments regarding the institution’s fair lending policies and
procedures pursuant to Regulatory Bulletin 1.3-106.
The Bank has a written Fair Lending Policy. The Bank proactively and affirmatively supports
the fair lending process through fair, but flexible lending policies.
The Bank provides ongoing educational opportunities to employees, members of the Board and
management on fair lending regulations and cultural diversity.
The Bank employs a second review process. All residential loans being recommended for denial are
reviewed by the Second Review Committee. The Second Review Committee consists of the
President and CEO, Senior Commercial Lender, CFO, and COO, or their designees. Two members
of the Committee will review all denied applications and make a final decision.
The Bank makes exceptions to the loan policy. All policy exceptions must be approved by the
next higher lending authority or the Loan Committee, and must be in writing. All exceptions
must be documented and placed in the credit file. All exceptions are tracked by the Credit
Committee and are provided to the Loan Committee and the Board of Trustees on a quarterly
basis for review.
MINORITY APPLICATION FLOW
The Bank’s LARs for 2012 and 2013 were reviewed to determine if the application flow from the
different racial groups within the Bank’s assessment area was reflective of the assessment areas
demographics.
According to the 2010 U.S. Census Data, the Bank’s two assessment areas contained a total
population of 226,060 individuals of which 9.1 percent are minorities. The assessment areas
minority and ethnic population is 2.0 percent Black/African American, 1.1 percent Asian, 0.5 percent
American Indian, 0.0 percent Hawaiian/Pacific Islander, 2.5 percent Hispanic or Latino and 3.0
percent other.
For 2012 and 2013, the Bank received 6,509 HMDA reportable loan applications from within its
assessment area. Of these applications, 102 or 1.6 percent were received from minority applicants.
The Bank also received 48 or 0.7 percent, applications from ethnic groups of Hispanic origin within
its assessment area.
The Bank’s level of lending was compared with that of the aggregate’s lending performance levels
for the most recent year that data was available, the year 2012. The comparison of this data assists in
deriving reasonable expectations for the rate of applications the Bank received from minority
residential loan applicants. Refer to the table below for information on the Bank’s minority
application flow as well as the aggregate lenders in the Bank’s assessment area.
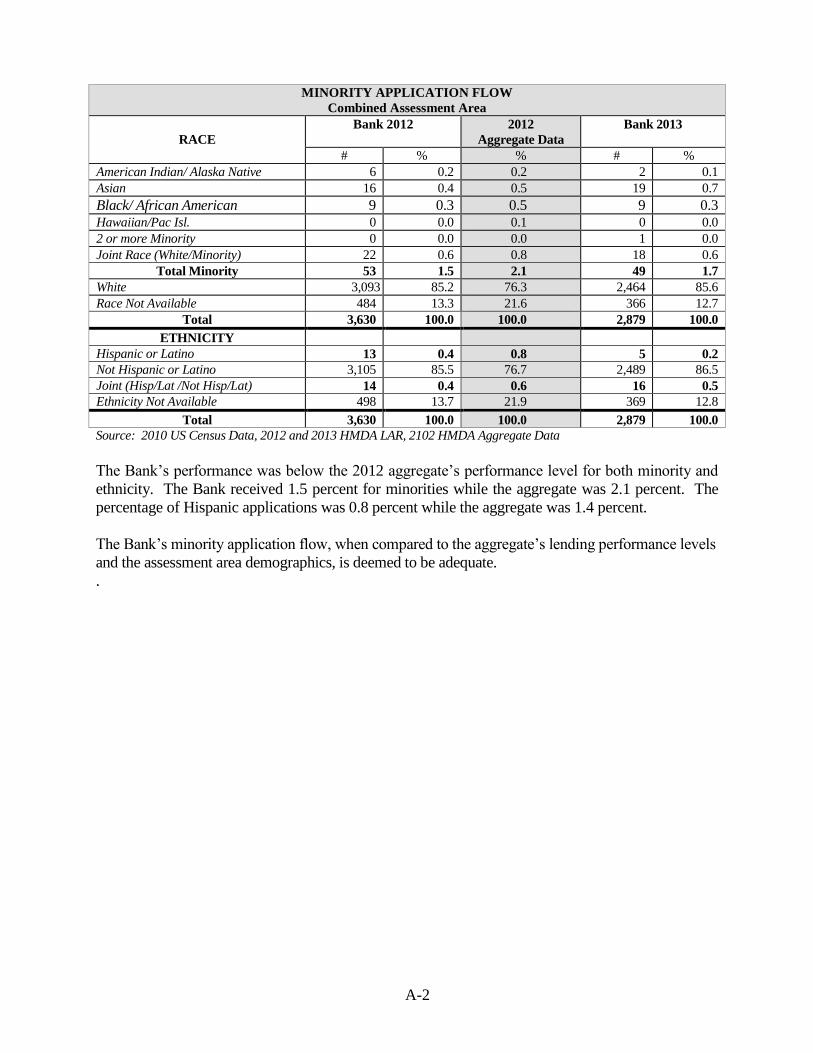
A-2
MINORITY APPLICATION FLOW
Combined Assessment Area
RACE
Bank 2012 2012
Aggregate Data
Bank 2013
# % % # %
American Indian/ Alaska Native 6 0.2 0.2 2 0.1
Asian 16 0.4 0.5 19 0.7
Black/ African American 9 0.3 0.5 9 0.3 Hawaiian/Pac Isl. 0 0.0 0.1 0 0.0
2 or more Minority 0 0.0 0.0 1 0.0
Joint Race (White/Minority) 22 0.6 0.8 18 0.6
Total Minority 53 1.5 2.1 49 1.7
White 3,093 85.2 76.3 2,464 85.6
Race Not Available 484 13.3 21.6 366 12.7
Total 3,630 100.0 100.0 2,879 100.0
ETHNICITY
Hispanic or Latino 13 0.4 0.8 5 0.2
Not Hispanic or Latino 3,105 85.5 76.7 2,489 86.5
Joint (Hisp/Lat /Not Hisp/Lat) 14 0.4 0.6 16 0.5
Ethnicity Not Available 498 13.7 21.9 369 12.8
Total 3,630 100.0 100.0 2,879 100.0
Source: 2010 US Census Data, 2012 and 2013 HMDA LAR, 2102 HMDA Aggregate Data
The Bank’s performance was below the 2012 aggregate’s performance level for both minority and
ethnicity. The Bank received 1.5 percent for minorities while the aggregate was 2.1 percent. The
percentage of Hispanic applications was 0.8 percent while the aggregate was 1.4 percent.
The Bank’s minority application flow, when compared to the aggregate’s lending performance levels
and the assessment area demographics, is deemed to be adequate.
.
B-1
APPENDIX B
Loss of Affordable Housing – Massachusetts Division of Banks
The Division of Banks’ regulation 209 CMR 46.22(2)(g) requires that the evaluation of the
lending performance of a large institution include a review of its efforts to forestall the loss of
affordable housing. The Division reviews the institution's loans to ensure that there is no undue
concentration and a systematic pattern of lending resulting in the loss of affordable housing
units.
Cape Cod Five’s development of credit products with flexible lending criteria, participation in
flexible lending programs, community development lending, and lending to low- and moderate-
income borrowers has assisted low- and moderate-income individuals to remain in their
neighborhoods.

C-1
APPENDIX C
General Definitions
GEOGRAPHY TERMS
Census Tract: Small subdivisions of metropolitan and other densely populated counties.
Census tract boundaries do not cross county lines; however, they may cross the boundaries of
metropolitan statistical areas. They usually have between 2,500 and 8,000 persons, and their
physical size varies widely depending upon population density. Census tracts are designed to be
homogeneous with respect to population characteristics, economic status, and living conditions
to allow for statistical comparisons.
Metropolitan Area (MA): One or more large population centers and adjacent communities that
have a high degree of economic and social integration. Each MA must contain either a place
with a minimum population of 50,000 of Census Bureau-defined urbanized area and a total MA
population of at least 100,000 (75,000 in New England). An MA comprises one or more central
counties and may include one or more outlying counties that have close economic and social
relationships with the central county. In New England, MAs are composed of cities and towns
rather than whole counties.
Metropolitan Statistical Area (MSA): One or more metropolitan areas that have economic and
social ties.
Primary Metropolitan Statistical Area (PMSA): A large urbanized county or cluster of
counties that demonstrate very strong internal economic and social links, in addition to close ties
to other portions of the larger area. If an area qualifies as an MA and has more than one million
persons, PMSAs may be defined within it.
Consolidated Metropolitan Statistical Area (CMSA): The larger area of which PMSAs are
component parts.
Non-Metropolitan Area: All areas outside of metropolitan areas. The definition of non-
metropolitan area is not consistent with the definition of rural areas. Urban and rural
classifications cut across the other hierarchies; for example, there is generally both urban and
rural territory within both metropolitan and non-metropolitan areas.
Urban Area: All territories, populations, and housing units in urbanized areas and in places of
2,500 or more persons outside urbanized areas. More specifically, “urban” consists of territory,
persons, and housing units in: places of 2,500 or more persons incorporated as cities, villages,
boroughs (except in Alaska and New York), and towns (except in the New England states, New
York, and Wisconsin) but excluding the rural portions of “extended cities”; census designated
place of 2,500 or more persons; and other territory, incorporated or unincorporated, including in
urbanized areas.
HOUSING TERMS
Family: Includes a householder and one or more other persons living in the same household who
are related to the householder by birth, marriage, or adoption. The number of family households
always equals the number of families; however, a family household may also include non-
C-2
relatives living with the family. Families are classified by type as either a married-couple family
or other family which is further classified into “male householder” (a family with a male
householder and no wife present) or “female householder” (a family with a female householder
and no husband present).
Household: Includes all persons occupying a housing unit. Persons not living in households are
classified as living in group quarters. In 100 percent tabulations, the count of households always
equals the count of occupied housing units.
Housing Unit: Includes a house, an apartment, a mobile home, a group of rooms, or a single
room that is occupied as separate living quarters.
Owner-Occupied Units: Includes units occupied by the owner or co-owner, even if the unit has
not been fully paid for or is mortgaged.
INCOME TERMS
Median Income: The median income divides the income distribution into two equal parts, one
having incomes above the median and other having incomes below the median.
Area Median Income: The median family income for the MSA, if a person or geography is
located in an MSA; or the statewide non-metropolitan median family income, if a person or
geography is located outside an MSA.
Family Income: Includes the income of all members of a family that are age 15 and older.
Household Income: Includes the income of the householder and all other persons that are age 15
and older in the household, whether related to the householder or not. Because many households
consist of only one person, median household income is usually less than median family income.
Low-Income: Individual income that is less than 50 percent of the area median income, or a
median family income that is less than 50 percent in the case of geography.
Moderate-Income: Individual income that is at least 50 percent and less than 80 percent of the
area median income, or a median family income that is at least 50 and less than 80 percent in the
case of a geography.
Middle-Income: Individual income that is at least 80 percent and less than 120 percent of the
area median income, or a median family income that is at least 80 and less than 120 percent in
the case of a geography.
Upper-Income: Individual income that is more than 120 percent of the area median income, or a
median family income that is more than 120 percent in the case of a geography.
HUD Adjusted Income Data: The U.S. Department of Housing and Urban Development
(HUD) issues annual estimates which update median family income from the metropolitan and
non-metropolitan areas. HUD starts with the most recent U.S. Census data and factors in
information from other sources to arrive at an annual estimate that more closely reflects current
economic conditions.
C-3
OTHER TERMS
Home Mortgage Disclosure Loan Application Register (HMDA LAR): The HMDA LARs
record all applications received for residential purchase, refinance, home improvement and
temporary-to-permanent construction loans.
Small Business Loan: A loan included in “loans to small businesses” as defined in the
Consolidated Report of Condition and Income (Call Report). These loans have original amounts
of $1 million or less and are either secured by nonfarm nonresidential properties or are classified
as commercial and industrial loans.
Small Farm Loan: A loan included in “loans to small farms” as defined in the instructions for
preparation of the Consolidated Report of Condition and Income (Call Report). These loans
have original amounts of $500,000 or less and are either secured by farmland, including farm
residential and other improvements, or are classified as loans to finance agricultural production
and other loans to farmers.
D-1
APPENDIX D
Investment Definitions
Community Development Corporation (CDC): A CDC allows banks and holding companies
to make equity type of investments in community development projects. The equity investments
are subject to limits specified by the Bank’s regulator. Bank CDCs can develop innovative debt
instruments or provide near-equity investments tailored to the development needs of the
community as well as to the financial and marketing needs of the Bank. A CDC may purchase,
own, rehabilitate, construct, manage and sell real property. Also, it may make equity or debt
investments in development projects and in local businesses. The CDC activities are expected to
directly benefit low- and moderate-income groups, and the investment dollars should not
represent an undue risk on the banking organization. Any real estate ownership should generally
be temporary, with ownership reverting to members or organizations in the community.
Community Development Financial Institutions (CDFIs): CDFIs are private intermediaries
(either for profit or non-profit) with community development as their primary mission. They
procure loans and investments that conventional financial institutions are unable to invest in, and
they link financing to other developmental activities. A CDFI facilitates the flow of lending and
investment capital into distressed communities and to individuals who have been unable to take
advantage of the services offered by traditional financial institutions. CDFIs share a common
mission and can be chartered as a credit union or bank. CDFIs can also be unregulated non-
profit institutions that gather private capital from a range of social investors for community
development lending or investing. Some basic types of CDFIs include community development
banks, community development loan funds, community development credit unions,
microenterprise funds, and community development venture capital funds. A certified CDFI
must meet eligibility requirements, which include: having a primary mission of promoting
community development; serving an investment area or target population; providing
development services; maintaining accountability to residents of its investment area or targeted
population through representation on its governing board of directors, or by other means; and not
constituting an agency or instrumentality of the United States, of any state or political
subdivision of a state.
Low Income Housing Tax Credits: The Low-Income Housing Tax Credit Program is a
housing program contained within the Internal Revenue Code of 1986, as amended, which is
administered by the U.S. Department of the Treasury and the Internal Revenue Service. The
U.S. Treasury Department, through the Internal Revenue Service, distributes low-income
housing tax credits to housing credit agencies. The housing agencies allocate tax credits on a
competitive basis. Developers who acquire, rehabilitate, or construct low-income rental housing
may keep their tax credits or sell them to corporations or investor groups, who, as owners of
these properties, will be able to reduce their own federal tax payments. The credit can be
claimed annually for ten consecutive years. For a project to be eligible, the developer must set
aside a specific percentage of units for occupancy by low-income residents. The set-aside
requirement remains in place throughout the compliance period, usually 30 years.
Qualified Investments: A qualified investment is defined as any lawful investment, deposit,
membership share, or grant that has as its primary purpose community development to support
the following endeavors: 1) affordable housing; 2) community services targeting low- and
moderate-income individuals; 3) activities that promote economic development by financing
small farms and small businesses; and 4) activities that revitalize or stabilize low- and moderate-
income geographies.
E-1
APPENDIX E
Standard Public Evaluation Language
LENDING TEST
Scope of Test
The lending test evaluates the institution's record of helping to meet the credit needs of its
assessment area(s) by considering an institution's home mortgage, small business, small farm,
and community development lending. The institution's lending performance is evaluated
pursuant to the following criteria: 1) the volume of lending activity; 2) the proportion of lending
within the assessment area(s); 3) the dispersion of loans and the number and amount of loans in
low-, moderate-, middle- and upper-income geographies in the assessment area(s); 4) the
distribution of loans among borrowers of low-, moderate-, middle- and upper-income levels and
businesses (including farms) of different sizes; 5) the distribution of small business and small
farm loans by loan amount at origination; 6) the volume of community development lending; and
7) the use of innovative or flexible lending practices. Performance under the lending test is
weighted more heavily than the investment and service tests when arriving at an overall rating.
Community Development Lending:
Performance Criteria
The institution's community development lending activities are evaluated pursuant to the
following criteria: 1) the extent to which community development lending opportunities have
been made available to the institution; 2) the responsiveness of the institution's community
development lending; and 3) the extent of leadership the institution has demonstrated in
community development lending.
Innovative and Flexible Lending Practices:
Performance Criteria
The institution's innovative and flexible lending practices are evaluated pursuant to the following
criteria: 1) the degree to which the loans serve low- and moderate-income creditworthy
borrowers in new ways or serve groups of creditworthy borrowers not previously served by the
institution; and 2) the success of each product serving low- and moderate-income borrowers,
including the number and dollar volume of loans originated during the review period.
INVESTMENT TEST
Scope of Test
The investment test evaluates the institution's record of helping to meet the credit needs of its
assessment area(s) through its use of qualified investments that benefit the assessment area(s) or
a broader statewide or regional area that includes the institution's assessment area(s). Activities
considered under the lending or service test may not be considered under the investment test.
The institution's investment performance is evaluated pursuant to the following criteria: 1) the
dollar amount of qualified investments; 2) the innovativeness or complexity of qualified
E-2
investments; 3) the responsiveness of qualified investments to credit and community
development needs; and 4) the degree to which the qualified investments are not routinely
provided by private investors.
SERVICE TEST
Scope of Test
The service test evaluates the institution's record of helping to meet the credit needs of its
assessment area(s) by analyzing both the availability and effectiveness of the institution's
systems for delivering retail banking services and the extent and innovativeness of its community
development services. The institution's retail banking services are evaluated pursuant to the
following criteria: 1) the distribution of the institution's branches among geographies of different
income levels; 2) the record of opening and closing branches, particularly branches located in
low- and moderate-income geographies or that primarily serve low- or moderate-income
individuals; 3) the availability and effectiveness of alternate systems for delivering retail banking
services; and 4) the range of services provided in low-, moderate-, middle-, and upper-income
geographies and the degree to which the services are tailored to meet the needs of those
geographies.
In addition, the institution's community development services are evaluated pursuant to the
following criteria: 1) the extent of community development services offered and used; 2) the
innovativeness of community development services, including whether they serve low- and
moderate-income customers in new ways or serve groups of customers not previously served; 3)
the degree to which they serve low- and moderate-income areas or individuals; and 4) their
responsiveness to available opportunities for community development services.
PERFORMANCE EVALUATION DISCLOSURE GUIDE
Massachusetts General Laws Chapter 167, Section 14, as amended, and the Uniform
Interagency Community Reinvestment Act (CRA) Guidelines for Disclosure of
Written Evaluations, and Part 345 of the Federal Deposit Insurance Corporation’s
Rules and Regulations, require all financial institutions to take the following actions
within 30 business days of receipt of the CRA evaluation of their institution:
1) Make its most current CRA performance evaluation available to the public;
2) At a minimum, place the evaluation in the institution's CRA public file located
at the head office and at a designated office in each assessment area;
3) Add the following language to the institution's required CRA public notice
that is posted in each depository facility:
"You may obtain the public section of our most recent CRA Performance
Evaluation, which was prepared by the Massachusetts Division of Banks and
the Federal Deposit Insurance Corporation, at 532 Main Street, Harwich Port,
MA 02646”.
[Please Note: If the institution has more than one assessment area, each office
(other than off-premises electronic deposit facilities) in that community shall
also include the address of the designated office for that assessment area.]
4) Provide a copy of its current evaluation to the public, upon request. In
connection with this, the institution is authorized to charge a fee which does
not exceed the cost of reproduction and mailing (if applicable).
The format and content of the institution's evaluation, as prepared by its supervisory
agencies, may not be altered or abridged in any manner. The institution is
encouraged to include its response to the evaluation in its CRA public file.