Embed Size (px)
Citation preview
1723
Journal of Applied Social Psychology, 2006, 36, 7, pp. 1723–1743.r 2006 Copyright the Authors
Journal compilation r 2006 Blackwell Publishing, Inc.
Progress Takes Work: Effects of the Locomotion Dimension
on Job Involvement, Effort Investment, and
Task Performance in Organizations1
ANTONIO PIERRO
Universita di Roma, La Sapienza
ARIE W. KRUGLANSKI2
University of Maryland, College Park
E. TORY HIGGINS
Columbia University
This research examined the relation between individual differences in the tendency
toward locomotion, which is defined as a proclivity toward psychological move-
ment; and job involvement, effort commitment, and performance in organizational
contexts. Four separate studies found support for the notion that locomotion is
related positively to effort investment in work activities. Locomotion also was
related positively to job involvement and successful performance, as assessed by a
self-report measure and by manager ratings. Finally, the positive relation between
locomotion and effort was mediated partially by job involvement, and the positive
relation between locomotion and performance was mediated by effort investment.
These findings are discussed in reference to the varied implications of the locomo-
tion dimension for human functioning in organizations.
Every self-regulatory activity involves movement in the psychologicalsense of the term. Each task has a beginning, a middle, and an end. It isinitiated, continued, and concluded. And the common speech about self-regulation contains key terms that betoken motility, such as advancement,progress, or headway; and the lack thereof, such as stagnation, feet dragging,or passivity.
The proclivity toward movement constitutes a psychological continuum,whose existence, as a dimension of individual differences, hardly has escapedthe notice of lay observers, though it has been relatively neglected by psy-chology as a science. Again, the common vernacular provides a testimonyto such awareness via epitaphs such as restless, man (or woman) of action,
1This work was supported by NSF Grant SBR-9417422.2Correspondence concerning this article should be addressed to Arie W. Kruglanski,
Department of Psychology, University of Maryland, College Park, MD 20742. E-mail:[email protected]
go-getter, or mover-and-shaker to characterize individuals high on the di-mension; and sluggish, lackadaisical, phlegmatic, or laggard to characterizeindividuals low on the dimension.
Recently, we (Higgins & Kruglanski, 1995; Higgins, Kruglanski, &Pierro, 2003; Kruglanski et al., 2000) have referred to the foregoingpsychological continuum as one of locomotion and constructed an individ-ual-difference measure to assess it. The purpose of the present work is toinvestigate how the locomotion variable affects individuals’ conduct in worksettings, including such pivotal aspects of work-related functioning as jobinvolvement, effort expenditure, and, ultimately, job performance.
Locomotion as a Psychological Dimension
The term locomotion refers to ‘‘moving from place to place’’ (Webster,1989, p. 701). According to field theory (see Deutsch, 1968; Lewin, 1951),locomotion concerns any change of position occurring in any region what-ever within the life space. Thus, the main concern of persons high on thelocomotion function is simply to move, in an experiential sense. To theextent that goals are ends toward which effort is directed, or terminal pointsin relation to which movement is referred, then goals are associated with thelocomotion function.
However, as just noted, the locomotors’ motivation is simply to expe-rience movement. In this sense, the goal may be the epiphenomenal con-sequence, rather than the true cause of the activity. Thus, for high (vs. low)locomotors, activities may be prompted because a task affords movement.In this particular sense, they are intrinsically motivated, rather than con-stituting extrinsic means to minimize the discrepancy between the currentstate and some desired end state (cf. Pierro, Kruglanski, & Higgins, inpress). To put it differently, high (vs. low) locomotors may be involved morehighly in their jobs and more concerned with advancement and progresstoward their objectives.
Kruglanski et al. (2000) measured locomotion as an individual-differencedimension via a 12-item questionnaire including statements such as ‘‘I don’tmind doing things even if they involve extra effort’’ and ‘‘I enjoy activelydoing things, more than just watching and observing.’’ These items wererated on a 6-point Likert-type scale ranging from 1 (strongly disagree)to 6 (strongly agree). This measure was found to exhibit good reliability(Cronbach’s as ranging from .79 to .84), as well as considerable convergentand discriminant validity (Kruglanski et al., 2000).
Among others, locomotion exhibited moderate associations, attesting toconvergent validity, with measures of commitment to prompt action, the
1724 PIERRO ET AL.
ability to stay focused on a task, psychological vitality or energy, the Type-Abehavior pattern, achievement orientation, conscientiousness, extroversion,action control, functional impulsivity, and decisiveness. Locomotion exhibitedno systematic relations to (attesting to discriminant validity from) politicalorientation, social dominance orientation, in-group favoritism, age, and gen-der. Also relevant to the discriminant validity of the locomotion scale, therelation of locomotion to any of the variables studied remained unchangedwhile controlling for the Big Five personality factors (Costa & McCrae, 1985).
Beyond its relation to other personality measures, the locomotion ten-dency was found to predict behavior. Specifically, locomotion was relatedpositively to completion speed in a proofreading task (Kruglanski et al.,2000, Study 9), and to speed of choosing the (subjectively) best means to thegoal (Kruglanski et al., 2000, Study 10). Locomotion also was related pos-itively to college students’ grade point averages (GPAs, controlling forSATs; Kruglanski et al., 2000, Study 7), it predicted a successful completionof elite military training (Kruglanski et al., 2000, Study 8), and it mediatedthe relation between intentions and overt behavior (Higgins et al., 2003).
Finally, it was found that the locomotion tendency could be inducedsituationally with the appropriate consequences for behavior. Avnet andHiggins (2003) experimentally instilled the locomotion orientation by havingparticipants give an example for each of three types of behavior taken fromthe locomotion scale of Kruglanski et al. (2000), such as ‘‘Think back to thetimes when you decided to do something and you couldn’t wait to getstarted.’’ Participants then were given a decision-making task in which theychose among different brands of reading lights. They were assigned either afull-evaluation strategy wherein one considers all of the alternatives and allof the attribute values for each alternative, or a progressive-eliminationstrategy that looks at the first evaluative attribute and eliminates whicheverbrand has the worst value for that attribute. Avnet and Higgins predictedthat the progressive-elimination strategy would give the decision maker astronger sense of movement, hence that the preference for it would be cor-related positively with the locomotion tendency. This is precisely what wasfound, even though the same brand of light was clearly the superior one andhence was chosen in both cases. In summary, then, growing evidence atteststhat locomotion represents a reliable and valid psychological construct thatfigures as a dimension of individual differences as well as a situationallyinducible state, and is connected in systematic ways to other relevant traitsand behaviors.
The emphasis on doing, which is characteristic of high locomotors, alsoshould affect their tendency to commit effort to the execution of work-related tasks. Doing, after all, consists in the investment of energy in ac-tivities, including the expenditure of physical effort on various types of
LOCOMOTION AND TASK PERFORMANCE 1725
legwork that carrying out projects typically involves. Such effort investmentshould be directly proportionate to and, in fact, should be mediated by one’sdegree of job involvement; which, in turn, should be proportionate to one’sstanding on the locomotion dimension.
A final link concerns the expected positive relation between effort in-vestment and performance success. All else being equal, the harder one tries,the more successful should one be. Indeed, previous research has demon-strated reliably a positive relation between effort and performance (e.g.,Blau, 1993; Brown & Leigh, 1996). In summary, then, we predict that thestrength of one’s locomotion tendency will determine one’s degree of jobinvolvement, in turn affecting one’s degree of effort investment in work-related activities, which may contribute positively to performance success.
These hypotheses are tested in the research described subsequently. Weconducted four separate studies to test our ideas. The first study, conductedon three different samples, examines the basic relation between individualdifferences in locomotion and the tendency to commit effort to work activ-ities. The second study investigates whether individual differences in locomo-tion are related positively to job involvement and whether differential jobinvolvement mediates the relation between locomotion and effort. The thirdand fourth studies look at the relation between locomotion, effort, and per-formance, including subjective own ratings (Study 3) as well as manager rat-ings of employees’ performance (Study 4). Finally, the fourth study which alsoincludes a measure of job involvement, examines the entire sequence, com-mencing with one’s standing on the locomotion dimension through jobinvolvement and effort investment, as these may ultimately impact task per-formance.
Study 1: Locomotion and Effort
As noted earlier, our first study consists of three separate samples andexamines the relation between locomotion and effort investment in workactivities.
Method
Participants: Sample A
Two hundred and thirty-seven state employees (Ministry of Education)in Rome, Italy (111 men, 118 women, 8 persons did not report their gender)participated in the study on a voluntary basis. Their mean age was 45.44years (SD5 9.95). Twenty participants had a primary school education (of8 years), 155 had a high school education (of 13 years), 50 had college
1726 PIERRO ET AL.
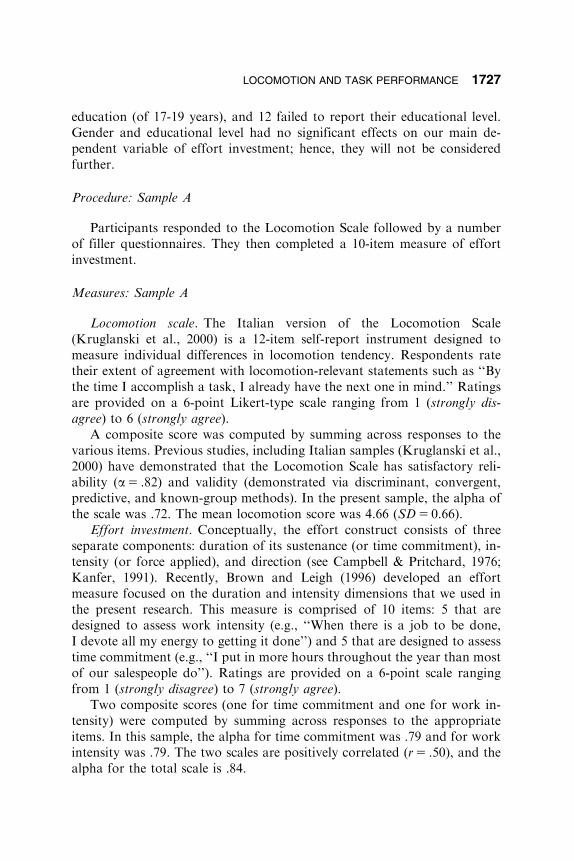
education (of 17-19 years), and 12 failed to report their educational level.Gender and educational level had no significant effects on our main de-pendent variable of effort investment; hence, they will not be consideredfurther.
Procedure: Sample A
Participants responded to the Locomotion Scale followed by a numberof filler questionnaires. They then completed a 10-item measure of effortinvestment.
Measures: Sample A
Locomotion scale. The Italian version of the Locomotion Scale(Kruglanski et al., 2000) is a 12-item self-report instrument designed tomeasure individual differences in locomotion tendency. Respondents ratetheir extent of agreement with locomotion-relevant statements such as ‘‘Bythe time I accomplish a task, I already have the next one in mind.’’ Ratingsare provided on a 6-point Likert-type scale ranging from 1 (strongly dis-agree) to 6 (strongly agree).
A composite score was computed by summing across responses to thevarious items. Previous studies, including Italian samples (Kruglanski et al.,2000) have demonstrated that the Locomotion Scale has satisfactory reli-ability (a5 .82) and validity (demonstrated via discriminant, convergent,predictive, and known-group methods). In the present sample, the alpha ofthe scale was .72. The mean locomotion score was 4.66 (SD5 0.66).
Effort investment. Conceptually, the effort construct consists of threeseparate components: duration of its sustenance (or time commitment), in-tensity (or force applied), and direction (see Campbell & Pritchard, 1976;Kanfer, 1991). Recently, Brown and Leigh (1996) developed an effortmeasure focused on the duration and intensity dimensions that we used inthe present research. This measure is comprised of 10 items: 5 that aredesigned to assess work intensity (e.g., ‘‘When there is a job to be done,I devote all my energy to getting it done’’) and 5 that are designed to assesstime commitment (e.g., ‘‘I put in more hours throughout the year than mostof our salespeople do’’). Ratings are provided on a 6-point scale rangingfrom 1 (strongly disagree) to 7 (strongly agree).
Two composite scores (one for time commitment and one for work in-tensity) were computed by summing across responses to the appropriateitems. In this sample, the alpha for time commitment was .79 and for workintensity was .79. The two scales are positively correlated (r5 .50), and thealpha for the total scale is .84.
LOCOMOTION AND TASK PERFORMANCE 1727
Participants: Sample B
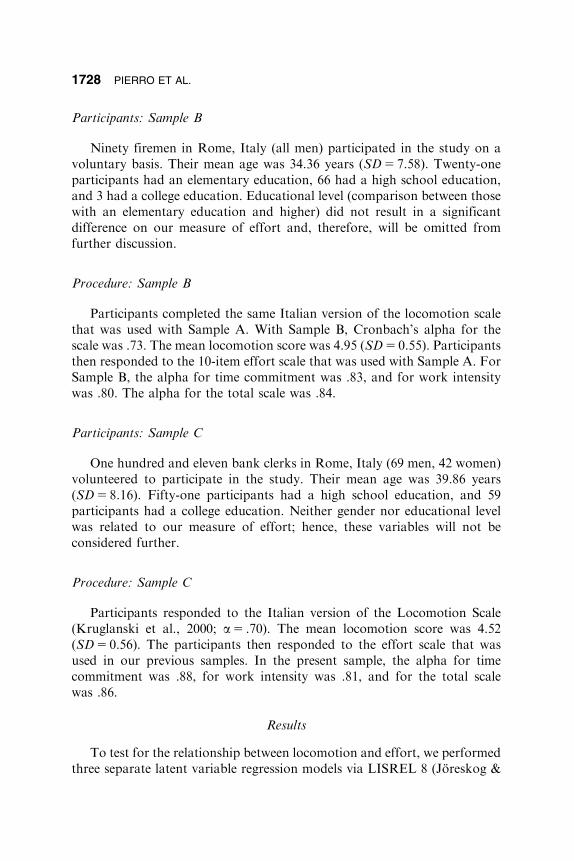
Ninety firemen in Rome, Italy (all men) participated in the study on avoluntary basis. Their mean age was 34.36 years (SD5 7.58). Twenty-oneparticipants had an elementary education, 66 had a high school education,and 3 had a college education. Educational level (comparison between thosewith an elementary education and higher) did not result in a significantdifference on our measure of effort and, therefore, will be omitted fromfurther discussion.
Procedure: Sample B
Participants completed the same Italian version of the locomotion scalethat was used with Sample A. With Sample B, Cronbach’s alpha for thescale was .73. The mean locomotion score was 4.95 (SD5 0.55). Participantsthen responded to the 10-item effort scale that was used with Sample A. ForSample B, the alpha for time commitment was .83, and for work intensitywas .80. The alpha for the total scale was .84.
Participants: Sample C
One hundred and eleven bank clerks in Rome, Italy (69 men, 42 women)volunteered to participate in the study. Their mean age was 39.86 years(SD5 8.16). Fifty-one participants had a high school education, and 59participants had a college education. Neither gender nor educational levelwas related to our measure of effort; hence, these variables will not beconsidered further.
Procedure: Sample C
Participants responded to the Italian version of the Locomotion Scale(Kruglanski et al., 2000; a5 .70). The mean locomotion score was 4.52(SD5 0.56). The participants then responded to the effort scale that wasused in our previous samples. In the present sample, the alpha for timecommitment was .88, for work intensity was .81, and for the total scalewas .86.
Results
To test for the relationship between locomotion and effort, we performedthree separate latent variable regression models via LISREL 8 (Joreskog &
1728 PIERRO ET AL.
Sorbom, 1993): one for each sample. In the latent variable modeling ap-proach, measurement error is taken into account; hence, regression param-eter estimates are corrected for error.
The models tested were specified as partial disaggregation models(Bagozzi & Heatherton, 1994) that use aggregates of items to form two ormore indicators per construct. Partial disaggregation models reduce thenumber of observed variables included in latent variable models, whichaccommodates modeling with smaller sample sizes and reduces the likeli-hood of computational problems. Moreover, the aggregation procedure re-duces measurement error in the observed indicators (Bagozzi, 1993; Bentler,1989).
For the latent locomotion construct, we computed two manifest indi-cators formed as the sum of six items (6 � 2) using the split-half pro-cedure. For the latent effort construct, we used as manifest indicatorsthe two composite measures of time commitment and work intensity.Goodness of fit of the models was evaluated via several different indexes: chisquare, comparative fit index (CFI), and root mean square residual(RMSR), as recommended by various sources (cf. Bollen, 1989; Tanaka,1993).
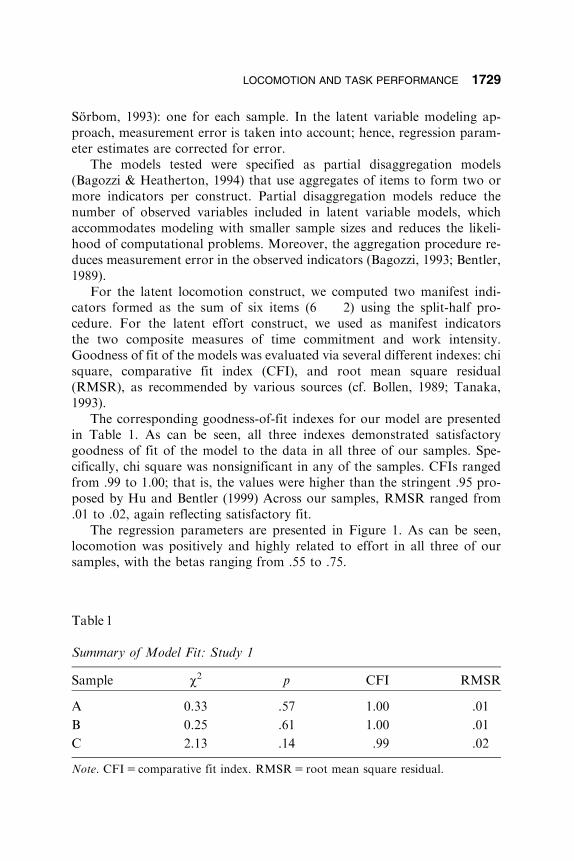
The corresponding goodness-of-fit indexes for our model are presentedin Table 1. As can be seen, all three indexes demonstrated satisfactorygoodness of fit of the model to the data in all three of our samples. Spe-cifically, chi square was nonsignificant in any of the samples. CFIs rangedfrom .99 to 1.00; that is, the values were higher than the stringent .95 pro-posed by Hu and Bentler (1999) Across our samples, RMSR ranged from.01 to .02, again reflecting satisfactory fit.
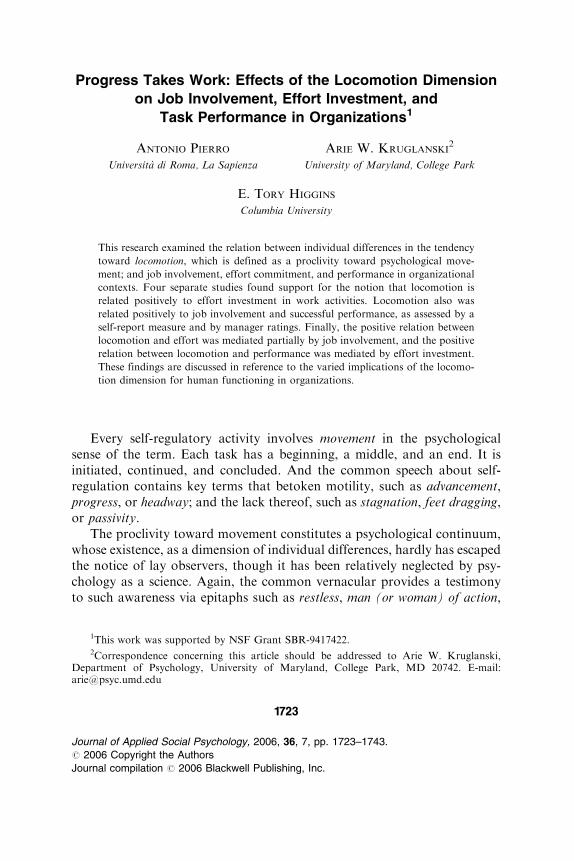
The regression parameters are presented in Figure 1. As can be seen,locomotion was positively and highly related to effort in all three of oursamples, with the betas ranging from .55 to .75.
Table 1
Summary of Model Fit: Study 1
Sample w2 p CFI RMSR
A 0.33 .57 1.00 .01
B 0.25 .61 1.00 .01
C 2.13 .14 .99 .02
Note. CFI5 comparative fit index. RMSR5 root mean square residual.
LOCOMOTION AND TASK PERFORMANCE 1729
Discussion
The data earlier provide strong and consistent support for the relationbetween the locomotion dimension of individual differences and the (self-ascribed) exertion of effort in work contexts. These results obtained in allthree of our samples that differed substantially in participants’ occupation,their age (mid-40s in the first sample, mid-30s in the second sample, and late30s in the third sample), their gender, and their occupational level. Thus, thebasic relationship between locomotion and effort exertion seems to be es-tablished robustly by our initial study. What remains to be investigated are(a) the specific mediators of this relationship, and (b) its consequences forperformance. In the research that follows, we proceeded to study both.
Study 2: Job Involvement as a Mediator of the Relation BetweenLocomotion and Effort
In prior studies (Higgins et al., 2003; Kruglanski et al., 2000; Pierro,Kruglanski, & Higgins, 2004), we hypothesized and observed a strong andpositive relation between locomotion and intrinsic motivation. High (vs.low) locomotors are attracted primarily by the opportunity for doing. Asvarious tasks provide such an opportunity, they appeal to locomotors intheir own right and without much concern about ulterior and extrinsic rea-sons for performance.
Locomotion
Loc 1 Loc 2
.84 b .79 a
.73 c
.77 b .74 a
.74 c
Effort
TC WI
.90 b .80 a
.70 c
.46 b .62 a
.63 c
.70 b
.43 a
.52 c
.55 b
.75 a
.70 c
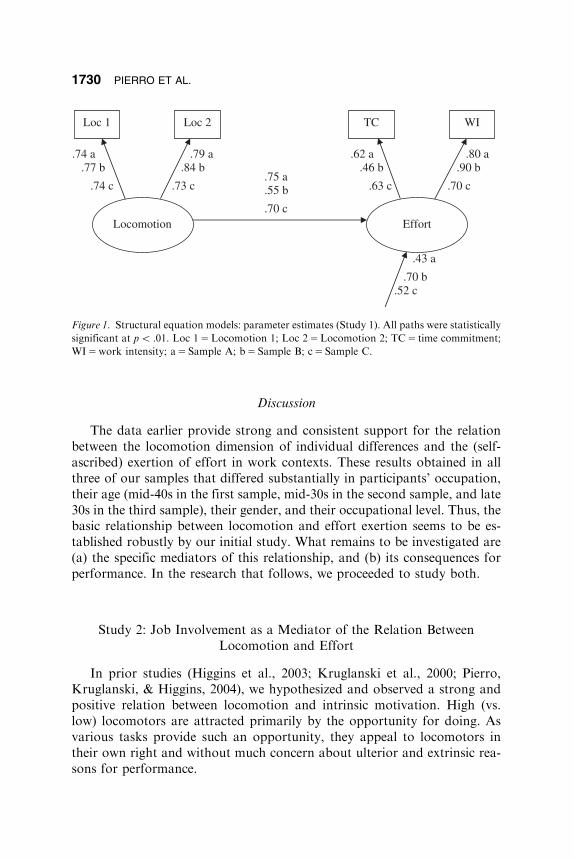
Figure 1. Structural equation models: parameter estimates (Study 1). All paths were statistically
significant at po .01. Loc 15Locomotion 1; Loc 25Locomotion 2; TC5 time commitment;
WI5work intensity; a5 Sample A; b5 Sample B; c5Sample C.
1730 PIERRO ET AL.
In work contexts, such intrinsic motivation may translate into jobinvolvement, which, in turn, may mediate the relationship betweenlocomotion and effort commitment that was found in Study 1, given thatjob involvement is substantially and positively related to effort commitment(Brown & Leigh, 1996; Efraty & Sirgy, 1990; Paterson & O’Driscoll, 1990;for a review, see Brown, 1996). Our objective in Study 2, therefore, is to testfor such mediation.
Method
Participants
Participants were 114 nurses (21 men, 88 women, 5 who failed to reporttheir gender) in a general hospital (by the name of Sandro Pertini) in Rome,Italy. The participants’ mean age was 35.02 years (SD5 7.02). Their prioreducational level was not measured in this particular study, though all of theparticipants were registered nurses. Participants’ gender did not enter intosignificant relationships with any of the presently investigated variables andwill not be considered further.
Procedure
Participants responded to the Italian version of the Locomotion Scale(Kruglanski et al., 2000) that was used in Study 1. In this sample, the alphafor the scale was .72. The mean locomotion score was 4.50 (SD5 0.65).Participants then completed a measure of job involvement and a measure ofeffort.
Job involvement. Job involvement has been defined as a cognitive beliefstate of a psychological identification with one’s job (Kanungo, 1982) thatinvolves a contingency between self-esteem and performance (Lodahl &Kejner, 1965). Although there are numerous instruments to measure jobinvolvement, the measure used most frequently is the one that was devel-oped by Lodahl and Kejner. In the present research, we used the Italianversion of the measure (Pierro, Lombardo, Fabbri, & Di Spirito, 1995).
The Job Involvement Scale is an eight-item instrument with statementssuch as ‘‘I am very much personally involved in my job,’’ or ‘‘The mostimportant things that happen to me involve my work.’’ Ratings are made ona 6-point scale ranging from 1 (strongly disagree) to 6 (strongly agree). In thepresent sample, the alpha for the Job Involvement Scale was .65.
Effort investment. Participants completed the same 10-item scale of effortthat was used in Study 1. In the present sample, the alpha for time
LOCOMOTION AND TASK PERFORMANCE 1731
commitment was 0.78 and for work intensity it was .82. The two subscaleswere significantly and positively correlated (r5 .36, po .01). Cronbach’salpha for the total effort scale was .82.
Results
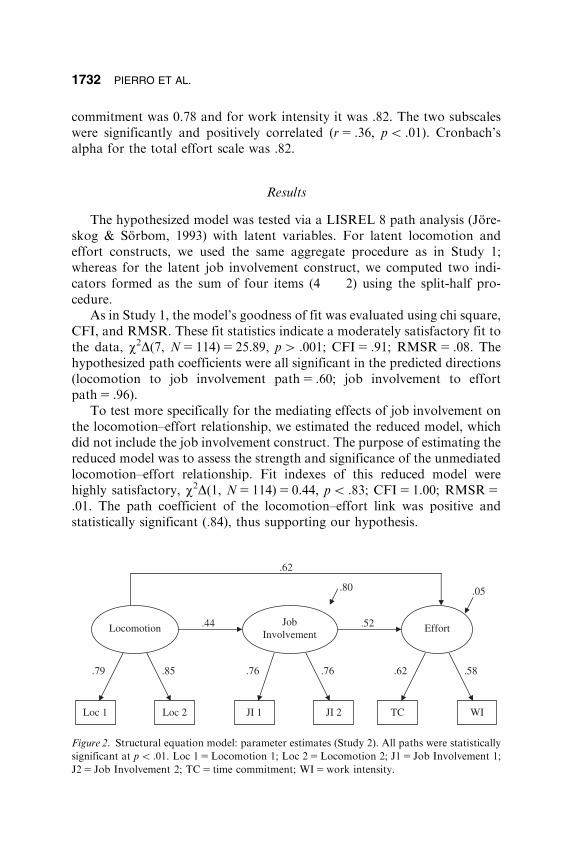
The hypothesized model was tested via a LISREL 8 path analysis (Jore-skog & Sorbom, 1993) with latent variables. For latent locomotion andeffort constructs, we used the same aggregate procedure as in Study 1;whereas for the latent job involvement construct, we computed two indi-cators formed as the sum of four items (4 � 2) using the split-half pro-cedure.
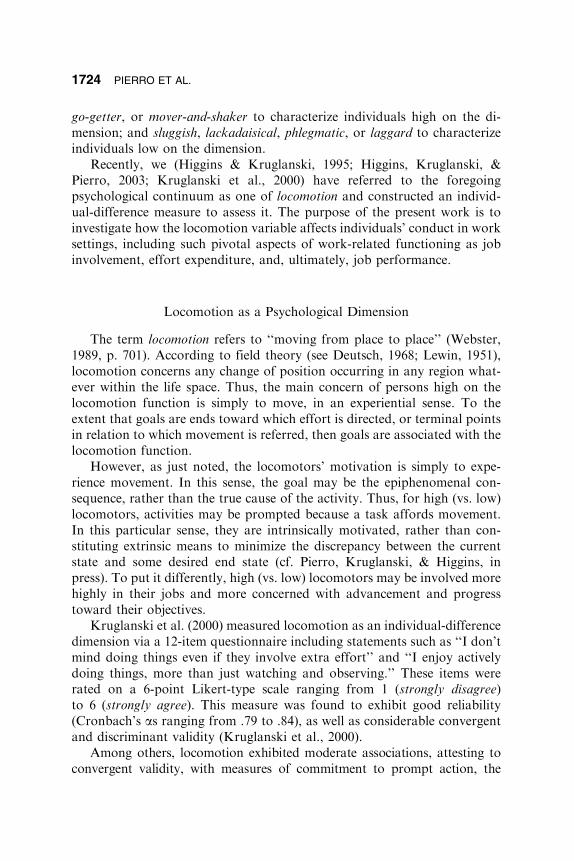
As in Study 1, the model’s goodness of fit was evaluated using chi square,CFI, and RMSR. These fit statistics indicate a moderately satisfactory fit tothe data, w2D(7, N5 114)5 25.89, p4 .001; CFI5 .91; RMSR5 .08. Thehypothesized path coefficients were all significant in the predicted directions(locomotion to job involvement path5 .60; job involvement to effortpath5 .96).
To test more specifically for the mediating effects of job involvement onthe locomotion–effort relationship, we estimated the reduced model, whichdid not include the job involvement construct. The purpose of estimating thereduced model was to assess the strength and significance of the unmediatedlocomotion–effort relationship. Fit indexes of this reduced model werehighly satisfactory, w2D(1, N5 114)5 0.44, po .83; CFI5 1.00; RMSR5
.01. The path coefficient of the locomotion–effort link was positive andstatistically significant (.84), thus supporting our hypothesis.
LocomotionJob
InvolvementEffort
Loc 1
.62
Loc 2
.79 .85
JI 1 JI 2
.76 .76
TC WI
.62 .58
.44 .52
.80 .05
Figure 2. Structural equation model: parameter estimates (Study 2). All paths were statistically
significant at po .01. Loc 15Locomotion 1; Loc 25Locomotion 2; J15 Job Involvement 1;
J25 Job Involvement 2; TC5 time commitment; WI5work intensity.
1732 PIERRO ET AL.
Subsequently, a direct locomotion to effort path was added to the basicmodel to assess its significance after job involvement was inserted as a pos-sible mediator of the relationship. Fit indexes of this particular model (seeFigure 2) were highly satisfactory, w2D(6, N5 114)5 9.69, po .14;CFI5 .98; RMSR5 .045; w2D(1, N5 114)5 16.20, p4 .001.
The effect of locomotion on effort, which was significant in the reducedmodel, was still significant (.62) when job involvement was added, eventhough it was decreased substantially, as compared to the reduced models.These results indicate that the relationship between locomotion and effortwas mediated partially by job involvement.
Discussion
The results of Study 2 are consistent with the notion that job involvementmediates the relationship between locomotion and effort, even though themediation is partial rather than complete. It seems fair to conclude, therefore,that high (vs. low) locomotors’ tendency to be more highly involved in theirjobs does play a role, in fact, in their tendencies to commit more effort to theirwork activities. However, the locomotion tendency is probably related toeffort investment in a more direct way as well. Individuals high on this par-ticular tendency generally are ready to invest efforts in whatever they do, as away to enhance their sense of psychological movement and advancement.
In our next two studies, we examine the impact that such effort invest-ment may exert on actual task performance, as it is evaluated subjectively bythe individuals themselves (in Study 3) and by their supervisors (in Study 4).Our fourth study affords the modeling of the entire sequence from individ-uals’ standing on the locomotion dimension, through their job involvementand effort investment to task performance.
Study 3: Locomotion, Effort, and Subjective Evaluations of Performance
In prior research (Kruglanski et al., 2000), we found a positive relationbetween locomotion and (a) students’ academic achievement, and (b) suc-cessful completion of the elite military training of U.S. Special Forces.Therefore, in the present study, we expect to replicate this positive relationin an organizational context. We further expect that the relation betweenlocomotion and performance will be mediated by effort, which was found tobe positively related to locomotion in Studies 1 and 2.
First, locomotion represents a motivational construct, and effort is gen-erally conceived of as a means whereby motivation is translated into workcompletion (Brown & Leigh, 1996; Parsons, 1968). Second, a number of
LOCOMOTION AND TASK PERFORMANCE 1733
previous studies found a positive relation between effort and performance(cf. Blau, 1993; Brown & Leigh, 1996).
Method
Participants
Eighty-seven employees of an Italian branch of a German investment com-pany (69 men, 18 women) participated in the study on a voluntary basis. Theirmean age was 35.13 years (SD57.83). 6 participants had an elementary schooleducation, 54 had a high school education, and 27 had a college education. Ofthe total sample, 23 participants were managers and 64 were salespersons.Neither gender, educational level, or occupational role had any effects on thepresent dependent variables; hence, they will not be discussed further.
Procedure
Data were collected in two phases. In the first phase, participants com-pleted the Italian version of the Locomotion Scale (Kruglanski et al., 2000)that was used in our first two studies, followed by a number of filler ques-tionnaires. In the present sample, the alpha for the scale was .82, and themean locomotion score was 4.86 (SD5 0.78). Participants then respondedto the same 10-item effort scale that was used in Studies 1 and 2. In thissample, Cronbach’s alpha for both time commitment and work intensitywas .87. As in our previous samples, the two subscales of this instrumentwere significantly and positively correlated (r5 .58, po .001), and the alphafor the total effort scale was .90.
In the second phase, which was conducted 3 months after the first phase,participants were asked to appraise their performance over the last 3months. Our measure of perceived performance consisted of the followingitems: ‘‘In terms of percentage, to what extent were your work objectivesreached during the last 3 months?’’ Responses to this item were recorded ona 10-point scale ranging from 1 (10%) to 10 (100%). The item ‘‘How do youevaluate your performance in the last 3 months?’’ was rated on a 10-pointscale ranging from 1 (extremely negatively) to 10 (extremely positively). Fi-nally, the item ‘‘To what degree do your results in the last 3 months reflectthe objectives you set for yourself?’’ was rated on a 10-point scale rangingfrom 1 (not at all) to 10 (entirely). The three scores were highly intercor-related (a5 .96) and, therefore, were combined to form an overall perfor-mance index.
1734 PIERRO ET AL.
Results
Our hypothesized model, wherein the relation between locomotion andperformance is mediated by effort, was tested via a LISREL 8 path analysis(Joreskog & Sorbom, 1993) with latent variables. For the latent locomotionand effort constructs, we generated the manifest indicators via the sameaggregate procedures described in connection with Study 1; whereas for thelatent performance construct, we used as the manifest indicators the threeindividual items. As in our prior studies, we evaluated the model’s goodnessof fit using chi-square, CFI, and RMSR indexes.
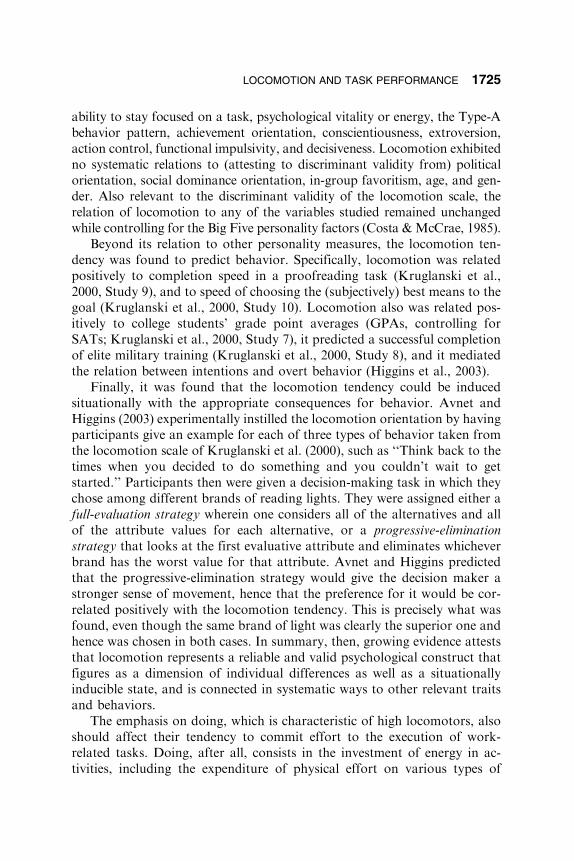
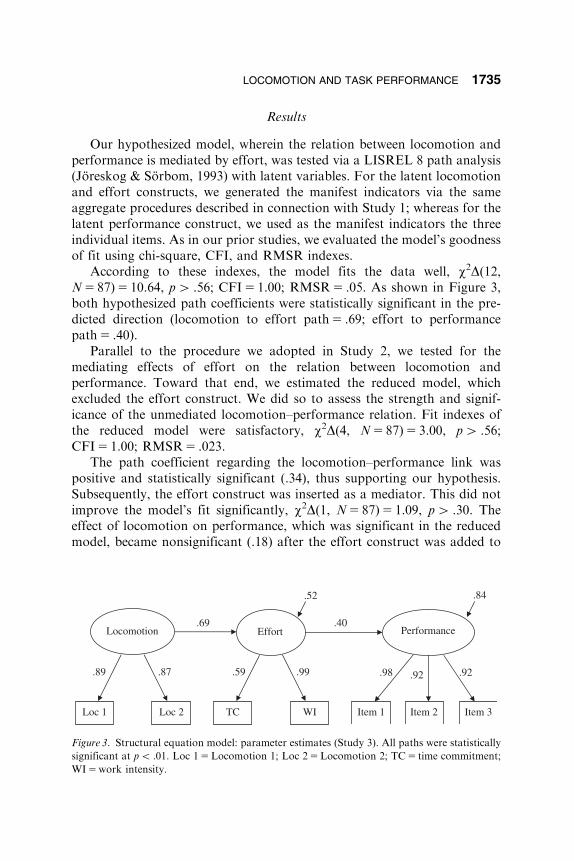
According to these indexes, the model fits the data well, w2D(12,N5 87)5 10.64, p4 .56; CFI5 1.00; RMSR5 .05. As shown in Figure 3,both hypothesized path coefficients were statistically significant in the pre-dicted direction (locomotion to effort path5 .69; effort to performancepath5 .40).
Parallel to the procedure we adopted in Study 2, we tested for themediating effects of effort on the relation between locomotion andperformance. Toward that end, we estimated the reduced model, whichexcluded the effort construct. We did so to assess the strength and signif-icance of the unmediated locomotion–performance relation. Fit indexes ofthe reduced model were satisfactory, w2D(4, N5 87)5 3.00, p4 .56;CFI5 1.00; RMSR5 .023.
The path coefficient regarding the locomotion–performance link waspositive and statistically significant (.34), thus supporting our hypothesis.Subsequently, the effort construct was inserted as a mediator. This did notimprove the model’s fit significantly, w2D(1, N5 87)5 1.09, p4 .30. Theeffect of locomotion on performance, which was significant in the reducedmodel, became nonsignificant (.18) after the effort construct was added to
Locomotion PerformanceEffort
Loc 1 Loc 2
.89 .87
TC WI
.59 .99
Item 1 Item 3
.98 .92
.69 .40
.52 .84
Item 2
.92
Figure 3. Structural equation model: parameter estimates (Study 3). All paths were statistically
significant at po .01. Loc 15Locomotion 1; Loc 25Locomotion 2; TC5 time commitment;
WI5work intensity.
LOCOMOTION AND TASK PERFORMANCE 1735
the model, indicating that the relationship between locomotion and perfor-mance was mediated by effort.
Discussion
The results earlier replicate the positive relation between locomotion andeffort found in our prior two studies, and they establish another, theoret-ically predicted effect: mediation by the locomotion–effort relation of thepositive link between locomotion and performance. It is also noteworthythat the longitudinal nature of the present research design affords relativelyunambiguous inferences about causality. Because participants’ responses tothe locomotion and effort scales came months before they were asked abouttheir performance, it seems highly implausible that the responses weredetermined by participants’ performance and much more likely that theopposite was the case; namely, that performance was determined by par-ticipants’ tendency to locomote via mediation of the more pronounced effortthat high (vs. low) locomotors invest in their work.
Whereas the latter interpretation is plausible in light of the data, it is notwithout an alternative interpretation that is related to the fact that all threevariables of present interest (i.e., locomotion, effort, and performance) wereassessed by paper-and-pencil self-report measures, reflecting participants’perceptions, rather than objective realities. Thus, it is possible that, ratherthan locomotion and effort determining performance, they are all deter-mined by a third variable: participants’ self-perceptions as locomotors,effort investors, and successful performers.
To control for this possibility in our fourth study, we used managers’ratings of employees’ performance and examined their relation to the linkbetween locomotion and effort. Finally, as already noted, Study 4 alsoincludes a measure of job involvement. Thus, it affords modeling of theentire hypothesized sequence between locomotion and performance throughmediation of job involvement and effort investment.
Study 4: Locomotion, Job Involvement, Effort,and Managers’ Performance Ratings
Method
Participants
Ninety-four employees of an insurance agency in Rome, Italy (41 men,53 women) participated in the study on a voluntary basis. Their mean age
1736 PIERRO ET AL.
was 33.21 years (SD5 7.88). Nine participants had a primary school ed-ucation, 81 had a high school education, and 4 had a college education.Neither gender nor educational level had any effects on the present de-pendent variables; hence, they will not be discussed further.
Procedure
Data were collected in two phases. In the first phase, participants com-pleted the Italian version of the Locomotion Scale (Kruglanski et al., 2000)that was used in our first two studies, followed by a number of filler ques-tionnaires. In the present sample, Cronbach’s alpha for this scale was .73,and the mean locomotion score was 4.54 (SD5 61.5). Participants thenproceeded to respond to the same eight-item job involvement scale (a5 .64)that was used in Study 2 and the same 10-item effort scale that was used inour first three studies. In this sample, Cronbach’s alpha for time commit-ment was .75, and for work intensity was .81. As in our previous samples,the two subscales of this instrument were significantly and positively cor-related (r5 .59, po .000), and the alpha for the total effort scale was .85.
In the second phase, which was conducted 3 months after the first phase,participants’ work performance was measured by managers’ ratings on thesame three-item instrument that was used in Study 3. In other words, weasked managers to appraise the performance of their employees (i.e., re-search participants) over the previous 3 months, using the following items:‘‘In terms of percentage, to what extent were the employee’s objectivesreached during the last 3 months?’’ This item was rated on a 10-point scaleranging from 1 (10%) to 10 (100%). The item ‘‘How do you evaluate theemployee’s performance in the last 3 months?’’ was rated on a 10-point scaleranging from 1 (extremely negatively) to 10 (extremely positively). Finally,the item ‘‘To what degree do the employee’s results in the last 3 monthsreflect her/his work objectives?’’ was rated on a 10-point scale ranging from1 (not at all) to 10 (entirely). The three scores were highly correlated(a5 .93). Thus, they were combined to form an overall performance index.
Results
In the present study, we aimed to accomplish the following objectives:(a) to replicate the results of Study 2 that locomotion affects both job in-volvement and effort measures positively and that the relationship betweenlocomotion and effort is not mediated completely by job involvement; (b) toreplicate the relationship between locomotion and performance that wasobtained in Study 3 and the finding that this relationship is mediated by
LOCOMOTION AND TASK PERFORMANCE 1737
effort and by job involvement; and (c) to replicate Brown and Leigh’s (1996)results that the relationship between job involvement and performance ismediated by effort.
The hypothesized model was tested via a LISREL 8 path analysis (Jore-skog & Sorbom, 1993) with latent variables. In this model, locomotion scorewas specified as an exogenous variable hypothesized to influence jobinvolvement and hypothesized, in turn, to influence effort, ultimately influ-encing performance. In addition, on the basis of Study 2’s results, wespecified a direct path from locomotion to effort as well.
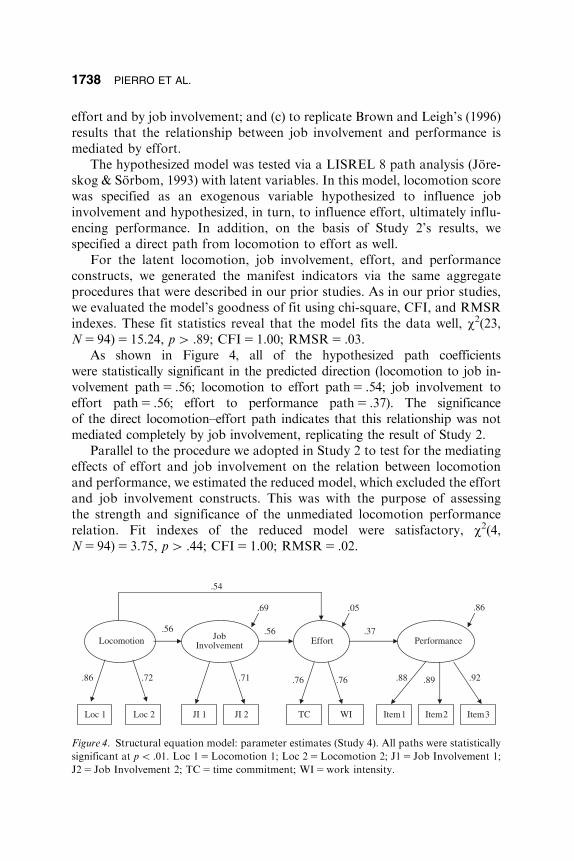
For the latent locomotion, job involvement, effort, and performanceconstructs, we generated the manifest indicators via the same aggregateprocedures that were described in our prior studies. As in our prior studies,we evaluated the model’s goodness of fit using chi-square, CFI, and RMSRindexes. These fit statistics reveal that the model fits the data well, w2(23,N5 94)5 15.24, p4 .89; CFI5 1.00; RMSR5 .03.
As shown in Figure 4, all of the hypothesized path coefficientswere statistically significant in the predicted direction (locomotion to job in-volvement path5 .56; locomotion to effort path5 .54; job involvement toeffort path5 .56; effort to performance path5 .37). The significanceof the direct locomotion–effort path indicates that this relationship was notmediated completely by job involvement, replicating the result of Study 2.
Parallel to the procedure we adopted in Study 2 to test for the mediatingeffects of effort and job involvement on the relation between locomotionand performance, we estimated the reduced model, which excluded the effortand job involvement constructs. This was with the purpose of assessingthe strength and significance of the unmediated locomotion performancerelation. Fit indexes of the reduced model were satisfactory, w2(4,N5 94)5 3.75, p4 .44; CFI5 1.00; RMSR5 .02.
Locomotion Performance Effort
Loc 1 Loc 2
.86
Item 1 Item 3
.88 .92
.56 .56
.86
Item 2
.89
JobInvolvement
.72
TC WI
.76 .76
JI 1 JI 2
.71
.37
.54
.69 .05
Figure 4. Structural equation model: parameter estimates (Study 4). All paths were statistically
significant at po .01. Loc 15Locomotion 1; Loc 25Locomotion 2; J15 Job Involvement 1;
J25 Job Involvement 2; TC5 time commitment; WI5work intensity.
1738 PIERRO ET AL.
The path coefficient regarding the locomotion–performance link waspositive and statistically significant (.33), thus supporting our hypothesis.Subsequently, a direct locomotion–performance path was added to the basicmodel to assess its significance after effort and job involvement were in-serted as mediators. This path did not improve the model’s fit significantly,w2D(1, N5 94)5 0.01, p4 .90. The effect of locomotion on performance,which was significant in the reduced model, became nonsignificant (.03)after the effort and job-involvement constructs where added to the model,indicating that the relationship between locomotion and performance ismediated by effort and job involvement.
Finally, to replicate Brown and Leigh’s (1996) results that relationshipbetween job involvement and performance is mediated by effort, we esti-mated the reduced model, which excluded the effort construct. This was withthe purpose of assessing the strength and significance of the unmediatedjob-involvement/performance relation. Fit indexes of the reduced modelwere satisfactory, w2(12, N5 94)5 7.60, p4 .82; CFI5 1.00; RMSR5 .04.
The path coefficient regarding the job-involvement/performance link ispositive and statistically significant (.38), supporting the results of Brownand Leigh (1996; for a review, see Brown, 1996). Subsequently, a direct job-involvement/performance path was added to the basic model to assess itssignificance after effort was inserted as a mediator. This path did not im-prove the model’s fit significantly, w2D(1, N5 94)5 0.05, p4 .90. The effectof job involvement on performance, which was significant in the reducedmodel, became nonsignificant (.07) after the effort construct was added tothe model, indicating that the relationship between job involvementand performance is mediated by effort, consistent with Brown and Leigh’sresults.
General Discussion
Taken as a body, the four studies contained in the present report tell acoherent story. They identify the propensity toward locomotion as a con-struct of considerable relevance to task performance in organizational con-texts. The locomotion dimension pertains to people’s proclivity towardpsychological movement. Tasks, in general, provide an opportunity for suchmovement; and movement, in turn, requires the investment of energy.It follows, therefore, that individuals high on the locomotion dimensionshould find tasks particularly engaging and appealing, and should investconsiderable efforts in their performance.
The data reported earlier offer consistent support for this analysis. Infour different studies, which were executed in diverse organizational con-texts, we found that our individual-difference measure of locomotion was
LOCOMOTION AND TASK PERFORMANCE 1739
related positively to effort expenditure. We found, in addition, that thelocomotion–effort relation was mediated partially by the positive relationbetween locomotion and job involvement, that locomotion was related pos-itively to performance, and that the relation between locomotion and per-formance was mediated by effort commitment.
Whereas the earlier relations were demonstrated primarily with self-report measures, at least in one case (namely, Study 4) we found evidencethat the superior performance of high (vs. low) locomotors was yieldedalso by managers’ ratings of performance. Furthermore, the longitudinaldesign of Study 3 excluded the possibility that perceived performance is thecause of participants’ self-ratings on the locomotion and effort-investmentdimensions and is consistent with the notion that the opposite, in fact,is the case; namely, that locomotion and effort determine performance.Finally, the present data are consistent with other findings wherebylocomotion was related positively to intrinsic motivation (cf. Kruglanskiet al., 2000; Pierro et al., in press), a variable that in other research wasfound to be related significantly to effort investment (Sheldon & Elliot,1998, 1999).
Though the present results suggest that organizations may benefit fromrecruiting and retaining employees with a high tendency toward locomotion,it is important to note that, like any other personality characteristic, loco-motion also involves tradeoffs that render it more desirable in some situ-ations and less so in others. Because of their tendency toward movement,high locomotors tend to favor autocratic (vs. participative) decision-makingstructures in organizations, and legitimate and coercive (rather than reward,referent, or expert) types of social power.
Recent work by our team (Kruglanski, Pierro, & Higgins, 2002) indeedreveals that locomotors tend to see as ideal, to exercise, and to be moresatisfied with strong as opposed to soft (Bui, Raven, & Schwarzwald, 1994)types of leadership, as such leadership spends relatively little time on ex-tended deliberations and is particularly suited to quickly moving, action-oriented organizational functioning. Clearly, such functioning is adaptedbetter to some types of organizations than to others.
Because of their desire for movement, high locomotors may have littlepatience with impediments that often may result from the need to listen tothe opinions of others and coordinate one’s activities with those of others. Inorganizational environments, where this is necessary, high locomotors mightfeel uncomfortable and continually frustrated, which may result in theiradoption of negative attitudes toward the organization and toward theircoworkers, thus undermining the organizational climate at their workplace(Brown & Leigh, 1996; Schneider, 1975). These issues could be investigatedprofitably in future research.
1740 PIERRO ET AL.
Other important issues concerning the locomotion dimension await fur-ther study in organizational contexts. One such issue relates to the possiblesituational antecedents of the locomotion tendency. It is possible to theorize,for example, that the experience of failure and a general organizationalclimate fraught with criticism and negativity may arrest carefree locomotionand induce a prevention focus (Higgins, 1997), which is characterized byvigilance and hesitancy; hence, a great deal of ‘‘looking prior to leaping.’’
It is also possible that obstacles to locomotionFinherent, for example,in paralyzing decision-making structures in organizations, where endlessdebate and disagreement forestall concerted actionFelevate the craving toput an end to the stalemate and initiate a movement of some sort. Finally, itis possible that in the course of human evolution, certain emotions such asfear or anger have become associated with the tendency to locomote; that is,to flee or to fight, in some sense.
Organizational contexts in which such emotions are likely to be evokedmight develop in their employees a strong locomotion tendency that, pos-sibly, may generalize to other contexts as well. In summary, then, a greatdeal of work needs to be done to understand the locomotion dimension in itsvaried implications of organizational significance. The present results sug-gest that the effort involved in so doing may be fruitful and worthwhile onboth theoretical and practical grounds.
References
Avnet, T., & Higgins, E. T. (2003). Locomotion, assessment, and regulatoryfit: Value transfer from ‘‘how’’ to ‘‘what.’’ Journal of Experimental SocialPsychology, 39, 525-530.
Bagozzi, R. P. (1993). Assessing construct validity in personality research:Application to measures of self-esteem. Journal of Research in Person-ality, 27, 49-87.
Bagozzi, R. P., & Heatherton, T. F. (1994). A general approach to repre-senting multifaceted personality constructs: Application to state self-esteem. Structural Equation Modeling, 1, 35-67.
Bentler, P. M. (1989). Structural equations program manual. Los Angeles,CA: BMDP.
Blau, G. J. (1993). Operationalizing direction and level of effort and testingtheir relationship to individual job performance. Organizational Behaviorand Human Decision Processes, 55, 152-170.
Bollen, K. A. (1989). Structural equations with latent variables. New York:Wiley.
Brown, S. P. (1996). A meta-analysis and review of organizational researchon job involvement. Psychological Bulletin, 120, 235-255.
LOCOMOTION AND TASK PERFORMANCE 1741
Brown, S. P., & Leigh, T. W. (1996). A new look at psychological climateand its relationship to job involvement, effort, and performance. Journalof Applied Psychology, 81, 358-368.
Bui, K. T., Raven, B. H., & Schwarzwald, J. (1994). Influence strategiesin dating relationships: The effects of relationship satisfaction,gender, and perspective. Journal of Social Behavior and Personality, 9,429-442.
Campbell, J. P., & Pritchard, R. D. (1976). Motivation theory in industrialand organizational psychology. In M. Dunnette (Ed.), Handbook of in-dustrial and organizational psychology (pp. 63-130). Chicago: RandMcNally.
Costa, P. T., Jr., & McCrae, R. R. (1985). The NEO Personality InventoryManual. Odessa, FL: Psychological Assessment Resources.
Deutsch, M. (1968). Field theory in social psychology. In G. Lindzey & E.Aronson (Eds.), Handbook of Social Psychology (Vol. 1, pp. 412-487).Reading, MA: Addison Wesley.
Efraty, D., & Sirgy, M. J. (1990). The effects of quality of working life(QWL) on employee behavioral responses. Social Indicators Research,22, 31-47.
Higgins, E. T. (1997). Beyond pleasure and pain. American Psychologist, 52,1280-1300.
Higgins, E. T., & Kruglanski, A. W. (1995). A theory of regulatory mode:When locomotion versus assessment is emphasized. Unpublished manu-script, Columbia University, New York.
Higgins, E. T., Kruglanski, A. W., & Pierro, A. (2003). Regulatory mode:Locomotion and assessment as distinct orientations. In M. P. Zanna(Ed.), Advances in Experimental Social Psychology (Vol. 35, pp. 294-345). New York: Academic Press.
Hu, L., & Bentler, P. M. (1999). Cutoff criteria for fit indexes in covariancestructure analysis: Conventional criteria versus new alternatives. Struc-tural Equation Modeling, 6, 1-55.
Joreskog, K. G., & Sorbom, D. (1993). LISREL 8. Structural equation mode-ling with the SIMPLIS command language. Chicago: Scientific Software.
Kanfer, R. (1991). Motivation theory and industrial and organizationalpsychology. In M. D. Dunnette & M. Hough (Eds.), Handbook of in-dustrial and organizational psychology. (2nd ed., Vol. 1, pp. 75-170). PaloAlto, CA: Consulting Psychologist Press.
Kanungo, R. N. (1982). Measurement of job and work involvement. Journalof Applied Psychology, 67, 341-349.
Kruglanski, A. W., Pierro, A., & Higgins, E. T. (2002). Regulatory mode andsocial influence in organizations. Unpublished manuscript, University ofMaryland, College Park, MD.
1742 PIERRO ET AL.
Kruglanski, A. W., Thompson, E. P., Higgins, E. T., Atash, M. N., Pierro,A., & Shah, J. Y., et al. (2000). To ‘‘Do the right thing’’ or to ‘‘Just doit’’: Locomotion and assessment as distinct self-regulatory imperatives.Journal of Personality and Social Psychology, 79, 793-815.
Lewin, K. (1951). Field theory in social science. New York: Harper.Lodahl, T. M., & Kejner, M. (1965). The definition and measurement of job
involvement. Journal of Applied Psychology, 49, 24-33.Parsons, T. (1968). The structure of social action. New York: Free Press.Paterson, J. M., & O’Driscoll, M. P. (1990). An empirical assessment of
Kanungo’s (1982) concept and measure of job involvement. AppliedPsychology: An International Review, 39, 293-306.
Pierro, A., Kruglanski, A. W., & Higgins, E. T. (2002a). Regulatory modeand social influence in organizations. Rome, Italy: University ‘‘La Sap-ienza.’’
Pierro, A., Kruglanski, A. W., & Higgins, E. T. (2002b). Regulatory modeand the joys of doing: Effects of ‘‘locomotion’’ and ‘‘assessment’’ on in-trinsic task-motivation in organizational contexts. Rome, Italy: University‘‘La Sapienza.’’
Pierro, A., Lombardo, I., Fabbri, S., & Di Spirito, A. (1995). Evidenzaempirica della validita discriminante delle misure di Job Involvement eOrganizational Commitment: Modelli di analisi fattoriale confermativa(via Lisrel) (Empirical evidence for the discriminant validity of jobinvolvement and organizational commitment measures: Confirmatoryfactor analysis models) (via Lisrel). Testing Psicometria, Metodologia,2, 5-18.
Schneider, B. (1975). Organizational climate: An essay. Personnel Psychol-ogy, 28, 447-479.
Sheldon, K. M., & Elliot, J. (1998). Goal striving, need satisfaction, andlongitudinal well-being: The self-concordance model. Personality andSocial Psychology Bulletin, 24, 546-557.
Sheldon, K. M., & Elliot, J. (1999). Goal striving, need satisfaction, andlongitudinal well-being: The self-concordance model. Journal of Person-ality and Social Psychology, 76, 482-497.
Tanaka, J. S. (1993). Multifaceted conceptions of fit in structural equationmodels. In K. A. Bollen & J. S. Long (Eds.), Testing structural equationmodels (pp. 10-39). Newbury Park, CA: Sage.
Webster’s ninth new collegiate dictionary. (1989). Springfield, MA: Merriam-Webster.
LOCOMOTION AND TASK PERFORMANCE 1743


![It Takes Two [and] Receptive Communication - ERIC](https://img.dokumen.tips/doc/110x75/632ca391c9e7ccd4b40afa59/it-takes-two-and-receptive-communication-eric.jpg)


