Embed Size (px)
Citation preview
A new Toshiba takes shape >>ANNUAL REPORT >> Year ended March 31, 2000
Printed in Japan
AN
NU
AL R
EPO
RT 2
00
0
CONTENTS
FINANCIAL HIGHLIGHTS 1TO OUR SHAREHOLDERS 2IT— A DRIVER OF GROWTH
Inter-Company Value Chain 8Electronic Components 10Media Cards 1 1Portable PCs 12Cellular Phones 13System Solution Services 14Digital Broadcasting Equipment 15B2B Internet Services 16B2C Internet Services 17
REVIEW OF OPERATIONSInformation & Communicationsand Industrial Systems 18
Digital Media 2 1Power Systems 24Electronic Devices & Components 26Home Appliances 29Others 30
RESEARCH AND DEVELOPMENT 3 1TOSHIBA AND THE ENVIRONMENT 34BOARD OF DIRECTORS, EXECUTIVE OFFICERSAND CORPORATE AUDITORS 36
MANAGEMENT’S DISCUSSION & ANALYSIS 37CONSOLIDATED FINANCIAL STATEMENTS 44GLOBAL NETWORK 64CONSOLIDATED SUBSIDIARIES 66INVESTOR REFERENCE 67
BASIC COMMITMENTOF THE TOSHIBA GROUPWe, the Toshiba Group companies, based on our total commitment topeople and to the future, are determined to help create a higher qualityof life for all people, and to do our part to help ensure that progresscontinues within the world community.
COMMITMENT TO PEOPLEWe endeavor to serve the needs of all people, especially our customers,shareholders, and employees, by implementing forward-lookingcorporate strategies while carrying out responsible and responsivebusiness activities. As good corporate citizens, we actively contribute tofurther the goals of society.
COMMITMENT TO THE FUTUREBy continually developing innovative technologies centering onthe fields of Electronics and Energy, we strive to create productsand services that enhance human life, and which lead to a thriving,healthy society. We constantly seek new approaches that help realize thegoals of the world community, including ways to improve the globalenvironment.
Committed to People,Committed to the Future.
FORWARD-LOOKING STATEMENTSThis annual report contains forward-looking statements concerning Toshiba’s future plans, strategiesand performance. These forward-looking statements are not historical facts, rather they representassumptions and beliefs based on economic, financial and competitive data currently available. Fur-thermore, they are subject to a number of risks and uncertainties that, without limitation, relate toeconomic conditions, worldwide mega-competition in the electronics business, customer demand,foreign currency exchange rates, tax rules, regulations and other factors. Toshiba therefore wishes tocaution readers that actual results may differ materially from our expectations.
INVESTOR REFERENCE
FoundedJuly 1875
Capital¥274,919 million (US$2,594 million)
Employees190,870
Common StockAuthorized: 10,000,000,000 sharesIssued: 3,219,006,450 sharesNo. of shareholders: 380,744Average holding: 8,455 shares
Transfer AgentThe Chuo Mitsui Trust and Banking Co., Ltd.
Headquarters1-1, Shibaura 1-chome, Minato-kuTokyo 105-8001, Japan
Principal Shareholders:The Dai-ichi Mutual Life Insurance Company 3.94%The Sakura Bank, Ltd. 3.88%The Chase Manhattan Bank NA London 3.85%Nippon Life Insurance Company 3.36%State Street Bank and Trust Company 2.63%Mitsui Mutual Life Insurance Company 2.22%The Sumitomo Trust and Banking Co., Ltd. (Trust Account) 2.01%Employees Stock Ownership Plan 1.86%The Nippon Fire & Marine Insurance Co., Ltd. 1.84%The Long-Term Credit Bank of Japan, Ltd. 1.52%
(As of March 31, 2000)
For further information, please contact:
Corporate Communications OfficeTOSHIBA CORPORATION1-1, Shibaura 1-chome, Minato-kuTokyo 105-8001, JapanPhone: (03) 3457-2096Facsimile: (03) 5444-9202or via the Internet at:http://www.toshiba.co.jp/about /ir/index.htm
Product names may be trademarksof their respective companies.
Printed on recycled paper
67
1
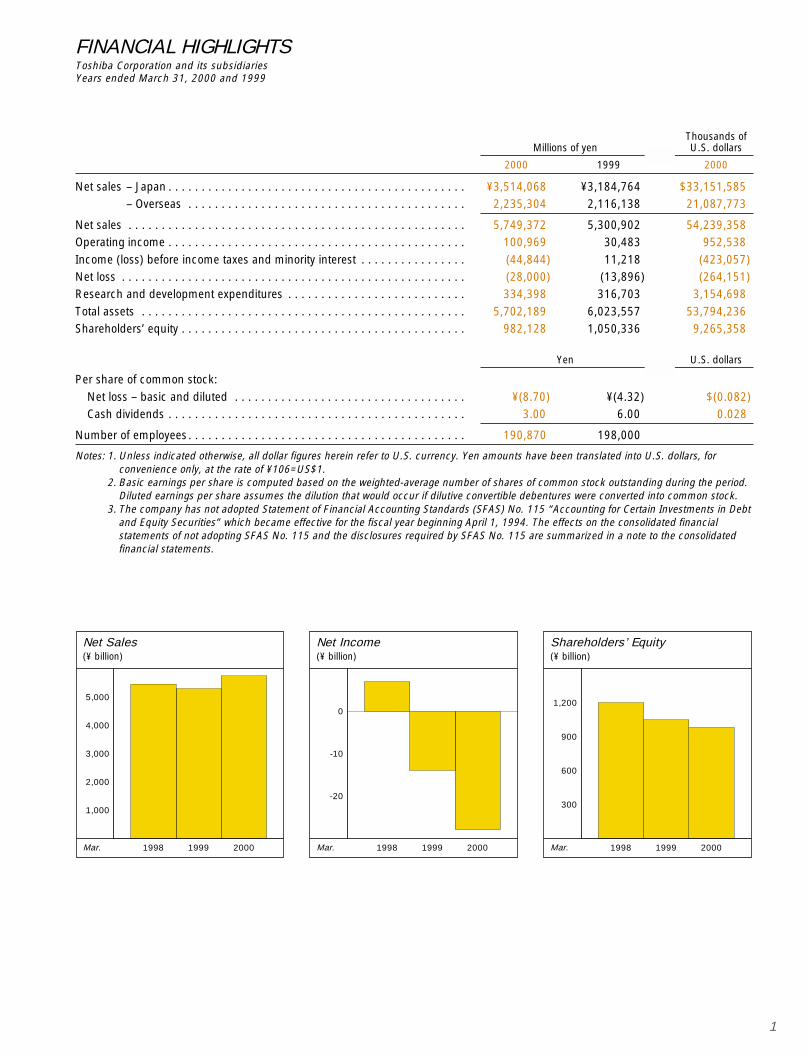
Thousands ofMillions of yen U.S. dollars
2000 1999 2000
Net sales – Japan . . . . . . . . . . . . . . . . . . . . . . . . . . . . . . . . . . . . . . . . . . . . . ¥3,514,068 ¥3,184,764 $33,151,585– Overseas . . . . . . . . . . . . . . . . . . . . . . . . . . . . . . . . . . . . . . . . . . 2,235,304 2,116,138 21,087,773
Net sales . . . . . . . . . . . . . . . . . . . . . . . . . . . . . . . . . . . . . . . . . . . . . . . . . . . 5,749,372 5,300,902 54,239,358Operating income . . . . . . . . . . . . . . . . . . . . . . . . . . . . . . . . . . . . . . . . . . . . . 100,969 30,483 952,538
Income (loss) before income taxes and minority interest . . . . . . . . . . . . . . . . (44,844) 11,218 (423,057)Net loss . . . . . . . . . . . . . . . . . . . . . . . . . . . . . . . . . . . . . . . . . . . . . . . . . . . . (28,000) (13,896) (264,151)Research and development expenditures . . . . . . . . . . . . . . . . . . . . . . . . . . . 334,398 316,703 3,154,698
Total assets . . . . . . . . . . . . . . . . . . . . . . . . . . . . . . . . . . . . . . . . . . . . . . . . . 5,702,189 6,023,557 53,794,236Shareholders’ equity . . . . . . . . . . . . . . . . . . . . . . . . . . . . . . . . . . . . . . . . . . . 982,128 1,050,336 9,265,358
Yen U.S. dollars
Per share of common stock:
Net loss – basic and diluted . . . . . . . . . . . . . . . . . . . . . . . . . . . . . . . . . . . ¥(8.70) ¥(4.32) $(0.082)Cash dividends . . . . . . . . . . . . . . . . . . . . . . . . . . . . . . . . . . . . . . . . . . . . . 3.00 6.00 0.028
Number of employees . . . . . . . . . . . . . . . . . . . . . . . . . . . . . . . . . . . . . . . . . . 190,870 198,000
Notes: 1. Unless indicated otherwise, all dollar figures herein refer to U.S. currency. Yen amounts have been translated into U.S. dollars, forconvenience only, at the rate of ¥106=US$1.
2. Basic earnings per share is computed based on the weighted-average number of shares of common stock outstanding during the period.Diluted earnings per share assumes the dilution that would occur if dilutive convertible debentures were converted into common stock.
3. The company has not adopted Statement of Financial Accounting Standards (SFAS) No. 115 “Accounting for Certain Investments in Debtand Equity Securities” which became effective for the fiscal year beginning April 1, 1994. The effects on the consolidated financialstatements of not adopting SFAS No. 115 and the disclosures required by SFAS No. 115 are summarized in a note to the consolidatedfinancial statements.
FINANCIAL HIGHLIGHTSToshiba Corporation and its subsidiariesYears ended March 31, 2000 and 1999
1,000
1998 1999 2000
2,000
3,000
4,000
5,000
-20
-10
0
1998 1999 2000
300
600
900
1,200
1998 1999 2000
Net Sales(¥ billion)
Net Income(¥ billion)
Shareholders’ Equity(¥ billion)
Mar. Mar. Mar.
2
Summary of Fiscal 1999 Operating Results
A review of fiscal 1999, to March 31, 2000, reveals a year of transition for Toshiba. Throughout the period, we continued
reforms that will position the company to achieve sustained growth in coming years. And although exceptional circumstances
kept us from profit, we are confident that the progress we made in fiscal 1999 readies Toshiba for a return to profitability in the
current fiscal term, and strong onward growth.
Japan saw another year of sluggish personal consumption, reflecting widespread concern about employment conditions
and falls in real income. In the second half, this was compounded by the declining effectiveness of government pump priming
in public investment and housing starts. However, not all the news was negative. Capital investment improved in the private
sector, particularly in information technology, share prices rallied and corporate earnings recovered. We look for more progress
in the present term.
Overseas, the main story was the continuing robustness of the personal consumption that is driving the U.S. economy.
Other welcome trends were the pace of recovery in Asia and the continuing upward trend in Europe.
In our operations, we achieved an 8% increase in consolidated net sales to ¥5,749 billion (US$54,239 million) in fiscal
1999, and our operating income increased by ¥70.5 billion (US$665 million) to ¥101 billion (US$953 million). However, we
reported a loss before income taxes and minority interests of ¥44.8 billion (US$423 million), and a net loss of ¥28 billion
(US$264 million), largely due to the settlement of a class-action lawsuit in the United States.
Despite this loss, we are sure that fiscal 2000 will see Toshiba return to profitability, thanks to significant advances in
restructuring during the previous year. This was particularly true in our semiconductor business, which put into force extensive
restructuring programs that tightened its focus on core businesses and realigned global manufacturing facilities. These moves,
and benefits gained from greater stability in DRAM prices, produced a dramatic rebound from a first half loss. Our home
appliances business also made a substantial return to profitability. And in its first full year, our new in-house company system
secured impressive gains in cash flows.
Settlement Reached in U.S. Class-Action Litigation
In October 1999, Toshiba reached a settlement in a class-action lawsuit in the U.S. brought by two owners of Toshiba
notebook personal computers concerning the floppy-disk controller (FDC) incorporated in the PCs. They alleged that the
floppy-disk controller may, under certain circumstances, cause data to be lost or corrupted when it is written to a floppy disk.
The class settlement was approved by the court in January 2000, and became final in March 2000.
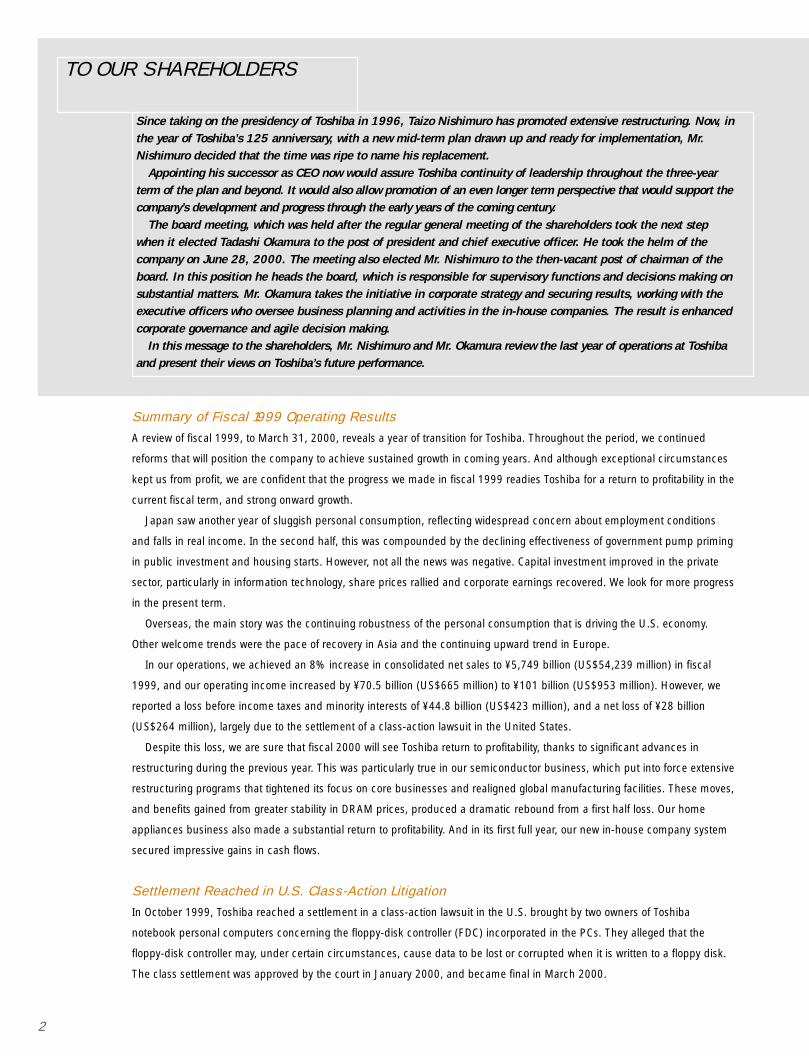
TO OUR SHAREHOLDERS
Since taking on the presidency of Toshiba in 1996, Taizo Nishimuro has promoted extensive restructuring. Now, inthe year of Toshiba’s 125 anniversary, with a new mid-term plan drawn up and ready for implementation, Mr.Nishimuro decided that the time was ripe to name his replacement.
Appointing his successor as CEO now would assure Toshiba continuity of leadership throughout the three-yearterm of the plan and beyond. It would also allow promotion of an even longer term perspective that would support thecompany’s development and progress through the early years of the coming century.
The board meeting, which was held after the regular general meeting of the shareholders took the next stepwhen it elected Tadashi Okamura to the post of president and chief executive officer. He took the helm of thecompany on June 28, 2000. The meeting also elected Mr. Nishimuro to the then-vacant post of chairman of theboard. In this position he heads the board, which is responsible for supervisory functions and decisions making onsubstantial matters. Mr. Okamura takes the initiative in corporate strategy and securing results, working with theexecutive officers who oversee business planning and activities in the in-house companies. The result is enhancedcorporate governance and agile decision making.
In this message to the shareholders, Mr. Nishimuro and Mr. Okamura review the last year of operations at Toshibaand present their views on Toshiba’s future performance.
3
With the full support of one of the best U.S. law firms, Toshiba vigorously defended itself in the lawsuit by arguing that –
while there was the potential for the FDC condition to cause data loss under certain rare circumstances – Toshiba was not
aware of that the FDC had ever actually caused data loss or data corruption in the approximately 15 million Toshiba portable
PCs used by its customers worldwide.
After carefully considering the expected risks attendant on continuing the case and the opinions of its lawyers and experts,
Toshiba decided to settle the case to avoid the risks involved in protracted complex litigation and a jury trial, including a
potential worst-case scenario where the company’s business itself would be threatened, and to continue to ensure its custom-
ers that the Toshiba brand name merits their trust.
In making such a decision, Toshiba took the following risks, among others, into account:
■ The plaintiffs could have argued that, under certain US law warranty theories, they were entitled to recover damages up to a
full refund of the purchase price without having to prove actual data loss or data corruption in any particular PC. Based on
the plaintiff’s arguments in this lawsuit, the damages awarded could have been as much as 1 trillion yen (approximately
US$10 billion).
■ Based on legal precedents in the U.S., including cases decided in the same jurisdiction as this lawsuit, there was a serious
risk that a huge amount of compensation could have been awarded through a jury verdict in the class-action lawsuit.
■ If Toshiba had not agreed to settle the case, the court could very likely have issued an injunction order prohibiting Toshiba
from selling any PCs in the U.S. without first placing a warning label on the PC that said the PC could destroy important data.
We settled the case without any admission or finding of liability, and without any admission or finding that its PCs have
any defects.
Toshiba has reflected a 106.3 billion yen (approximately US$1 billion) loss in its financial results for fiscal 1999, in con-
nection with the settlement payment and other performance obligations under the settlement agreement.
We express our sincere regrets for any concern that this may have caused to our shareholders. We are making every effort
to minimize any impact the settlement may have on our business, and also fully reviewing our business systems toward
preventing any recurrence of such an incident.
Looking Back on a Year of Accelerating Change
In fiscal 1999, Toshiba took on the challenge of fundamentally redefining its management structure, business portfolio and
corporate culture. Our underlying aim was nothing less than to ensure survival and thriving growth in today’s borderless
economy and fierce global competition.
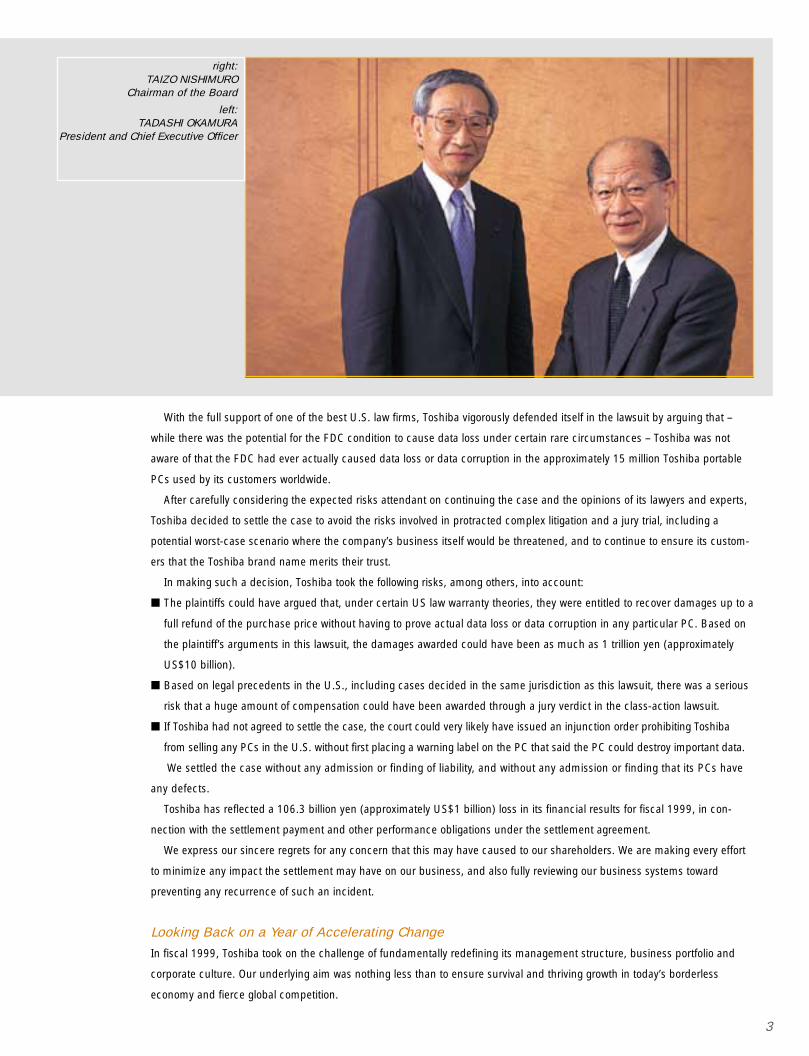
right:TAIZO NISHIMURO
Chairman of the Board
left:TADASHI OKAMURA
President and Chief Executive Officer
4
Optimizing the Benefits of the In-House Company System
A central strand of our management restructuring was the April 1999 introduction of the in-house company system at Toshiba
Corporation. This gives each company operating autonomy and all necessary business resources, and requires them to
develop an appropriate business approach, effective strategies and fast decision making. They also have to meet stringent
targets for ROI and Cash Flow ROI and maximize cash flows. Improvement under the new system has been dramatic, as fiscal
1999 witnessed a net increase of ¥143 billion in cash flows from operating and investing activities. In short, the first year of
operations under the new system offers positive grounds for future expectations.
Alliances Pave the Way to Profitability
In parallel with restructuring, we entered into a number of alliances in fiscal 1999, all with the intent of winning in the global
marketplace and improving profitability.
In matured businesses, we set up joint ventures with Mitsubishi Electric Corporation in the industrial motor business, with
General Electric Company and Hitachi, Ltd. in international nuclear fuel operations, and with Carrier Corporation in air condition-
ers. All three have made significant progress, especially that with Carrier. In its first year, it brought our air-conditioning business
back to profit, after a series of losses. We are intent on making our matured businesses globally competitive and profitable.
For those ends, we will continue to seek alliances with powerful partners, restructure existing operations, and consider other
means to optimizing our business portfolio.
We also promote strategic partnerships in growth businesses, especially electronic components. Noteworthy collaborations
include a June 1999 joint venture with Sony Computer Entertainment Inc. to produce the CPU for its PlayStation2 game
console, and a new US-based joint venture with SanDisk Corporation, formed in May 2000 to develop and manufacture
next-generation flash memories. Moves like these allow us to maximize the results we can achieve with finite resources,
and to direct them to activities offering the greatest potential for attractive returns. We will continue to use partnerships as
a tool to promote Toshiba’s competitiveness.
Change in Corporate Culture
Of course, reorganization can only succeed if it is backed up by a whole-hearted commitment to success in the market. The
key to that is Management Innovation 2001 (MI2001). Launched in October 1998, this company-wide initiative is applying
Six-Sigma methodology to building a corporate culture that encourages continuous innovation and seeks total customer
satisfaction. We began extending MI2001 throughout Toshiba Group in October 1999, disseminating a uniform methodology
throughout the group via an information network that also supports the flow of results and achievements among companies.
In fiscal 1999, some 4,000 MI2001 projects generated savings of approximately ¥34 billion.
Words Into Action ...
5
The Next Step—The Mid-Term Business Plan
As we have noted, our performance has improved steadily since the second half of fiscal 1999, especially in our semi-
conductor business. We are convinced that this represents the first benefits of our restructuring program, and we are
sure it is no short-term trend. Consequently, the mid-term business plan announced in March 2000 represents a clear
roadmap for future expansion. It sets forth fundamental management policies and strategies for the three years to March
2003, and is designed to bring us to the point where we can sustain high growth and profitability throughout Toshiba
Group. We are achieving this through the benefits gained from fully utilizing the latest advances in information systems
and expanding IT-related businesses.
Our strategic business sectors will prioritize IT business, particularly in the central areas of networks and mobile devices.
We will accelerate growth by fusing our advanced capabilities in network security, image compression and other crucial mobile
technologies with our leading-edge semiconductor, LCDs and digital components technologies.
Business-to-business (B2B) operations center on the e-Net Business Division, formed by the Information & Industrial
Systems and Services Company in April, 2000 as a platform for expanding system solutions. The main approach here will
be to utilize to the full our front-end processing skills as an application service provider (ASP). In this connection, we are
enlarging and upgrading our data center, the core of our services support. We will enter the emerging area of digital data-
broadcasting by working with our affiliate, MediaServe Corporation, to build an e-commerce organization offering retailing,
billing and payment services via digital TV broadcasts.
As part of our drive into Internet-based services we established our ninth in-house company, the iValue Creation Company,
in April 2000. A wide range of on-line operations will include business-to-consumer (B2C) services that use Toshiba’s present
portals and the FreshEye search engine, to conduct “Web-top” services over broadband, mobile networks. Content-related
services will be rapidly developed through ties with such prominent partners as Time Warner, Nippon Television Network,
Kadokawa Shoten Publishing and EMI.
Establishing an Inter-Company Value Chain
We introduced the in-house company system as a means for individual companies to develop strategies for success in an age
of global mega-competition. In order to achieve the goals of our mid-term business plan, it is essential that we are able to
integrate the strengths of the different companies with one another, to expand the range of business opportunities and
enhance total value. The vehicle for this is our inter-company value chain, which can promote in-house alliances in key areas,
6
particularly among companies working in IT-related businesses. The value chain is now promoting six projects in media cards,
mobile devices, network home appliances, digital broadcasting services, Internet services and Intelligent Traffic Systems and
automotive electronics.
A Sound Base for Consistently High Returns
Raising Returns on Assets and Assuring Financial Soundness
We are taking numerous steps to use our assets more productively. The advanced customer relationship management (CRM)
and supply chain management (SCM) systems we are introducing give us the flexibility we need to handle demand fluctuations
and to improve inventory management and cut stock levels. Financial initiatives include enhanced utilization of asset-backed
securities and commitment line. New investments will be tightly focused and tracked to make sure they create value exceed-
ing the cost of capital, toward which we are promoting management systems that reflect a corporate ROE target and ROI and
free cash flow targets for each in-house company.
IT Investments to Upgrade Internal Systems
New IT systems have the potential to revolutionize management, and we have devoted considerable resources to their
development and adoption. Model CRM and SCM systems for our PC and semiconductor businesses are already being
deployed, and will be extended to cover worldwide operations. We expect them to get products to market faster and to achieve
major reductions in inventories and distribution costs. In fiscal 1999, we completed the adoption of enterprise resource
planning (ERP) software that is expected to raise productivity and returns. We are also adopting procurement EDI that will
achieve significant cost cuts by bringing all procurement activities onto the Internet by the end of fiscal 2001.
A New Style of Management
The current fiscal term will see the continued evolution of the in-house company system. Each company will have the
freedom, and responsibility, to choose the platform best suited to its markets: the current in-house status, a spin-off, alliances,
or any other approach deemed appropriate. At the same time, the corporate headquarters will seek to reinforce consolidated
performance by promoting strategic tie-ups among Toshiba Group, embracing the in-house companies and related subsidiaries
and affiliates. Such cooperation will include exchanges of human and other resources to facilitate the productive use of assets.
Another area where we are promoting change is remuneration, part of a focus on developing individual capabilities.
Performance will be given much greater weight in determining pay and promotions, and individuals will be motivated to
perform at full potential, in an environment that allows them to develop their creativity and capabilities. The in-house compa-
7
Words Into Action ...
nies will establish personnel systems suited to their operations, and new business ventures will be much more flexible, able to
offer stock options, annual-salary packages and other forms of remuneration and incentives.
Environmental protection is a central plank of management, and Toshiba seeks to work for a society that maximizes
recycling of resources. Environmental accounting was introduced in fiscal 1999, and we will step up disclosure through
environmental reports. Our goal here is to make all of Toshiba’s operations fully transparent in terms of environmental activities.
The Ultimate Goal - Increasing Toshiba’s Value
We want to close this review by restating a point we made at the beginning: fiscal 1999 was a year of transition that saw
Toshiba position itself for sustained growth and profitability in the future. This year, and in years to come, we will be
decisive in pursuing the goals of our mid-term plan. We will listen to the market, recognizing it as the source of information
we need, the force that shapes our strategy and the focus of our activities. We will foster closer links with our customers, to
better understand their needs and wants. And, most importantly, we will achieve results that meet the expectations of our
stakeholders– particularly our shareholders, customers and employees – and that earn Toshiba recognition as a respected
and valued company.
Through our products and services and our enhanced customer support, we will assure a level of performance in this and
coming years that places Toshiba in the front ranks of the world's most admired companies.
June 2000
Taizo Nishimuro Tadashi Okamura
Director Director
Chairman of the Board President and Chief Executive Officer
8
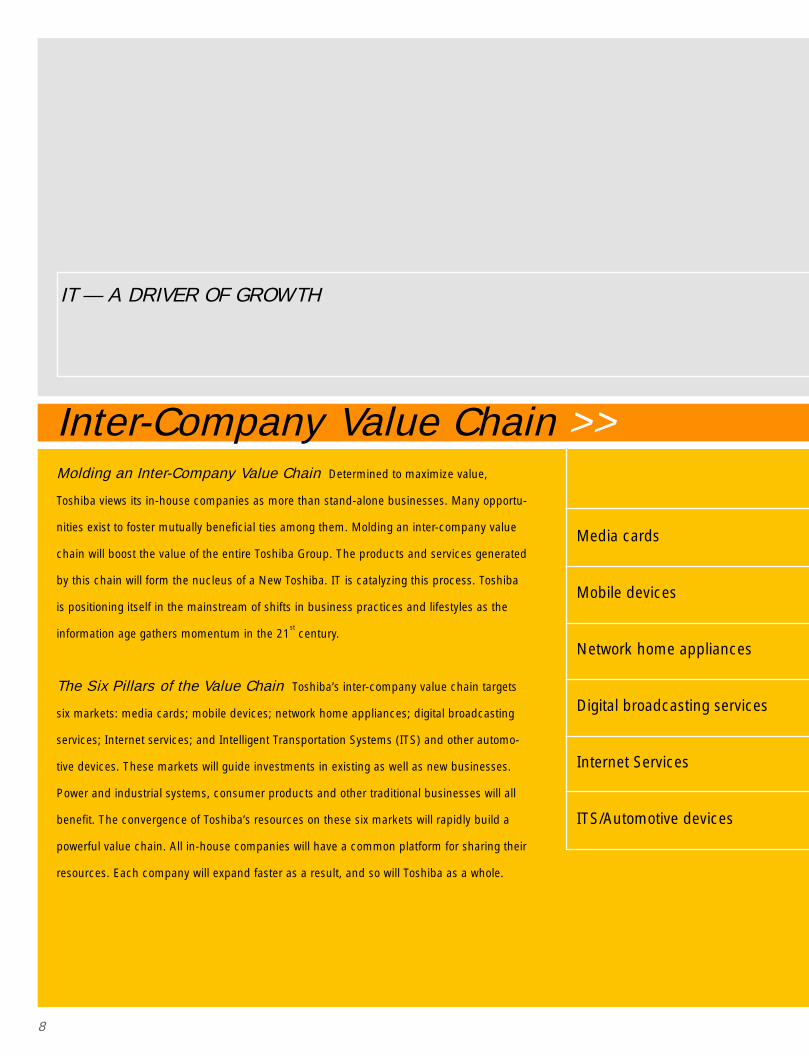
IT — A DRIVER OF GROWTH
Molding an Inter-Company Value Chain Determined to maximize value,
Toshiba views its in-house companies as more than stand-alone businesses. Many opportu-
nities exist to foster mutually beneficial ties among them. Molding an inter-company value
chain will boost the value of the entire Toshiba Group. The products and services generated
by this chain will form the nucleus of a New Toshiba. IT is catalyzing this process. Toshiba
is positioning itself in the mainstream of shifts in business practices and lifestyles as the
information age gathers momentum in the 21st century.
The Six Pillars of the Value Chain Toshiba’s inter-company value chain targets
six markets: media cards; mobile devices; network home appliances; digital broadcasting
services; Internet services; and Intelligent Transportation Systems (ITS) and other automo-
tive devices. These markets will guide investments in existing as well as new businesses.
Power and industrial systems, consumer products and other traditional businesses will all
benefit. The convergence of Toshiba’s resources on these six markets will rapidly build a
powerful value chain. All in-house companies will have a common platform for sharing their
resources. Each company will expand faster as a result, and so will Toshiba as a whole.
Media cards
Mobile devices
Network home appliances
Digital broadcasting services
Internet Services
ITS/Automotive devices
Inter-Company Value Chain >>

9
Toshiba is intently focused on a single field: information technology (IT).Toshiba is offering products ranging from information appliances like portablePCs, mobile phones, and portable audio-visual devices, all of which canfunction as portals, to cutting-edge electronic components like semiconduc-tors and LCDs. And it is coupling them with services that provide solutions forspecific customer requirements. Channeling resources to two IT domains—mobile applications and networking—will place Toshiba on a faster growthtrack, one driven by value-added products and services.
Information andIndustrial Systems
& ServicesCompany
iValue CreationCompany
Digital MediaNetworkCompany
SemiconductorCompany
Display Devices& Components
Company
Power Systems& ServicesCompany
HomeAppliancesCompany
Memory cards/applicationproducts
LCDs/Batteries
Flash memoriesContent
distribution
Wireless devicesSatellite
PCCellular phone
Telecom LSIs LCDs/BatteriesContentdistribution
Network AVDigital TV
System LSIs LCDs/BatteriesContent
distributionDigital white
goods
Mobile databroadcasting
BtoC Contentdistribution
BtoB ASP BtoC Contentdistribution
Infrastructure/application
systemsPCs for cars
System LSIsCPUs
Fuel cells
Toshiba Corporation comprises nine in-house companies as of April 1, 2000: the seven companies listed in the table, Medical Systems Company andElevator and Building Systems Company.
10
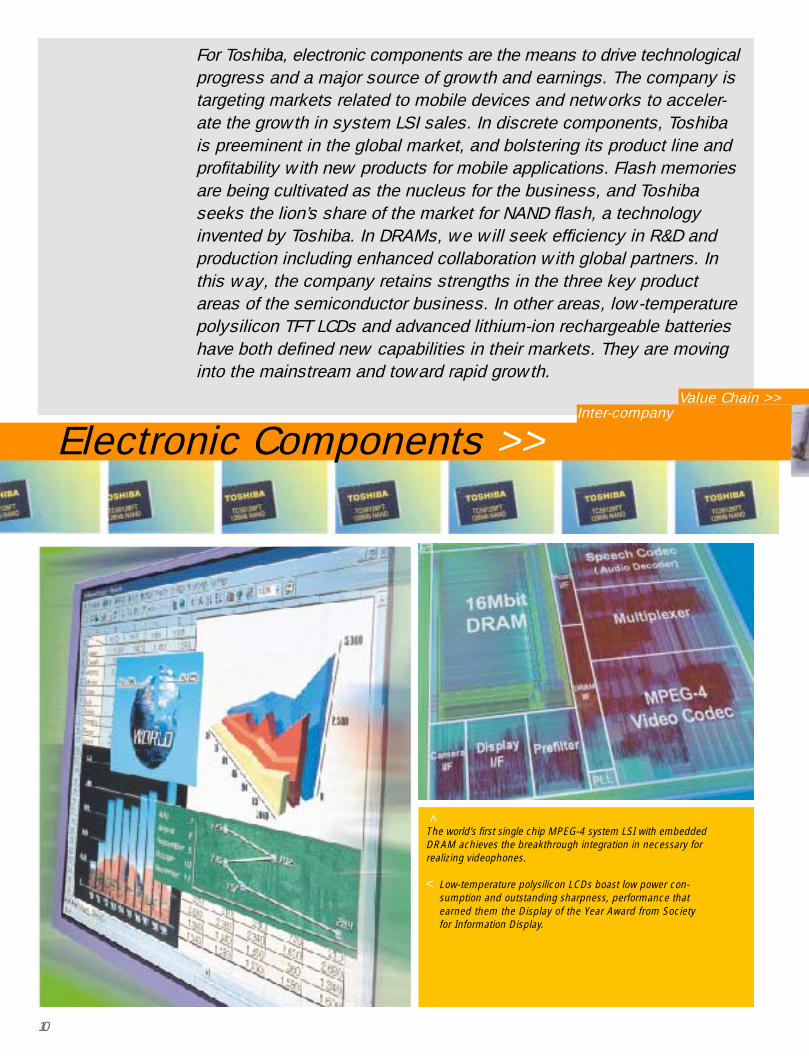
For Toshiba, electronic components are the means to drive technologicalprogress and a major source of growth and earnings. The company istargeting markets related to mobile devices and networks to acceler-ate the growth in system LSI sales. In discrete components, Toshibais preeminent in the global market, and bolstering its product line andprofitability with new products for mobile applications. Flash memoriesare being cultivated as the nucleus for the business, and Toshibaseeks the lion’s share of the market for NAND flash, a technologyinvented by Toshiba. In DRAMs, we will seek efficiency in R&D andproduction including enhanced collaboration with global partners. Inthis way, the company retains strengths in the three key productareas of the semiconductor business. In other areas, low-temperaturepolysilicon TFT LCDs and advanced lithium-ion rechargeable batterieshave both defined new capabilities in their markets. They are movinginto the mainstream and toward rapid growth.
Electronic Components >>
The world’s first single chip MPEG-4 system LSI with embeddedDRAM achieves the breakthrough integration in necessary forrealizing videophones.
< Low-temperature polysilicon LCDs boast low power con-sumption and outstanding sharpness, performance thatearned them the Display of the Year Award from Societyfor Information Display.
<
Inter-companyValue Chain >>
11
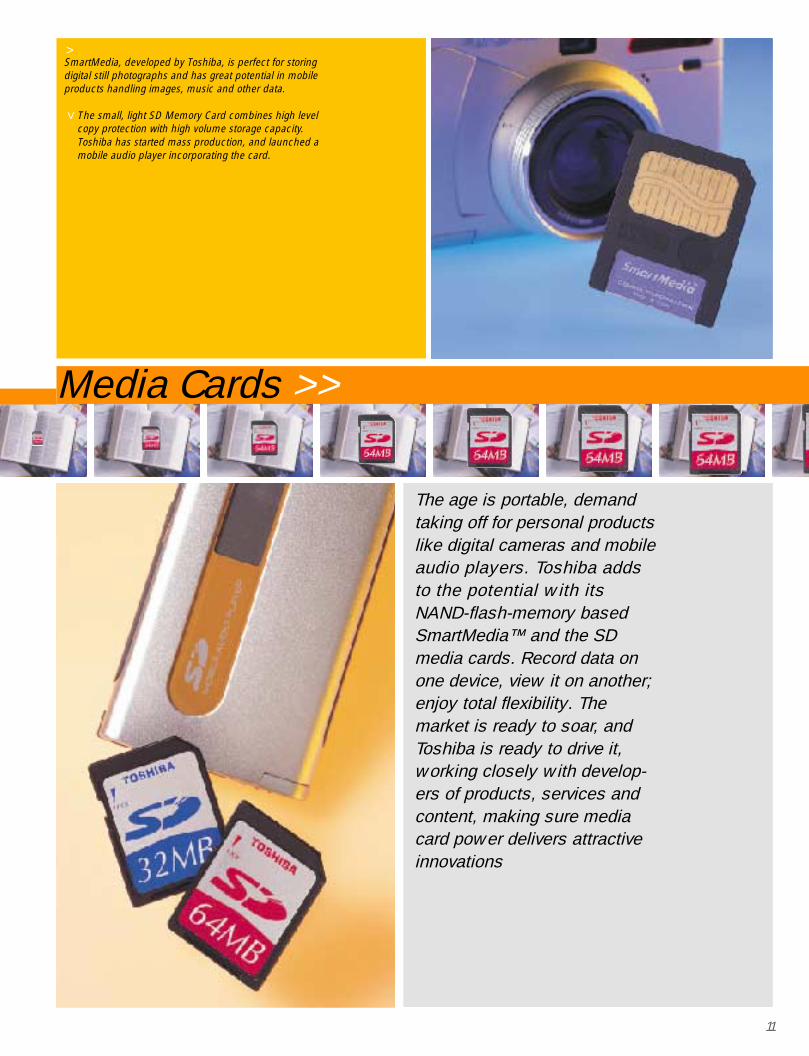
The age is portable, demandtaking off for personal productslike digital cameras and mobileaudio players. Toshiba addsto the potential with itsNAND-flash-memory basedSmartMedia™ and the SDmedia cards. Record data onone device, view it on another;enjoy total flexibility. Themarket is ready to soar, andToshiba is ready to drive it,working closely with develop-ers of products, services andcontent, making sure mediacard power delivers attractiveinnovations
Media Cards >>
SmartMedia, developed by Toshiba, is perfect for storingdigital still photographs and has great potential in mobileproducts handling images, music and other data.
The small, light SD Memory Card combines high levelcopy protection with high volume storage capacity.Toshiba has started mass production, and launched amobile audio player incorporating the card.
>
>
12
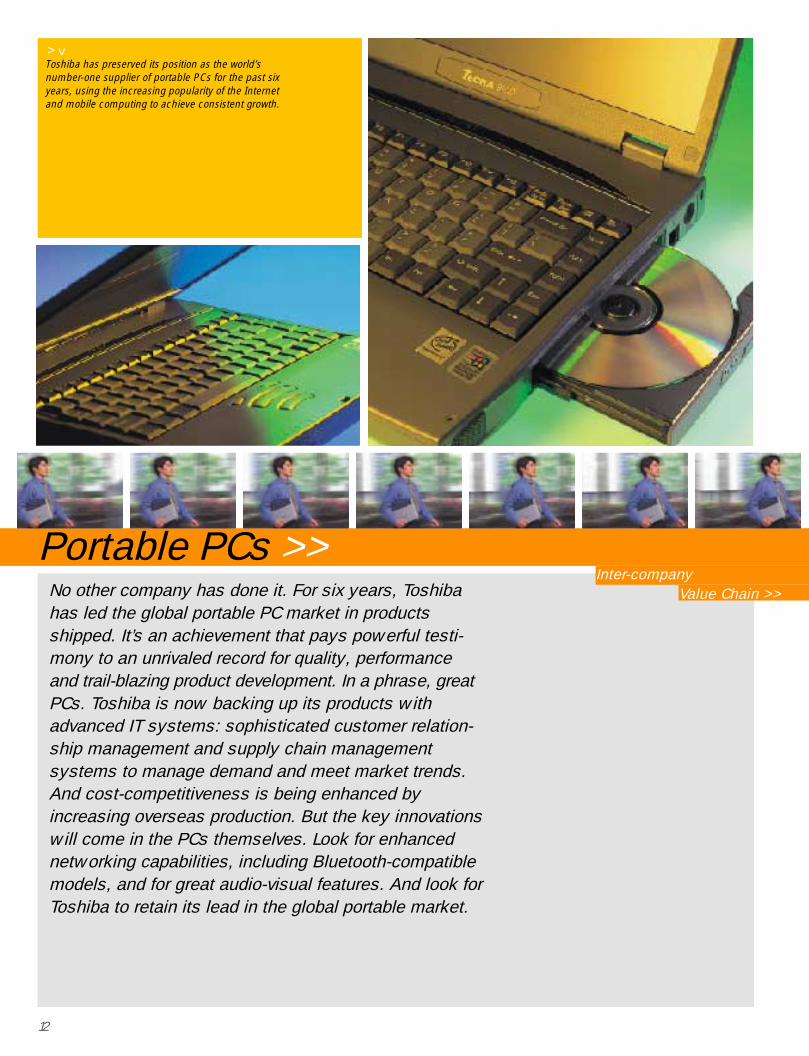
No other company has done it. For six years, Toshibahas led the global portable PC market in productsshipped. It’s an achievement that pays powerful testi-mony to an unrivaled record for quality, performanceand trail-blazing product development. In a phrase, greatPCs. Toshiba is now backing up its products withadvanced IT systems: sophisticated customer relation-ship management and supply chain managementsystems to manage demand and meet market trends.And cost-competitiveness is being enhanced byincreasing overseas production. But the key innovationswill come in the PCs themselves. Look for enhancednetworking capabilities, including Bluetooth-compatiblemodels, and for great audio-visual features. And look forToshiba to retain its lead in the global portable market.
Inter-companyValue Chain >>
Portable PCs >>
Toshiba has preserved its position as the world’snumber-one supplier of portable PCs for the past sixyears, using the increasing popularity of the Internetand mobile computing to achieve consistent growth.
<>
13
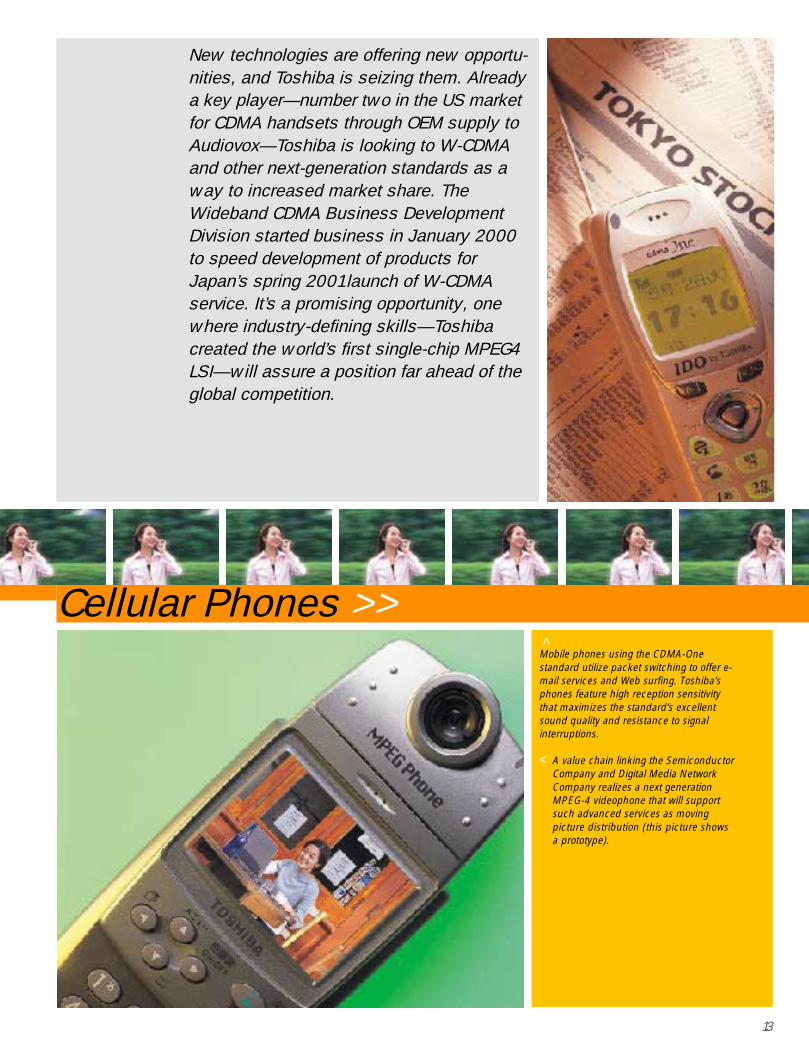
New technologies are offering new opportu-nities, and Toshiba is seizing them. Alreadya key player—number two in the US marketfor CDMA handsets through OEM supply toAudiovox—Toshiba is looking to W-CDMAand other next-generation standards as away to increased market share. TheWideband CDMA Business DevelopmentDivision started business in January 2000to speed development of products forJapan’s spring 2001 launch of W-CDMAservice. It’s a promising opportunity, onewhere industry-defining skills—Toshibacreated the world’s first single-chip MPEG4LSI—will assure a position far ahead of theglobal competition.
Cellular Phones >> Mobile phones using the CDMA-Onestandard utilize packet switching to offer e-mail services and Web surfing. Toshiba’sphones feature high reception sensitivitythat maximizes the standard’s excellentsound quality and resistance to signalinterruptions.
< A value chain linking the SemiconductorCompany and Digital Media NetworkCompany realizes a next generationMPEG-4 videophone that will supportsuch advanced services as movingpicture distribution (this picture showsa prototype).
<
14
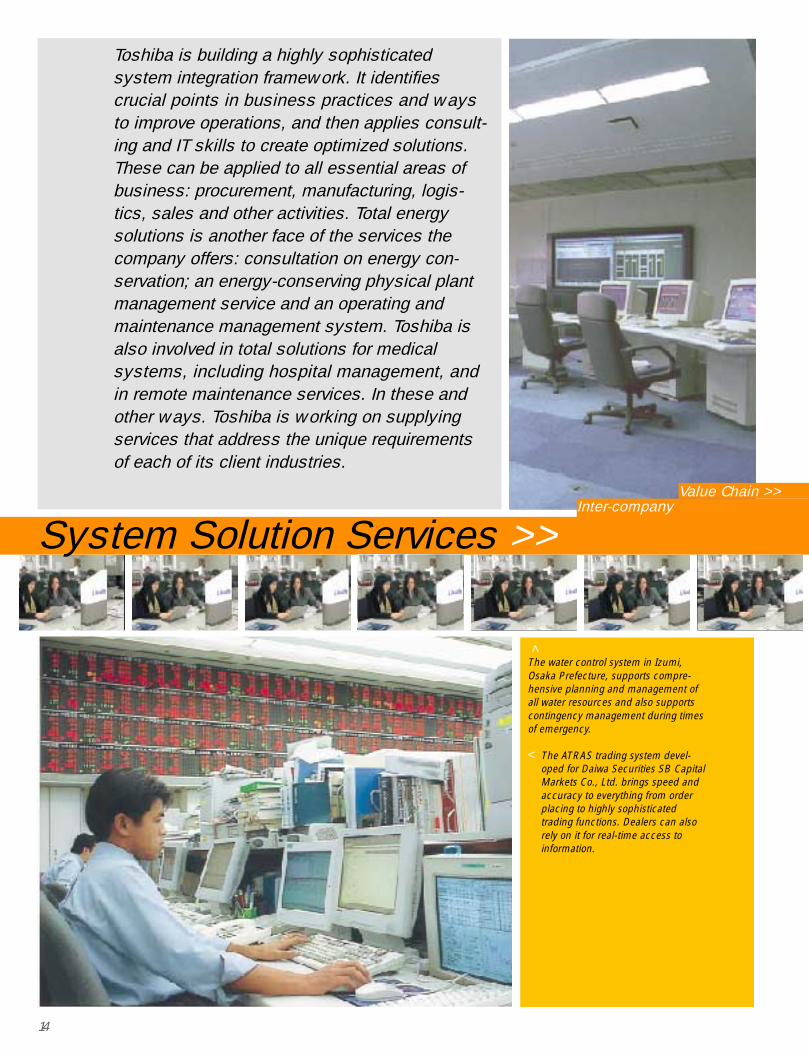
Toshiba is building a highly sophisticatedsystem integration framework. It identifiescrucial points in business practices and waysto improve operations, and then applies consult-ing and IT skills to create optimized solutions.These can be applied to all essential areas ofbusiness: procurement, manufacturing, logis-tics, sales and other activities. Total energysolutions is another face of the services thecompany offers: consultation on energy con-servation; an energy-conserving physical plantmanagement service and an operating andmaintenance management system. Toshiba isalso involved in total solutions for medicalsystems, including hospital management, andin remote maintenance services. In these andother ways. Toshiba is working on supplyingservices that address the unique requirementsof each of its client industries.
The water control system in Izumi,Osaka Prefecture, supports compre-hensive planning and management ofall water resources and also supportscontingency management during timesof emergency.
< The ATRAS trading system devel-oped for Daiwa Securities SB CapitalMarkets Co., Ltd. brings speed andaccuracy to everything from orderplacing to highly sophisticatedtrading functions. Dealers can alsorely on it for real-time access toinformation.
<
Inter-companyValue Chain >>
System Solution Services >>
15
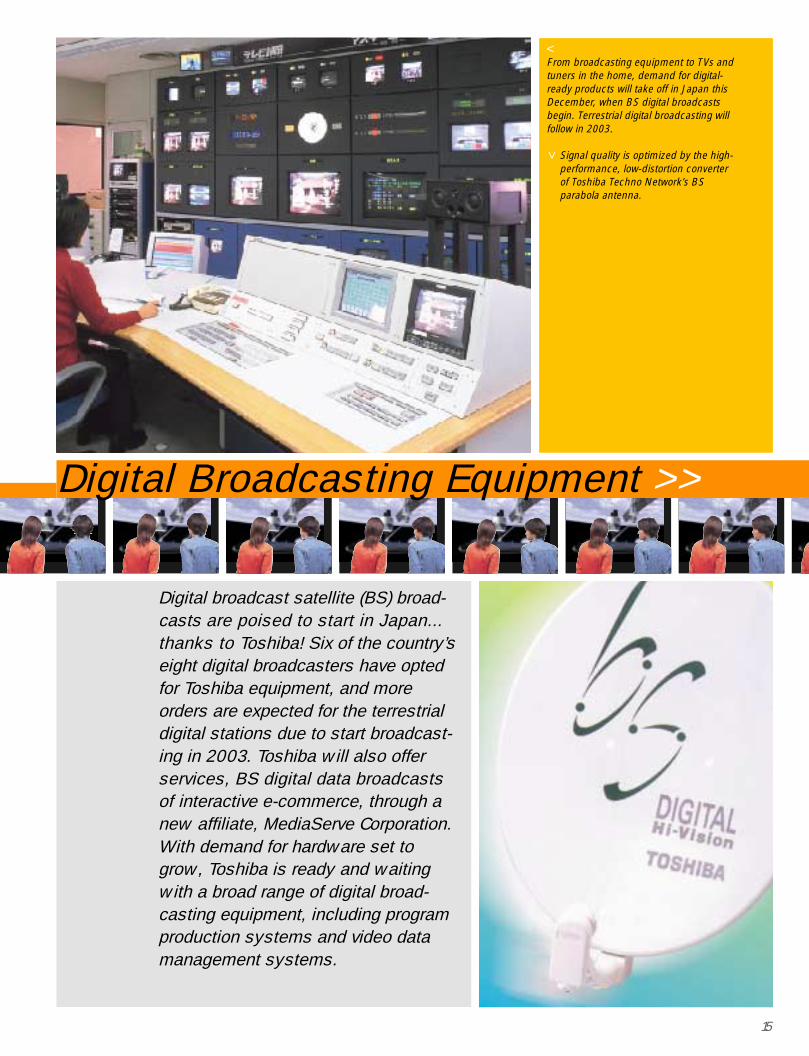
Digital broadcast satellite (BS) broad-casts are poised to start in Japan...thanks to Toshiba! Six of the country’seight digital broadcasters have optedfor Toshiba equipment, and moreorders are expected for the terrestrialdigital stations due to start broadcast-ing in 2003. Toshiba will also offerservices, BS digital data broadcastsof interactive e-commerce, through anew affiliate, MediaServe Corporation.With demand for hardware set togrow, Toshiba is ready and waitingwith a broad range of digital broad-casting equipment, including programproduction systems and video datamanagement systems.
From broadcasting equipment to TVs andtuners in the home, demand for digital-ready products will take off in Japan thisDecember, when BS digital broadcastsbegin. Terrestrial digital broadcasting willfollow in 2003.
Signal quality is optimized by the high-performance, low-distortion converterof Toshiba Techno Network’s BSparabola antenna.
<
<
Digital Broadcasting Equipment >>
16
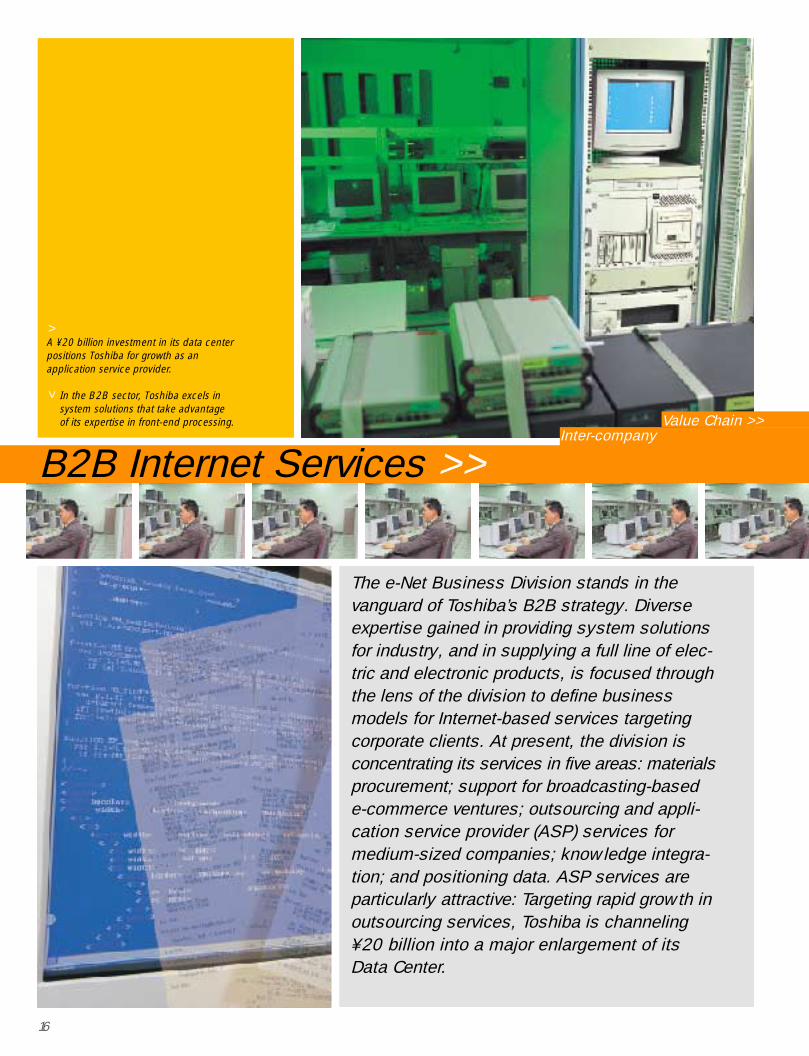
The e-Net Business Division stands in thevanguard of Toshiba’s B2B strategy. Diverseexpertise gained in providing system solutionsfor industry, and in supplying a full line of elec-tric and electronic products, is focused throughthe lens of the division to define businessmodels for Internet-based services targetingcorporate clients. At present, the division isconcentrating its services in five areas: materialsprocurement; support for broadcasting-basede-commerce ventures; outsourcing and appli-cation service provider (ASP) services formedium-sized companies; knowledge integra-tion; and positioning data. ASP services areparticularly attractive: Targeting rapid growth inoutsourcing services, Toshiba is channeling¥20 billion into a major enlargement of itsData Center.
A ¥20 billion investment in its data centerpositions Toshiba for growth as anapplication service provider.
In the B2B sector, Toshiba excels insystem solutions that take advantageof its expertise in front-end processing.
>
Inter-companyValue Chain >>
>
B2B Internet Services >>
17
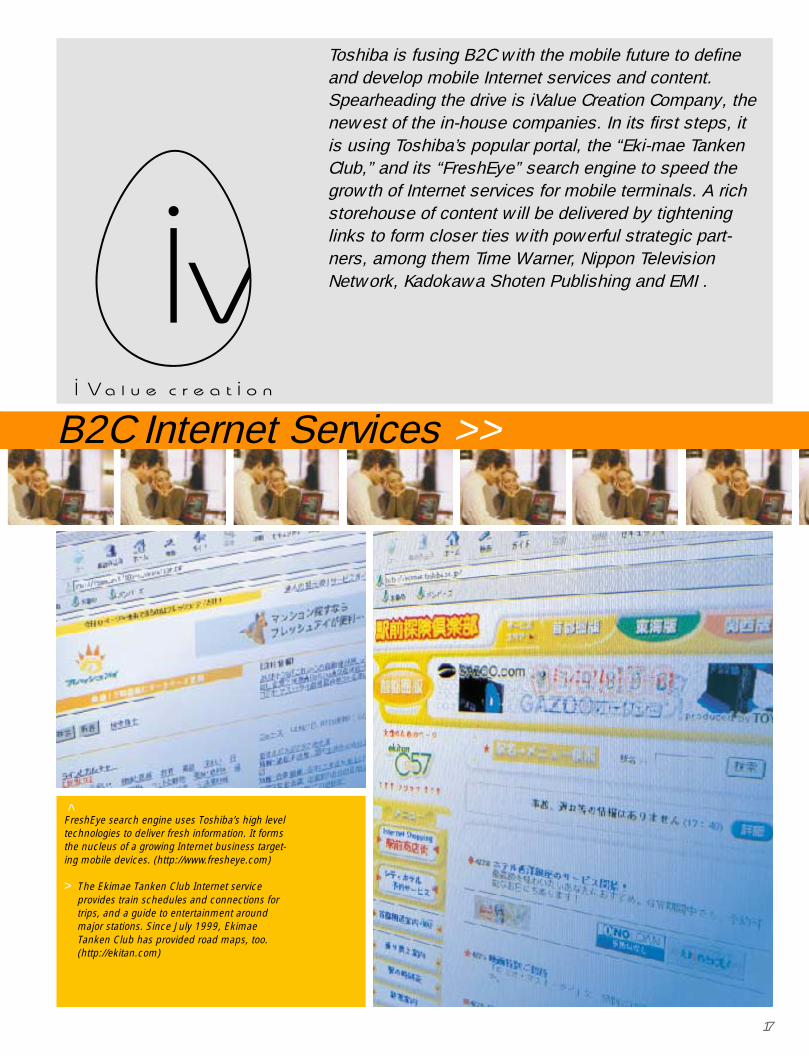
Toshiba is fusing B2C with the mobile future to defineand develop mobile Internet services and content.Spearheading the drive is iValue Creation Company, thenewest of the in-house companies. In its first steps, itis using Toshiba’s popular portal, the “Eki-mae TankenClub,” and its “FreshEye” search engine to speed thegrowth of Internet services for mobile terminals. A richstorehouse of content will be delivered by tighteninglinks to form closer ties with powerful strategic part-ners, among them Time Warner, Nippon TelevisionNetwork, Kadokawa Shoten Publishing and EMI .
FreshEye search engine uses Toshiba’s high leveltechnologies to deliver fresh information. It formsthe nucleus of a growing Internet business target-ing mobile devices. (http://www.fresheye.com)
> The Ekimae Tanken Club Internet serviceprovides train schedules and connections fortrips, and a guide to entertainment aroundmajor stations. Since July 1999, EkimaeTanken Club has provided road maps, too.(http://ekitan.com)
<
B2C Internet Services >>
18
The year saw considerable advances for broad-
casting equipment. As Japan prepared for digital
broadcasts via broadcasting satellites in late
2000, Toshiba captured crucial equipment
orders from five of six program broadcasters and
from six of eight data broadcasters, including
MediaServe Corporation, a Toshiba affiliate. The
company’s strength-in-depth in digital broad-
casting was underlined by the Telecommuni-
cations Advancement Organization of Japan’s
selection of Toshiba to provide key equipment
for six of the ten digital terrestrial experimental
broadcasting facilities it will fund under a
supplementary budget granted to the Ministry
of Posts and Telecommunications.
Progress was made in IT-based services and
communications, key areas for future growth.
Initiatives included the December 1999 establish-
ment of T&I Solution Co. Ltd., a Toshiba and IBM
Japan, Ltd. joint venture that supports banks with
data processing and communications systems.
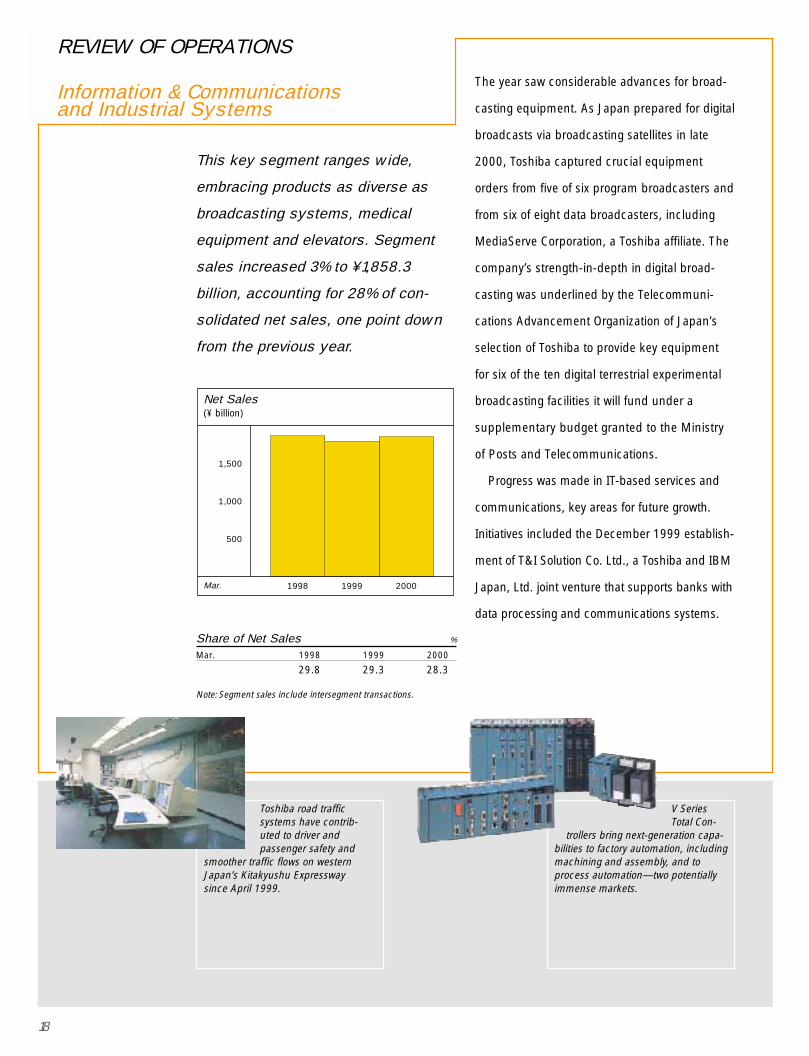
Information & Communicationsand Industrial Systems
REVIEW OF OPERATIONS
500
1,000
1,500
1999 20001998
Net Sales(¥ billion)
Mar.
This key segment ranges wide,
embracing products as diverse as
broadcasting systems, medical
equipment and elevators. Segment
sales increased 3% to ¥1,858.3
billion, accounting for 28% of con-
solidated net sales, one point down
from the previous year.
Share of Net Sales %
Mar. 1998 1999 2000
29.8 29.3 28.3
Note:Segment sales include intersegment transactions.
V SeriesTotal Con-
trollers bring next-generation capa-bilities to factory automation, includingmachining and assembly, and toprocess automation—two potentiallyimmense markets.
Toshiba road trafficsystems have contrib-uted to driver andpassenger safety and
smoother traffic flows on westernJapan’s Kitakyushu Expresswaysince April 1999.
19
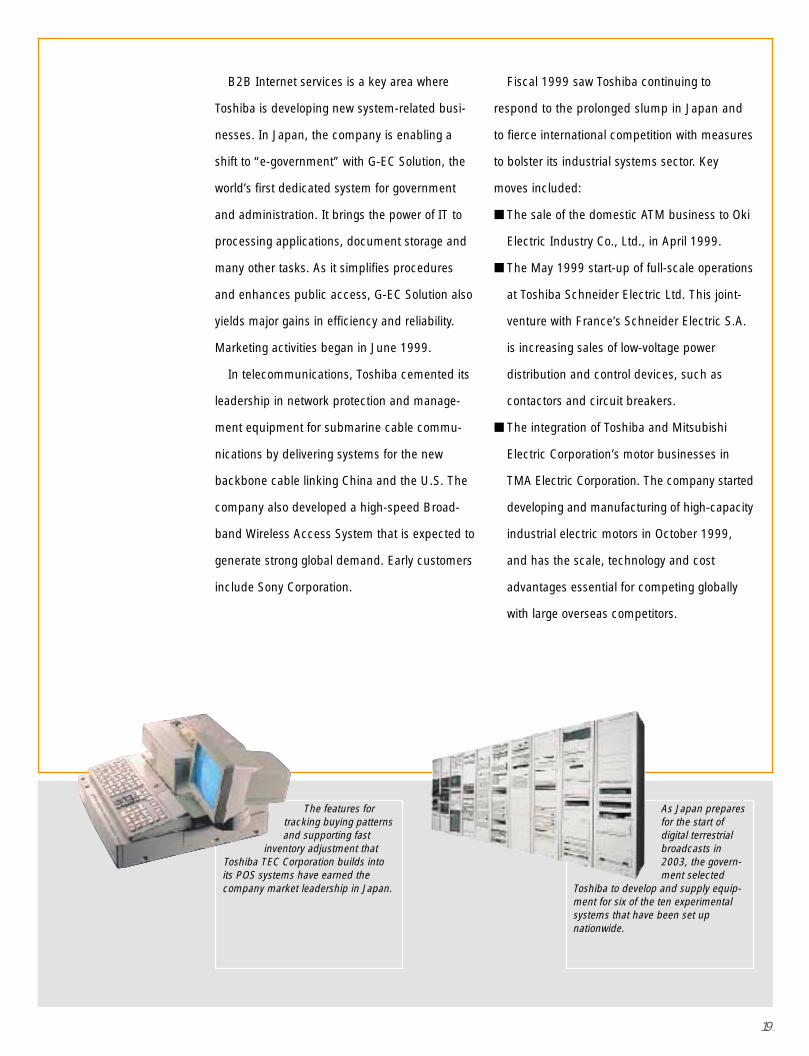
B2B Internet services is a key area where
Toshiba is developing new system-related busi-
nesses. In Japan, the company is enabling a
shift to “e-government” with G-EC Solution, the
world’s first dedicated system for government
and administration. It brings the power of IT to
processing applications, document storage and
many other tasks. As it simplifies procedures
and enhances public access, G-EC Solution also
yields major gains in efficiency and reliability.
Marketing activities began in June 1999.
In telecommunications, Toshiba cemented its
leadership in network protection and manage-
ment equipment for submarine cable commu-
nications by delivering systems for the new
backbone cable linking China and the U.S. The
company also developed a high-speed Broad-
band Wireless Access System that is expected to
generate strong global demand. Early customers
include Sony Corporation.
Fiscal 1999 saw Toshiba continuing to
respond to the prolonged slump in Japan and
to fierce international competition with measures
to bolster its industrial systems sector. Key
moves included:
■ The sale of the domestic ATM business to Oki
Electric Industry Co., Ltd., in April 1999.
■ The May 1999 start-up of full-scale operations
at Toshiba Schneider Electric Ltd. This joint-
venture with France’s Schneider Electric S.A.
is increasing sales of low-voltage power
distribution and control devices, such as
contactors and circuit breakers.
■ The integration of Toshiba and Mitsubishi
Electric Corporation’s motor businesses in
TMA Electric Corporation. The company started
developing and manufacturing of high-capacity
industrial electric motors in October 1999,
and has the scale, technology and cost
advantages essential for competing globally
with large overseas competitors.
As Japan preparesfor the start ofdigital terrestrialbroadcasts in2003, the govern-ment selected
Toshiba to develop and supply equip-ment for six of the ten experimentalsystems that have been set upnationwide.
The features fortracking buying patternsand supporting fast
inventory adjustment thatToshiba TEC Corporation builds intoits POS systems have earned thecompany market leadership in Japan.
20
■ The March 2000 agreement with General
Electric Company of the U.S. on a joint venture
in industrial control systems. Once it starts
operation in October 2000, the combined
resources of its parents will allow the new
company to better meet the demands of
current clients and to enter new markets.
Efficiency gains in sales, engineering and
maintenance are expected to shape an
extremely competitive operation.
■ The December 1999 decision to spin off
Toshiba Corporation’s industrial systems busi-
ness into two subsidiaries, one dedicated to
manufacturing the other sales, in order to
enhance cost competitiveness and respon-
siveness to market shifts. The new companies
began operations in April 2000.
The medical systems business experienced a
year of slowing demand and moves to curb
medical costs that caused sales to decline. The
company responded with competitive products,
including the Aquilion multi-slice CT system,
which integrates the world’s fastest CT scanner
with the world’s widest multi-slice detector.
Aquilion covers larger areas at higher speed and
in more detail than other CT scanners, signifi-
cantly cutting burdens on patients in terms of
scanning time, exposure to x-ray radiation and
the use of contrast agent.
Toshiba’s reputation in the elevator and esca-
lator business was burnished by winning a con-
tract to construct the world’s fastest elevators for
Taipei Financial Center, Taiwan. In other
business, the superiority of the company’s
machine-room-less SPACEL elevator generated
strong sales that are expected to continue in
2000 and beyond, as the majority of elevators
make the switch to this technology. Another
highlight was expansion of a technology sharing
agreement with Kone Corporation of Finland.
The latestadditionto theAcquilion™series sets
the standard for multi-slice CT systems.It offers an unrivaled half-second full-rotation scanning, the fastest in theworld, and the ability to produceimages of four slices simultaneously.
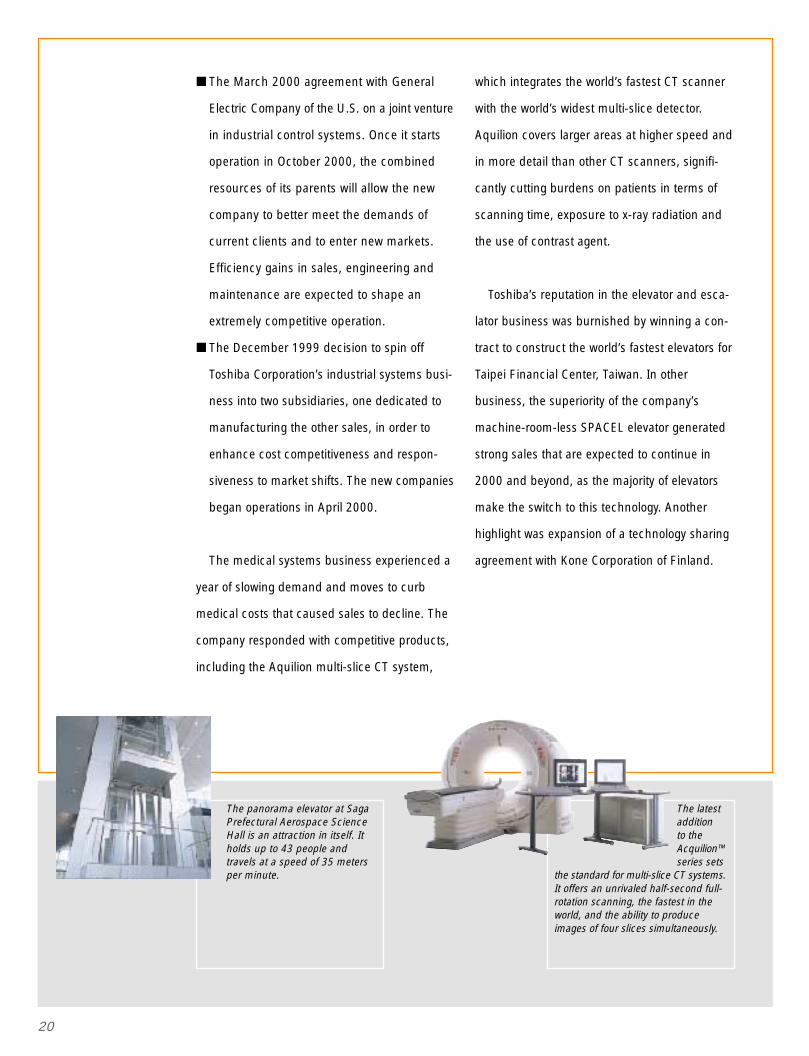
The panorama elevator at SagaPrefectural Aerospace ScienceHall is an attraction in itself. Itholds up to 43 people andtravels at a speed of 35 metersper minute.
21
Toshiba’s preeminence in mobile computing
received powerful confirmation as the com-
pany recorded an unprecedented sixth year as
number one in the global portable PC market.
Overall, PC unit shipments climbed 21 per-
cent, in support of marked sales increases in
Japan and overseas, and operating income
remained high, reinforced by successful
efforts to curb costs and inventories. With
demand rising, the company expanded opera-
tions with the April 2000 start-up of Toshiba
Computer Systems (Shanghai) Co. Ltd., a new
subsidiary in Shanghai, China that will manu-
facture and sell portable PCs.
Higher sales were also recorded in network-
related equipment. Year-on-year sales of PC
servers soared about 2.7 times through expan-
sion into Europe and China, reinforced market-
ing operations in the United States, and high
demand for entry-model units in the Japanese
market. Domestic sales of UNIX servers also
Digital Media
300
600
900
1,200
1,500
1998 1999 2000
Net Sales(¥ billion)
Mar.
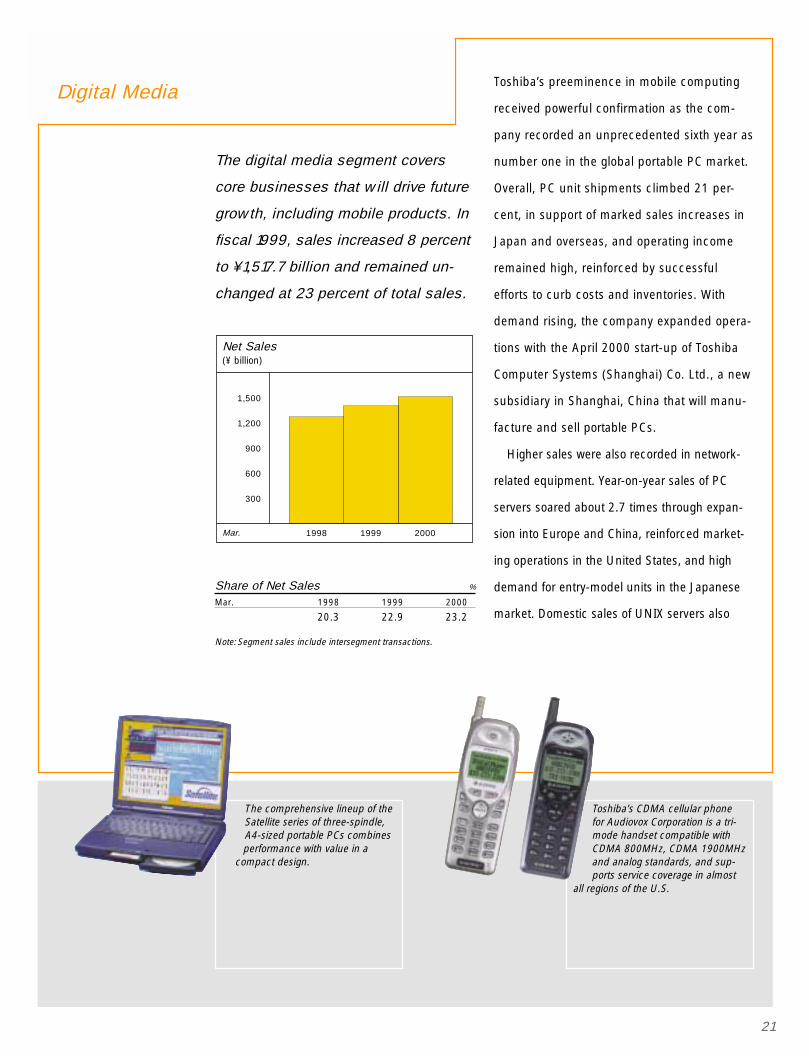
The digital media segment covers
core businesses that will drive future
growth, including mobile products. In
fiscal 1999, sales increased 8 percent
to ¥1,517.7 billion and remained un-
changed at 23 percent of total sales.
Share of Net Sales %
Mar. 1998 1999 2000
20.3 22.9 23.2
Note:Segment sales include intersegment transactions.
Toshiba’s CDMA cellular phonefor Audiovox Corporation is a tri-mode handset compatible withCDMA 800MHz, CDMA 1900MHzand analog standards, and sup-ports service coverage in almost
all regions of the U.S.
The comprehensive lineup of theSatellite series of three-spindle,A4-sized portable PCs combinesperformance with value in a
compact design.
22
grew, alongside strong demand for Internet
business servers. In the U.S., Toshiba developed
the first cable modem to be certified by Cable
Labs, a move that won major orders from U.S.
CATV operators.
With cellular phone penetration of the Japa-
nese market at an all-time high, the year saw a
slowdown in the pace of new subscriptions.
Demand for upgraded handsets more than
made up for this, particularly for phones sup-
porting Internet capabilities. Demand for cellular
phones also climbed in North America, as
CDMA and other digital formats attracted new
subscribers. In this positive environment,
Toshiba generated significant increases in
orders, sales and earnings.
The growing demand for computers provided
a welcome stimulus in data storage equipment.
New 2.5-inch hard disk drives for the notebook
PC market, featuring GMR heads and the
industry’s highest data recording density,
enjoyed steady sales growth. Expansion was
more dramatic in optical disk drives, where the
accelerating shift from CD-ROM drives to DVD-
ROM spurred a surge in demand. Toshiba’s slim
models proved particularly popular and took the
lead in market share.
Video products enjoyed solid domestic busi-
ness as consumers readied for the start of BS
digital broadcasts in 2000. Flat-screen color TVs
increased market share, with interest focused on
models offering the higher picture quality of
progressive scan technology, D3/D4 digital con-
nection terminals and other features needed for
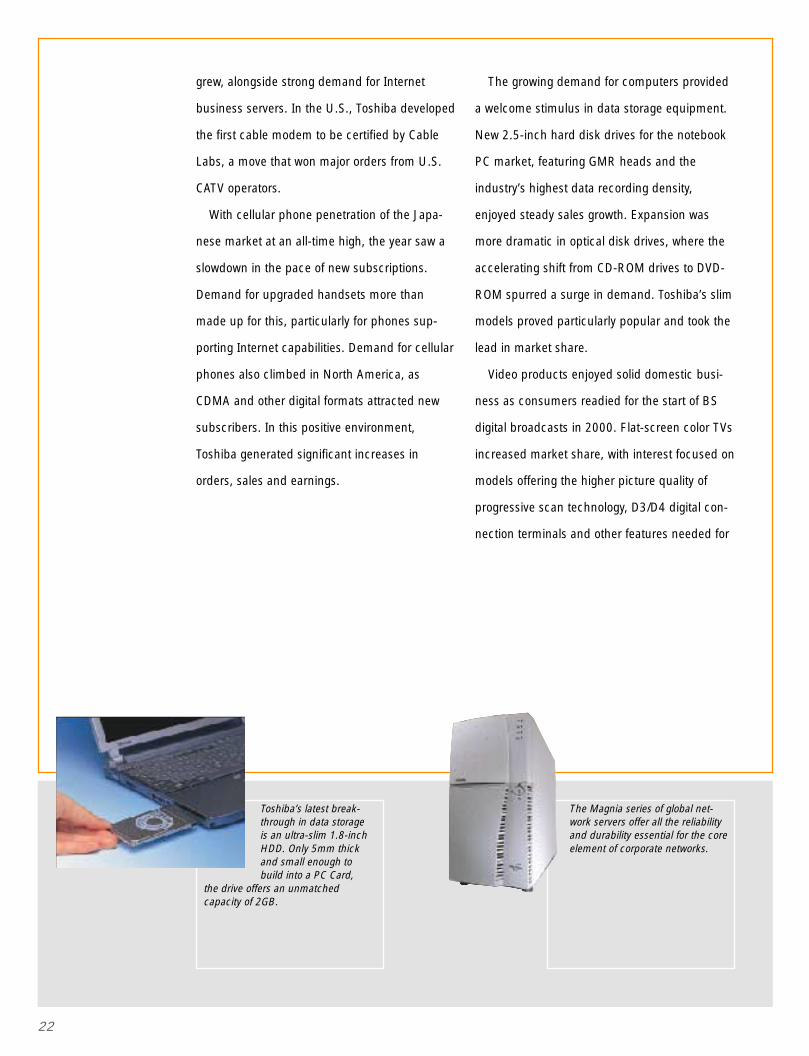
The Magnia series of global net-work servers offer all the reliabilityand durability essential for the coreelement of corporate networks.
Toshiba’s latest break-through in data storageis an ultra-slim 1.8-inchHDD. Only 5mm thickand small enough tobuild into a PC Card,
the drive offers an unmatchedcapacity of 2GB.
23
digital reception. However, rapid yen apprecia-
tion over the year hurt the overseas market. The
growing use of PCs as a presentation tool trans-
lated into higher sales of LCD projectors in
Japan and overseas. A move away from the
traditional boxy design to round projectors
proved successful, particularly a Toshiba model
of unprecedented lightness and compactness.
DVD video players made a dramatic move
into the mainstream, with major rises in sales in
all key markets, especially North America.
Digital still cameras continued to enjoy growing
popularity, and Toshiba saw a major upswing
in sales with the worldwide success of the
“Allegretto” series. The star model was the
Allegretto M70, which combines outstanding
picture quality with a 3.37-million-pixel CCD
and wide-aperture 3X zoom lens.
In March 2000, Toshiba offered the world a
glimpse of the digital mobile future when it
unveiled a series of revolutionary products,
including the first ever mobile audio player with
SD memory card; an MPEG4-based digital
camera with 3.37-million pixel CCD; and a
portable DVD-ROM/Video player with a high
resolution low-temperature polysilicon TFT LCD.
Through such innovations Toshiba will realize
the full potential of the networked era.
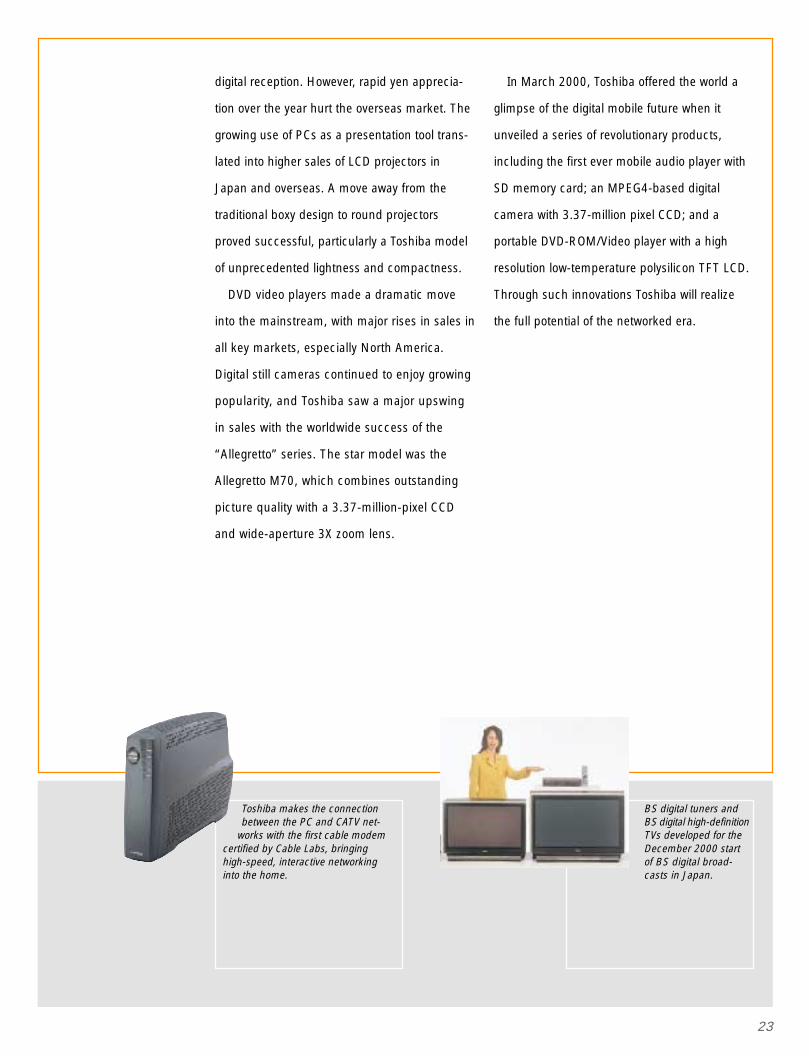
BS digital tuners andBS digital high-definitionTVs developed for theDecember 2000 startof BS digital broad-casts in Japan.
Toshiba makes the connectionbetween the PC and CATV net-
works with the first cable modemcertified by Cable Labs, bringinghigh-speed, interactive networkinginto the home.
24
Power SystemsAlthough results were flat in Japan, where
electric utilities continue to squeeze capital
expenditure, growth in exports to China and the
Middle East underpinned a strategy of globaliza-
tion of operations.
Nuclear power saw major contributions to
sales from construction work at Unit No. 3 of
Onagawa Nuclear Power Station, operated by
Tohoku Electric Power Co., Inc., and replace-
ment of the reactor shroud at Unit No. 2 of
Tokyo Electric Power Co., Inc.’s Fukushima No.
1 Nuclear Power Station.
A number of large orders were received
during the year.
■ With Marubeni Corporation, Toshiba was
selected by the Abu Dhabi Electricity & Water
Authority to supply a complete network of
substations. Work began in September 1999
and will be completed by April 2001. This was
the third consecutive order in Abu Dhabi.
100
200
300
400
500
1998 1999 2000
Net Sales(¥ billion)
Mar.
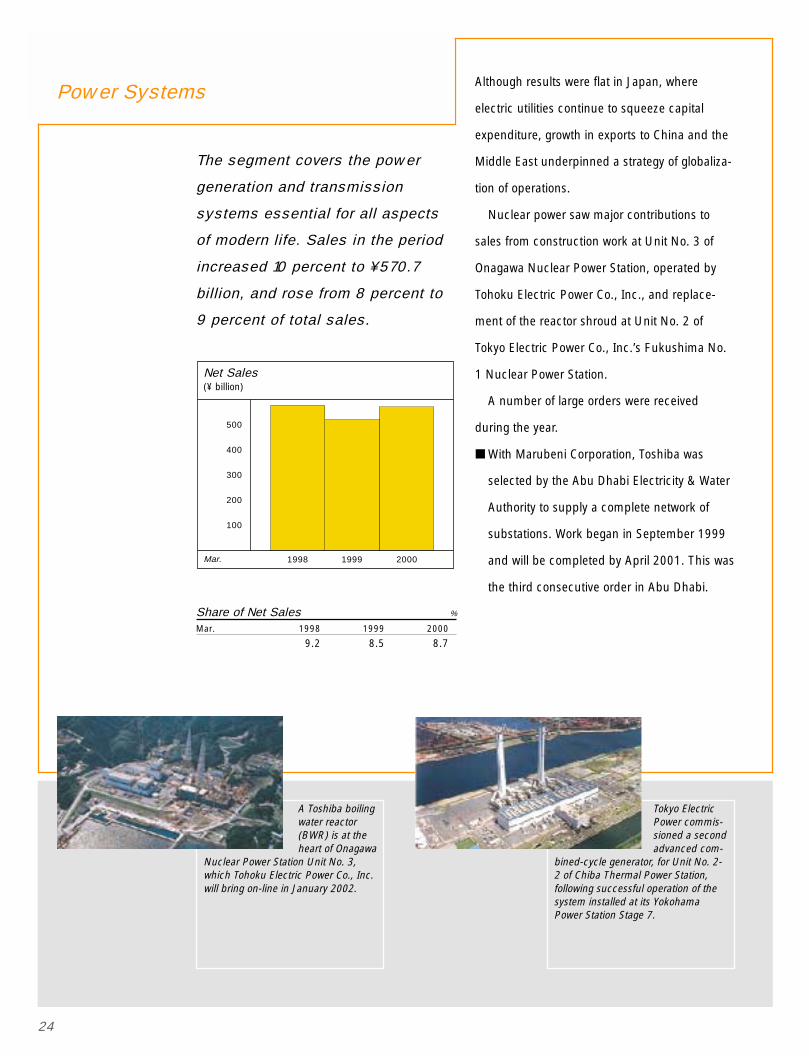
The segment covers the power
generation and transmission
systems essential for all aspects
of modern life. Sales in the period
increased 10 percent to ¥570.7
billion, and rose from 8 percent to
9 percent of total sales.
Share of Net Sales %
Mar. 1998 1999 2000
9.2 8.5 8.7
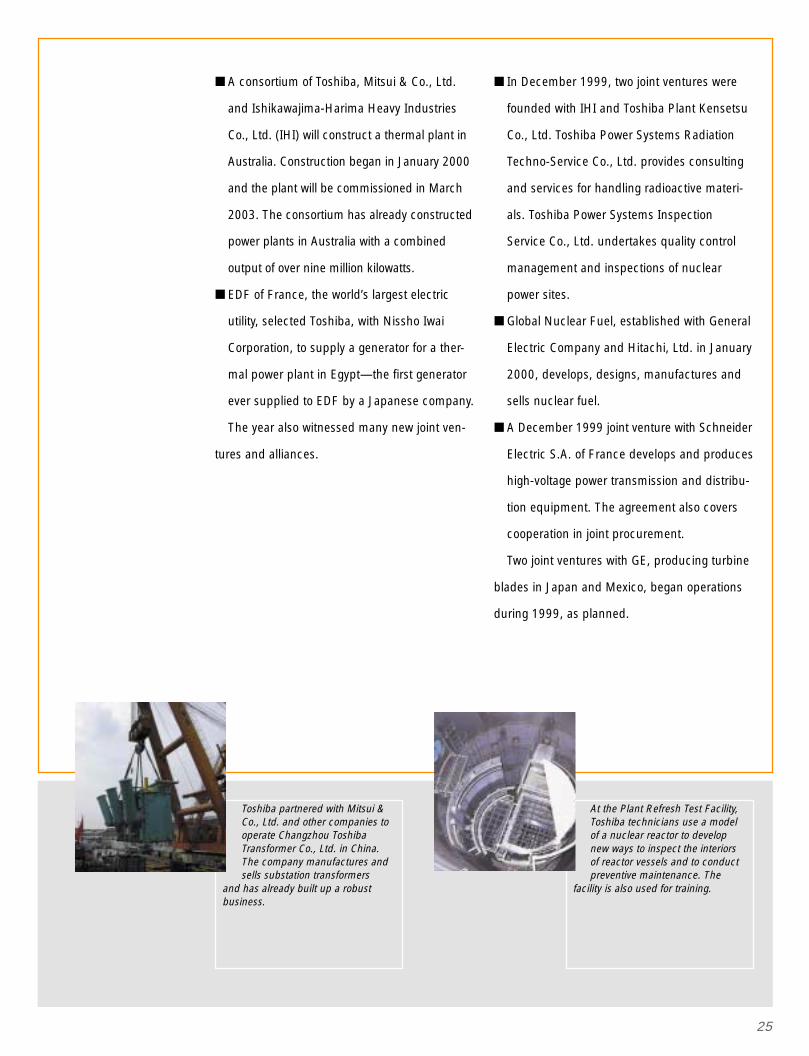
Tokyo ElectricPower commis-sioned a secondadvanced com-
bined-cycle generator, for Unit No. 2-2 of Chiba Thermal Power Station,following successful operation of thesystem installed at its YokohamaPower Station Stage 7.
A Toshiba boilingwater reactor(BWR) is at theheart of Onagawa
Nuclear Power Station Unit No. 3,which Tohoku Electric Power Co., Inc.will bring on-line in January 2002.
25
■ A consortium of Toshiba, Mitsui & Co., Ltd.
and Ishikawajima-Harima Heavy Industries
Co., Ltd. (IHI) will construct a thermal plant in
Australia. Construction began in January 2000
and the plant will be commissioned in March
2003. The consortium has already constructed
power plants in Australia with a combined
output of over nine million kilowatts.
■ EDF of France, the world’s largest electric
utility, selected Toshiba, with Nissho Iwai
Corporation, to supply a generator for a ther-
mal power plant in Egypt—the first generator
ever supplied to EDF by a Japanese company.
The year also witnessed many new joint ven-
tures and alliances.
■ In December 1999, two joint ventures were
founded with IHI and Toshiba Plant Kensetsu
Co., Ltd. Toshiba Power Systems Radiation
Techno-Service Co., Ltd. provides consulting
and services for handling radioactive materi-
als. Toshiba Power Systems Inspection
Service Co., Ltd. undertakes quality control
management and inspections of nuclear
power sites.
■ Global Nuclear Fuel, established with General
Electric Company and Hitachi, Ltd. in January
2000, develops, designs, manufactures and
sells nuclear fuel.
■ A December 1999 joint venture with Schneider
Electric S.A. of France develops and produces
high-voltage power transmission and distribu-
tion equipment. The agreement also covers
cooperation in joint procurement.
Two joint ventures with GE, producing turbine
blades in Japan and Mexico, began operations
during 1999, as planned.
At the Plant Refresh Test Facility,Toshiba technicians use a modelof a nuclear reactor to developnew ways to inspect the interiorsof reactor vessels and to conductpreventive maintenance. The
facility is also used for training.
Toshiba partnered with Mitsui &Co., Ltd. and other companies tooperate Changzhou ToshibaTransformer Co., Ltd. in China.The company manufactures andsells substation transformers
and has already built up a robustbusiness.
26
A number of factors came together to increase
semiconductor sales: demand flourished for
NAND flash memories; DRAM sales benefited
from price stability and increased volumes of
128M DRAMs and other capacities; cellular
phones stimulated demand for LSIs and discrete
devices. As a result, semiconductor operations
returned to the black in the second half of the
fiscal year. LCD sales were also strong, on large
orders from manufacturers of portable PCs and
other mobile products.
With growing application in digital cameras,
music players and other products, NAND flash
memory is poised to take off. Toshiba’s full
fledged strategy for the business includes a joint
venture with SanDisk Corporation, Flash Vision
LLC. With Toshiba’s expertise in such areas as
fine-line geometry and Shallow Trench Isolation
Technology, and SanDisk’s capabilities in multi-
Electronic Devices & Components
300
600
900
1,200
1998 1999 2000
Net Sales(¥ billion)
Mar.
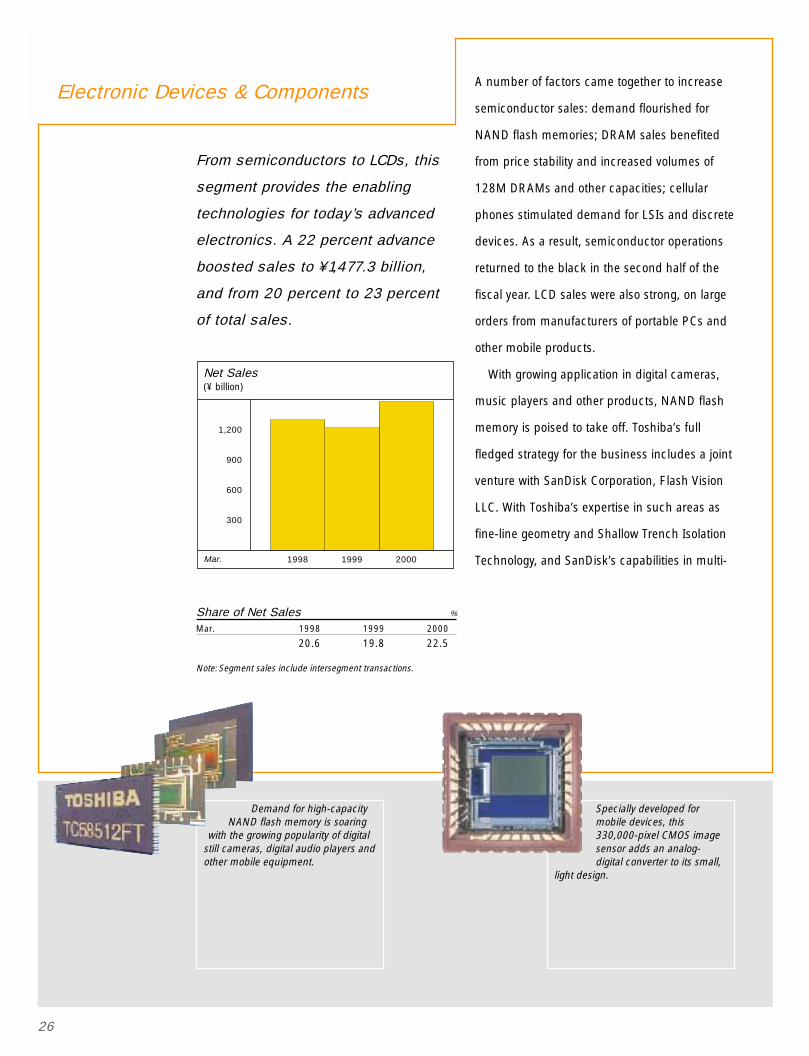
From semiconductors to LCDs, this
segment provides the enabling
technologies for today’s advanced
electronics. A 22 percent advance
boosted sales to ¥1,477.3 billion,
and from 20 percent to 23 percent
of total sales.
Share of Net Sales %
Mar. 1998 1999 2000
20.6 19.8 22.5
Note:Segment sales include intersegment transactions.
Specially developed formobile devices, this330,000-pixel CMOS imagesensor adds an analog-digital converter to its small,
light design.
Demand for high-capacityNAND flash memory is soaring
with the growing popularity of digitalstill cameras, digital audio players andother mobile equipment.
27
level cell technology, Flash Vision will develop
high-capacity NAND flash memories and con-
trollers for SD memory cards. Its products will go
into the SD memory card Toshiba developed
with SanDisk and Matsushita Electric Industrial
Co., Ltd., and into Smart Media and other
memory cards.
Toshiba’s advanced capabilities in integration
were the center of attention with the announce-
ment of “Emotion Engine”. This 128-bit CPU,
developed with Sony Computer Entertainment
Inc., for its PlayStation 2 game console, takes
game playing to a new level. A dedicated new
8-inch wafer fab at Toshiba’s Oita Operations
started to manufacture the CPU in fall 1999.
More ingenuity was demonstrated in April
2000, when Toshiba began producing the first
ever multi-chip package to combine a 64MB
NOR flash memory with an 8MB SRAM. It’s a
breakthrough device that will help make cellular
phones and other portable devices even smaller.
As it builds a solid base for long-term expan-
sion, Toshiba has restructured semiconductor
operations around three core businesses:
memories, system LSIs and discrete devices.
In line with this strategy, the company took a
number of steps in the course of the term.
■ In March 2000, Toshiba combined its know-
how in fine-geometry technology and other
skills with Dai Nippon Printing Co., Ltd.’s
knowledge of volume production techniques
to form a semiconductor photomask produc-
tion joint venture.
■ Asia Electronics Inc., a subsidiary, transferred
its semiconductor tester operation to
Advantest Corporation.
■ Toshiba decided to sell its share of logic-
device manufacturer Tohoku Semiconductor
Corporation to the joint-venture partner,
Motorola, Inc.
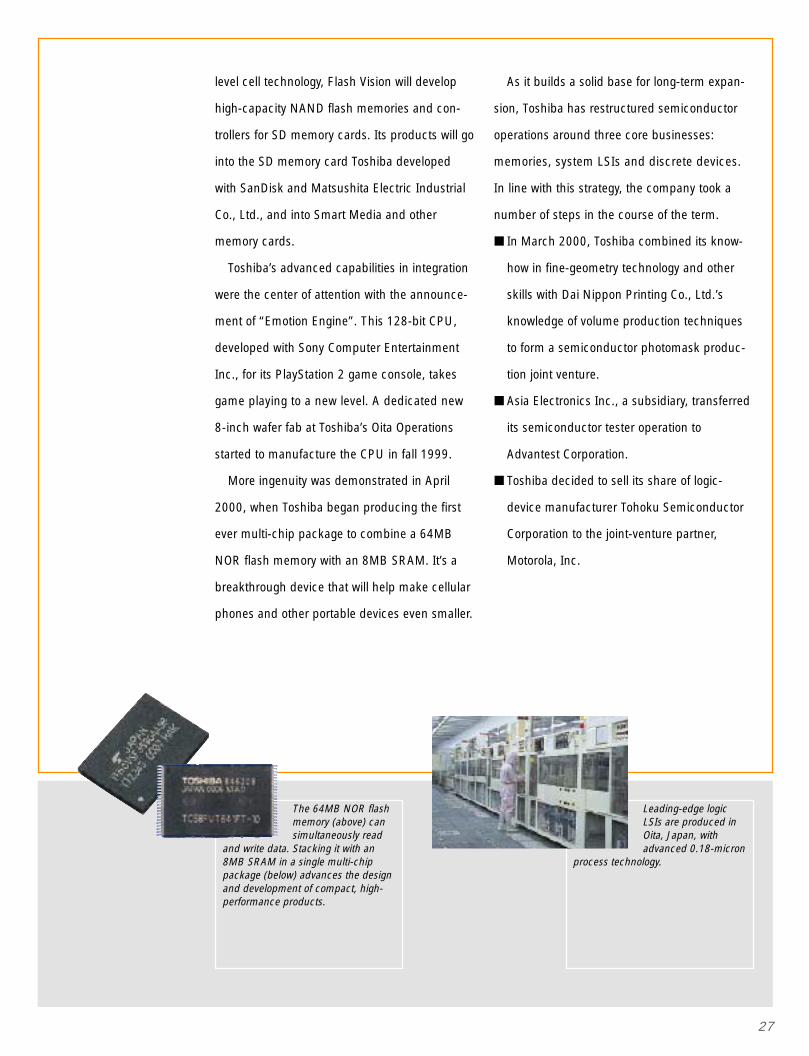
Leading-edge logicLSIs are produced inOita, Japan, withadvanced 0.18-micron
process technology.
The 64MB NOR flashmemory (above) cansimultaneously read
and write data. Stacking it with an8MB SRAM in a single multi-chippackage (below) advances the designand development of compact, high-performance products.
28
■ Toshiba agreed to purchase IBM’s share in their
joint-venture fab, Dominion Semiconductor in
the U.S. Dominion LLC will become a wholly
owned subsidiary in December 2000, and the
Toshiba DRAM and NAND flash memory pro-
duction base for North America. Shipments of
256M DRAMs will begin late in 2000.
Reorganization also saw the company set in
motion a global project to apply IT to cutting
inventories, speeding deliveries and enhancing
customer satisfaction.
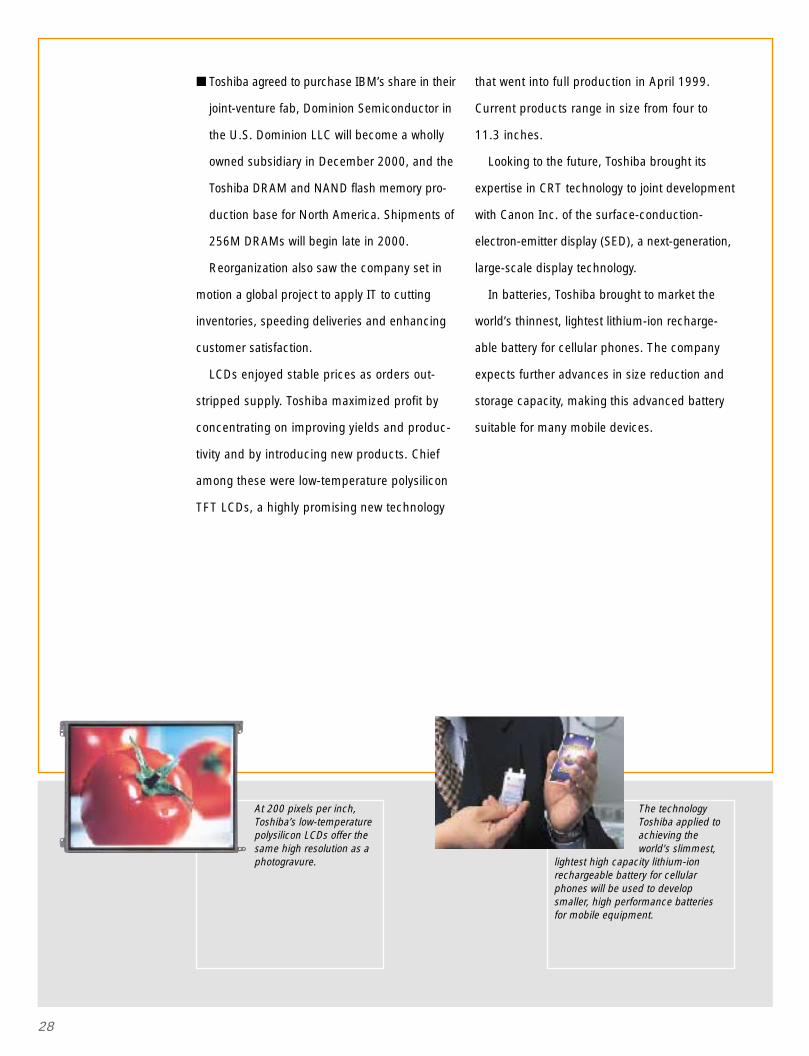
LCDs enjoyed stable prices as orders out-
stripped supply. Toshiba maximized profit by
concentrating on improving yields and produc-
tivity and by introducing new products. Chief
among these were low-temperature polysilicon
TFT LCDs, a highly promising new technology
that went into full production in April 1999.
Current products range in size from four to
11.3 inches.
Looking to the future, Toshiba brought its
expertise in CRT technology to joint development
with Canon Inc. of the surface-conduction-
electron-emitter display (SED), a next-generation,
large-scale display technology.
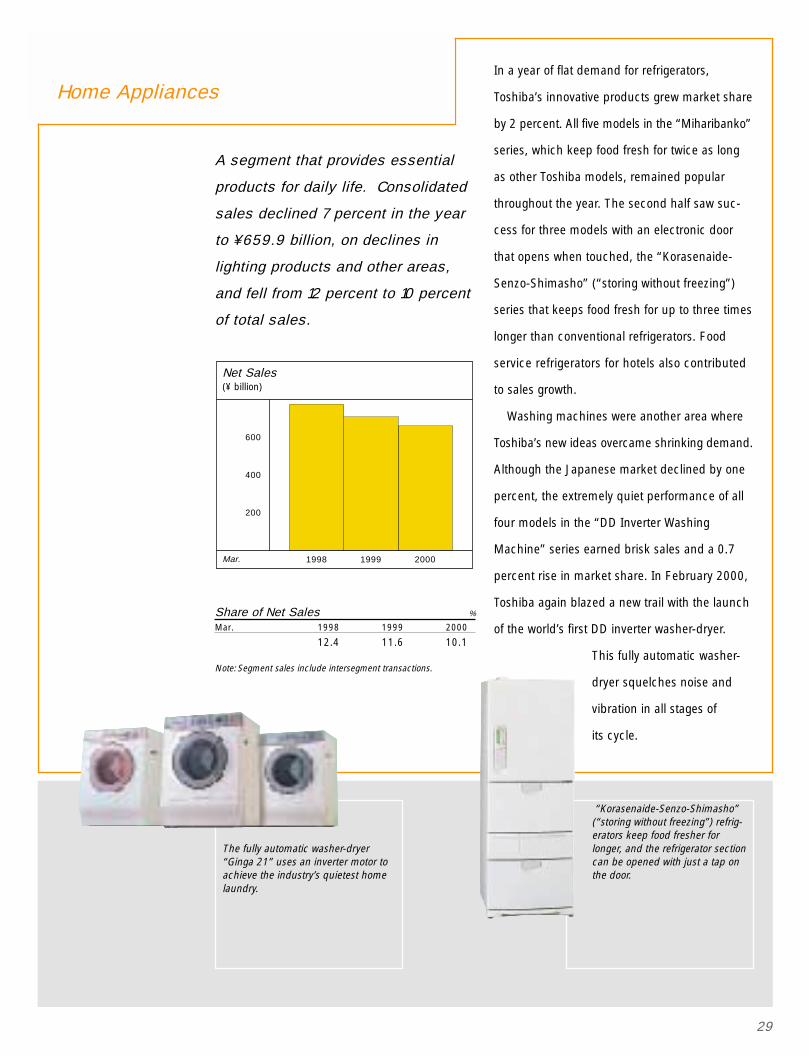
In batteries, Toshiba brought to market the
world’s thinnest, lightest lithium-ion recharge-
able battery for cellular phones. The company
expects further advances in size reduction and
storage capacity, making this advanced battery
suitable for many mobile devices.
The technologyToshiba applied toachieving theworld's slimmest,
lightest high capacity lithium-ionrechargeable battery for cellularphones will be used to developsmaller, high performance batteriesfor mobile equipment.
At 200 pixels per inch,Toshiba’s low-temperaturepolysilicon LCDs offer thesame high resolution as aphotogravure.
29
In a year of flat demand for refrigerators,
Toshiba’s innovative products grew market share
by 2 percent. All five models in the “Miharibanko”
series, which keep food fresh for twice as long
as other Toshiba models, remained popular
throughout the year. The second half saw suc-
cess for three models with an electronic door
that opens when touched, the “Korasenaide-
Senzo-Shimasho” (“storing without freezing”)
series that keeps food fresh for up to three times
longer than conventional refrigerators. Food
service refrigerators for hotels also contributed
to sales growth.
Washing machines were another area where
Toshiba’s new ideas overcame shrinking demand.
Although the Japanese market declined by one
percent, the extremely quiet performance of all
four models in the “DD Inverter Washing
Machine” series earned brisk sales and a 0.7
percent rise in market share. In February 2000,
Toshiba again blazed a new trail with the launch
of the world’s first DD inverter washer-dryer.
This fully automatic washer-
dryer squelches noise and
vibration in all stages of
its cycle.
Home Appliances
200
400
600
1998 1999 2000
Net Sales(¥ billion)
Mar.
A segment that provides essential
products for daily life. Consolidated
sales declined 7 percent in the year
to ¥659.9 billion, on declines in
lighting products and other areas,
and fell from 12 percent to 10 percent
of total sales.
Share of Net Sales %
Mar. 1998 1999 2000
12.4 11.6 10.1
Note:Segment sales include intersegment transactions.
“Korasenaide-Senzo-Shimasho”(“storing without freezing”) refrig-erators keep food fresher forlonger, and the refrigerator sectioncan be opened with just a tap onthe door.
The fully automatic washer-dryer“Ginga 21” uses an inverter motor toachieve the industry’s quietest homelaundry.
30
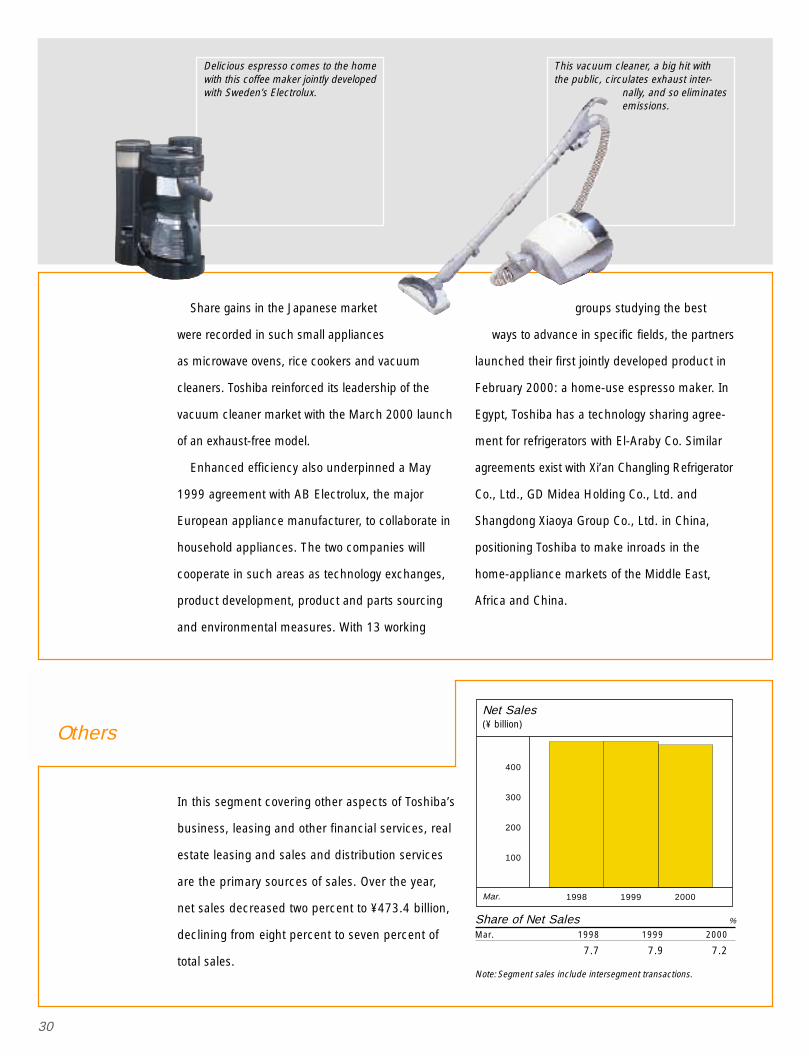
Share gains in the Japanese market
were recorded in such small appliances
as microwave ovens, rice cookers and vacuum
cleaners. Toshiba reinforced its leadership of the
vacuum cleaner market with the March 2000 launch
of an exhaust-free model.
Enhanced efficiency also underpinned a May
1999 agreement with AB Electrolux, the major
European appliance manufacturer, to collaborate in
household appliances. The two companies will
cooperate in such areas as technology exchanges,
product development, product and parts sourcing
and environmental measures. With 13 working
In this segment covering other aspects of Toshiba’s
business, leasing and other financial services, real
estate leasing and sales and distribution services
are the primary sources of sales. Over the year,
net sales decreased two percent to ¥473.4 billion,
declining from eight percent to seven percent of
total sales.
Others
100
200
300
400
1998 1999 2000
Net Sales(¥ billion)
Mar.
groups studying the best
ways to advance in specific fields, the partners
launched their first jointly developed product in
February 2000: a home-use espresso maker. In
Egypt, Toshiba has a technology sharing agree-
ment for refrigerators with El-Araby Co. Similar
agreements exist with Xi’an Changling Refrigerator
Co., Ltd., GD Midea Holding Co., Ltd. and
Shangdong Xiaoya Group Co., Ltd. in China,
positioning Toshiba to make inroads in the
home-appliance markets of the Middle East,
Africa and China.
Share of Net Sales %
Mar. 1998 1999 2000
7.7 7.9 7.2
Note:Segment sales include intersegment transactions.
This vacuum cleaner, a big hit withthe public, circulates exhaust inter-
nally, and so eliminatesemissions.
Delicious espresso comes to the homewith this coffee maker jointly developedwith Sweden’s Electrolux.
31
RESEARCH AND DEVELOPMENT
The corporate R&D Center conducts research programs that seek to anticipate
and meet the emerging needs of end users and that help to define the future
direction of Toshiba. The adoption of the in-house company system has helped
to clarify this role. Each of the nine companies works in defined markets, against
recognized competitors, a focus that makes it easier to refine core technologies
and accelerate the pace of research.
Under the mid-term business plan, and in support of the product areas being
nurtured by the inter-company value chain, we are concentrating our energies on
the critical fields of mobile communications and networks. The following para-
graphs introduce some of our recent advances in technologies that will shape
the next generation of products.
MPEG-4 System LSI for Next-
Generation Mobile Phones
This DRAM-embedded system LSI for MPEG-4
video/audio encoding will enable realization of
cellular video phones incorporating next-genera-
tion IMT-2000 technology. The LSI integrates
two essential elements: the multimedia signal
processors, with 16M DRAM, that are needed to
support videophones and multimedia browsers
on cellular phones; and a video input/output
interface supporting direct connection to a
camera or display. Mounting these functions on
a single chip and adding newly developed en-
ergy-saving circuitry cuts power consumption to
only 240mW—73% lower than for multiple
chips doing the same job. This high-perfor-
mance, low-energy design is essential for practi-
cal MPEG-4 on cellular phones.
As a key device for bringing videophone and
multimedia browser capabilities to mobile
phones, this new LSI will allow phone users to
enjoy the Internet’s rich audio and visual content
with a handset offering the same compact dimen-
sions as current models. A multitude of applica-
tions, including video telephony, will open the
way to a world of personal mobile multimedia.
“Software Defined Radio” Technology
Every new generation of cellular phone brings
new capabilities. But until now, anyone wanting
to enjoy them had to trade up for a new hand-
set, an expensive proposition. Toshiba’s “Soft-
ware Defined Radio” makes the upgrade a
software solution, not a hardware one, and can
be applied to Japan’s PDC and PHS formats and
32
to GSM, today’s most widely used format. Soft-
ware Defined Radio allows a single handset to
be updated to accommodate new capabilities,
such as e-mail and high-speed data transmis-
sions, and allows format changes that give
access to mobile communications systems
around the world.
Upgrades are delivered as a software rewrite
over the telephone, at just the press of a button.
Commercial systems can be configured that
support user verification, payment, connection
control and other capabilities.
Moving Image Broadcasting and
Reception System for Bluetooth
Toshiba has developed the world’s first
Bluetooth video transmission system incorporat-
ing MPEG-4 signal compression. The Bluetooth
standard supports wireless interconnection of
portable PCs, peripherals, mobile phones and
other mobile devices over short distances. Data
and voice transmissions require no intricate
operations, but Toshiba’s new system employs
Bluetooth for seamless transmission of MPEG-4
video between the Internet and Bluetooth net-
works. Video conferencing is one potential appli-
cation, telephony another: audio and video
signals could be transferred from mobile termi-
nals through Bluetooth to W-CDMA or other
next-generation wireless systems.
High-Capacity, Ultra-Slim Advanced
Lithium-Ion Battery
With the advanced lithium-ion battery (ALB),
Toshiba has unveiled a breakthrough in battery
technology for cellular phones that also has
much wider potential. Batteries hold the key to
reducing the size and weight of mobile devices,
and to adding functionality that increases use-
fulness. The new cellular phone battery is only
3.6mm thick, weighs a mere 13 grams and has
a weight-energy density of 160Wh/kg. These
advantages also allow replacement of the cus-
tomary metal canister with a laminated film
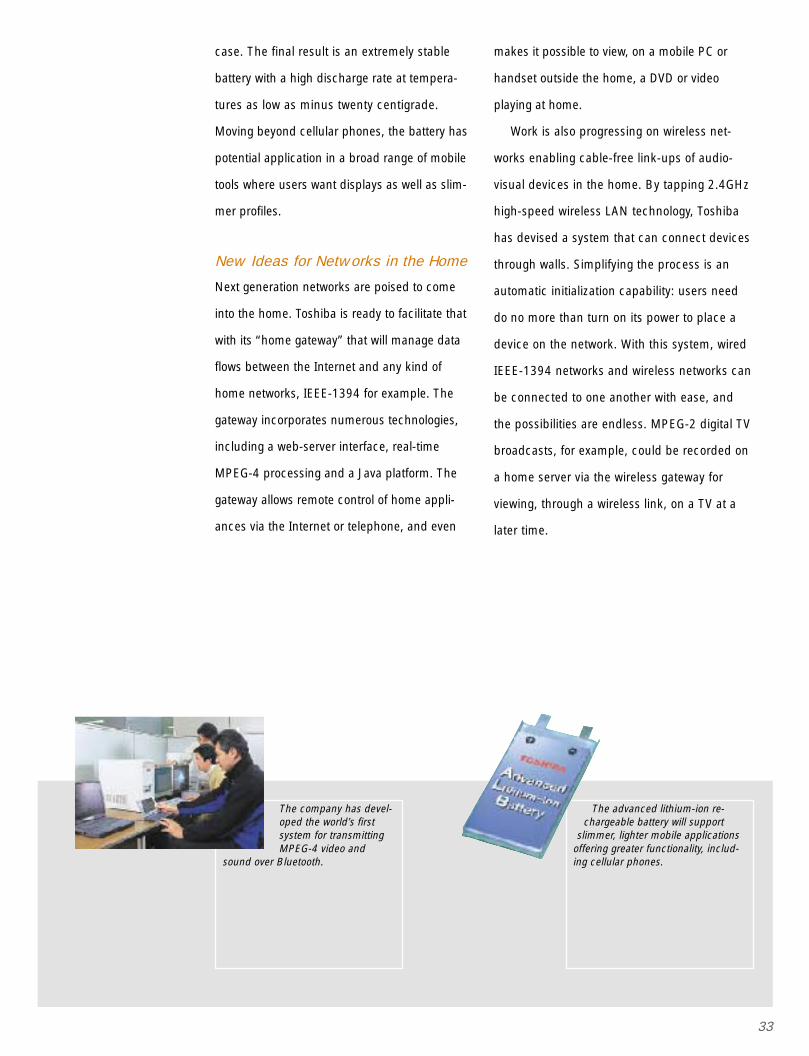
Toshiba’s prototypefor Software DefinedRadio is a softwaresolution allowing
upgrades of cellular phone functionsand changes of the operating format.
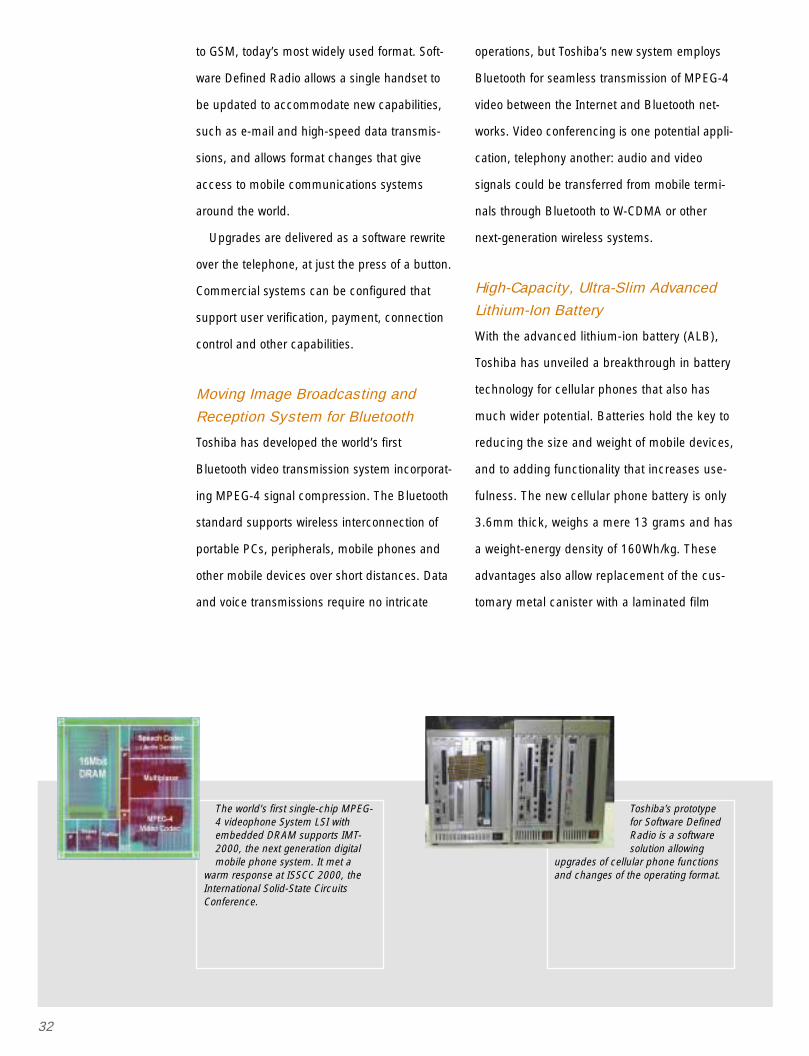
The world's first single-chip MPEG-4 videophone System LSI withembedded DRAM supports IMT-2000, the next generation digitalmobile phone system. It met a
warm response at ISSCC 2000, theInternational Solid-State CircuitsConference.
33
case. The final result is an extremely stable
battery with a high discharge rate at tempera-
tures as low as minus twenty centigrade.
Moving beyond cellular phones, the battery has
potential application in a broad range of mobile
tools where users want displays as well as slim-
mer profiles.
New Ideas for Networks in the Home
Next generation networks are poised to come
into the home. Toshiba is ready to facilitate that
with its “home gateway” that will manage data
flows between the Internet and any kind of
home networks, IEEE-1394 for example. The
gateway incorporates numerous technologies,
including a web-server interface, real-time
MPEG-4 processing and a Java platform. The
gateway allows remote control of home appli-
ances via the Internet or telephone, and even
makes it possible to view, on a mobile PC or
handset outside the home, a DVD or video
playing at home.
Work is also progressing on wireless net-
works enabling cable-free link-ups of audio-
visual devices in the home. By tapping 2.4GHz
high-speed wireless LAN technology, Toshiba
has devised a system that can connect devices
through walls. Simplifying the process is an
automatic initialization capability: users need
do no more than turn on its power to place a
device on the network. With this system, wired
IEEE-1394 networks and wireless networks can
be connected to one another with ease, and
the possibilities are endless. MPEG-2 digital TV
broadcasts, for example, could be recorded on
a home server via the wireless gateway for
viewing, through a wireless link, on a TV at a
later time.
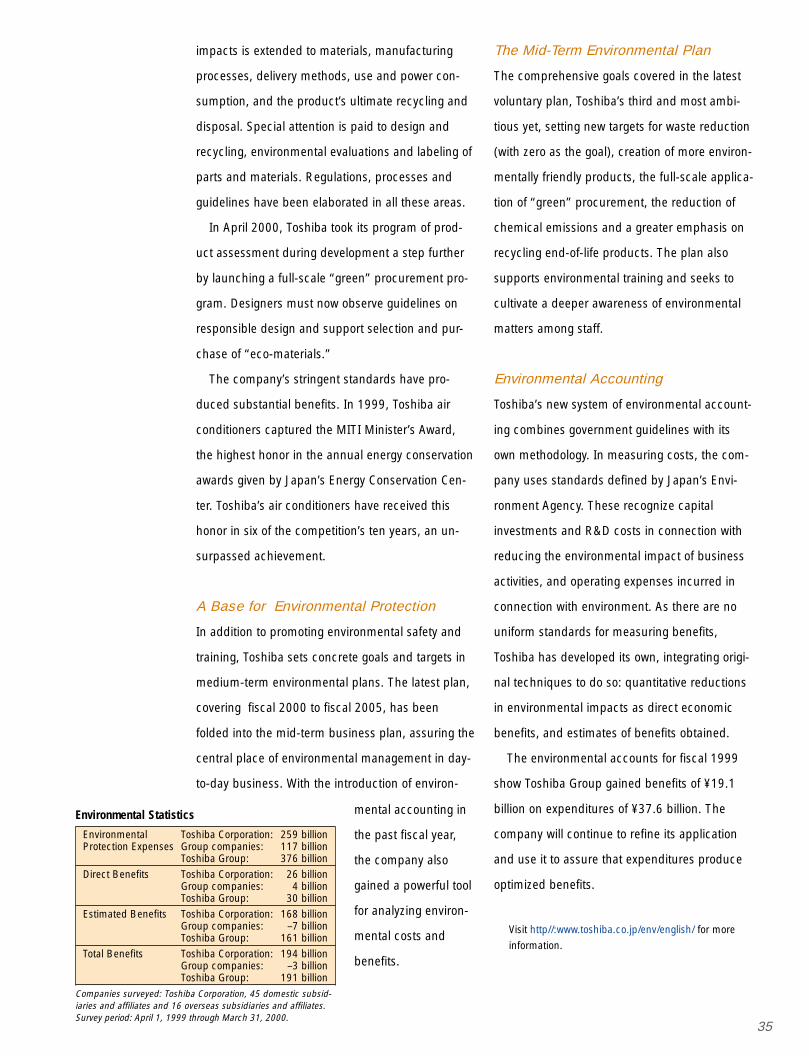
The advanced lithium-ion re-chargeable battery will support
slimmer, lighter mobile applicationsoffering greater functionality, includ-ing cellular phones.
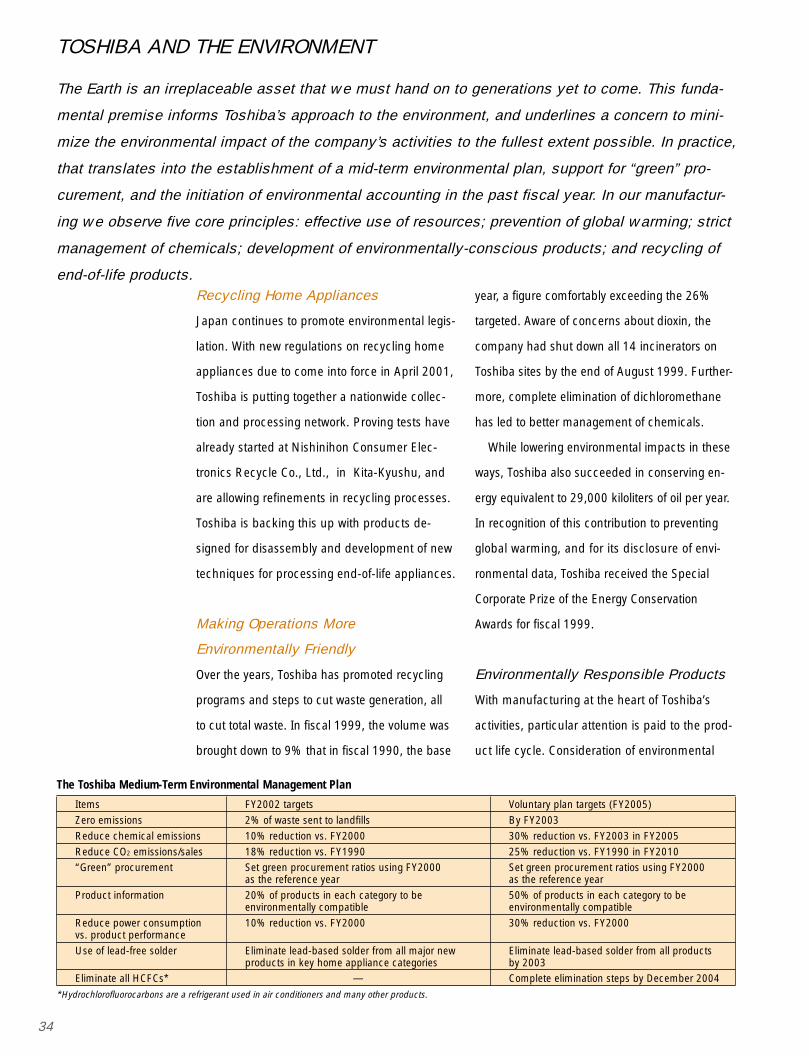
The company has devel-oped the world’s firstsystem for transmittingMPEG-4 video and
sound over Bluetooth.
34
TOSHIBA AND THE ENVIRONMENT
The Earth is an irreplaceable asset that we must hand on to generations yet to come. This funda-
mental premise informs Toshiba’s approach to the environment, and underlines a concern to mini-
mize the environmental impact of the company’s activities to the fullest extent possible. In practice,
that translates into the establishment of a mid-term environmental plan, support for “green” pro-
curement, and the initiation of environmental accounting in the past fiscal year. In our manufactur-
ing we observe five core principles: effective use of resources; prevention of global warming; strict
management of chemicals; development of environmentally-conscious products; and recycling of
end-of-life products.Recycling Home Appliances
Japan continues to promote environmental legis-
lation. With new regulations on recycling home
appliances due to come into force in April 2001,
Toshiba is putting together a nationwide collec-
tion and processing network. Proving tests have
already started at Nishinihon Consumer Elec-
tronics Recycle Co., Ltd., in Kita-Kyushu, and
are allowing refinements in recycling processes.
Toshiba is backing this up with products de-
signed for disassembly and development of new
techniques for processing end-of-life appliances.
Making Operations More
Environmentally Friendly
Over the years, Toshiba has promoted recycling
programs and steps to cut waste generation, all
to cut total waste. In fiscal 1999, the volume was
brought down to 9% that in fiscal 1990, the base
year, a figure comfortably exceeding the 26%
targeted. Aware of concerns about dioxin, the
company had shut down all 14 incinerators on
Toshiba sites by the end of August 1999. Further-
more, complete elimination of dichloromethane
has led to better management of chemicals.
While lowering environmental impacts in these
ways, Toshiba also succeeded in conserving en-
ergy equivalent to 29,000 kiloliters of oil per year.
In recognition of this contribution to preventing
global warming, and for its disclosure of envi-
ronmental data, Toshiba received the Special
Corporate Prize of the Energy Conservation
Awards for fiscal 1999.
Environmentally Responsible Products
With manufacturing at the heart of Toshiba’s
activities, particular attention is paid to the prod-
uct life cycle. Consideration of environmental
The Toshiba Medium-Term Environmental Management Plan
Items FY2002 targets Voluntary plan targets (FY2005)
Zero emissions 2% of waste sent to landfills By FY2003
Reduce chemical emissions 10% reduction vs. FY2000 30% reduction vs. FY2003 in FY2005
Reduce CO2 emissions/sales 18% reduction vs. FY1990 25% reduction vs. FY1990 in FY2010
“Green” procurement Set green procurement ratios using FY2000 Set green procurement ratios using FY2000as the reference year as the reference year
Product information 20% of products in each category to be 50% of products in each category to beenvironmentally compatible environmentally compatible
Reduce power consumption 10% reduction vs. FY2000 30% reduction vs. FY2000vs. product performance
Use of lead-free solder Eliminate lead-based solder from all major new Eliminate lead-based solder from all productsproducts in key home appliance categories by 2003
Eliminate all HCFCs* Complete elimination steps by December 2004
*Hydrochlorofluorocarbons are a refrigerant used in air conditioners and many other products.
—
35
impacts is extended to materials, manufacturing
processes, delivery methods, use and power con-
sumption, and the product’s ultimate recycling and
disposal. Special attention is paid to design and
recycling, environmental evaluations and labeling of
parts and materials. Regulations, processes and
guidelines have been elaborated in all these areas.
In April 2000, Toshiba took its program of prod-
uct assessment during development a step further
by launching a full-scale “green” procurement pro-
gram. Designers must now observe guidelines on
responsible design and support selection and pur-
chase of “eco-materials.”
The company’s stringent standards have pro-
duced substantial benefits. In 1999, Toshiba air
conditioners captured the MITI Minister’s Award,
the highest honor in the annual energy conservation
awards given by Japan’s Energy Conservation Cen-
ter. Toshiba’s air conditioners have received this
honor in six of the competition’s ten years, an un-
surpassed achievement.
A Base for Environmental Protection
In addition to promoting environmental safety and
training, Toshiba sets concrete goals and targets in
medium-term environmental plans. The latest plan,
covering fiscal 2000 to fiscal 2005, has been
folded into the mid-term business plan, assuring the
central place of environmental management in day-
to-day business. With the introduction of environ-
The Mid-Term Environmental Plan
The comprehensive goals covered in the latest
voluntary plan, Toshiba’s third and most ambi-
tious yet, setting new targets for waste reduction
(with zero as the goal), creation of more environ-
mentally friendly products, the full-scale applica-
tion of “green” procurement, the reduction of
chemical emissions and a greater emphasis on
recycling end-of-life products. The plan also
supports environmental training and seeks to
cultivate a deeper awareness of environmental
matters among staff.
Environmental Accounting
Toshiba’s new system of environmental account-
ing combines government guidelines with its
own methodology. In measuring costs, the com-
pany uses standards defined by Japan’s Envi-
ronment Agency. These recognize capital
investments and R&D costs in connection with
reducing the environmental impact of business
activities, and operating expenses incurred in
connection with environment. As there are no
uniform standards for measuring benefits,
Toshiba has developed its own, integrating origi-
nal techniques to do so: quantitative reductions
in environmental impacts as direct economic
benefits, and estimates of benefits obtained.
The environmental accounts for fiscal 1999
show Toshiba Group gained benefits of ¥19.1
billion on expenditures of ¥37.6 billion. The
company will continue to refine its application
and use it to assure that expenditures produce
optimized benefits.
Visit http//:www.toshiba.co.jp/env/english/ for more
information.
Environmental Statistics
Environmental Toshiba Corporation: 259 billionProtection Expenses Group companies: 117 billion
Toshiba Group: 376 billion
Direct Benefits Toshiba Corporation: 26 billionGroup companies: 4 billionToshiba Group: 30 billion
Estimated Benefits Toshiba Corporation: 168 billionGroup companies: –7 billionToshiba Group: 161 billion
Total Benefits Toshiba Corporation: 194 billionGroup companies: –3 billionToshiba Group: 191 billion
Companies surveyed: Toshiba Corporation, 45 domestic subsid-iaries and affiliates and 16 overseas subsidiaries and affiliates.Survey period: April 1, 1999 through March 31, 2000.
mental accounting in
the past fiscal year,
the company also
gained a powerful tool
for analyzing environ-
mental costs and
benefits.
36
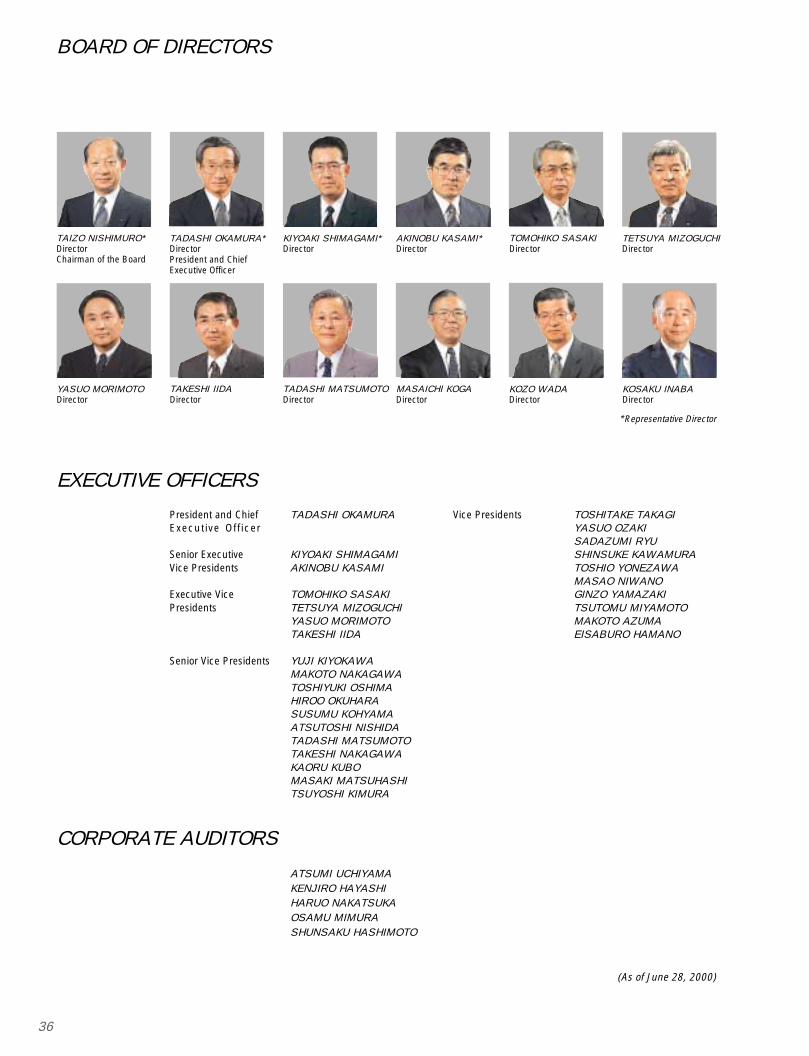
BOARD OF DIRECTORS
President and Chief TADASHI OKAMURAExecutive Officer
Senior Executive KIYOAKI SHIMAGAMIVice Presidents AKINOBU KASAMI
Executive Vice TOMOHIKO SASAKIPresidents TETSUYA MIZOGUCHI
YASUO MORIMOTOTAKESHI IIDA
Senior Vice Presidents YUJI KIYOKAWAMAKOTO NAKAGAWATOSHIYUKI OSHIMAHIROO OKUHARASUSUMU KOHYAMAATSUTOSHI NISHIDATADASHI MATSUMOTOTAKESHI NAKAGAWAKAORU KUBOMASAKI MATSUHASHITSUYOSHI KIMURA
Vice Presidents TOSHITAKE TAKAGIYASUO OZAKISADAZUMI RYUSHINSUKE KAWAMURATOSHIO YONEZAWAMASAO NIWANOGINZO YAMAZAKITSUTOMU MIYAMOTOMAKOTO AZUMAEISABURO HAMANO
EXECUTIVE OFFICERS
TAIZO NISHIMURO*DirectorChairman of the Board
AKINOBU KASAMI*Director
KIYOAKI SHIMAGAMI*Director
TADASHI OKAMURA*DirectorPresident and ChiefExecutive Officer
CORPORATE AUDITORS
ATSUMI UCHIYAMAKENJIRO HAYASHIHARUO NAKATSUKAOSAMU MIMURASHUNSAKU HASHIMOTO
*Representative Director
(As of June 28, 2000)
YASUO MORIMOTODirector
TETSUYA MIZOGUCHIDirector
TAKESHI IIDADirector
TADASHI MATSUMOTODirector
MASAICHI KOGADirector
TOMOHIKO SASAKIDirector
KOZO WADADirector
KOSAKU INABADirector
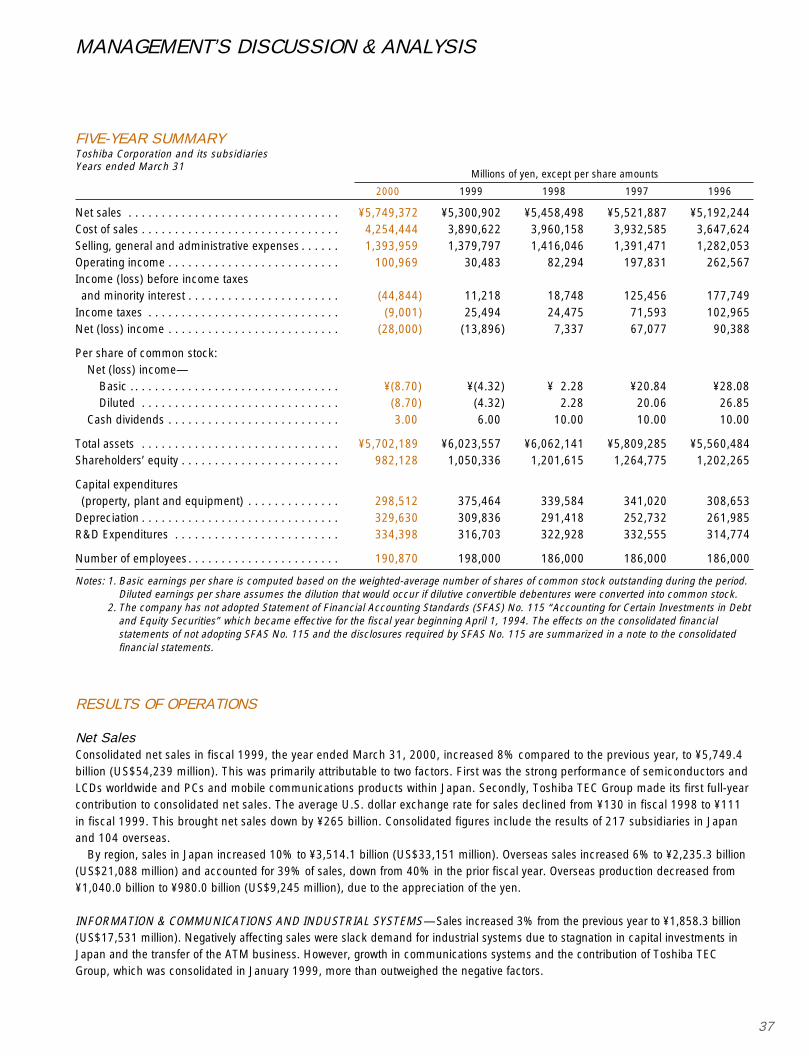
37
MANAGEMENT’S DISCUSSION & ANALYSIS
Millions of yen, except per share amounts
2000 1999 1998 1997 1996
Net sales . . . . . . . . . . . . . . . . . . . . . . . . . . . . . . . . ¥5,749,372 ¥5,300,902 ¥5,458,498 ¥5,521,887 ¥5,192,244Cost of sales . . . . . . . . . . . . . . . . . . . . . . . . . . . . . . 4,254,444 3,890,622 3,960,158 3,932,585 3,647,624Selling, general and administrative expenses . . . . . . 1,393,959 1,379,797 1,416,046 1,391,471 1,282,053Operating income . . . . . . . . . . . . . . . . . . . . . . . . . . 100,969 30,483 82,294 197,831 262,567Income (loss) before income taxesand minority interest . . . . . . . . . . . . . . . . . . . . . . . (44,844) 11,218 18,748 125,456 177,749
Income taxes . . . . . . . . . . . . . . . . . . . . . . . . . . . . . (9,001) 25,494 24,475 71,593 102,965Net (loss) income . . . . . . . . . . . . . . . . . . . . . . . . . . (28,000) (13,896) 7,337 67,077 90,388
Per share of common stock:Net (loss) income—
Basic . . . . . . . . . . . . . . . . . . . . . . . . . . . . . . . . ¥(8.70) ¥(4.32) ¥ 2.28 ¥20.84 ¥28.08Diluted . . . . . . . . . . . . . . . . . . . . . . . . . . . . . . (8.70) (4.32) 2.28 20.06 26.85
Cash dividends . . . . . . . . . . . . . . . . . . . . . . . . . . 3.00 6.00 10.00 10.00 10.00
Total assets . . . . . . . . . . . . . . . . . . . . . . . . . . . . . . ¥5,702,189 ¥6,023,557 ¥6,062,141 ¥5,809,285 ¥5,560,484Shareholders’ equity . . . . . . . . . . . . . . . . . . . . . . . . 982,128 1,050,336 1,201,615 1,264,775 1,202,265
Capital expenditures(property, plant and equipment) . . . . . . . . . . . . . . 298,512 375,464 339,584 341,020 308,653
Depreciation . . . . . . . . . . . . . . . . . . . . . . . . . . . . . . 329,630 309,836 291,418 252,732 261,985R&D Expenditures . . . . . . . . . . . . . . . . . . . . . . . . . 334,398 316,703 322,928 332,555 314,774
Number of employees . . . . . . . . . . . . . . . . . . . . . . . 190,870 198,000 186,000 186,000 186,000
Notes: 1. Basic earnings per share is computed based on the weighted-average number of shares of common stock outstanding during the period.Diluted earnings per share assumes the dilution that would occur if dilutive convertible debentures were converted into common stock.
2. The company has not adopted Statement of Financial Accounting Standards (SFAS) No. 115 “Accounting for Certain Investments in Debtand Equity Securities” which became effective for the fiscal year beginning April 1, 1994. The effects on the consolidated financialstatements of not adopting SFAS No. 115 and the disclosures required by SFAS No. 115 are summarized in a note to the consolidatedfinancial statements.
FIVE-YEAR SUMMARYToshiba Corporation and its subsidiariesYears ended March 31
RESULTS OF OPERATIONS
Net SalesConsolidated net sales in fiscal 1999, the year ended March 31, 2000, increased 8% compared to the previous year, to ¥5,749.4billion (US$54,239 million). This was primarily attributable to two factors. First was the strong performance of semiconductors andLCDs worldwide and PCs and mobile communications products within Japan. Secondly, Toshiba TEC Group made its first full-yearcontribution to consolidated net sales. The average U.S. dollar exchange rate for sales declined from ¥130 in fiscal 1998 to ¥111in fiscal 1999. This brought net sales down by ¥265 billion. Consolidated figures include the results of 217 subsidiaries in Japanand 104 overseas.
By region, sales in Japan increased 10% to ¥3,514.1 billion (US$33,151 million). Overseas sales increased 6% to ¥2,235.3 billion(US$21,088 million) and accounted for 39% of sales, down from 40% in the prior fiscal year. Overseas production decreased from¥1,040.0 billion to ¥980.0 billion (US$9,245 million), due to the appreciation of the yen.
INFORMATION & COMMUNICATIONS AND INDUSTRIAL SYSTEMS—Sales increased 3% from the previous year to ¥1,858.3 billion(US$17,531 million). Negatively affecting sales were slack demand for industrial systems due to stagnation in capital investments inJapan and the transfer of the ATM business. However, growth in communications systems and the contribution of Toshiba TECGroup, which was consolidated in January 1999, more than outweighed the negative factors.
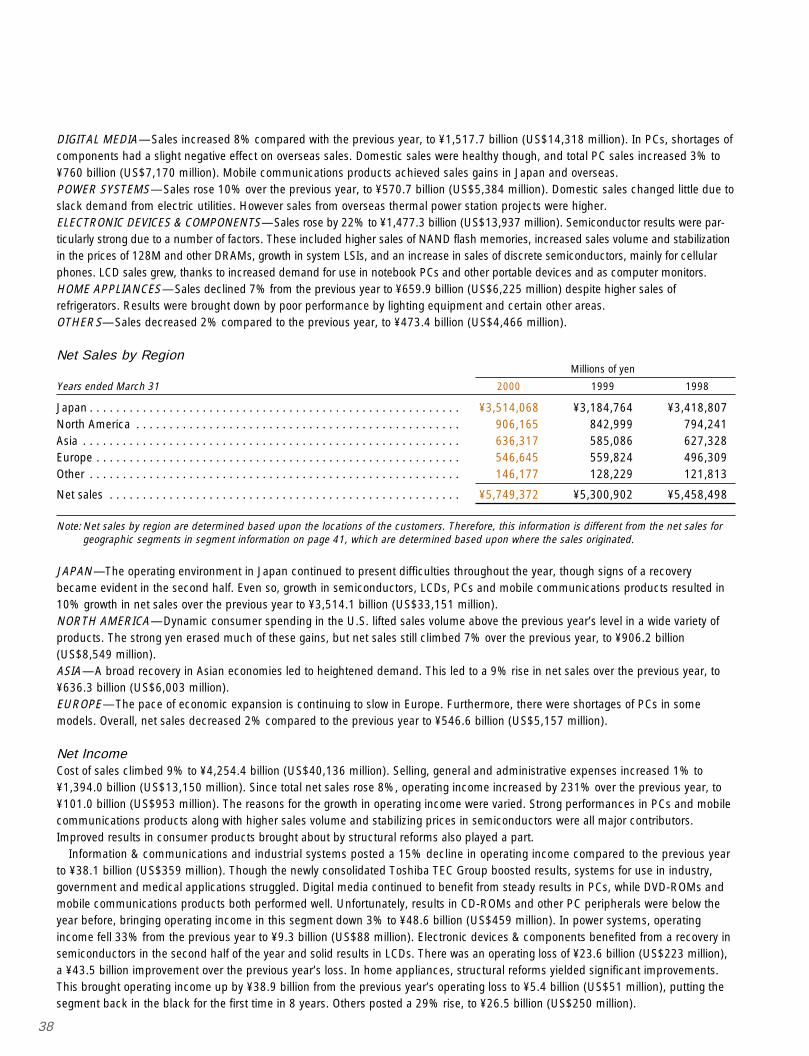
38
DIGITAL MEDIA—Sales increased 8% compared with the previous year, to ¥1,517.7 billion (US$14,318 million). In PCs, shortages ofcomponents had a slight negative effect on overseas sales. Domestic sales were healthy though, and total PC sales increased 3% to¥760 billion (US$7,170 million). Mobile communications products achieved sales gains in Japan and overseas.POWER SYSTEMS—Sales rose 10% over the previous year, to ¥570.7 billion (US$5,384 million). Domestic sales changed little due toslack demand from electric utilities. However sales from overseas thermal power station projects were higher.ELECTRONIC DEVICES & COMPONENTS—Sales rose by 22% to ¥1,477.3 billion (US$13,937 million). Semiconductor results were par-ticularly strong due to a number of factors. These included higher sales of NAND flash memories, increased sales volume and stabilizationin the prices of 128M and other DRAMs, growth in system LSIs, and an increase in sales of discrete semiconductors, mainly for cellularphones. LCD sales grew, thanks to increased demand for use in notebook PCs and other portable devices and as computer monitors.HOME APPLIANCES—Sales declined 7% from the previous year to ¥659.9 billion (US$6,225 million) despite higher sales ofrefrigerators. Results were brought down by poor performance by lighting equipment and certain other areas.OTHERS—Sales decreased 2% compared to the previous year, to ¥473.4 billion (US$4,466 million).
Net Sales by RegionMillions of yen
Years ended March 31 2000 1999 1998
Japan . . . . . . . . . . . . . . . . . . . . . . . . . . . . . . . . . . . . . . . . . . . . . . . . . . . . . . . . ¥3,514,068 ¥3,184,764 ¥3,418,807North America . . . . . . . . . . . . . . . . . . . . . . . . . . . . . . . . . . . . . . . . . . . . . . . . . 906,165 842,999 794,241Asia . . . . . . . . . . . . . . . . . . . . . . . . . . . . . . . . . . . . . . . . . . . . . . . . . . . . . . . . . 636,317 585,086 627,328Europe . . . . . . . . . . . . . . . . . . . . . . . . . . . . . . . . . . . . . . . . . . . . . . . . . . . . . . . 546,645 559,824 496,309Other . . . . . . . . . . . . . . . . . . . . . . . . . . . . . . . . . . . . . . . . . . . . . . . . . . . . . . . . 146,177 128,229 121,813
Net sales . . . . . . . . . . . . . . . . . . . . . . . . . . . . . . . . . . . . . . . . . . . . . . . . . . . . . ¥5,749,372 ¥5,300,902 ¥5,458,498
Note: Net sales by region are determined based upon the locations of the customers. Therefore, this information is different from the net sales forgeographic segments in segment information on page 41, which are determined based upon where the sales originated.
JAPAN—The operating environment in Japan continued to present difficulties throughout the year, though signs of a recoverybecame evident in the second half. Even so, growth in semiconductors, LCDs, PCs and mobile communications products resulted in10% growth in net sales over the previous year to ¥3,514.1 billion (US$33,151 million).NORTH AMERICA—Dynamic consumer spending in the U.S. lifted sales volume above the previous year’s level in a wide variety ofproducts. The strong yen erased much of these gains, but net sales still climbed 7% over the previous year, to ¥906.2 billion(US$8,549 million).ASIA—A broad recovery in Asian economies led to heightened demand. This led to a 9% rise in net sales over the previous year, to¥636.3 billion (US$6,003 million).EUROPE—The pace of economic expansion is continuing to slow in Europe. Furthermore, there were shortages of PCs in somemodels. Overall, net sales decreased 2% compared to the previous year to ¥546.6 billion (US$5,157 million).
Net IncomeCost of sales climbed 9% to ¥4,254.4 billion (US$40,136 million). Selling, general and administrative expenses increased 1% to¥1,394.0 billion (US$13,150 million). Since total net sales rose 8%, operating income increased by 231% over the previous year, to¥101.0 billion (US$953 million). The reasons for the growth in operating income were varied. Strong performances in PCs and mobilecommunications products along with higher sales volume and stabilizing prices in semiconductors were all major contributors.Improved results in consumer products brought about by structural reforms also played a part.
Information & communications and industrial systems posted a 15% decline in operating income compared to the previous yearto ¥38.1 billion (US$359 million). Though the newly consolidated Toshiba TEC Group boosted results, systems for use in industry,government and medical applications struggled. Digital media continued to benefit from steady results in PCs, while DVD-ROMs andmobile communications products both performed well. Unfortunately, results in CD-ROMs and other PC peripherals were below theyear before, bringing operating income in this segment down 3% to ¥48.6 billion (US$459 million). In power systems, operatingincome fell 33% from the previous year to ¥9.3 billion (US$88 million). Electronic devices & components benefited from a recovery insemiconductors in the second half of the year and solid results in LCDs. There was an operating loss of ¥23.6 billion (US$223 million),a ¥43.5 billion improvement over the previous year’s loss. In home appliances, structural reforms yielded significant improvements.This brought operating income up by ¥38.9 billion from the previous year’s operating loss to ¥5.4 billion (US$51 million), putting thesegment back in the black for the first time in 8 years. Others posted a 29% rise, to ¥26.5 billion (US$250 million).
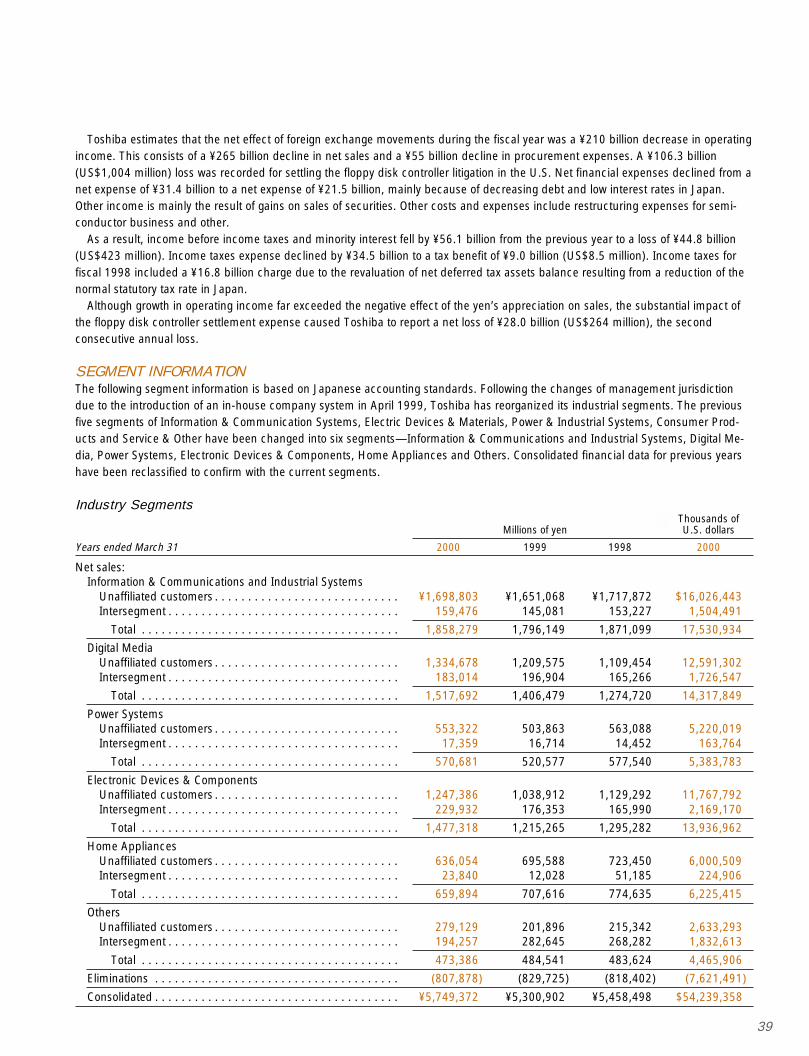
39
Toshiba estimates that the net effect of foreign exchange movements during the fiscal year was a ¥210 billion decrease in operatingincome. This consists of a ¥265 billion decline in net sales and a ¥55 billion decline in procurement expenses. A ¥106.3 billion(US$1,004 million) loss was recorded for settling the floppy disk controller litigation in the U.S. Net financial expenses declined from anet expense of ¥31.4 billion to a net expense of ¥21.5 billion, mainly because of decreasing debt and low interest rates in Japan.Other income is mainly the result of gains on sales of securities. Other costs and expenses include restructuring expenses for semi-conductor business and other.
As a result, income before income taxes and minority interest fell by ¥56.1 billion from the previous year to a loss of ¥44.8 billion(US$423 million). Income taxes expense declined by ¥34.5 billion to a tax benefit of ¥9.0 billion (US$8.5 million). Income taxes forfiscal 1998 included a ¥16.8 billion charge due to the revaluation of net deferred tax assets balance resulting from a reduction of thenormal statutory tax rate in Japan.
Although growth in operating income far exceeded the negative effect of the yen’s appreciation on sales, the substantial impact ofthe floppy disk controller settlement expense caused Toshiba to report a net loss of ¥28.0 billion (US$264 million), the secondconsecutive annual loss.
SEGMENT INFORMATIONThe following segment information is based on Japanese accounting standards. Following the changes of management jurisdictiondue to the introduction of an in-house company system in April 1999, Toshiba has reorganized its industrial segments. The previousfive segments of Information & Communication Systems, Electric Devices & Materials, Power & Industrial Systems, Consumer Prod-ucts and Service & Other have been changed into six segments—Information & Communications and Industrial Systems, Digital Me-dia, Power Systems, Electronic Devices & Components, Home Appliances and Others. Consolidated financial data for previous yearshave been reclassified to confirm with the current segments.
Industry SegmentsThousands of
Millions of yen U.S. dollars
Years ended March 31 2000 1999 1998 2000
Net sales:Information & Communications and Industrial Systems
Unaffiliated customers . . . . . . . . . . . . . . . . . . . . . . . . . . . . ¥1,698,803 ¥1,651,068 ¥1,717,872 $16,026,443Intersegment . . . . . . . . . . . . . . . . . . . . . . . . . . . . . . . . . . . 159,476 145,081 153,227 1,504,491
Total . . . . . . . . . . . . . . . . . . . . . . . . . . . . . . . . . . . . . . . 1,858,279 1,796,149 1,871,099 17,530,934
Digital MediaUnaffiliated customers . . . . . . . . . . . . . . . . . . . . . . . . . . . . 1,334,678 1,209,575 1,109,454 12,591,302Intersegment . . . . . . . . . . . . . . . . . . . . . . . . . . . . . . . . . . . 183,014 196,904 165,266 1,726,547
Total . . . . . . . . . . . . . . . . . . . . . . . . . . . . . . . . . . . . . . . 1,517,692 1,406,479 1,274,720 14,317,849
Power SystemsUnaffiliated customers . . . . . . . . . . . . . . . . . . . . . . . . . . . . 553,322 503,863 563,088 5,220,019Intersegment . . . . . . . . . . . . . . . . . . . . . . . . . . . . . . . . . . . 17,359 16,714 14,452 163,764
Total . . . . . . . . . . . . . . . . . . . . . . . . . . . . . . . . . . . . . . . 570,681 520,577 577,540 5,383,783
Electronic Devices & ComponentsUnaffiliated customers . . . . . . . . . . . . . . . . . . . . . . . . . . . . 1,247,386 1,038,912 1,129,292 11,767,792Intersegment . . . . . . . . . . . . . . . . . . . . . . . . . . . . . . . . . . . 229,932 176,353 165,990 2,169,170
Total . . . . . . . . . . . . . . . . . . . . . . . . . . . . . . . . . . . . . . . 1,477,318 1,215,265 1,295,282 13,936,962
Home AppliancesUnaffiliated customers . . . . . . . . . . . . . . . . . . . . . . . . . . . . 636,054 695,588 723,450 6,000,509Intersegment . . . . . . . . . . . . . . . . . . . . . . . . . . . . . . . . . . . 23,840 12,028 51,185 224,906
Total . . . . . . . . . . . . . . . . . . . . . . . . . . . . . . . . . . . . . . . 659,894 707,616 774,635 6,225,415
OthersUnaffiliated customers . . . . . . . . . . . . . . . . . . . . . . . . . . . . 279,129 201,896 215,342 2,633,293Intersegment . . . . . . . . . . . . . . . . . . . . . . . . . . . . . . . . . . . 194,257 282,645 268,282 1,832,613
Total . . . . . . . . . . . . . . . . . . . . . . . . . . . . . . . . . . . . . . . 473,386 484,541 483,624 4,465,906
Eliminations . . . . . . . . . . . . . . . . . . . . . . . . . . . . . . . . . . . . . (807,878) (829,725) (818,402) (7,621,491)
Consolidated . . . . . . . . . . . . . . . . . . . . . . . . . . . . . . . . . . . . . ¥5,749,372 ¥5,300,902 ¥5,458,498 $54,239,358
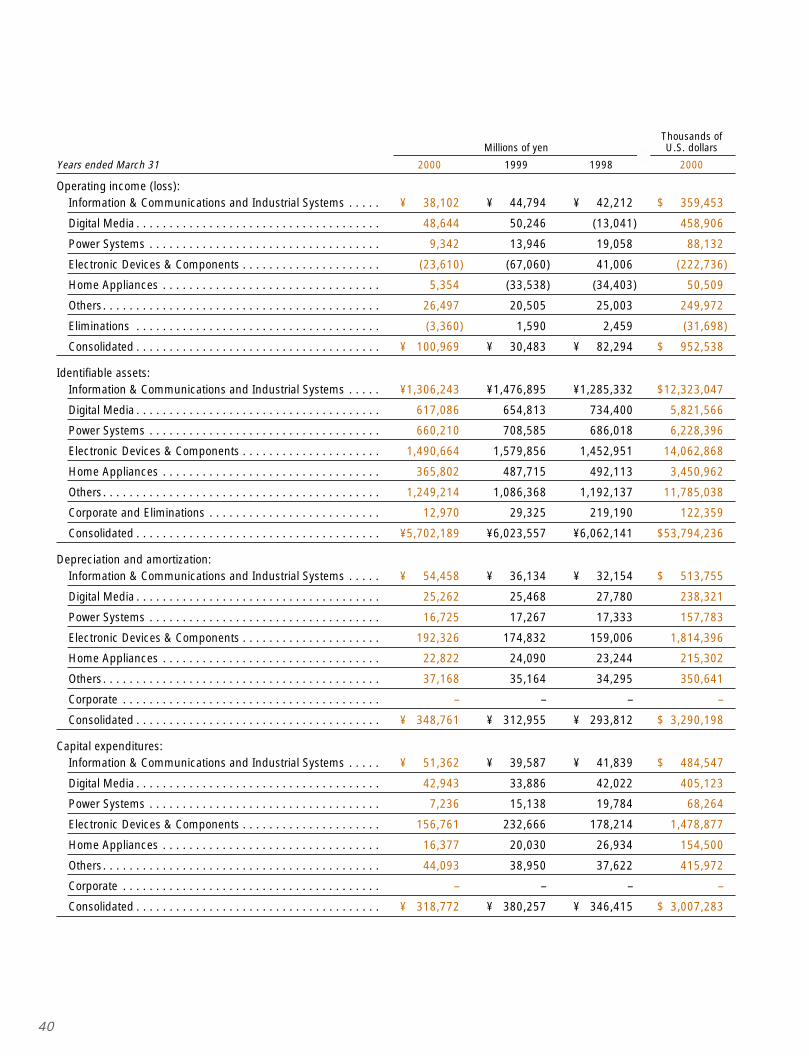
40
Thousands ofMillions of yen U.S. dollars
Years ended March 31 2000 1999 1998 2000
Operating income (loss):Information & Communications and Industrial Systems . . . . . ¥ 38,102 ¥ 44,794 ¥ 42,212 $ 359,453
Digital Media . . . . . . . . . . . . . . . . . . . . . . . . . . . . . . . . . . . . . 48,644 50,246 (13,041) 458,906
Power Systems . . . . . . . . . . . . . . . . . . . . . . . . . . . . . . . . . . . 9,342 13,946 19,058 88,132
Electronic Devices & Components . . . . . . . . . . . . . . . . . . . . . (23,610) (67,060) 41,006 (222,736)
Home Appliances . . . . . . . . . . . . . . . . . . . . . . . . . . . . . . . . . 5,354 (33,538) (34,403) 50,509
Others. . . . . . . . . . . . . . . . . . . . . . . . . . . . . . . . . . . . . . . . . . 26,497 20,505 25,003 249,972
Eliminations . . . . . . . . . . . . . . . . . . . . . . . . . . . . . . . . . . . . . (3,360) 1,590 2,459 (31,698)
Consolidated . . . . . . . . . . . . . . . . . . . . . . . . . . . . . . . . . . . . . ¥ 100,969 ¥ 30,483 ¥ 82,294 $ 952,538
Identifiable assets:Information & Communications and Industrial Systems . . . . . ¥1,306,243 ¥1,476,895 ¥1,285,332 $12,323,047
Digital Media . . . . . . . . . . . . . . . . . . . . . . . . . . . . . . . . . . . . . 617,086 654,813 734,400 5,821,566
Power Systems . . . . . . . . . . . . . . . . . . . . . . . . . . . . . . . . . . . 660,210 708,585 686,018 6,228,396
Electronic Devices & Components . . . . . . . . . . . . . . . . . . . . . 1,490,664 1,579,856 1,452,951 14,062,868
Home Appliances . . . . . . . . . . . . . . . . . . . . . . . . . . . . . . . . . 365,802 487,715 492,113 3,450,962
Others. . . . . . . . . . . . . . . . . . . . . . . . . . . . . . . . . . . . . . . . . . 1,249,214 1,086,368 1,192,137 11,785,038
Corporate and Eliminations . . . . . . . . . . . . . . . . . . . . . . . . . . 12,970 29,325 219,190 122,359
Consolidated . . . . . . . . . . . . . . . . . . . . . . . . . . . . . . . . . . . . . ¥5,702,189 ¥6,023,557 ¥6,062,141 $53,794,236
Depreciation and amortization:Information & Communications and Industrial Systems . . . . . ¥ 54,458 ¥ 36,134 ¥ 32,154 $ 513,755
Digital Media . . . . . . . . . . . . . . . . . . . . . . . . . . . . . . . . . . . . . 25,262 25,468 27,780 238,321
Power Systems . . . . . . . . . . . . . . . . . . . . . . . . . . . . . . . . . . . 16,725 17,267 17,333 157,783
Electronic Devices & Components . . . . . . . . . . . . . . . . . . . . . 192,326 174,832 159,006 1,814,396
Home Appliances . . . . . . . . . . . . . . . . . . . . . . . . . . . . . . . . . 22,822 24,090 23,244 215,302
Others. . . . . . . . . . . . . . . . . . . . . . . . . . . . . . . . . . . . . . . . . . 37,168 35,164 34,295 350,641
Corporate . . . . . . . . . . . . . . . . . . . . . . . . . . . . . . . . . . . . . . . – – – –
Consolidated . . . . . . . . . . . . . . . . . . . . . . . . . . . . . . . . . . . . . ¥ 348,761 ¥ 312,955 ¥ 293,812 $ 3,290,198
Capital expenditures:Information & Communications and Industrial Systems . . . . . ¥ 51,362 ¥ 39,587 ¥ 41,839 $ 484,547
Digital Media . . . . . . . . . . . . . . . . . . . . . . . . . . . . . . . . . . . . . 42,943 33,886 42,022 405,123
Power Systems . . . . . . . . . . . . . . . . . . . . . . . . . . . . . . . . . . . 7,236 15,138 19,784 68,264
Electronic Devices & Components . . . . . . . . . . . . . . . . . . . . . 156,761 232,666 178,214 1,478,877
Home Appliances . . . . . . . . . . . . . . . . . . . . . . . . . . . . . . . . . 16,377 20,030 26,934 154,500
Others. . . . . . . . . . . . . . . . . . . . . . . . . . . . . . . . . . . . . . . . . . 44,093 38,950 37,622 415,972
Corporate . . . . . . . . . . . . . . . . . . . . . . . . . . . . . . . . . . . . . . . – – – –
Consolidated . . . . . . . . . . . . . . . . . . . . . . . . . . . . . . . . . . . . . ¥ 318,772 ¥ 380,257 ¥ 346,415 $ 3,007,283
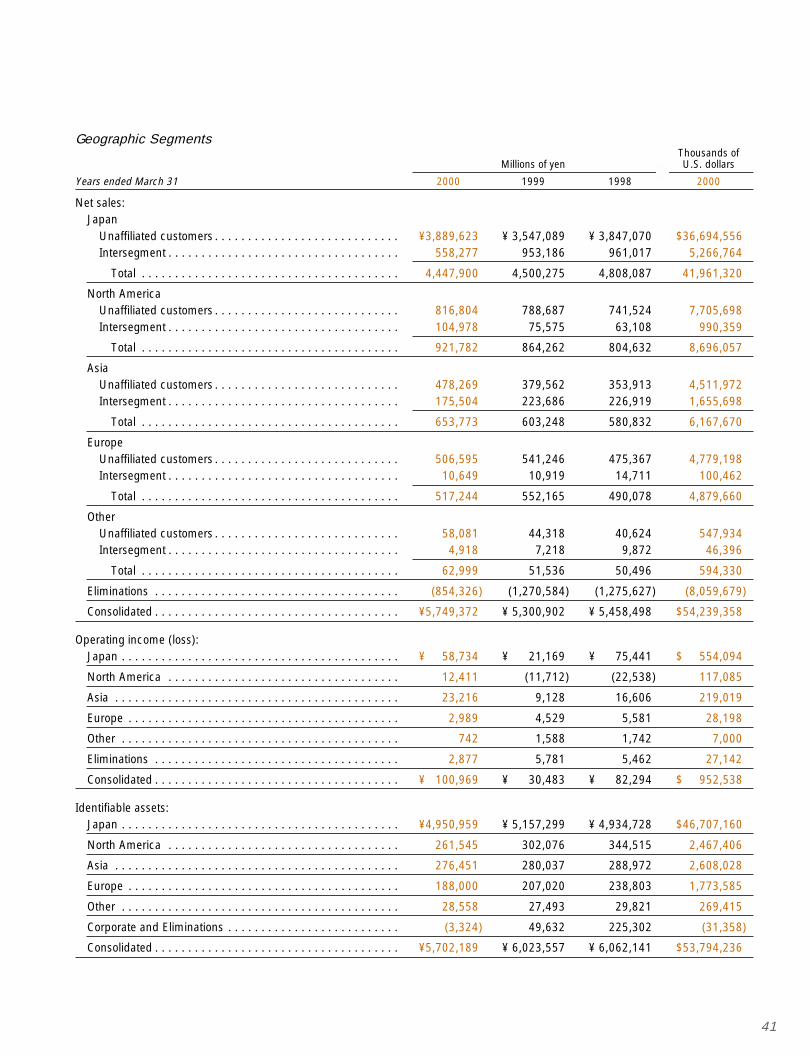
41
Geographic SegmentsThousands of
Millions of yen U.S. dollars
Years ended March 31 2000 1999 1998 2000
Net sales:Japan
Unaffiliated customers . . . . . . . . . . . . . . . . . . . . . . . . . . . . ¥3,889,623 ¥ 3,547,089 ¥ 3,847,070 $36,694,556Intersegment . . . . . . . . . . . . . . . . . . . . . . . . . . . . . . . . . . . 558,277 953,186 961,017 5,266,764
Total . . . . . . . . . . . . . . . . . . . . . . . . . . . . . . . . . . . . . . . 4,447,900 4,500,275 4,808,087 41,961,320
North AmericaUnaffiliated customers . . . . . . . . . . . . . . . . . . . . . . . . . . . . 816,804 788,687 741,524 7,705,698Intersegment . . . . . . . . . . . . . . . . . . . . . . . . . . . . . . . . . . . 104,978 75,575 63,108 990,359
Total . . . . . . . . . . . . . . . . . . . . . . . . . . . . . . . . . . . . . . . 921,782 864,262 804,632 8,696,057
AsiaUnaffiliated customers . . . . . . . . . . . . . . . . . . . . . . . . . . . . 478,269 379,562 353,913 4,511,972Intersegment . . . . . . . . . . . . . . . . . . . . . . . . . . . . . . . . . . . 175,504 223,686 226,919 1,655,698
Total . . . . . . . . . . . . . . . . . . . . . . . . . . . . . . . . . . . . . . . 653,773 603,248 580,832 6,167,670
EuropeUnaffiliated customers . . . . . . . . . . . . . . . . . . . . . . . . . . . . 506,595 541,246 475,367 4,779,198Intersegment . . . . . . . . . . . . . . . . . . . . . . . . . . . . . . . . . . . 10,649 10,919 14,711 100,462
Total . . . . . . . . . . . . . . . . . . . . . . . . . . . . . . . . . . . . . . . 517,244 552,165 490,078 4,879,660
OtherUnaffiliated customers . . . . . . . . . . . . . . . . . . . . . . . . . . . . 58,081 44,318 40,624 547,934Intersegment . . . . . . . . . . . . . . . . . . . . . . . . . . . . . . . . . . . 4,918 7,218 9,872 46,396
Total . . . . . . . . . . . . . . . . . . . . . . . . . . . . . . . . . . . . . . . 62,999 51,536 50,496 594,330
Eliminations . . . . . . . . . . . . . . . . . . . . . . . . . . . . . . . . . . . . . (854,326) (1,270,584) (1,275,627) (8,059,679)
Consolidated . . . . . . . . . . . . . . . . . . . . . . . . . . . . . . . . . . . . . ¥5,749,372 ¥ 5,300,902 ¥ 5,458,498 $54,239,358
Operating income (loss):Japan . . . . . . . . . . . . . . . . . . . . . . . . . . . . . . . . . . . . . . . . . . ¥ 58,734 ¥ 21,169 ¥ 75,441 $ 554,094
North America . . . . . . . . . . . . . . . . . . . . . . . . . . . . . . . . . . . 12,411 (11,712) (22,538) 117,085
Asia . . . . . . . . . . . . . . . . . . . . . . . . . . . . . . . . . . . . . . . . . . . 23,216 9,128 16,606 219,019
Europe . . . . . . . . . . . . . . . . . . . . . . . . . . . . . . . . . . . . . . . . . 2,989 4,529 5,581 28,198
Other . . . . . . . . . . . . . . . . . . . . . . . . . . . . . . . . . . . . . . . . . . 742 1,588 1,742 7,000
Eliminations . . . . . . . . . . . . . . . . . . . . . . . . . . . . . . . . . . . . . 2,877 5,781 5,462 27,142
Consolidated . . . . . . . . . . . . . . . . . . . . . . . . . . . . . . . . . . . . . ¥ 100,969 ¥ 30,483 ¥ 82,294 $ 952,538
Identifiable assets:Japan . . . . . . . . . . . . . . . . . . . . . . . . . . . . . . . . . . . . . . . . . . ¥4,950,959 ¥ 5,157,299 ¥ 4,934,728 $46,707,160
North America . . . . . . . . . . . . . . . . . . . . . . . . . . . . . . . . . . . 261,545 302,076 344,515 2,467,406
Asia . . . . . . . . . . . . . . . . . . . . . . . . . . . . . . . . . . . . . . . . . . . 276,451 280,037 288,972 2,608,028
Europe . . . . . . . . . . . . . . . . . . . . . . . . . . . . . . . . . . . . . . . . . 188,000 207,020 238,803 1,773,585
Other . . . . . . . . . . . . . . . . . . . . . . . . . . . . . . . . . . . . . . . . . . 28,558 27,493 29,821 269,415
Corporate and Eliminations . . . . . . . . . . . . . . . . . . . . . . . . . . (3,324) 49,632 225,302 (31,358)
Consolidated . . . . . . . . . . . . . . . . . . . . . . . . . . . . . . . . . . . . . ¥5,702,189 ¥ 6,023,557 ¥ 6,062,141 $53,794,236
42
RESEARCH AND DEVELOPMENTConsolidated R&D expenditures increased 6% to ¥334.4 billion (US$3,155 million). This was 5.8% of net sales, compared with 6%in the previous year. Toshiba is actively involved in all areas of R&D, from basic research to product development and productiontechnology. Major themes are wireless networks, digital broadcasting equipment, W-CDMA terminals, fine design rules in semi-conductor production, LSIs, polysilicon LCDs, new MRI and digital copiers. Toshiba estimates that fiscal 2000 R&D expenditureswill be ¥350 billion (US$3,302 million).
CAPITAL INVESTMENTSCapital expenditures, which include investments in property, plant and equipment of ¥298.5 billion (US$2,816 million), were ¥318.8billion (US$3,007 million), a decrease of 16% compared to the previous fiscal year. Capital expenditures for electronic devices &components were ¥156.8 billion (US$1,479 million), 49% of the total. Significant elements of these expenditures were fine process facili-ties at the Yokkaichi Operations, memory manufacturing facilities at subsidiary Yokkaichi Toshiba Electronics Corporation and low-tem-perature polysilicon LCD production facilities at Fukaya Operations. In other segments, capital expenditures were ¥51.4 billion (US$485million) in information & communications and industrial systems, ¥42.9 billion (US$405 million) in digital media, ¥7.2 billion (US$68 mil-lion) in power systems, ¥16.4 billion (US$154 million) in home appliances and ¥44.1 billion (US$416 million) in others.
FINANCIAL POSITIONAs of March 31, 2000, total assets were ¥5,702.2 billion (US$53,794 million), ¥321.4 billion less than at the end of the previous fiscalyear. Inventories decreased by ¥160.7 billion due to the completion of plants in power systems and the inventory reductions madepossible by the introduction of supply chain management. Current assets declined by ¥142.1 billion. Property, plant and equipmentdeclined by ¥90.2 billion due to lower levels of capital investments. Total debt was reduced by ¥214.3 billion from the previous year to¥1,967.3 billion (US$18,559 million) as operating cash flows increased substantially. Accrued pension and severance costs wentdown by ¥106.3 billion due to growth in the value of pension assets. Shareholders’ equity decreased by ¥68.2 billion compared to theprevious year to ¥982.1 billion (US$9,265 million). Factors here were the year’s net loss and a negative foreign currency translationadjustment.
CASH FLOWSNet cash provided by operating activities totaled ¥435.9 billion (US$4,113 million), a considerable increase over last year’s ¥264.9billion. This is mainly attributable to the decrease in inventories and the increase in depreciation and amortization.
Net cash used in investing activities came to ¥293.2 billion (US$2,766 million), which included ¥298.5 billion (US$2,816) of acqui-sition of property and equipment, the main component being manufacturing facilities for electronic devices. Capital investments weredown from the previous year, but falling proceeds from the sale of marketable securities and other factors resulted in an increase incash requirements of ¥13.1 billion.
Net cash used in financing activities was ¥158.7 billion (US$1,497 million) due to continued efforts to reduce debt.In addition to the above items, the effect of exchange rate changes was a negative ¥16.6 billion (US$157 million). This resulted in a
net decrease of ¥32.5 billion in cash and cash equivalents, bringing the total to ¥465.2 billion (US$4,389 million).
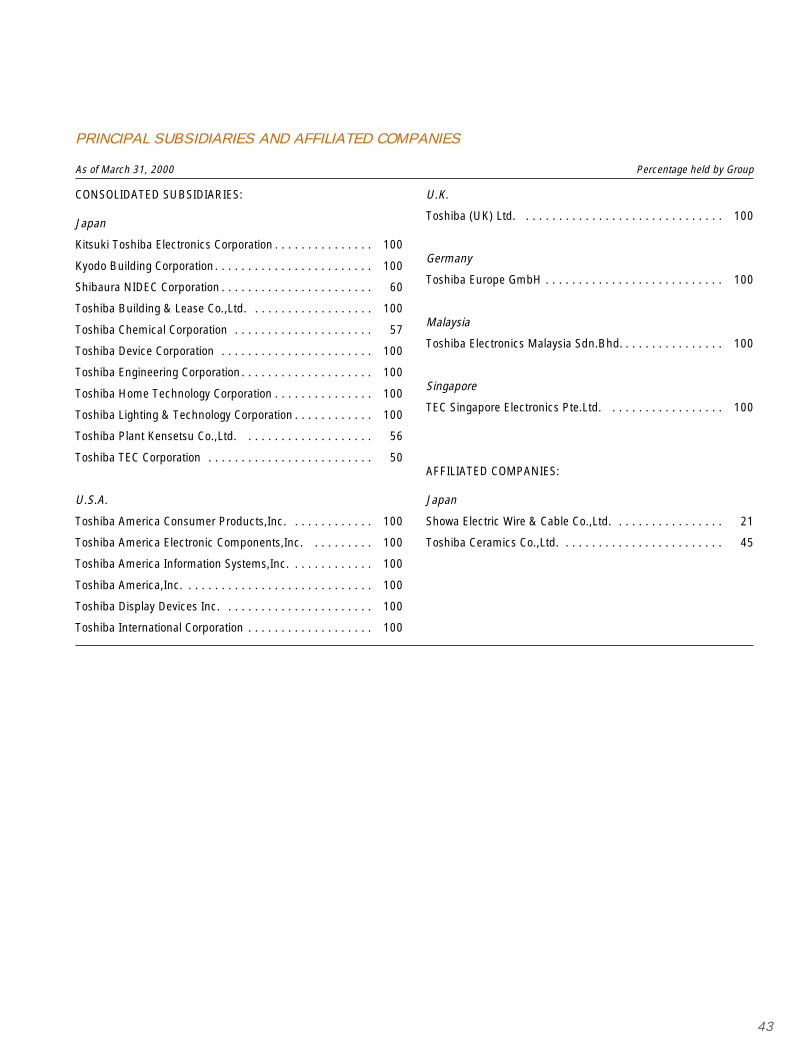
43
PRINCIPAL SUBSIDIARIES AND AFFILIATED COMPANIES
As of March 31, 2000 Percentage held by Group
CONSOLIDATED SUBSIDIARIES:
Japan
Kitsuki Toshiba Electronics Corporation . . . . . . . . . . . . . . . 100
Kyodo Building Corporation. . . . . . . . . . . . . . . . . . . . . . . . 100
Shibaura NIDEC Corporation . . . . . . . . . . . . . . . . . . . . . . . 60
Toshiba Building & Lease Co.,Ltd. . . . . . . . . . . . . . . . . . . 100
Toshiba Chemical Corporation . . . . . . . . . . . . . . . . . . . . . 57
Toshiba Device Corporation . . . . . . . . . . . . . . . . . . . . . . . 100
Toshiba Engineering Corporation . . . . . . . . . . . . . . . . . . . . 100
Toshiba Home Technology Corporation . . . . . . . . . . . . . . . 100
Toshiba Lighting & Technology Corporation . . . . . . . . . . . . 100
Toshiba Plant Kensetsu Co.,Ltd. . . . . . . . . . . . . . . . . . . . 56
Toshiba TEC Corporation . . . . . . . . . . . . . . . . . . . . . . . . . 50
U.S.A.
Toshiba America Consumer Products,Inc. . . . . . . . . . . . . 100
Toshiba America Electronic Components,Inc. . . . . . . . . . 100
Toshiba America Information Systems,Inc. . . . . . . . . . . . . 100
Toshiba America,Inc. . . . . . . . . . . . . . . . . . . . . . . . . . . . . 100
Toshiba Display Devices Inc. . . . . . . . . . . . . . . . . . . . . . . 100
Toshiba International Corporation . . . . . . . . . . . . . . . . . . . 100
U.K.
Toshiba (UK) Ltd. . . . . . . . . . . . . . . . . . . . . . . . . . . . . . . 100
Germany
Toshiba Europe GmbH . . . . . . . . . . . . . . . . . . . . . . . . . . . 100
Malaysia
Toshiba Electronics Malaysia Sdn.Bhd. . . . . . . . . . . . . . . . 100
Singapore
TEC Singapore Electronics Pte.Ltd. . . . . . . . . . . . . . . . . . 100
AFFILIATED COMPANIES:
Japan
Showa Electric Wire & Cable Co.,Ltd. . . . . . . . . . . . . . . . . 21
Toshiba Ceramics Co.,Ltd. . . . . . . . . . . . . . . . . . . . . . . . . 45
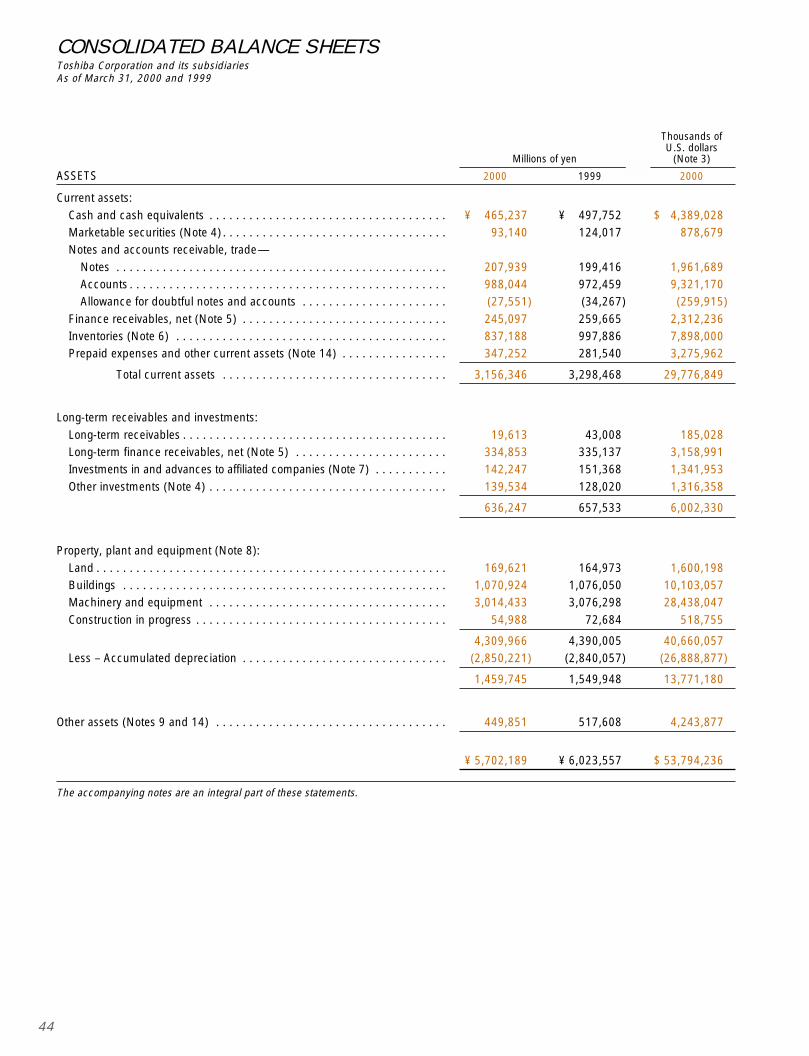
44
Thousands ofU.S. dollars
Millions of yen (Note 3)
ASSETS 2000 1999 2000
Current assets:
Cash and cash equivalents . . . . . . . . . . . . . . . . . . . . . . . . . . . . . . . . . . . . ¥ 465,237 ¥ 497,752 $ 4,389,028Marketable securities (Note 4) . . . . . . . . . . . . . . . . . . . . . . . . . . . . . . . . . . 93,140 124,017 878,679Notes and accounts receivable, trade—
Notes . . . . . . . . . . . . . . . . . . . . . . . . . . . . . . . . . . . . . . . . . . . . . . . . . . 207,939 199,416 1,961,689Accounts . . . . . . . . . . . . . . . . . . . . . . . . . . . . . . . . . . . . . . . . . . . . . . . . 988,044 972,459 9,321,170Allowance for doubtful notes and accounts . . . . . . . . . . . . . . . . . . . . . . (27,551) (34,267) (259,915)
Finance receivables, net (Note 5) . . . . . . . . . . . . . . . . . . . . . . . . . . . . . . . 245,097 259,665 2,312,236Inventories (Note 6) . . . . . . . . . . . . . . . . . . . . . . . . . . . . . . . . . . . . . . . . . 837,188 997,886 7,898,000Prepaid expenses and other current assets (Note 14) . . . . . . . . . . . . . . . . 347,252 281,540 3,275,962
Total current assets . . . . . . . . . . . . . . . . . . . . . . . . . . . . . . . . . . 3,156,346 3,298,468 29,776,849
Long-term receivables and investments:
Long-term receivables . . . . . . . . . . . . . . . . . . . . . . . . . . . . . . . . . . . . . . . . 19,613 43,008 185,028Long-term finance receivables, net (Note 5) . . . . . . . . . . . . . . . . . . . . . . . 334,853 335,137 3,158,991Investments in and advances to affiliated companies (Note 7) . . . . . . . . . . . 142,247 151,368 1,341,953
Other investments (Note 4) . . . . . . . . . . . . . . . . . . . . . . . . . . . . . . . . . . . . 139,534 128,020 1,316,358
636,247 657,533 6,002,330
Property, plant and equipment (Note 8):
Land . . . . . . . . . . . . . . . . . . . . . . . . . . . . . . . . . . . . . . . . . . . . . . . . . . . . . 169,621 164,973 1,600,198Buildings . . . . . . . . . . . . . . . . . . . . . . . . . . . . . . . . . . . . . . . . . . . . . . . . . 1,070,924 1,076,050 10,103,057Machinery and equipment . . . . . . . . . . . . . . . . . . . . . . . . . . . . . . . . . . . . 3,014,433 3,076,298 28,438,047
Construction in progress . . . . . . . . . . . . . . . . . . . . . . . . . . . . . . . . . . . . . . 54,988 72,684 518,755
4,309,966 4,390,005 40,660,057Less – Accumulated depreciation . . . . . . . . . . . . . . . . . . . . . . . . . . . . . . . (2,850,221) (2,840,057) (26,888,877)
1,459,745 1,549,948 13,771,180
Other assets (Notes 9 and 14) . . . . . . . . . . . . . . . . . . . . . . . . . . . . . . . . . . . 449,851 517,608 4,243,877
¥ 5,702,189 ¥ 6,023,557 $ 53,794,236
The accompanying notes are an integral part of these statements.
CONSOLIDATED BALANCE SHEETSToshiba Corporation and its subsidiariesAs of March 31, 2000 and 1999
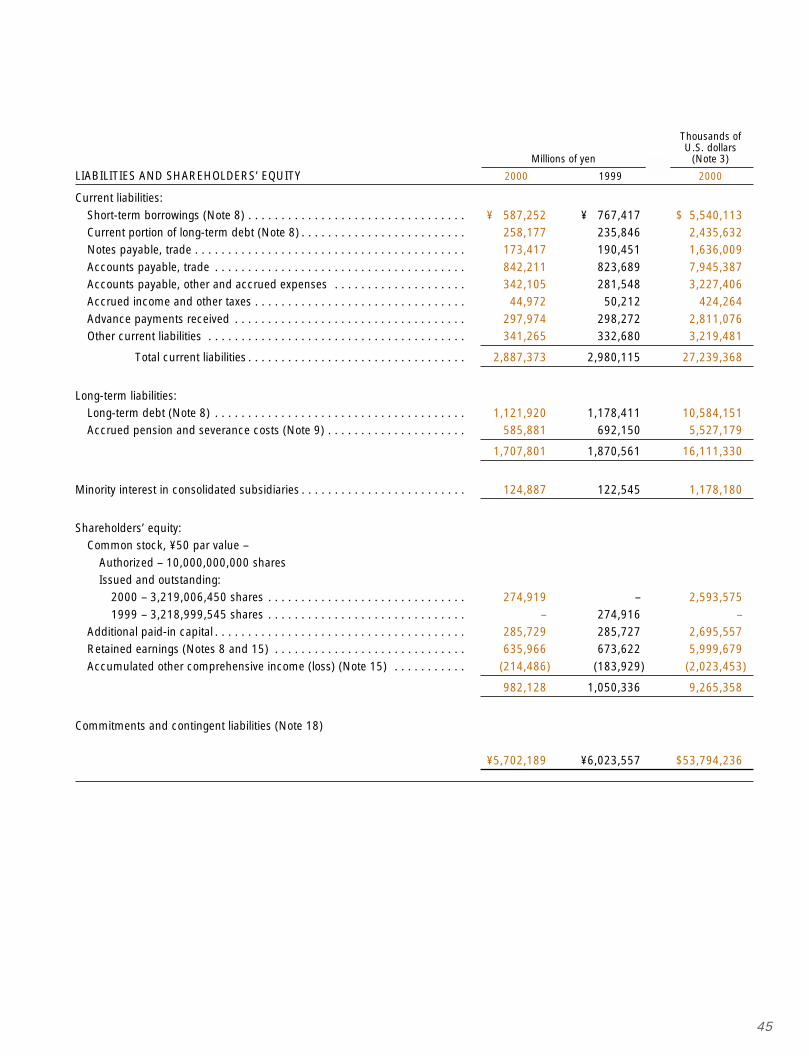
45
Thousands ofU.S. dollars
Millions of yen (Note 3)
LIABILITIES AND SHAREHOLDERS’ EQUITY 2000 1999 2000
Current liabilities:
Short-term borrowings (Note 8) . . . . . . . . . . . . . . . . . . . . . . . . . . . . . . . . . ¥ 587,252 ¥ 767,417 $ 5,540,113Current portion of long-term debt (Note 8) . . . . . . . . . . . . . . . . . . . . . . . . . 258,177 235,846 2,435,632Notes payable, trade . . . . . . . . . . . . . . . . . . . . . . . . . . . . . . . . . . . . . . . . . 173,417 190,451 1,636,009
Accounts payable, trade . . . . . . . . . . . . . . . . . . . . . . . . . . . . . . . . . . . . . . 842,211 823,689 7,945,387Accounts payable, other and accrued expenses . . . . . . . . . . . . . . . . . . . . 342,105 281,548 3,227,406Accrued income and other taxes . . . . . . . . . . . . . . . . . . . . . . . . . . . . . . . . 44,972 50,212 424,264
Advance payments received . . . . . . . . . . . . . . . . . . . . . . . . . . . . . . . . . . . 297,974 298,272 2,811,076Other current liabilities . . . . . . . . . . . . . . . . . . . . . . . . . . . . . . . . . . . . . . . 341,265 332,680 3,219,481
Total current liabilities . . . . . . . . . . . . . . . . . . . . . . . . . . . . . . . . . 2,887,373 2,980,115 27,239,368
Long-term liabilities:Long-term debt (Note 8) . . . . . . . . . . . . . . . . . . . . . . . . . . . . . . . . . . . . . . 1,121,920 1,178,411 10,584,151Accrued pension and severance costs (Note 9) . . . . . . . . . . . . . . . . . . . . . 585,881 692,150 5,527,179
1,707,801 1,870,561 16,111,330
Minority interest in consolidated subsidiaries . . . . . . . . . . . . . . . . . . . . . . . . . 124,887 122,545 1,178,180
Shareholders’ equity:Common stock, ¥50 par value –
Authorized – 10,000,000,000 sharesIssued and outstanding:
2000 – 3,219,006,450 shares . . . . . . . . . . . . . . . . . . . . . . . . . . . . . . 274,919 – 2,593,575
1999 – 3,218,999,545 shares . . . . . . . . . . . . . . . . . . . . . . . . . . . . . . – 274,916 –Additional paid-in capital . . . . . . . . . . . . . . . . . . . . . . . . . . . . . . . . . . . . . . 285,729 285,727 2,695,557Retained earnings (Notes 8 and 15) . . . . . . . . . . . . . . . . . . . . . . . . . . . . . 635,966 673,622 5,999,679
Accumulated other comprehensive income (loss) (Note 15) . . . . . . . . . . . (214,486) (183,929) (2,023,453)
982,128 1,050,336 9,265,358
Commitments and contingent liabilities (Note 18)
¥5,702,189 ¥6,023,557 $53,794,236
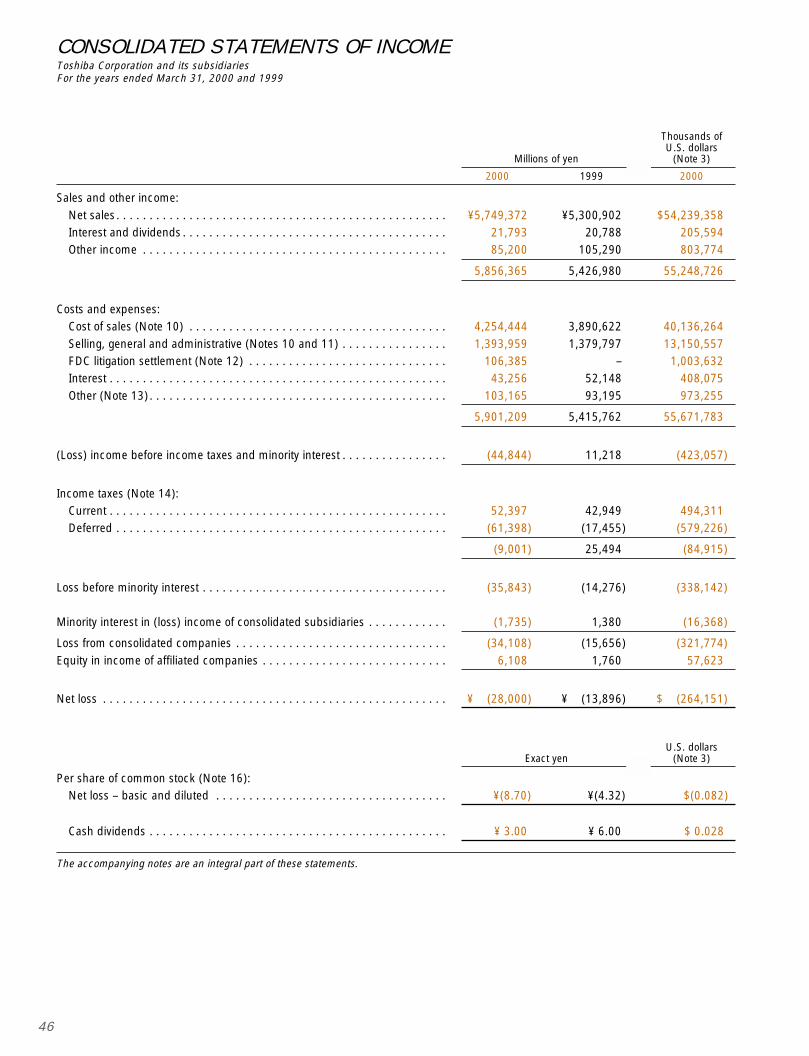
46
Thousands ofU.S. dollars
Millions of yen (Note 3)
2000 1999 2000
Sales and other income:
Net sales . . . . . . . . . . . . . . . . . . . . . . . . . . . . . . . . . . . . . . . . . . . . . . . . . . ¥5,749,372 ¥5,300,902 $54,239,358Interest and dividends . . . . . . . . . . . . . . . . . . . . . . . . . . . . . . . . . . . . . . . . 21,793 20,788 205,594Other income . . . . . . . . . . . . . . . . . . . . . . . . . . . . . . . . . . . . . . . . . . . . . . 85,200 105,290 803,774
5,856,365 5,426,980 55,248,726
Costs and expenses:Cost of sales (Note 10) . . . . . . . . . . . . . . . . . . . . . . . . . . . . . . . . . . . . . . . 4,254,444 3,890,622 40,136,264
Selling, general and administrative (Notes 10 and 11) . . . . . . . . . . . . . . . . 1,393,959 1,379,797 13,150,557FDC litigation settlement (Note 12) . . . . . . . . . . . . . . . . . . . . . . . . . . . . . . 106,385 – 1,003,632Interest . . . . . . . . . . . . . . . . . . . . . . . . . . . . . . . . . . . . . . . . . . . . . . . . . . . 43,256 52,148 408,075
Other (Note 13) . . . . . . . . . . . . . . . . . . . . . . . . . . . . . . . . . . . . . . . . . . . . . 103,165 93,195 973,255
5,901,209 5,415,762 55,671,783
(Loss) income before income taxes and minority interest . . . . . . . . . . . . . . . . (44,844) 11,218 (423,057)
Income taxes (Note 14):Current . . . . . . . . . . . . . . . . . . . . . . . . . . . . . . . . . . . . . . . . . . . . . . . . . . . 52,397 42,949 494,311Deferred . . . . . . . . . . . . . . . . . . . . . . . . . . . . . . . . . . . . . . . . . . . . . . . . . . (61,398) (17,455) (579,226)
(9,001) 25,494 (84,915)
Loss before minority interest . . . . . . . . . . . . . . . . . . . . . . . . . . . . . . . . . . . . . (35,843) (14,276) (338,142)
Minority interest in (loss) income of consolidated subsidiaries . . . . . . . . . . . . (1,735) 1,380 (16,368)
Loss from consolidated companies . . . . . . . . . . . . . . . . . . . . . . . . . . . . . . . . (34,108) (15,656) (321,774)
Equity in income of affiliated companies . . . . . . . . . . . . . . . . . . . . . . . . . . . . 6,108 1,760 57,623
Net loss . . . . . . . . . . . . . . . . . . . . . . . . . . . . . . . . . . . . . . . . . . . . . . . . . . . . ¥ (28,000) ¥ (13,896) $ (264,151)
U.S. dollarsExact yen (Note 3)
Per share of common stock (Note 16):Net loss – basic and diluted . . . . . . . . . . . . . . . . . . . . . . . . . . . . . . . . . . . ¥(8.70) ¥(4.32) $(0.082)
Cash dividends . . . . . . . . . . . . . . . . . . . . . . . . . . . . . . . . . . . . . . . . . . . . . ¥ 3.00 ¥ 6.00 $ 0.028
The accompanying notes are an integral part of these statements.
CONSOLIDATED STATEMENTS OF INCOMEToshiba Corporation and its subsidiariesFor the years ended March 31, 2000 and 1999
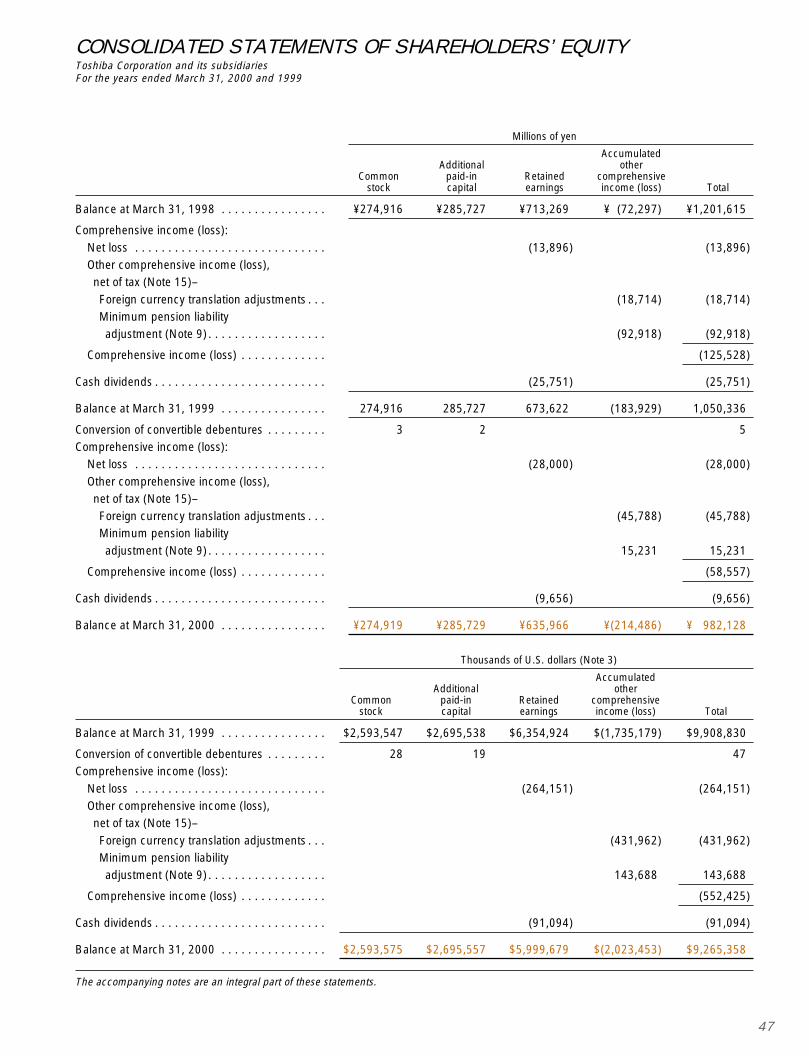
47
Millions of yen
AccumulatedAdditional other
Common paid-in Retained comprehensivestock capital earnings income (loss) Total
Balance at March 31, 1998 . . . . . . . . . . . . . . . . ¥274,916 ¥285,727 ¥713,269 ¥ (72,297) ¥1,201,615
Comprehensive income (loss):
Net loss . . . . . . . . . . . . . . . . . . . . . . . . . . . . . (13,896) (13,896)Other comprehensive income (loss),net of tax (Note 15)–
Foreign currency translation adjustments . . . (18,714) (18,714)Minimum pension liabilityadjustment (Note 9) . . . . . . . . . . . . . . . . . . (92,918) (92,918)
Comprehensive income (loss) . . . . . . . . . . . . . (125,528)
Cash dividends . . . . . . . . . . . . . . . . . . . . . . . . . . (25,751) (25,751)
Balance at March 31, 1999 . . . . . . . . . . . . . . . . 274,916 285,727 673,622 (183,929) 1,050,336
Conversion of convertible debentures . . . . . . . . . 3 2 5Comprehensive income (loss):
Net loss . . . . . . . . . . . . . . . . . . . . . . . . . . . . . (28,000) (28,000)
Other comprehensive income (loss),net of tax (Note 15)–Foreign currency translation adjustments . . . (45,788) (45,788)Minimum pension liability
adjustment (Note 9) . . . . . . . . . . . . . . . . . . 15,231 15,231
Comprehensive income (loss) . . . . . . . . . . . . . (58,557)
Cash dividends . . . . . . . . . . . . . . . . . . . . . . . . . . (9,656) (9,656)
Balance at March 31, 2000 . . . . . . . . . . . . . . . . ¥274,919 ¥285,729 ¥635,966 ¥(214,486) ¥ 982,128
Thousands of U.S. dollars (Note 3)
AccumulatedAdditional other
Common paid-in Retained comprehensivestock capital earnings income (loss) Total
Balance at March 31, 1999 . . . . . . . . . . . . . . . . $2,593,547 $2,695,538 $6,354,924 $(1,735,179) $9,908,830
Conversion of convertible debentures . . . . . . . . . 28 19 47Comprehensive income (loss):
Net loss . . . . . . . . . . . . . . . . . . . . . . . . . . . . . (264,151) (264,151)Other comprehensive income (loss),net of tax (Note 15)–
Foreign currency translation adjustments . . . (431,962) (431,962)Minimum pension liabilityadjustment (Note 9) . . . . . . . . . . . . . . . . . . 143,688 143,688
Comprehensive income (loss) . . . . . . . . . . . . . (552,425)
Cash dividends . . . . . . . . . . . . . . . . . . . . . . . . . . (91,094) (91,094)
Balance at March 31, 2000 . . . . . . . . . . . . . . . . $2,593,575 $2,695,557 $5,999,679 $(2,023,453) $9,265,358
The accompanying notes are an integral part of these statements.
CONSOLIDATED STATEMENTS OF SHAREHOLDERS’ EQUITYToshiba Corporation and its subsidiariesFor the years ended March 31, 2000 and 1999
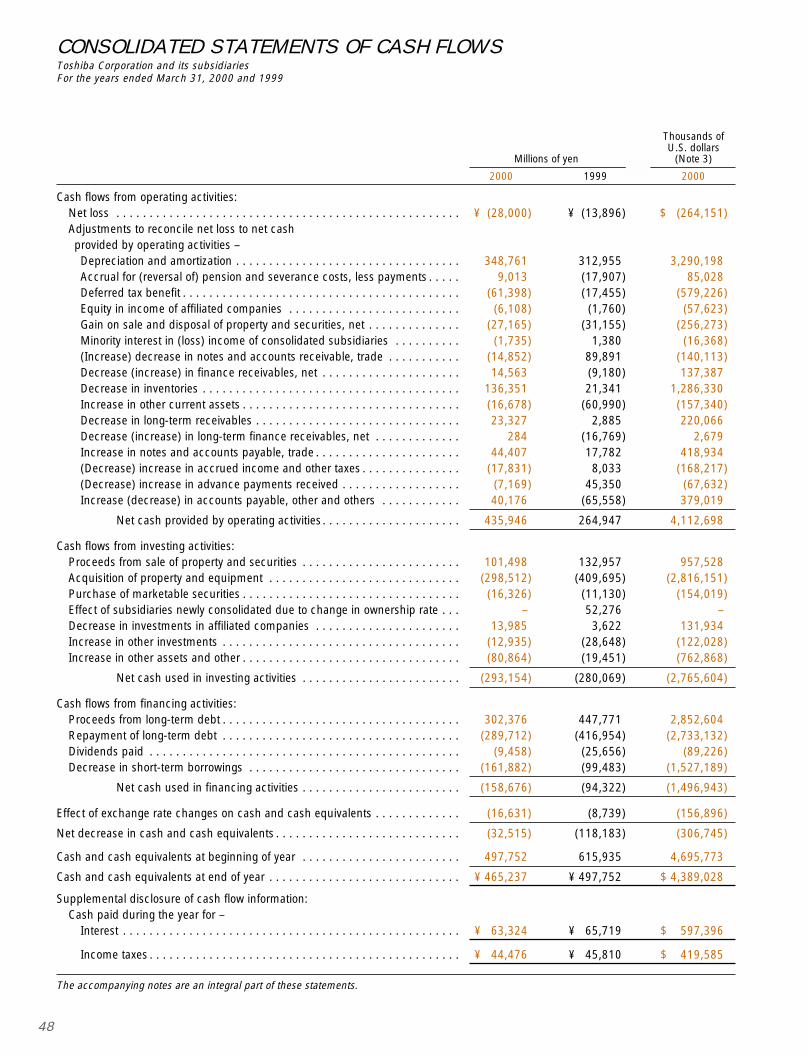
48
Thousands ofU.S. dollars
Millions of yen (Note 3)
2000 1999 2000
Cash flows from operating activities:Net loss . . . . . . . . . . . . . . . . . . . . . . . . . . . . . . . . . . . . . . . . . . . . . . . . . . . . ¥ (28,000) ¥ (13,896) $ (264,151)Adjustments to reconcile net loss to net cashprovided by operating activities –Depreciation and amortization . . . . . . . . . . . . . . . . . . . . . . . . . . . . . . . . . . 348,761 312,955 3,290,198Accrual for (reversal of) pension and severance costs, less payments . . . . . 9,013 (17,907) 85,028Deferred tax benefit . . . . . . . . . . . . . . . . . . . . . . . . . . . . . . . . . . . . . . . . . . (61,398) (17,455) (579,226)Equity in income of affiliated companies . . . . . . . . . . . . . . . . . . . . . . . . . . (6,108) (1,760) (57,623)Gain on sale and disposal of property and securities, net . . . . . . . . . . . . . . (27,165) (31,155) (256,273)Minority interest in (loss) income of consolidated subsidiaries . . . . . . . . . . (1,735) 1,380 (16,368)(Increase) decrease in notes and accounts receivable, trade . . . . . . . . . . . (14,852) 89,891 (140,113)Decrease (increase) in finance receivables, net . . . . . . . . . . . . . . . . . . . . . 14,563 (9,180) 137,387Decrease in inventories . . . . . . . . . . . . . . . . . . . . . . . . . . . . . . . . . . . . . . . 136,351 21,341 1,286,330Increase in other current assets . . . . . . . . . . . . . . . . . . . . . . . . . . . . . . . . . (16,678) (60,990) (157,340)Decrease in long-term receivables . . . . . . . . . . . . . . . . . . . . . . . . . . . . . . . 23,327 2,885 220,066Decrease (increase) in long-term finance receivables, net . . . . . . . . . . . . . 284 (16,769) 2,679Increase in notes and accounts payable, trade . . . . . . . . . . . . . . . . . . . . . . 44,407 17,782 418,934(Decrease) increase in accrued income and other taxes . . . . . . . . . . . . . . . (17,831) 8,033 (168,217)(Decrease) increase in advance payments received . . . . . . . . . . . . . . . . . . (7,169) 45,350 (67,632)Increase (decrease) in accounts payable, other and others . . . . . . . . . . . . 40,176 (65,558) 379,019
Net cash provided by operating activities . . . . . . . . . . . . . . . . . . . . . 435,946 264,947 4,112,698
Cash flows from investing activities:Proceeds from sale of property and securities . . . . . . . . . . . . . . . . . . . . . . . . 101,498 132,957 957,528Acquisition of property and equipment . . . . . . . . . . . . . . . . . . . . . . . . . . . . . (298,512) (409,695) (2,816,151)Purchase of marketable securities . . . . . . . . . . . . . . . . . . . . . . . . . . . . . . . . . (16,326) (11,130) (154,019)Effect of subsidiaries newly consolidated due to change in ownership rate . . . – 52,276 –Decrease in investments in affiliated companies . . . . . . . . . . . . . . . . . . . . . . 13,985 3,622 131,934Increase in other investments . . . . . . . . . . . . . . . . . . . . . . . . . . . . . . . . . . . . (12,935) (28,648) (122,028)Increase in other assets and other . . . . . . . . . . . . . . . . . . . . . . . . . . . . . . . . . (80,864) (19,451) (762,868)
Net cash used in investing activities . . . . . . . . . . . . . . . . . . . . . . . . (293,154) (280,069) (2,765,604)
Cash flows from financing activities:Proceeds from long-term debt . . . . . . . . . . . . . . . . . . . . . . . . . . . . . . . . . . . . 302,376 447,771 2,852,604Repayment of long-term debt . . . . . . . . . . . . . . . . . . . . . . . . . . . . . . . . . . . . (289,712) (416,954) (2,733,132)Dividends paid . . . . . . . . . . . . . . . . . . . . . . . . . . . . . . . . . . . . . . . . . . . . . . . (9,458) (25,656) (89,226)Decrease in short-term borrowings . . . . . . . . . . . . . . . . . . . . . . . . . . . . . . . . (161,882) (99,483) (1,527,189)
Net cash used in financing activities . . . . . . . . . . . . . . . . . . . . . . . . (158,676) (94,322) (1,496,943)
Effect of exchange rate changes on cash and cash equivalents . . . . . . . . . . . . . (16,631) (8,739) (156,896)
Net decrease in cash and cash equivalents . . . . . . . . . . . . . . . . . . . . . . . . . . . . (32,515) (118,183) (306,745)
Cash and cash equivalents at beginning of year . . . . . . . . . . . . . . . . . . . . . . . . 497,752 615,935 4,695,773
Cash and cash equivalents at end of year . . . . . . . . . . . . . . . . . . . . . . . . . . . . . ¥ 465,237 ¥ 497,752 $ 4,389,028
Supplemental disclosure of cash flow information:Cash paid during the year for –
Interest . . . . . . . . . . . . . . . . . . . . . . . . . . . . . . . . . . . . . . . . . . . . . . . . . . . ¥ 63,324 ¥ 65,719 $ 597,396
Income taxes . . . . . . . . . . . . . . . . . . . . . . . . . . . . . . . . . . . . . . . . . . . . . . . ¥ 44,476 ¥ 45,810 $ 419,585
The accompanying notes are an integral part of these statements.
CONSOLIDATED STATEMENTS OF CASH FLOWSToshiba Corporation and its subsidiariesFor the years ended March 31, 2000 and 1999
49
1. COMPANY OPERATIONS:Toshiba Corporation and its subsidiaries are engaged in the research and development, manufacturing and sales of high-technologyelectronic and energy products, which span (1) information & communications and industrial systems, (2) digital media, (3) powersystems, (4) electronic devices & components, (5) home appliances, and (6) others. For the years ended March 31, 2000 and 1999,sales in information & communications and industrial systems represented the most significant portion of the company’s total sales,approximately 30%, and both of sales in digital media and electronic devices & components represented over 20% of the company’ssales, while sales in power systems and home appliances were approximately equal in amount, each representing approximately 10%of the company’s sales. Sales in others were relatively small compared to those derived from other business activities. The productsare manufactured and marketed throughout the world with approximately 60 percent of sales in Japan and the remainder in NorthAmerica, Asia, Europe and elsewhere.
2. SUMMARY OF SIGNIFICANT ACCOUNTING POLICIES:PREPARATION OF FINANCIAL STATEMENTS –The company and its domestic subsidiaries maintain their records and prepare their financial statements in accordance with account-ing principles generally accepted in Japan, and its foreign subsidiaries in conformity with those of the countries of their domicile.
Certain adjustments and reclassifications have been incorporated in the accompanying consolidated financial statements to con-form with accounting principles generally accepted in the United States of America. These adjustments were not recorded in thestatutory books.
BASIS OF CONSOLIDATION AND INVESTMENTS IN AFFILIATED COMPANIES –The consolidated financial statements include the accounts of the company and those of its subsidiaries. All significant intercompanytransactions and accounts are eliminated in consolidation.
Investments in affiliated companies (20 to 50 percent-owned companies) in which the ability to exercise significant influence existsare stated at cost plus equity in undistributed earnings (losses). Net consolidated income (loss) includes the company’s equity in thecurrent net earnings (losses) of such companies, after elimination of unrealized intercompany profits.
Goodwill recognized at the time of investments in subsidiaries and affiliated companies is amortized on a straight-line basis over theestimated period of benefit.
USE OF ESTIMATES –The preparation of the consolidated financial statements in conformity with accounting principles generally accepted in the UnitedStates of America requires management to make estimates and assumptions that affect the reported amounts of assets and liabilitiesand disclosure of contingent assets and liabilities at the date of the consolidated financial statements and the reported amounts ofrevenues and expenses during the reporting period. Actual results could differ from those estimates.
CONSOLIDATED STATEMENT OF CASH FLOWS –For purposes of the statement of cash flows, the company considers all highly liquid investments purchased with original maturities ofthree months or less to be cash equivalents.
FOREIGN CURRENCY TRANSLATION –The assets and liabilities of foreign subsidiaries that operate in a local currency environment are translated into Japanese yen atapplicable current exchange rates at year end. Income and expense items are translated at average exchange rates prevailing duringthe year. The effects of these translation adjustments are included in the other comprehensive income (loss) and reported as a com-ponent of shareholders’ equity. Exchange gains and losses resulting from foreign currency transactions and translation of assets andliabilities denominated in foreign currencies are included in the consolidated statements of income.
REVENUE RECOGNITION –Sales of finished products, other than under long-term contracts, are recorded in the accounts as shipments are made, except forsales of certain products which are recorded in the accounts upon customer acceptance.
Sales under long-term contracts are generally recorded in the accounts based upon progress toward completion of the contracts asmeasured by achievement of contract milestones.
MARKETABLE SECURITIES AND OTHER INVESTMENTS –Marketable equity securities included in marketable securities (current) and other investments (non-current) are stated at the lower ofcost or market in the aggregate. Other marketable securities included in marketable securities (current) are stated at the lower of costor market in the aggregate and investments other than marketable equity securities in other investments (non-current) are stated atcost less any significant decline in fair value assessed to be other than temporary.
NOTES TO CONSOLIDATED FINANCIAL STATEMENTSToshiba Corporation and its subsidiaries
50
Realized gains and losses on the sale of securities are based on the average cost of all the units of a particular security held at thetime of sale.
INVENTORIES –Raw materials, and finished products and work in process for stock sales items are stated at the lower of cost or market, cost beingdetermined principally by the average method. Finished products and work in process for contract items are stated at the lower of costor estimated realizable value, cost being determined by accumulated production costs.
Effective April 1, 1999, the company changed its method of accounting for the costs of finished products and work in process forstock sales items from the first-in, first-out method to the average method. The company believes that the average method provides abetter matching of costs and revenues, and this accounting change resulted in insignificant effects on cost of sales and inventories.
In accordance with general industry practice, items with long manufacturing periods are included among inventories even when notrealizable within one year.
PROPERTY, PLANT AND EQUIPMENT AND DEPRECIATION –Property, plant and equipment, including significant renewals and additions, are carried at cost. When retired or otherwisedisposed of, the cost and related depreciation are cleared from the respective accounts and the net difference, less any amountrealized on disposal, is included in earnings. Maintenance and repairs, including minor renewals and betterments, are charged toincome as incurred.
Depreciation is computed generally by a declining-balance method at rates based on the estimated useful lives of the relatedassets, according to general class, type of construction and use.
INCOME TAXES –Deferred income taxes are recorded to reflect the expected future tax consequences of temporary differences between the tax basis ofassets and liabilities and their reported amounts in the financial statements, and are measured by applying currently enacted tax laws.
ACCRUED PENSION AND SEVERANCE COSTS –The company and its subsidiaries have various retirement benefit plans covering substantially all employees. Current service costs ofthe retirement benefit plans are accrued in the period. Prior service costs resulting from amendments to the plans are amortized overthe average remaining service period of employees expected to receive benefits (See Note 9).
NET INCOME PER SHARE –Basic earnings per share (“EPS”) is computed based on the weighted-average number of shares of common stock outstanding duringeach period. Diluted EPS assumes the dilution that could occur if dilutive convertible debentures were converted into common stock.
FINANCIAL INSTRUMENTS –The company uses a variety of derivative financial instruments, which include forward exchange contracts, interest rate swap agree-ments and currency swap agreements, for the purpose of currency exchange rate and interest rate risk management. Refer to Note17 for descriptions of these financial instruments, including the methods used to account for them.
COMPREHENSIVE INCOME –Under Statement of Financial Accounting Standards (SFAS) No. 130, “Reporting Comprehensive Income,” comprehensive income isdefined as total changes in shareholders’ equity except capital transactions. As discussed in Note 4, the company has not adoptedSFAS No. 115, “Accounting for Certain Investments in Debt and Equity Securities,” and consequently, the effects on shareholders’equity as required under the provisions of SFAS No. 115 are not included in comprehensive income. The company’s comprehensiveincome (loss) is comprised of net income (loss) and other comprehensive income (loss) representing changes in foreign currencytranslation adjustments and minimum pension liability adjustment. Comprehensive income (loss) and its components are disclosed inthe consolidated statements of shareholders’ equity and in Note 15.
NEW ACCOUNTING STANDARDS –In June 1998, the Financial Accounting Standards Board (FASB) issued SFAS No. 133, “Accounting for Derivative Instruments andHedging Activities.” SFAS No. 133 establishes accounting and reporting standards for derivative instruments and for hedging activities.SFAS No. 133 requires that all derivatives be recognized as either assets or liabilities in the balance sheet and be measured at fairvalue. The fair value adjustments are recorded in current earnings or other comprehensive income, depending on whether a derivativeinstrument is designated as part of a hedge transaction and, if it is, the type of hedge transaction. In June 1999, FASB issued SFASNo.137, “Accounting for Derivative Instruments and Hedging Activities—Deferral of the Effective Date of SFAS No.133,” which defersthe effective date of SFAS No.133 for one year. Therefore, in the case of the company, SFAS No.133 is effective for the fiscal yearbeginning April 1, 2001. Currently, the company is in the process of assessing the impact from adoption of this statement on itsresults of operations or financial conditions.
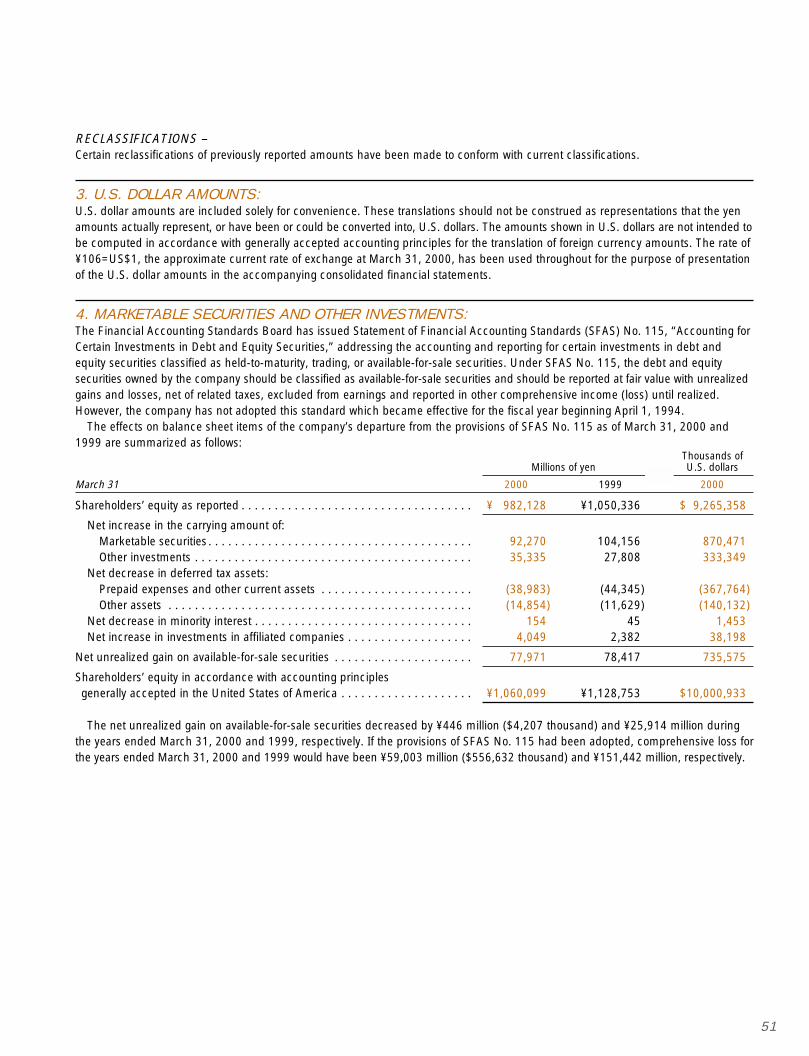
51
RECLASSIFICATIONS –Certain reclassifications of previously reported amounts have been made to conform with current classifications.
3. U.S. DOLLAR AMOUNTS:U.S. dollar amounts are included solely for convenience. These translations should not be construed as representations that the yenamounts actually represent, or have been or could be converted into, U.S. dollars. The amounts shown in U.S. dollars are not intended tobe computed in accordance with generally accepted accounting principles for the translation of foreign currency amounts. The rate of¥106=US$1, the approximate current rate of exchange at March 31, 2000, has been used throughout for the purpose of presentationof the U.S. dollar amounts in the accompanying consolidated financial statements.
4. MARKETABLE SECURITIES AND OTHER INVESTMENTS:The Financial Accounting Standards Board has issued Statement of Financial Accounting Standards (SFAS) No. 115, “Accounting forCertain Investments in Debt and Equity Securities,” addressing the accounting and reporting for certain investments in debt andequity securities classified as held-to-maturity, trading, or available-for-sale securities. Under SFAS No. 115, the debt and equitysecurities owned by the company should be classified as available-for-sale securities and should be reported at fair value with unrealizedgains and losses, net of related taxes, excluded from earnings and reported in other comprehensive income (loss) until realized.However, the company has not adopted this standard which became effective for the fiscal year beginning April 1, 1994.
The effects on balance sheet items of the company’s departure from the provisions of SFAS No. 115 as of March 31, 2000 and1999 are summarized as follows:
Thousands ofMillions of yen U.S. dollars
March 31 2000 1999 2000
Shareholders’ equity as reported . . . . . . . . . . . . . . . . . . . . . . . . . . . . . . . . . . . ¥ 982,128 ¥1,050,336 $ 9,265,358
Net increase in the carrying amount of:Marketable securities . . . . . . . . . . . . . . . . . . . . . . . . . . . . . . . . . . . . . . . . 92,270 104,156 870,471Other investments . . . . . . . . . . . . . . . . . . . . . . . . . . . . . . . . . . . . . . . . . . 35,335 27,808 333,349
Net decrease in deferred tax assets:Prepaid expenses and other current assets . . . . . . . . . . . . . . . . . . . . . . . (38,983) (44,345) (367,764)Other assets . . . . . . . . . . . . . . . . . . . . . . . . . . . . . . . . . . . . . . . . . . . . . . (14,854) (11,629) (140,132)
Net decrease in minority interest . . . . . . . . . . . . . . . . . . . . . . . . . . . . . . . . . 154 45 1,453Net increase in investments in affiliated companies . . . . . . . . . . . . . . . . . . . 4,049 2,382 38,198
Net unrealized gain on available-for-sale securities . . . . . . . . . . . . . . . . . . . . . 77,971 78,417 735,575
Shareholders’ equity in accordance with accounting principlesgenerally accepted in the United States of America . . . . . . . . . . . . . . . . . . . . ¥1,060,099 ¥1,128,753 $10,000,933
The net unrealized gain on available-for-sale securities decreased by ¥446 million ($4,207 thousand) and ¥25,914 million duringthe years ended March 31, 2000 and 1999, respectively. If the provisions of SFAS No. 115 had been adopted, comprehensive loss forthe years ended March 31, 2000 and 1999 would have been ¥59,003 million ($556,632 thousand) and ¥151,442 million, respectively.
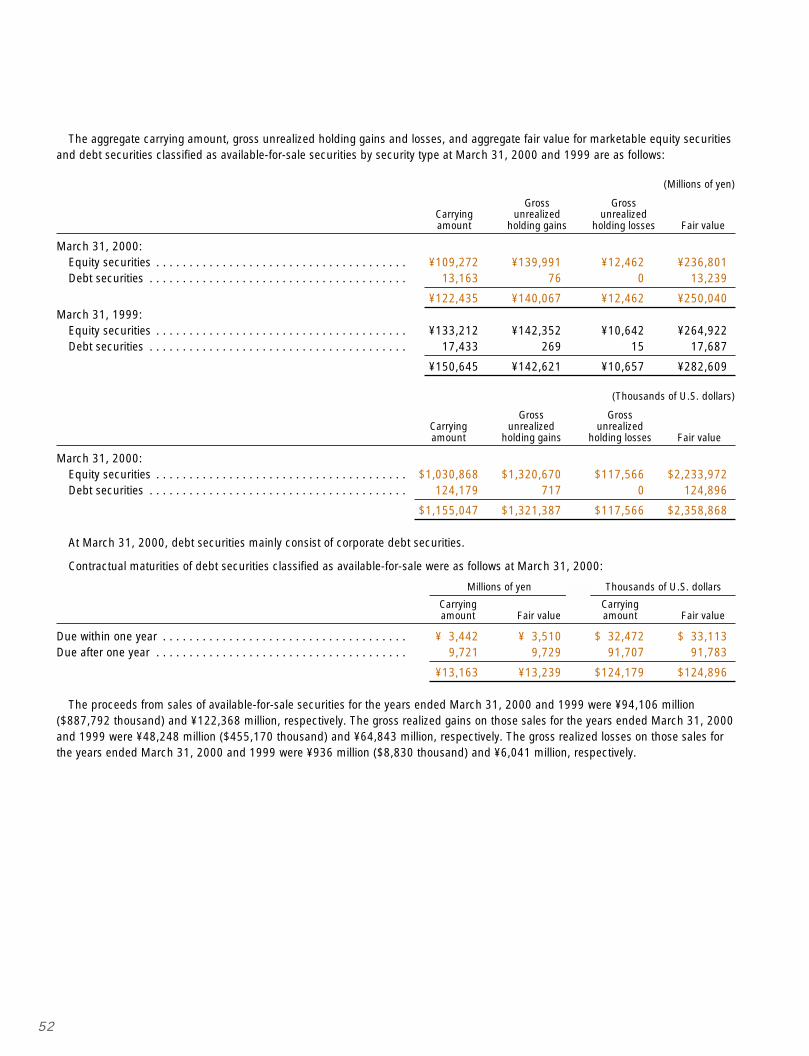
52
The aggregate carrying amount, gross unrealized holding gains and losses, and aggregate fair value for marketable equity securitiesand debt securities classified as available-for-sale securities by security type at March 31, 2000 and 1999 are as follows:
(Millions of yen)
Gross GrossCarrying unrealized unrealizedamount holding gains holding losses Fair value
March 31, 2000:Equity securities . . . . . . . . . . . . . . . . . . . . . . . . . . . . . . . . . . . . . . ¥109,272 ¥139,991 ¥12,462 ¥236,801Debt securities . . . . . . . . . . . . . . . . . . . . . . . . . . . . . . . . . . . . . . . 13,163 76 0 13,239
¥122,435 ¥140,067 ¥12,462 ¥250,040March 31, 1999:
Equity securities . . . . . . . . . . . . . . . . . . . . . . . . . . . . . . . . . . . . . . ¥133,212 ¥142,352 ¥10,642 ¥264,922Debt securities . . . . . . . . . . . . . . . . . . . . . . . . . . . . . . . . . . . . . . . 17,433 269 15 17,687
¥150,645 ¥142,621 ¥10,657 ¥282,609
(Thousands of U.S. dollars)
Gross GrossCarrying unrealized unrealizedamount holding gains holding losses Fair value
March 31, 2000:Equity securities . . . . . . . . . . . . . . . . . . . . . . . . . . . . . . . . . . . . . . $1,030,868 $1,320,670 $117,566 $2,233,972Debt securities . . . . . . . . . . . . . . . . . . . . . . . . . . . . . . . . . . . . . . . 124,179 717 0 124,896
$1,155,047 $1,321,387 $117,566 $2,358,868
At March 31, 2000, debt securities mainly consist of corporate debt securities.
Contractual maturities of debt securities classified as available-for-sale were as follows at March 31, 2000:
Millions of yen Thousands of U.S. dollars
Carrying Carryingamount Fair value amount Fair value
Due within one year . . . . . . . . . . . . . . . . . . . . . . . . . . . . . . . . . . . . . ¥ 3,442 ¥ 3,510 $ 32,472 $ 33,113Due after one year . . . . . . . . . . . . . . . . . . . . . . . . . . . . . . . . . . . . . . 9,721 9,729 91,707 91,783
¥13,163 ¥13,239 $124,179 $124,896
The proceeds from sales of available-for-sale securities for the years ended March 31, 2000 and 1999 were ¥94,106 million($887,792 thousand) and ¥122,368 million, respectively. The gross realized gains on those sales for the years ended March 31, 2000and 1999 were ¥48,248 million ($455,170 thousand) and ¥64,843 million, respectively. The gross realized losses on those sales forthe years ended March 31, 2000 and 1999 were ¥936 million ($8,830 thousand) and ¥6,041 million, respectively.
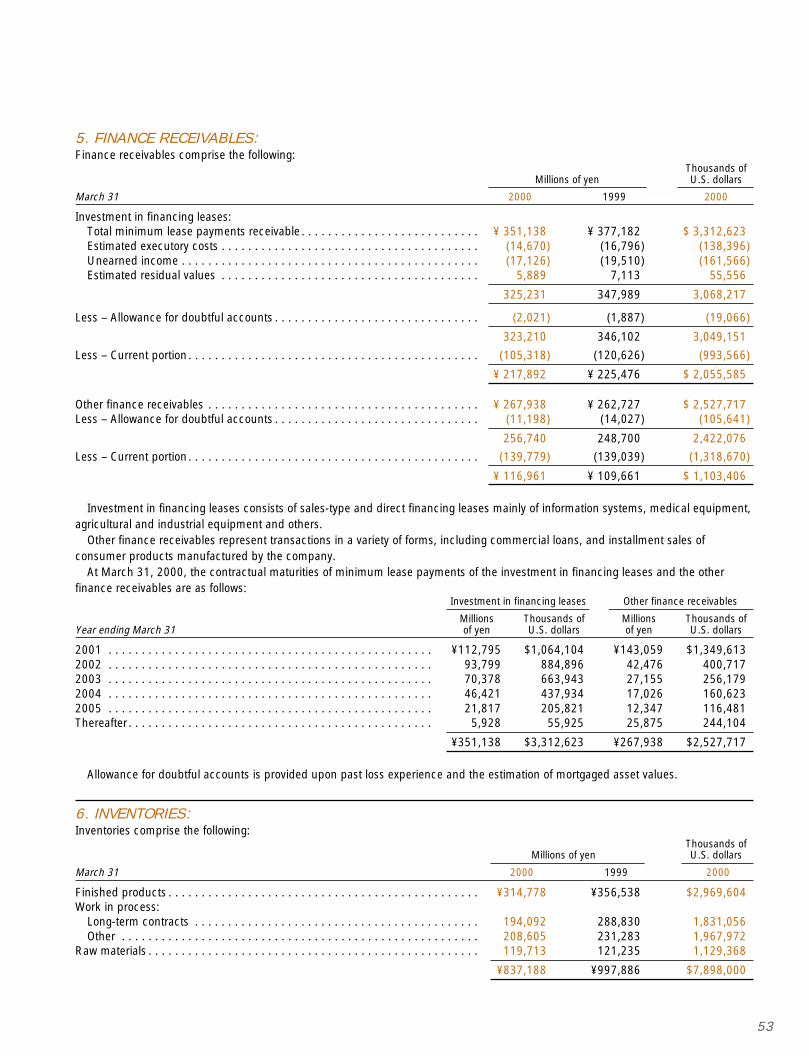
53
5. FINANCE RECEIVABLES:Finance receivables comprise the following:
Thousands ofMillions of yen U.S. dollars
March 31 2000 1999 2000
Investment in financing leases:Total minimum lease payments receivable . . . . . . . . . . . . . . . . . . . . . . . . . . . ¥ 351,138 ¥ 377,182 $ 3,312,623Estimated executory costs . . . . . . . . . . . . . . . . . . . . . . . . . . . . . . . . . . . . . . . (14,670) (16,796) (138,396)Unearned income . . . . . . . . . . . . . . . . . . . . . . . . . . . . . . . . . . . . . . . . . . . . . (17,126) (19,510) (161,566)Estimated residual values . . . . . . . . . . . . . . . . . . . . . . . . . . . . . . . . . . . . . . . 5,889 7,113 55,556
325,231 347,989 3,068,217
Less – Allowance for doubtful accounts . . . . . . . . . . . . . . . . . . . . . . . . . . . . . . . (2,021) (1,887) (19,066)
323,210 346,102 3,049,151
Less – Current portion . . . . . . . . . . . . . . . . . . . . . . . . . . . . . . . . . . . . . . . . . . . . (105,318) (120,626) (993,566)
¥ 217,892 ¥ 225,476 $ 2,055,585
Other finance receivables . . . . . . . . . . . . . . . . . . . . . . . . . . . . . . . . . . . . . . . . . ¥ 267,938 ¥ 262,727 $ 2,527,717Less – Allowance for doubtful accounts . . . . . . . . . . . . . . . . . . . . . . . . . . . . . . . (11,198) (14,027) (105,641)
256,740 248,700 2,422,076
Less – Current portion . . . . . . . . . . . . . . . . . . . . . . . . . . . . . . . . . . . . . . . . . . . . (139,779) (139,039) (1,318,670)
¥ 116,961 ¥ 109,661 $ 1,103,406
Investment in financing leases consists of sales-type and direct financing leases mainly of information systems, medical equipment,agricultural and industrial equipment and others.
Other finance receivables represent transactions in a variety of forms, including commercial loans, and installment sales ofconsumer products manufactured by the company.
At March 31, 2000, the contractual maturities of minimum lease payments of the investment in financing leases and the otherfinance receivables are as follows:
Investment in financing leases Other finance receivables
Millions Thousands of Millions Thousands ofYear ending March 31 of yen U.S. dollars of yen U.S. dollars
2001 . . . . . . . . . . . . . . . . . . . . . . . . . . . . . . . . . . . . . . . . . . . . . . . . . ¥112,795 $1,064,104 ¥143,059 $1,349,6132002 . . . . . . . . . . . . . . . . . . . . . . . . . . . . . . . . . . . . . . . . . . . . . . . . . 93,799 884,896 42,476 400,7172003 . . . . . . . . . . . . . . . . . . . . . . . . . . . . . . . . . . . . . . . . . . . . . . . . . 70,378 663,943 27,155 256,1792004 . . . . . . . . . . . . . . . . . . . . . . . . . . . . . . . . . . . . . . . . . . . . . . . . . 46,421 437,934 17,026 160,6232005 . . . . . . . . . . . . . . . . . . . . . . . . . . . . . . . . . . . . . . . . . . . . . . . . . 21,817 205,821 12,347 116,481Thereafter . . . . . . . . . . . . . . . . . . . . . . . . . . . . . . . . . . . . . . . . . . . . . . 5,928 55,925 25,875 244,104
¥351,138 $3,312,623 ¥267,938 $2,527,717
Allowance for doubtful accounts is provided upon past loss experience and the estimation of mortgaged asset values.
6. INVENTORIES:Inventories comprise the following:
Thousands ofMillions of yen U.S. dollars
March 31 2000 1999 2000
Finished products . . . . . . . . . . . . . . . . . . . . . . . . . . . . . . . . . . . . . . . . . . . . . . . ¥314,778 ¥356,538 $2,969,604Work in process:
Long-term contracts . . . . . . . . . . . . . . . . . . . . . . . . . . . . . . . . . . . . . . . . . . . 194,092 288,830 1,831,056Other . . . . . . . . . . . . . . . . . . . . . . . . . . . . . . . . . . . . . . . . . . . . . . . . . . . . . . 208,605 231,283 1,967,972
Raw materials . . . . . . . . . . . . . . . . . . . . . . . . . . . . . . . . . . . . . . . . . . . . . . . . . . 119,713 121,235 1,129,368
¥837,188 ¥997,886 $7,898,000
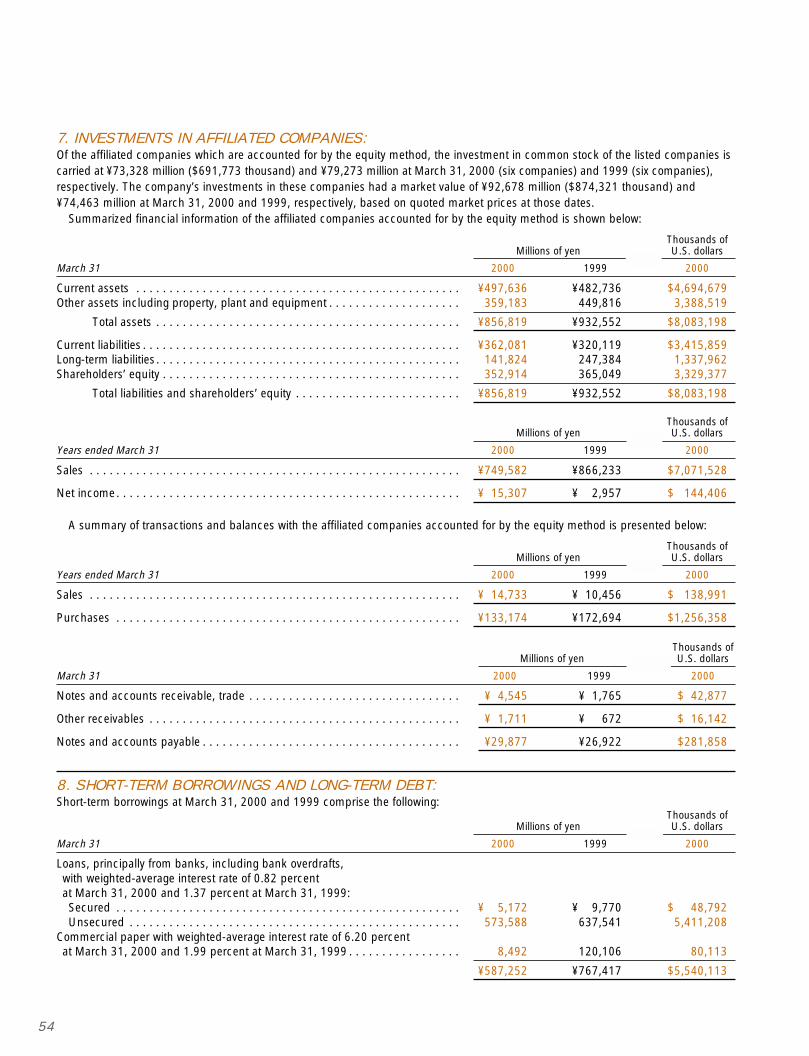
54
7. INVESTMENTS IN AFFILIATED COMPANIES:Of the affiliated companies which are accounted for by the equity method, the investment in common stock of the listed companies iscarried at ¥73,328 million ($691,773 thousand) and ¥79,273 million at March 31, 2000 (six companies) and 1999 (six companies),respectively. The company’s investments in these companies had a market value of ¥92,678 million ($874,321 thousand) and¥74,463 million at March 31, 2000 and 1999, respectively, based on quoted market prices at those dates.
Summarized financial information of the affiliated companies accounted for by the equity method is shown below:
Thousands ofMillions of yen U.S. dollars
March 31 2000 1999 2000
Current assets . . . . . . . . . . . . . . . . . . . . . . . . . . . . . . . . . . . . . . . . . . . . . . . . . ¥497,636 ¥482,736 $4,694,679Other assets including property, plant and equipment . . . . . . . . . . . . . . . . . . . . 359,183 449,816 3,388,519
Total assets . . . . . . . . . . . . . . . . . . . . . . . . . . . . . . . . . . . . . . . . . . . . . . ¥856,819 ¥932,552 $8,083,198
Current liabilities . . . . . . . . . . . . . . . . . . . . . . . . . . . . . . . . . . . . . . . . . . . . . . . . ¥362,081 ¥320,119 $3,415,859Long-term liabilities . . . . . . . . . . . . . . . . . . . . . . . . . . . . . . . . . . . . . . . . . . . . . . 141,824 247,384 1,337,962Shareholders’ equity . . . . . . . . . . . . . . . . . . . . . . . . . . . . . . . . . . . . . . . . . . . . . 352,914 365,049 3,329,377
Total liabilities and shareholders’ equity . . . . . . . . . . . . . . . . . . . . . . . . . ¥856,819 ¥932,552 $8,083,198
Thousands ofMillions of yen U.S. dollars
Years ended March 31 2000 1999 2000
Sales . . . . . . . . . . . . . . . . . . . . . . . . . . . . . . . . . . . . . . . . . . . . . . . . . . . . . . . . ¥749,582 ¥866,233 $7,071,528
Net income. . . . . . . . . . . . . . . . . . . . . . . . . . . . . . . . . . . . . . . . . . . . . . . . . . . . ¥ 15,307 ¥ 2,957 $ 144,406
A summary of transactions and balances with the affiliated companies accounted for by the equity method is presented below:
Thousands ofMillions of yen U.S. dollars
Years ended March 31 2000 1999 2000
Sales . . . . . . . . . . . . . . . . . . . . . . . . . . . . . . . . . . . . . . . . . . . . . . . . . . . . . . . . ¥ 14,733 ¥ 10,456 $ 138,991
Purchases . . . . . . . . . . . . . . . . . . . . . . . . . . . . . . . . . . . . . . . . . . . . . . . . . . . . ¥133,174 ¥172,694 $1,256,358
Thousands ofMillions of yen U.S. dollars
March 31 2000 1999 2000
Notes and accounts receivable, trade . . . . . . . . . . . . . . . . . . . . . . . . . . . . . . . . ¥ 4,545 ¥ 1,765 $ 42,877
Other receivables . . . . . . . . . . . . . . . . . . . . . . . . . . . . . . . . . . . . . . . . . . . . . . . ¥ 1,711 ¥ 672 $ 16,142
Notes and accounts payable . . . . . . . . . . . . . . . . . . . . . . . . . . . . . . . . . . . . . . . ¥29,877 ¥26,922 $281,858
8. SHORT-TERM BORROWINGS AND LONG-TERM DEBT:Short-term borrowings at March 31, 2000 and 1999 comprise the following:
Thousands ofMillions of yen U.S. dollars
March 31 2000 1999 2000
Loans, principally from banks, including bank overdrafts,with weighted-average interest rate of 0.82 percentat March 31, 2000 and 1.37 percent at March 31, 1999:Secured . . . . . . . . . . . . . . . . . . . . . . . . . . . . . . . . . . . . . . . . . . . . . . . . . . . . ¥ 5,172 ¥ 9,770 $ 48,792Unsecured . . . . . . . . . . . . . . . . . . . . . . . . . . . . . . . . . . . . . . . . . . . . . . . . . . 573,588 637,541 5,411,208
Commercial paper with weighted-average interest rate of 6.20 percentat March 31, 2000 and 1.99 percent at March 31, 1999 . . . . . . . . . . . . . . . . . 8,492 120,106 80,113
¥587,252 ¥767,417 $5,540,113
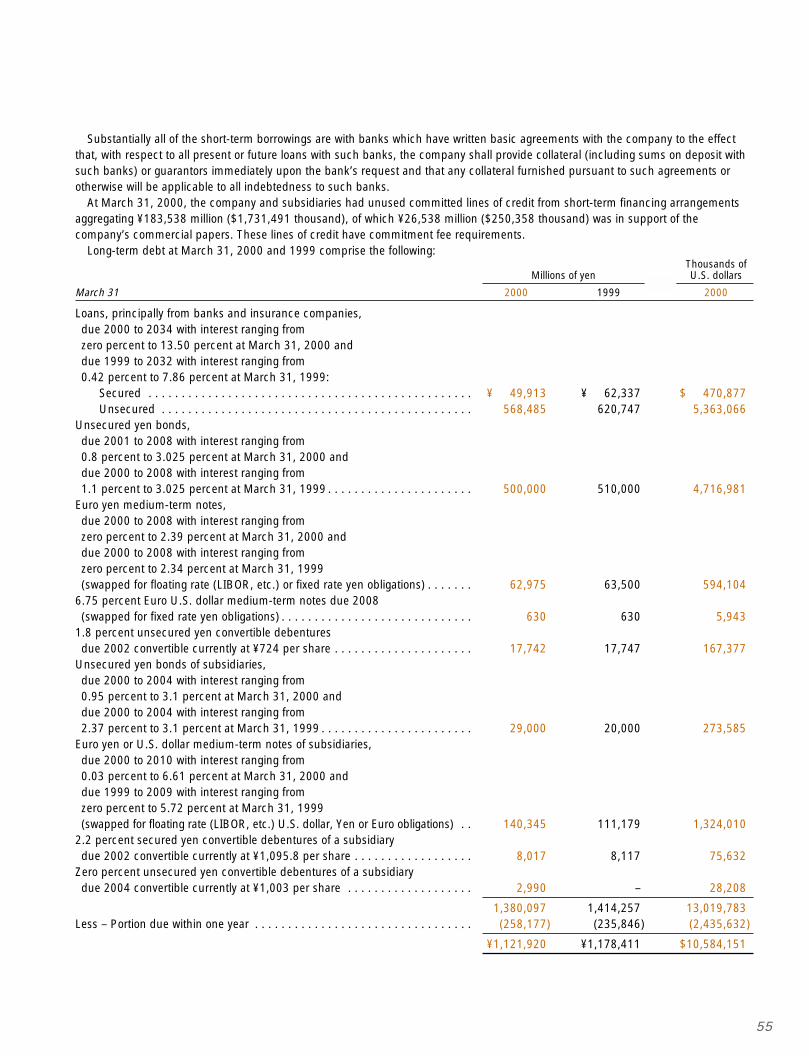
55
Substantially all of the short-term borrowings are with banks which have written basic agreements with the company to the effectthat, with respect to all present or future loans with such banks, the company shall provide collateral (including sums on deposit withsuch banks) or guarantors immediately upon the bank’s request and that any collateral furnished pursuant to such agreements orotherwise will be applicable to all indebtedness to such banks.
At March 31, 2000, the company and subsidiaries had unused committed lines of credit from short-term financing arrangementsaggregating ¥183,538 million ($1,731,491 thousand), of which ¥26,538 million ($250,358 thousand) was in support of thecompany’s commercial papers. These lines of credit have commitment fee requirements.
Long-term debt at March 31, 2000 and 1999 comprise the following:Thousands of
Millions of yen U.S. dollars
March 31 2000 1999 2000
Loans, principally from banks and insurance companies,due 2000 to 2034 with interest ranging fromzero percent to 13.50 percent at March 31, 2000 anddue 1999 to 2032 with interest ranging from0.42 percent to 7.86 percent at March 31, 1999:
Secured . . . . . . . . . . . . . . . . . . . . . . . . . . . . . . . . . . . . . . . . . . . . . . . . . ¥ 49,913 ¥ 62,337 $ 470,877Unsecured . . . . . . . . . . . . . . . . . . . . . . . . . . . . . . . . . . . . . . . . . . . . . . . 568,485 620,747 5,363,066
Unsecured yen bonds,due 2001 to 2008 with interest ranging from0.8 percent to 3.025 percent at March 31, 2000 anddue 2000 to 2008 with interest ranging from1.1 percent to 3.025 percent at March 31, 1999 . . . . . . . . . . . . . . . . . . . . . . 500,000 510,000 4,716,981
Euro yen medium-term notes,due 2000 to 2008 with interest ranging fromzero percent to 2.39 percent at March 31, 2000 anddue 2000 to 2008 with interest ranging fromzero percent to 2.34 percent at March 31, 1999(swapped for floating rate (LIBOR, etc.) or fixed rate yen obligations) . . . . . . . 62,975 63,500 594,104
6.75 percent Euro U.S. dollar medium-term notes due 2008(swapped for fixed rate yen obligations) . . . . . . . . . . . . . . . . . . . . . . . . . . . . . 630 630 5,943
1.8 percent unsecured yen convertible debenturesdue 2002 convertible currently at ¥724 per share . . . . . . . . . . . . . . . . . . . . . 17,742 17,747 167,377
Unsecured yen bonds of subsidiaries,due 2000 to 2004 with interest ranging from0.95 percent to 3.1 percent at March 31, 2000 anddue 2000 to 2004 with interest ranging from2.37 percent to 3.1 percent at March 31, 1999 . . . . . . . . . . . . . . . . . . . . . . . 29,000 20,000 273,585
Euro yen or U.S. dollar medium-term notes of subsidiaries,due 2000 to 2010 with interest ranging from0.03 percent to 6.61 percent at March 31, 2000 anddue 1999 to 2009 with interest ranging fromzero percent to 5.72 percent at March 31, 1999(swapped for floating rate (LIBOR, etc.) U.S. dollar, Yen or Euro obligations) . . 140,345 111,179 1,324,010
2.2 percent secured yen convertible debentures of a subsidiarydue 2002 convertible currently at ¥1,095.8 per share . . . . . . . . . . . . . . . . . . 8,017 8,117 75,632
Zero percent unsecured yen convertible debentures of a subsidiarydue 2004 convertible currently at ¥1,003 per share . . . . . . . . . . . . . . . . . . . 2,990 – 28,208
1,380,097 1,414,257 13,019,783Less – Portion due within one year . . . . . . . . . . . . . . . . . . . . . . . . . . . . . . . . . (258,177) (235,846) (2,435,632)
¥1,121,920 ¥1,178,411 $10,584,151
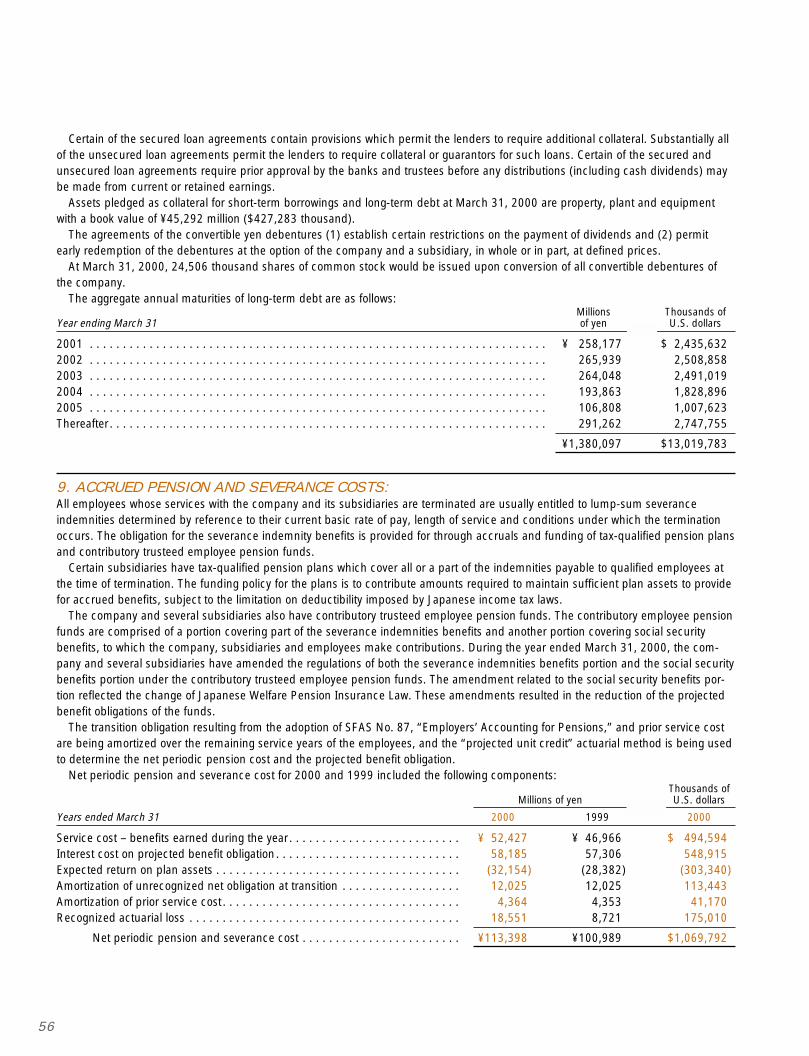
56
Certain of the secured loan agreements contain provisions which permit the lenders to require additional collateral. Substantially allof the unsecured loan agreements permit the lenders to require collateral or guarantors for such loans. Certain of the secured andunsecured loan agreements require prior approval by the banks and trustees before any distributions (including cash dividends) maybe made from current or retained earnings.
Assets pledged as collateral for short-term borrowings and long-term debt at March 31, 2000 are property, plant and equipmentwith a book value of ¥45,292 million ($427,283 thousand).
The agreements of the convertible yen debentures (1) establish certain restrictions on the payment of dividends and (2) permitearly redemption of the debentures at the option of the company and a subsidiary, in whole or in part, at defined prices.
At March 31, 2000, 24,506 thousand shares of common stock would be issued upon conversion of all convertible debentures ofthe company.
The aggregate annual maturities of long-term debt are as follows:Millions Thousands of
Year ending March 31 of yen U.S. dollars
2001 . . . . . . . . . . . . . . . . . . . . . . . . . . . . . . . . . . . . . . . . . . . . . . . . . . . . . . . . . . . . . . . . . . . . . ¥ 258,177 $ 2,435,6322002 . . . . . . . . . . . . . . . . . . . . . . . . . . . . . . . . . . . . . . . . . . . . . . . . . . . . . . . . . . . . . . . . . . . . . 265,939 2,508,8582003 . . . . . . . . . . . . . . . . . . . . . . . . . . . . . . . . . . . . . . . . . . . . . . . . . . . . . . . . . . . . . . . . . . . . . 264,048 2,491,0192004 . . . . . . . . . . . . . . . . . . . . . . . . . . . . . . . . . . . . . . . . . . . . . . . . . . . . . . . . . . . . . . . . . . . . . 193,863 1,828,8962005 . . . . . . . . . . . . . . . . . . . . . . . . . . . . . . . . . . . . . . . . . . . . . . . . . . . . . . . . . . . . . . . . . . . . . 106,808 1,007,623Thereafter . . . . . . . . . . . . . . . . . . . . . . . . . . . . . . . . . . . . . . . . . . . . . . . . . . . . . . . . . . . . . . . . . . 291,262 2,747,755
¥1,380,097 $13,019,783
9. ACCRUED PENSION AND SEVERANCE COSTS:All employees whose services with the company and its subsidiaries are terminated are usually entitled to lump-sum severanceindemnities determined by reference to their current basic rate of pay, length of service and conditions under which the terminationoccurs. The obligation for the severance indemnity benefits is provided for through accruals and funding of tax-qualified pension plansand contributory trusteed employee pension funds.
Certain subsidiaries have tax-qualified pension plans which cover all or a part of the indemnities payable to qualified employees atthe time of termination. The funding policy for the plans is to contribute amounts required to maintain sufficient plan assets to providefor accrued benefits, subject to the limitation on deductibility imposed by Japanese income tax laws.
The company and several subsidiaries also have contributory trusteed employee pension funds. The contributory employee pensionfunds are comprised of a portion covering part of the severance indemnities benefits and another portion covering social securitybenefits, to which the company, subsidiaries and employees make contributions. During the year ended March 31, 2000, the com-pany and several subsidiaries have amended the regulations of both the severance indemnities benefits portion and the social securitybenefits portion under the contributory trusteed employee pension funds. The amendment related to the social security benefits por-tion reflected the change of Japanese Welfare Pension Insurance Law. These amendments resulted in the reduction of the projectedbenefit obligations of the funds.
The transition obligation resulting from the adoption of SFAS No. 87, “Employers’ Accounting for Pensions,” and prior service costare being amortized over the remaining service years of the employees, and the “projected unit credit” actuarial method is being usedto determine the net periodic pension cost and the projected benefit obligation.
Net periodic pension and severance cost for 2000 and 1999 included the following components:Thousands of
Millions of yen U.S. dollars
Years ended March 31 2000 1999 2000
Service cost – benefits earned during the year . . . . . . . . . . . . . . . . . . . . . . . . . . ¥ 52,427 ¥ 46,966 $ 494,594Interest cost on projected benefit obligation. . . . . . . . . . . . . . . . . . . . . . . . . . . . 58,185 57,306 548,915Expected return on plan assets . . . . . . . . . . . . . . . . . . . . . . . . . . . . . . . . . . . . . (32,154) (28,382) (303,340)Amortization of unrecognized net obligation at transition . . . . . . . . . . . . . . . . . . 12,025 12,025 113,443Amortization of prior service cost . . . . . . . . . . . . . . . . . . . . . . . . . . . . . . . . . . . . 4,364 4,353 41,170Recognized actuarial loss . . . . . . . . . . . . . . . . . . . . . . . . . . . . . . . . . . . . . . . . . 18,551 8,721 175,010
Net periodic pension and severance cost . . . . . . . . . . . . . . . . . . . . . . . . ¥113,398 ¥100,989 $1,069,792
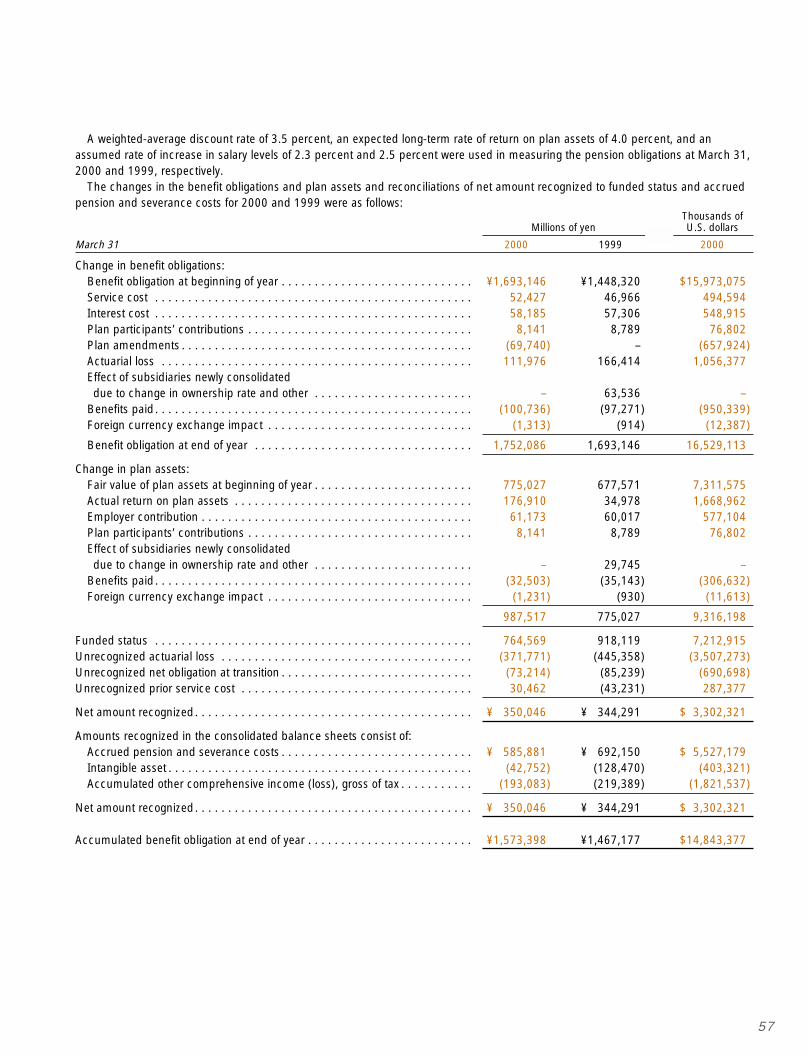
57
A weighted-average discount rate of 3.5 percent, an expected long-term rate of return on plan assets of 4.0 percent, and anassumed rate of increase in salary levels of 2.3 percent and 2.5 percent were used in measuring the pension obligations at March 31,2000 and 1999, respectively.
The changes in the benefit obligations and plan assets and reconciliations of net amount recognized to funded status and accruedpension and severance costs for 2000 and 1999 were as follows:
Thousands ofMillions of yen U.S. dollars
March 31 2000 1999 2000
Change in benefit obligations:Benefit obligation at beginning of year . . . . . . . . . . . . . . . . . . . . . . . . . . . . . ¥1,693,146 ¥1,448,320 $15,973,075Service cost . . . . . . . . . . . . . . . . . . . . . . . . . . . . . . . . . . . . . . . . . . . . . . . . 52,427 46,966 494,594Interest cost . . . . . . . . . . . . . . . . . . . . . . . . . . . . . . . . . . . . . . . . . . . . . . . . 58,185 57,306 548,915Plan participants’ contributions . . . . . . . . . . . . . . . . . . . . . . . . . . . . . . . . . . 8,141 8,789 76,802Plan amendments . . . . . . . . . . . . . . . . . . . . . . . . . . . . . . . . . . . . . . . . . . . . (69,740) – (657,924)Actuarial loss . . . . . . . . . . . . . . . . . . . . . . . . . . . . . . . . . . . . . . . . . . . . . . . 111,976 166,414 1,056,377Effect of subsidiaries newly consolidateddue to change in ownership rate and other . . . . . . . . . . . . . . . . . . . . . . . . – 63,536 –
Benefits paid . . . . . . . . . . . . . . . . . . . . . . . . . . . . . . . . . . . . . . . . . . . . . . . . (100,736) (97,271) (950,339)Foreign currency exchange impact . . . . . . . . . . . . . . . . . . . . . . . . . . . . . . . (1,313) (914) (12,387)
Benefit obligation at end of year . . . . . . . . . . . . . . . . . . . . . . . . . . . . . . . . . 1,752,086 1,693,146 16,529,113
Change in plan assets:Fair value of plan assets at beginning of year . . . . . . . . . . . . . . . . . . . . . . . . 775,027 677,571 7,311,575Actual return on plan assets . . . . . . . . . . . . . . . . . . . . . . . . . . . . . . . . . . . . 176,910 34,978 1,668,962Employer contribution . . . . . . . . . . . . . . . . . . . . . . . . . . . . . . . . . . . . . . . . . 61,173 60,017 577,104Plan participants’ contributions . . . . . . . . . . . . . . . . . . . . . . . . . . . . . . . . . . 8,141 8,789 76,802Effect of subsidiaries newly consolidateddue to change in ownership rate and other . . . . . . . . . . . . . . . . . . . . . . . . – 29,745 –
Benefits paid . . . . . . . . . . . . . . . . . . . . . . . . . . . . . . . . . . . . . . . . . . . . . . . . (32,503) (35,143) (306,632)Foreign currency exchange impact . . . . . . . . . . . . . . . . . . . . . . . . . . . . . . . (1,231) (930) (11,613)
987,517 775,027 9,316,198
Funded status . . . . . . . . . . . . . . . . . . . . . . . . . . . . . . . . . . . . . . . . . . . . . . . . 764,569 918,119 7,212,915Unrecognized actuarial loss . . . . . . . . . . . . . . . . . . . . . . . . . . . . . . . . . . . . . . (371,771) (445,358) (3,507,273)Unrecognized net obligation at transition . . . . . . . . . . . . . . . . . . . . . . . . . . . . . (73,214) (85,239) (690,698)Unrecognized prior service cost . . . . . . . . . . . . . . . . . . . . . . . . . . . . . . . . . . . 30,462 (43,231) 287,377
Net amount recognized. . . . . . . . . . . . . . . . . . . . . . . . . . . . . . . . . . . . . . . . . . ¥ 350,046 ¥ 344,291 $ 3,302,321
Amounts recognized in the consolidated balance sheets consist of:Accrued pension and severance costs . . . . . . . . . . . . . . . . . . . . . . . . . . . . . ¥ 585,881 ¥ 692,150 $ 5,527,179Intangible asset . . . . . . . . . . . . . . . . . . . . . . . . . . . . . . . . . . . . . . . . . . . . . . (42,752) (128,470) (403,321)Accumulated other comprehensive income (loss), gross of tax . . . . . . . . . . . (193,083) (219,389) (1,821,537)
Net amount recognized. . . . . . . . . . . . . . . . . . . . . . . . . . . . . . . . . . . . . . . . . . ¥ 350,046 ¥ 344,291 $ 3,302,321
Accumulated benefit obligation at end of year . . . . . . . . . . . . . . . . . . . . . . . . . ¥1,573,398 ¥1,467,177 $14,843,377
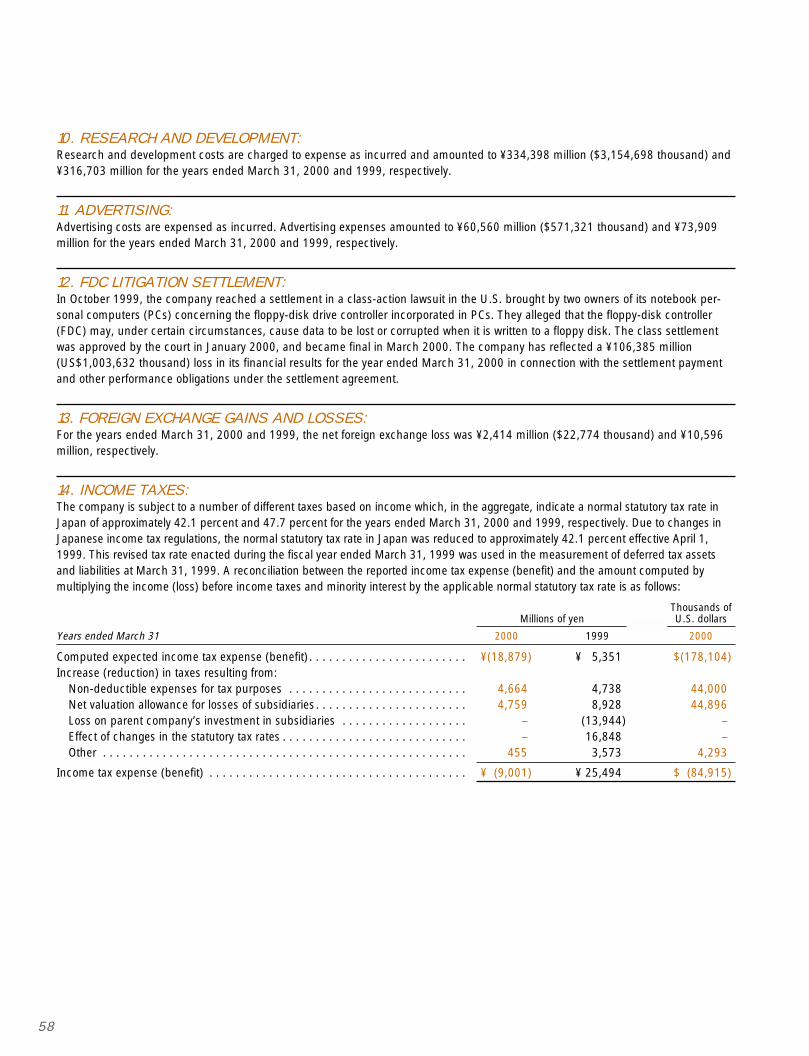
58
10. RESEARCH AND DEVELOPMENT:Research and development costs are charged to expense as incurred and amounted to ¥334,398 million ($3,154,698 thousand) and¥316,703 million for the years ended March 31, 2000 and 1999, respectively.
11. ADVERTISING:Advertising costs are expensed as incurred. Advertising expenses amounted to ¥60,560 million ($571,321 thousand) and ¥73,909million for the years ended March 31, 2000 and 1999, respectively.
12. FDC LITIGATION SETTLEMENT:In October 1999, the company reached a settlement in a class-action lawsuit in the U.S. brought by two owners of its notebook per-sonal computers (PCs) concerning the floppy-disk drive controller incorporated in PCs. They alleged that the floppy-disk controller(FDC) may, under certain circumstances, cause data to be lost or corrupted when it is written to a floppy disk. The class settlementwas approved by the court in January 2000, and became final in March 2000. The company has reflected a ¥106,385 million(US$1,003,632 thousand) loss in its financial results for the year ended March 31, 2000 in connection with the settlement paymentand other performance obligations under the settlement agreement.
13. FOREIGN EXCHANGE GAINS AND LOSSES:For the years ended March 31, 2000 and 1999, the net foreign exchange loss was ¥2,414 million ($22,774 thousand) and ¥10,596million, respectively.
14. INCOME TAXES:The company is subject to a number of different taxes based on income which, in the aggregate, indicate a normal statutory tax rate inJapan of approximately 42.1 percent and 47.7 percent for the years ended March 31, 2000 and 1999, respectively. Due to changes inJapanese income tax regulations, the normal statutory tax rate in Japan was reduced to approximately 42.1 percent effective April 1,1999. This revised tax rate enacted during the fiscal year ended March 31, 1999 was used in the measurement of deferred tax assetsand liabilities at March 31, 1999. A reconciliation between the reported income tax expense (benefit) and the amount computed bymultiplying the income (loss) before income taxes and minority interest by the applicable normal statutory tax rate is as follows:
Thousands ofMillions of yen U.S. dollars
Years ended March 31 2000 1999 2000
Computed expected income tax expense (benefit) . . . . . . . . . . . . . . . . . . . . . . . . ¥(18,879) ¥ 5,351 $(178,104)Increase (reduction) in taxes resulting from:
Non-deductible expenses for tax purposes . . . . . . . . . . . . . . . . . . . . . . . . . . . 4,664 4,738 44,000Net valuation allowance for losses of subsidiaries . . . . . . . . . . . . . . . . . . . . . . . 4,759 8,928 44,896Loss on parent company’s investment in subsidiaries . . . . . . . . . . . . . . . . . . . – (13,944) –Effect of changes in the statutory tax rates . . . . . . . . . . . . . . . . . . . . . . . . . . . . – 16,848 –Other . . . . . . . . . . . . . . . . . . . . . . . . . . . . . . . . . . . . . . . . . . . . . . . . . . . . . . . 455 3,573 4,293
Income tax expense (benefit) . . . . . . . . . . . . . . . . . . . . . . . . . . . . . . . . . . . . . . . ¥ (9,001) ¥ 25,494 $ (84,915)
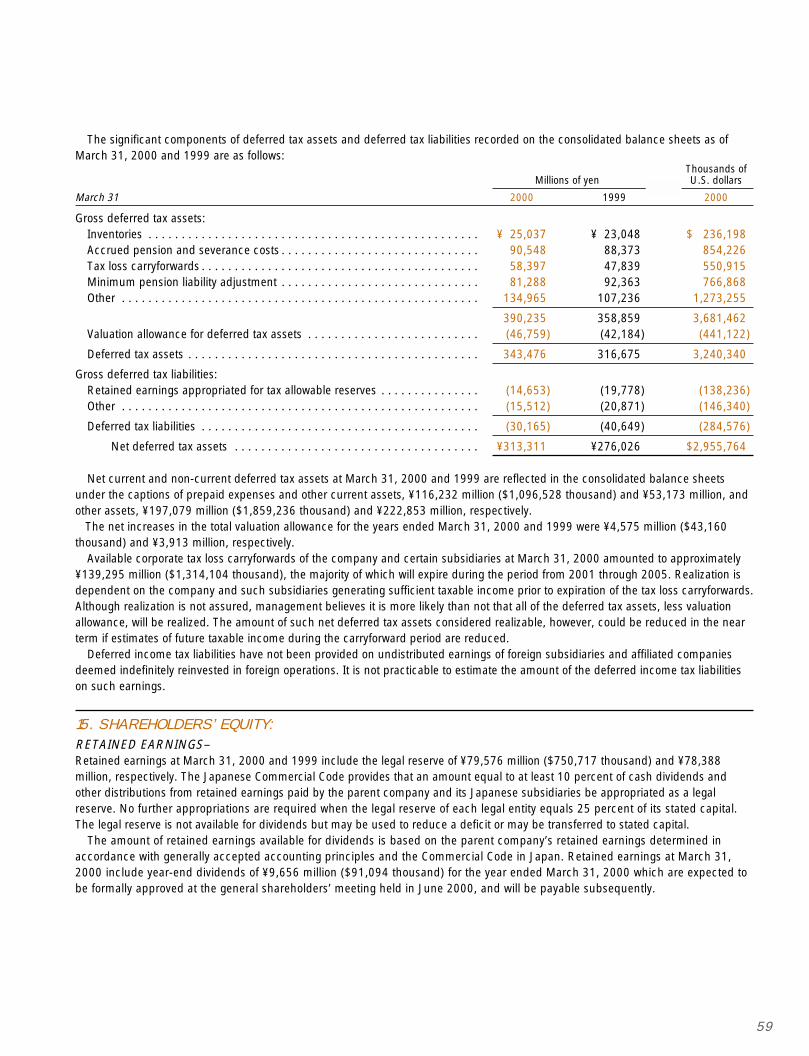
59
15. SHAREHOLDERS’ EQUITY:RETAINED EARNINGS–Retained earnings at March 31, 2000 and 1999 include the legal reserve of ¥79,576 million ($750,717 thousand) and ¥78,388million, respectively. The Japanese Commercial Code provides that an amount equal to at least 10 percent of cash dividends andother distributions from retained earnings paid by the parent company and its Japanese subsidiaries be appropriated as a legalreserve. No further appropriations are required when the legal reserve of each legal entity equals 25 percent of its stated capital.The legal reserve is not available for dividends but may be used to reduce a deficit or may be transferred to stated capital.
The amount of retained earnings available for dividends is based on the parent company’s retained earnings determined inaccordance with generally accepted accounting principles and the Commercial Code in Japan. Retained earnings at March 31,2000 include year-end dividends of ¥9,656 million ($91,094 thousand) for the year ended March 31, 2000 which are expected tobe formally approved at the general shareholders’ meeting held in June 2000, and will be payable subsequently.
The significant components of deferred tax assets and deferred tax liabilities recorded on the consolidated balance sheets as ofMarch 31, 2000 and 1999 are as follows:
Thousands ofMillions of yen U.S. dollars
March 31 2000 1999 2000
Gross deferred tax assets:Inventories . . . . . . . . . . . . . . . . . . . . . . . . . . . . . . . . . . . . . . . . . . . . . . . . . . ¥ 25,037 ¥ 23,048 $ 236,198Accrued pension and severance costs . . . . . . . . . . . . . . . . . . . . . . . . . . . . . . 90,548 88,373 854,226Tax loss carryforwards . . . . . . . . . . . . . . . . . . . . . . . . . . . . . . . . . . . . . . . . . . 58,397 47,839 550,915Minimum pension liability adjustment . . . . . . . . . . . . . . . . . . . . . . . . . . . . . . 81,288 92,363 766,868Other . . . . . . . . . . . . . . . . . . . . . . . . . . . . . . . . . . . . . . . . . . . . . . . . . . . . . . 134,965 107,236 1,273,255
390,235 358,859 3,681,462Valuation allowance for deferred tax assets . . . . . . . . . . . . . . . . . . . . . . . . . . (46,759) (42,184) (441,122)
Deferred tax assets . . . . . . . . . . . . . . . . . . . . . . . . . . . . . . . . . . . . . . . . . . . . 343,476 316,675 3,240,340
Gross deferred tax liabilities:Retained earnings appropriated for tax allowable reserves . . . . . . . . . . . . . . . (14,653) (19,778) (138,236)Other . . . . . . . . . . . . . . . . . . . . . . . . . . . . . . . . . . . . . . . . . . . . . . . . . . . . . . (15,512) (20,871) (146,340)
Deferred tax liabilities . . . . . . . . . . . . . . . . . . . . . . . . . . . . . . . . . . . . . . . . . . (30,165) (40,649) (284,576)
Net deferred tax assets . . . . . . . . . . . . . . . . . . . . . . . . . . . . . . . . . . . . . ¥313,311 ¥276,026 $2,955,764
Net current and non-current deferred tax assets at March 31, 2000 and 1999 are reflected in the consolidated balance sheetsunder the captions of prepaid expenses and other current assets, ¥116,232 million ($1,096,528 thousand) and ¥53,173 million, andother assets, ¥197,079 million ($1,859,236 thousand) and ¥222,853 million, respectively. The net increases in the total valuation allowance for the years ended March 31, 2000 and 1999 were ¥4,575 million ($43,160thousand) and ¥3,913 million, respectively.
Available corporate tax loss carryforwards of the company and certain subsidiaries at March 31, 2000 amounted to approximately¥139,295 million ($1,314,104 thousand), the majority of which will expire during the period from 2001 through 2005. Realization isdependent on the company and such subsidiaries generating sufficient taxable income prior to expiration of the tax loss carryforwards.Although realization is not assured, management believes it is more likely than not that all of the deferred tax assets, less valuationallowance, will be realized. The amount of such net deferred tax assets considered realizable, however, could be reduced in the nearterm if estimates of future taxable income during the carryforward period are reduced.
Deferred income tax liabilities have not been provided on undistributed earnings of foreign subsidiaries and affiliated companiesdeemed indefinitely reinvested in foreign operations. It is not practicable to estimate the amount of the deferred income tax liabilitieson such earnings.
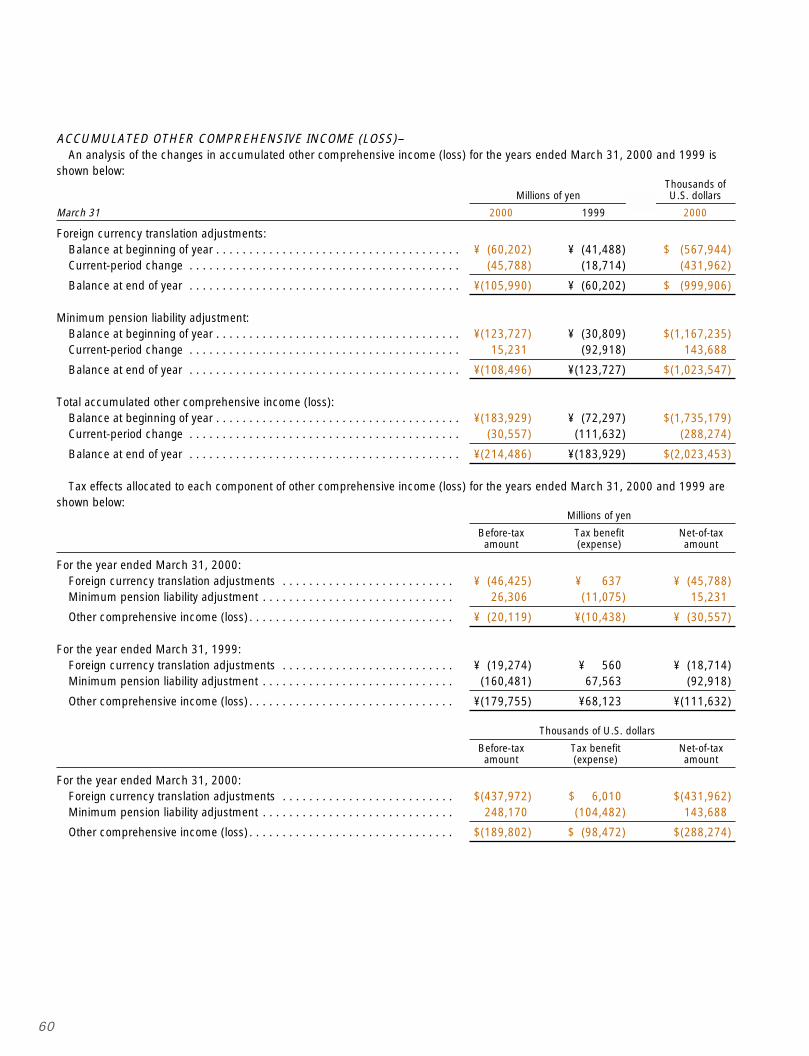
60
ACCUMULATED OTHER COMPREHENSIVE INCOME (LOSS)–An analysis of the changes in accumulated other comprehensive income (loss) for the years ended March 31, 2000 and 1999 is
shown below:Thousands of
Millions of yen U.S. dollars
March 31 2000 1999 2000
Foreign currency translation adjustments:Balance at beginning of year . . . . . . . . . . . . . . . . . . . . . . . . . . . . . . . . . . . . . ¥ (60,202) ¥ (41,488) $ (567,944)Current-period change . . . . . . . . . . . . . . . . . . . . . . . . . . . . . . . . . . . . . . . . . (45,788) (18,714) (431,962)
Balance at end of year . . . . . . . . . . . . . . . . . . . . . . . . . . . . . . . . . . . . . . . . . ¥(105,990) ¥ (60,202) $ (999,906)
Minimum pension liability adjustment:Balance at beginning of year . . . . . . . . . . . . . . . . . . . . . . . . . . . . . . . . . . . . . ¥(123,727) ¥ (30,809) $(1,167,235)Current-period change . . . . . . . . . . . . . . . . . . . . . . . . . . . . . . . . . . . . . . . . . 15,231 (92,918) 143,688
Balance at end of year . . . . . . . . . . . . . . . . . . . . . . . . . . . . . . . . . . . . . . . . . ¥(108,496) ¥(123,727) $(1,023,547)
Total accumulated other comprehensive income (loss):Balance at beginning of year . . . . . . . . . . . . . . . . . . . . . . . . . . . . . . . . . . . . . ¥(183,929) ¥ (72,297) $(1,735,179)Current-period change . . . . . . . . . . . . . . . . . . . . . . . . . . . . . . . . . . . . . . . . . (30,557) (111,632) (288,274)
Balance at end of year . . . . . . . . . . . . . . . . . . . . . . . . . . . . . . . . . . . . . . . . . ¥(214,486) ¥(183,929) $(2,023,453)
Tax effects allocated to each component of other comprehensive income (loss) for the years ended March 31, 2000 and 1999 areshown below:
Millions of yen
Before-tax Tax benefit Net-of-taxamount (expense) amount
For the year ended March 31, 2000:Foreign currency translation adjustments . . . . . . . . . . . . . . . . . . . . . . . . . . ¥ (46,425) ¥ 637 ¥ (45,788)Minimum pension liability adjustment . . . . . . . . . . . . . . . . . . . . . . . . . . . . . 26,306 (11,075) 15,231
Other comprehensive income (loss) . . . . . . . . . . . . . . . . . . . . . . . . . . . . . . . ¥ (20,119) ¥(10,438) ¥ (30,557)
For the year ended March 31, 1999:Foreign currency translation adjustments . . . . . . . . . . . . . . . . . . . . . . . . . . ¥ (19,274) ¥ 560 ¥ (18,714)Minimum pension liability adjustment . . . . . . . . . . . . . . . . . . . . . . . . . . . . . (160,481) 67,563 (92,918)
Other comprehensive income (loss) . . . . . . . . . . . . . . . . . . . . . . . . . . . . . . . ¥(179,755) ¥68,123 ¥(111,632)
Thousands of U.S. dollars
Before-tax Tax benefit Net-of-taxamount (expense) amount
For the year ended March 31, 2000:Foreign currency translation adjustments . . . . . . . . . . . . . . . . . . . . . . . . . . $(437,972) $ 6,010 $(431,962)Minimum pension liability adjustment . . . . . . . . . . . . . . . . . . . . . . . . . . . . . 248,170 (104,482) 143,688
Other comprehensive income (loss) . . . . . . . . . . . . . . . . . . . . . . . . . . . . . . . $(189,802) $ (98,472) $(288,274)
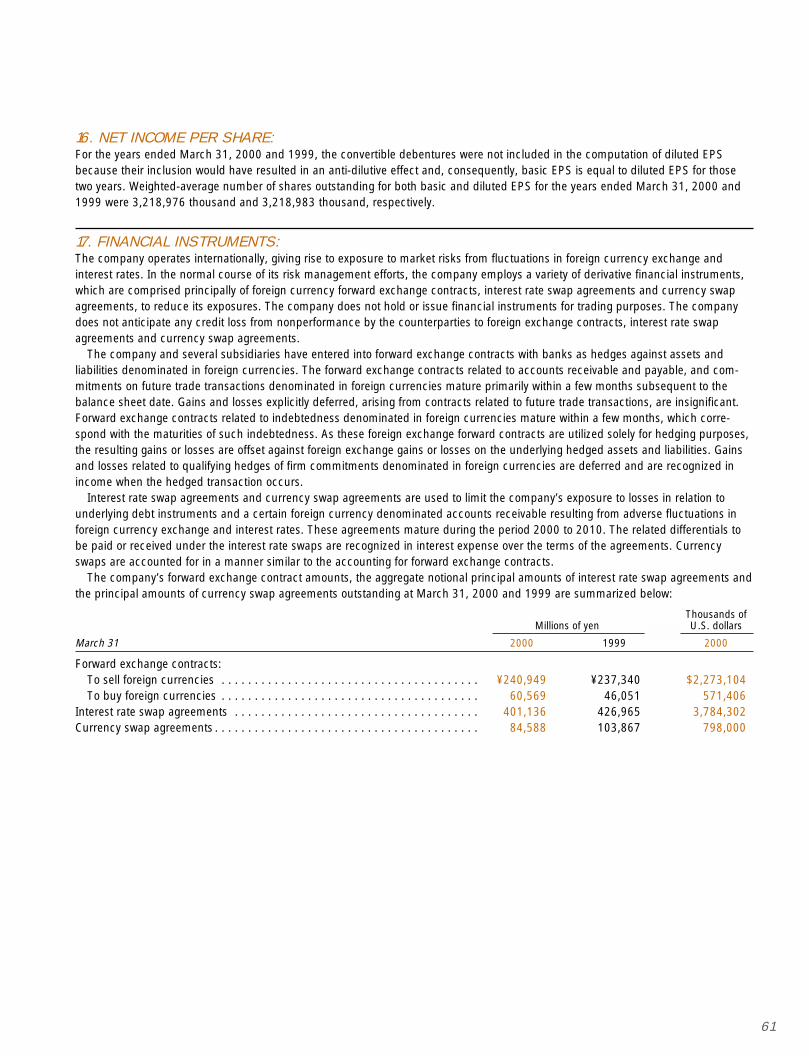
61
16. NET INCOME PER SHARE:For the years ended March 31, 2000 and 1999, the convertible debentures were not included in the computation of diluted EPSbecause their inclusion would have resulted in an anti-dilutive effect and, consequently, basic EPS is equal to diluted EPS for thosetwo years. Weighted-average number of shares outstanding for both basic and diluted EPS for the years ended March 31, 2000 and1999 were 3,218,976 thousand and 3,218,983 thousand, respectively.
17. FINANCIAL INSTRUMENTS:The company operates internationally, giving rise to exposure to market risks from fluctuations in foreign currency exchange andinterest rates. In the normal course of its risk management efforts, the company employs a variety of derivative financial instruments,which are comprised principally of foreign currency forward exchange contracts, interest rate swap agreements and currency swapagreements, to reduce its exposures. The company does not hold or issue financial instruments for trading purposes. The companydoes not anticipate any credit loss from nonperformance by the counterparties to foreign exchange contracts, interest rate swapagreements and currency swap agreements.
The company and several subsidiaries have entered into forward exchange contracts with banks as hedges against assets andliabilities denominated in foreign currencies. The forward exchange contracts related to accounts receivable and payable, and com-mitments on future trade transactions denominated in foreign currencies mature primarily within a few months subsequent to thebalance sheet date. Gains and losses explicitly deferred, arising from contracts related to future trade transactions, are insignificant.Forward exchange contracts related to indebtedness denominated in foreign currencies mature within a few months, which corre-spond with the maturities of such indebtedness. As these foreign exchange forward contracts are utilized solely for hedging purposes,the resulting gains or losses are offset against foreign exchange gains or losses on the underlying hedged assets and liabilities. Gainsand losses related to qualifying hedges of firm commitments denominated in foreign currencies are deferred and are recognized inincome when the hedged transaction occurs.
Interest rate swap agreements and currency swap agreements are used to limit the company’s exposure to losses in relation tounderlying debt instruments and a certain foreign currency denominated accounts receivable resulting from adverse fluctuations inforeign currency exchange and interest rates. These agreements mature during the period 2000 to 2010. The related differentials tobe paid or received under the interest rate swaps are recognized in interest expense over the terms of the agreements. Currencyswaps are accounted for in a manner similar to the accounting for forward exchange contracts.
The company’s forward exchange contract amounts, the aggregate notional principal amounts of interest rate swap agreements andthe principal amounts of currency swap agreements outstanding at March 31, 2000 and 1999 are summarized below:
Thousands ofMillions of yen U.S. dollars
March 31 2000 1999 2000
Forward exchange contracts:To sell foreign currencies . . . . . . . . . . . . . . . . . . . . . . . . . . . . . . . . . . . . . . . ¥240,949 ¥237,340 $2,273,104To buy foreign currencies . . . . . . . . . . . . . . . . . . . . . . . . . . . . . . . . . . . . . . . 60,569 46,051 571,406
Interest rate swap agreements . . . . . . . . . . . . . . . . . . . . . . . . . . . . . . . . . . . . . 401,136 426,965 3,784,302Currency swap agreements . . . . . . . . . . . . . . . . . . . . . . . . . . . . . . . . . . . . . . . . 84,588 103,867 798,000
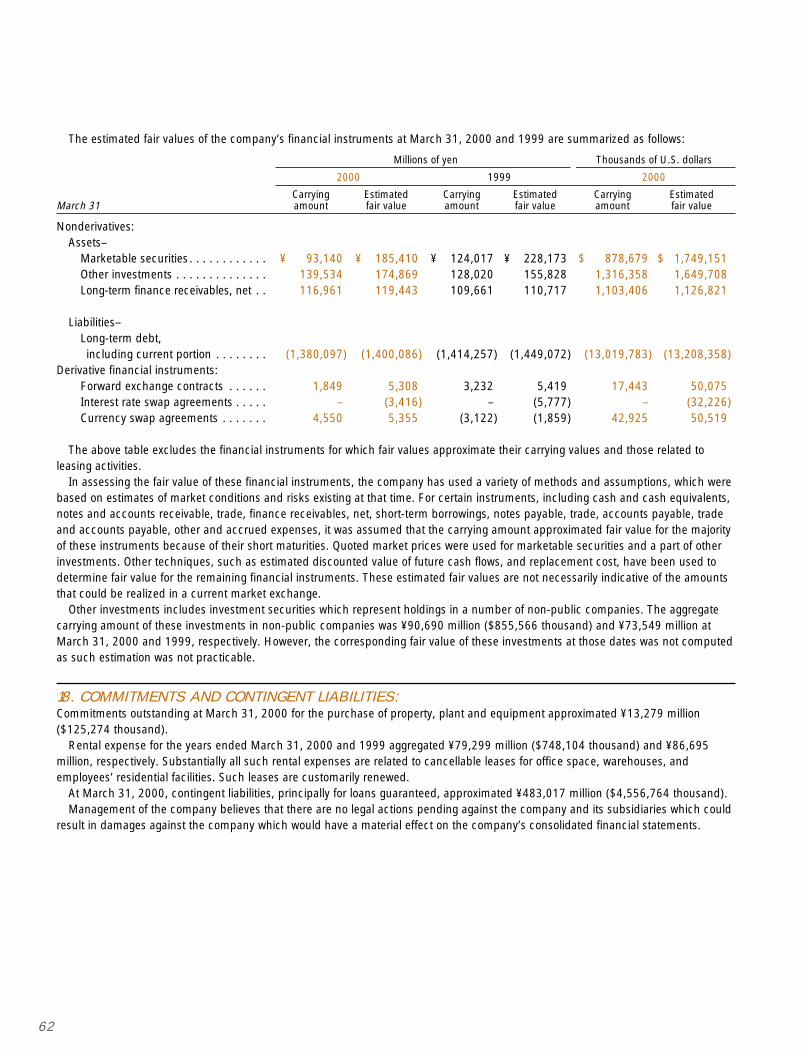
62
The estimated fair values of the company’s financial instruments at March 31, 2000 and 1999 are summarized as follows:
Millions of yen Thousands of U.S. dollars
2000 1999 2000
Carrying Estimated Carrying Estimated Carrying EstimatedMarch 31 amount fair value amount fair value amount fair value
Nonderivatives:Assets–
Marketable securities . . . . . . . . . . . . ¥ 93,140 ¥ 185,410 ¥ 124,017 ¥ 228,173 $ 878,679 $ 1,749,151Other investments . . . . . . . . . . . . . . 139,534 174,869 128,020 155,828 1,316,358 1,649,708Long-term finance receivables, net . . 116,961 119,443 109,661 110,717 1,103,406 1,126,821
Liabilities–Long-term debt,including current portion . . . . . . . . (1,380,097) (1,400,086) (1,414,257) (1,449,072) (13,019,783) (13,208,358)
Derivative financial instruments:Forward exchange contracts . . . . . . 1,849 5,308 3,232 5,419 17,443 50,075Interest rate swap agreements . . . . . – (3,416) – (5,777) – (32,226)Currency swap agreements . . . . . . . 4,550 5,355 (3,122) (1,859) 42,925 50,519
The above table excludes the financial instruments for which fair values approximate their carrying values and those related toleasing activities.
In assessing the fair value of these financial instruments, the company has used a variety of methods and assumptions, which werebased on estimates of market conditions and risks existing at that time. For certain instruments, including cash and cash equivalents,notes and accounts receivable, trade, finance receivables, net, short-term borrowings, notes payable, trade, accounts payable, tradeand accounts payable, other and accrued expenses, it was assumed that the carrying amount approximated fair value for the majorityof these instruments because of their short maturities. Quoted market prices were used for marketable securities and a part of otherinvestments. Other techniques, such as estimated discounted value of future cash flows, and replacement cost, have been used todetermine fair value for the remaining financial instruments. These estimated fair values are not necessarily indicative of the amountsthat could be realized in a current market exchange.
Other investments includes investment securities which represent holdings in a number of non-public companies. The aggregatecarrying amount of these investments in non-public companies was ¥90,690 million ($855,566 thousand) and ¥73,549 million atMarch 31, 2000 and 1999, respectively. However, the corresponding fair value of these investments at those dates was not computedas such estimation was not practicable.
18. COMMITMENTS AND CONTINGENT LIABILITIES:Commitments outstanding at March 31, 2000 for the purchase of property, plant and equipment approximated ¥13,279 million($125,274 thousand).
Rental expense for the years ended March 31, 2000 and 1999 aggregated ¥79,299 million ($748,104 thousand) and ¥86,695million, respectively. Substantially all such rental expenses are related to cancellable leases for office space, warehouses, andemployees’ residential facilities. Such leases are customarily renewed.
At March 31, 2000, contingent liabilities, principally for loans guaranteed, approximated ¥483,017 million ($4,556,764 thousand).Management of the company believes that there are no legal actions pending against the company and its subsidiaries which could
result in damages against the company which would have a material effect on the company’s consolidated financial statements.
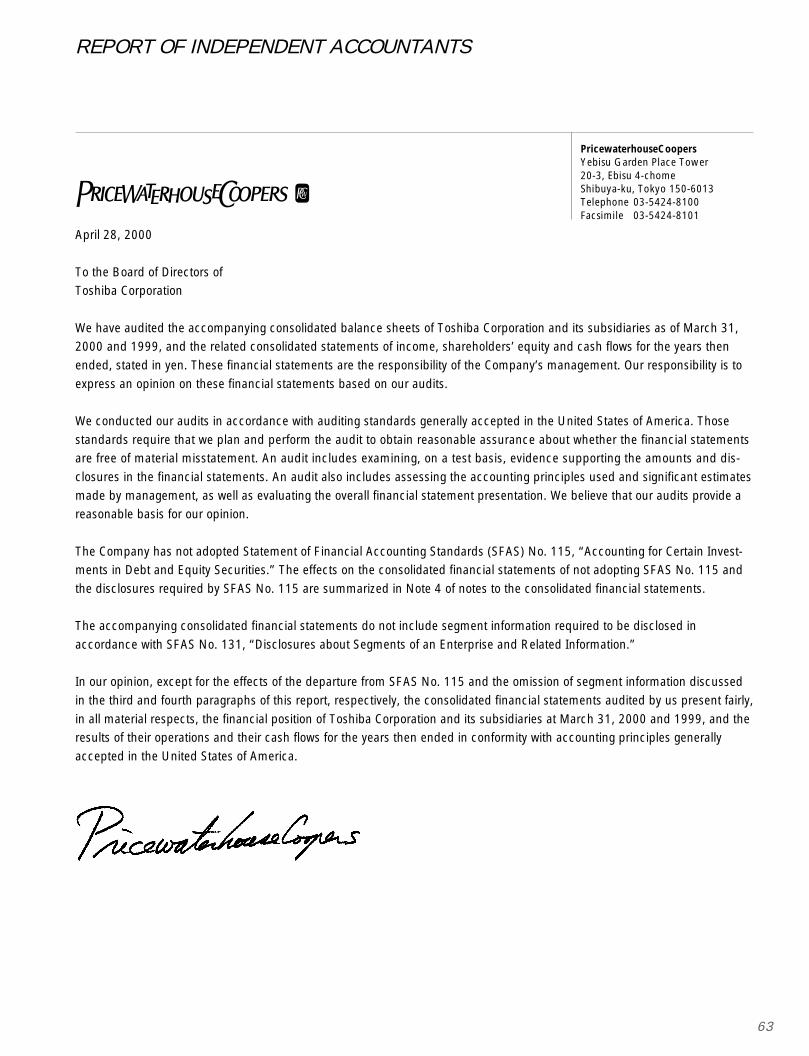
63
REPORT OF INDEPENDENT ACCOUNTANTS
April 28, 2000
To the Board of Directors of
Toshiba Corporation
We have audited the accompanying consolidated balance sheets of Toshiba Corporation and its subsidiaries as of March 31,
2000 and 1999, and the related consolidated statements of income, shareholders’ equity and cash flows for the years then
ended, stated in yen. These financial statements are the responsibility of the Company’s management. Our responsibility is to
express an opinion on these financial statements based on our audits.
We conducted our audits in accordance with auditing standards generally accepted in the United States of America. Those
standards require that we plan and perform the audit to obtain reasonable assurance about whether the financial statements
are free of material misstatement. An audit includes examining, on a test basis, evidence supporting the amounts and dis-
closures in the financial statements. An audit also includes assessing the accounting principles used and significant estimates
made by management, as well as evaluating the overall financial statement presentation. We believe that our audits provide a
reasonable basis for our opinion.
The Company has not adopted Statement of Financial Accounting Standards (SFAS) No. 115, “Accounting for Certain Invest-
ments in Debt and Equity Securities.” The effects on the consolidated financial statements of not adopting SFAS No. 115 and
the disclosures required by SFAS No. 115 are summarized in Note 4 of notes to the consolidated financial statements.
The accompanying consolidated financial statements do not include segment information required to be disclosed in
accordance with SFAS No. 131, “Disclosures about Segments of an Enterprise and Related Information.”
In our opinion, except for the effects of the departure from SFAS No. 115 and the omission of segment information discussed
in the third and fourth paragraphs of this report, respectively, the consolidated financial statements audited by us present fairly,
in all material respects, the financial position of Toshiba Corporation and its subsidiaries at March 31, 2000 and 1999, and the
results of their operations and their cash flows for the years then ended in conformity with accounting principles generally
accepted in the United States of America.
PricewaterhouseCoopersYebisu Garden Place Tower20-3, Ebisu 4-chomeShibuya-ku, Tokyo 150-6013Telephone 03-5424-8100Facsimile 03-5424-8101
64
GLOBAL NETWORK
OVERSEAS OFFICESLatin AmericaBuenos Aires
AsiaBeijingShanghaiManilaBangkokJakartaNew Delhi
Middle EastBaghdadAbu Dhabi
EuropeMoscow
AfricaJohannesburg
OVERSEAS SUBSIDIARIES AND AFFILIATESNorth AmericaToshiba of Canada, Ltd. Markham, Ontario, CanadaToshiba America, Inc. New York, New York, U.S.A.Toshiba America Capital Corporation New York, New York, U.S.A.Toshiba America Research, Inc. Morristown, New Jersey, U.S.A.Toshiba America Medical Systems, Inc. Tustin, California, U.S.A.Toshiba America MRI Inc. South San Francisco, California, U.S.A.Applied Super Conetics, Inc. San Diego, California, U.S.A.Toshiba America Information Systems, Inc. Irvine, California, U.S.A.Toshiba America Business Solutions, Inc. Irvine, California, U.S.A.Toshiba America Consumer Products, Inc. Wayne, New Jersey, U.S.A.Toshiba Hawaii, Inc. Honolulu, Hawaii, U.S.A.Toshiba International Corporation Houston, Texas, U.S.A.Toshiba America Electronic Components, Inc. Irvine, California, U.S.A.Toshiba Display Devices Inc. Horseheads, New York, U.S.A.Dominion Semiconductor, L.L.C. Manassas, Virginia, U.S.A.Semiconductor America, Inc. Irvine, California, U.S.A.Toshiba Venture Capital, Inc. Polo Alto, California, U.S.A.Toshiba America Venture Capital, Inc. Lyndhurst, New Jersey, U.S.A.Enceratec, Inc. Columbus, Indiana, U.S.A.
Latin AmericaToshiba de Mexico, S.A. de C.V. Mexico City, MexicoToshiba Electromex, S.A. de C.V. Ciudad Juárez, MexicoGE Toshiba Turbine Components de Mexico S.R.L de C.V Monterrey, MexicoToshiba de Venezuela C.A. Caracas, VenezuelaToshiba Medical do Brasil Ltda. São Paulo, BrazilSemp Toshiba Amazonas S.A. Manaus, BrazilT and S Servicos Industrias s/c Ltda. São Paulo, BrazilToshiba do Brasil, S.A. São Paulo, Brazil
EuropeToshiba of Europe Ltd. London, U.K.Toshiba International Finance (UK) Plc. London, U.K.Toshiba Research Europe Ltd. Cambridge, U.K.Toshiba Medical Systems Ltd. Crawley, U.K.Toshiba Information Systems (UK) Ltd. Weybridge, U.K.Toshiba (UK) Ltd. Camberley, U.K.TTI Card Technology Europe Ltd. Northamptonshire, U.K.Toshiba International (Europe) Ltd. Uxbridge, U.K.Toshiba Electronics (UK) Ltd. Camberley, U.K.Toshiba Electronics Scandinavia AB Bromma, SwedenToshiba International Finance (Netherlands) B.V. Haarlem, The NetherlandsToshiba Medical Systems Europe B.V. Zoetermeer, The NetherlandsToshiba Medical Systems NV/SA Antwerpen, BelgiumToshiba Medical Systems GmbH Neuss, GermanyToshiba Europe GmbH Neuss, GermanyToshiba Semiconductor GmbH Braunschweig, GermanyToshiba Electronics Europe GmbH Düsseldorf, GermanyToshiba Medical France S.A. Boulogne, France
65
Toshiba Systèmes (France) S.A. Puteaux, FranceToshiba Electronics France S.A.R.L. Rosny-Sous-Bois, FranceToshiba Medical Systems Gesellschaft m.b.H. Wiener Neudorf, AustriaToshiba Medical Systems AG Oetwil am See, SwitzerlandToshiba Medical Systems S.R.L. Rome, ItalyToshiba Electronics Italiana S.R.L. Milan, ItalyToshiba Medical Systems S.A. Madrid, SpainToshiba Electronics España S.A. Madrid, SpainZAO Toshiba Medical Systems Moscow, Russian Federation
Middle EastToshiba Gulf FZE Dubai, UAE
AsiaToshiba (China) Co., Ltd. Beijing, The People’s Republic of ChinaToshiba Technology Development (Shanghai) Co., Ltd. Shanghai, The People’s Republic of ChinaToshiba Dalian Co., Ltd. Dalian, The People’s Republic of ChinaHangzhi Machinery & Electronics Co., Ltd. Hangzhou, The People’s Republic of ChinaJiangsu Honshiba Tontru Network System Equipment Co., Ltd. Nanjing, The People’s Republic of ChinaShenyang NETS System Integration Co., Ltd. Shenyang, The People’s Republic of ChinaDalian Toshiba Television Co., Ltd. Dalian, The People’s Republic of ChinaShanghai Jinzhi Electronics Co., Ltd. Shanghai, The People’s Republic of ChinaToshiba Computer System (Shanghai) Co., Ltd. Shanghai, The People’s Republic of ChinaChangzhou Toshiba Transformer Co., Ltd. Changzhou, The People’s Republic of ChinaShenyang Toshiba Elevator Co., Ltd. Shenyang, The People’s Republic of ChinaShanghai GFC Toshiba Elevator Co., Ltd. Shanghai, The People’s Republic of ChinaWuxi Huazhi Semiconductor Co., Ltd. Wuxi, The People’s Republic of ChinaJiangxi Toshiba Electronic Materials Co., Ltd. Ganzhou, The People’s Republic of ChinaTsurong Xiamen Xiangyu Trading Co., Ltd. Xiamen, The People’s Republic of ChinaToshiba Hong Kong Ltd. Kowloon, Hong KongToshiba Electronics Asia, Ltd. Kowloon, Hong KongKorea Electronic Material Co., Ltd. Inchon, The Republic of KoreaHanji Electronic Engineering Co., Ltd. Seoul, The Republic of KoreaToshiba Electronics Korea Corporation Seoul, The Republic of KoreaTaiwan Toshiba International Semiconductor Designing Corporation Taipei, TaiwanToshiba Memory Semiconductor Taiwan Corp. Taipei, TaiwanToshiba Electronics Taiwan Corporation Taipei, TaiwanToshiba Information Equipment (Philippines), Inc. Laguna, PhilippinesToshiba Electronics Philippines, Inc. Manila, PhilippinesToshiba Vietnam Consumer Products Co., Ltd. Ho Chi Minh City, VietnamToshiba Thailand Co., Ltd. Bangkok, ThailandThai Toshiba Electric Industries Co., Ltd. Bangkok, ThailandToshiba Consumer Products (Thailand) Co., Ltd. Pathumthani, ThailandToshiba Display Devices (Thailand) Co., Ltd. Pathumthani, ThailandToshiba Semiconductor (Thailand) Co., Ltd. Pathumthani, ThailandToshiba Sales and Services Sdn. Bhd. Selangor, MalaysiaToshiba Electronics Malaysia Sdn. Bhd. Selangor, MalaysiaToshiba Electronics Trading (Malaysia) Sdn. Bhd. Selangor, MalaysiaWah Seong Engineering Sdn. Bhd. Penang, MalaysiaWS Elevators Sdn. Bhd. Penang, MalaysiaToshiba Capital (Asia) Ltd. SingaporeToshiba Asia Pacific Pte., Ltd. SingaporeToshiba Medical Systems Asia Pte., Ltd. SingaporeToshiba Data Dynamics Pte., Ltd. SingaporeToshiba Video Products Pte., Ltd. SingaporeToshiba Singapore Pte., Ltd. SingaporeToshiba Electronics Asia (Singapore) Pte., Ltd. SingaporeP.T. Toshiba Consumer Products (Indonesia) Jawa Barat, IndonesiaP.T. Toshiba Display Devices Indonesia Jawa Barat, IndonesiaP.T. Schneider Manufacturing Batam Batam, Indonesia
OceaniaToshiba (Australia) Pty., Ltd. Sydney, AustraliaToshiba International Corporation Pty., Ltd. Sydney, Australia
(As of March 31, 2000)
66
(As of March 31, 2000)
CONSOLIDATED SUBSIDIARIES
CONSOLIDATED DOMESTIC SUBSIDIARIESA&T Battery CorporationFukuoka Toshiba Electronics CorporationIwate Toshiba Electronics Co., Ltd.Kaga Toshiba Electronics CorporationKitashiba Electric Co., Ltd.Kitsuki Toshiba Electronics CorporationKyodo Building CorporationShibaura Mechatronics CorporationShibaura NIDEC CorporationTerm CorporationToshiba Air Conditioning Co., Ltd.Toshiba Battery Co., Ltd.Toshiba Building & Lease Co., Ltd.Toshiba Capital CorporationToshiba Carrier Air Conditioning Systems CorporationToshiba Carrier CorporationToshiba Chemical CorporationToshiba Credit CorporationToshiba Device CorporationToshiba Digital Frontiers Inc.Toshiba Electric Appliances Co., Ltd.Toshiba Elevator CorporationToshiba Elevator Products CorporationToshiba Engineering CorporationToshiba Finance CorporationToshiba GE Turbine Components Co., Ltd.Toshiba Hokuto Electronics CorporationToshiba Home Technology CorporationToshiba Information Equipments Co., Ltd.Toshiba Information Systems (Japan) CorporationToshiba Kansai Lifestyle-Electronics CorporationToshiba Lighting & Technology CorporationToshiba Logistics CorporationToshiba Medical Finance Co., Ltd.Toshiba Medical Systems Co., Ltd.Toshiba Microelectronics CorporationToshiba Multi Media Devices Co., Ltd.Toshiba Plant Kensetsu Co., Ltd.Toshiba Shutoken Lifestyle-Electronics CorporationToshiba TEC CorporationToshiba Video Products Japan Co., Ltd.Toyo Carrier Engineering Co., Ltd.Yokkaichi Toshiba Electronics Corporation
Plus 174 other domestic subsidiaries
CONSOLIDATED OVERSEAS SUBSIDIARIESChangzhou Toshiba Transformer Co., Ltd.Dalian Toshiba Television Co., Ltd.Hangzhi Machinery & Electronics Co., Ltd.P.T. Toshiba Consumer Products (Indonesia)P.T. Toshiba Display Devices IndonesiaPacific Fuel Cell Capital (U.S.A.), Inc.Semiconductor America, Inc.Shenyang Toshiba Elevator Co., Ltd.TEC (UK) Ltd.TEC America, Inc.TEC France International S.A.TEC Singapore Electronics Pte. Ltd.TIM Electronics Sdn. Bhd.Toshiba (Australia) Pty., Ltd.Toshiba (China) Co., Ltd.Toshiba (UK) Ltd.Toshiba America Business Solutions, Inc.Toshiba America Capital CorporationToshiba America Consumer Products, Inc.Toshiba America Electronic Components, Inc.Toshiba America Information Systems, Inc.Toshiba America Medical Systems, Inc.Toshiba America MRI Inc.Toshiba America Venture Capital, Inc.Toshiba America, Inc.Toshiba Capital (Asia) Ltd.Toshiba Chemical Singapore Pte., Ltd.Toshiba Compressor (Taiwan) CorporationToshiba Consumer Products (Thailand) Co., Ltd.Toshiba Dalian Co., Ltd.Toshiba Display Devices (Thailand) Co., Ltd.Toshiba Display Devices Inc.Toshiba do Brasil, S.A.Toshiba Electronics (UK) Ltd.Toshiba Electronics Asia, Ltd.Toshiba Electronics Europe GmbHToshiba Electronics Malaysia Sdn. Bhd.Toshiba Electronics Taiwan CorporationToshiba Europe GmbHToshiba Information Equipment (Philippines), Inc.Toshiba Information Systems (UK) Ltd.Toshiba International CorporationToshiba International Finance (Netherlands) B.V.Toshiba International Finance (UK) Plc.Toshiba Medical Systems Asia Pte., Ltd.Toshiba Medical Systems Europe B.V.Toshiba Satellite Broadband, Inc.Toshiba Semiconductor (Thailand) Co., Ltd.Toshiba Semiconductor GmbHToshiba Systèmes (France) S.A.Toshiba TEC Europe Imaging Systems S.A.Toshiba Venture Capital, Inc.Toshiba Video Products Pte., Ltd.Wuxi Huazhi Semiconductor Co., Ltd.Wuxi Tochemi Electro Chemical Co., Ltd.
Plus 49 other overseas subsidiaries
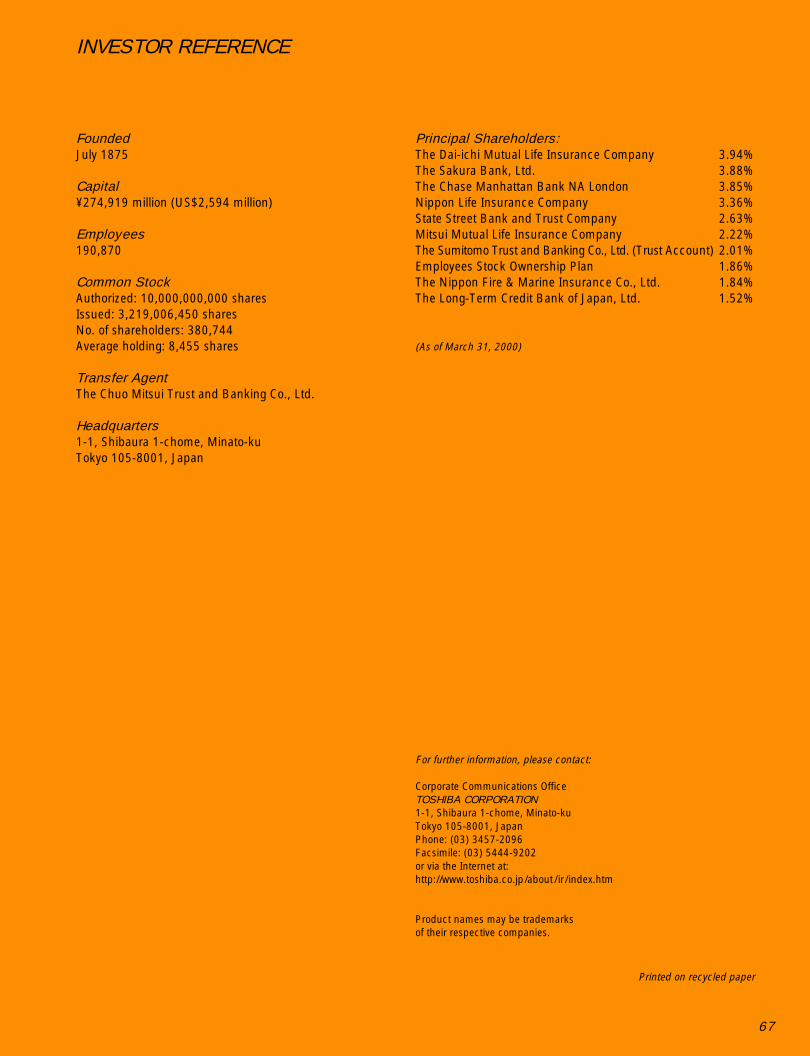
CONTENTS
FINANCIAL HIGHLIGHTS 1TO OUR SHAREHOLDERS 2IT— A DRIVER OF GROWTH
Inter-Company Value Chain 8Electronic Components 10Media Cards 1 1Portable PCs 12Cellular Phones 13System Solution Services 14Digital Broadcasting Equipment 15B2B Internet Services 16B2C Internet Services 17
REVIEW OF OPERATIONSInformation & Communicationsand Industrial Systems 18
Digital Media 2 1Power Systems 24Electronic Devices & Components 26Home Appliances 29Others 30
RESEARCH AND DEVELOPMENT 3 1TOSHIBA AND THE ENVIRONMENT 34BOARD OF DIRECTORS, EXECUTIVE OFFICERSAND CORPORATE AUDITORS 36
MANAGEMENT’S DISCUSSION & ANALYSIS 37CONSOLIDATED FINANCIAL STATEMENTS 44GLOBAL NETWORK 64CONSOLIDATED SUBSIDIARIES 66INVESTOR REFERENCE 67
BASIC COMMITMENTOF THE TOSHIBA GROUPWe, the Toshiba Group companies, based on our total commitment topeople and to the future, are determined to help create a higher qualityof life for all people, and to do our part to help ensure that progresscontinues within the world community.
COMMITMENT TO PEOPLEWe endeavor to serve the needs of all people, especially our customers,shareholders, and employees, by implementing forward-lookingcorporate strategies while carrying out responsible and responsivebusiness activities. As good corporate citizens, we actively contribute tofurther the goals of society.
COMMITMENT TO THE FUTUREBy continually developing innovative technologies centering onthe fields of Electronics and Energy, we strive to create productsand services that enhance human life, and which lead to a thriving,healthy society. We constantly seek new approaches that help realize thegoals of the world community, including ways to improve the globalenvironment.
Committed to People,Committed to the Future.
FORWARD-LOOKING STATEMENTSThis annual report contains forward-looking statements concerning Toshiba’s future plans, strategiesand performance. These forward-looking statements are not historical facts, rather they representassumptions and beliefs based on economic, financial and competitive data currently available. Fur-thermore, they are subject to a number of risks and uncertainties that, without limitation, relate toeconomic conditions, worldwide mega-competition in the electronics business, customer demand,foreign currency exchange rates, tax rules, regulations and other factors. Toshiba therefore wishes tocaution readers that actual results may differ materially from our expectations.
INVESTOR REFERENCE
FoundedJuly 1875
Capital¥274,919 million (US$2,594 million)
Employees190,870
Common StockAuthorized: 10,000,000,000 sharesIssued: 3,219,006,450 sharesNo. of shareholders: 380,744Average holding: 8,455 shares
Transfer AgentThe Chuo Mitsui Trust and Banking Co., Ltd.
Headquarters1-1, Shibaura 1-chome, Minato-kuTokyo 105-8001, Japan
Principal Shareholders:The Dai-ichi Mutual Life Insurance Company 3.94%The Sakura Bank, Ltd. 3.88%The Chase Manhattan Bank NA London 3.85%Nippon Life Insurance Company 3.36%State Street Bank and Trust Company 2.63%Mitsui Mutual Life Insurance Company 2.22%The Sumitomo Trust and Banking Co., Ltd. (Trust Account) 2.01%Employees Stock Ownership Plan 1.86%The Nippon Fire & Marine Insurance Co., Ltd. 1.84%The Long-Term Credit Bank of Japan, Ltd. 1.52%
(As of March 31, 2000)
For further information, please contact:
Corporate Communications OfficeTOSHIBA CORPORATION1-1, Shibaura 1-chome, Minato-kuTokyo 105-8001, JapanPhone: (03) 3457-2096Facsimile: (03) 5444-9202or via the Internet at:http://www.toshiba.co.jp/about /ir/index.htm
Product names may be trademarksof their respective companies.
Printed on recycled paper
67

A new Toshiba takes shape >>ANNUAL REPORT >> Year ended March 31, 2000
Printed in Japan
AN
NU
AL R
EPO
RT 2
00
0


