Embed Size (px)
Citation preview
AN INFORMATION
ADVANTAGE 2010A
NN
UA
L R
EP
OR
T

at-a-glanceAS OF 12/31/10
IRON MOUNTAIN
YEAR FOUNDED
1951CORPORATE CLIENTS
>150,000EMPLOYEES
>19,000FACILITIES WORLDWIDE
>1,000FORTUNE 1000 RANK
644MEMBER S&P 500 INDEX
Visit www.ironmountain.com for more information.
REVENUESin billions
$3.13
ADJUSTED OIBDA1
in millions
$945
NET LOSS2
per share
$0.27
ADJUSTED EPS1
diluted
$1.15
FCF 1
in millions
$373(1) These are non-GAAP measures. Please refer to p. 34 of the accompanying Annual Report on Form 10-K for additional information including the reconciliations of
these non-GAAP measures to their nearest GAAP measure.
(2) Attributable to Iron Mountain Incorporated.
2010 FINANCIAL RESULTS
ABOUT THE COMPANYIron Mountain Incorporated (NYSE: IRM) provides information management services that help organizations lower the costs, risks and inefficiencies of managing their physical and digital data. The company’s solutions enable customers to protect and better use their information — regardless of its format, location or lifecycle stage — so they can optimize their business and ensure proper recovery, compliance and discovery. Founded in 1951, Iron Mountain manages billions of information assets, including business records, electronic files, medical data, emails and more for organizations around the world.
12010 ANNUAL REPORT
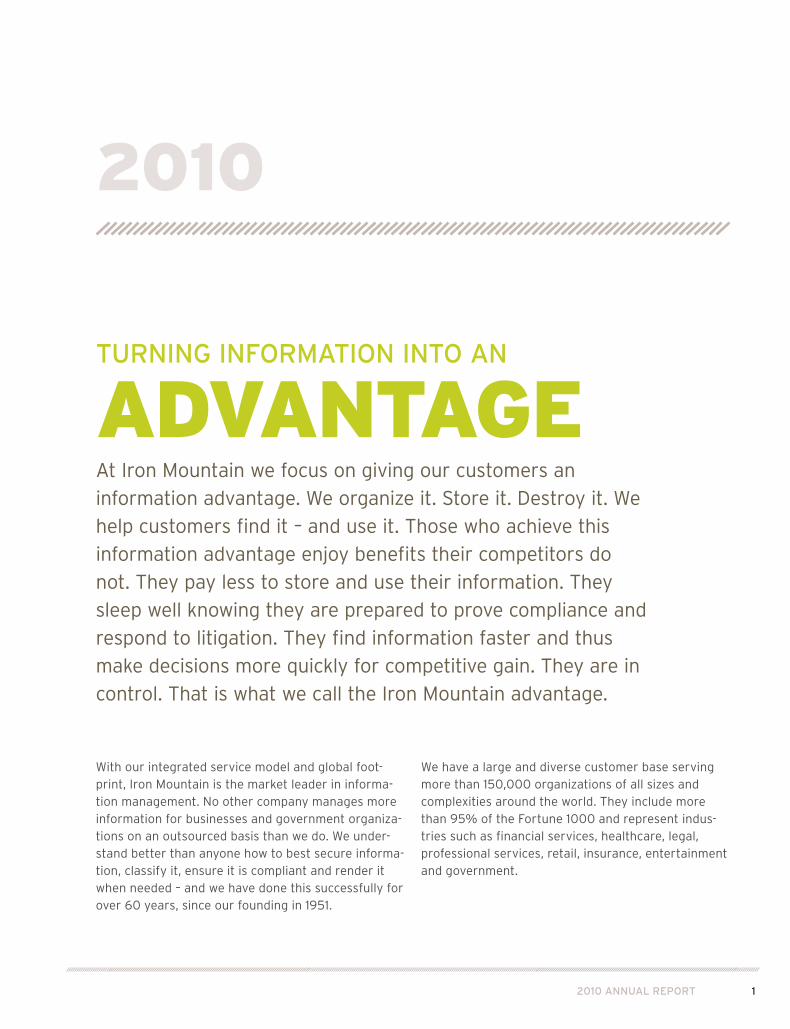
TURNING INFORMATION INTO AN
ADVANTAGEAt Iron Mountain we focus on giving our customers an
information advantage. We organize it. Store it. Destroy it. We
help customers find it – and use it. Those who achieve this
information advantage enjoy benefits their competitors do
not. They pay less to store and use their information. They
sleep well knowing they are prepared to prove compliance and
respond to litigation. They find information faster and thus
make decisions more quickly for competitive gain. They are in
control. That is what we call the Iron Mountain advantage.
With our integrated service model and global foot-print, Iron Mountain is the market leader in informa-tion management. No other company manages more information for businesses and government organiza-tions on an outsourced basis than we do. We under-stand better than anyone how to best secure informa-tion, classify it, ensure it is compliant and render it when needed – and we have done this successfully for over 60 years, since our founding in 1951.
We have a large and diverse customer base serving more than 150,000 organizations of all sizes and complexities around the world. They include more than 95% of the Fortune 1000 and represent indus-tries such as financial services, healthcare, legal, professional services, retail, insurance, entertainment and government.
2010
2 IRON MOUNTAIN
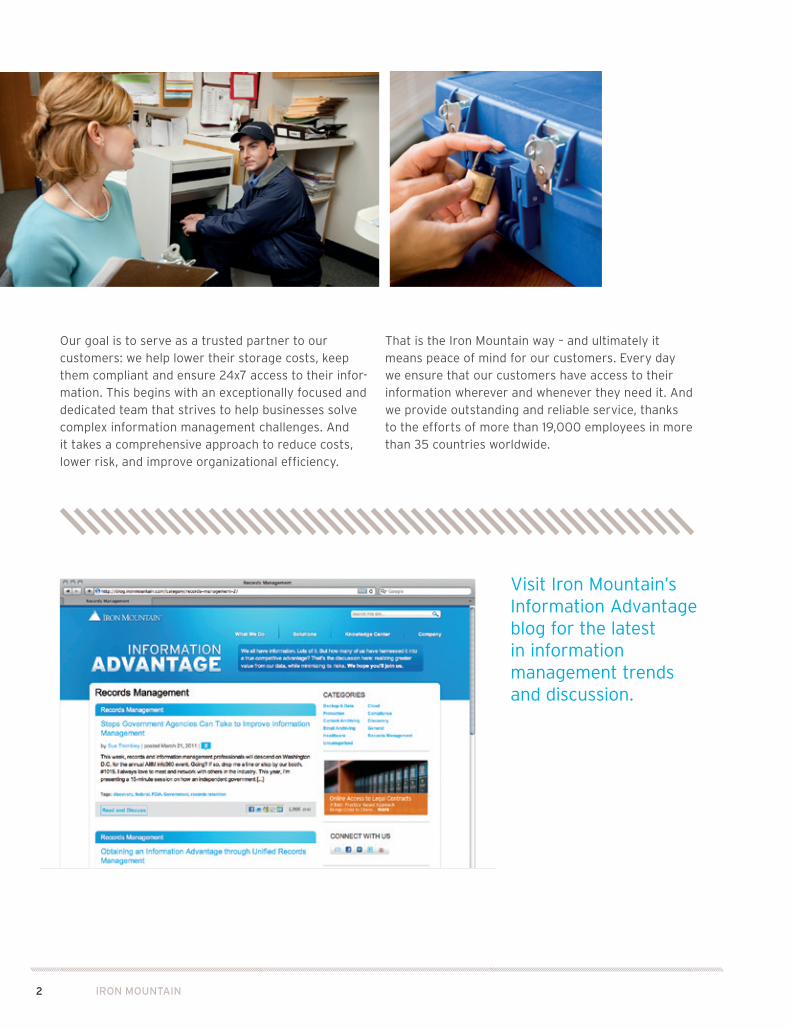
Our goal is to serve as a trusted partner to our customers: we help lower their storage costs, keep them compliant and ensure 24x7 access to their infor-mation. This begins with an exceptionally focused and dedicated team that strives to help businesses solve complex information management challenges. And it takes a comprehensive approach to reduce costs, lower risk, and improve organizational efficiency.
That is the Iron Mountain way – and ultimately it means peace of mind for our customers. Every day we ensure that our customers have access to their information wherever and whenever they need it. And we provide outstanding and reliable service, thanks to the efforts of more than 19,000 employees in more than 35 countries worldwide.
Visit Iron Mountain’s Information Advantage blog for the latest in information management trends and discussion.
32010 ANNUAL REPORT
STRONG FINANCIAL PERFORMANCE BUILT ON A POWERFUL BUSINESS FOUNDATION
We delivered another year of strong financial perfor-mance in 2010. Revenues increased 4%, Adjusted OIBDA increased 9% and Adjusted EPS increased 17%. Free Cash Flow (FCF) increased 11% to a record $373 million. These results reflect the power of our
business foundation.
At Iron Mountain, we’ve established a sustain-able leadership posi-tion in an attractive business. Our business model is centered on helping customers effectively manage and safeguard their information. With our integrated product
offerings and operations in more than 35 countries, spanning five continents, Iron Mountain is a proven global market leader in information management services. We have strong relationships within a large and diverse customer base: our revenues are derived from more than 150,000 customers including more than 95% of the Fortune 1000. We have developed a superior chain of custody utilizing our expertise, footprint and range of service capability that is unmatched in our industry.
This business platform provides a sustainable source of advantage which supports strong annuity-based revenues and cash flows. Our core physical services — the storage and management of paper records, offsite storage and management of backup data and secure document shredding — comprise 89% of our total revenues and are all built on a strong foundation of recurring storage and related service revenues.
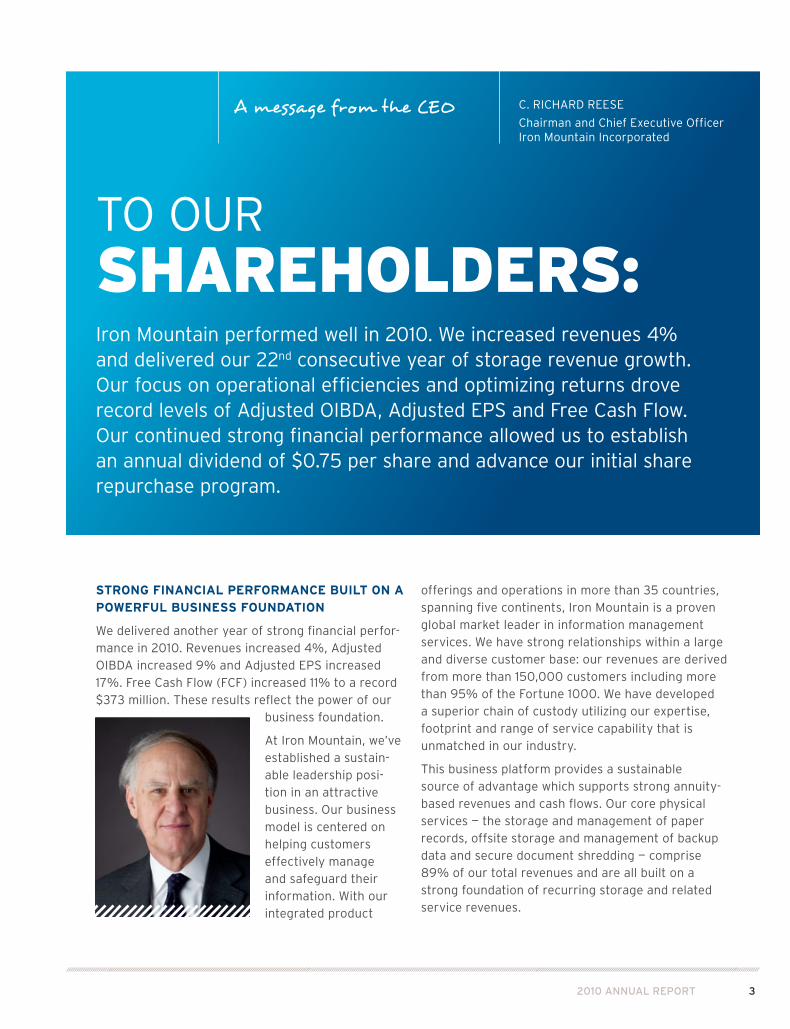
C. RICHARD REESE
Chairman and Chief Executive Officer Iron Mountain Incorporated
A message from the CEO
TO OUR SHAREHOLDERS:Iron Mountain performed well in 2010. We increased revenues 4% and delivered our 22nd consecutive year of storage revenue growth. Our focus on operational efficiencies and optimizing returns drove record levels of Adjusted OIBDA, Adjusted EPS and Free Cash Flow. Our continued strong financial performance allowed us to establish an annual dividend of $0.75 per share and advance our initial share repurchase program.

4 IRON MOUNTAIN
DRIVING RETURN ON INVESTMENT
We are focused on capitalizing on our business platform to drive return on investment. Steadily improving Return on Invested Capital, or ROIC, reflects benefits from our efficient capital spending, our emphasis on operational excellence and expan-sion of our high return core physical business.
Operational excellence is key to everything we do at Iron Mountain. We’ve achieved operational excellence in our North America Physical Business segment through specific initiatives around optimized pricing, transportation, workflows and procurement. These programs increased North American margins by more than 800 basis points since 2007. Our focus on capital management across our business drove capital expenditures (excluding real estate) as a percent of revenues from 9.4% in 2009 to 8.1% in 2010, a 130 basis point improvement. Since 2006 we have reduced capital spending as a percent of revenues by 40% while supporting continued expan-
sion of our core physical business. Looking forward, we will continue to drive productivity improvements that support long-term margin gains and continued capital efficiencies. We anticipate that the majority of our margin growth over the next few years will come from our international business as we apply the same techniques and programs that increased North American profits and cash flows.
We are expanding our core physical business glob-ally to drive return on investment. North American revenues increased 3% in 2010, supported by storage gains and strong growth in hybrid services. We are pursuing targeted investments to protect and expand this high return franchise. We have signifi-cant unvended market opportunities for our core physical services and we are strengthening our sales, marketing and product management capability to support new customer acquisition and segmented service line development. International revenues increased 6% in 2010, driven by continued solid
performance
Steadily improving ROIC reflects benefits from our efficient capital spending, our emphasis on operational excellence and expansion of our high return core physical business.

52010 ANNUAL REPORT
momentum in expansion of high margin storage revenues which set the foundation for the recur-ring annuity stream. We have a clear line of sight to attractive incremental returns in our International business as we build local scale and rollout proven operational excellence initiatives.
Our focus on operational excellence and core busi-ness expansion has yielded impressive financial results. Since 2006 the Company has increased Adjusted OIBDA, Adjusted EPS and FCF at compounded annual growth rates of 12%, 18% and 68%, respectively, well ahead of revenue gains.
These gains would have been even stronger had we achieved our goals in developing our digital busi-ness lines. Digital revenue growth was limited to 1% in 2010. We experienced a rapid change in our eDiscovery business, which declined 10% and pres-sured profits. We have changed leadership in this business to improve management execution and have advanced integration and cost rationalization efforts.
RETURNING CAPITAL TO SHAREHOLDERS
Our primary investment focus is on growing our business organically and continuing to optimize the highly attractive business we have built. This emphasis has enabled us to expand cash flows, strengthen our balance sheet and confidently advance shareholder payouts.
In February 2010 we declared our first ever divi-dend. In December 2010 we increased the dividend by 200%, reflecting our confidence in our ability to grow our business profitably while delivering strong, sustainable returns for our investors. This dividend, which represents a payout of more than 60% of annual adjusted net income, provides a solid founda-tion for our shareholder payout approach. We expect to increase the dividend as we continue to expand our earnings and Free Cash Flow.
We also intend to execute share repurchases at prices that create value for our shareholders. In 2010 we announced the authorization of up to
confidence
Our expanding cash flows, combined with our strong balance sheet, enabled us to confidently advance our initial shareholder payout program.

6 IRON MOUNTAIN
$350 million for the repurchase of our shares. For the year, we repurchased 4.8 million shares, or approximately 2% of the total shares outstanding. Benefits from share repurchases and lower interest costs supported a 17% increase in Adjusted EPS in 2010. Share repurchases, along with tax strategies and debt cost optimization, will help us to continue driving solid Adjusted EPS and FCF growth.
We are committed to increasing per share value for our shareholders. Ultimately, value creation comes down to how well we manage the business and how well we invest your capital. We take this responsi-bility very seriously, and are managing the business to grow Free Cash Flow and increase returns on invested capital. We expect that our ability to grow revenues and Free Cash Flow will translate directly to increased shareholder returns.
Iron Mountain is a company with a strong, sustain-able competitive position. We provide services that are vitally important to our customers and we earn their trust every day through consistency and outstanding service. I would like to thank our more than 19,000 dedicated employees, our loyal customers, and you, our shareholders, for your continued support.
Yours truly,
C. Richard Reese

72010 ANNUAL REPORT
helping our own
Together, The Iron Mountain Foundation and employees work in harmony to do the right thing for each other and our customers.
The Iron Mountain Foundation was established to support Iron Mountain’s charitable activi-ties. The goal in setting up the Foundation was to establish a formal mechanism through which Iron Mountain and its employees, working together, can support great causes. The Foundation currently focuses on two programs: The Iron Mountain Education Fund and The Mountaineer Employee Relief Fund. The Iron Mountain Education Fund provides college tuition assistance for children of our employees. The Mountaineer Employee Relief Fund offers short-term assistance to employees unable to cover basic needs due to disaster or sudden hardship.
Iron Mountain has a strong commitment to our employees and believes that they are the true measurement of our success. Initially formed in 2005 to aid employees impacted by Hurricane Katrina, the Employee Relief Fund has helped more than 100 Mountaineers affected by natural disasters, including a tornado in Illinois, a wildfire in California and Hurricanes Gustav and Ike. In 2010 the Fund aided over 30 employees in Chile after one of the biggest earthquakes in history devastated the area on February 27, 2010. More recently, employees in New Zealand impacted by that region’s earthquake received assistance.
While the Iron Mountain Foundation provided support to
our employees recovering from the devastating earthquake in Chile, the Iron Mountain Chile team responded immediately to recover customer assets, repair damage to facilities and restore service to customers. These employees acted fast, taking on new, unfamiliar roles and addressed many challenges with a true sense of urgency. Within the first week, the team restored service to customers and continued for months to recover millions of boxes and restore operations. The work that this team accomplished is not only outstanding, but is also a testa-ment to the character and loyalty of our Mountaineers.
8 IRON MOUNTAIN
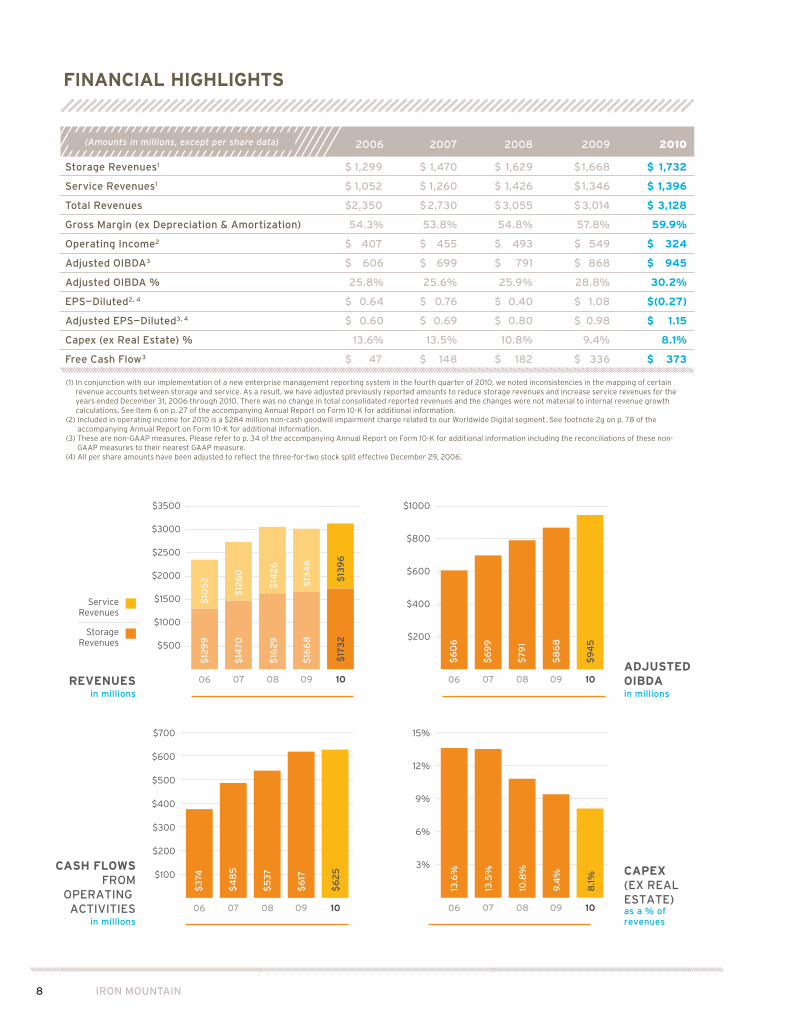
2006 2007 2008 2009 2010
Storage Revenues1 $ 1,299 $ 1,470 $ 1,629 $ 1,668 $ 1,732
Service Revenues1 $ 1,052 $ 1,260 $ 1,426 $ 1,346 $ 1,396
Total Revenues $ 2,350 $ 2,730 $ 3,055 $ 3,014 $ 3,128
Gross Margin (ex Depreciation & Amortization) 54.3% 53.8% 54.8% 57.8% 59.9%
Operating Income2 $ 407 $ 455 $ 493 $ 549 $ 324
Adjusted OIBDA3 $ 606 $ 699 $ 791 $ 868 $ 945
Adjusted OIBDA % 25.8% 25.6% 25.9% 28.8% 30.2%
EPS—Diluted2, 4 $ 0.64 $ 0.76 $ 0.40 $ 1.08 $ (0.27)
Adjusted EPS—Diluted3, 4 $ 0.60 $ 0.69 $ 0.80 $ 0.98 $ 1.15
Capex (ex Real Estate) % 13.6% 13.5% 10.8% 9.4% 8.1%
Free Cash Flow3 $ 47 $ 148 $ 182 $ 336 $ 373
(1) In conjunction with our implementation of a new enterprise management reporting system in the fourth quarter of 2010, we noted inconsistencies in the mapping of certain revenue accounts between storage and service. As a result, we have adjusted previously reported amounts to reduce storage revenues and increase service revenues for the years ended December 31, 2006 through 2010. There was no change in total consolidated reported revenues and the changes were not material to internal revenue growth calculations. See Item 6 on p. 27 of the accompanying Annual Report on Form 10-K for additional information.
(2) Included in operating income for 2010 is a $284 million non-cash goodwill impairment charge related to our Worldwide Digital segment. See footnote 2g on p. 78 of the accompanying Annual Report on Form 10-K for additional information.
(3) These are non-GAAP measures. Please refer to p. 34 of the accompanying Annual Report on Form 10-K for additional information including the reconciliations of these non-GAAP measures to their nearest GAAP measure.
(4) All per share amounts have been adjusted to reflect the three-for-two stock split effective December 29, 2006.
(Amounts in millions, except per share data)
FINANCIAL HIGHLIGHTS
CASH FLOWSFROM
OPERATING ACTIVITIES
in millions
$700
$600
$500
$400
$300
$200
$100
06 07 08 09 10
ADJUSTED OIBDAin millions
$1000
$800
$600
$400
$200
06 07 08 09 10
CAPEX(EX REAL ESTATE)as a % of revenues
15%
12%
9%
6%
3%
06 07 08 09 10
ServiceRevenues
StorageRevenues
REVENUESin millions
$3500
$3000
$2500
$2000
$1500
$1000
$500
06
$12
99
$6
06
$7
91
$8
68
$9
45
$6
99
$3
74
$5
37
$6
17
$6
25
$4
85
13.6
%
10.8
%
9.4
%
8.1%
13.5
%
$10
52
$14
70$
126
0
$16
29
$14
26
$16
68
$13
46
$17
32
$13
96
07 08 09 10

92010 ANNUAL REPORT
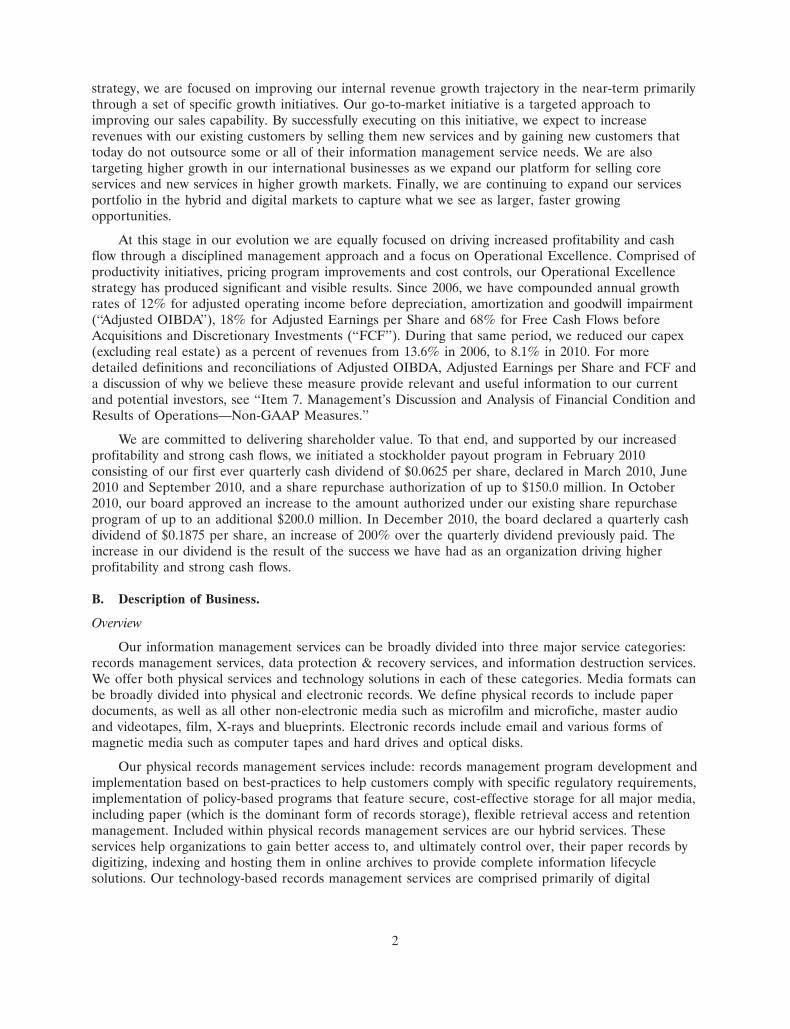
OPERATIONS REVIEW2010 was a year of strong financial performance for Iron Mountain. We achieved record levels of Adjusted OIBDA, Adjusted EPS and Free Cash Flow driven by our 22nd year of increased storage revenues. Further, we implemented our first-ever shareholder payout program to return to our shareholders cash in excess of that needed by our business.
2010
Over the past four years, while expanding our busi-ness, we have driven consistently strong financial results. Compounded annual growth rates of Adjusted OIBDA (12%) and Adjusted EPS (18%) have come in well ahead of revenue growth (7%). During this period, our strong operating performance combined with a 40% improvement in capital efficiency resulted in Free Cash Flow as a percent of revenue increasing to 12% in 2010 from 2% in 2006.
2010 FINANCIAL HIGHLIGHTS
Total revenue increased 4% to $3,128 million in 2010. Internal growth for the year was 2% with an additional 2% of growth coming from acquisitions completed in 2010 and favorable foreign exchange. Storage revenues increased for the 22nd consecutive year to $1,732 million. Service revenues, which build on our storage foundation, expanded 4% to $1,396 million. Adjusted EPS increased 17% in 2010 to $1.15
10 IRON MOUNTAIN
per share from $0.98 per share in 2009 supported by strong operating performance, lower interest expense and fewer shares outstanding.
Gross profits increased 8% to $1,873 million supported by benefits from productivity initiatives, improved gross margins in our international opera-tions and higher recycled paper prices. These gains combined with controlled overhead spending resulted in $945 million of Adjusted OIBDA for 2010, a 9% increase over the prior year. Reported net loss for the year was $54 million, or $0.27 per diluted share, including a $1.40 per share goodwill impairment charge related to the digital business as discussed more fully on page 17 of this report.
We improved our capital efficiency and increased our cash flow in 2010. As a percentage of revenues, capital spending (excluding real estate) decreased 130 basis points to 8.1%. This was a record low for the company and supported the generation of $373 million in FCF.
We ended the year with a strong balance sheet. Our consolidated leverage ratio was 2.9 times EBITDA (as defined in our credit facility) at year end, at the low
end of our three to four times target range and well below the covenant limitation of 5.5 times included in our credit facility. At December 31, 2010 we had more than $1.0 billion of cash and availability under our revolving credit facility. In a series of two trans-
actions beginning in September 2010 and ending in January 2011, we redeemed $431 million of 7-3/4% notes due 2015. We used excess cash and borrowings under our revolving credit facility to redeem these notes. Combined, these transactions reduce interest expense by approximately $30 million on an annual basis. As of year-end, we had an average maturity
$150
$120
$90
$600605 07 08 09 10
Raw Data
Iron Mountain S&P 500 Russell 1000
60
90
120
150
$100
$50
$150
$200
$250
060504 07 08 09
Iron Mountain S&P 500 Russell 1000
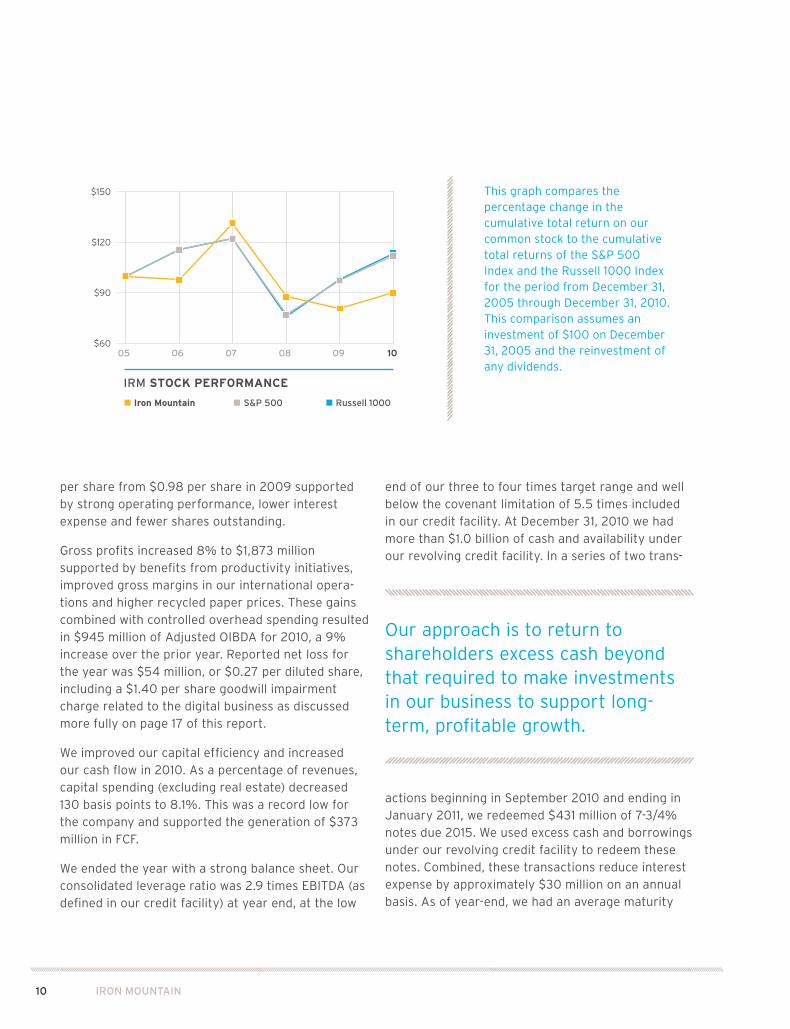
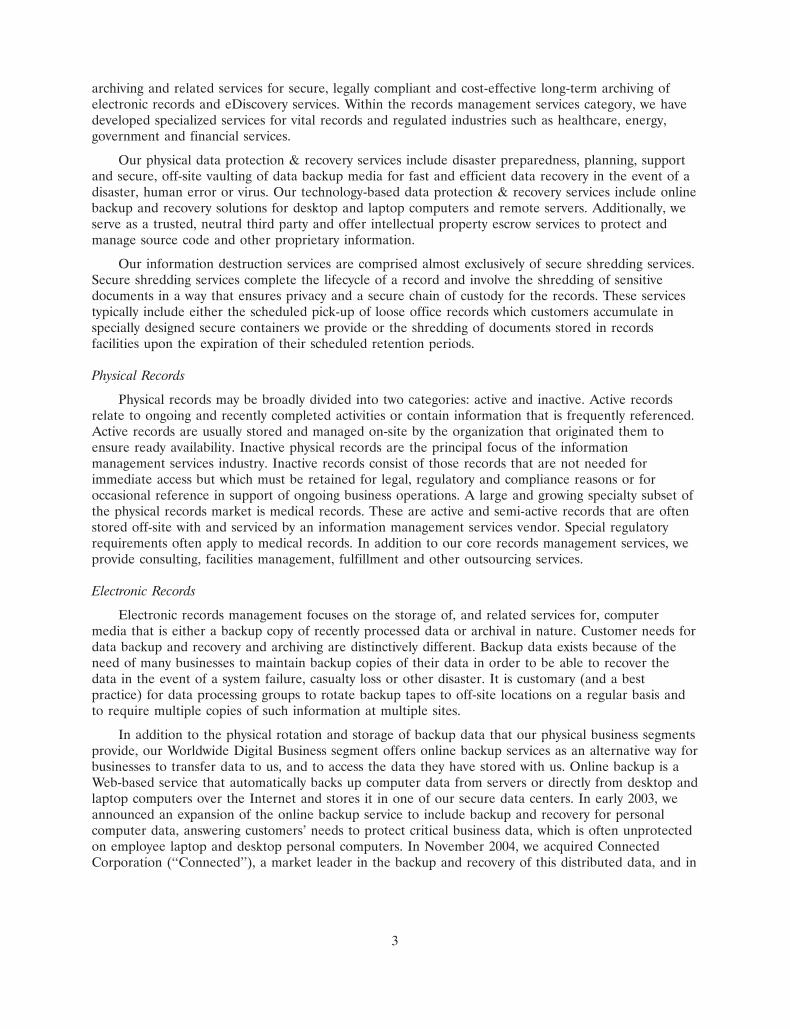
IRM STOCK PERFORMANCE
This graph compares the percentage change in the cumulative total return on our common stock to the cumulative total returns of the S&P 500 Index and the Russell 1000 Index for the period from December 31, 2005 through December 31, 2010. This comparison assumes an investment of $100 on December 31, 2005 and the reinvestment of any dividends.
Our approach is to return to shareholders excess cash beyond that required to make investments in our business to support long-term, profitable growth.

112010 ANNUAL REPORT
0
500
1000
1500
2000
91 92 93 94 95 96 97 98 99 00 01 02 03 04 05 06 07 08 09 10
$23
4
$38
4
$5
07
$6
03
$6
93
$74
8
$8
53
$10
14
$11
52
$12
99
$14
70
$16
29
$16
68
$17
32
$2000
$1750
$1500
$1250
$1000
$750
$500
$250
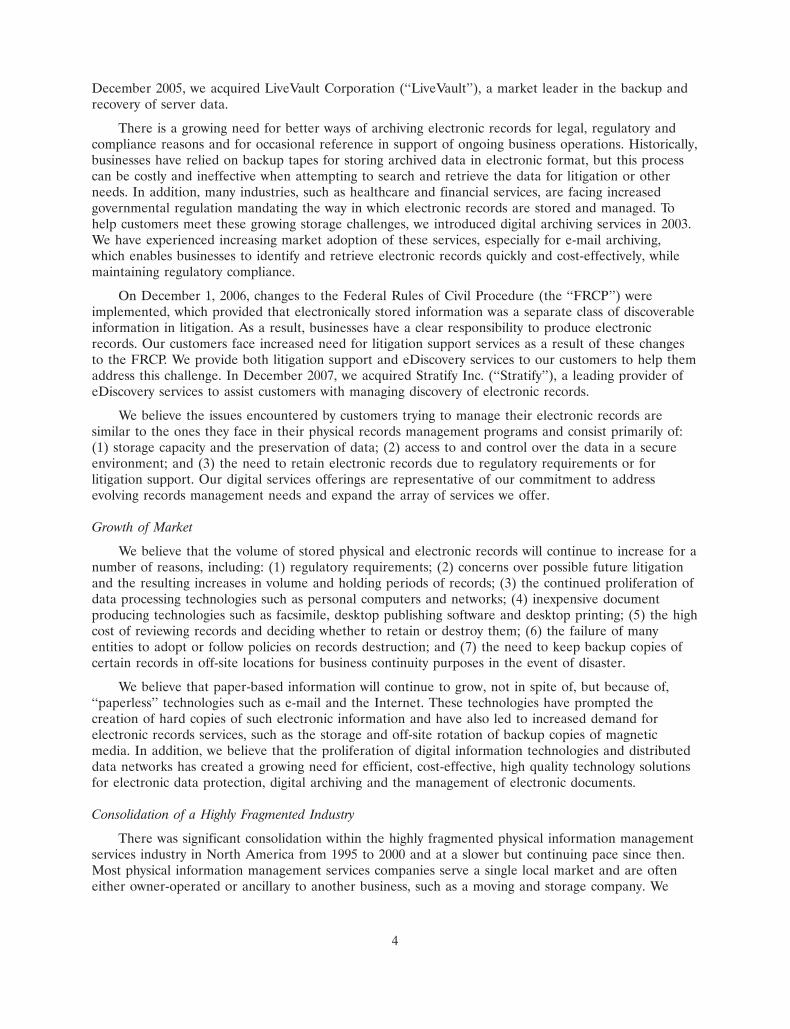
22 YEARS OF STORAGE REVENUE GROWTHAnnual storage revenues (in millions)
$73 $8
2
$9
1
$10
1
$12
0
$16
2
of seven years and no meaningful repayment obliga-tions until 2014.
Our track record in growing our cash flows and strengthening our balance sheet combined with our confidence in our ability to grow our business profit-ably supported our decision to initiate a shareholder payout program in 2010. Our approach is to return to shareholders excess cash beyond that required to make investments in our business to support long-term, profitable growth. It is comprised of two important elements – a quarterly dividend and an authorization to repurchase shares. Our dividend currently stands at $0.75 per share on an annual
basis, following a 200% increase announced in December 2010. This level of dividend provides a solid foundation to our payout approach and currently represents more than 60% of annual adjusted net income. We expect to increase the dividend as we continue to expand our earnings and Free Cash Flow.
In 2010 our board authorized a total of $350 million for the repurchase of our shares. Last year we repur-chased 4.8 million shares for approximately $111 million. This leaves us a balance of $239 million for additional share repurchases under our existing authorization.

12 IRON MOUNTAIN
strength
The North American Physical Business segment provides strong returns and generates significant free cash flow.
132010 ANNUAL REPORT
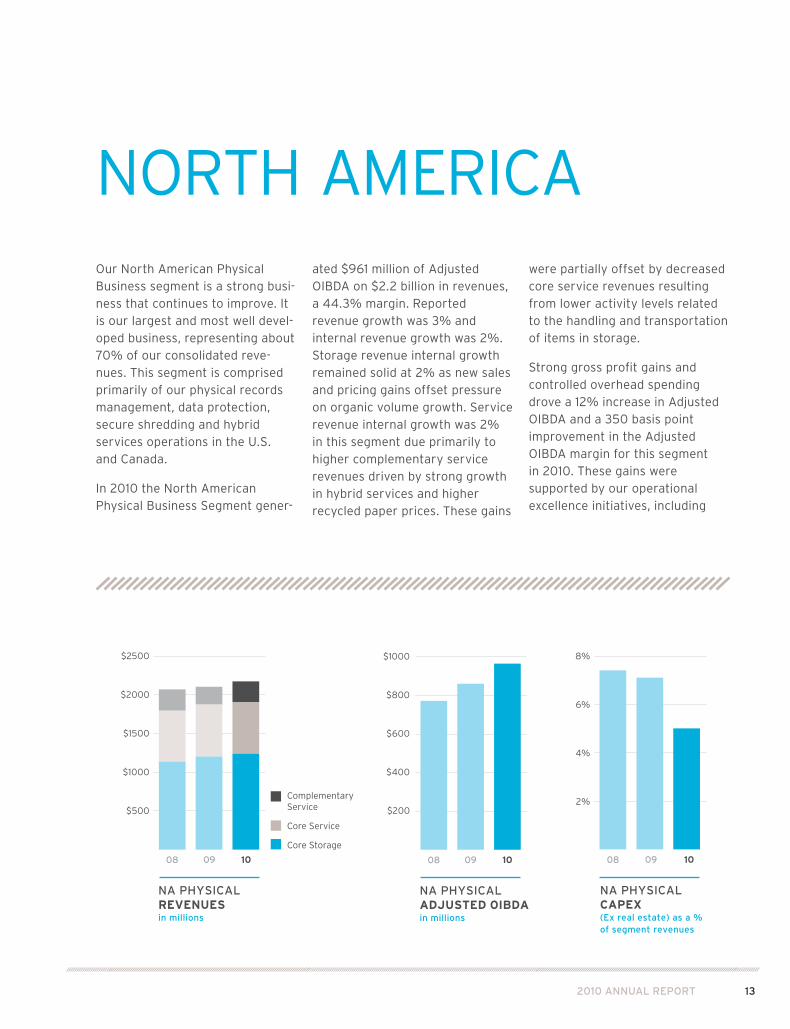
Our North American Physical Business segment is a strong busi-ness that continues to improve. It is our largest and most well devel-oped business, representing about 70% of our consolidated reve-nues. This segment is comprised primarily of our physical records management, data protection, secure shredding and hybrid services operations in the U.S. and Canada.
In 2010 the North American Physical Business Segment gener-
ated $961 million of Adjusted OIBDA on $2.2 billion in revenues, a 44.3% margin. Reported revenue growth was 3% and internal revenue growth was 2%. Storage revenue internal growth remained solid at 2% as new sales and pricing gains offset pressure on organic volume growth. Service revenue internal growth was 2% in this segment due primarily to higher complementary service revenues driven by strong growth in hybrid services and higher recycled paper prices. These gains
were partially offset by decreased core service revenues resulting from lower activity levels related to the handling and transportation of items in storage.
Strong gross profit gains and controlled overhead spending drove a 12% increase in Adjusted OIBDA and a 350 basis point improvement in the Adjusted OIBDA margin for this segment in 2010. These gains were supported by our operational excellence initiatives, including
NA PHYSICALREVENUESin millions
ComplementaryService
Core Service
Core Storage
ComplementaryService
Core Service
Core Storage
NA PHYSICAL
REVENUESIN MILLIONS
07 08 090
500
1000
1500
2000
2500
$2500
$2000
$1500
$1000
$500
$2500
$2000
$1500
$1000
$500
08 09 10
NORTH AMERICA
$1000
$800
$600
$400
$200
$1000
$800
$600
$400
$200
NA PHYSICALADJUSTED OIBDAIN MILLIONS
0
200
400
600
800
1000
08 09 10
NA PHYSICALADJUSTED OIBDAin millions
08 09 10
NA PHYSICALCAPEX(Ex real estate) as a % of segment revenues
NA PHYSICAL
CAPEX(EX REAL ESTATE) AS A % OF SEGMENT REVENUES
07 08 090
1
2
3
4
5
6
7
8 12%
10%
8%
6%
4%
2%
8%
6%
4%
2%
08 09 10

14 IRON MOUNTAIN
pricing program and produc-tivity improvements, as well as the impact of higher recycled paper prices. Capital expendi-tures (excluding real estate) in North America improved to 5.1% of segment revenues from 7.1% in 2009 as a result of controlled capital spending, pricing gains and lower net volume growth.
Since 2007 our focus on opti-mizing this business has resulted in significantly higher profit-ability, cash flow and returns in this segment. Over this time we
have increased Adjusted OIBDA at an annual compounded rate of 12%, well ahead of our 5% compounded annual growth in revenues, yielding more than 800 basis points in Adjusted OIBDA margin improvement. North America provides strong returns and generates significant free cash flow. We see large unvended opportunities for our core services in North America and we intend to continue converting these oppor-tunities into profitable growth which enhance returns.
Our international business is the same fundamental business as the one we operate in North America and, as demonstrated in North America, when fully-developed, this business generates attractive returns.

152010 ANNUAL REPORT
The International Physical Business segment, which repre-sents 23% of our consolidated revenues, is the same funda-mental business as the one we operate in North America. It is a business we know well and, as demonstrated in North America, when fully-developed, this busi-ness generates attractive returns.
International revenues grew 6% for the year, on a reported basis,
to $725 million from $683 million in 2009. Internal growth was 4% with favorable foreign currency exchange contributing an addi-tional 2% to the overall growth rate. Revenue performance in this segment featured strong storage internal growth of 6%, or three times the rate of our more devel-oped North American business. Adjusted OIBDA grew nearly 7% on a reported basis, in line with revenue growth, to $134 million,
or 18.4% of segment revenues. Capital expenditures (excluding real estate) as a percent of segment revenues were 12.1% in 2010 compared to 12.3% in 2009. The rate of capital spending in our International business is currently higher than that in our North American business as we invest to increase scale, improve produc-tivity and rationalize our real estate, just as we did in North America.
0
100
200
300
400
500
600
700
800 $800
$600
$400
$200
INTL PHYSICALREVENUESin millions
ComplementaryService
Core Service
Core Storage
08 09 10
INTERNATIONAL
INTL PHYSICALCAPEX(Ex real estate) as a % of segment revenues
cash flow
2008
0
5
10
15
20 20%
15%
10%
5%
08 09 100
30
60
90
120
150 $150
$120
$90
$60
$30
INTL PHYSICALADJUSTED OIBDAin millions
08 09 10

16 IRON MOUNTAIN
IRON MOUNTAIN’S GLOBAL FOOTPRINT
Delivering services via an unmatched global footprint comprised of operations in more than 35 countries on five continents.

172010 ANNUAL REPORT
Our Worldwide Digital Segment was 7% of total revenues in 2010. It is comprised of three main service lines: online backup and recovery, digital archiving and eDiscovery. Gains in both online backup and recovery and archiving services, reflecting our acquisition of Mimosa Systems Inc. in February 2010, drove 1% growth in reported revenues. Internal revenue growth was (3)% as these gains were more than offset by lower revenues in our eDiscovery
business, which experienced a significant change in market dynamics. Adjusted OIBDA for 2010 was $28 million compared to $50 million in 2009 as our cost reductions were not executed quickly enough to offset lower eDiscovery revenues in a rapidly changing market. Despite the decrease in segment profitability our digital business remained cash flow positive as the segment’s Adjusted OIBDA exceeded its capital expenditures.
As noted on our recent earnings calls, we proactively reassessed the value of our Digital goodwill beginning in the third quarter, which resulted in an impairment charge of $284 million related to our Worldwide Digital segment in 2010. This charge impacted our reported 2010 EPS by $1.40.
WORLDWIDE DIGITAL
0
50
100
150
200
250
$250
$200
$150
$100
$50
WW DIGITALREVENUESin millions
ComplementaryService
Core Service
Core Storage
08 09 10
cash flow
2008
0
10
20
30
40
50
60 $60
$50
$40
$30
$20
$10
WW DIGITALADJUSTED OIBDAin millions
08 09 100
3
6
9
12
1515%
12%
9%
6%
3%
08 09 10
WW DIGITALCAPEX(Ex real estate) as a % of segment revenues

18 IRON MOUNTAIN
Looking ahead to 2011, we expect to continue to drive solid Adjusted EPS and FCF gains on steady revenue growth. Our goals are for 2% to 4% reported revenue growth supported by progress on new sales, increased hybrid services revenues and interna-tional expansion. We are targeting solid underlying Adjusted OIBDA growth supported by continued focus on productivity improvement
in our North American field and support operations and further strengthening of international operating margins. These gains will fund incremental investments in sales and marketing capability in support of accelerated new sales growth for 2012.
We expect our cash management approach to support continued solid Adjusted EPS and FCF growth.
Adjusted EPS will benefit from lower interest costs, reflecting recent refinancing activities and fewer shares outstanding. Our FCF outlook is supported by projections for lower interest expense and continued improvement in capital efficiency reflecting benefits from capital allocation controls.
2011 FINANCIAL OUTLOOK
UNITED STATESSECURITIES AND EXCHANGE COMMISSION
Washington, D.C. 20549
FORM 10-K(Mark One)
� ANNUAL REPORT PURSUANT TO SECTION 13 OR 15(d) OF THESECURITIES EXCHANGE ACT OF 1934
For the Fiscal Year Ended December 31, 2010
or
� TRANSITION REPORT PURSUANT TO SECTION 13 OR 15(d) OF THESECURITIES EXCHANGE ACT OF 1934
For the transition period from to
Commission File Number 1-13045
IRON MOUNTAIN INCORPORATED(Exact name of Registrant as Specified in Its Charter)
Delaware 23-2588479(State or other jurisdiction of incorporation) (I.R.S. Employer Identification No.)745 Atlantic Avenue, Boston, Massachusetts 02111
(Address of principal executive offices) (Zip Code)617-535-4766
(Registrant’s telephone number, including area code)
Securities registered pursuant to Section 12(b) of the Act:
Title of Each Class Name of Exchange on Which Registered
Common Stock, $.01 par value per share New York Stock ExchangeSecurities registered pursuant to Section 12(g) of the Act: None
Indicate by check mark if the registrant is a well-known seasoned issuer, as defined in Rule 405 of the SecuritiesAct. Yes � No �
Indicate by check mark if the registrant is not required to file reports pursuant to Section 13 or Section 15(d) of theAct. Yes � No �
Indicate by check mark whether the registrant: (1) has filed all reports required to be filed by Section 13 or 15(d)of the Securities Exchange Act of 1934 during the preceding 12 months (or for such shorter period that the registrantwas required to file such reports), and (2) has been subject to such filing requirements for the past90 days. Yes � No �
Indicate by check mark whether the registrant has submitted electronically and posted on its corporate Web site, ifany, every Interactive Data File required to be submitted and posted pursuant to Rule 405 of Regulation S-T during thepreceding 12 months (or for such shorter period that the registrant was required to submit and post suchfiles). Yes � No �
Indicate by check mark if disclosure of delinquent filers pursuant to Item 405 of Regulation S-K is not containedherein, and will not be contained, to the best of registrant’s knowledge, in definitive proxy or information statementsincorporated by reference in Part III of this Form 10-K or any amendment to this Form 10-K �
Indicate by check mark whether the registrant is a large accelerated filer, an accelerated filer, a non-acceleratedfiler or a small reporting company. See the definitions of ‘‘large accelerated filer,’’ ‘‘accelerated filer’’ and ‘‘smallerreporting company’’ in Rule 12b-2 of the Exchange Act. (Check one):
Large accelerated filer � Accelerated filer �Non-accelerated filer � Smaller reporting company �
(Do not check if a smaller reporting company)
Indicate by check mark whether the registrant is a shell company (as defined in Rule 12b-2 of the ExchangeAct). Yes � No �
As of June 30, 2010, the aggregate market value of the Common Stock of the registrant held by non-affiliates of theregistrant was $3,942,455.18 based on the closing price on the New York Stock Exchange on such date.
Number of shares of the registrant’s Common Stock at February 10, 2011: 200,194,653

IRON MOUNTAIN INCORPORATED2010 FORM 10-K ANNUAL REPORT
Table of Contents
Page
PART I
Item 1. Business . . . . . . . . . . . . . . . . . . . . . . . . . . . . . . . . . . . . . . . . . . . . . . . . . . . . . . . . 1
Item 1A. Risk Factors . . . . . . . . . . . . . . . . . . . . . . . . . . . . . . . . . . . . . . . . . . . . . . . . . . . . . 16
Item 1B. Unresolved Staff Comments . . . . . . . . . . . . . . . . . . . . . . . . . . . . . . . . . . . . . . . . . . 23
Item 2. Properties . . . . . . . . . . . . . . . . . . . . . . . . . . . . . . . . . . . . . . . . . . . . . . . . . . . . . . . 23
Item 3. Legal Proceedings . . . . . . . . . . . . . . . . . . . . . . . . . . . . . . . . . . . . . . . . . . . . . . . . . 23
Item 4. [Removed and Reserved] . . . . . . . . . . . . . . . . . . . . . . . . . . . . . . . . . . . . . . . . . . . . 24
PART II
Item 5. Market for Registrant’s Common Equity, Related Stockholder Matters and IssuerPurchases of Equity Securities . . . . . . . . . . . . . . . . . . . . . . . . . . . . . . . . . . . . . . . 25
Item 6. Selected Financial Data . . . . . . . . . . . . . . . . . . . . . . . . . . . . . . . . . . . . . . . . . . . . . 27
Item 7. Management’s Discussion and Analysis of Financial Condition and Results ofOperations . . . . . . . . . . . . . . . . . . . . . . . . . . . . . . . . . . . . . . . . . . . . . . . . . . . . . 31
Item 7A. Quantitative and Qualitative Disclosures About Market Risk . . . . . . . . . . . . . . . . . . 63
Item 8. Financial Statements and Supplementary Data . . . . . . . . . . . . . . . . . . . . . . . . . . . . 65
Item 9. Changes in and Disagreements with Accountants on Accounting and FinancialDisclosure . . . . . . . . . . . . . . . . . . . . . . . . . . . . . . . . . . . . . . . . . . . . . . . . . . . . . 65
Item 9A. Controls and Procedures . . . . . . . . . . . . . . . . . . . . . . . . . . . . . . . . . . . . . . . . . . . . 65
Item 9B. Other Information . . . . . . . . . . . . . . . . . . . . . . . . . . . . . . . . . . . . . . . . . . . . . . . . . 67
PART III
Item 10. Directors, Executive Officers and Corporate Governance . . . . . . . . . . . . . . . . . . . . . 68
Item 11. Executive Compensation . . . . . . . . . . . . . . . . . . . . . . . . . . . . . . . . . . . . . . . . . . . . 68
Item 12. Security Ownership of Certain Beneficial Owners and Management and RelatedStockholder Matters . . . . . . . . . . . . . . . . . . . . . . . . . . . . . . . . . . . . . . . . . . . . . . 68
Item 13. Certain Relationships and Related Transactions, and Director Independence . . . . . . . 68
Item 14. Principal Accountant Fees and Services . . . . . . . . . . . . . . . . . . . . . . . . . . . . . . . . . . 68
PART IV
Item 15. Exhibits, Financial Statement Schedules . . . . . . . . . . . . . . . . . . . . . . . . . . . . . . . . . 68
i

References in this Annual Report on Form 10-K to ‘‘the Company,’’ ‘‘we,’’ ‘‘us’’ or ‘‘our’’ includeIron Mountain Incorporated and its consolidated subsidiaries, unless the context indicates otherwise.
DOCUMENTS INCORPORATED BY REFERENCE
Certain information required in Items 10, 11, 12, 13 and 14 of Part III of this Annual Report onForm 10-K is incorporated by reference from our definitive Proxy Statement for our 2011 AnnualMeeting of Stockholders to be filed with the Securities and Exchange Commission within 120 days afterthe close of the fiscal year ended December 31, 2010.
CAUTIONARY NOTE REGARDING FORWARD-LOOKING STATEMENTS
We have made statements in this Annual Report on Form 10-K that constitute ‘‘forward-lookingstatements’’ as that term is defined in the Private Securities Litigation Reform Act of 1995 and otherfederal securities laws. These forward-looking statements concern our operations, economicperformance, financial condition, goals, beliefs, future growth strategies, investment objectives, plansand current expectations. The forward-looking statements are subject to various known and unknownrisks, uncertainties and other factors. When we use words such as ‘‘believes,’’ ‘‘expects,’’ ‘‘anticipates,’’‘‘estimates’’ or similar expressions, we are making forward-looking statements.
Although we believe that our forward-looking statements are based on reasonable assumptions, ourexpected results may not be achieved, and actual results may differ materially from our expectations.Important factors that could cause actual results to differ from expectations include, among others:
• the cost to comply with current and future laws, regulations and customer demands relating toprivacy issues;
• the impact of litigation or disputes that may arise in connection with incidents in which we failto protect our customers’ information;
• changes in the price for our services relative to the cost of providing such services;
• changes in customer preferences and demand for our services;
• the cost or potential liabilities associated with real estate necessary for our business;
• the performance of business partners upon whom we depend for technical assistance ormanagement expertise outside the U.S.;
• changes in the political and economic environments in the countries in which our internationalsubsidiaries operate;
• in the various digital businesses in which we are engaged, our ability to keep up with rapidtechnological changes, evolving industry expectations and changing customer requirements orcompetition for customers;
• claims that our technology violates the intellectual property rights of a third party;
• the impact of legal restrictions or limitations under stock repurchase plans on price, volume ortiming of stock repurchases;
• the impact of alternative, more attractive investments on dividends or stock repurchases;
• our ability or inability to complete acquisitions on satisfactory terms and to integrate acquiredcompanies efficiently; and
• other trends in competitive or economic conditions affecting our financial condition or results ofoperations not presently contemplated.
ii

Other risks may adversely impact us, as described more fully under ‘‘Item 1A. Risk Factors.’’
You should not rely upon forward-looking statements except as statements of our presentintentions and of our present expectations, which may or may not occur. You should read thesecautionary statements as being applicable to all forward-looking statements wherever they appear.Except as required by law, we undertake no obligation to release publicly the result of any revision tothese forward-looking statements that may be made to reflect events or circumstances after the datehereof or to reflect the occurrence of unanticipated events. Readers are also urged to carefully reviewand consider the various disclosures we have made in this document, as well as our other periodicreports filed with the Securities and Exchange Commission (the ‘‘Commission’’ or ‘‘SEC’’).
iii
PART I
Item 1. Business.
A. Development of Business.
We provide information management services that help organizations around the world lower thecosts, risks and inefficiencies of managing their physical and digital data. Our solutions enablecustomers to protect and better use their information—regardless of its format, location or lifecyclestage—so they can optimize their business and ensure proper recovery, compliance and discovery. Weoffer comprehensive records management services, data protection & recovery services and informationdestruction services, along with the expertise and experience to address complex informationmanagement challenges such as rising storage costs, litigation, regulatory compliance and disasterrecovery. Founded in an underground facility near Hudson, New York in 1951, Iron Mountain is atrusted partner to more than 150,000 corporate clients throughout North America, Europe, LatinAmerica and Asia Pacific. We have a diversified customer base comprised of commercial, legal,banking, healthcare, accounting, insurance, entertainment and government organizations, includingmore than 95% of the Fortune 1000. As of December 31, 2010, we provided services in more than 35countries on five continents, employed over 19,000 people and operated more than 1,000 facilities.
Now in our 60th year, we have experienced tremendous growth, particularly since successfullycompleting the initial public offering of our common stock in February 1996. We have grown from abusiness with limited product offerings and annual revenues of $104.0 million in 1995 into a globalenterprise providing a broad range of information management services to customers in marketsaround the world with total revenues of more than $3.1 billion for the year ended December 31, 2010.On January 5, 2009, we were added to the S&P 500 Index and as of December 31, 2010 we werenumber 644 on the Fortune 1000.
Our success since becoming a public company in 1996 has been driven in large part by ourexecution of a consistent long-term growth plan to build market leadership by extending our strategicposition through service line and global expansion. This growth plan has been sequenced into threephases. The first phase involved establishing leadership and broad market access in our core businesses:records management and data protection & recovery, primarily through acquisitions. In the secondphase we invested in building a successful selling organization to access new customers, convertingpreviously unvended demand. While different parts of our business are in different stages of evolutionalong our three-phase strategy, as an enterprise, we have transitioned to the third phase of our growthplan, which we call the capitalization phase. In this phase, which we expect will run for a long time tocome, we seek to expand our relationships with our customers to continue solving their increasinglycomplex information management problems. Doing this well means expanding our service offerings ona global basis while maximizing our solid core businesses. In doing this, we continue to build what webelieve to be a very durable business through disciplined execution.
Consistent with this strategy, we have transitioned from a growth strategy driven primarily byacquisitions of information management services companies to expansion driven primarily by internalgrowth. In 2001, internal revenue growth exceeded growth through acquisitions for the first time sincewe began our acquisition program in 1996. This has continued to be the case in each year since 2001with the exception of 2004. In the absence of unusual acquisition activity, we expect to achieve more ofour revenue growth internally in 2011 and beyond.
We expect to achieve our long-term growth goals by offering our customers integrated services thataddress their increasingly complex information management needs regardless of the format, location orlifecycle stage of their information. By doing so we aim to help our customers reduce the costs, risksand complexities associated with managing their data while increasing their compliance with variouslaws, regulations, company policies and industry best practices. Consistent with our overall growth
1
strategy, we are focused on improving our internal revenue growth trajectory in the near-term primarilythrough a set of specific growth initiatives. Our go-to-market initiative is a targeted approach toimproving our sales capability. By successfully executing on this initiative, we expect to increaserevenues with our existing customers by selling them new services and by gaining new customers thattoday do not outsource some or all of their information management service needs. We are alsotargeting higher growth in our international businesses as we expand our platform for selling coreservices and new services in higher growth markets. Finally, we are continuing to expand our servicesportfolio in the hybrid and digital markets to capture what we see as larger, faster growingopportunities.
At this stage in our evolution we are equally focused on driving increased profitability and cashflow through a disciplined management approach and a focus on Operational Excellence. Comprised ofproductivity initiatives, pricing program improvements and cost controls, our Operational Excellencestrategy has produced significant and visible results. Since 2006, we have compounded annual growthrates of 12% for adjusted operating income before depreciation, amortization and goodwill impairment(‘‘Adjusted OIBDA’’), 18% for Adjusted Earnings per Share and 68% for Free Cash Flows beforeAcquisitions and Discretionary Investments (‘‘FCF’’). During that same period, we reduced our capex(excluding real estate) as a percent of revenues from 13.6% in 2006, to 8.1% in 2010. For moredetailed definitions and reconciliations of Adjusted OIBDA, Adjusted Earnings per Share and FCF anda discussion of why we believe these measure provide relevant and useful information to our currentand potential investors, see ‘‘Item 7. Management’s Discussion and Analysis of Financial Condition andResults of Operations—Non-GAAP Measures.’’
We are committed to delivering shareholder value. To that end, and supported by our increasedprofitability and strong cash flows, we initiated a stockholder payout program in February 2010consisting of our first ever quarterly cash dividend of $0.0625 per share, declared in March 2010, June2010 and September 2010, and a share repurchase authorization of up to $150.0 million. In October2010, our board approved an increase to the amount authorized under our existing share repurchaseprogram of up to an additional $200.0 million. In December 2010, the board declared a quarterly cashdividend of $0.1875 per share, an increase of 200% over the quarterly dividend previously paid. Theincrease in our dividend is the result of the success we have had as an organization driving higherprofitability and strong cash flows.
B. Description of Business.
Overview
Our information management services can be broadly divided into three major service categories:records management services, data protection & recovery services, and information destruction services.We offer both physical services and technology solutions in each of these categories. Media formats canbe broadly divided into physical and electronic records. We define physical records to include paperdocuments, as well as all other non-electronic media such as microfilm and microfiche, master audioand videotapes, film, X-rays and blueprints. Electronic records include email and various forms ofmagnetic media such as computer tapes and hard drives and optical disks.
Our physical records management services include: records management program development andimplementation based on best-practices to help customers comply with specific regulatory requirements,implementation of policy-based programs that feature secure, cost-effective storage for all major media,including paper (which is the dominant form of records storage), flexible retrieval access and retentionmanagement. Included within physical records management services are our hybrid services. Theseservices help organizations to gain better access to, and ultimately control over, their paper records bydigitizing, indexing and hosting them in online archives to provide complete information lifecyclesolutions. Our technology-based records management services are comprised primarily of digital
2
archiving and related services for secure, legally compliant and cost-effective long-term archiving ofelectronic records and eDiscovery services. Within the records management services category, we havedeveloped specialized services for vital records and regulated industries such as healthcare, energy,government and financial services.
Our physical data protection & recovery services include disaster preparedness, planning, supportand secure, off-site vaulting of data backup media for fast and efficient data recovery in the event of adisaster, human error or virus. Our technology-based data protection & recovery services include onlinebackup and recovery solutions for desktop and laptop computers and remote servers. Additionally, weserve as a trusted, neutral third party and offer intellectual property escrow services to protect andmanage source code and other proprietary information.
Our information destruction services are comprised almost exclusively of secure shredding services.Secure shredding services complete the lifecycle of a record and involve the shredding of sensitivedocuments in a way that ensures privacy and a secure chain of custody for the records. These servicestypically include either the scheduled pick-up of loose office records which customers accumulate inspecially designed secure containers we provide or the shredding of documents stored in recordsfacilities upon the expiration of their scheduled retention periods.
Physical Records
Physical records may be broadly divided into two categories: active and inactive. Active recordsrelate to ongoing and recently completed activities or contain information that is frequently referenced.Active records are usually stored and managed on-site by the organization that originated them toensure ready availability. Inactive physical records are the principal focus of the informationmanagement services industry. Inactive records consist of those records that are not needed forimmediate access but which must be retained for legal, regulatory and compliance reasons or foroccasional reference in support of ongoing business operations. A large and growing specialty subset ofthe physical records market is medical records. These are active and semi-active records that are oftenstored off-site with and serviced by an information management services vendor. Special regulatoryrequirements often apply to medical records. In addition to our core records management services, weprovide consulting, facilities management, fulfillment and other outsourcing services.
Electronic Records
Electronic records management focuses on the storage of, and related services for, computermedia that is either a backup copy of recently processed data or archival in nature. Customer needs fordata backup and recovery and archiving are distinctively different. Backup data exists because of theneed of many businesses to maintain backup copies of their data in order to be able to recover thedata in the event of a system failure, casualty loss or other disaster. It is customary (and a bestpractice) for data processing groups to rotate backup tapes to off-site locations on a regular basis andto require multiple copies of such information at multiple sites.
In addition to the physical rotation and storage of backup data that our physical business segmentsprovide, our Worldwide Digital Business segment offers online backup services as an alternative way forbusinesses to transfer data to us, and to access the data they have stored with us. Online backup is aWeb-based service that automatically backs up computer data from servers or directly from desktop andlaptop computers over the Internet and stores it in one of our secure data centers. In early 2003, weannounced an expansion of the online backup service to include backup and recovery for personalcomputer data, answering customers’ needs to protect critical business data, which is often unprotectedon employee laptop and desktop personal computers. In November 2004, we acquired ConnectedCorporation (‘‘Connected’’), a market leader in the backup and recovery of this distributed data, and in
3
December 2005, we acquired LiveVault Corporation (‘‘LiveVault’’), a market leader in the backup andrecovery of server data.
There is a growing need for better ways of archiving electronic records for legal, regulatory andcompliance reasons and for occasional reference in support of ongoing business operations. Historically,businesses have relied on backup tapes for storing archived data in electronic format, but this processcan be costly and ineffective when attempting to search and retrieve the data for litigation or otherneeds. In addition, many industries, such as healthcare and financial services, are facing increasedgovernmental regulation mandating the way in which electronic records are stored and managed. Tohelp customers meet these growing storage challenges, we introduced digital archiving services in 2003.We have experienced increasing market adoption of these services, especially for e-mail archiving,which enables businesses to identify and retrieve electronic records quickly and cost-effectively, whilemaintaining regulatory compliance.
On December 1, 2006, changes to the Federal Rules of Civil Procedure (the ‘‘FRCP’’) wereimplemented, which provided that electronically stored information was a separate class of discoverableinformation in litigation. As a result, businesses have a clear responsibility to produce electronicrecords. Our customers face increased need for litigation support services as a result of these changesto the FRCP. We provide both litigation support and eDiscovery services to our customers to help themaddress this challenge. In December 2007, we acquired Stratify Inc. (‘‘Stratify’’), a leading provider ofeDiscovery services to assist customers with managing discovery of electronic records.
We believe the issues encountered by customers trying to manage their electronic records aresimilar to the ones they face in their physical records management programs and consist primarily of:(1) storage capacity and the preservation of data; (2) access to and control over the data in a secureenvironment; and (3) the need to retain electronic records due to regulatory requirements or forlitigation support. Our digital services offerings are representative of our commitment to addressevolving records management needs and expand the array of services we offer.
Growth of Market
We believe that the volume of stored physical and electronic records will continue to increase for anumber of reasons, including: (1) regulatory requirements; (2) concerns over possible future litigationand the resulting increases in volume and holding periods of records; (3) the continued proliferation ofdata processing technologies such as personal computers and networks; (4) inexpensive documentproducing technologies such as facsimile, desktop publishing software and desktop printing; (5) the highcost of reviewing records and deciding whether to retain or destroy them; (6) the failure of manyentities to adopt or follow policies on records destruction; and (7) the need to keep backup copies ofcertain records in off-site locations for business continuity purposes in the event of disaster.
We believe that paper-based information will continue to grow, not in spite of, but because of,‘‘paperless’’ technologies such as e-mail and the Internet. These technologies have prompted thecreation of hard copies of such electronic information and have also led to increased demand forelectronic records services, such as the storage and off-site rotation of backup copies of magneticmedia. In addition, we believe that the proliferation of digital information technologies and distributeddata networks has created a growing need for efficient, cost-effective, high quality technology solutionsfor electronic data protection, digital archiving and the management of electronic documents.
Consolidation of a Highly Fragmented Industry
There was significant consolidation within the highly fragmented physical information managementservices industry in North America from 1995 to 2000 and at a slower but continuing pace since then.Most physical information management services companies serve a single local market and are ofteneither owner-operated or ancillary to another business, such as a moving and storage company. We
4
believe that the consolidation trend in the physical information management industry, both in NorthAmerica and other international geographies, may continue because of the industry’s capitalrequirements for growth, opportunities for large information management services providers to achieveeconomies of scale and customer demands for more sophisticated technology-based solutions.
We believe that the consolidation trend in this industry is also due to, and may continue as a resultof, the preference of certain large organizations to contract with one vendor in multiple cities andcountries for multiple services. In particular, larger customers increasingly demand a single,sophisticated company to handle all of their important physical records needs. Large national andmultinational companies are better able to satisfy these demands than smaller competitors. We havemade, and may continue to make from time to time, acquisitions of our competitors, many of whomare small, single-city operators.
Description of Our Business
We generate our revenues by providing storage (both physical and electronic records in a variety ofinformation media formats), core records management, data protection & recovery, informationdestruction services, hybrid services and an expanding menu of complementary products and services toa large and diverse customer base. Providing outsourced information management services is themainstay of our customer relationships and provides the foundation for our revenue growth. Coreservices, which are a vital part of a comprehensive records management program, consist primarily ofthe handling and transportation of stored records and information. In our secure shredding operations,core services consist primarily of the scheduled collection and shredding of records and documentsgenerated by business operations. Additionally, core services include hybrid services, recurring projectrevenues and maintenance fees associated with software license sales. As is the case with storagerevenues, core service revenues are highly recurring in nature. In 2010, our storage and core servicerevenues represented approximately 87% of our total consolidated revenues. In addition to our coreservices, we offer a wide array of complementary products and services, including special project work,data restoration projects, fulfillment services, consulting services and product sales (including softwarelicenses, specially designed storage containers and related supplies). In addition, included incomplementary services revenue is recycled paper revenues. These services address more specific needsand are designed to enhance our customers’ overall records management programs. These servicescomplement our core services; however, they are more episodic and discretionary in nature. Revenuegenerated by all of our operating segments includes both core and complementary components.
Our various operating segments offer the products and services discussed below. In general, ourNorth American Physical Business and our International Physical Business segments offer physicalrecords management services, data protection & recovery services and information destruction services,in their respective geographies. Our Worldwide Digital Business segment includes our online backupand recovery solutions for server data and personal computers, digital archiving services, eDiscoveryservices and intellectual property management services and is not limited to any particular geography.Some of our complementary services and products are offered within all of our segments. The amountof revenues derived from our North American Physical Business, International Physical Business andWorldwide Digital Business operating segments and other relevant data, including financial informationabout geographic areas and product and service lines, for fiscal years 2008, 2009 and 2010 are set forthin Note 9 to Notes to Consolidated Financial Statements.
Service Offerings
Our information management services can be broadly divided into three major categories: recordsmanagement services, data protection & recovery services and information destruction services. Weoffer both physical services and technology solutions in the records management and data protection &
5
recovery categories. Currently, we only offer physical services in the information destruction servicescategory.
Records Management Services
By far our largest category of services, records management services are comprised primarily of thearchival storage of records, both physical and digital, for long periods of time according to applicablelaws, regulations and industry best practice. Core to any records management program is the handlingand transportation of those records being stored and the destruction of documents stored in recordsfacilities upon the expiration of their scheduled retention periods. For physical records, this isaccomplished through our extensive service and courier operations. Other records management servicesinclude: our hybrid services as well as Compliant Records Management and Consulting Services, HealthInformation Management Solutions, Film & Sound Archives, Energy Data Services, Discovery Servicesand other ancillary services.
Hard copy business records are typically stored in cartons packed by the customer for long periodsof time with limited activity. For some customers we store individual files on an open shelf basis andthese files are typically more active. Storage charges are generally billed monthly on a per storage unitbasis, usually either per carton or per cubic foot of records, and include the provision of space, racking,computerized inventory and activity tracking and physical security.
Service and courier operations are an integral part of our comprehensive records managementprogram for all physical media. They include adding records to storage, temporary removal of recordsfrom storage, refiling of removed records, permanent withdrawals from storage and the destruction ofrecords. Service charges are generally assessed for each activity on a per unit basis. Courier operationsconsist primarily of the pick-up and delivery of records upon customer request. Charges for courierservices are based on urgency of delivery, volume and location and are billed monthly. As ofDecember 31, 2010, we were utilizing a fleet of approximately 3,700 owned or leased vehicles.
Our digital archiving services focus on archiving digital information with long-term preservationrequirements. These services represent the digital analogy to our physical records management services.Because of increased litigation risks and regulatory mandates, such as the changes to the FRCP thatexplicitly define electronically stored information as a separate class of discoverable information,companies are increasingly aware of the need to apply the same records management policies andretention schedules to electronic data as they do physical records. Typical digital records include e-mail,e-statements, images, electronic documents retained for legal or compliance purposes and other datadocumenting business transactions.
The growth rate of mission-critical digital information is accelerating, driven in part by the use ofthe Internet as a distribution and transaction medium. The rising cost and increasing importance ofdigital information management, coupled with the increasing availability of telecommunicationsbandwidth at lower costs, may create meaningful opportunities for us to provide solutions to ourcustomers with respect to their digital records management challenges. We continue to cultivatemarketing and technology partnerships to support this anticipated growth.
The focus of our hybrid business is to develop, implement and support comprehensive informationmanagement solutions for the complete lifecycle of our customers’ information. We seek to developsolutions that solve our customers’ document management challenges by integrating the management ofphysical records, document conversion and digital storage. Our hybrid services complement our corephysical and digital service offerings, leveraging our global footprint and our existing customerrelationships. We differentiate our offerings by providing solutions that integrate and extend ourexisting portfolio of products and services.
6

The trend towards increased usage of Electronic Document Management (‘‘EDM’’) systemsrepresents another opportunity for us. In addition to our existing archival storage services, there isincreased opportunity to manage active records. Our hybrid services provide the bridge betweencustomers’ physical documents and their new EDM solutions.
We offer records management services that have been tailored for specific industries such as healthcare, or to address the needs of customers with more specific needs based on the critical nature oftheir records. Healthcare information services principally include the handling, storage, filing,processing and retrieval of medical records used by hospitals, private practitioners and other medicalinstitutions. Medical records tend to be more active in nature and are typically stored on specializedopen shelving systems that provide easier access to individual files. Healthcare information services alsoinclude recurring project work and ancillary services. Recurring project work involves the on-siteremoval of aged patient files and related computerized file indexing. Ancillary healthcare informationservices include release of information (medical record copying and delivery), temporary staffing,contract coding, facilities management and imaging.
Vital records contain critical or irreplaceable data such as master audio and video recordings, filmand other highly proprietary information, such as energy data. Vital records may require specialfacilities or services, either because of the data they contain or the media on which they are recorded.Our charges for providing enhanced security and special climate-controlled environments for vitalrecords are higher than for typical storage services. We provide the same ancillary services for vitalrecords as we provide for our other storage operations.
Our Discovery Services comprise solutions designed to address the legal discovery and corporategovernance needs of our customers. Those services and solutions allow our customers to collect,prepare, process, review, and produce data that may exist in either paper or digital form in response tointernal investigations, litigation or regulatory requests.
Electronic discovery is the component of legal discovery involving information that is convertedinto digital data or collected and processed in that form. Our eDiscovery services, principally embodiedby the Iron Mountain Legal Discovery application acquired in the Stratify acquisition, help ourcustomers identify, organize, analyze, and review particularly relevant or responsive information fromwithin the universe of electronic data generated during the normal course of their business. The abilityof current content management technologies to capture and maintain several copies of documents—including different versions of working drafts—underscores the challenges companies face in managinginformation for eDiscovery.
Our consolidated suite of physical and digital discovery services has been designed to deliver asecure, end-to-end chain-of-custody, while also reducing both risks and costs for our customers.
We offer a variety of additional services which customers may request or contract for on anindividual basis. These services include conducting records inventories, packing records into cartons orother containers, and creating computerized indices of files and individual documents. We also provideservices for the management of active records programs. We can provide these services, which generallyinclude document and file processing and storage, both off-site at our own facilities and by supplyingour own personnel to perform management functions on-site at the customer’s premises.
Other complementary lines of business that we operate include fulfillment services andprofessional consulting services. Fulfillment services are performed by our wholly-owned subsidiary,Iron Mountain Fulfillment Services, Inc. (‘‘IMFS’’). IMFS stores customer marketing literature anddelivers this material to sales offices, trade shows and prospective customers’ locations based on currentand prospective customer orders. In addition, IMFS assembles custom marketing packages and ordersand manages and provides detailed reporting on customer marketing literature inventories. A growingelement of the content we manage and fulfill is stored digitally and printed on demand by IMFS.
7
Digital print allows marketing materials such as brochures, direct mail, flyers, pamphlets andnewsletters to be personalized to the recipient with the variable messages, graphics and content.
We provide professional consulting services to customers, enabling them to develop and implementcomprehensive records and information management programs. Our consulting business draws on ourexperience in information management services to analyze the practices of companies and assist themin creating more effective programs of records and information management. Our consultants workwith these customers to develop policies and schedules for document retention and destruction.
We also sell a full line of specially designed corrugated cardboard storage cartons. We divestedourselves of our commodity data products sales business in 2008 and our domain name managementproduct line in 2010. Consistent with our treatment of acquisitions, we will eliminate all revenuesassociated with our data products business from the calculation of our internal growth rates for 2008and 2009 and revenues associated with our domain name management product line were eliminatedfrom the calculation of internal growth rate for 2010 and will also be eliminated from that calculationin 2011.
Data Protection & Recovery Services
Our data protection & recovery services are designed to comply with applicable laws andregulations and to satisfy industry best practices with regard to the off-site vaulting of data for disasterrecovery and business continuity purposes. As is the case with our records management services, weprovide data protection & recovery services for both physical and electronic records. We also offerintellectual property management services in this category.
Physical data protection & recovery services consist of the storage and rotation of backupcomputer media as part of corporate disaster recovery and business continuity plans. Computer tapes,cartridges and disk packs are transported off-site by our courier operations on a scheduled basis tosecure, climate-controlled facilities, where they are available to customers 24 hours a day, 365 days ayear, to facilitate data recovery in the event of a disaster. Frequently, back-up tapes are then rotatedfrom our facilities back to our customers’ data centers. We also manage tape library relocations andsupport disaster recovery testing and execution.
Online backup is our Web-based service that automatically backs up computer data from servers ordirectly from desktop or laptop computers over the Internet and stores it in one of our secure datacenters. Customers use our Connected� backup for PC and Mac software product for online backup ofdesktop or laptop computer data and our LiveVault� server data backup and recovery product foronline backup of server data. Customers can choose our off-site hosted Software as a Service solutionor they can license the software from us as part of a customer on-site solution.
Through our intellectual property management services, we act as a trusted, neutral, third party,safeguarding valuable technology assets—such as software source code, object code and data—insecure, access-protected escrow accounts. Acting in this intermediary role, we help document andmaintain intellectual property integrity. The result is increased control and leverage for all parties,enabling them to protect themselves, while maintaining competitive advantage.
Information Destruction Services
Our information destruction services consist primarily of physical secure shredding operations.Secure shredding is a natural extension of our hardcopy records management services, completing thelifecycle of a record, and involves the shredding of sensitive documents for corporate customers that, inmany cases, also use our services for management of less sensitive archival records. These servicestypically include the scheduled pick-up of loose office records which customers accumulate in speciallydesigned secure containers we provide. Complementary to our shredding operations is the sale of the
8
resultant waste paper to third-party recyclers. Through a combination of plant-based shreddingoperations and mobile shredding units comprised of custom built trucks, we are able to offer secureshredding services to our customers throughout the U.S., Canada, the U.K., Australia/New Zealand andLatin America.
Financial Characteristics of Our Business
Our financial model is based on the recurring nature of our various revenue streams. Thehistorical predictability of our revenues and the resulting Adjusted OIBDA allow us to operate with ahigh degree of financial leverage. Our business has the following financial characteristics:
• Recurring Revenues. We derive a majority of our consolidated revenues from fixed periodic,usually monthly, fees charged to customers based on the volume of records stored. Once acustomer places physical records in storage with us and until those records are destroyed orpermanently removed (for which we typically receive a service fee), we receive recurringpayments for storage fees without incurring additional labor or marketing expenses or significantcapital costs. Similarly, contracts for the storage of electronic backup media consist primarily offixed monthly payments. Our annual revenues from these fixed periodic storage fees have grownfor 22 consecutive years. For each of the five years 2006 through 2010, storage revenues, whichare stable and recurring, have accounted for over 53% or more of our total consolidatedrevenues. This stable and growing storage revenue base also provides the foundation forincreases in service revenues and Adjusted OIBDA.
• Historically Non-Cyclical Storage Business. Historically, we have not experienced any significantreductions in our storage business as a result of economic downturns although, during recenteconomic slowdowns, the rate at which some customers added new cartons to their inventorywas below historical levels. We believe that companies that have outsourced recordsmanagement services are less likely during economic downturns to incur the move-out costs andother expenses associated with accelerating destructions of their records, switching vendors ormoving their records management services programs in-house. However, during the currentrecession, which is more severe and has lasted longer than other recent downturns, destructionrates have increased as some customers have been more willing to incur additional short-termservice costs in exchange for lower storage costs in the long-term. In addition, we haveexperienced longer sales cycles and lower incoming volumes from existing customers, due inlarge part we believe to high unemployment rates and generally lower levels of business activity.Combined, these impacts have resulted in lower net volume growth rates in the short-term. Thenet effect of these factors has been the continued growth of our storage revenue base, albeit at alower rate. For each of the five years 2006 through 2010, total net volume growth in NorthAmerica has ranged from between 1% to 7%.
• Inherent Growth from Existing Physical Records Customers. Our physical records customers have,on average, sent us additional cartons at a faster rate than stored cartons have been destroyedor permanently removed. However, in the current economic downturn, elevated destruction andwithdrawal rates have resulted in lower net volume growth in recent quarters. We believe thecontinued growth of our physical records storage revenues is the result of a number of factors,including: (1) the trend toward increased records retention; (2) customer satisfaction with ourservices; (3) the costs and inconvenience of moving storage operations in-house or to anotherprovider of information management services; and (4) our positive pricing actions.
• Diversified and Stable Customer Base. As of December 31, 2010, we had over 150,000 corporateclients in a variety of industries. We currently provide services to commercial, legal, banking,healthcare, accounting, insurance, entertainment and government organizations, including morethan 95% of the Fortune 1000. No customer accounted for as much as 2% of our consolidated
9
revenues in any of the years ended December 31, 2008, 2009 and 2010. For each of the threeyears 2008 through 2010, the average volume reduction due to customers terminating theirrelationship with us was less than 2%.
• Capital Expenditures Related Primarily to Business Line Growth and Ongoing Operations. Ourbusiness requires significant capital expenditures to support our expected revenue growth andongoing operations as well as new products and services and increased profitability. As thenature of our business has evolved over time, so has the nature of our capital expenditures.Every year we expend capital to support a number of different objectives. The majority of ourcapital goes to support business line growth and our ongoing operations. We also expend capitalto support the development and improvement of products and services and projects designed toincrease our profitability. These expenditures are generally smaller and more discretionary innature. Below are descriptions of the major types of capital expenditures we are likely to makein a given year:
• Capital to support business line growth—these expenditures are primarily related to capacityexpansion. This includes investments in new building outfitting, carton storage systems, tapestorage systems and containers, shredding plants and bins and technology service storageand processing capacity.
• Capital to support ongoing business operations—these expenditures are primarily related tomajor repairs and/or the replacement of assets such as facilities, warehouse equipment andcomputers, previously referred to as maintenance capital expenditures. This category alsoincludes operational support initiatives such as sales and marketing and informationtechnology projects to support infrastructure requirements.
• Capital for new product development—these expenditures are directly related to thedevelopment of new products or services in support of our integrated value proposition.
• Capital for product improvement—these expenditures are primarily related to product andservice enhancements that support our leadership position in the various markets in whichwe operate. Spending in this area includes items such as increased feature functionality,security upgrades or system enhancements.
• Capital to support operational efficiencies—these expenditures are primarily related to drivingincreased profitability through cost savings and operating efficiencies and include items suchas facility consolidations and systems to support operating process improvements.
• Capital to acquire/construct real estate—these expenditures are directly related to theacquisition of real estate, either through the purchase of a new facility or the exercise of apurchase option in an existing lease, or the construction of a new facility.
10

Following is a table presenting our capital expenditures(1) for 2008, 2009 and 2010 organized by thenature of the spending as described above:
Year Ended December 31,
Nature of Capital Spend (dollars in millions) 2008(3) 2009(3) 2010(3)
Business Line Growth . . . . . . . . . . . . . . . . . . . . . . . . . . . . . . . . . . . . . . . . . $226 $164 $125Business Operations(2) . . . . . . . . . . . . . . . . . . . . . . . . . . . . . . . . . . . . . . . . $ 55 $ 63 $ 72Product Development . . . . . . . . . . . . . . . . . . . . . . . . . . . . . . . . . . . . . . . . . $ 16 $ 17 $ 15Product Improvement . . . . . . . . . . . . . . . . . . . . . . . . . . . . . . . . . . . . . . . . . $ 21 $ 32 $ 33Operational Efficiencies . . . . . . . . . . . . . . . . . . . . . . . . . . . . . . . . . . . . . . . $ 11 $ 9 $ 8Real Estate . . . . . . . . . . . . . . . . . . . . . . . . . . . . . . . . . . . . . . . . . . . . . . . . $ 44 $ 36 $ 14
Total Capital . . . . . . . . . . . . . . . . . . . . . . . . . . . . . . . . . . . . . . . . . . . . . . . $373 $321 $268
We believe that capital expenditures incurred as a percent of revenues is a meaningful metric forinvestors as it indicates the efficiency with which we are investing in the growth and operationalefficiency of our business. For the years 2008 through 2010, our total capital expenditures incurred as apercent of revenues were approximately 12%, 11% and 9%, respectively. The decrease in capitalexpenditures as percent of revenues since 2008 is due primarily to our disciplined approach to capitalmanagement, a mix shift toward less capital intense service revenues and moderating growth rates inour physical storage business.
Following is a table presenting our capital expenditures(1) as a percent of total revenues for 2008,2009 and 2010 organized by the nature of the spending as described above:
Year Ended December 31,
Nature of Capital Spend 2008(3) 2009(3) 2010(3)
Business Line Growth . . . . . . . . . . . . . . . . . . . . . . . . . . . . . . . . . . . . . . . . . 7.4% 5.4% 4.0%Business Operations(2) . . . . . . . . . . . . . . . . . . . . . . . . . . . . . . . . . . . . . . . . 1.8% 2.1% 2.3%Product Development . . . . . . . . . . . . . . . . . . . . . . . . . . . . . . . . . . . . . . . . . 0.5% 0.6% 0.5%Product Improvement . . . . . . . . . . . . . . . . . . . . . . . . . . . . . . . . . . . . . . . . . 0.7% 1.0% 1.1%Operational Efficiencies . . . . . . . . . . . . . . . . . . . . . . . . . . . . . . . . . . . . . . . 0.3% 0.3% 0.3%Real Estate . . . . . . . . . . . . . . . . . . . . . . . . . . . . . . . . . . . . . . . . . . . . . . . . 1.4% 1.2% 0.5%
Total Capital . . . . . . . . . . . . . . . . . . . . . . . . . . . . . . . . . . . . . . . . . . . . . . . 12.2% 10.6% 8.6%
(1) Represents accrued capital expenditures and may differ from amounts presented on the cash basisin the Consolidated Statement of Cash Flows.
(2) Capital expended in support of ongoing business operations includes amounts previously referredto as maintenance capital expenditures. This category also includes capital expended onoperational support initiatives such as sales and marketing and information technology projects tosupport infrastructure requirements.
(3) Columns may not foot due to rounding.
Growth Strategy
We offer our customers an integrated value proposition by providing them with comprehensiverecords management services, data protection & recovery services and information destruction services,along with the expertise and experience to address complex information management challenges suchas rising storage costs, litigation, regulatory compliance and disaster recovery. We expect to maintain aleadership position in the information management services industry around the world by enabling
11

customers to protect and better use their information—regardless of its format, location or lifecyclestage—so they can optimize their business and ensure proper recovery, compliance and discovery.
In the U.S. and Canada, we seek to be one of the largest information management servicesproviders in each of our markets. Internationally, our objectives are to continue to capitalize on ourexpertise in the information management services industry and to make additional acquisitions andinvestments in selected international markets. Our near-term growth objectives are comprised of a setof specific initiatives including: (1) our go-to-market initiative, which is a targeted, low risk approach toimproving our sales capability and thereby increasing revenues with our existing customers by sellingthem new services and gaining net new customers that today are unvended; (2) higher growth in ourinternational businesses as we expand our platform for selling core services and new services in highergrowth markets; and (3) continuing to expand our services portfolio in the hybrid and digital marketsto capture those larger, faster growing opportunities. Although the focus will be on growing ourbusiness organically, targeted acquisitions will continue to play a role in our overall growth strategy.
Introduction of New Products and Services
We continue to expand our portfolio of products and services. Adding new products and servicesallows us to further penetrate our existing customer accounts and attract new customers in previouslyuntapped markets.
In February, 2010, we acquired Mimosa Systems, Inc. (‘‘Mimosa’’), a leader in enterprise-classdigital content archiving solutions. Our NearPoint� solution, which was part of the Mimosa acquisition,is an enterprise archiving platform that manages the retention and disposition of email, files andSharePoint� information in accordance with corporate governance policy. As part of our comprehensiveportfolio of cloud and on-premise information management solutions, NearPoint content archiving letscompanies reduce risk and lower their storage and discovery costs. In October 2010, our NearPointsolution was positioned in the Leaders Quadrant in Gartner Inc.’s Magic Quadrant for EnterpriseInformation Archiving 2010 report. Gartner’s Magic Quadrant report positions technology vendorswithin a particular quadrant based on their completeness of vision and ability to execute whenaddressing companies’ information archiving needs.
Growth from Existing Customers
Our existing customers’ storage of physical records contributes to storage and storage-relatedservice revenues growth because, on average, they generate additional cartons at a faster rate than oldcartons are destroyed or permanently removed. In order to maximize growth opportunities fromexisting customers, we seek to maintain high levels of customer retention by providing premiumcustomer service through our local account management staff.
Our sales coverage model is designed to identify and capitalize on incremental revenueopportunities by allocating our sales resources based on a sophisticated segmentation of our customerbase and selling additional records management, data protection & recovery and informationdestruction services, in new and existing markets, within our existing customer relationships. We alsoseek to leverage existing business relationships with our customers by selling complementary servicesand products. Services include special project work, data restoration projects, fulfillment services,consulting services and product sales (including software licenses, specially designed storage containersand related supplies). In addition, included in complementary services revenue is recycled paperrevenues.
Addition of New Customers
Our sales forces are dedicated to three primary objectives: (1) establishing new customer accountrelationships; (2) generating additional revenue from existing customers in new and existing markets;
12

and (3) expanding new and existing customer relationships by effectively selling a wide array ofcomplementary services and products. In order to accomplish these objectives, our sales forces draw onour U.S. and international marketing organizations and senior management.
Growth through Acquisitions
The goals of our current acquisition program are (1) to supplement internal growth in our physicalbusinesses by expanding our new service capabilities and industry-specific services and continuing toexpand our presence in targeted international markets and (2) to accelerate our leadership and time tomarket for our targeted technology services. We have a successful record of acquiring and integratinginformation management services companies.
Acquisitions in the North American Physical Segment
We substantially completed our geographic expansion in North America in 2003. Given the smallnumber of attractive acquisition targets in our core physical businesses in North America and ourincreased revenue base, future acquisitions are expected to be less significant to our overall NorthAmerican revenue growth than in the past. Acquisitions in the North American Physical segment willlikely focus primarily on expanding our hybrid services capabilities.
Acquisitions in the International Physical Segment
We substantially completed our geographic expansion in Europe and Latin America by 2003 andbegan our expansion into Asia Pacific in 2005. We expect to continue to make acquisitions andinvestments in information management services businesses outside North America. We have acquiredand invested in, and seek to acquire and invest in, information management services companies incountries, and, more specifically, markets within such countries, where we believe there is potential forsignificant growth. Future acquisitions and investments will focus primarily on developing priorityexpansion markets in Continental Europe and Asia, with continued leverage of our successful jointventure model. Similar to our strategy in North America, we will also explore international acquisitionsthat strengthen our capabilities in areas such as hybrid services and industry-specific services.
The experience, depth and strength of local management are particularly important in ourinternational expansion and acquisition strategy. Since beginning our international expansion programin January 1999, we have, directly and through joint ventures, expanded our operations into more than35 countries in Europe, Latin America and Asia Pacific. These transactions have taken, and maycontinue to take, the form of acquisitions of an entire business or controlling or minority investments,with a long-term goal of full ownership. We believe our joint venture strategy, rather than an outrightacquisition, may, in certain markets, better position us to expand the existing business. The localpartner benefits from our expertise in the information management services industry, our multinationalcustomer relationships, our access to capital and our technology, and we benefit from our localpartners’ knowledge of the market, relationships with local customers and their presence in thecommunity. In addition to the criteria we use to evaluate North American acquisition candidates, whenlooking at an international investment or acquisition, we also evaluate the presence in the potentialmarket of our existing customers as well as the risks uniquely associated with an internationalinvestment, including those risks described below.
Our long-term goal is to acquire full ownership of each business in which we made a joint ventureinvestment. Since 2007, we acquired the remaining minority equity ownership in our Brazilian (2008),Greek (2010), Chinese (2010), Hong Kong (2010) and Singapore (2010) operations. In 2010, to betteralign our operations with our long-term international growth objectives, we divested our ownershipstakes in Indonesia and Sri Lanka. We now own more than 98% of our international operations,measured as a percentage of consolidated revenues.
13
Our international investments are subject to risks and uncertainties relating to the indigenouspolitical, social, regulatory, tax and economic structures of other countries, as well as fluctuations incurrency valuation, exchange controls, expropriation and governmental policies limiting returns toforeign investors.
The amount of our revenues derived from international operations and other relevant financialdata for fiscal years 2008, 2009 and 2010 are set forth in Note 9 to Notes to Consolidated FinancialStatements. For the years ended December 31, 2008, 2009 and 2010, we derived approximately 32%,30% and 31%, respectively, of our total revenues from outside of the U.S. As of December 31, 2008,2009 and 2010, we have long-lived assets of approximately 31%, 34% and 35%, respectively, outside ofthe U.S.
Acquisitions in the Worldwide Digital Segment
Our focus on technology innovation allows us to bring leading products and services to marketdesigned to solve customer problems in the areas of data protection, archiving and discovery. Ourapproach to innovation includes our internal development efforts, partnering with other technologycompanies and acquisition of new and existing technologies. We intend to build or develop our owntechnology in areas core to our strategy in order to protect and extend our position in the market.Examples include, backup and archiving Software as a Service and data reduction technologies. We aredeveloping global technology partnerships that complement our product and service offerings, allow usto offer a complete solution to the marketplace and keep us in contact with emerging technologycompanies. Our technology acquisition strategy is designed to accelerate our product strategy,leadership and time to market and past examples include the Connected (2004), LiveVault (2005),Stratify (2007) and Mimosa (2010) acquisitions. We expect our future technology acquisitions will be oftwo primary types, those that bring us new or improved technologies to enhance our existing technologyportfolio and those that increase our market position through technology and established revenuestreams.
Competition
We compete with our current and potential customers’ internal information management servicescapabilities. We can provide no assurance that these organizations will begin or continue to use anoutside company such as Iron Mountain for their future information management services.
We also compete with multiple information management service providers in all geographic areaswhere we operate. We believe that competition for customers is based on price, reputation forreliability, quality of service and scope and scale of technology and that we generally competeeffectively in each of these areas.
Alternative Technologies
We derive most of our revenues from the storage of paper documents and storage-related services.This storage requires significant physical space. Alternative storage technologies exist, many of whichrequire significantly less space than paper documents. These technologies include computer media,microform, CD-ROM and optical disk. To date, none of these technologies has replaced paperdocuments as the principal means for storing information. However, we can provide no assurance thatour customers will continue to store most of their records in paper documents format. We continue toinvest in additional services such as online backup and digital records management, designed to addressour customers’ need for efficient, cost-effective, high quality solutions for electronic records andinformation management.
14
Employees
As of December 31, 2010, we employed over 9,800 employees in the U.S. and over 9,600employees outside of the U.S. At December 31, 2010, an aggregate of 478 employees were representedby unions in California, Georgia and three provinces in Canada.
All non-union employees are generally eligible to participate in our benefit programs, whichinclude medical, dental, life, short and long-term disability, retirement/401(k) and accidental death anddismemberment plans. Unionized employees receive these types of benefits through their unions. Inaddition to base compensation and other usual benefits, all full-time employees participate in someform of incentive-based compensation program that provides payments based on revenues, profits,collections or attainment of specified objectives for the unit in which they work. Management believesthat we have good relationships with our employees and unions. All union employees are currentlyunder renewed labor agreements or operating under an extension agreement.
Insurance
For strategic risk transfer purposes, we maintain a comprehensive insurance program with insurersthat we believe to be reputable and that have adequate capitalization in amounts that we believe to beappropriate. Property insurance is purchased on a comprehensive basis, including flood and earthquake(including excess coverage), subject to certain policy conditions, sublimits and deductibles. Property isinsured based upon the replacement cost of real and personal property, including leaseholdimprovements, business income loss and extra expense. Among other types of insurance that we carry,subject to certain policy conditions, sublimits and deductibles are: medical, workers compensation,general liability, umbrella, automobile, professional, warehouse legal liability and directors and officersliability policies. In 2002, we established a wholly-owned Vermont domiciled captive insurance companyas a subsidiary through which we retain and reinsure a portion of our property loss exposure.
Our customer contracts usually contain provisions limiting our liability with respect to loss ordestruction of, or damage to, records stored with us. Our liability under these contracts is often limitedto a nominal fixed amount per item or unit of storage, such as per cubic foot. We cannot assure youthat where we have limitation of liability provisions that they will be enforceable in all instances orwould otherwise protect us from liability. Also, some of our contracts with large volume accounts andsome of the contracts assumed in our acquisitions contain no such limits or contain higher limits. Inaddition to provisions limiting our liability, our standard storage and service contracts include aschedule setting forth the majority of the customer-specific terms, including storage and service pricingand service delivery terms. Our customers may dispute the interpretation of various provisions in theircontracts. While we have had relatively few disputes with our customers with regard to the terms oftheir customer contracts, and any disputes to date have not been material, we can give you noassurance that we will not have material disputes in the future.
Environmental Matters
Some of our current and formerly owned or leased properties were previously used by entitiesother than us for industrial or other purposes that involved the use, storage, generation and/or disposalof hazardous substances and wastes, including petroleum products. In some instances these propertiesincluded the operation of underground storage tanks or the presence of asbestos-containing materials.Although we have from time to time conducted limited environmental investigations and remedialactivities at some of our former and current facilities, we have not undertaken an in-depthenvironmental review of all of our properties. We therefore may be liable for environmental costs andmay be unable to sell, rent, mortgage or use contaminated real estate owned or leased by us. Undervarious federal, state and local environmental laws, we may be liable for environmental compliance andremediation costs to address contamination, if any, located at owned and leased properties as well as
15

damages arising from such contamination, whether or not we know of, or were responsible for, thecontamination, or the contamination occurred while we owned or leased the property. Environmentalconditions for which we might be liable may also exist at properties that we may acquire in the future.In addition, future regulatory action and environmental laws may impose costs for environmentalcompliance that do not exist today.
We transfer a portion of our risk of financial loss due to currently undetected environmentalmatters by purchasing an environmental impairment liability insurance policy, which covers all ownedand leased locations. Coverage is provided for both liability and remediation costs.
Internet Website
Our Internet address is www.ironmountain.com. Under the ‘‘Investors’’ section on our Internetwebsite, we make available through a hyperlink to a third party website, free of charge, our AnnualReport on Form 10-K, our Quarterly Reports on Form 10-Q, our Current Reports on Form 8-K andamendments to those reports filed or furnished pursuant to Section 13(a) or 15(d) of the SecuritiesExchange Act of 1934 (the ‘‘Exchange Act’’) as soon as reasonably practicable after such forms arefiled with or furnished to the SEC. We are not including the information contained on or availablethrough our website as a part of, or incorporating such information by reference into, this AnnualReport on Form 10-K. Copies of our corporate governance guidelines, code of ethics and the chartersof our audit, compensation, and nominating and governance committees are available on the Investorssection of our website, www.ironmountain.com, under the heading ‘‘Corporate Governance.’’
Item 1A. Risk Factors.
Our businesses face many risks. If any of the events or circumstances described in the followingrisks actually occur, our businesses, financial condition or results of operations could suffer and thetrading price of our debt or equity securities could decline. Our investors and prospective investorsshould consider the following risks and the information contained under the heading ‘‘Cautionary NoteRegarding Forward-Looking Statements’’ before deciding to invest in our securities.
Operational Risks
Governmental and customer focus on data security could increase our costs of operations. We may not beable to fully offset these costs through increases in our rates. In addition, incidents in which we fail toprotect our customers’ information against security breaches could result in monetary damages against usand could otherwise damage our reputation, harm our businesses and adversely impact our results ofoperations.
In reaction to publicized incidents in which electronically stored information has been lost, illegallyaccessed or stolen, almost all states have adopted breach of data security statutes or regulations thatrequire notification to consumers if the security of their personal information, such as social securitynumbers, is breached. In addition, certain federal laws and regulations affecting financial institutions,health care providers and plans and others impose requirements regarding the privacy and security ofinformation maintained by those institutions as well as notification to persons whose personalinformation is accessed by an unauthorized third party. Some of these laws and regulations provide forcivil fines in certain circumstances. One state has adopted regulations requiring every company thatmaintains or stores personal information to adopt a comprehensive written information securityprogram. In some instances European data protection authorities have issued large fines as a result ofdata security breaches.
Continued governmental focus on data security may lead to additional legislative action. Forexample, the United States Congress is expected to consider legislation that would expand the federaldata breach notification requirement beyond the financial and medical fields. The continued emphasis
16
on information security may lead customers to request that we take additional measures to enhancesecurity and assume higher liability under our contracts. We have experienced incidents in whichcustomers’ backup tapes or other records have been lost, and we have been informed by customers insome incidents that the lost media or records contained personal information, resulting in monetarydamages which we have paid. As a result of legislative initiatives and client demands, we may have tomodify our operations with the goal of further improving data security. Any such modifications mayresult in increased expenses and operating complexity, and we may be unable to increase the rates wecharge for our services sufficiently to offset any increased expenses.
In addition to increases in the costs of operations or potential liability that may result from aheightened focus on data security, our reputation may be damaged by any compromise of security,accidental loss or theft of customer data in our possession. We believe that establishing and maintaininga good reputation is critical to attracting and retaining customers. If our reputation is damaged, wemay become less competitive, which could negatively impact our businesses, financial condition orresults of operations.
Our customer contracts may not always limit our liability and may sometimes contain terms that could leadto disputes in interpretation.
Our customer contracts usually contain provisions limiting our liability with respect to loss ordestruction of, or damage to, records or information stored with us. Our liability under physical storagecontracts is often limited to a nominal fixed amount per item or unit of storage, such as per cubic foot.Our liability under our digital, hybrid services and other service contracts is often limited to apercentage of annual revenue under the contract. We cannot assure you that where we have limitationof liability provisions they will be enforceable in all instances or would otherwise protect us fromliability. In addition to provisions limiting our liability, our standard storage and service contractsinclude a schedule setting forth the majority of the customer-specific terms, including storage andservice pricing and service delivery terms. Our customers may dispute the interpretation of variousprovisions in their contracts. While we have had relatively few disputes with our customers with regardto the terms of their customer contracts, and any disputes to date have not been material, we can giveyou no assurance that we will not have material disputes in the future.
We face competition for customers.
We compete, in some of our business lines, with our current and potential customers’ internalinformation management services capabilities. These organizations may not begin or continue to use athird party, such as our company, for their future information management services needs. We alsocompete, in both our physical and digital businesses, with multiple information management servicesproviders in all geographic areas where we operate; our current or potential customers may choose touse those competitors instead of us.
Our customers may shift from paper storage to alternative technologies that require less physical space.
We derive most of our revenues from the storage of paper documents and storage related services.This storage requires significant physical space, which we provide through our owned and leasedfacilities. Alternative storage technologies exist, many of which require significantly less space thanpaper documents. These technologies include computer media, microform, CD-ROM and optical disk.We can provide no assurance that our customers will continue to store most of their records in paperdocuments format. A significant shift by our customers to storage of data through non-paper basedtechnologies, whether now existing or developed in the future, could adversely affect our businesses.
17
Our customers may be constrained in their ability to pay for services or require fewer services.
Continued economic weakness in the markets where we operate may cause some customers topostpone projects for which they would otherwise retain our services and may, in some instances, causecustomers to forgo our services. Many of our largest customers are financial institutions that have beenparticularly affected by the economic downturn; their condition may lead them to reduce their use ofour services. In addition, a higher percentage of our customers may seek protection under bankruptcylaws, potentially affecting not only future business but also our ability to collect accounts receivable.
We may be subject to certain costs and potential liabilities associated with the real estate required for ourbusinesses.
Because our physical businesses are heavily dependent on real estate, we face special risksattributable to the real estate we own or lease. Such risks include:
• variable occupancy costs and difficulty locating suitable sites due to fluctuations in real estatemarkets;
• uninsured losses or damage to our storage facilities due to an inability to obtain full coverage ona cost-effective basis for some casualties, such as earthquakes, or any coverage for certain losses,such as losses from riots or terrorist activities;
• inability to use our real estate holdings effectively if the demand for physical storage were todiminish because of customers’ acceptance of other storage technologies; and
• liability under environmental laws for the costs of investigation and cleanup of contaminated realestate owned or leased by us, whether or not we know of, or were responsible for, thecontamination, or the contamination occurred while we owned or leased the property.
Some of our current and formerly owned or leased properties were previously used by entitiesother than us for industrial or other purposes that involved the use, storage, generation and/or disposalof hazardous substances and wastes, including petroleum products. In some instances these propertiesincluded the operation of underground storage tanks or the presence of asbestos-containing materials.Although we have from time to time conducted limited environmental investigations and remedialactivities at some of our former and current facilities, we have not undertaken an in-depthenvironmental review of all of our properties. We therefore may be potentially liable for environmentalcosts like those discussed above and may be unable to sell, rent, mortgage or use contaminated realestate owned or leased by us. Environmental conditions for which we might be liable may also exist atproperties that we may acquire in the future. In addition, future regulatory action and environmentallaws may impose costs for environmental compliance that do not exist today.
International operations may pose unique risks.
As of December 31, 2010, we provided services in more than 35 countries outside the U.S. As partof our growth strategy, we expect to continue to acquire or invest in information management servicesbusinesses in foreign markets. International operations are subject to numerous risks, including:
• the impact of foreign government regulations and U.S. regulations that apply to us wherever weoperate;
• the volatility of certain foreign economies in which we operate;
• political uncertainties;
• unforeseen liabilities, particularly within acquired businesses;
18

• the risk that the business partners upon whom we depend for technical assistance ormanagement and acquisition expertise outside of the U.S. will not perform as expected;
• differences in business practices; and
• foreign currency fluctuations.
In particular, our net income can be significantly affected by fluctuations in currencies associatedwith certain intercompany balances of our foreign subsidiaries to us and between our foreignsubsidiaries.
We may not be able to effectively operate and expand our digital businesses.
We operate certain digital information management businesses. Our participation in these marketsposes certain unique risks. For example, we may be unable to:
• keep up with rapid technological changes, evolving industry expectations and changing customerrequirements;
• compete effectively against other companies that possess greater technical expertise, capital orother necessary resources;
• successfully acquire and integrate businesses or technologies to complement our current serviceofferings;
• develop, hire or otherwise obtain the necessary technical expertise;
• accurately predict the size of the markets for any of these services; or
• raise the amount of capital necessary to effectively participate in these markets.
In addition, the digital solutions we offer may not gain or retain market acceptance, or businesspartners upon whom we depend for technical and management expertise and the hardware andsoftware products we need to complement our services, may not perform as expected.
We may be subject to claims that our technology, particularly with respect to digital services, violates theintellectual property rights of a third party.
Third parties may have legal rights (including ownership of patents, trade secrets, trademarks andcopyrights) to ideas, materials, processes, names or original works that are the same or similar to thosewe use, especially in our digital business. Third parties may bring claims, or threaten to bring claims,against us that allege that their intellectual property rights are being infringed or violated by our use ofintellectual property. Litigation or threatened litigation could be costly and distract our seniormanagement from operating our business. Further, if we cannot establish our right or obtain the rightto use the intellectual property on reasonable terms, we may be required to develop alternativeintellectual property at our expense to mitigate potential harm.
Changing fire and safety standards may result in significant expense in certain jurisdictions.
We operate 990 records management and offsite data protection facilities worldwide, including 587in the United States alone. Many of these facilities were built and outfitted by third parties and addedto Iron Mountain’s real estate portfolio as part of acquisitions completed between 1995 and 2005. Someof these facilities contain fire suppression and safety features that are different from our currentspecifications for new facilities, although we believe all of our facilities were constructed in compliancewith laws and regulations in effect at the time of their construction or outfitting. Where we believe thefire suppression and safety features of a facility require improvement, we will develop and implement aplan to remediate the issue. In some instances local authorities having jurisdiction may take the
19
position that our fire suppression and safety features in a particular facility are insufficient and requireadditional measures which may involve considerable expense to the company. If additional fire safetyand suppression measures were required at a large number of our facilities, this could negatively impactour business, financial condition or results of operations.
Fluctuations in commodity prices may affect our operating revenues and results of operations.
Our operating revenues and results of operations are impacted by significant changes incommodity prices. Our secure shredding operations generate revenue from the sale of shredded paperto recyclers. We generate additional revenue when the price of diesel fuel rises above certainpredetermined rates through a customer surcharge. As a result, significant declines in paper and dieselfuel prices may negatively impact our revenues and results of operations while increases in othercommodity prices, including steel, may negatively impact our results of operations.
Unexpected events could disrupt our operations and adversely affect our results of operations.
Unexpected events, including fires or explosions at our facilities, natural disasters such ashurricanes and earthquakes, war or terrorist activities, unplanned power outages, supply disruptions andfailure of equipment or systems, could adversely affect our results of operations. These events couldresult in customer disruption, physical damages to one or more key operating facilities, the temporaryclosure of one or more key operating facilities or the temporary disruption of information systems.
Attacks on our internal information technology systems could damage our reputation, harm our businessesand adversely impact our results of operations.
Our reputation for providing secure information storage to customers is critical to the success ofour business. We regularly face attempts by hackers and similar unauthorized users to gain access toour information technology systems. Although we seek to prevent, detect and investigate these securityincidents and have taken steps to prevent such security breaches, there can be no assurance that attacksby unauthorized users will not be attempted in the future or that our security measures will beeffective. A successful breach of the security of our information technology systems could lead to theftor misuse of our customers’ proprietary or confidential information and result in third party claimsagainst us and reputational harm. If our reputation is damaged, we may become less competitive, whichcould negatively impact our businesses, financial condition or results of operations.
Risks Relating to Our Common Stock
No Guaranty of Dividend Payments or Stock Repurchases
Although our board of directors approved a share repurchase program and adopted a dividendpolicy under which we intend to pay quarterly cash dividends on our common stock, any determinationsby us to repurchase our common stock or pay cash dividends on our common stock in the future willbe based primarily upon our financial condition, results of operations, business requirements, the priceof our common stock in the case of the repurchase program and our board of directors’ continuingdetermination that the repurchase program and the declaration of dividends under the dividend policyare in the best interests of our stockholders and are in compliance with all laws and agreementsapplicable to the repurchase and dividend programs. The terms of our credit agreement and ourindentures contain provisions permitting the payment of cash dividends and stock repurchases subjectto certain limitations.
20
Risks Relating to Our Indebtedness
Our substantial indebtedness could adversely affect our financial health and prevent us from fulfilling ourobligations under our various debt instruments.
We have a significant amount of indebtedness. The following table shows important credit statisticsas of December 31, 2010 (dollars in millions):
Total long-term debt . . . . . . . . . . . . . . . . . . . . . . . . . . . . . . . . . . . . . . . . . . . . . . . . . . . . . $3,009.5Total equity . . . . . . . . . . . . . . . . . . . . . . . . . . . . . . . . . . . . . . . . . . . . . . . . . . . . . . . . . . . $1,963.3Debt to equity ratio . . . . . . . . . . . . . . . . . . . . . . . . . . . . . . . . . . . . . . . . . . . . . . . . . . . . . 1.53X
Our substantial indebtedness could have important consequences to you. Our indebtedness mayincrease as we continue to borrow under existing and future credit arrangements in order to financefuture acquisitions and for general corporate purposes, which would increase the associated risks. Theserisks include:
• inability to satisfy our obligations with respect to our various debt instruments;
• inability to adjust to adverse economic conditions;
• inability to fund future working capital, capital expenditures, acquisitions and other generalcorporate requirements, including possible required repurchases of our various indebtedness;
• limits on our flexibility in planning for, or reacting to, changes in our business and theinformation management services industry;
• limits on future borrowings under our existing or future credit arrangements, which could affectour ability to pay our indebtedness or to fund our other liquidity needs;
• inability to generate sufficient funds to cover required interest payments; and
• restrictions on our ability to refinance our indebtedness on commercially reasonable terms.
Restrictive loan covenants may limit our ability to pursue our growth strategy.
Our credit facility and our indentures contain covenants restricting or limiting our ability to, amongother things:
• incur additional indebtedness;
• pay dividends or make other restricted payments;
• make asset dispositions;
• create or permit liens; and
• make capital expenditures and other investments.
These restrictions may adversely affect our ability to pursue our acquisition and other growthstrategies.
We may not have the ability to raise the funds necessary to finance the repurchase of outstanding seniorsubordinated indebtedness upon a change of control event as required by our indentures.
Upon the occurrence of a change of control, we will be required to offer to repurchase alloutstanding senior subordinated indebtedness. However, it is possible that we will not have sufficientfunds at the time of the change of control to make the required repurchase of the notes or thatrestrictions in our revolving credit facility will not allow such repurchases. In addition, certain important
21
corporate events, such as leveraged recapitalizations that would increase the level of our indebtedness,would not constitute a ‘‘change of control’’ under our indentures.
Since Iron Mountain is a holding company, our ability to make payments on our various debt obligationsdepends in part on the operations of our subsidiaries.
Iron Mountain is a holding company, and substantially all of our assets consist of the stock of oursubsidiaries and substantially all of our operations are conducted by our direct and indirect whollyowned subsidiaries. As a result, our ability to make payments on our various debt obligations will bedependent upon the receipt of sufficient funds from our subsidiaries. However, our various debtobligations are guaranteed, on a joint and several and full and unconditional basis, by most, but not all,of our direct and indirect wholly owned U.S. subsidiaries.
Acquisition and Expansion Risks
Failure to manage our growth may impact operating results.
If we succeed in expanding our existing businesses, or in moving into new areas of business, thatexpansion may place increased demands on our management, operating systems, internal controls andfinancial and physical resources. If not managed effectively, these increased demands may adverselyaffect the services we provide to existing customers. In addition, our personnel, systems, procedures andcontrols may be inadequate to support future operations. Consequently, in order to manage growtheffectively, we may be required to increase expenditures to increase our physical resources, expand,train and manage our employee base, improve management, financial and information systems andcontrols, or make other capital expenditures. Our results of operations and financial condition could beharmed if we encounter difficulties in effectively managing the budgeting, forecasting and other processcontrol issues presented by future growth.
Failure to successfully integrate acquired operations could negatively impact our future results of operations.
The success of any acquisition depends in part on our ability to integrate the acquired company.The process of integrating acquired businesses may involve unforeseen difficulties and may require adisproportionate amount of our management’s attention and our financial and other resources. We cangive no assurance that we will ultimately be able to effectively integrate and manage the operations ofany acquired business. Nor can we assure you that we will be able to maintain or improve the historicalfinancial performance of Iron Mountain or our acquisitions. The failure to successfully integrate thesecultures, operating systems, procedures and information technologies could have a material adverseeffect on our results of operations.
We may be unable to continue our international expansion.
Our growth strategy involves expanding operations in international markets, and we expect tocontinue this expansion. Europe, Latin America and Australia have been our primary areas of focus forinternational expansion, and we have begun our expansion into the Asia Pacific region. We haveentered into joint ventures and have acquired all or a majority of the equity in informationmanagement services businesses operating in these areas and may acquire other informationmanagement services businesses in the future.
This growth strategy involves risks. We may be unable to pursue this strategy in the future. Forexample, we may be unable to:
• identify suitable companies to acquire or invest in;
• complete acquisitions on satisfactory terms;
22
• incur additional debt necessary to acquire suitable companies if we are unable to pay thepurchase price out of working capital, common stock or other equity securities; or
• enter into successful business arrangements for technical assistance or management expertiseoutside of the U.S.
We also compete with other information management services providers for companies to acquire.Some of our competitors may possess substantial financial and other resources. If any such competitorwere to devote additional resources to pursue such acquisition candidates or focus its strategy on ourinternational markets, the purchase price for potential acquisitions or investments could rise,competition in international markets could increase and our results of operations could be adverselyaffected.
Item 1B. Unresolved Staff Comments.
None.
Item 2. Properties.
As of December 31, 2010, we conducted operations through 804 leased facilities and 238 facilitiesthat we own. Our facilities are divided among our reportable segments as follows: North AmericanPhysical Business (658), International Physical Business (363), Worldwide Digital Business (20) andCorporate (1). These facilities contain a total of 66 million square feet of space. Facility rent expensewas $224.7 million and $227.8 million for the years ended December 31, 2009 and 2010, respectively.The leased facilities typically have initial lease terms of five to ten years with one or more five yearoptions to extend. In addition, some of the leases contain either a purchase option or a right of firstrefusal upon the sale of the property. Our facilities are located throughout North America, Europe,Latin America and Asia Pacific, with the largest number of facilities in California, Florida, New York,New Jersey, Texas, Canada and the U.K. We believe that the space available in our facilities isadequate to meet our current needs, although future growth may require that we acquire additionalreal property either by leasing or purchasing. See Note 10 to Notes to Consolidated FinancialStatements for information regarding our minimum annual lease commitments.
Item 3. Legal Proceedings.
In September 2010, Iron Mountain do Brasil Ltda., our Brazilian operating subsidiary (‘‘IMB’’),was sued in Curitiba, Brazil in the 11th Lower Labor Claim Court. The plaintiff in the six relatedlawsuits, Sindicato dos Trabalhadores em Empresas de Servicos Contabeis, Assessoramento, Perıcias,Informacoes, Pesquisas, e em Empresas Prestadoras de Servicos do Estado do Parana (Union ofWorkers in Business Services Accounting, Advice, Expertise, Information, Research and ServicesCompanies in the State of Parana), a labor union in Brazil, purports to represent approximately 2,000individuals who provided services for IMB. The complaint alleges that these individuals were incorrectlyclassified as non-employees by IMB and seeks unspecified monetary damages, including attorneys’ fees,unpaid wages, unpaid benefits and certain penalties. The parties participated in a preliminary hearingin December 2010 and an additional hearing is scheduled to take place in May 2011, in which oralarguments will be presented. We intend to defend this case vigorously. While we are unable to predictthe final outcome of this matter at this time, we do not expect this lawsuit will have a material impacton our consolidated results of operations or financial condition.
In August 2010, we were named as a defendant in a patent infringement suit filed in the USDistrict Court for the Eastern District of Texas by Oasis Research, LLC. The plaintiff alleges that ourConnected backup technology infringes certain U.S. patents owned by the plaintiff and seeks damagesequal to 10% of our Connected revenue from 2005 through 2010, or approximately $26 million, andfuture royalties. In November 2010, we filed a motion to dismiss for misjoinder, or in the alternative, to
23

sever and transfer claims to the US District Court for the District of Massachusetts. In December 2010,Oasis Research LLC filed a response opposing our motions. The court has not ruled on anyoutstanding motions. A scheduling conference has been set for April 18, 2011. Although we are unableto predict the final outcome of this matter at this time, we believe we have meritorious defenses andintend to defend this case vigorously. We do not expect this lawsuit will have a material impact on ourconsolidated results of operations or financial condition.
In July 2006, we experienced a significant fire in a leased records and information managementfacility in London, England, that resulted in the complete destruction of the facility and its contents.The London Fire Brigade (‘‘LFB’’) issued a report in which it was concluded that the fire resultedeither from human agency, i.e., arson, or an unidentified ignition device or source, and its report to theHome Office concluded that the fire resulted from a deliberate act. The LFB also concluded that theinstalled sprinkler system failed to control the fire due to the primary electric fire pump being disabledprior to the fire and the standby diesel fire pump being disabled in the early stages of the fire by third-party contractors. We have received notices of claims from customers or their subrogated insurancecarriers under various theories of liability arising out of lost data and/or records as a result of the fire.Certain of those claims have resulted in litigation in courts in the United Kingdom. We deny anyliability in respect of the London fire and we have referred these claims to our excess warehouse legalliability insurer, which has been defending them to date under a reservation of rights. Certain of theclaims have been settled for nominal amounts, typically one to two British pounds sterling per carton,as specified in the contracts, which amounts have been or will be reimbursed to us from our primaryproperty insurer. We believe we carry adequate property and liability insurance. We do not expect thatlegal proceedings related to this event will have a material impact to our consolidated results ofoperations or financial condition.
General
In addition to the matters discussed above, we are involved in litigation from time to time in theordinary course of business with a portion of the defense and/or settlement costs being covered byvarious commercial liability insurance policies purchased by us. In the opinion of management, otherthan discussed above, no material legal proceedings are pending to which we, or any of our properties,are subject.
Item 4. [Removed and Reserved.]
24

PART II
Item 5. Market for Registrant’s Common Equity, Related Stockholder Matters and Issuer Purchases ofEquity Securities.
Our common stock is traded on the New York Stock Exchange, or the NYSE, under the symbol‘‘IRM.’’ The following table sets forth the high and low sale prices on the NYSE, for the years 2009and 2010:
Sale Prices
High Low
2009First Quarter . . . . . . . . . . . . . . . . . . . . . . . . . . . . . . . . . . . . . . . . . . . . . . . . . . . $25.66 $16.91Second Quarter . . . . . . . . . . . . . . . . . . . . . . . . . . . . . . . . . . . . . . . . . . . . . . . . . 31.27 21.52Third Quarter . . . . . . . . . . . . . . . . . . . . . . . . . . . . . . . . . . . . . . . . . . . . . . . . . . . 32.04 26.29Fourth Quarter . . . . . . . . . . . . . . . . . . . . . . . . . . . . . . . . . . . . . . . . . . . . . . . . . . 27.57 22.74
2010First Quarter . . . . . . . . . . . . . . . . . . . . . . . . . . . . . . . . . . . . . . . . . . . . . . . . . . . $27.76 $21.32Second Quarter . . . . . . . . . . . . . . . . . . . . . . . . . . . . . . . . . . . . . . . . . . . . . . . . . 28.49 22.44Third Quarter . . . . . . . . . . . . . . . . . . . . . . . . . . . . . . . . . . . . . . . . . . . . . . . . . . . 25.81 20.09Fourth Quarter . . . . . . . . . . . . . . . . . . . . . . . . . . . . . . . . . . . . . . . . . . . . . . . . . . 25.42 19.93
The closing price of our common stock on the NYSE on February 10, 2011 was $26.67. As ofFebruary 10, 2011, there were 607 holders of record of our common stock. We believe that there aremore than 80,000 beneficial owners of our common stock.
We did not pay dividends on our common stock during 2009, however, in February 2010, ourboard of directors adopted a dividend policy under which we began paying quarterly dividends on ourcommon stock. The first quarterly dividend of $0.0625 per share was paid on April 15, 2010 tostockholders of record on March 25, 2010 in the aggregate amount of $12.7 million. The secondquarterly dividend of $0.0625 per share was paid on July 15, 2010 to stockholders of record on June 25,2010 in the aggregate amount of $12.6 million. The third quarterly dividend of $0.0625 per share waspaid on October 15, 2010 to stockholders of record on September 28, 2010 in the aggregate amount of$12.5 million. The fourth quarterly dividend of $0.1875 per share was paid on January 14, 2011 tostockholders of record on December 27, 2010 in the aggregate amount of $37.5 million. Declarationand payment of future quarterly dividends is at the discretion of our board of directors. In February2010, our board of directors also approved a share repurchase program authorizing up to $150.0 millionin repurchases of our common stock, and in October 2010, our board of directors authorized up to anadditional $200.0 million of such purchases, for a total of $350.0 million. Any determinations by us torepurchase our common stock or pay cash dividends on our common stock in the future will be basedprimarily upon our financial condition, results of operations, business requirements, the price of ourcommon stock in the case of the repurchase program and our board of directors’ continuingdetermination that the repurchase program and the declaration of dividends under the dividend policyare in the best interests of our stockholders and are in compliance with all laws and agreementsapplicable to the repurchase and dividend programs. The terms of our credit agreement and ourindentures contain provisions permitting the payment of cash dividends and stock repurchases subjectto certain limitations.
25

Unregistered Sales of Equity Securities and Use of Proceeds
There were no sales of unregistered securities for the three months ended December 31, 2010.The following table sets forth our common stock repurchased for the three months endedDecember 31, 2010:
Issuer Purchases of EquitySecurities
Maximum Number(or Approximate
Total Number Dollar Value) ofof Shares Shares that May Yet
Purchased as Part Be Purchased UnderTotal Number of Publicly the Plans or
of Shares Average Price Announced Plans Programs(4)Period(1) Purchased(2) Paid per Share or Programs(3) (In Thousands)
October 1, 2010–October 31, 2010 . . . 444,480 $21.41 444,480 $245,900November 1, 2010–November 30, 2010 312,770 $22.39 312,770 $238,899December 1, 2010–December 31, 2010 16,139 $22.74 16,139 $238,532
Total . . . . . . . . . . . . . . . . . . . . . . . . 773,389 $21.83 773,389
(1) Information is based on trade dates of repurchase transactions.
(2) Consists of shares of our common stock, par value $.01 per share. All repurchases were madepursuant to an announced plan. All repurchases were made in open market transactions under theterms of a Rule 10b5-1 plan adopted by us.
(3) In February 2010, we announced that our board of directors had authorized a stock repurchaseprogram for up to $150.0 million of our common stock from time to time on the open market orin privately negotiated transactions. In October 2010, our board of directors authorized up to anadditional $200.0 million for our stock repurchase program, increasing our total authorizationsfrom $150.0 million to $350.0 million. The board of directors did not specify an expiration date forthis program.
(4) Dollar amounts represented reflect $350.0 million minus the total aggregate amount purchased insuch month and all prior months during which the repurchase program was in effect and excludecommissions paid in connection therewith.
26

Item 6. Selected Financial Data.
The following selected consolidated statements of operations, balance sheet and other data havebeen derived from our audited consolidated financial statements (see footnote (2) below). The selectedconsolidated financial and operating information set forth below, giving effect to stock splits, should beread in conjunction with ‘‘Item 7. Management’s Discussion and Analysis of Financial Condition andResults of Operations’’ and our Consolidated Financial Statements and the Notes thereto includedelsewhere in this filing.
Year Ended December 31,
2006 2007 2008 2009 2010(1)
(In thousands, except per share data)
Consolidated Statements ofOperations Data:
Revenues:Storage(2) . . . . . . . . . . . . . . . . . . $1,298,549 $1,470,269 $1,628,698 $1,667,642 $1,731,695Service(2) . . . . . . . . . . . . . . . . . . 1,051,793 1,259,766 1,426,436 1,345,953 1,395,854
Total Revenues . . . . . . . . . . . . . 2,350,342 2,730,035 3,055,134 3,013,595 3,127,549Operating Expenses:
Cost of sales (excludingdepreciation and amortization) . 1,074,268 1,260,120 1,382,019 1,271,214 1,254,198
Selling, general and administrative . 670,074 771,375 882,364 874,359 927,873Depreciation and amortization . . . 208,373 249,294 290,738 319,072 344,283Goodwill impairment(3) . . . . . . . . — — — — 283,785(Gain) Loss on disposal/writedown
of property, plant andequipment, net . . . . . . . . . . . . . (9,560) (5,472) 7,483 406 (6,143)
Total Operating Expenses . . . . . 1,943,155 2,275,317 2,562,604 2,465,051 2,803,996Operating Income . . . . . . . . . . . . . . 407,187 454,718 492,530 548,544 323,553Interest Expense, Net . . . . . . . . . . . 194,958 228,593 236,635 227,790 220,986Other (Income) Expense, Net . . . . . . (11,989) 3,101 31,028 (12,079) 1,772
Income Before Provision forIncome Taxes . . . . . . . . . . . . 224,218 223,024 224,867 332,833 100,795
Provision for Income Taxes . . . . . . . . 93,795 69,010 142,924 110,527 149,787
Net Income (Loss) . . . . . . . . . . . . . . 130,423 154,014 81,943 222,306 (48,992)Less: Net Income (Loss)
Attributable to NoncontrollingInterests . . . . . . . . . . . . . . . . 1,560 920 (94) 1,429 4,908
Net Income (Loss) Attributable toIron Mountain Incorporated . . . . . $ 128,863 $ 153,094 $ 82,037 $ 220,877 $ (53,900)
(footnotes follow)
27

Year Ended December 31,
2006 2007 2008 2009 2010(1)
(In thousands, except per share data)
Earnings (Losses) per Share—Basicand Diluted:
Net Income (Loss) Attributable toIron Mountain Incorporated perShare—Basic . . . . . . . . . . . . . . . . $ 0.65 $ 0.77 $ 0.41 $ 1.09 $ (0.27)
Net Income (Loss) Attributable toIron Mountain Incorporated perShare—Diluted . . . . . . . . . . . . . . $ 0.64 $ 0.76 $ 0.40 $ 1.08 $ (0.27)
Weighted Average Common SharesOutstanding—Basic . . . . . . . . . . . 198,116 199,938 201,279 202,812 201,991
Weighted Average Common SharesOutstanding—Diluted . . . . . . . . . . 200,463 202,062 203,290 204,271 201,991
Dividends Declared per CommonShare(4) . . . . . . . . . . . . . . . . . . . $ — $ — $ — $ — $ 0.375
Year Ended December 31,
2006 2007 2008 2009 2010(1)
(In thousands)
Other Data:Adjusted OIBDA(5) . . . . . . . . . . . . . . . . . . . . $606,000 $698,540 $790,751 $868,022 $945,478Adjusted OIBDA Margin(5) . . . . . . . . . . . . . . 25.8% 25.6% 25.9% 28.8% 30.2%Ratio of Earnings to Fixed Charges . . . . . . . . . 1.8 x 1.7 x 1.7 x 2.1x 1.3x
As of December 31,
2006 2007 2008 2009 2010(1)
(In thousands)
Consolidated Balance Sheet Data:Cash and Cash Equivalents . . . . . . . . $ 45,369 $ 125,607 $ 278,370 $ 446,656 $ 258,693Total Assets . . . . . . . . . . . . . . . . . . . . 5,209,521 6,307,921 6,356,854 6,846,834 6,395,799Total Long-Term Debt (including
Current Portion of Long-Term Debt) 2,668,816 3,266,288 3,243,215 3,251,784 3,009,455Total Equity . . . . . . . . . . . . . . . . . . . 1,570,788 1,816,769 1,818,553 2,157,471 1,963,262
(footnotes follow)
28
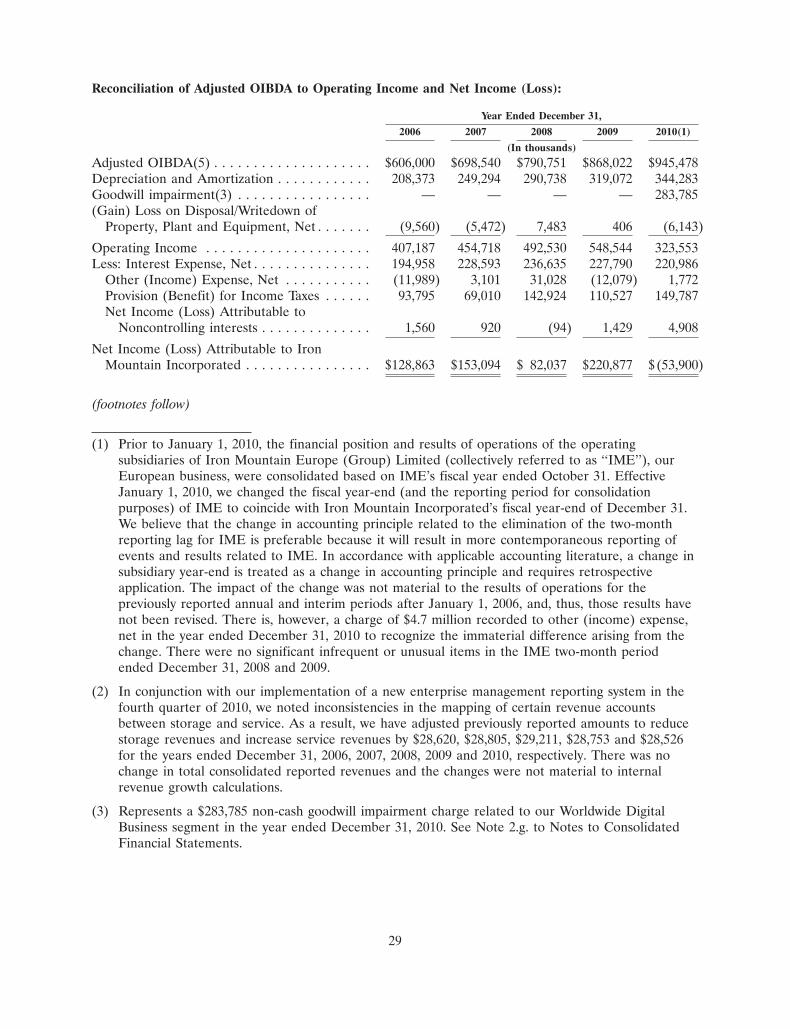
Reconciliation of Adjusted OIBDA to Operating Income and Net Income (Loss):
Year Ended December 31,
2006 2007 2008 2009 2010(1)
(In thousands)
Adjusted OIBDA(5) . . . . . . . . . . . . . . . . . . . . $606,000 $698,540 $790,751 $868,022 $945,478Depreciation and Amortization . . . . . . . . . . . . 208,373 249,294 290,738 319,072 344,283Goodwill impairment(3) . . . . . . . . . . . . . . . . . — — — — 283,785(Gain) Loss on Disposal/Writedown of
Property, Plant and Equipment, Net . . . . . . . (9,560) (5,472) 7,483 406 (6,143)
Operating Income . . . . . . . . . . . . . . . . . . . . . 407,187 454,718 492,530 548,544 323,553Less: Interest Expense, Net . . . . . . . . . . . . . . . 194,958 228,593 236,635 227,790 220,986
Other (Income) Expense, Net . . . . . . . . . . . (11,989) 3,101 31,028 (12,079) 1,772Provision (Benefit) for Income Taxes . . . . . . 93,795 69,010 142,924 110,527 149,787Net Income (Loss) Attributable to
Noncontrolling interests . . . . . . . . . . . . . . 1,560 920 (94) 1,429 4,908
Net Income (Loss) Attributable to IronMountain Incorporated . . . . . . . . . . . . . . . . $128,863 $153,094 $ 82,037 $220,877 $(53,900)
(footnotes follow)
(1) Prior to January 1, 2010, the financial position and results of operations of the operatingsubsidiaries of Iron Mountain Europe (Group) Limited (collectively referred to as ‘‘IME’’), ourEuropean business, were consolidated based on IME’s fiscal year ended October 31. EffectiveJanuary 1, 2010, we changed the fiscal year-end (and the reporting period for consolidationpurposes) of IME to coincide with Iron Mountain Incorporated’s fiscal year-end of December 31.We believe that the change in accounting principle related to the elimination of the two-monthreporting lag for IME is preferable because it will result in more contemporaneous reporting ofevents and results related to IME. In accordance with applicable accounting literature, a change insubsidiary year-end is treated as a change in accounting principle and requires retrospectiveapplication. The impact of the change was not material to the results of operations for thepreviously reported annual and interim periods after January 1, 2006, and, thus, those results havenot been revised. There is, however, a charge of $4.7 million recorded to other (income) expense,net in the year ended December 31, 2010 to recognize the immaterial difference arising from thechange. There were no significant infrequent or unusual items in the IME two-month periodended December 31, 2008 and 2009.
(2) In conjunction with our implementation of a new enterprise management reporting system in thefourth quarter of 2010, we noted inconsistencies in the mapping of certain revenue accountsbetween storage and service. As a result, we have adjusted previously reported amounts to reducestorage revenues and increase service revenues by $28,620, $28,805, $29,211, $28,753 and $28,526for the years ended December 31, 2006, 2007, 2008, 2009 and 2010, respectively. There was nochange in total consolidated reported revenues and the changes were not material to internalrevenue growth calculations.
(3) Represents a $283,785 non-cash goodwill impairment charge related to our Worldwide DigitalBusiness segment in the year ended December 31, 2010. See Note 2.g. to Notes to ConsolidatedFinancial Statements.
29

(4) In February 2010, our board of directors adopted a dividend policy under which we began payingquarterly dividends on our common stock. See ‘‘Item 5. Market for Registrant’s Common Equity,Related Stockholder Matters and Issuer Purchases of Equity Securities.’’
(5) Adjusted OIBDA is defined as operating income before depreciation, amortization, goodwillimpairment and (gain) loss on disposal/writedown of property, plant and equipment, net. AdjustedOIBDA Margin is calculated by dividing Adjusted OIBDA by total revenues. For a more detaileddefinition and reconciliation of Adjusted OIBDA and a discussion of why we believe thesemeasures provide relevant and useful information to our current and potential investors, see‘‘Item 7. Management’s Discussion and Analysis of Financial Condition and Results ofOperations—Non-GAAP Measures.’’
30

Item 7. Management’s Discussion and Analysis of Financial Condition and Results of Operations.
The following discussion should be read in conjunction with ‘‘Item 6. Selected Financial Data’’ and theConsolidated Financial Statements and Notes thereto and the other financial and operating informationincluded elsewhere in this filing.
This discussion contains ‘‘forward-looking statements,’’ as that term is defined in the PrivateSecurities Litigation Reform Act of 1995 and in other federal securities laws. See ‘‘Cautionary NoteRegarding Forward-Looking Statements’’ on page ii of this filing and ‘‘Item 1A. Risk Factors’’beginning on page 16 of this filing.
Overview
Our revenues consist of storage revenues as well as service revenues. Storage revenues, bothphysical and digital, which are considered a key performance indicator for the information managementservices industry, consist primarily of recurring periodic charges related to the storage of materials ordata (generally on a per unit basis), which are typically retained by customers for many years, and haveaccounted for over 53% of total consolidated revenues in each of the last five years. Our annualrevenues from these fixed periodic storage fees have grown for 22 consecutive years. Service revenuesare comprised of charges for related core service activities and a wide array of complementary productsand services. Included in core service revenues are: (1) the handling of records, including the additionof new records, temporary removal of records from storage, refiling of removed records, destruction ofrecords, and permanent withdrawals from storage; (2) courier operations, consisting primarily of thepickup and delivery of records upon customer request; (3) secure shredding of sensitive documents; and(4) other recurring services, including hybrid services, recurring project revenues and maintenance andsupport fees associated with software license sales. Our complementary services revenues includespecial project work, data restoration projects, fulfillment services, consulting services and product sales(including software licenses, specially designed storage containers and related supplies). Our secureshredding revenues include the sale of recycled paper (included in complementary services revenues),the price of which can fluctuate from period to period, adding to the volatility and reducing thepredictability of that revenue stream. Our consolidated revenues are also subject to variations caused bythe net effect of foreign currency translation on revenue derived from outside the U.S. For the yearsended December 31, 2008, 2009 and 2010, we derived approximately 32%, 30% and 31%, respectively,of our total revenues from outside the U.S. In conjunction with our implementation of a new enterprisemanagement reporting system in the fourth quarter of 2010, we noted inconsistencies in the mapping ofcertain revenue accounts between storage and service. As a result, we have adjusted previously reportedamounts to reduce storage revenues and increase service revenues by approximately $29.2 million,$28.8 million and $28.5 million for the years ending December 31, 2008, 2009, and 2010, respectively.There was no change in total consolidated reported revenues and the changes were not material tointernal revenue growth calculations.
We recognize revenue when the following criteria are met: persuasive evidence of an arrangementexists, services have been rendered, the sales price is fixed or determinable, and collectability of theresulting receivable is reasonably assured. Storage and service revenues are recognized in the monththe respective storage or service is provided and customers are generally billed on a monthly basis oncontractually agreed-upon terms. Amounts related to future storage or prepaid service contracts,including maintenance and support contracts, for customers where storage fees or services are billed inadvance are accounted for as deferred revenue and recognized ratably over the applicable storage orservice period or when the service is performed. Revenue from the sales of products, which is includedas a component of service revenues, is recognized when shipped to the customer and title has passed tothe customer. Revenues from the sales of products has historically not been significant. Revenues fromsales of software licenses are recognized at the time of product delivery to our customer or reseller,
31

and revenue from maintenance and support agreements are recognized ratably over the term of theagreement.
Cost of sales (excluding depreciation and amortization) consists primarily of wages and benefits forfield personnel, facility occupancy costs (including rent and utilities), transportation expenses (includingvehicle leases and fuel), other product cost of sales and other equipment costs and supplies. Of these,wages and benefits and facility occupancy costs are the most significant. Trends in total wages andbenefits dollars and as a percentage of total consolidated revenue are influenced by changes inheadcount and compensation levels, achievement of incentive compensation targets, workforceproductivity and variability in costs associated with medical insurance and workers compensation.Trends in facility occupancy costs are impacted by the total number of facilities we occupy, the mix ofproperties we own versus properties we occupy under operating leases, fluctuations in per square footoccupancy costs, and the levels of utilization of these properties. Due to the declining economicenvironment in 2008, the then current fair market values of vans, trucks and mobile shredding unitswithin our vehicle fleet portfolio, which we leased, declined. As a result, certain vehicle leases thatpreviously met the requirements to be considered operating leases were classified as capital leases uponrenewal, or at lease inception, for new leases. The impact of this change with respect to these leaseswas to lower vehicle rent expense (a component of transportation costs within cost of sales) byapproximately $22.4 million in 2009, offset by an increased amount of combined depreciation (byapproximately $20.2 million) and interest expense (by approximately $3.3 million) for the year endedDecember 31, 2009 as compared to the year ended December 31, 2008.
The expansion of our European, secure shredding and digital services businesses has impacted themajor cost of sales components. Our European operations are more labor intensive than our core U.S.physical businesses and, therefore, add incremental labor costs at a higher percentage of segmentrevenue than our North American core physical business. This trend is more than offset byimprovements in domestic labor costs as a percentage of North American revenues. Our secureshredding operations incur less facility costs and higher transportation costs as a percentage of revenuescompared to our core physical businesses and our digital services require significantly lower labor andfacility costs than our core physical businesses.
Selling, general and administrative expenses consist primarily of wages and benefits formanagement, administrative, information technology, sales, account management and marketingpersonnel, as well as expenses related to communications and data processing, travel, professional fees,bad debts, training, office equipment and supplies. Trends in total wage and benefit dollars as apercentage of total consolidated revenue are influenced by changes in headcount and compensationlevels, achievement of incentive compensation targets, workforce productivity and variability in costsassociated with medical insurance. The overhead structure of our expanding European and Asianoperations, as compared to our North American operations, is more labor intensive and has notachieved the same level of overhead leverage, which may result in an increase in selling, general andadministrative expenses, as a percentage of consolidated revenue, as our European and Asianoperations become a more meaningful percentage of our consolidated results. Similarly, our digitalservices businesses require a higher level of overhead, particularly in the area of informationtechnology, than our core physical businesses.
Our depreciation and amortization charges result primarily from the capital-intensive nature of ourbusiness. The principal components of depreciation relate to storage systems, which include racking,building and leasehold improvements, computer systems hardware and software, and buildings.Amortization relates primarily to customer relationship acquisition costs and core technology and isimpacted by the nature and timing of acquisitions.
During the quarter ended September 30, 2010, prior to our annual goodwill impairment review, weconcluded that events occurred and circumstances changed in the Worldwide Digital Business reporting
32
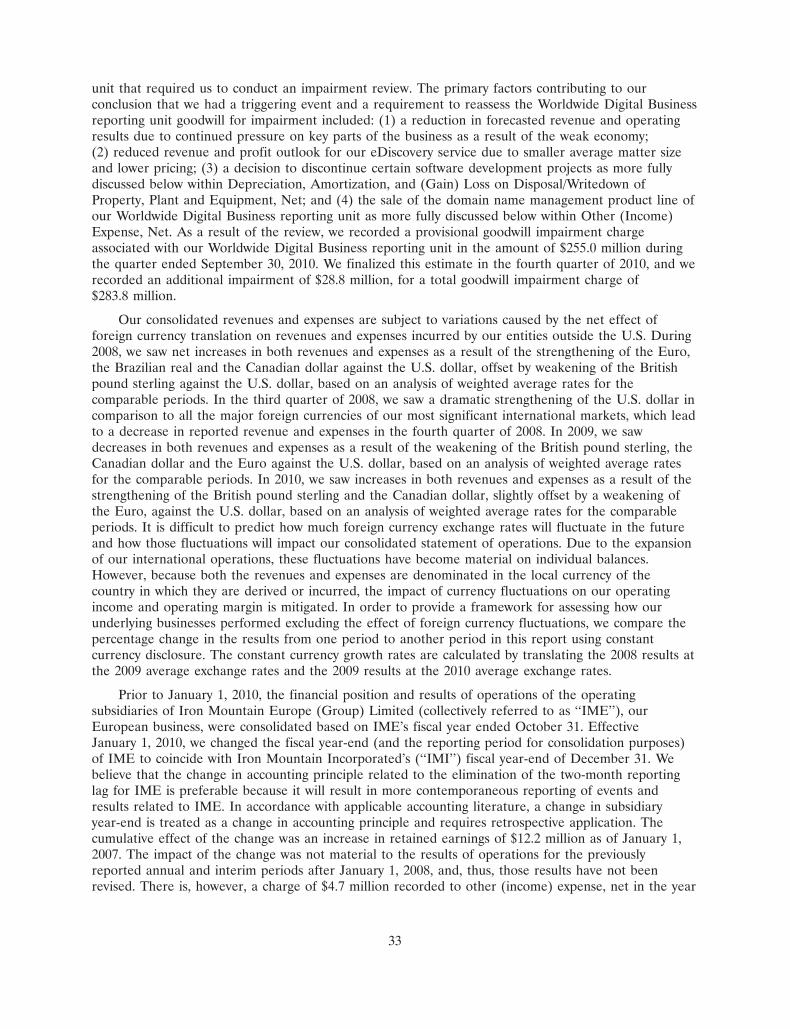
unit that required us to conduct an impairment review. The primary factors contributing to ourconclusion that we had a triggering event and a requirement to reassess the Worldwide Digital Businessreporting unit goodwill for impairment included: (1) a reduction in forecasted revenue and operatingresults due to continued pressure on key parts of the business as a result of the weak economy;(2) reduced revenue and profit outlook for our eDiscovery service due to smaller average matter sizeand lower pricing; (3) a decision to discontinue certain software development projects as more fullydiscussed below within Depreciation, Amortization, and (Gain) Loss on Disposal/Writedown ofProperty, Plant and Equipment, Net; and (4) the sale of the domain name management product line ofour Worldwide Digital Business reporting unit as more fully discussed below within Other (Income)Expense, Net. As a result of the review, we recorded a provisional goodwill impairment chargeassociated with our Worldwide Digital Business reporting unit in the amount of $255.0 million duringthe quarter ended September 30, 2010. We finalized this estimate in the fourth quarter of 2010, and werecorded an additional impairment of $28.8 million, for a total goodwill impairment charge of$283.8 million.
Our consolidated revenues and expenses are subject to variations caused by the net effect offoreign currency translation on revenues and expenses incurred by our entities outside the U.S. During2008, we saw net increases in both revenues and expenses as a result of the strengthening of the Euro,the Brazilian real and the Canadian dollar against the U.S. dollar, offset by weakening of the Britishpound sterling against the U.S. dollar, based on an analysis of weighted average rates for thecomparable periods. In the third quarter of 2008, we saw a dramatic strengthening of the U.S. dollar incomparison to all the major foreign currencies of our most significant international markets, which leadto a decrease in reported revenue and expenses in the fourth quarter of 2008. In 2009, we sawdecreases in both revenues and expenses as a result of the weakening of the British pound sterling, theCanadian dollar and the Euro against the U.S. dollar, based on an analysis of weighted average ratesfor the comparable periods. In 2010, we saw increases in both revenues and expenses as a result of thestrengthening of the British pound sterling and the Canadian dollar, slightly offset by a weakening ofthe Euro, against the U.S. dollar, based on an analysis of weighted average rates for the comparableperiods. It is difficult to predict how much foreign currency exchange rates will fluctuate in the futureand how those fluctuations will impact our consolidated statement of operations. Due to the expansionof our international operations, these fluctuations have become material on individual balances.However, because both the revenues and expenses are denominated in the local currency of thecountry in which they are derived or incurred, the impact of currency fluctuations on our operatingincome and operating margin is mitigated. In order to provide a framework for assessing how ourunderlying businesses performed excluding the effect of foreign currency fluctuations, we compare thepercentage change in the results from one period to another period in this report using constantcurrency disclosure. The constant currency growth rates are calculated by translating the 2008 results atthe 2009 average exchange rates and the 2009 results at the 2010 average exchange rates.
Prior to January 1, 2010, the financial position and results of operations of the operatingsubsidiaries of Iron Mountain Europe (Group) Limited (collectively referred to as ‘‘IME’’), ourEuropean business, were consolidated based on IME’s fiscal year ended October 31. EffectiveJanuary 1, 2010, we changed the fiscal year-end (and the reporting period for consolidation purposes)of IME to coincide with Iron Mountain Incorporated’s (‘‘IMI’’) fiscal year-end of December 31. Webelieve that the change in accounting principle related to the elimination of the two-month reportinglag for IME is preferable because it will result in more contemporaneous reporting of events andresults related to IME. In accordance with applicable accounting literature, a change in subsidiaryyear-end is treated as a change in accounting principle and requires retrospective application. Thecumulative effect of the change was an increase in retained earnings of $12.2 million as of January 1,2007. The impact of the change was not material to the results of operations for the previouslyreported annual and interim periods after January 1, 2008, and, thus, those results have not beenrevised. There is, however, a charge of $4.7 million recorded to other (income) expense, net in the year
33
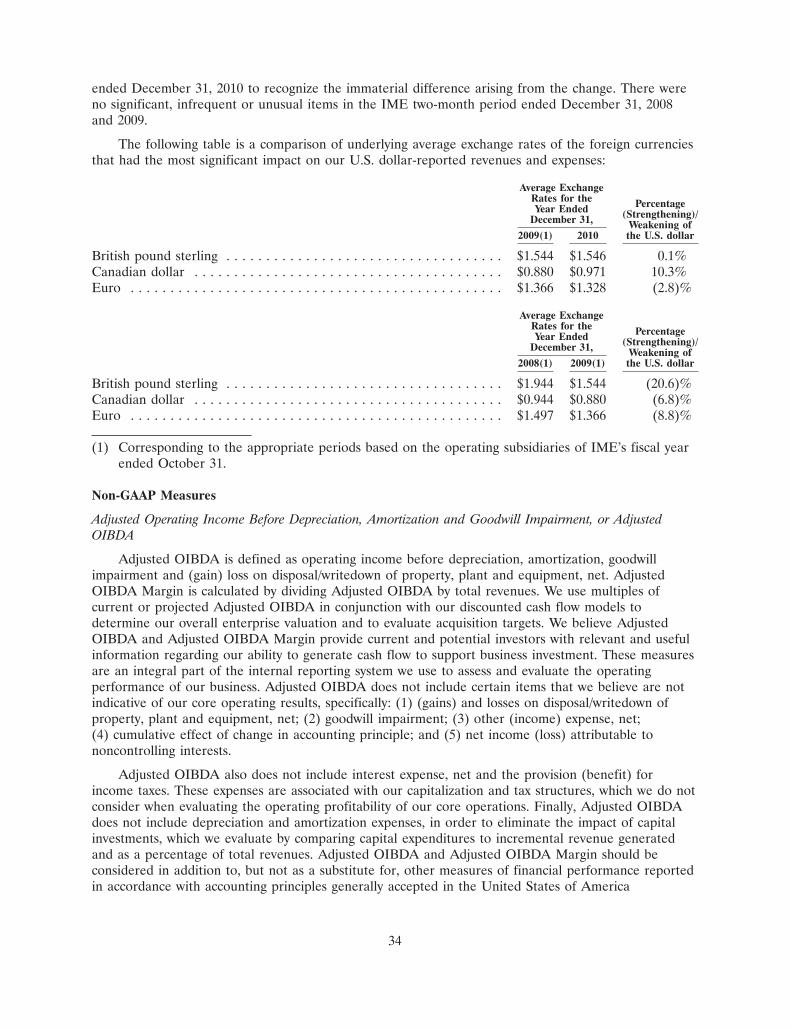
ended December 31, 2010 to recognize the immaterial difference arising from the change. There wereno significant, infrequent or unusual items in the IME two-month period ended December 31, 2008and 2009.
The following table is a comparison of underlying average exchange rates of the foreign currenciesthat had the most significant impact on our U.S. dollar-reported revenues and expenses:
Average ExchangeRates for the PercentageYear Ended (Strengthening)/December 31, Weakening of
2009(1) 2010 the U.S. dollar
British pound sterling . . . . . . . . . . . . . . . . . . . . . . . . . . . . . . . . . . . $1.544 $1.546 0.1%Canadian dollar . . . . . . . . . . . . . . . . . . . . . . . . . . . . . . . . . . . . . . . $0.880 $0.971 10.3%Euro . . . . . . . . . . . . . . . . . . . . . . . . . . . . . . . . . . . . . . . . . . . . . . . $1.366 $1.328 (2.8)%
Average ExchangeRates for the PercentageYear Ended (Strengthening)/December 31, Weakening of
2008(1) 2009(1) the U.S. dollar
British pound sterling . . . . . . . . . . . . . . . . . . . . . . . . . . . . . . . . . . . $1.944 $1.544 (20.6)%Canadian dollar . . . . . . . . . . . . . . . . . . . . . . . . . . . . . . . . . . . . . . . $0.944 $0.880 (6.8)%Euro . . . . . . . . . . . . . . . . . . . . . . . . . . . . . . . . . . . . . . . . . . . . . . . $1.497 $1.366 (8.8)%
(1) Corresponding to the appropriate periods based on the operating subsidiaries of IME’s fiscal yearended October 31.
Non-GAAP Measures
Adjusted Operating Income Before Depreciation, Amortization and Goodwill Impairment, or AdjustedOIBDA
Adjusted OIBDA is defined as operating income before depreciation, amortization, goodwillimpairment and (gain) loss on disposal/writedown of property, plant and equipment, net. AdjustedOIBDA Margin is calculated by dividing Adjusted OIBDA by total revenues. We use multiples ofcurrent or projected Adjusted OIBDA in conjunction with our discounted cash flow models todetermine our overall enterprise valuation and to evaluate acquisition targets. We believe AdjustedOIBDA and Adjusted OIBDA Margin provide current and potential investors with relevant and usefulinformation regarding our ability to generate cash flow to support business investment. These measuresare an integral part of the internal reporting system we use to assess and evaluate the operatingperformance of our business. Adjusted OIBDA does not include certain items that we believe are notindicative of our core operating results, specifically: (1) (gains) and losses on disposal/writedown ofproperty, plant and equipment, net; (2) goodwill impairment; (3) other (income) expense, net;(4) cumulative effect of change in accounting principle; and (5) net income (loss) attributable tononcontrolling interests.
Adjusted OIBDA also does not include interest expense, net and the provision (benefit) forincome taxes. These expenses are associated with our capitalization and tax structures, which we do notconsider when evaluating the operating profitability of our core operations. Finally, Adjusted OIBDAdoes not include depreciation and amortization expenses, in order to eliminate the impact of capitalinvestments, which we evaluate by comparing capital expenditures to incremental revenue generatedand as a percentage of total revenues. Adjusted OIBDA and Adjusted OIBDA Margin should beconsidered in addition to, but not as a substitute for, other measures of financial performance reportedin accordance with accounting principles generally accepted in the United States of America
34

(‘‘GAAP’’), such as operating or net income (loss) or cash flows from operating activities (asdetermined in accordance with GAAP).
Reconciliation of Adjusted OIBDA to Operating Income and Net Income (Loss) (in thousands):
Year Ended December 31,
2006 2007 2008 2009 2010
Adjusted OIBDA . . . . . . . . . . . . . . . . . . . . . . $606,000 $698,540 $790,751 $868,022 $945,478Less: Depreciation and Amortization . . . . . . . . 208,373 249,294 290,738 319,072 344,283
Goodwill impairment . . . . . . . . . . . . . . . . . — — — — 283,785(Gain) Loss on Disposal/Writedown of
Property, Plant and Equipment, Net . . . . . (9,560) (5,472) 7,483 406 (6,143)
Operating Income . . . . . . . . . . . . . . . . . . . . . 407,187 454,718 492,530 548,544 323,553Less: Interest Expense, Net . . . . . . . . . . . . . . . 194,958 228,593 236,635 227,790 220,986
Other (Income) Expense, Net . . . . . . . . . (11,989) 3,101 31,028 (12,079) 1,772Provision (Benefit) for Income Taxes . . . . 93,795 69,010 142,924 110,527 149,787Net Income (Loss) Attributable to
Noncontrolling interests . . . . . . . . . . . . 1,560 920 (94) 1,429 4,908
Net Income (Loss) Attributable to IronMountain Incorporated . . . . . . . . . . . . . . . . $128,863 $153,094 $ 82,037 $220,877 $(53,900)
Free Cash Flows before Acquisitions and Discretionary Investments, or FCF
FCF is defined as Cash Flows from Operating Activities less capital expenditures (excluding realestate), net of proceeds from the sales of property and equipment and other, net, and additions tocustomer acquisition cost. Our management uses this measure when evaluating the operatingperformance and profitability of our consolidated business. FCF is a useful measure in determining ourability to generate excess cash flows for reinvestment in the business, for discretionary deployment ininvestments such as real estate or acquisition opportunities, the potential returning of capital toshareholders or the repayment of indebtedness. As such, we believe this measure provides relevant anduseful information to our current and potential investors.
FCF reconciled to Cash Flows from Operating Activities (in thousands):
Year Ended December 31,
2006 2007 2008 2009 2010
Free Cash Flows before Acquisitions andDiscretionary Investments . . . . . . . . . . . . . $ 47,469 $ 147,571 $ 181,535 $ 335,633 $ 373,385Add: Capital Expenditures (excluding real
estate), net(1) . . . . . . . . . . . . . . . . . . . . 312,562 320,670 341,312 270,519 238,514Additions to Customer Acquisitions Costs 14,251 16,403 14,182 10,759 13,241
Cash Flows From Operating Activities . . . . . . $ 374,282 $ 484,644 $ 537,029 $ 616,911 $ 625,140
Cash Flows from Investing Activities . . . . . . . $(446,714) $(866,635) $(459,594) $(324,066) $(432,670)
Cash Flows from Financing Activities . . . . . . . $ 82,734 $ 457,005 $ 87,368 $(129,692) $(381,234)
(1) The 2010 results include approximately $11,000 incurred by IME in November and December 2009prior to the change in its fiscal year end.
35

Adjusted Earnings per Share (‘‘EPS’’)
Adjusted EPS is defined as reported earnings per share excluding: (a) gains and losses on thedisposal/write down of property, plant and equipment, net; (b) goodwill impairment charges; (c) other(income) expense, net; (d) the tax impact of reconciling items and discrete tax items; and (e) netincome (loss) attributable to noncontrolling interests. We do not believe these excluded items to beindicative of our ongoing operating results and they are not considered when we are forecasting ourfuture results. We believe Adjusted EPS is of value to investors when comparing our results from past,present and future periods.
Adjusted EPS—Fully Diluted reconciled to Reported EPS Fully Diluted:
Year Ended December 31,
2006 2007 2008 2009 2010
Adjusted EPS—Fully Diluted . . . . . . . . . . . . . . . . . . . . . . . $ 0.60 $ 0.69 $0.80 $ 0.98 $ 1.15Less: (Gain) Loss on disposal/writedown of
property, plant and equipment, net . . . . . . . . . . . . . . (0.05) (0.03) 0.04 — (0.03)Goodwill Impairment . . . . . . . . . . . . . . . . . . . . . . . . . . — — — — 1.40Other (Income) Expense, net . . . . . . . . . . . . . . . . . . . . (0.06) 0.02 0.15 (0.06) 0.01Tax impact of reconciling items and discrete tax items . . 0.06 (0.06) 0.21 (0.05) 0.02Noncontrolling Interests . . . . . . . . . . . . . . . . . . . . . . . . 0.01 0.00 — 0.01 0.02
Reported EPS—Fully Diluted . . . . . . . . . . . . . . . . . . . . . . . $ 0.64 $ 0.76 $0.40 $ 1.08 $(0.27)
Critical Accounting Policies
Our discussion and analysis of our financial condition and results of operations are based upon ourconsolidated financial statements, which have been prepared in accordance with GAAP. Thepreparation of these financial statements requires us to make estimates, judgments and assumptionsthat affect the reported amounts of assets, liabilities, revenues and expenses, and related disclosure ofcontingent assets and liabilities at the date of the financial statements and for the period then ended.On an on-going basis, we evaluate the estimates used. We base our estimates on historical experience,actuarial estimates, current conditions and various other assumptions that we believe to be reasonableunder the circumstances. These estimates form the basis for making judgments about the carryingvalues of assets and liabilities and are not readily apparent from other sources. Actual results maydiffer from these estimates. Our critical accounting policies include the following, which are listed in noparticular order:
Revenue Recognition
Our revenues consist of storage revenues as well as service revenues and are reflected net of salesand value added taxes. Storage revenues, both physical and digital, which are considered a keyperformance indicator for the information management services industry, consist primarily of recurringperiodic charges related to the storage of materials or data (generally on a per unit basis). Servicerevenues are comprised of charges for related core service activities and a wide array of complementaryproducts and services. Included in core service revenues are: (1) the handling of records, includingaddition of new records, temporary removal of records from storage, refilling of removed records,destruction of records, and permanent withdrawals from storage; (2) courier operations, consistingprimarily of the pickup and delivery of records upon customer request; (3) secure shredding of sensitivedocuments; and (4) other recurring services, including hybrid services, recurring project revenues andmaintenance and support fees associated with software license sales. Our complementary servicesrevenues include special project work, data restoration projects, fulfillment services, consulting services
36

and product sales (including software licenses, specially designed storage containers and relatedsupplies). Our secure shredding revenues include the sale of recycled paper (included incomplementary services revenues), the price of which can fluctuate from period to period, adding tothe volatility and reducing the predictability of that revenue stream.
We recognize revenue when the following criteria are met: persuasive evidence of an arrangementexists, services have been rendered, the sales price is fixed or determinable, and collectability of theresulting receivable is reasonably assured. Storage and service revenues are recognized in the monththe respective storage or service is provided and customers are generally billed on a monthly basis oncontractually agreed-upon terms. Amounts related to future storage or prepaid service contracts,including maintenance and support contracts, for customers where storage fees or services are billed inadvance are accounted for as deferred revenue and recognized ratably over the applicable storage orservice period or when the service is performed. Revenue from the sales of products, which is includedas a component of service revenues, is recognized when shipped to the customer and title has passed tothe customer. Revenues from the sales of products has historically not been significant. Revenues fromsales of software licenses are recognized at the time of product delivery to our customer or reseller,and revenue from maintenance and support agreements are recognized ratably over the term of theagreement. Revenues from software license sales and maintenance and support accounted for less than1% of our annual 2010 consolidated revenues. Within our Worldwide Digital Business segment, incertain instances, we process and host data for customers. In these instances, the processing fees aredeferred and recognized over the estimated service period.
Accounting for Acquisitions
Part of our growth strategy has included the acquisition of numerous businesses. The purchaseprice of these acquisitions has been determined after due diligence of the acquired business, marketresearch, strategic planning, and the forecasting of expected future results and synergies. Estimatedfuture results and expected synergies are subject to revisions as we integrate each acquisition andattempt to leverage resources.
Each acquisition has been accounted for using the purchase method of accounting as definedunder the applicable accounting standards at the date of each acquisition. Accounting for theseacquisitions has resulted in the capitalization of the cost in excess of fair value of the net assetsacquired in each of these acquisitions as goodwill. We estimated the fair values of the assets acquiredin each acquisition as of the date of acquisition and these estimates are subject to adjustment. Theseestimates are subject to final assessments of the fair value of property, plant and equipment, intangibleassets, operating leases and deferred income taxes. We complete these assessments within one year ofthe date of acquisition. See Note 6 to Notes to Consolidated Financial Statements.
Allowance for Doubtful Accounts and Credit Memos
We maintain an allowance for doubtful accounts and credit memos for estimated losses resultingfrom the potential inability of our customers to make required payments and disputes regarding billingand service issues. When calculating the allowance, we consider our past loss experience, current andprior trends in our aged receivables and credit memo activity, current economic conditions, and specificcircumstances of individual receivable balances. If the financial condition of our customers were tosignificantly change, resulting in a significant improvement or impairment of their ability to makepayments, an adjustment of the allowance may be required. We consider accounts receivable to bedelinquent after such time as reasonable means of collection have been exhausted. We charge-offuncollectible balances as circumstances warrant, generally no later than one year past due. As ofDecember 31, 2009 and 2010, our allowance for doubtful accounts and credit memos balance totaled$25.5 million and $25.9 million, respectively.
37

Impairment of Tangible and Intangible Assets
Assets subject to amortization—We review long-lived assets and all amortizable intangible assetsfor impairment whenever events or changes in circumstances indicate the carrying amount of suchassets may not be recoverable. Recoverability of these assets is determined by comparing the forecastedundiscounted net cash flows of the operation to which the assets relate to their carrying amount. Theoperations are generally distinguished by the business segment and geographic region in which theyoperate. If the operation is determined to be unable to recover the carrying amount of its assets, thenintangible assets are written down first, followed by the other long-lived assets of the operation, to fairvalue. Fair value is based on discounted cash flows or appraised values, depending upon the nature ofthe assets.
Goodwill—Assets not subject to amortization: Goodwill and intangible assets with indefinite livesare not amortized but are reviewed annually for impairment or more frequently if impairmentindicators arise. We have selected October 1 as our annual goodwill impairment review date. Weperformed our annual goodwill impairment review as of October 1, 2008 and 2009 and noted noimpairment of goodwill. In making this assessment, we relied on a number of factors includingoperating results, business plans, anticipated future cash flows, transactions and market place data.There are inherent uncertainties related to these factors and our judgment in applying them to theanalysis of goodwill impairment. During the quarter ended September 30, 2010, prior to our annualgoodwill impairment review, we concluded that events occurred and circumstances changed in theWorldwide Digital Business reporting unit that required us to conduct an impairment review. Theprimary factors contributing to our conclusion that we had a triggering event and a requirement toreassess the Worldwide Digital Business reporting unit goodwill for impairment included: (1) areduction in forecasted revenue and operating results due to continued pressure on key parts of thebusiness as a result of the weak economy; (2) reduced revenue and profit outlook for our eDiscoveryservice due to smaller average matter size and lower pricing; (3) a decision to discontinue certainsoftware development projects as is more fully discussed below within Depreciation, Amortization, and(Gain) Loss on Disposal/Writedown of Property, Plant and Equipment, Net and; (4) the sale of thedomain name management product line of our Worldwide Digital Business reporting unit as is morefully discussed below within Other (Income) Expense, Net. As a result of the review, we recorded aprovisional goodwill impairment charge associated with our Worldwide Digital Business reporting unitin the amount of $255.0 million during the quarter ended September 30, 2010. We finalized thisestimate in the fourth quarter of 2010, and we recorded an additional impairment of $28.8 million, fora total goodwill impairment charge of $283.8 million.
We performed our most recent annual goodwill impairment review as of October 1, 2010 andnoted no additional impairment of goodwill. As of December 31, 2010, no factors were identified thatwould alter our October 1, 2010 goodwill assessment. In making this assessment, we relied on a numberof factors including operating results, business plans, anticipated future cash flows, transactions andmarket place data. There are inherent uncertainties related to these factors and our judgment inapplying them to the analysis of goodwill impairment.
Our reporting units at which level we performed our goodwill impairment analysis as of October 1,2010 were as follows: North America; Europe; Latin America; Australia/New Zealand; WorldwideDigital; Joint Ventures (includes India, the various joint ventures in Southeast Asia and Russia, referredto as the ‘‘Joint Ventures’’) and Business Process Management (‘‘BPM’’). Given their similar economiccharacteristics, products, customers and processes, (1) the United Kingdom, Ireland and Norway and(2) the countries of Continental Europe (excluding joint ventures), each a reporting unit, have beenaggregated as Europe and tested as one for goodwill impairment. As of December 31, 2010, thecarrying value of goodwill, net amounted to $1,735.0 million, $440.9 million, $29.8 million and$67.1 million for North America, Europe, Latin America and Australia/New Zealand, respectively. OurJoint Ventures and BPM reporting units have no goodwill as of December 31, 2010. Our Worldwide
38

Digital reporting unit goodwill was written down to $51.1 million as of December 31, 2010 as a resultof the charges previously discussed above. Our North America, Europe, Latin America, Australia/NewZealand and Worldwide Digital reporting units have estimated fair values as of October 1, 2010 thatexceed their carrying value by greater than 20%.
Reporting unit valuations have been calculated using an income approach based on the presentvalue of future cash flows of each reporting unit or a combined approach based on the present value offuture cash flows and market and transaction multiples of revenues and earnings. The income approachincorporates many assumptions including future growth rates, discount factors, expected capitalexpenditures and income tax cash flows. Changes in economic and operating conditions impacting theseassumptions could result in goodwill impairments in future periods. In conjunction with our annualgoodwill impairment reviews, we reconcile the sum of the valuations of all of our reporting units to ourmarket capitalization as of such dates.
Accounting for Internal Use Software
We develop various software applications for internal use. Computer software costs associated withinternal use software are expensed as incurred until certain capitalization criteria are met. Payroll andrelated costs for employees who are directly associated with, and who devote time to, the developmentof internal use computer software projects (to the extent time is spent directly on the project) arecapitalized and depreciated over the estimated useful life of the software. Capitalization begins whenthe design stage of the application has been completed and it is probable that the application will becompleted and used to perform the function intended. Depreciation begins when the software is placedin service. Computer software costs that are capitalized are periodically evaluated for impairment.
It may be necessary for us to write-off amounts associated with the development of internal usesoftware if the project cannot be completed as intended. Our expansion into new technology-basedservice offerings requires the development of internal use software that will be susceptible to rapid andsignificant changes in technology. We may be required to write-off unamortized costs or shorten theestimated useful life if an internal use software program is replaced with an alternative tool prior to theend of the software’s estimated useful life. General uncertainties related to expansion into digitalbusinesses, including the timing of introduction and market acceptance of our services, may adverselyimpact the recoverability of these assets. As of December 31, 2009 and 2010, capitalized labor net ofaccumulated depreciation was $41.4 million and $35.3 million, respectively. See Note 2(f) to Notes toConsolidated Financial Statements.
During the years ended December 31, 2008, 2009 and 2010, we wrote-off $0.6 million (primarily inCorporate), $0.6 million (primarily in Corporate) and $4.9 million (primarily in the Worldwide DigitalBusiness segment), respectively, of previously deferred software costs, primarily internal labor costs,associated with internal use software development projects that were discontinued afterimplementation, which resulted in a loss on disposal/writedown of property, plant and equipment, net.
Income Taxes
We have recorded a valuation allowance, amounting to $79.9 million as of December 31, 2010, toreduce our deferred tax assets, primarily associated with certain state and foreign net operating losscarryforwards and foreign tax credit carryforwards, to the amount that is more likely than not to berealized. We have federal net operating loss carryforwards which begin to expire in 2020 through 2029of $84.3 million ($29.5 million, tax effected) at December 31, 2010 to reduce future federal taxableincome. We have an asset for state net operating losses of $15.6 million (net of federal tax benefit),which begins to expire in 2011 through 2029, subject to a valuation allowance of approximately 75%.We have assets for foreign net operating losses of $38.1 million, with various expiration dates, subjectto a valuation allowance of approximately 74%. Additionally, we have federal research credits of
39

$2.2 million which begin to expire in 2022 through 2029 and state research credits of $1.1 million (netof federal tax benefit) which have no expiration date, subject to a valuation allowance of approximately19%. We also have foreign tax credits of $60.8 million, which begin to expire in 2014 through 2019,subject to a valuation allowance of approximately 65%. U.S. legislative changes in 2010 reduced theexpected utilization of foreign tax credits which resulted in the requirement for a valuation allowance.If actual results differ unfavorably from certain of our estimates used, we may not be able to realize allor part of our net deferred income tax assets and foreign tax credit carryforwards and additionalvaluation allowances may be required. Although we believe our estimates are reasonable, no assurancecan be given that our estimates reflected in the tax provisions and accruals will equal our actual results.These differences could have a material impact on our income tax provision and operating results inthe period in which such determination is made.
The evaluation of an uncertain tax position is a two-step process. The first step is a recognitionprocess whereby the company determines whether it is more likely than not that a tax position will besustained upon examination, including resolution of any related appeals or litigation processes, basedon the technical merits of the position. The second step is a measurement process whereby a taxposition that meets the more likely than not recognition threshold is calculated to determine theamount of benefit to recognize in the financial statements. The tax position is measured at the largestamount of benefit that is greater than 50% likely of being realized upon ultimate settlement.
We are subject to examination by various tax authorities in jurisdictions in which we havesignificant business operations. We regularly assess the likelihood of additional assessments by taxauthorities and provide for these matters as appropriate. As of December 31, 2009 and 2010, we hadapproximately $88.2 million and $59.9 million, respectively, of reserves related to uncertain taxpositions. The reversal of these reserves will be recorded as a reduction of our income tax provision ifsustained. Although we believe our tax estimates are appropriate, the final determination of tax auditsand any related litigation could result in favorable or unfavorable changes in our estimates.
We are currently under audit by the state of Massachusetts for the 2004 through 2008 tax years.We have not received any assessments to date. However, we may receive a notice of intention to assessin the range of zero to approximately $12.0 million, including interest and penalties. While we areunable to predict the final outcome of the audit at this time, it may result in an assessment of excisetax, which is a component of the income tax provision, or an assessment of net worth tax, which is anoperating charge. We intend to defend this case vigorously. We do not expect this audit to have amaterial impact on our consolidated results of operations or financial condition.
We have elected to recognize interest and penalties associated with uncertain tax positions as acomponent of the provision (benefit) for income taxes in the accompanying consolidated statements ofoperations. We recorded $4.5 million, $4.7 million and $(1.6) million for gross interest and penalties forthe years ended December 31, 2008, 2009 and 2010, respectively.
We had $12.9 million and $11.6 million accrued for the payment of interest and penalties as ofDecember 31, 2009 and 2010, respectively.
We have not provided deferred taxes on book basis differences related to certain foreignsubsidiaries because such basis differences are not expected to reverse in the foreseeable future and weintend to reinvest indefinitely outside the U.S. These basis differences arose primarily through theundistributed book earnings of our foreign subsidiaries. The basis differences could be reversed througha sale of the subsidiaries, the receipt of dividends from subsidiaries and certain other events or actionson our part, which would result in an increase in our provision for income taxes. It is not practicable tocalculate the amount of such basis differences.
40

Stock-Based Compensation
We record stock-based compensation expense, utilizing the straight-line method, for the cost ofstock options, restricted stock, restricted stock units and shares issued under the employee stockpurchase plan. Stock-based compensation expense, included in the accompanying consolidatedstatements of operations, for the years ended December 31, 2008, 2009 and 2010 was $19.0 million($15.7 million after tax or $0.08 per basic and diluted share), $18.7 million ($14.7 million after tax or$0.07 per basic and diluted shares) and $20.4 million ($15.7 million after tax or $0.08 per basic anddiluted shares), respectively.
The fair values of option grants are estimated on the date of grant using the Black-Scholes optionpricing model. Expected volatility and the expected term are the input factors to that model whichrequire the most significant management judgment. Expected volatility is calculated utilizing dailyhistorical volatility over a period that equates to the expected life of the option. The expected life(estimated period of time outstanding) of stock options granted is estimated using the historicalexercise behavior of employees.
Self-Insured Liabilities
We are self-insured up to certain limits for costs associated with workers’ compensation claims,vehicle accidents, property and general business liabilities, and benefits paid under employee healthcareand short-term disability programs. At December 31, 2009 and 2010 there were approximately$41.1 million and $43.9 million, respectively, of self-insurance accruals reflected in our consolidatedbalance sheets. The measurement of these costs requires the consideration of historical cost experienceand judgments about the present and expected levels of cost per claim. We account for these costsprimarily through actuarial methods, which develop estimates of the undiscounted liability for claimsincurred, including those claims incurred but not reported. These methods provide estimates of futureultimate claim costs based on claims incurred as of the balance sheet date.
We believe the use of actuarial methods to account for these liabilities provides a consistent andeffective way to measure these highly judgmental accruals. However, the use of any estimationtechnique in this area is inherently sensitive given the magnitude of claims involved and the length oftime until the ultimate cost is known. We believe our recorded obligations for these expenses areappropriate. Nevertheless, changes in healthcare costs, severity, and other factors can materially affectthe estimates for these liabilities.
Recent Accounting Pronouncements
In October 2009, the Financial Accounting Standards Board (the ‘‘FASB’’) issued amendedguidance on multiple-deliverable revenue arrangements and software revenue recognition. Themultiple-deliverable revenue arrangements updates to the FASB Accounting Standards Codification�(the ‘‘Codification’’) apply to all deliverables in contractual arrangements in all industries in which avendor will perform multiple revenue-generating activities. The change to the Codification creates aselling price hierarchy that an entity must use as evidence of fair value in separately accounting for alldeliverables on a relative selling price basis which qualify for separation. The selling price hierarchyincludes: (1) vendor-specific objective evidence; (2) third-party evidence; and (3) estimated selling price.Broadly speaking, this update to the Codification will result in the possibility for some entities torecognize revenue earlier and more closely align with the economics of certain revenue arrangements ifthe other criteria for separation (e.g. standalone value to the customer) are met. The software revenuerecognition guidance was issued to address factors that entities should consider when determiningwhether the software and non-software components of a product function together to deliver theproduct’s essential functionality. The software revenue recognition updates to the Codification willallow revenue arrangements in which software and non-software components deliver together a
41
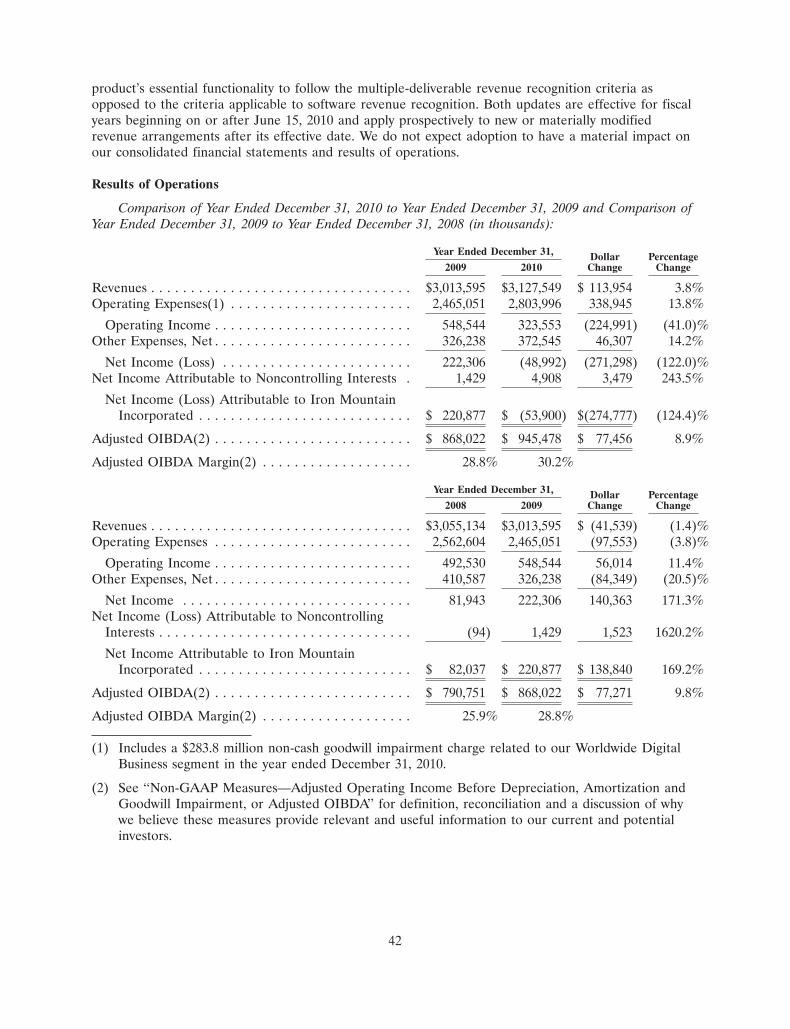
product’s essential functionality to follow the multiple-deliverable revenue recognition criteria asopposed to the criteria applicable to software revenue recognition. Both updates are effective for fiscalyears beginning on or after June 15, 2010 and apply prospectively to new or materially modifiedrevenue arrangements after its effective date. We do not expect adoption to have a material impact onour consolidated financial statements and results of operations.
Results of Operations
Comparison of Year Ended December 31, 2010 to Year Ended December 31, 2009 and Comparison ofYear Ended December 31, 2009 to Year Ended December 31, 2008 (in thousands):
Year Ended December 31, Dollar Percentage2009 2010 Change Change
Revenues . . . . . . . . . . . . . . . . . . . . . . . . . . . . . . . . . $3,013,595 $3,127,549 $ 113,954 3.8%Operating Expenses(1) . . . . . . . . . . . . . . . . . . . . . . . 2,465,051 2,803,996 338,945 13.8%
Operating Income . . . . . . . . . . . . . . . . . . . . . . . . . 548,544 323,553 (224,991) (41.0)%Other Expenses, Net . . . . . . . . . . . . . . . . . . . . . . . . . 326,238 372,545 46,307 14.2%
Net Income (Loss) . . . . . . . . . . . . . . . . . . . . . . . . 222,306 (48,992) (271,298) (122.0)%Net Income Attributable to Noncontrolling Interests . 1,429 4,908 3,479 243.5%
Net Income (Loss) Attributable to Iron MountainIncorporated . . . . . . . . . . . . . . . . . . . . . . . . . . . $ 220,877 $ (53,900) $(274,777) (124.4)%
Adjusted OIBDA(2) . . . . . . . . . . . . . . . . . . . . . . . . . $ 868,022 $ 945,478 $ 77,456 8.9%
Adjusted OIBDA Margin(2) . . . . . . . . . . . . . . . . . . . 28.8% 30.2%
Year Ended December 31, Dollar Percentage2008 2009 Change Change
Revenues . . . . . . . . . . . . . . . . . . . . . . . . . . . . . . . . . $3,055,134 $3,013,595 $ (41,539) (1.4)%Operating Expenses . . . . . . . . . . . . . . . . . . . . . . . . . 2,562,604 2,465,051 (97,553) (3.8)%
Operating Income . . . . . . . . . . . . . . . . . . . . . . . . . 492,530 548,544 56,014 11.4%Other Expenses, Net . . . . . . . . . . . . . . . . . . . . . . . . . 410,587 326,238 (84,349) (20.5)%
Net Income . . . . . . . . . . . . . . . . . . . . . . . . . . . . . 81,943 222,306 140,363 171.3%Net Income (Loss) Attributable to Noncontrolling
Interests . . . . . . . . . . . . . . . . . . . . . . . . . . . . . . . . (94) 1,429 1,523 1620.2%
Net Income Attributable to Iron MountainIncorporated . . . . . . . . . . . . . . . . . . . . . . . . . . . $ 82,037 $ 220,877 $ 138,840 169.2%
Adjusted OIBDA(2) . . . . . . . . . . . . . . . . . . . . . . . . . $ 790,751 $ 868,022 $ 77,271 9.8%
Adjusted OIBDA Margin(2) . . . . . . . . . . . . . . . . . . . 25.9% 28.8%
(1) Includes a $283.8 million non-cash goodwill impairment charge related to our Worldwide DigitalBusiness segment in the year ended December 31, 2010.
(2) See ‘‘Non-GAAP Measures—Adjusted Operating Income Before Depreciation, Amortization andGoodwill Impairment, or Adjusted OIBDA’’ for definition, reconciliation and a discussion of whywe believe these measures provide relevant and useful information to our current and potentialinvestors.
42
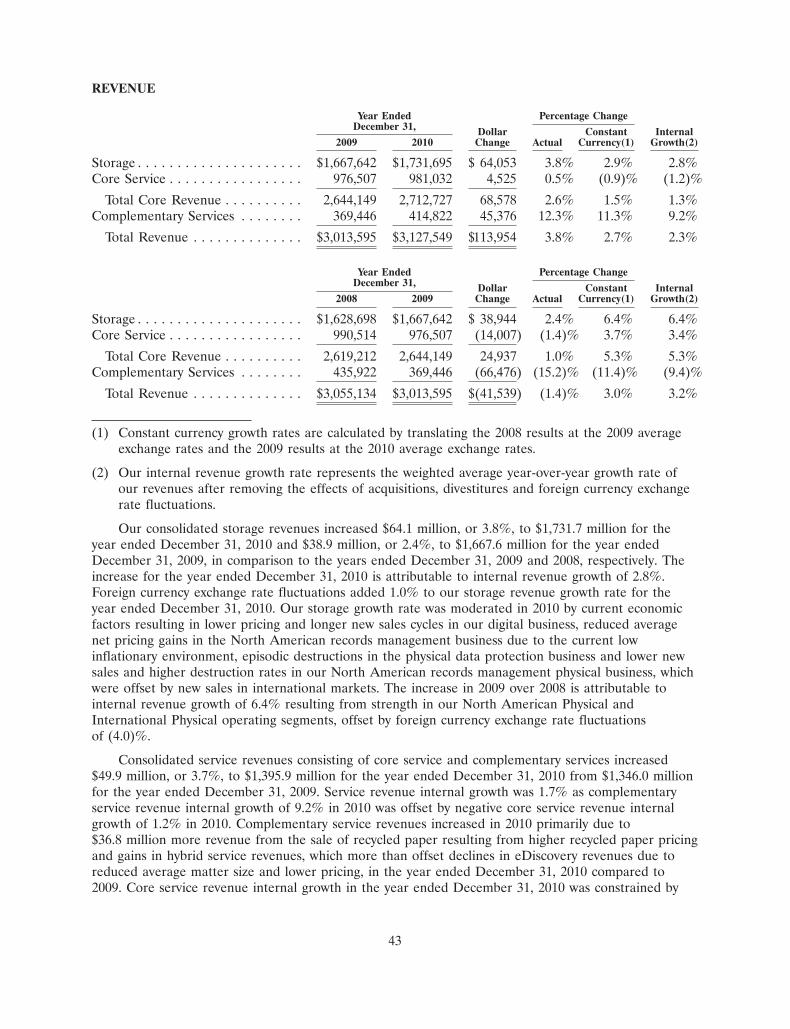
REVENUE
Year Ended Percentage ChangeDecember 31, Dollar Constant Internal
2009 2010 Change Actual Currency(1) Growth(2)
Storage . . . . . . . . . . . . . . . . . . . . . $1,667,642 $1,731,695 $ 64,053 3.8% 2.9% 2.8%Core Service . . . . . . . . . . . . . . . . . 976,507 981,032 4,525 0.5% (0.9)% (1.2)%
Total Core Revenue . . . . . . . . . . 2,644,149 2,712,727 68,578 2.6% 1.5% 1.3%Complementary Services . . . . . . . . 369,446 414,822 45,376 12.3% 11.3% 9.2%
Total Revenue . . . . . . . . . . . . . . $3,013,595 $3,127,549 $113,954 3.8% 2.7% 2.3%
Year Ended Percentage ChangeDecember 31, Dollar Constant Internal
2008 2009 Change Actual Currency(1) Growth(2)
Storage . . . . . . . . . . . . . . . . . . . . . $1,628,698 $1,667,642 $ 38,944 2.4% 6.4% 6.4%Core Service . . . . . . . . . . . . . . . . . 990,514 976,507 (14,007) (1.4)% 3.7% 3.4%
Total Core Revenue . . . . . . . . . . 2,619,212 2,644,149 24,937 1.0% 5.3% 5.3%Complementary Services . . . . . . . . 435,922 369,446 (66,476) (15.2)% (11.4)% (9.4)%
Total Revenue . . . . . . . . . . . . . . $3,055,134 $3,013,595 $(41,539) (1.4)% 3.0% 3.2%
(1) Constant currency growth rates are calculated by translating the 2008 results at the 2009 averageexchange rates and the 2009 results at the 2010 average exchange rates.
(2) Our internal revenue growth rate represents the weighted average year-over-year growth rate ofour revenues after removing the effects of acquisitions, divestitures and foreign currency exchangerate fluctuations.
Our consolidated storage revenues increased $64.1 million, or 3.8%, to $1,731.7 million for theyear ended December 31, 2010 and $38.9 million, or 2.4%, to $1,667.6 million for the year endedDecember 31, 2009, in comparison to the years ended December 31, 2009 and 2008, respectively. Theincrease for the year ended December 31, 2010 is attributable to internal revenue growth of 2.8%.Foreign currency exchange rate fluctuations added 1.0% to our storage revenue growth rate for theyear ended December 31, 2010. Our storage growth rate was moderated in 2010 by current economicfactors resulting in lower pricing and longer new sales cycles in our digital business, reduced averagenet pricing gains in the North American records management business due to the current lowinflationary environment, episodic destructions in the physical data protection business and lower newsales and higher destruction rates in our North American records management physical business, whichwere offset by new sales in international markets. The increase in 2009 over 2008 is attributable tointernal revenue growth of 6.4% resulting from strength in our North American Physical andInternational Physical operating segments, offset by foreign currency exchange rate fluctuationsof (4.0)%.
Consolidated service revenues consisting of core service and complementary services increased$49.9 million, or 3.7%, to $1,395.9 million for the year ended December 31, 2010 from $1,346.0 millionfor the year ended December 31, 2009. Service revenue internal growth was 1.7% as complementaryservice revenue internal growth of 9.2% in 2010 was offset by negative core service revenue internalgrowth of 1.2% in 2010. Complementary service revenues increased in 2010 primarily due to$36.8 million more revenue from the sale of recycled paper resulting from higher recycled paper pricingand gains in hybrid service revenues, which more than offset declines in eDiscovery revenues due toreduced average matter size and lower pricing, in the year ended December 31, 2010 compared to2009. Core service revenue internal growth in the year ended December 31, 2010 was constrained by
43

current economic trends and pressures on activity-based service revenues related to the handling andtransportation of items in storage. Favorable foreign currency exchange rate fluctuations for the yearended December 31, 2010 compared to the same period in 2009 increased reported service revenues1.4%. Consolidated service revenues decreased $80.5 million, or (5.6)%, to $1,346.0 million for the yearended December 31, 2009 from $1,426.4 million for the year ended December 31, 2008. Servicerevenue internal growth was negative 0.5% as a result of negative complementary service revenueinternal growth of 9.4% in 2009, partially offset by core service revenue internal growth of 3.4% over2008. As expected, complementary service revenues decreased on a year-over-year basis primarily dueto the completion of a large special project in Europe in the third quarter of 2008 and $34.4 millionless revenue from the sale of recycled paper revenues resulting from a steep decline in recycled paperpricing. We also experienced softness in 2009 in the more discretionary revenues such as projectrevenues and fulfillment services. Core service revenue growth was also constrained by currenteconomic trends and pressures on activity-based service revenues related to the handling andtransportation of items in storage and secure shredding. Unfavorable foreign currency exchange ratefluctuations reduced reported service revenues by 4.7% for 2009 compared to 2008.
For the reasons stated above, our consolidated revenues increased $114.0 million, or 3.8%, to$3,127.5 million for the year ended December 31, 2010 from $3,013.6 million for the year endedDecember 31, 2009. Internal revenue growth was 2.3% for 2010. We calculate internal revenue growthin local currency for our international operations. For the year ended December 31, 2010, foreigncurrency exchange rate fluctuations increased our reported revenues by 1.2% primarily due to thestrengthening of the British pound sterling and the Canadian dollar against the U.S. dollar, offset bythe weakening of the Euro against the U.S. dollar, based on an analysis of weighted average rates forthe comparable periods. Our consolidated revenues decreased $41.5 million, or (1.4)%, to$3,013.6 million for the year ended December 31, 2009 from $3,055.1 million for the year endedDecember 31, 2008. Internal revenue growth was 3.2% and 7.9% in 2009 and 2008, respectively, andacquisitions contributed 0.3% and 3.4% in 2009 and 2008, respectively. For the year endedDecember 31, 2009, foreign currency exchange rate fluctuations negatively impacted our reportedrevenues by 4.3% primarily due to the weakening of the British pound sterling, the Canadian dollarand the Euro against the U.S. dollar, based on an analysis of weighted average rates for thecomparable periods. For the year ended December 31, 2008, net favorable foreign currency exchangerate fluctuations that impacted our revenues were 0.6% and were primarily due to the strengthening ofthe Euro, the Brazilian real and the Canadian dollar against the U.S. dollar, offset by the weakening ofthe British pound sterling against the U.S. dollar, based on an analysis of weighted average rates forthe comparable periods.
Internal Growth—Eight-Quarter Trend
2009 2010
First Second Third Fourth First Second Third FourthQuarter Quarter Quarter Quarter Quarter Quarter Quarter Quarter
Storage Revenue . . . . . . . . . . . . . . . . . . 7.5% 6.6% 6.9% 4.7% 3.5% 3.3% 2.2% 2.1%Service Revenue . . . . . . . . . . . . . . . . . . . 0.4% 1.2% (3.6)% 0.1% 4.4% 1.0% 1.7% (0.2)%Total Revenue . . . . . . . . . . . . . . . . . . . . 4.2% 4.1% 2.0% 2.6% 3.9% 2.2% 2.0% 1.1%
We expect our consolidated internal revenue growth for 2011 to be approximately 0% to 2%.During the past eight quarters our storage internal growth rate has ranged between 2.1% and 7.5%.Our storage growth rate was moderated by current economic factors resulting in lower pricing andlonger new sales cycles in our digital business, reduced average net pricing gains in the North Americanrecords management business due to the current low inflationary environment, episodic destructions inthe physical data protection business and lower new sales and higher destruction rates in our NorthAmerican records management physical business, which were offset by new sales in internationalmarkets. The internal growth rate for service revenue is inherently more volatile than the storage
44

revenue internal growth rate due to the more discretionary nature of certain complementary serviceswe offer, such as large special projects, software licenses, and the volatility of prices for recycled paper.These revenues, which are often event driven and impacted to a greater extent by economic downturnsas customers defer or cancel the purchase of certain services as a way to reduce their short-term costs,may be difficult to replicate in future periods. As a commodity, recycled paper prices are subject to thevolatility of that market. The internal growth rate for service revenues reflects the following:(1) pressures on activity-based service revenues related to the handling and transportation of items instorage and secure shredding; (2) the expected softness in our complementary service revenues, such asproject revenues and fulfillment services, beginning in late 2008; (3) declines in commodity prices forrecycled paper and fuel, beginning in late 2008 and into 2009, but improving throughout 2010; and(4) a large public sector contract in Europe that was completed in the third quarter of 2008.
OPERATING EXPENSES
Cost of Sales
Consolidated cost of sales (excluding depreciation and amortization) is comprised of the followingexpenses (in thousands):
Percentage % of PercentageChange Consolidated ChangeYear Ended December 31, RevenuesDollar Constant (Favorable)/2009 2010 Change Actual Currency 2009 2010 Unfavorable
Labor . . . . . . . . . . . . $ 626,751 $ 621,012 $ (5,739) (0.9)% (2.3)% 20.8% 19.9% (0.9)%Facilities . . . . . . . . . . 419,616 417,503 (2,113) (0.5)% (1.8)% 13.9% 13.3% (0.6)%Transportation . . . . . . 110,285 107,991 (2,294) (2.1)% (3.1)% 3.7% 3.5% (0.2)%Product Cost of Sales
and Other . . . . . . . . 114,562 107,692 (6,870) (6.0)% (6.4)% 3.8% 3.4% (0.4)%
$1,271,214 $1,254,198 $(17,016) (1.3)% (2.6)% 42.2% 40.1% (2.1)%
Percentage % of PercentageChange Consolidated ChangeYear Ended December 31, RevenuesDollar Constant (Favorable)/2008 2009 Change Actual Currency 2008 2009 Unfavorable
Labor . . . . . . . . . . . . $ 674,466 $ 626,751 $ (47,715) (7.1)% (2.5)% 22.1% 20.8% (1.3)%Facilities . . . . . . . . . . 424,796 419,616 (5,180) (1.2)% 3.6% 13.9% 13.9% 0.0%Transportation . . . . . 152,080 110,285 (41,795) (27.5)% (23.8)% 5.0% 3.7% (1.3)%Product Cost of Sales
and Other . . . . . . . 130,677 114,562 (16,115) (12.3)% (8.0)% 4.3% 3.8% (0.5)%
$1,382,019 $1,271,214 $(110,805) (8.0)% (3.5)% 45.2% 42.2% (3.0)%
Labor
Labor expense decreased to 19.9% of consolidated revenues for the year ended December 31,2010 compared to 20.8% for the year ended December 31, 2009. For the year ended December 31,2010 as compared to the year ended December 31, 2009, labor expense was unfavorably impacted by1.4 percentage points due to currency variations. Excluding the effect of currency rate fluctuations,labor expense decreased by 2.3% in 2010 primarily due to productivity gains in our North AmericanPhysical Business, lower core service levels and lower incentive compensation expense of $12.5 millionin the year ended December 31, 2010.
45
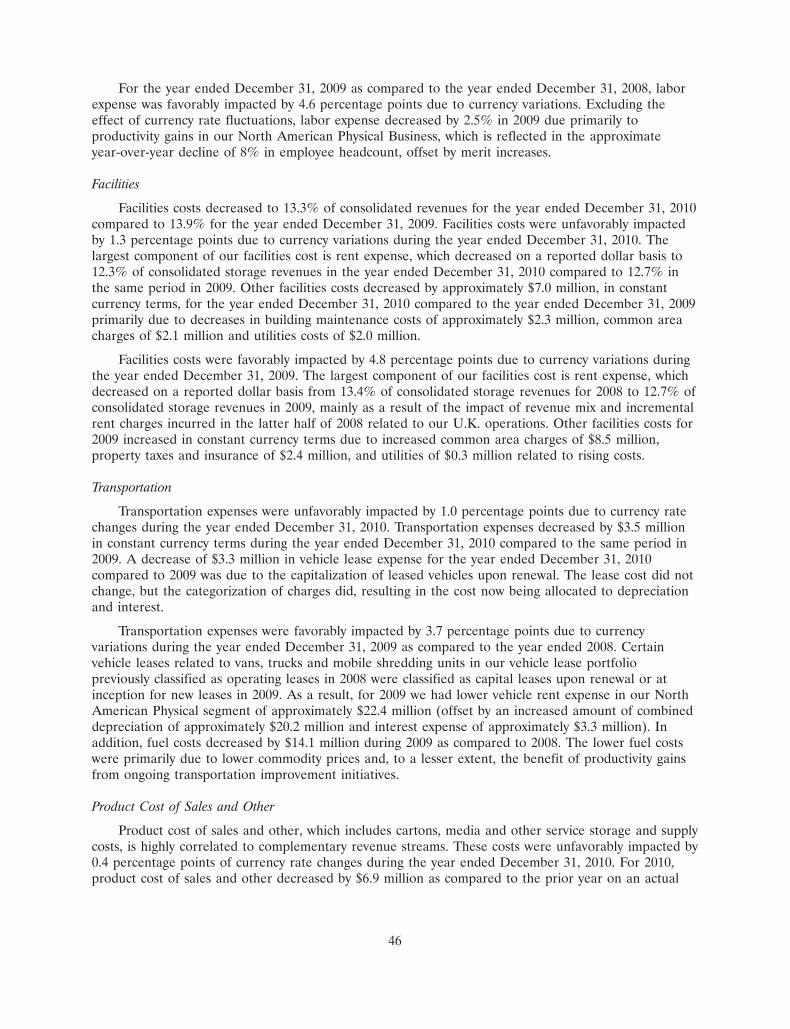
For the year ended December 31, 2009 as compared to the year ended December 31, 2008, laborexpense was favorably impacted by 4.6 percentage points due to currency variations. Excluding theeffect of currency rate fluctuations, labor expense decreased by 2.5% in 2009 due primarily toproductivity gains in our North American Physical Business, which is reflected in the approximateyear-over-year decline of 8% in employee headcount, offset by merit increases.
Facilities
Facilities costs decreased to 13.3% of consolidated revenues for the year ended December 31, 2010compared to 13.9% for the year ended December 31, 2009. Facilities costs were unfavorably impactedby 1.3 percentage points due to currency variations during the year ended December 31, 2010. Thelargest component of our facilities cost is rent expense, which decreased on a reported dollar basis to12.3% of consolidated storage revenues in the year ended December 31, 2010 compared to 12.7% inthe same period in 2009. Other facilities costs decreased by approximately $7.0 million, in constantcurrency terms, for the year ended December 31, 2010 compared to the year ended December 31, 2009primarily due to decreases in building maintenance costs of approximately $2.3 million, common areacharges of $2.1 million and utilities costs of $2.0 million.
Facilities costs were favorably impacted by 4.8 percentage points due to currency variations duringthe year ended December 31, 2009. The largest component of our facilities cost is rent expense, whichdecreased on a reported dollar basis from 13.4% of consolidated storage revenues for 2008 to 12.7% ofconsolidated storage revenues in 2009, mainly as a result of the impact of revenue mix and incrementalrent charges incurred in the latter half of 2008 related to our U.K. operations. Other facilities costs for2009 increased in constant currency terms due to increased common area charges of $8.5 million,property taxes and insurance of $2.4 million, and utilities of $0.3 million related to rising costs.
Transportation
Transportation expenses were unfavorably impacted by 1.0 percentage points due to currency ratechanges during the year ended December 31, 2010. Transportation expenses decreased by $3.5 millionin constant currency terms during the year ended December 31, 2010 compared to the same period in2009. A decrease of $3.3 million in vehicle lease expense for the year ended December 31, 2010compared to 2009 was due to the capitalization of leased vehicles upon renewal. The lease cost did notchange, but the categorization of charges did, resulting in the cost now being allocated to depreciationand interest.
Transportation expenses were favorably impacted by 3.7 percentage points due to currencyvariations during the year ended December 31, 2009 as compared to the year ended 2008. Certainvehicle leases related to vans, trucks and mobile shredding units in our vehicle lease portfoliopreviously classified as operating leases in 2008 were classified as capital leases upon renewal or atinception for new leases in 2009. As a result, for 2009 we had lower vehicle rent expense in our NorthAmerican Physical segment of approximately $22.4 million (offset by an increased amount of combineddepreciation of approximately $20.2 million and interest expense of approximately $3.3 million). Inaddition, fuel costs decreased by $14.1 million during 2009 as compared to 2008. The lower fuel costswere primarily due to lower commodity prices and, to a lesser extent, the benefit of productivity gainsfrom ongoing transportation improvement initiatives.
Product Cost of Sales and Other
Product cost of sales and other, which includes cartons, media and other service storage and supplycosts, is highly correlated to complementary revenue streams. These costs were unfavorably impacted by0.4 percentage points of currency rate changes during the year ended December 31, 2010. For 2010,product cost of sales and other decreased by $6.9 million as compared to the prior year on an actual
46
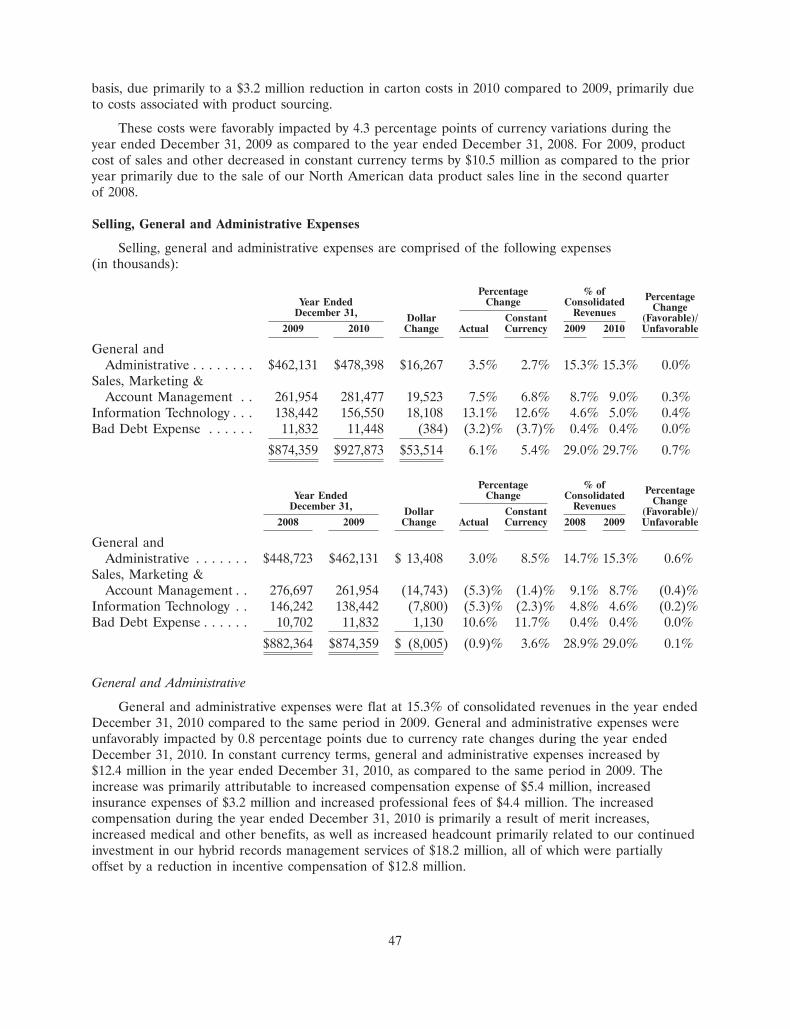
basis, due primarily to a $3.2 million reduction in carton costs in 2010 compared to 2009, primarily dueto costs associated with product sourcing.
These costs were favorably impacted by 4.3 percentage points of currency variations during theyear ended December 31, 2009 as compared to the year ended December 31, 2008. For 2009, productcost of sales and other decreased in constant currency terms by $10.5 million as compared to the prioryear primarily due to the sale of our North American data product sales line in the second quarterof 2008.
Selling, General and Administrative Expenses
Selling, general and administrative expenses are comprised of the following expenses(in thousands):
Percentage % of PercentageYear Ended Change Consolidated ChangeDecember 31, RevenuesDollar Constant (Favorable)/2009 2010 Change Actual Currency 2009 2010 Unfavorable
General andAdministrative . . . . . . . . $462,131 $478,398 $16,267 3.5% 2.7% 15.3% 15.3% 0.0%
Sales, Marketing &Account Management . . 261,954 281,477 19,523 7.5% 6.8% 8.7% 9.0% 0.3%
Information Technology . . . 138,442 156,550 18,108 13.1% 12.6% 4.6% 5.0% 0.4%Bad Debt Expense . . . . . . 11,832 11,448 (384) (3.2)% (3.7)% 0.4% 0.4% 0.0%
$874,359 $927,873 $53,514 6.1% 5.4% 29.0% 29.7% 0.7%
Percentage % of PercentageYear Ended Change Consolidated ChangeDecember 31, RevenuesDollar Constant (Favorable)/2008 2009 Change Actual Currency 2008 2009 Unfavorable
General andAdministrative . . . . . . . $448,723 $462,131 $ 13,408 3.0% 8.5% 14.7% 15.3% 0.6%
Sales, Marketing &Account Management . . 276,697 261,954 (14,743) (5.3)% (1.4)% 9.1% 8.7% (0.4)%
Information Technology . . 146,242 138,442 (7,800) (5.3)% (2.3)% 4.8% 4.6% (0.2)%Bad Debt Expense . . . . . . 10,702 11,832 1,130 10.6% 11.7% 0.4% 0.4% 0.0%
$882,364 $874,359 $ (8,005) (0.9)% 3.6% 28.9% 29.0% 0.1%
General and Administrative
General and administrative expenses were flat at 15.3% of consolidated revenues in the year endedDecember 31, 2010 compared to the same period in 2009. General and administrative expenses wereunfavorably impacted by 0.8 percentage points due to currency rate changes during the year endedDecember 31, 2010. In constant currency terms, general and administrative expenses increased by$12.4 million in the year ended December 31, 2010, as compared to the same period in 2009. Theincrease was primarily attributable to increased compensation expense of $5.4 million, increasedinsurance expenses of $3.2 million and increased professional fees of $4.4 million. The increasedcompensation during the year ended December 31, 2010 is primarily a result of merit increases,increased medical and other benefits, as well as increased headcount primarily related to our continuedinvestment in our hybrid records management services of $18.2 million, all of which were partiallyoffset by a reduction in incentive compensation of $12.8 million.
47
General and administrative expenses were favorably impacted by 5.5 percentage points due tocurrency variations during the year ended December 31, 2009 as compared to the year endedDecember 31, 2008. In constant currency terms, compensation expense, including medical and otherbenefits, increased by $17.8 million in 2009 as a result of merit increases and increased headcount. Inaddition, legal costs and professional fees (related to project and cost saving initiatives) increased$24.7 million in 2009 as compared to 2008. These increases were offset by lower discretionary spendingof $8.8 million for items including recruiting and relocations, telephone, training, postage and supplies,and certain enterprise-wide meetings which were held in 2008 but not in 2009.
Sales, Marketing & Account Management
Sales, marketing and account management expenses were unfavorably impacted by 0.7 percentagepoints due to currency changes during the year ended December 31, 2010. In constant currency terms,the increase of $18.0 million in the year ended December 31, 2010 is primarily related to increasedcompensation of $9.6 million, including $5.8 million of incremental costs related to the acquisition ofMimosa and general merit increases. Additionally, incremental professional fees of $2.0 million and$4.6 million of incremental marketing costs also contributed to the increase.
Sales, marketing and account management expenses were favorably impacted by 3.9 percentagepoints due to currency variations during the year ended December 31, 2009 as compared to the yearended December 31, 2008. In constant currency terms, the decrease of 1.4% in 2009 was primarilyrelated to lower discretionary spending of $4.1 million on items such as travel and entertainment andour enterprise-wide sales meeting which was held in 2008 but not in 2009. Commissions expense alsodeclined by $10.2 million in constant currency terms during 2009 as compared to 2008. These decreaseswere partially offset by increased investment in personnel in sales and account management and meritincreases in our International Physical segment of $4.8 million and increased compensation (other thancommissions) of $4.4 million primarily as a result of merit increases in the North American Physicalsegment.
Information Technology
Information technology expenses were unfavorably impacted by 0.5 percentage points due tocurrency rate changes during the year ended December 31, 2010. In constant currency terms,information technology expenses increased $17.5 million during the year ended December 31, 2010.Compensation increased $6.9 million, primarily associated with the acquisition of Mimosa and increasedmerit raises, offset by lower incentive compensation. Additionally, overhead expenses increased by$10.5 million, primarily a result of increased corporate expenses, increased professional fees of$4.1 million (related to project and cost saving initiatives) and $2.1 million of incremental costs relatedto the Mimosa acquisition.
Information technology expenses were favorably impacted by 3.0 percentage points due to currencyvariations during the year ended December 31, 2009 as compared to 2008. In constant currency terms,the decrease of 2.3% in information technology expenses for 2009 was due to reduced overhead anddiscretionary spending, such as recruiting, travel and entertainment, professional fees, and equipmentrental costs of $2.3 million and disciplined cost management.
Bad Debt Expense
Consolidated bad debt expense for the year ended December 31, 2010 decreased $0.4 million to$11.5 million (0.4% of consolidated revenues) from $11.8 million (0.4% of consolidated revenues) forthe year ended December 31, 2009. We maintain an allowance for doubtful accounts that is calculatedbased on our past loss experience, current and prior trends in our aged receivables, current economicconditions, and specific circumstances of individual receivable balances. We continue to monitor our
48

customers’ payment activity and make adjustments based on their financial condition and in light ofhistorical and expected trends.
Consolidated bad debt expense increased $1.1 million to $11.8 million (0.4% of consolidatedrevenues) for the year ended December 31, 2009 from $10.7 million (0.4% of consolidated revenues)for the year ended December 31, 2008. The increase in bad debt expense in 2009 from 2008 wasattributable to the worsening economic climate.
Goodwill Impairment
During the quarter ended September 30, 2010, prior to our annual goodwill impairment review, weconcluded that events occurred and circumstances changed in the Worldwide Digital Business reportingunit that required us to conduct an impairment review. The primary factors contributing to ourconclusion that we had a triggering event and a requirement to reassess the Worldwide Digital Businessreporting unit goodwill for impairment included: (1) a reduction in forecasted revenue and operatingresults due to continued pressure on key parts of the business as a result of the weak economy;(2) reduced revenue and profit outlook for our eDiscovery service due to smaller average matter sizeand lower pricing; (3) a decision to discontinue certain software development projects as more fullydiscussed below within Depreciation, Amortization, and (Gain) Loss on Disposal/Writedown ofProperty, Plant and Equipment, Net; and (4) the sale of the domain name management product line ofour Worldwide Digital Business reporting unit as more fully discussed below within Other (Income)Expense, Net. As a result of the review, we recorded a provisional goodwill impairment chargeassociated with our Worldwide Digital Business reporting unit in the amount of $255.0 million duringthe quarter ended September 30, 2010. We finalized this estimate in the fourth quarter of 2010, and werecorded an additional impairment of $28.8 million, for a total goodwill impairment charge of$283.8 million.
Depreciation, Amortization, and (Gain) Loss on Disposal/Writedown of Property, Plant andEquipment, Net
Depreciation expense increased $23.1 million for the year ended December 31, 2010, compared tothe year ended December 31, 2009, primarily due to additional depreciation expense related to capitalexpenditures and acquisitions, including storage systems, which include racking, building and leaseholdimprovements, computer systems hardware and software, and buildings. Depreciation expense increased$29.0 million for the year ended December 31, 2009, compared to the year ended December 31, 2008,primarily due to additional depreciation expense of approximately $20.2 million resulting from certainvehicle leases which had been classified as operating leases in 2008 being classified as capital leasesupon renewal or at inception for new leases in 2009, as well as additional depreciation associated withtechnology investments in our Worldwide Digital Business segment of $4.1 million.
Amortization expense increased $2.1 million for the year ended December 31, 2010, compared tothe year ended December 31, 2009, primarily due to the increased amortization of intangible assets,such as customer relationship intangible assets and intellectual property acquired through businesscombinations. Amortization expense decreased $0.6 million for the year ended December 31, 2009compared to the year ended December 31, 2008, primarily due to decreases resulting from currencyvariations which were offset by the increased amortization of intangible assets, such as customerrelationship intangible assets and intellectual property acquired through business combinations.
Consolidated gain on disposal/writedown of property, plant and equipment, net of $6.1 million forthe year ended December 31, 2010 consisted primarily of a gain of approximately $10.2 million as aresult of the settlement with our insurers in connection with a portion of the property component ofour claim related to the Chilean earthquake in the third and fourth quarter of 2010, gains ofapproximately $3.2 million in North America primarily related to the disposition of certain owned
49

equipment and a gain on disposal of a building in our International Physical segment of approximately$1.3 million in the United Kingdom, offset by approximately $1.0 million of asset write downsassociated with our Latin American operations, approximately $2.6 million of impairment lossesprimarily related to certain owned facilities in North America, and an approximately $4.9 millionwrite-off in the third and fourth quarters of 2010 of previously deferred software costs related to ourWorldwide Digital Business segment associated with certain software development projects that werediscontinued after implementation.
Consolidated loss on disposal/writedown of property, plant and equipment, net of $0.4 million forthe year ended December 31, 2009, consisted primarily of a gain on disposal of a building in ourInternational Physical segment of approximately $1.9 million in France, offset by losses on thewritedown of certain facilities of approximately $1.0 million in our North American Physical segment,$0.7 million in our International Physical segment, $0.3 million in our Worldwide Digital segment and$0.3 million in Corporate (associated with discontinued products after implementation). Consolidatedloss on disposal/writedown of property, plant and equipment, net of $7.5 million for the year endedDecember 31, 2008, consisted primarily of a $2.3 million impairment of an owned storage facility inNorth America which we decided to exit in the first quarter of 2008, a $1.3 million impairment of anowned storage facility which we decided to exit in the third quarter of 2008, a $0.5 million writedownfor an owned storage facility that we had vacated and had classified as available for sale in the thirdquarter of 2008, a $1.9 million writedown of two owned storage facilities in North America and relatedassets which we decided to exit in the fourth quarter of 2008, as well as a $0.6 million write-off ofpreviously deferred software costs in Corporate associated with discontinued products afterimplementation and other disposal and asset writedowns.
OPERATING INCOME and ADJUSTED OIBDA
As a result of all the foregoing factors, consolidated operating income decreased $225.0 million, or41.0%, to $323.6 million (10.3% of consolidated revenues) for the year ended December 31, 2010 from$548.5 million (18.2% of consolidated revenues) for the year ended December 31, 2009. As a result ofall the foregoing factors, consolidated Adjusted OIBDA increased $77.5 million, or 8.9%, to$945.5 million (30.2% of consolidated revenues) for the year ended December 31, 2010 from$868.0 million (28.8% of consolidated revenues) for the year ended December 31, 2009.
As a result of all the foregoing factors, consolidated operating income increased $56.0 million, or11.4%, to $548.5 million (18.2% of consolidated revenues) for the year ended December 31, 2009 from$492.5 million (16.1% of consolidated revenues) for the year ended December 31, 2008. As a result ofall the foregoing factors, consolidated Adjusted OIBDA increased $77.3 million, or 9.8%, to$868.0 million (28.8% of consolidated revenues) for the year ended December 31, 2009 from$790.8 million (25.9% of consolidated revenues) for the year ended December 31, 2008.
OTHER EXPENSES, NET
Interest Expense, Net
Consolidated interest expense, net decreased $6.8 million to $221.0 million (7.1% of consolidatedrevenues) for the year ended December 31, 2010 from $227.8 million (7.6% of consolidated revenues)for the year ended December 31, 2009 primarily due to a reduction in year-over-year short termborrowings on our revolving credit facility, as well as a reduction in our outstanding borrowings due tothe early retirement of $200.0 million of our 73⁄4% Senior Subordinated Notes due 2015 (the ‘‘73⁄4%Notes’’) during 2010. Our weighted average interest rate was 6.9% and 7.0% at December 31, 2010 and2009, respectively.
Consolidated interest expense, net decreased $8.8 million to $227.8 million (7.6% of consolidatedrevenues) for the year ended December 31, 2009 from $236.6 million (7.7% of consolidated revenues)
50

for the year ended December 31, 2008 primarily due to a reduction in year-over-year borrowings underour revolving credit facility while our weighted average interest rate remained flat at 7.0% as ofDecember 31, 2009 and 2008. We incurred approximately $3.3 million of additional interest expense oncapital leases on certain vehicle leases previously classified as operating leases prior to renewal or uponlease inception.
Other (Income) Expense, Net (in thousands)
Year EndedDecember 31, Dollar
2009 2010 Change
Foreign currency transaction (gains) losses, net . . . . . . . . . . . . . . . . . . . $(12,477) $ 5,305 $17,782Debt extinguishment expense . . . . . . . . . . . . . . . . . . . . . . . . . . . . . . . . 3,031 1,792 (1,239)Other, net . . . . . . . . . . . . . . . . . . . . . . . . . . . . . . . . . . . . . . . . . . . . . . (2,633) (5,325) (2,692)
$(12,079) $ 1,772 $13,851
Year EndedDecember 31, Dollar
2008 2009 Change
Foreign currency transaction losses (gains), net . . . . . . . . . . . . . . . . . . $28,882 $(12,477) $(41,359)Debt extinguishment expense . . . . . . . . . . . . . . . . . . . . . . . . . . . . . . . 418 3,031 2,613Other, net . . . . . . . . . . . . . . . . . . . . . . . . . . . . . . . . . . . . . . . . . . . . . 1,728 (2,633) (4,361)
$31,028 $(12,079) $(43,107)
Net foreign currency transaction losses of $5.3 million, based on period-end exchange rates, wererecorded in the year ended December 31, 2010. Losses resulted primarily from changes in the exchangerate of the British pound sterling, the Euro and the Russian Ruble, offset by the Brazilian Real, againstthe U.S. dollar compared to December 31, 2009, as these currencies relate to our intercompanybalances with and between our European and Latin American subsidiaries, and gains associated withour British pound sterling forward contracts, British pound sterling denominated debt and Eurodenominated debt.
Net foreign currency transaction gains of $12.5 million, based on period-end exchange rates, wererecorded in the year ended December 31, 2009. Gains resulted primarily from changes in the exchangerate of the British pound sterling, Euro, Brazilian Real and Chilean Peso against the U.S. dollarcompared to December 31, 2008, as these currencies relate to our intercompany balances with andbetween our European and Latin American subsidiaries, offset by losses as a result of British poundssterling and Euro denominated debt and forward foreign currency swap contracts held by our U.S.parent company.
Net foreign currency transaction losses of $28.9 million, based on period-end exchange rates, wererecorded in the year ended December 31, 2008. Losses resulted primarily as a result of the Britishpound sterling against the U.S. dollar compared to December 31, 2007, as this currency relates to ourintercompany balances with and between our U.K. subsidiaries, offset by gains on themarking-to-market of British pound sterling and Euro denominated debt and forward foreign currencyswap contracts held by our U.S. parent company.
During the year ended December 31, 2010, we redeemed $200.0 million of the $431.3 millionaggregate principal amount outstanding of the 73⁄4% Notes at a redemption price of $1,012.92 for eachone thousand dollars of principal amount of the notes redeemed, plus accrued and unpaid interest. Werecorded a charge to other expense (income), net of $1.8 million in the third quarter of 2010 related tothe early extinguishment of the 73⁄4% Notes being redeemed. This charge consists of the call premium
51
and deferred financing costs, net of original issue premiums related to the 73⁄4% Notes that wereredeemed. During the year ended December 31, 2009, we redeemed our 85⁄8% Senior SubordinatedNotes due 2013 and wrote-off $3.0 million in associated deferred financing costs. During 2008, weredeemed the remaining outstanding portion of our 81⁄4% Senior Subordinated Notes due 2011 and, inconnection with the reduction in our revolving credit facility availability due to a bankruptcy of one ofour lenders, we wrote-off $0.4 million in deferred financing costs.
Other, net in the year ended December 31, 2010 was a $5.3 million gain. In August 2010, wedivested the domain name management product line of our Worldwide Digital Business segment forapproximately $11.4 million in cash at closing, resulting in a pretax gain of approximately $6.9 million($2.8 million after tax) in 2010. The assets sold primarily consisted of customer contracts. Also includedin the gain for the year ended December 31, 2010 was $1.2 million of gains related to certain tradingmarketable securities held in a trust for the benefit of employees included in a deferred compensationplan we sponsor. Offsetting these gains was $4.7 million of losses related to the impact of the change inIME’s fiscal year-end. Since its inception, IME had operated with an October 31 fiscal year-end. IME’sfinancial results had historically been consolidated with IMI’s results with a two month lag. In order tobetter align our European processes with the enterprise, effective January 1, 2010, the IME fiscalyear-end was changed to December 31 to match the Company’s fiscal year-end. The $4.7 million chargerepresents the net impact of this change for the two years ended December 31, 2009. Other, net in theyear ended December 31, 2009 primarily consisted of $1.7 million of gains related to certain tradingmarketable securities held in a trust for the benefit of employees included in a deferred compensationplan we sponsor, in addition to $0.6 million of business interruption proceeds for an owned storagefacility in France, which was taken by eminent domain in the first quarter of 2009. Other, net in theyear ended December 31, 2008 primarily consisted of $1.8 million of writedowns related to certaintrading marketable securities held in a trust for the benefit of employees included in a deferredcompensation plan we sponsor.
Provision for Income Taxes
Our effective tax rates for the years ended December 31, 2008, 2009 and 2010 were 63.6%, 33.2%and 148.6%, respectively. The primary reconciling items between the federal statutory rate of 35% andour overall effective tax rate for the year ended December 31, 2010 is a goodwill impairment charge, ofwhich a majority was non-deductible for tax purposes. U.S. legislative changes in 2010 reduced theexpected utilization of foreign tax credits. Certain previously unrecognized tax benefits were recognizedin 2010 due to expirations of statute of limitation periods and settlements with tax authorities in variousworldwide jurisdictions. In 2009 and 2008, we had significant unrealized foreign exchange gains andlosses on intercompany loans and on debt and derivative instruments in different jurisdictions withdifferent tax rates. For 2009, foreign currency gains were recorded in lower tax jurisdictions associatedwith the marking-to-market of intercompany loan positions while foreign currency losses were recordedin higher tax jurisdictions associated with the marking-to-market of debt and derivative instruments,which reduced the effective tax rate by 4.9% for the year ended December 31, 2009. Our effective taxrate is higher than the statutory rate in 2008 primarily due to significant foreign exchange gains andlosses in different jurisdictions with different tax rates. For 2008, foreign currency gains were recordedin higher tax jurisdictions, associated with our marking-to-market of debt and derivative instruments,while foreign currency losses were recorded in lower tax jurisdictions, associated with themarking-to-market of intercompany loan positions, which together increased the 2008 tax rate by 22.5%for the year ended December 31, 2008.
Our effective tax rate is subject to variability in the future due to, among other items: (1) changesin the mix of income from foreign jurisdictions; (2) tax law changes; (3) volatility in foreign exchangegains and (losses); (4) the timing of the establishment and reversal of tax reserves; and (5) our abilityto utilize foreign tax credits that we generate. We are subject to income taxes in the U.S. and numerous
52

foreign jurisdictions. We are subject to examination by various tax authorities in jurisdictions in whichwe have significant business operations. We regularly assess the likelihood of additional assessments bytax authorities and provide for these matters as appropriate. Although we believe our tax estimates areappropriate, the final determination of tax audits and any related litigation could result in changes inour estimates. Discrete items are recorded in the period they occur.
NET INCOME
As a result of all the foregoing factors, consolidated net income for the year ended December 31,2010 decreased $271.3 million, or 122.0%, to a net loss of $49.0 million (negative 1.6% of consolidatedrevenues) from net income of $222.3 million (7.4% of consolidated revenues) for the year endedDecember 31, 2009. The decrease in operating income noted above is primarily due to the goodwillimpairment charge associated with our Worldwide Digital Business segment, as well as, foreign currencyexchange rate impacts and the impact of the change in IME’s fiscal year-end included in other income(expense), net and the impact of our tax rate for 2010 and the resulting increase in the provision forincome taxes described above contributed to the decrease in net income, and were partially offset bythe recorded gain associated with the divestiture of the domain name management product line of ourWorldwide Digital Business segment. For the year ended December 31, 2010, net income attributableto noncontrolling interests resulted in a decrease in net income attributable to Iron MountainIncorporated of $4.9 million. These represent our noncontrolling partners’ share of earnings/losses inour majority-owned international subsidiaries that are consolidated in our operating results.
As a result of all the foregoing factors, consolidated net income for the year ended December 31,2009 increased $140.4 million, or 171.3%, to $222.3 million (7.4% of consolidated revenues) from netincome of $81.9 million (2.7% of consolidated revenues) for the year ended December 31, 2008. Theincrease in operating income noted above, the foreign currency exchange rate impacts included in otherincome (expense), net and the impact of our tax rate for 2009 contributed to the increase in netincome. For the year ended December 31, 2009, net income attributable to noncontrolling interestsresulted in a reduction to net income attributable to Iron Mountain Incorporated of $1.4 million.
Segment Analysis (in thousands)
Corporate and our operating segments are discussed below. Our reportable operating segments areNorth American Physical Business, International Physical Business and Worldwide Digital Business. SeeNote 9 to Notes to Consolidated Financial Statements. Our North American Physical Business, whichconsists of the United States and Canada, offers the storage of paper documents, as well as all othernon-electronic media such as microfilm and microfiche, master audio and videotapes, film, X-rays andblueprints, including healthcare information services, vital records services, service and courieroperations, and the collection, handling and disposal of sensitive documents for corporate customers(‘‘Hard Copy’’); the storage and rotation of backup computer media as part of corporate disasterrecovery plans, including service and courier operations (‘‘Data Protection’’); information destructionservices (‘‘Destruction’’); and the storage, assembly, and detailed reporting of customer marketingliterature and delivery to sales offices, trade shows and prospective customers’ sites based on currentand prospective customer orders (‘‘Fulfillment’’). Our International Physical Business segment offersinformation management services throughout Europe, Latin America and Asia Pacific, including HardCopy, Data Protection and Destruction (in the U.K., Australia, New Zealand and Latin America). OurWorldwide Digital Business offers information management services for electronic records conveyed viatelecommunication lines and the Internet, including online backup and recovery solutions for serverdata and personal computers, as well as email archiving, third party intellectual property escrowservices that protect intellectual property assets such as software source code, and electronic discoveryservices for the legal market that offers in-depth discovery and data investigation solutions. Corporateconsists of costs related to executive and staff functions, including finance, human resources and
53

information technology, which benefit the enterprise as a whole. These costs are primarily related tothe general management of these functions on a corporate level and the design and development ofprograms, policies and procedures that are then implemented in the individual segments, with eachsegment bearing its own cost of implementation. Corporate also includes stock-based employeecompensation expense associated with all employee stock-based awards.
North American Physical Business
PercentageChange
Year Ended December 31, Dollar Constant Internal2009 2010 Change Actual Currency Growth
Segment Revenue . . . . . . . . . . . . . . . . $2,101,526 $2,170,814 $ 69,288 3.3% 2.3% 2.3%
Segment Adjusted OIBDA(1) . . . . . . . $ 856,761 $ 961,135 $104,374 12.2% 11.1%
Segment Adjusted OIBDA(1) as aPercentage of Segment Revenue . . . . 40.8% 44.3%
PercentageChange
Year Ended December 31, Dollar Constant Internal2008 2009 Change Actual Currency Growth
Segment Revenue . . . . . . . . . . . . . . . . . $2,067,316 $2,101,526 $34,210 1.7% 2.3% 2.8%
Segment Adjusted OIBDA(1) . . . . . . . . $ 768,523 $ 856,761 $88,238 11.5% 12.2%
Segment Adjusted OIBDA(1) as aPercentage of Segment Revenue . . . . 37.2% 40.8%
(1) See Note 9 to Notes to the Consolidated Financial Statements for definition of Adjusted OIBDAand for the basis on which allocations are made and a reconciliation of Adjusted OIBDA toincome (loss) before provision (benefit) for income taxes.
During the year ended December 31, 2010, revenue in our North American Physical Businesssegment increased 3.3% over the year ended December 31, 2009, primarily due to internal growth of2.3%. Total revenue internal growth was comprised of storage internal growth of 2.3% related toincreased Hard Copy and Data Protection revenues and service internal growth of 2.3%. Currenteconomic factors have led to a moderation in our storage growth rate as a result of reduced averagenet pricing gains due to the current low inflationary environment, episodic destructions in the physicaldata protection business and lower new sales and higher destruction rates in our physical business overthe past year. Core service revenue growth was also constrained by current economic trends andpressures on activity-based services revenues related to the handling and transportation of items instorage. Our core services business yielded negative internal growth of 2.3%, which was more thanoffset by complementary services revenues internal growth of 16.3%, due primarily to higher recycledpaper prices and gains in hybrid service revenues. Additionally, favorable foreign currency rate changesrelated to Canada resulted in increased 2010 revenue, as measured in U.S. dollars, of 1.0%. AdjustedOIBDA as a percentage of segment revenue increased in 2010 due mainly to productivity gains anddisciplined cost management, partially offset by a $6.3 million increase in general and administrativecompensation and a $1.2 million increase in bad debt expense.
During the year ended December 31, 2009, revenue in our North American Physical Businesssegment increased 1.7% over the year ended December 31, 2008, primarily due to internal growth of2.8%. Total revenue internal growth was due to solid storage internal growth of 6.2% related toincreased Hard Copy and Data Protection revenues and was negatively impacted by depressed service
54
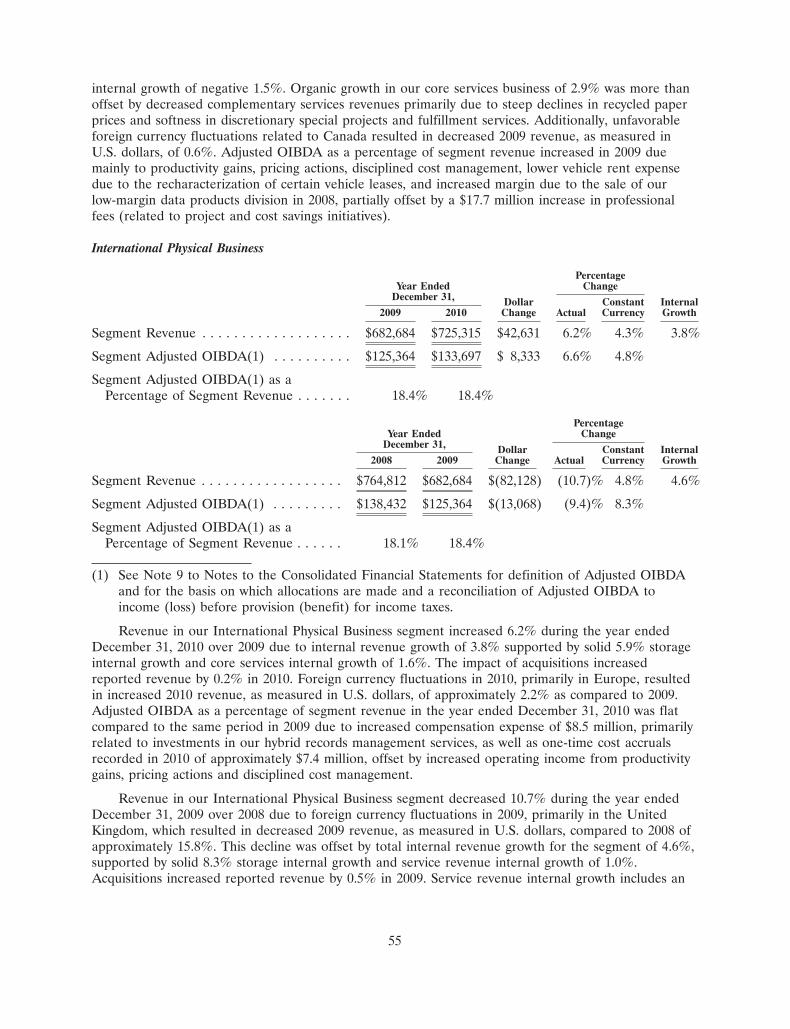
internal growth of negative 1.5%. Organic growth in our core services business of 2.9% was more thanoffset by decreased complementary services revenues primarily due to steep declines in recycled paperprices and softness in discretionary special projects and fulfillment services. Additionally, unfavorableforeign currency fluctuations related to Canada resulted in decreased 2009 revenue, as measured inU.S. dollars, of 0.6%. Adjusted OIBDA as a percentage of segment revenue increased in 2009 duemainly to productivity gains, pricing actions, disciplined cost management, lower vehicle rent expensedue to the recharacterization of certain vehicle leases, and increased margin due to the sale of ourlow-margin data products division in 2008, partially offset by a $17.7 million increase in professionalfees (related to project and cost savings initiatives).
International Physical Business
PercentageYear Ended Change
December 31, Dollar Constant Internal2009 2010 Change Actual Currency Growth
Segment Revenue . . . . . . . . . . . . . . . . . . . $682,684 $725,315 $42,631 6.2% 4.3% 3.8%
Segment Adjusted OIBDA(1) . . . . . . . . . . $125,364 $133,697 $ 8,333 6.6% 4.8%
Segment Adjusted OIBDA(1) as aPercentage of Segment Revenue . . . . . . . 18.4% 18.4%
PercentageYear Ended Change
December 31, Dollar Constant Internal2008 2009 Change Actual Currency Growth
Segment Revenue . . . . . . . . . . . . . . . . . . $764,812 $682,684 $(82,128) (10.7)% 4.8% 4.6%
Segment Adjusted OIBDA(1) . . . . . . . . . $138,432 $125,364 $(13,068) (9.4)% 8.3%
Segment Adjusted OIBDA(1) as aPercentage of Segment Revenue . . . . . . 18.1% 18.4%
(1) See Note 9 to Notes to the Consolidated Financial Statements for definition of Adjusted OIBDAand for the basis on which allocations are made and a reconciliation of Adjusted OIBDA toincome (loss) before provision (benefit) for income taxes.
Revenue in our International Physical Business segment increased 6.2% during the year endedDecember 31, 2010 over 2009 due to internal revenue growth of 3.8% supported by solid 5.9% storageinternal growth and core services internal growth of 1.6%. The impact of acquisitions increasedreported revenue by 0.2% in 2010. Foreign currency fluctuations in 2010, primarily in Europe, resultedin increased 2010 revenue, as measured in U.S. dollars, of approximately 2.2% as compared to 2009.Adjusted OIBDA as a percentage of segment revenue in the year ended December 31, 2010 was flatcompared to the same period in 2009 due to increased compensation expense of $8.5 million, primarilyrelated to investments in our hybrid records management services, as well as one-time cost accrualsrecorded in 2010 of approximately $7.4 million, offset by increased operating income from productivitygains, pricing actions and disciplined cost management.
Revenue in our International Physical Business segment decreased 10.7% during the year endedDecember 31, 2009 over 2008 due to foreign currency fluctuations in 2009, primarily in the UnitedKingdom, which resulted in decreased 2009 revenue, as measured in U.S. dollars, compared to 2008 ofapproximately 15.8%. This decline was offset by total internal revenue growth for the segment of 4.6%,supported by solid 8.3% storage internal growth and service revenue internal growth of 1.0%.Acquisitions increased reported revenue by 0.5% in 2009. Service revenue internal growth includes an
55
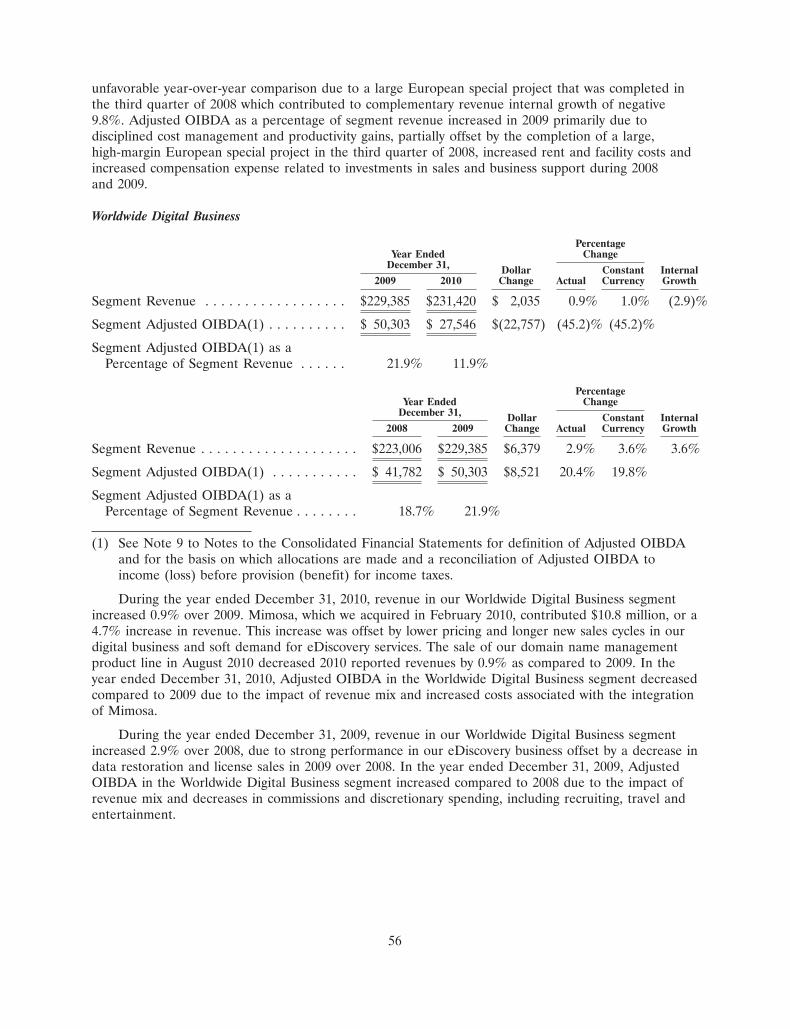
unfavorable year-over-year comparison due to a large European special project that was completed inthe third quarter of 2008 which contributed to complementary revenue internal growth of negative9.8%. Adjusted OIBDA as a percentage of segment revenue increased in 2009 primarily due todisciplined cost management and productivity gains, partially offset by the completion of a large,high-margin European special project in the third quarter of 2008, increased rent and facility costs andincreased compensation expense related to investments in sales and business support during 2008and 2009.
Worldwide Digital Business
PercentageYear Ended Change
December 31, Dollar Constant Internal2009 2010 Change Actual Currency Growth
Segment Revenue . . . . . . . . . . . . . . . . . . $229,385 $231,420 $ 2,035 0.9% 1.0% (2.9)%
Segment Adjusted OIBDA(1) . . . . . . . . . . $ 50,303 $ 27,546 $(22,757) (45.2)% (45.2)%
Segment Adjusted OIBDA(1) as aPercentage of Segment Revenue . . . . . . 21.9% 11.9%
PercentageYear Ended Change
December 31, Dollar Constant Internal2008 2009 Change Actual Currency Growth
Segment Revenue . . . . . . . . . . . . . . . . . . . . $223,006 $229,385 $6,379 2.9% 3.6% 3.6%
Segment Adjusted OIBDA(1) . . . . . . . . . . . $ 41,782 $ 50,303 $8,521 20.4% 19.8%
Segment Adjusted OIBDA(1) as aPercentage of Segment Revenue . . . . . . . . 18.7% 21.9%
(1) See Note 9 to Notes to the Consolidated Financial Statements for definition of Adjusted OIBDAand for the basis on which allocations are made and a reconciliation of Adjusted OIBDA toincome (loss) before provision (benefit) for income taxes.
During the year ended December 31, 2010, revenue in our Worldwide Digital Business segmentincreased 0.9% over 2009. Mimosa, which we acquired in February 2010, contributed $10.8 million, or a4.7% increase in revenue. This increase was offset by lower pricing and longer new sales cycles in ourdigital business and soft demand for eDiscovery services. The sale of our domain name managementproduct line in August 2010 decreased 2010 reported revenues by 0.9% as compared to 2009. In theyear ended December 31, 2010, Adjusted OIBDA in the Worldwide Digital Business segment decreasedcompared to 2009 due to the impact of revenue mix and increased costs associated with the integrationof Mimosa.
During the year ended December 31, 2009, revenue in our Worldwide Digital Business segmentincreased 2.9% over 2008, due to strong performance in our eDiscovery business offset by a decrease indata restoration and license sales in 2009 over 2008. In the year ended December 31, 2009, AdjustedOIBDA in the Worldwide Digital Business segment increased compared to 2008 due to the impact ofrevenue mix and decreases in commissions and discretionary spending, including recruiting, travel andentertainment.
56
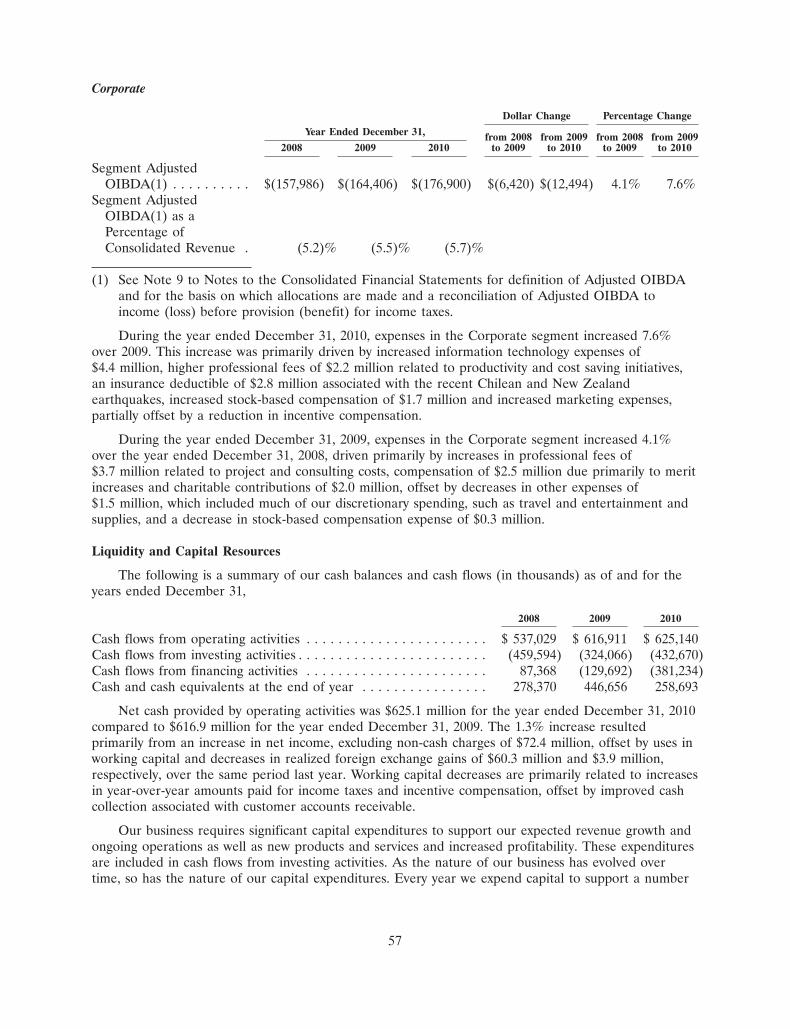
Corporate
Dollar Change Percentage Change
Year Ended December 31, from 2008 from 2009 from 2008 from 20092008 2009 2010 to 2009 to 2010 to 2009 to 2010
Segment AdjustedOIBDA(1) . . . . . . . . . . $(157,986) $(164,406) $(176,900) $(6,420) $(12,494) 4.1% 7.6%
Segment AdjustedOIBDA(1) as aPercentage ofConsolidated Revenue . (5.2)% (5.5)% (5.7)%
(1) See Note 9 to Notes to the Consolidated Financial Statements for definition of Adjusted OIBDAand for the basis on which allocations are made and a reconciliation of Adjusted OIBDA toincome (loss) before provision (benefit) for income taxes.
During the year ended December 31, 2010, expenses in the Corporate segment increased 7.6%over 2009. This increase was primarily driven by increased information technology expenses of$4.4 million, higher professional fees of $2.2 million related to productivity and cost saving initiatives,an insurance deductible of $2.8 million associated with the recent Chilean and New Zealandearthquakes, increased stock-based compensation of $1.7 million and increased marketing expenses,partially offset by a reduction in incentive compensation.
During the year ended December 31, 2009, expenses in the Corporate segment increased 4.1%over the year ended December 31, 2008, driven primarily by increases in professional fees of$3.7 million related to project and consulting costs, compensation of $2.5 million due primarily to meritincreases and charitable contributions of $2.0 million, offset by decreases in other expenses of$1.5 million, which included much of our discretionary spending, such as travel and entertainment andsupplies, and a decrease in stock-based compensation expense of $0.3 million.
Liquidity and Capital Resources
The following is a summary of our cash balances and cash flows (in thousands) as of and for theyears ended December 31,
2008 2009 2010
Cash flows from operating activities . . . . . . . . . . . . . . . . . . . . . . . $ 537,029 $ 616,911 $ 625,140Cash flows from investing activities . . . . . . . . . . . . . . . . . . . . . . . . (459,594) (324,066) (432,670)Cash flows from financing activities . . . . . . . . . . . . . . . . . . . . . . . 87,368 (129,692) (381,234)Cash and cash equivalents at the end of year . . . . . . . . . . . . . . . . 278,370 446,656 258,693
Net cash provided by operating activities was $625.1 million for the year ended December 31, 2010compared to $616.9 million for the year ended December 31, 2009. The 1.3% increase resultedprimarily from an increase in net income, excluding non-cash charges of $72.4 million, offset by uses inworking capital and decreases in realized foreign exchange gains of $60.3 million and $3.9 million,respectively, over the same period last year. Working capital decreases are primarily related to increasesin year-over-year amounts paid for income taxes and incentive compensation, offset by improved cashcollection associated with customer accounts receivable.
Our business requires significant capital expenditures to support our expected revenue growth andongoing operations as well as new products and services and increased profitability. These expendituresare included in cash flows from investing activities. As the nature of our business has evolved overtime, so has the nature of our capital expenditures. Every year we expend capital to support a number
57
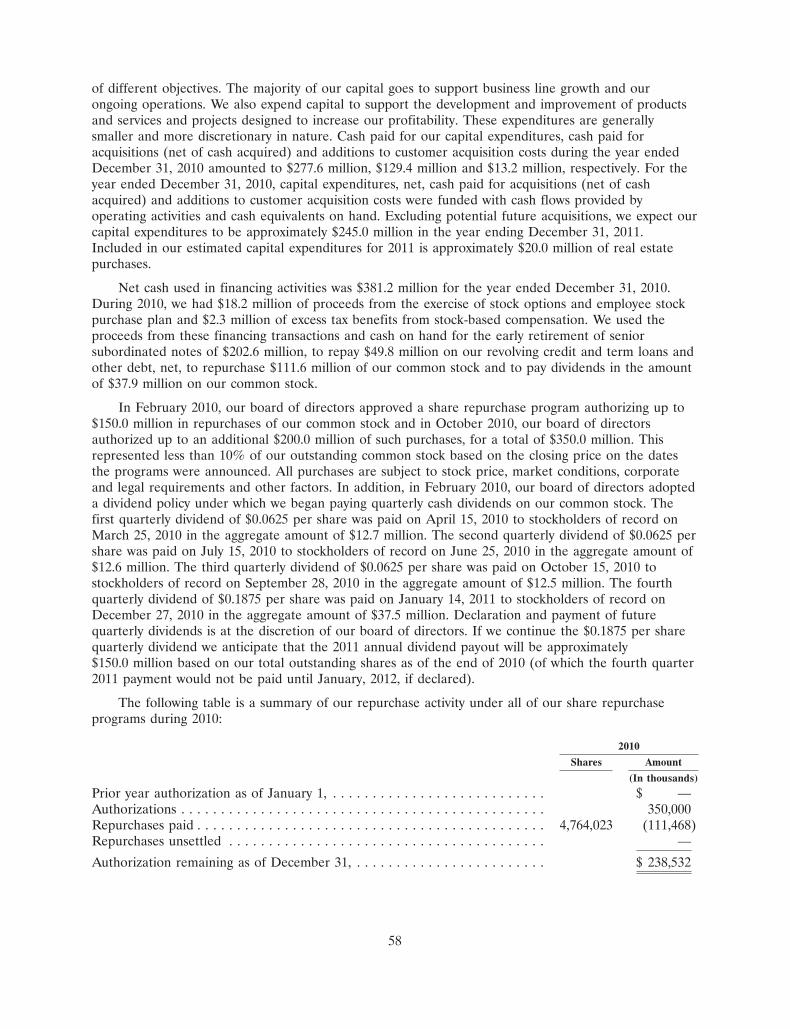
of different objectives. The majority of our capital goes to support business line growth and ourongoing operations. We also expend capital to support the development and improvement of productsand services and projects designed to increase our profitability. These expenditures are generallysmaller and more discretionary in nature. Cash paid for our capital expenditures, cash paid foracquisitions (net of cash acquired) and additions to customer acquisition costs during the year endedDecember 31, 2010 amounted to $277.6 million, $129.4 million and $13.2 million, respectively. For theyear ended December 31, 2010, capital expenditures, net, cash paid for acquisitions (net of cashacquired) and additions to customer acquisition costs were funded with cash flows provided byoperating activities and cash equivalents on hand. Excluding potential future acquisitions, we expect ourcapital expenditures to be approximately $245.0 million in the year ending December 31, 2011.Included in our estimated capital expenditures for 2011 is approximately $20.0 million of real estatepurchases.
Net cash used in financing activities was $381.2 million for the year ended December 31, 2010.During 2010, we had $18.2 million of proceeds from the exercise of stock options and employee stockpurchase plan and $2.3 million of excess tax benefits from stock-based compensation. We used theproceeds from these financing transactions and cash on hand for the early retirement of seniorsubordinated notes of $202.6 million, to repay $49.8 million on our revolving credit and term loans andother debt, net, to repurchase $111.6 million of our common stock and to pay dividends in the amountof $37.9 million on our common stock.
In February 2010, our board of directors approved a share repurchase program authorizing up to$150.0 million in repurchases of our common stock and in October 2010, our board of directorsauthorized up to an additional $200.0 million of such purchases, for a total of $350.0 million. Thisrepresented less than 10% of our outstanding common stock based on the closing price on the datesthe programs were announced. All purchases are subject to stock price, market conditions, corporateand legal requirements and other factors. In addition, in February 2010, our board of directors adopteda dividend policy under which we began paying quarterly cash dividends on our common stock. Thefirst quarterly dividend of $0.0625 per share was paid on April 15, 2010 to stockholders of record onMarch 25, 2010 in the aggregate amount of $12.7 million. The second quarterly dividend of $0.0625 pershare was paid on July 15, 2010 to stockholders of record on June 25, 2010 in the aggregate amount of$12.6 million. The third quarterly dividend of $0.0625 per share was paid on October 15, 2010 tostockholders of record on September 28, 2010 in the aggregate amount of $12.5 million. The fourthquarterly dividend of $0.1875 per share was paid on January 14, 2011 to stockholders of record onDecember 27, 2010 in the aggregate amount of $37.5 million. Declaration and payment of futurequarterly dividends is at the discretion of our board of directors. If we continue the $0.1875 per sharequarterly dividend we anticipate that the 2011 annual dividend payout will be approximately$150.0 million based on our total outstanding shares as of the end of 2010 (of which the fourth quarter2011 payment would not be paid until January, 2012, if declared).
The following table is a summary of our repurchase activity under all of our share repurchaseprograms during 2010:
2010
Shares Amount
(In thousands)
Prior year authorization as of January 1, . . . . . . . . . . . . . . . . . . . . . . . . . . . $ —Authorizations . . . . . . . . . . . . . . . . . . . . . . . . . . . . . . . . . . . . . . . . . . . . . . 350,000Repurchases paid . . . . . . . . . . . . . . . . . . . . . . . . . . . . . . . . . . . . . . . . . . . . 4,764,023 (111,468)Repurchases unsettled . . . . . . . . . . . . . . . . . . . . . . . . . . . . . . . . . . . . . . . . —
Authorization remaining as of December 31, . . . . . . . . . . . . . . . . . . . . . . . . $ 238,532
58

Due to the declining economic environment in 2008, the current fair market value of vans, trucksand mobile shredding units within our vehicle fleet portfolio, which we lease, have declined. As aresult, certain vehicle leases that previously met the requirements to be considered operating leaseshave been classified as capital leases, and certain others will be, upon renewal. The impact of thesechanges on our consolidated cash flow statement in the year ended December 31, 2009 and 2010 is thatpayments related to these leases previously reflected as a use of cash within the operating activitiessection of our consolidated statement of cash flows are now, and will be, reflected as a use of cashwithin the financing activities section of our consolidated statement of cash flows. For 2009 and 2010,the amount of this impact was $19.1 million and $21.9 million, respectively.
Financial instruments that potentially subject us to market risk consist principally of cash and cashequivalents (including money market funds and time deposits). As of December 31, 2010, we hadsignificant concentrations of liquid investments with seven global banks and four ‘‘Triple A’’ ratedmoney market funds which we consider to be large, highly rated investment grade institutions. As ofDecember 31, 2010, our cash and cash equivalent and restricted cash balance was $293.8 million,including money market funds and time deposits amounting to $241.2 million. A substantial portion ofthese money market funds are invested in U.S. treasuries.
We are highly leveraged and expect to continue to be highly leveraged for the foreseeable future.Our consolidated debt as of December 31, 2010 was comprised of the following (in thousands):
Revolving Credit Facility(1) . . . . . . . . . . . . . . . . . . . . . . . . . . . . . . . . . . . . . . . . . . . . . . $ —Term Loan Facility(1) . . . . . . . . . . . . . . . . . . . . . . . . . . . . . . . . . . . . . . . . . . . . . . . . . . 396,20071⁄4% GBP Senior Subordinated Notes due 2014(2) . . . . . . . . . . . . . . . . . . . . . . . . . . . . . 232,53073⁄4% Senior Subordinated Notes due 2015(2) . . . . . . . . . . . . . . . . . . . . . . . . . . . . . . . . . 233,23465⁄8% Senior Subordinated Notes due 2016(2) . . . . . . . . . . . . . . . . . . . . . . . . . . . . . . . . . 317,52971⁄2% CAD Senior Subordinated Notes due 2017 (the ‘‘Subsidiary Notes’’)(3) . . . . . . . . . . 175,30683⁄4% Senior Subordinated Notes due 2018(2) . . . . . . . . . . . . . . . . . . . . . . . . . . . . . . . . . 200,0008% Senior Subordinated Notes due 2018(2) . . . . . . . . . . . . . . . . . . . . . . . . . . . . . . . . . . 49,77763⁄4% Euro Senior Subordinated Notes due 2018(2) . . . . . . . . . . . . . . . . . . . . . . . . . . . . . 338,1298% Senior Subordinated Notes due 2020(2) . . . . . . . . . . . . . . . . . . . . . . . . . . . . . . . . . . 300,00083⁄8% Senior Subordinated Notes due 2021(2) . . . . . . . . . . . . . . . . . . . . . . . . . . . . . . . . . 548,174Real Estate Mortgages, Capital Leases and Other(4) . . . . . . . . . . . . . . . . . . . . . . . . . . . . 218,576
Total Long-term Debt . . . . . . . . . . . . . . . . . . . . . . . . . . . . . . . . . . . . . . . . . . . . . . . . . 3,009,455Less Current Portion . . . . . . . . . . . . . . . . . . . . . . . . . . . . . . . . . . . . . . . . . . . . . . . . . . . (96,990)
Long-term Debt, Net of Current Portion . . . . . . . . . . . . . . . . . . . . . . . . . . . . . . . . . $2,912,465
(1) The capital stock or other equity interests of most of our U.S. subsidiaries, and up to 66% of thecapital stock or other equity interests of our first tier foreign subsidiaries, are pledged to securethese debt instruments, together with all intercompany obligations of foreign subsidiaries owed tous or to one of our U.S. subsidiary guarantors.
(2) Collectively referred to as the Parent Notes. Iron Mountain Incorporated (‘‘IMI’’) is the directobligor on the Parent Notes, which are fully and unconditionally guaranteed, on a seniorsubordinated basis, by substantially all of its direct and indirect 100% owned U.S. subsidiaries (the‘‘Guarantors’’). These guarantees are joint and several obligations of the Guarantors. IronMountain Canada Corporation (‘‘Canada Company’’) and the remainder of our subsidiaries do notguarantee the Parent Notes.
(3) Canada Company is the direct obligor on the Subsidiary Notes, which are fully and unconditionallyguaranteed, on a senior subordinated basis, by IMI and the Guarantors. These guarantees are jointand several obligations of IMI and the Guarantors.
59

(4) Includes (a) real estate mortgages of $7.5 million, (b) capital lease obligations of $201.9 million,and (c) other various notes and other obligations, which were assumed by us as a result of certainacquisitions, of $9.2 million.
Our credit facility consists of (i) revolving credit facilities under which we can borrow, subject tocertain limitations as defined in the credit agreement we entered into on April 16, 2007 governing thisfacility (the ‘‘Credit Agreement’’), up to an aggregate amount of $765.0 million (including Canadiandollar and multi-currency revolving credit facilities), and (ii) a $410.0 million term loan facility. Ourrevolving credit facility is supported by a group of 24 banks. Our subsidiaries, Canada Company andIron Mountain Switzerland GmbH, may borrow directly under the Canadian revolving credit and multi-currency revolving credit facilities, respectively. Additional subsidiary borrowers may be added underthe multi-currency revolving credit facility. The revolving credit facility terminates on April 16, 2012.With respect to the term loan facility, quarterly loan payments of approximately $1.0 million arerequired through maturity on April 16, 2014, at which time the remaining outstanding principal balanceof the term loan facility is due. The interest rate on borrowings under the Credit Agreement variesdepending on our choice of interest rate and currency options, plus an applicable margin. IMIguarantees the obligations of each of the subsidiary borrowers under the Credit Agreement, andsubstantially all of our U.S. subsidiaries guarantee the obligations of IMI and the subsidiary borrowers.The capital stock or other equity interests of most of our U.S. subsidiaries, and up to 66% of thecapital stock or other equity interests of our first tier foreign subsidiaries, are pledged to secure theCredit Agreement, together with all intercompany obligations of foreign subsidiaries owed to us or toone of our U.S. subsidiary guarantors. As of December 31, 2010, we had no outstanding borrowingsunder the revolving credit facility; we had various outstanding letters of credit totaling $2.5 million. Theremaining availability, based on IMI’s leverage ratio, which is calculated based on the last 12 months’earnings before interest, taxes, depreciation and amortization (‘‘EBITDA’’), and other adjustments asdefined in the Credit Agreement and current external debt, under the revolving credit facility onDecember 31, 2010, was $762.5 million. The interest rate in effect under the term loan facility was1.8% as of December 31, 2010.
The Credit Agreement, our indentures and other agreements governing our indebtedness containcertain restrictive financial and operating covenants, including covenants that restrict our ability tocomplete acquisitions, pay cash dividends, incur indebtedness, make investments, sell assets and takecertain other corporate actions. The covenants do not contain a rating trigger. Therefore, a change inour debt rating would not trigger a default under the Credit Agreement, our indentures or otheragreements governing our indebtedness. Our revolving credit and term loan facilities, as well as ourindentures, use EBITDA based calculations as primary measures of financial performance, includingleverage ratios. IMI’s revolving credit and term leverage ratio was 3.3 and 2.9 as of December 31, 2009and 2010, respectively, compared to a maximum allowable ratio of 5.5. Similarly, our bond leverageratio, per the indentures, was 4.1 and 3.4 as of December 31, 2009 and 2010, respectively, compared toa maximum allowable ratio of 6.5. Noncompliance with these leverage ratios would have a materialadverse effect on our financial condition and liquidity. In the fourth quarter of 2007, we designated asExcluded Restricted Subsidiaries (as defined in the indentures), certain of our subsidiaries that own ourassets and conduct our operations in the United Kingdom. As a result of such designation, thesesubsidiaries are now subject to substantially all of the covenants of the indentures, except that they arenot required to provide a guarantee, and the EBITDA and debt of these subsidiaries is included forpurposes of calculating the leverage ratio.
Our ability to pay interest on or to refinance our indebtedness depends on our futureperformance, working capital levels and capital structure, which are subject to general economic,financial, competitive, legislative, regulatory and other factors which may be beyond our control. Therecan be no assurance that we will generate sufficient cash flow from our operations or that future
60

financings will be available on acceptable terms or in amounts sufficient to enable us to service orrefinance our indebtedness, or to make necessary capital expenditures.
In February 2010, we acquired the stock of Mimosa, a provider of enterprise-class digital contentarchiving solutions, for approximately $112.0 million in cash and approximately $2.0 million in fairvalue of options issued. Mimosa, based in Santa Clara, California, provides an on-premises integratedarchive for email, SharePoint� data and files, and complements IMI’s existing enterprise-class, cloud-based digital archive services. NearPoint�, Mimosa’s enterprise archiving platform, has applications forretention and disposition, eDiscovery, compliance supervision, classification, recovery, and end-usersearch, enabling customers to reduce risk, and lower their eDiscovery and storage costs.
In September 2010, we redeemed $200.0 million of the $431.3 million aggregate principal amountoutstanding of the 73⁄4% Notes at a redemption price of $1,012.92 for each one thousand dollars ofprincipal amount of the notes redeemed, plus accrued and unpaid interest. We recorded a charge toother expense (income), net of $1.8 million in the third quarter of 2010 related to the earlyextinguishment of the 73⁄4% Notes being redeemed. This charge consists of the call premium anddeferred financing costs, net of original issue premiums related to the 73⁄4% Notes that were redeemed.In January 2011, we redeemed the remaining $231.3 million aggregate principal amount outstanding ofthe 73⁄4% Notes at a redemption price of $1,000 for each one thousand dollars of principal amount ofnotes redeemed, plus accrued and unpaid interest. We will record a gain to other expense (income), netof approximately $0.8 million in the first quarter of 2011 related to the early extinguishment of the73⁄4% Notes being redeemed. This gain consists of original issue premiums, net of deferred financingcosts related to the 73⁄4% Notes that were redeemed.
In January 2011, we acquired the remaining 80% interest of our joint venture in Poland (IronMountain Poland Holdings Limited) in a stock transaction for an estimated purchase price of$69.5 million, including an initial cash purchase price of $35.0 million. As a result, we now own 100%of our Polish operations, which provide storage and records management services. The terms of thepurchase and sale agreement requires a second payment based upon the audited financial results of thejoint venture for the period April 1, 2010 through March 31, 2011. This payment is based upon aformula defined in the purchase and sale agreement and is expected to be paid in the second quarterof 2011. Our current estimate of the second payment is approximately $32.0 million. Additionally, thepurchase and sale agreement provides for the payment of up to a maximum of $2.5 million ofcontingent consideration to be paid in July 2012 based upon meeting certain performance criteria. Thecarrying value of the 20% interest that we owned and accounted for under the equity method ofaccounting amounted to approximately $5.5 million as of December 31, 2010. We will calculate the fairvalue of such interest on the date of the acquisition of the additional 80% interest and will record again during the first quarter of 2011 to other (income) expense, net included in the consolidatedstatement of operations. One of the members of our board of directors and several of his familymembers hold an indirect equity interest in one of the shareholders that will receive proceeds inconnection with this transaction. As a result of this equity interest, our board member together withseveral of his family members will receive approximately 24% of the purchase price that we pay inconnection with this transaction.
61

Contractual Obligations
The following table summarizes our contractual obligations as of December 31, 2010 and theanticipated effect of these obligations on our liquidity in future years (in thousands):
Payments Due by Period
Less than More thanTotal 1 Year 1-3 Years 3-5 Years 5 Years
Capital Lease Obligations . . . . . . . . . . . . $ 201,857 $ 34,531 $ 66,148 $ 26,103 $ 75,075Long-Term Debt Obligations
(excluding Capital Lease Obligations) . . 2,812,193 62,459 13,142 798,014 1,938,578Interest Payments(1) . . . . . . . . . . . . . . . . 1,455,156 188,871 365,869 321,171 579,245Operating Lease Obligations(2) . . . . . . . . 2,917,267 223,671 419,600 381,064 1,892,932Purchase and Asset Retirement
Obligations(3) . . . . . . . . . . . . . . . . . 46,814 28,116 6,704 1,848 10,146
Total(4) . . . . . . . . . . . . . . . . . . . . . . . . . $7,433,287 $537,648 $871,463 $1,528,200 $4,495,976
(1) Amounts include variable rate interest payments, which are calculated utilizing the applicableinterest rates as of December 31, 2010; see Note 4 to Notes to Consolidated Financial Statements.Amounts also include interest on capital leases.
(2) Amounts are offset by sublease income of $11.2 million in total (including $2.7 million,$3.8 million, $2.8 million and $1.9 million, in less than 1 year, 1-3 years, 3-5 years and more than5 years, respectively).
(3) In connection with some of our acquisitions, we have potential earn-out obligations that may bepayable in the event businesses we acquired meet certain financial objectives. These payments arebased on the future results of these operations, and our estimate of the maximum contingentearn-out payments we may be required to make under all such agreements as of December 31,2010 is approximately $2.0 million.
(4) The table above excludes $59.9 million in uncertain tax positions as we are unable to makereasonably reliable estimates of the period of cash settlement, if any, with the respective taxingauthorities.
We expect to meet our cash flow requirements for the next twelve months from cash generatedfrom operations, existing cash, cash equivalents, borrowings under the Credit Agreement and otherfinancings, which may include secured credit facilities, securitizations and mortgage or capital leasefinancings. We expect to meet our long-term cash flow requirements using the same means describedabove, as well as the potential issuance of debt or equity securities as we deem appropriate.
Off-Balance Sheet Arrangements
We have no off-balance sheet arrangements as defined in Regulation S-K Item 303(a)(4)(ii).
Net Operating Losses, Research Credits and Foreign Tax Credit Carryforwards
We have federal net operating loss carryforwards which begin to expire in 2020 through 2029 of$84.3 million ($29.5 million, tax effected) at December 31, 2010 to reduce future federal taxableincome. We have an asset for state net operating losses of $15.6 million (net of federal tax benefit),which begins to expire in 2011 through 2029, subject to a valuation allowance of approximately 75%.We have assets for foreign net operating losses of $38.1 million, with various expiration dates, subjectto a valuation allowance of approximately 74%. Additionally, we have federal research credits of$2.2 million which begin to expire in 2022 through 2029 and state research credits of $1.1 million (net
62
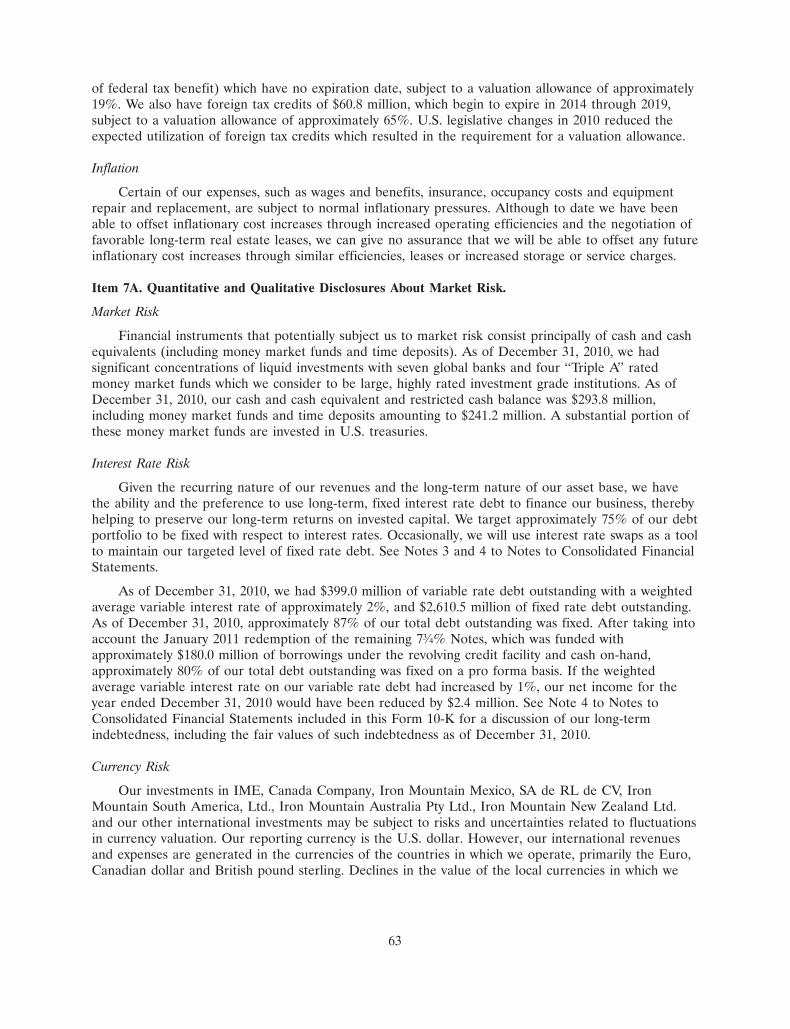
of federal tax benefit) which have no expiration date, subject to a valuation allowance of approximately19%. We also have foreign tax credits of $60.8 million, which begin to expire in 2014 through 2019,subject to a valuation allowance of approximately 65%. U.S. legislative changes in 2010 reduced theexpected utilization of foreign tax credits which resulted in the requirement for a valuation allowance.
Inflation
Certain of our expenses, such as wages and benefits, insurance, occupancy costs and equipmentrepair and replacement, are subject to normal inflationary pressures. Although to date we have beenable to offset inflationary cost increases through increased operating efficiencies and the negotiation offavorable long-term real estate leases, we can give no assurance that we will be able to offset any futureinflationary cost increases through similar efficiencies, leases or increased storage or service charges.
Item 7A. Quantitative and Qualitative Disclosures About Market Risk.
Market Risk
Financial instruments that potentially subject us to market risk consist principally of cash and cashequivalents (including money market funds and time deposits). As of December 31, 2010, we hadsignificant concentrations of liquid investments with seven global banks and four ‘‘Triple A’’ ratedmoney market funds which we consider to be large, highly rated investment grade institutions. As ofDecember 31, 2010, our cash and cash equivalent and restricted cash balance was $293.8 million,including money market funds and time deposits amounting to $241.2 million. A substantial portion ofthese money market funds are invested in U.S. treasuries.
Interest Rate Risk
Given the recurring nature of our revenues and the long-term nature of our asset base, we havethe ability and the preference to use long-term, fixed interest rate debt to finance our business, therebyhelping to preserve our long-term returns on invested capital. We target approximately 75% of our debtportfolio to be fixed with respect to interest rates. Occasionally, we will use interest rate swaps as a toolto maintain our targeted level of fixed rate debt. See Notes 3 and 4 to Notes to Consolidated FinancialStatements.
As of December 31, 2010, we had $399.0 million of variable rate debt outstanding with a weightedaverage variable interest rate of approximately 2%, and $2,610.5 million of fixed rate debt outstanding.As of December 31, 2010, approximately 87% of our total debt outstanding was fixed. After taking intoaccount the January 2011 redemption of the remaining 73⁄4% Notes, which was funded withapproximately $180.0 million of borrowings under the revolving credit facility and cash on-hand,approximately 80% of our total debt outstanding was fixed on a pro forma basis. If the weightedaverage variable interest rate on our variable rate debt had increased by 1%, our net income for theyear ended December 31, 2010 would have been reduced by $2.4 million. See Note 4 to Notes toConsolidated Financial Statements included in this Form 10-K for a discussion of our long-termindebtedness, including the fair values of such indebtedness as of December 31, 2010.
Currency Risk
Our investments in IME, Canada Company, Iron Mountain Mexico, SA de RL de CV, IronMountain South America, Ltd., Iron Mountain Australia Pty Ltd., Iron Mountain New Zealand Ltd.and our other international investments may be subject to risks and uncertainties related to fluctuationsin currency valuation. Our reporting currency is the U.S. dollar. However, our international revenuesand expenses are generated in the currencies of the countries in which we operate, primarily the Euro,Canadian dollar and British pound sterling. Declines in the value of the local currencies in which we
63
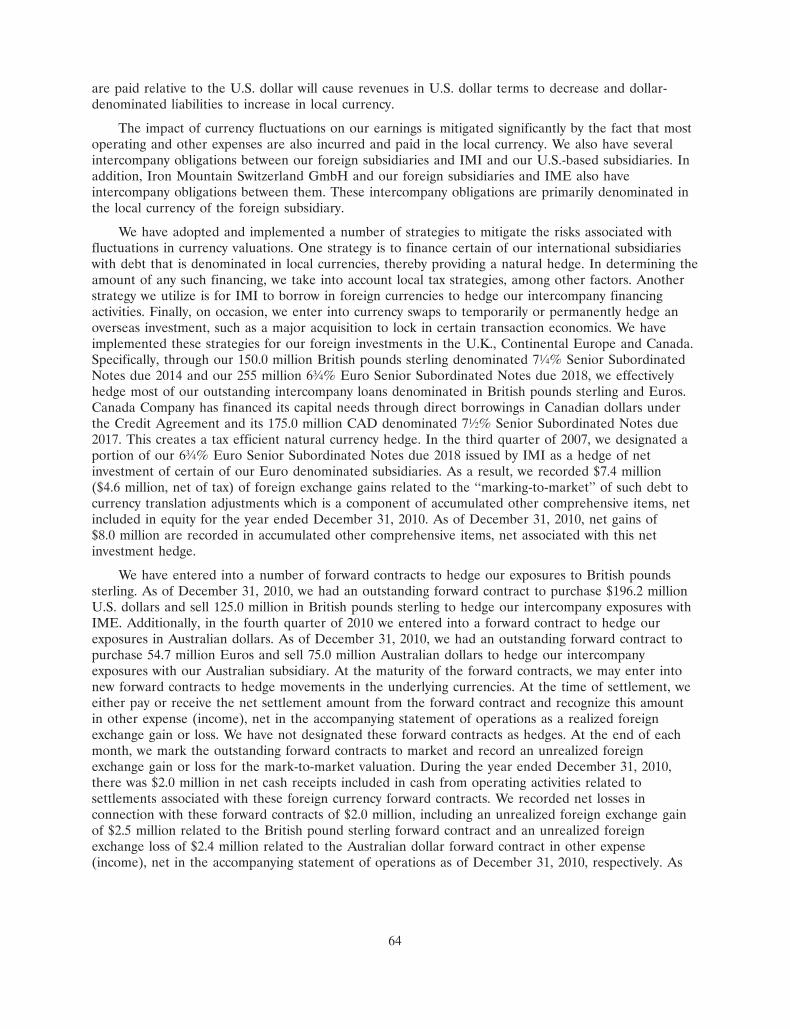
are paid relative to the U.S. dollar will cause revenues in U.S. dollar terms to decrease and dollar-denominated liabilities to increase in local currency.
The impact of currency fluctuations on our earnings is mitigated significantly by the fact that mostoperating and other expenses are also incurred and paid in the local currency. We also have severalintercompany obligations between our foreign subsidiaries and IMI and our U.S.-based subsidiaries. Inaddition, Iron Mountain Switzerland GmbH and our foreign subsidiaries and IME also haveintercompany obligations between them. These intercompany obligations are primarily denominated inthe local currency of the foreign subsidiary.
We have adopted and implemented a number of strategies to mitigate the risks associated withfluctuations in currency valuations. One strategy is to finance certain of our international subsidiarieswith debt that is denominated in local currencies, thereby providing a natural hedge. In determining theamount of any such financing, we take into account local tax strategies, among other factors. Anotherstrategy we utilize is for IMI to borrow in foreign currencies to hedge our intercompany financingactivities. Finally, on occasion, we enter into currency swaps to temporarily or permanently hedge anoverseas investment, such as a major acquisition to lock in certain transaction economics. We haveimplemented these strategies for our foreign investments in the U.K., Continental Europe and Canada.Specifically, through our 150.0 million British pounds sterling denominated 71⁄4% Senior SubordinatedNotes due 2014 and our 255 million 63⁄4% Euro Senior Subordinated Notes due 2018, we effectivelyhedge most of our outstanding intercompany loans denominated in British pounds sterling and Euros.Canada Company has financed its capital needs through direct borrowings in Canadian dollars underthe Credit Agreement and its 175.0 million CAD denominated 71⁄2% Senior Subordinated Notes due2017. This creates a tax efficient natural currency hedge. In the third quarter of 2007, we designated aportion of our 63⁄4% Euro Senior Subordinated Notes due 2018 issued by IMI as a hedge of netinvestment of certain of our Euro denominated subsidiaries. As a result, we recorded $7.4 million($4.6 million, net of tax) of foreign exchange gains related to the ‘‘marking-to-market’’ of such debt tocurrency translation adjustments which is a component of accumulated other comprehensive items, netincluded in equity for the year ended December 31, 2010. As of December 31, 2010, net gains of$8.0 million are recorded in accumulated other comprehensive items, net associated with this netinvestment hedge.
We have entered into a number of forward contracts to hedge our exposures to British poundssterling. As of December 31, 2010, we had an outstanding forward contract to purchase $196.2 millionU.S. dollars and sell 125.0 million in British pounds sterling to hedge our intercompany exposures withIME. Additionally, in the fourth quarter of 2010 we entered into a forward contract to hedge ourexposures in Australian dollars. As of December 31, 2010, we had an outstanding forward contract topurchase 54.7 million Euros and sell 75.0 million Australian dollars to hedge our intercompanyexposures with our Australian subsidiary. At the maturity of the forward contracts, we may enter intonew forward contracts to hedge movements in the underlying currencies. At the time of settlement, weeither pay or receive the net settlement amount from the forward contract and recognize this amountin other expense (income), net in the accompanying statement of operations as a realized foreignexchange gain or loss. We have not designated these forward contracts as hedges. At the end of eachmonth, we mark the outstanding forward contracts to market and record an unrealized foreignexchange gain or loss for the mark-to-market valuation. During the year ended December 31, 2010,there was $2.0 million in net cash receipts included in cash from operating activities related tosettlements associated with these foreign currency forward contracts. We recorded net losses inconnection with these forward contracts of $2.0 million, including an unrealized foreign exchange gainof $2.5 million related to the British pound sterling forward contract and an unrealized foreignexchange loss of $2.4 million related to the Australian dollar forward contract in other expense(income), net in the accompanying statement of operations as of December 31, 2010, respectively. As
64

of December 31, 2010, except as noted above, our currency exposures to intercompany balances areunhedged.
The impact of devaluation or depreciating currency on an entity depends on the residual effect onthe local economy and the ability of an entity to raise prices and/or reduce expenses. Due to ourconstantly changing currency exposure and the potential substantial volatility of currency exchangerates, we cannot predict the effect of exchange fluctuations on our business. The effect of a change inforeign exchange rates on our net investment in foreign subsidiaries is reflected in the ‘‘AccumulatedOther Comprehensive Items, net’’ component of equity. A 10% depreciation in year-end 2010functional currencies, relative to the U.S. dollar, would result in a reduction in our equity ofapproximately $80.4 million.
Item 8. Financial Statements and Supplementary Data.
The information required by this item is included in Item 15(a) of this Annual Report onForm 10-K.
Item 9. Changes in and Disagreements with Accountants on Accounting and Financial Disclosure.
None.
Item 9A. Controls and Procedures.
Disclosure Controls and Procedures
The term ‘‘disclosure controls and procedures’’ is defined in Rules 13a-15(e) and 15d-15(e) of theSecurities Exchange Act of 1934, as amended (the ‘‘Exchange Act’’). These rules refer to the controlsand other procedures of a company that are designed to ensure that information is recorded,processed, summarized and communicated to management, including its principal executive andprincipal financial officers, as appropriate to allow timely decisions regarding what is required to bedisclosed by a company in the reports that it files under the Exchange Act. As of December 31, 2010(the ‘‘Evaluation Date’’), we carried out an evaluation, under the supervision and with the participationof our management, including our chief executive officer and chief financial officer, of the effectivenessof our disclosure controls and procedures. Based upon that evaluation, our chief executive officer andchief financial officer have concluded that, as of the Evaluation Date, our disclosure controls andprocedures are effective.
Management’s Report on Internal Control over Financial Reporting
Our management is responsible for establishing and maintaining adequate internal control overfinancial reporting, as such term is defined in Rule 13a-15(f) of the Exchange Act. Under thesupervision and with the participation of our management, including our chief executive officer andchief financial officer, we conducted an evaluation of the effectiveness of our internal control overfinancial reporting based on the framework in Internal Control—Integrated Framework issued by theCommittee of Sponsoring Organizations of the Treadway Commission. Based on our evaluation underthe framework in Internal Control—Integrated Framework, our management concluded that our internalcontrol over financial reporting was effective as of December 31, 2010.
The effectiveness of our internal control over financial reporting has been audited by Deloitte &Touche LLP, an independent registered public accounting firm, as stated in their report which isincluded herein.
65

REPORT OF INDEPENDENT REGISTERED PUBLIC ACCOUNTING FIRM
To the Board of Directors and Stockholders of Iron Mountain Incorporated
We have audited the internal control over financial reporting of Iron Mountain Incorporated andsubsidiaries (the ‘‘Company’’) as of December 31, 2010, based on criteria established in InternalControl—Integrated Framework issued by the Committee of Sponsoring Organizations of the TreadwayCommission. The Company’s management is responsible for maintaining effective internal control overfinancial reporting and for its assessment of the effectiveness of internal control over financialreporting, included in the accompanying Management’s Report on Internal Control Over FinancialReporting. Our responsibility is to express an opinion on the Company’s internal control over financialreporting based on our audit.
We conducted our audit in accordance with the standards of the Public Company AccountingOversight Board (United States). Those standards require that we plan and perform the audit to obtainreasonable assurance about whether effective internal control over financial reporting was maintainedin all material respects. Our audit included obtaining an understanding of internal control overfinancial reporting, assessing the risk that a material weakness exists, testing and evaluating the designand operating effectiveness of internal control based on the assessed risk, and performing such otherprocedures as we considered necessary in the circumstances. We believe that our audit provides areasonable basis for our opinion.
A company’s internal control over financial reporting is a process designed by, or under thesupervision of, the company’s principal executive and principal financial officers, or persons performingsimilar functions, and effected by the company’s board of directors, management, and other personnelto provide reasonable assurance regarding the reliability of financial reporting and the preparation offinancial statements for external purposes in accordance with generally accepted accounting principles.A company’s internal control over financial reporting includes those policies and procedures that(1) pertain to the maintenance of records that, in reasonable detail, accurately and fairly reflect thetransactions and dispositions of the assets of the company; (2) provide reasonable assurance thattransactions are recorded as necessary to permit preparation of financial statements in accordance withgenerally accepted accounting principles, and that receipts and expenditures of the company are beingmade only in accordance with authorizations of management and directors of the company; and(3) provide reasonable assurance regarding prevention or timely detection of unauthorized acquisition,use, or disposition of the company’s assets that could have a material effect on the financial statements.
Because of the inherent limitations of internal control over financial reporting, including thepossibility of collusion or improper management override of controls, material misstatements due toerror or fraud may not be prevented or detected on a timely basis. Also, projections of any evaluationof the effectiveness of the internal control over financial reporting to future periods are subject to therisk that the controls may become inadequate because of changes in conditions, or that the degree ofcompliance with the policies or procedures may deteriorate.
In our opinion, the Company maintained, in all material respects, effective internal control overfinancial reporting as of December 31, 2010, based on the criteria established in Internal Control—Integrated Framework issued by the Committee of Sponsoring Organizations of the TreadwayCommission.
We have also audited, in accordance with the standards of the Public Company AccountingOversight Board (United States), the consolidated financial statements as of and for the year endedDecember 31, 2010 of the Company and our report dated February 28, 2011 expressed an unqualifiedopinion on those financial statements.
/s/ DELOITTE & TOUCHE LLP
Boston, MassachusettsFebruary 28, 2011
66

Changes in Internal Control over Financial Reporting
There have been no changes in our internal control over financial reporting during the quarterended December 31, 2010 that have materially affected, or are reasonably likely to materially affect,our internal control over financial reporting.
Item 9B. Other Information.
None.
67

PART III
Item 10. Directors, Executive Officers and Corporate Governance.
The information required by Item 10 is incorporated by reference to our definitive ProxyStatement for our 2011 Annual Meeting of Stockholders.
Item 11. Executive Compensation.
The information required by Item 11 is incorporated by reference to our definitive ProxyStatement for our 2011 Annual Meeting of Stockholders.
Item 12. Security Ownership of Certain Beneficial Owners and Management and Related StockholderMatters.
The information required by Item 12 is incorporated by reference to our definitive ProxyStatement for our 2011 Annual Meeting of Stockholders.
Item 13. Certain Relationships and Related Transactions, and Director Independence.
The information required by Item 13 is incorporated by reference to our definitive ProxyStatement for our 2011 Annual Meeting of Stockholders.
Item 14. Principal Accountant Fees and Services.
The information required by Item 14 is incorporated by reference to our definitive ProxyStatement for our 2011 Annual Meeting of Stockholders.
PART IV
Item 15. Exhibits, Financial Statement Schedules.
(a) Financial Statements and Financial Statement Schedules filed as part of this report:
Page
A. Iron Mountain Incorporated
Report of Independent Registered Public Accounting Firm . . . . . . . . . . . . . . . . . . . . . . . . . . . . 69
Consolidated Balance Sheets, December 31, 2009 and 2010 . . . . . . . . . . . . . . . . . . . . . . . . . . . . 70
Consolidated Statements of Operations, Years Ended December 31, 2008, 2009 and 2010 . . . . . . 71
Consolidated Statements of Equity, Years Ended December 31, 2008, 2009 and 2010 . . . . . . . . . 72
Consolidated Statements of Comprehensive Income (Loss), Years Ended December 31, 2008,2009 and 2010 . . . . . . . . . . . . . . . . . . . . . . . . . . . . . . . . . . . . . . . . . . . . . . . . . . . . . . . . . . . 73
Consolidated Statements of Cash Flows, Years Ended December 31, 2008, 2009 and 2010 . . . . . . 74
Notes to Consolidated Financial Statements . . . . . . . . . . . . . . . . . . . . . . . . . . . . . . . . . . . . . . . 75
(b) Exhibits filed as part of this report: As listed in the Exhibit Index following the signature page hereof.
68

REPORT OF INDEPENDENT REGISTERED PUBLIC ACCOUNTING FIRM
To the Board of Directors and Stockholders of Iron Mountain Incorporated
We have audited the accompanying consolidated balance sheets of Iron Mountain Incorporatedand subsidiaries (the ‘‘Company’’) as of December 31, 2010 and 2009, and the related consolidatedstatements of operations, equity, comprehensive income (loss), and cash flows for each of the threeyears in the period ended December 31, 2010. These financial statements are the responsibility of theCompany’s management. Our responsibility is to express an opinion on these financial statements basedon our audits.
We conducted our audits in accordance with the standards of the Public Company AccountingOversight Board (United States). Those standards require that we plan and perform the audit to obtainreasonable assurance about whether the financial statements are free of material misstatement. Anaudit includes examining, on a test basis, evidence supporting the amounts and disclosures in thefinancial statements. An audit also includes assessing the accounting principles used and significantestimates made by management, as well as evaluating the overall financial statement presentation. Webelieve that our audits provide a reasonable basis for our opinion.
In our opinion, such consolidated financial statements present fairly, in all material respects, thefinancial position of Iron Mountain Incorporated and subsidiaries as of December 31, 2010 and 2009,and the results of their operations and their cash flows for each of the three years in the period endedDecember 31, 2010, in conformity with accounting principles generally accepted in the United States ofAmerica.
We have also audited, in accordance with the standards of the Public Company AccountingOversight Board (United States), the Company’s internal control over financial reporting as ofDecember 31, 2010, based on the criteria established in Internal Control—Integrated Framework issuedby the Committee of Sponsoring Organizations of the Treadway Commission and our report datedFebruary 28, 2011 expressed an unqualified opinion on the Company’s internal control over financialreporting.
/s/ DELOITTE & TOUCHE LLP
Boston, MassachusettsFebruary 28, 2011
69
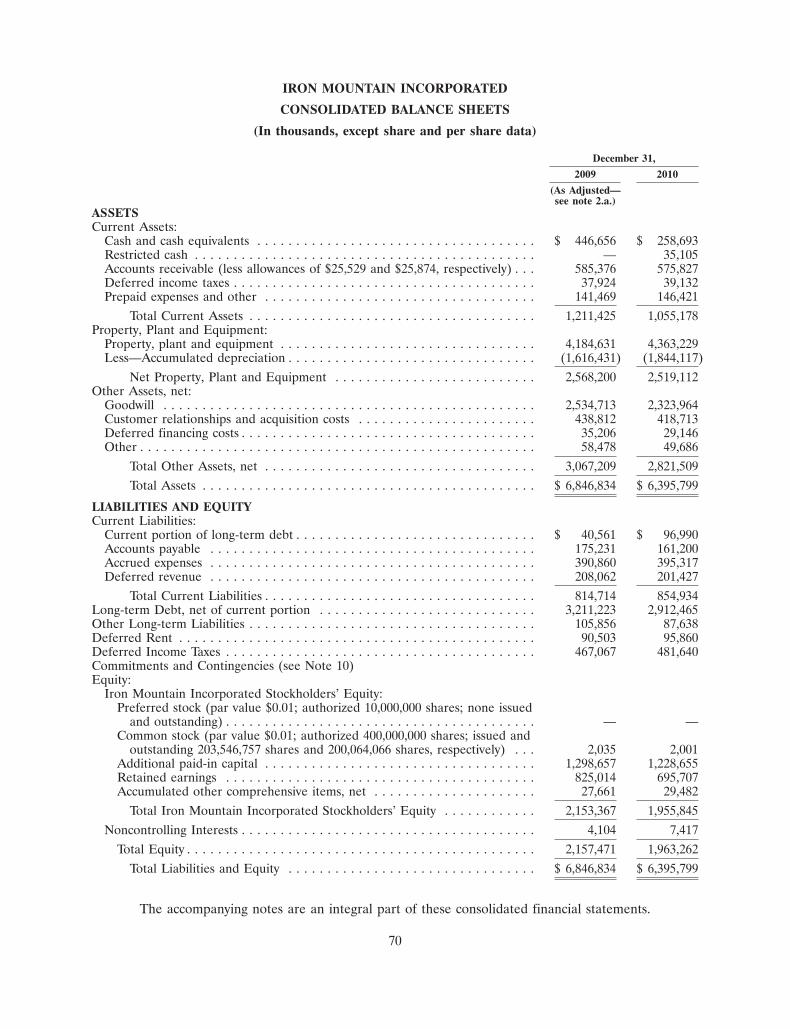
IRON MOUNTAIN INCORPORATED
CONSOLIDATED BALANCE SHEETS
(In thousands, except share and per share data)
December 31,
2009 2010
(As Adjusted—see note 2.a.)
ASSETSCurrent Assets:
Cash and cash equivalents . . . . . . . . . . . . . . . . . . . . . . . . . . . . . . . . . . . . $ 446,656 $ 258,693Restricted cash . . . . . . . . . . . . . . . . . . . . . . . . . . . . . . . . . . . . . . . . . . . . — 35,105Accounts receivable (less allowances of $25,529 and $25,874, respectively) . . . 585,376 575,827Deferred income taxes . . . . . . . . . . . . . . . . . . . . . . . . . . . . . . . . . . . . . . . 37,924 39,132Prepaid expenses and other . . . . . . . . . . . . . . . . . . . . . . . . . . . . . . . . . . . 141,469 146,421
Total Current Assets . . . . . . . . . . . . . . . . . . . . . . . . . . . . . . . . . . . . . 1,211,425 1,055,178Property, Plant and Equipment:
Property, plant and equipment . . . . . . . . . . . . . . . . . . . . . . . . . . . . . . . . . 4,184,631 4,363,229Less—Accumulated depreciation . . . . . . . . . . . . . . . . . . . . . . . . . . . . . . . . (1,616,431) (1,844,117)
Net Property, Plant and Equipment . . . . . . . . . . . . . . . . . . . . . . . . . . 2,568,200 2,519,112Other Assets, net:
Goodwill . . . . . . . . . . . . . . . . . . . . . . . . . . . . . . . . . . . . . . . . . . . . . . . . 2,534,713 2,323,964Customer relationships and acquisition costs . . . . . . . . . . . . . . . . . . . . . . . 438,812 418,713Deferred financing costs . . . . . . . . . . . . . . . . . . . . . . . . . . . . . . . . . . . . . . 35,206 29,146Other . . . . . . . . . . . . . . . . . . . . . . . . . . . . . . . . . . . . . . . . . . . . . . . . . . . 58,478 49,686
Total Other Assets, net . . . . . . . . . . . . . . . . . . . . . . . . . . . . . . . . . . . 3,067,209 2,821,509
Total Assets . . . . . . . . . . . . . . . . . . . . . . . . . . . . . . . . . . . . . . . . . . . $ 6,846,834 $ 6,395,799
LIABILITIES AND EQUITYCurrent Liabilities:
Current portion of long-term debt . . . . . . . . . . . . . . . . . . . . . . . . . . . . . . . $ 40,561 $ 96,990Accounts payable . . . . . . . . . . . . . . . . . . . . . . . . . . . . . . . . . . . . . . . . . . 175,231 161,200Accrued expenses . . . . . . . . . . . . . . . . . . . . . . . . . . . . . . . . . . . . . . . . . . 390,860 395,317Deferred revenue . . . . . . . . . . . . . . . . . . . . . . . . . . . . . . . . . . . . . . . . . . 208,062 201,427
Total Current Liabilities . . . . . . . . . . . . . . . . . . . . . . . . . . . . . . . . . . . 814,714 854,934Long-term Debt, net of current portion . . . . . . . . . . . . . . . . . . . . . . . . . . . . 3,211,223 2,912,465Other Long-term Liabilities . . . . . . . . . . . . . . . . . . . . . . . . . . . . . . . . . . . . . 105,856 87,638Deferred Rent . . . . . . . . . . . . . . . . . . . . . . . . . . . . . . . . . . . . . . . . . . . . . . 90,503 95,860Deferred Income Taxes . . . . . . . . . . . . . . . . . . . . . . . . . . . . . . . . . . . . . . . . 467,067 481,640Commitments and Contingencies (see Note 10)Equity:
Iron Mountain Incorporated Stockholders’ Equity:Preferred stock (par value $0.01; authorized 10,000,000 shares; none issued
and outstanding) . . . . . . . . . . . . . . . . . . . . . . . . . . . . . . . . . . . . . . . . — —Common stock (par value $0.01; authorized 400,000,000 shares; issued and
outstanding 203,546,757 shares and 200,064,066 shares, respectively) . . . 2,035 2,001Additional paid-in capital . . . . . . . . . . . . . . . . . . . . . . . . . . . . . . . . . . . 1,298,657 1,228,655Retained earnings . . . . . . . . . . . . . . . . . . . . . . . . . . . . . . . . . . . . . . . . 825,014 695,707Accumulated other comprehensive items, net . . . . . . . . . . . . . . . . . . . . . 27,661 29,482
Total Iron Mountain Incorporated Stockholders’ Equity . . . . . . . . . . . . 2,153,367 1,955,845
Noncontrolling Interests . . . . . . . . . . . . . . . . . . . . . . . . . . . . . . . . . . . . . . 4,104 7,417
Total Equity . . . . . . . . . . . . . . . . . . . . . . . . . . . . . . . . . . . . . . . . . . . . . 2,157,471 1,963,262
Total Liabilities and Equity . . . . . . . . . . . . . . . . . . . . . . . . . . . . . . . . $ 6,846,834 $ 6,395,799
The accompanying notes are an integral part of these consolidated financial statements.
70

IRON MOUNTAIN INCORPORATED
CONSOLIDATED STATEMENTS OF OPERATIONS
(In thousands, except per share data)
Year Ended December 31,
2008 2009 2010
Revenues:Storage (see Note 2.y.) . . . . . . . . . . . . . . . . . . . . . . . . . . . . . $1,628,698 $1,667,642 $1,731,695Service (see Note 2.y.) . . . . . . . . . . . . . . . . . . . . . . . . . . . . . 1,426,436 1,345,953 1,395,854
Total Revenues . . . . . . . . . . . . . . . . . . . . . . . . . . . . . . . . . 3,055,134 3,013,595 3,127,549Operating Expenses:
Cost of sales (excluding depreciation and amortization) . . . . . 1,382,019 1,271,214 1,254,198Selling, general and administrative . . . . . . . . . . . . . . . . . . . . . 882,364 874,359 927,873Depreciation and amortization . . . . . . . . . . . . . . . . . . . . . . . 290,738 319,072 344,283Goodwill impairment (see Note 2.g.) . . . . . . . . . . . . . . . . . . . — — 283,785Loss (Gain) on disposal/writedown of property, plant and
equipment, net . . . . . . . . . . . . . . . . . . . . . . . . . . . . . . . . . 7,483 406 (6,143)
Total Operating Expenses . . . . . . . . . . . . . . . . . . . . . . . . . 2,562,604 2,465,051 2,803,996Operating Income . . . . . . . . . . . . . . . . . . . . . . . . . . . . . . . . . . 492,530 548,544 323,553Interest Expense, Net (includes Interest Income of $5,485,
$2,566 and $1,787 in 2008, 2009 and 2010, respectively) . . . . . 236,635 227,790 220,986Other Expense (Income), Net . . . . . . . . . . . . . . . . . . . . . . . . . . 31,028 (12,079) 1,772
Income Before Provision for Income Taxes . . . . . . . . . . . . . 224,867 332,833 100,795Provision for Income Taxes . . . . . . . . . . . . . . . . . . . . . . . . . . . . 142,924 110,527 149,787
Net Income (Loss) . . . . . . . . . . . . . . . . . . . . . . . . . . . . . . . . . . 81,943 222,306 (48,992)Less: Net (Loss) Income Attributable to Noncontrolling
Interests . . . . . . . . . . . . . . . . . . . . . . . . . . . . . . . . . . . . (94) 1,429 4,908
Net Income (Loss) Attributable to Iron Mountain Incorporated . $ 82,037 $ 220,877 $ (53,900)
Earnings (Losses) per Share—Basic and Diluted:Net Income (Loss) Attributable to Iron Mountain Incorporated
per Share—Basic . . . . . . . . . . . . . . . . . . . . . . . . . . . . . . . . . $ 0.41 $ 1.09 $ (0.27)
Net Income (Loss) Attributable to Iron Mountain Incorporatedper Share—Diluted . . . . . . . . . . . . . . . . . . . . . . . . . . . . . . . $ 0.40 $ 1.08 $ (0.27)
Weighted Average Common Shares Outstanding—Basic . . . . . . . 201,279 202,812 201,991
Weighted Average Common Shares Outstanding—Diluted . . . . . 203,290 204,271 201,991
The accompanying notes are an integral part of these consolidated financial statements.
71
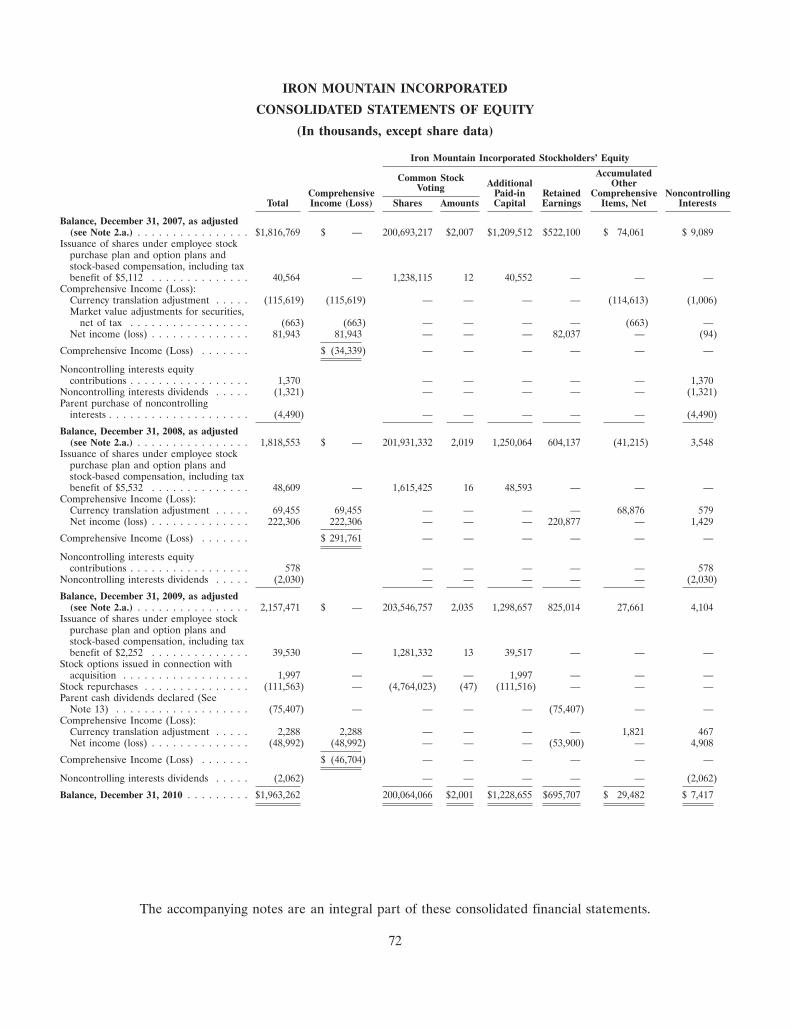
IRON MOUNTAIN INCORPORATED
CONSOLIDATED STATEMENTS OF EQUITY
(In thousands, except share data)
Iron Mountain Incorporated Stockholders’ Equity
AccumulatedCommon Stock Additional OtherVotingComprehensive Paid-in Retained Comprehensive NoncontrollingTotal Income (Loss) Shares Amounts Capital Earnings Items, Net Interests
Balance, December 31, 2007, as adjusted(see Note 2.a.) . . . . . . . . . . . . . . . . $1,816,769 $ — 200,693,217 $2,007 $1,209,512 $522,100 $ 74,061 $ 9,089
Issuance of shares under employee stockpurchase plan and option plans andstock-based compensation, including taxbenefit of $5,112 . . . . . . . . . . . . . . 40,564 — 1,238,115 12 40,552 — — —
Comprehensive Income (Loss):Currency translation adjustment . . . . . (115,619) (115,619) — — — — (114,613) (1,006)Market value adjustments for securities,
net of tax . . . . . . . . . . . . . . . . . (663) (663) — — — — (663) —Net income (loss) . . . . . . . . . . . . . . 81,943 81,943 — — — 82,037 — (94)
Comprehensive Income (Loss) . . . . . . . $ (34,339) — — — — — —
Noncontrolling interests equitycontributions . . . . . . . . . . . . . . . . . 1,370 — — — — — 1,370
Noncontrolling interests dividends . . . . . (1,321) — — — — — (1,321)Parent purchase of noncontrolling
interests . . . . . . . . . . . . . . . . . . . . (4,490) — — — — — (4,490)
Balance, December 31, 2008, as adjusted(see Note 2.a.) . . . . . . . . . . . . . . . . 1,818,553 $ — 201,931,332 2,019 1,250,064 604,137 (41,215) 3,548
Issuance of shares under employee stockpurchase plan and option plans andstock-based compensation, including taxbenefit of $5,532 . . . . . . . . . . . . . . 48,609 — 1,615,425 16 48,593 — — —
Comprehensive Income (Loss):Currency translation adjustment . . . . . 69,455 69,455 — — — — 68,876 579Net income (loss) . . . . . . . . . . . . . . 222,306 222,306 — — — 220,877 — 1,429
Comprehensive Income (Loss) . . . . . . . $ 291,761 — — — — — —
Noncontrolling interests equitycontributions . . . . . . . . . . . . . . . . . 578 — — — — — 578
Noncontrolling interests dividends . . . . . (2,030) — — — — — (2,030)
Balance, December 31, 2009, as adjusted(see Note 2.a.) . . . . . . . . . . . . . . . . 2,157,471 $ — 203,546,757 2,035 1,298,657 825,014 27,661 4,104
Issuance of shares under employee stockpurchase plan and option plans andstock-based compensation, including taxbenefit of $2,252 . . . . . . . . . . . . . . 39,530 — 1,281,332 13 39,517 — — —
Stock options issued in connection withacquisition . . . . . . . . . . . . . . . . . . 1,997 — — — 1,997 — — —
Stock repurchases . . . . . . . . . . . . . . . (111,563) — (4,764,023) (47) (111,516) — — —Parent cash dividends declared (See
Note 13) . . . . . . . . . . . . . . . . . . . (75,407) — — — — (75,407) — —Comprehensive Income (Loss):
Currency translation adjustment . . . . . 2,288 2,288 — — — — 1,821 467Net income (loss) . . . . . . . . . . . . . . (48,992) (48,992) — — — (53,900) — 4,908
Comprehensive Income (Loss) . . . . . . . $ (46,704) — — — — — —
Noncontrolling interests dividends . . . . . (2,062) — — — — — (2,062)
Balance, December 31, 2010 . . . . . . . . . $1,963,262 200,064,066 $2,001 $1,228,655 $695,707 $ 29,482 $ 7,417
The accompanying notes are an integral part of these consolidated financial statements.
72

IRON MOUNTAIN INCORPORATED
CONSOLIDATED STATEMENTS OF COMPREHENSIVE INCOME (LOSS)
(In thousands)
Years Ended December 31,
2008 2009 2010
Net Income (Loss) . . . . . . . . . . . . . . . . . . . . . . . . . . . . . . . . . . . . . $ 81,943 $222,306 $(48,992)Other Comprehensive Income (Loss):
Foreign Currency Translation Adjustments . . . . . . . . . . . . . . . . . . (115,619) 69,455 2,288Market Value Adjustments for Securities, Net of Tax . . . . . . . . . . . (663) — —
Total Other Comprehensive (Loss) Income . . . . . . . . . . . . . . . . . . . (116,282) 69,455 2,288
Comprehensive (Loss) Income . . . . . . . . . . . . . . . . . . . . . . . . . . . . (34,339) 291,761 (46,704)Comprehensive (Loss) Income Attributable to Noncontrolling
Interests . . . . . . . . . . . . . . . . . . . . . . . . . . . . . . . . . . . . . . . . . (1,100) 2,008 5,375
Comprehensive (Loss) Income Attributable to Iron MountainIncorporated . . . . . . . . . . . . . . . . . . . . . . . . . . . . . . . . . . . . . . . . $ (33,239) $289,753 $(52,079)
The accompanying notes are an integral part of these consolidated financial statements.
73
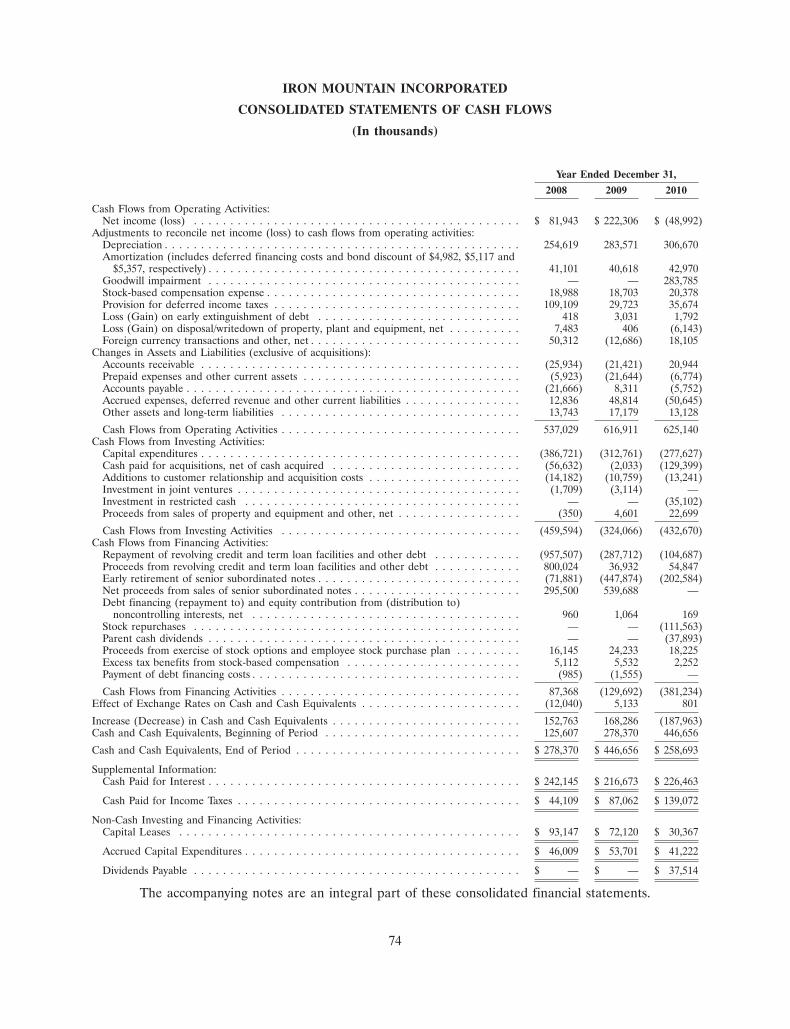
IRON MOUNTAIN INCORPORATED
CONSOLIDATED STATEMENTS OF CASH FLOWS
(In thousands)
Year Ended December 31,
2008 2009 2010
Cash Flows from Operating Activities:Net income (loss) . . . . . . . . . . . . . . . . . . . . . . . . . . . . . . . . . . . . . . . . . . . . . $ 81,943 $ 222,306 $ (48,992)
Adjustments to reconcile net income (loss) to cash flows from operating activities:Depreciation . . . . . . . . . . . . . . . . . . . . . . . . . . . . . . . . . . . . . . . . . . . . . . . . . 254,619 283,571 306,670Amortization (includes deferred financing costs and bond discount of $4,982, $5,117 and
$5,357, respectively) . . . . . . . . . . . . . . . . . . . . . . . . . . . . . . . . . . . . . . . . . . . 41,101 40,618 42,970Goodwill impairment . . . . . . . . . . . . . . . . . . . . . . . . . . . . . . . . . . . . . . . . . . . — — 283,785Stock-based compensation expense . . . . . . . . . . . . . . . . . . . . . . . . . . . . . . . . . . . 18,988 18,703 20,378Provision for deferred income taxes . . . . . . . . . . . . . . . . . . . . . . . . . . . . . . . . . . 109,109 29,723 35,674Loss (Gain) on early extinguishment of debt . . . . . . . . . . . . . . . . . . . . . . . . . . . . 418 3,031 1,792Loss (Gain) on disposal/writedown of property, plant and equipment, net . . . . . . . . . . 7,483 406 (6,143)Foreign currency transactions and other, net . . . . . . . . . . . . . . . . . . . . . . . . . . . . . 50,312 (12,686) 18,105
Changes in Assets and Liabilities (exclusive of acquisitions):Accounts receivable . . . . . . . . . . . . . . . . . . . . . . . . . . . . . . . . . . . . . . . . . . . . (25,934) (21,421) 20,944Prepaid expenses and other current assets . . . . . . . . . . . . . . . . . . . . . . . . . . . . . . (5,923) (21,644) (6,774)Accounts payable . . . . . . . . . . . . . . . . . . . . . . . . . . . . . . . . . . . . . . . . . . . . . . (21,666) 8,311 (5,752)Accrued expenses, deferred revenue and other current liabilities . . . . . . . . . . . . . . . . 12,836 48,814 (50,645)Other assets and long-term liabilities . . . . . . . . . . . . . . . . . . . . . . . . . . . . . . . . . 13,743 17,179 13,128
Cash Flows from Operating Activities . . . . . . . . . . . . . . . . . . . . . . . . . . . . . . . . . 537,029 616,911 625,140Cash Flows from Investing Activities:
Capital expenditures . . . . . . . . . . . . . . . . . . . . . . . . . . . . . . . . . . . . . . . . . . . . (386,721) (312,761) (277,627)Cash paid for acquisitions, net of cash acquired . . . . . . . . . . . . . . . . . . . . . . . . . . (56,632) (2,033) (129,399)Additions to customer relationship and acquisition costs . . . . . . . . . . . . . . . . . . . . . (14,182) (10,759) (13,241)Investment in joint ventures . . . . . . . . . . . . . . . . . . . . . . . . . . . . . . . . . . . . . . . (1,709) (3,114) —Investment in restricted cash . . . . . . . . . . . . . . . . . . . . . . . . . . . . . . . . . . . . . . — — (35,102)Proceeds from sales of property and equipment and other, net . . . . . . . . . . . . . . . . . (350) 4,601 22,699
Cash Flows from Investing Activities . . . . . . . . . . . . . . . . . . . . . . . . . . . . . . . . . (459,594) (324,066) (432,670)Cash Flows from Financing Activities:
Repayment of revolving credit and term loan facilities and other debt . . . . . . . . . . . . (957,507) (287,712) (104,687)Proceeds from revolving credit and term loan facilities and other debt . . . . . . . . . . . . 800,024 36,932 54,847Early retirement of senior subordinated notes . . . . . . . . . . . . . . . . . . . . . . . . . . . . (71,881) (447,874) (202,584)Net proceeds from sales of senior subordinated notes . . . . . . . . . . . . . . . . . . . . . . . 295,500 539,688 —Debt financing (repayment to) and equity contribution from (distribution to)
noncontrolling interests, net . . . . . . . . . . . . . . . . . . . . . . . . . . . . . . . . . . . . . 960 1,064 169Stock repurchases . . . . . . . . . . . . . . . . . . . . . . . . . . . . . . . . . . . . . . . . . . . . . — — (111,563)Parent cash dividends . . . . . . . . . . . . . . . . . . . . . . . . . . . . . . . . . . . . . . . . . . . — — (37,893)Proceeds from exercise of stock options and employee stock purchase plan . . . . . . . . . 16,145 24,233 18,225Excess tax benefits from stock-based compensation . . . . . . . . . . . . . . . . . . . . . . . . 5,112 5,532 2,252Payment of debt financing costs . . . . . . . . . . . . . . . . . . . . . . . . . . . . . . . . . . . . . (985) (1,555) —
Cash Flows from Financing Activities . . . . . . . . . . . . . . . . . . . . . . . . . . . . . . . . . 87,368 (129,692) (381,234)Effect of Exchange Rates on Cash and Cash Equivalents . . . . . . . . . . . . . . . . . . . . . . (12,040) 5,133 801
Increase (Decrease) in Cash and Cash Equivalents . . . . . . . . . . . . . . . . . . . . . . . . . . 152,763 168,286 (187,963)Cash and Cash Equivalents, Beginning of Period . . . . . . . . . . . . . . . . . . . . . . . . . . . 125,607 278,370 446,656
Cash and Cash Equivalents, End of Period . . . . . . . . . . . . . . . . . . . . . . . . . . . . . . . $ 278,370 $ 446,656 $ 258,693
Supplemental Information:Cash Paid for Interest . . . . . . . . . . . . . . . . . . . . . . . . . . . . . . . . . . . . . . . . . . . $ 242,145 $ 216,673 $ 226,463
Cash Paid for Income Taxes . . . . . . . . . . . . . . . . . . . . . . . . . . . . . . . . . . . . . . . $ 44,109 $ 87,062 $ 139,072
Non-Cash Investing and Financing Activities:Capital Leases . . . . . . . . . . . . . . . . . . . . . . . . . . . . . . . . . . . . . . . . . . . . . . . $ 93,147 $ 72,120 $ 30,367
Accrued Capital Expenditures . . . . . . . . . . . . . . . . . . . . . . . . . . . . . . . . . . . . . . $ 46,009 $ 53,701 $ 41,222
Dividends Payable . . . . . . . . . . . . . . . . . . . . . . . . . . . . . . . . . . . . . . . . . . . . . $ — $ — $ 37,514
The accompanying notes are an integral part of these consolidated financial statements.
74
IRON MOUNTAIN INCORPORATED
NOTES TO CONSOLIDATED FINANCIAL STATEMENTS
DECEMBER 31, 2010(In thousands, except share and per share data)
1. Nature of Business
The accompanying financial statements represent the consolidated accounts of Iron MountainIncorporated, a Delaware corporation, and its subsidiaries. We are a global full-service provider ofinformation management and related services for all media in various locations throughout NorthAmerica, Europe, Latin America and Asia Pacific. We have a diversified customer base comprised ofcommercial, legal, banking, health care, accounting, insurance, entertainment and governmentorganizations.
2. Summary of Significant Accounting Policies
a. Principles of Consolidation and Change in Accounting Principle
The accompanying financial statements reflect our financial position and results of operations on aconsolidated basis. Prior to January 1, 2010, the financial position and results of operations of theoperating subsidiaries of Iron Mountain Europe (Group) Limited (collectively referred to as ‘‘IME’’),our European business, were consolidated based on IME’s fiscal year ended October 31. EffectiveJanuary 1, 2010, we changed the fiscal year-end (and the reporting period for consolidation purposes)of IME to coincide with Iron Mountain Incorporated’s (‘‘IMI’’) fiscal year-end of December 31. Webelieve that the change in accounting principle related to the elimination of the two-month reportinglag for IME is preferable because it will result in more contemporaneous reporting of events andresults related to IME. In accordance with applicable accounting literature, a change in subsidiaryyear-end is treated as a change in accounting principle and requires retrospective application. Thecumulative effect of the change was an increase in retained earnings of $12,225 as of January 1, 2007.The impact of the change was not material to the results of operations for the previously reportedannual and interim periods after January 1, 2008, and, thus, those results have not been revised. Thereis, however, a charge of $4,711 recorded to other expense (income), net in the year endedDecember 31, 2010 to recognize the immaterial difference arising from the change. Had the annualfinancial statements been revised, operating income, pretax income and net income attributable to IronMountain Incorporated in calendar 2008 would have been decreased by $6,950, $11,700 and $9,039,respectively, and operating income, pretax income and net income (loss) attributable to Iron MountainIncorporated in calendar 2009 would have been increased by $3,714, $7,041 and $4,957, respectively. Inaddition, revenue, operating income, pretax income and net income attributable to Iron MountainIncorporated for the year ended December 31, 2010 would not have changed materially had we noteliminated the two-month reporting lag. There were no significant, infrequent or unusual items in theIME two-month period ended December 31, 2008 and 2009. All intercompany account balances havebeen eliminated.
b. Use of Estimates
The preparation of financial statements in conformity with accounting principles generally acceptedin the United States of America (‘‘GAAP’’) requires us to make estimates, judgments and assumptionsthat affect the reported amounts of assets, liabilities, revenues and expenses, and related disclosure ofcontingent assets and liabilities at the date of the financial statements and for the period then ended.On an on-going basis, we evaluate the estimates used. We base our estimates on historical experience,actuarial estimates, current conditions and various other assumptions that we believe to be reasonableunder the circumstances. These estimates form the basis for making judgments about the carrying
75
IRON MOUNTAIN INCORPORATED
NOTES TO CONSOLIDATED FINANCIAL STATEMENTS (Continued)
DECEMBER 31, 2010(In thousands, except share and per share data)
2. Summary of Significant Accounting Policies (Continued)
values of assets and liabilities and are not readily apparent from other sources. Actual results maydiffer from these estimates.
c. Cash and Cash Equivalents
Cash and cash equivalents include cash on hand and cash invested in short-term securities whichhave remaining maturities at the date of purchase of less than 90 days. Cash and cash equivalents arecarried at cost, which approximates fair value.
We have restricted cash associated with a collateral trust agreement with our insurance carrier thatwas entered into in 2010 related to our worker’s compensation self-insurance program. The restrictedcash subject to this agreement was $35,105 as of December 31, 2010 and is included in current assetson our consolidated balance sheets. Restricted cash consists primarily of U.S. treasuries.
d. Foreign Currency
Local currencies are considered the functional currencies for our operations outside the UnitedStates, with the exception of certain foreign holding companies and our financing center in Switzerland,whose functional currencies are the U.S. dollar. In those instances where the local currency is thefunctional currency, assets and liabilities are translated at period-end exchange rates, and revenues andexpenses are translated at average exchange rates for the applicable period. Resulting translationadjustments are reflected in the accumulated other comprehensive items, net component of IronMountain Incorporated Stockholders’ Equity and Noncontrolling Interests. The gain or loss on foreigncurrency transactions, calculated as the difference between the historical exchange rate and theexchange rate at the applicable measurement date, including those related to (a) our 71⁄4% GBP SeniorSubordinated Notes due 2014, (b) our 63⁄4 Euro Senior Subordinated Notes due 2018, (c) theborrowings in certain foreign currencies under our revolving credit agreement, and (d) certain foreigncurrency denominated intercompany obligations of our foreign subsidiaries to us and between ourforeign subsidiaries which are not considered permanently invested, are included in other expense(income), net, on our consolidated statements of operations. The total gain or loss on foreign currencytransactions amounted to a net loss of $28,882, a net gain of $12,477 and a net loss of $5,305 for theyears ended December 31, 2008, 2009 and 2010, respectively.
e. Derivative Instruments and Hedging Activities
Every derivative instrument is required to be recorded in the balance sheet as either an asset or aliability measured at its fair value. Periodically, we acquire derivative instruments that are intended tohedge either cash flows or values which are subject to foreign exchange or other market price risk, andnot for trading purposes. We have formally documented our hedging relationships, includingidentification of the hedging instruments and the hedged items, as well as our risk managementobjectives and strategies for undertaking each hedge transaction. Given the recurring nature of ourrevenues and the long term nature of our asset base, we have the ability and the preference to uselong-term, fixed interest rate debt to finance our business, thereby preserving our long term returns oninvested capital. We target approximately 75% of our debt portfolio to be fixed with respect to interestrates. Occasionally, we will use interest rate swaps as a tool to maintain our targeted level of fixed ratedebt. In addition, we will use borrowings in foreign currencies, either obtained in the U.S. or by ourforeign subsidiaries, to naturally hedge foreign currency risk associated with our internationalinvestments. Sometimes we enter into currency swaps to temporarily hedge an overseas investment,
76
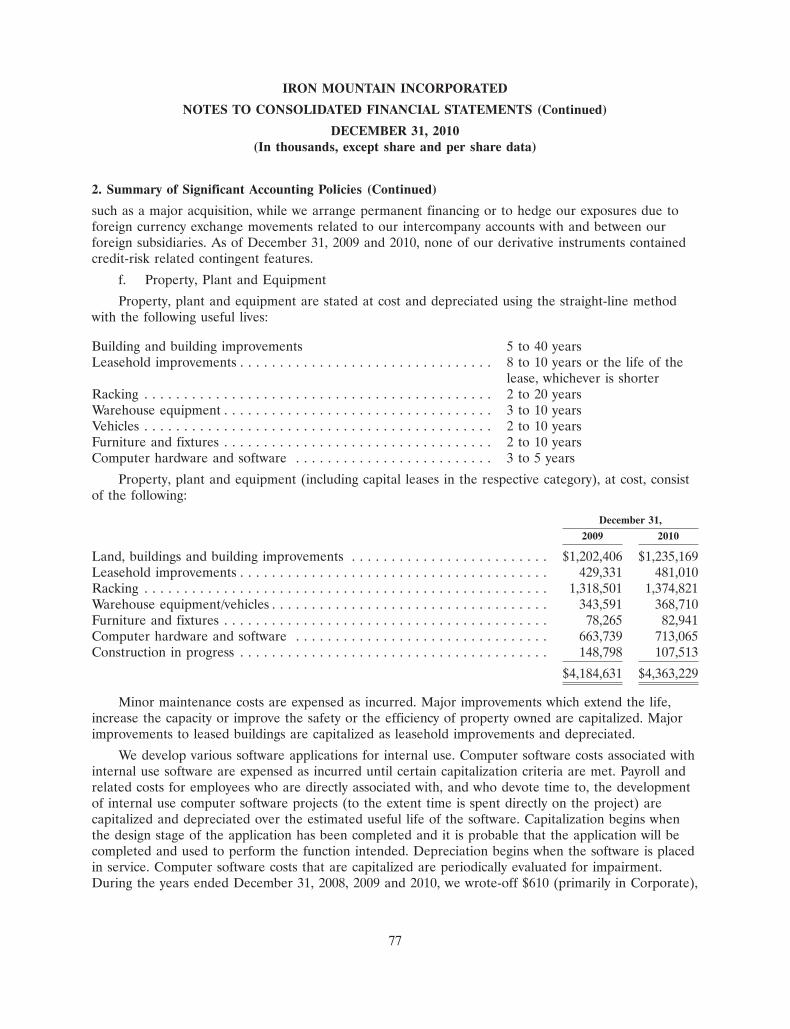
IRON MOUNTAIN INCORPORATED
NOTES TO CONSOLIDATED FINANCIAL STATEMENTS (Continued)
DECEMBER 31, 2010(In thousands, except share and per share data)
2. Summary of Significant Accounting Policies (Continued)
such as a major acquisition, while we arrange permanent financing or to hedge our exposures due toforeign currency exchange movements related to our intercompany accounts with and between ourforeign subsidiaries. As of December 31, 2009 and 2010, none of our derivative instruments containedcredit-risk related contingent features.
f. Property, Plant and Equipment
Property, plant and equipment are stated at cost and depreciated using the straight-line methodwith the following useful lives:
Building and building improvements 5 to 40 yearsLeasehold improvements . . . . . . . . . . . . . . . . . . . . . . . . . . . . . . . . 8 to 10 years or the life of the
lease, whichever is shorterRacking . . . . . . . . . . . . . . . . . . . . . . . . . . . . . . . . . . . . . . . . . . . . 2 to 20 yearsWarehouse equipment . . . . . . . . . . . . . . . . . . . . . . . . . . . . . . . . . . 3 to 10 yearsVehicles . . . . . . . . . . . . . . . . . . . . . . . . . . . . . . . . . . . . . . . . . . . . 2 to 10 yearsFurniture and fixtures . . . . . . . . . . . . . . . . . . . . . . . . . . . . . . . . . . 2 to 10 yearsComputer hardware and software . . . . . . . . . . . . . . . . . . . . . . . . . 3 to 5 years
Property, plant and equipment (including capital leases in the respective category), at cost, consistof the following:
December 31,
2009 2010
Land, buildings and building improvements . . . . . . . . . . . . . . . . . . . . . . . . . $1,202,406 $1,235,169Leasehold improvements . . . . . . . . . . . . . . . . . . . . . . . . . . . . . . . . . . . . . . . 429,331 481,010Racking . . . . . . . . . . . . . . . . . . . . . . . . . . . . . . . . . . . . . . . . . . . . . . . . . . . 1,318,501 1,374,821Warehouse equipment/vehicles . . . . . . . . . . . . . . . . . . . . . . . . . . . . . . . . . . . 343,591 368,710Furniture and fixtures . . . . . . . . . . . . . . . . . . . . . . . . . . . . . . . . . . . . . . . . . 78,265 82,941Computer hardware and software . . . . . . . . . . . . . . . . . . . . . . . . . . . . . . . . 663,739 713,065Construction in progress . . . . . . . . . . . . . . . . . . . . . . . . . . . . . . . . . . . . . . . 148,798 107,513
$4,184,631 $4,363,229
Minor maintenance costs are expensed as incurred. Major improvements which extend the life,increase the capacity or improve the safety or the efficiency of property owned are capitalized. Majorimprovements to leased buildings are capitalized as leasehold improvements and depreciated.
We develop various software applications for internal use. Computer software costs associated withinternal use software are expensed as incurred until certain capitalization criteria are met. Payroll andrelated costs for employees who are directly associated with, and who devote time to, the developmentof internal use computer software projects (to the extent time is spent directly on the project) arecapitalized and depreciated over the estimated useful life of the software. Capitalization begins whenthe design stage of the application has been completed and it is probable that the application will becompleted and used to perform the function intended. Depreciation begins when the software is placedin service. Computer software costs that are capitalized are periodically evaluated for impairment.During the years ended December 31, 2008, 2009 and 2010, we wrote-off $610 (primarily in Corporate),
77

IRON MOUNTAIN INCORPORATED
NOTES TO CONSOLIDATED FINANCIAL STATEMENTS (Continued)
DECEMBER 31, 2010(In thousands, except share and per share data)
2. Summary of Significant Accounting Policies (Continued)
$600 (primarily in Corporate) and $4,908 (primarily in the Worldwide Digital Business segment),respectively, of previously deferred software costs, primarily internal labor costs, associated withinternal use software development projects that were discontinued after implementation, which resultedin a loss on disposal/writedown of property, plant and equipment, net in the accompanying consolidatedstatement of operations.
Entities are required to record the fair value of a liability for an asset retirement obligation in theperiod in which it is incurred. Asset retirement obligations represent the costs to repair, replace orremove tangible long-lived assets required by law, regulatory rule or contractual agreement. When theliability is initially recorded, the entity capitalizes the cost by increasing the carrying amount of therelated long-lived asset, which is then depreciated over the useful life of the related asset. The liabilityis increased over time through income such that the liability will equate to the future cost to retire thelong-lived asset at the expected retirement date. Upon settlement of the liability, an entity either settlesthe obligation for its recorded amount or realizes a gain or loss upon settlement. Our obligations areprimarily the result of requirements under our facility lease agreements which generally have ‘‘return tooriginal condition’’ clauses which would require us to remove or restore items such as shred pits, vaults,demising walls and office build-outs, among others. The significant assumptions used in estimating ouraggregate asset retirement obligation are the timing of removals, the probability of a requirement toperform, estimated cost and associated expected inflation rates that are consistent with historical ratesand credit-adjusted risk-free rates that approximate our incremental borrowing rate.
A reconciliation of liabilities for asset retirement obligations (included in other long-termliabilities) is as follows:
December 31,
2009 2010
Asset Retirement Obligations, beginning of the year . . . . . . . . . . . . . . . . . . . . . . . $ 9,096 $10,899Liabilities Incurred . . . . . . . . . . . . . . . . . . . . . . . . . . . . . . . . . . . . . . . . . . . . . . . 882 533Liabilities Settled . . . . . . . . . . . . . . . . . . . . . . . . . . . . . . . . . . . . . . . . . . . . . . . . (312) (70)Accretion Expense . . . . . . . . . . . . . . . . . . . . . . . . . . . . . . . . . . . . . . . . . . . . . . . 1,233 1,271Change in Probability Adjustment . . . . . . . . . . . . . . . . . . . . . . . . . . . . . . . . . . . . — (2,745)Foreign Currency Exchange Movement . . . . . . . . . . . . . . . . . . . . . . . . . . . . . . . . — (239)
Asset Retirement Obligations, end of the year . . . . . . . . . . . . . . . . . . . . . . . . . . . $10,899 $ 9,649
g. Goodwill and Other Intangible Assets
Goodwill and intangible assets with indefinite lives are not amortized but are reviewed annually forimpairment or more frequently if impairment indicators arise. We currently have no intangible assetsthat have indefinite lives and which are not amortized, other than goodwill. Separable intangible assetsthat are not deemed to have indefinite lives are amortized over their useful lives. We periodically assesswhether events or circumstances warrant a change in the life over which our intangible assets areamortized.
We have selected October 1 as our annual goodwill impairment review date. We performed ourannual goodwill impairment review as of October 1, 2008 and 2009 and noted no impairment of
78
IRON MOUNTAIN INCORPORATED
NOTES TO CONSOLIDATED FINANCIAL STATEMENTS (Continued)
DECEMBER 31, 2010(In thousands, except share and per share data)
2. Summary of Significant Accounting Policies (Continued)
goodwill. In making this assessment, we relied on a number of factors including operating results,business plans, anticipated future cash flows, transactions and market place data. There are inherentuncertainties related to these factors and our judgment in applying them to the analysis of goodwillimpairment. During the quarter ended September 30, 2010, prior to our annual goodwill impairmentreview, we concluded that events occurred and circumstances changed in the Worldwide DigitalBusiness reporting unit that required us to conduct an impairment review. The primary factorscontributing to our conclusion that we had a triggering event and a requirement to reassess theWorldwide Digital Business reporting unit goodwill for impairment included: (1) a reduction inforecasted revenue and operating results due to continued pressure on key parts of the business as aresult of the weak economy; (2) reduced revenue and profit outlook for our eDiscovery service due tosmaller average matter size and lower pricing; (3) a decision to discontinue certain softwaredevelopment projects as is more fully discussed at Note 2.f.; and (4) the sale of the domain namemanagement product line of our Worldwide Digital Business reporting unit as is more fully discussed atNote 14. As a result of the review, we recorded a provisional goodwill impairment charge associatedwith our Worldwide Digital Business reporting unit in the amount of $255,000 during the quarter endedSeptember 30, 2010. We finalized this estimate in the fourth quarter of 2010, and we recorded anadditional impairment of $28,785, for a total goodwill impairment charge of $283,785.
We performed our most recent annual goodwill impairment review as of October 1, 2010 andnoted no additional impairment of goodwill. As of December 31, 2010, no factors were identified thatwould alter our October 1, 2010 goodwill assessment. In making this assessment, we relied on a numberof factors including operating results, business plans, anticipated future cash flows, transactions andmarket place data. There are inherent uncertainties related to these factors and our judgment inapplying them to the analysis of goodwill impairment.
Our reporting units at which level we performed our goodwill impairment analysis as of October 1,2010 were as follows: North America; Europe; Latin America; Australia/New Zealand; WorldwideDigital; Joint Ventures (includes India, the various joint ventures in Southeast Asia and Russia(referred to as ‘‘Joint Ventures’’) and Business Process Management (‘‘BPM’’). Given their similareconomic characteristics, products, customers and processes, the (1) United Kingdom, Ireland andNorway and (2) the countries of Continental Europe (excluding joint ventures), each a reporting unit,have been aggregated as Europe and tested as one for goodwill impairment. As of December 31, 2010,the carrying value of goodwill, net amounted to $1,734,974, $440,920, $29,787 and $67,138 for NorthAmerica, Europe, Latin America and Australia/New Zealand, respectively. Our Joint Ventures andBPM reporting units have no goodwill as of December 31, 2010. Our Worldwide Digital Businessreporting unit goodwill was written down to $51,145 as of December 31, 2010 as a result of the chargespreviously discussed above.
Reporting unit valuations have been calculated using an income approach based on the presentvalue of future cash flows of each reporting unit or a combined approach based on the present value offuture cash flows and market and transaction multiples of revenues and earnings. The income approachincorporates many assumptions including future growth rates, discount factors, expected capitalexpenditures and income tax cash flows. Changes in economic and operating conditions impacting theseassumptions could result in goodwill impairments in future periods. In conjunction with our annual
79
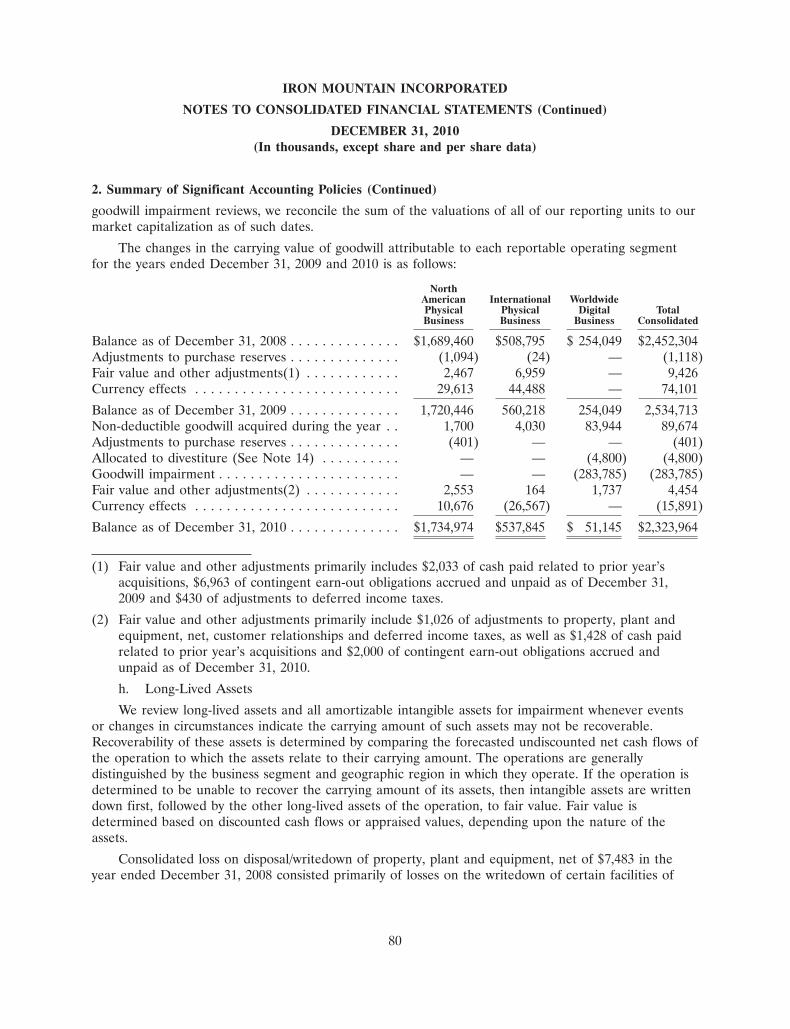
IRON MOUNTAIN INCORPORATED
NOTES TO CONSOLIDATED FINANCIAL STATEMENTS (Continued)
DECEMBER 31, 2010(In thousands, except share and per share data)
2. Summary of Significant Accounting Policies (Continued)
goodwill impairment reviews, we reconcile the sum of the valuations of all of our reporting units to ourmarket capitalization as of such dates.
The changes in the carrying value of goodwill attributable to each reportable operating segmentfor the years ended December 31, 2009 and 2010 is as follows:
NorthAmerican International WorldwidePhysical Physical Digital TotalBusiness Business Business Consolidated
Balance as of December 31, 2008 . . . . . . . . . . . . . . $1,689,460 $508,795 $ 254,049 $2,452,304Adjustments to purchase reserves . . . . . . . . . . . . . . (1,094) (24) — (1,118)Fair value and other adjustments(1) . . . . . . . . . . . . 2,467 6,959 — 9,426Currency effects . . . . . . . . . . . . . . . . . . . . . . . . . . 29,613 44,488 — 74,101
Balance as of December 31, 2009 . . . . . . . . . . . . . . 1,720,446 560,218 254,049 2,534,713Non-deductible goodwill acquired during the year . . 1,700 4,030 83,944 89,674Adjustments to purchase reserves . . . . . . . . . . . . . . (401) — — (401)Allocated to divestiture (See Note 14) . . . . . . . . . . — — (4,800) (4,800)Goodwill impairment . . . . . . . . . . . . . . . . . . . . . . . — — (283,785) (283,785)Fair value and other adjustments(2) . . . . . . . . . . . . 2,553 164 1,737 4,454Currency effects . . . . . . . . . . . . . . . . . . . . . . . . . . 10,676 (26,567) — (15,891)
Balance as of December 31, 2010 . . . . . . . . . . . . . . $1,734,974 $537,845 $ 51,145 $2,323,964
(1) Fair value and other adjustments primarily includes $2,033 of cash paid related to prior year’sacquisitions, $6,963 of contingent earn-out obligations accrued and unpaid as of December 31,2009 and $430 of adjustments to deferred income taxes.
(2) Fair value and other adjustments primarily include $1,026 of adjustments to property, plant andequipment, net, customer relationships and deferred income taxes, as well as $1,428 of cash paidrelated to prior year’s acquisitions and $2,000 of contingent earn-out obligations accrued andunpaid as of December 31, 2010.
h. Long-Lived Assets
We review long-lived assets and all amortizable intangible assets for impairment whenever eventsor changes in circumstances indicate the carrying amount of such assets may not be recoverable.Recoverability of these assets is determined by comparing the forecasted undiscounted net cash flows ofthe operation to which the assets relate to their carrying amount. The operations are generallydistinguished by the business segment and geographic region in which they operate. If the operation isdetermined to be unable to recover the carrying amount of its assets, then intangible assets are writtendown first, followed by the other long-lived assets of the operation, to fair value. Fair value isdetermined based on discounted cash flows or appraised values, depending upon the nature of theassets.
Consolidated loss on disposal/writedown of property, plant and equipment, net of $7,483 in theyear ended December 31, 2008 consisted primarily of losses on the writedown of certain facilities of
80
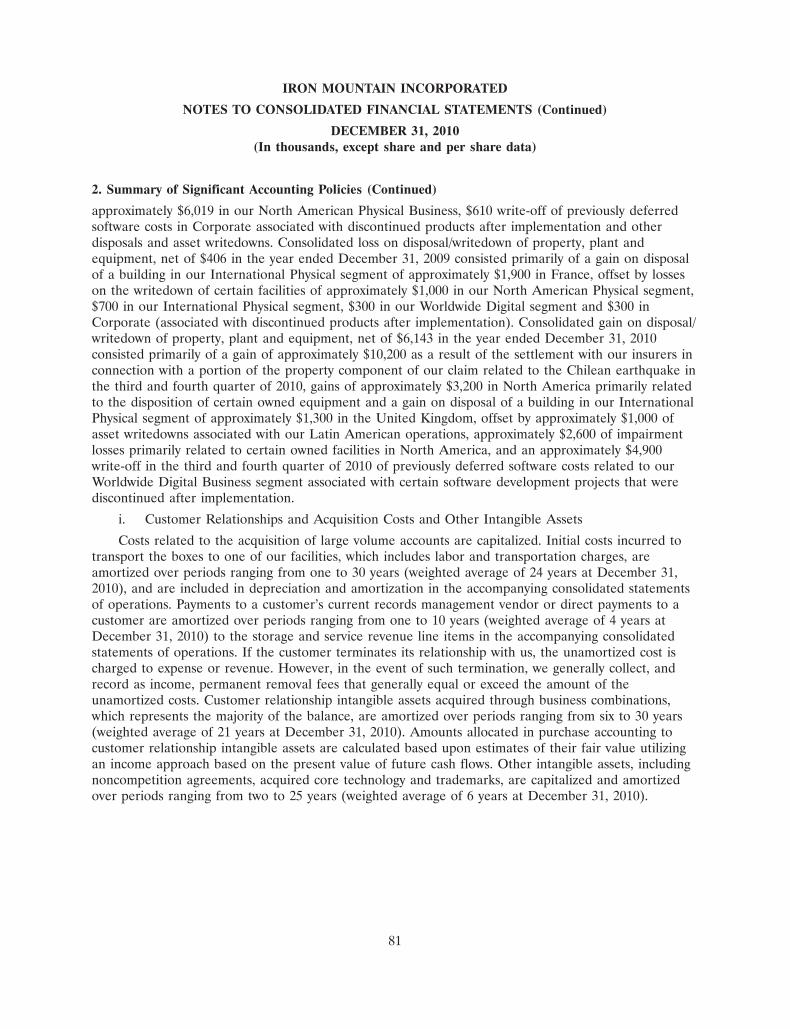
IRON MOUNTAIN INCORPORATED
NOTES TO CONSOLIDATED FINANCIAL STATEMENTS (Continued)
DECEMBER 31, 2010(In thousands, except share and per share data)
2. Summary of Significant Accounting Policies (Continued)
approximately $6,019 in our North American Physical Business, $610 write-off of previously deferredsoftware costs in Corporate associated with discontinued products after implementation and otherdisposals and asset writedowns. Consolidated loss on disposal/writedown of property, plant andequipment, net of $406 in the year ended December 31, 2009 consisted primarily of a gain on disposalof a building in our International Physical segment of approximately $1,900 in France, offset by losseson the writedown of certain facilities of approximately $1,000 in our North American Physical segment,$700 in our International Physical segment, $300 in our Worldwide Digital segment and $300 inCorporate (associated with discontinued products after implementation). Consolidated gain on disposal/writedown of property, plant and equipment, net of $6,143 in the year ended December 31, 2010consisted primarily of a gain of approximately $10,200 as a result of the settlement with our insurers inconnection with a portion of the property component of our claim related to the Chilean earthquake inthe third and fourth quarter of 2010, gains of approximately $3,200 in North America primarily relatedto the disposition of certain owned equipment and a gain on disposal of a building in our InternationalPhysical segment of approximately $1,300 in the United Kingdom, offset by approximately $1,000 ofasset writedowns associated with our Latin American operations, approximately $2,600 of impairmentlosses primarily related to certain owned facilities in North America, and an approximately $4,900write-off in the third and fourth quarter of 2010 of previously deferred software costs related to ourWorldwide Digital Business segment associated with certain software development projects that werediscontinued after implementation.
i. Customer Relationships and Acquisition Costs and Other Intangible Assets
Costs related to the acquisition of large volume accounts are capitalized. Initial costs incurred totransport the boxes to one of our facilities, which includes labor and transportation charges, areamortized over periods ranging from one to 30 years (weighted average of 24 years at December 31,2010), and are included in depreciation and amortization in the accompanying consolidated statementsof operations. Payments to a customer’s current records management vendor or direct payments to acustomer are amortized over periods ranging from one to 10 years (weighted average of 4 years atDecember 31, 2010) to the storage and service revenue line items in the accompanying consolidatedstatements of operations. If the customer terminates its relationship with us, the unamortized cost ischarged to expense or revenue. However, in the event of such termination, we generally collect, andrecord as income, permanent removal fees that generally equal or exceed the amount of theunamortized costs. Customer relationship intangible assets acquired through business combinations,which represents the majority of the balance, are amortized over periods ranging from six to 30 years(weighted average of 21 years at December 31, 2010). Amounts allocated in purchase accounting tocustomer relationship intangible assets are calculated based upon estimates of their fair value utilizingan income approach based on the present value of future cash flows. Other intangible assets, includingnoncompetition agreements, acquired core technology and trademarks, are capitalized and amortizedover periods ranging from two to 25 years (weighted average of 6 years at December 31, 2010).
81
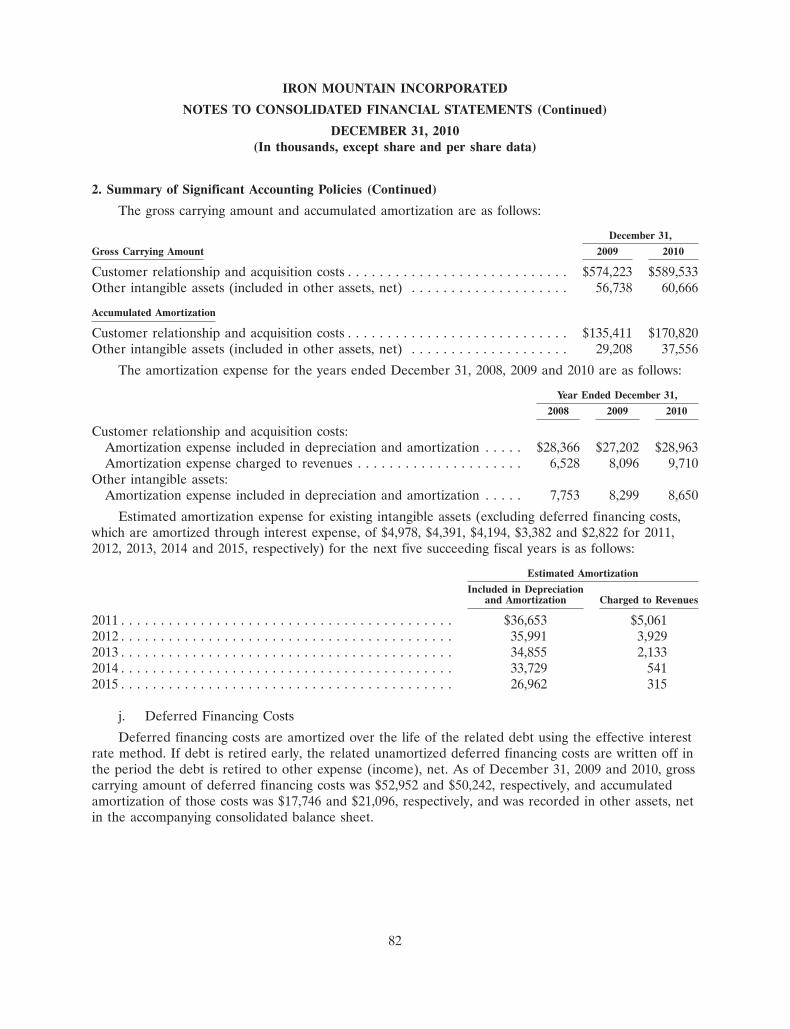
IRON MOUNTAIN INCORPORATED
NOTES TO CONSOLIDATED FINANCIAL STATEMENTS (Continued)
DECEMBER 31, 2010(In thousands, except share and per share data)
2. Summary of Significant Accounting Policies (Continued)
The gross carrying amount and accumulated amortization are as follows:
December 31,
Gross Carrying Amount 2009 2010
Customer relationship and acquisition costs . . . . . . . . . . . . . . . . . . . . . . . . . . . . $574,223 $589,533Other intangible assets (included in other assets, net) . . . . . . . . . . . . . . . . . . . . 56,738 60,666
Accumulated Amortization
Customer relationship and acquisition costs . . . . . . . . . . . . . . . . . . . . . . . . . . . . $135,411 $170,820Other intangible assets (included in other assets, net) . . . . . . . . . . . . . . . . . . . . 29,208 37,556
The amortization expense for the years ended December 31, 2008, 2009 and 2010 are as follows:
Year Ended December 31,
2008 2009 2010
Customer relationship and acquisition costs:Amortization expense included in depreciation and amortization . . . . . $28,366 $27,202 $28,963Amortization expense charged to revenues . . . . . . . . . . . . . . . . . . . . . 6,528 8,096 9,710
Other intangible assets:Amortization expense included in depreciation and amortization . . . . . 7,753 8,299 8,650
Estimated amortization expense for existing intangible assets (excluding deferred financing costs,which are amortized through interest expense, of $4,978, $4,391, $4,194, $3,382 and $2,822 for 2011,2012, 2013, 2014 and 2015, respectively) for the next five succeeding fiscal years is as follows:
Estimated Amortization
Included in Depreciationand Amortization Charged to Revenues
2011 . . . . . . . . . . . . . . . . . . . . . . . . . . . . . . . . . . . . . . . . . . $36,653 $5,0612012 . . . . . . . . . . . . . . . . . . . . . . . . . . . . . . . . . . . . . . . . . . 35,991 3,9292013 . . . . . . . . . . . . . . . . . . . . . . . . . . . . . . . . . . . . . . . . . . 34,855 2,1332014 . . . . . . . . . . . . . . . . . . . . . . . . . . . . . . . . . . . . . . . . . . 33,729 5412015 . . . . . . . . . . . . . . . . . . . . . . . . . . . . . . . . . . . . . . . . . . 26,962 315
j. Deferred Financing Costs
Deferred financing costs are amortized over the life of the related debt using the effective interestrate method. If debt is retired early, the related unamortized deferred financing costs are written off inthe period the debt is retired to other expense (income), net. As of December 31, 2009 and 2010, grosscarrying amount of deferred financing costs was $52,952 and $50,242, respectively, and accumulatedamortization of those costs was $17,746 and $21,096, respectively, and was recorded in other assets, netin the accompanying consolidated balance sheet.
82
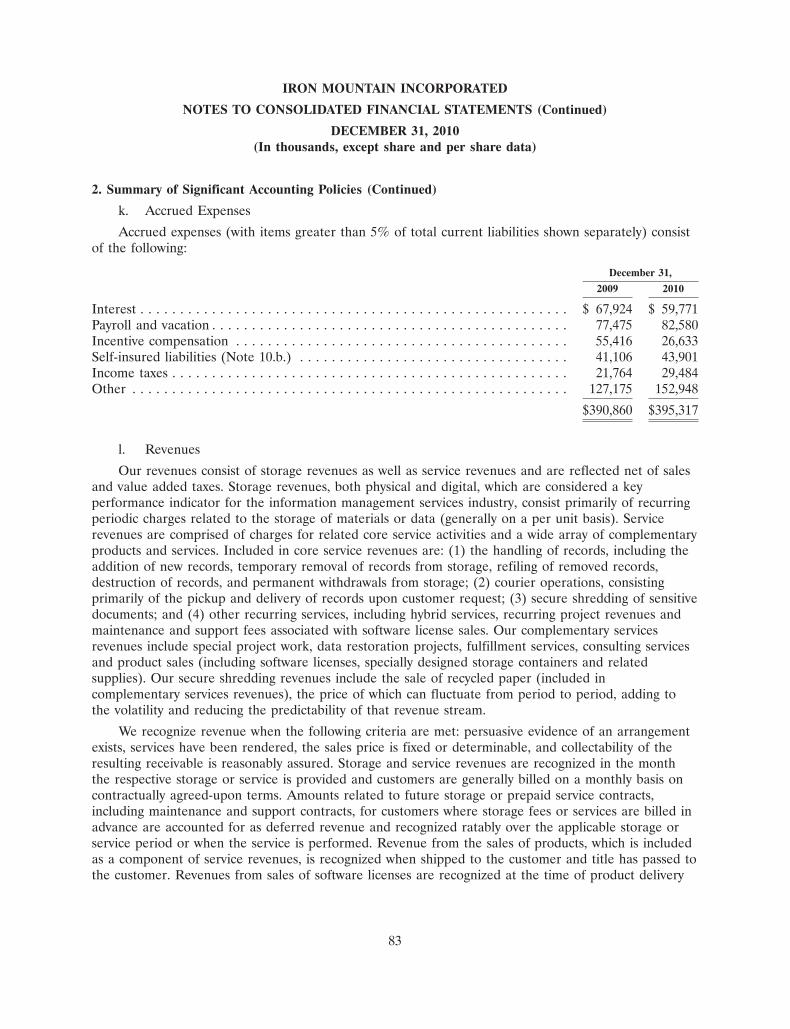
IRON MOUNTAIN INCORPORATED
NOTES TO CONSOLIDATED FINANCIAL STATEMENTS (Continued)
DECEMBER 31, 2010(In thousands, except share and per share data)
2. Summary of Significant Accounting Policies (Continued)
k. Accrued Expenses
Accrued expenses (with items greater than 5% of total current liabilities shown separately) consistof the following:
December 31,
2009 2010
Interest . . . . . . . . . . . . . . . . . . . . . . . . . . . . . . . . . . . . . . . . . . . . . . . . . . . . . . $ 67,924 $ 59,771Payroll and vacation . . . . . . . . . . . . . . . . . . . . . . . . . . . . . . . . . . . . . . . . . . . . . 77,475 82,580Incentive compensation . . . . . . . . . . . . . . . . . . . . . . . . . . . . . . . . . . . . . . . . . . 55,416 26,633Self-insured liabilities (Note 10.b.) . . . . . . . . . . . . . . . . . . . . . . . . . . . . . . . . . . 41,106 43,901Income taxes . . . . . . . . . . . . . . . . . . . . . . . . . . . . . . . . . . . . . . . . . . . . . . . . . . 21,764 29,484Other . . . . . . . . . . . . . . . . . . . . . . . . . . . . . . . . . . . . . . . . . . . . . . . . . . . . . . . 127,175 152,948
$390,860 $395,317
l. Revenues
Our revenues consist of storage revenues as well as service revenues and are reflected net of salesand value added taxes. Storage revenues, both physical and digital, which are considered a keyperformance indicator for the information management services industry, consist primarily of recurringperiodic charges related to the storage of materials or data (generally on a per unit basis). Servicerevenues are comprised of charges for related core service activities and a wide array of complementaryproducts and services. Included in core service revenues are: (1) the handling of records, including theaddition of new records, temporary removal of records from storage, refiling of removed records,destruction of records, and permanent withdrawals from storage; (2) courier operations, consistingprimarily of the pickup and delivery of records upon customer request; (3) secure shredding of sensitivedocuments; and (4) other recurring services, including hybrid services, recurring project revenues andmaintenance and support fees associated with software license sales. Our complementary servicesrevenues include special project work, data restoration projects, fulfillment services, consulting servicesand product sales (including software licenses, specially designed storage containers and relatedsupplies). Our secure shredding revenues include the sale of recycled paper (included incomplementary services revenues), the price of which can fluctuate from period to period, adding tothe volatility and reducing the predictability of that revenue stream.
We recognize revenue when the following criteria are met: persuasive evidence of an arrangementexists, services have been rendered, the sales price is fixed or determinable, and collectability of theresulting receivable is reasonably assured. Storage and service revenues are recognized in the monththe respective storage or service is provided and customers are generally billed on a monthly basis oncontractually agreed-upon terms. Amounts related to future storage or prepaid service contracts,including maintenance and support contracts, for customers where storage fees or services are billed inadvance are accounted for as deferred revenue and recognized ratably over the applicable storage orservice period or when the service is performed. Revenue from the sales of products, which is includedas a component of service revenues, is recognized when shipped to the customer and title has passed tothe customer. Revenues from sales of software licenses are recognized at the time of product delivery
83

IRON MOUNTAIN INCORPORATED
NOTES TO CONSOLIDATED FINANCIAL STATEMENTS (Continued)
DECEMBER 31, 2010(In thousands, except share and per share data)
2. Summary of Significant Accounting Policies (Continued)
to our customer or reseller, and revenue from maintenance and support agreements are recognizedratably over the term of the agreement. Revenues from the sales of products has historically not beensignificant. Revenues from software license sales and maintenance and support accounted for less than1% of our annual 2010 consolidated revenues. Within our Worldwide Digital Business segment, incertain instances, we process and host data for customers. In these instances, the processing fees aredeferred and recognized over the estimated service period.
m. Rent Normalization
We have entered into various leases for buildings that expire over various terms. Certain leaseshave fixed escalation clauses (excluding those tied to CPI or other inflation-based indices) or otherfeatures (including return to original condition, primarily in the United Kingdom) which requirenormalization of the rental expense over the life of the lease resulting in deferred rent being reflectedin the accompanying consolidated balance sheets. In addition, we have assumed various above andbelow market leases in connection with certain of our acquisitions. The difference between the presentvalue of these lease obligations and the market rate at the date of the acquisition was recorded as adeferred rent liability or other long-term asset and is being amortized over the remaining lives of therespective leases.
n. Stock-Based Compensation
We record stock-based compensation expense, utilizing the straight-line method, for the cost ofstock options, restricted stock, restricted stock units and shares of stock issued under the employeestock purchase plan (together, ‘‘Employee Stock-Based Awards’’).
Stock-based compensation expense for Employee Stock-Based Awards included in theaccompanying consolidated statements of operations for the years ended December 31, 2008, 2009 and2010 was $18,988 ($15,682 after tax or $0.08 per basic and diluted share), $18,703 ($14,716 after tax or$0.07 per basic and diluted share) and $20,378 ($15,672 after tax or $0.08 per basic and diluted share),respectively.
The benefits associated with the tax deductions in excess of recognized compensation cost arerequired to be reported as a financing cash flow. This requirement reduces reported operating cashflows and increases reported financing cash flows. As a result, net financing cash flows included $5,112,$5,532 and $2,252 for the years ended December 31, 2008, 2009 and 2010, respectively, from thebenefits of tax deductions in excess of recognized compensation cost. We used the short form methodto calculate the Additional Paid-in Capital (‘‘APIC’’) pool. The tax benefit of any resulting excess taxdeduction increases the APIC pool. Any resulting tax deficiency is deducted from the APIC pool.
Stock Options
Under our various stock option plans, options were granted with exercise prices equal to themarket price of the stock on the date of grant. The majority of our options become exercisable ratablyover a period of five years and generally have a contractual life of ten years, unless the holder’semployment is terminated. Beginning in 2007, certain of the options we issue become exercisableratably over a period of ten years and have a contractual life of 12 years, unless the holder’semployment is terminated. As of December 31, 2010, ten-year vesting options represent 7.5% of totaloutstanding options. Our directors are considered employees for purposes of our stock option plans
84

IRON MOUNTAIN INCORPORATED
NOTES TO CONSOLIDATED FINANCIAL STATEMENTS (Continued)
DECEMBER 31, 2010(In thousands, except share and per share data)
2. Summary of Significant Accounting Policies (Continued)
and stock option reporting. Options granted to our non-employee directors generally becomeexercisable after one year.
In December 2008, we amended each of the Iron Mountain Incorporated 2002 Stock IncentivePlan, the Iron Mountain Incorporated 1997 Stock Option Plan, the LiveVault Corporation 2001 StockIncentive Plan and the Stratify, Inc. 1999 Stock Plan (each a ‘‘Plan’’ and, collectively, the ‘‘Plans’’) toprovide that any unvested options and other awards granted under the respective Plan shall vestimmediately should an employee be terminated by the Company, or terminate his or her ownemployment for good reason (as defined in each Plan), in connection with a vesting change in control(as defined in each Plan). The Mimosa Systems, Inc. 2009 Equity Incentive Plan and the MimosaSystems, Inc. 2003 Stock Plan were similarly amended in June 2010.
A total of 37,536,442 shares of common stock have been reserved for grants of options and otherrights under our various stock incentive plans. The number of shares available for grant atDecember 31, 2010 was 6,505,111.
The weighted average fair value of options granted in 2008, 2009 and 2010 was $9.49, $9.72 and$7.71 per share, respectively. The values were estimated on the date of grant using the Black-Scholesoption pricing model. The following table summarizes the weighted average assumptions used forgrants in the year ended December 31:
Weighted Average Assumption 2008 2009 2010
Expected volatility . . . . . . . . . . . . . . . . . . . . . . . . . . . . . . . . . . 26.7% 32.1% 32.8%Risk-free interest rate . . . . . . . . . . . . . . . . . . . . . . . . . . . . . . . 2.98% 2.64% 2.48%Expected dividend yield . . . . . . . . . . . . . . . . . . . . . . . . . . . . . . None None 1.2%Expected life of the option . . . . . . . . . . . . . . . . . . . . . . . . . . . . 6.6 Years 6.4 Years 6.4 Years
Expected volatility is calculated utilizing daily historical volatility over a period that equates to theexpected life of the option. The risk-free interest rate was based on the U.S. Treasury interest rateswhose term is consistent with the expected life of the stock options. Beginning in the first quarter of2010, expected dividend yield was considered in the option pricing model as a result of our newdividend program. The expected life (estimated period of time outstanding) of the stock optionsgranted is estimated using the historical exercise behavior of employees.
85
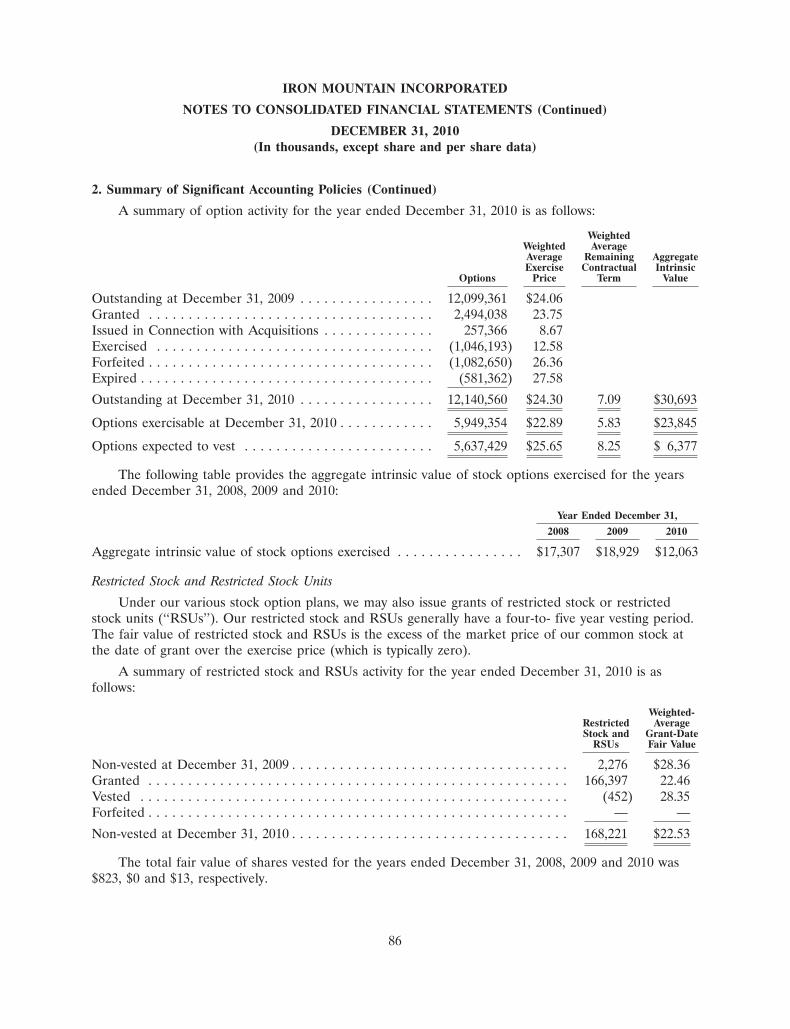
IRON MOUNTAIN INCORPORATED
NOTES TO CONSOLIDATED FINANCIAL STATEMENTS (Continued)
DECEMBER 31, 2010(In thousands, except share and per share data)
2. Summary of Significant Accounting Policies (Continued)
A summary of option activity for the year ended December 31, 2010 is as follows:
WeightedWeighted AverageAverage Remaining AggregateExercise Contractual Intrinsic
Options Price Term Value
Outstanding at December 31, 2009 . . . . . . . . . . . . . . . . . 12,099,361 $24.06Granted . . . . . . . . . . . . . . . . . . . . . . . . . . . . . . . . . . . . 2,494,038 23.75Issued in Connection with Acquisitions . . . . . . . . . . . . . . 257,366 8.67Exercised . . . . . . . . . . . . . . . . . . . . . . . . . . . . . . . . . . . (1,046,193) 12.58Forfeited . . . . . . . . . . . . . . . . . . . . . . . . . . . . . . . . . . . . (1,082,650) 26.36Expired . . . . . . . . . . . . . . . . . . . . . . . . . . . . . . . . . . . . . (581,362) 27.58
Outstanding at December 31, 2010 . . . . . . . . . . . . . . . . . 12,140,560 $24.30 7.09 $30,693
Options exercisable at December 31, 2010 . . . . . . . . . . . . 5,949,354 $22.89 5.83 $23,845
Options expected to vest . . . . . . . . . . . . . . . . . . . . . . . . 5,637,429 $25.65 8.25 $ 6,377
The following table provides the aggregate intrinsic value of stock options exercised for the yearsended December 31, 2008, 2009 and 2010:
Year Ended December 31,
2008 2009 2010
Aggregate intrinsic value of stock options exercised . . . . . . . . . . . . . . . . $17,307 $18,929 $12,063
Restricted Stock and Restricted Stock Units
Under our various stock option plans, we may also issue grants of restricted stock or restrictedstock units (‘‘RSUs’’). Our restricted stock and RSUs generally have a four-to- five year vesting period.The fair value of restricted stock and RSUs is the excess of the market price of our common stock atthe date of grant over the exercise price (which is typically zero).
A summary of restricted stock and RSUs activity for the year ended December 31, 2010 is asfollows:
Weighted-Restricted AverageStock and Grant-Date
RSUs Fair Value
Non-vested at December 31, 2009 . . . . . . . . . . . . . . . . . . . . . . . . . . . . . . . . . . . 2,276 $28.36Granted . . . . . . . . . . . . . . . . . . . . . . . . . . . . . . . . . . . . . . . . . . . . . . . . . . . . . 166,397 22.46Vested . . . . . . . . . . . . . . . . . . . . . . . . . . . . . . . . . . . . . . . . . . . . . . . . . . . . . . (452) 28.35Forfeited . . . . . . . . . . . . . . . . . . . . . . . . . . . . . . . . . . . . . . . . . . . . . . . . . . . . . — —
Non-vested at December 31, 2010 . . . . . . . . . . . . . . . . . . . . . . . . . . . . . . . . . . . 168,221 $22.53
The total fair value of shares vested for the years ended December 31, 2008, 2009 and 2010 was$823, $0 and $13, respectively.
86

IRON MOUNTAIN INCORPORATED
NOTES TO CONSOLIDATED FINANCIAL STATEMENTS (Continued)
DECEMBER 31, 2010(In thousands, except share and per share data)
2. Summary of Significant Accounting Policies (Continued)
Employee Stock Purchase Plan
We offer an employee stock purchase plan in which participation is available to substantially allU.S. and Canadian employees who meet certain service eligibility requirements (the ‘‘ESPP’’). TheESPP provides a way for our eligible employees to become stockholders on favorable terms. The ESPPprovides for the purchase of our common stock by eligible employees through successive offeringperiods. We generally have two six-month offering periods per year, the first of which begins June 1and ends November 30 and the second of which begins December 1 and ends May 31. During eachoffering period, participating employees accumulate after-tax payroll contributions, up to a maximum of15% of their compensation, to pay the exercise price of their options. Participating employees maywithdraw from an offering period before the purchase date and obtain a refund of the amountswithheld as payroll deductions. At the end of the offering period, outstanding options are exercised,and each employee’s accumulated contributions are used to purchase our common stock. The price forshares purchased under the ESPP is 95% of the fair market price at the end of the offering period,without a look-back feature. As a result, we do not recognize compensation cost for the ESPP sharespurchased. The ESPP was amended and approved by our stockholders on May 26, 2005 and thenumber of shares available for purchase under the ESPP was increased to 3,487,500. For the yearsended December 31, 2008, 2009 and 2010, there were 305,151 shares, 258,680 shares and 257,381shares, respectively, purchased under the ESPP. The number of shares available for purchase under theESPP at December 31, 2010 was 554,320.
As of December 31, 2010, unrecognized compensation cost related to the unvested portion of ourEmployee Stock-Based Awards was $52,296 and is expected to be recognized over a weighted-averageperiod of 3.7 years.
We generally issue shares for the exercises of stock options, restricted stock, RSUs and sharesunder our ESPP from unissued reserved shares.
o. Income Taxes
Accounting for income taxes requires the recognition of deferred tax assets and liabilities for theexpected future tax consequences of temporary differences between the tax and financial reporting basisof assets and liabilities and for loss and credit carryforwards. Valuation allowances are provided whenrecovery of deferred tax assets is not considered more likely than not. We have elected to recognizeinterest and penalties associated with uncertain tax positions as a component of the provision forincome taxes in the accompanying consolidated statements of operations.
p. Income (Loss) Per Share—Basic and Diluted
Basic net income (loss) per common share is calculated by dividing net income (loss) attributableto Iron Mountain Incorporated by the weighted average number of common shares outstanding. Thecalculation of diluted net income (loss) per share is consistent with that of basic net income (loss) pershare but gives effect to all potential common shares (that is, securities such as options, warrants orconvertible securities) that were outstanding during the period, unless the effect is antidilutive.
87
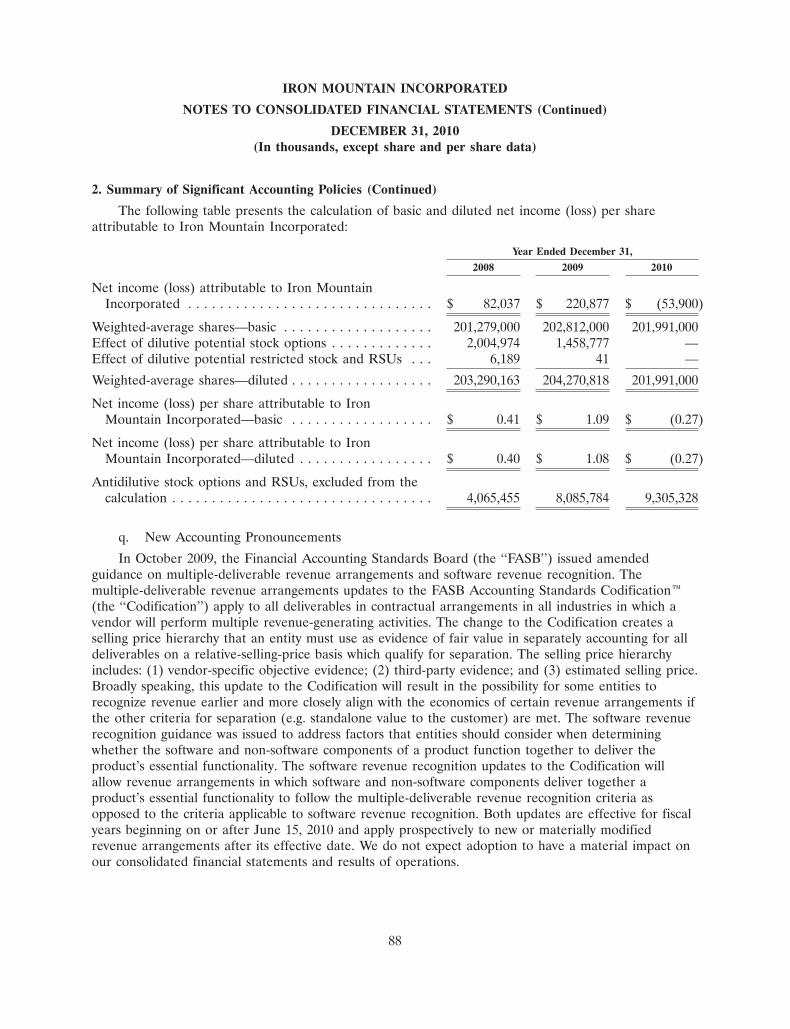
IRON MOUNTAIN INCORPORATED
NOTES TO CONSOLIDATED FINANCIAL STATEMENTS (Continued)
DECEMBER 31, 2010(In thousands, except share and per share data)
2. Summary of Significant Accounting Policies (Continued)
The following table presents the calculation of basic and diluted net income (loss) per shareattributable to Iron Mountain Incorporated:
Year Ended December 31,
2008 2009 2010
Net income (loss) attributable to Iron MountainIncorporated . . . . . . . . . . . . . . . . . . . . . . . . . . . . . . . $ 82,037 $ 220,877 $ (53,900)
Weighted-average shares—basic . . . . . . . . . . . . . . . . . . . 201,279,000 202,812,000 201,991,000Effect of dilutive potential stock options . . . . . . . . . . . . . 2,004,974 1,458,777 —Effect of dilutive potential restricted stock and RSUs . . . 6,189 41 —
Weighted-average shares—diluted . . . . . . . . . . . . . . . . . . 203,290,163 204,270,818 201,991,000
Net income (loss) per share attributable to IronMountain Incorporated—basic . . . . . . . . . . . . . . . . . . $ 0.41 $ 1.09 $ (0.27)
Net income (loss) per share attributable to IronMountain Incorporated—diluted . . . . . . . . . . . . . . . . . $ 0.40 $ 1.08 $ (0.27)
Antidilutive stock options and RSUs, excluded from thecalculation . . . . . . . . . . . . . . . . . . . . . . . . . . . . . . . . . 4,065,455 8,085,784 9,305,328
q. New Accounting Pronouncements
In October 2009, the Financial Accounting Standards Board (the ‘‘FASB’’) issued amendedguidance on multiple-deliverable revenue arrangements and software revenue recognition. Themultiple-deliverable revenue arrangements updates to the FASB Accounting Standards Codification�(the ‘‘Codification’’) apply to all deliverables in contractual arrangements in all industries in which avendor will perform multiple revenue-generating activities. The change to the Codification creates aselling price hierarchy that an entity must use as evidence of fair value in separately accounting for alldeliverables on a relative-selling-price basis which qualify for separation. The selling price hierarchyincludes: (1) vendor-specific objective evidence; (2) third-party evidence; and (3) estimated selling price.Broadly speaking, this update to the Codification will result in the possibility for some entities torecognize revenue earlier and more closely align with the economics of certain revenue arrangements ifthe other criteria for separation (e.g. standalone value to the customer) are met. The software revenuerecognition guidance was issued to address factors that entities should consider when determiningwhether the software and non-software components of a product function together to deliver theproduct’s essential functionality. The software revenue recognition updates to the Codification willallow revenue arrangements in which software and non-software components deliver together aproduct’s essential functionality to follow the multiple-deliverable revenue recognition criteria asopposed to the criteria applicable to software revenue recognition. Both updates are effective for fiscalyears beginning on or after June 15, 2010 and apply prospectively to new or materially modifiedrevenue arrangements after its effective date. We do not expect adoption to have a material impact onour consolidated financial statements and results of operations.
88

IRON MOUNTAIN INCORPORATED
NOTES TO CONSOLIDATED FINANCIAL STATEMENTS (Continued)
DECEMBER 31, 2010(In thousands, except share and per share data)
2. Summary of Significant Accounting Policies (Continued)
r. Allowance for Doubtful Accounts and Credit Memo Reserves
We maintain an allowance for doubtful accounts and credit memos for estimated losses resultingfrom the potential inability of our customers to make required payments and disputes regarding billingand service issues. When calculating the allowance, we consider our past loss experience, current andprior trends in our aged receivables and credit memo activity, current economic conditions, and specificcircumstances of individual receivable balances. If the financial condition of our customers were tosignificantly change, resulting in a significant improvement or impairment of their ability to makepayments, an adjustment of the allowance may be required. We consider accounts receivable to bedelinquent after such time as reasonable means of collection have been exhausted. We charge-offuncollectible balances as circumstances warrant, generally, no later than one year past due.
Rollforward of allowance for doubtful accounts and credit memo reserves is as follows:
Allowance forBalance at Credit Memos Bad Debts Balance at
Beginning of Charged to Charged to End ofYear Ended December 31, the Year Revenue Expense Other(1) Deductions(2) the Year
2008 . . . . . . . . . . . . . . . . . $19,246 $31,885 $10,702 $(1,819) $(40,452) $19,5622009 . . . . . . . . . . . . . . . . . 19,562 43,529 11,832 764 (50,158) 25,5292010 . . . . . . . . . . . . . . . . . 25,529 46,894 11,448 (665) (57,332) 25,874
(1) Primarily consists of recoveries of previously written-off accounts receivable, allowances ofbusinesses acquired and the impact associated with currency translation adjustments.
(2) Primarily consists of the write-off of accounts receivable.
s. Concentrations of Credit Risk
Financial instruments that potentially subject us to market risk consist principally of cash and cashequivalents (including money market funds and time deposits), restricted cash (primarily U.S.treasuries) and accounts receivable. The only significant concentrations of liquid investments as ofDecember 31, 2010 relates to cash and cash equivalents and restricted cash held on deposit with sevenglobal banks and four ‘‘Triple A’’ rated money market funds which we consider to be large, highly ratedinvestment grade institutions. As of December 31, 2010, our cash and cash equivalent and restrictedcash balance was $293,798, including money market funds and time deposits amounting to $241,151. Asubstantial portion of these money market funds are invested in U.S. treasuries.
t. Fair Value Measurements
Entities are permitted under GAAP to elect to measure many financial instruments and certainother items at either fair value or cost. We did not elect the fair value measurement option for any ofour financial assets or liabilities.
Our financial assets or liabilities are measured using inputs from the three levels of the fair valuehierarchy. A financial asset or liability’s classification within the hierarchy is determined based on thelowest level input that is significant to the fair value measurement. The three levels are as follows:
Level 1—Inputs are unadjusted quoted prices in active markets for identical assets or liabilitiesthat we have the ability to access at the measurement date.
89
IRON MOUNTAIN INCORPORATED
NOTES TO CONSOLIDATED FINANCIAL STATEMENTS (Continued)
DECEMBER 31, 2010(In thousands, except share and per share data)
2. Summary of Significant Accounting Policies (Continued)
Level 2—Inputs include quoted prices for similar assets and liabilities in active markets, quotedprices for identical or similar assets or liabilities in markets that are not active, inputs other thanquoted prices that are observable for the asset or liability (i.e., interest rates, yield curves, etc.), andinputs that are derived principally from or corroborated by observable market data by correlation orother means (market corroborated inputs).
Level 3—Unobservable inputs that reflect our assumptions about the assumptions that marketparticipants would use in pricing the asset or liability.
The following tables provide the assets and liabilities carried at fair value measured on a recurringbasis as of December 31, 2009 and 2010, respectively:
Fair Value Measurements atDecember 31, 2009 Using
Total Carrying Quoted prices Significant other SignificantValue at in active observable unobservable
December 31, markets inputs inputsDescription 2009 (Level 1) (Level 2) (Level 3)
Money Market Funds(1) . . . . . . . . . . . . . . . . $265,904 $ — $265,904 $—Time Deposits(1) . . . . . . . . . . . . . . . . . . . . . 115,695 — 115,695 —Trading Securities . . . . . . . . . . . . . . . . . . . . . 10,168 8,061(2) 2,107(1) —Derivative Assets(3) . . . . . . . . . . . . . . . . . . . 4,115 — 4,115 —
Fair Value Measurements atDecember 31, 2010 Using
Total Carrying Quoted prices Significant other SignificantValue at in active observable unobservable
December 31, markets inputs inputsDescription 2010 (Level 1) (Level 2) (Level 3)
Money Market Funds(1) . . . . . . . . . . . . . . . . $107,129 $ — $107,129 $—Time Deposits(1) . . . . . . . . . . . . . . . . . . . . . 134,022 — 134,022 —Trading Securities . . . . . . . . . . . . . . . . . . . . . 9,215 8,527(2) 688(1) —Derivative Assets(3) . . . . . . . . . . . . . . . . . . . 2,500 — 2,500 —Derivative Liabilities(3) . . . . . . . . . . . . . . . . . 2,440 — 2,440 —
(1) Money market funds and time deposits (including certain trading securities) are measured basedon quoted prices for similar assets and/or subsequent transactions.
(2) Securities are measured at fair value using quoted market prices.(3) Our derivative assets and liabilities primarily relate to short-term (six months or less) foreign
currency contracts that we have entered into to hedge our intercompany exposures denominated inBritish pounds sterling and Australian dollars. We calculate the fair value of such forward contractsby adjusting the spot rate utilized at the balance sheet date for translation purposes by an estimateof the forward points observed in active markets.
Disclosures are required in the financial statements for items measured at fair value on anon-recurring basis. We did not have any material items that are measured at fair value on anon-recurring basis for the years ended December 31, 2009 and 2010, respectively, except goodwillcalculated based on Level 3 inputs, more fully disclosed at Note 2.g.
90
IRON MOUNTAIN INCORPORATED
NOTES TO CONSOLIDATED FINANCIAL STATEMENTS (Continued)
DECEMBER 31, 2010(In thousands, except share and per share data)
2. Summary of Significant Accounting Policies (Continued)
u. Available-for-sale and Trading Securities
We have one trust that holds marketable securities. Marketable securities are classified asavailable-for-sale or trading. As of December 31, 2009 and 2010, the fair value of the money marketand mutual funds included in this trust amounted to $10,168 and $9,215, respectively, and wereincluded in prepaid expenses and other in the accompanying consolidated balance sheets. During 2008,we classified these marketable securities included in the trust as trading, and included in other expense(income), net in the accompanying consolidated statement of operations realized and unrealized netlosses of $2,563, net gains of $1,745 and net gains of $1,221 for the years ended December 31, 2008,2009 and 2010, respectively.
v. Investments
As of December 31, 2010, we have investments in joint ventures, including noncontrolling interests,in Iron Mountain Poland Holdings Limited of 20% (Poland), in Iron Mountain A/S of 20% (Denmark),in Iron Mountain Arsivleme Hizmetleri A.S. of 40% (Turkey), in Sispace AG of 15% (Switzerland) andin Kelman Technologies Inc. of 25% (U.S. and Canada). These investments are accounted for using theequity method because we exercise significant influence over these entities and their operations. As ofDecember 31, 2009 and 2010, the carrying value related to our equity investments was $9,148 and$9,663, respectively, included in other assets in the accompanying consolidated balance sheets.
w. Accumulated Other Comprehensive Items, Net
Accumulated other comprehensive items, net consists of foreign currency translation adjustmentsas of December, 31, 2009 and 2010, respectively.
x. Other Expense (Income), Net
Other expense (income), net consists of the following:
Year Ended December 31,
2008 2009 2010
Foreign currency transaction losses (gains), net . . . . . . . . . . . . . . . . . . . $28,882 $(12,477) $ 5,305Debt extinguishment expense . . . . . . . . . . . . . . . . . . . . . . . . . . . . . . . . 418 3,031 1,792Other, net . . . . . . . . . . . . . . . . . . . . . . . . . . . . . . . . . . . . . . . . . . . . . . 1,728 (2,633) (5,325)
$31,028 $(12,079) $ 1,772
y. Reclassifications
In conjunction with our implementation of a new enterprise management reporting system in thefourth quarter of 2010, we noted inconsistencies in the mapping of certain revenue accounts betweenstorage and service. As a result, we have adjusted previously reported amounts to reduce storagerevenues and increase service revenues by $29,211, $28,753, and $28,526 for the years endedDecember 31, 2008, 2009 and 2010, respectively. There was no change in total consolidated reportedrevenues.
91
IRON MOUNTAIN INCORPORATED
NOTES TO CONSOLIDATED FINANCIAL STATEMENTS (Continued)
DECEMBER 31, 2010(In thousands, except share and per share data)
3. Derivative Instruments and Hedging Activities
We have entered into a number of forward contracts to hedge our exposures in British poundssterling. As of December 31, 2010, we had an outstanding forward contract to purchase $196,154U.S. dollars and sell 125,000 British pounds sterling to hedge our intercompany exposures with IME.Additionally, in the fourth quarter of 2010, we entered into a forward contract to hedge our exposuresin Australian dollars. As of December 31, 2010, we had an outstanding forward contract to purchase54,745 Euros and sell 75,000 Australian dollars to hedge our intercompany exposures with ourAustralian subsidiary. At the maturity of the forward contracts, we may enter into new forwardcontracts to hedge movements in the underlying currencies. At the time of settlement, we either pay orreceive the net settlement amount from the forward contract and recognize this amount in other(income) expense, net in the accompanying statement of operations as a realized foreign exchange gainor loss. At the end of each month, we mark the outstanding forward contracts to market and record anunrealized foreign exchange gain or loss for the mark-to-market valuation. We have not designatedthese forward contracts as hedges. During the years ended December 31, 2008, 2009 and 2010, therewas $24,145 in net cash receipts, $2,392 in net cash disbursements and $2,030 in net cash receipts,respectively, included in cash from operating activities related to settlements associated with theseforeign currency forward contracts. The following table provides the fair value of our derivativeinstruments as of December 31, 2009 and 2010 and their gains and losses for the years endedDecember 31, 2008, 2009 and 2010:
Asset Derivatives
December 31,
2009 2010
Balance Sheet Fair Balance Sheet FairDerivatives Not Designated as Hedging Instruments Location Value Location Value
Foreign exchange contracts . . . . . . . . . . . . . Current assets $ 4,115 Current assets $2,500
Total . . . . . . . . . . . . . . . . . . . . . . . . . . . . . $ 4,115 $2,500
Liability Derivatives
December 31,
2009 2010
Balance Sheet Fair Balance Sheet FairDerivatives Not Designated as Hedging Instruments Location Value Location Value
Foreign exchange contracts . . . . . . . . . . . . . Current liabilities $ — Current liabilities $2,440
Total . . . . . . . . . . . . . . . . . . . . . . . . . . . . . $ — $2,440
Amount of (Gain) LossRecognized in Income
on DerivativesLocation of (Gain) Loss December 31,Recognized in Income
Derivatives Not Designated as Hedging Instruments on Derivative 2008 2009 2010
Foreign exchange contracts . . . . . . . . . . . . . Other (income) expense, net $(36,886) $11,952 $2,025
Total . . . . . . . . . . . . . . . . . . . . . . . . . . . . . $(36,886) $11,952 $2,025
92
IRON MOUNTAIN INCORPORATED
NOTES TO CONSOLIDATED FINANCIAL STATEMENTS (Continued)
DECEMBER 31, 2010(In thousands, except share and per share data)
3. Derivative Instruments and Hedging Activities (Continued)
In the third quarter of 2007, we designated a portion of our 63⁄4% Euro Senior Subordinated Notesdue 2018 issued by IMI (the ‘‘63⁄4% Euro Notes’’) as a hedge of net investment of certain of our Eurodenominated subsidiaries. For the years ended December 31, 2008, 2009 and 2010, we designated onaverage 167,578, 95,500 and 74,750 Euros, respectively, of the 63⁄4% Euro Notes as a hedge of netinvestment of certain of our Euro denominated subsidiaries. As a result, we recorded foreign exchangegains of $10,471 ($6,296, net of tax) related to the change in fair value of such debt due to currencytranslation adjustments which is a component of accumulated other comprehensive items, net includedin stockholders’ equity for the year ended December 31, 2008. We recorded foreign exchange gains of$1,863 ($989, net of tax) related to the change in fair value of such debt due to currency translationadjustments which is a component of accumulated other comprehensive items, net included instockholders’ equity for the year ended December 31, 2009. We recorded foreign exchange gains of$7,392 ($4,620, net of tax) related to the change in fair value of such debt due to currency translationadjustments which is a component of accumulated other comprehensive items, net included instockholders’ equity for the year ended December 31, 2010. As of December 31, 2010, net gains of$7,978 are recorded in accumulated other comprehensive items, net associated with this net investmenthedge.
93

IRON MOUNTAIN INCORPORATED
NOTES TO CONSOLIDATED FINANCIAL STATEMENTS (Continued)
DECEMBER 31, 2010(In thousands, except share and per share data)
4. Debt
Long-term debt consists of the following:
December 31, 2009 December 31, 2010
Carrying Fair Carrying FairAmount Value Amount Value
Revolving Credit Facility(1) . . . . . . . . . . . . . . . . . . . . $ 21,799 $ 21,799 $ — $ —Term Loan Facility(1) . . . . . . . . . . . . . . . . . . . . . . . . 400,300 400,300 396,200 396,20071⁄4% GBP Senior Subordinated Notes due 2014
(the ‘‘71⁄4% Notes’’)(2)(3) . . . . . . . . . . . . . . . . . . . . 238,920 236,531 232,530 234,85573⁄4% Senior Subordinated Notes due 2015
(the ‘‘73⁄4% Notes’’)(2)(3) . . . . . . . . . . . . . . . . . . . . 435,856 433,411 233,234 231,68365⁄8% Senior Subordinated Notes due 2016
(the ‘‘65⁄8% Notes’’)(2)(3) . . . . . . . . . . . . . . . . . . . . 317,035 313,200 317,529 321,59271⁄2% CAD Senior Subordinated Notes due 2017
(the ‘‘Subsidiary Notes’’)(2)(4) . . . . . . . . . . . . . . . . 166,810 165,142 175,306 182,09983⁄4% Senior Subordinated Notes due 2018
(the ‘‘83⁄4% Notes’’)(2)(3) . . . . . . . . . . . . . . . . . . . . 200,000 207,750 200,000 209,6258% Senior Subordinated Notes due 2018
(the ‘‘8% Notes’’)(2)(3) . . . . . . . . . . . . . . . . . . . . . 49,749 48,464 49,777 53,75663⁄4% Euro Senior Subordinated Notes due 2018
(the ‘‘63⁄4% Notes’’)(2)(3) . . . . . . . . . . . . . . . . . . . . 363,166 343,562 338,129 337,6318% Senior Subordinated Notes due 2020
(the ‘‘8% Notes due 2020’’)(2)(3) . . . . . . . . . . . . . . 300,000 305,250 300,000 316,31383⁄8% Senior Subordinated Notes due 2021
(the ‘‘83⁄8% Notes’’)(2)(3) . . . . . . . . . . . . . . . . . . . . 548,002 567,188 548,174 589,188Real Estate Mortgages, Capital Leases and Other(5) . . 210,147 210,147 218,576 218,576
Total Long-term Debt . . . . . . . . . . . . . . . . . . . . . . . . 3,251,784 3,009,455Less Current Portion(6) . . . . . . . . . . . . . . . . . . . . . . . (40,561) (96,990)
Long-term Debt, Net of Current Portion . . . . . . . . . . . $3,211,223 $2,912,465
(1) The capital stock or other equity interests of most of our U.S. subsidiaries, and up to 66% of thecapital stock or other equity interests of our first tier foreign subsidiaries, are pledged to securethese debt instruments, together with all intercompany obligations of foreign subsidiaries owed tous or to one of our U.S. subsidiary guarantors. The fair value of this long-term debt approximatesthe carrying value (as borrowings under these debt instruments are based on current variablemarket interest rates as of December 31, 2009 and 2010, respectively).
(2) The fair values of these debt instruments are based on quoted market prices for these notes onDecember 31, 2009 and 2010, respectively.
(3) Collectively referred to as the Parent Notes. IMI is the direct obligor on the Parent Notes, whichare fully and unconditionally guaranteed, on a senior subordinated basis, by substantially all of itsdirect and indirect 100% owned U.S. subsidiaries (the ‘‘Guarantors’’). These guarantees are joint
94

IRON MOUNTAIN INCORPORATED
NOTES TO CONSOLIDATED FINANCIAL STATEMENTS (Continued)
DECEMBER 31, 2010(In thousands, except share and per share data)
4. Debt (Continued)
and several obligations of the Guarantors. Iron Mountain Canada Corporation (‘‘CanadaCompany’’) and the remainder of our subsidiaries do not guarantee the Parent Notes.
(4) Canada Company is the direct obligor on the Subsidiary Notes, which are fully and unconditionallyguaranteed, on a senior subordinated basis, by IMI and the Guarantors. These guarantees are jointand several obligations of IMI and the Guarantors.
(5) Includes (a) real estate mortgages of $6,564 and $7,492 as of December 31, 2009 and 2010,respectively, which bear interest at rates ranging from 1.8% to 7.3% and are payable in variousinstallments through 2023, (b) capital lease obligations of $193,738 and $201,857 as ofDecember 31, 2009 and 2010, respectively, which bear a weighted average interest rate of 6.1% asof December 31, 2010 and (c) other various notes and other obligations, which were assumed by usas a result of certain acquisitions, of $9,845 and $9,227 as of December 31, 2009 and 2010,respectively, and bear a weighted average interest rate of 9.5% as of December 31, 2010. Webelieve the fair value of this debt approximates its carrying value.
(6) Includes $51,694 associated with the 73⁄4% Notes which we fully redeemed in January 2011. Thisamount represents the portion of the redemption funded with cash on-hand. The remaining fundswere drawn under the revolving credit facility.
a. Revolving Credit Facility and Term Loans
Our credit facility consists of (i) revolving credit facilities under which we can borrow, subject tocertain limitations as defined in the credit agreement we entered into on April 16, 2007 governing thisfacility (the ‘‘Credit Agreement’’), up to an aggregate amount of $765,000 (including Canadian dollarand multi-currency revolving credit facilities), and (ii) a $410,000 term loan facility. Our revolving creditfacility is supported by a group of 24 banks. Our subsidiaries, Canada Company and Iron MountainSwitzerland GmbH, may borrow directly under the Canadian revolving credit and multi-currencyrevolving credit facilities, respectively. Additional subsidiary borrowers may be added under the multi-currency revolving credit facility. The revolving credit facility terminates on April 16, 2012. With respectto the term loan facility, quarterly loan payments of approximately $1,000 are required throughmaturity on April 16, 2014, at which time the remaining outstanding principal balance of the term loanfacility is due. The interest rate on borrowings under the Credit Agreement varies depending on ourchoice of interest rate and currency options, plus an applicable margin. IMI guarantees the obligationsof each of the subsidiary borrowers under the Credit Agreement, and substantially all of our U.S.subsidiaries guarantee the obligations of IMI and the subsidiary borrowers. The capital stock or otherequity interests of most of our U.S. subsidiaries, and up to 66% of the capital stock or other equityinterests of our first tier foreign subsidiaries, are pledged to secure the Credit Agreement, togetherwith all intercompany obligations of foreign subsidiaries owed to us or to one of our U.S. subsidiaryguarantors. As of December 31, 2010, we had no outstanding borrowings under the revolving creditfacility; we had various outstanding letters of credit totaling $2,476. The remaining availability, based onIMI’s leverage ratio, which is calculated based on the last 12 months’ earnings before interest, taxes,depreciation and amortization (‘‘EBITDA’’), and other adjustments as defined in the Credit Agreementand current external debt, under the revolving credit facility on December 31, 2010, was $762,524. Theinterest rate in effect under the term loan facility was 1.8% as of December 31, 2010. For the years
95

IRON MOUNTAIN INCORPORATED
NOTES TO CONSOLIDATED FINANCIAL STATEMENTS (Continued)
DECEMBER 31, 2010(In thousands, except share and per share data)
4. Debt (Continued)
ended December 31, 2008, 2009 and 2010, we recorded commitment fees of $1,561, $1,953 and $2,348,respectively, based on the unused balances under our revolving credit facilities.
The Credit Agreement, our indentures and other agreements governing our indebtedness containcertain restrictive financial and operating covenants, including covenants that restrict our ability tocomplete acquisitions, pay cash dividends, incur indebtedness, make investments, sell assets and takecertain other corporate actions. The covenants do not contain a rating trigger. Therefore, a change inour debt rating would not trigger a default under the Credit Agreement, our indentures or otheragreements governing our indebtedness. Our revolving credit and term loan facilities, as well as ourindentures, use EBITDA based calculations as primary measures of financial performance, includingleverage ratios. IMI’s revolving credit and term leverage ratio was 3.3 and 2.9 as of December 31, 2009and 2010, respectively, compared to a maximum allowable ratio of 5.5. Similarly, our bond leverageratio, per the indentures, was 4.1 and 3.4 as of December 31, 2009 and 2010, respectively, compared toa maximum allowable ratio of 6.5. Noncompliance with these leverage ratios would have a materialadverse effect on our financial condition and liquidity. In the fourth quarter of 2007, we designated asExcluded Restricted Subsidiaries (as defined in the indentures), certain of our subsidiaries that own ourassets and conduct our operations in the United Kingdom. As a result of such designation, thesesubsidiaries are now subject to substantially all of the covenants of the indentures, except that they arenot required to provide a guarantee, and the EBITDA and debt of these subsidiaries is included forpurposes of calculating the leverage ratio.
b. Notes Issued under Indentures
As of December 31, 2010, we had nine series of senior subordinated notes issued under variousindentures, eight are direct obligations of the parent company, IMI; one (the Subsidiary Notes) is adirect obligation of Canada Company; and all are subordinated to debt outstanding under the CreditAgreement:
• 150,000 British pounds sterling principal amount of notes maturing on April 15, 2014 andbearing interest at a rate of 71⁄4% per annum, payable semi-annually in arrears on April 15 andOctober 15;
• $231,255 principal amount of notes maturing on January 15, 2015 and bearing interest at a rateof 73⁄4% per annum, payable semi-annually in arrears on January 15 and July 15;
• $320,000 principal amount of notes maturing on January 1, 2016 and bearing interest at a rate of65⁄8% per annum, payable semi-annually in arrears on January 1 and July 1;
• 175,000 CAD principal amount of notes maturing on March 15, 2017 and bearing interest at arate of 71⁄2% per annum, payable semi-annually in arrears on March 15 and September 15 (theSubsidiary Notes);
• $200,000 principal amount of notes maturing on July 15, 2018 and bearing interest at a rate of83⁄4% per annum, payable semi-annually in arrears on January 15 and July 15;
• $50,000 principal amount of notes maturing on October 15, 2018 and bearing interest at a rateof 8% per annum, payable semi-annually in arrears on April 15 and October 15;
96
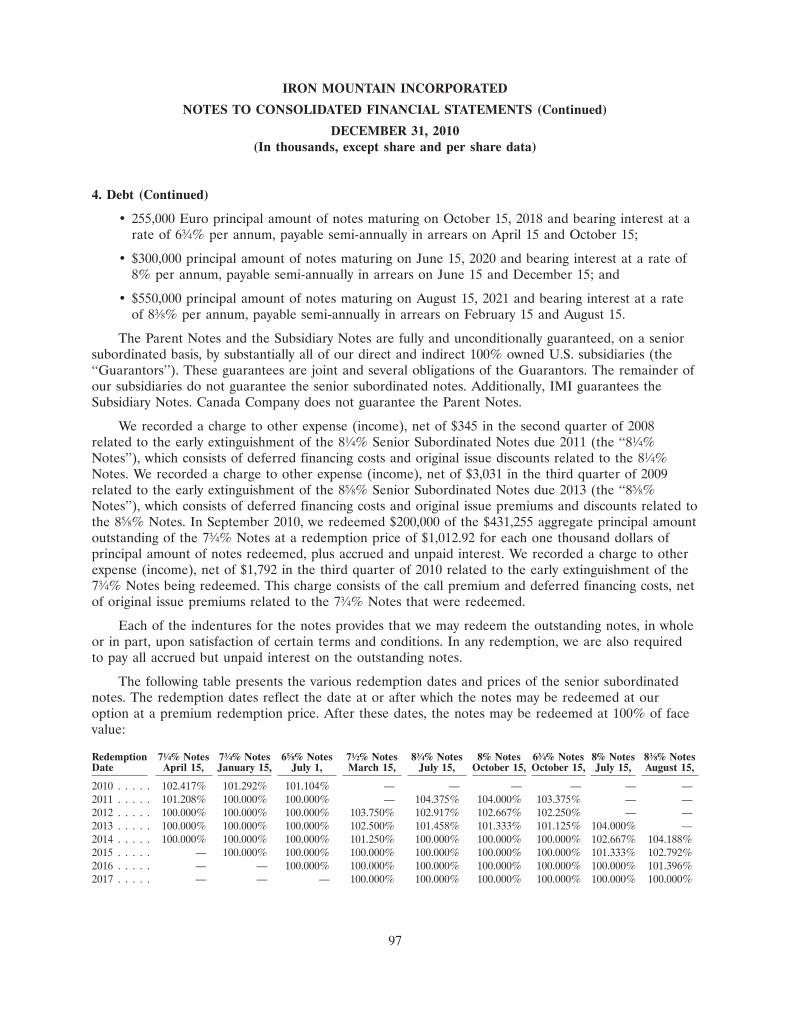
IRON MOUNTAIN INCORPORATED
NOTES TO CONSOLIDATED FINANCIAL STATEMENTS (Continued)
DECEMBER 31, 2010(In thousands, except share and per share data)
4. Debt (Continued)
• 255,000 Euro principal amount of notes maturing on October 15, 2018 and bearing interest at arate of 63⁄4% per annum, payable semi-annually in arrears on April 15 and October 15;
• $300,000 principal amount of notes maturing on June 15, 2020 and bearing interest at a rate of8% per annum, payable semi-annually in arrears on June 15 and December 15; and
• $550,000 principal amount of notes maturing on August 15, 2021 and bearing interest at a rateof 83⁄8% per annum, payable semi-annually in arrears on February 15 and August 15.
The Parent Notes and the Subsidiary Notes are fully and unconditionally guaranteed, on a seniorsubordinated basis, by substantially all of our direct and indirect 100% owned U.S. subsidiaries (the‘‘Guarantors’’). These guarantees are joint and several obligations of the Guarantors. The remainder ofour subsidiaries do not guarantee the senior subordinated notes. Additionally, IMI guarantees theSubsidiary Notes. Canada Company does not guarantee the Parent Notes.
We recorded a charge to other expense (income), net of $345 in the second quarter of 2008related to the early extinguishment of the 81⁄4% Senior Subordinated Notes due 2011 (the ‘‘81⁄4%Notes’’), which consists of deferred financing costs and original issue discounts related to the 81⁄4%Notes. We recorded a charge to other expense (income), net of $3,031 in the third quarter of 2009related to the early extinguishment of the 85⁄8% Senior Subordinated Notes due 2013 (the ‘‘85⁄8%Notes’’), which consists of deferred financing costs and original issue premiums and discounts related tothe 85⁄8% Notes. In September 2010, we redeemed $200,000 of the $431,255 aggregate principal amountoutstanding of the 73⁄4% Notes at a redemption price of $1,012.92 for each one thousand dollars ofprincipal amount of notes redeemed, plus accrued and unpaid interest. We recorded a charge to otherexpense (income), net of $1,792 in the third quarter of 2010 related to the early extinguishment of the73⁄4% Notes being redeemed. This charge consists of the call premium and deferred financing costs, netof original issue premiums related to the 73⁄4% Notes that were redeemed.
Each of the indentures for the notes provides that we may redeem the outstanding notes, in wholeor in part, upon satisfaction of certain terms and conditions. In any redemption, we are also requiredto pay all accrued but unpaid interest on the outstanding notes.
The following table presents the various redemption dates and prices of the senior subordinatednotes. The redemption dates reflect the date at or after which the notes may be redeemed at ouroption at a premium redemption price. After these dates, the notes may be redeemed at 100% of facevalue:
Redemption 71⁄4% Notes 73⁄4% Notes 65⁄8% Notes 71⁄2% Notes 83⁄4% Notes 8% Notes 63⁄4% Notes 8% Notes 83⁄8% NotesDate April 15, January 15, July 1, March 15, July 15, October 15, October 15, July 15, August 15,
2010 . . . . . 102.417% 101.292% 101.104% — — — — — —2011 . . . . . 101.208% 100.000% 100.000% — 104.375% 104.000% 103.375% — —2012 . . . . . 100.000% 100.000% 100.000% 103.750% 102.917% 102.667% 102.250% — —2013 . . . . . 100.000% 100.000% 100.000% 102.500% 101.458% 101.333% 101.125% 104.000% —2014 . . . . . 100.000% 100.000% 100.000% 101.250% 100.000% 100.000% 100.000% 102.667% 104.188%2015 . . . . . — 100.000% 100.000% 100.000% 100.000% 100.000% 100.000% 101.333% 102.792%2016 . . . . . — — 100.000% 100.000% 100.000% 100.000% 100.000% 100.000% 101.396%2017 . . . . . — — — 100.000% 100.000% 100.000% 100.000% 100.000% 100.000%
97

IRON MOUNTAIN INCORPORATED
NOTES TO CONSOLIDATED FINANCIAL STATEMENTS (Continued)
DECEMBER 31, 2010(In thousands, except share and per share data)
4. Debt (Continued)
Prior to July 15, 2011, the 83⁄4% Notes are redeemable at our option, in whole or in part, at aspecified make-whole price.
Prior to October 15, 2011, the 8% Notes and 63⁄4% Notes are redeemable at our option, in wholeor in part, at a specified make-whole price.
Prior to June 15, 2013, the 8% Notes are redeemable at our option, in whole or in part, at aspecified make-whole price.
Prior to August 15, 2014, the 83⁄8% Notes are redeemable at our option, in whole or in part, at aspecified make-whole price.
Each of the indentures for the notes provides that we must repurchase, at the option of theholders, the notes at 101% of their principal amount, plus accrued and unpaid interest, upon theoccurrence of a ‘‘Change of Control,’’ which is defined in each respective indenture. Except forrequired repurchases upon the occurrence of a Change of Control or in the event of certain asset sales,each as described in the respective indenture, we are not required to make sinking fund or redemptionpayments with respect to any of the notes.
Our indentures and other agreements governing our indebtedness contain certain restrictivefinancial and operating covenants including covenants that restrict our ability to complete acquisitions,pay cash dividends, incur indebtedness, make investments, sell assets and take certain other corporateactions. The covenants do not contain a rating trigger. Therefore, a change in our debt rating wouldnot trigger a default under our indentures or other agreements governing our indebtedness.
Maturities of long-term debt, excluding (premiums) discounts, net, are as follows:
Year Amount
2011 . . . . . . . . . . . . . . . . . . . . . . . . . . . . . . . . . . . . . . . . . . . . . . . . . . . . . . . . . . . . . . . $ 96,9902012 . . . . . . . . . . . . . . . . . . . . . . . . . . . . . . . . . . . . . . . . . . . . . . . . . . . . . . . . . . . . . . . 49,1532013 . . . . . . . . . . . . . . . . . . . . . . . . . . . . . . . . . . . . . . . . . . . . . . . . . . . . . . . . . . . . . . . 30,1372014 . . . . . . . . . . . . . . . . . . . . . . . . . . . . . . . . . . . . . . . . . . . . . . . . . . . . . . . . . . . . . . . 634,7922015 . . . . . . . . . . . . . . . . . . . . . . . . . . . . . . . . . . . . . . . . . . . . . . . . . . . . . . . . . . . . . . . 189,325Thereafter . . . . . . . . . . . . . . . . . . . . . . . . . . . . . . . . . . . . . . . . . . . . . . . . . . . . . . . . . . . 2,013,653
$3,014,050
5. Selected Consolidated Financial Statements of Parent, Guarantors, Canada Company andNon-Guarantors
The following data summarizes the consolidating Company on the equity method of accounting asof December 31, 2009 and 2010 and for the years ended December 31, 2008, 2009 and 2010.
The Parent Notes and the Subsidiary Notes are guaranteed by the subsidiaries referred to below asthe ‘‘Guarantors.’’ These subsidiaries are 100% owned by the Parent. The guarantees are full andunconditional, as well as joint and several.
98
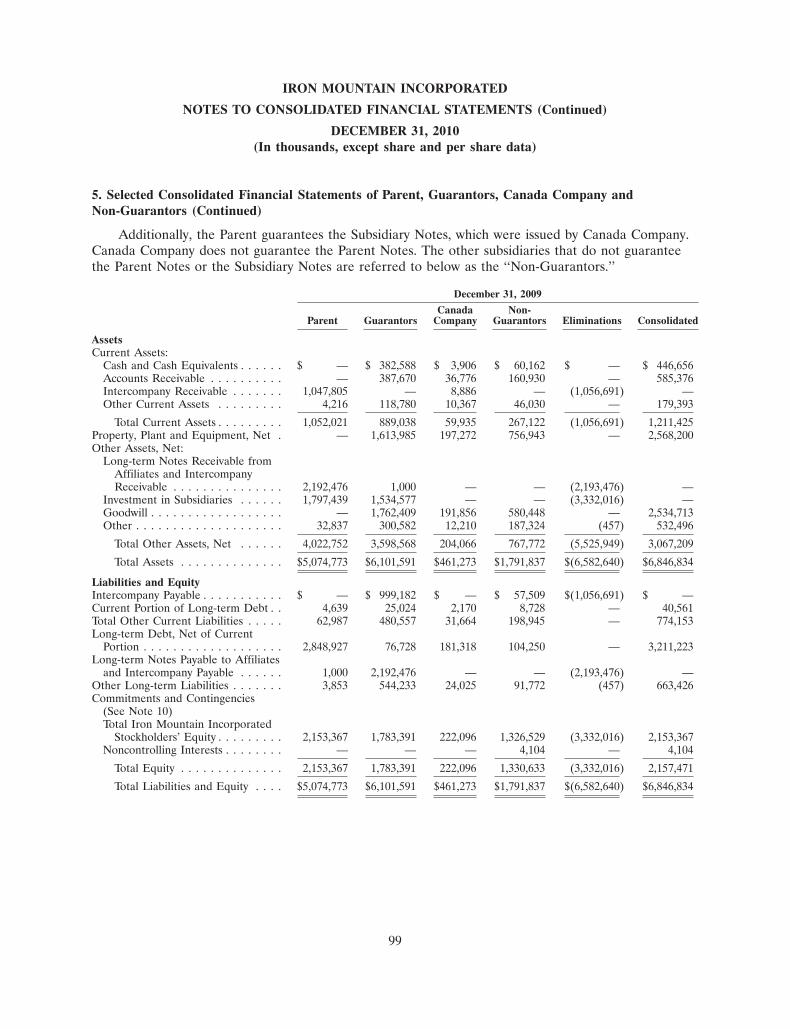
IRON MOUNTAIN INCORPORATED
NOTES TO CONSOLIDATED FINANCIAL STATEMENTS (Continued)
DECEMBER 31, 2010(In thousands, except share and per share data)
5. Selected Consolidated Financial Statements of Parent, Guarantors, Canada Company andNon-Guarantors (Continued)
Additionally, the Parent guarantees the Subsidiary Notes, which were issued by Canada Company.Canada Company does not guarantee the Parent Notes. The other subsidiaries that do not guaranteethe Parent Notes or the Subsidiary Notes are referred to below as the ‘‘Non-Guarantors.’’
December 31, 2009
Canada Non-Parent Guarantors Company Guarantors Eliminations Consolidated
AssetsCurrent Assets:
Cash and Cash Equivalents . . . . . . $ — $ 382,588 $ 3,906 $ 60,162 $ — $ 446,656Accounts Receivable . . . . . . . . . . — 387,670 36,776 160,930 — 585,376Intercompany Receivable . . . . . . . 1,047,805 — 8,886 — (1,056,691) —Other Current Assets . . . . . . . . . 4,216 118,780 10,367 46,030 — 179,393
Total Current Assets . . . . . . . . . 1,052,021 889,038 59,935 267,122 (1,056,691) 1,211,425Property, Plant and Equipment, Net . — 1,613,985 197,272 756,943 — 2,568,200Other Assets, Net:
Long-term Notes Receivable fromAffiliates and IntercompanyReceivable . . . . . . . . . . . . . . . 2,192,476 1,000 — — (2,193,476) —
Investment in Subsidiaries . . . . . . 1,797,439 1,534,577 — — (3,332,016) —Goodwill . . . . . . . . . . . . . . . . . . — 1,762,409 191,856 580,448 — 2,534,713Other . . . . . . . . . . . . . . . . . . . . 32,837 300,582 12,210 187,324 (457) 532,496
Total Other Assets, Net . . . . . . 4,022,752 3,598,568 204,066 767,772 (5,525,949) 3,067,209
Total Assets . . . . . . . . . . . . . . $5,074,773 $6,101,591 $461,273 $1,791,837 $(6,582,640) $6,846,834
Liabilities and EquityIntercompany Payable . . . . . . . . . . . $ — $ 999,182 $ — $ 57,509 $(1,056,691) $ —Current Portion of Long-term Debt . . 4,639 25,024 2,170 8,728 — 40,561Total Other Current Liabilities . . . . . 62,987 480,557 31,664 198,945 — 774,153Long-term Debt, Net of Current
Portion . . . . . . . . . . . . . . . . . . . 2,848,927 76,728 181,318 104,250 — 3,211,223Long-term Notes Payable to Affiliates
and Intercompany Payable . . . . . . 1,000 2,192,476 — — (2,193,476) —Other Long-term Liabilities . . . . . . . 3,853 544,233 24,025 91,772 (457) 663,426Commitments and Contingencies
(See Note 10)Total Iron Mountain Incorporated
Stockholders’ Equity . . . . . . . . . 2,153,367 1,783,391 222,096 1,326,529 (3,332,016) 2,153,367Noncontrolling Interests . . . . . . . . — — — 4,104 — 4,104
Total Equity . . . . . . . . . . . . . . 2,153,367 1,783,391 222,096 1,330,633 (3,332,016) 2,157,471
Total Liabilities and Equity . . . . $5,074,773 $6,101,591 $461,273 $1,791,837 $(6,582,640) $6,846,834
99
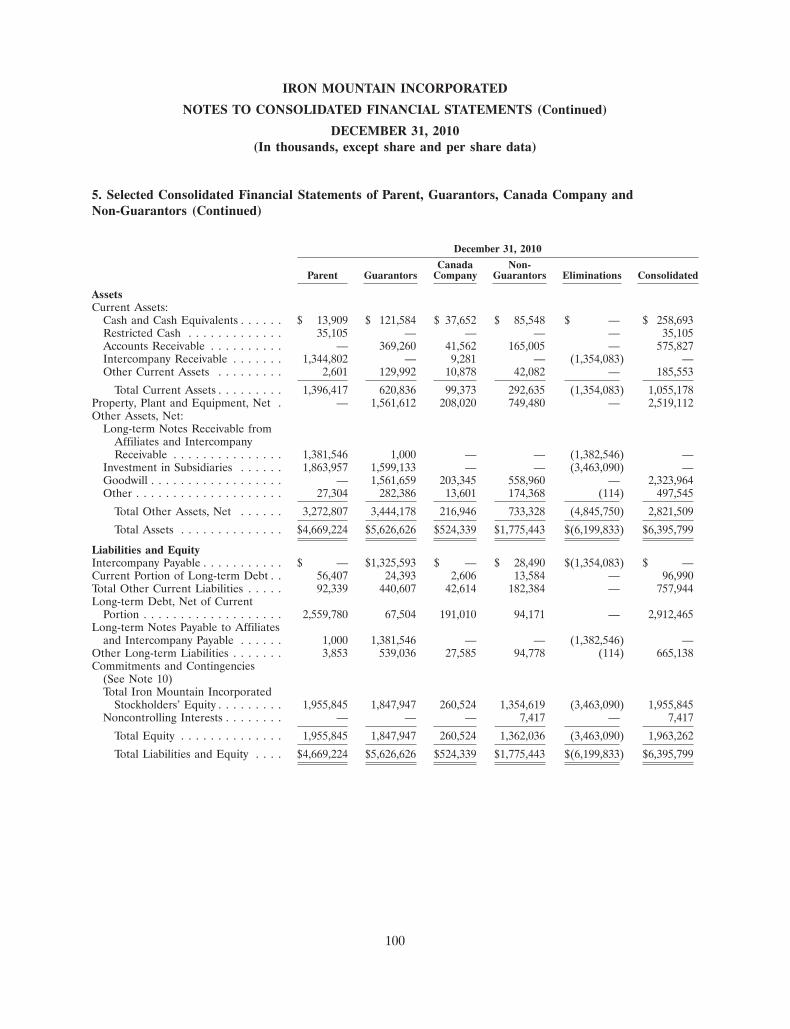
IRON MOUNTAIN INCORPORATED
NOTES TO CONSOLIDATED FINANCIAL STATEMENTS (Continued)
DECEMBER 31, 2010(In thousands, except share and per share data)
5. Selected Consolidated Financial Statements of Parent, Guarantors, Canada Company andNon-Guarantors (Continued)
December 31, 2010
Canada Non-Parent Guarantors Company Guarantors Eliminations Consolidated
AssetsCurrent Assets:
Cash and Cash Equivalents . . . . . . $ 13,909 $ 121,584 $ 37,652 $ 85,548 $ — $ 258,693Restricted Cash . . . . . . . . . . . . . 35,105 — — — — 35,105Accounts Receivable . . . . . . . . . . — 369,260 41,562 165,005 — 575,827Intercompany Receivable . . . . . . . 1,344,802 — 9,281 — (1,354,083) —Other Current Assets . . . . . . . . . 2,601 129,992 10,878 42,082 — 185,553
Total Current Assets . . . . . . . . . 1,396,417 620,836 99,373 292,635 (1,354,083) 1,055,178Property, Plant and Equipment, Net . — 1,561,612 208,020 749,480 — 2,519,112Other Assets, Net:
Long-term Notes Receivable fromAffiliates and IntercompanyReceivable . . . . . . . . . . . . . . . 1,381,546 1,000 — — (1,382,546) —
Investment in Subsidiaries . . . . . . 1,863,957 1,599,133 — — (3,463,090) —Goodwill . . . . . . . . . . . . . . . . . . — 1,561,659 203,345 558,960 — 2,323,964Other . . . . . . . . . . . . . . . . . . . . 27,304 282,386 13,601 174,368 (114) 497,545
Total Other Assets, Net . . . . . . 3,272,807 3,444,178 216,946 733,328 (4,845,750) 2,821,509
Total Assets . . . . . . . . . . . . . . $4,669,224 $5,626,626 $524,339 $1,775,443 $(6,199,833) $6,395,799
Liabilities and EquityIntercompany Payable . . . . . . . . . . . $ — $1,325,593 $ — $ 28,490 $(1,354,083) $ —Current Portion of Long-term Debt . . 56,407 24,393 2,606 13,584 — 96,990Total Other Current Liabilities . . . . . 92,339 440,607 42,614 182,384 — 757,944Long-term Debt, Net of Current
Portion . . . . . . . . . . . . . . . . . . . 2,559,780 67,504 191,010 94,171 — 2,912,465Long-term Notes Payable to Affiliates
and Intercompany Payable . . . . . . 1,000 1,381,546 — — (1,382,546) —Other Long-term Liabilities . . . . . . . 3,853 539,036 27,585 94,778 (114) 665,138Commitments and Contingencies
(See Note 10)Total Iron Mountain Incorporated
Stockholders’ Equity . . . . . . . . . 1,955,845 1,847,947 260,524 1,354,619 (3,463,090) 1,955,845Noncontrolling Interests . . . . . . . . — — — 7,417 — 7,417
Total Equity . . . . . . . . . . . . . . 1,955,845 1,847,947 260,524 1,362,036 (3,463,090) 1,963,262
Total Liabilities and Equity . . . . $4,669,224 $5,626,626 $524,339 $1,775,443 $(6,199,833) $6,395,799
100

IRON MOUNTAIN INCORPORATED
NOTES TO CONSOLIDATED FINANCIAL STATEMENTS (Continued)
DECEMBER 31, 2010(In thousands, except share and per share data)
5. Selected Consolidated Financial Statements of Parent, Guarantors, Canada Company andNon-Guarantors (Continued)
Year Ended December 31, 2008
Canada Non-Parent Guarantors Company Guarantors Eliminations Consolidated
Revenues:Storage . . . . . . . . . . . . . . . . . . . $ — $1,152,222 $ 92,532 $ 383,944 $ — $1,628,698Service . . . . . . . . . . . . . . . . . . . . — 929,639 98,355 398,442 — 1,426,436
Total Revenues . . . . . . . . . . . . . — 2,081,861 190,887 782,386 — 3,055,134Operating Expenses:
Cost of Sales (ExcludingDepreciation and Amortization) . — 884,212 84,216 413,591 — 1,382,019
Selling, General and Administrative . 109 626,983 33,175 222,097 — 882,364Depreciation and Amortization . . . . 182 196,783 13,755 80,018 — 290,738Loss (Gain) on Disposal/Writedown
of Property, Plant and Equipment,Net . . . . . . . . . . . . . . . . . . . . — 7,568 21 (106) — 7,483
Total Operating Expenses . . . . . . 291 1,715,546 131,167 715,600 — 2,562,604
Operating (Loss) Income . . . . . . . . . (291) 366,315 59,720 66,786 — 492,530Interest Expense (Income), Net . . . . . 209,712 (28,760) 46,849 8,834 — 236,635Other (Income) Expense, Net . . . . . . (125,361) (2,248) (351) 158,988 — 31,028
(Loss) Income Before Provision(Benefit) for Income Taxes . . . . . . (84,642) 397,323 13,222 (101,036) — 224,867
Provision (Benefit) for Income Taxes . — 138,454 (3,682) 8,152 — 142,924Equity in the (Earnings) Losses of
Subsidiaries, Net of Tax . . . . . . . . . (166,679) 95,532 — — 71,147 —
Net Income (Loss) . . . . . . . . . . . . . 82,037 163,337 16,904 (109,188) (71,147) 81,943Less: Net (Loss) Income
Attributable to NoncontrollingInterests . . . . . . . . . . . . . . . . . — — — (94) — (94)
Net Income (Loss) Attributable toIron Mountain Incorporated . . . . . $ 82,037 $ 163,337 $ 16,904 $(109,094) $ (71,147) $ 82,037
101

IRON MOUNTAIN INCORPORATED
NOTES TO CONSOLIDATED FINANCIAL STATEMENTS (Continued)
DECEMBER 31, 2010(In thousands, except share and per share data)
5. Selected Consolidated Financial Statements of Parent, Guarantors, Canada Company andNon-Guarantors (Continued)
Year Ended December 31, 2009
Canada Non-Parent Guarantors Company Guarantors Eliminations Consolidated
Revenues:Storage . . . . . . . . . . . . . . . . . . . $ — $1,219,149 $ 93,244 $ 355,249 $ — $1,667,642Service . . . . . . . . . . . . . . . . . . . . — 904,443 96,764 344,746 — 1,345,953
Total Revenues . . . . . . . . . . . . . — 2,123,592 190,008 699,995 — 3,013,595Operating Expenses:
Cost of Sales (ExcludingDepreciation and Amortization) . — 829,539 80,205 361,470 — 1,271,214
Selling, General and Administrative . 92 638,770 32,127 203,370 — 874,359Depreciation and Amortization . . . . 231 226,559 15,717 76,565 — 319,072Loss (Gain) on Disposal/Writedown
of Property, Plant and Equipment,Net . . . . . . . . . . . . . . . . . . . . — 1,435 123 (1,152) — 406
Total Operating Expenses . . . . . . 323 1,696,303 128,172 640,253 — 2,465,051
Operating (Loss) Income . . . . . . . . . (323) 427,289 61,836 59,742 — 548,544Interest Expense (Income), Net . . . . . 202,947 (28,189) 42,066 10,966 — 227,790Other Expense (Income), Net . . . . . . 44,642 (4,766) (2) (51,953) — (12,079)
(Loss) Income Before Provision(Benefit) for Income Taxes . . . . . . (247,912) 460,244 19,772 100,729 — 332,833
Provision (Benefit) for Income Taxes . — 97,504 3,624 9,399 — 110,527Equity in the (Earnings) Losses of
Subsidiaries, Net of Tax . . . . . . . . . (468,789) (102,601) — — 571,390 —
Net Income (Loss) . . . . . . . . . . . . . 220,877 465,341 16,148 91,330 (571,390) 222,306Less: Net Income (Loss)
Attributable to NoncontrollingInterests . . . . . . . . . . . . . . . . . — — — 1,429 — 1,429
Net Income (Loss) Attributable toIron Mountain Incorporated . . . . . $ 220,877 $ 465,341 $ 16,148 $ 89,901 $(571,390) $ 220,877
102
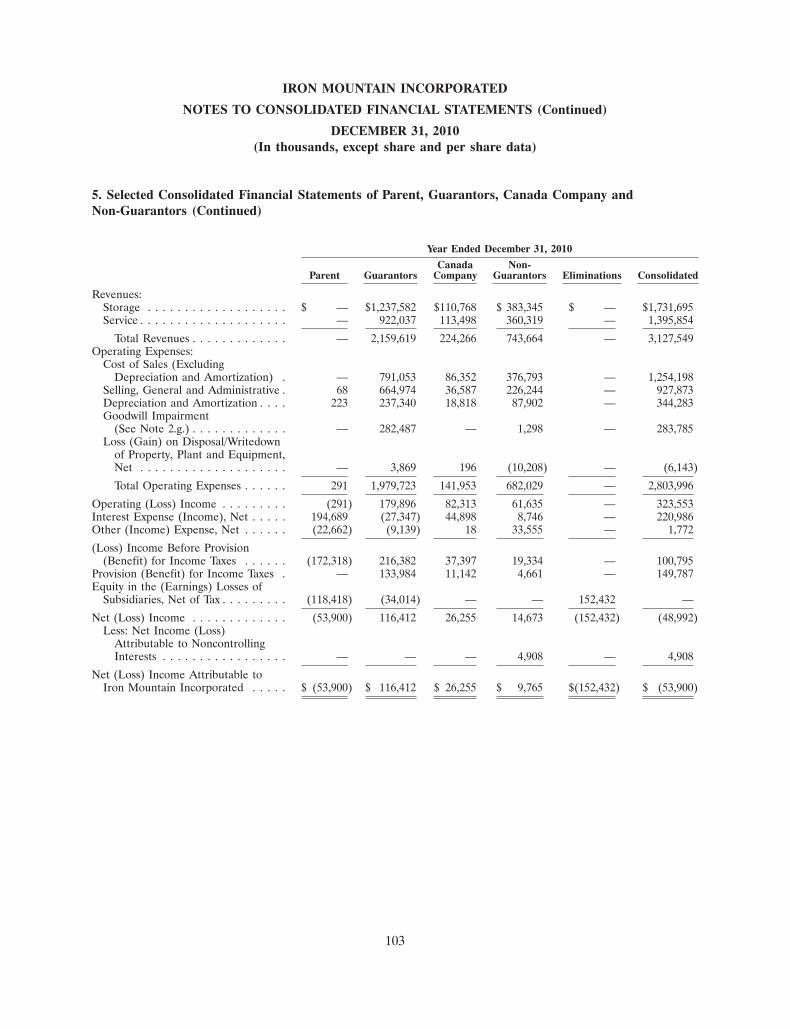
IRON MOUNTAIN INCORPORATED
NOTES TO CONSOLIDATED FINANCIAL STATEMENTS (Continued)
DECEMBER 31, 2010(In thousands, except share and per share data)
5. Selected Consolidated Financial Statements of Parent, Guarantors, Canada Company andNon-Guarantors (Continued)
Year Ended December 31, 2010
Canada Non-Parent Guarantors Company Guarantors Eliminations Consolidated
Revenues:Storage . . . . . . . . . . . . . . . . . . . $ — $1,237,582 $110,768 $ 383,345 $ — $1,731,695Service . . . . . . . . . . . . . . . . . . . . — 922,037 113,498 360,319 — 1,395,854
Total Revenues . . . . . . . . . . . . . — 2,159,619 224,266 743,664 — 3,127,549Operating Expenses:
Cost of Sales (ExcludingDepreciation and Amortization) . — 791,053 86,352 376,793 — 1,254,198
Selling, General and Administrative . 68 664,974 36,587 226,244 — 927,873Depreciation and Amortization . . . . 223 237,340 18,818 87,902 — 344,283Goodwill Impairment
(See Note 2.g.) . . . . . . . . . . . . . — 282,487 — 1,298 — 283,785Loss (Gain) on Disposal/Writedown
of Property, Plant and Equipment,Net . . . . . . . . . . . . . . . . . . . . — 3,869 196 (10,208) — (6,143)
Total Operating Expenses . . . . . . 291 1,979,723 141,953 682,029 — 2,803,996
Operating (Loss) Income . . . . . . . . . (291) 179,896 82,313 61,635 — 323,553Interest Expense (Income), Net . . . . . 194,689 (27,347) 44,898 8,746 — 220,986Other (Income) Expense, Net . . . . . . (22,662) (9,139) 18 33,555 — 1,772
(Loss) Income Before Provision(Benefit) for Income Taxes . . . . . . (172,318) 216,382 37,397 19,334 — 100,795
Provision (Benefit) for Income Taxes . — 133,984 11,142 4,661 — 149,787Equity in the (Earnings) Losses of
Subsidiaries, Net of Tax . . . . . . . . . (118,418) (34,014) — — 152,432 —
Net (Loss) Income . . . . . . . . . . . . . (53,900) 116,412 26,255 14,673 (152,432) (48,992)Less: Net Income (Loss)
Attributable to NoncontrollingInterests . . . . . . . . . . . . . . . . . — — — 4,908 — 4,908
Net (Loss) Income Attributable toIron Mountain Incorporated . . . . . $ (53,900) $ 116,412 $ 26,255 $ 9,765 $(152,432) $ (53,900)
103
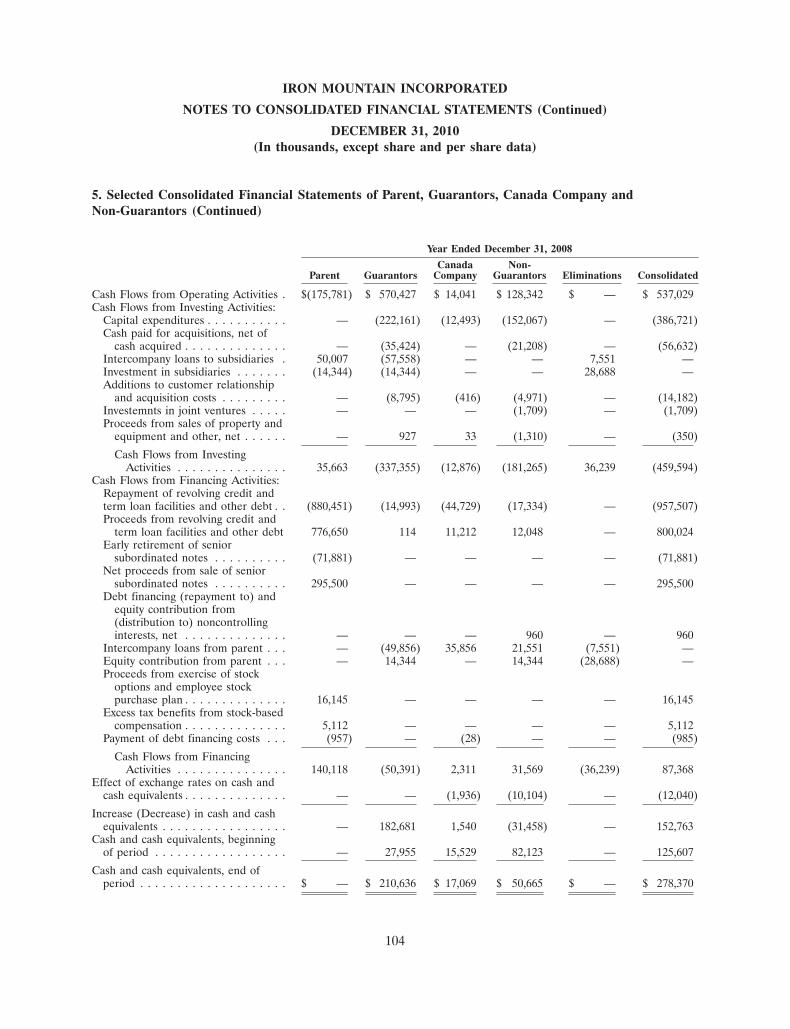
IRON MOUNTAIN INCORPORATED
NOTES TO CONSOLIDATED FINANCIAL STATEMENTS (Continued)
DECEMBER 31, 2010(In thousands, except share and per share data)
5. Selected Consolidated Financial Statements of Parent, Guarantors, Canada Company andNon-Guarantors (Continued)
Year Ended December 31, 2008
Canada Non-Parent Guarantors Company Guarantors Eliminations Consolidated
Cash Flows from Operating Activities . $(175,781) $ 570,427 $ 14,041 $ 128,342 $ — $ 537,029Cash Flows from Investing Activities:
Capital expenditures . . . . . . . . . . . — (222,161) (12,493) (152,067) — (386,721)Cash paid for acquisitions, net of
cash acquired . . . . . . . . . . . . . . — (35,424) — (21,208) — (56,632)Intercompany loans to subsidiaries . 50,007 (57,558) — — 7,551 —Investment in subsidiaries . . . . . . . (14,344) (14,344) — — 28,688 —Additions to customer relationship
and acquisition costs . . . . . . . . . — (8,795) (416) (4,971) — (14,182)Investemnts in joint ventures . . . . . — — — (1,709) — (1,709)Proceeds from sales of property and
equipment and other, net . . . . . . — 927 33 (1,310) — (350)
Cash Flows from InvestingActivities . . . . . . . . . . . . . . . 35,663 (337,355) (12,876) (181,265) 36,239 (459,594)
Cash Flows from Financing Activities:Repayment of revolving credit andterm loan facilities and other debt . . (880,451) (14,993) (44,729) (17,334) — (957,507)Proceeds from revolving credit and
term loan facilities and other debt 776,650 114 11,212 12,048 — 800,024Early retirement of senior
subordinated notes . . . . . . . . . . (71,881) — — — — (71,881)Net proceeds from sale of senior
subordinated notes . . . . . . . . . . 295,500 — — — — 295,500Debt financing (repayment to) and
equity contribution from(distribution to) noncontrollinginterests, net . . . . . . . . . . . . . . — — — 960 — 960
Intercompany loans from parent . . . — (49,856) 35,856 21,551 (7,551) —Equity contribution from parent . . . — 14,344 — 14,344 (28,688) —Proceeds from exercise of stock
options and employee stockpurchase plan . . . . . . . . . . . . . . 16,145 — — — — 16,145
Excess tax benefits from stock-basedcompensation . . . . . . . . . . . . . . 5,112 — — — — 5,112
Payment of debt financing costs . . . (957) — (28) — — (985)
Cash Flows from FinancingActivities . . . . . . . . . . . . . . . 140,118 (50,391) 2,311 31,569 (36,239) 87,368
Effect of exchange rates on cash andcash equivalents . . . . . . . . . . . . . . — — (1,936) (10,104) — (12,040)
Increase (Decrease) in cash and cashequivalents . . . . . . . . . . . . . . . . . — 182,681 1,540 (31,458) — 152,763
Cash and cash equivalents, beginningof period . . . . . . . . . . . . . . . . . . — 27,955 15,529 82,123 — 125,607
Cash and cash equivalents, end ofperiod . . . . . . . . . . . . . . . . . . . . $ — $ 210,636 $ 17,069 $ 50,665 $ — $ 278,370
104
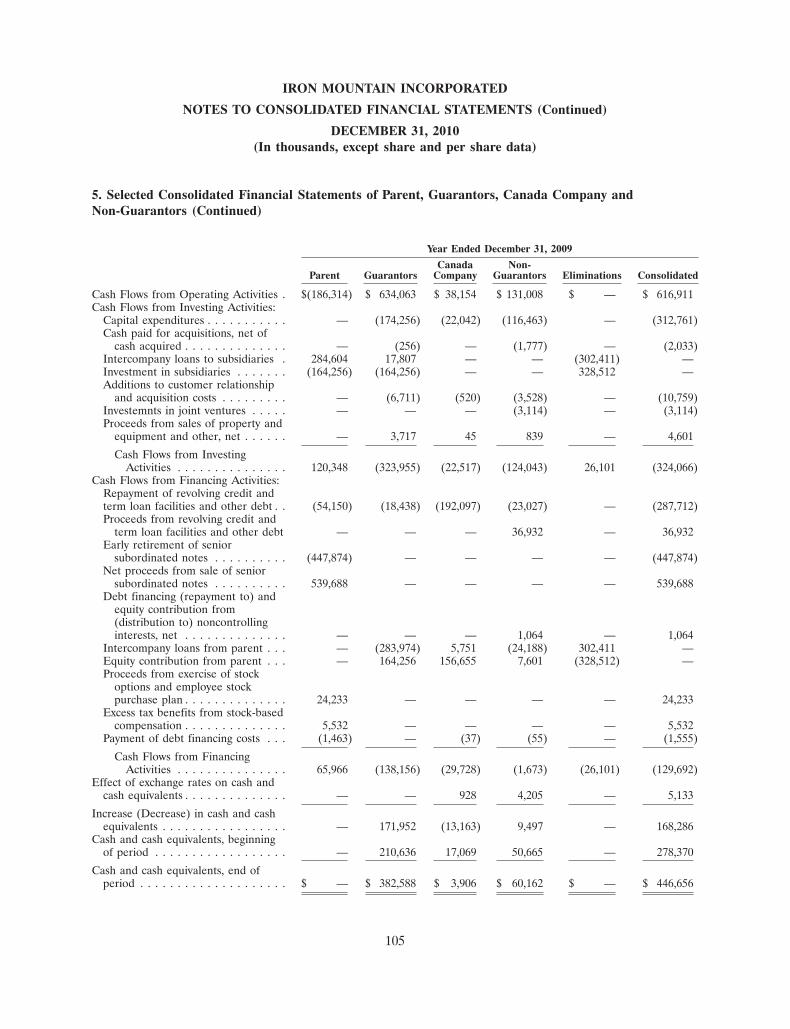
IRON MOUNTAIN INCORPORATED
NOTES TO CONSOLIDATED FINANCIAL STATEMENTS (Continued)
DECEMBER 31, 2010(In thousands, except share and per share data)
5. Selected Consolidated Financial Statements of Parent, Guarantors, Canada Company andNon-Guarantors (Continued)
Year Ended December 31, 2009
Canada Non-Parent Guarantors Company Guarantors Eliminations Consolidated
Cash Flows from Operating Activities . $(186,314) $ 634,063 $ 38,154 $ 131,008 $ — $ 616,911Cash Flows from Investing Activities:
Capital expenditures . . . . . . . . . . . — (174,256) (22,042) (116,463) — (312,761)Cash paid for acquisitions, net of
cash acquired . . . . . . . . . . . . . . — (256) — (1,777) — (2,033)Intercompany loans to subsidiaries . 284,604 17,807 — — (302,411) —Investment in subsidiaries . . . . . . . (164,256) (164,256) — — 328,512 —Additions to customer relationship
and acquisition costs . . . . . . . . . — (6,711) (520) (3,528) — (10,759)Investemnts in joint ventures . . . . . — — — (3,114) — (3,114)Proceeds from sales of property and
equipment and other, net . . . . . . — 3,717 45 839 — 4,601
Cash Flows from InvestingActivities . . . . . . . . . . . . . . . 120,348 (323,955) (22,517) (124,043) 26,101 (324,066)
Cash Flows from Financing Activities:Repayment of revolving credit andterm loan facilities and other debt . . (54,150) (18,438) (192,097) (23,027) — (287,712)Proceeds from revolving credit and
term loan facilities and other debt — — — 36,932 — 36,932Early retirement of senior
subordinated notes . . . . . . . . . . (447,874) — — — — (447,874)Net proceeds from sale of senior
subordinated notes . . . . . . . . . . 539,688 — — — — 539,688Debt financing (repayment to) and
equity contribution from(distribution to) noncontrollinginterests, net . . . . . . . . . . . . . . — — — 1,064 — 1,064
Intercompany loans from parent . . . — (283,974) 5,751 (24,188) 302,411 —Equity contribution from parent . . . — 164,256 156,655 7,601 (328,512) —Proceeds from exercise of stock
options and employee stockpurchase plan . . . . . . . . . . . . . . 24,233 — — — — 24,233
Excess tax benefits from stock-basedcompensation . . . . . . . . . . . . . . 5,532 — — — — 5,532
Payment of debt financing costs . . . (1,463) — (37) (55) — (1,555)
Cash Flows from FinancingActivities . . . . . . . . . . . . . . . 65,966 (138,156) (29,728) (1,673) (26,101) (129,692)
Effect of exchange rates on cash andcash equivalents . . . . . . . . . . . . . . — — 928 4,205 — 5,133
Increase (Decrease) in cash and cashequivalents . . . . . . . . . . . . . . . . . — 171,952 (13,163) 9,497 — 168,286
Cash and cash equivalents, beginningof period . . . . . . . . . . . . . . . . . . — 210,636 17,069 50,665 — 278,370
Cash and cash equivalents, end ofperiod . . . . . . . . . . . . . . . . . . . . $ — $ 382,588 $ 3,906 $ 60,162 $ — $ 446,656
105

IRON MOUNTAIN INCORPORATED
NOTES TO CONSOLIDATED FINANCIAL STATEMENTS (Continued)
DECEMBER 31, 2010(In thousands, except share and per share data)
5. Selected Consolidated Financial Statements of Parent, Guarantors, Canada Company andNon-Guarantors (Continued)
Year Ended December 31, 2010
Canada Non-Parent Guarantors Company Guarantors Eliminations Consolidated
Cash Flows from Operating Activities . $(180,588) $ 597,506 $ 56,113 $ 152,109 $ — $ 625,140Cash Flows from Investing Activities:
Capital expenditures . . . . . . . . . . . — (155,737) (16,593) (105,297) — (277,627)Cash paid for acquisitions, net of
cash acquired . . . . . . . . . . . . . . — (112,346) (3,705) (13,348) — (129,399)Intercompany loans to subsidiaries . 577,316 34,465 — — (611,781) —Investment in subsidiaries . . . . . . . (12,054) (36,920) — — 48,974 —Investment in restricted cash . . . . . (35,102) — — — — (35,102)Additions to customer relationship
and acquisition costs . . . . . . . . . — (9,332) (594) (3,315) — (13,241)Proceeds from sales of property and
equipment and other, net . . . . . . — 5,867 93 16,739 — 22,699
Cash Flows from InvestingActivities . . . . . . . . . . . . . . . 530,160 (274,003) (20,799) (105,221) (562,807) (432,670)
Cash Flows from Financing Activities:Repayment of revolving credit and
term loan facilities and other debt (4,100) (24,226) (2,504) (73,857) — (104,687)Proceeds from revolving credit and
term loan facilities and other debt — — — 54,847 — 54,847Early retirement of senior
subordinated notes . . . . . . . . . . (202,584) — — — — (202,584)Debt financing (repayment to) and
equity contribution from(distribution to) noncontrollinginterests, net . . . . . . . . . . . . . . — — — 169 — 169
Intercompany loans from parent . . . — (572,335) 122 (39,568) 611,781 —Equity contribution from parent . . . — 12,054 — 36,920 (48,974) —Stock repurchases . . . . . . . . . . . . (111,563) — — — — (111,563)Parent cash dividends . . . . . . . . . . (37,893) — — — — (37,893)Proceeds from exercise of stock
options and employee stockpurchase plan . . . . . . . . . . . . . . 18,225 — — — — 18,225
Excess tax benefits from stock-basedcompensation . . . . . . . . . . . . . . 2,252 — — — — 2,252
Cash Flows from FinancingActivities . . . . . . . . . . . . . . . (335,663) (584,507) (2,382) (21,489) 562,807 (381,234)
Effect of exchange rates on cash andcash equivalents . . . . . . . . . . . . . . — — 814 (13) — 801
Increase (Decrease) in cash and cashequivalents . . . . . . . . . . . . . . . . . 13,909 (261,004) 33,746 25,386 — (187,963)
Cash and cash equivalents, beginningof period . . . . . . . . . . . . . . . . . . — 382,588 3,906 60,162 — 446,656
Cash and cash equivalents, end ofperiod . . . . . . . . . . . . . . . . . . . . $ 13,909 $ 121,584 $ 37,652 $ 85,548 $ — $ 258,693
106
IRON MOUNTAIN INCORPORATED
NOTES TO CONSOLIDATED FINANCIAL STATEMENTS (Continued)
DECEMBER 31, 2010(In thousands, except share and per share data)
6. Acquisitions
We account for acquisitions using the purchase method of accounting, and, accordingly, the resultsof operations for each acquisition have been included in our consolidated results from their respectiveacquisition dates. Cash consideration for our various acquisitions was primarily provided throughborrowings under our credit facilities and cash equivalents on-hand. We completed no acquisitionsduring 2009. Included in cash paid for acquisitions in the consolidated statement of cash flows for theyear ended December 31, 2009 is contingent and other payments of $2,033 related to acquisitions madein prior years. The unaudited pro forma results of operations for the current and prior periods are notpresented due to the insignificant impact of the 2008 and 2010 acquisitions on our consolidated resultsof operations. Noteworthy acquisitions are as follows:
To enhance our existing operations in the records management and information destructionbusiness and expand our geographical footprint in North America, in May 2008, we acquiredDocuVault for $31,378. DocuVault provided records storage, secure shredding and data backup servicesin Denver and Colorado Springs.
In February 2010, we acquired the stock of Mimosa Systems, Inc. (‘‘Mimosa’’), a provider ofenterprise-class digital content archiving solutions, for approximately $112,000 in cash andapproximately $2,000 in fair value of options issued. Mimosa, based in Santa Clara, California, providesan on-premises integrated archive for email, SharePoint� data and files, and complements IMI’sexisting enterprise-class, cloud-based digital archive services. NearPoint�, Mimosa’s enterprise archivingplatform, has applications for retention and disposition, eDiscovery, compliance supervision,classification, recovery, and end-user search, enabling customers to reduce risk and lower theireDiscovery and storage costs. Mimosa is part of the Worldwide Digital Business segment. We deposited$11,200 of the cash consideration payable in our acquisition of Mimosa into escrow to secure certainindemnification obligations of the former stockholders of Mimosa (the ‘‘Mimosa Stockholders’’) and tosatisfy certain other obligations of the Mimosa Stockholders. On May 16, 2011, amounts remaining inthe escrow fund will be distributed to the Mimosa Stockholders, minus (i) $750 which shall continue tobe held as security for certain types of claims and (ii) any amounts held for unresolved indemnificationclaims made by us. On February 16, 2012, the balance of the escrow fund less any amounts held forunresolved claims will be distributed to the Mimosa Stockholders. The allocation of the purchase pricewill be finalized upon the final settlement of the purchase price with the Mimosa Stockholders.Acquisition costs expensed associated with the Mimosa acquisition were not significant.
In May 2010 we acquired the remaining 87% interest of our joint venture in Greece (Safedoc S.A.) in a stock transaction for a cash purchase price of approximately $4,700, and we now control100% of our Greek operations, which provide storage and records management services. The carryingvalue of the 13% interest that we had previously acquired and accounted for under the equity methodof accounting amounted to approximately $416 and the fair value of such interest on the date ofacquisition was approximately $473 and resulted in a gain being recorded on the date of the transactionto other (income) expense, net of approximately $57 during the second quarter of 2010.
107

IRON MOUNTAIN INCORPORATED
NOTES TO CONSOLIDATED FINANCIAL STATEMENTS (Continued)
DECEMBER 31, 2010(In thousands, except share and per share data)
6. Acquisitions (Continued)
A summary of the cumulative consideration paid and the allocation of the purchase price of all ofthe acquisitions in each respective year is as follows:
2008 2010
Cash Paid (gross of cash acquired) . . . . . . . . . . . . . . . . . . . . . . . . . . . . . . . . . . $54,541(1) $121,697Fair Value of Options Issued . . . . . . . . . . . . . . . . . . . . . . . . . . . . . . . . . . . . . . — 1,997Fair Value of Previously Held Equity Interest . . . . . . . . . . . . . . . . . . . . . . . . . . — 473
Total Consideration . . . . . . . . . . . . . . . . . . . . . . . . . . . . . . . . . . . . . . . . . . . 54,541 124,167Fair Value of Identifiable Assets Acquired:
Cash, Accounts Receivable, Prepaid Expenses,Deferred Income Taxes and Other . . . . . . . . . . . . . . . . . . . . . . . . . . . . . . . . 3,172 29,194Property, Plant and Equipment(2) . . . . . . . . . . . . . . . . . . . . . . . . . . . . . . . . . 4,026 3,366Customer Relationship Assets(3) . . . . . . . . . . . . . . . . . . . . . . . . . . . . . . . . . . 24,989 8,789Core Technology(3) . . . . . . . . . . . . . . . . . . . . . . . . . . . . . . . . . . . . . . . . . . . 2,511 2,600Other Assets . . . . . . . . . . . . . . . . . . . . . . . . . . . . . . . . . . . . . . . . . . . . . . . . 996 —Liabilities Assumed(4) . . . . . . . . . . . . . . . . . . . . . . . . . . . . . . . . . . . . . . . . . (3,922) (9,066)Noncontrolling Interests . . . . . . . . . . . . . . . . . . . . . . . . . . . . . . . . . . . . . . . . 4,489(5) (390)
Total Fair Value of Identifiable Net Assets Acquired . . . . . . . . . . . . . . . . . . . 36,261 34,493
Recorded Goodwill . . . . . . . . . . . . . . . . . . . . . . . . . . . . . . . . . . . . . . . . . . . . . $18,280 $ 89,674
(1) Included in cash paid for acquisitions in the consolidated statements of cash flows for the yearsended December 31, 2008 and 2010 are contingent and other payments of $2,319 and $8,540,respectively, related to acquisitions made in previous years.
(2) Consists primarily of racking, leasehold improvements and computer hardware and software.
(3) The weighted average lives of customer relationship assets associated with acquisitions in 2008 was28 years. The weighted average lives of customer relationship assets and core technology associatedwith acquisitions in 2010 were 10 and 9 years, respectively.
(4) Consists primarily of accounts payable, accrued expenses, notes payable, deferred revenue anddeferred income taxes.
(5) Consisted primarily of the carrying value of noncontrolling interests in Brazil at the date ofacquisition in 2008.
Allocations of the purchase price for the 2010 acquisitions were based on estimates of the fairvalue of net assets acquired and are subject to adjustment. The purchase price allocations of the 2010acquisitions are subject to finalization of the assessment of the fair value of intangible assets (primarilycustomer relationship assets) and racking.
In connection with our acquisition in India in May 2006, we entered into a shareholder agreement.The agreement contains a put provision that would allow the noncontrolling interest holder to sell theremaining 49.9% equity interest to us beginning on the third anniversary of this agreement for thegreater of fair market value or approximately 84,835 Rupees (approximately $1,872). We recorded a
108
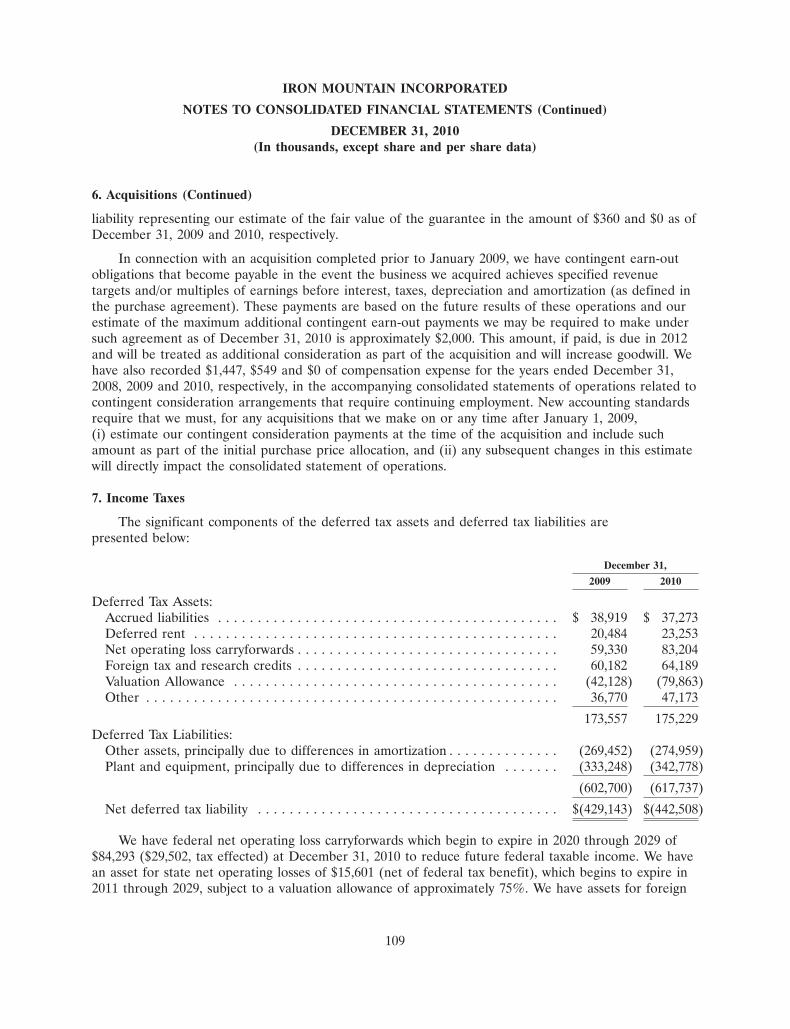
IRON MOUNTAIN INCORPORATED
NOTES TO CONSOLIDATED FINANCIAL STATEMENTS (Continued)
DECEMBER 31, 2010(In thousands, except share and per share data)
6. Acquisitions (Continued)
liability representing our estimate of the fair value of the guarantee in the amount of $360 and $0 as ofDecember 31, 2009 and 2010, respectively.
In connection with an acquisition completed prior to January 2009, we have contingent earn-outobligations that become payable in the event the business we acquired achieves specified revenuetargets and/or multiples of earnings before interest, taxes, depreciation and amortization (as defined inthe purchase agreement). These payments are based on the future results of these operations and ourestimate of the maximum additional contingent earn-out payments we may be required to make undersuch agreement as of December 31, 2010 is approximately $2,000. This amount, if paid, is due in 2012and will be treated as additional consideration as part of the acquisition and will increase goodwill. Wehave also recorded $1,447, $549 and $0 of compensation expense for the years ended December 31,2008, 2009 and 2010, respectively, in the accompanying consolidated statements of operations related tocontingent consideration arrangements that require continuing employment. New accounting standardsrequire that we must, for any acquisitions that we make on or any time after January 1, 2009,(i) estimate our contingent consideration payments at the time of the acquisition and include suchamount as part of the initial purchase price allocation, and (ii) any subsequent changes in this estimatewill directly impact the consolidated statement of operations.
7. Income Taxes
The significant components of the deferred tax assets and deferred tax liabilities arepresented below:
December 31,
2009 2010
Deferred Tax Assets:Accrued liabilities . . . . . . . . . . . . . . . . . . . . . . . . . . . . . . . . . . . . . . . . . . . $ 38,919 $ 37,273Deferred rent . . . . . . . . . . . . . . . . . . . . . . . . . . . . . . . . . . . . . . . . . . . . . . 20,484 23,253Net operating loss carryforwards . . . . . . . . . . . . . . . . . . . . . . . . . . . . . . . . . 59,330 83,204Foreign tax and research credits . . . . . . . . . . . . . . . . . . . . . . . . . . . . . . . . . 60,182 64,189Valuation Allowance . . . . . . . . . . . . . . . . . . . . . . . . . . . . . . . . . . . . . . . . . (42,128) (79,863)Other . . . . . . . . . . . . . . . . . . . . . . . . . . . . . . . . . . . . . . . . . . . . . . . . . . . . 36,770 47,173
173,557 175,229Deferred Tax Liabilities:
Other assets, principally due to differences in amortization . . . . . . . . . . . . . . (269,452) (274,959)Plant and equipment, principally due to differences in depreciation . . . . . . . (333,248) (342,778)
(602,700) (617,737)
Net deferred tax liability . . . . . . . . . . . . . . . . . . . . . . . . . . . . . . . . . . . . . . $(429,143) $(442,508)
We have federal net operating loss carryforwards which begin to expire in 2020 through 2029 of$84,293 ($29,502, tax effected) at December 31, 2010 to reduce future federal taxable income. We havean asset for state net operating losses of $15,601 (net of federal tax benefit), which begins to expire in2011 through 2029, subject to a valuation allowance of approximately 75%. We have assets for foreign
109

IRON MOUNTAIN INCORPORATED
NOTES TO CONSOLIDATED FINANCIAL STATEMENTS (Continued)
DECEMBER 31, 2010(In thousands, except share and per share data)
7. Income Taxes (Continued)
net operating losses of $38,101, with various expiration dates, subject to a valuation allowance ofapproximately 74%. Additionally, we have federal research credits of $2,200 which begin to expire in2022 through 2029 and state research credit of $1,148 (net of federal tax benefit), which have noexpiration date, subject to a valuation allowance of approximately 19%. We also have foreign taxcredits of $60,841, which begin to expire in 2014 through 2019, subject to a valuation allowance ofapproximately 65%. U.S. legislative changes in 2010 reduced the expected utilization of foreign taxcredits which resulted in the requirement for a valuation allowance.
Rollforward of valuation allowance is as follows:
Balance at Balance atBeginning of Charged to Other Other End of
Year Ended December 31, the Year Expense Additions Deductions the Year
2008 . . . . . . . . . . . . . . . . . . . . . . . . . . . . . . $43,404 $ 1,439 $ — $ — $44,8432009 . . . . . . . . . . . . . . . . . . . . . . . . . . . . . . 44,843 808 3,517 (7,040) 42,1282010 . . . . . . . . . . . . . . . . . . . . . . . . . . . . . . 42,128 39,395 — (1,660) 79,863
We receive a tax deduction upon the exercise of non-qualified stock options or upon thedisqualifying disposition by employees of incentive stock options and certain shares acquired under ouremployee stock purchase plan for the difference between the exercise price and the market price of theunderlying common stock on the date of exercise or disqualifying disposition. The tax benefit fornon-qualified stock options is included in the consolidated financial statements in the period in whichcompensation expense is recorded. The tax benefit associated with compensation expense recorded inthe consolidated financial statements related to incentive stock options is recorded in the period thedisqualifying disposition occurs. All tax benefits for awards issued prior to January 1, 2003 andincremental tax benefits in excess of compensation expense recorded in the consolidated financialstatements are credited directly to equity and amounted to $5,112, $5,532 and $2,252 for the yearsended December 31, 2008, 2009 and 2010, respectively.
We have not provided deferred taxes on book basis differences related to certain foreignsubsidiaries because such basis differences are not expected to reverse in the foreseeable future and weintend to reinvest indefinitely outside the U.S. These basis differences arose primarily through theundistributed book earnings of our foreign subsidiaries. The basis differences could be reversed througha sale of the subsidiaries, the receipt of dividends from subsidiaries and certain other events or actionson our part, which would result in an increase in our provision for income taxes. It is not practicable tocalculate the amount of such basis differences.
The components of income (loss) before provision (benefit) for income taxes are:
2008 2009 2010
U.S. . . . . . . . . . . . . . . . . . . . . . . . . . . . . . . . . . . . . . . . . . . . . . . . $ 315,122 $215,594 $ 41,267Canada . . . . . . . . . . . . . . . . . . . . . . . . . . . . . . . . . . . . . . . . . . . . . 16,128 22,162 39,822Foreign . . . . . . . . . . . . . . . . . . . . . . . . . . . . . . . . . . . . . . . . . . . . . (106,383) 95,077 19,706
$ 224,867 $332,833 $100,795
110
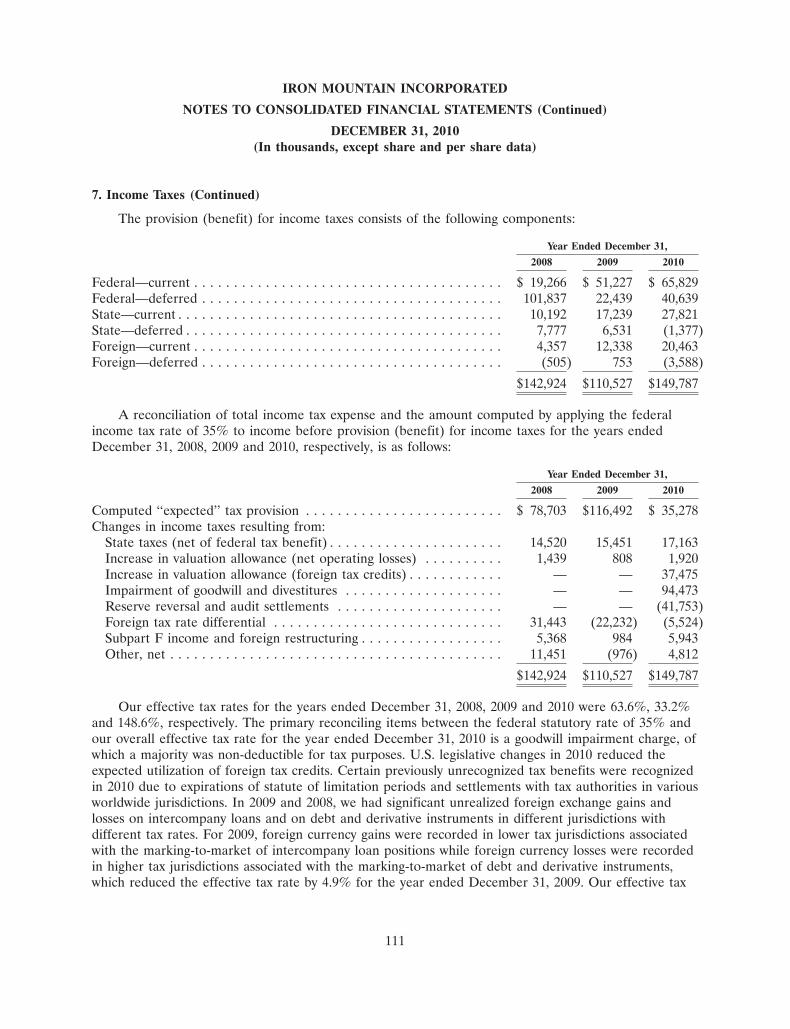
IRON MOUNTAIN INCORPORATED
NOTES TO CONSOLIDATED FINANCIAL STATEMENTS (Continued)
DECEMBER 31, 2010(In thousands, except share and per share data)
7. Income Taxes (Continued)
The provision (benefit) for income taxes consists of the following components:
Year Ended December 31,
2008 2009 2010
Federal—current . . . . . . . . . . . . . . . . . . . . . . . . . . . . . . . . . . . . . . . $ 19,266 $ 51,227 $ 65,829Federal—deferred . . . . . . . . . . . . . . . . . . . . . . . . . . . . . . . . . . . . . . 101,837 22,439 40,639State—current . . . . . . . . . . . . . . . . . . . . . . . . . . . . . . . . . . . . . . . . . 10,192 17,239 27,821State—deferred . . . . . . . . . . . . . . . . . . . . . . . . . . . . . . . . . . . . . . . . 7,777 6,531 (1,377)Foreign—current . . . . . . . . . . . . . . . . . . . . . . . . . . . . . . . . . . . . . . . 4,357 12,338 20,463Foreign—deferred . . . . . . . . . . . . . . . . . . . . . . . . . . . . . . . . . . . . . . (505) 753 (3,588)
$142,924 $110,527 $149,787
A reconciliation of total income tax expense and the amount computed by applying the federalincome tax rate of 35% to income before provision (benefit) for income taxes for the years endedDecember 31, 2008, 2009 and 2010, respectively, is as follows:
Year Ended December 31,
2008 2009 2010
Computed ‘‘expected’’ tax provision . . . . . . . . . . . . . . . . . . . . . . . . . $ 78,703 $116,492 $ 35,278Changes in income taxes resulting from:
State taxes (net of federal tax benefit) . . . . . . . . . . . . . . . . . . . . . . 14,520 15,451 17,163Increase in valuation allowance (net operating losses) . . . . . . . . . . 1,439 808 1,920Increase in valuation allowance (foreign tax credits) . . . . . . . . . . . . — — 37,475Impairment of goodwill and divestitures . . . . . . . . . . . . . . . . . . . . — — 94,473Reserve reversal and audit settlements . . . . . . . . . . . . . . . . . . . . . — — (41,753)Foreign tax rate differential . . . . . . . . . . . . . . . . . . . . . . . . . . . . . 31,443 (22,232) (5,524)Subpart F income and foreign restructuring . . . . . . . . . . . . . . . . . . 5,368 984 5,943Other, net . . . . . . . . . . . . . . . . . . . . . . . . . . . . . . . . . . . . . . . . . . 11,451 (976) 4,812
$142,924 $110,527 $149,787
Our effective tax rates for the years ended December 31, 2008, 2009 and 2010 were 63.6%, 33.2%and 148.6%, respectively. The primary reconciling items between the federal statutory rate of 35% andour overall effective tax rate for the year ended December 31, 2010 is a goodwill impairment charge, ofwhich a majority was non-deductible for tax purposes. U.S. legislative changes in 2010 reduced theexpected utilization of foreign tax credits. Certain previously unrecognized tax benefits were recognizedin 2010 due to expirations of statute of limitation periods and settlements with tax authorities in variousworldwide jurisdictions. In 2009 and 2008, we had significant unrealized foreign exchange gains andlosses on intercompany loans and on debt and derivative instruments in different jurisdictions withdifferent tax rates. For 2009, foreign currency gains were recorded in lower tax jurisdictions associatedwith the marking-to-market of intercompany loan positions while foreign currency losses were recordedin higher tax jurisdictions associated with the marking-to-market of debt and derivative instruments,which reduced the effective tax rate by 4.9% for the year ended December 31, 2009. Our effective tax
111
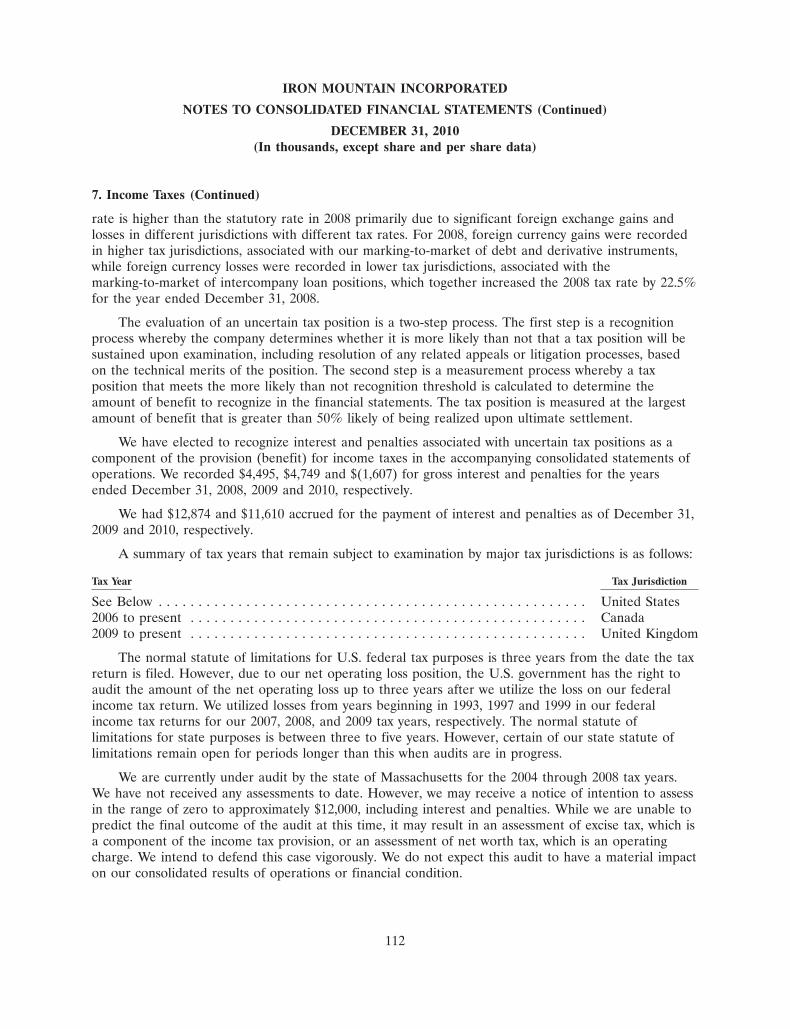
IRON MOUNTAIN INCORPORATED
NOTES TO CONSOLIDATED FINANCIAL STATEMENTS (Continued)
DECEMBER 31, 2010(In thousands, except share and per share data)
7. Income Taxes (Continued)
rate is higher than the statutory rate in 2008 primarily due to significant foreign exchange gains andlosses in different jurisdictions with different tax rates. For 2008, foreign currency gains were recordedin higher tax jurisdictions, associated with our marking-to-market of debt and derivative instruments,while foreign currency losses were recorded in lower tax jurisdictions, associated with themarking-to-market of intercompany loan positions, which together increased the 2008 tax rate by 22.5%for the year ended December 31, 2008.
The evaluation of an uncertain tax position is a two-step process. The first step is a recognitionprocess whereby the company determines whether it is more likely than not that a tax position will besustained upon examination, including resolution of any related appeals or litigation processes, basedon the technical merits of the position. The second step is a measurement process whereby a taxposition that meets the more likely than not recognition threshold is calculated to determine theamount of benefit to recognize in the financial statements. The tax position is measured at the largestamount of benefit that is greater than 50% likely of being realized upon ultimate settlement.
We have elected to recognize interest and penalties associated with uncertain tax positions as acomponent of the provision (benefit) for income taxes in the accompanying consolidated statements ofoperations. We recorded $4,495, $4,749 and $(1,607) for gross interest and penalties for the yearsended December 31, 2008, 2009 and 2010, respectively.
We had $12,874 and $11,610 accrued for the payment of interest and penalties as of December 31,2009 and 2010, respectively.
A summary of tax years that remain subject to examination by major tax jurisdictions is as follows:
Tax Year Tax Jurisdiction
See Below . . . . . . . . . . . . . . . . . . . . . . . . . . . . . . . . . . . . . . . . . . . . . . . . . . . . . . United States2006 to present . . . . . . . . . . . . . . . . . . . . . . . . . . . . . . . . . . . . . . . . . . . . . . . . . . Canada2009 to present . . . . . . . . . . . . . . . . . . . . . . . . . . . . . . . . . . . . . . . . . . . . . . . . . . United Kingdom
The normal statute of limitations for U.S. federal tax purposes is three years from the date the taxreturn is filed. However, due to our net operating loss position, the U.S. government has the right toaudit the amount of the net operating loss up to three years after we utilize the loss on our federalincome tax return. We utilized losses from years beginning in 1993, 1997 and 1999 in our federalincome tax returns for our 2007, 2008, and 2009 tax years, respectively. The normal statute oflimitations for state purposes is between three to five years. However, certain of our state statute oflimitations remain open for periods longer than this when audits are in progress.
We are currently under audit by the state of Massachusetts for the 2004 through 2008 tax years.We have not received any assessments to date. However, we may receive a notice of intention to assessin the range of zero to approximately $12,000, including interest and penalties. While we are unable topredict the final outcome of the audit at this time, it may result in an assessment of excise tax, which isa component of the income tax provision, or an assessment of net worth tax, which is an operatingcharge. We intend to defend this case vigorously. We do not expect this audit to have a material impacton our consolidated results of operations or financial condition.
112
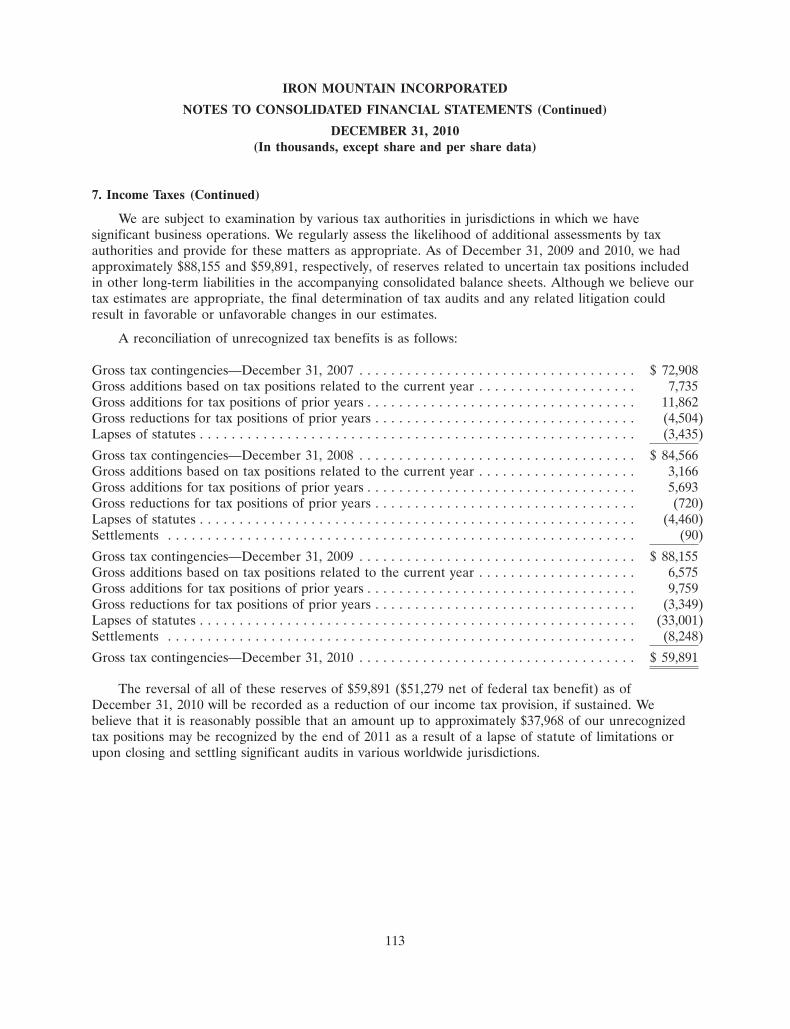
IRON MOUNTAIN INCORPORATED
NOTES TO CONSOLIDATED FINANCIAL STATEMENTS (Continued)
DECEMBER 31, 2010(In thousands, except share and per share data)
7. Income Taxes (Continued)
We are subject to examination by various tax authorities in jurisdictions in which we havesignificant business operations. We regularly assess the likelihood of additional assessments by taxauthorities and provide for these matters as appropriate. As of December 31, 2009 and 2010, we hadapproximately $88,155 and $59,891, respectively, of reserves related to uncertain tax positions includedin other long-term liabilities in the accompanying consolidated balance sheets. Although we believe ourtax estimates are appropriate, the final determination of tax audits and any related litigation couldresult in favorable or unfavorable changes in our estimates.
A reconciliation of unrecognized tax benefits is as follows:
Gross tax contingencies—December 31, 2007 . . . . . . . . . . . . . . . . . . . . . . . . . . . . . . . . . . . $ 72,908Gross additions based on tax positions related to the current year . . . . . . . . . . . . . . . . . . . . 7,735Gross additions for tax positions of prior years . . . . . . . . . . . . . . . . . . . . . . . . . . . . . . . . . . 11,862Gross reductions for tax positions of prior years . . . . . . . . . . . . . . . . . . . . . . . . . . . . . . . . . (4,504)Lapses of statutes . . . . . . . . . . . . . . . . . . . . . . . . . . . . . . . . . . . . . . . . . . . . . . . . . . . . . . . (3,435)
Gross tax contingencies—December 31, 2008 . . . . . . . . . . . . . . . . . . . . . . . . . . . . . . . . . . . $ 84,566Gross additions based on tax positions related to the current year . . . . . . . . . . . . . . . . . . . . 3,166Gross additions for tax positions of prior years . . . . . . . . . . . . . . . . . . . . . . . . . . . . . . . . . . 5,693Gross reductions for tax positions of prior years . . . . . . . . . . . . . . . . . . . . . . . . . . . . . . . . . (720)Lapses of statutes . . . . . . . . . . . . . . . . . . . . . . . . . . . . . . . . . . . . . . . . . . . . . . . . . . . . . . . (4,460)Settlements . . . . . . . . . . . . . . . . . . . . . . . . . . . . . . . . . . . . . . . . . . . . . . . . . . . . . . . . . . . (90)
Gross tax contingencies—December 31, 2009 . . . . . . . . . . . . . . . . . . . . . . . . . . . . . . . . . . . $ 88,155Gross additions based on tax positions related to the current year . . . . . . . . . . . . . . . . . . . . 6,575Gross additions for tax positions of prior years . . . . . . . . . . . . . . . . . . . . . . . . . . . . . . . . . . 9,759Gross reductions for tax positions of prior years . . . . . . . . . . . . . . . . . . . . . . . . . . . . . . . . . (3,349)Lapses of statutes . . . . . . . . . . . . . . . . . . . . . . . . . . . . . . . . . . . . . . . . . . . . . . . . . . . . . . . (33,001)Settlements . . . . . . . . . . . . . . . . . . . . . . . . . . . . . . . . . . . . . . . . . . . . . . . . . . . . . . . . . . . (8,248)
Gross tax contingencies—December 31, 2010 . . . . . . . . . . . . . . . . . . . . . . . . . . . . . . . . . . . $ 59,891
The reversal of all of these reserves of $59,891 ($51,279 net of federal tax benefit) as ofDecember 31, 2010 will be recorded as a reduction of our income tax provision, if sustained. Webelieve that it is reasonably possible that an amount up to approximately $37,968 of our unrecognizedtax positions may be recognized by the end of 2011 as a result of a lapse of statute of limitations orupon closing and settling significant audits in various worldwide jurisdictions.
113
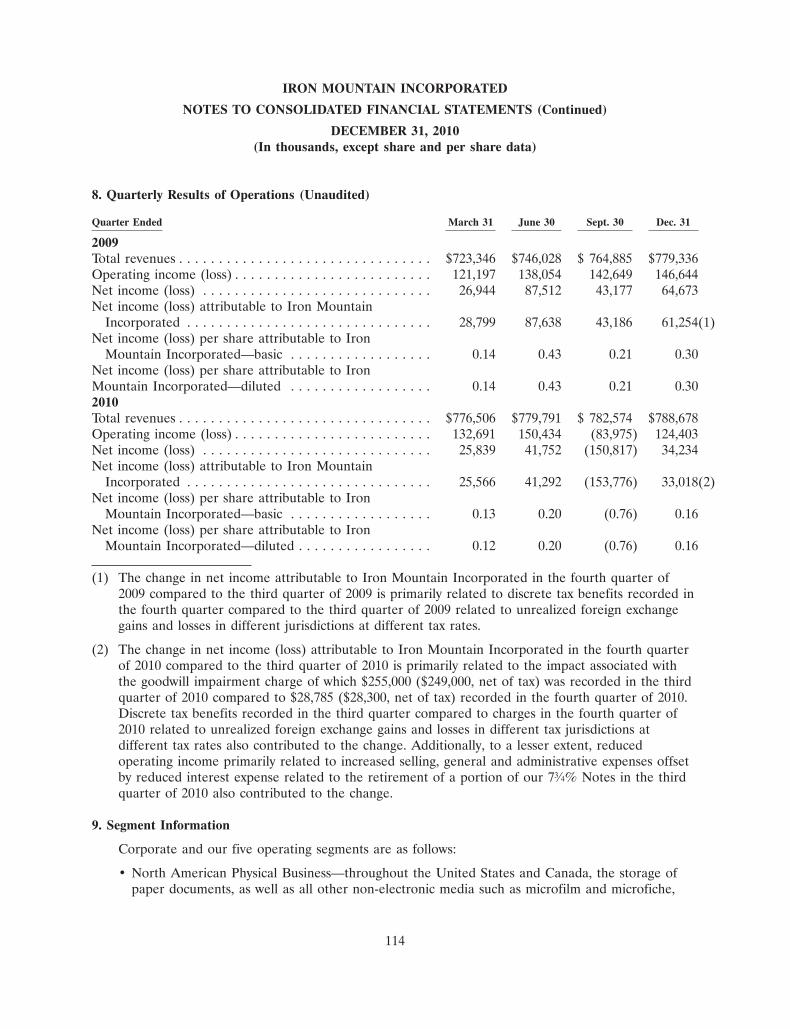
IRON MOUNTAIN INCORPORATED
NOTES TO CONSOLIDATED FINANCIAL STATEMENTS (Continued)
DECEMBER 31, 2010(In thousands, except share and per share data)
8. Quarterly Results of Operations (Unaudited)
Quarter Ended March 31 June 30 Sept. 30 Dec. 31
2009Total revenues . . . . . . . . . . . . . . . . . . . . . . . . . . . . . . . . $723,346 $746,028 $ 764,885 $779,336Operating income (loss) . . . . . . . . . . . . . . . . . . . . . . . . . 121,197 138,054 142,649 146,644Net income (loss) . . . . . . . . . . . . . . . . . . . . . . . . . . . . . 26,944 87,512 43,177 64,673Net income (loss) attributable to Iron Mountain
Incorporated . . . . . . . . . . . . . . . . . . . . . . . . . . . . . . . 28,799 87,638 43,186 61,254(1)Net income (loss) per share attributable to Iron
Mountain Incorporated—basic . . . . . . . . . . . . . . . . . . 0.14 0.43 0.21 0.30Net income (loss) per share attributable to IronMountain Incorporated—diluted . . . . . . . . . . . . . . . . . . 0.14 0.43 0.21 0.302010Total revenues . . . . . . . . . . . . . . . . . . . . . . . . . . . . . . . . $776,506 $779,791 $ 782,574 $788,678Operating income (loss) . . . . . . . . . . . . . . . . . . . . . . . . . 132,691 150,434 (83,975) 124,403Net income (loss) . . . . . . . . . . . . . . . . . . . . . . . . . . . . . 25,839 41,752 (150,817) 34,234Net income (loss) attributable to Iron Mountain
Incorporated . . . . . . . . . . . . . . . . . . . . . . . . . . . . . . . 25,566 41,292 (153,776) 33,018(2)Net income (loss) per share attributable to Iron
Mountain Incorporated—basic . . . . . . . . . . . . . . . . . . 0.13 0.20 (0.76) 0.16Net income (loss) per share attributable to Iron
Mountain Incorporated—diluted . . . . . . . . . . . . . . . . . 0.12 0.20 (0.76) 0.16
(1) The change in net income attributable to Iron Mountain Incorporated in the fourth quarter of2009 compared to the third quarter of 2009 is primarily related to discrete tax benefits recorded inthe fourth quarter compared to the third quarter of 2009 related to unrealized foreign exchangegains and losses in different jurisdictions at different tax rates.
(2) The change in net income (loss) attributable to Iron Mountain Incorporated in the fourth quarterof 2010 compared to the third quarter of 2010 is primarily related to the impact associated withthe goodwill impairment charge of which $255,000 ($249,000, net of tax) was recorded in the thirdquarter of 2010 compared to $28,785 ($28,300, net of tax) recorded in the fourth quarter of 2010.Discrete tax benefits recorded in the third quarter compared to charges in the fourth quarter of2010 related to unrealized foreign exchange gains and losses in different tax jurisdictions atdifferent tax rates also contributed to the change. Additionally, to a lesser extent, reducedoperating income primarily related to increased selling, general and administrative expenses offsetby reduced interest expense related to the retirement of a portion of our 73⁄4% Notes in the thirdquarter of 2010 also contributed to the change.
9. Segment Information
Corporate and our five operating segments are as follows:
• North American Physical Business—throughout the United States and Canada, the storage ofpaper documents, as well as all other non-electronic media such as microfilm and microfiche,
114

IRON MOUNTAIN INCORPORATED
NOTES TO CONSOLIDATED FINANCIAL STATEMENTS (Continued)
DECEMBER 31, 2010(In thousands, except share and per share data)
9. Segment Information (Continued)
master audio and videotapes, film, X-rays and blueprints, including healthcare informationservices, vital records services, service and courier operations, and the collection, handling anddisposal of sensitive documents for corporate customers (‘‘Hard Copy’’); the storage and rotationof backup computer media as part of corporate disaster recovery plans, including service andcourier operations (‘‘Data Protection’’); information destruction services (‘‘Destruction’’); andthe storage, assembly, and detailed reporting of customer marketing literature and delivery tosales offices, trade shows and prospective customers’ sites based on current and prospectivecustomer orders, which we refer to as the ‘‘Fulfillment’’ business.
• Worldwide Digital Business—information management services for electronic records conveyedvia telecommunication lines and the Internet, including online backup and recovery solutions forserver data and personal computers, as well as email archiving, third party intellectual propertyescrow services that protect and manage source code, and electronic discovery services for thelegal market that offers in-depth discovery and data investigation solutions.
• Europe—information management services throughout Europe, including Hard Copy, DataProtection and Destruction (in the U.K.).
• Latin America—information management services throughout Mexico, Brazil, Chile, Argentinaand Peru, including Hard Copy, Data Protection and Destruction.
• Asia Pacific—information management services throughout Australia and New Zealand,including Hard Copy, Data Protection and Destruction; and in certain cities in India, Singapore,Hong Kong-SAR and China, including Hard Copy and Data Protection.
• Corporate—consists of costs related to executive and staff functions, including finance, humanresources and information technology, which benefit the enterprise as a whole. These costs areprimarily related to the general management of these functions on a corporate level and thedesign and development of programs, policies and procedures that are then implemented in theindividual segments, with each segment bearing its own cost of implementation. Corporate alsoincludes stock-based employee compensation expense associated with all Employee Stock-BasedAwards.
The Latin America, Asia Pacific and Europe operating segments have been aggregated given theirsimilar economic characteristics, products, customers and processes and reported as one reportablesegment, ‘‘International Physical Business.’’ The Worldwide Digital Business does not meet thequantitative criteria for a reportable segment; however, management determined that it would disclosesuch information on a voluntary basis.
115

IRON MOUNTAIN INCORPORATED
NOTES TO CONSOLIDATED FINANCIAL STATEMENTS (Continued)
DECEMBER 31, 2010(In thousands, except share and per share data)
9. Segment Information (Continued)
An analysis of our business segment information and reconciliation to the consolidated financialstatements is as follows:
NorthAmerican International WorldwidePhysical Physical Digital TotalBusiness Business Business Corporate Consolidated
2008Total Revenues . . . . . . . . . . . . . . . . . . . . . . . . . . . . $2,067,316 $ 764,812 $223,006 $ — $3,055,134Depreciation and Amortization . . . . . . . . . . . . . . . . . 145,260 78,800 32,511 34,167 290,738
Depreciation . . . . . . . . . . . . . . . . . . . . . . . . . . . . 134,320 64,220 22,094 33,985 254,619Amortization . . . . . . . . . . . . . . . . . . . . . . . . . . . . 10,940 14,580 10,417 182 36,119
Adjusted OIBDA . . . . . . . . . . . . . . . . . . . . . . . . . . 768,523 138,432 41,782 (157,986) 790,751Total Assets(1) . . . . . . . . . . . . . . . . . . . . . . . . . . . . 4,283,291 1,516,521 429,409 127,633 6,356,854Expenditures for Segment Assets . . . . . . . . . . . . . . . . 225,361 172,321 32,069 27,784 457,535
Capital Expenditures . . . . . . . . . . . . . . . . . . . . . . 180,682 146,142 32,113 27,784 386,721Cash Paid for Acquisitions, Net of Cash acquired . . . 35,468 21,208 (44) — 56,632Additions to Customer Relationship and Acquisition
Costs . . . . . . . . . . . . . . . . . . . . . . . . . . . . . . . 9,211 4,971 — — 14,1822009Total Revenues . . . . . . . . . . . . . . . . . . . . . . . . . . . . 2,101,526 682,684 229,385 — 3,013,595Depreciation and Amortization . . . . . . . . . . . . . . . . . 173,798 75,236 36,856 33,182 319,072
Depreciation . . . . . . . . . . . . . . . . . . . . . . . . . . . . 162,110 62,331 26,179 32,951 283,571Amortization . . . . . . . . . . . . . . . . . . . . . . . . . . . . 11,688 12,905 10,677 231 35,501
Adjusted OIBDA . . . . . . . . . . . . . . . . . . . . . . . . . . 856,761 125,364 50,303 (164,406) 868,022Total Assets(1) . . . . . . . . . . . . . . . . . . . . . . . . . . . . 4,576,155 1,723,659 413,974 133,046 6,846,834Expenditures for Segment Assets . . . . . . . . . . . . . . . . 160,758 115,740 20,287 28,768 325,553
Capital Expenditures . . . . . . . . . . . . . . . . . . . . . . 153,247 110,459 20,287 28,768 312,761Cash Paid for Acquisitions, Net of Cash acquired . . . 256 1,777 — — 2,033Additions to Customer Relationship and Acquisition
Costs . . . . . . . . . . . . . . . . . . . . . . . . . . . . . . . 7,255 3,504 — — 10,7592010Total Revenues . . . . . . . . . . . . . . . . . . . . . . . . . . . . 2,170,814 725,315 231,420 — 3,127,549Depreciation and Amortization . . . . . . . . . . . . . . . . . 185,271 86,261 35,961 36,790 344,283
Depreciation . . . . . . . . . . . . . . . . . . . . . . . . . . . . 172,507 72,962 24,634 36,567 306,670Amortization . . . . . . . . . . . . . . . . . . . . . . . . . . . . 12,764 13,299 11,327 223 37,613
Adjusted OIBDA . . . . . . . . . . . . . . . . . . . . . . . . . . 961,135 133,697 27,546 (176,900) 945,478Total Assets(1) . . . . . . . . . . . . . . . . . . . . . . . . . . . . 4,337,987 1,689,155 196,674 171,983 6,395,799Expenditures for Segment Assets . . . . . . . . . . . . . . . . 135,765 121,695 128,236 34,571 420,267
Capital Expenditures . . . . . . . . . . . . . . . . . . . . . . 120,102 105,094 17,860 34,571 277,627Cash Paid for Acquisitions, Net of Cash acquired . . . 5,675 13,348 110,376 — 129,399Additions to Customer Relationship and Acquisition
Costs . . . . . . . . . . . . . . . . . . . . . . . . . . . . . . . 9,988 3,253 — — 13,241
(1) Excludes all intercompany receivables or payables and investment in subsidiary balances.
116
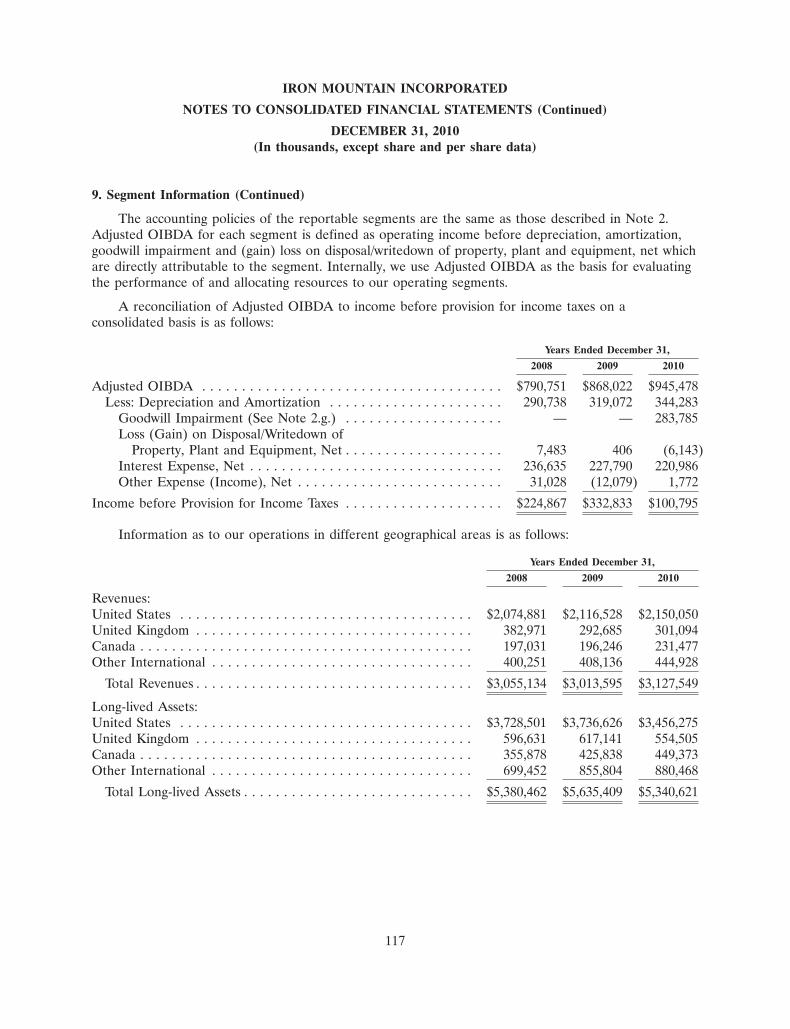
IRON MOUNTAIN INCORPORATED
NOTES TO CONSOLIDATED FINANCIAL STATEMENTS (Continued)
DECEMBER 31, 2010(In thousands, except share and per share data)
9. Segment Information (Continued)
The accounting policies of the reportable segments are the same as those described in Note 2.Adjusted OIBDA for each segment is defined as operating income before depreciation, amortization,goodwill impairment and (gain) loss on disposal/writedown of property, plant and equipment, net whichare directly attributable to the segment. Internally, we use Adjusted OIBDA as the basis for evaluatingthe performance of and allocating resources to our operating segments.
A reconciliation of Adjusted OIBDA to income before provision for income taxes on aconsolidated basis is as follows:
Years Ended December 31,
2008 2009 2010
Adjusted OIBDA . . . . . . . . . . . . . . . . . . . . . . . . . . . . . . . . . . . . . . $790,751 $868,022 $945,478Less: Depreciation and Amortization . . . . . . . . . . . . . . . . . . . . . . 290,738 319,072 344,283
Goodwill Impairment (See Note 2.g.) . . . . . . . . . . . . . . . . . . . . — — 283,785Loss (Gain) on Disposal/Writedown of
Property, Plant and Equipment, Net . . . . . . . . . . . . . . . . . . . . 7,483 406 (6,143)Interest Expense, Net . . . . . . . . . . . . . . . . . . . . . . . . . . . . . . . . 236,635 227,790 220,986Other Expense (Income), Net . . . . . . . . . . . . . . . . . . . . . . . . . . 31,028 (12,079) 1,772
Income before Provision for Income Taxes . . . . . . . . . . . . . . . . . . . . $224,867 $332,833 $100,795
Information as to our operations in different geographical areas is as follows:
Years Ended December 31,
2008 2009 2010
Revenues:United States . . . . . . . . . . . . . . . . . . . . . . . . . . . . . . . . . . . . . $2,074,881 $2,116,528 $2,150,050United Kingdom . . . . . . . . . . . . . . . . . . . . . . . . . . . . . . . . . . . 382,971 292,685 301,094Canada . . . . . . . . . . . . . . . . . . . . . . . . . . . . . . . . . . . . . . . . . . 197,031 196,246 231,477Other International . . . . . . . . . . . . . . . . . . . . . . . . . . . . . . . . . 400,251 408,136 444,928
Total Revenues . . . . . . . . . . . . . . . . . . . . . . . . . . . . . . . . . . . $3,055,134 $3,013,595 $3,127,549
Long-lived Assets:United States . . . . . . . . . . . . . . . . . . . . . . . . . . . . . . . . . . . . . $3,728,501 $3,736,626 $3,456,275United Kingdom . . . . . . . . . . . . . . . . . . . . . . . . . . . . . . . . . . . 596,631 617,141 554,505Canada . . . . . . . . . . . . . . . . . . . . . . . . . . . . . . . . . . . . . . . . . . 355,878 425,838 449,373Other International . . . . . . . . . . . . . . . . . . . . . . . . . . . . . . . . . 699,452 855,804 880,468
Total Long-lived Assets . . . . . . . . . . . . . . . . . . . . . . . . . . . . . $5,380,462 $5,635,409 $5,340,621
117

IRON MOUNTAIN INCORPORATED
NOTES TO CONSOLIDATED FINANCIAL STATEMENTS (Continued)
DECEMBER 31, 2010(In thousands, except share and per share data)
9. Segment Information (Continued)
Information as to our revenues by product and service lines is as follows:
Years Ended December 31,
2008 2009 2010
Revenues:Records Management(1)(2) . . . . . . . . . . . . . . . . . . . . . . . . . . . $2,146,293 $2,155,684 $2,217,928Data Protection & Recovery(1)(3) . . . . . . . . . . . . . . . . . . . . . . 612,158 606,608 629,101Information Destruction(1)(4) . . . . . . . . . . . . . . . . . . . . . . . . . 296,683 251,303 280,520
Total Revenues . . . . . . . . . . . . . . . . . . . . . . . . . . . . . . . . . . . $3,055,134 $3,013,595 $3,127,549
(1) Each of the service offerings within our product and service lines has a component of revenue thatis storage related and a component that is service revenues, except the Information Destructionservice offering, which does not have a storage component.
(2) Includes Business Records Management, Archiving and Discovery Services, Compliant RecordsManagement and Consulting Services, Hybrid Services, Fulfillment Services, Health InformationManagement Solutions, Film and Sound Archives and Energy Data Services.
(3) Includes Physical Data Protection & Recovery Services, Online Computer and Server Backup andIntellectual Property Management.
(4) Includes Physical Secure Shredding and Compliant Information Destruction.
10. Commitments and Contingencies
a. Leases
Most of our leased facilities are leased under various operating leases that typically have initiallease terms of five to ten years. A majority of these leases have renewal options with one or more fiveyear options to extend and may have fixed or Consumer Price Index escalation clauses. We also leaseequipment under operating leases (primarily computers) which have an average lease life of threeyears. Vehicles and office equipment are also leased and have remaining lease lives ranging from oneto seven years. Due to the declining economic environment in 2008, the current fair market values ofvans, trucks and mobile shredding units within our vehicle fleet portfolio, which we lease, declined. Asa result, certain vehicle leases that previously met the requirements to be considered operating leaseswere classified as capital leases upon renewal. The 2008 impact of this change on our consolidatedbalance sheet as of December 31, 2008 was to increase property, plant and equipment and debt by$58,517 and this had no impact on 2008 operating results. Operating results for 2009 and 2010accordingly have lower vehicle rent expense (a component of transportation costs within cost of sales),offset by an increased amount of combined depreciation and interest expense. Total rent expense(including common area maintenance charges) under all of our operating leases was $280,360(including $20,828 associated with vehicle leases which became capital leases in 2008), $251,053 and$250,609 for the years ended December 31, 2008, 2009 and 2010, respectively. Included in total rent
118

IRON MOUNTAIN INCORPORATED
NOTES TO CONSOLIDATED FINANCIAL STATEMENTS (Continued)
DECEMBER 31, 2010(In thousands, except share and per share data)
10. Commitments and Contingencies (Continued)
expense was sublease income of $5,341, $4,324 and $2,912 for the years ended December 31, 2008,2009 and 2010, respectively.
Estimated minimum future lease payments (excluding common area maintenance charges) includepayments for certain renewal periods at our option because failure to renew results in an economicdisincentive due to significant capital expenditure costs (e.g., racking), thereby making it reasonablyassured that we will renew the lease. Such payments in effect at December 31, are as follows:
OperatingLease Sublease Capital
Year Payment Income Leases
2011 . . . . . . . . . . . . . . . . . . . . . . . . . . . . . . . . . . . . . . . . . . . . . . . $ 226,320 $ 2,649 $ 45,6862012 . . . . . . . . . . . . . . . . . . . . . . . . . . . . . . . . . . . . . . . . . . . . . . . 215,812 2,042 50,9272013 . . . . . . . . . . . . . . . . . . . . . . . . . . . . . . . . . . . . . . . . . . . . . . . 207,556 1,726 32,1512014 . . . . . . . . . . . . . . . . . . . . . . . . . . . . . . . . . . . . . . . . . . . . . . . 196,141 1,468 24,2812015 . . . . . . . . . . . . . . . . . . . . . . . . . . . . . . . . . . . . . . . . . . . . . . . 187,767 1,376 15,694Thereafter . . . . . . . . . . . . . . . . . . . . . . . . . . . . . . . . . . . . . . . . . . 1,894,831 1,899 144,685
Total minimum lease payments . . . . . . . . . . . . . . . . . . . . . . . . . . . $2,928,427 $11,160 $ 313,424
Less amounts representing interest . . . . . . . . . . . . . . . . . . . . . . . (111,567)
Present value of capital lease obligations . . . . . . . . . . . . . . . . . . . $ 201,857
In addition, we have certain contractual obligations related to purchase commitments which requireminimum payments of $28,116, $3,013, $1,691, $1,098, $750 and $497 in 2011, 2012, 2013, 2014, 2015and thereafter, respectively.
b. Self-Insured Liabilities
We are self-insured up to certain limits for costs associated with workers’ compensation claims,vehicle accidents, property and general business liabilities, and benefits paid under employee healthcareand short-term disability programs. At December 31, 2009 and 2010 there were $41,106 and $43,901,respectively, of self-insurance accruals reflected in our consolidated balance sheets. The measurementof these costs requires the consideration of historical cost experience and judgments about the presentand expected levels of cost per claim. We account for these costs primarily through actuarial methods,which develop estimates of the undiscounted liability for claims incurred, including those claimsincurred but not reported. These methods provide estimates of future ultimate claim costs based onclaims incurred as of the balance sheet date.
c. Litigation
We are involved in litigation from time to time in the ordinary course of business with a portion ofthe defense and/or settlement costs being covered by various commercial liability insurance policiespurchased by us. In the opinion of management, no material legal proceedings are pending to whichwe, or any of our properties, are subject, except as discussed below. We record legal costs associatedwith loss contingencies as expenses in the period in which they are incurred.
119
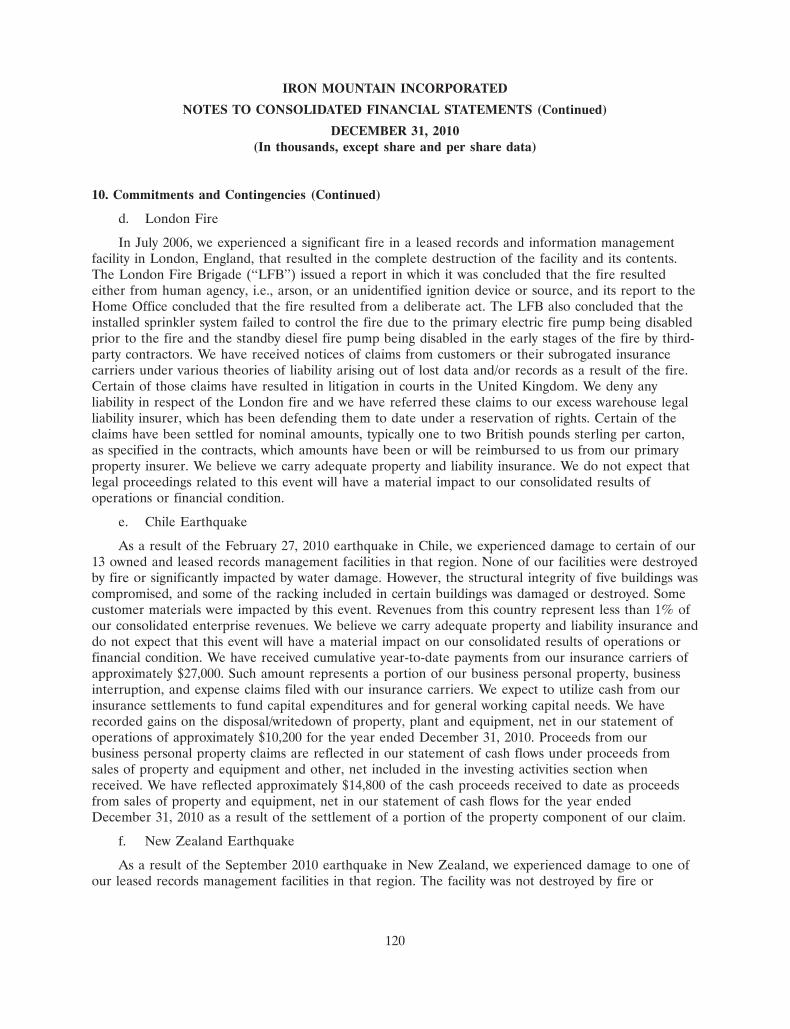
IRON MOUNTAIN INCORPORATED
NOTES TO CONSOLIDATED FINANCIAL STATEMENTS (Continued)
DECEMBER 31, 2010(In thousands, except share and per share data)
10. Commitments and Contingencies (Continued)
d. London Fire
In July 2006, we experienced a significant fire in a leased records and information managementfacility in London, England, that resulted in the complete destruction of the facility and its contents.The London Fire Brigade (‘‘LFB’’) issued a report in which it was concluded that the fire resultedeither from human agency, i.e., arson, or an unidentified ignition device or source, and its report to theHome Office concluded that the fire resulted from a deliberate act. The LFB also concluded that theinstalled sprinkler system failed to control the fire due to the primary electric fire pump being disabledprior to the fire and the standby diesel fire pump being disabled in the early stages of the fire by third-party contractors. We have received notices of claims from customers or their subrogated insurancecarriers under various theories of liability arising out of lost data and/or records as a result of the fire.Certain of those claims have resulted in litigation in courts in the United Kingdom. We deny anyliability in respect of the London fire and we have referred these claims to our excess warehouse legalliability insurer, which has been defending them to date under a reservation of rights. Certain of theclaims have been settled for nominal amounts, typically one to two British pounds sterling per carton,as specified in the contracts, which amounts have been or will be reimbursed to us from our primaryproperty insurer. We believe we carry adequate property and liability insurance. We do not expect thatlegal proceedings related to this event will have a material impact to our consolidated results ofoperations or financial condition.
e. Chile Earthquake
As a result of the February 27, 2010 earthquake in Chile, we experienced damage to certain of our13 owned and leased records management facilities in that region. None of our facilities were destroyedby fire or significantly impacted by water damage. However, the structural integrity of five buildings wascompromised, and some of the racking included in certain buildings was damaged or destroyed. Somecustomer materials were impacted by this event. Revenues from this country represent less than 1% ofour consolidated enterprise revenues. We believe we carry adequate property and liability insurance anddo not expect that this event will have a material impact on our consolidated results of operations orfinancial condition. We have received cumulative year-to-date payments from our insurance carriers ofapproximately $27,000. Such amount represents a portion of our business personal property, businessinterruption, and expense claims filed with our insurance carriers. We expect to utilize cash from ourinsurance settlements to fund capital expenditures and for general working capital needs. We haverecorded gains on the disposal/writedown of property, plant and equipment, net in our statement ofoperations of approximately $10,200 for the year ended December 31, 2010. Proceeds from ourbusiness personal property claims are reflected in our statement of cash flows under proceeds fromsales of property and equipment and other, net included in the investing activities section whenreceived. We have reflected approximately $14,800 of the cash proceeds received to date as proceedsfrom sales of property and equipment, net in our statement of cash flows for the year endedDecember 31, 2010 as a result of the settlement of a portion of the property component of our claim.
f. New Zealand Earthquake
As a result of the September 2010 earthquake in New Zealand, we experienced damage to one ofour leased records management facilities in that region. The facility was not destroyed by fire or
120
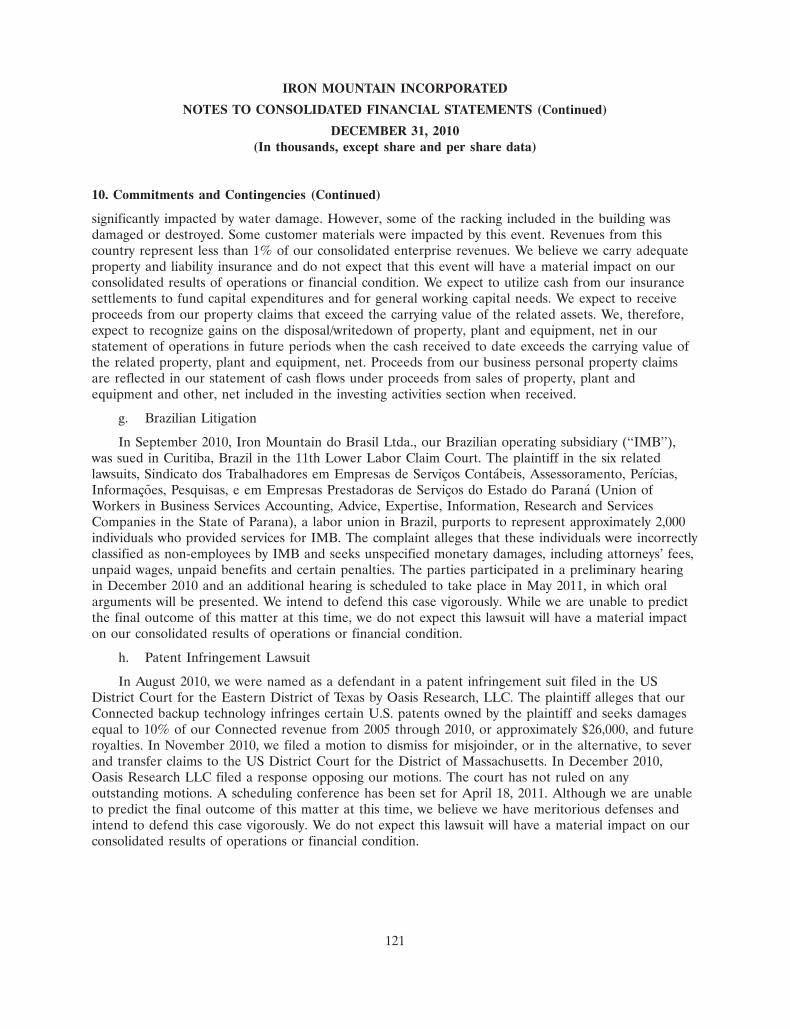
IRON MOUNTAIN INCORPORATED
NOTES TO CONSOLIDATED FINANCIAL STATEMENTS (Continued)
DECEMBER 31, 2010(In thousands, except share and per share data)
10. Commitments and Contingencies (Continued)
significantly impacted by water damage. However, some of the racking included in the building wasdamaged or destroyed. Some customer materials were impacted by this event. Revenues from thiscountry represent less than 1% of our consolidated enterprise revenues. We believe we carry adequateproperty and liability insurance and do not expect that this event will have a material impact on ourconsolidated results of operations or financial condition. We expect to utilize cash from our insurancesettlements to fund capital expenditures and for general working capital needs. We expect to receiveproceeds from our property claims that exceed the carrying value of the related assets. We, therefore,expect to recognize gains on the disposal/writedown of property, plant and equipment, net in ourstatement of operations in future periods when the cash received to date exceeds the carrying value ofthe related property, plant and equipment, net. Proceeds from our business personal property claimsare reflected in our statement of cash flows under proceeds from sales of property, plant andequipment and other, net included in the investing activities section when received.
g. Brazilian Litigation
In September 2010, Iron Mountain do Brasil Ltda., our Brazilian operating subsidiary (‘‘IMB’’),was sued in Curitiba, Brazil in the 11th Lower Labor Claim Court. The plaintiff in the six relatedlawsuits, Sindicato dos Trabalhadores em Empresas de Servicos Contabeis, Assessoramento, Perıcias,Informacoes, Pesquisas, e em Empresas Prestadoras de Servicos do Estado do Parana (Union ofWorkers in Business Services Accounting, Advice, Expertise, Information, Research and ServicesCompanies in the State of Parana), a labor union in Brazil, purports to represent approximately 2,000individuals who provided services for IMB. The complaint alleges that these individuals were incorrectlyclassified as non-employees by IMB and seeks unspecified monetary damages, including attorneys’ fees,unpaid wages, unpaid benefits and certain penalties. The parties participated in a preliminary hearingin December 2010 and an additional hearing is scheduled to take place in May 2011, in which oralarguments will be presented. We intend to defend this case vigorously. While we are unable to predictthe final outcome of this matter at this time, we do not expect this lawsuit will have a material impacton our consolidated results of operations or financial condition.
h. Patent Infringement Lawsuit
In August 2010, we were named as a defendant in a patent infringement suit filed in the USDistrict Court for the Eastern District of Texas by Oasis Research, LLC. The plaintiff alleges that ourConnected backup technology infringes certain U.S. patents owned by the plaintiff and seeks damagesequal to 10% of our Connected revenue from 2005 through 2010, or approximately $26,000, and futureroyalties. In November 2010, we filed a motion to dismiss for misjoinder, or in the alternative, to severand transfer claims to the US District Court for the District of Massachusetts. In December 2010,Oasis Research LLC filed a response opposing our motions. The court has not ruled on anyoutstanding motions. A scheduling conference has been set for April 18, 2011. Although we are unableto predict the final outcome of this matter at this time, we believe we have meritorious defenses andintend to defend this case vigorously. We do not expect this lawsuit will have a material impact on ourconsolidated results of operations or financial condition.
121
IRON MOUNTAIN INCORPORATED
NOTES TO CONSOLIDATED FINANCIAL STATEMENTS (Continued)
DECEMBER 31, 2010(In thousands, except share and per share data)
11. Related Party Transactions
We lease space to an affiliated company, Schooner Capital LLC (‘‘Schooner’’), for its corporateheadquarters located in Boston, Massachusetts. For the years ended December 31, 2008, 2009 and2010, Schooner paid rent to us totaling $152, $177 and $198, respectively. We lease facilities from atrust of which one of our officers is the beneficiary. Our aggregate rental payment for such facilitiesduring 2008, 2009 and 2010 was $1,078, $1,105 and $1,149, respectively.
12. 401(k) Plans
We have a defined contribution plan, which generally covers all non-union U.S. employees meetingcertain service requirements. Eligible employees may elect to defer from 1% to 25% of compensationper pay period up to the amount allowed by the Internal Revenue Code. In addition, IME operates adefined contribution plan, which is similar to the U.S.’s 401(k) Plan. We make matching contributionsbased on the amount of an employee’s contribution in accordance with the plan documents. We haveexpensed $14,883, $15,277 and $17,848 for the years ended December 31, 2008, 2009 and 2010,respectively.
13. Stockholders’ Equity Matters
In February 2010, our board of directors approved a share repurchase program authorizing up to$150,000 in repurchases of our common stock, and in October 2010, our board of directors authorizedup to an additional $200,000 of such purchases, for a total of $350,000. This represented less than 10%of our outstanding common stock based on the closing price on the dates the programs wereannounced. All purchases are subject to stock price, market conditions, corporate and legalrequirements and other factors. In addition, in February 2010, our board of directors adopted adividend policy under which we began paying quarterly cash dividends on our common stock. The firstquarterly dividend of $0.0625 per share was paid on April 15, 2010 to stockholders of record onMarch 25, 2010 in the aggregate amount of $12,720. The second quarterly dividend of $0.0625 pershare was paid on July 15, 2010 to stockholders of record on June 25, 2010 in the aggregate amount of$12,641. The third quarterly dividend of $0.0625 per share was paid on October 15, 2010 tostockholders of record on September 28, 2010 in the aggregate amount of $12,532. The fourth quarterlydividend of $0.1875 per share was paid on January 14, 2011 to stockholders of record on December 27,2010 in the aggregate amount of $37,514. Declaration and payment of future quarterly dividends is atthe discretion of our board of directors.
14. Divestiture
In August 2010, we divested the domain name management product line of our Worldwide DigitalBusiness segment for approximately $11,400 in cash at closing. The assets sold primarily consisted ofcustomer contracts. Total revenues of this product line for the year ending December 31, 2009 and theseven months ending July 31, 2010 were approximately $6,300 and $3,500, respectively. We haveconcluded that the asset sale is not a discontinued operation and, therefore, have recorded a pretaxgain on sale in other (income) expense, net of approximately $6,900 in the statement of operations inthe third quarter of 2010. Approximately $4,800 of goodwill was allocated to this domain namemanagement product line, utilizing the relative fair value approach. The estimated tax expense
122
IRON MOUNTAIN INCORPORATED
NOTES TO CONSOLIDATED FINANCIAL STATEMENTS (Continued)
DECEMBER 31, 2010(In thousands, except share and per share data)
14. Divestiture (Continued)
associated with this transaction of approximately $4,066 was recorded in 2010 in the provision forincome taxes.
15. Subsequent Events
In January 2011, we redeemed the remaining $231,255 aggregate principal amount outstanding ofthe 73⁄4% Notes at a redemption price of $1,000 for each one thousand dollars of principal amount ofnotes redeemed, plus accrued and unpaid interest. We will record a gain to other expense (income), netof approximately $800 in the first quarter of 2011 related to the early extinguishment of the 73⁄4%Notes being redeemed. This gain consists of original issue premiums, net of deferred financing costsrelated to the 73⁄4% Notes that were redeemed.
In January 2011, we acquired the remaining 80% interest of our joint venture in Poland (IronMountain Poland Holdings Limited) in a stock transaction for an estimated purchase price of $69,500,including an initial cash purchase price of $35,000. As a result, we now own 100% of our Polishoperations, which provide storage and records management services. The terms of the purchase andsale agreement requires a second payment based upon the audited financial results of the joint venturefor the period April 1, 2010 through March 31, 2011. This payment is based upon a formula defined inthe purchase and sale agreement and is expected to be paid in the second quarter of 2011. Our currentestimate of the second payment is approximately $32,000. Additionally, the purchase and saleagreement provides for the payment of up to a maximum of $2,500 of contingent consideration to bepaid in July 2012 based upon meeting certain performance criteria. The carrying value of the 20%interest that we owned and accounted for under the equity method of accounting amounted toapproximately $5,500 as of December 31, 2010. We will calculate the fair value of such interest on thedate of the acquisition of the additional 80% interest and will record a gain during the first quarter of2011 to other (income) expense, net included in the consolidated statement of operations. One of themembers of our board of directors and several of his family members hold an indirect equity interest inone of the shareholders that will receive proceeds in connection with this transaction. As a result ofthis equity interest, our board member together with several of his family members will receiveapproximately 24% of the purchase price that we pay in connection with this transaction.
We have evaluated subsequent events through the date our financial statements were issued.
123
SIGNATURES
Pursuant to the requirements of Section 13 or 15(d) of the Securities Exchange Act of 1934, theregistrant has duly caused this report to be signed on its behalf by the undersigned, thereunto dulyauthorized.
IRON MOUNTAIN INCORPORATED
By: /s/ BRIAN P. MCKEON
Brian P. McKeonExecutive Vice President and
Chief Financial Officer(Principal Financial and Accounting Officer)
Dated: March 1, 2011
Pursuant to the requirements of the Securities Exchange Act of 1934, this report has been signedbelow by the following persons on behalf of the registrant and in the capacities and on the datesindicated.
Name Title Date
/s/ C. RICHARD REESE Chairman of the Board of Directors March 1, 2011and Executive ChairmanC. Richard Reese
/s/ ROBERT T. BRENNAN President and Chief Executive Officer March 1, 2011and DirectorRobert T. Brennan
Executive Vice President and Chief/s/ BRIAN P. MCKEONFinancial Officer (Principal Financial March 1, 2011
Brian P. McKeon and Accounting Officer)
/s/ CLARKE H. BAILEYDirector March 1, 2011
Clarke H. Bailey
/s/ CONSTANTIN R. BODENDirector March 1, 2011
Constantin R. Boden
/s/ KENT P. DAUTENDirector March 1, 2011
Kent P. Dauten
/s/ PAUL F. DENINGERDirector March 1, 2011
Paul F. Deninger
/s/ PER-KRISTIAN HALVORSENDirector March 1, 2011
Per-Kristian Halvorsen
124

Name Title Date
/s/ MICHAEL LAMACHDirector March 1, 2011
Michael Lamach
/s/ ARTHUR D. LITTLEDirector March 1, 2011
Arthur D. Little
/s/ VINCENT J. RYANDirector March 1, 2011
Vincent J. Ryan
/s/ LAURIE A. TUCKERDirector March 1, 2011
Laurie A. Tucker
/s/ ALFRED J. VERRECCHIADirector March 1, 2011
Alfred J. Verrecchia
125
INDEX TO EXHIBITS
Certain exhibits indicated below are incorporated by reference to documents we have filed with theCommission. Each exhibit marked by a pound sign (#) is a management contract or compensatoryplan.
Exhibit Item
2.1 Agreement and Plan of Merger by and between Iron Mountain Incorporated, a Pennsylvaniacorporation, and the Company, dated as of May 27, 2005. (Incorporated by reference to theCompany’s Current Report on Form 8-K dated May 27, 2005).
3.1 Amended and Restated Certificate of Incorporation of the Company, as amended.(Incorporated by reference to the Company’s Annual Report on Form 10-K for the year endedDecember 31, 2006).
3.2 Amended and Restated Bylaws of the Company (as adopted on March 5, 2010). (Incorporatedby reference to the Company’s Current Report on Form 8-K dated March 5, 2010).
3.3 Declaration of Trust of IM Capital Trust I, dated as of December 10, 2001 among theCompany, The Bank of New York, The Bank of New York (Delaware) and John P. Lawrence,as trustees. (Incorporated by reference to the Company’s Registration Statement No. 333-75068,filed with the Commission on December 13, 2001).
3.4 Certificate of Trust of IM Capital Trust I. (Incorporated by reference to the Company’sRegistration Statement No. 333-75068, filed with the Commission on December 13, 2001).
4.1 Indenture for 71⁄4% Senior Subordinated Notes due 2014, dated as of January 22, 2004, by andamong the Company, the Guarantors named therein and The Bank of New York, as trustee.(Incorporated by reference to the Company’s Current Report on Form 8-K dated July 11, 2006).
4.2 Senior Subordinated Indenture, dated as of December 30, 2002, among the Company, theGuarantors named therein and The Bank of New York, as trustee. (Incorporated by reference tothe Company’s Annual Report on Form 10-K for the year ended December 31, 2002).
4.3 First Supplemental Indenture, dated as of December 30, 2002, among the Company, theGuarantors named therein and The Bank of New York, as trustee relating to the 73⁄4% SeniorSubordinated Notes due 2015. (Incorporated by reference to the Company’s Annual Report onForm 10-K for the year ended December 31, 2002).
4.4 Second Supplemental Indenture, dated as of June 20, 2003, among the Company, theGuarantors named therein and The Bank of New York, as trustee relating to the 65⁄8% SeniorSubordinated Notes due 2016. (Incorporated by reference to the Company’s Annual Report onForm 10-K for the year ended December 31, 2003).
4.5 Third Supplemental Indenture, dated as of July 17, 2006, by and among the Company, theGuarantors named therein and The Bank of New York Trust Company, N.A., as trusteerelating to the 83⁄4% Senior Subordinated Notes due 2018. (Incorporated by reference to theCompany’s Current Report on Form 8-K dated July 20, 2006).
4.6 Fourth Supplemental Indenture, dated as of October 16, 2006, by and among the Company,the Guarantors named therein and The Bank of New York Trust Company, N.A., as trusteerelating to the 8% Senior Subordinated Notes due 2018 and the 63⁄4% Senior SubordinatedNotes due 2018. (Incorporated by reference to the Company’s Current Report on Form 8-K datedOctober 17, 2006).
126

Exhibit Item
4.7 Fifth Supplemental Indenture, dated as of January 19, 2007, by and among the Company, theGuarantors named therein and The Bank of New York Trust Company, N.A., as trusteerelating to the 63⁄4% Senior Subordinated Notes due 2018. (Incorporated by reference to theCompany’s Current Report on Form 8-K dated January 24, 2007).
4.8 Amendment No. 1 to Fifth Supplemental Indenture, dated as of February 23, 2007, by andamong the Company, the Guarantors named therein and The Bank of New York TrustCompany, N.A., as trustee. (Incorporated by reference to the Company’s Annual Report onForm 10-K for the year ended December 31, 2006).
4.9 Sixth Supplemental Indenture, dated as of March 15, 2007, by and among Iron Mountain NovaScotia Funding Company, the Company and the other guarantors named therein and TheBank of New York Trust Company, N.A., as trustee relating to the 71⁄2% Senior SubordinatedNotes due 2017. (Incorporated by reference to the Company’s Current Report on Form 8-K datedMarch 23, 2007).
4.10 Registration Rights Agreement, dated as of March 15, 2007, between Iron Mountain NovaScotia Funding Company, the Company and the other guarantors named therein and theInitial Purchasers named therein. (Incorporated by reference to the Company’s Current Report onForm 8-K dated March 23, 2007).
4.11 Seventh Supplemental Indenture, dated as of June 5, 2008, by and among the Company, theGuarantors named therein and The Bank of New York Trust Company, N.A., as trusteerelating to the 8% Senior Subordinated Notes due 2020. (Incorporated by reference to theCompany’s Current Report on Form 8-K dated June 11, 2008).
4.12 Eighth Supplemental Indenture, dated as of August 10, 2009, by and among the Company, theGuarantors named therein and The Bank of New York Trust Company, N.A., as trusteerelating to the 83⁄8% Senior Subordinated Notes due 2021. (Incorporated by reference to theCompany’s Current Report on Form 8-K dated August 11, 2009).
4.13 Form of stock certificate representing shares of Common Stock, $.01 par value per share, ofthe Company. (#) (Incorporated by reference to the Company’s Registration StatementNo. 333-167837, filed with the Commission on June 28, 2010).
10.1 Iron Mountain Incorporated Executive Deferred Compensation Plan. (#) (Incorporated byreference to the Company’s Annual Report on Form 10-K for the year ended December 31, 2007).
10.2 First Amendment to the Iron Mountain Incorporated Executive Deferred Compensation Plan.(#) (Incorporated by reference to the Company’s Annual Report on Form 10-K for the year endedDecember 31, 2008).
10.3 Iron Mountain Incorporated 1997 Stock Option Plan, as amended. (#) (Incorporated byreference to the Company’s Annual Report on Form 10-K for the year ended December 31, 2000).
10.4 Amendment to Iron Mountain Incorporated 1997 Stock Option Plan, as amended. (#)(Incorporated by reference to the Company’s Current Report on Form 8-K dated December 10,2008).
10.5 Iron Mountain Incorporated 1995 Stock Incentive Plan, as amended. (#) (Incorporated byreference to Iron Mountain/DE’s Current Report on Form 8-K dated April 16, 1999).
10.6 Iron Mountain Incorporated 2002 Stock Incentive Plan. (#) (Incorporated by reference to theCompany’s Annual Report on Form 10-K for the year ended December 31, 2002).
127
Exhibit Item
10.7 Third Amendment to the Iron Mountain Incorporated 2002 Stock Incentive Plan. (#)(Incorporated by reference to Appendix A of the Company’s Proxy Statement for the 2008 AnnualMeeting of Stockholders filed April 21, 2008).
10.8 Fourth Amendment to the Iron Mountain Incorporated 2002 Stock Incentive Plan. (#)(Incorporated by reference to the Company’s Current Report on Form 8-K dated December 10,2008).
10.9 Fifth Amendment to the Iron Mountain Incorporated 2002 Stock Incentive Plan. (#)(Incorporated by reference to the Company’s Current Report on Form 8-K dated June 4, 2010).
10.10 Stratify, Inc. 1999 Stock Plan. (#) (Incorporated by reference to the Company’s Annual Report onForm 10-K for the year ended December 31, 2007).
10.11 Amendment to Stratify, Inc. 1999 Stock Plan. (#) (Incorporated by reference to the Company’sCurrent Report on Form 8-K dated December 10, 2008).
10.12 Form of Iron Mountain Incorporated 1995 Stock Incentive Plan Amended and RestatedNon-Qualified Stock Option Agreement. (#) (Incorporated by reference to the Company’sAnnual Report on Form 10-K for the year ended December 31, 2004).
10.13 Form of Iron Mountain Incorporated 1995 Stock Incentive Plan Incentive Stock OptionAgreement. (#) (Incorporated by reference to the Company’s Annual Report on Form 10-K forthe year ended December 31, 2004).
10.14 Form of Iron Mountain Incorporated 1995 Stock Incentive Plan Non-Qualified Stock OptionAgreement. (#) (Incorporated by reference to the Company’s Annual Report on Form 10-K forthe year ended December 31, 2004).
10.15 Form of Iron Mountain Incorporated 1995 Stock Incentive Plan Amended and Restated IronMountain Non-Qualified Stock Option Agreement. (#) (Incorporated by reference to theCompany’s Annual Report on Form 10-K for the year ended December 31, 2004).
10.16 Form of Iron Mountain Incorporated 1995 Stock Incentive Plan Incentive Stock OptionAgreement. (#) (Incorporated by reference to the Company’s Annual Report on Form 10-K forthe year ended December 31, 2004).
10.17 Form of Iron Mountain Incorporated 1995 Stock Incentive Plan Non-Qualified Stock OptionAgreement. (#) (Incorporated by reference to the Company’s Annual Report on Form 10-K forthe year ended December 31, 2004).
10.18 Form of Iron Mountain Incorporated 1997 Stock Option Plan Stock Option Agreement(version 1). (#) (Incorporated by reference to the Company’s Annual Report on Form 10-K for theyear ended December 31, 2004).
10.19 Form of Iron Mountain Incorporated 1997 Stock Option Plan Stock Option Agreement(version 2). (#) (Incorporated by reference to the Company’s Annual Report on Form 10-K for theyear ended December 31, 2004).
10.20 Form of Iron Mountain Incorporated 2002 Stock Incentive Plan Stock Option Agreement(version 1). (#) (Incorporated by reference to the Company’s Annual Report on Form 10-K for theyear ended December 31, 2004).
10.21 Form of Iron Mountain Incorporated 2002 Stock Incentive Plan Stock Option Agreement(version 2). (#) (Incorporated by reference to the Company’s Annual Report on Form 10-K for theyear ended December 31, 2004).
128
Exhibit Item
10.22 Iron Mountain Incorporated 2002 Stock Incentive Plan Stock Option Agreement, datedMay 24, 2007, by and between Iron Mountain Incorporated and Brian P. McKeon. (#)(Incorporated by reference to the Company’s Quarterly Report on Form 10-Q for the quarter endedJune 30, 2007).
10.23 Change in Control Agreement, dated December 10, 2008, by and between the Company andBrian P. McKeon. (Incorporated by reference to the Company’s Current Report on Form 8-K datedDecember 10, 2008).
10.24 Change in Control Agreement, dated December 10, 2008, by and between the Company andRobert Brennan. (Incorporated by reference to the Company’s Current Report on Form 8-K datedDecember 10, 2008).
10.25 Iron Mountain Incorporated 2003 Senior Executive Incentive Program. (#) (Incorporated byreference to the Company’s Current Report on Form 8-K dated April 5, 2005).
10.26 Amendment to the Iron Mountain Incorporated 2003 Senior Executive Incentive Program. (#)(Incorporated by reference to the Company’s Current Report on Form 8-K dated June 4, 2010).
10.27 Iron Mountain Incorporated 2006 Senior Executive Incentive Program. (#) (Incorporated byreference to the Company’s Current Report on Form 8-K dated June 1, 2006).
10.28 Amendment to the Iron Mountain Incorporated 2006 Senior Executive Incentive Program. (#)(Incorporated by reference to the Company’s Current Report on Form 8-K dated June 4, 2010).
10.29 Employment Agreement, dated as of August 11, 2008, by and between the Company andRobert Brennan. (Incorporated by reference to the Company’s Current Report on Form 8-K datedAugust 11, 2008).
10.30 Contract of Employment with Iron Mountain, between Iron Mountain Belgium NV and MarcDuale. (Incorporated by reference to the Company’s Current Report on Form 8-K datedDecember 30, 2009) (#).
10.31 Agreement on transfer of the employment contract between Iron Mountain Belgium NV andMarc Duale to Iron Mountain BPM International, dated December 31, 2010. (#) (Filedherewith).
10.32 Restated Compensation Plan for Non-Employee Directors. (#) (Filed herewith).
10.33 Iron Mountain Incorporated Director Deferred Compensation Plan. (#) (Incorporated byreference to the Company’s Annual Report on Form 10-K for the year ended December 31, 2007).
10.34 Amended and Restated Registration Rights Agreement, dated as of June 12, 1997, by andamong the Company and certain stockholders of the Company. (#) (Incorporated by referenceto Iron Mountain/DE’s Quarterly Report on Form 10-Q for the quarter ended June 30, 1997).
10.35 Master Lease and Security Agreement, dated as of May 22, 2001, between Iron MountainStatutory Trust—2001, as Lessor, and Iron Mountain Records Management, Inc., as Lessee.(Incorporated by reference to the Company’s Quarterly Report on Form 10-Q for the quarter endedJune 30, 2001).
10.36 Amendment No. 1 to Master Lease and Security Agreement, dated as of November 1, 2001between Iron Mountain Statutory Trust—2001, as Lessor, and Iron Mountain RecordsManagement, Inc., as Lessee. (Incorporated by reference to the Company’s Annual Report onForm 10-K for the year ended December 31, 2001).
129
Exhibit Item
10.37 Amendment to Master Lease and Security Agreement and Unconditional Guaranty, datedMarch 15, 2002, between Iron Mountain Statutory Trust—2001, Iron Mountain InformationManagement, Inc. and the Company. (Incorporated by reference to the Company’s QuarterlyReport on Form 10-Q for the quarter ended March 31, 2002).
10.38 Unconditional Guaranty, dated as of May 22, 2001, from the Company, as Guarantor, to IronMountain Statutory Trust—2001, as Lessor. (Incorporated by reference to the Company’sQuarterly Report on Form 10-Q for the quarter ended June 30, 2001).
10.39 Subsidiary Guaranty, dated as of May 22, 2001, from certain subsidiaries of the Company asguarantors, for the benefit of Iron Mountain Statutory Trust—2001 and consented to by Bankof Nova Scotia. (Incorporated by reference to the Company’s Annual Report on Form 10-K for theyear ended December 31, 2002).
10.40 Guaranty Letter, dated December 31, 2002, to Scotiabanc, Inc. from Iron MountainInformation Services, Inc., as Lessee and the Company as Guarantor. (Incorporated by referenceto the Company’s Annual Report on Form 10-K for the year ended December 31, 2002).
10.41 Master Construction Agency Agreement, dated as of May 22, 2001, between Iron MountainStatutory Trust—2001, as Lessor, and Iron Mountain Records Management, Inc., asConstruction Agent. (Incorporated by reference to the Company’s Quarterly Report on Form 10-Qfor the quarter ended June 30, 2001).
10.42 Credit Agreement, dated as of April 16, 2007, among the Company, Iron Mountain CanadaCorporation, Iron Mountain Nova Scotia Funding Company, Iron MountainSwitzerland GmbH, the lenders party thereto, J.P. Morgan Securities Inc. and Barclays Capital,as Co-Lead Arrangers and Joint Bookrunners, Barclays Bank PLC and Bank of America, N.A.,as Co-Syndication Agents, Citizens Bank of Massachusetts, The Royal Bank of Scotland PLC,The Bank of Nova Scotia and HSBC Bank USA, National Association, as Co-DocumentationAgents, JPMorgan Chase Bank, N.A., Toronto Branch, as Canadian Administrative Agent, andJPMorgan Chase Bank, N.A., as Administrative Agent. (Incorporated by reference to theCompany’s Current Report on Form 8-K dated April 20, 2007).
10.43 Acknowledgment, Confirmation and Amendment of Guarantee or Security Document, datedas of April 16 2007, among Iron Mountain Incorporated, certain of its subsidiaries asguarantors and/or pledgors, JPMorgan Chase Bank, N.A., Toronto Branch, as CanadianAdministrative Agent, and JPMorgan Chase Bank, N.A., as Administrative Agent.(Incorporated by reference to the Company’s Current Report on Form 8-K dated April 20, 2007).
10.44 Agreement of Resignation, Appointment and Acceptance, dated as of January 28, 2005, by andamong the Company, The Bank of New York, as prior trustee, and The Bank of New YorkTrust Company, N.A., as successor trustee, relating to the Senior Subordinated Indenture for73⁄4% Senior Subordinated Notes due 2015 and 65⁄8% Senior Subordinated Notes due 2016,dated as of December 30, 2002. (Incorporated by reference to the Company’s Current Report onForm 8-K dated July 11, 2006).
12 Statement re: Computation of Ratios. (Filed herewith).
18.1 Preferability letter from Deloitte & Touche LLP regarding a change in accounting principledated May 10, 2010. (Incorporated by reference to the Company’s Quarterly Report on Form 10-Qfor the quarter ended March 31, 2010).
21 Subsidiaries of the Company. (Filed herewith).
23.1 Consent of Deloitte & Touche LLP (Iron Mountain Incorporated, Delaware). (Filed herewith).
130

Exhibit Item
31.1 Rule 13a-14(a) Certification of Chief Executive Officer. (Filed herewith).
31.2 Rule 13a-14(a) Certification of Chief Financial Officer. (Filed herewith).
32.1 Section 1350 Certification of Chief Executive Officer. (Filed herewith).
32.2 Section 1350 Certification of Chief Financial Officer. (Filed herewith).
101 The following materials from Iron Mountain Incorporated’s Annual Report on Form 10-K forthe year ended December 31, 2010 formatted in XBRL (eXtensible Business ReportingLanguage): (i) the Consolidated Balance Sheets, (ii) Consolidated Statements of Operations,(iii) Consolidated Statements of Equity, (iv) Consolidated Statements of ComprehensiveIncome (Loss), (v) Consolidated Statements of Cash Flows and (vi) Notes to ConsolidatedFinancial Statements, tagged as blocks of text. (Furnished herewith.)
131
SENIOR OFFICERS
C. Richard Reese Chairman of the Board and Chief Executive Officer
Harold E. EbbighausenPresident, Iron Mountain North America
Brian P. McKeon Executive Vice President and Chief Financial Officer
Marc A. DualePresident, Iron Mountain International
1 Member of the Audit Committee (Mr. Verrecchia is Chairman)2 Member of the Compensation Committee (Mr. Bailey is Chairman)
3 Member of the Nominating and Governance Committee (Mr. Little is Chairman)4 Member of the Finance Committee (Mr. Ryan is Chairman)
CORPORATE DIRECTORS AND OFFICERS(As of 4/15/11)
DIRECTORS
C. Richard Reese
Chairman of the Board of Directors and Chief Executive Officer Iron Mountain IncorporatedBoston, MA
Clarke H. Bailey2
Chief Executive Officer and Chairman of the Board of Directors EDCI Holdings, Inc.New York, NY
Constantin R. Boden1, 3, 4 Principal Boden Partners LLC New York, NY
Kent P. Dauten1, 2, 4
Managing Director, President and DirectorKeystone Capital, Inc.Deerfield, IL
Paul F. Deninger4 Senior Managing Director Evercore Partners, Inc. Boston, MA
Per-Kristian Halvorsen3 Senior Vice President and Chief Innovation Officer Intuit Inc. Mountain View, CA
Michael W. Lamach2
President, Chief Executive Officer and Chairman of the Board of Directors Ingersoll-Rand, plc Davidson, NC
Arthur D. Little1, 3
President and DirectorA & J Acquisition Company, Inc.Effingham, NH
Vincent J. Ryan4 President and Director Schooner Capital Corporation Boston, MA
Laurie A. Tucker3
Senior Vice President of Corporate MarketingFedEx Services, Inc.Memphis, TN
Alfred J. Verrecchia1 Chairman of the Board of Directors Hasbro Inc. Pawtucket, RI

CORPORATE INFORMATION
Transfer Agent, Trustee and RegistrarThe Bank of New York Mellon Corporation877/897-6892201/680-6685 (outside the U.S.)800/231-5469 (Hearing Impaired – TDD Phone)E-Mail: [email protected]: www.bnymellon.com/shareowner/isd
Address Shareholder Inquiries to:Iron Mountain Incorporatedc/o BNY Mellon Shareowners Services480 Washington BoulevardJersey City, NJ 07310
Send Certificates for Transfer and Address Changes to:Iron Mountain Incorporatedc/o BNY Mellon Shareowners ServicesP.O. Box 358015Pittsburgh, PA 15252-8015
Corporate HeadquartersIron Mountain Incorporated745 Atlantic AvenueBoston, MA 02111800/935-6966www.ironmountain.com
Common Stock DataTraded: NYSE Symbol: IRMBeneficial Shareholders: more than 80,000
Investor RelationsStephen P. GoldenVice President, Investor RelationsIron Mountain Incorporated745 Atlantic AvenueBoston, MA 02111617/535-4766www.ironmountain.com
Independent Registered Public Accounting FirmDeloitte & Touche LLP200 Berkeley StreetBoston, MA 02116
DividendsWe did not pay dividends on our common stock during 2009. However, in February 2010 our board of directors adopted a dividend policy under which we began paying quarterly dividends on our common stock in the second quarter of 2010. We initially paid dividends at the quar-terly rate of $0.0625 per share. In December 2010, our board of directors increased the quarterly dividend rate to $0.1875 per share.
In February 2010, our board of directors also approved a share repurchase program authorizing up to $150.0 million in repurchases of our common stock, and in October 2010, our board of directors authorized up to an additional $200.0 million of such repurchases, for a total of $350.0 million.
Any determinations by us to repurchase our common stock or pay cash dividends on our common stock in the future will be based primarily upon our financial condition, results of opera-tions, business requirements, the price of our common stock in the case of the repurchase program and our board of directors’ continuing determination that the repurchase program and the declaration of dividends under the dividend policy are in the best interests of our stockholders and are in compliance with all laws and agree-ments applicable to the repurchase and dividend programs. The terms of our credit agreement and our indentures contain provisions permit-ting the payment of cash dividends and stock repurchases, subject to certain limitations.
SHAREHOLDER INFORMATION
BUSINESS OPERATIONS
OPERATIONAL LOCATIONS(As of 12/31/10)
Asia Pacific
Australia
China
Hong Kong-SAR
India
New Zealand
Singapore
Europe
Austria
Belgium
Czech Republic
Denmark
England
France
Germany
Greece
Hungary
Italy
Netherlands
Northern Ireland
Norway
Poland
Republic of Ireland
Romania
Russia
Scotland
Serbia
Slovak Republic
Spain
Switzerland
Turkey
Ukraine
Latin America
Argentina
Brazil
Chile
Mexico
Peru
North America
Canada
United States
We have made statements in this Annual Report that constitute “forward-looking statements” as that term is defined in the Private Securities Litigation Reform Act of 1995 and other federal securities laws. These forward-looking statements concern our operations, economic performance, financial condition, goals, beliefs, future growth strategies, investment objectives, plans and current expectations. The forward-looking statements are subject to various known and unknown risks, uncertainties and other factors. When we use words such as “believes,” “expects,” “anticipates,” “estimates” or similar expressions, we are making forward-looking statements.
Although we believe that our forward-looking statements are based on reasonable assumptions, our expected results may not be achieved, and actual results may differ materially from our expectations. Important factors that could cause actual results to differ from expectations include, among others:
• the cost to comply with current and future laws, regulations and customer demands relating to privacy issues;
• the impact of litigation or disputes that may arise in connection with incidents in which we fail to protect our customers’ information;
• changes in the price for our services relative to the cost of providing such services;
• changes in customer preferences and demand for our services;
• the cost or potential liabilities associated with real estate necessary for our business;
• the performance of business partners upon whom we depend for technical assistance or management expertise outside the U.S.;
• changes in the political and economic environments in the countries in which our international subsidiaries operate;
• in the various digital businesses in which we are engaged, our ability to keep up with rapid technological changes, evolving industry expectations and changing customer requirements or competition for customers;
• claims that our technology violates the intellectual property rights of a third party;
• the impact of legal restrictions or limitations under stock repurchase plans on price, volume or timing of stock repurchases;
• the impact of alternative, more attractive investments on dividends or stock repurchases;
• our ability or inability to complete acquisitions on satisfactory terms and to integrate acquired companies efficiently; and
• other trends in competitive or economic conditions affecting our financial condition or results of operations not presently contemplated.
Other risks may adversely impact us, as described more fully under “Item 1A. Risk Factors” included in the accompanying Annual Report on Form 10-K for the year ended December 31, 2010.
You should not rely upon forward-looking statements except as statements of our present intentions and of our present expectations, which may or may not occur. You should read these cautionary statements as being applicable to all forward-looking statements wherever they appear. Except as required by law, we undertake no obligation to release publicly the result of any revision to these forward-looking statements that may be made to reflect events or circumstances after the date hereof or to reflect the occurrence of unanticipated events. Readers are also urged to carefully review and consider the various disclosures we have made in this document, as well as our other periodic reports filed with the Securities and Exchange Commission (the “Commission” or “SEC”).
CAUTIONARY NOTE REGARDING FORWARD-LOOKING STATEMENTS
The Company will furnish without charge to any stockholder, upon written or oral request, a copy of the Company’s Annual Report on Form 10-K, including the financial statements and other documents filed pursuant to Sections 13(a), 13(c), 14 or 15(d) of the Exchange Act. Requests for such documents should be addressed to the Secretary of Iron Mountain Incorporated, 745 Atlantic Avenue, Boston, Massachusetts 02111, telephone number (617) 535-4766.
1477-AR-11