Embed Size (px)
Citation preview
U.S. Department of the InteriorU.S. Geological Survey
Scientific Investigations Report 2006–5284
Prepared in cooperation with the Missouri Department of Natural Resources
Peak Discharge, Flood Profile, Flood Inundation, and Debris Movement Accompanying the Failure of the Upper Reservoir at the Taum Sauk Pump Storage Facility near Lesterville, Missouri

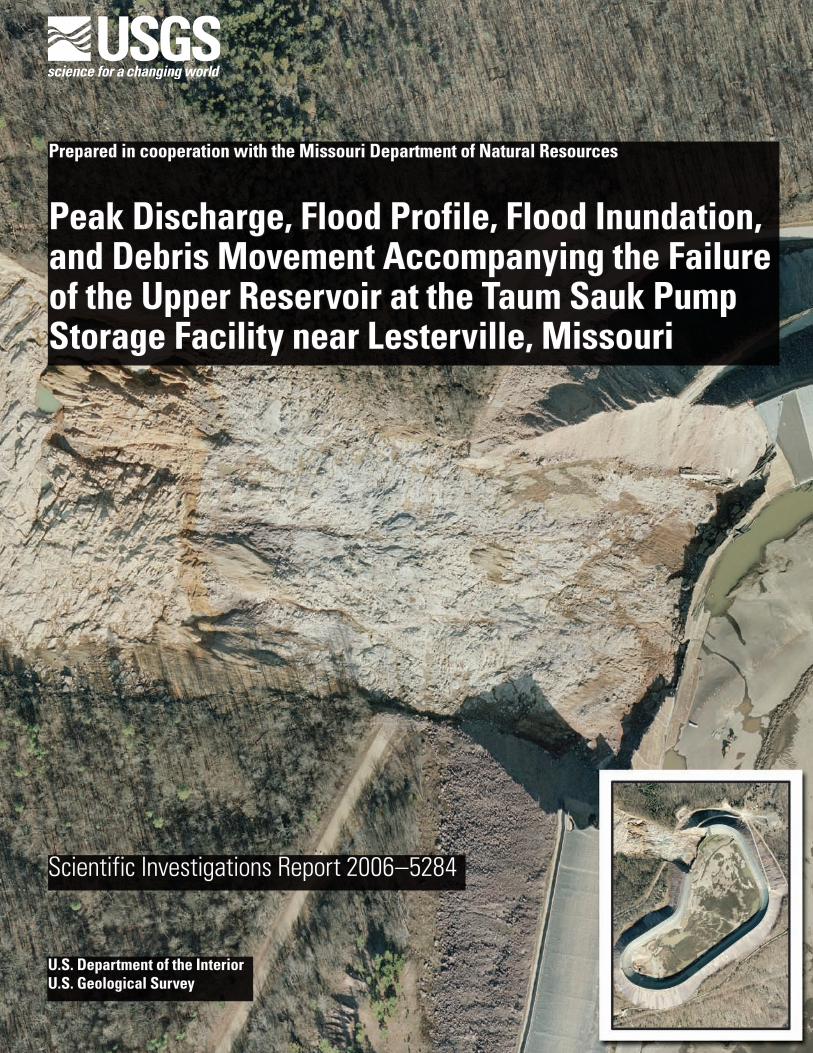
Front Cover. Upper reservoir embankment failure at the Taum Sauk pump storage facility near Lesterville, Missouri, January, 2006 (photograph published with permission from MACTEC Engineering and Consulting, Inc.).
Back Cover. Flow over the spillway of the lower reservoir, on the recession of the embankment failure flood at theTaum Sauk pump storage facility near Lesterville, Missouri, December 14, 2005 (photograph by C. Shane Barks, U.S. Geological Survey).
Peak Discharge, Flood Profile, Flood Inundation, and Debris Movement Accompanying the Failure of the Upper Reservoir at the Taum Sauk Pump Storage Facility near Lesterville, Missouri
By Paul H. Rydlund, Jr.
Prepared in cooperation with theMissouri Department of Natural Resources
Scientific Investigations Report 2006–5284
U.S. Department of the InteriorU.S. Geological Survey
U.S. Department of the InteriorDIRK KEMPTHORNE, Secretary
U.S. Geological SurveyMark D. Myers, Director
U.S. Geological Survey, Reston, Virginia: 2006
For sale by U.S. Geological Survey, Information ServicesBox 25286, Denver Federal CenterDenver, CO 80225
For more information about the USGS and its products:Telephone: 1-888-ASK-USGSWorld Wide Web: http://www.usgs.gov/
Any use of trade, product, or firm names in this publication is for descriptive purposes only and does not imply endorsement by the U.S. Government.
Although this report is in the public domain, permission must be secured from the individual copyright ownersto reproduce any copyrighted materials contained within this report.
Suggested citation: Rydlund, P.H., Jr., 2006, Peak Discharge, Flood Profile, Flood Inundation, and Debris Movement Accompanying the Fail-ure of the Upper Reservoir at the Taum Sauk Storage Facility near Lesterville, Missouri: U.S. Geological Survey ScientificInvestigations Report 2006–5284, 46 p.
iii
Contents
Abstract. . . . . . . . . . . . . . . . . . . . . . . . . . . . . . . . . . . . . . . . . . . . . . . . . . . . . . . . . . . . . . . . . . . . . . . . . . . . . . . . . . . . . . . . . . . . . . . . . . . . . 1Introduction . . . . . . . . . . . . . . . . . . . . . . . . . . . . . . . . . . . . . . . . . . . . . . . . . . . . . . . . . . . . . . . . . . . . . . . . . . . . . . . . . . . . . . . . . . . . . . . . . 1
Purpose and Scope . . . . . . . . . . . . . . . . . . . . . . . . . . . . . . . . . . . . . . . . . . . . . . . . . . . . . . . . . . . . . . . . . . . . . . . . . . . . . . . . . . . 2Description of the Study Area . . . . . . . . . . . . . . . . . . . . . . . . . . . . . . . . . . . . . . . . . . . . . . . . . . . . . . . . . . . . . . . . . . . . . . . . . 2Acknowledgments. . . . . . . . . . . . . . . . . . . . . . . . . . . . . . . . . . . . . . . . . . . . . . . . . . . . . . . . . . . . . . . . . . . . . . . . . . . . . . . . . . . . 6
Reconnaissance and Data Collection. . . . . . . . . . . . . . . . . . . . . . . . . . . . . . . . . . . . . . . . . . . . . . . . . . . . . . . . . . . . . . . . . . . . . . . . 6Aerial Topographic Survey . . . . . . . . . . . . . . . . . . . . . . . . . . . . . . . . . . . . . . . . . . . . . . . . . . . . . . . . . . . . . . . . . . . . . . . . . . . . 6Ground Survey. . . . . . . . . . . . . . . . . . . . . . . . . . . . . . . . . . . . . . . . . . . . . . . . . . . . . . . . . . . . . . . . . . . . . . . . . . . . . . . . . . . . . . . . 6Lower Reservoir Bathymetry Survey . . . . . . . . . . . . . . . . . . . . . . . . . . . . . . . . . . . . . . . . . . . . . . . . . . . . . . . . . . . . . . . . . . 6
Peak Discharge . . . . . . . . . . . . . . . . . . . . . . . . . . . . . . . . . . . . . . . . . . . . . . . . . . . . . . . . . . . . . . . . . . . . . . . . . . . . . . . . . . . . . . . . . . . . 11Discharge Analyses along Proffit Mountain. . . . . . . . . . . . . . . . . . . . . . . . . . . . . . . . . . . . . . . . . . . . . . . . . . . . . . . . . . . 11Slope-Area Analyses along the East Fork Black River. . . . . . . . . . . . . . . . . . . . . . . . . . . . . . . . . . . . . . . . . . . . . . . . . 11Dynamic Wave Analyses. . . . . . . . . . . . . . . . . . . . . . . . . . . . . . . . . . . . . . . . . . . . . . . . . . . . . . . . . . . . . . . . . . . . . . . . . . . . . 11
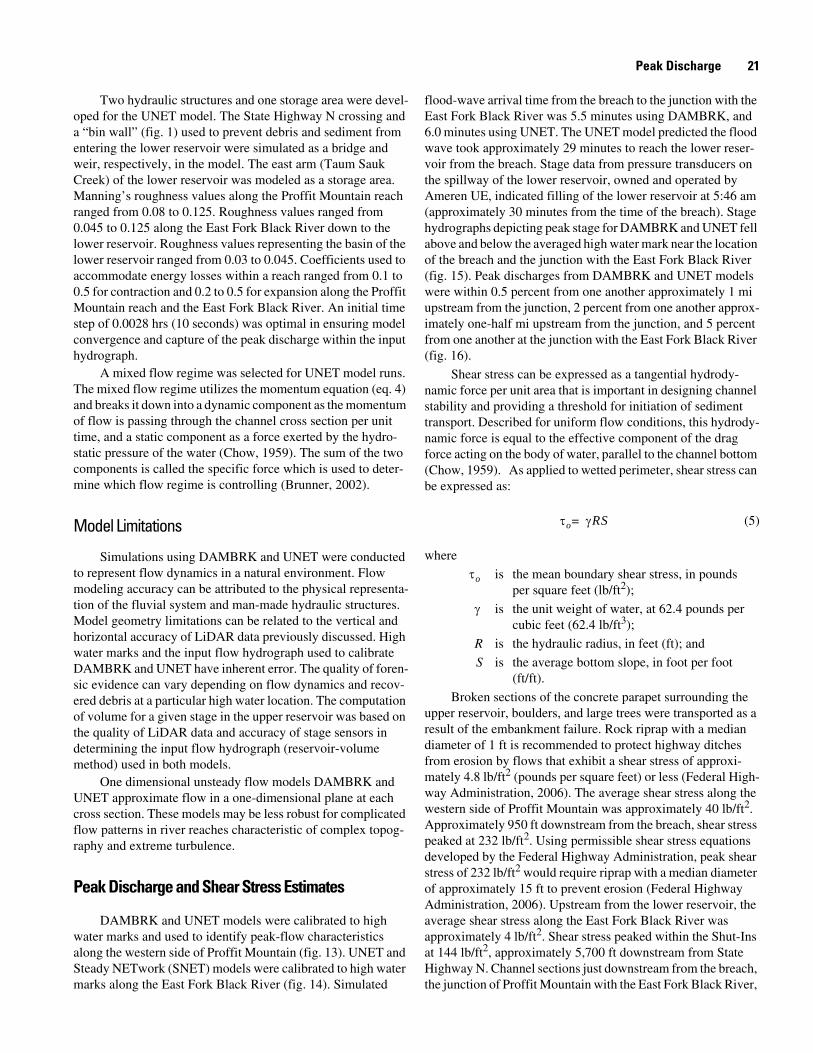
DAMBRK Model Setup. . . . . . . . . . . . . . . . . . . . . . . . . . . . . . . . . . . . . . . . . . . . . . . . . . . . . . . . . . . . . . . . . . . . . . . . . 12UNET Model Setup. . . . . . . . . . . . . . . . . . . . . . . . . . . . . . . . . . . . . . . . . . . . . . . . . . . . . . . . . . . . . . . . . . . . . . . . . . . . . 18Model Limitations. . . . . . . . . . . . . . . . . . . . . . . . . . . . . . . . . . . . . . . . . . . . . . . . . . . . . . . . . . . . . . . . . . . . . . . . . . . . . . . 21
Peak Discharge and Shear Stress Estimates . . . . . . . . . . . . . . . . . . . . . . . . . . . . . . . . . . . . . . . . . . . . . . . . . . . . . . . . . 21Comparison of Embankment Failure Discharge with Natural Floods . . . . . . . . . . . . . . . . . . . . . . . . . . . . . . . . . . 22
Embankment Failure Profiles and Natural Flood Profiles . . . . . . . . . . . . . . . . . . . . . . . . . . . . . . . . . . . . . . . . . . . . . . . . . . . . 23Flood Profiles along Proffit Mountain . . . . . . . . . . . . . . . . . . . . . . . . . . . . . . . . . . . . . . . . . . . . . . . . . . . . . . . . . . . . . . . . . 27Flood Profiles along the East Fork Black River. . . . . . . . . . . . . . . . . . . . . . . . . . . . . . . . . . . . . . . . . . . . . . . . . . . . . . . . . 27Flood Profiles along Taum Sauk Creek. . . . . . . . . . . . . . . . . . . . . . . . . . . . . . . . . . . . . . . . . . . . . . . . . . . . . . . . . . . . . . . . 27
Flood Inundation. . . . . . . . . . . . . . . . . . . . . . . . . . . . . . . . . . . . . . . . . . . . . . . . . . . . . . . . . . . . . . . . . . . . . . . . . . . . . . . . . . . . . . . . . . . . 29Debris Movement . . . . . . . . . . . . . . . . . . . . . . . . . . . . . . . . . . . . . . . . . . . . . . . . . . . . . . . . . . . . . . . . . . . . . . . . . . . . . . . . . . . . . . . . . . 33Summary. . . . . . . . . . . . . . . . . . . . . . . . . . . . . . . . . . . . . . . . . . . . . . . . . . . . . . . . . . . . . . . . . . . . . . . . . . . . . . . . . . . . . . . . . . . . . . . . . . . 43References. . . . . . . . . . . . . . . . . . . . . . . . . . . . . . . . . . . . . . . . . . . . . . . . . . . . . . . . . . . . . . . . . . . . . . . . . . . . . . . . . . . . . . . . . . . . . . . . . 44
Figures
1. Map showing location of Johnson's Shut-Ins State Park boundary and Taum Sauk pump-storage hydroelectric power plant facility . . . . . . . . . . . . . . . . . . . . . . . . . . . . . . . . . . . . . . . . . . . . . . . . . . . .3
2–3. Photographs showing—2. Flood wave damage at base of Proffit Mountain and State Highway N. . . . . . . . . . . . . . . . . . . . . . . . 43. Stripped overburden as a result of flood wave force on the western slope of
Proffit Mountain . . . . . . . . . . . . . . . . . . . . . . . . . . . . . . . . . . . . . . . . . . . . . . . . . . . . . . . . . . . . . . . . . . . . . . . . . . . . . .54. Map showing aerial image flown after embankment failure flood (December 14, 2005) with
location of high water marks. . . . . . . . . . . . . . . . . . . . . . . . . . . . . . . . . . . . . . . . . . . . . . . . . . . . . . . . . . . . . . . . . . . . . . . .75. Photographs showing topographic survey along Taum Sauk Creek, February 6, 2006 . . . . . . . . . . . . . . .8
6–7. Maps showing— 6. Bathymetric surface for lower Taum Sauk reservoir near Lesterville, Missouri... . . . . . . . . . . . . . .9 7. Bathymetric surface difference for lower Taum Sauk reservoir near Lesterville,
Missouri. . . . . . . . . . . . . . . . . . . . . . . . . . . . . . . . . . . . . . . . . . . . . . . . . . . . . . . . . . . . . . . . . . . . . . . . . . . . . . . . . . . . .138. Graph showing hydrograph from volume analysis of upper reservoir embankment failure . . . . . . . . 15
iv
9–11. Maps showing— 9. Cross-section location of slope-area computation along the western side of
Proffit Mountain . . . . . . . . . . . . . . . . . . . . . . . . . . . . . . . . . . . . . . . . . . . . . . . . . . . . . . . . . . . . . . . . . . . . . . . . . . . . 1610. Cross-section location of slope-area computation along the upper East Fork
Black River . . . . . . . . . . . . . . . . . . . . . . . . . . . . . . . . . . . . . . . . . . . . . . . . . . . . . . . . . . . . . . . . . . . . . . . . . . . . . . . . . 1711. Cross-section location of slope-area computation along the lower East Fork
Black River . . . . . . . . . . . . . . . . . . . . . . . . . . . . . . . . . . . . . . . . . . . . . . . . . . . . . . . . . . . . . . . . . . . . . . . . . . . . . . . . . 1912. Definition sketch of dynamic and kinematic flood-wave movement and rating-curve
description . . . . . . . . . . . . . . . . . . . . . . . . . . . . . . . . . . . . . . . . . . . . . . . . . . . . . . . . . . . . . . . . . . . . . . . . . . . . . . . . . . . . . . . 2013–19. Graphs showing—
13. High water marks and simulated water-surface elevations of the embankment failure flood along the western side of Proffit Mountain using dynamic wave unsteady flow models DAMBRK and UNET. . . . . . . . . . . . . . . . . . . . . . . . . . . . . . . . . . . . . . . . . . . . . . . . . 22
14. High water marks and simulated water-surface elevation of the embankment failure flood along the East Fork Black River using UNET and SNET models.. . . . . . . . . . . . . . . . . 23
15. Stage and flow hydrographs depicting dynamic wave unsteady flow models DAMBRK and UNET along Proffit Mountain . . . . . . . . . . . . . . . . . . . . . . . . . . . . . . . . . . . . . . . . . . . . . . . . 24
16. Peak discharge summary for the embankment failure flood along the western side of Proffit Mountain. . . . . . . . . . . . . . . . . . . . . . . . . . . . . . . . . . . . . . . . . . . . . . . . . . . . . . . . . . . . . . . . . . . . . . . . . . .25
17. Total shear stress along the western side of Proffit Mountain and the East Fork Black River . . . . . . . . . . . . . . . . . . . . . . . . . . . . . . . . . . . . . . . . . . . . . . . . . . . . . . . . . . . . . . . . . . . . . . . . . . . . . . . . . .26
18. Left and right bank high water profiles along the western side of Proffit Mountain. . . . . . . . . . . 29 19. Simulated 2- through 500- year flood frequency profiles along the East Fork
Black River from the Steady NETwork model (SNET). . . . . . . . . . . . . . . . . . . . . . . . . . . . . . . . . . . . . . . . 3020. Map showing proposed stream restoration plan. . . . . . . . . . . . . . . . . . . . . . . . . . . . . . . . . . . . . . . . . . . . . . . . . . 3121. Graph showing simulated embankment failure flood compared with 100- and 500- year
flood frequency profiles along Taum Sauk Creek from the Steady NETwork model (SNET) . . . . . . . . 33 22–24. Map showing—
22. Location of Steady NETwork (SNET) model along Taum Sauk Creek. . . . . . . . . . . . . . . . . . . . . . . . 34 23. Quantitative assessment of debris on the East Fork Black River from State Highway N
to the lower reservoir near Lesterville, Missouri. . . . . . . . . . . . . . . . . . . . . . . . . . . . . . . . . . . . . . . . . . . . . 35 24. Difference between LiDAR surface and 10-meter digital elevation model for area
upstream from the bin wall of the lower reservoir affected by embankment failure flood near Lesterville, Missouri. . . . . . . . . . . . . . . . . . . . . . . . . . . . . . . . . . . . . . . . . . . . . . . . . . . . . . . . . . . . . . 41
TABLES
1. Cross-section properties for a slope-area computation along the western side of Proffit Mountain. . . . . . . . . . . . . . . . . . . . . . . . . . . . . . . . . . . . . . . . . . . . . . . . . . . . . . . . . . . . . . . . . . . . . . . . . . . . . . . . . . . . . . . . . .15
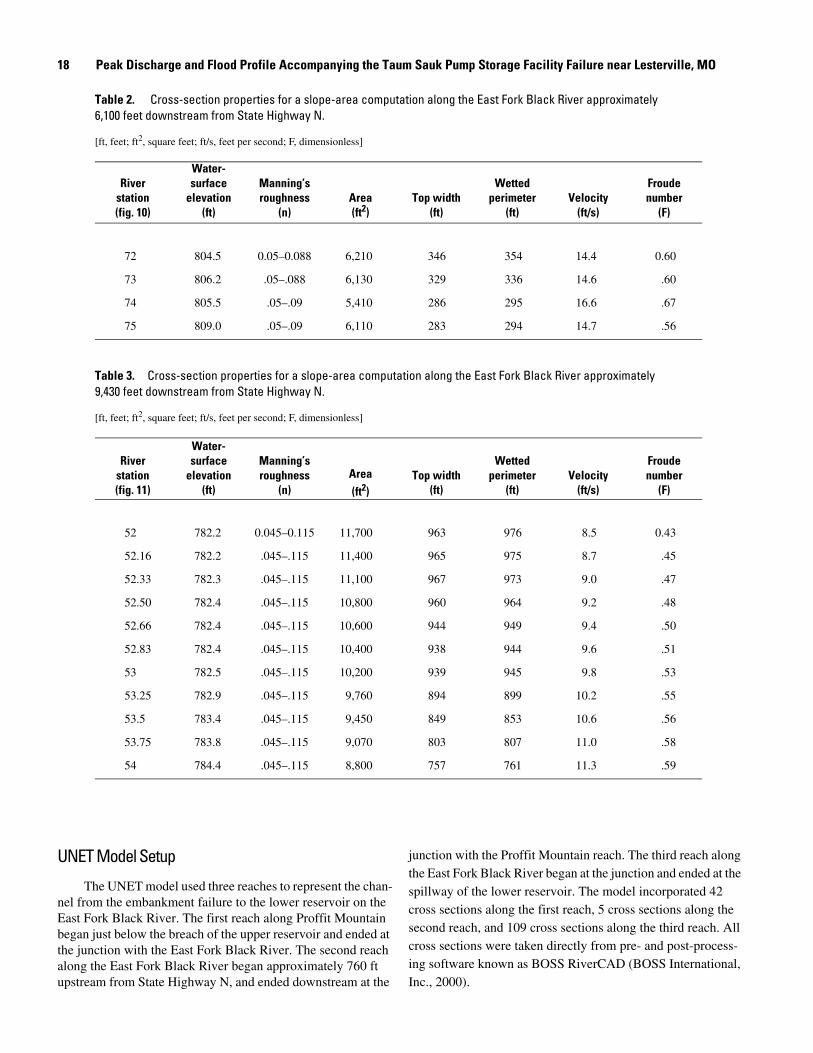
2. Cross-section properties for a slope-area computation along the East Fork Black River approximately 6,100 feet downstream from State Highway N . . . . . . . . . . . . . . . . . . . . . . . . . . . . . . . . . . . . . 18
3. Cross-section properties for a slope-area computation along the East Fork Black River approximately 9,430 feet downstream from State Highway N . . . . . . . . . . . . . . . . . . . . . . . . . . . . . . . . . . . . . 18
4. Simulated flow at maximum water-surface elevation at specific locations along the western side of Proffit Mountain. . . . . . . . . . . . . . . . . . . . . . . . . . . . . . . . . . . . . . . . . . . . . . . . . . . . . . . . . . . . . . . . . . . . . . . . . . . 25
5. Simulated Unsteady NETwork (UNET) flow at maximum water-surface elevation at specific locations along the East Fork Black River . . . . . . . . . . . . . . . . . . . . . . . . . . . . . . . . . . . . . . . . . . . . . . . . . . . . . . . . . 26
6. Basin area and slope defined at State Highway N and County Road 206.. . . . . . . . . . . . . . . . . . . . . . . . . . 277. Historic peak discharge and flood magnitude and frequency along the East Fork Black River . . . . . 28

v
PLATES
[In pocket]
1–12. Maps showing— 1. Food inundation extent of the upper reservoir embankment failure,
December 14, 2005 . . . . . . . . . . . . . . . . . . . . . . . . . . . . . . . . . . . . . . . . . . . . . . . . . . . . . . . . . . . . . . . . . . . . . . . . .CD 2. Estimated maximum water depth upstream from the lower reservoir of the
upper reservoir embankment failure flood, December 14, 2005 . . . . . . . . . . . . . . . . . . . . . . . . . . . . . .CD 3. Estimated flood inundation extent along Taum Sauk Creek representing a
hypothetical embankment failure on the east side . . . . . . . . . . . . . . . . . . . . . . . . . . . . . . . . . . . . . . . . . .CD 4. Estimated flood inundation extent representing the 100-year flood frequency at
11,500 cubic feet per second along Taum Sauk Creek. . . . . . . . . . . . . . . . . . . . . . . . . . . . . . . . . . . . . . .CD 5. Estimated flood inundation extent representing the 500-year flood frequency at
16,400 cubic feet per second along Taum Sauk Creek. . . . . . . . . . . . . . . . . . . . . . . . . . . . . . . . . . . . . . .CD 6. Estimated flood inundation extent representing the 2-year flood frequency at
3,720 cubic feet per second along the East Fork Black River. . . . . . . . . . . . . . . . . . . . . . . . . . . . . . . . .CD 7. Estimated flood inundation extent representing the 5-year flood frequency at
7,420 cubic feet per second along the East Fork Black River. . . . . . . . . . . . . . . . . . . . . . . . . . . . . . . . .CD 8. Estimated flood inundation extent representing the 10-year flood frequency at
10,500 cubic feet per second along the East Fork Black River. . . . . . . . . . . . . . . . . . . . . . . . . . . . . . . .CD 9. Estimated flood inundation extent representing the 25-year flood frequency at
15,000 cubic feet per second along the East Fork Black River. . . . . . . . . . . . . . . . . . . . . . . . . . . . . . . .CD 10. Estimated flood inundation extent representing the 50-year flood frequency at
18,300 cubic feet per second along the East Fork Black River. . . . . . . . . . . . . . . . . . . . . . . . . . . . . . . .CD 11. Estimated flood inundation extent representing the 100-year flood frequency at
21,900 cubic feet per second along the East Fork Black River. . . . . . . . . . . . . . . . . . . . . . . . . . . . . . . .CD 12. Estimated flood inundation extent representing the 500-year flood frequency at
30,500 cubic feet per second along the East Fork Black River. . . . . . . . . . . . . . . . . . . . . . . . . . . . . . . .CD
vi
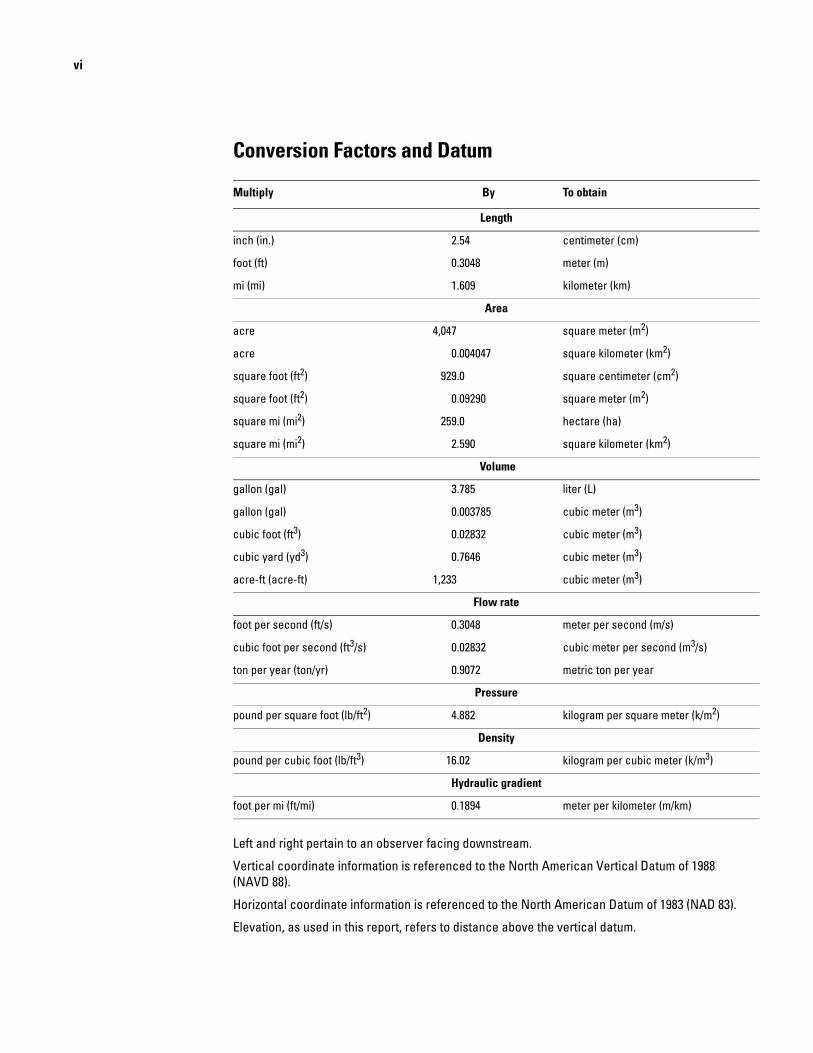
Conversion Factors and Datum
Multiply By To obtain
Length
inch (in.) 2.54 centimeter (cm)
foot (ft) 0.3048 meter (m)
mi (mi) 1.609 kilometer (km)
Area
acre 4,047 square meter (m2)
acre 0.004047 square kilometer (km2)
square foot (ft2) 929.0 square centimeter (cm2)
square foot (ft2) 0.09290 square meter (m2)
square mi (mi2) 259.0 hectare (ha)
square mi (mi2) 2.590 square kilometer (km2)
Volume
gallon (gal) 3.785 liter (L)
gallon (gal) 0.003785 cubic meter (m3)
cubic foot (ft3) 0.02832 cubic meter (m3)
cubic yard (yd3) 0.7646 cubic meter (m3)
acre-ft (acre-ft) 1,233 cubic meter (m3)
Flow rate
foot per second (ft/s) 0.3048 meter per second (m/s)
cubic foot per second (ft3/s) 0.02832 cubic meter per second (m3/s)
ton per year (ton/yr) 0.9072 metric ton per year
Pressure
pound per square foot (lb/ft2) 4.882 kilogram per square meter (k/m2)
Density
pound per cubic foot (lb/ft3) 16.02 kilogram per cubic meter (k/m3)
Hydraulic gradient
foot per mi (ft/mi) 0.1894 meter per kilometer (m/km)
Left and right pertain to an observer facing downstream.
Vertical coordinate information is referenced to the North American Vertical Datum of 1988 (NAVD 88).
Horizontal coordinate information is referenced to the North American Datum of 1983 (NAD 83).
Elevation, as used in this report, refers to distance above the vertical datum.
Peak Discharge, Flood Profile, Flood Inundation, and Debris Movement Accompanying the Failure of the Upper Reservoir at the Taum Sauk Pump Storage Facility near Lesterville, Missouri
By Paul H. Rydlund, Jr.
Abstract
The Taum Sauk pump-storage hydroelectric power plant located in Reynolds County, Missouri, uses turbines that oper-ate as pumps and hydraulic head generated by discharging water from an upper to a lower reservoir to produce electricity. A 55-acre upper reservoir with a 1.5- billion gallon capacity was built on top of Proffit Mountain, approximately 760 feet above the floodplain of the East Fork Black River. At approxi-mately 5:16 am on December 14, 2005, a 680-foot wide section of the upper reservoir embankment failed suddenly, sending water rushing down the western side of Proffit Mountain and emptying into the floodplain of East Fork Black River. Flood waters from the upper reservoir flowed downstream through Johnson’s Shut-Ins State Park and into the lower reservoir of the East Fork Black River. Floods such as this present unique chal-lenges and opportunities to analyze and document peak-flow characteristics, flood profiles, inundation extents, and debris movement.
On December 16, 2005, Light Detection and Ranging (LiDAR) data were collected and used to support hydraulic analyses, forensic failure analyses, damage extent, and mitiga-tion of future disasters. To evaluate the impact of sedimentation in the lower reservoir, a bathymetric survey conducted on December 22 and 23, 2005, was compared to a previous bathy-metric survey conducted in April, 2005. Survey results indi-cated the maximum reservoir capacity difference of 147 acre-feet existed at a pool elevation of 730 feet.
Peak discharge estimates of 289,000 cubic feet per second along Proffit Mountain and 95,000 cubic feet per second along the East Fork Black River were determined through indirect measurement techniques. The magnitude of the embankment failure flood along the East Fork Black River was approxi-mately 4 times greater than the 100-year flood frequency esti-mate of 21,900 cubic feet per second, and approximately 3 times greater than the 500-year flood frequency estimate of 30,500 cubic feet per second. Dynamic wave unsteady flow models Dam Break (DAMBRK) and Unsteady NETwork (UNET) were used to route the flood wave from the embank-
ment failure breach of the upper reservoir to the spillway of the lower reservoir. Simulated velocities ranged from 20 to 51 feet per second along Proffit Mountain and 12 to 32 feet per second along the East Fork Black River. Simulated arrival time of the flood wave took approximately 5.5 to 6.0 minutes to enter into the floodplain of the East Fork Black River, and roughly 29 minutes to begin filling the lower reservoir. Simulated shear stress values reached as high as 232 pounds per square foot along the slope of Proffit Mountain and 144 pounds per square foot within the Shut-Ins. Flood depths from the embankment failure may have reached greater than 50 feet along Proffit Mountain and as much as 30 to 40 feet along the East Fork Black River.
A steady-state model was used to develop 2-, 5-, 10-, 25-, 50-, 100-, and 500-year flood frequency profiles along the East Fork Black River. A similar flood event, hypothetically resulting from a breach of the east embankment above Taum Sauk Creek, was simulated along with the 100- and 500-year flood profiles on Taum Sauk Creek. Estimated extents of flood inundation were developed for each profile.
Debris movement was extensive as a result of the flood wave moving down Proffit Mountain and through Johnson’s Shut-Ins State Park. A quantitative assessment of debris move-ment was conducted to benefit rehabilitation efforts within the park. Approximately 180 acres of timber were affected as a result of the embankment failure flood.
Introduction
The Taum Sauk pump-storage hydroelectric power plant owned and operated by Ameren UE was completed in July, 1963, and went into commercial operation on December 20, 1963. After years of planning, Ameren UE chose 1,590-ft (foot) high Proffit Mountain in Reynolds County, Missouri, for the location of the power plant. The plant was named “Taum Sauk” after the legendary Indian chief who once ruled tribes in the area. The plant utilizes reversible turbines that operate as pumps. The pumps use power from other plants to pump water
2 Peak Discharge and Flood Profile Accompanying the Taum Sauk Pump Storage Facility Failure near Lesterville, MO
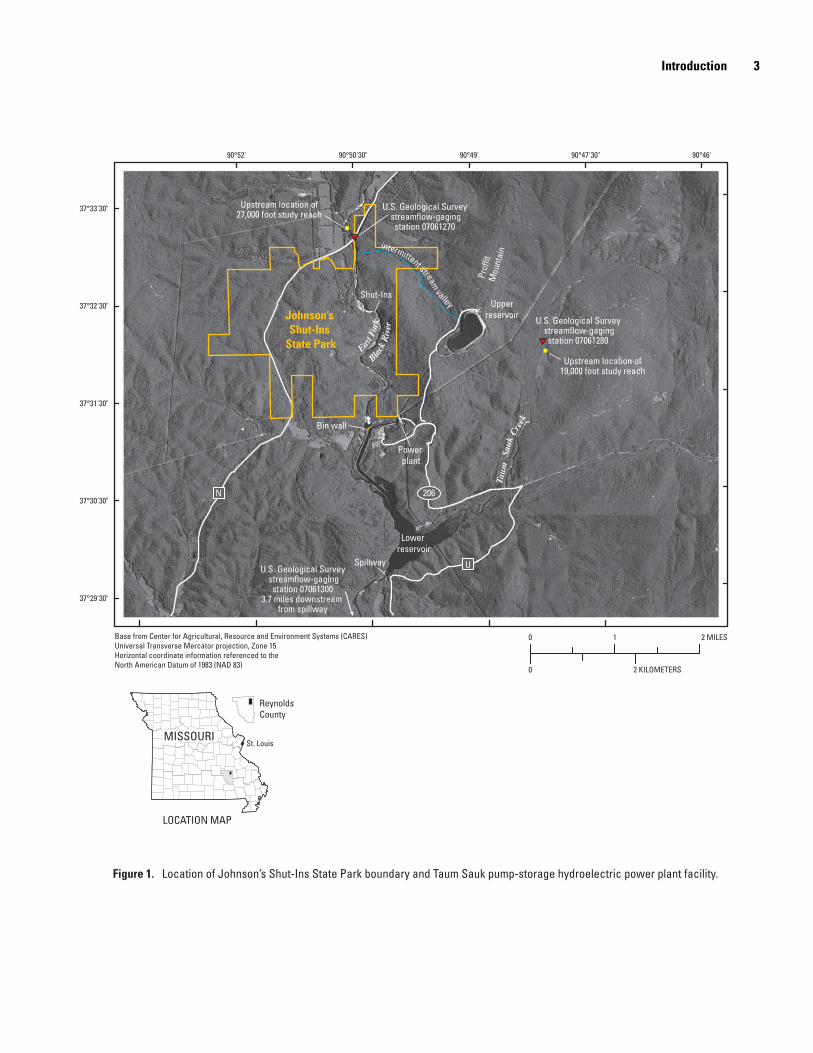
into an upper reservoir on top of Proffit Mountain during “off-peak” hours occurring nights and weekends. When electricity demand is high, the pumps become turbine-generators and the process is reversed as water is released from the upper reservoir to the lower reservoir through a 7,000-ft tunnel, producing electricity in the same manner as a conventional hydro-electric power plant. The approximate operating head between the lower and upper reservoir ranges from 776 to 860 ft (Hendron and others, 2006). Johnson’s Shut-Ins State Park, managed by the Missouri Department of Natural Resources, exists along the East Fork Black River adjacent to Proffit Mountain (fig. 1). The term “Shut-Ins,” defines an area where waters of the East Fork Black River become confined, or “shut-in,” to a narrow channel approximately 1 mi (mile) downstream from State Highway N. With time, transported sand and gravel have pro-duced unique erosional features such as small gorges, chutes, and potholes throughout the Shut-Ins.
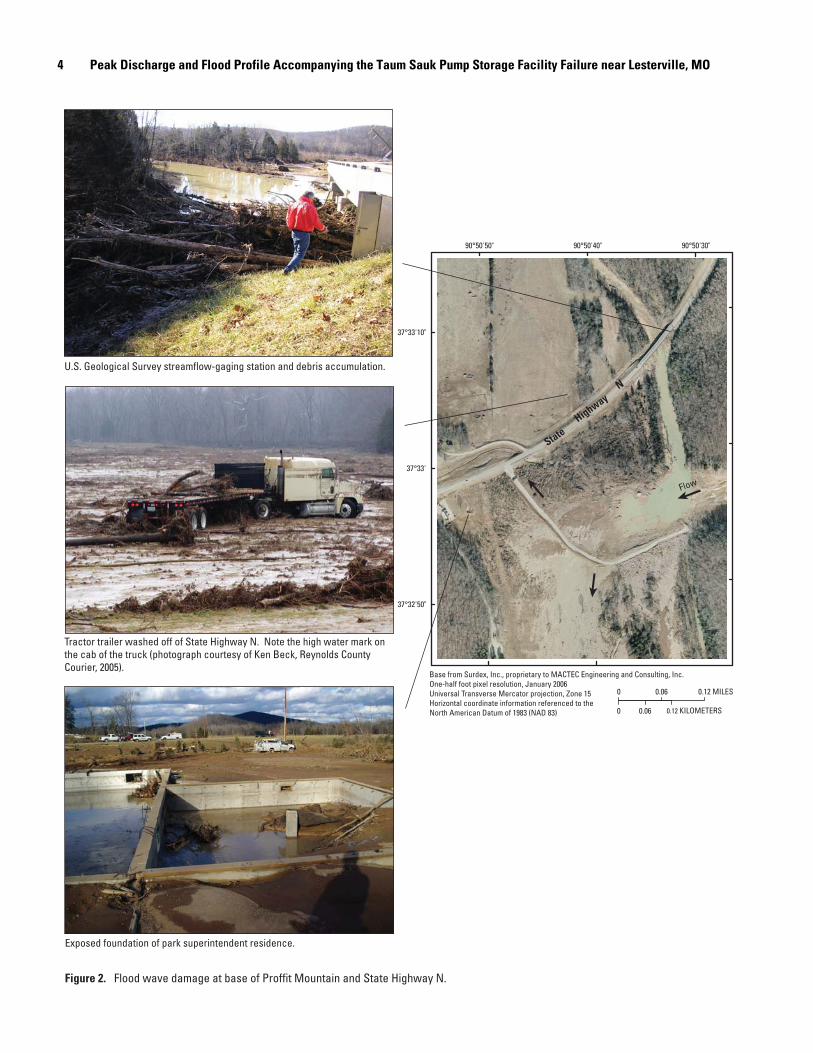
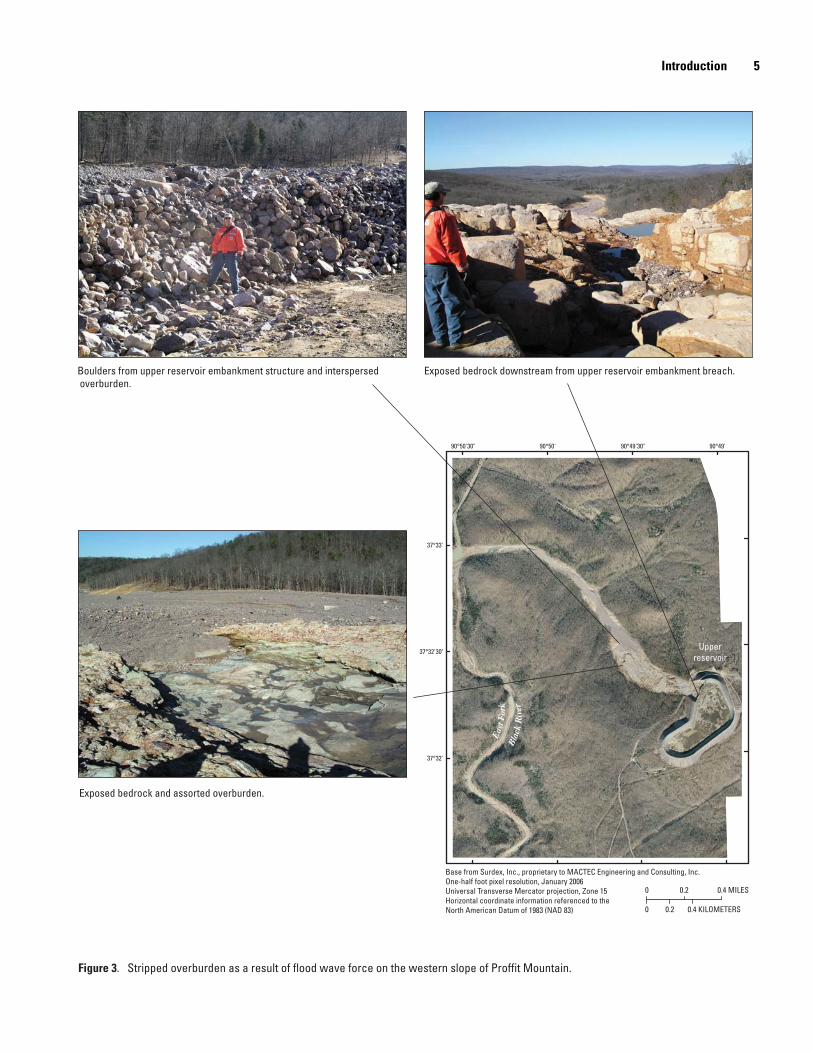
At approximately 5:16 am on December 14, 2005, the embankment of the upper reservoir failed as water filled the res-ervoir during the “off peak” pumping cycle. A 680-ft wide breach of the 55-acre reservoir drained approximately 1.5 bil-lion gallons of water down an intermittent stream valley along the western side of Proffit Mountain and into the East Fork Black River. The full breach developed within 25 minutes from the initial drop of the reservoir level (Hendron and others, 2006). The flood wave split at the base of Proffit Mountain, removing a residential structure from the foundation, washing a tractor trailer vehicle off of State Highway N, and damaging a U.S. Geological Survey (USGS) streamflow-gaging station located at the State Highway N crossing of East Fork Black River (fig. 2). The USGS streamflow-gaging station recorded the last stage at 5:15 am on December 14, 2005. The force of the flood wave stripped overburden from the western slope of Proffit Mountain, exposing bedrock and depositing material downstream (fig. 3). The embankment surrounding the kidney shaped upper reservoir is approximately 6,562-ft long and is composed of rock fill that is protected by a 10-in. (inch) thick concrete face on the upstream side (Hendron and others, 2006). Original drawings indicate an approximate 1.3:1 slope on the upstream and downstream face of the embankment with a 12-ft wide crest at an elevation of 1,589 ft. A 10-ft high, 1-ft thick concrete reinforced parapet wall extends the crest to an eleva-tion of 1,599 ft, as originally constructed. The concrete parapet has settled 1 to 2 ft since 1963 (Hendron and others, 2006). Excavated rock primarily composed of rhyolite porphyry was used to construct the embankment.
Floods of large magnitude such as the one produced by the embankment failure disrupt ecological and fluvial systems by altering channel configurations, substrate, and sediment load and present unique challenges and opportunities to analyze and document flood characteristics, such as flood hydraulics and unit peak discharge within the surrounding watershed. To address this need, the USGS in cooperation with the Missouri Department of Natural Resources (MDNR) conducted a study on the East Fork Black River and Taum Sauk Creek at the Taum Sauk Pump Storage Facility near Lesterville, Missouri.
Purpose and Scope
The purpose of this report is to document the flood peak discharge, flood profiles, flood inundation, and debris move-ment as a result of the failure of the upper reservoir. This report presents flood frequency comparisons along the East Fork Black River and examines the impact of flooding for a hypo-thetical case in which the eastern embankment would fail, releasing flood waters into Taum Sauk Creek located on the east side of Proffit Mountain. One-dimensional dynamic wave unsteady flow models were used to route the embankment fail-ure flood, thereby producing a flood hydrograph from the breach of the upper reservoir, down the western slope of Proffit Mountain, into the East Fork Black River, and further down-stream to the spillway of the lower reservoir. One-dimensional steady-state simulations produced flood profiles that were used in developing inundation maps for flood frequency estimates along the East Fork Black River just upstream from State High-way N, downstream to the spillway of the lower reservoir. A quantitative approach was used to roughly estimate the volume of debris movement, and to examine debris impacts along the East Fork Black River and within the lower reservoir.
Description of the Study Area
The Taum Sauk pump-storage hydroelectric power plant is located in Reynolds County, Missouri, approximately 2 mi north of Lesterville and approximately 90 mi southwest of St. Louis. The study area resides among the St. Francois mountains in the Ozark Plateau physiographic region, which is heavily wooded and rugged with narrow valleys, dendritic (tree-shaped) drainage, and main channel gradients steeper than else-where in Missouri. Elevations in this region range from about 800 to 1,700 ft (Alexander and Wilson, 1995). The upper reser-voir, on top of Proffit Mountain, has an average basin bottom elevation of approximately 1,505 ft. The lower reservoir is at the junction of the East Fork Black River and Taum Sauk Creek, and is impounded by a dam in the form of a concrete ogee spill-way across the East Fork Black River (fig. 1). Normal operating pool elevations for the lower reservoir range from 736 to 748 ft (M. Menne, Ameren UE, oral commun., 2006).
Analyses along the western side of Proffit Mountain were conducted along an 8,400-ft reach of an intermittent stream val-ley from the breach of the upper reservoir down the mountain to its intersection with the East Fork Black River. Analyses along the East Fork Black River were conducted along a 27,000-ft reach from a location just upstream from State Highway N, to the spillway of the lower reservoir. Analyses along Taum Sauk Creek were conducted along a 19,000-ft reach from an upstream location perpendicular to the east embankment of the upper reservoir, downstream to the spillway of the lower reservoir.
A USGS streamflow-gaging station located on the down-stream face of State Highway N over the East Fork Black River (fig. 1) has been in operation from October 2001 to September 2002, and from October 2003 to the current year (2006). The
Introduction 3
90°52' 90°50'30" 90°49' 90°47'30" 90°46'
37°29'30"
37°30'30"
37°31'30"
37°32'30"
37°33'30"
Bin wall
Johnson’s Shut-Ins
State Park
Prof
fitM
ount
ain
Upperreservoir
Lowerreservoir
Powerplant
Spillway
Shut-Ins
Taum
Sauk
Cre
ek
U
N 206
intermittent streamvalley
U.S. Geological Survey streamflow-gaging
station 07061270
U.S. Geological Survey streamflow-gaging
station 07061280
U.S. Geological Survey streamflow-gaging
station 070613003.7 miles downstream
from spillway
East F
ork
Black
Riv
er
Upstream location of19,000 foot study reach
Upstream location of27,000 foot study reach
MISSOURI
ReynoldsCounty
Base from Center for Agricultural, Resource and Environment Systems (CARES)Universal Transverse Mercator projection, Zone 15Horizontal coordinate information referenced to theNorth American Datum of 1983 (NAD 83)
St. Louis
LOCATION MAP
Figure 1. Location of Johnson’s Shut-Ins State Park boundary and Taum Sauk pump-storage hydroelectric power plant facility.
0 1 2 MILES
0 2 KILOMETERS
4 Peak Discharge and Flood Profile Accompanying the Taum Sauk Pump Storage Facility Failure near Lesterville, MO
90°50'50" 90°50'40" 90°50'30"
37°32'50"
37°33'
37°33'10"
StateHighway
N
0 0.06 0.12 MILES
0 0.06 0.12 KILOMETERS
Base from Surdex, Inc., proprietary to MACTEC Engineering and Consulting, Inc.One-half foot pixel resolution, January 2006Universal Transverse Mercator projection, Zone 15Horizontal coordinate information referenced to theNorth American Datum of 1983 (NAD 83)
Figure 2. Flood wave damage at base of Proffit Mountain and State Highway N.
Exposed foundation of park superintendent residence.
Tractor trailer washed off of State Highway N. Note the high water mark onthe cab of the truck (photograph courtesy of Ken Beck, Reynolds County Courier, 2005).
U.S. Geological Survey streamflow-gaging station and debris accumulation.
Flow
Introduction 5
90°50'30" 90°50' 90°49'30" 90°49'
37°32'
37°32'30"
37°33'
Figure 3. Stripped overburden as a result of flood wave force on the western slope of Proffit Mountain.
Exposed bedrock and assorted overburden.
Upperreservoir
Eas
t For
kB
lack
Riv
er
0 0.2 0.4 MILES
0 0.2 0.4 KILOMETERS
Base from Surdex, Inc., proprietary to MACTEC Engineering and Consulting, Inc.One-half foot pixel resolution, January 2006Universal Transverse Mercator projection, Zone 15Horizontal coordinate information referenced to theNorth American Datum of 1983 (NAD 83)
Boulders from upper reservoir embankment structure and interspersed overburden.
Exposed bedrock downstream from upper reservoir embankment breach.
6 Peak Discharge and Flood Profile Accompanying the Taum Sauk Pump Storage Facility Failure near Lesterville, MO
maximum recorded gage height of 838.6 ft occurred May 12, 2002, before a developed stage-discharge relation (Hauck and Nagel, 2002). The annual mean discharge recorded for the period of record is 79.4 ft3/s (cubic feet per second) (Hauck and Nagel, 2004).
Acknowledgments
The author thanks all personnel from the Missouri Department of Natural Resources that were involved with data collection, coordination, or provided guidance. The author also thanks Ameren UE and MACTEC Engineering and Consulting, Inc. for data sharing and data-collection support.
Reconnaissance and Data Collection
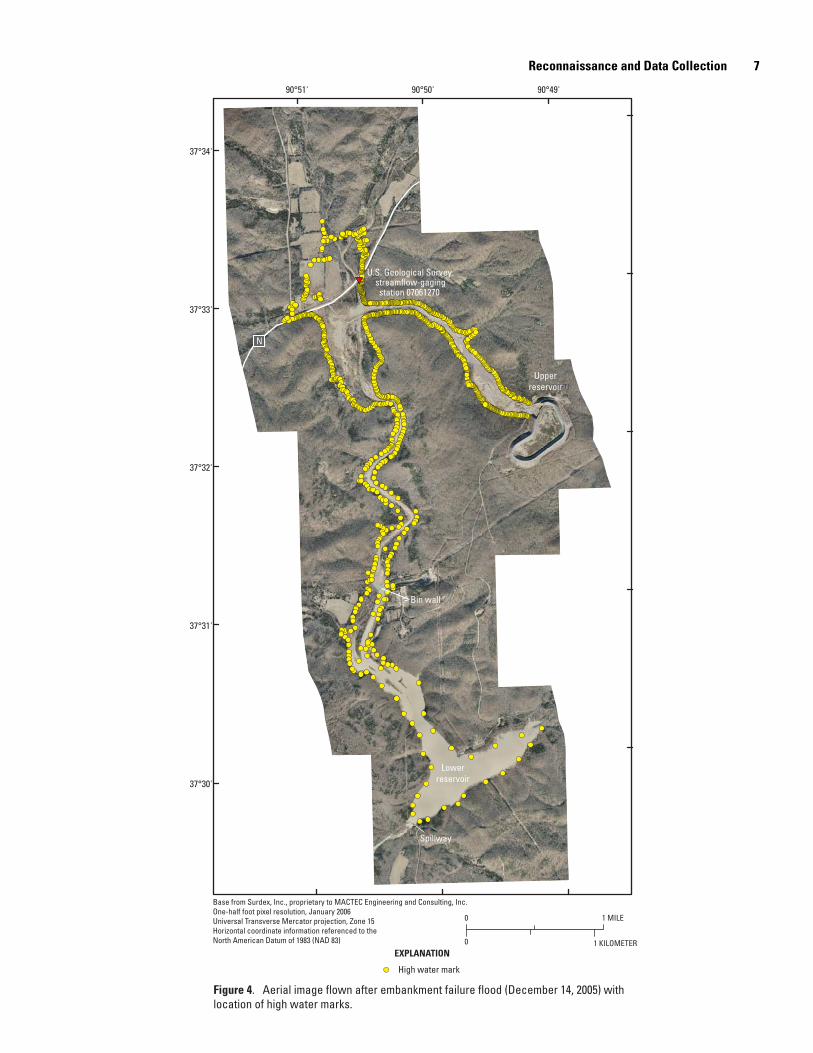
The failure of the upper reservoir presented a historic opportunity to conduct field assessments and gather data. Within hours of the failure, field crews were on site to document damage and monument high water marks from the upper reser-voir breach, down along the western side of Proffit Mountain, to a junction with the East Fork Black River. In addition, recon-naissance and high water monumentation were performed along the East Fork Black River from a location upstream from State Highway N, to the lower reservoir spillway (fig. 4). Digital film footage was used to document flood damage and help develop a conceptualization of flow behavior from the breach down to the lower reservoir.
A double peak was evident along the East Fork Black River during the monumentation of high water marks. The larger peak was from the part of the flood wave that flowed downstream after entering the floodplain at the base of Proffit Mountain. The second smaller peak was from a smaller part of the flood waters that initially moved upstream, overtopping a substantial part of State Highway N, submerging a culvert open-ing, and flowing upstream through the bridge over the East Fork Black River. The smaller secondary peak resulted when the flood waters above State Highway N flowed back through the culvert, bridge opening, and continued through Johnson’s Shut-Ins State Park. Areas of super-elevated water surfaces produced by centrifugal forces were evident from high water marks and the debris that was produced by the flow as it rushed down Prof-fit Mountain, built up against the opposing valley wall from the base of Proffit Mountain, and meandered downstream along the East Fork Black River. Left and right bank water-surface eleva-tion differences determined from high water marks ranged as high as 35 to 40 ft down Proffit Mountain, 12 to 20 ft across the valley floor at the base of Proffit Mountain, and as much as 7 ft through the Shut-Ins.
Aerial Topographic Survey
Light Detection and Ranging (LiDAR) derived mass points at an approximate ground spacing of 2.3 ft or better throughout a 31.5 mi2 (square mile) area (Sanborn Inc., written commun., 2005) were collected to define the land surface and structures. A digital elevation model (DEM) was completed at a vertical accu-racy of 0.5 ft Root Mean Square Error (RMSE) and a horizontal accuracy of 1.64 ft (RMSE) (Brostuen, 2006). The arrival of the LiDAR aircraft, data capture, and data completion occurred on December 16, 2004. The completed bald-earth DEM was avail-able within 2 weeks of the original data acquisition.
Geo-referenced and attributed contours were derived from the LiDAR data. Cross sections were cut from contours perpen-dicular to conceptualized flow paths and used for all hydraulic analyses. All cross sections provided necessary geometry for hydraulic modeling and indirect determinations of discharge using the slope-area method. Substantial modifications to chan-nel and floodplain geometry from the flood were assumed to have occurred on the rising limb of the hydrograph (before the peak); therefore, all indirect and hydraulic analyses of peak discharge used post-flood geometry. Contour data also served as the foun-dation for inundation mapping within this study. In addition, LiDAR data supported spatial and volumetric analysis of over-burden and debris by differencing the LiDAR DEM with a pre-existing 10-meter DEM based on 1:24,000-scale topography.
Ground Survey
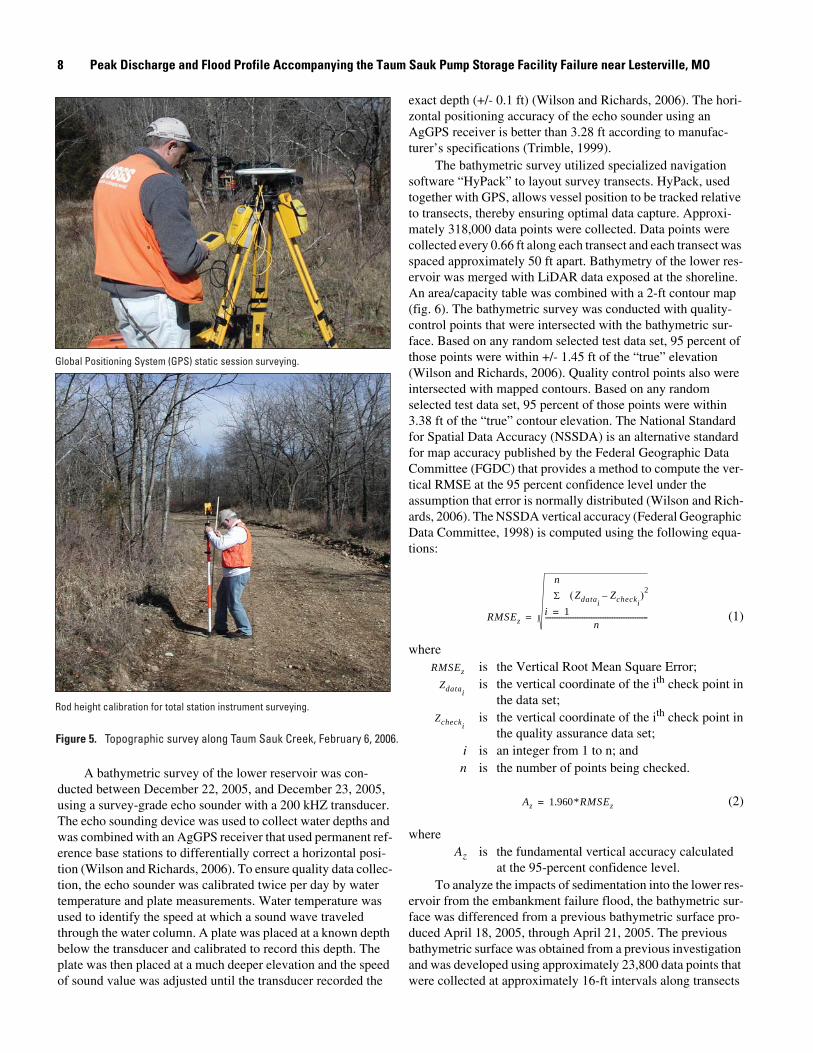
The Missouri Department of Natural Resources, Division of Geology and Land Survey (MDNR-DGLS), deployed staff to cor-relate approximately 885 monumented high water marks to datum. Global positioning system (GPS) surveying was used to establish survey control points throughout the reach that were referenced to horizontal and vertical datum. The majority of control was post processed using the National Geodetic Survey Online Positioning Users Service and local High Accuracy Network (HARN) stations (O. Lashley, Missouri Department of Natural Resources, Division of Geology and Land Survey, oral commun., 2006). Surveying using total station instrumentation established positioning and elevation from control points to high water marks.
Supplemental topographic surveys were conducted along Taum Sauk Creek, outside of the eastern limit of LiDAR data cap-ture. Topographic surveys along Taum Sauk Creek also utilized GPS and total station surveying, and were conducted to establish cross sections necessary for modeling and inundation mapping (fig. 5).
Lower Reservoir Bathymetry Survey
The embankment failure flood had large hydraulic head differences that imposed high shear stress that subsequently contributed to the transport of sediment and debris into the lower reservoir. An area/capacity table produced by a bathy-metric survey provided volumetric analysis, which helped in determining the impact of sedimentation.
Reconnaissance and Data Collection 7
N
High water mark
EXPLANATION
90°51' 90°50' 90°49'
37°30'
37°31'
37°32'
37°33'
37°34'
Base from Surdex, Inc., proprietary to MACTEC Engineering and Consulting, Inc.One-half foot pixel resolution, January 2006Universal Transverse Mercator projection, Zone 15Horizontal coordinate information referenced to theNorth American Datum of 1983 (NAD 83)
Figure 4. Aerial image flown after embankment failure flood (December 14, 2005) with location of high water marks.
0 1 MILE
0 1 KILOMETER
Bin wall
Spillway
U.S. Geological Survey streamflow-gaging
station 07061270
Upperreservoir
Upperreservoir
Lowerreservoir
8 Peak Discharge and Flood Profile Accompanying the Taum Sauk Pump Storage Facility Failure near Lesterville, MO
Figure 5. Topographic survey along Taum Sauk Creek, February 6, 2006.
Global Positioning System (GPS) static session surveying.
Rod height calibration for total station instrument surveying.
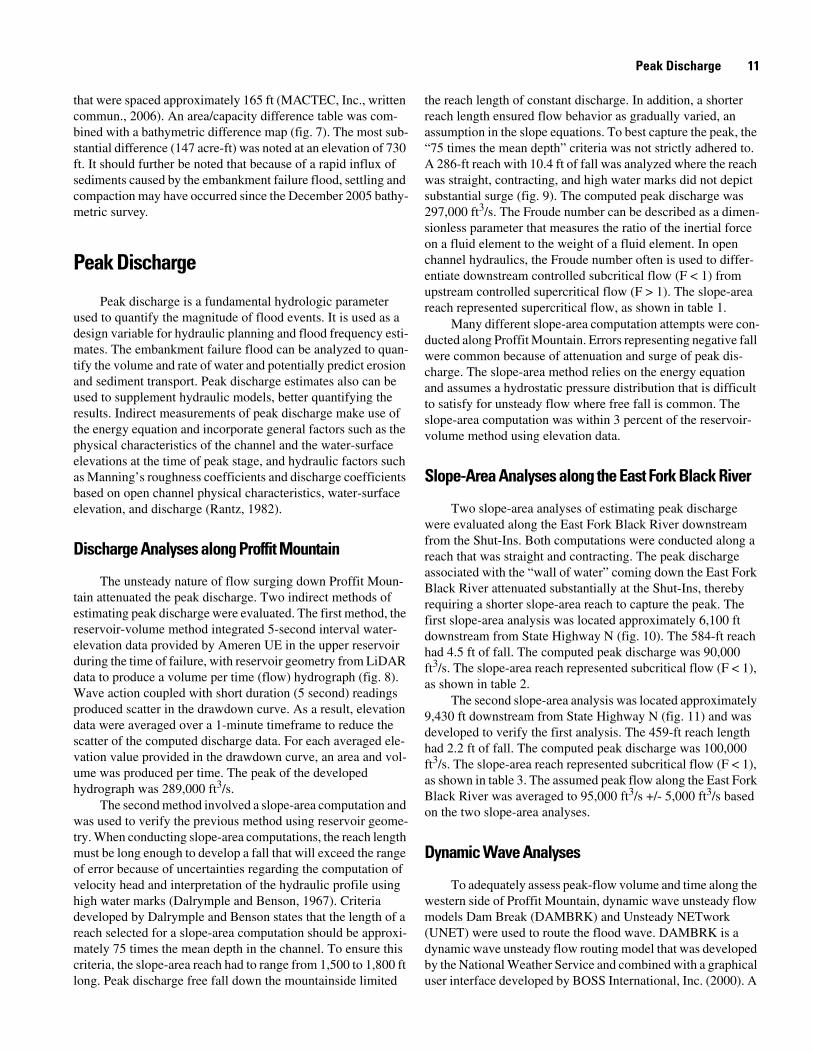
A bathymetric survey of the lower reservoir was con-ducted between December 22, 2005, and December 23, 2005, using a survey-grade echo sounder with a 200 kHZ transducer. The echo sounding device was used to collect water depths and was combined with an AgGPS receiver that used permanent ref-erence base stations to differentially correct a horizontal posi-tion (Wilson and Richards, 2006). To ensure quality data collec-tion, the echo sounder was calibrated twice per day by water temperature and plate measurements. Water temperature was used to identify the speed at which a sound wave traveled through the water column. A plate was placed at a known depth below the transducer and calibrated to record this depth. The plate was then placed at a much deeper elevation and the speed of sound value was adjusted until the transducer recorded the
exact depth (+/- 0.1 ft) (Wilson and Richards, 2006). The hori-zontal positioning accuracy of the echo sounder using an AgGPS receiver is better than 3.28 ft according to manufac-turer’s specifications (Trimble, 1999).
The bathymetric survey utilized specialized navigation software “HyPack” to layout survey transects. HyPack, used together with GPS, allows vessel position to be tracked relative to transects, thereby ensuring optimal data capture. Approxi-mately 318,000 data points were collected. Data points were collected every 0.66 ft along each transect and each transect was spaced approximately 50 ft apart. Bathymetry of the lower res-ervoir was merged with LiDAR data exposed at the shoreline. An area/capacity table was combined with a 2-ft contour map (fig. 6). The bathymetric survey was conducted with quality-control points that were intersected with the bathymetric sur-face. Based on any random selected test data set, 95 percent of those points were within +/- 1.45 ft of the “true” elevation (Wilson and Richards, 2006). Quality control points also were intersected with mapped contours. Based on any random selected test data set, 95 percent of those points were within 3.38 ft of the “true” contour elevation. The National Standard for Spatial Data Accuracy (NSSDA) is an alternative standard for map accuracy published by the Federal Geographic Data Committee (FGDC) that provides a method to compute the ver-tical RMSE at the 95 percent confidence level under the assumption that error is normally distributed (Wilson and Rich-ards, 2006). The NSSDA vertical accuracy (Federal Geographic Data Committee, 1998) is computed using the following equa-tions:
nΣ ( )Z –data Z 2
checki ii = 1RMSE = ----------------------------------------------------------z (1)
n
whereis the Vertical Root Mean Square Error;
is the vertical coordinate of the ith check point inthe data set;
is the vertical coordinate of the ith check point inthe quality assurance data set;
i is an integer from 1 to n; andn is the number of points being checked.
(2)
whereAz is the fundamental vertical accuracy calculated
at the 95-percent confidence level.To analyze the impacts of sedimentation into the lower res-
ervoir from the embankment failure flood, the bathymetric sur-face was differenced from a previous bathymetric surface pro-duced April 18, 2005, through April 21, 2005. The previous bathymetric surface was obtained from a previous investigation and was developed using approximately 23,800 data points that were collected at approximately 16-ft intervals along transects
RMSEz
Zdatai
Zchecki
A =z 1.960*RMSEz
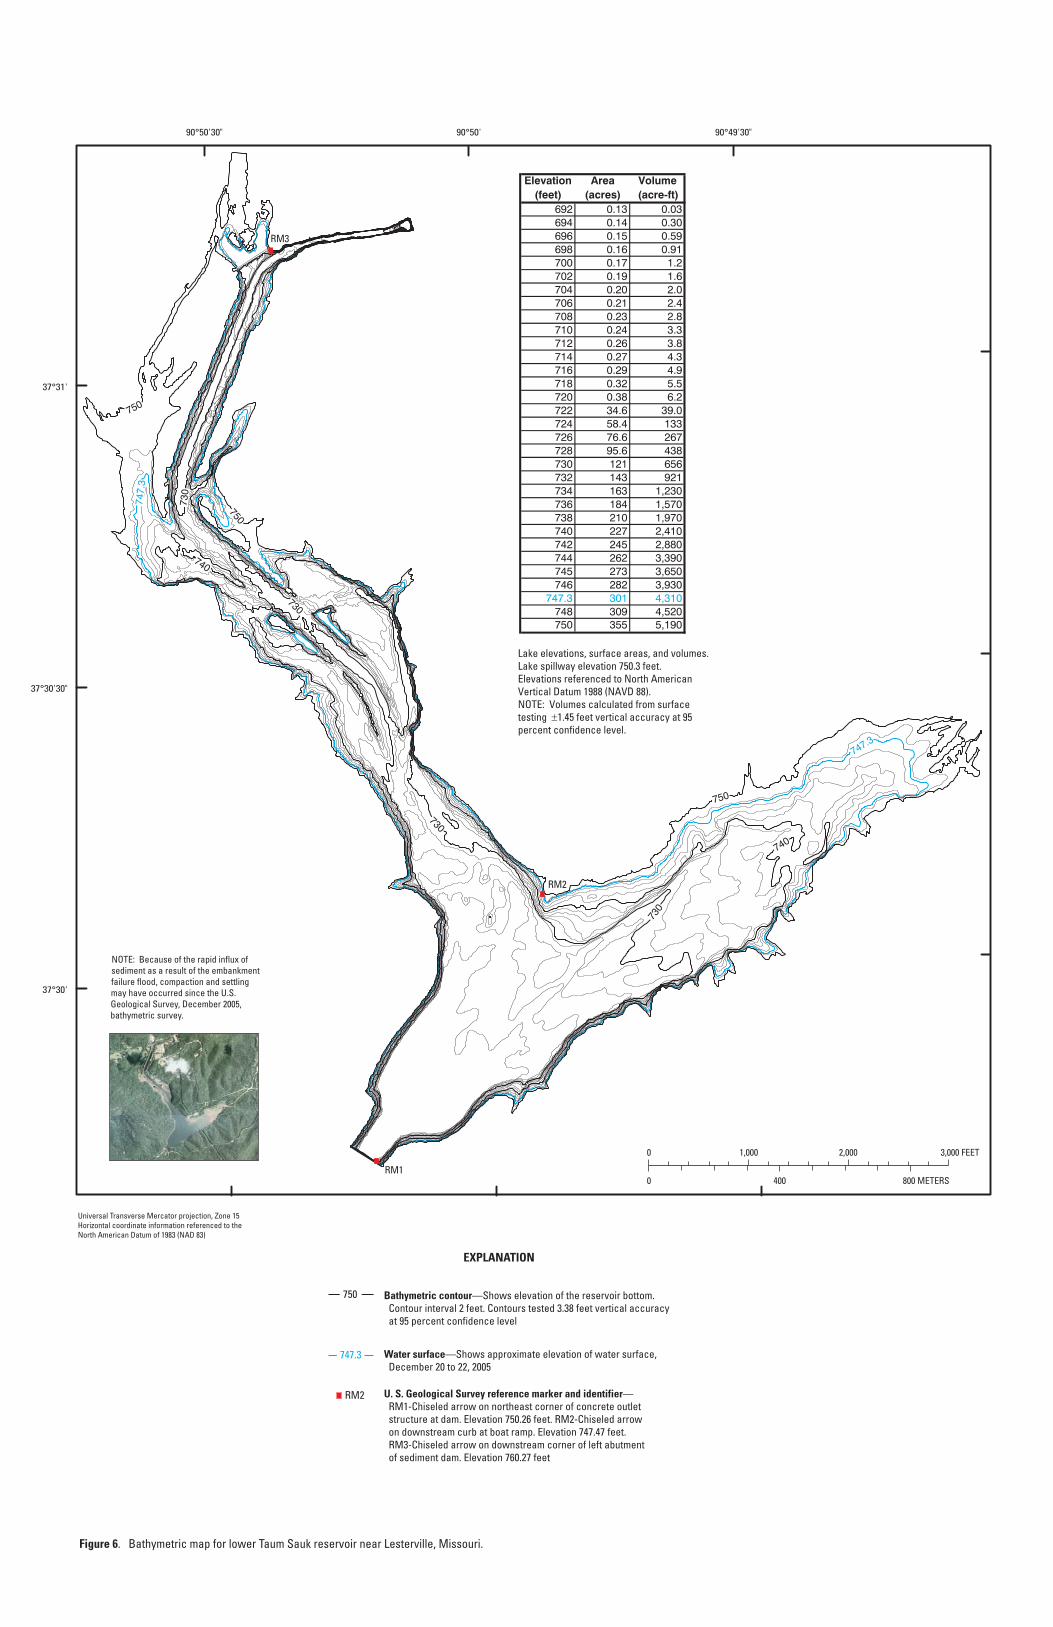
Elevation Area Volume(feet) (acres) (acre-ft)
692 0.13 0.03694 0.14 0.30696 0.15 0.59698 0.16 0.91700 0.17 1.2702 0.19 1.6704 0.20 2.0706 0.21 2.4708 0.23 2.8710 0.24 3.3712 0.26 3.8714 0.27 4.3716 0.29 4.9718 0.32 5.5720 0.38 6.2722 34.6 39.0724 58.4 133726 76.6 267728 95.6 438730 121 656732 143 921734 163 1,230736 184 1,570738 210 1,970740 227 2,410742 245 2,880744 262 3,390745 273 3,650746 282 3,930
747.3 301 4,310748 309 4,520750 355 5,190
Lake elevations, surface areas, and volumes.Lake spillway elevation 750.3 feet.Elevations referenced to North AmericanVertical Datum 1988 (NAVD 88).NOTE: Volumes calculated from surface testing ±1.45 feet vertical accuracy at 95percent confidence level.
EXPLANATION
Bathymetric contour—Shows elevation of the reservoir bottom. Contour interval 2 feet. Contours tested 3.38 feet vertical accuracy at 95 percent confidence level
Water surface—Shows approximate elevation of water surface, December 20 to 22, 2005
U. S. Geological Survey reference marker and identifier— RM1-Chiseled arrow on northeast corner of concrete outlet structure at dam. Elevation 750.26 feet. RM2-Chiseled arrow on downstream curb at boat ramp. Elevation 747.47 feet. RM3-Chiseled arrow on downstream corner of left abutment of sediment dam. Elevation 760.27 feet
750
747.3
Figure 6. Bathymetric map for lower Taum Sauk reservoir near Lesterville, Missouri.
Universal Transverse Mercator projection, Zone 15Horizontal coordinate information referenced to theNorth American Datum of 1983 (NAD 83)
NOTE: Because of the rapid influx of sediment as a result of the embankment failure flood, compaction and settling may have occurred since the U.S. Geological Survey, December 2005, bathymetric survey.
90°50'30" 90°50' 90°49'30"
37°30'
37°30'30"
37°31'
730
750
740
730
750
730730
730
740
750
747.3
747.
3
0 400 800 METERS
0 1,000 2,000 3,000 FEET
S
S
S
RM1
RM2
RM3
RM2
Peak Discharge 11
that were spaced approximately 165 ft (MACTEC, Inc., written commun., 2006). An area/capacity difference table was com-bined with a bathymetric difference map (fig. 7). The most sub-stantial difference (147 acre-ft) was noted at an elevation of 730 ft. It should further be noted that because of a rapid influx of sediments caused by the embankment failure flood, settling and compaction may have occurred since the December 2005 bathy-metric survey.
Peak Discharge
Peak discharge is a fundamental hydrologic parameter used to quantify the magnitude of flood events. It is used as a design variable for hydraulic planning and flood frequency esti-mates. The embankment failure flood can be analyzed to quan-tify the volume and rate of water and potentially predict erosion and sediment transport. Peak discharge estimates also can be used to supplement hydraulic models, better quantifying the results. Indirect measurements of peak discharge make use of the energy equation and incorporate general factors such as the physical characteristics of the channel and the water-surface elevations at the time of peak stage, and hydraulic factors such as Manning’s roughness coefficients and discharge coefficients based on open channel physical characteristics, water-surface elevation, and discharge (Rantz, 1982).
Discharge Analyses along Proffit Mountain
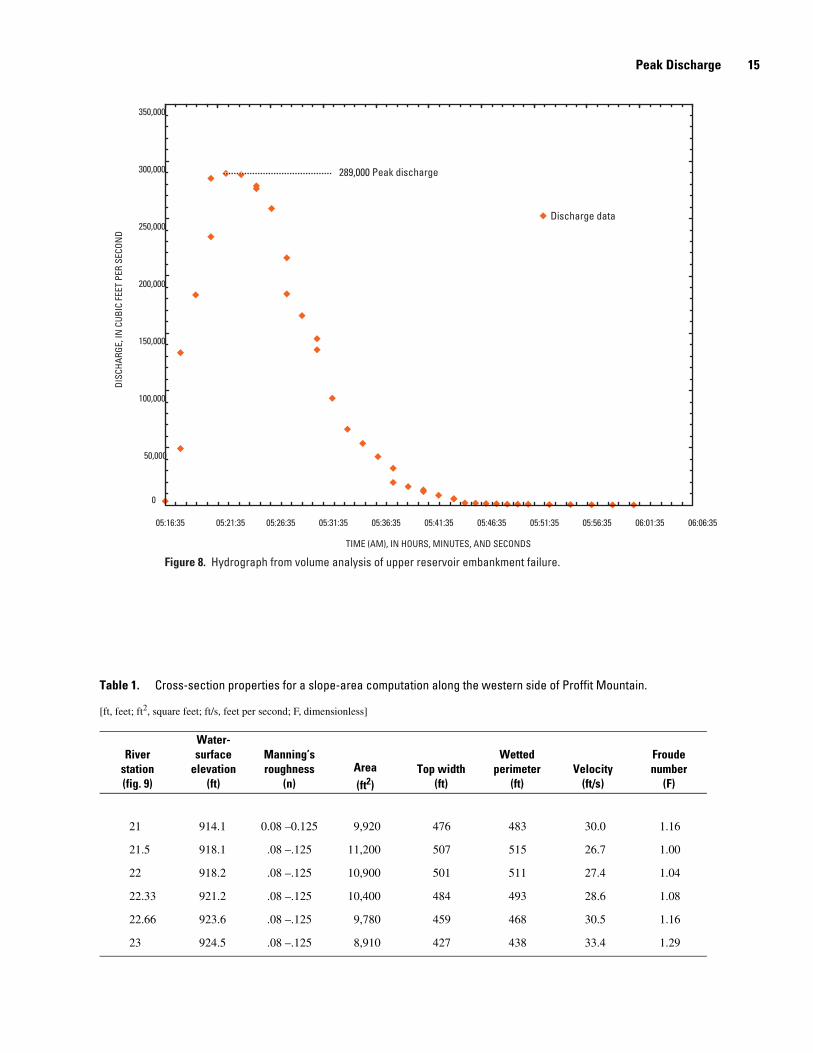
The unsteady nature of flow surging down Proffit Moun-tain attenuated the peak discharge. Two indirect methods of estimating peak discharge were evaluated. The first method, the reservoir-volume method integrated 5-second interval water-elevation data provided by Ameren UE in the upper reservoir during the time of failure, with reservoir geometry from LiDAR data to produce a volume per time (flow) hydrograph (fig. 8). Wave action coupled with short duration (5 second) readings produced scatter in the drawdown curve. As a result, elevation data were averaged over a 1-minute timeframe to reduce the scatter of the computed discharge data. For each averaged ele-vation value provided in the drawdown curve, an area and vol-ume was produced per time. The peak of the developed hydrograph was 289,000 ft3/s.
The second method involved a slope-area computation and was used to verify the previous method using reservoir geome-try. When conducting slope-area computations, the reach length must be long enough to develop a fall that will exceed the range of error because of uncertainties regarding the computation of velocity head and interpretation of the hydraulic profile using high water marks (Dalrymple and Benson, 1967). Criteria developed by Dalrymple and Benson states that the length of a reach selected for a slope-area computation should be approxi-mately 75 times the mean depth in the channel. To ensure this criteria, the slope-area reach had to range from 1,500 to 1,800 ft long. Peak discharge free fall down the mountainside limited
the reach length of constant discharge. In addition, a shorter reach length ensured flow behavior as gradually varied, an assumption in the slope equations. To best capture the peak, the “75 times the mean depth” criteria was not strictly adhered to. A 286-ft reach with 10.4 ft of fall was analyzed where the reach was straight, contracting, and high water marks did not depict substantial surge (fig. 9). The computed peak discharge was 297,000 ft3/s. The Froude number can be described as a dimen-sionless parameter that measures the ratio of the inertial force on a fluid element to the weight of a fluid element. In open channel hydraulics, the Froude number often is used to differ-entiate downstream controlled subcritical flow (F < 1) from upstream controlled supercritical flow (F > 1). The slope-area reach represented supercritical flow, as shown in table 1.
Many different slope-area computation attempts were con-ducted along Proffit Mountain. Errors representing negative fall were common because of attenuation and surge of peak dis-charge. The slope-area method relies on the energy equation and assumes a hydrostatic pressure distribution that is difficult to satisfy for unsteady flow where free fall is common. The slope-area computation was within 3 percent of the reservoir-volume method using elevation data.
Slope-Area Analyses along the East Fork Black River
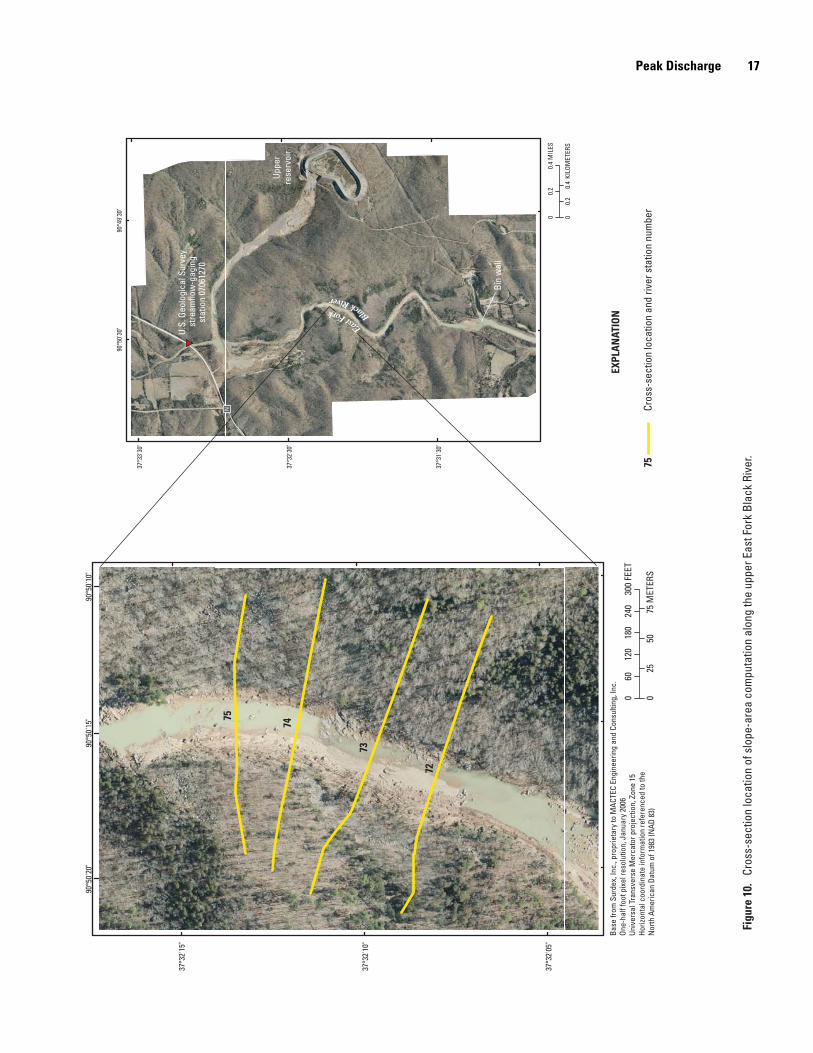
Two slope-area analyses of estimating peak discharge were evaluated along the East Fork Black River downstream from the Shut-Ins. Both computations were conducted along a reach that was straight and contracting. The peak discharge associated with the “wall of water” coming down the East Fork Black River attenuated substantially at the Shut-Ins, thereby requiring a shorter slope-area reach to capture the peak. The first slope-area analysis was located approximately 6,100 ft downstream from State Highway N (fig. 10). The 584-ft reach had 4.5 ft of fall. The computed peak discharge was 90,000 ft3/s. The slope-area reach represented subcritical flow (F < 1), as shown in table 2.
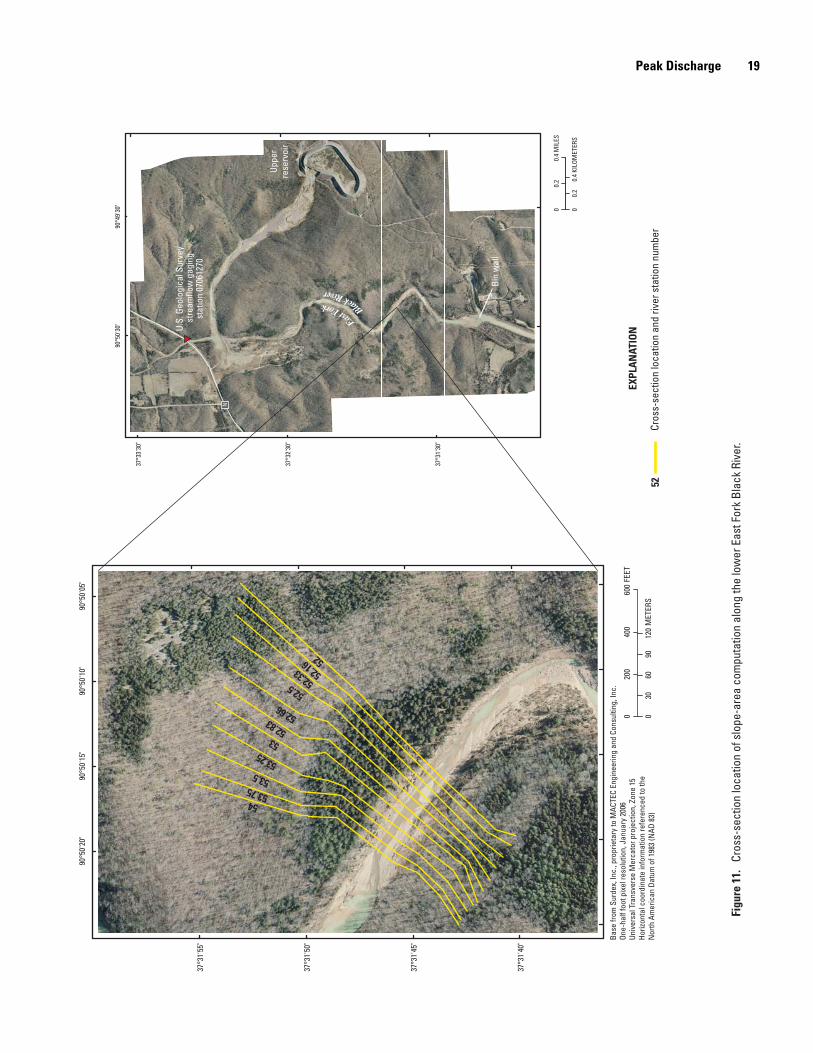
The second slope-area analysis was located approximately 9,430 ft downstream from State Highway N (fig. 11) and was developed to verify the first analysis. The 459-ft reach length had 2.2 ft of fall. The computed peak discharge was 100,000 ft3/s. The slope-area reach represented subcritical flow (F < 1), as shown in table 3. The assumed peak flow along the East Fork Black River was averaged to 95,000 ft3/s +/- 5,000 ft3/s based on the two slope-area analyses.
Dynamic Wave Analyses
To adequately assess peak-flow volume and time along the western side of Proffit Mountain, dynamic wave unsteady flow models Dam Break (DAMBRK) and Unsteady NETwork (UNET) were used to route the flood wave. DAMBRK is a dynamic wave unsteady flow routing model that was developed by the National Weather Service and combined with a graphical user interface developed by BOSS International, Inc. (2000). A
12 Peak Discharge and Flood Profile Accompanying the Taum Sauk Pump Storage Facility Failure near Lesterville, MO
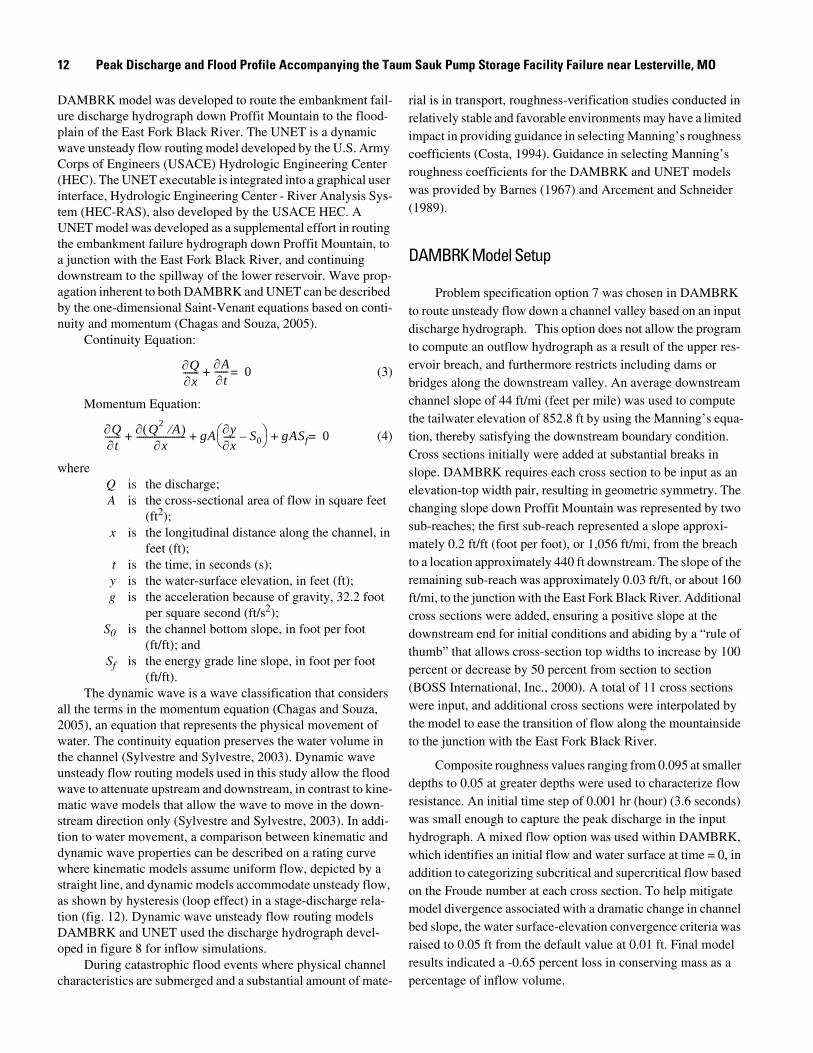
DAMBRK model was developed to route the embankment fail-ure discharge hydrograph down Proffit Mountain to the flood-plain of the East Fork Black River. The UNET is a dynamic wave unsteady flow routing model developed by the U.S. Army Corps of Engineers (USACE) Hydrologic Engineering Center (HEC). The UNET executable is integrated into a graphical user interface, Hydrologic Engineering Center - River Analysis Sys-tem (HEC-RAS), also developed by the USACE HEC. A UNET model was developed as a supplemental effort in routing the embankment failure hydrograph down Proffit Mountain, to a junction with the East Fork Black River, and continuing downstream to the spillway of the lower reservoir. Wave prop-agation inherent to both DAMBRK and UNET can be described by the one-dimensional Saint-Venant equations based on conti-nuity and momentum (Chagas and Souza, 2005).
Continuity Equation:
∂Q ∂A------- + ------= 0 (3)∂x ∂t
Momentum Equation:
∂Q ∂( )Q2 ⁄ A ⎛ ⎞∂y------- + +---------------------- gA ----- – S + gAS = 0 (4)∂t ∂x ⎝ ⎠∂x 0 f
whereQ is the discharge; A is the cross-sectional area of flow in square feet
(ft2);x is the longitudinal distance along the channel, in
feet (ft);t is the time, in seconds (s);y is the water-surface elevation, in feet (ft);g is the acceleration because of gravity, 32.2 foot
per square second (ft/s2);S0 is the channel bottom slope, in foot per foot
(ft/ft); andSf is the energy grade line slope, in foot per foot
(ft/ft).The dynamic wave is a wave classification that considers
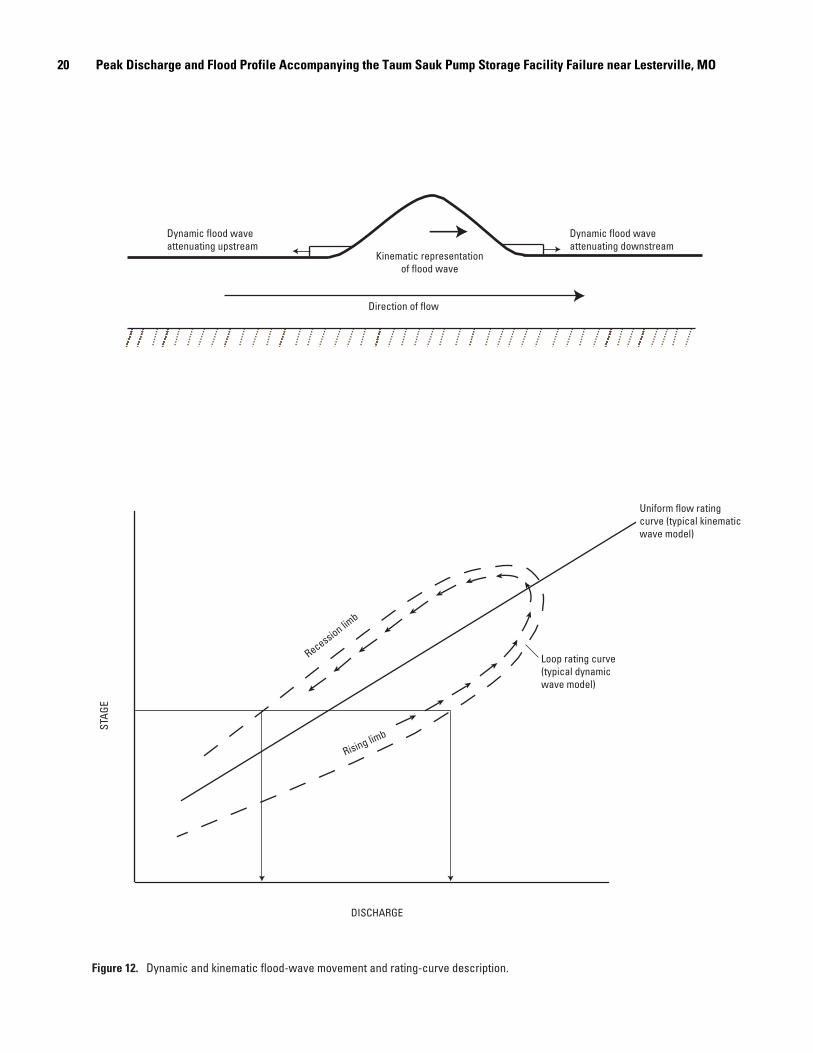
all the terms in the momentum equation (Chagas and Souza, 2005), an equation that represents the physical movement of water. The continuity equation preserves the water volume in the channel (Sylvestre and Sylvestre, 2003). Dynamic wave unsteady flow routing models used in this study allow the flood wave to attenuate upstream and downstream, in contrast to kine-matic wave models that allow the wave to move in the down-stream direction only (Sylvestre and Sylvestre, 2003). In addi-tion to water movement, a comparison between kinematic and dynamic wave properties can be described on a rating curve where kinematic models assume uniform flow, depicted by a straight line, and dynamic models accommodate unsteady flow, as shown by hysteresis (loop effect) in a stage-discharge rela-tion (fig. 12). Dynamic wave unsteady flow routing models DAMBRK and UNET used the discharge hydrograph devel-oped in figure 8 for inflow simulations.
During catastrophic flood events where physical channel characteristics are submerged and a substantial amount of mate-
rial is in transport, roughness-verification studies conducted in relatively stable and favorable environments may have a limited impact in providing guidance in selecting Manning’s roughness coefficients (Costa, 1994). Guidance in selecting Manning’s roughness coefficients for the DAMBRK and UNET models was provided by Barnes (1967) and Arcement and Schneider (1989).
DAMBRK Model Setup
Problem specification option 7 was chosen in DAMBRK to route unsteady flow down a channel valley based on an input discharge hydrograph. This option does not allow the program to compute an outflow hydrograph as a result of the upper res-ervoir breach, and furthermore restricts including dams or bridges along the downstream valley. An average downstream channel slope of 44 ft/mi (feet per mile) was used to compute the tailwater elevation of 852.8 ft by using the Manning’s equa-tion, thereby satisfying the downstream boundary condition. Cross sections initially were added at substantial breaks in slope. DAMBRK requires each cross section to be input as an elevation-top width pair, resulting in geometric symmetry. The changing slope down Proffit Mountain was represented by two sub-reaches; the first sub-reach represented a slope approxi-mately 0.2 ft/ft (foot per foot), or 1,056 ft/mi, from the breach to a location approximately 440 ft downstream. The slope of the remaining sub-reach was approximately 0.03 ft/ft, or about 160 ft/mi, to the junction with the East Fork Black River. Additional cross sections were added, ensuring a positive slope at the downstream end for initial conditions and abiding by a “rule of thumb” that allows cross-section top widths to increase by 100 percent or decrease by 50 percent from section to section (BOSS International, Inc., 2000). A total of 11 cross sections were input, and additional cross sections were interpolated by the model to ease the transition of flow along the mountainside to the junction with the East Fork Black River.
Composite roughness values ranging from 0.095 at smaller depths to 0.05 at greater depths were used to characterize flow resistance. An initial time step of 0.001 hr (hour) (3.6 seconds) was small enough to capture the peak discharge in the input hydrograph. A mixed flow option was used within DAMBRK, which identifies an initial flow and water surface at time = 0, in addition to categorizing subcritical and supercritical flow based on the Froude number at each cross section. To help mitigate model divergence associated with a dramatic change in channel bed slope, the water surface-elevation convergence criteria was raised to 0.05 ft from the default value at 0.01 ft. Final model results indicated a -0.65 percent loss in conserving mass as a percentage of inflow volume.
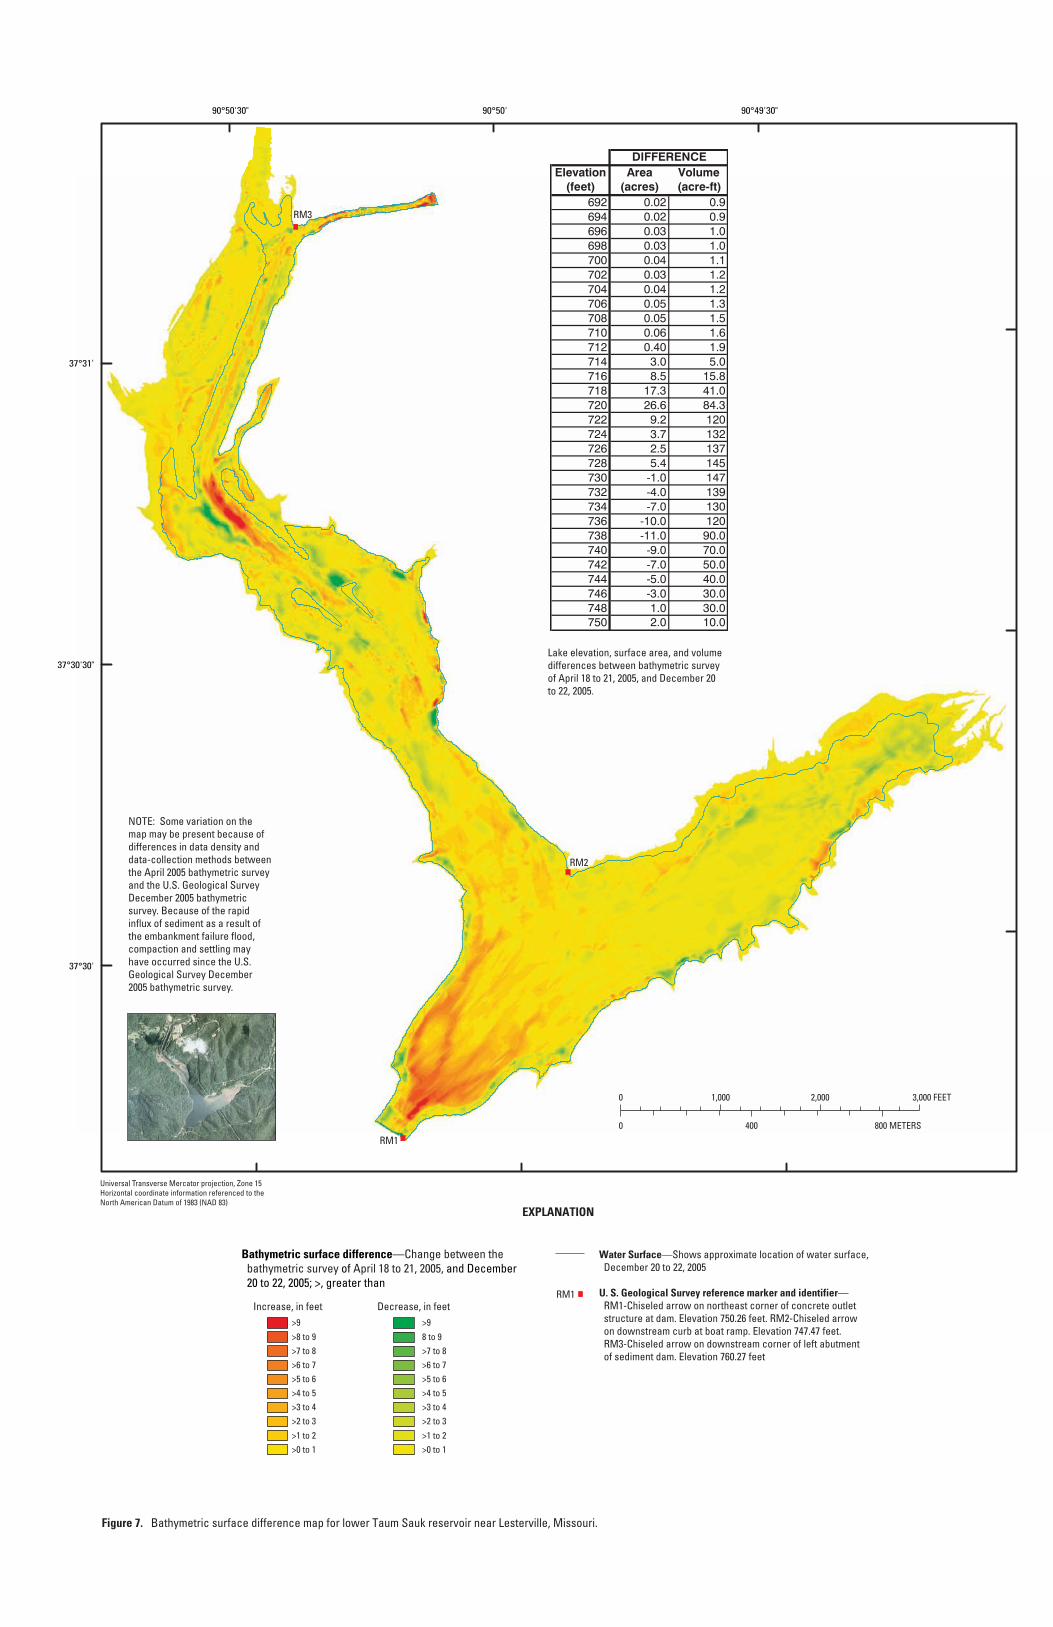
Figure 7. Bathymetric surface difference map for lower Taum Sauk reservoir near Lesterville, Missouri.
RM3
RM1
RM2
EXPLANATION
Water Surface—Shows approximate location of water surface, December 20 to 22, 2005
U. S. Geological Survey reference marker and identifier— RM1-Chiseled arrow on northeast corner of concrete outlet structure at dam. Elevation 750.26 feet. RM2-Chiseled arrow on downstream curb at boat ramp. Elevation 747.47 feet. RM3-Chiseled arrow on downstream corner of left abutment of sediment dam. Elevation 760.27 feet
>9>8 to 9>7 to 8>6 to 7>5 to 6>4 to 5>3 to 4>2 to 3>1 to 2>0 to 1
>98 to 9>7 to 8>6 to 7>5 to 6>4 to 5>3 to 4>2 to 3>1 to 2>0 to 1
Decrease, in feet
Bathymetric surface difference—Change between the bathymetric survey of April 18 to 21, 2005, and December 20 to 22, 2005; >, greater than
Increase, in feetSRM1
Universal Transverse Mercator projection, Zone 15Horizontal coordinate information referenced to theNorth American Datum of 1983 (NAD 83)
NOTE: Some variation on the map may be present because of differences in data density and data-collection methods between the April 2005 bathymetric survey and the U.S. Geological Survey December 2005 bathymetric survey. Because of the rapid influx of sediment as a result of the embankment failure flood, compaction and settling may have occurred since the U.S. Geological Survey December 2005 bathymetric survey.
Lake elevation, surface area, and volume differences between bathymetric survey of April 18 to 21, 2005, and December 20 to 22, 2005.
Elevation Area Volume(feet) (acres) (acre-ft)
692 0.02 0.9694 0.02 0.9696 0.03 1.0698 0.03 1.0700 0.04 1.1702 0.03 1.2704 0.04 1.2706 0.05 1.3708 0.05 1.5710 0.06 1.6712 0.40 1.9714 3.0 5.0716 8.5 15.8718 17.3 41.0720 26.6 84.3722 9.2 120724 3.7 132726 2.5 137728 5.4 145730 -1.0 147732 -4.0 139734 -7.0 130736 -10.0 120738 -11.0 90.0740 -9.0 70.0742 -7.0 50.0744 -5.0 40.0746 -3.0 30.0748 1.0 30.0750 2.0 10.0
DIFFERENCE
0 400 800 METERS
0 1,000 2,000 3,000 FEET
90°50'30" 90°50' 90°49'30"
37°30'
37°30'30"
37°31'
Peak Discharge 15
50,000
100,000
150,000
200,000
250,000
300,000
350,000
05:16:35 05:21:35 05:26:35 05:31:35 05:36:35 05:41:35 05:46:35 05:51:35 05:56:35 06:01:35 06:06:35
TIME (AM), IN HOURS, MINUTES, AND SECONDS
DISC
HARG
E, IN
CUB
IC F
EET
PER
SECO
ND
289,000 Peak discharge
Figure 8. Hydrograph from volume analysis of upper reservoir embankment failure.
Discharge data
0
Table 1. Cross-section properties for a slope-area computation along the western side of Proffit Mountain.
[ft, feet; ft2, square feet; ft/s, feet per second; F, dimensionless]
Water- River surface Manning’s Wetted Froude
station elevation roughness Area Top width perimeter Velocity number(fig. 9) (ft) (n) (ft2) (ft) (ft) (ft/s) (F)
21 914.1 0.08 –0.125 9,920 476 483 30.0 1.16
21.5 918.1 .08 –.125 11,200 507 515 26.7 1.00
22 918.2 .08 –.125 10,900 501 511 27.4 1.04
22.33 921.2 .08 –.125 10,400 484 493 28.6 1.08
22.66 923.6 .08 –.125 9,780 459 468 30.5 1.16
23 924.5 .08 –.125 8,910 427 438 33.4 1.29

16 Peak Discharge and Flood Profile Accompanying the Taum Sauk Pump Storage Facility Failure near Lesterville, MO90
°50'
90°4
9'55
"
37°3
2'50
"
37°3
2'55
"
090
180
270
360
FEET
020
4060
80 M
ETER
S
21
22
23
21.5
22.3
322
.66
Figu
re 9
. C
ross
-sec
tion
loca
tion
of s
lope
-are
a co
mpu
tatio
n al
ong
the
wes
tern
sid
e of
Pro
ffit M
ount
ain.
EXPL
AN
ATIO
N
Cros
s-se
ctio
n lo
catio
n an
d riv
er s
tatio
n nu
mbe
r23
Base
from
Sur
dex,
Inc.
, pro
prie
tary
to M
ACTE
C En
gine
erin
g an
d Co
nsul
ting,
Inc.
One-
half
foot
pix
el re
solu
tion,
Jan
uary
200
6Un
iver
sal T
rans
vers
e M
erca
tor p
roje
ctio
n, Z
one
15Ho
rizon
tal c
oord
inat
e in
form
atio
n re
fere
nced
to th
eN
orth
Am
eric
an D
atum
of 1
983
(NAD
83)
00.
20.
4 M
ILES
00.
20.
4 KI
LOM
ETER
S
90°5
0'30
"90
°49'
30"
37°3
2'30
"
37°3
3'30
"
37°3
1'30
"
Bin
wal
l
Uppe
rre
serv
oir
N
U.S.
Geo
logi
cal S
urve
y s
tream
flow
-gag
ing
stat
ion
0706
1270
EastFork BlackRiver
Peak Discharge 17
EXPL
AN
ATIO
N
Cros
s-se
ctio
n lo
catio
n an
d riv
er s
tatio
n nu
mbe
r75
Figu
re 1
0.
Cros
s-se
ctio
n lo
catio
n of
slo
pe-a
rea
com
puta
tion
alon
g th
e up
per E
ast F
ork
Blac
k Ri
ver.
90°5
0'30
"90
°49'
30"
37°3
1'30
"
37°3
2'30
"
37°3
3'30
"
00.
20.
4M
ILES
00.
20.
4KI
LOM
ETER
S
90°5
0'20
"90
°50'
15"
90°5
0'10
"
37°3
2'05
"
37°3
2'10
"
37°3
2'15
"
060
120
180
240
300
FEET
025
5075
MET
ERS
72
73
74
75
Base
from
Sur
dex,
Inc.
, pro
prie
tary
to M
ACTE
C En
gine
erin
g an
d Co
nsul
ting,
Inc.
One-
half
foot
pix
el re
solu
tion,
Jan
uary
200
6Un
iver
sal T
rans
vers
e M
erca
tor p
roje
ctio
n, Z
one
15Ho
rizon
tal c
oord
inat
e in
form
atio
n re
fere
nced
to th
eN
orth
Am
eric
an D
atum
of 1
983
(NAD
83)
Bin
wal
l
Uppe
rre
serv
oir
N
U.S.
Geo
logi
cal S
urve
y s
tream
flow
-gag
ing
stat
ion
0706
1270
EastFork BlackRiver
18 Peak Discharge and Flood Profile Accompanying the Taum Sauk Pump Storage Facility Failure near Lesterville, MO
Table 2. Cross-section properties for a slope-area computation along the East Fork Black River approximately 6,100 feet downstream from State Highway N.
[ft, feet; ft2, square feet; ft/s, feet per second; F, dimensionless]
River station(fig. 10)
Water-surface
elevation(ft)
Manning’sroughness
(n)Area(ft2)
Top width(ft)
Wettedperimeter
(ft)Velocity
(ft/s)
Froudenumber
(F)
72
73
74
75
804.5
806.2
805.5
809.0
0.05–0.088
.05–.088
.05–.09
.05–.09
6,210
6,130
5,410
6,110
346
329
286
283
354
336
295
294
14.4
14.6
16.6
14.7
0.60
.60
.67
.56
Table 3. Cross-section properties for a slope-area computation along the East Fork Black River approximately 9,430 feet downstream from State Highway N.
[ft, feet; ft2, square feet; ft/s, feet per second; F, dimensionless]
Water-River surface Manning’s Wetted Froude
station elevation roughness Area Top width perimeter Velocity number(fig. 11) (ft) (n) (ft2) (ft) (ft) (ft/s) (F)
52 782.2 0.045–0.115 11,700 963 976 8.5 0.43
52.16 782.2 .045–.115 11,400 965 975 8.7 .45
52.33 782.3 .045–.115 11,100 967 973 9.0 .47
52.50 782.4 .045–.115 10,800 960 964 9.2 .48
52.66 782.4 .045–.115 10,600 944 949 9.4 .50
52.83 782.4 .045–.115 10,400 938 944 9.6 .51
53 782.5 .045–.115 10,200 939 945 9.8 .53
53.25 782.9 .045–.115 9,760 894 899 10.2 .55
53.5 783.4 .045–.115 9,450 849 853 10.6 .56
53.75 783.8 .045–.115 9,070 803 807 11.0 .58
54 784.4 .045–.115 8,800 757 761 11.3 .59
UNET Model Setup
The UNET model used three reaches to represent the chan-nel from the embankment failure to the lower reservoir on the East Fork Black River. The first reach along Proffit Mountain began just below the breach of the upper reservoir and ended at the junction with the East Fork Black River. The second reach along the East Fork Black River began approximately 760 ft upstream from State Highway N, and ended downstream at the
junction with the Proffit Mountain reach. The third reach along the East Fork Black River began at the junction and ended at the spillway of the lower reservoir. The model incorporated 42 cross sections along the first reach, 5 cross sections along the second reach, and 109 cross sections along the third reach. All cross sections were taken directly from pre- and post-process-ing software known as BOSS RiverCAD (BOSS International, Inc., 2000).
Peak Discharge 19
EXPL
AN
ATIO
N
Cros
s-se
ctio
n lo
catio
n an
d riv
er s
tatio
n nu
mbe
r52
Figu
re 1
1.
Cros
s-se
ctio
n lo
catio
n of
slo
pe-a
rea
com
puta
tion
alon
g th
e lo
wer
Eas
t For
k Bl
ack
Rive
r.
90°5
0'20
"90
°50'
15"
90°5
0'10
"90
°50'
05"
37°3
1'40
"
37°3
1'45
"
37°3
1'50
"
37°3
1'55
"
020
040
060
0FE
ET
030
6090
120
MET
ERS
5252.
16
52.33
52.5
52.66
52.83
53
53.25
53.5
53.7554
Base
from
Sur
dex,
Inc.
, pro
prie
tary
to M
ACTE
C En
gine
erin
g an
d Co
nsul
ting,
Inc.
One-
half
foot
pix
el re
solu
tion,
Jan
uary
200
6Un
iver
sal T
rans
vers
e M
erca
tor p
roje
ctio
n, Z
one
15Ho
rizon
tal c
oord
inat
e in
form
atio
n re
fere
nced
to th
eN
orth
Am
eric
an D
atum
of 1
983
(NAD
83)
90°5
0'30
"90
°49'
30"
37°3
1'30
"
37°3
2'30
"
37°3
3'30
"
00.
20.
4 M
ILES
00.
20.
4 KI
LOM
ETER
S
Bin
wal
l
Uppe
rre
serv
oir
N
U.S.
Geo
logi
cal S
urve
y s
tream
flow
gag
ing
stat
ion
0706
1270
EastFork BlackRiver
20 Peak Discharge and Flood Profile Accompanying the Taum Sauk Pump Storage Facility Failure near Lesterville, MO
DISCHARGE
STAG
E
Rising limb
Recession limb
Kinematic representationof flood wave
Dynamic flood waveattenuating upstream
Dynamic flood waveattenuating downstream
Uniform flow rating curve (typical kinematic wave model)
Loop rating curve (typical dynamic wave model)
Figure 12. Dynamic and kinematic flood-wave movement and rating-curve description.
Direction of flow
Peak Discharge 21
Two hydraulic structures and one storage area were devel-oped for the UNET model. The State Highway N crossing and a “bin wall” (fig. 1) used to prevent debris and sediment from entering the lower reservoir were simulated as a bridge and weir, respectively, in the model. The east arm (Taum Sauk Creek) of the lower reservoir was modeled as a storage area. Manning’s roughness values along the Proffit Mountain reach ranged from 0.08 to 0.125. Roughness values ranged from 0.045 to 0.125 along the East Fork Black River down to the lower reservoir. Roughness values representing the basin of the lower reservoir ranged from 0.03 to 0.045. Coefficients used to accommodate energy losses within a reach ranged from 0.1 to 0.5 for contraction and 0.2 to 0.5 for expansion along the Proffit Mountain reach and the East Fork Black River. An initial time step of 0.0028 hrs (10 seconds) was optimal in ensuring model convergence and capture of the peak discharge within the input hydrograph.
A mixed flow regime was selected for UNET model runs. The mixed flow regime utilizes the momentum equation (eq. 4) and breaks it down into a dynamic component as the momentum of flow is passing through the channel cross section per unit time, and a static component as a force exerted by the hydro-static pressure of the water (Chow, 1959). The sum of the two components is called the specific force which is used to deter-mine which flow regime is controlling (Brunner, 2002).
Model Limitations
Simulations using DAMBRK and UNET were conducted to represent flow dynamics in a natural environment. Flow modeling accuracy can be attributed to the physical representa-tion of the fluvial system and man-made hydraulic structures. Model geometry limitations can be related to the vertical and horizontal accuracy of LiDAR data previously discussed. High water marks and the input flow hydrograph used to calibrate DAMBRK and UNET have inherent error. The quality of foren-sic evidence can vary depending on flow dynamics and recov-ered debris at a particular high water location. The computation of volume for a given stage in the upper reservoir was based on the quality of LiDAR data and accuracy of stage sensors in determining the input flow hydrograph (reservoir-volume method) used in both models.
One dimensional unsteady flow models DAMBRK and UNET approximate flow in a one-dimensional plane at each cross section. These models may be less robust for complicated flow patterns in river reaches characteristic of complex topog-raphy and extreme turbulence.
Peak Discharge and Shear Stress Estimates
DAMBRK and UNET models were calibrated to high water marks and used to identify peak-flow characteristics along the western side of Proffit Mountain (fig. 13). UNET and Steady NETwork (SNET) models were calibrated to high water marks along the East Fork Black River (fig. 14). Simulated
flood-wave arrival time from the breach to the junction with the East Fork Black River was 5.5 minutes using DAMBRK, and 6.0 minutes using UNET. The UNET model predicted the flood wave took approximately 29 minutes to reach the lower reser-voir from the breach. Stage data from pressure transducers on the spillway of the lower reservoir, owned and operated by Ameren UE, indicated filling of the lower reservoir at 5:46 am (approximately 30 minutes from the time of the breach). Stage hydrographs depicting peak stage for DAMBRK and UNET fell above and below the averaged high water mark near the location of the breach and the junction with the East Fork Black River (fig. 15). Peak discharges from DAMBRK and UNET models were within 0.5 percent from one another approximately 1 mi upstream from the junction, 2 percent from one another approx-imately one-half mi upstream from the junction, and 5 percent from one another at the junction with the East Fork Black River (fig. 16).
Shear stress can be expressed as a tangential hydrody-namic force per unit area that is important in designing channel stability and providing a threshold for initiation of sediment transport. Described for uniform flow conditions, this hydrody-namic force is equal to the effective component of the drag force acting on the body of water, parallel to the channel bottom (Chow, 1959). As applied to wetted perimeter, shear stress can be expressed as:
τo= γRS (5)
where
τo is the mean boundary shear stress, in pounds per square feet (lb/ft2);
γ is the unit weight of water, at 62.4 pounds percubic feet (62.4 lb/ft3);
R is the hydraulic radius, in feet (ft); and
S is the average bottom slope, in foot per foot (ft/ft).
Broken sections of the concrete parapet surrounding the upper reservoir, boulders, and large trees were transported as a result of the embankment failure. Rock riprap with a median diameter of 1 ft is recommended to protect highway ditches from erosion by flows that exhibit a shear stress of approxi-mately 4.8 lb/ft2 (pounds per square feet) or less (Federal High-way Administration, 2006). The average shear stress along the western side of Proffit Mountain was approximately 40 lb/ft2. Approximately 950 ft downstream from the breach, shear stress peaked at 232 lb/ft2. Using permissible shear stress equations developed by the Federal Highway Administration, peak shear stress of 232 lb/ft2 would require riprap with a median diameter of approximately 15 ft to prevent erosion (Federal Highway Administration, 2006). Upstream from the lower reservoir, the average shear stress along the East Fork Black River was approximately 4 lb/ft2. Shear stress peaked within the Shut-Ins at 144 lb/ft2, approximately 5,700 ft downstream from State Highway N. Channel sections just downstream from the breach, the junction of Proffit Mountain with the East Fork Black River,
22 Peak Discharge and Flood Profile Accompanying the Taum Sauk Pump Storage Facility Failure near Lesterville, MO
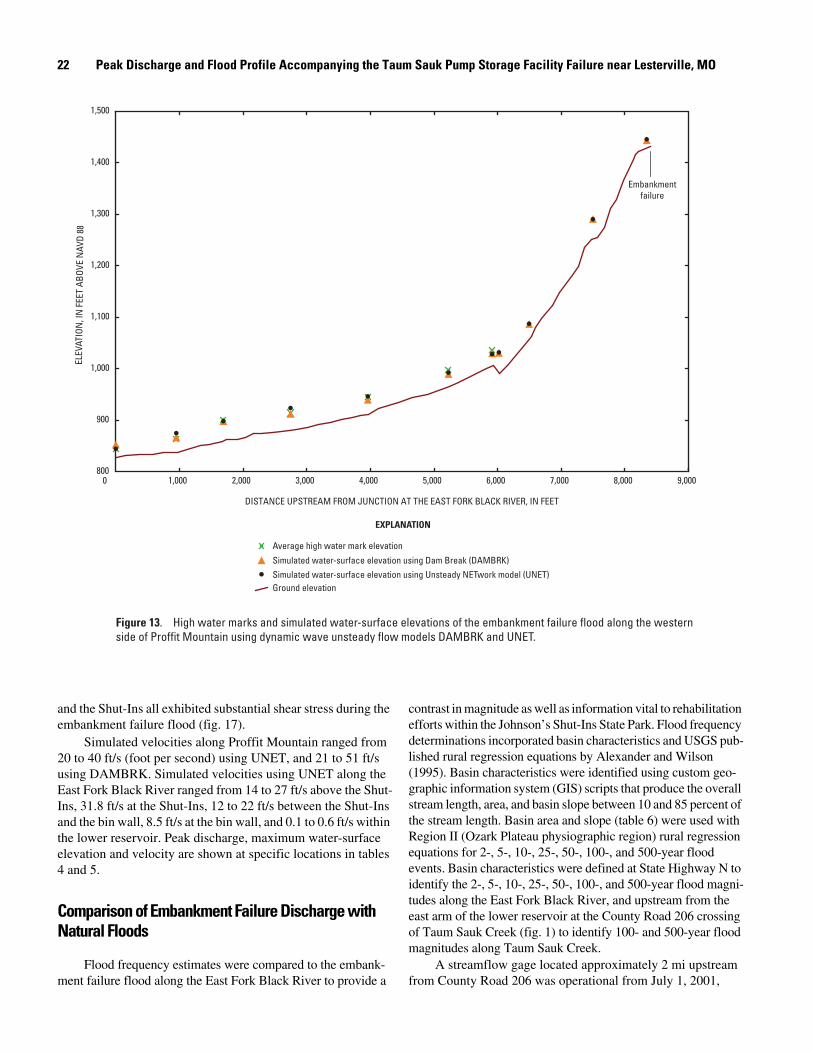
Figure 13. High water marks and simulated water-surface elevations of the embankment failure flood along the western side of Proffit Mountain using dynamic wave unsteady flow models DAMBRK and UNET.
800
900
1,000
1,100
1,200
1,300
1,400
1,500
0 1,000 2,000 3,000 4,000 5,000 6,000 7,000 8,000 9,000
DISTANCE UPSTREAM FROM JUNCTION AT THE EAST FORK BLACK RIVER, IN FEET
Embankmentfailure
ELEV
ATIO
N, I
N F
EET
ABOV
E N
AVD
88
EXPLANATION
Simulated water-surface elevation using Dam Break (DAMBRK) Simulated water-surface elevation using Unsteady NETwork model (UNET)
Average high water mark elevation
Ground elevation
and the Shut-Ins all exhibited substantial shear stress during the embankment failure flood (fig. 17).
Simulated velocities along Proffit Mountain ranged from 20 to 40 ft/s (foot per second) using UNET, and 21 to 51 ft/s using DAMBRK. Simulated velocities using UNET along the East Fork Black River ranged from 14 to 27 ft/s above the Shut-Ins, 31.8 ft/s at the Shut-Ins, 12 to 22 ft/s between the Shut-Ins and the bin wall, 8.5 ft/s at the bin wall, and 0.1 to 0.6 ft/s within the lower reservoir. Peak discharge, maximum water-surface elevation and velocity are shown at specific locations in tables 4 and 5.
Comparison of Embankment Failure Discharge with Natural Floods
Flood frequency estimates were compared to the embank-ment failure flood along the East Fork Black River to provide a
contrast in magnitude as well as information vital to rehabilitation efforts within the Johnson’s Shut-Ins State Park. Flood frequency determinations incorporated basin characteristics and USGS pub-lished rural regression equations by Alexander and Wilson (1995). Basin characteristics were identified using custom geo-graphic information system (GIS) scripts that produce the overall stream length, area, and basin slope between 10 and 85 percent of the stream length. Basin area and slope (table 6) were used with Region II (Ozark Plateau physiographic region) rural regression equations for 2-, 5-, 10-, 25-, 50-, 100-, and 500-year flood events. Basin characteristics were defined at State Highway N to identify the 2-, 5-, 10-, 25-, 50-, 100-, and 500-year flood magni-tudes along the East Fork Black River, and upstream from the east arm of the lower reservoir at the County Road 206 crossing of Taum Sauk Creek (fig. 1) to identify 100- and 500-year flood magnitudes along Taum Sauk Creek.
A streamflow gage located approximately 2 mi upstream from County Road 206 was operational from July 1, 2001,
Embankment Failure Profiles and Natural Flood Profiles 23
Shut-InsBin wall
State Highway N
Spillway crestlocation at
lower reservoir
EXPLANATION
Average high water mark elevation Simulated water-surface elevation using Unsteady NETwork model (UNET)Ground elevationSimulated water-surface elevation using Steady NETwork model (SNET)
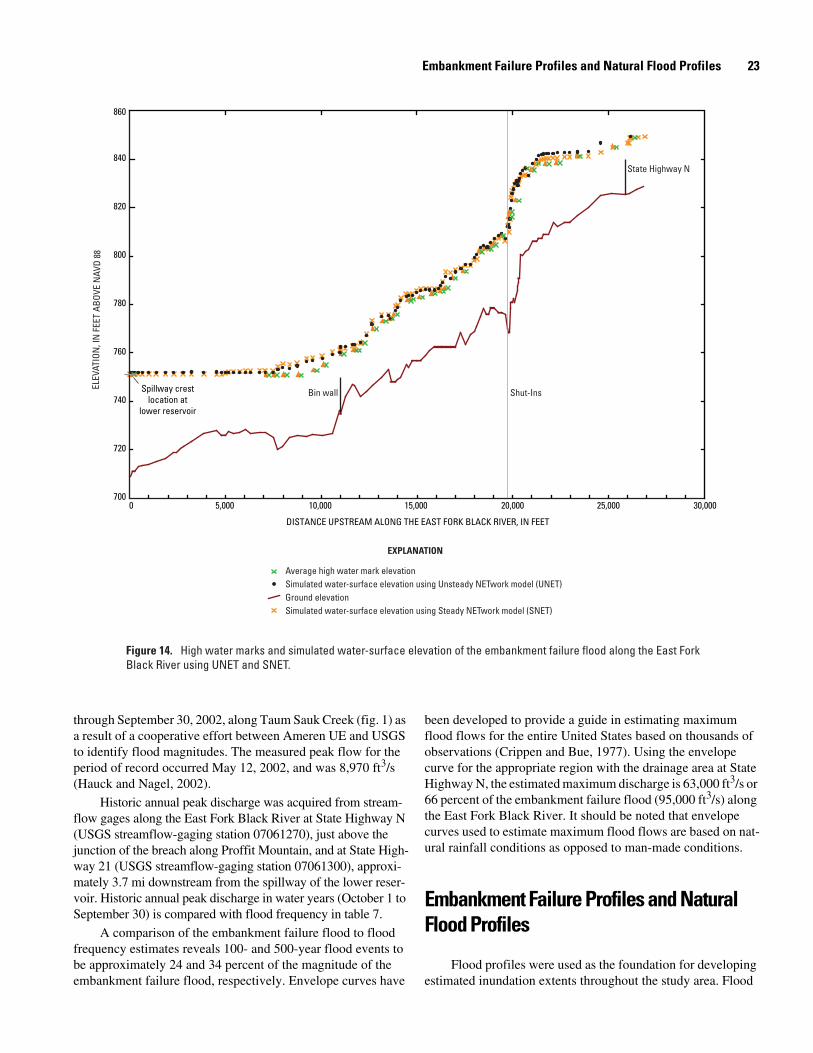
Figure 14. High water marks and simulated water-surface elevation of the embankment failure flood along the East Fork Black River using UNET and SNET.
700
720
740
760
780
800
820
840
860
0 5,000 10,000 15,000 20,000 25,000 30,000
DISTANCE UPSTREAM ALONG THE EAST FORK BLACK RIVER, IN FEET
ELEV
ATIO
N, I
N F
EET
ABOV
E N
AVD
88
through September 30, 2002, along Taum Sauk Creek (fig. 1) as a result of a cooperative effort between Ameren UE and USGS to identify flood magnitudes. The measured peak flow for the period of record occurred May 12, 2002, and was 8,970 ft3/s (Hauck and Nagel, 2002).
Historic annual peak discharge was acquired from stream-flow gages along the East Fork Black River at State Highway N (USGS streamflow-gaging station 07061270), just above the junction of the breach along Proffit Mountain, and at State High-way 21 (USGS streamflow-gaging station 07061300), approxi-mately 3.7 mi downstream from the spillway of the lower reser-voir. Historic annual peak discharge in water years (October 1 to September 30) is compared with flood frequency in table 7.
A comparison of the embankment failure flood to flood frequency estimates reveals 100- and 500-year flood events to be approximately 24 and 34 percent of the magnitude of the embankment failure flood, respectively. Envelope curves have
been developed to provide a guide in estimating maximum flood flows for the entire United States based on thousands of observations (Crippen and Bue, 1977). Using the envelope curve for the appropriate region with the drainage area at State Highway N, the estimated maximum discharge is 63,000 ft3/s or 66 percent of the embankment failure flood (95,000 ft3/s) along the East Fork Black River. It should be noted that envelope curves used to estimate maximum flood flows are based on nat-ural rainfall conditions as opposed to man-made conditions.
Embankment Failure Profiles and Natural Flood Profiles
Flood profiles were used as the foundation for developing estimated inundation extents throughout the study area. Flood

24 Peak Discharge and Flood Profile Accompanying the Taum Sauk Pump Storage Facility Failure near Lesterville, MO
848.5
1,448
1,430
1,435
1,440
1,445
1,450
1,455
5:16:35 5:22:35 5:28:35 5:34:35 5:40:35 5:46:35 5:52:35 5:58:35 6:04:35 6:10:35 6:16:35
830
835
840
845
850
855
5:16:35 5:28:35 5:40:35 5:52:35 6:04:35 6:16:35 6:28:35 6:40:35 6:52:35 7:04:35
0
500,00
100,000
150,000
200,000
250,000
300,000
350,000
5:16:35 5:22:35 5:28:35 5:34:35 5:40:35 5:46:35 5:52:35 5:58:35 6:04:35 6:10:35 6:16:35
LOCATION AT THE DOWNSTREAM ENDOF EMBANKMENT FAILURE
LOCATION AT THE JUNCTION OF THEEAST FORK BLACK RIVER
LOCATION AT THE JUNCTION OF THEEAST FORK BLACK RIVER
EXPLANATION
Averaged high water mark elevation
Simulated hydrograph using Dam Break (DAMBRK)
Simulated hydrograph using Unsteady NETwork model (UNET)
Figure 15. Stage and flow hydrographs depicting dynamic wave unsteady flow models DAMBRK and UNET along Proffit Mountain.
ELEV
ATIO
N, I
N F
EET
ABOV
E N
AVD
88
TIME (AM), IN HOURS, MINUTES, AND SECONDS
INST
ANTA
NEO
US P
EAK
DISC
HARG
E,
IN C
UBIC
FEE
T PE
R SE
CON
D

Embankment Failure Profiles and Natural Flood Profiles 25
EXPLANATION
Routed peak discharge using Unsteady NETwork model (UNET)
Routed peak discharge using Dam Break (DAMBRK)
Figure 16. Peak discharge summary for the embankment failure flood along the western side of Proffit Mountain.
DISC
HARG
E AT
MAX
IMUM
WAT
ER-S
URFA
CE E
LEVA
TION
, IN
CUB
IC F
EET
PER
SECO
ND
270,000
280,000
290,000
300,000
DISTANCE UPSTREAM FROM JUNCTION AT THE EAST FORK BLACK RIVER, IN FEET
0 1,000 2,000 3,000 4,000 5,000 6,000 7,000 8,000 9,000
Embankmentfailure
Table 4. Simulated flow at maximum water-surface elevation at specific locations along the western side of Proffit Mountain.
[DAMBRK; Dam Break; UNET; Unsteady NETwork model; ft, feet; ft3/s, cubic feet per second; ft/s, feet per second]
DAMBRK UNET
Water- Water-Distance Peak surface Peak surface
from failure discharge elevation Velocity discharge elevation VelocityLocation (ft) (ft3/s) (ft) (ft/s) (ft3/s) (ft) (ft/s)
Downstream end of 0 290,000 1444.5 35.8 290,000 1,450.9 34.7embankment failure
Slope-area river 5,150 289,000 917.9 31.8 284,000 925.5 32.5station 23
Junction with East 8,170 287,000 852.8 51.3 274,000 846.6 40.0Fork Black River
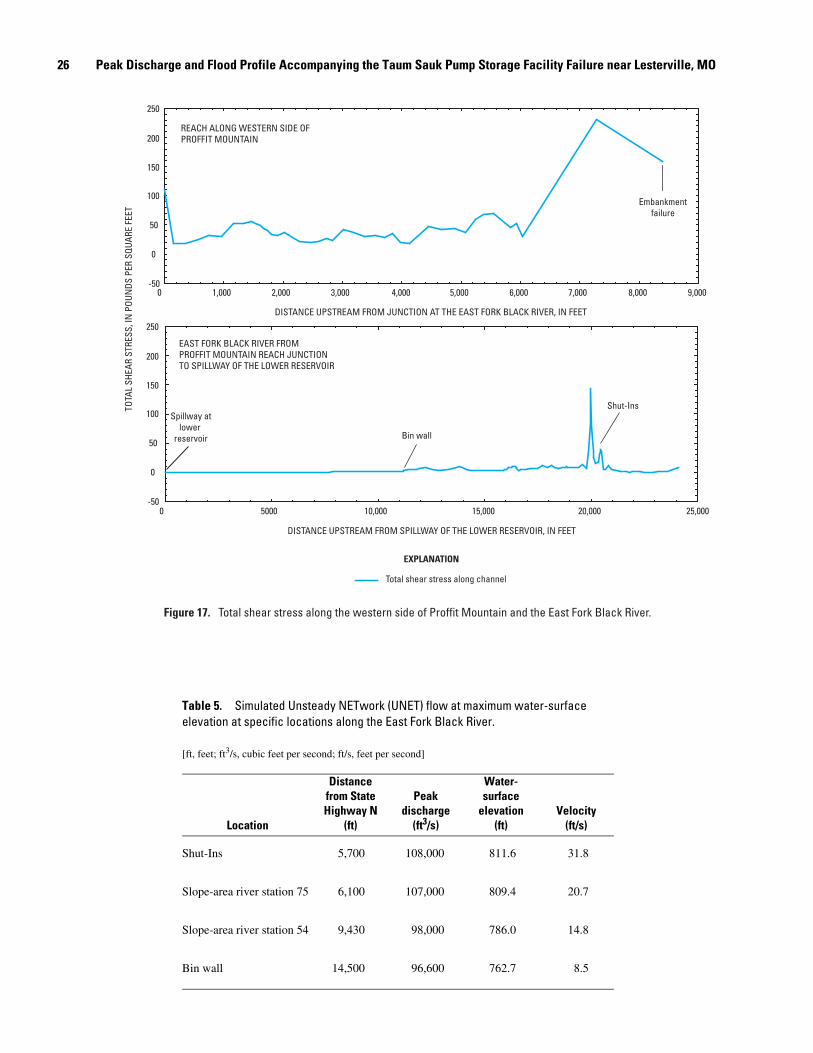
26 Peak Discharge and Flood Profile Accompanying the Taum Sauk Pump Storage Facility Failure near Lesterville, MO
Figure 17. Total shear stress along the western side of Proffit Mountain and the East Fork Black River.
EXPLANATION
Total shear stress along channel
-50
50
0
100
150
200
250
5000 10,000 15,000 20,000 25,0000
-50
50
0
100
150
200
250
0 1,000 2,000 3,000 4,000 5,000 6,000 7,000 8,000 9,000
Embankmentfailure
Bin wall
Spillway atlower
reservoir
Shut-Ins
EAST FORK BLACK RIVER FROM PROFFIT MOUNTAIN REACH JUNCTIONTO SPILLWAY OF THE LOWER RESERVOIR
REACH ALONG WESTERN SIDE OFPROFFIT MOUNTAIN
TOTA
L SH
EAR
STRE
SS, I
N P
OUN
DS P
ER S
QUAR
E FE
ET
DISTANCE UPSTREAM FROM SPILLWAY OF THE LOWER RESERVOIR, IN FEET
DISTANCE UPSTREAM FROM JUNCTION AT THE EAST FORK BLACK RIVER, IN FEET
Table 5. Simulated Unsteady NETwork (UNET) flow at maximum water-surface elevation at specific locations along the East Fork Black River.
[ft, feet; ft3/s, cubic feet per second; ft/s, feet per second]
Location
Distance from State Highway N
(ft)
Peakdischarge
(ft3/s)
Water- surface
elevation(ft)
Velocity(ft/s)
Shut-Ins 5,700 108,000 811.6 31.8
Slope-area river station 75 6,100 107,000 809.4 20.7
Slope-area river station 54 9,430 98,000 786.0 14.8
Bin wall 14,500 96,600 762.7 8.5
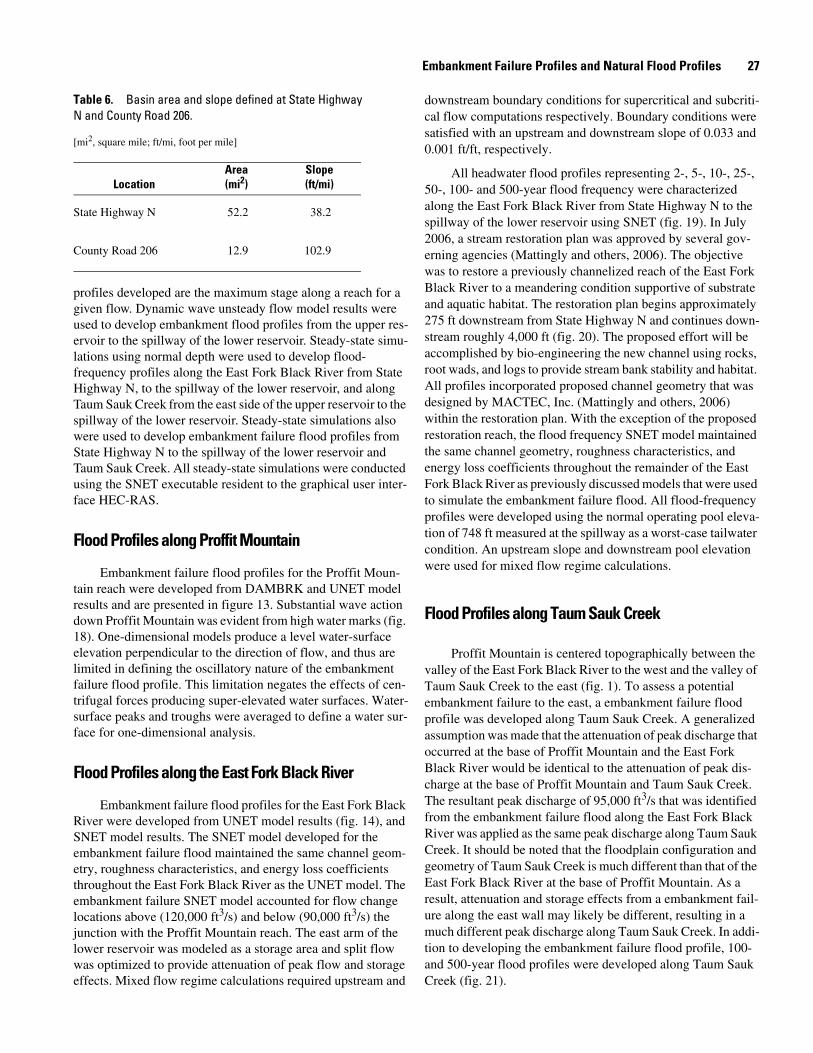
Embankment Failure Profiles and Natural Flood Profiles 27
Table 6. Basin area and slope defined at State Highway N and County Road 206.
[mi2, square mile; ft/mi, foot per mile]
LocationArea (mi2)
Slope(ft/mi)
State Highway N 52.2 38.2
County Road 206 12.9 102.9
profiles developed are the maximum stage along a reach for a given flow. Dynamic wave unsteady flow model results were used to develop embankment flood profiles from the upper res-ervoir to the spillway of the lower reservoir. Steady-state simu-lations using normal depth were used to develop flood-frequency profiles along the East Fork Black River from State Highway N, to the spillway of the lower reservoir, and along Taum Sauk Creek from the east side of the upper reservoir to the spillway of the lower reservoir. Steady-state simulations also were used to develop embankment failure flood profiles from State Highway N to the spillway of the lower reservoir and Taum Sauk Creek. All steady-state simulations were conducted using the SNET executable resident to the graphical user inter-face HEC-RAS.
Flood Profiles along Proffit Mountain
Embankment failure flood profiles for the Proffit Moun-tain reach were developed from DAMBRK and UNET model results and are presented in figure 13. Substantial wave action down Proffit Mountain was evident from high water marks (fig. 18). One-dimensional models produce a level water-surface elevation perpendicular to the direction of flow, and thus are limited in defining the oscillatory nature of the embankment failure flood profile. This limitation negates the effects of cen-trifugal forces producing super-elevated water surfaces. Water-surface peaks and troughs were averaged to define a water sur-face for one-dimensional analysis.
Flood Profiles along the East Fork Black River
Embankment failure flood profiles for the East Fork Black River were developed from UNET model results (fig. 14), and SNET model results. The SNET model developed for the embankment failure flood maintained the same channel geom-etry, roughness characteristics, and energy loss coefficients throughout the East Fork Black River as the UNET model. The embankment failure SNET model accounted for flow change locations above (120,000 ft3/s) and below (90,000 ft3/s) the junction with the Proffit Mountain reach. The east arm of the lower reservoir was modeled as a storage area and split flow was optimized to provide attenuation of peak flow and storage effects. Mixed flow regime calculations required upstream and
downstream boundary conditions for supercritical and subcriti-cal flow computations respectively. Boundary conditions were satisfied with an upstream and downstream slope of 0.033 and 0.001 ft/ft, respectively.
All headwater flood profiles representing 2-, 5-, 10-, 25-, 50-, 100- and 500-year flood frequency were characterized along the East Fork Black River from State Highway N to the spillway of the lower reservoir using SNET (fig. 19). In July 2006, a stream restoration plan was approved by several gov-erning agencies (Mattingly and others, 2006). The objective was to restore a previously channelized reach of the East Fork Black River to a meandering condition supportive of substrate and aquatic habitat. The restoration plan begins approximately 275 ft downstream from State Highway N and continues down-stream roughly 4,000 ft (fig. 20). The proposed effort will be accomplished by bio-engineering the new channel using rocks, root wads, and logs to provide stream bank stability and habitat. All profiles incorporated proposed channel geometry that was designed by MACTEC, Inc. (Mattingly and others, 2006) within the restoration plan. With the exception of the proposed restoration reach, the flood frequency SNET model maintained the same channel geometry, roughness characteristics, and energy loss coefficients throughout the remainder of the East Fork Black River as previously discussed models that were used to simulate the embankment failure flood. All flood-frequency profiles were developed using the normal operating pool eleva-tion of 748 ft measured at the spillway as a worst-case tailwater condition. An upstream slope and downstream pool elevation were used for mixed flow regime calculations.
Flood Profiles along Taum Sauk Creek
Proffit Mountain is centered topographically between the valley of the East Fork Black River to the west and the valley of Taum Sauk Creek to the east (fig. 1). To assess a potential embankment failure to the east, a embankment failure flood profile was developed along Taum Sauk Creek. A generalized assumption was made that the attenuation of peak discharge that occurred at the base of Proffit Mountain and the East Fork Black River would be identical to the attenuation of peak dis-charge at the base of Proffit Mountain and Taum Sauk Creek. The resultant peak discharge of 95,000 ft3/s that was identified from the embankment failure flood along the East Fork Black River was applied as the same peak discharge along Taum Sauk Creek. It should be noted that the floodplain configuration and geometry of Taum Sauk Creek is much different than that of the East Fork Black River at the base of Proffit Mountain. As a result, attenuation and storage effects from a embankment fail-ure along the east wall may likely be different, resulting in a much different peak discharge along Taum Sauk Creek. In addi-tion to developing the embankment failure flood profile, 100- and 500-year flood profiles were developed along Taum Sauk Creek (fig. 21).

28 Peak Discharge and Flood Profile Accompanying the Taum Sauk Pump Storage Facility Failure near Lesterville, MO
Table 7. Historic peak discharge and flood magnitude and frequency along the East Fork Black River.
[USGS, U.S. Geological Survey; ft3/s, cubic feet per second; --, undefined stage-discharge relation]
State Highway 21 State Highway N Flood magnitude and frequency USGS streamflow-gaging station USGS streamflow-gaging station at
07061300 07061270 State Highway NRecurrence Estimated
Wateryear
Discharge(ft3/s)
Wateryear
Discharge(ft3/s)
intervalt-year
discharge(ft3/s)
1961 7,200 2003 -- 2 3,720
1962 2,920 2004 3,740 5 7,420
1963 1,810 2005 2,600 10 10,500
1964 4,480 25 15,000
1965 825 50 18,300
1966 6,450 100 21,900
1967 2,150 500 30,500
1968 7,650
1969 5,400
1970 5,100
1971 2,430
1972 8,250
1973 10,400
1974 6,270
1975 6,590
1976 2,280
1977 9,920
1978 2,860
1979 8,420
1980 1,330
1981 4,480
1982 4,850
1983 8,110
1984 3,150
1985 8,840
1986 35,800
1987 2,480
1988 6,310
1989 3,450
1990 5,560
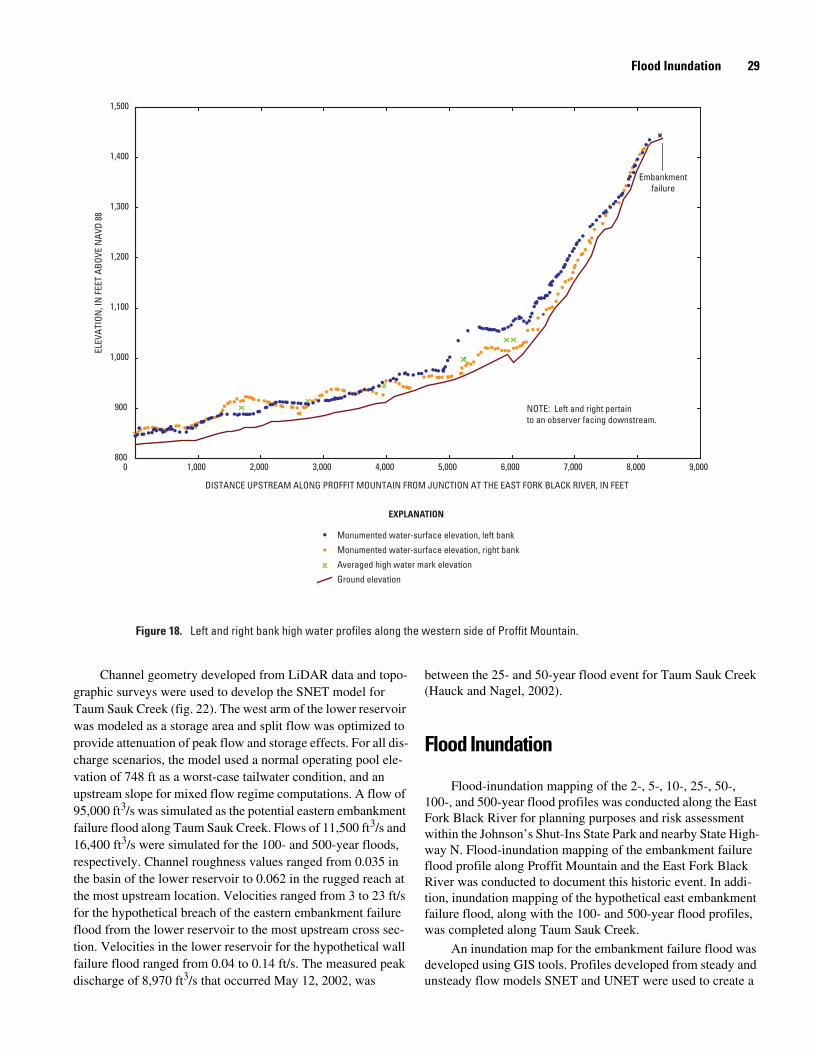
Flood Inundation 29
800
900
1,000
1,100
1,200
1,300
1,400
1,500
0 1,000 2,000 3,000 4,000 5,000 6,000 7,000 8,000 9,000
DISTANCE UPSTREAM ALONG PROFFIT MOUNTAIN FROM JUNCTION AT THE EAST FORK BLACK RIVER, IN FEET
ELEV
ATIO
N, I
N F
EET
ABOV
E N
AVD
88
Embankmentfailure
EXPLANATION
Monumented water-surface elevation, left bank
Monumented water-surface elevation, right bank
Averaged high water mark elevation
Ground elevation
Figure 18. Left and right bank high water profiles along the western side of Proffit Mountain.
NOTE: Left and right pertainto an observer facing downstream.
Channel geometry developed from LiDAR data and topo-graphic surveys were used to develop the SNET model for Taum Sauk Creek (fig. 22). The west arm of the lower reservoir was modeled as a storage area and split flow was optimized to provide attenuation of peak flow and storage effects. For all dis-charge scenarios, the model used a normal operating pool ele-vation of 748 ft as a worst-case tailwater condition, and an upstream slope for mixed flow regime computations. A flow of 95,000 ft3/s was simulated as the potential eastern embankment failure flood along Taum Sauk Creek. Flows of 11,500 ft3/s and 16,400 ft3/s were simulated for the 100- and 500-year floods, respectively. Channel roughness values ranged from 0.035 in the basin of the lower reservoir to 0.062 in the rugged reach at the most upstream location. Velocities ranged from 3 to 23 ft/s for the hypothetical breach of the eastern embankment failure flood from the lower reservoir to the most upstream cross sec-tion. Velocities in the lower reservoir for the hypothetical wall failure flood ranged from 0.04 to 0.14 ft/s. The measured peak discharge of 8,970 ft3/s that occurred May 12, 2002, was
between the 25- and 50-year flood event for Taum Sauk Creek (Hauck and Nagel, 2002).
Flood Inundation
Flood-inundation mapping of the 2-, 5-, 10-, 25-, 50-, 100-, and 500-year flood profiles was conducted along the East Fork Black River for planning purposes and risk assessment within the Johnson’s Shut-Ins State Park and nearby State High-way N. Flood-inundation mapping of the embankment failure flood profile along Proffit Mountain and the East Fork Black River was conducted to document this historic event. In addi-tion, inundation mapping of the hypothetical east embankment failure flood, along with the 100- and 500-year flood profiles, was completed along Taum Sauk Creek.
An inundation map for the embankment failure flood was developed using GIS tools. Profiles developed from steady and unsteady flow models SNET and UNET were used to create a

30 Peak Discharge and Flood Profile Accompanying the Taum Sauk Pump Storage Facility Failure near Lesterville, MO
0 5,000 10,000 15,000 20,000 25,000 30,000705
725
745
765
785
805
825
845
DISTANCE UPSTREAM ALONG THE EAST FORK BLACK RIVER, IN FEET
Spillway crestlocation at
lower reservoir
Normal poolelevation748 feet
Bin wallShut-Ins
StateHighway N
Flood profile, in years (recurrence interval)500
100 50 25 10 5 2 Ground elevation
Figure 19. Simulated 2- through 500-year flood frequency profiles along the East Fork Black River from the Steady NETwork model (SNET).
water surface. The water surface was differenced from a LiDAR-generated ground surface to produce an estimated extent of inundation. The one-dimensional profile of the embankment failure flood produced lines of equal water-sur-face elevation perpendicular to flow. As a result, the inundation extent was further developed by making adjustments based on super-elevated surfaces from high water mark elevations shown in figure 4. An estimated flood extent of the embankment fail-ure flood is located on the CD-ROM, at the back of this report (plate 1). High water data were used to develop an additional surface that was differenced from the LiDAR-generated ground surface to produce an extent of maximum water depth for the upper reservoir embankment failure. Average depths along Proffit Mountain and the East Fork Black River were between 10 and 30 ft. Specific locations along Proffit Mountain indicate depths may have exceeded 50 ft. Depths at the Shut-Ins ranged from 30 to 40 ft. Estimated depths along Proffit Mountain and
the East Fork Black River are illustrated on plate 2, located on the CD-ROM, at the back of this report.
A similar procedure was used to create estimated inundation extents along Taum Sauk Creek. A ground surface was devel-oped using topographic survey and LiDAR data. The ground sur-face was differenced with profiles representing a hypothetical east embankment failure flood and 100- and 500-year flood events. Estimated flood extents of the hypothetical east embank-ment failure flood, the 100-year flood, and the 500-year flood are located on the CD-ROM. at the back of this report (plates 3, 4, and 5).
Estimated inundation extents were developed for the 2-, 5-, 10-, 25-, 50-, 100-, and 500-year flood profiles along the East Fork Black River from a location just above State Highway N to the spillway of the lower reservoir. The reach of channel restora-tion just downstream from State Highway N was incorporated as part of the process. Proposed channel design cross sections pro-vided by MACTEC, Inc. were added to geo-referenced
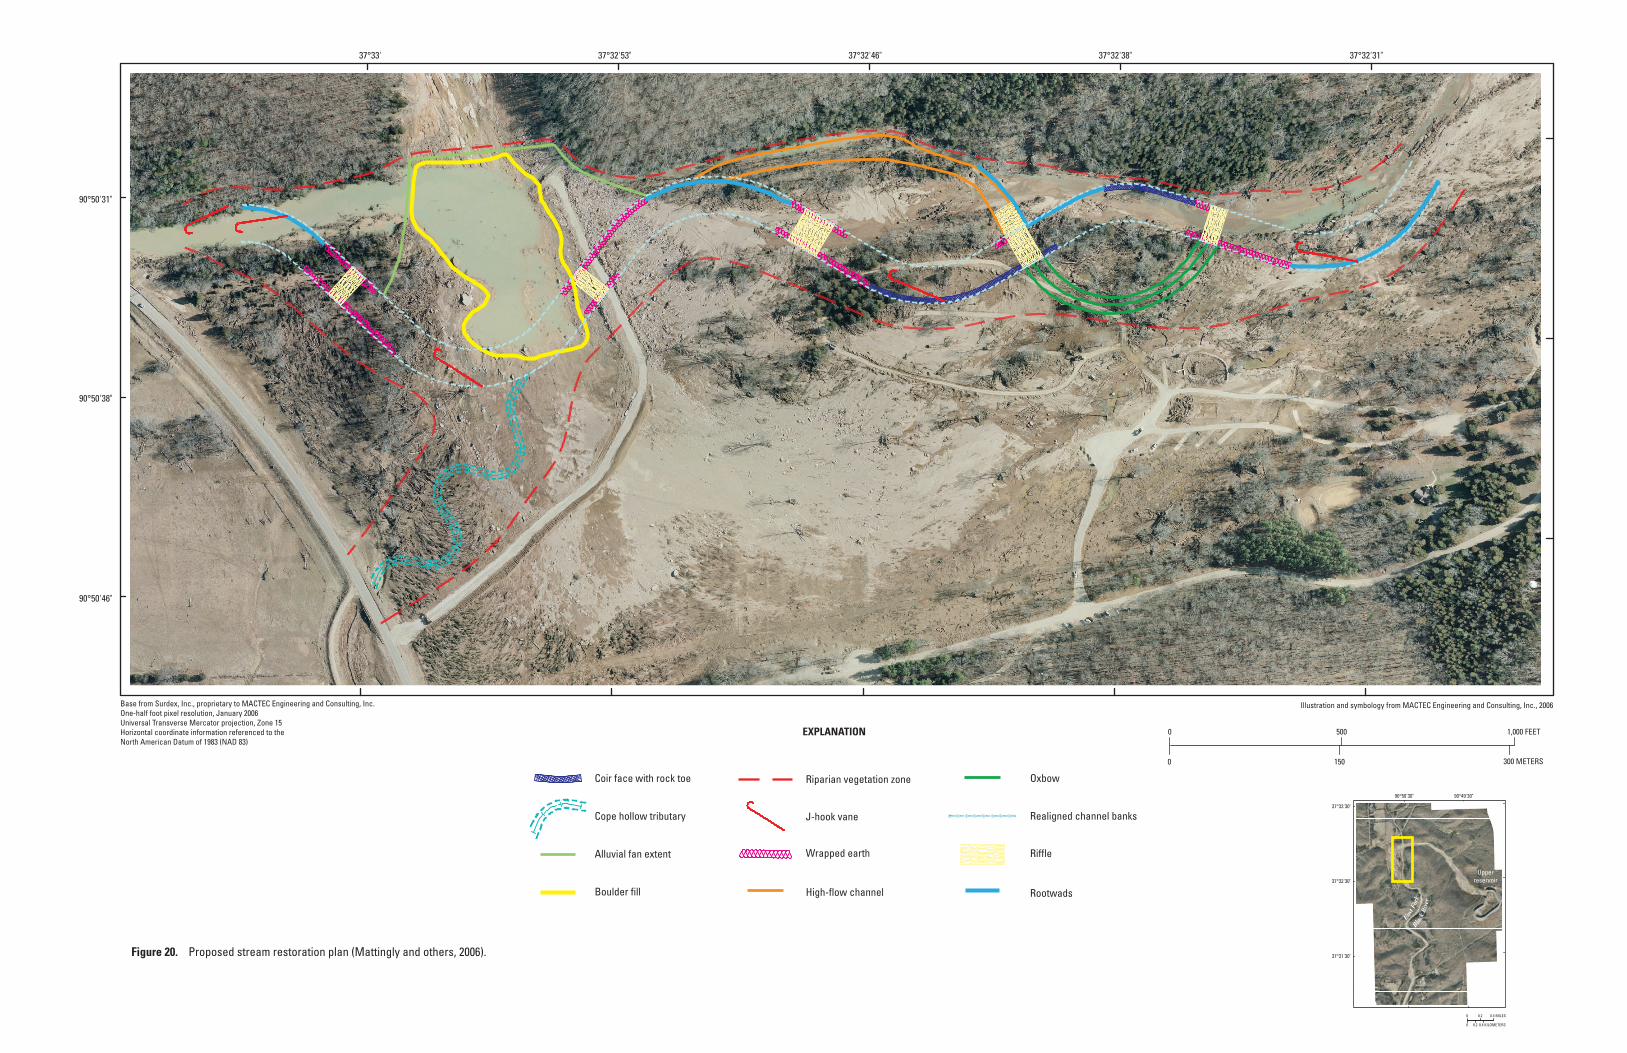
90°50'46"
90°50'38"
90°50'31"
37°32'31"37°32'38"37°32'46"37°32'53"37°33'
Figure 20. Proposed stream restoration plan (Mattingly and others, 2006).
Base from Surdex, Inc., proprietary to MACTEC Engineering and Consulting, Inc.One-half foot pixel resolution, January 2006Universal Transverse Mercator projection, Zone 15Horizontal coordinate information referenced to theNorth American Datum of 1983 (NAD 83)
EXPLANATION
Coir face with rock toe
Cope hollow tributary
Alluvial fan extent
Boulder fill
Riparian vegetation zone
J-hook vane
Wrapped earth
High-flow channel
Oxbow
Realigned channel banks
Riffle
Rootwads
Illustration and symbology from MACTEC Engineering and Consulting, Inc., 2006
0 150 300 METERS
0 500 1,000 FEET
90°50'30" 90°49'30"
37°31'30"
37°32'30"
37°33'30"
0 0.2 0.4 MILES
0 0.2 0.4 KILOMETERS
Upperreservoir
East F
ork
Black
Riv
er

Debris Movement 33
Figure 21. Simulated embankment failure flood compared with 100- and 500-year flood frequency profiles along Taum Sauk Creek from the Steady NETwork model (SNET).
Normal poolelevation748 feet
DISTANCE UPSTREAM FROM LOWER RESERVOIR ALONG TAUM SAUK CREEK, IN FEET
705
725
745
765
785
805
825
845
0 2,000 4,000 6,000 8,000 10,000 12,000 14,000 16,000 18,000
ELEV
ATIO
N, I
N F
EET
ABOV
E N
AVD
88
Embankment failure flood500-year flood profile100-year flood profileGround elevation
Spillway crestlocation at
lower reservoir
0.5-ft pixel imagery (provided by MACTEC, Inc.) and plan view of proposed meandering (fig. 20). A GIS script provided interpolation of x,y,z points between each cross section along the design stream path to form a new surface for the 4,000-ft proposed reach. The new surface was blended with the existing surface to form modified ground geometry that was differenced with the 2-, 5-, 10-, 25-, 50-, 100-, and 500-year flood surfaces. Estimated flood inundation extents for the 2-, 5-, 10-, 25-, 50-, 100-, and 500-year flood surfaces are located on the CD-ROM, at the back of this report (plates 6, 7, 8, 9, 10, 11, and 12).
Debris Movement
The force of the embankment failure flood changed the geomorphic landscape by degrading and aggrading deposits and transporting sediment and woody debris. Texture and sedimen-tology of deposits along the western slope of Proffit Mountain concluded no substantial evidence to warrant a debris flow (J. Costa, U.S. Geological Survey, oral commun., 2006). A quanti-
tative assessment was conducted to estimate the volume of sed-iment and debris that was transported from floodwaters entering the East Fork Black River and the lower reservoir.
Field estimates were conducted from State Highway N along the East Fork Black River to the bin wall upstream from the lower reservoir. Areas of the deposition were defined using GPS in conjunction with high-resolution color imagery. Quan-titative estimates of deposition were recorded within identified areas and documented as sand/gravel and woody debris (fig. 23).
Another approach in determining debris movement was to difference the current (2006) LiDAR surface from a pre-exist-ing 10-meter DEM based on 1:24,000 scale topography (fig. 24). Substantial differences in data density between current LiDAR point data and pre-existing elevation data used to create the DEM limited the accuracy of the resulting difference map. Using a GIS technique, an estimated 180 acres of timber were affected along the western side of Proffit Mountain to a location at the Shut-Ins. During field reconnaissance, much of the woody debris was observed being reduced to mulch to be used along foot paths within the Johnson’s Shut-Ins State Park.
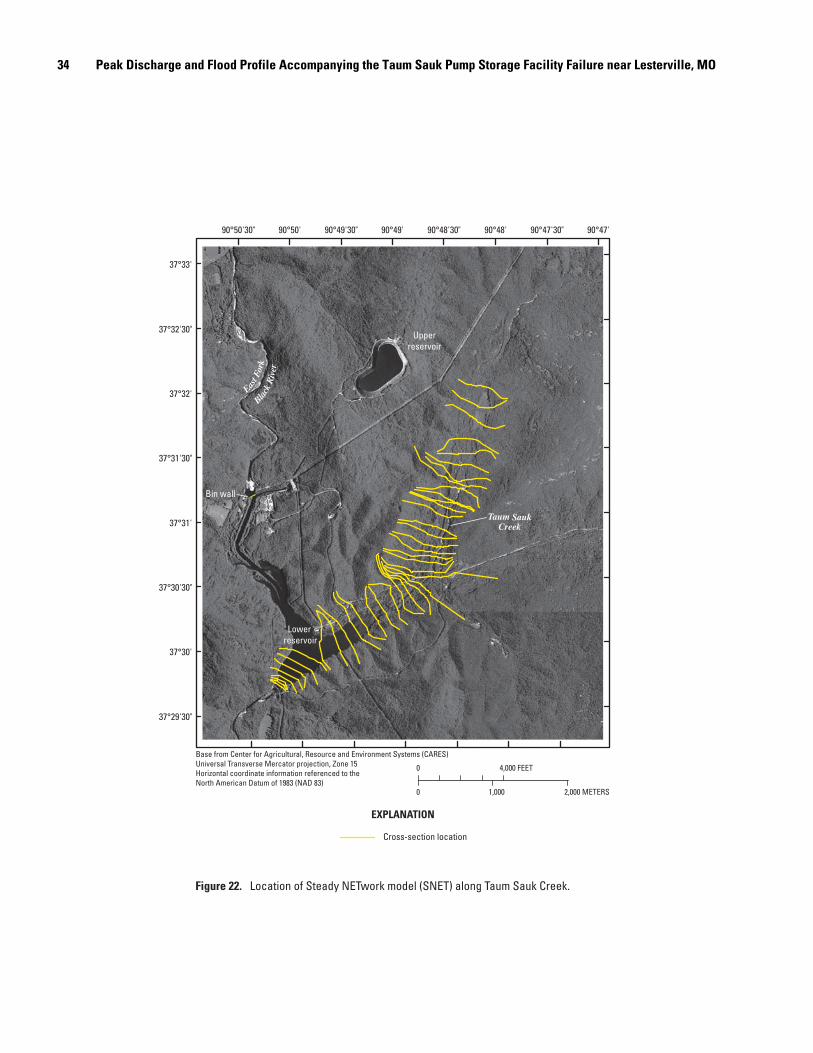
34 Peak Discharge and Flood Profile Accompanying the Taum Sauk Pump Storage Facility Failure near Lesterville, MO
0 4,000 FEET
0 1,000 2,000 METERS
Base from Center for Agricultural, Resource and Environment Systems (CARES)Universal Transverse Mercator projection, Zone 15Horizontal coordinate information referenced to theNorth American Datum of 1983 (NAD 83)
90°50'30" 90°50' 90°49'30" 90°49' 90°48'30" 90°48' 90°47'30" 90°47'
37°29'30"
37°30'
37°30'30"
37°31'
37°31'30"
37°32'
37°32'30"
37°33'
Figure 22. Location of Steady NETwork model (SNET) along Taum Sauk Creek.
EXPLANATION
Cross-section location
Upperreservoir
Lowerreservoir
East F
ork
Black
Riv
er
Taum SaukCreek
Bin wall
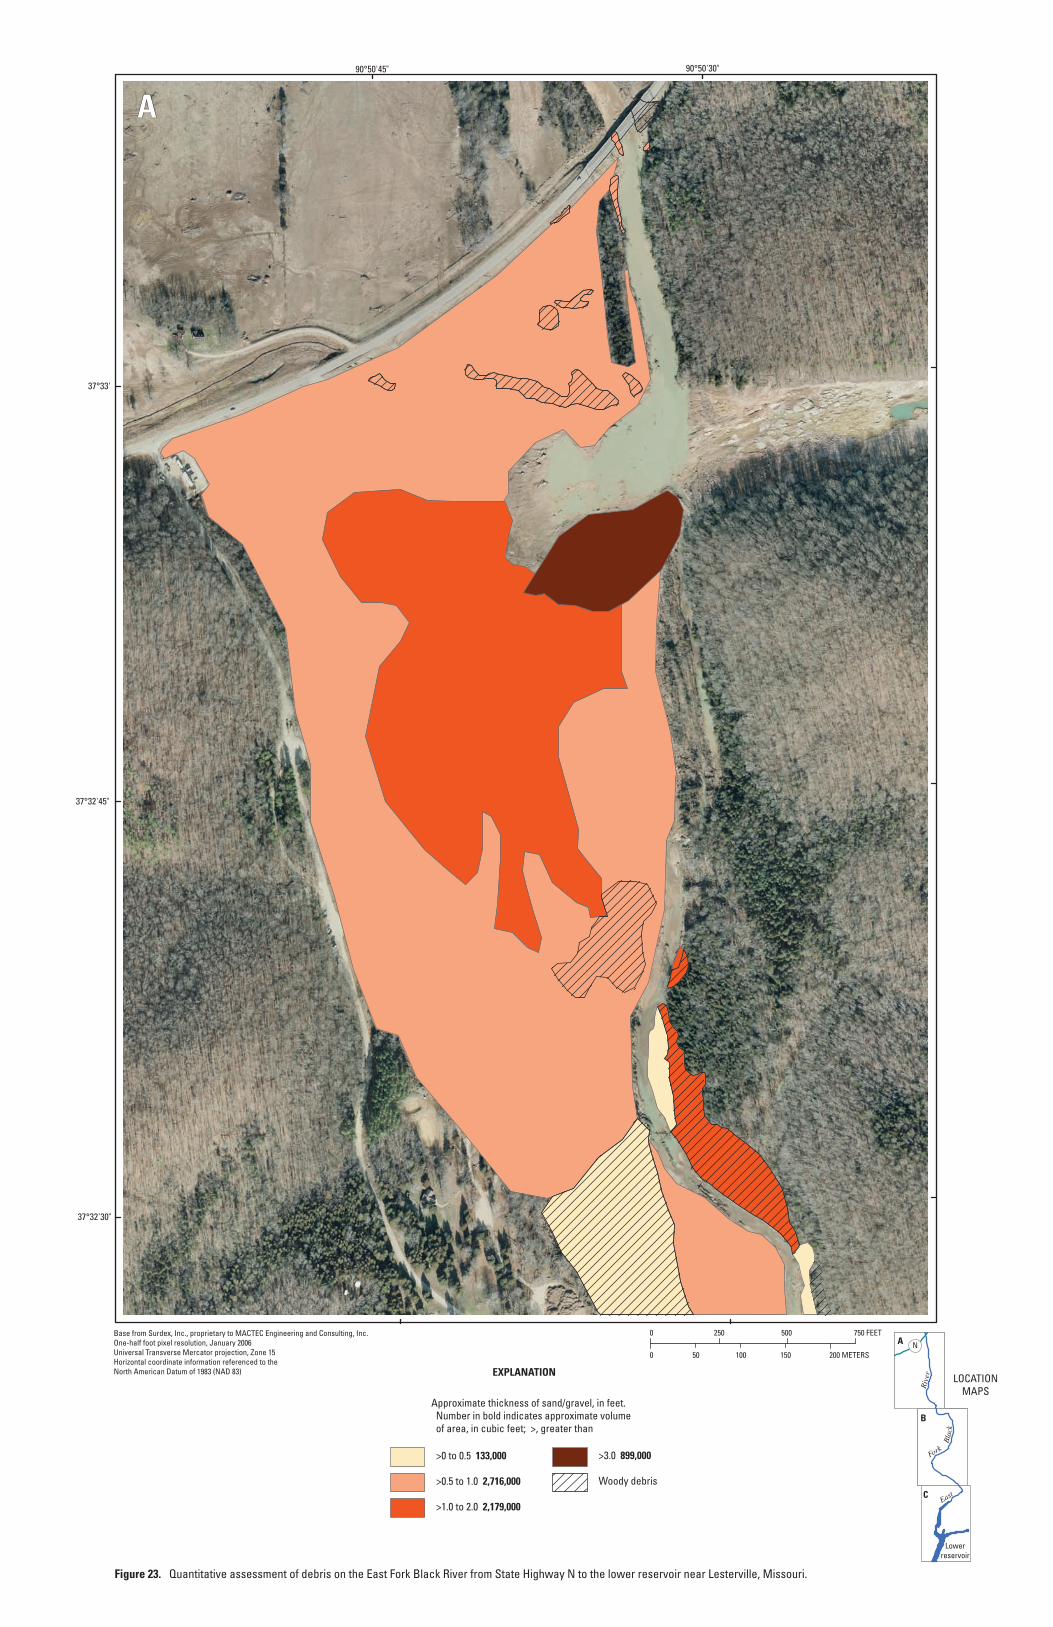
A
Figure 23. Quantitative assessment of debris on the East Fork Black River from State Highway N to the lower reservoir near Lesterville, Missouri.
Base from Surdex, Inc., proprietary to MACTEC Engineering and Consulting, Inc.One-half foot pixel resolution, January 2006Universal Transverse Mercator projection, Zone 15Horizontal coordinate information referenced to theNorth American Datum of 1983 (NAD 83)
0 750 FEET250 500
0 200 METERS50 100 150
Approximate thickness of sand/gravel, in feet. Number in bold indicates approximate volume of area, in cubic feet; >, greater than
>0 to 0.5 133,000
>0.5 to 1.0 2,716,000
>1.0 to 2.0 2,179,000
EXPLANATION
>3.0 899,000
Woody debris
Lowerreservoir
A
C
B
N
East
Fork
Riv
er LOCATIONMAPS
Bla
ck
90°50'45" 90°50'30"
37°32'30"
37°32'45"
37°33'
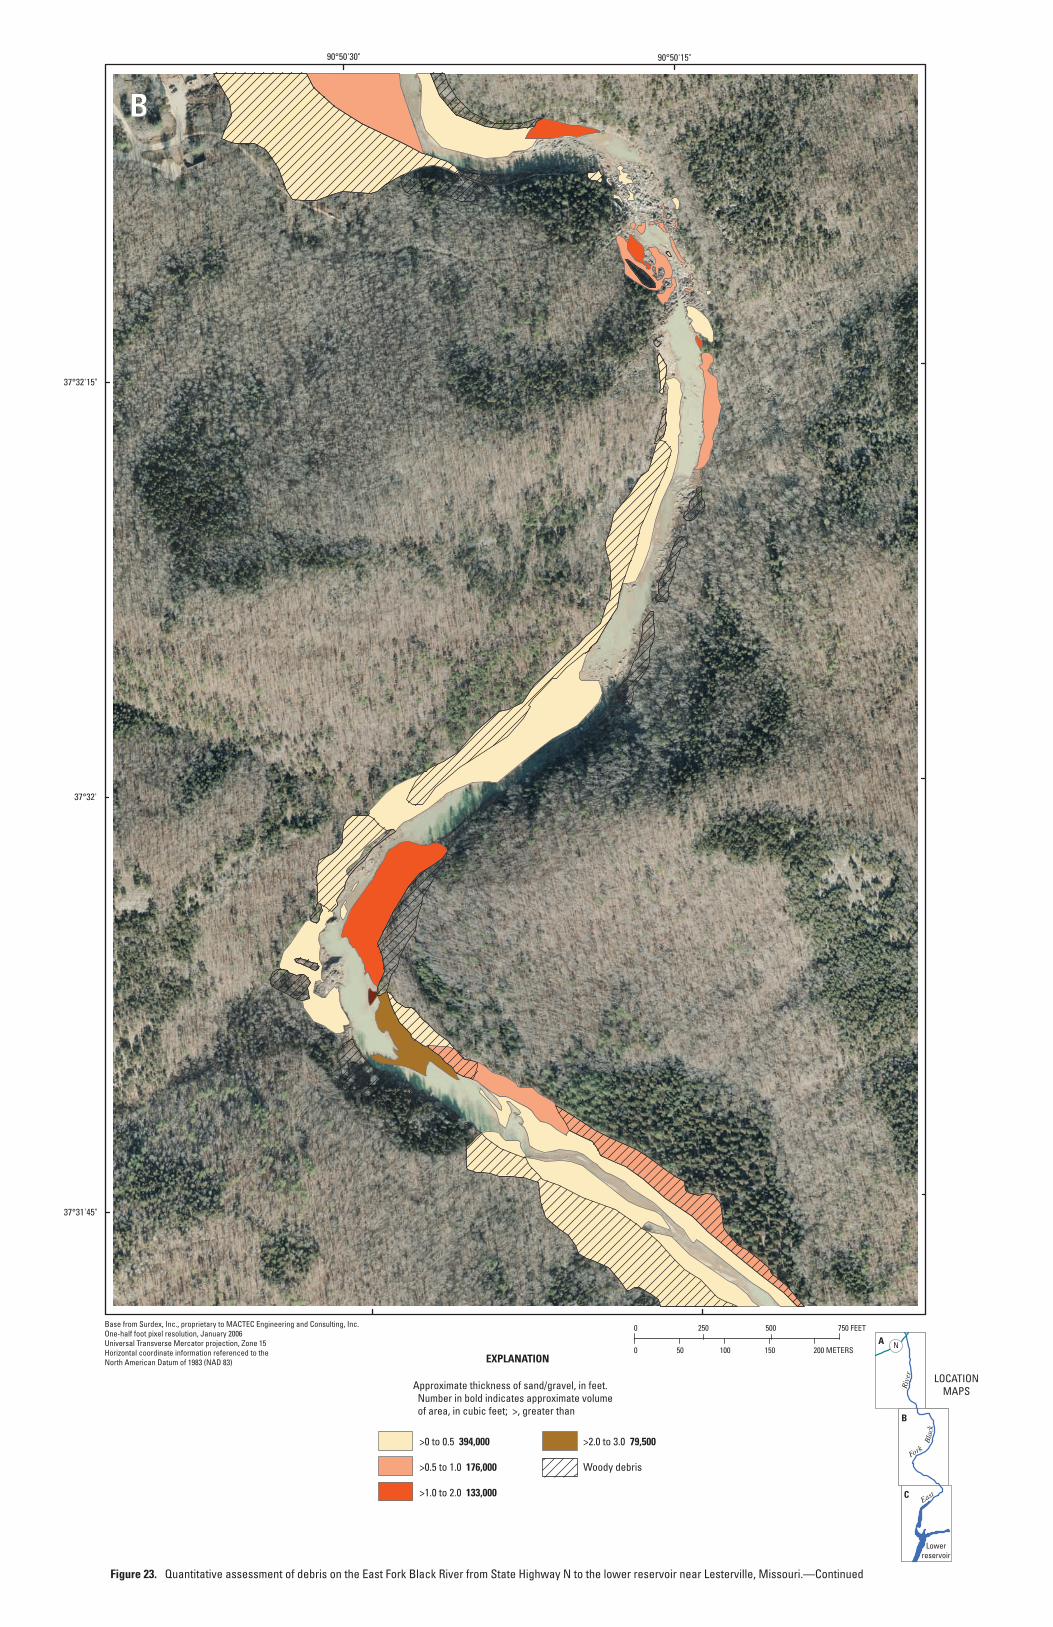
B
Figure 23. Quantitative assessment of debris on the East Fork Black River from State Highway N to the lower reservoir near Lesterville, Missouri.—Continued
Base from Surdex, Inc., proprietary to MACTEC Engineering and Consulting, Inc.One-half foot pixel resolution, January 2006Universal Transverse Mercator projection, Zone 15Horizontal coordinate information referenced to theNorth American Datum of 1983 (NAD 83)
Lowerreservoir
A
C
B
N
East
Fork
Riv
er LOCATIONMAPS
Bla
ck
>0 to 0.5 394,000
>0.5 to 1.0 176,000
>1.0 to 2.0 133,000
EXPLANATION
>2.0 to 3.0 79,500
Woody debris
Approximate thickness of sand/gravel, in feet. Number in bold indicates approximate volume of area, in cubic feet; >, greater than
0 750 FEET250 500
0 200 METERS50 100 150
90°50'30" 90°50'15"
37°31'45"
37°32'
37°32'15"
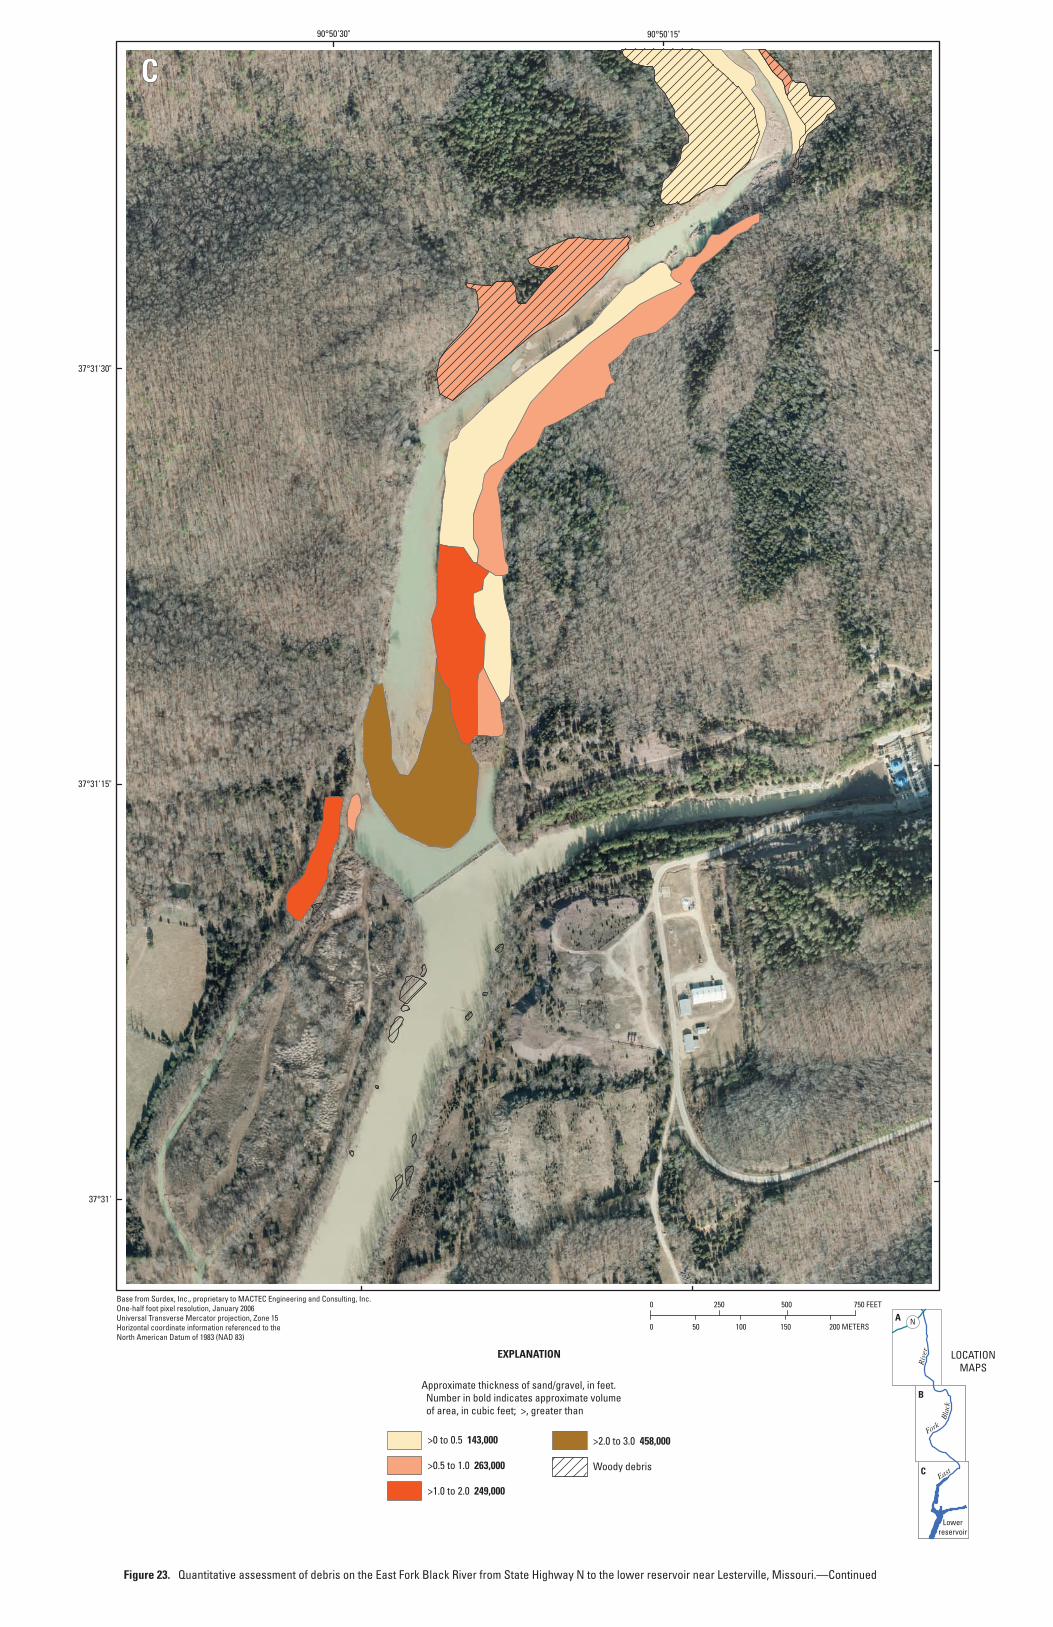
C
0 750 FEET250 500
0 200 METERS50 100 150
>0 to 0.5 143,000
>0.5 to 1.0 263,000
>1.0 to 2.0 249,000
EXPLANATION
>2.0 to 3.0 458,000
Woody debris
Approximate thickness of sand/gravel, in feet. Number in bold indicates approximate volume of area, in cubic feet; >, greater than
Lowerreservoir
A
C
B
N
East
Fork
Riv
er LOCATIONMAPS
Bla
ck
Base from Surdex, Inc., proprietary to MACTEC Engineering and Consulting, Inc.One-half foot pixel resolution, January 2006Universal Transverse Mercator projection, Zone 15Horizontal coordinate information referenced to theNorth American Datum of 1983 (NAD 83)
90°50'30" 90°50'15"
37°31'
37°31'15"
37°31'30"
Figure 23. Quantitative assessment of debris on the East Fork Black River from State Highway N to the lower reservoir near Lesterville, Missouri.—Continued
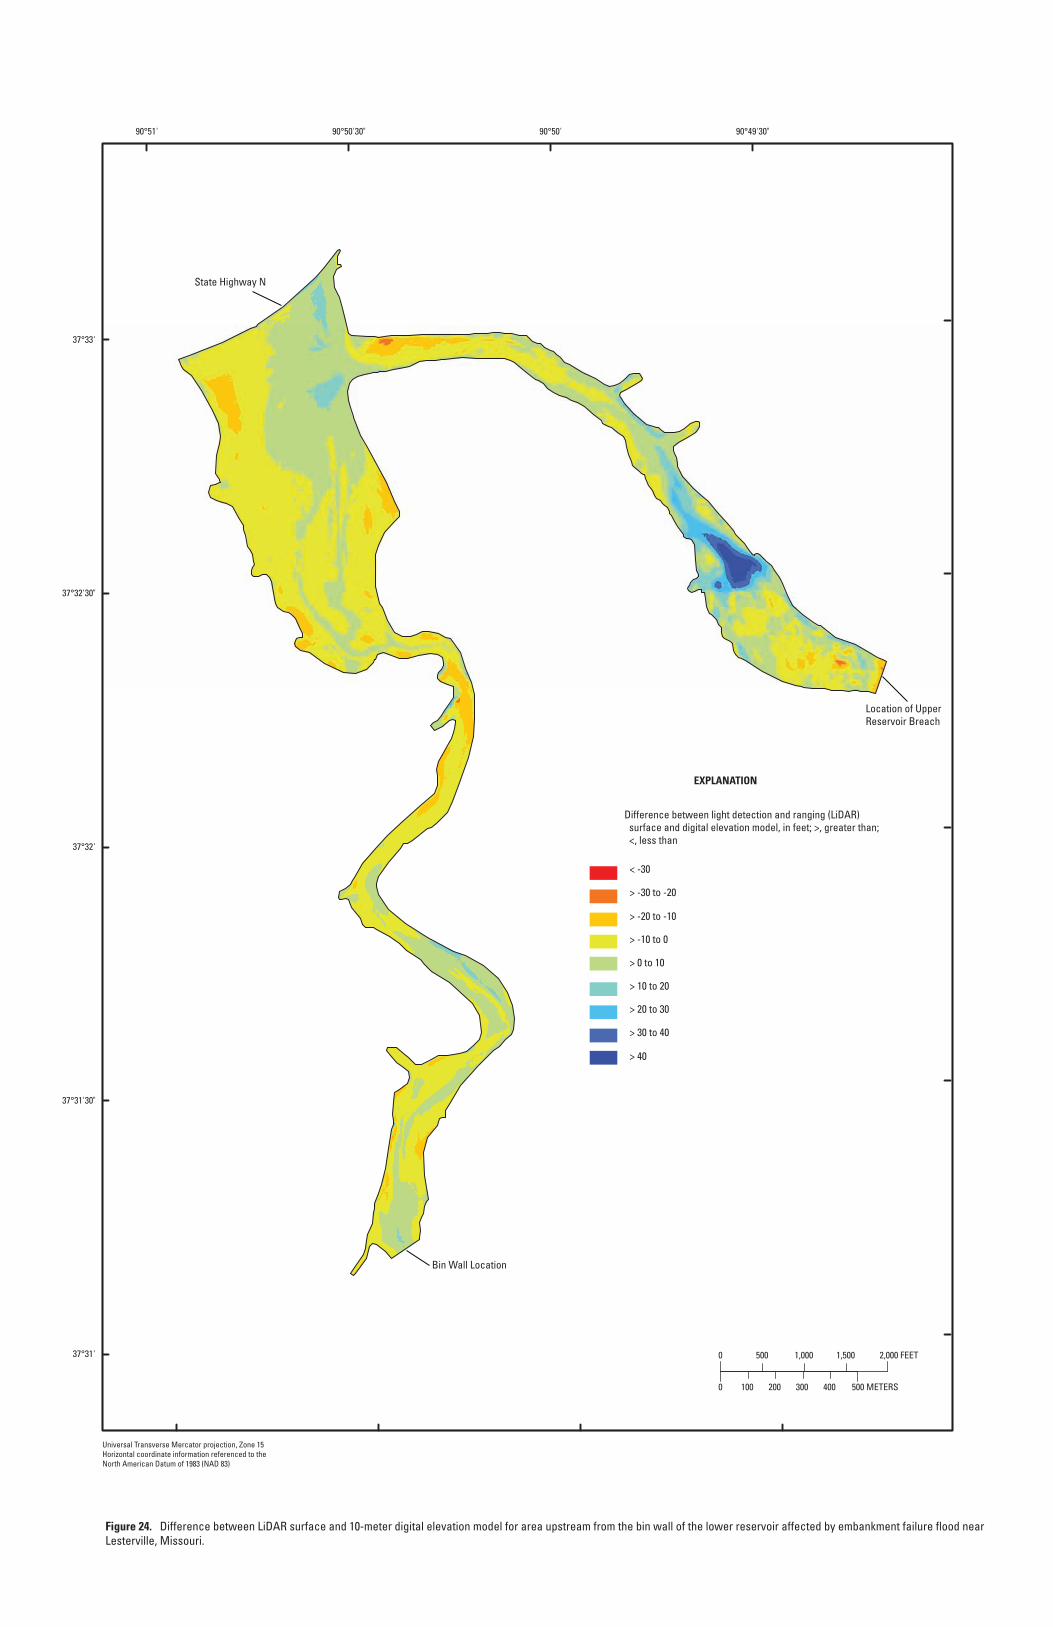
90°51' 90°50'30" 90°50' 90°49'30"
37°31'
37°31'30"
37°32'
37°32'30"
37°33'
0 2,000 FEET500 1,000 1,500
0 500 METERS100 200 300 400
Universal Transverse Mercator projection, Zone 15Horizontal coordinate information referenced to theNorth American Datum of 1983 (NAD 83)
< -30
> -30 to -20
> -20 to -10
> -10 to 0
> 0 to 10
> 10 to 20
> 20 to 30
> 30 to 40
> 40
Difference between light detection and ranging (LiDAR) surface and digital elevation model, in feet; >, greater than; <, less than
EXPLANATION
Bin Wall Location
Location of UpperReservoir Breach
State Highway N
Figure 24. Difference between LiDAR surface and 10-meter digital elevation model for area upstream from the bin wall of the lower reservoir affected by embankment failure flood near Lesterville, Missouri.
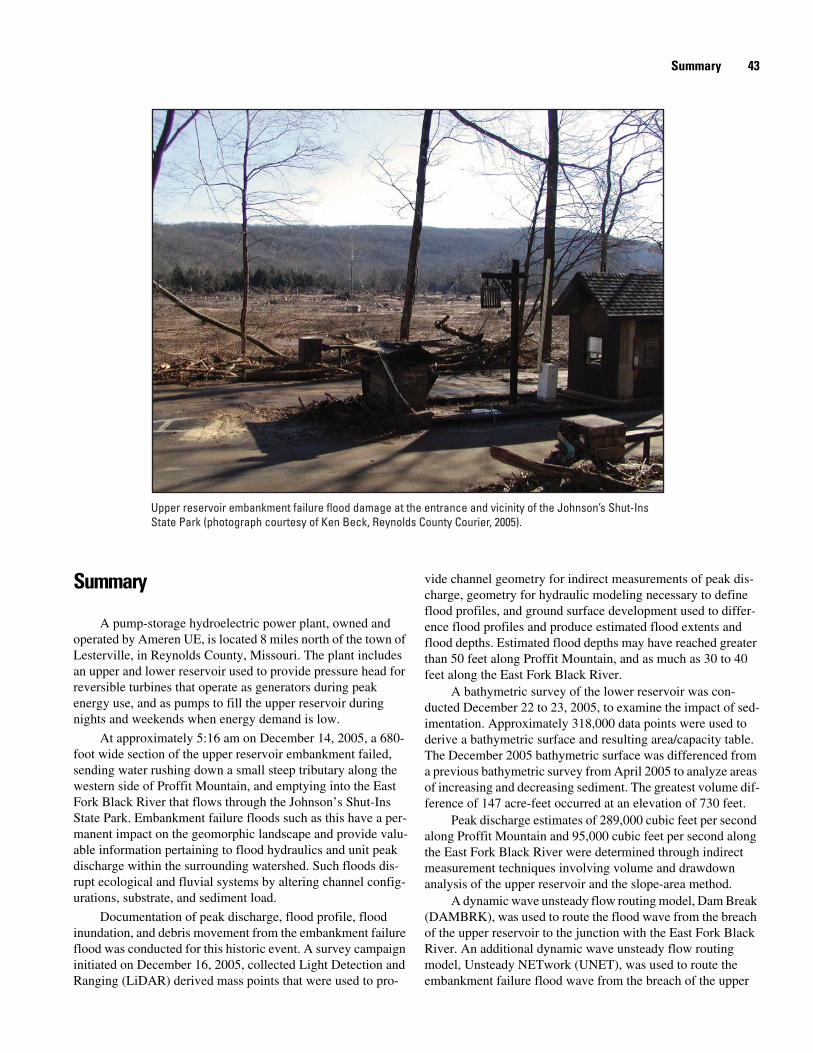
Summary 43
Upper reservoir embankment failure flood damage at the entrance and vicinity of the Johnson’s Shut-Ins State Park (photograph courtesy of Ken Beck, Reynolds County Courier, 2005).
Summary
A pump-storage hydroelectric power plant, owned and operated by Ameren UE, is located 8 miles north of the town of Lesterville, in Reynolds County, Missouri. The plant includes an upper and lower reservoir used to provide pressure head for reversible turbines that operate as generators during peak energy use, and as pumps to fill the upper reservoir during nights and weekends when energy demand is low.
At approximately 5:16 am on December 14, 2005, a 680-foot wide section of the upper reservoir embankment failed, sending water rushing down a small steep tributary along the western side of Proffit Mountain, and emptying into the East Fork Black River that flows through the Johnson’s Shut-Ins State Park. Embankment failure floods such as this have a per-manent impact on the geomorphic landscape and provide valu-able information pertaining to flood hydraulics and unit peak discharge within the surrounding watershed. Such floods dis-rupt ecological and fluvial systems by altering channel config-urations, substrate, and sediment load.
Documentation of peak discharge, flood profile, flood inundation, and debris movement from the embankment failure flood was conducted for this historic event. A survey campaign initiated on December 16, 2005, collected Light Detection and Ranging (LiDAR) derived mass points that were used to pro-
vide channel geometry for indirect measurements of peak dis-charge, geometry for hydraulic modeling necessary to define flood profiles, and ground surface development used to differ-ence flood profiles and produce estimated flood extents and flood depths. Estimated flood depths may have reached greater than 50 feet along Proffit Mountain, and as much as 30 to 40 feet along the East Fork Black River.
A bathymetric survey of the lower reservoir was con-ducted December 22 to 23, 2005, to examine the impact of sed-imentation. Approximately 318,000 data points were used to derive a bathymetric surface and resulting area/capacity table. The December 2005 bathymetric surface was differenced from a previous bathymetric survey from April 2005 to analyze areas of increasing and decreasing sediment. The greatest volume dif-ference of 147 acre-feet occurred at an elevation of 730 feet.
Peak discharge estimates of 289,000 cubic feet per second along Proffit Mountain and 95,000 cubic feet per second along the East Fork Black River were determined through indirect measurement techniques involving volume and drawdown analysis of the upper reservoir and the slope-area method.
A dynamic wave unsteady flow routing model, Dam Break (DAMBRK), was used to route the flood wave from the breach of the upper reservoir to the junction with the East Fork Black River. An additional dynamic wave unsteady flow routing model, Unsteady NETwork (UNET), was used to route the embankment failure flood wave from the breach of the upper
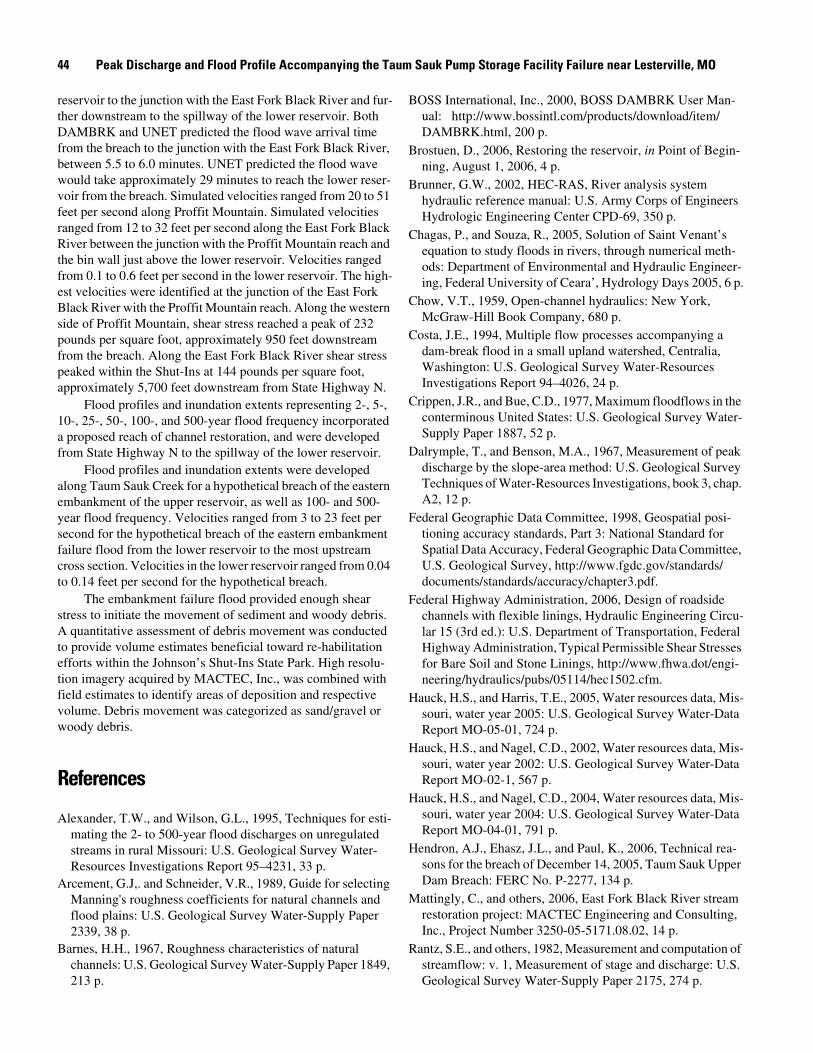
44 Peak Discharge and Flood Profile Accompanying the Taum Sauk Pump Storage Facility Failure near Lesterville, MO
reservoir to the junction with the East Fork Black River and fur-ther downstream to the spillway of the lower reservoir. Both DAMBRK and UNET predicted the flood wave arrival time from the breach to the junction with the East Fork Black River, between 5.5 to 6.0 minutes. UNET predicted the flood wave would take approximately 29 minutes to reach the lower reser-voir from the breach. Simulated velocities ranged from 20 to 51 feet per second along Proffit Mountain. Simulated velocities ranged from 12 to 32 feet per second along the East Fork Black River between the junction with the Proffit Mountain reach and the bin wall just above the lower reservoir. Velocities ranged from 0.1 to 0.6 feet per second in the lower reservoir. The high-est velocities were identified at the junction of the East Fork Black River with the Proffit Mountain reach. Along the western side of Proffit Mountain, shear stress reached a peak of 232 pounds per square foot, approximately 950 feet downstream from the breach. Along the East Fork Black River shear stress peaked within the Shut-Ins at 144 pounds per square foot, approximately 5,700 feet downstream from State Highway N.
Flood profiles and inundation extents representing 2-, 5-, 10-, 25-, 50-, 100-, and 500-year flood frequency incorporated a proposed reach of channel restoration, and were developed from State Highway N to the spillway of the lower reservoir.
Flood profiles and inundation extents were developed along Taum Sauk Creek for a hypothetical breach of the eastern embankment of the upper reservoir, as well as 100- and 500-year flood frequency. Velocities ranged from 3 to 23 feet per second for the hypothetical breach of the eastern embankment failure flood from the lower reservoir to the most upstream cross section. Velocities in the lower reservoir ranged from 0.04 to 0.14 feet per second for the hypothetical breach.
The embankment failure flood provided enough shear stress to initiate the movement of sediment and woody debris. A quantitative assessment of debris movement was conducted to provide volume estimates beneficial toward re-habilitation efforts within the Johnson’s Shut-Ins State Park. High resolu-tion imagery acquired by MACTEC, Inc., was combined with field estimates to identify areas of deposition and respective volume. Debris movement was categorized as sand/gravel or woody debris.
References
Alexander, T.W., and Wilson, G.L., 1995, Techniques for esti-mating the 2- to 500-year flood discharges on unregulated streams in rural Missouri: U.S. Geological Survey Water- Resources Investigations Report 95–4231, 33 p.
Arcement, G.J,. and Schneider, V.R., 1989, Guide for selecting Manning's roughness coefficients for natural channels and flood plains: U.S. Geological Survey Water-Supply Paper 2339, 38 p.
Barnes, H.H., 1967, Roughness characteristics of natural channels: U.S. Geological Survey Water-Supply Paper 1849, 213 p.
BOSS International, Inc., 2000, BOSS DAMBRK User Man-ual: http://www.bossintl.com/products/download/item/DAMBRK.html, 200 p.
Brostuen, D., 2006, Restoring the reservoir, in Point of Begin-ning, August 1, 2006, 4 p.
Brunner, G.W., 2002, HEC-RAS, River analysis system hydraulic reference manual: U.S. Army Corps of Engineers Hydrologic Engineering Center CPD-69, 350 p.
Chagas, P., and Souza, R., 2005, Solution of Saint Venant’s equation to study floods in rivers, through numerical meth-ods: Department of Environmental and Hydraulic Engineer-ing, Federal University of Ceara’, Hydrology Days 2005, 6 p.
Chow, V.T., 1959, Open-channel hydraulics: New York, McGraw-Hill Book Company, 680 p.
Costa, J.E., 1994, Multiple flow processes accompanying a dam-break flood in a small upland watershed, Centralia, Washington: U.S. Geological Survey Water-Resources Investigations Report 94–4026, 24 p.
Crippen, J.R., and Bue, C.D., 1977, Maximum floodflows in the conterminous United States: U.S. Geological Survey Water-Supply Paper 1887, 52 p.
Dalrymple, T., and Benson, M.A., 1967, Measurement of peak discharge by the slope-area method: U.S. Geological Survey Techniques of Water-Resources Investigations, book 3, chap. A2, 12 p.
Federal Geographic Data Committee, 1998, Geospatial posi-tioning accuracy standards, Part 3: National Standard for Spatial Data Accuracy, Federal Geographic Data Committee, U.S. Geological Survey, http://www.fgdc.gov/standards/documents/standards/accuracy/chapter3.pdf.
Federal Highway Administration, 2006, Design of roadside channels with flexible linings, Hydraulic Engineering Circu-lar 15 (3rd ed.): U.S. Department of Transportation, Federal Highway Administration, Typical Permissible Shear Stresses for Bare Soil and Stone Linings, http://www.fhwa.dot/engi-neering/hydraulics/pubs/05114/hec1502.cfm.
Hauck, H.S., and Harris, T.E., 2005, Water resources data, Mis-souri, water year 2005: U.S. Geological Survey Water-Data Report MO-05-01, 724 p.
Hauck, H.S., and Nagel, C.D., 2002, Water resources data, Mis-souri, water year 2002: U.S. Geological Survey Water-Data Report MO-02-1, 567 p.
Hauck, H.S., and Nagel, C.D., 2004, Water resources data, Mis-souri, water year 2004: U.S. Geological Survey Water-Data Report MO-04-01, 791 p.
Hendron, A.J., Ehasz, J.L., and Paul, K., 2006, Technical rea-sons for the breach of December 14, 2005, Taum Sauk Upper Dam Breach: FERC No. P-2277, 134 p.
Mattingly, C., and others, 2006, East Fork Black River stream restoration project: MACTEC Engineering and Consulting, Inc., Project Number 3250-05-5171.08.02, 14 p.
Rantz, S.E., and others, 1982, Measurement and computation of streamflow: v. 1, Measurement of stage and discharge: U.S. Geological Survey Water-Supply Paper 2175, 274 p.

References 45
Sylvestre, J., and Sylvestre, P., 2003, National Weather Service hydrology workshop: National Weather Service—Office of Hydrologic Development, 79 p.
Trimble Navigation Limited, 1999, AgGPS 124/132 Operation Manual, Revision B: Trimble Precision Agricultural Sys-tems, 218 p.
Wilson, G.W., and Richards, J.M., 2006, Procedural documen-tation and accuracy assessment of bathymetric maps and area/capacity tables for small reservoirs: U.S. Geological Survey Scientific Investigations Report 2006–5208, 24 p.

For more information concerning the research described in this report, contact:
U.S. Geological SurveyMissouri Water Science Center1400 Independence RoadMail Stop 100Rolla, MO 65401(573) 308-3665http://mo.water.usgs.gov
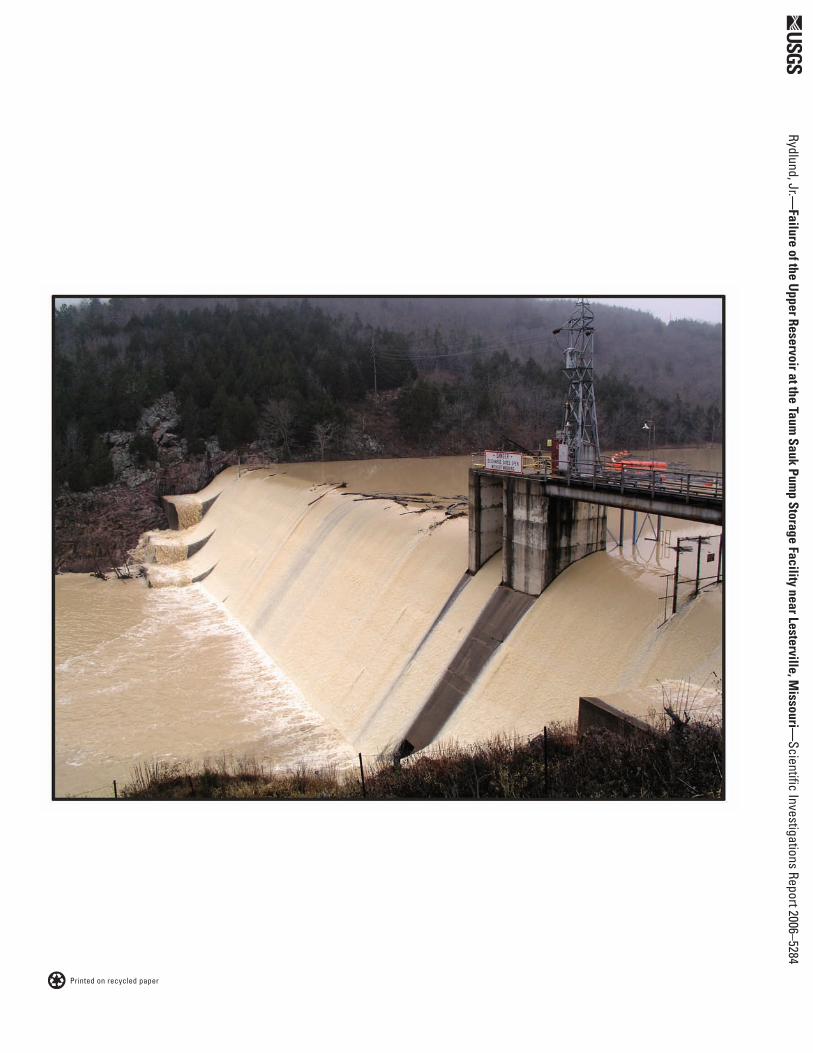
Printed on recycled paper
Rydlund, Jr.—Failure of the U
pper Reservoir at the Taum Sauk Pum
p Storage Facility near Lesterville, Missouri—
Scientific Investigations Report 2006–5284


