Embed Size (px)
Citation preview
Aw ard Number: 04HQAG0011
CONTINUOUS BROADBAND MONITORING OF CRUSTAL DEFORMATION
NEAR ACTIVE FAULTS IN SOUTHERN CALIFORNIA
Final Technical Report, May 31, 2007
Duncan Carr Agnew
Frank K. Wyatt
Institute of Geophysics and Planetary Physics
Scripps Institution of Oceanography
University of California, San Diego
La Jolla, CA 92093-0225
(858) 534-2590 (FAX 534-5332); [email protected]
Aw ard Number: 04HQAG0011
CONTINUOUS BROADBAND MONITORING OF CRUSTAL DEFORMATION
NEAR ACTIVE FAULTS IN SOUTHERN CALIFORNIA
Duncan Carr Agnew
Frank K. Wyatt
Institute of Geophysics and Planetary Physics
Scripps Institution of Oceanography
University of California, San Diego
La Jolla, CA 92093-0225
(858) 534-2590 (FAX 534-5332); [email protected]
Abstract
This grant helps to support the operation of two facilities for the continuous mea-
surement of strain changes in Southern California: Pinon Flat Observatory (PFO),
between the San Jacinto and San Andreas faults, and at Durmid Hill (DHL), near the
southern end of the San Andreas fault—and effectively within the fault zone. The
instruments at these locations—a single longbase strainmeter at DHL, and three
strainmeters and two tiltmeters at PFO—measure crustal deformation in Southern
California for periods from seconds to years. In the period covered by this report we
have observed two changes in long-term strain. At PFO the NW-SE strain reversed
beginning in 2004, though it changed again, fairly abruptly, following the 2005 Anza
earthquake. Signals seen in the days and weeks following this earthquake strongly
suggest large amounts of postseismic slip. At DHL, the strain rate has decreased
slightly after the 1999 Hector Mine earthquake; we continue to see occasional aseis-
mic steps, probably related to local creep on the San Andreas fault nearby.
Accomplishments: Investigations Undertaken, Results
1. Introduction
This grant helps to support the operation of two facilities for the continuous measurement
of strain changes in Southern California: Pinon Flat Observatory (PFO), between the San Jacinto
and San Andreas faults, and at Durmid Hill (DHL), near the southern end of the San Andreas
fault—and effectively within the fault zone. Other operational support for PFO is provided by
SCEC and for DHL by the Plate Boundary Observatory project, with matching funds for both
sites from Scripps Institution of Oceanography.
The instruments at these locations (two longbase strainmeters at DHL, three strainmeters
and two tiltmeters at PFO) measure crustal deformation in Southern California for periods from
seconds to years. By recording strain over this wide range of frequencies these measurements
provide a nearly unique bridge between seismology and geodesy that is rarely available. At
PFO, intercomparison of results from many types of sensors gives the best records available. An
accurate record of strain and tilt changes in the area near the observatories provides a better
understanding of the mechanics of faulting, used both for studies of the seismic cycle in Southern
California and for comparison with other types of measurements of crustal deformation.
This award provides funding primarily for operation of the observatories including support
for power distribution, data recording, preliminary data-processing, and data distribution: all
basic activities, but all needed if the observatory is to operate and provide recordings. (For
DHL—which now has two longbase strainmeters—the operational costs for the new component,
DHM, are covered exclusively by PBO.) Part of the support is to cover the creation of well-
edited versions of the data, under the supervision of the PIs.
In the absence of a significant geophysical event, it is in the nature of this kind of data col-
lection that there may not be something new to report in the data every year; however, even with-
out events, the accumulation of data can reveal new information. This report gives examples of
both kinds of results.
Figure 1
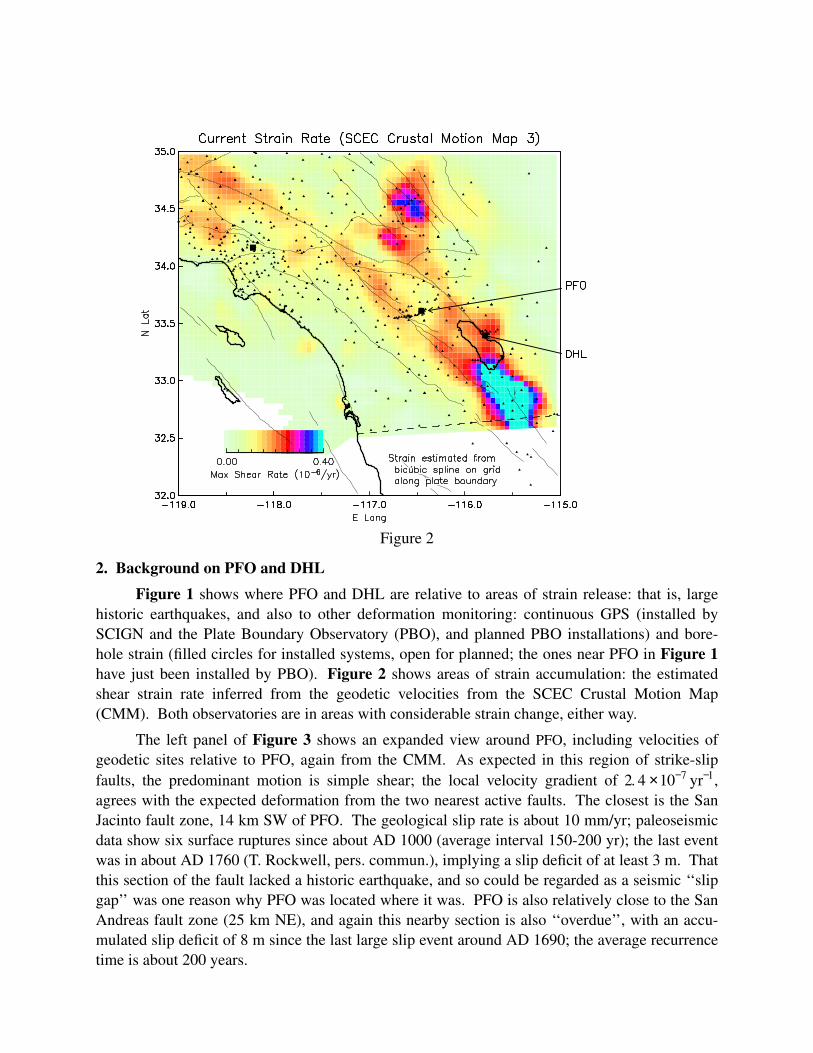
Figure 2
2. Background on PFO and DHL
Figure 1 shows where PFO and DHL are relative to areas of strain release: that is, large
historic earthquakes, and also to other deformation monitoring: continuous GPS (installed by
SCIGN and the Plate Boundary Observatory (PBO), and planned PBO installations) and bore-
hole strain (filled circles for installed systems, open for planned; the ones near PFO in Figure 1
have just been installed by PBO). Figure 2 shows areas of strain accumulation: the estimated
shear strain rate inferred from the geodetic velocities from the SCEC Crustal Motion Map
(CMM). Both observatories are in areas with considerable strain change, either way.
The left panel of Figure 3 shows an expanded view around PFO, including velocities of
geodetic sites relative to PFO, again from the CMM. As expected in this region of strike-slip
faults, the predominant motion is simple shear; the local velocity gradient of 2. 4 ×10⁻⁷ yr−1,
agrees with the expected deformation from the two nearest active faults. The closest is the San
Jacinto fault zone, 14 km SW of PFO. The geological slip rate is about 10 mm/yr; paleoseismic
data show six surface ruptures since about AD 1000 (average interval 150-200 yr); the last event
was in about AD 1760 (T. Rockwell, pers. commun.), implying a slip deficit of at least 3 m. That
this section of the fault lacked a historic earthquake, and so could be regarded as a seismic ‘‘slip
gap’’ was one reason why PFO was located where it was. PFO is also relatively close to the San
Andreas fault zone (25 km NE), and again this nearby section is also ‘‘overdue’’, with an accu-
mulated slip deficit of 8 m since the last large slip event around AD 1690; the average recurrence
time is about 200 years.
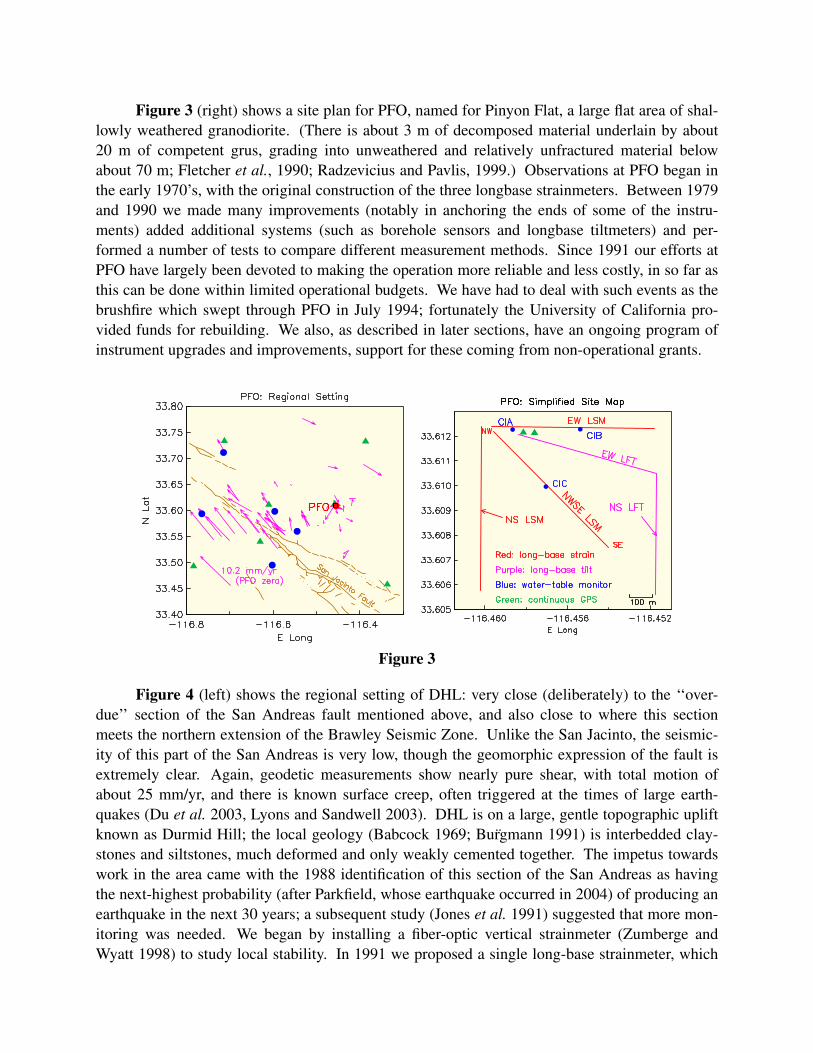
Figure 3 (right) shows a site plan for PFO, named for Pinyon Flat, a large flat area of shal-
lowly weathered granodiorite. (There is about 3 m of decomposed material underlain by about
20 m of competent grus, grading into unweathered and relatively unfractured material below
about 70 m; Fletcher et al., 1990; Radzevicius and Pavlis, 1999.) Observations at PFO began in
the early 1970’s, with the original construction of the three longbase strainmeters. Between 1979
and 1990 we made many improvements (notably in anchoring the ends of some of the instru-
ments) added additional systems (such as borehole sensors and longbase tiltmeters) and per-
formed a number of tests to compare different measurement methods. Since 1991 our efforts at
PFO have largely been devoted to making the operation more reliable and less costly, in so far as
this can be done within limited operational budgets. We hav e had to deal with such events as the
brushfire which swept through PFO in July 1994; fortunately the University of California pro-
vided funds for rebuilding. We also, as described in later sections, have an ongoing program of
instrument upgrades and improvements, support for these coming from non-operational grants.
Figure 3
Figure 4 (left) shows the regional setting of DHL: very close (deliberately) to the ‘‘over-
due’’ section of the San Andreas fault mentioned above, and also close to where this section
meets the northern extension of the Brawley Seismic Zone. Unlike the San Jacinto, the seismic-
ity of this part of the San Andreas is very low, though the geomorphic expression of the fault is
extremely clear. Again, geodetic measurements show nearly pure shear, with total motion of
about 25 mm/yr, and there is known surface creep, often triggered at the times of large earth-
quakes (Du et al. 2003, Lyons and Sandwell 2003). DHL is on a large, gentle topographic uplift
known as Durmid Hill; the local geology (Babcock 1969; Bur gmann 1991) is interbedded clay-
stones and siltstones, much deformed and only weakly cemented together. The impetus towards
work in the area came with the 1988 identification of this section of the San Andreas as having
the next-highest probability (after Parkfield, whose earthquake occurred in 2004) of producing an
earthquake in the next 30 years; a subsequent study (Jones et al. 1991) suggested that more mon-
itoring was needed. We beg an by installing a fiber-optic vertical strainmeter (Zumberge and
Wyatt 1998) to study local stability. In 1991 we proposed a single long-base strainmeter, which
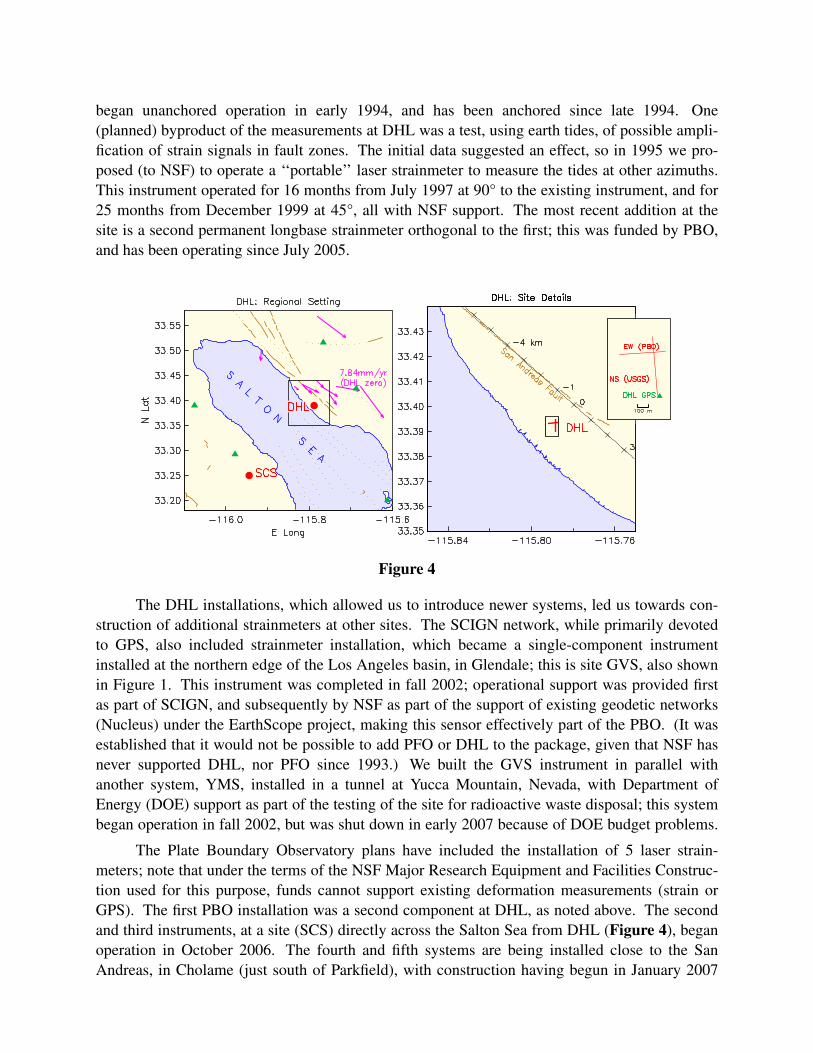
began unanchored operation in early 1994, and has been anchored since late 1994. One
(planned) byproduct of the measurements at DHL was a test, using earth tides, of possible ampli-
fication of strain signals in fault zones. The initial data suggested an effect, so in 1995 we pro-
posed (to NSF) to operate a ‘‘portable’’ laser strainmeter to measure the tides at other azimuths.
This instrument operated for 16 months from July 1997 at 90° to the existing instrument, and for
25 months from December 1999 at 45°, all with NSF support. The most recent addition at the
site is a second permanent longbase strainmeter orthogonal to the first; this was funded by PBO,
and has been operating since July 2005.
Figure 4
The DHL installations, which allowed us to introduce newer systems, led us towards con-
struction of additional strainmeters at other sites. The SCIGN network, while primarily devoted
to GPS, also included strainmeter installation, which became a single-component instrument
installed at the northern edge of the Los Angeles basin, in Glendale; this is site GVS, also shown
in Figure 1. This instrument was completed in fall 2002; operational support was provided first
as part of SCIGN, and subsequently by NSF as part of the support of existing geodetic networks
(Nucleus) under the EarthScope project, making this sensor effectively part of the PBO. (It was
established that it would not be possible to add PFO or DHL to the package, given that NSF has
never supported DHL, nor PFO since 1993.) We built the GVS instrument in parallel with
another system, YMS, installed in a tunnel at Yucca Mountain, Nevada, with Department of
Energy (DOE) support as part of the testing of the site for radioactive waste disposal; this system
began operation in fall 2002, but was shut down in early 2007 because of DOE budget problems.
The Plate Boundary Observatory plans have included the installation of 5 laser strain-
meters; note that under the terms of the NSF Major Research Equipment and Facilities Construc-
tion used for this purpose, funds cannot support existing deformation measurements (strain or
GPS). The first PBO installation was a second component at DHL, as noted above. The second
and third instruments, at a site (SCS) directly across the Salton Sea from DHL (Figure 4), began
operation in October 2006. The fourth and fifth systems are being installed close to the San
Andreas, in Cholame (just south of Parkfield), with construction having begun in January 2007
and to be completed a year later.
3. Recent Strainmeter Measurements of Earthquake-Related Phenomena
We now show what the instruments at PFO and DHL are capable of, by providing exam-
ples of specific cases. We start with the long-period changes caused by tectonic sources and then
describe in some detail one of the most interesting results of the last three years: large aseismic
strains observed following the 2005 Anza earthquake.
Figure 5
3.1. Long-term Strain Changes at DHL
In considering first the long-term (months and more) performance of these instruments, we
are examining something that is a severe test of any continuously recording strain-measuring sys-
tem (borehole or longbase)—the secular signal—but one that long-base instruments have per-
formed well in, such that they giv e complete coverage of the strain spectrum from seismic fre-
quencies to the longest-term secular strains.
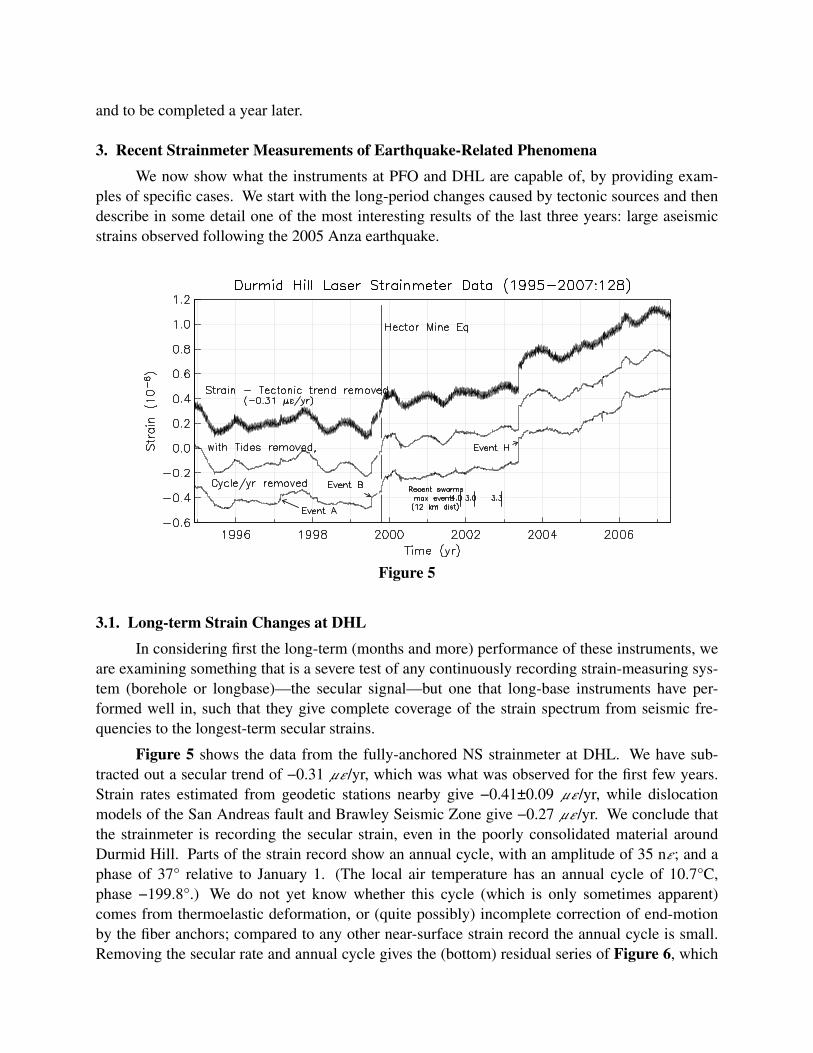
Figure 5 shows the data from the fully-anchored NS strainmeter at DHL. We hav e sub-
tracted out a secular trend of −0.31 µε /yr, which was what was observed for the first few years.
Strain rates estimated from geodetic stations nearby give −0.41±0.09 µε /yr, while dislocation
models of the San Andreas fault and Brawley Seismic Zone give −0.27 µε /yr. We conclude that
the strainmeter is recording the secular strain, even in the poorly consolidated material around
Durmid Hill. Parts of the strain record show an annual cycle, with an amplitude of 35 nε ; and a
phase of 37° relative to January 1. (The local air temperature has an annual cycle of 10.7°C,
phase −199.8°.) We do not yet know whether this cycle (which is only sometimes apparent)
comes from thermoelastic deformation, or (quite possibly) incomplete correction of end-motion
by the fiber anchors; compared to any other near-surface strain record the annual cycle is small.
Removing the secular rate and annual cycle gives the (bottom) residual series of Figure 6, which
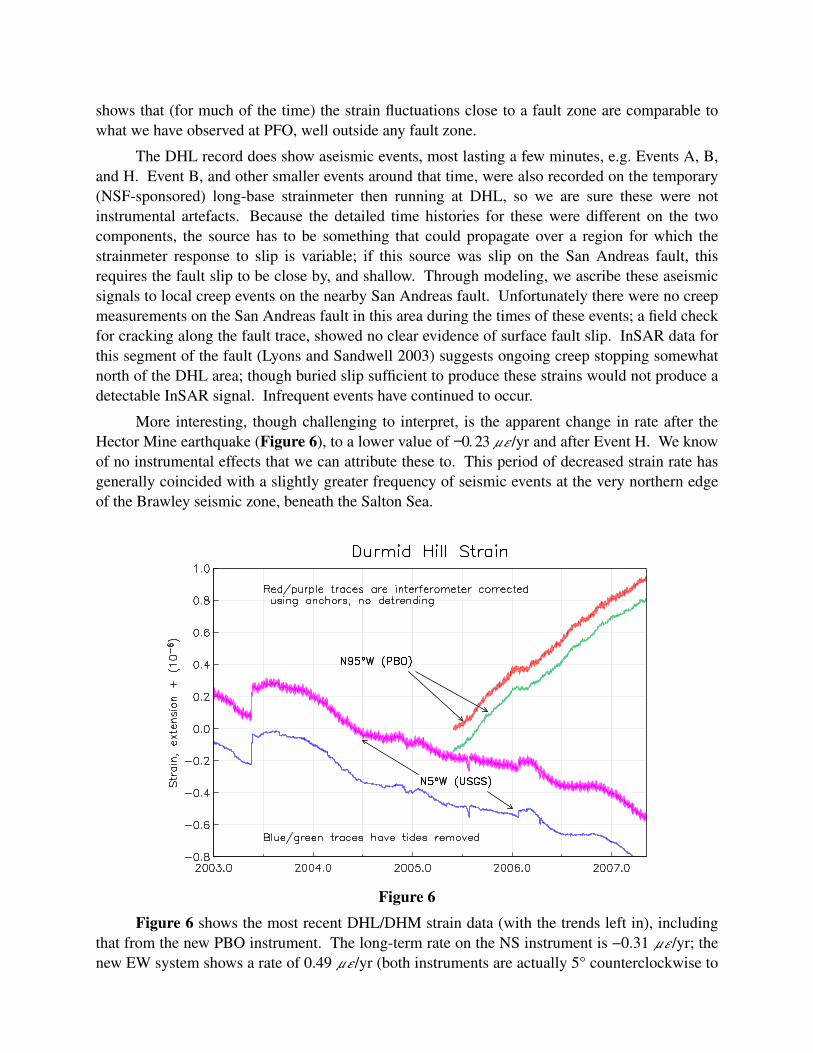
shows that (for much of the time) the strain fluctuations close to a fault zone are comparable to
what we have observed at PFO, well outside any fault zone.
The DHL record does show aseismic events, most lasting a few minutes, e.g. Events A, B,
and H. Event B, and other smaller events around that time, were also recorded on the temporary
(NSF-sponsored) long-base strainmeter then running at DHL, so we are sure these were not
instrumental artefacts. Because the detailed time histories for these were different on the two
components, the source has to be something that could propagate over a region for which the
strainmeter response to slip is variable; if this source was slip on the San Andreas fault, this
requires the fault slip to be close by, and shallow. Through modeling, we ascribe these aseismic
signals to local creep events on the nearby San Andreas fault. Unfortunately there were no creep
measurements on the San Andreas fault in this area during the times of these events; a field check
for cracking along the fault trace, showed no clear evidence of surface fault slip. InSAR data for
this segment of the fault (Lyons and Sandwell 2003) suggests ongoing creep stopping somewhat
north of the DHL area; though buried slip sufficient to produce these strains would not produce a
detectable InSAR signal. Infrequent events have continued to occur.
More interesting, though challenging to interpret, is the apparent change in rate after the
Hector Mine earthquake (Figure 6), to a lower value of −0. 23 µε /yr and after Event H. We know
of no instrumental effects that we can attribute these to. This period of decreased strain rate has
generally coincided with a slightly greater frequency of seismic events at the very northern edge
of the Brawley seismic zone, beneath the Salton Sea.
Figure 6
Figure 6 shows the most recent DHL/DHM strain data (with the trends left in), including
that from the new PBO instrument. The long-term rate on the NS instrument is −0.31 µε /yr; the
new EW system shows a rate of 0.49 µε /yr (both instruments are actually 5° counterclockwise to
the directions given, to be at 45° to the local fault strike). These rates are consistent with the
shear expected from a dislocation model, though they, like the geodetic results, imply a local
dilatation as well.
3.2. Long-term Strain Changes at PFO
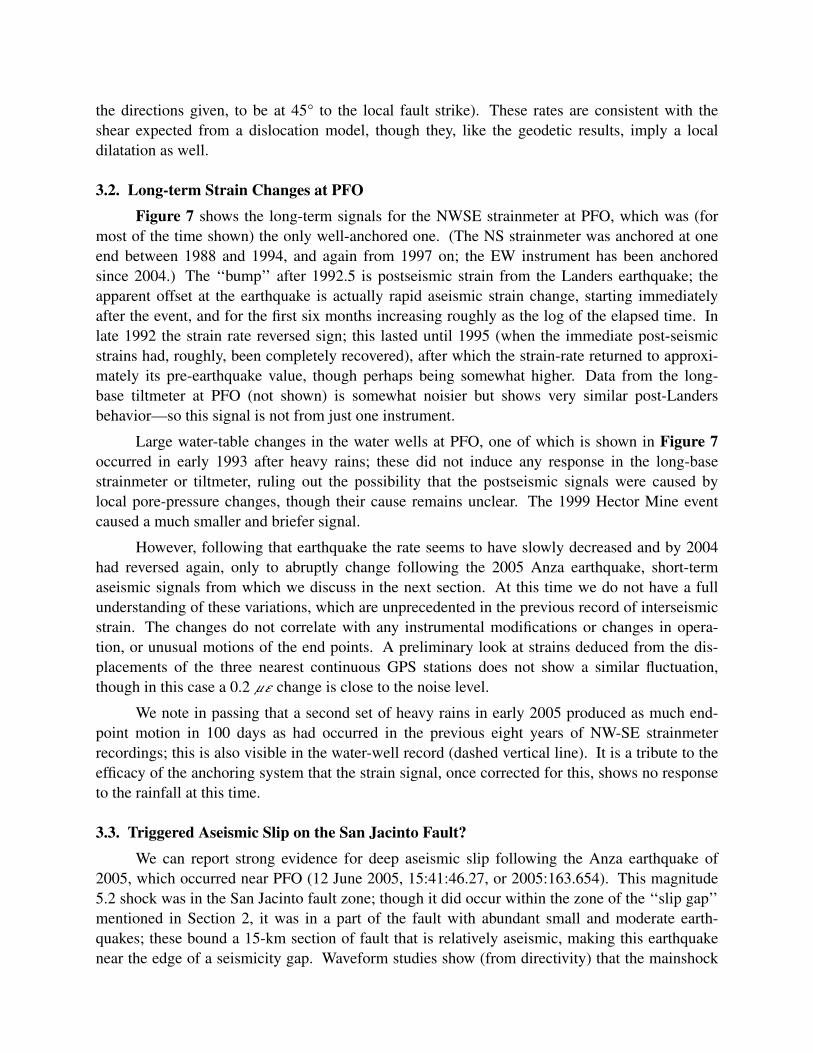
Figure 7 shows the long-term signals for the NWSE strainmeter at PFO, which was (for
most of the time shown) the only well-anchored one. (The NS strainmeter was anchored at one
end between 1988 and 1994, and again from 1997 on; the EW instrument has been anchored
since 2004.) The ‘‘bump’’ after 1992.5 is postseismic strain from the Landers earthquake; the
apparent offset at the earthquake is actually rapid aseismic strain change, starting immediately
after the event, and for the first six months increasing roughly as the log of the elapsed time. In
late 1992 the strain rate reversed sign; this lasted until 1995 (when the immediate post-seismic
strains had, roughly, been completely recovered), after which the strain-rate returned to approxi-
mately its pre-earthquake value, though perhaps being somewhat higher. Data from the long-
base tiltmeter at PFO (not shown) is somewhat noisier but shows very similar post-Landers
behavior—so this signal is not from just one instrument.
Large water-table changes in the water wells at PFO, one of which is shown in Figure 7
occurred in early 1993 after heavy rains; these did not induce any response in the long-base
strainmeter or tiltmeter, ruling out the possibility that the postseismic signals were caused by
local pore-pressure changes, though their cause remains unclear. The 1999 Hector Mine event
caused a much smaller and briefer signal.
However, following that earthquake the rate seems to have slowly decreased and by 2004
had reversed again, only to abruptly change following the 2005 Anza earthquake, short-term
aseismic signals from which we discuss in the next section. At this time we do not have a full
understanding of these variations, which are unprecedented in the previous record of interseismic
strain. The changes do not correlate with any instrumental modifications or changes in opera-
tion, or unusual motions of the end points. A preliminary look at strains deduced from the dis-
placements of the three nearest continuous GPS stations does not show a similar fluctuation,
though in this case a 0.2 µε change is close to the noise level.
We note in passing that a second set of heavy rains in early 2005 produced as much end-
point motion in 100 days as had occurred in the previous eight years of NW-SE strainmeter
recordings; this is also visible in the water-well record (dashed vertical line). It is a tribute to the
efficacy of the anchoring system that the strain signal, once corrected for this, shows no response
to the rainfall at this time.
3.3. Triggered Aseismic Slip on the San Jacinto Fault?
We can report strong evidence for deep aseismic slip following the Anza earthquake of
2005, which occurred near PFO (12 June 2005, 15:41:46.27, or 2005:163.654). This magnitude
5.2 shock was in the San Jacinto fault zone; though it did occur within the zone of the ‘‘slip gap’’
mentioned in Section 2, it was in a part of the fault with abundant small and moderate earth-
quakes; these bound a 15-km section of fault that is relatively aseismic, making this earthquake
near the edge of a seismicity gap. Wav eform studies show (from directivity) that the mainshock
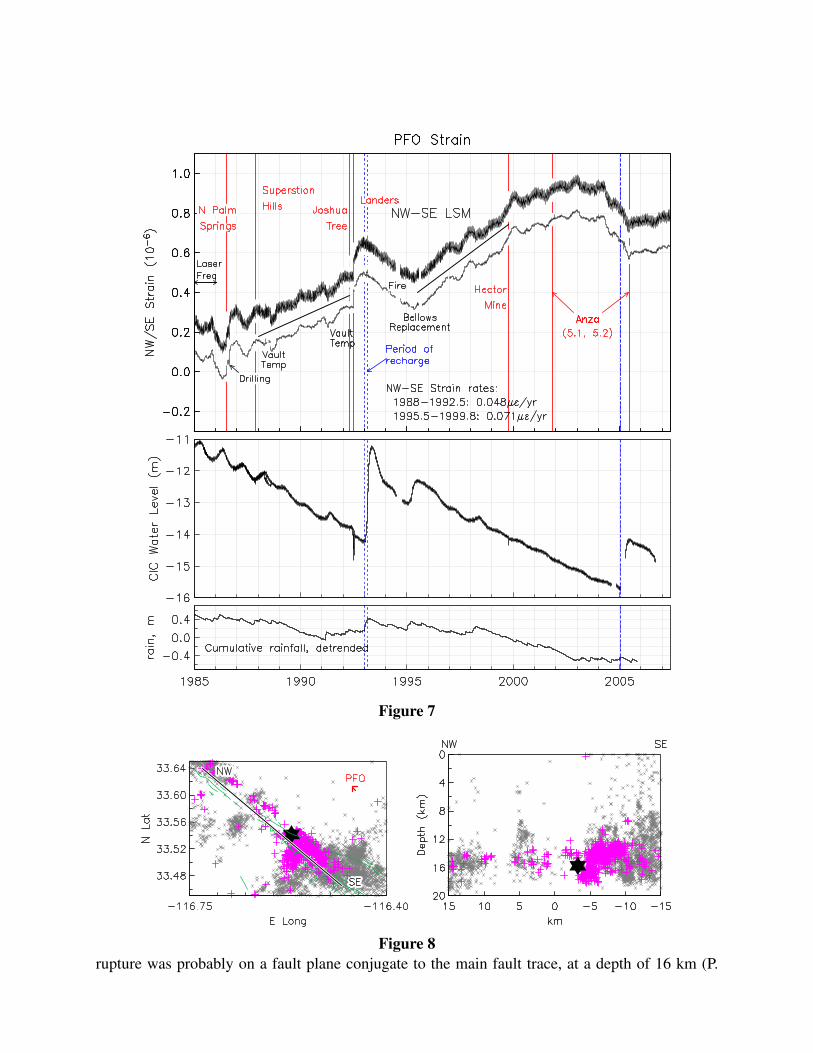
Figure 7
Figure 8
rupture was probably on a fault plane conjugate to the main fault trace, at a depth of 16 km (P.
Figure 9
Shearer, pers. commun.).
This earthquake was followed by a normally decaying aftershock sequence, with the time
history shown in Figure 9, and from a volume (purple blob in Figure 8) that is commensurate
with the likely rupture zone. However, it also triggered an increase of seismicity along the fault
zone NW of the epicenter, within the seismicity gap: Figure 8 shows a map view and cross-sec-
tion, with the aftershocks and triggered events in purple, background seismicity in gray, and the
mainshock epicenter as a black star. The spatial extent of triggered seismicity suggested possible
triggered slip over a larger part of the fault zone; the strain changes at PFO strongly support that
such slip occurred.
Figure 9 shows the time series from all three long-base strainmeters at PFO, from 120
days before the earthquake to the end of 2005. We hav e removed the tides (except at the end, for
scale), and also variations at 1 and 2 cycles/day from local thermoelastic effects. We also show
the water-height series from three of the water wells at PFO, and the level of activity in the after-
shock zone. The coseismic offset was not recorded because strong ground shaking deflected the
laser beam, and we have not displayed its (modeled) magnitude as its size would mask the varia-
tion of interest. All three strain records show a clear strain change after the earthquake, with
equal and opposite responses from the NS and EW components, and a much smaller response for
the NW-SE—which does, as mentioned above, change its long-term rate following the earth-
quake.
The diversity of responses argues against this being some kind of local response at PFO; it
is difficult to imagine such a strain showing this kind of azimuthal selectivity. The likeliest non-
tectonic source of such a response would be equilibration of the groundwater following the shak-
ing, but the water-well records show only a small coseismic change, recovered within less than a
day, and no significant modification to the long-term changes caused by the heavy rains of the
previous winter: recharge followed by a return to a long-term decrease in level.
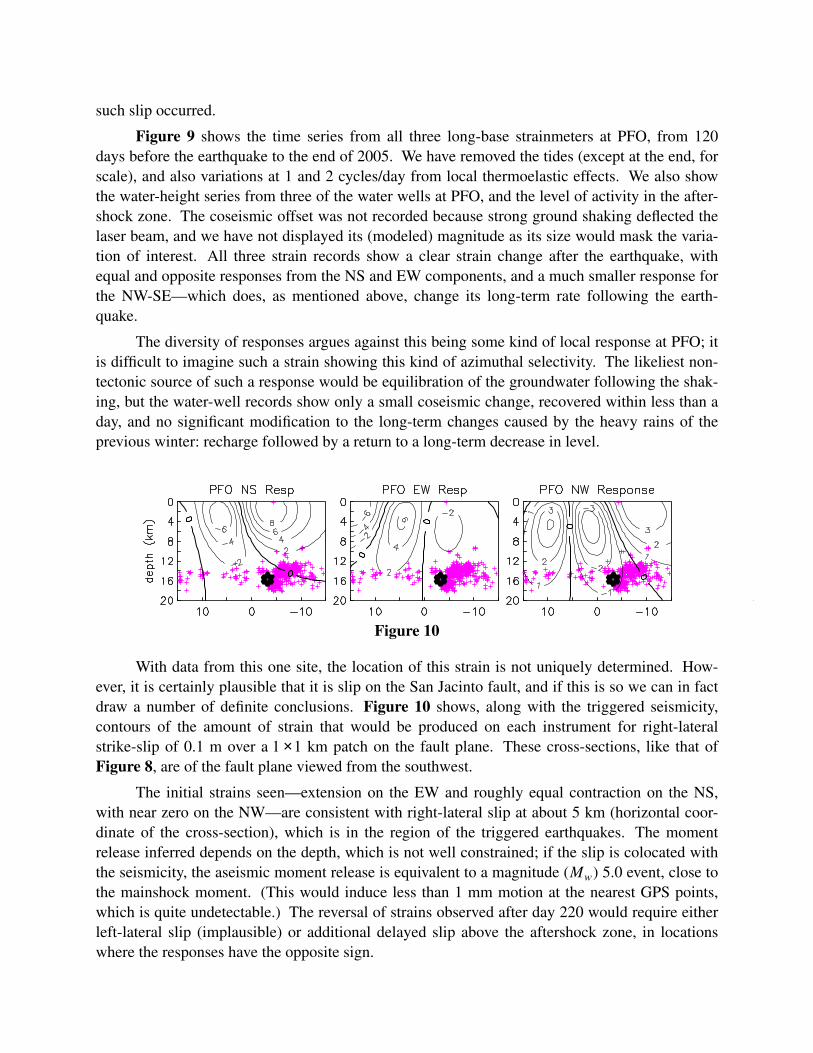
Figure 10
With data from this one site, the location of this strain is not uniquely determined. How-
ev er, it is certainly plausible that it is slip on the San Jacinto fault, and if this is so we can in fact
draw a number of definite conclusions. Figure 10 shows, along with the triggered seismicity,
contours of the amount of strain that would be produced on each instrument for right-lateral
strike-slip of 0.1 m over a 1 ×1 km patch on the fault plane. These cross-sections, like that of
Figure 8, are of the fault plane viewed from the southwest.
The initial strains seen—extension on the EW and roughly equal contraction on the NS,
with near zero on the NW—are consistent with right-lateral slip at about 5 km (horizontal coor-
dinate of the cross-section), which is in the region of the triggered earthquakes. The moment
release inferred depends on the depth, which is not well constrained; if the slip is colocated with
the seismicity, the aseismic moment release is equivalent to a magnitude (Mw) 5.0 event, close to
the mainshock moment. (This would induce less than 1 mm motion at the nearest GPS points,
which is quite undetectable.) The reversal of strains observed after day 220 would require either
left-lateral slip (implausible) or additional delayed slip above the aftershock zone, in locations
where the responses have the opposite sign.
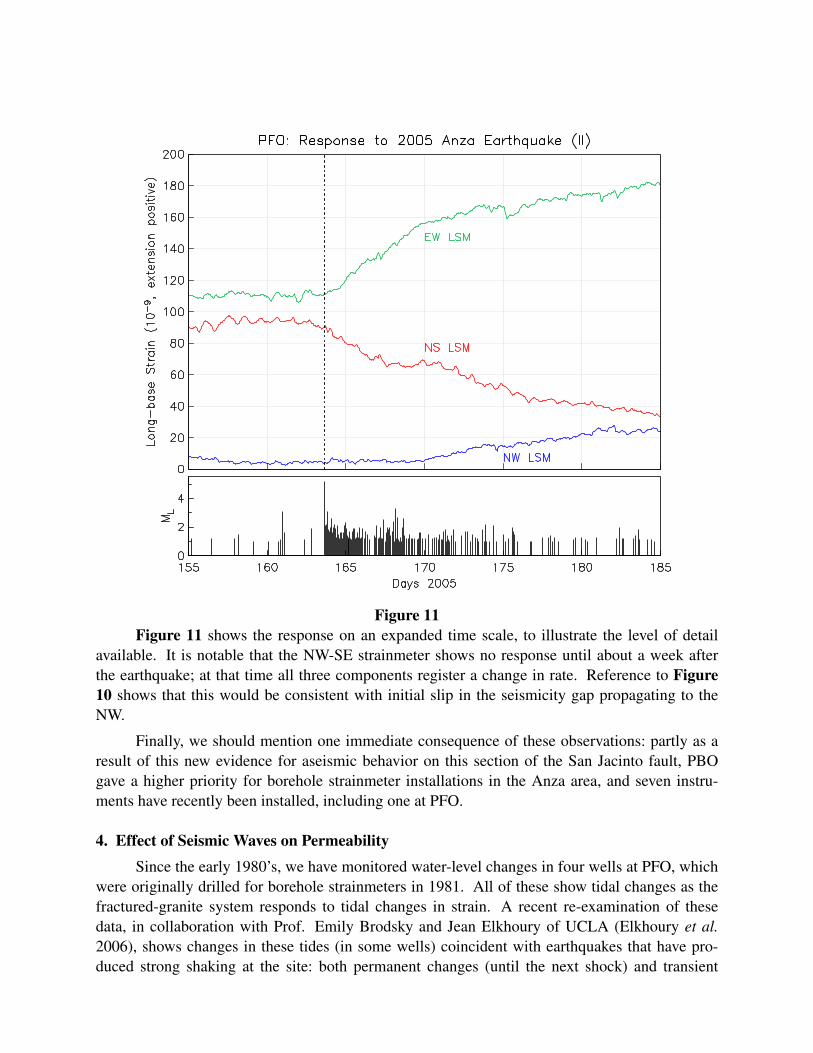
Figure 11
Figure 11 shows the response on an expanded time scale, to illustrate the level of detail
available. It is notable that the NW-SE strainmeter shows no response until about a week after
the earthquake; at that time all three components register a change in rate. Reference to Figure
10 shows that this would be consistent with initial slip in the seismicity gap propagating to the
NW.
Finally, we should mention one immediate consequence of these observations: partly as a
result of this new evidence for aseismic behavior on this section of the San Jacinto fault, PBO
gave a higher priority for borehole strainmeter installations in the Anza area, and seven instru-
ments have recently been installed, including one at PFO.
4. Effect of Seismic Wav es on Permeability
Since the early 1980’s, we have monitored water-level changes in four wells at PFO, which
were originally drilled for borehole strainmeters in 1981. All of these show tidal changes as the
fractured-granite system responds to tidal changes in strain. A recent re-examination of these
data, in collaboration with Prof. Emily Brodsky and Jean Elkhoury of UCLA (Elkhoury et al.
2006), shows changes in these tides (in some wells) coincident with earthquakes that have pro-
duced strong shaking at the site: both permanent changes (until the next shock) and transient
changes that decay over the weeks following the earthquake. These presumably reflect changes
in the local hydraulic regime, and can serve as a useful model for understanding how cracks in
the crust can be affected by, and heal after, large dynamic strains—a topic of clear interest for
understanding possible dynamic triggering of earthquakes.
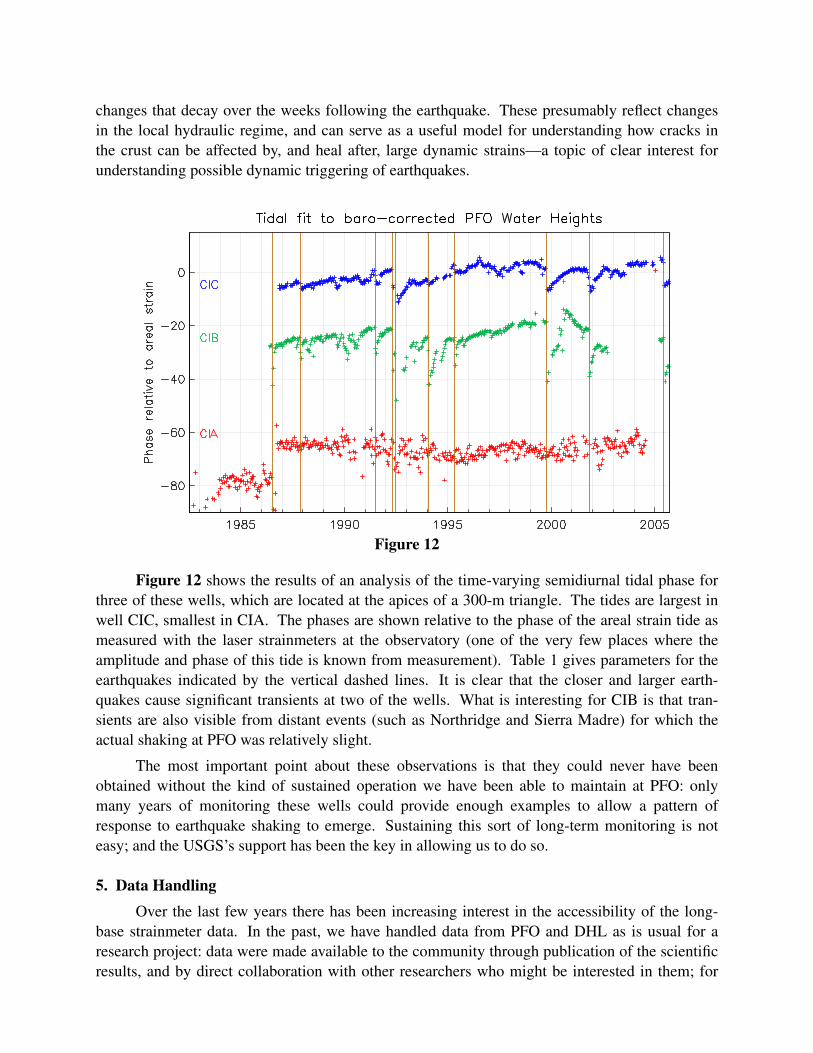
Figure 12
Figure 12 shows the results of an analysis of the time-varying semidiurnal tidal phase for
three of these wells, which are located at the apices of a 300-m triangle. The tides are largest in
well CIC, smallest in CIA. The phases are shown relative to the phase of the areal strain tide as
measured with the laser strainmeters at the observatory (one of the very few places where the
amplitude and phase of this tide is known from measurement). Table 1 gives parameters for the
earthquakes indicated by the vertical dashed lines. It is clear that the closer and larger earth-
quakes cause significant transients at two of the wells. What is interesting for CIB is that tran-
sients are also visible from distant events (such as Northridge and Sierra Madre) for which the
actual shaking at PFO was relatively slight.
The most important point about these observations is that they could never hav e been
obtained without the kind of sustained operation we have been able to maintain at PFO: only
many years of monitoring these wells could provide enough examples to allow a pattern of
response to earthquake shaking to emerge. Sustaining this sort of long-term monitoring is not
easy; and the USGS’s support has been the key in allowing us to do so.
5. Data Handling
Over the last few years there has been increasing interest in the accessibility of the long-
base strainmeter data. In the past, we have handled data from PFO and DHL as is usual for a
research project: data were made available to the community through publication of the scientific
results, and by direct collaboration with other researchers who might be interested in them; for
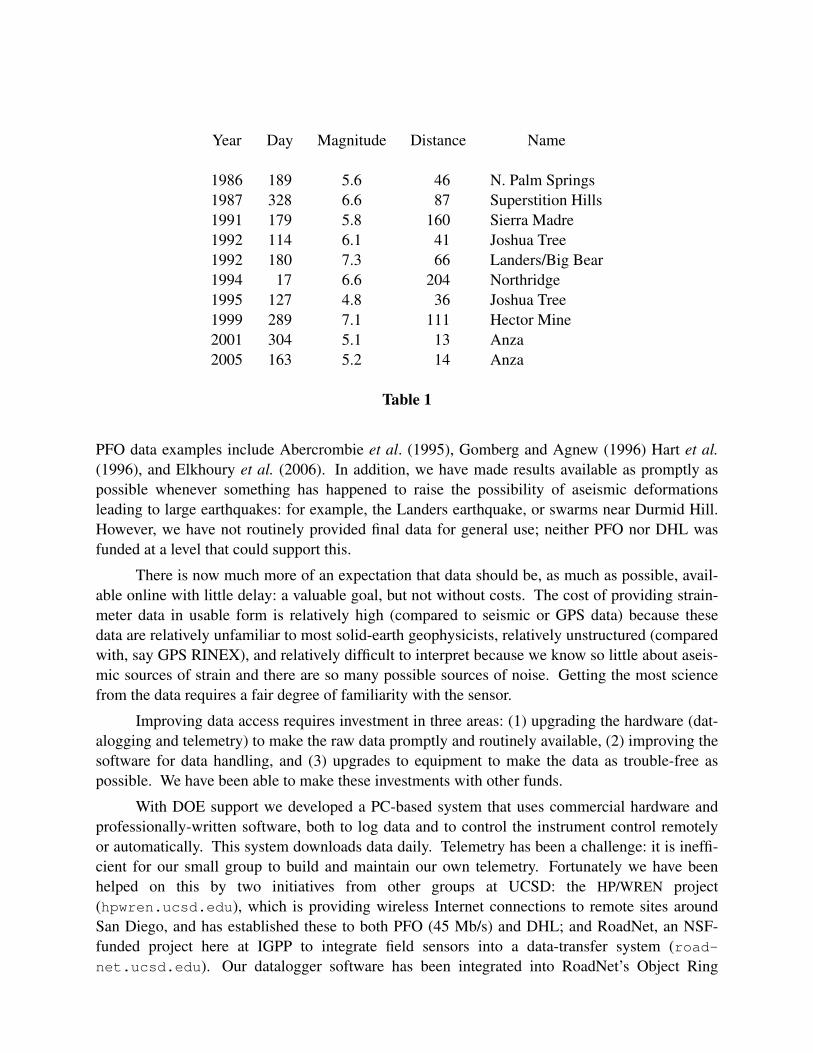
Year Day Magnitude Distance Name
1986 189 5.6 46 N. Palm Springs
1987 328 6.6 87 Superstition Hills
1991 179 5.8 160 Sierra Madre
1992 114 6.1 41 Joshua Tree
1992 180 7.3 66 Landers/Big Bear
1994 17 6.6 204 Northridge
1995 127 4.8 36 Joshua Tree
1999 289 7.1 111 Hector Mine
2001 304 5.1 13 Anza
2005 163 5.2 14 Anza
Table 1
PFO data examples include Abercrombie et al. (1995), Gomberg and Agnew (1996) Hart et al.
(1996), and Elkhoury et al. (2006). In addition, we have made results available as promptly as
possible whenever something has happened to raise the possibility of aseismic deformations
leading to large earthquakes: for example, the Landers earthquake, or swarms near Durmid Hill.
However, we hav e not routinely provided final data for general use; neither PFO nor DHL was
funded at a level that could support this.
There is now much more of an expectation that data should be, as much as possible, avail-
able online with little delay: a valuable goal, but not without costs. The cost of providing strain-
meter data in usable form is relatively high (compared to seismic or GPS data) because these
data are relatively unfamiliar to most solid-earth geophysicists, relatively unstructured (compared
with, say GPS RINEX), and relatively difficult to interpret because we know so little about aseis-
mic sources of strain and there are so many possible sources of noise. Getting the most science
from the data requires a fair degree of familiarity with the sensor.
Improving data access requires investment in three areas: (1) upgrading the hardware (dat-
alogging and telemetry) to make the raw data promptly and routinely available, (2) improving the
software for data handling, and (3) upgrades to equipment to make the data as trouble-free as
possible. We hav e been able to make these investments with other funds.
With DOE support we developed a PC-based system that uses commercial hardware and
professionally-written software, both to log data and to control the instrument control remotely
or automatically. This system downloads data daily. Telemetry has been a challenge: it is ineffi-
cient for our small group to build and maintain our own telemetry. Fortunately we have been
helped on this by two initiatives from other groups at UCSD: the HP/WREN project
(hpwren.ucsd.edu), which is providing wireless Internet connections to remote sites around
San Diego, and has established these to both PFO (45 Mb/s) and DHL; and RoadNet, an NSF-
funded project here at IGPP to integrate field sensors into a data-transfer system (road-
net.ucsd.edu). Our datalogger software has been integrated into RoadNet’s Object Ring
Buffer system, providing realtime 1-Hz data from both DHL and PFO.
Most of the research community is best served by downloadable files of final data, regu-
larly updated. For research purposes we updated data only occasionally (in part because of the
personnel issues described above); to provide regular updates at an acceptable level of effort has
required additional software development to process the raw data, assemble it into files for edit-
ing, organize the edits, and produce the final results—also mundane, but not simple (indeed, still
being worked on). Part of this was developing a filter suitable for producing 5-minute data from
1-Hz data, while tuned to the ways in which strainmeter data are handled (Agnew and Hodgkin-
son 2007). All of this development was supported by the PBO, for which there is a clear expec-
tation of regularly-updated data. At this time both the PFO and DHL data are being processed
using these packages, so that all data are being handled in the same way.
There remains the question of how to make the data available. We hav e used our website
[http://pfostrain.ucsd.edu], to provide 5-minute raw data for the time since the new log-
gers were installed (2003:122 for DHL, 2005:140 for PFO), in a simple ASCII format. While
this is manageable, there are advantages in making this task, also, parallel with PBO; so we are
working to provide PFO and DHL data to the NCEDC in the same formats as PBO.
With other funding we have spent considerable effort to help build a community of users
for strain data, co-teaching in two workshops organized by UNAVCO in the summers of 2005
and 2006, and documenting and making available our processing software (http://igpp-
web.ucsd.edu/˜agnew/piasd).
To produce the final strain series requires us to combine series from the main interferome-
ter, two optical-anchor interferometers, laser-frequency data, and the vacuum pressure, with use-
ful auxiliary information being the temperatures of the end buildings and the optics tables, and
environmental data from the site. Combining the data when there are no problems is not diffi-
cult; but when there are, skill is needed to edit the data to provide the best measure of earth
strain. In our experience, editing the data is a matter of judgment, aided by experience; it is also
helped by examining supplementary information, notably records of environmental data, and also
‘‘metadata’’—the whole range of records of what was done to each instrument. And, as data are
edited, there is a feedback process: not infrequently, only after the data have been edited can sub-
tle problems be identified which call for further editing. Some of this could be automated, but
since any simple system would not significantly reduce the effort required, and because our pri-
mary aim has been to produce the highest-quality results, we have not invested heavily in auto-
mated editing.
Given the range of artefacts that can appear in the raw data the observations are most likely
to be used more if processed data is routinely available and we have found that this is more
important than realtime access. This need for processing is not unusual for geodetic data: many
geophysicists use the velocities, the time series, or the covariance files produced by the GPS pro-
cessing centers; very few process the raw data.
Data from the laser strainmeters at PFO and DHL are thus being made available to the
research community by providing data to the NCEDC in the same formats as PBO, specifically:
• Raw data as it is downloaded from the datalogger, in the datalogger (Ice-9) format; PBO
has developed tools for conversion to SEED.
• Fully-corrected and edited data in the XML format used by PBO, with a latency of no
more than six months.
Both raw and edited data are to be provided from the start of 2007. We are committed of course
to making older data available on request.
In addition, plots of raw data continue to be available in real time through the RoadNet
system; see http://mercali.ucsd.edu/waveform.cgi; for the NS LSM at DHL, click on
DHL1, channel 14; for the NS LSM at PFO, click on PFO1, channel 36; for the EW LSM, chan-
nel 37; for the NW LSM, 38. (None of these are corrected.)
We expect these data to be used for decision-making in the wake of large earthquakes or
other possible events; for better estimates of seismic hazard around the San Andreas and San Jac-
into faults; and for the broader understanding of the earthquake cycle in Southern California.
References
R. E. Abercrombie, D. C. Agnew, and F. K. Wyatt, “Testing a model of earthquake nucleation,”
Bull. Seismol. Soc. Amer., 85, pp. 1873-1878 (1995).
D. C. Agnew and K. M. Hodgkinson, “Designing compact causal digital filters for low-frequency
strainmeter data,” Bull. Seismol. Soc. Amer., 97, pp. 91-99 (2007).
E. A. Babcock, “Structural geology and geophysics of the Durmid area, Imperial Valley, Califor-
nia,” Ph.D Thesis, University of California Riverside (1969).
R. Bur gmann, “Transpression along the southern San Andreas Fault, Durmid Hill,” Tectonics, 10,
pp. 1152-1163 (1991).
W-x. Du, L. R. Sykes, B. Shaw, and C. H. Scholz, “Triggered aseismic fault slip from nearby
earthquakes, static or dynamic effect?,” J. Geophys. Res., 108.B2.ESE24, pp. 1-21 (2003).
J. E. Elkhoury, E. E. Brodsky, and D. C. Agnew, “Seismic wav es increase permeability,” Nature,
441, pp. 1135-1138 (2006).
J. Fletcher, T. Fumal, H.-P. Liu, and J. C. Carroll, “Near-surface velocities and attenuation at two
boreholes near Anza, California from logging data,” Bull. Seismol. Soc. Amer., 80, pp.
807-831 (1990).
J. Gomberg and D. C. Agnew, “The accuracy of seismic estimates of dynamic strains: an evalua-
tion using strainmeter and seismometer data from Piñon Flat Observatory, California,”
Bull. Seismol. Soc. Amer., 86, pp. 212-220 (1996).
R. H. G. Hart, M. T. Gladwin, R. L. Gwyther, D. C. Agnew, and F. K. Wyatt, “Tidal calibration
of borehole strainmeters: removing the effects of local inhomogeneity,” J. Geophys. Res.,
101, pp. 25553-25571 (1996).
L. M. Jones, K. E. Sieh, D. Agnew, C. Allen, R. Bilham, M. Ghilarducci, B. Hager, E. Hauksson,
K. Hudnut, D. Jackson, and A. Sylvester, “Short-Term Earthquake Hazard Assessment for
the Southern San Andreas Fault, Southern California,” USGS Open-File Report 91-32, U.
S. Geological Survey (1991).
S. Lyons and D. Sandwell, “Fault creep along the southern San Andreas from interferometric
synthetic aperture radar, permanent scatterers, and stacking,” J. Geophys. Res., 108, pp.
ETG 11-1-ETG 11-24 (2003).
S. J. Radzevicius and G. L. Pavlis, “High-frequency reflections in granite: Delineation of the
weathering front in granodiorite at Piñon Flat, California,” Geophysics, 64, pp. 1828-1835
(1999).
M. A. Zumberge and F. K. Wyatt, “Optical fiber interferometers for referencing surface bench-
marks to depth,” Pure Appl. Geophys., 152, pp. 221-246 (1998).

Bibliography
Elkhoury, J. E., E. E. Brodsky, and D. C. Agnew (2006). Seismic waves increase permeability,
Nature, 441, 1135-1138.
Agnew, D. C., and K. M. Hodgkinson (2007). Designing compact causal digital filters for low-
frequency strainmeter data, Bull. Seismol. Soc. Amer., 97, 91-99.