Embed Size (px)
Citation preview

Western Michigan University Western Michigan University
ScholarWorks at WMU ScholarWorks at WMU
Honors Theses Lee Honors College
4-14-2020
Paper Recycling Fiber Recapture Paper Recycling Fiber Recapture
Abigail Cortright Western Michigan University, [email protected]
Follow this and additional works at: https://scholarworks.wmich.edu/honors_theses
Part of the Other Chemical Engineering Commons, and the Other Engineering Commons
Recommended Citation Recommended Citation Cortright, Abigail, "Paper Recycling Fiber Recapture" (2020). Honors Theses. 3237. https://scholarworks.wmich.edu/honors_theses/3237
This Honors Thesis-Open Access is brought to you for free and open access by the Lee Honors College at ScholarWorks at WMU. It has been accepted for inclusion in Honors Theses by an authorized administrator of ScholarWorks at WMU. For more information, please contact [email protected].

Ryan Binkowski, Abigail Cortright, William Hettel, Erin Riley & Ivan Soto Yoda Chemical Company Paper Division Design Engineer Team 4601 Campus Drive Kalamazoo MI, 49008A April 24th, 2020 James Springstead, Division Manager Yoda Chemical Company, Kalamazoo Division 4601 Campus Drive Kalamazoo MI, 49008
Dear James Springstead,
The following report, Paper Recycling Fiber Recapture, has been completed and is enclosed. The purpose of this project was to evaluate the amount of recoverable fiber that could be obtained from five separate waste streams in the facility. This project began on January 13th, 2020 and was completed on April 8th, 2020.
The results of the analysis examined two possible situations where rerouting piping in the facility could allow for a recovery of fiber, reducing the mill’s overall landfill and fiber purchasing costs. In Options One and Two, rejected fiber streams were rerouted back into the process either at the hydropulper or to the fractionation process, while piping was changed around the hydrocyclone cleaning system to allow accepts from the secondary hydrocyclone cleaner to proceed to the paper machine. A third option focused on alternative equipment additions that could be made to improve hydrocyclone cleaners and pressure screens. The conclusion found that Option One would be the best to install in the facility. From the analysis, it can be seen in Option One that 5.26 kg/min of fiber was recovered through an investment of $217,970.70, leading to $522,333.87 in annual savings. Option Two also saved 5.26 kg/min of fiber, but through a higher investment of $224,004.30 and a lower annual savings of $516,699.15. This is submitted as a final copy of the report. Please feel free to contact us if you have any concerns or questions. Sincerely, Ivan Soto Abigail Cortright William Hettel
Erin Riley Ryan Binkowski

Executive Summary The goal of the Yoda Chemical Company Paper Recycling Fiber Recapture project and subsequent report was to identify and recommend plant optimization opportunities associated with the potential recovery of five waste streams. Additionally, an analysis of the upgrade’s design was completed in order to determine the economic viability of fiber recapture. Beginning the analysis, the five waste streams were identified and analyzed. The waste streams include the top liner, back liner, and filler liner primary cleaner rejects on the K1 machine, the common rejects from under the K3 paper machine, and the tertiary cleaner rejects from stock preparation. Two different fiber recapture scenarios were evaluated for economic and process viability. Option One rerouted each waste stream back into the pulper in the stock preparation area. Option Two rerouted the tertiary cleaner rejects from stock prep back into the pulper, while the other four streams were rerouted to the fractionation stage in the process prior to the paper machine pressure cleaners. Both of these options required assumptions to be made. First, when a reject stream was recycled back into the system, it was assumed that all usable fiber was then considered accepts. The second assumption was that mill equipment was located in close proximity in order to prevent the installation of unnecessary tanks and pumps. A third fiber recovery option was explored in relation to optimizing the cleaners and screens currently in use through the addition of elutriation water, changing the hydrocyclone cleaners’ diameters, and changing the pressure cleaners’ hole and slot sizes. The cost of equipment required to complete Options One and Two was found in addition to the savings in utility costs resulting from the changes. The equipment costs were $43,593.94 and $44,800.86 for Options One and Two, respectively. The differences between these costs could be attributed to how the streams were rerouted in each option. Next, the amount of savings due to the decreased utilities was calculated. For Option One, the annual savings in utility cost amounted to $522,333.87. In Option Two, the annual utility savings was slightly lower at $516,699.15. Based on a seven year MACRS cash flow analysis consisting of a ten year plant life and 30% minimum acceptable rate of return, Option One resulted in a net present value of $1,077,238.38, a return on investment of 1,825%, and a payback period of 0.4467 years. Option Two produced a net present value of $1,057,981.98, a return on investment of 1,754%, and a payback period of 0.4638 years.
1

Paper Recycling Fiber Recapture
Prepared for James Springstead
Kalamazoo Division Manager, Yoda Chemical Company
Prepared By Ryan Binkowski, Abigail Cortright, William Hettel, Erin Riley & Ivan Soto
Paper Division Design Team, Yoda Chemical Company April 24th, 2020
2

TABLE OF CONTENTS
TABLE OF FIGURES.....................................................................................................................4 TABLE OF TABLES......................................................................................................................5
RECYCLE FIBER RECAPTURE INTRODUCTION...................................................................6 Project Overview...............................................................................................................6 Market Survey……………………………………………………………………….......7 EQUIPMENT & TESTING STANDARD BACKGROUND INFORMATION…......................10
Centrifugal or Hydrocyclone……..................................................................................10 Pressure Screens………………….................................................................................12 TAPPI Testing Standards ……………………………………………………………...14
DISCUSSION................................................................................................................................14 Recycle Paper Plant Original Process Overview............................................................14 Fiber Recovery Initial Data Analysis ............................................................................16
Recycle Paper Plant Material Balance Overview...........................................................17 Original Plant Mass Balance .........................................................................................18 General Mill Assumption...............................................................................................18 Option One: Mass Balance & Plant Layout...................................................................19 Option Two: Mass Balance & Plant Layout...................................................................20 Option Three: Equipment Alternatives...........................................................................22 General Mill and Installation Safety ..............................................................................22
EQUIPMENT & UTILITY COST ...............................................................................................23 CONCLUSION..............................................................................................................................25 RECOMMENDATION.................................................................................................................26 LITERATURE CITED…………………………………………………………………………..28 APPENDIX....................................................................................................................................28 Appendix A.................................................................................................................................28
Appendix B.................................................................................................................................31 Appendix C.................................................................................................................................34 Appendix D.................................................................................................................................37 Appendix E.................................................................................................................................38 Appendix F..................................................................................................................................39 Appendix G.................................................................................................................................40 Appendix H.................................................................................................................................42
3

TABLE OF FIGURES Figure 1. Flowsheet of Papermaking Process..................................................................................6 Figure 2. Average Price to Landfill a Ton of MSW by Region and Year.......................................7 Figure 3. OCC and Mixed Paper Pricing.........................................................................................8 Figure 4. Natural Gas Price for the Industrial Sector.......................................................................8 Figure 5. Price of Water in the Late 1990’s....................................................................................9 Figure 6. Average water and sewage treatment cost increases compared with cost increases for all items in consumer price index………………………………....................................................9 Figure 7. Hydrocyclone Design…….............................................................................................10 Figure 8. Typical Operating Standards of Hydrocyclones.............................................................12 Figure 9. Basic Design of a Pressure Screen.................................................................................13 Figure 10. Pressure Screen Designs...............................................................................................13 Figure 11. Original PFD................................................................................................................15 Figure 12. Option One recycle loops.............................................................................................19 Figure 13. Option Two split recycle loops.....................................................................................21
4

TABLE OF TABLES Table 1. Variables Affecting Centrifugal Cleaner Performance...................................................11 Table 2. TAPPI Standard Test Methods…………………….......................................................14 Table 3. Fiber Analysis Testing Results ………..........................................................................16 Table 4. Filler Accept Fiber Length..............................................................................................16 Table 5. Reject Stream Fiber Length ………………………….................................................17 Table 6. Comparison Difference between Standard and Reject …..............................................17 Table 7. Stream Fiber Recovery Data ……………………..........................................................18 Table 8. Effect of Flow Rate on Percentage Open……………………………………………....20 Table 9. Equipment Costs for Option One……………………………………………………...23 Table 10. Equipment Costs for Option Two..…………………………………………………....23 Table 11. Utility Cost Savings for Option One...………………………………………………...24 Table 12. Utility Cost Savings for Option Two...………………………………………………..24 Table 13. Summary of Cash Flow Analysis...…………………………………………………...25
5

Recycle Fiber Recapture Introduction
Project Overview Yoda Chemical Company (YCC) has requested an analysis of fiber recovery options in their 100% recycled fiber plant. In the recycled papermaking process, there are multiple stages of cleaners in order to prevent rejects such as metal, plastic, or glass from reaching the paper machines. A process flow diagram of the stock preparation process can be seen in Figure 1.
Figure 1: Flowsheet of Papermaking Process
When contaminants are rejected from screens, good fiber is often mistakenly discarded as well. In order to recapture the fiber from the process shown in Figure 1, cleaner waste streams must be tested and analyzed. From data that has been previously collected, five potential waste streams have been identified. The reject streams to be analyzed include the top liner, back liner, and filler liner primary cleaner rejects on the K1 machine, the common rejects from under the K3 paper machine, and the tertiary cleaner rejects from stock preparation. This report has been prepared in order to identify plant optimization opportunities in regards to fiber recovery through completing an economic analysis, providing incremental investment options, as well as providing an economic sensitivity and risk analysis. Based on the results of these studies, recommendations will be made to YCC management regarding potential savings and viability of fiber recovery options.
6

Market Survey In order to proceed with this project, a market survey was conducted to provide more accurate cost estimates. Some of the key components examined for the scope of this project included old corrugated containerboard (OCC), mixed paper, natural gas, water, and landfill costs as can be seen in the figures below. In Figure 2, the cost of landfilling one ton of municipal solid waste is shown by both year and region.
Figure 2: Average Price to Landfill a Ton of MSW by Region and Year
Based on this figure, one can see that for each region there has been a steady increase in the price to landfill municipal solid waste in all regions as well as the entire United States since 2010. For the Kalamazoo mill’s region of operation, Northeast, the cost to landfill is the highest with the most recent data being in 2017 at a cost of $79.30 per ton. Considering this for the purpose of recovering more fibers via the cleaning process, the goal of reducing fiber waste will aid in minimizing landfill cost, especially as the cost is rising. Another component to analyze within the market survey is old corrugated containerboard and mixed paper since this is a recycled paper mill. From Figure 3, one can see that since 2017 the price of recycled paper has declined.
7

Figure 3: OCC and Mixed Paper Pricing
The data displayed here is the average U.S. dollar per short ton for open market purchases by mills. One should also note that the blue circles are old corrugated containerboard and the black squares represent mixed paper. This decline in price is due to China’s exit from the OCC market. Since they are not currently purchasing OCC, there is a large supply on the market, which is beneficial for production at the Kalamazoo mill. Being able to purchase the raw materials at a lower cost allows for a high profit margin. Another item considered in this market survey is the cost of natural gas. The annual industrial price can be seen in Figure 4 below.
Figure 4: Natural Gas Price for the Industrial Sector
Based on this figure, the overall trend since 2010 has been a decrease. This is also beneficial for the process because with yet another raw material seeing a decline in price, there are more opportunities for profit. The final component considered in this market survey is water. For the
8

paper making process, water is used in large volumes. Combining the two figures below, Figures 5 and 6, will aid in the understanding of the industrial water market price trend.
Figure 5: Price of Water in the Late 1990’s
To begin, Figure 5 demonstrates the market price of water for several countries in the late 1990’s dollars per cubic meter. The main focus for this project is the industrial water for the United States, and a rough estimate from this figure results in approximately $0.50 per cubic meter. Next, one should consult Figure 6 to see the current wastewater treatment pricing.
Figure 6: Average water and sewage treatment cost increases compared with cost increases for
all items in consumer price index
9

As seen in Figure 6, the cost of water has substantially increased since 1984. Combining the historical price of water and the percentage increase, it is obvious that water is an expensive part of the process and one that may be hard to reduce, but can be overcome with cost saving elsewhere. Overall this market survey will aid in the cost analysis that will occur later in the project timeline. The market survey will also impact what types of cleaners are financially feasible based on the current process costs.
Equipment & Testing Standards Background Information
Centrifugal or Hydrocyclones
In 1891, the standard centrifugal cleaner was patented; however, it was not widely utilized until the 1950’s. Other terms for a centrifugal cleaner include a hydrocyclone, vortex cleaner, liquid cyclone, or “centricleaner”. The basic design of such a cleaner can be seen in Figure 8.
Figure 7 : Hydrocyclone Design
A centrifugal cleaner is essentially a conical or cylindrical-conical pressure vessel in which the feed stream enters tangentially. Operating on the basis of a free vortex, a stable air core in the center, which creates a pressure drop that in turn generates the centrifugal action the cleaner itself is able to separate unwanted particles via centrifugal force and fluid shear. The unwanted particles or “junk” are separated into accepts and rejects on the premise of density and shape. Accepts exit the cleaner through the end with the largest diameter and the rejects exit at the opposite or smaller diameter end.
10

Certain operating or design parameters can affect the performance of the centrifugal cleaner drastically. To begin, the cleaners are typically arranged in a cascade system and have several stages such as primary, secondary, tertiary, etc. Another fact to note is that a smaller diameter will form a more intense centrifugal force allowing for a more efficient cleaning of small particles. When determining the feed rates and pressure drop across the cleaner, it is important to keep in mind that if the flow is too turbulent, eddy currents will form resulting in wasted hydraulic energy and a decrease in the overall efficiency. Other parameters that affect the cleaners performance can be seen in Table 1 below that was obtained from the Handbook for Pulp and Paper Technologists textbook.
Table 1: Variables Affecting Centrifugal Cleaner Performance
From Table 1, it can be seen that the process of cleaning fiber takes into account several different factors. Even with all of these different parameters that can be changed, there are still a few standards that are followed. One of these being that the typical reject rate lies between 10% and 20%. Another standard is that the pressure drop normally ranges from 30 psi to 35 psi. A third standard is that the process typically operates at consistencies no higher than 1%. More of these standards can be seen in Figure 9 below. For the sake of this project’s scope, one should focus on the medium consistency or MC column.
11

Figure 8: Typical Operating Standards of Hydrocyclones
Without considering all of these variables one may run into issues. The most common operating problem is the plugging of the reject nozzle with fiber flocs, foreign material, or thick stock. To avoid this problem, some mills will implement a defloccing screen prior to the cascade sequence.
Within the centrifugal cleaners, the design can be varied based on the flow of the stock. There are three types of cleaners: forward, reverse, and through flow. A forward flow is the original design which is aimed at removing heavy debris or foregin material with a specific gravity higher than 1.0. The reverse flow cleaners have the accepts stream exiting at the bottom instead of the top and are more suited for removing light debris with a specific gravity less than 1.0. The third type, through flow, replaced reverse flow cleaners. This type of centrifugal cleaners operates at lower pressure drops and hydraulic reject rates.
Centrifuge cleaners or hydrocyclones operate on the simple premise of separating by density through centrifugal force and fluid shear. That being said, many variables and parameters can be changed to better suit the desired accept and reject rates.
Pressure Screens
Another integral part of the fiber recovery process is the pressure screens which can be coarse or fine screens in the stock preparation area or machine screens directly before the paper machine. In the case of this project, pressure screens are the final stage of cleaning before going to the paper machine. A simplistic overview of a pressure screen can be seen in Figure 9 below.
12

Figure 9: Basic Design of a Pressure Screen
Pressure screens are commonly used for fine screening and are defined based on the flow and arrangement of the cleaning element. The flow can be inward or outward and the cleaning element can be inside or outside of the screen basket. Some of these combinations can be seen in Figure 10.
Figure 10: Pressure Screen Designs
The most commonly used design is an outward flow with inner rotor foils, which is the middle arrangement in Figure 10. Pressure screens have a few basic mechanisms:
● Separation of particles through the deflocculation of pulp ● Passage of fibers through the holes or slots ● Occasional cleaning of the screen plate by suction pulses generated by a rotor ● Concentration and discharge of both contaminants and air
These basic mechanisms aid in cleaning the pulp slurry and allow for a better sheet as the end product. There are many adjustments that can be made in which the passage of fiber can be
13

affected. Such changes include slot width, wear, manufacturing failure, flow rate, and many more. Overall, a uniform flow is desired as this would provide the highest possible throughput without plugging, and a slot width of 80 - 250 micrometers is commonly used. Another item to note is that by having fibers pass through in a longitudinal direction, smaller slots can be used with better quality of fiber recovery results. Again, the pressure screens serve as the final cleaning stage in the process as a clean slurry is needed for the machine later on.
TAPPI Test Standards
All data recorded in the notes found behind the refrigerator are believed to have been collected in accordance with all applicable TAPPI standard test methods. Such standards provide structure to each test conducted and ensure repeatability of each test by any organization, anywhere in the world. A table of the applicable standards and their focuses are present in Table 2 below.
Table 2: TAPPI Standard Test Methods
DISCUSSION
Recycle Paper Plant Original Process Overview
To begin the optimization of the paper recycling plant, an original process flow diagram (PFD) was created. Figure 11 shows a diagram of the plant. The plant designs were constructed of basic elements used for the cleaning system. The PFD starting point is a single stock prep tank that contains old corrugated containerboard (OCC) fiber. This tank was assumed to be supplied by a continuous pulper system. The stock then flows into a series of cleaners designed to remove different size particles in the pulp. Primary cleaners are the beginning stages of this series. Here, large debris are centrifuged out of the system using a high degree of force. The cleaner portion of the stock is forced out of the top and sent to the pressure screens. The rejected portions of the stock are forced out the bottom and transferred to the next stage, the secondary cleaners. At this
14

stage, the same type of process is repeated to remove even more contaminants in the stock. The major difference is that the accepts do not proceed to screening. Instead, accepts from the secondary cleaner are tied back into the feed of the primary cleaner. The reject stream from the secondary cleaner is fed to the tertiary where a similar process is done. However, the rejects from the tertiary are sewered and not recycled back into the system.
After stock prep cleaning, which ends at the fractionation tank in Figure 11, the next process in cleaning is a pressure screen. Pressure screens are a pressurized vat designed to separate usable fibers from the rest of the pulp. The stock flow coming from stock prep is assumed to be separated into long and short fibers. The stock is then separated further into mixing tanks for each paper ply: top, mid, and bottom based on the ratios needed for the grade on the machine. The topliner, filler, backliner, and K3 liner pressure screens are all assumed to be the last cleaners before fiber is sent to the paper machine headboxes. This is to protect the machine against any final contaminants that have not been rejected by this point in the process. It is also shown in the PFD, Figure 11, that all rejected streams coming off the pressure screens go directly into the sewers and are not recovered currently.
Figure 11: Original PFD
15

Fiber Recovery Initial Data Analysis
The data that was acquired from the mill using the current paper process has been reorganized into a new usable way, unlike the original notes found behind a refrigerator. The data focuses on evaluating which stream would have the most recyclable fibers that are both usable and retain a fiber length similar to the filler ply fiber length. Table 3 shows the results of the consistency, CED, usable fiber and ash tests.
Table 3: Fiber Analysis Testing Results
Table 3 shows the average results for each test completed at each sample spot, in regards to the waste streams that left the papermaking process. At an initial evaluation of the data, it can be seen that K1 topliner and filler possess the most usable fiber in their respected waste streams being approximately 70% and 63.5%. It can also be seen that the most potential to recover fibers is in the stock prep area, where a 75 gpm stream being rejected has a 65.18% fiber content, with 48.16% of that being usable fiber. Additional analysis will be needed to determine which streams will have the most fiber recovery.
Identification of the stream that has the most recoverable fiber is one key aspect, but additionally, the stream must have a similar fiber length to that of the filler ply in order to maximize fiber strength. Table 4 contains data collected from the filler accepts flow to the paper machine to have a comparable basis.
Table 4: Filler Accept Fiber Length
Table 4 shows the standard percent fines arithmetic, percent fines length weighted and the mean length of the fibers within the accepts of the filler ply. This percentage of fines and the mean length should be close to this standard for the five reject streams. Table 5 shows the average values for each of these sections for the reject streams.
16

Table 5: Reject Stream Fiber Length
Table 5 displays each rejected stream’s fiber length and percentage of fines. The difference between the reject stream and that of the standards can be calculated for comparison. Table 6 shows the difference between the standard that is desired and the rejected streams.
Table 6: Comparison Difference between Standard and Reject
The percentage difference calculated between the standard and rejected waste streams in Table 6 can show where fiber length can be of significant importance. In both the K1 topliner and filler streams, the fiber length is less than a percent off from the filler accepts fiber length, making it suitable fiber for use, however they both possess higher fines content which could lead to more energy being needed to dry the fines in the sheet. The stock prep stream is very suitable since it has both a high fiber length of 1.76 mm compared to the standard of 1.2474 mm plus a 39.43% difference in the amount of fines that it possesses. This data will be further analyzed throughout the completion of the material balance.
Recycle Paper Plant Material Balance Overview
The material balance for the recycling plant was completed with the intent to stay within the scope of recycling as much fibers in the reject streams as possible. A full material balance could not be completed due to insufficient information regarding the process. However, this paper explores two options where all the reject streams are looped back into the system to achieve maximum fiber recovery. Other equipment alternatives were also given as a third option to show possible outlooks for process improvements. The original plant as it stands does not recycle any of the rejected streams that exist throughout the process. This is assumed to be because of poor engineering and improper equipment usage. The first option created to recycle fibers, purges all reject streams into the pulper. A purge system was chosen to allow usable fibers to be looped back into the system while allowing debris to still exit the system. The second option involves a
17
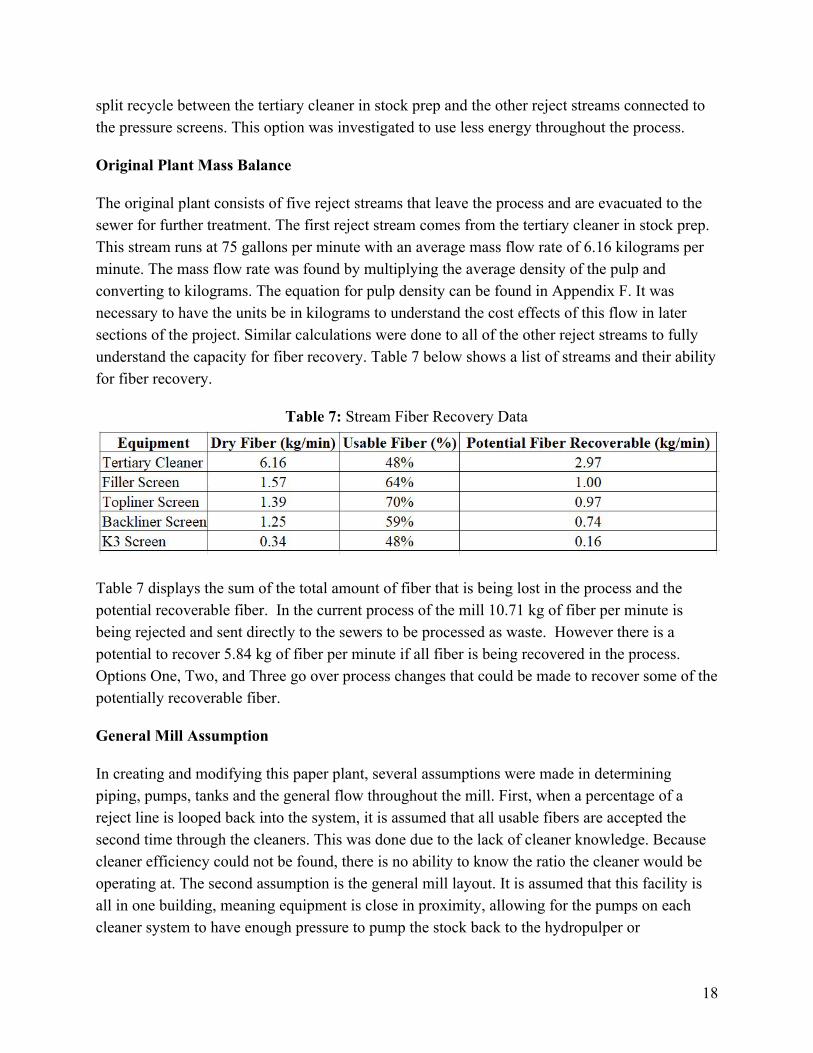
split recycle between the tertiary cleaner in stock prep and the other reject streams connected to the pressure screens. This option was investigated to use less energy throughout the process.
Original Plant Mass Balance
The original plant consists of five reject streams that leave the process and are evacuated to the sewer for further treatment. The first reject stream comes from the tertiary cleaner in stock prep. This stream runs at 75 gallons per minute with an average mass flow rate of 6.16 kilograms per minute. The mass flow rate was found by multiplying the average density of the pulp and converting to kilograms. The equation for pulp density can be found in Appendix F. It was necessary to have the units be in kilograms to understand the cost effects of this flow in later sections of the project. Similar calculations were done to all of the other reject streams to fully understand the capacity for fiber recovery. Table 7 below shows a list of streams and their ability for fiber recovery.
Table 7: Stream Fiber Recovery Data
Table 7 displays the sum of the total amount of fiber that is being lost in the process and the potential recoverable fiber. In the current process of the mill 10.71 kg of fiber per minute is being rejected and sent directly to the sewers to be processed as waste. However there is a potential to recover 5.84 kg of fiber per minute if all fiber is being recovered in the process. Options One, Two, and Three go over process changes that could be made to recover some of the potentially recoverable fiber.
General Mill Assumption
In creating and modifying this paper plant, several assumptions were made in determining piping, pumps, tanks and the general flow throughout the mill. First, when a percentage of a reject line is looped back into the system, it is assumed that all usable fibers are accepted the second time through the cleaners. This was done due to the lack of cleaner knowledge. Because cleaner efficiency could not be found, there is no ability to know the ratio the cleaner would be operating at. The second assumption is the general mill layout. It is assumed that this facility is all in one building, meaning equipment is close in proximity, allowing for the pumps on each cleaner system to have enough pressure to pump the stock back to the hydropulper or
18

fractionation tank (see Figures 12 and 13). In this case, the facility layout is also not known, meaning that all piping estimations given will be given for the pipe being connected in a straight line. This means that piping does not take into consideration large amounts of curves, bends, or elevation changes.
Option One: Mass Balance & Plant Layout
In order to recover as much fiber as possible, there were alterations made to the process. Option One explores this by creating a tie-in at all reject points and then recycling them back to the repulper. This can be seen in Figure 12 below.
Figure 12: Option One Recycle Loops
The red line in Figure 12 shows the addition to the original PFD figure. These lines represent the added piping, elbows, and valves. It was determined that 160 ft of piping, 17 elbows, 5 knife gate valves, and a microwave consistency meter would be added with Option One. It is important to understand the amount of equipment added for a cost analysis which is completed later in this report. All reject streams were cut and a tee conduit was added. One portion of the tee goes to the sewer while the other is recycled back into the hydropulper. The ratio of flow returning to the process versus that which is being discarded as waste to the sewer is controlled through valves that are connected to the pipes leading to the sewer and back to the process. The valve will dictate the amount of reject flow leaving the system. The open percentage of the valve has direct
19

correlation to the amount of fiber being recycled. This amount was calculated by multiplying the percentage open by the mass flow rate. Table 8 shows the relationship of flow rate to percentage open.
Table 8: Effect of Flow Rate on Percentage Open
Table 8 shows the amount of fiber that is being recovered when dealing through a split ratio of 90% and 10%. The valve to the sewer is set at 10% open while the valve that returns the rejected flow back to the hydropulper is 90% open. At these valve settings, the amount of fiber recovered is 5.26 kg/min (2,922.7 tons/yr) and the amount of fiber sent to the sewer is 5.45 kg/min (3027.83 ton/yr). This reduces the amount of fiber that is sent to the sewer by 49.11% from the current mill’s process.
Option Two: Mass Balance & Plant Layout
Option Two also aims to recover as much usable fiber from the reject streams as possible with the use of tie-ins for all reject streams. However, in Option Two, the recycle lines are rerouted to optimize energy efficiency. A process flow diagram of Option Two can be seen in Figure 13.
20

Figure 13: Option Two split recycle loops
As shown, only the tertiary cleaner rejects are returned to the repulper, while all other cleaner rejects are rerouted to fractionation prior to the paper machine cleaners. A tank and a pump were also added to reloop the tertiary reject line. The pump selected operates at 3600 RPM with 15 hp. This pump was chosen because it met the adequate flow rate for the recovery loops. The tank selected was a cylindrical stainless steel tank with dimensions of 7 ft x 10 ft. This allows for storage of the fiber before returning to the hydropulper in situations where the hydropulper cannot accept fiber at that time. Additional piping was changed around the hydrocylcone cleaners where the accepted fiber from the secondary hydrocyclone cleaners was sent forward to the machines rather than back to the primary cleaner. This reduced bottlenecking of the primary cleaner and kept the fiber moving forward since other cleaner units are in place to take care of finer debris. As in Option One, pipes, elbows, valves, and a microwave consistency meter were added to Option Two. In determining the material needed, it was found that 120 feet of piping, 13 elbows, and 5 valves would be added. All tie-ins still utilized control valves to dictate the ratio of rejects recovered and returned to the process versus rejects sent to the sewer. This ratio
21

would not change between Options One and Two; only the destination of the recycle lines. This means that identical to Option One, 5.26 kg/min of fiber would be recovered.
Option Three: Equipment Alternatives Improvements to cleaner equipment in stock preparation and on the paper machines are essential to increase the amount of fiber that can be recovered in each waste stream. In stock preparation, the hydrocylcone cleaners can be modified to increase the fiber recovery by adding elutriation water. Additionally, more dirt can be removed from the system by changing the cone diameter. The pressure screens that are located immediately before the paper machines can be improved by selecting smaller or larger screen sizes. Hydrocylone cleaners in the stock prep area have the potential to include a built-in mechanism to recover smaller fibers that enter the reject screen. This is known as elutriation water where water at a high pressure is pumped into the bottom of the cleaner cone. The elutriation water acts as a mechanism to move lightweight contaminants (small fibers, shives, etc.) back into the cleaner cone through the usage of a bubbling method. The smaller fibers and shives will be absorbed into the bubbles, while other smaller materials such as metals and styrofoam will not be affected and will be rejected. Another option to upgrade the cleaner cones is to change the diameter of the cones, effectively changing pressure drop across the cone. Depending on the type of debris in the system, the diameter of the cone will vary. In cases where the diameter is larger, debris such as small metals, stickys, and dirt are targeted, while smaller diameter cones target styrofoam, sand, and smaller grit particles. Pressure screen cleanliness and reject flows can be improved by using different slot and hole sizes in the baskets. In determining the appropriate hole and slot sizes, it again depends on the debris that the system is attempting to remove. In cases where large amounts of waste is trying to be removed, smaller basket sizes are used to force large particles (such as rocks, metals, and dirt) to be less likely to pass through the screen. In a system where stock is cleaner and large amounts of stock are being pulled to the paper machine, larger basket slots are used to increase the accepted flow rates and reduce the reject flow rate. By ensuring that the screens being used are optimized, fiber recovery can be increased. General Mill & Installation Safety With installing any of the alternative options presented above there is some level of safety concerns that must be taken into consideration. In general installation of piping, it must be considered that contract workers have the appropriate safety training, personal protective
22

equipment (PPE) and permits for the installation (i.e fire or hot work permits). PPE such as steel-toed boots, ear plugs, safety glasses, and hard hats must be worn during installation to protect employees and contract workers. In Option Two, there is the installation of a tank and a pump; in this case, the tank must have a built in overflow chute so that if the tank overflows, the rejected fiber is delivered directly into the sewers. For the newly installed knife gate valves, potential failure must be considered. In a situation where the valve mechanics fail it is best to have air-to-close valves. Air-to-close valves need air flow in order to close, therefore, should it fail, the valve would open to 100%. This would prevent issues with debris leaving the system if the valve failed. Equipment and Utility Costs The first part of the cost analysis completed involved calculating the equipment costs for both options. The data from this analysis can be seen in Tables 9 and 10.
Table 9: Equipment Costs for Option One
Table 10: Equipment Costs for Option Two
As shown, Option One had an equipment cost of $43,593.94 and Option Two had an equipment cost of $44,800.86. These costs can be attributed to the differences in how the streams were rerouted. For Option One, 160 feet of piping, 17 elbows, 5 knife gate valves, and one microwave consistency meter were installed. In Option Two, 120 feet of piping, 13 elbows, 5 knife gate valves, one pump, and one microwave consistency meter were installed. Due to the lower
23

equipment requirement to recover the reject streams, Option One resulted in a slightly lower equipment cost than Option Two. Utility costs were also calculated. Because of the nature of the project, the utility cost decreased after the project was completed. Therefore, the annual savings made as a result of reduced utilities are displayed in Tables 11 and 12.
Table 11: Utility Cost Savings for Option One
Table 12: Utility Cost Savings for Option Two
The utilities that were affected by this project included landfill and fiber costs in addition to the energy needed to run the added pump in Option Two. To calculate landfill and fiber savings, the landfill and fiber costs were extrapolated from the market surveys completed. The landfill cost utilized in this analysis was $82.50 per ton while fiber costs were estimated at $100 per ton. Since both options recovered each of the five streams, their landfill and fiber savings were identical. When the streams were rerouted in Option Two however, it was determined that an additional pump was needed in order to transport the reject streams to their new location. The annual cost of the pump was calculated on the basis of the pump operating at 11.18 kW at a price of $0.06 per kW. This additional cost resulted in Option One having a higher total annual utility savings of $522,333.87 compared to Option Two’s total annual savings of $516,699.15. The final part of the cost analysis included creating a cash flow table for each option. This analysis utilized a 7 year MACRS depreciation, with a 30% minimum acceptable rate of return (MARR) and a ten year plant life. The summarized results for this analysis can be seen in Table 13. The complete cash flow table can be found in the Appendix.
24

Table 13: Summary of Cash Flow Analysis
As discussed above, purchased equipment costs for Options One and Two totaled $43,593.94 and $44,800.86, respectively. Lang factors of 4.3 for fixed capital investment (FCI) and 5.0 for total capital investment (TCI) were used for the solid-fluid processing plant. These factors allowed for the calculation of FCI and working capital (WC). Overall, Option One had an FCI of $187,453.94 and a WC of $30,515.76 while Option Two had an FCI of $192,643.70 and a WC of $31,360.60. Additionally, the net present value (NPV) from the investments made in Option One totaled $1,077,238.38 and $1,057,981.98 in Option Two. Given that the NPV was positive for both options, return on investment and the payback period were also able to be calculated for both options. Option One yielded a return on investment of 1,825% and a payback period of 0.4467 years. Option Two resulted in a 1,754% return on investment and a 0.4638 year payback period. As can be seen, both of these options are highly profitable with quick returns on the investments made. Conclusion This report has reviewed and analyzed both the design and economic viability of recycling five fiber waste streams back into the papermaking process. The waste streams included the top liner, back liner, and filler reject streams off of the machine screens on the K1 machine, the common rejects from under the K3 paper machine, and the tertiary cleaner rejects from stock preparation. In order to complete this analysis, market surveys and research on different types of cleaners and screens were completed, process flow diagrams and material balances were made, and cost tables were formulated. The market surveys were conducted to evaluate the costs of raw materials entering the process. The materials considered in the market surveys were landfill costs, OCC and mixed paper costs, natural gas prices, and the costs of water and water treatment. By using the data gathered from the market surveys, an accurate cost analysis was able to be completed.
25

After an initial analysis of the data found behind the refrigerator, a material balance of the process was completed. Two different methods of fiber recovery were determined. In Option One, all five of the waste streams were recycled back into the hydropulper. In Option Two, the tertiary rejects were sent to the hydropulper while the other four streams were only recycled back to the fractionation stage. As a result of the material balance, it was determined that 5.84 kg of fiber per minute had the potential to be recovered. From the assumption that the valve to the sewer would be set at 10% open while the valve that returns the rejected flow back to the hydropulper would be 90% open, it was found that 5.26 kg of fiber per minute could be recovered. When creating cash flow tables and evaluating the finances for the two recovery options, the process was considered to be a solid-fluid process which provided a Lang factor of 5.0 for TCI and a Lang factor of 4.3 for FCI. Other assumptions utilized were a tax rate of 21%, 7 year MACRS depreciation and a ten year plant life. For Option One, 160 feet of piping, 17 elbows, 5 knife gate valves, and one microwave consistency meter were installed resulting in an equipment cost of $43,593.94. Option Two required the installation of 120 feet of piping, 13 elbows, 5 knife gate valves, one pump, and one microwave consistency meter resulting in an equipment cost of $44,800.86. The added equipment in each option amounted to a total capital investment of $217,969.70 and $224,004.30 for Option One and Two, respectively. The amount of money saved in utilities per year for each option was also calculated. For Option One, this amounted to $522,333.87 while Option Two had a slightly lower utility cost savings of $516,699.15. As a result of the investments and savings made, Option One had a net present value (NPV) of $1,077,238.38, a return on investment (ROI) of 1,825%, and a payback period (PBP) of 0.4467 years. Option Two resulted in an NPV of $1,057,981.98, an ROI of 1,754% and a PBP of 0.4638 years. Recommendation In closing, this fiber recapture project resulted in many opportunities for cost savings. After the analysis, it has been decided that Option One would be the most advantageous option for the Yoda Chemical Company. The total capital investment of $217,969.70 accounts for the installation of 160 feet of piping, 17 elbows, 5 knife gate valves, and one microwave consistency meter. From these changes, it is estimated that $522,333.87 per year is saved in utility costs of landfill and purchased fiber. This high level of savings would have a return on investment of 1,825% and a payback period of 0.4467 years. Another recommendation would be to also implement Option Three, which included the utilization of elutriation water into the hydrocyclone cleaners in addition to the optimization of the hydrocyclone and pressure screens to better screen the debris in the system.
26

Literature Cited “BERKELEY B3TPMS 15 H.P. B74766.” EPumps.com,
www.epumps.com/b3tpms-b74766.html?utm_source=google_shopping&gclid=CjwKCAjw4KD0BRBUEiwA7MFNTaPo2iPx9Q4DAQ2FRv3et80E5NcvId8IJglvEqJIGsr5P0ZjHhvbjBoCylgQAvD_BwE
Hoke, Ulrich, and Samuel Schabel. Recycled Fibre and Deinking. 2nd ed., vol. 7, Paper
Engineers' Association, 2009. Maxwell, Steve. “Historical Water Price Trends.” American Water Works Association, John
Wiley & Sons, Ltd, 1 Apr. 2010, awwa.onlinelibrary.wiley.com/doi/epdf/10.1002/j.1551-8833.2010.tb10086.x.
“MetalsDepot® - Buy Steel Pipe Online!” MetalsDepot® - Buy Steel Pipe Online!,
www.metalsdepot.com/steel-products/steel-pipe. SMOOK, GARY. Handbook for Pulp and Paper Technologists. 4th ed., NIELSEN
BOOKDATA, 2016. Staff, RT. “Prices Plummet, Oversupply Persists.” Recycling Today, Recycling Today, 8 Mar.
2018, www.recyclingtoday.com/article/prices-plummet-oversupply-persists/. “The Cost to Landfill MSW in the US Continues to Rise Despite Soft Demand.” SWEEP, 10 July
2017, nrra.net/sweep/the-cost-to-landfill-msw-in-the-us-continues-to-rise-despite-soft-demand/.
“Prices & Trends.” Energy.gov, www.energy.gov/energy-economy/prices-trends. “Pricing Water.” OECD Observer,
oecdobserver.org/news/fullstory.php/aid/939/Pricing_water.html. “Valmet Microwave Consistency Measurement (Valmet MCA).” Valmet,
www.valmet.com/automation/analyzers-measurements/consistency/microwave-consistency-measurement-mca/.
“304 Stainless Steel Butt Weld Long Elbows Schedule 40.” Www.stainlesssteelfittings.com,
www.stainlesssteelfittings.com/304_Schedule_40_Elbow_90L_stainless_p/w490les4.htm?gclid=EAIaIQobChMIqaLvwMPP6AIVYZJbCh0qdAAcEAQYAyABEgJ8s_D_BwE.
“8.” IrrigationKing.com,
www.irrigationking.com/8-cast-iron-gate-valve-w-rubber-wedge.html?gclid=CjwKCAjw4KD0BRBUEiwA7MFNTWGq94FrnaWcbHR5h3Cb6GRpnoEWPIGm15acxOlbJicwBWUi-8jc9RoCBDIQAvD_BwE.
27

APPENDICES
Appendix A: Market Survey
Figure 2: Average Price to Landfill a Ton of MSW by Region and Year
Figure 3: OCC and Mixed Paper Pricing
28

Appendix A: Market Survey - Continued
Figure 4: Natural Gas Price for the Industrial Sector
Figure 5: Price of Water in the Late 1990’s
29

Appendix A: Market Survey - Continued
Figure 6: Average water and sewage treatment cost increases compared with cost increases for
all items in consumer price index
30

Appendix B : Equipment & Testing Standard Background Information
Figure 7: Hydrocyclone Design
Table 1: Variables Affecting Centrifugal Cleaner Performance
31

Appendix B : Equipment and Testing Standard Background Information - Continued
Figure 8: Typical Operating Standards of Hydrocyclones
Figure 9: Basic Design of a Pressure Screen
32

Appendix B : Equipment and Testing Standard Background Information - Continued
Figure 10: Pressure Screen Designs
Table 2: TAPPI Standard Test Methods
33

Appendix C : Original and Modified PFDs
Figure 1: Flowsheet of Papermaking Process
Figure 11: Original PFD
34
Appendix C : Original and Modified PFDs - Continued
Figure 12: Option One Recycle Loops
35

Appendix C : Original and Modified PFDs - Continued
Figure 13: Option Two split recycle loops
36

Appendix D: Initial Data Analysis
Table 3: Fiber Analysis Testing Results
Table 4: Filler Accept Fiber Length
Table 5: Reject Stream Fiber Length
Table 6: Comparison Difference between Standard and Reject
37

Appendix E: Material and Energy Balance
Table 7: Stream Fiber Recovery Data
Table 8: Effect of Flow Rate on Percentage Open
38

Appendix F : Sample Calculations
Table 14: Variable Descriptions
D Pulp Density
x Consistency
W Density of Fluid
S Density of Fiber
Figure 14: Pulp Density Sample Calculation
39

Appendix G: Economic Analysis
Table 9: Equipment Costs for Option One
Table 10: Equipment Costs for Option Two
Table 11: Utility Cost Savings for Option One
Table 12: Utility Cost Savings for Option Two
40

Appendix G: Economic Analysis - Continued
Table 13: Summary of Cash Flow Analysis
41

Appendix H: Cost Calculation Equations
Working Capital equation:
C .15 CIW = 0 * F
Discount Factor equation:
FD = 1(1+i)n
Book Value equation:
v(current year) v(P rior year) EPB = B − D
Profit equation:
RO NC XP EPP = I − E − D
Tax equation:
AX ax Rate ROT = T * P
Cash Flow equation:
F NC XP AXC = I − E − T
Discounted Cash Flow equation:
CF F FD = C * D
42