Embed Size (px)
Citation preview

October 4, 2018
Orient Paper & Industries Ltd.
Growth catalysts in place; rerating potential…
CMP INR 43 Target INR 57 Initiating Coverage –BUY
SKP Securities Ltd www.skpsecurities.com Page 1 of 26
Key Share Data
Face Value (INR) 1.0
Equity Capital (INR Mn) 212.2
Market Cap (INR Mn) 9,124.4
52 Week High/Low (INR) 62/25
6 months Avg. Daily Volume (NSE) 763,091
BSE Code 502420
NSE Code ORIENTPPR
Reuters Code ORPP.NS
Bloomberg Code OPI:IN
Shareholding Pattern (as on June 2018)
39%
21%
40%Promoter
FII/MF
Puiblic & Other
Source: Company
Particulars FY17 FY18 FY19E FY20E
Net Sales 5,114.9 6,613.6 6,838.6 7,613.0
Growth (%) 29.3% 3.4% 11.3%
EBITDA 315.4 1,118.8 1,354.0 1,583.5
PAT 108.8 492.9 941.3 1,011.4
Growth (%) 353.2% 91.0% 7.4%
EPS (INR) 0.5 2.3 4.4 4.8
BVPS (INR) 59.1 62.1 65.6 69.4
Key Financials (INR Million)
Particulars FY17 FY18 FY19E FY20E
P/E (x) 129.1 13.3 9.7 9.0
P/BVPS (x) 1.2 0.5 0.7 0.6
Mcap/Sales (x) 2.7 1.0 1.3 1.2
EV/EBITDA (x) 50.1 6.1 6.8 6.0
ROCE (%) 0.5% 6.0% 7.3% 8.3%
ROE (%) 0.9% 3.7% 6.8% 6.9%
EBITDA Mar (%) 6.2% 16.9% 19.8% 20.8%
PAT Mar (%) 2.1% 7.5% 13.8% 13.3%
Debt - Equity (x) 0.1 0.1 0.0 0.1
Key Financials Ratios
Source: Company, SKP Research
1 Yr price performance OPIL; vis-à-vis BSE Mid Cap
-50%
0%
50%
100%
28
-Sep
-17
26
-Oct-
17
23
-Nov-1
7
21
-Dec-1
7
18
-Ja
n-1
8
15
-Fe
b-1
8
15
-Ma
r-1
8
12
-Apr-
18
10
-Ma
y-…
7-J
un
-18
5-J
ul-
18
2-A
ug-1
8
30
-Aug
-18
27
-Sep
-18
OPIL BSE MID Cap
Company Background
Orient Paper and Industries Limited (Orient Paper), promoted by CK Birla Group, is India’s largest manufacturer and exporter of tissue paper with ~17% domestic market share. Its integrated manufacturing facility is located at Amlai in Madhya Pradesh (MP) having a total installed paper capacity of 100,000 MTPA viz. 50,000 MTPA each of Tissue and Writing & Printing (W&P) Paper. It also has 72,500 MTPA of pulp capacity and a 55 MW captive power plant. It also has 36,000 MTPA capacity of Caustic Soda, contributing ~18% to revenue. Vide a process of sequential demergers, its erstwhile cement and consumer durables businesses are now parts of two separate listed entities. Investment Rationale
India’s largest tissue paper producer; buoyant demand puts Orient in a sweet spot India is expected to emerge as the fastest-growing paper market, growing at a rate of
~7% per annum. The Indian tissue paper market is relatively small (1% of total global demand) but has been recording double-digit growth on the back of increasing hygiene awareness and rising disposable income. In addition there is a good demand for quality tissue paper in global markets where Indian tissue paper industry has demonstrated its ability to provide desired quality at competitive prices.
Orient Paper enjoys a first mover advantage in the tissue paper segment having ventured in it in 1997 by setting up 10,000 MTPA capacity, when the total tissue paper industry size was only 5,000 MTPA. This was expanded to 25,000 MTPA in FY10 and currently is 50,000 MTPA, making it the largest tissue paper player in the country.
The Company has an edge over its peers in tissue paper segment as existing tissue paper players are not able to ramp up capacity and key domestic paper producers are yet to enter this segment. Therefore, absence of competition in the domestic market and sprawling export opportunity (Middle East and newer markets such as South Africa, Australia, Zimbabwe, Tanzania, and Ghana) puts Orient Paper in a sweet spot.
Pulp capex will lead to raw material security and an additional tissue capacity To eliminate its dependency on the more expensive market pulp (<10% of total pulp
requirement at >50% higher cost than own manufacturing), Orient Paper has planned to increase its pulp capacity from 72,500 MTPA to 100,000 MTPA at a cost of Rs 450 mn. It is also setting up a new recovery boiler at a cost of ~Rs 1.65 bn and upgrading its pulp capacity to become ECF (elemental chlorine free) complaint at a cost of ~Rs 150 mn. The proposed capex will be commissioned by Q3FY20 and will be funded majorly through internal accruals and marginal borrowings. Post expansion the enhanced pulp capacity will support paper production of 120,000-125,000 MTPA as against current paper capacity of 100,000 MTPA.
To augment its enhanced pulp capacity of 100,000 MTPA, surplus power (>15 MW) and huge land bank at M.P, Orient Paper may take up brownfield tissue paper expansion of ~20,000 MTPA as its existing tissue capacity is expected to reach optimum utilization in few years. This expansion can be done at minimal incremental cost and will take approx 1.5 years to get commissioned.
Strong entry barriers restricting entry of new players in the industry Strong entry barriers like huge capital outlay, high gestation period of ~24-30 months
including requisite environmental clearances, availability of land & water, cost of upgrading technology regularly, growing wood plantations, establishing a distribution network and high energy cost, augurs well for Orient Paper.
Balance sheet strength bodes well Over last few years, Orient Paper has deleveraged its balance sheet by repaying debt
of Rs 1 bn. As on June 2018, total debt stands at ~Rs 0.6 bn (D/E of 0.1x) against an expected operating cash flow of Rs 1.2-1.6 bn in FY19E & FY20E respectively, providing visibility to meet future capex requirements comfortably.
Further, Orient paper holds investments worth ~Rs 2.8 bn in equity shares of Hyderabad Industries Ltd., as a part of the Promoter Group and Century Textiles & Industries Ltd., in which the management intends to liquidate stake going forward. It also holds ~800 acres of land at its erstwhile plant at Brajrajnagar, closed since 1999, which, we believe, will be used for other purposes going forward.
Valuation Orient Paper has moved up the value chain into tissue paper, which has higher growth
potential and better realizations, leading to a self-sustained model (increasing profitability) backed by favourable demand-supply equilibrium and muted domestic wood prices. Additionally, with internal cost controls and effective management, this business is showing signs of: (1) improvement in utilization (asset turnover), (2) healthy margins, and (3) strong free cash flow generation, providing visibility to comfortably meet future capex requirements and better return ratios.
We have valued the stock on SOTP basis valuing Orient’s core paper business at 7x EV/EBITDA of FY20E and investments (except Brajrajnagar land) at Rs 8/-share. We recommend a BUY on the stock with a target price of Rs 57/- in 15 months, although the long term story looks even better. Any monetization of Brajrajnagar land will trigger an upside potential of Orient Paper profitability and stock price.
Anik Das
Tel No: +91-33-40077020;
Mobile: +91-8017914822
E-mail: [email protected]
Orient Paper & Industries Ltd.
SKP Securities Ltd www.skpsecurities.com Page 2 of 26
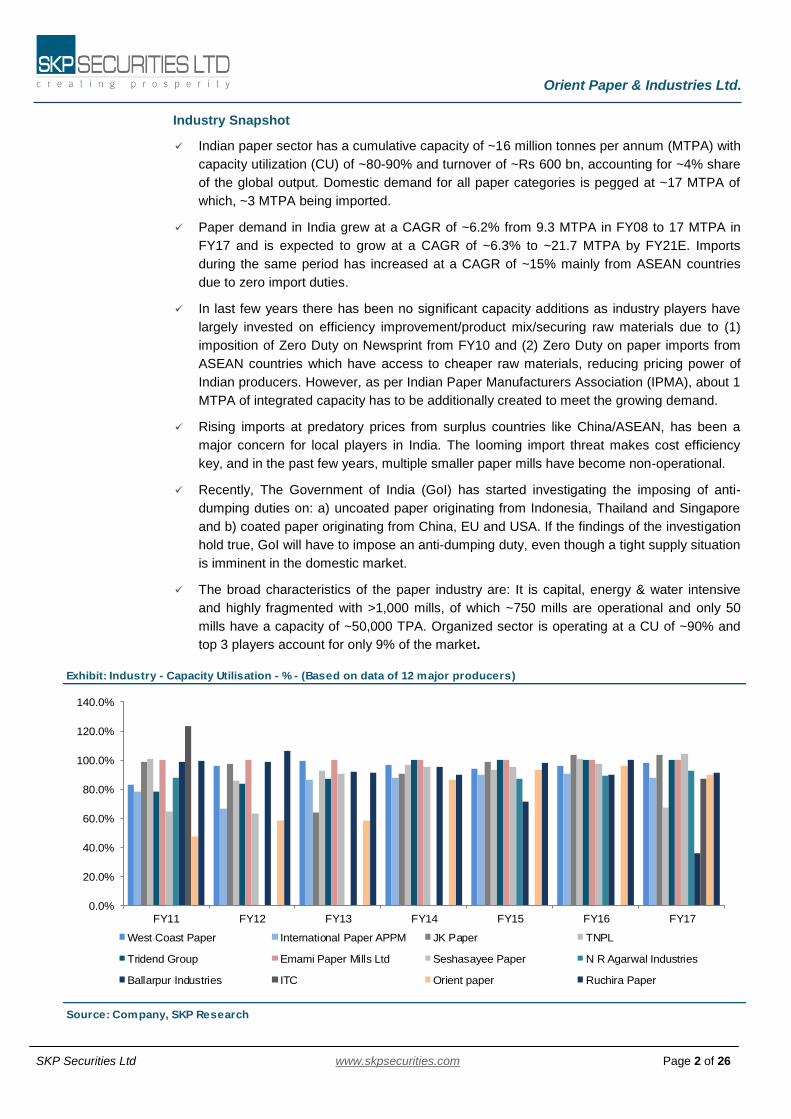
Exhibit: Industry - Capacity Utilisation - % - (Based on data of 12 major producers)
Source: Company, SKP Research
0.0%
20.0%
40.0%
60.0%
80.0%
100.0%
120.0%
140.0%
FY11 FY12 FY13 FY14 FY15 FY16 FY17
West Coast Paper International Paper APPM JK Paper TNPL
Tridend Group Emami Paper Mills Ltd Seshasayee Paper N R Agarwal Industries
Ballarpur Industries ITC Orient paper Ruchira Paper
Industry Snapshot
Indian paper sector has a cumulative capacity of ~16 million tonnes per annum (MTPA) with
capacity utilization (CU) of ~80-90% and turnover of ~Rs 600 bn, accounting for ~4% share
of the global output. Domestic demand for all paper categories is pegged at ~17 MTPA of
which, ~3 MTPA being imported.
Paper demand in India grew at a CAGR of ~6.2% from 9.3 MTPA in FY08 to 17 MTPA in
FY17 and is expected to grow at a CAGR of ~6.3% to ~21.7 MTPA by FY21E. Imports
during the same period has increased at a CAGR of ~15% mainly from ASEAN countries
due to zero import duties.
In last few years there has been no significant capacity additions as industry players have
largely invested on efficiency improvement/product mix/securing raw materials due to (1)
imposition of Zero Duty on Newsprint from FY10 and (2) Zero Duty on paper imports from
ASEAN countries which have access to cheaper raw materials, reducing pricing power of
Indian producers. However, as per Indian Paper Manufacturers Association (IPMA), about 1
MTPA of integrated capacity has to be additionally created to meet the growing demand.
Rising imports at predatory prices from surplus countries like China/ASEAN, has been a
major concern for local players in India. The looming import threat makes cost efficiency
key, and in the past few years, multiple smaller paper mills have become non-operational.
Recently, The Government of India (GoI) has started investigating the imposing of anti-
dumping duties on: a) uncoated paper originating from Indonesia, Thailand and Singapore
and b) coated paper originating from China, EU and USA. If the findings of the investigation
hold true, GoI will have to impose an anti-dumping duty, even though a tight supply situation
is imminent in the domestic market.
The broad characteristics of the paper industry are: It is capital, energy & water intensive
and highly fragmented with >1,000 mills, of which ~750 mills are operational and only 50
mills have a capacity of ~50,000 TPA. Organized sector is operating at a CU of ~90% and
top 3 players account for only 9% of the market.
Orient Paper & Industries Ltd.
SKP Securities Ltd www.skpsecurities.com Page 3 of 26
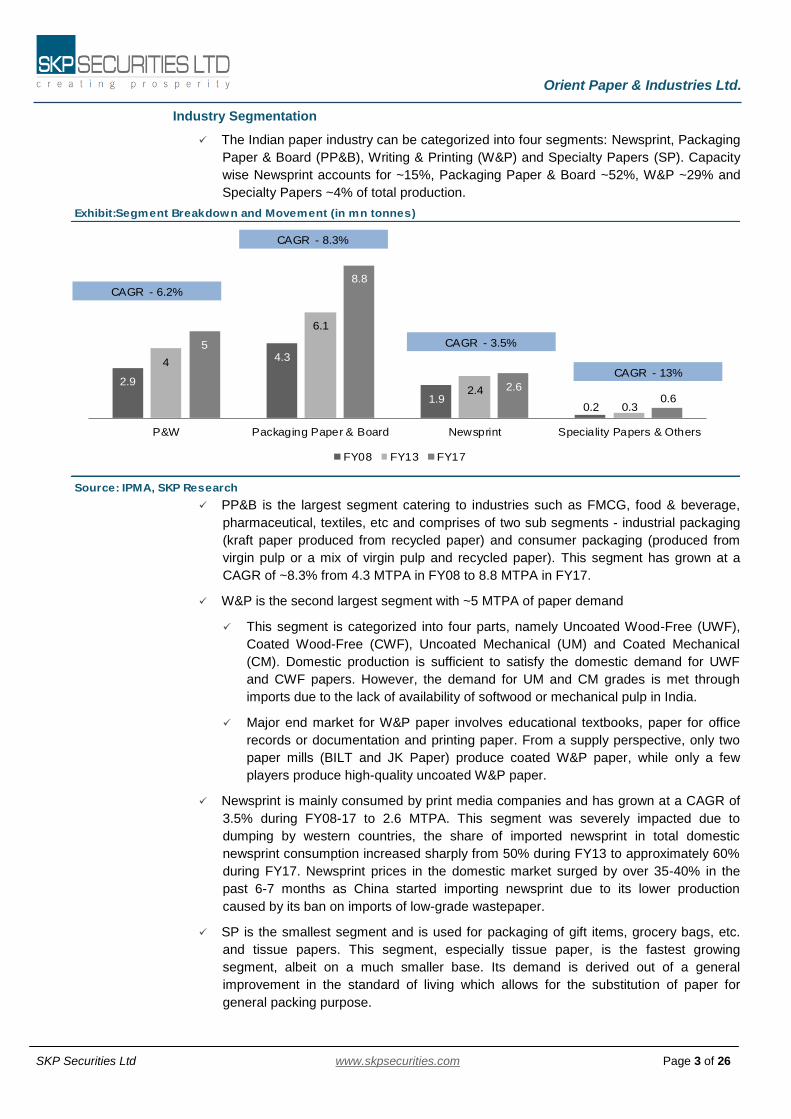
Exhibit:Segment Breakdown and Movement (in mn tonnes)
Source: IPMA, SKP Research
2.9
4.3
1.90.2
4
6.1
2.4
0.3
5
8.8
2.60.6
P&W Packaging Paper & Board Newsprint Speciality Papers & Others
FY08 FY13 FY17
CAGR - 6.2%
CAGR - 8.3%
CAGR - 3.5%
CAGR - 13%
Industry Segmentation
The Indian paper industry can be categorized into four segments: Newsprint, Packaging
Paper & Board (PP&B), Writing & Printing (W&P) and Specialty Papers (SP). Capacity
wise Newsprint accounts for ~15%, Packaging Paper & Board ~52%, W&P ~29% and
Specialty Papers ~4% of total production.
PP&B is the largest segment catering to industries such as FMCG, food & beverage,
pharmaceutical, textiles, etc and comprises of two sub segments - industrial packaging
(kraft paper produced from recycled paper) and consumer packaging (produced from
virgin pulp or a mix of virgin pulp and recycled paper). This segment has grown at a
CAGR of ~8.3% from 4.3 MTPA in FY08 to 8.8 MTPA in FY17.
W&P is the second largest segment with ~5 MTPA of paper demand
This segment is categorized into four parts, namely Uncoated Wood-Free (UWF),
Coated Wood-Free (CWF), Uncoated Mechanical (UM) and Coated Mechanical
(CM). Domestic production is sufficient to satisfy the domestic demand for UWF
and CWF papers. However, the demand for UM and CM grades is met through
imports due to the lack of availability of softwood or mechanical pulp in India.
Major end market for W&P paper involves educational textbooks, paper for office
records or documentation and printing paper. From a supply perspective, only two
paper mills (BILT and JK Paper) produce coated W&P paper, while only a few
players produce high-quality uncoated W&P paper.
Newsprint is mainly consumed by print media companies and has grown at a CAGR of
3.5% during FY08-17 to 2.6 MTPA. This segment was severely impacted due to
dumping by western countries, the share of imported newsprint in total domestic
newsprint consumption increased sharply from 50% during FY13 to approximately 60%
during FY17. Newsprint prices in the domestic market surged by over 35-40% in the
past 6-7 months as China started importing newsprint due to its lower production
caused by its ban on imports of low-grade wastepaper.
SP is the smallest segment and is used for packaging of gift items, grocery bags, etc.
and tissue papers. This segment, especially tissue paper, is the fastest growing
segment, albeit on a much smaller base. Its demand is derived out of a general
improvement in the standard of living which allows for the substitution of paper for
general packing purpose.
Orient Paper & Industries Ltd.
SKP Securities Ltd www.skpsecurities.com Page 4 of 26
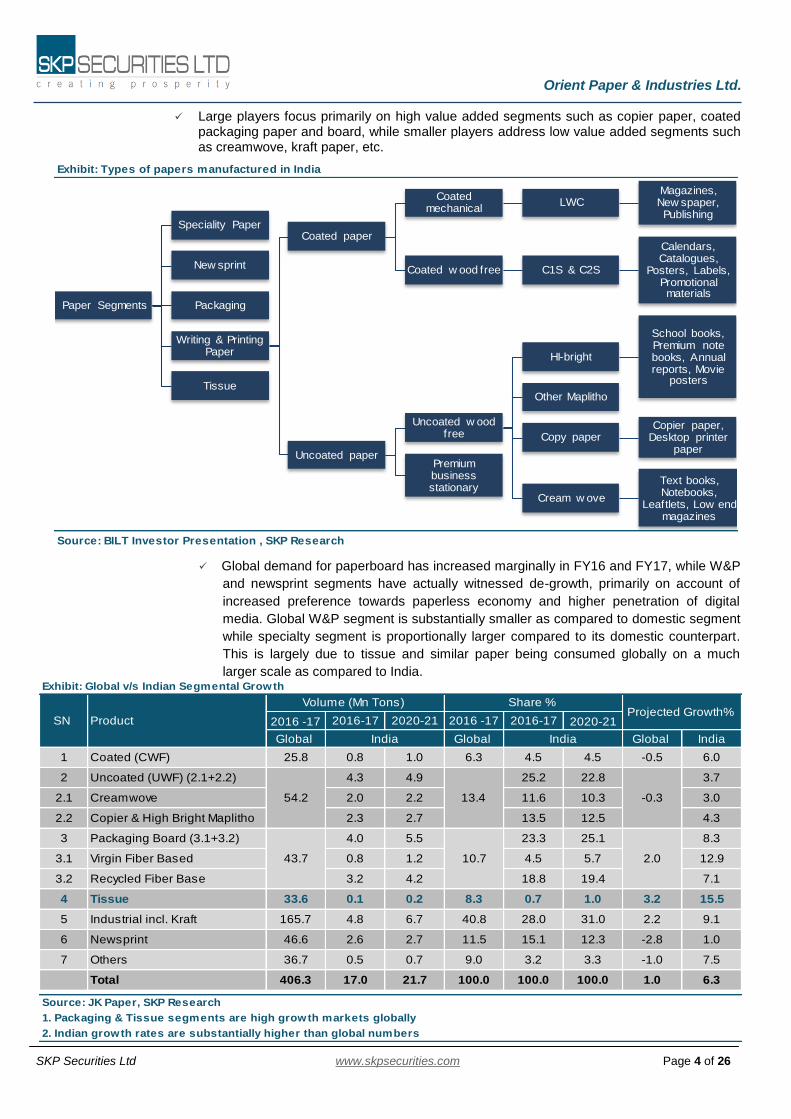
Exhibit: Types of papers manufactured in India
Source: BILT Investor Presentation , SKP Research
Paper Segments
Speciality Paper
New sprint
Packaging
Writing & Printing Paper
Coated paper
Coated mechanical
LWCMagazines, New spaper, Publishing
Coated w ood free C1S & C2S
Calendars, Catalogues,
Posters, Labels, Promotional materials
Uncoated paper
Uncoated w ood free
HI-bright
School books, Premium note books, Annual reports, Movie
posters
Other Maplitho
Copy paperCopier paper,
Desktop printer paper
Cream w ove
Text books, Notebooks,
Leaftlets, Low end magazines
Premium business stationary
Tissue
Large players focus primarily on high value added segments such as copier paper, coated packaging paper and board, while smaller players address low value added segments such as creamwove, kraft paper, etc.
Global demand for paperboard has increased marginally in FY16 and FY17, while W&P
and newsprint segments have actually witnessed de-growth, primarily on account of
increased preference towards paperless economy and higher penetration of digital
media. Global W&P segment is substantially smaller as compared to domestic segment
while specialty segment is proportionally larger compared to its domestic counterpart.
This is largely due to tissue and similar paper being consumed globally on a much
larger scale as compared to India.
Exhibit: Global v/s Indian Segmental Growth
2016 -17 2016-17 2020-21 2016 -17 2016-17 2020-21
Global Global Global India
1 Coated (CWF) 25.8 0.8 1.0 6.3 4.5 4.5 -0.5 6.0
2 Uncoated (UWF) (2.1+2.2) 4.3 4.9 25.2 22.8 3.7
2.1 Creamwove 2.0 2.2 11.6 10.3 3.0
2.2 Copier & High Bright Maplitho 2.3 2.7 13.5 12.5 4.3
3 Packaging Board (3.1+3.2) 4.0 5.5 23.3 25.1 8.3
3.1 Virgin Fiber Based 0.8 1.2 4.5 5.7 12.9
3.2 Recycled Fiber Base 3.2 4.2 18.8 19.4 7.1
4 Tissue 33.6 0.1 0.2 8.3 0.7 1.0 3.2 15.5
5 Industrial incl. Kraft 165.7 4.8 6.7 40.8 28.0 31.0 2.2 9.1
6 Newsprint 46.6 2.6 2.7 11.5 15.1 12.3 -2.8 1.0
7 Others 36.7 0.5 0.7 9.0 3.2 3.3 -1.0 7.5
Total 406.3 17.0 21.7 100.0 100.0 100.0 1.0 6.3
1. Packaging & Tissue segments are high growth markets globally
2. Indian growth rates are substantially higher than global numbers
Projected Growth%
Source: JK Paper, SKP Research
54.2 13.4 -0.3
43.7 10.7 2.0
SN Product
Volume (Mn Tons) Share %
India India
Orient Paper & Industries Ltd.
SKP Securities Ltd www.skpsecurities.com Page 5 of 26
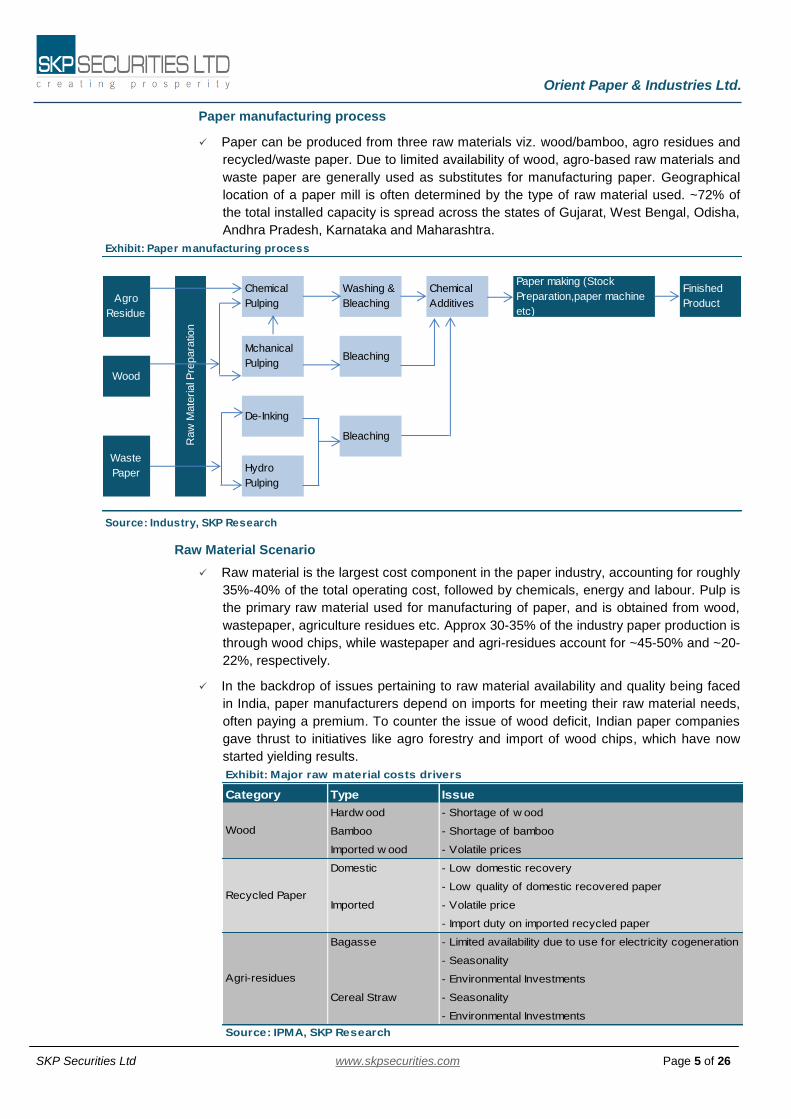
Exhibit: Paper manufacturing process
Source: Industry, SKP Research
De-Inking
Hydro
Pulping
Bleaching
Raw
Mate
rial P
repara
tion
Agro
Residue
Wood
Waste
Paper
Chemical
Pulping
Washing &
Bleaching
Chemical
Additives
Paper making (Stock
Preparation,paper machine
etc)
Finished
Product
Mchanical
PulpingBleaching
Paper manufacturing process
Paper can be produced from three raw materials viz. wood/bamboo, agro residues and
recycled/waste paper. Due to limited availability of wood, agro-based raw materials and
waste paper are generally used as substitutes for manufacturing paper. Geographical
location of a paper mill is often determined by the type of raw material used. ~72% of
the total installed capacity is spread across the states of Gujarat, West Bengal, Odisha,
Andhra Pradesh, Karnataka and Maharashtra.
Raw Material Scenario
Raw material is the largest cost component in the paper industry, accounting for roughly
35%-40% of the total operating cost, followed by chemicals, energy and labour. Pulp is
the primary raw material used for manufacturing of paper, and is obtained from wood,
wastepaper, agriculture residues etc. Approx 30-35% of the industry paper production is
through wood chips, while wastepaper and agri-residues account for ~45-50% and ~20-
22%, respectively.
In the backdrop of issues pertaining to raw material availability and quality being faced
in India, paper manufacturers depend on imports for meeting their raw material needs,
often paying a premium. To counter the issue of wood deficit, Indian paper companies
gave thrust to initiatives like agro forestry and import of wood chips, which have now
started yielding results.
Exhibit: Major raw material costs drivers
Category Type Issue
Hardw ood - Shortage of w ood
Bamboo - Shortage of bamboo
Imported w ood - Volatile prices
Domestic - Low domestic recovery
- Low quality of domestic recovered paper
Imported - Volatile price
- Import duty on imported recycled paper
Bagasse - Limited availability due to use for electricity cogeneration
- Seasonality
- Environmental Investments
Cereal Straw - Seasonality
- Environmental Investments
Source: IPMA, SKP Research
Wood
Recycled Paper
Agri-residues
Orient Paper & Industries Ltd.
SKP Securities Ltd www.skpsecurities.com Page 6 of 26
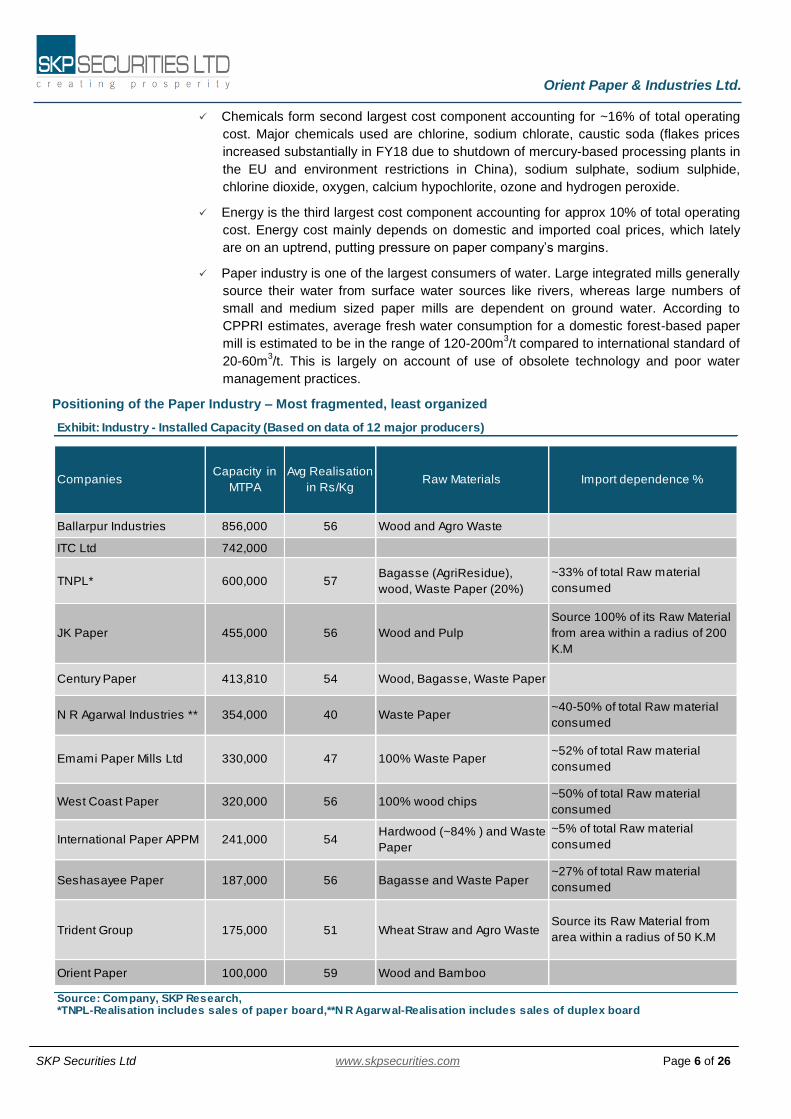
Exhibit: Industry - Installed Capacity (Based on data of 12 major producers)
Ballarpur Industries 856,000 56 Wood and Agro Waste
ITC Ltd 742,000
TNPL* 600,000 57Bagasse (AgriResidue),
wood, Waste Paper (20%)
Seshasayee Paper 187,000 56 Bagasse and Waste Paper
Trident Group 175,000 51 Wheat Straw and Agro Waste
Orient Paper 100,000 59 Wood and Bamboo
*TNPL-Realisation includes sales of paper board,**N R Agarwal-Realisation includes sales of duplex board
N R Agarwal Industries ** 354,000 40 Waste Paper ~40-50% of total Raw material
consumed
~5% of total Raw material
consumed
~27% of total Raw material
consumed
Source its Raw Material from
area within a radius of 50 K.M
Source: Company, SKP Research,
~50% of total Raw material
consumed
International Paper APPM 241,000
56 100% wood chips
54Hardwood (~84% ) and Waste
Paper
West Coast Paper 320,000
47 100% Waste Paper~52% of total Raw material
consumed Emami Paper Mills Ltd 330,000
54 Wood, Bagasse, Waste Paper Century Paper 413,810
~33% of total Raw material
consumed
JK Paper 455,000 56 Wood and Pulp
Source 100% of its Raw Material
from area within a radius of 200
K.M
Companies Capacity in
MTPA
Avg Realisation
in Rs/Kg Raw Materials Import dependence %
Chemicals form second largest cost component accounting for ~16% of total operating
cost. Major chemicals used are chlorine, sodium chlorate, caustic soda (flakes prices
increased substantially in FY18 due to shutdown of mercury-based processing plants in
the EU and environment restrictions in China), sodium sulphate, sodium sulphide,
chlorine dioxide, oxygen, calcium hypochlorite, ozone and hydrogen peroxide.
Energy is the third largest cost component accounting for approx 10% of total operating
cost. Energy cost mainly depends on domestic and imported coal prices, which lately
are on an uptrend, putting pressure on paper company’s margins.
Paper industry is one of the largest consumers of water. Large integrated mills generally
source their water from surface water sources like rivers, whereas large numbers of
small and medium sized paper mills are dependent on ground water. According to
CPPRI estimates, average fresh water consumption for a domestic forest-based paper
mill is estimated to be in the range of 120-200m3/t compared to international standard of
20-60m3/t. This is largely on account of use of obsolete technology and poor water
management practices.
Positioning of the Paper Industry – Most fragmented, least organized
Orient Paper & Industries Ltd.
SKP Securities Ltd www.skpsecurities.com Page 7 of 26
Exhibit: Average NBSK Pulp List Price ($/ADMT) Exhibit: Global traded pulp producers share – 2017
Source: Mercer International 10K , SKP Research Source: Mercer International 10K , SKP Research
Fibria, 18%
Suzano, 10%
CMPC, 9%
APRIL, 8%
Arauco, 6%
Asia Pulp & Paper, 6%
UPM, 5%
Eldorado Celulose, 5%
Cenibra, 3%
Klabin, 3%
Others, 28%
905
935
800
810
1030
750
700
595
605
890990
1020
940
990
1205
0
200
400
600
800
1000
1200
1400
2013 2014 2015 2016 2017
Europe China North America
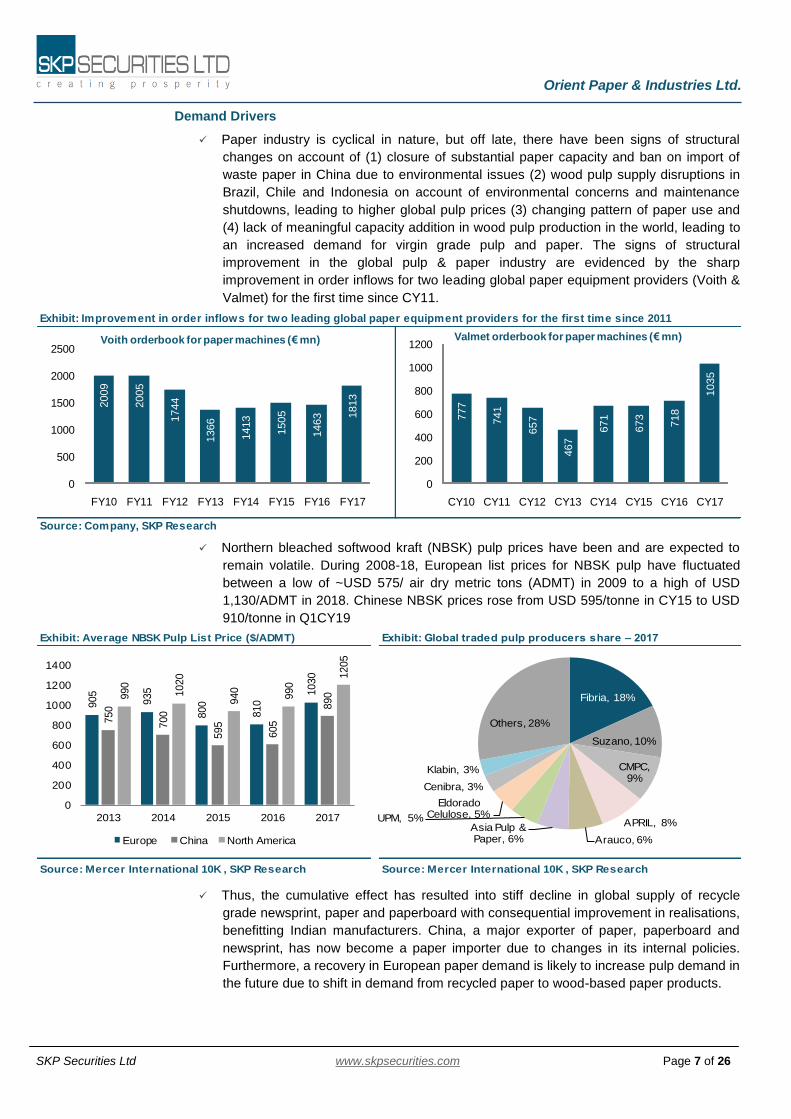
Demand Drivers
Paper industry is cyclical in nature, but off late, there have been signs of structural
changes on account of (1) closure of substantial paper capacity and ban on import of
waste paper in China due to environmental issues (2) wood pulp supply disruptions in
Brazil, Chile and Indonesia on account of environmental concerns and maintenance
shutdowns, leading to higher global pulp prices (3) changing pattern of paper use and
(4) lack of meaningful capacity addition in wood pulp production in the world, leading to
an increased demand for virgin grade pulp and paper. The signs of structural
improvement in the global pulp & paper industry are evidenced by the sharp
improvement in order inflows for two leading global paper equipment providers (Voith &
Valmet) for the first time since CY11.
Northern bleached softwood kraft (NBSK) pulp prices have been and are expected to
remain volatile. During 2008-18, European list prices for NBSK pulp have fluctuated
between a low of ~USD 575/ air dry metric tons (ADMT) in 2009 to a high of USD
1,130/ADMT in 2018. Chinese NBSK prices rose from USD 595/tonne in CY15 to USD
910/tonne in Q1CY19
Thus, the cumulative effect has resulted into stiff decline in global supply of recycle
grade newsprint, paper and paperboard with consequential improvement in realisations,
benefitting Indian manufacturers. China, a major exporter of paper, paperboard and
newsprint, has now become a paper importer due to changes in its internal policies.
Furthermore, a recovery in European paper demand is likely to increase pulp demand in
the future due to shift in demand from recycled paper to wood-based paper products.
Exhibit: Improvement in order inflows for two leading global paper equipment providers for the first time since 2011
Source: Company, SKP Research
2009
2005
1744
1366
1413
1505
1463 1
813
0
500
1000
1500
2000
2500
FY10 FY11 FY12 FY13 FY14 FY15 FY16 FY17
Voith orderbook for paper machines (€ mn)
777
741
657
467
671
673
718
1035
0
200
400
600
800
1000
1200
CY10 CY11 CY12 CY13 CY14 CY15 CY16 CY17
Valmet orderbook for paper machines (€ mn)
Orient Paper & Industries Ltd.
SKP Securities Ltd www.skpsecurities.com Page 8 of 26
Exhibit: Per capita indicators (Rs '000 at current prices) Exhibit: Age distribution of Indian population
Source: : Central Statistics Office (CSO), IBEF, SKP Research
73.5 82.4 91.9
100.2
108.6
119.3
71.6 80.5 89.8 98.1
106.6
117.4
40.3
45.9
52.3
57.4
61.6 6
80
20
40
60
80
100
120
140
FY12 FY13 FY14 FY15 FY16 FY17
Per Capita GNDI Indian GDP Per Capita Per Capita PFCE
46.9 37.9 37.1 30.1 26.7
55.456.9 63.4
66.2 66.2
7.37.7 5.8 6.1 5.8
0
20
40
60
80
100
120
Japan US China World India
0-14 years 15-64 years >64 years
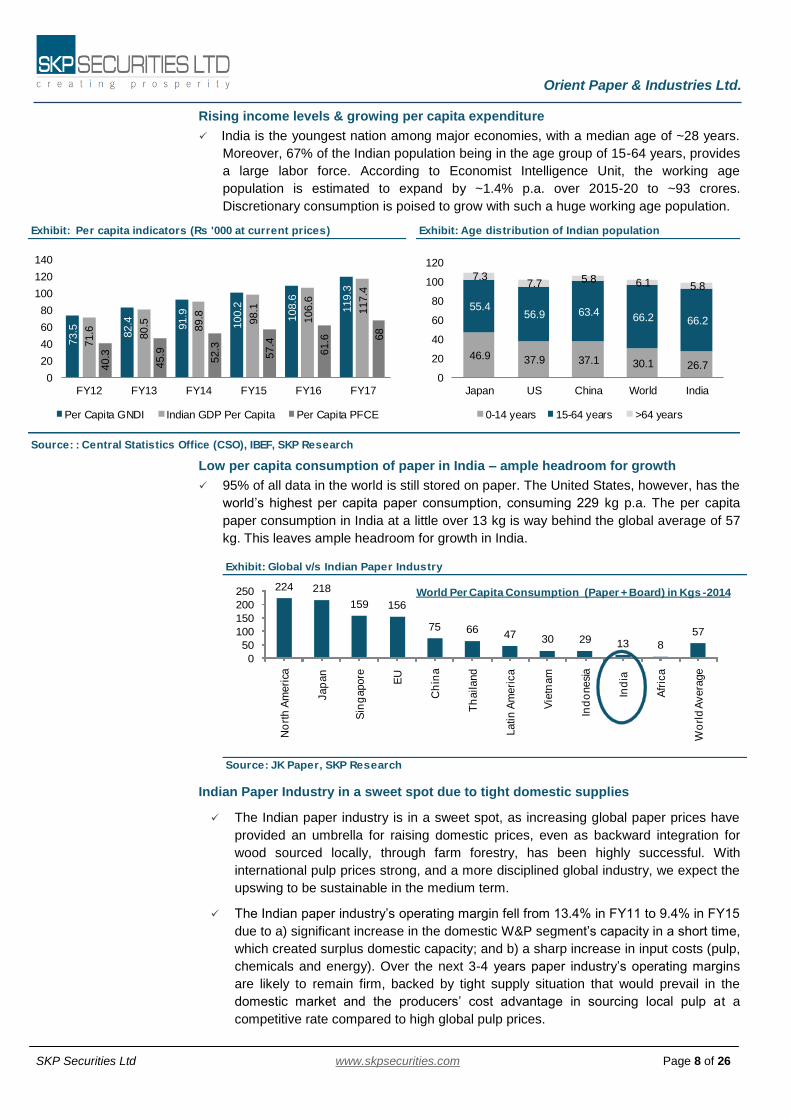
Rising income levels & growing per capita expenditure
India is the youngest nation among major economies, with a median age of ~28 years.
Moreover, 67% of the Indian population being in the age group of 15-64 years, provides
a large labor force. According to Economist Intelligence Unit, the working age
population is estimated to expand by ~1.4% p.a. over 2015-20 to ~93 crores.
Discretionary consumption is poised to grow with such a huge working age population.
Low per capita consumption of paper in India – ample headroom for growth
95% of all data in the world is still stored on paper. The United States, however, has the
world’s highest per capita paper consumption, consuming 229 kg p.a. The per capita
paper consumption in India at a little over 13 kg is way behind the global average of 57
kg. This leaves ample headroom for growth in India.
Indian Paper Industry in a sweet spot due to tight domestic supplies
The Indian paper industry is in a sweet spot, as increasing global paper prices have
provided an umbrella for raising domestic prices, even as backward integration for
wood sourced locally, through farm forestry, has been highly successful. With
international pulp prices strong, and a more disciplined global industry, we expect the
upswing to be sustainable in the medium term.
The Indian paper industry’s operating margin fell from 13.4% in FY11 to 9.4% in FY15
due to a) significant increase in the domestic W&P segment’s capacity in a short time,
which created surplus domestic capacity; and b) a sharp increase in input costs (pulp,
chemicals and energy). Over the next 3-4 years paper industry’s operating margins
are likely to remain firm, backed by tight supply situation that would prevail in the
domestic market and the producers’ cost advantage in sourcing local pulp at a
competitive rate compared to high global pulp prices.
Source: JK Paper, SKP Research
Exhibit: Global v/s Indian Paper Industry
224 218
159 156
75 6647 30 29 13 8
57
0
50
100
150
200
250
No
rth
Am
eri
ca
Jap
an
Sin
gapore
EU
Ch
ina
Th
ailand
Latin
Am
eri
ca
Vie
tnam
Ind
onesi
a
Ind
ia
Afr
ica
Wo
rld A
vera
ge
World Per Capita Consumption (Paper + Board) in Kgs -2014

Orient Paper & Industries Ltd.
SKP Securities Ltd www.skpsecurities.com Page 9 of 26
Exhibit: Industry - Financial Synopsis
Source: Company, SKP Research
20.9%
10.2%
14.8%16.0%
4.3%
10.9%
14.6%
8.1%13.4%
10.1% 10.3% 9.8%
9.4%
11.1%
14.7%15.8%
0.0%
5.0%
10.0%
15.0%
20.0%
25.0%
FY11 FY12 FY13 FY14 FY15 FY16 FY17 FY18
Industry's margin & revenue growth (%)
Margin(%) Revenue Growth (%)
2.3
1.9
1.0
1.3
1.0
1.31.4
1.7
1.0 1.0 1.1 1.2 1.2
1.41.4
0.8
0.0
0.5
1.0
1.5
2.0
2.5
FY11 FY12 FY13 FY14 FY15 FY16 FY17 FY18
D/E (X) & ICR (X)
D/E (X) ICR (X)
Unlike in the previous cycle where players added capacity in uncoated paper
segment, future capex creation would be in a different vertical of the paper industry
(specialty paper, packaging board) by strong players and the weak balance sheet of
key paper producers (such as BILT) would restrict them from aggressively
participating in the current cycle.
After receiving environmental and other clearance, it usually takes 18-24 months for a
brownfield expansion and 24-30 months for a greenfield expansion. As per industry
estimates, as against an estimated annual increase in demand of ~1 MTPA for virgin-
pulp-based uncoated paper, only two players have received environmental clearance
for brownfield expansion for an aggregate capacity of ~150 KTPA. Therefore, we
believe the industry is likely to face a tight supply situation over next 3-4 years, giving
enhanced pricing power to existing paper manufacturers.
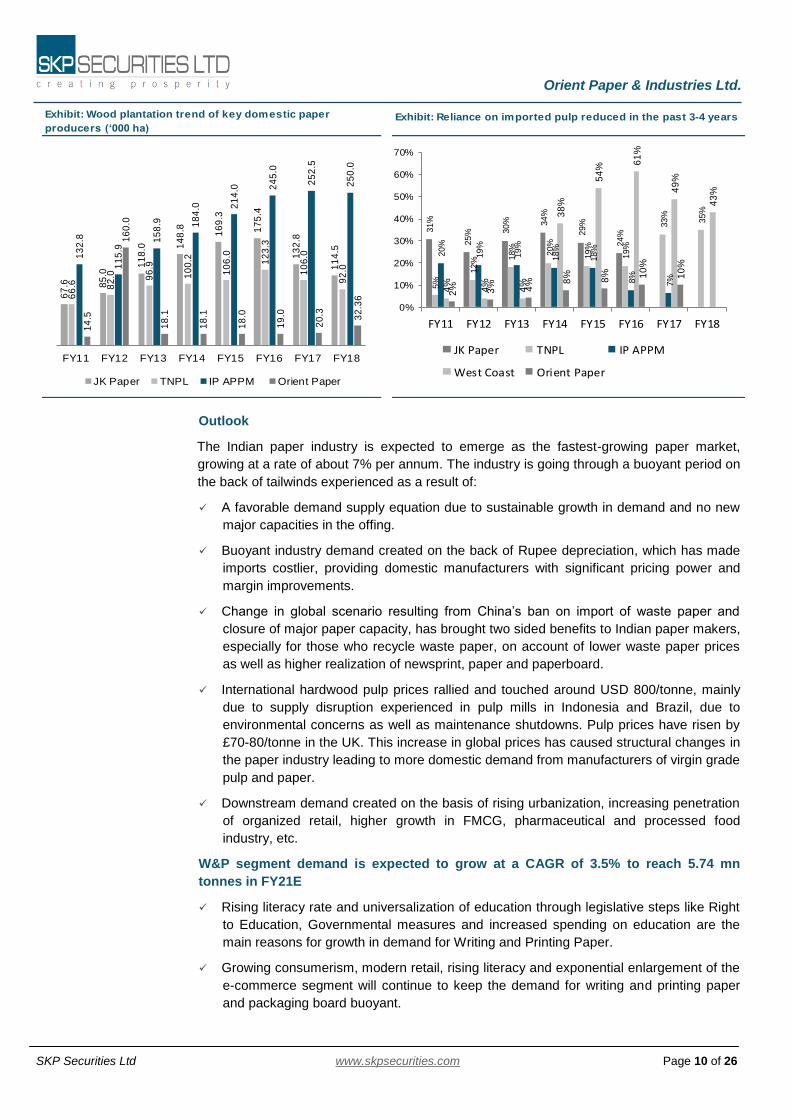
Domestic wood prices to remain weak on increased plantation of wood & bamboo
reclassification
Over the past decade, key focus area for wood-based domestic paper manufacturers
has been on improving farm forestry near the plant area (within a radius of 200 KM) for
better wood availability at reasonable prices. This also helps in reducing freight cost and
less reliance on costlier imported wood/pulp.
This commitment was reinforced through various initiatives such as training of farmers
to enhance plantation yields and assisting farmers seeking loans for plantation
reinvestment. The farm forestry initiative has also helped enhancing sustainable
livelihoods across rural districts, provided farmers a stable customer and the prospect of
equitable realizations (income out of eucalyptus, subabul and casuarina wood
cultivation is estimated to be far better than other cash crops).
The GoI is now seriously considering utilization of waste lands for plantations to
generate revenue, thereby generating job opportunities in rural segment and reducing
reliance on imported wood/pulp. Further, the recent draft National Forest Policy 2018
and the Government’s reclassification of bamboo from forest produce to non-forest
produce (for bamboo grown outside reserved forest areas) in November 2017 are
positive steps to increase wood/bamboo supply in the domestic market.
Orient Paper & Industries Ltd.
SKP Securities Ltd www.skpsecurities.com Page 10 of 26
Exhibit: Wood plantation trend of key domestic paper
producers (‘000 ha)Exhibit: Reliance on imported pulp reduced in the past 3-4 years
67
.6 85
.0
11
8.0 1
48
.8 16
9.3
17
5.4
13
2.8
11
4.5
66
.6 82
.0 96
.9
10
0.2
10
6.0
12
3.3
10
6.0
92
.0
13
2.8
11
5.9
15
8.9 18
4.0 2
14
.0 24
5.0
25
2.5
25
0.0
14
.5
16
0.0
18
.1
18
.1
18
.0
19
.0
20
.3 32
.36
FY11 FY12 FY13 FY14 FY15 FY16 FY17 FY18
JK Paper TNPL IP APPM Orient Paper
31%
25% 3
0% 34
%
29
%
24%
5%
12% 1
8%
20
%
19%
19%
33%
35%
20%
19
%
19
%
18%
18
%
8%
7%
4%
4%
4%
38
%
54
%
61
%
49
%
43
%
2% 3% 4% 8
% 8% 10
%
10
%
0%
10%
20%
30%
40%
50%
60%
70%
FY11 FY12 FY13 FY14 FY15 FY16 FY17 FY18
JK Paper TNPL IP APPM
West Coast Orient Paper
Outlook
The Indian paper industry is expected to emerge as the fastest-growing paper market,
growing at a rate of about 7% per annum. The industry is going through a buoyant period on
the back of tailwinds experienced as a result of:
A favorable demand supply equation due to sustainable growth in demand and no new
major capacities in the offing.
Buoyant industry demand created on the back of Rupee depreciation, which has made
imports costlier, providing domestic manufacturers with significant pricing power and
margin improvements.
Change in global scenario resulting from China’s ban on import of waste paper and
closure of major paper capacity, has brought two sided benefits to Indian paper makers,
especially for those who recycle waste paper, on account of lower waste paper prices
as well as higher realization of newsprint, paper and paperboard.
International hardwood pulp prices rallied and touched around USD 800/tonne, mainly
due to supply disruption experienced in pulp mills in Indonesia and Brazil, due to
environmental concerns as well as maintenance shutdowns. Pulp prices have risen by
£70-80/tonne in the UK. This increase in global prices has caused structural changes in
the paper industry leading to more domestic demand from manufacturers of virgin grade
pulp and paper.
Downstream demand created on the basis of rising urbanization, increasing penetration
of organized retail, higher growth in FMCG, pharmaceutical and processed food
industry, etc.
W&P segment demand is expected to grow at a CAGR of 3.5% to reach 5.74 mn
tonnes in FY21E
Rising literacy rate and universalization of education through legislative steps like Right
to Education, Governmental measures and increased spending on education are the
main reasons for growth in demand for Writing and Printing Paper.
Growing consumerism, modern retail, rising literacy and exponential enlargement of the
e-commerce segment will continue to keep the demand for writing and printing paper
and packaging board buoyant.
Orient Paper & Industries Ltd.
SKP Securities Ltd www.skpsecurities.com Page 11 of 26
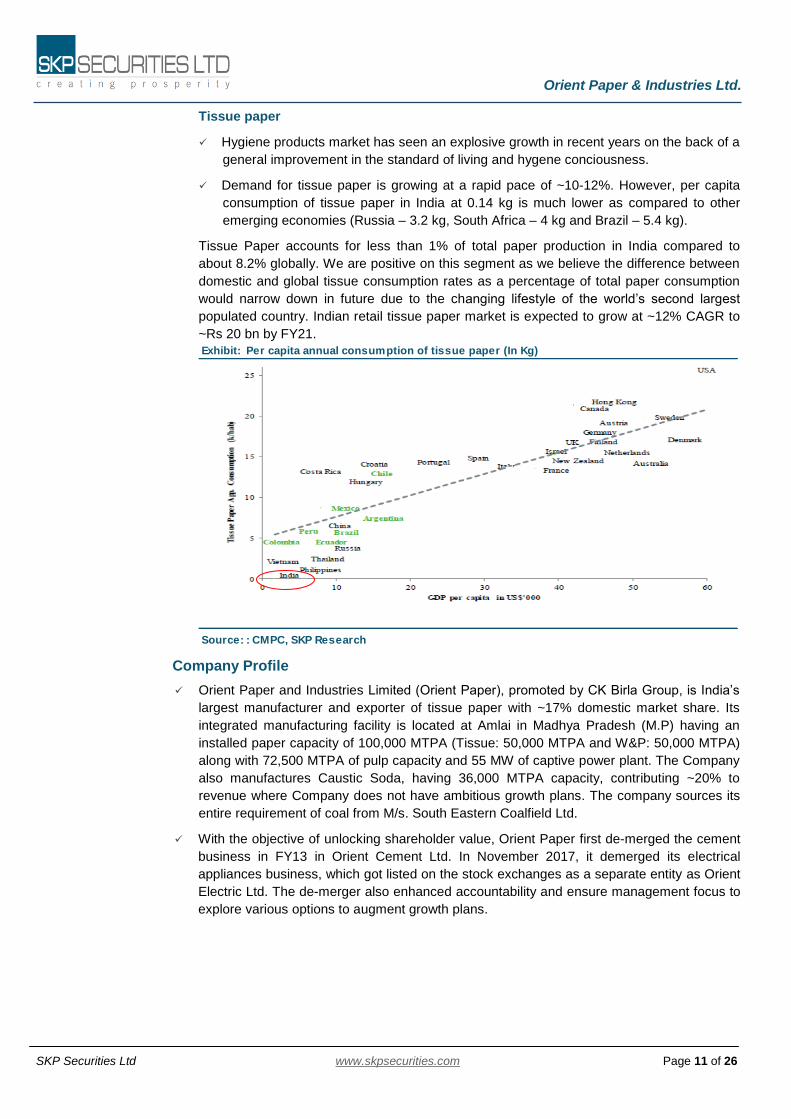
Exhibit: Per capita annual consumption of tissue paper (In Kg)
Source: : CMPC, SKP Research
Tissue paper
Hygiene products market has seen an explosive growth in recent years on the back of a
general improvement in the standard of living and hygene conciousness.
Demand for tissue paper is growing at a rapid pace of ~10-12%. However, per capita
consumption of tissue paper in India at 0.14 kg is much lower as compared to other
emerging economies (Russia – 3.2 kg, South Africa – 4 kg and Brazil – 5.4 kg).
Tissue Paper accounts for less than 1% of total paper production in India compared to
about 8.2% globally. We are positive on this segment as we believe the difference between
domestic and global tissue consumption rates as a percentage of total paper consumption
would narrow down in future due to the changing lifestyle of the world’s second largest
populated country. Indian retail tissue paper market is expected to grow at ~12% CAGR to
~Rs 20 bn by FY21.
Company Profile
Orient Paper and Industries Limited (Orient Paper), promoted by CK Birla Group, is India’s
largest manufacturer and exporter of tissue paper with ~17% domestic market share. Its
integrated manufacturing facility is located at Amlai in Madhya Pradesh (M.P) having an
installed paper capacity of 100,000 MTPA (Tissue: 50,000 MTPA and W&P: 50,000 MTPA)
along with 72,500 MTPA of pulp capacity and 55 MW of captive power plant. The Company
also manufactures Caustic Soda, having 36,000 MTPA capacity, contributing ~20% to
revenue where Company does not have ambitious growth plans. The company sources its
entire requirement of coal from M/s. South Eastern Coalfield Ltd.
With the objective of unlocking shareholder value, Orient Paper first de-merged the cement
business in FY13 in Orient Cement Ltd. In November 2017, it demerged its electrical
appliances business, which got listed on the stock exchanges as a separate entity as Orient
Electric Ltd. The de-merger also enhanced accountability and ensure management focus to
explore various options to augment growth plans.
Orient Paper & Industries Ltd.
SKP Securities Ltd www.skpsecurities.com Page 12 of 26
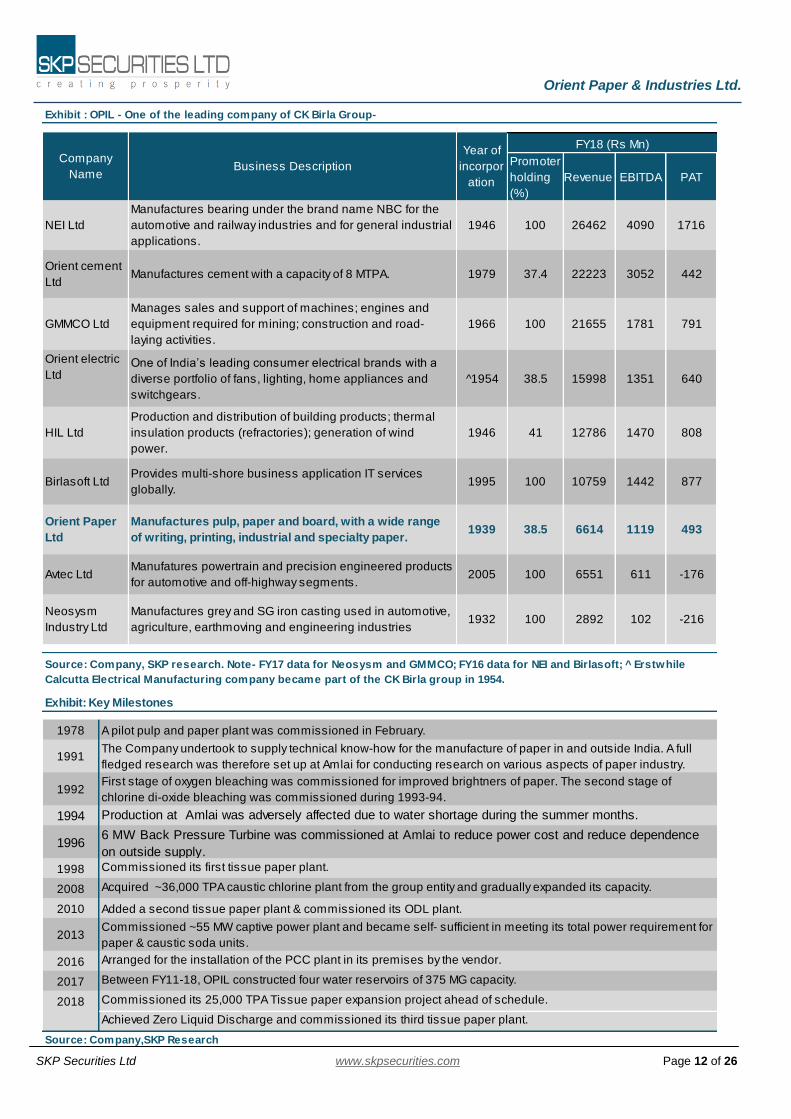
Exhibit : OPIL - One of the leading company of CK Birla Group-
Promoter
holding
(%)
Revenue EBITDA PAT
FY18 (Rs Mn)Company
Name Business Description
Year of
incorpor
ation
Source: Company, SKP research. Note- FY17 data for Neosysm and GMMCO; FY16 data for NEI and Birlasoft; ^ Erstwhile
Calcutta Electrical Manufacturing company became part of the CK Birla group in 1954.
-216
611
102
493
-176
1716
442
791
640
808
877
6614
6551
2892
4090
3052
1781
1351
1470
1442
1119
26462
22223
21655
15998
12786
10759
100
37.4
100
38.5
41
100
38.51939
2005
1932
100
100
Manufactures bearing under the brand name NBC for the
automotive and railway industries and for general industrial
applications.
NEI Ltd
Orient cement
LtdManufactures cement with a capacity of 8 MTPA.
Birlasoft LtdProvides multi-shore business application IT services
globally.
GMMCO Ltd
Manages sales and support of machines; engines and
equipment required for mining; construction and road-
laying activities.
1946
1979
1966
^1954
1946
1995
Avtec LtdManufatures powertrain and precision engineered products
for automotive and off-highway segments.
Neosysm
Industry Ltd
Manufactures grey and SG iron casting used in automotive,
agriculture, earthmoving and engineering industries
Orient electric
LtdOne of India’s leading consumer electrical brands with a
diverse portfolio of fans, lighting, home appliances and
switchgears.
HIL Ltd
Production and distribution of building products; thermal
insulation products (refractories); generation of wind
power.
Orient Paper
Ltd
Manufactures pulp, paper and board, with a wide range
of writing, printing, industrial and specialty paper.
Exhibit: Key Milestones
1978 A pilot pulp and paper plant was commissioned in February.
1991The Company undertook to supply technical know-how for the manufacture of paper in and outside India. A full
fledged research was therefore set up at Amlai for conducting research on various aspects of paper industry.
1992First stage of oxygen bleaching was commissioned for improved brightners of paper. The second stage of
chlorine di-oxide bleaching was commissioned during 1993-94.
1994 Production at Amlai was adversely affected due to water shortage during the summer months.
19966 MW Back Pressure Turbine was commissioned at Amlai to reduce power cost and reduce dependence
on outside supply.
1998 Commissioned its first tissue paper plant.
2008 Acquired ~36,000 TPA caustic chlorine plant from the group entity and gradually expanded its capacity.
2010 Added a second tissue paper plant & commissioned its ODL plant.
2013Commissioned ~55 MW captive power plant and became self- sufficient in meeting its total power requirement for
paper & caustic soda units.
2016 Arranged for the installation of the PCC plant in its premises by the vendor.
2017 Between FY11-18, OPIL constructed four water reservoirs of 375 MG capacity.
2018 Commissioned its 25,000 TPA Tissue paper expansion project ahead of schedule.
Achieved Zero Liquid Discharge and commissioned its third tissue paper plant.
Source: Company,SKP Research
Orient Paper & Industries Ltd.
SKP Securities Ltd www.skpsecurities.com Page 13 of 26
Parameter Paper & Board Caustic soda Others
Key competitors
Demand drivers
Source: Company, SKP Research
Key risks
3%
3%
Exhibit : Orient Paper and Industries Limited - Business Mix
Geographic presence
Sales growth (FY14-FY18 – 4-yr CAGR)
Sales forecast (FY18-FY20 – 2-yr CAGR)
18%
14%
Revenue contribution (FY17) 79%
(12%) (7% growth in volume and 4% growth in realization CAGR)
(7%) (4% growth in volume and 5% growth in realization CAGR)
Capital Allocation
Credit Rating
Domestic: 83%, Exports: 17% (UAE and Rest of the world)
A prominent player in the writing & printing (W&P) paper segment with a capacity of
50,000 TPA. It also has a diversified presence in all the high-value tissue segments
(Tissue Capacity – 50,000 TPA) with manufacturing facilities located in AMLAI, Madhya
Pradesh.
Orient has been prudent in capital allocation. To eliminate its dependency on the
more expensive market pulp), Orient Paper has planned to increase its pulp capacity
from 72,500 MTPA to 100,000 MTPA at a cost of Rs 450 mn. It is also setting up a new
recovery boiler at a cost of ~Rs 1.65 bn and upgrading its pulp capacity to become
ECF (elemental chlorine free) complaint at a cost of ~Rs 150 mn. Post expansion the
enhanced pulp capacity will support paper production of 120,000-125,000 MTPA as
against current paper capacity of 100,000 MTPA.
Revenue contribution (FY20E)
Market position
JK Papers Ltd, BILT, TNPL, Century, ITC, WCPM and Emami Paper
The increasing rates of literacy rate, consumerism, economic activity,changing
lifestyles and e-commerce transactions are key revenue drivers in this industry.
CARE Ratings assigned CARE AA-; Stable / CARE A1+ (Double A minus; Outlook:
Stable/ A One plus) rating in view of long and satisfactory track record of the company.
Volatility in raw material (Bamboo/wood,pulp,chemical) prices of paper division
Threat from imports, though limited in tissue paper segment
83%
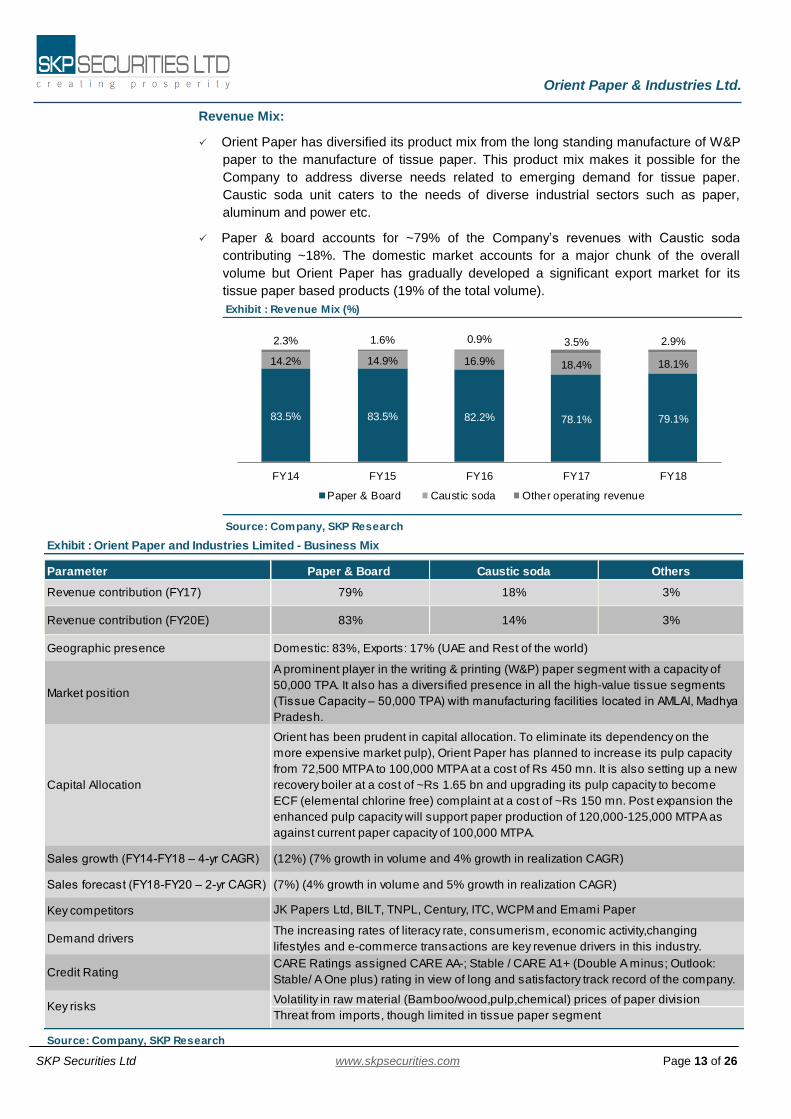
Exhibit : Revenue Mix (%)
Source: Company, SKP Research
83.5% 83.5% 82.2% 78.1% 79.1%
14.2% 14.9% 16.9% 18.4% 18.1%
2.3% 1.6% 0.9% 3.5% 2.9%
FY14 FY15 FY16 FY17 FY18
Paper & Board Caustic soda Other operating revenue
Revenue Mix:
Orient Paper has diversified its product mix from the long standing manufacture of W&P
paper to the manufacture of tissue paper. This product mix makes it possible for the
Company to address diverse needs related to emerging demand for tissue paper.
Caustic soda unit caters to the needs of diverse industrial sectors such as paper,
aluminum and power etc.
Paper & board accounts for ~79% of the Company’s revenues with Caustic soda
contributing ~18%. The domestic market accounts for a major chunk of the overall
volume but Orient Paper has gradually developed a significant export market for its
tissue paper based products (19% of the total volume).
Orient Paper & Industries Ltd.
SKP Securities Ltd www.skpsecurities.com Page 14 of 26
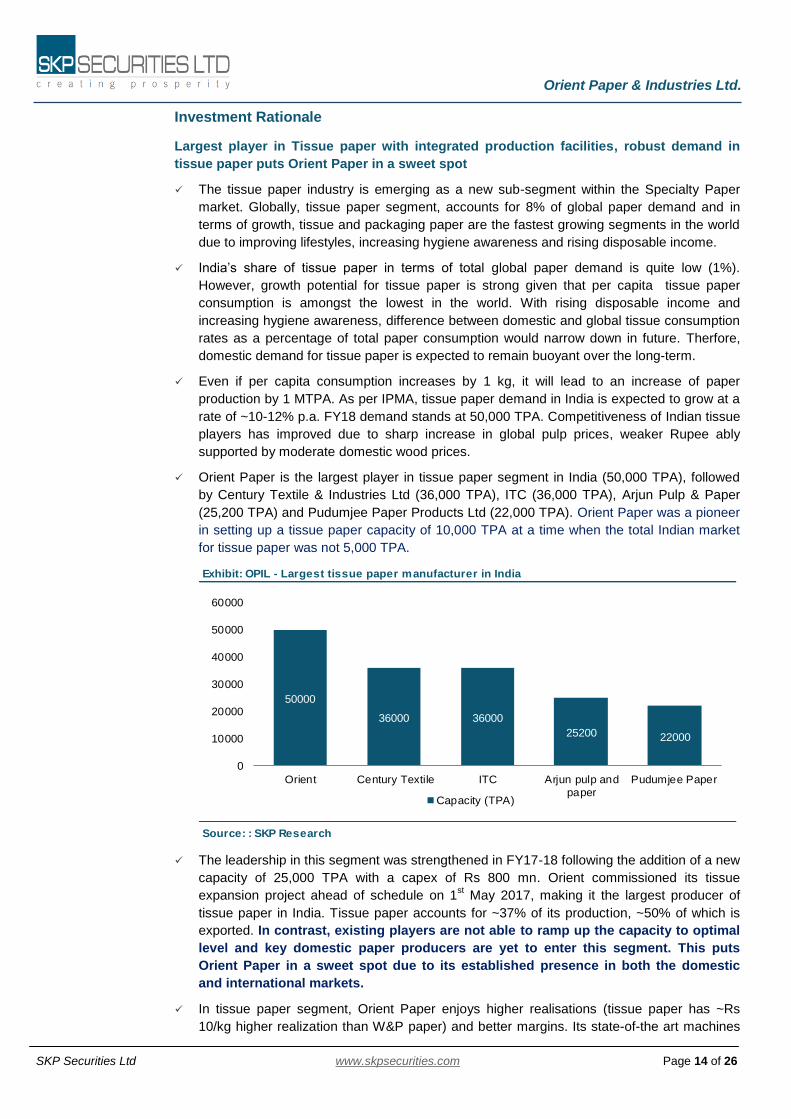
Exhibit: OPIL - Largest tissue paper manufacturer in India
Source: : SKP Research
50000
36000 36000
25200 22000
0
10000
20000
30000
40000
50000
60000
Orient Century Textile ITC Arjun pulp and
paper
Pudumjee Paper
Capacity (TPA)
Investment Rationale
Largest player in Tissue paper with integrated production facilities, robust demand in
tissue paper puts Orient Paper in a sweet spot
The tissue paper industry is emerging as a new sub-segment within the Specialty Paper
market. Globally, tissue paper segment, accounts for 8% of global paper demand and in
terms of growth, tissue and packaging paper are the fastest growing segments in the world
due to improving lifestyles, increasing hygiene awareness and rising disposable income.
India’s share of tissue paper in terms of total global paper demand is quite low (1%).
However, growth potential for tissue paper is strong given that per capita tissue paper
consumption is amongst the lowest in the world. With rising disposable income and
increasing hygiene awareness, difference between domestic and global tissue consumption
rates as a percentage of total paper consumption would narrow down in future. Therfore,
domestic demand for tissue paper is expected to remain buoyant over the long-term.
Even if per capita consumption increases by 1 kg, it will lead to an increase of paper
production by 1 MTPA. As per IPMA, tissue paper demand in India is expected to grow at a
rate of ~10-12% p.a. FY18 demand stands at 50,000 TPA. Competitiveness of Indian tissue
players has improved due to sharp increase in global pulp prices, weaker Rupee ably
supported by moderate domestic wood prices.
Orient Paper is the largest player in tissue paper segment in India (50,000 TPA), followed
by Century Textile & Industries Ltd (36,000 TPA), ITC (36,000 TPA), Arjun Pulp & Paper
(25,200 TPA) and Pudumjee Paper Products Ltd (22,000 TPA). Orient Paper was a pioneer
in setting up a tissue paper capacity of 10,000 TPA at a time when the total Indian market
for tissue paper was not 5,000 TPA.
The leadership in this segment was strengthened in FY17-18 following the addition of a new
capacity of 25,000 TPA with a capex of Rs 800 mn. Orient commissioned its tissue
expansion project ahead of schedule on 1st May 2017, making it the largest producer of
tissue paper in India. Tissue paper accounts for ~37% of its production, ~50% of which is
exported. In contrast, existing players are not able to ramp up the capacity to optimal
level and key domestic paper producers are yet to enter this segment. This puts
Orient Paper in a sweet spot due to its established presence in both the domestic
and international markets.
In tissue paper segment, Orient Paper enjoys higher realisations (tissue paper has ~Rs
10/kg higher realization than W&P paper) and better margins. Its state-of-the art machines
Orient Paper & Industries Ltd.
SKP Securities Ltd www.skpsecurities.com Page 15 of 26
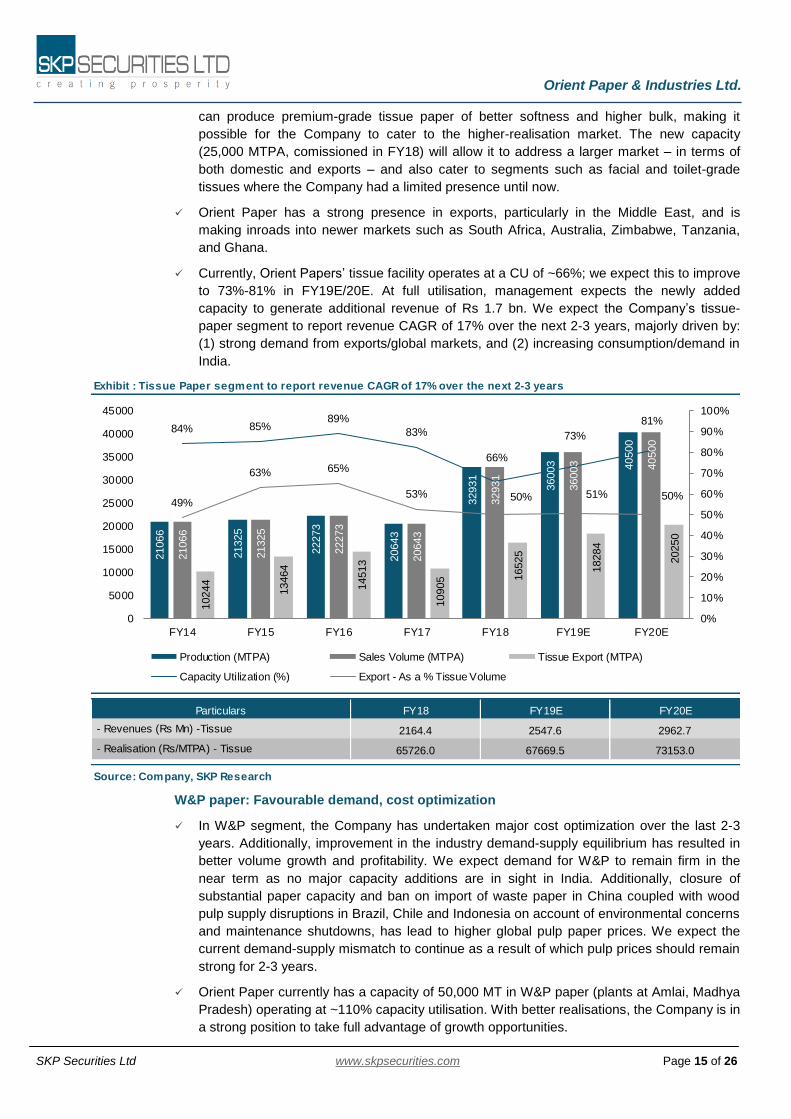
Exhibit : Tissue Paper segment to report revenue CAGR of 17% over the next 2-3 years
Source: Company, SKP Research
- Revenues (Rs Mn) -Tissue
- Realisation (Rs/MTPA) - Tissue
FY20EFY19EFY18Particulars
2164.4
65726.0
2547.6
67669.5
2962.7
73153.0
21066
21325
22273
20643
32931
36003 40500
21066
21325
22273
20643
32931
36003 40500
10244
13464
14513
10905 1
6525
18284
20250
84% 85%89%
83%
66%
73%
81%
49%
63% 65%
53% 50% 51% 50%
0%
10%
20%
30%
40%
50%
60%
70%
80%
90%
100%
0
5000
10000
15000
20000
25000
30000
35000
40000
45000
FY14 FY15 FY16 FY17 FY18 FY19E FY20E
Production (MTPA) Sales Volume (MTPA) Tissue Export (MTPA)
Capacity Utilization (%) Export - As a % Tissue Volume
can produce premium-grade tissue paper of better softness and higher bulk, making it
possible for the Company to cater to the higher-realisation market. The new capacity
(25,000 MTPA, comissioned in FY18) will allow it to address a larger market – in terms of
both domestic and exports – and also cater to segments such as facial and toilet-grade
tissues where the Company had a limited presence until now.
Orient Paper has a strong presence in exports, particularly in the Middle East, and is
making inroads into newer markets such as South Africa, Australia, Zimbabwe, Tanzania,
and Ghana.
Currently, Orient Papers’ tissue facility operates at a CU of ~66%; we expect this to improve
to 73%-81% in FY19E/20E. At full utilisation, management expects the newly added
capacity to generate additional revenue of Rs 1.7 bn. We expect the Company’s tissue-
paper segment to report revenue CAGR of 17% over the next 2-3 years, majorly driven by:
(1) strong demand from exports/global markets, and (2) increasing consumption/demand in
India.
W&P paper: Favourable demand, cost optimization
In W&P segment, the Company has undertaken major cost optimization over the last 2-3
years. Additionally, improvement in the industry demand-supply equilibrium has resulted in
better volume growth and profitability. We expect demand for W&P to remain firm in the
near term as no major capacity additions are in sight in India. Additionally, closure of
substantial paper capacity and ban on import of waste paper in China coupled with wood
pulp supply disruptions in Brazil, Chile and Indonesia on account of environmental concerns
and maintenance shutdowns, has lead to higher global pulp paper prices. We expect the
current demand-supply mismatch to continue as a result of which pulp prices should remain
strong for 2-3 years.
Orient Paper currently has a capacity of 50,000 MT in W&P paper (plants at Amlai, Madhya
Pradesh) operating at ~110% capacity utilisation. With better realisations, the Company is in
a strong position to take full advantage of growth opportunities.

Orient Paper & Industries Ltd.
SKP Securities Ltd www.skpsecurities.com Page 16 of 26
Exhibit : Writing/printing (WP) paper
Source: Company, SKP Research
3341.3
60751.0
- Revenues (Rs Mn) -Writing/printing (WP)
- Realisation (Rs/MTPA) - Writing/printing (WP)
FY20EFY19EFY18Particulars
3063.6
55632.8
3004.4
58414.5
47367
53487
54657
52074
55068
51432
55000
47367
53487
54657
52074
55068
51432
55000
86%
97% 99% 95%
110%
94%100%
0%
20%
40%
60%
80%
100%
120%
42000
44000
46000
48000
50000
52000
54000
56000
FY14 FY15 FY16 FY17 FY18 FY19E FY20E
Production (MTPA) Sales Volume (MTPA) Capacity Utilization (%)
The company had a three-week maintenance shutdown in June 2018, longer than the
seven-day shutdown in FY17. Therefore, we expect revenue CAGR of about 4.4% for this
segment over the next 2-3 years.
Projected pulp capacity increase will lead to raw material security & an additional tissue
capacity
Orient Paper has recently announced its plan to increase pulp capacity from 72,500 TPA to
100,000 TPA to eliminate its dependency on expensive market pulp (<10% of total pulp
requirement and cost is >50% higher than own manufacturing) at a cost of Rs 450 mn. The
Company is also setting up a new recovery boiler at a cost of ~Rs 1.65 bn and upgrading its
pulp capacity to become ECF (elemental chlorine free) complaint at a cost of ~Rs 150 mn.
The proposed capex will be commissioned by Q3FY20 and will be funded majorly through
internal accruals and marginal borrowings. Post expansion the enhanced pulp capacity will
support paper production of 120,000-125,000 MTPA as against current paper capacity of
100,000 MTPA.
Furthermore, Orient Paper may go for a brownfield tissue paper expansion of ~20,000
MTPA (existing tissue capacity is expected reach optimum utilization in few years) to
augment its enhanced pulp capacity of 100,000 MTPA, surplus power (>15 MW) and huge
land bank at M.P. If it happens, expansion will be done at a minimal cost and will take
approx 1.5 years to get commissioned.
Margins to improve with better product mix and cost rationalization
In the paper sector, marketing focuses on selling the largest volume at the highest
realizations. This, in turn, warrants the creation of a superior product mix that enhances
margins and return on employed capital. Therefore, Orient Paper has diversified from the
longstanding manufacture of W&P paper to the manufacture of tissue paper.
Orient Paper has upgraded the quality of its tissue paper to address all segments i.e. facial,
toilet, toweling and napkin grades for domestic and export markets. In the writing & printing
segment, Orient Paper has developed suitable publishing grade papers in addition to its
stronghold in the notebook segment.
With its strong product profile, Orient Paper is focusing on higher-margin divisions (tissue
paper – which has ~Rs 10/kg higher realization). In FY18, tissues’ revenue contribution was
32%; with an increased capacity, we expect the share to increase to 39% by FY20.
Orient Paper & Industries Ltd.
SKP Securities Ltd www.skpsecurities.com Page 17 of 26
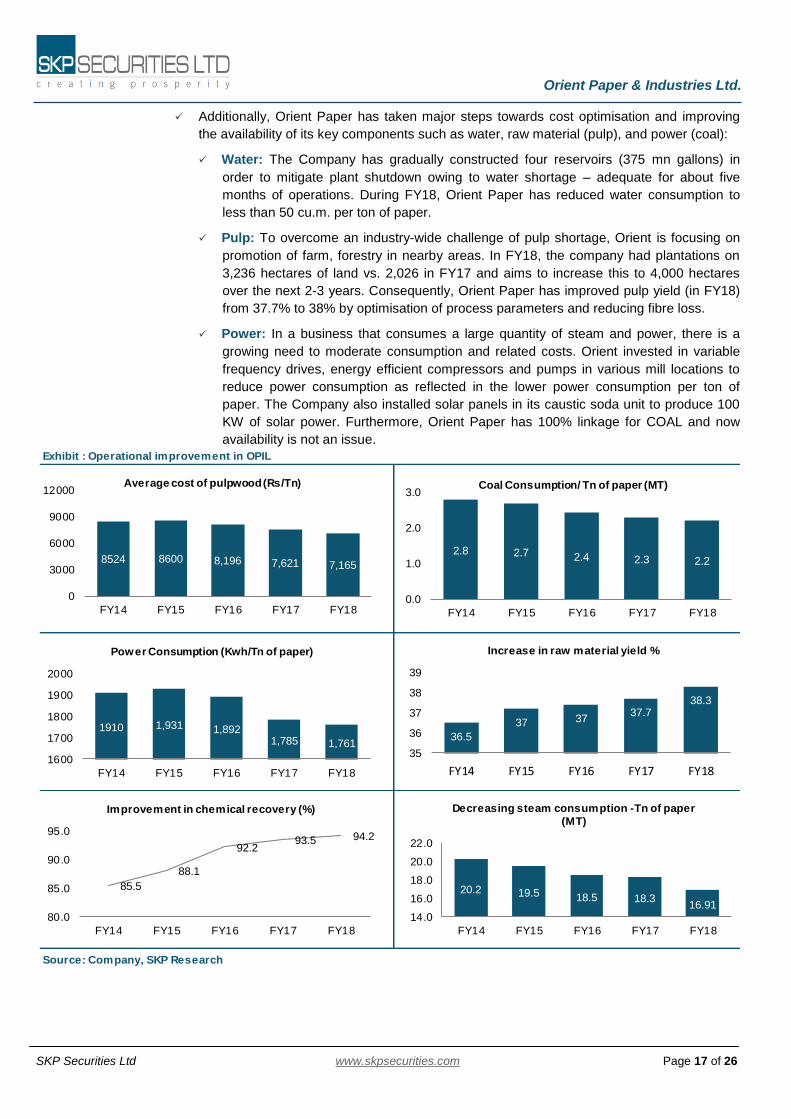
Additionally, Orient Paper has taken major steps towards cost optimisation and improving
the availability of its key components such as water, raw material (pulp), and power (coal):
Water: The Company has gradually constructed four reservoirs (375 mn gallons) in
order to mitigate plant shutdown owing to water shortage – adequate for about five
months of operations. During FY18, Orient Paper has reduced water consumption to
less than 50 cu.m. per ton of paper.
Pulp: To overcome an industry-wide challenge of pulp shortage, Orient is focusing on
promotion of farm, forestry in nearby areas. In FY18, the company had plantations on
3,236 hectares of land vs. 2,026 in FY17 and aims to increase this to 4,000 hectares
over the next 2-3 years. Consequently, Orient Paper has improved pulp yield (in FY18)
from 37.7% to 38% by optimisation of process parameters and reducing fibre loss.
Power: In a business that consumes a large quantity of steam and power, there is a
growing need to moderate consumption and related costs. Orient invested in variable
frequency drives, energy efficient compressors and pumps in various mill locations to
reduce power consumption as reflected in the lower power consumption per ton of
paper. The Company also installed solar panels in its caustic soda unit to produce 100
KW of solar power. Furthermore, Orient Paper has 100% linkage for COAL and now
availability is not an issue.
Exhibit : Operational improvement in OPIL
Source: Company, SKP Research
8524 8600 8,196 7,621 7,165
0
3000
6000
9000
12000
FY14 FY15 FY16 FY17 FY18
Average cost of pulpwood (Rs/Tn)
2.8 2.7 2.4 2.3 2.2
0.0
1.0
2.0
3.0
FY14 FY15 FY16 FY17 FY18
Coal Consumption/ Tn of paper (MT)
1910 1,931 1,8921,785 1,761
1600
1700
1800
1900
2000
FY14 FY15 FY16 FY17 FY18
Power Consumption (Kwh/Tn of paper)
36.5
37 3737.7
38.3
35
36
37
38
39
FY14 FY15 FY16 FY17 FY18
Increase in raw material yield %
85.5
88.1
92.293.5 94.2
80.0
85.0
90.0
95.0
FY14 FY15 FY16 FY17 FY18
Improvement in chemical recovery (%)
20.2 19.5 18.5 18.316.91
14.0
16.0
18.0
20.0
22.0
FY14 FY15 FY16 FY17 FY18
Decreasing steam consumption -Tn of paper
(MT)
Orient Paper & Industries Ltd.
SKP Securities Ltd www.skpsecurities.com Page 18 of 26
Strong entry barriers restricting the entry of new players into the industry:
A technology intensive industry: Indian paper industry is gradually moving towards
advanced technologies, where size of the company and capital outlay comes into play.
Those who can adapt to new technologies will survive, while others will feel the heat, as the
cost of non-wood based raw material for making paper is gradually coming at par with
wood-based raw materials. Small paper making units could find it increasingly difficult to
survive the cut-throat competition in the sector.
Highly capital intensive industry: Setting up new capacities in paper requires substantial
capital outlay. Given the importance of captive power generation and mandatory ECF
compliance, it is estimated that setting a new venture would entail an investment of Rs.
80,000-100,000/mt, with a minimum viable plant size of 50,000 mt, implying a capex of over
Rs 5 bn. Also investment needed for upgrading technology, growing wood plantations and
establishing a distribution network; all make manufacturing paper a capital intensive task.
Adding to the woes, the industry is cyclical. Thus, small players might not be able to keep
up with heavy investments that are required to make them competitive.
High gestation period & tough environmental clearances: The pulp and paper industry
is among the world’s largest producers of water pollutants and waste products. This makes
the industry heavily regulated, and requires heavy investment from companies to be
environmentally compliant. Therefore, besides the huge capital outlays, requisite
environmental clearances and availability of land & water also pose significant challenges to
new projects, thereby restricting entry of new players
Indian paper industry is actively promoting agro-forestry, which has a five year cycle, to
meet its raw material needs. Here also a long gestation period acts as a hindrance.
It takes about 24-30 months for a greenfield project to commission in India, which
includes 12-15 months of erection of infrastructure and another 12-15 months for
getting requisite environmental clearances from the regulatory authorities.
High energy intensive industry with high energy cost: The Indian paper industry is
energy intensive which is scarce in India. Manufacturing one tonne of paper requires, 1,500
kWh of power and 850-1,000 kgs of coal.
Further, the cost of own power generation is increasing due to consistent increase in
coal prices. Thus, high energy consumption and high energy costs also act as a good
entry barrier.
Advent of GST: GST has been introduced at 12-18% for most paper categories. This
implies that the margin cushion available to small companies may be pressured; this along
with the high cost of environment compliance should drive the industry towards
consolidation.
Economies of scale: The average capacity of an Indian paper mill is about 21,373 TPA,
which is less than 1/5th of the average capacity of European mills, and about 1/9th the size
of the average US mill. The water, power and chemical requirements for paper production
reduce as the mills grow larger.
Orient Paper & Industries Ltd.
SKP Securities Ltd www.skpsecurities.com Page 19 of 26
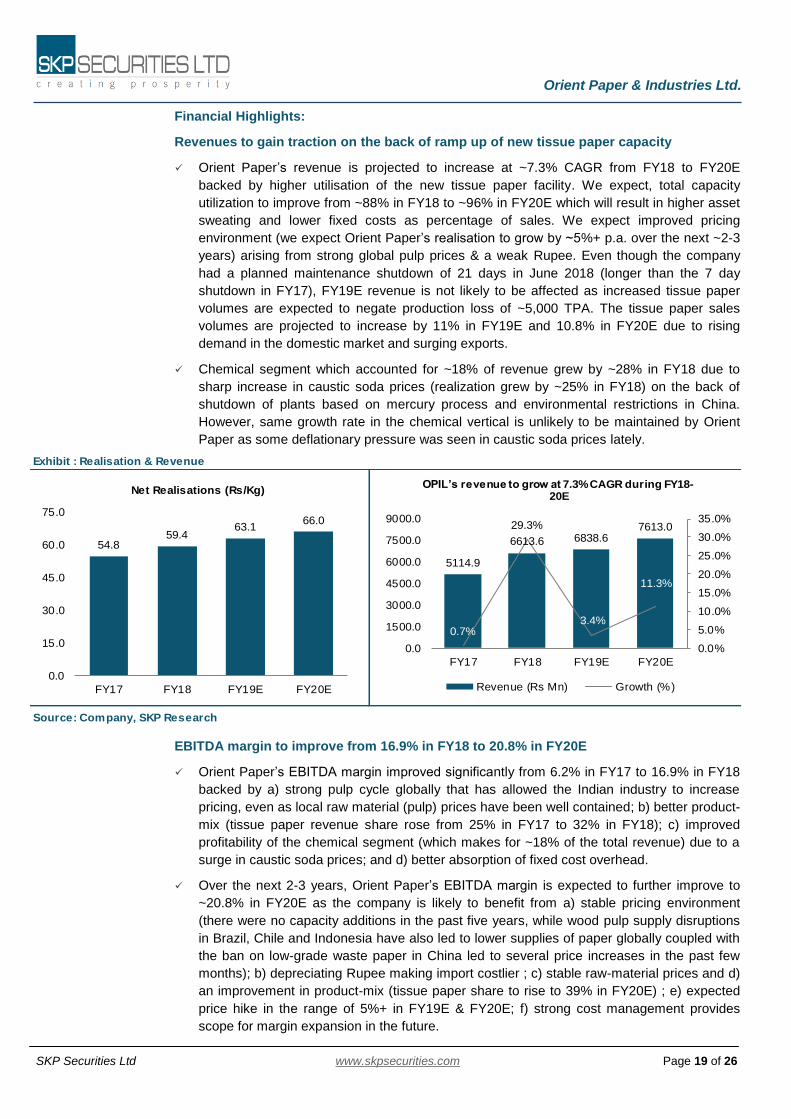
Exhibit : Realisation & Revenue
Source: Company, SKP Research
54.859.4
63.166.0
0.0
15.0
30.0
45.0
60.0
75.0
FY17 FY18 FY19E FY20E
Net Realisations (Rs/Kg)
5114.9
6613.6 6838.67613.0
0.7%
29.3%
3.4%
11.3%
0.0%
5.0%
10.0%
15.0%
20.0%
25.0%
30.0%
35.0%
0.0
1500.0
3000.0
4500.0
6000.0
7500.0
9000.0
FY17 FY18 FY19E FY20E
OPIL’s revenue to grow at 7.3% CAGR during FY18-20E
Revenue (Rs Mn) Growth (%)
Financial Highlights:
Revenues to gain traction on the back of ramp up of new tissue paper capacity
Orient Paper’s revenue is projected to increase at ~7.3% CAGR from FY18 to FY20E
backed by higher utilisation of the new tissue paper facility. We expect, total capacity
utilization to improve from ~88% in FY18 to ~96% in FY20E which will result in higher asset
sweating and lower fixed costs as percentage of sales. We expect improved pricing
environment (we expect Orient Paper’s realisation to grow by ~5%+ p.a. over the next ~2-3
years) arising from strong global pulp prices & a weak Rupee. Even though the company
had a planned maintenance shutdown of 21 days in June 2018 (longer than the 7 day
shutdown in FY17), FY19E revenue is not likely to be affected as increased tissue paper
volumes are expected to negate production loss of ~5,000 TPA. The tissue paper sales
volumes are projected to increase by 11% in FY19E and 10.8% in FY20E due to rising
demand in the domestic market and surging exports.
Chemical segment which accounted for ~18% of revenue grew by ~28% in FY18 due to
sharp increase in caustic soda prices (realization grew by ~25% in FY18) on the back of
shutdown of plants based on mercury process and environmental restrictions in China.
However, same growth rate in the chemical vertical is unlikely to be maintained by Orient
Paper as some deflationary pressure was seen in caustic soda prices lately.
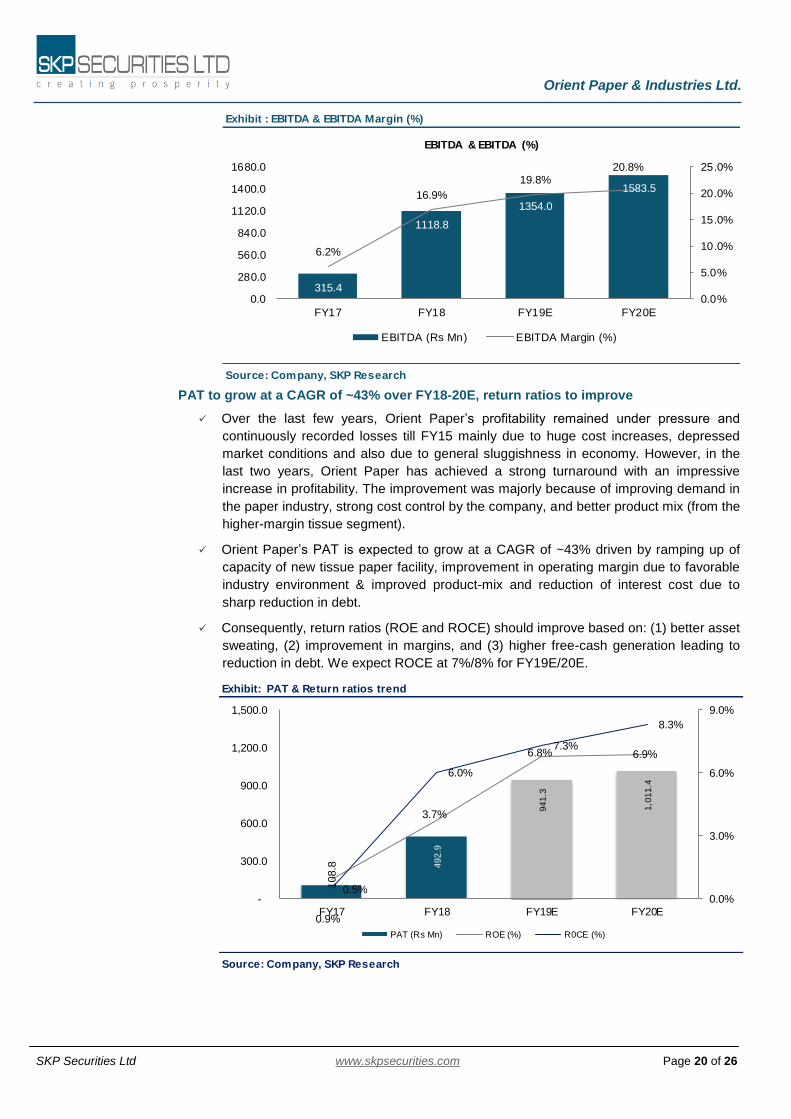
EBITDA margin to improve from 16.9% in FY18 to 20.8% in FY20E
Orient Paper’s EBITDA margin improved significantly from 6.2% in FY17 to 16.9% in FY18
backed by a) strong pulp cycle globally that has allowed the Indian industry to increase
pricing, even as local raw material (pulp) prices have been well contained; b) better product-
mix (tissue paper revenue share rose from 25% in FY17 to 32% in FY18); c) improved
profitability of the chemical segment (which makes for ~18% of the total revenue) due to a
surge in caustic soda prices; and d) better absorption of fixed cost overhead.
Over the next 2-3 years, Orient Paper’s EBITDA margin is expected to further improve to
~20.8% in FY20E as the company is likely to benefit from a) stable pricing environment
(there were no capacity additions in the past five years, while wood pulp supply disruptions
in Brazil, Chile and Indonesia have also led to lower supplies of paper globally coupled with
the ban on low-grade waste paper in China led to several price increases in the past few
months); b) depreciating Rupee making import costlier ; c) stable raw-material prices and d)
an improvement in product-mix (tissue paper share to rise to 39% in FY20E) ; e) expected
price hike in the range of 5%+ in FY19E & FY20E; f) strong cost management provides
scope for margin expansion in the future.
Orient Paper & Industries Ltd.
SKP Securities Ltd www.skpsecurities.com Page 20 of 26
Exhibit: PAT & Return ratios trend
Source: Company, SKP Research
108.8
492
.9
94
1.3
1,0
11
.4
0.9%
3.7%
6.8% 6.9%
0.5%
6.0%
7.3%
8.3%
0.0%
3.0%
6.0%
9.0%
-
300.0
600.0
900.0
1,200.0
1,500.0
FY17 FY18 FY19E FY20E
PAT (Rs Mn) ROE (%) R0CE (%)
Exhibit : EBITDA & EBITDA Margin (%)
Source: Company, SKP Research
315.4
1118.8
1354.0
1583.5
6.2%
16.9%
19.8%20.8%
0.0%
5.0%
10.0%
15.0%
20.0%
25.0%
0.0
280.0
560.0
840.0
1120.0
1400.0
1680.0
FY17 FY18 FY19E FY20E
EBITDA & EBITDA (%)
EBITDA (Rs Mn) EBITDA Margin (%)
PAT to grow at a CAGR of ~43% over FY18-20E, return ratios to improve
Over the last few years, Orient Paper’s profitability remained under pressure and
continuously recorded losses till FY15 mainly due to huge cost increases, depressed
market conditions and also due to general sluggishness in economy. However, in the
last two years, Orient Paper has achieved a strong turnaround with an impressive
increase in profitability. The improvement was majorly because of improving demand in
the paper industry, strong cost control by the company, and better product mix (from the
higher-margin tissue segment).
Orient Paper’s PAT is expected to grow at a CAGR of ~43% driven by ramping up of
capacity of new tissue paper facility, improvement in operating margin due to favorable
industry environment & improved product-mix and reduction of interest cost due to
sharp reduction in debt.
Consequently, return ratios (ROE and ROCE) should improve based on: (1) better asset
sweating, (2) improvement in margins, and (3) higher free-cash generation leading to
reduction in debt. We expect ROCE at 7%/8% for FY19E/20E.
Orient Paper & Industries Ltd.
SKP Securities Ltd www.skpsecurities.com Page 21 of 26
Exhibit : Total Debt (Rs Mn) & Interest coverage ratio
Source: Company, SKP Research
1682.2
698.9 650.2750.0
0.3
5.7
14.5
19.0
0.0
2.0
4.0
6.0
8.0
10.0
12.0
14.0
16.0
18.0
20.0
0.0
280.0
560.0
840.0
1120.0
1400.0
1680.0
1960.0
FY17 FY18 FY19E FY20E
Total Debt (Rs Mn) ICR (X)
Exhibit: Exhibit: Peer Comparison
FY16 FY17 FY18 FY16 FY17 FY18 FY16 FY17 FY18 FY16 FY17 FY18
JK Paper 28.1 455000 56 16% 20% 22% 6% 14% 18% 9% 13% 16% 1.4x 1.1x 0.6x
West Coast Paper 21.7 320000 56 15% 19% 21% 22% 22% 30% 12% 21% 22% 1.2x 0.5x 0.3x
TNPL 18.8 600000 57 23.4% 24.6% 13.1% 19% 16% -3% 13% 14% 5% 1.7x 1.4x 1.2x
International Paper 18.1 241000 54 11.3% 14.5% 17.5% 9% 7% 16% 7% 13% 21% 1.0x 0.5x 0.3x
Ruchira Paper * 3.0 130000 39 13.1% 15.3% 16.6% 17% 24% 22% 22% 27% 26% 0.5x 0.4x 0.4x
Pudumjee Paper 2.1 60000 5.8% 9.4% 8.5% 9.8% 9.5% 8.2% 15% 14% 12% 0.4x 0.3x 0.1x
Orient Paper 9.3 100000 59 6.2% 16.9% 1% 4% 0% 6% 0.1x 0.1x
Source: Company,SKP Research
* Ruchira Paper - Realisation includes sales of Kraft paper
ROE (%) ROCE (%) D/E (X)Companies
Mcap
(Rs Bn)
Realization
(Rs/Kg)
EBITDA Margin (%)Capacity
(MTPA)
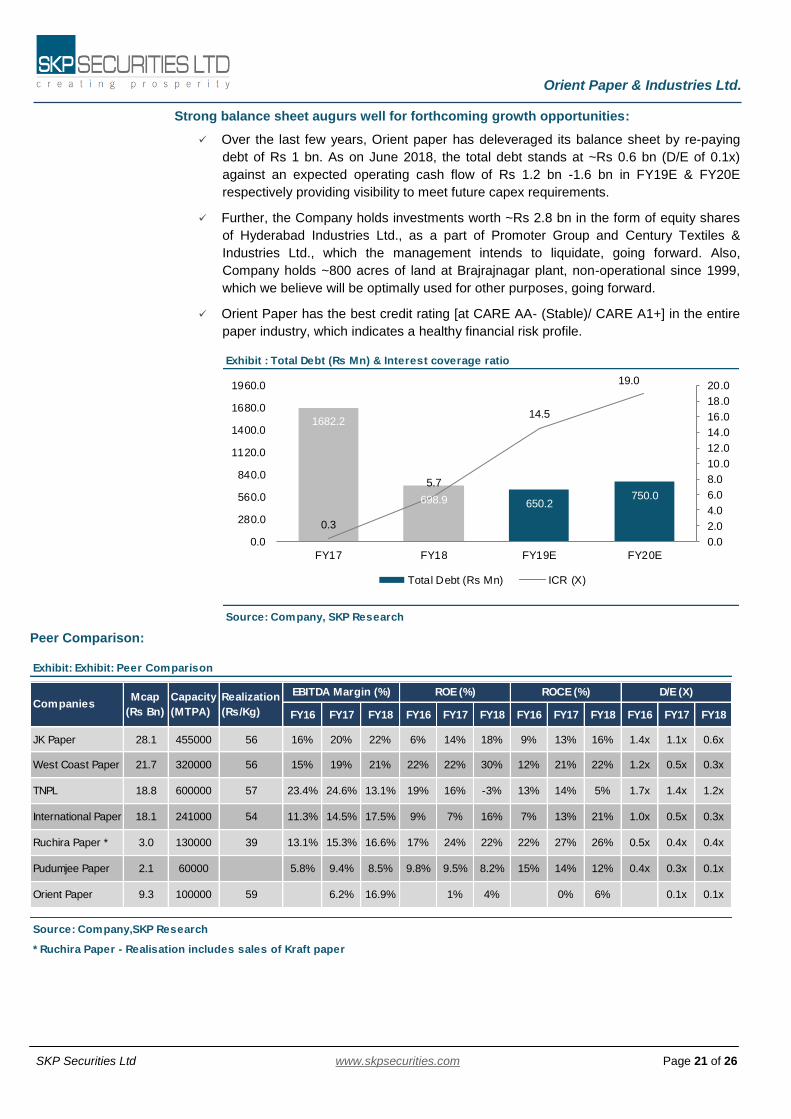
Strong balance sheet augurs well for forthcoming growth opportunities:
Over the last few years, Orient paper has deleveraged its balance sheet by re-paying
debt of Rs 1 bn. As on June 2018, the total debt stands at ~Rs 0.6 bn (D/E of 0.1x)
against an expected operating cash flow of Rs 1.2 bn -1.6 bn in FY19E & FY20E
respectively providing visibility to meet future capex requirements.
Further, the Company holds investments worth ~Rs 2.8 bn in the form of equity shares
of Hyderabad Industries Ltd., as a part of Promoter Group and Century Textiles &
Industries Ltd., which the management intends to liquidate, going forward. Also,
Company holds ~800 acres of land at Brajrajnagar plant, non-operational since 1999,
which we believe will be optimally used for other purposes, going forward.
Orient Paper has the best credit rating [at CARE AA- (Stable)/ CARE A1+] in the entire
paper industry, which indicates a healthy financial risk profile.
Peer Comparison:

Orient Paper & Industries Ltd.
SKP Securities Ltd www.skpsecurities.com Page 22 of 26
Valuations
Orient Paper has moved up the value chain which has higher growth potential and better
realizations, leading to a self-sustained model (increasing profitability) backed by
favourable demand-supply equilibrium and muted domestic wood prices. Additionally, with
internal cost controls and effective management, this business is showing signs of: (1)
improvement in utilization (asset turnover), (2) healthy margins, and (3) strong free cash
flow generation, providing visibility to meet future capex requirements and better return
ratios.
We have valued the stock on SOTP basis valuing Orient’s core paper business at 7x
EV/EBITDA of FY20E and investments (except Brajrajnagar land) at Rs 8/-share. We
recommend a BUY on the stock with a target price of Rs 57/- in 15 months, although the
long term story looks even better. Any monetization of Brajrajnagar land will trigger an
upside potential on Orient Paper profitability and stock price.
Risks & Concerns
Competition from unorganised players: As mentioned earlier, Indian paper industry is highly fragmented with ~825 small to large mills. Any increase in the competitive intensity from unorganized segment may be detrimental for the Company.
Import from ASEAN countries and China: Increase in cheap inflow under the Free Trade Agreement (FTA), may cause pricing pressure on some segments of the paper industry. Paper demand in India grew at a CAGR of ~6.2% from 9.3 MTPA in FY08 to 17 MTPA in FY17. Imports during the same period has increased at a CAGR of ~15% mainly from ASEAN countries due to zero import duties, affecting fresh capacity creation.
In order to provide a level playing field to the domestic industry and encourage farming of wood in India, there is a need to review the current import duty structure and re-examine existing FTAs and the new ones under formulation.
Unfavourable forex fluctuations: Sharp Rupee appreciation: may reduce the competitive advantage of domestically sourced wood vs imported pulp.
Shortage or rise in prices of raw materials: Traditionally, woodchips supply has been much lower than the actual demand. Also, diversion or increase in demand for wood from competing industries like MDF & construction may cause shortage or rise in price.
Exhibit: SOTP based target price
EV/EBIDTA FY20E
EBIDTA (Rs mn) 1584
Est EV/EBIDTA (x) 7
EV (Rs mn) 11085
Net Debt (Rs mn) 605
Add
30% Discount - Century Textiles & Industries Limited 719
40% Discount - Hyderabad Industries Limited 920
Shareholders' Value (Rs mn) 12119
O/s Shares (mn Shares in FY20E) 212
Fair Value (Rs per share) 57
CMP (Rs) 43
Return (%) 33%
Orient Paper & Industries Ltd.
SKP Securities Ltd www.skpsecurities.com Page 23 of 26
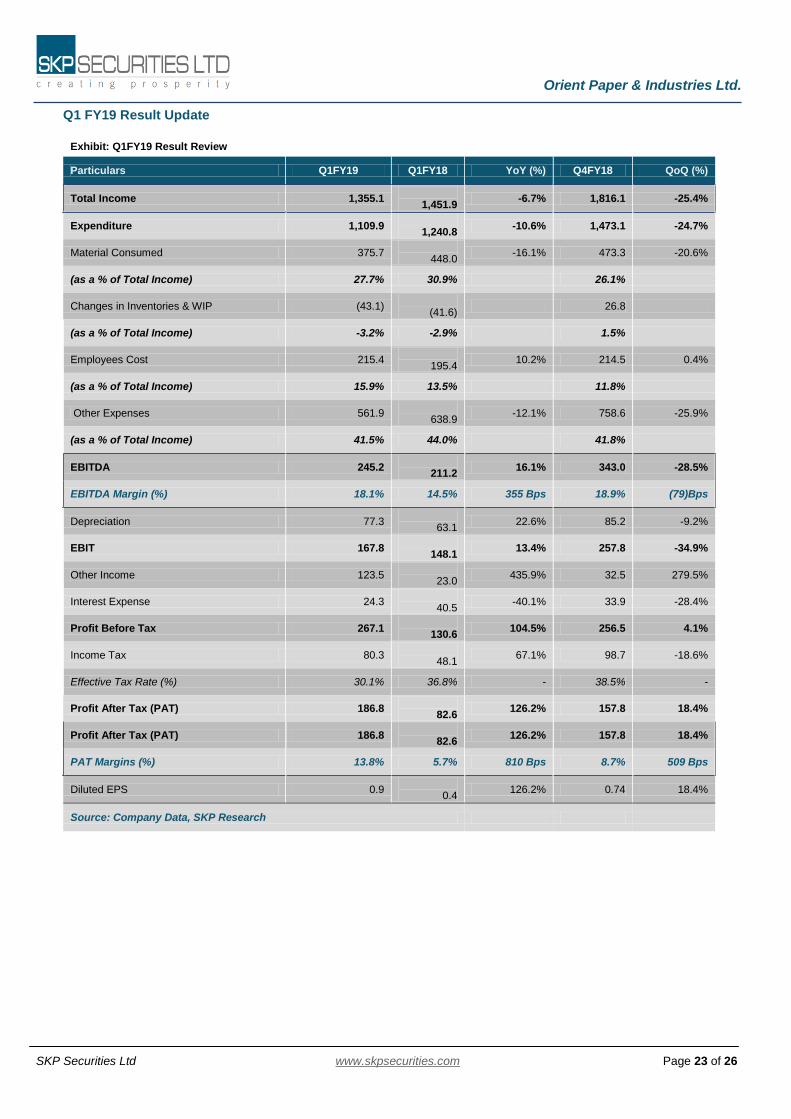
Q1 FY19 Result Update
Exhibit: Q1FY19 Result Review
Particulars Q1FY19 Q1FY18 YoY (%) Q4FY18 QoQ (%)
Total Income 1,355.1
1,451.9 -6.7% 1,816.1 -25.4%
Expenditure 1,109.9
1,240.8 -10.6% 1,473.1 -24.7%
Material Consumed 375.7
448.0 -16.1% 473.3 -20.6%
(as a % of Total Income) 27.7% 30.9% 26.1%
Changes in Inventories & WIP (43.1)
(41.6) 26.8
(as a % of Total Income) -3.2% -2.9% 1.5%
Employees Cost 215.4
195.4 10.2% 214.5 0.4%
(as a % of Total Income) 15.9% 13.5% 11.8%
Other Expenses 561.9
638.9 -12.1% 758.6 -25.9%
(as a % of Total Income) 41.5% 44.0% 41.8%
EBITDA 245.2
211.2 16.1% 343.0 -28.5%
EBITDA Margin (%) 18.1% 14.5% 355 Bps 18.9% (79)Bps
Depreciation 77.3
63.1 22.6% 85.2 -9.2%
EBIT 167.8
148.1 13.4% 257.8 -34.9%
Other Income 123.5
23.0 435.9% 32.5 279.5%
Interest Expense 24.3
40.5 -40.1% 33.9 -28.4%
Profit Before Tax 267.1
130.6 104.5% 256.5 4.1%
Income Tax 80.3
48.1 67.1% 98.7 -18.6%
Effective Tax Rate (%) 30.1% 36.8% - 38.5% -
Profit After Tax (PAT) 186.8
82.6 126.2% 157.8 18.4%
Profit After Tax (PAT) 186.8
82.6 126.2% 157.8 18.4%
PAT Margins (%) 13.8% 5.7% 810 Bps 8.7% 509 Bps
Diluted EPS 0.9
0.4 126.2% 0.74 18.4%
Source: Company Data, SKP Research
Orient Paper & Industries Ltd.
SKP Securities Ltd www.skpsecurities.com Page 24 of 26
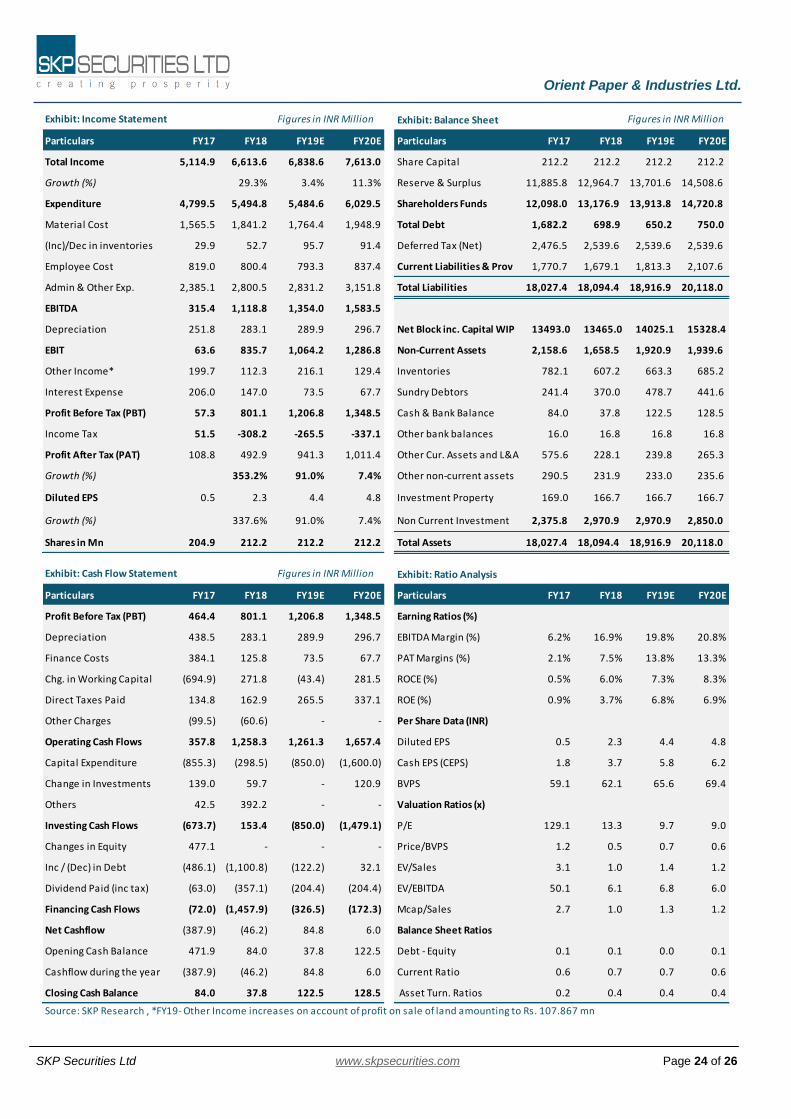
Exhibit: Balance Sheet
Particulars FY17 FY18 FY19E FY20E Particulars FY17 FY18 FY19E FY20E
Total Income 5,114.9 6,613.6 6,838.6 7,613.0 Share Capital 212.2 212.2 212.2 212.2
Growth (%) 29.3% 3.4% 11.3% Reserve & Surplus 11,885.8 12,964.7 13,701.6 14,508.6
Expenditure 4,799.5 5,494.8 5,484.6 6,029.5 Shareholders Funds 12,098.0 13,176.9 13,913.8 14,720.8
Material Cost 1,565.5 1,841.2 1,764.4 1,948.9 Total Debt 1,682.2 698.9 650.2 750.0
(Inc)/Dec in inventories 29.9 52.7 95.7 91.4 Deferred Tax (Net) 2,476.5 2,539.6 2,539.6 2,539.6
Employee Cost 819.0 800.4 793.3 837.4 Current Liabilities & Prov 1,770.7 1,679.1 1,813.3 2,107.6
Admin & Other Exp. 2,385.1 2,800.5 2,831.2 3,151.8 Total Liabilities 18,027.4 18,094.4 18,916.9 20,118.0
EBITDA 315.4 1,118.8 1,354.0 1,583.5
Depreciation 251.8 283.1 289.9 296.7 Net Block inc. Capital WIP 13493.0 13465.0 14025.1 15328.4
EBIT 63.6 835.7 1,064.2 1,286.8 Non-Current Assets 2,158.6 1,658.5 1,920.9 1,939.6
Other Income* 199.7 112.3 216.1 129.4 Inventories 782.1 607.2 663.3 685.2
Interest Expense 206.0 147.0 73.5 67.7 Sundry Debtors 241.4 370.0 478.7 441.6
Profit Before Tax (PBT) 57.3 801.1 1,206.8 1,348.5 Cash & Bank Balance 84.0 37.8 122.5 128.5
Income Tax 51.5 -308.2 -265.5 -337.1 Other bank balances 16.0 16.8 16.8 16.8
Profit After Tax (PAT) 108.8 492.9 941.3 1,011.4 Other Cur. Assets and L&A 575.6 228.1 239.8 265.3
Growth (%) 353.2% 91.0% 7.4% Other non-current assets 290.5 231.9 233.0 235.6
Diluted EPS 0.5 2.3 4.4 4.8 Investment Property 169.0 166.7 166.7 166.7
Growth (%) 337.6% 91.0% 7.4% Non Current Investment 2,375.8 2,970.9 2,970.9 2,850.0
Shares in Mn 204.9 212.2 212.2 212.2 Total Assets 18,027.4 18,094.4 18,916.9 20,118.0
Exhibit: Ratio Analysis
Particulars FY17 FY18 FY19E FY20E Particulars FY17 FY18 FY19E FY20E
Profit Before Tax (PBT) 464.4 801.1 1,206.8 1,348.5 Earning Ratios (%)
Depreciation 438.5 283.1 289.9 296.7 EBITDA Margin (%) 6.2% 16.9% 19.8% 20.8%
Finance Costs 384.1 125.8 73.5 67.7 PAT Margins (%) 2.1% 7.5% 13.8% 13.3%
Chg. in Working Capital (694.9) 271.8 (43.4) 281.5 ROCE (%) 0.5% 6.0% 7.3% 8.3%
Direct Taxes Paid 134.8 162.9 265.5 337.1 ROE (%) 0.9% 3.7% 6.8% 6.9%
Other Charges (99.5) (60.6) - - Per Share Data (INR)
Operating Cash Flows 357.8 1,258.3 1,261.3 1,657.4 Diluted EPS 0.5 2.3 4.4 4.8
Capital Expenditure (855.3) (298.5) (850.0) (1,600.0) Cash EPS (CEPS) 1.8 3.7 5.8 6.2
Change in Investments 139.0 59.7 - 120.9 BVPS 59.1 62.1 65.6 69.4
Others 42.5 392.2 - - Valuation Ratios (x)
Investing Cash Flows (673.7) 153.4 (850.0) (1,479.1) P/E 129.1 13.3 9.7 9.0
Changes in Equity 477.1 - - - Price/BVPS 1.2 0.5 0.7 0.6
Inc / (Dec) in Debt (486.1) (1,100.8) (122.2) 32.1 EV/Sales 3.1 1.0 1.4 1.2
Dividend Paid (inc tax) (63.0) (357.1) (204.4) (204.4) EV/EBITDA 50.1 6.1 6.8 6.0
Financing Cash Flows (72.0) (1,457.9) (326.5) (172.3) Mcap/Sales 2.7 1.0 1.3 1.2
Net Cashflow (387.9) (46.2) 84.8 6.0 Balance Sheet Ratios
Opening Cash Balance 471.9 84.0 37.8 122.5 Debt - Equity 0.1 0.1 0.0 0.1
Cashflow during the year (387.9) (46.2) 84.8 6.0 Current Ratio 0.6 0.7 0.7 0.6
Closing Cash Balance 84.0 37.8 122.5 128.5 Asset Turn. Ratios 0.2 0.4 0.4 0.4
Source: SKP Research , *FY19- Other Income increases on account of profit on sale of land amounting to Rs. 107.867 mn
Figures in INR MillionExhibit: Income Statement
Figures in INR MillionExhibit: Cash Flow Statement
Figures in INR Million
Orient Paper & Industries Ltd.
SKP Securities Ltd www.skpsecurities.com Page 25 of 26
Notes: The above analysis and data are based on last available prices and not official closing rates. SKP Research is also available on Bloomberg and Thomson First Call. DISCLAIMER: This document has been prepared by SKP Securities Ltd, hereinafter referred to as SKP to provide information about the
company (ies)/sector(s), if any, covered in the report and may be distributed by it and/or its affiliates. SKP Securities Ltd., offers
broking and depository participant services and is regulated by Securities and Exchange Board of India (SEBI). It also distributes
investment products/services like mutual funds, alternative investment funds, bonds, IPOs, etc., renders corporate advisory
services and invests its own funds in securities and investment products. We declare that no material disciplinary action has
been taken against SKP by any regulatory authority impacting Equity Research Analysis. As a value addition to its clients, it
offers its research services and reports in various formats to its clients and prospects. As such, SKP is making these disclosures
under SEBI (Research Analysts) Regulations, 2014.
Terms & Conditions and Other Disclosures: This research report (“Report”) is for the personal information of the selected recipient(s), does not construe to be any
investment, legal or taxation advice, is not for public distribution and should not be copied, reproduced or redistributed to any
other person or in any form without SKP’s prior permission. The information provided in the Report is from publicly available
data, which we believe, are reliable. While reasonable endeavours have been made to present reliable data in the Report so far
as it relates to current and historical information, but SKP does not guarantee the accuracy or completeness of the data in the
Report. Accordingly, SKP or its promoters, directors, subsidiaries, associates or employees shall not be in any way responsible
for any loss or damage that may arise to any person from any inadvertent error in the information contained and views and
opinions expressed in this publication. Past performance mentioned in the Report should not be taken as an indication or
guarantee of future performance, and no representation or warranty, express or implied, is made regarding future
performance. Information, opinions and estimates contained in this report reflect a judgment of its original date of publication
by SKP and are subject to change without notice. The price, value of and income from any of the securities mentioned in this
report can rise or fall. The Report includes analysis and views of individual research analysts (which, hereinafter, includes
persons reporting to them) covering this Report. The Report is purely for information purposes. Opinions expressed in the
Report are SKP’s or its research analysts’ current opinions as of the date of the Report and may be subject to change from time
to time without notice. SKP or any person connected with it does not accept any liability arising from the use of this document.
Investors should not solely rely on the information contained in this Report and must make investment decisions based on their
own investment objectives, judgment, risk profile and financial position. The recipients of this Report may take professional
advice before acting on this information. SKP, along with its affiliates, are engaged in various financial services and so might
have financial, businesses or other interest in other entities, including the subject company or its affiliates mentioned in this
report, for which it might have received any compensation in the past twelve months. SKP does not provide any merchant
banking or market making service and does not manage public offers. However, SKP encourages independence in preparation
of research reports and strives to minimize conflict in preparation of research reports. SKP and its analysts did not receive any
compensation or other benefits from the subject company mentioned in the Report or from a third party in connection with
preparation of the Report. Accordingly, SKP and its Research Analyst do not have any material conflict of interest at the time of
publication of this Report. SKP’s research analysts may provide input into its other business activities. Investors should assume
that SKP and/or its affiliates are seeking or will seek business assignments from the company (ies) that are the subject of this
material and that the research analysts who are involved in preparing this material may educate investors on investments in
such businesses. The research analysts responsible for the preparation of this document may interact with trading desk/sales
personnel and other parties for the purpose of gathering, applying and interpreting information. Our research analysts are paid
on the profitability of SKP, which may include earnings from business activities for which this Report is being used, but not for
Orient Paper & Industries Ltd.
SKP Securities Ltd www.skpsecurities.com Page 26 of 26
the preparation of this report. SKP generally prohibits its analysts, persons reporting to analysts and their relatives from
maintaining a financial interest in the securities or derivatives of any company (ies) that the analyst covers. Additionally, SKP
generally, prohibits its analysts and persons reporting to analysts from serving as an officer, director or advisory board member
of any companies that the analyst cover. The following Disclosure of Interest Statement, clarifies it further: SKP and/or its
Directors/or its affiliates or its Research Analyst(s) engaged in preparation of this Report or his/her relative (i) do not own 1% or
more of the equity securities of the subject company mentioned in the report as of the last day of the month preceding the
publication of the research report (ii) do not have any financial interests in the subject company mentioned in this report (iii)
do not have any other material conflict of interest at the time of publication of the research report. The distribution of this
document in other jurisdictions may be strictly restricted and/ or prohibited by law, and persons into whose possession this
document comes should inform themselves about such restriction and/ or prohibition, and observe any such restrictions and/
or prohibition.
SKP Securities Limited is registered as a Research Analyst under SEBI (Research Analyst) Regulations, 2014 having registration
no. INH300002902.
Analyst Certification The views expressed in this research report accurately reflect the personal views of the analyst about the subject securities or
issues, which are subject to change without prior notice and does not represent to be an authority on the subject. No part of
the compensation of the research analyst was, is, or will be directly or indirectly related to the specific recommendations and
views expressed by research analyst in this report. The research analysts, strategists, or research associates principally
responsible for preparation of SKP research receive compensation based upon various factors, including quality of research,
investor client feedback, stock picking, competitive factors and firm revenues.
Disclosure of Interest Statement
Analyst ownership of the stock NIL
Served as an officer, director or employee NIL
SKP Securities Ltd
Contacts Research Dealing
Mumbai Kolkata Mumbai Kolkata
Phone 022 4922 6006 033 4007 7000 022 4922 6000 033 4007 7400
Fax 022 4922 6066 033 4007 7007 022 4922 6066 033 4007 7007
E-mail [email protected] [email protected]
Member: NSE BSE NSDL CDSL
INB/INF 230707532, NSECDS: NSE230707532, BSE: INB010707538, Depository Participant: IN-DP-155-2015, ARN: 0006
Private Wealth | Broking | Distribution | Institutional Equities | Investment Banking