Embed Size (px)
Citation preview
VST Industries Ltd.
1
Lorem ipsum dolor sit amet, consectetuer adipiscing elit, sed diam nonummy nibh euismod tincidunt ut laoreet dolore magna aliquam erat volutpat. Ut wisi enim ad minim veniam, quis nostrud exerci tation ullamcorper suscipit lobortis nisl ut aliquip ex ea commodo consequat. Duis autem vel eum iriure dolor in hendrerit in vulputate velit esse molestie consequat, vel illum dolore eu feugiat nulla
▪ Lorem ipsum dolor sit amet, consectetuer adipiscing elit, sed diam nonummy nibh
euismod tincidunt ut laoreet dolore magna aliquam erat volutpat. Ut wisi enim ad minim veniam,
▪ quis nostrud exerci tation ullamcorper suscipit lobortis nisl ut aliquip ex ea commodo consequat. Duis autem vel eum iriure dolor in hendrerit in vulputate velit esse molestie consequat,
▪ vel illum dolore eu feugiat nulla facilisis at vero eros et accumsan et iusto odio dignissim qui blandit praesent luptatum zzril delenit augue duis dolore te feugait nulla facilisi. et iusto odio dignissim qui blandit praesent luptatum zzril delenit augue duis dolore te feugait nulla facilisLorem ipsum dolor sit amet,
Initiating Coverage
VST Industries Ltd.
19-February-2021
VST Industries Ltd.
2
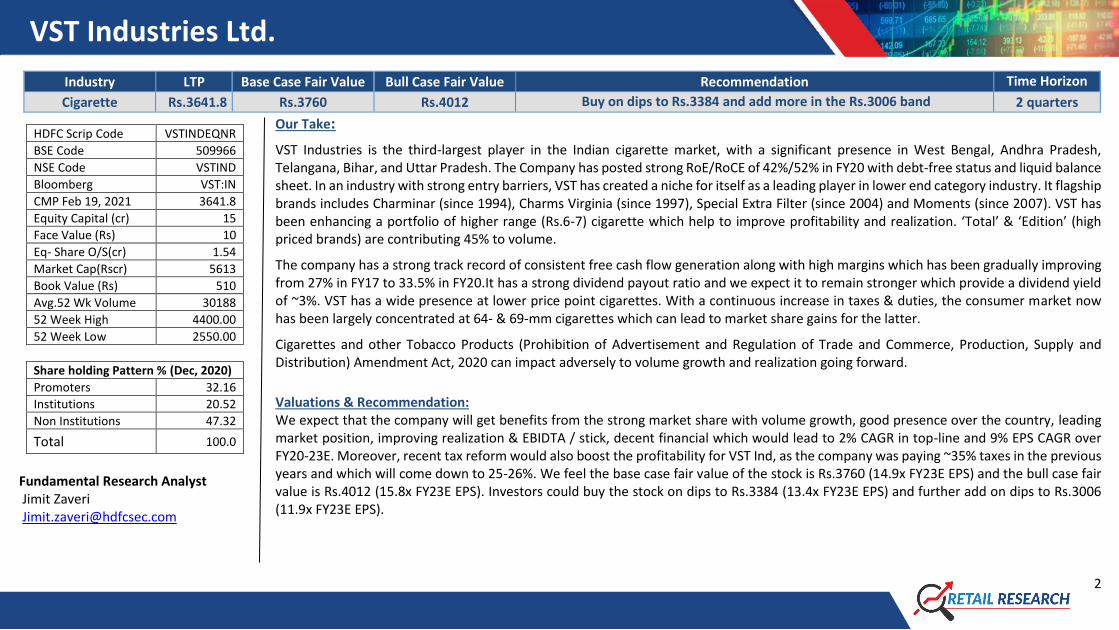
Industry LTP Base Case Fair Value Bull Case Fair Value Recommendation Time Horizon
Cigarette Rs.3641.8 Rs.3760 Rs.4012 Buy on dips to Rs.3384 and add more in the Rs.3006 band 2 quarters
Our Take:
VST Industries is the third-largest player in the Indian cigarette market, with a significant presence in West Bengal, Andhra Pradesh, Telangana, Bihar, and Uttar Pradesh. The Company has posted strong RoE/RoCE of 42%/52% in FY20 with debt-free status and liquid balance sheet. In an industry with strong entry barriers, VST has created a niche for itself as a leading player in lower end category industry. It flagship brands includes Charminar (since 1994), Charms Virginia (since 1997), Special Extra Filter (since 2004) and Moments (since 2007). VST has been enhancing a portfolio of higher range (Rs.6-7) cigarette which help to improve profitability and realization. ‘Total’ & ‘Edition’ (high priced brands) are contributing 45% to volume.
The company has a strong track record of consistent free cash flow generation along with high margins which has been gradually improving from 27% in FY17 to 33.5% in FY20.It has a strong dividend payout ratio and we expect it to remain stronger which provide a dividend yield of ~3%. VST has a wide presence at lower price point cigarettes. With a continuous increase in taxes & duties, the consumer market now has been largely concentrated at 64- & 69-mm cigarettes which can lead to market share gains for the latter.
Cigarettes and other Tobacco Products (Prohibition of Advertisement and Regulation of Trade and Commerce, Production, Supply and Distribution) Amendment Act, 2020 can impact adversely to volume growth and realization going forward.
Valuations & Recommendation: We expect that the company will get benefits from the strong market share with volume growth, good presence over the country, leading market position, improving realization & EBIDTA / stick, decent financial which would lead to 2% CAGR in top-line and 9% EPS CAGR over FY20-23E. Moreover, recent tax reform would also boost the profitability for VST Ind, as the company was paying ~35% taxes in the previous years and which will come down to 25-26%. We feel the base case fair value of the stock is Rs.3760 (14.9x FY23E EPS) and the bull case fair value is Rs.4012 (15.8x FY23E EPS). Investors could buy the stock on dips to Rs.3384 (13.4x FY23E EPS) and further add on dips to Rs.3006 (11.9x FY23E EPS).
HDFC Scrip Code VSTINDEQNR
BSE Code 509966
NSE Code VSTIND
Bloomberg VST:IN
CMP Feb 19, 2021 3641.8
Equity Capital (cr) 15
Face Value (Rs) 10
Eq- Share O/S(cr) 1.54
Market Cap(Rscr) 5613
Book Value (Rs) 510
Avg.52 Wk Volume 30188
52 Week High 4400.00
52 Week Low 2550.00
Share holding Pattern % (Dec, 2020)
Promoters 32.16
Institutions 20.52
Non Institutions 47.32
Total 100.0
Fundamental Research Analyst Jimit Zaveri [email protected]
VST Industries Ltd.
3
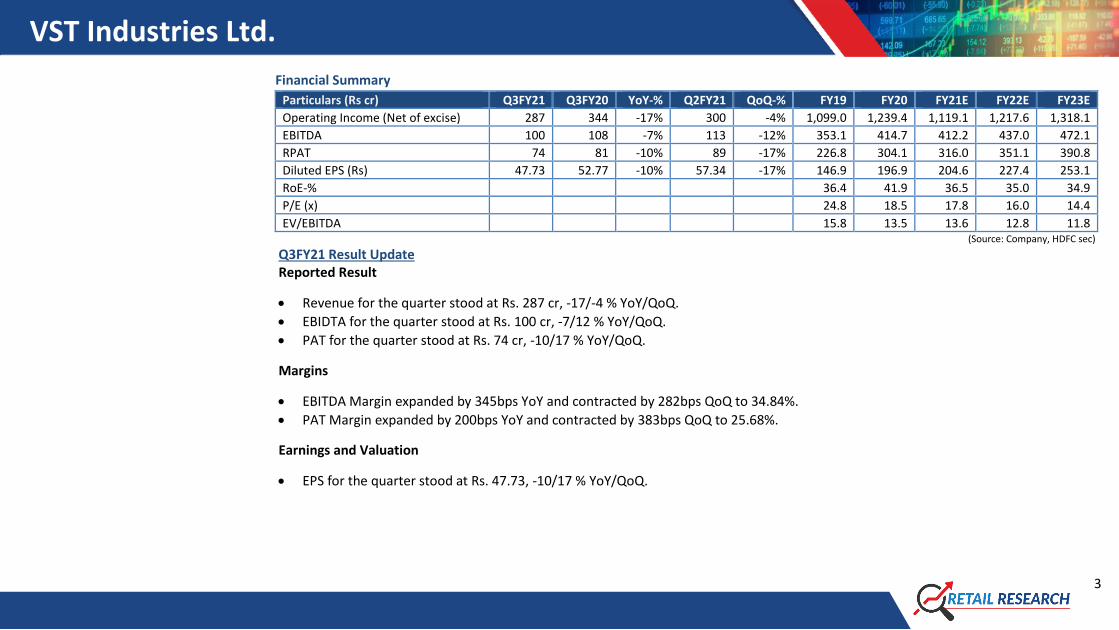
Financial Summary
Particulars (Rs cr) Q3FY21 Q3FY20 YoY-% Q2FY21 QoQ-% FY19 FY20 FY21E FY22E FY23E
Operating Income (Net of excise) 287 344 -17% 300 -4% 1,099.0 1,239.4 1,119.1 1,217.6 1,318.1
EBITDA 100 108 -7% 113 -12% 353.1 414.7 412.2 437.0 472.1
RPAT 74 81 -10% 89 -17% 226.8 304.1 316.0 351.1 390.8
Diluted EPS (Rs) 47.73 52.77 -10% 57.34 -17% 146.9 196.9 204.6 227.4 253.1
RoE-% 36.4 41.9 36.5 35.0 34.9
P/E (x) 24.8 18.5 17.8 16.0 14.4
EV/EBITDA 15.8 13.5 13.6 12.8 11.8 (Source: Company, HDFC sec)
Q3FY21 Result Update Reported Result
• Revenue for the quarter stood at Rs. 287 cr, -17/-4 % YoY/QoQ.
• EBIDTA for the quarter stood at Rs. 100 cr, -7/12 % YoY/QoQ.
• PAT for the quarter stood at Rs. 74 cr, -10/17 % YoY/QoQ.
Margins
• EBITDA Margin expanded by 345bps YoY and contracted by 282bps QoQ to 34.84%.
• PAT Margin expanded by 200bps YoY and contracted by 383bps QoQ to 25.68%.
Earnings and Valuation
• EPS for the quarter stood at Rs. 47.73, -10/17 % YoY/QoQ.
VST Industries Ltd.
4
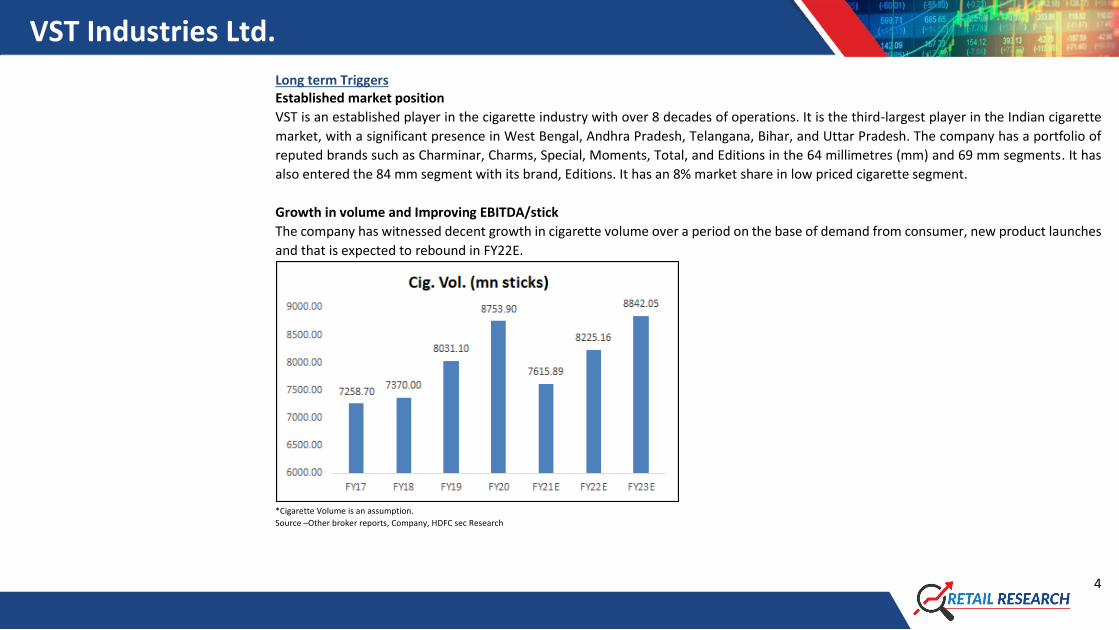
Long term Triggers Established market position
VST is an established player in the cigarette industry with over 8 decades of operations. It is the third-largest player in the Indian cigarette
market, with a significant presence in West Bengal, Andhra Pradesh, Telangana, Bihar, and Uttar Pradesh. The company has a portfolio of
reputed brands such as Charminar, Charms, Special, Moments, Total, and Editions in the 64 millimetres (mm) and 69 mm segments. It has
also entered the 84 mm segment with its brand, Editions. It has an 8% market share in low priced cigarette segment.
Growth in volume and Improving EBITDA/stick
The company has witnessed decent growth in cigarette volume over a period on the base of demand from consumer, new product launches
and that is expected to rebound in FY22E.
*Cigarette Volume is an assumption.
Source –Other broker reports, Company, HDFC sec Research
VST Industries Ltd.
5
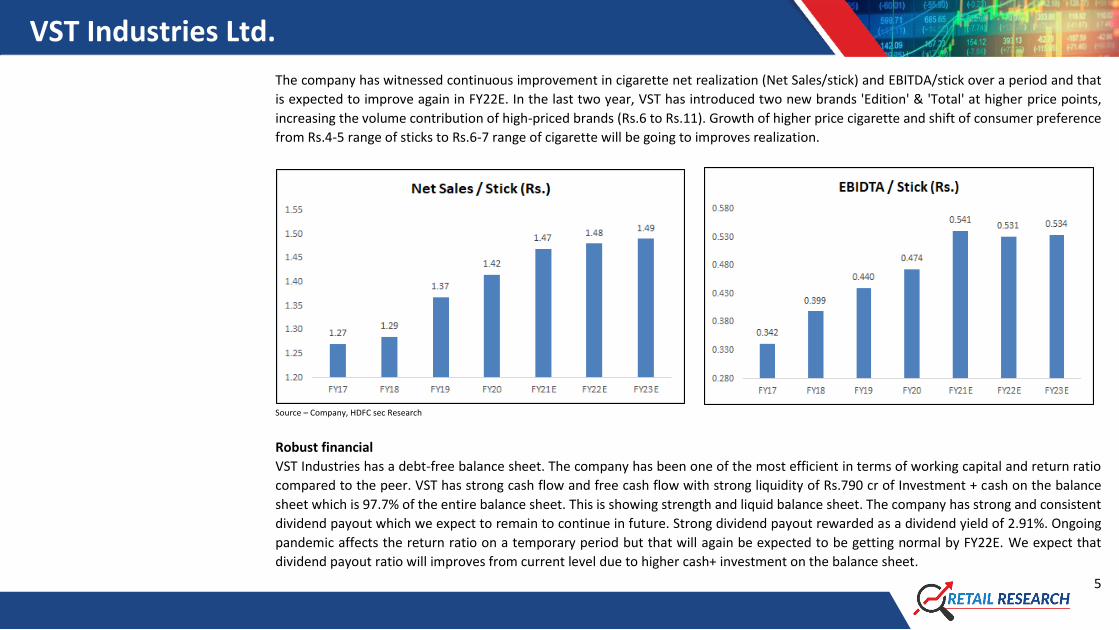
The company has witnessed continuous improvement in cigarette net realization (Net Sales/stick) and EBITDA/stick over a period and that
is expected to improve again in FY22E. In the last two year, VST has introduced two new brands 'Edition' & 'Total' at higher price points,
increasing the volume contribution of high-priced brands (Rs.6 to Rs.11). Growth of higher price cigarette and shift of consumer preference
from Rs.4-5 range of sticks to Rs.6-7 range of cigarette will be going to improves realization.
Source – Company, HDFC sec Research
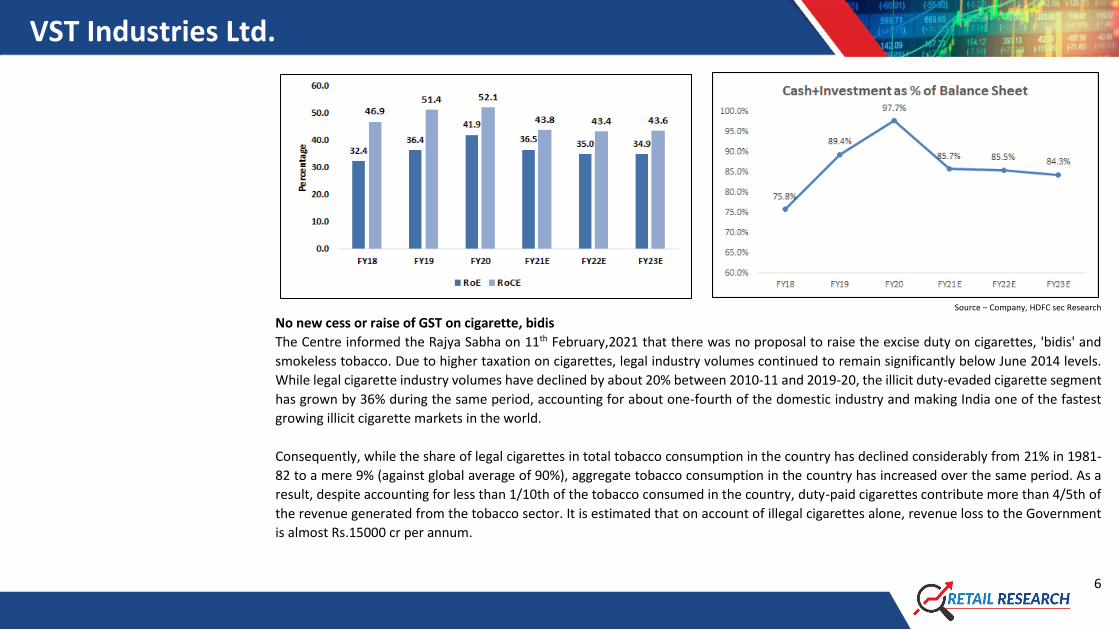
Robust financial
VST Industries has a debt-free balance sheet. The company has been one of the most efficient in terms of working capital and return ratio
compared to the peer. VST has strong cash flow and free cash flow with strong liquidity of Rs.790 cr of Investment + cash on the balance
sheet which is 97.7% of the entire balance sheet. This is showing strength and liquid balance sheet. The company has strong and consistent
dividend payout which we expect to remain to continue in future. Strong dividend payout rewarded as a dividend yield of 2.91%. Ongoing
pandemic affects the return ratio on a temporary period but that will again be expected to be getting normal by FY22E. We expect that
dividend payout ratio will improves from current level due to higher cash+ investment on the balance sheet.
VST Industries Ltd.
6
Source – Company, HDFC sec Research
No new cess or raise of GST on cigarette, bidis
The Centre informed the Rajya Sabha on 11th February,2021 that there was no proposal to raise the excise duty on cigarettes, 'bidis' and
smokeless tobacco. Due to higher taxation on cigarettes, legal industry volumes continued to remain significantly below June 2014 levels.
While legal cigarette industry volumes have declined by about 20% between 2010-11 and 2019-20, the illicit duty-evaded cigarette segment
has grown by 36% during the same period, accounting for about one-fourth of the domestic industry and making India one of the fastest
growing illicit cigarette markets in the world.
Consequently, while the share of legal cigarettes in total tobacco consumption in the country has declined considerably from 21% in 1981-
82 to a mere 9% (against global average of 90%), aggregate tobacco consumption in the country has increased over the same period. As a
result, despite accounting for less than 1/10th of the tobacco consumed in the country, duty-paid cigarettes contribute more than 4/5th of
the revenue generated from the tobacco sector. It is estimated that on account of illegal cigarettes alone, revenue loss to the Government
is almost Rs.15000 cr per annum.
VST Industries Ltd.
7
What could go wrong Covid-19 led lockdown has an impact on growth
March quarter was largely unaffected by lockdown given pre-stocking by dealers, But Q1FY21 has significantly impacted by 45 days
production halt as well as the shutdown of most retail shops in the country.
A large number of grocery stores selling essential food, health and hygiene products were permitted to remain open, they operated with
significant restrictions concerning the duration of opening hours, timings, number of customers that could be serviced at a time etc. In many
geographies, convenience outlets remained closed for extended durations. Non-availability of public transport adversely impacted the
availability of manpower involved in value chain operations like warehousing, order capture, transportation and so on. Q2FY21 and Q3FY21
also has witnessed by fall in volume. So that 9MFY21 has reported ~22% of volume degrowth.
Higher taxation such as GST and excise duty will affect the industry profitability. Also, perception as a sin industry to affect adversely.
Cigarettes and other Tobacco Products (Prohibition of Advertisement and Regulation of Trade and Commerce, Production, Supply and
Distribution) Amendment Act, 2020
The government has drafted the Cigarettes and other Tobacco Products (Prohibition of Advertisement and Regulation of Trade and
Commerce, Production, Supply and Distribution) Amendment Act, 2020. The provision for raising the age limit to 21 years (from the current
of 18 years) is part of the new bill being piloted by the Union Health Ministry. Trade/commerce in cigarettes or other tobacco product shall
be in sealed, intact and original packaging. Contravention of this Section 7 will lead to imprisonment of two years or fine going up to Rs 1
lakh and second conviction leading to prison for 5 years or fine going up to Rs 5 lakh.
The bill also has a provision for coming down on the manufacture and sale of illicit cigarettes and tobacco products. Sale of illicit products
will lead to a punishment of imprisonment of 1 year and a fine of Rs 50,000 and a second conviction of imprisonment of 2 years and Rs 1
lakh. The fine on the manufacture of illicit cigarettes is imprisonment of 2 years and a fine of Rs 1 lakh. The penalty for smoking at restricted
areas is being increased from Rs 200 to Rs 2,000.
VST Industries Ltd.
8
No person shall directly or indirectly advertise cigarettes or any other tobacco products through any medium and no person shall take part
in any advertisement that directly or indirectly promotes the use or consumption of cigarettes or any other tobacco products.
If this draft becomes law then the cigarette industry will face difficulties to grow volume and also to improves realization.
A discriminatory taxation and regulatory regime along with a sharp increase in illegal trade in recent years, especially at the premium end
cigarette, continue to pose significant challenges to the legal cigarette industry in the country.
Competition from unorganized players:
Non duty-paid cigarettes have benefited from the large price distortion arising from exponential tax hikes which has adversely affected large
organized players.
Ban on loose Sticks
Continuation of harsher regulations such as selling restrictions and ban on sale of loose sticks in key large states can pose challenges for
volume growth of the organized industry and VST in particular.
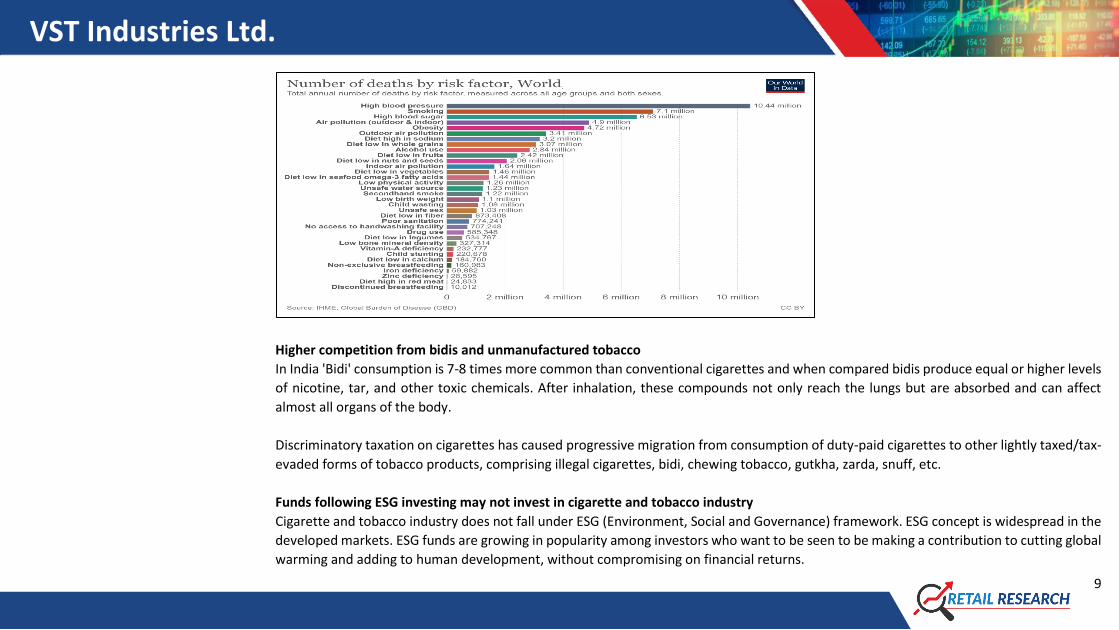
Healthy lifestyle awareness can affect growth
Cigarettes contain about 600 ingredients. Smoking generates more than 7,000 chemicals. Many of these are poisonous and at least 69 of
them can cause cancer. In India, among tobacco use, smoking is one of the major causes of deaths and diseases, accounting for millions of
such cases.
VST Industries Ltd.
9
Higher competition from bidis and unmanufactured tobacco
In India 'Bidi' consumption is 7-8 times more common than conventional cigarettes and when compared bidis produce equal or higher levels
of nicotine, tar, and other toxic chemicals. After inhalation, these compounds not only reach the lungs but are absorbed and can affect
almost all organs of the body.
Discriminatory taxation on cigarettes has caused progressive migration from consumption of duty-paid cigarettes to other lightly taxed/tax-
evaded forms of tobacco products, comprising illegal cigarettes, bidi, chewing tobacco, gutkha, zarda, snuff, etc.
Funds following ESG investing may not invest in cigarette and tobacco industry
Cigarette and tobacco industry does not fall under ESG (Environment, Social and Governance) framework. ESG concept is widespread in the
developed markets. ESG funds are growing in popularity among investors who want to be seen to be making a contribution to cutting global
warming and adding to human development, without compromising on financial returns.
VST Industries Ltd.
10
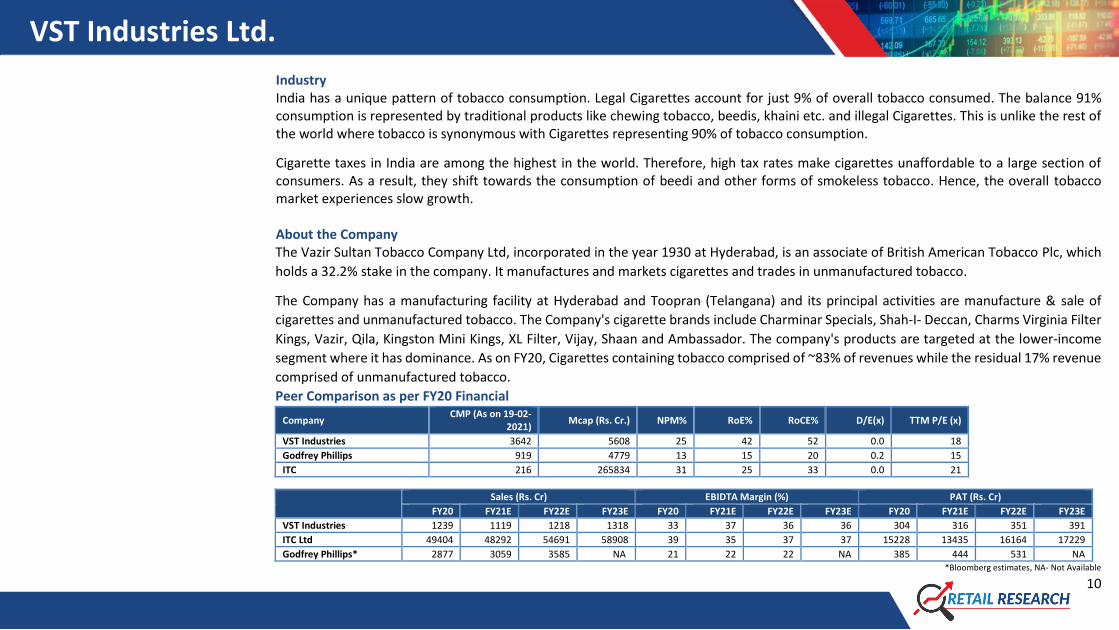
Industry India has a unique pattern of tobacco consumption. Legal Cigarettes account for just 9% of overall tobacco consumed. The balance 91% consumption is represented by traditional products like chewing tobacco, beedis, khaini etc. and illegal Cigarettes. This is unlike the rest of the world where tobacco is synonymous with Cigarettes representing 90% of tobacco consumption.
Cigarette taxes in India are among the highest in the world. Therefore, high tax rates make cigarettes unaffordable to a large section of consumers. As a result, they shift towards the consumption of beedi and other forms of smokeless tobacco. Hence, the overall tobacco market experiences slow growth. About the Company The Vazir Sultan Tobacco Company Ltd, incorporated in the year 1930 at Hyderabad, is an associate of British American Tobacco Plc, which
holds a 32.2% stake in the company. It manufactures and markets cigarettes and trades in unmanufactured tobacco.
The Company has a manufacturing facility at Hyderabad and Toopran (Telangana) and its principal activities are manufacture & sale of
cigarettes and unmanufactured tobacco. The Company's cigarette brands include Charminar Specials, Shah-I- Deccan, Charms Virginia Filter
Kings, Vazir, Qila, Kingston Mini Kings, XL Filter, Vijay, Shaan and Ambassador. The company's products are targeted at the lower-income
segment where it has dominance. As on FY20, Cigarettes containing tobacco comprised of ~83% of revenues while the residual 17% revenue
comprised of unmanufactured tobacco.
Peer Comparison as per FY20 Financial
Company CMP (As on 19-02-
2021) Mcap (Rs. Cr.) NPM% RoE% RoCE% D/E(x) TTM P/E (x)
VST Industries 3642 5608 25 42 52 0.0 18
Godfrey Phillips 919 4779 13 15 20 0.2 15
ITC 216 265834 31 25 33 0.0 21
Sales (Rs. Cr) EBIDTA Margin (%) PAT (Rs. Cr)
FY20 FY21E FY22E FY23E FY20 FY21E FY22E FY23E FY20 FY21E FY22E FY23E
VST Industries 1239 1119 1218 1318 33 37 36 36 304 316 351 391
ITC Ltd 49404 48292 54691 58908 39 35 37 37 15228 13435 16164 17229
Godfrey Phillips* 2877 3059 3585 NA 21 22 22 NA 385 444 531 NA *Bloomberg estimates, NA- Not Available
VST Industries Ltd.
11
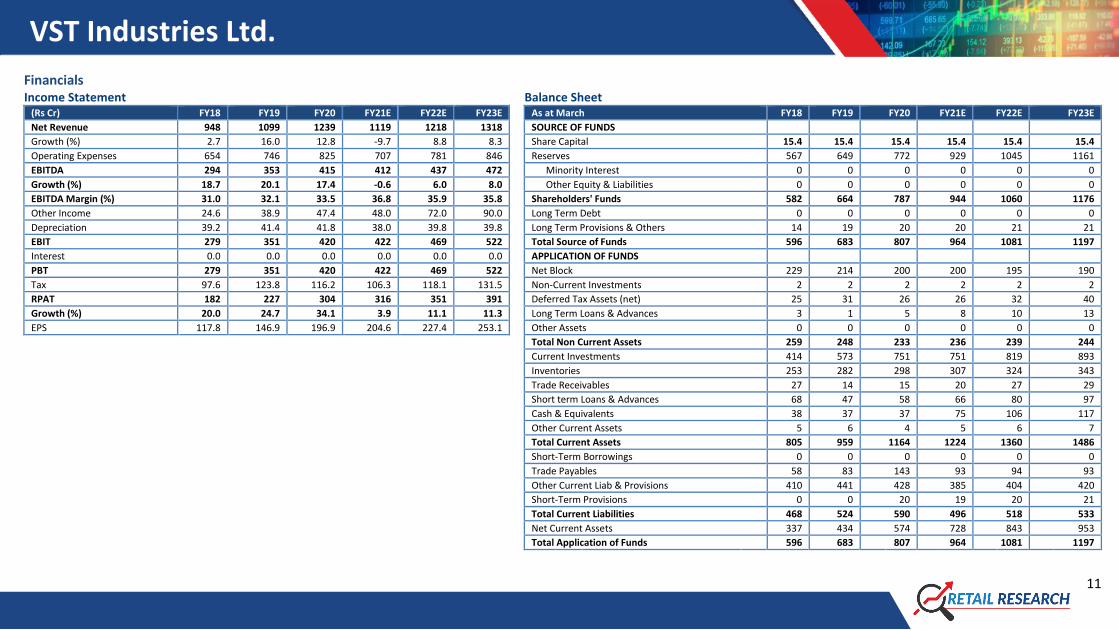
Financials Income Statement Balance Sheet
(Rs Cr) FY18 FY19 FY20 FY21E FY22E FY23E As at March FY18 FY19 FY20 FY21E FY22E FY23E
Net Revenue 948 1099 1239 1119 1218 1318 SOURCE OF FUNDS
Growth (%) 2.7 16.0 12.8 -9.7 8.8 8.3 Share Capital 15.4 15.4 15.4 15.4 15.4 15.4
Operating Expenses 654 746 825 707 781 846 Reserves 567 649 772 929 1045 1161
EBITDA 294 353 415 412 437 472 Minority Interest 0 0 0 0 0 0
Growth (%) 18.7 20.1 17.4 -0.6 6.0 8.0 Other Equity & Liabilities 0 0 0 0 0 0
EBITDA Margin (%) 31.0 32.1 33.5 36.8 35.9 35.8 Shareholders' Funds 582 664 787 944 1060 1176
Other Income 24.6 38.9 47.4 48.0 72.0 90.0 Long Term Debt 0 0 0 0 0 0
Depreciation 39.2 41.4 41.8 38.0 39.8 39.8 Long Term Provisions & Others 14 19 20 20 21 21
EBIT 279 351 420 422 469 522 Total Source of Funds 596 683 807 964 1081 1197
Interest 0.0 0.0 0.0 0.0 0.0 0.0 APPLICATION OF FUNDS
PBT 279 351 420 422 469 522 Net Block 229 214 200 200 195 190
Tax 97.6 123.8 116.2 106.3 118.1 131.5 Non-Current Investments 2 2 2 2 2 2
RPAT 182 227 304 316 351 391 Deferred Tax Assets (net) 25 31 26 26 32 40
Growth (%) 20.0 24.7 34.1 3.9 11.1 11.3 Long Term Loans & Advances 3 1 5 8 10 13
EPS 117.8 146.9 196.9 204.6 227.4 253.1 Other Assets 0 0 0 0 0 0
Total Non Current Assets 259 248 233 236 239 244
Current Investments 414 573 751 751 819 893
Inventories 253 282 298 307 324 343
Trade Receivables 27 14 15 20 27 29
Short term Loans & Advances 68 47 58 66 80 97
Cash & Equivalents 38 37 37 75 106 117
Other Current Assets 5 6 4 5 6 7
Total Current Assets 805 959 1164 1224 1360 1486
Short-Term Borrowings 0 0 0 0 0 0
Trade Payables 58 83 143 93 94 93
Other Current Liab & Provisions 410 441 428 385 404 420
Short-Term Provisions 0 0 20 19 20 21
Total Current Liabilities 468 524 590 496 518 533
Net Current Assets 337 434 574 728 843 953
Total Application of Funds 596 683 807 964 1081 1197
VST Industries Ltd.
12
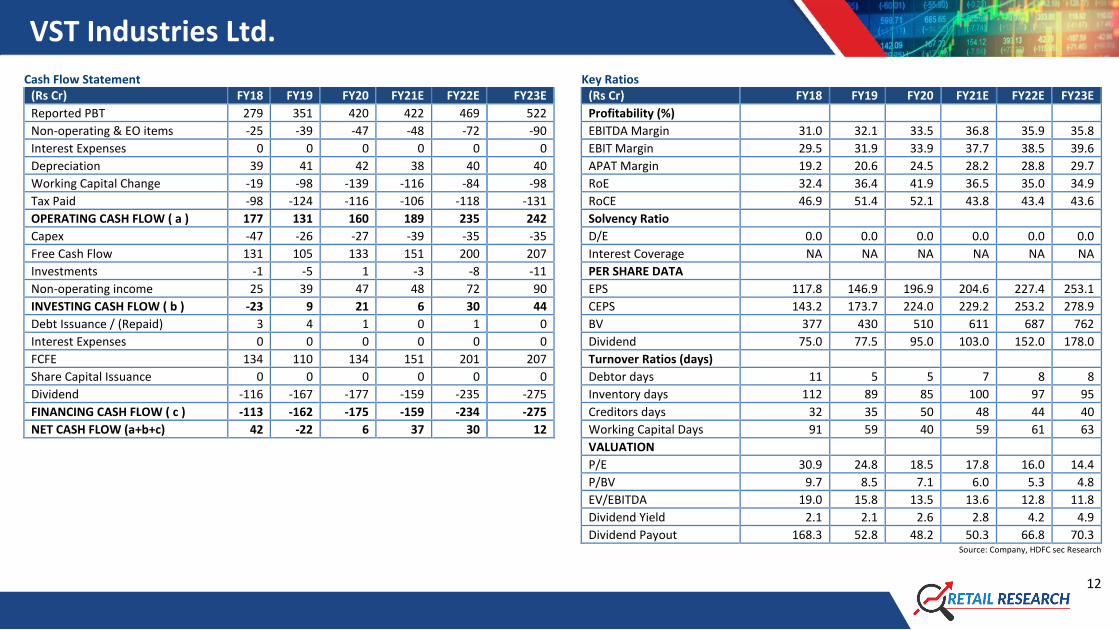
Cash Flow Statement Key Ratios (Rs Cr) FY18 FY19 FY20 FY21E FY22E FY23E (Rs Cr) FY18 FY19 FY20 FY21E FY22E FY23E
Reported PBT 279 351 420 422 469 522 Profitability (%)
Non-operating & EO items -25 -39 -47 -48 -72 -90 EBITDA Margin 31.0 32.1 33.5 36.8 35.9 35.8
Interest Expenses 0 0 0 0 0 0 EBIT Margin 29.5 31.9 33.9 37.7 38.5 39.6
Depreciation 39 41 42 38 40 40 APAT Margin 19.2 20.6 24.5 28.2 28.8 29.7
Working Capital Change -19 -98 -139 -116 -84 -98 RoE 32.4 36.4 41.9 36.5 35.0 34.9
Tax Paid -98 -124 -116 -106 -118 -131 RoCE 46.9 51.4 52.1 43.8 43.4 43.6
OPERATING CASH FLOW ( a ) 177 131 160 189 235 242 Solvency Ratio
Capex -47 -26 -27 -39 -35 -35 D/E 0.0 0.0 0.0 0.0 0.0 0.0
Free Cash Flow 131 105 133 151 200 207 Interest Coverage NA NA NA NA NA NA
Investments -1 -5 1 -3 -8 -11 PER SHARE DATA
Non-operating income 25 39 47 48 72 90 EPS 117.8 146.9 196.9 204.6 227.4 253.1
INVESTING CASH FLOW ( b ) -23 9 21 6 30 44 CEPS 143.2 173.7 224.0 229.2 253.2 278.9
Debt Issuance / (Repaid) 3 4 1 0 1 0 BV 377 430 510 611 687 762
Interest Expenses 0 0 0 0 0 0 Dividend 75.0 77.5 95.0 103.0 152.0 178.0
FCFE 134 110 134 151 201 207 Turnover Ratios (days)
Share Capital Issuance 0 0 0 0 0 0 Debtor days 11 5 5 7 8 8
Dividend -116 -167 -177 -159 -235 -275 Inventory days 112 89 85 100 97 95
FINANCING CASH FLOW ( c ) -113 -162 -175 -159 -234 -275 Creditors days 32 35 50 48 44 40
NET CASH FLOW (a+b+c) 42 -22 6 37 30 12 Working Capital Days 91 59 40 59 61 63
VALUATION
P/E 30.9 24.8 18.5 17.8 16.0 14.4
P/BV 9.7 8.5 7.1 6.0 5.3 4.8
EV/EBITDA 19.0 15.8 13.5 13.6 12.8 11.8
Dividend Yield 2.1 2.1 2.6 2.8 4.2 4.9
Dividend Payout 168.3 52.8 48.2 50.3 66.8 70.3 Source: Company, HDFC sec Research
VST Industries Ltd.
13
Disclosure: I, Jimit Zaveri, (MBA - Finance), authors and the names subscribed to this report, hereby certify that all of the views expressed in this research report accurately reflect our views about the subject issuer(s) or securities. HSL has no material adverse disciplinary history as on the date of
publication of this report. We also certify that no part of our compensation was, is, or will be directly or indirectly related to the specific recommendation(s) or view(s) in this report.
Research Analyst or his/her relative or HDFC Securities Ltd. does not have any financial interest in the subject company. Also Research Analyst or his relative or HDFC Securities Ltd. or its Associate may have beneficial ownership of 1% or more in the subject company at the end of the
month immediately preceding the date of publication of the Research Report. Further Research Analyst or his relative or HDFC Securities Ltd. or its associate does not have any material conflict of interest.
Any holding in stock – No
HDFC Securities Limited (HSL) is a SEBI Registered Research Analyst having registration no. INH000002475.
Disclaimer:
This report has been prepared by HDFC Securities Ltd and is meant for sole use by the recipient and not for circulation. The information and opinions contained herein have been compiled or arrived at, based upon information obtained in good faith from sources believed to be reliable.
Such information has not been independently verified and no guaranty, representation of warranty, express or implied, is made as to its accuracy, completeness or correctness. All such information and opinions are subject to change without notice. This document is for information
purposes only. Descriptions of any company or companies or their securities mentioned herein are not intended to be complete and this document is not, and should not be construed as an offer or solicitation of an offer, to buy or sell any securities or other financial instruments.
This report is not directed to, or intended for display, downloading, printing, reproducing or for distribution to or use by, any person or entity who is a citizen or resident or located in any locality, state, country or other jurisdiction where such distribution, publication, reproduction,
availability or use would be contrary to law or regulation or what would subject HSL or its affiliates to any registration or licensing requirement within such jurisdiction.
If this report is inadvertently sent or has reached any person in such country, especially, United States of America, the same should be ignored and brought to the attention of the sender. This document may not be reproduced, distributed or published in whole or in part, directly or
indirectly, for any purposes or in any manner.
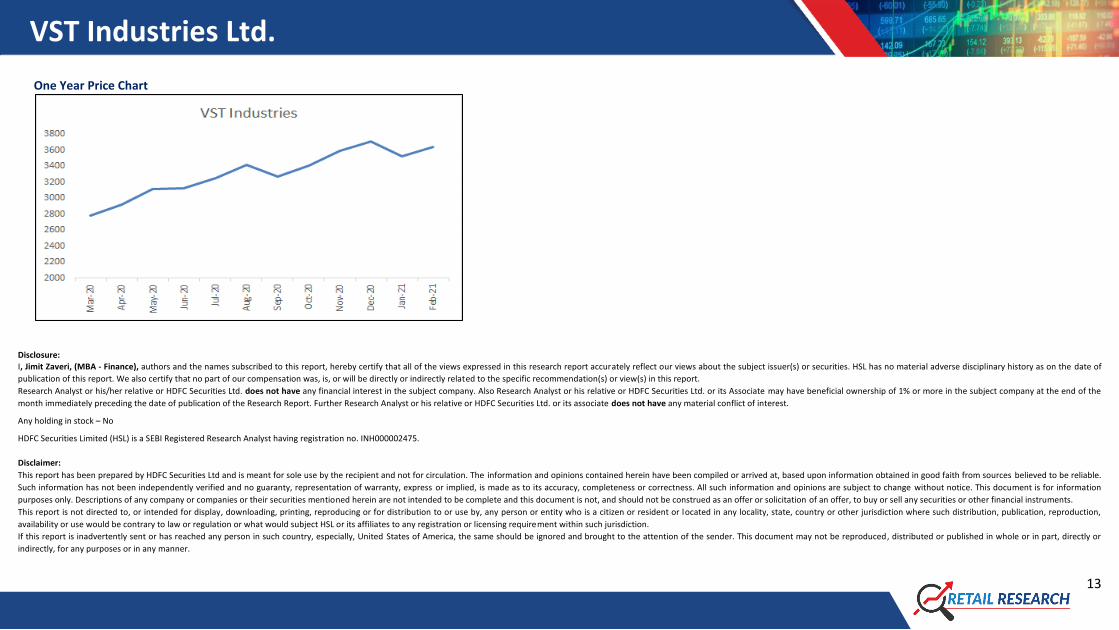
One Year Price Chart
VST Industries Ltd.
14
Foreign currencies denominated securities, wherever mentioned, are subject to exchange rate fluctuations, which could have an adverse effect on their value or price, or the income derived from them. In addition, investors in securities such as ADRs, the values of which are influenced by
foreign currencies effectively assume currency risk.
It should not be considered to be taken as an offer to sell or a solicitation to buy any security. HSL may from time to time solicit from, or perform broking, or other services for, any company mentioned in this mail and/or its attachments.
HSL and its affiliated company(ies), their directors and employees may; (a) from time to time, have a long or short position in, and buy or sell the securities of the company(ies) mentioned herein or (b) be engaged in any other transaction involving such securities and earn brokerage or
other compensation or act as a market maker in the financial instruments of the company(ies) discussed herein or act as an advisor or lender/borrower to such company(ies) or may have any other potential conflict of interests with respect to any recommendation and other related
information and opinions.
HSL, its directors, analysts or employees do not take any responsibility, financial or otherwise, of the losses or the damages sustained due to the investments made or any action taken on basis of this report, including but not restricted to, fluctuation in the prices of shares and bonds,
changes in the currency rates, diminution in the NAVs, reduction in the dividend or income, etc.
HSL and other group companies, its directors, associates, employees may have various positions in any of the stocks, securities and financial instruments dealt in the report, or may make sell or purchase or other deals in these securities from time to time or may deal in other securities of
the companies / organizations described in this report.
HSL or its associates might have managed or co-managed public offering of securities for the subject company or might have been mandated by the subject company for any other assignment in the past twelve months.
HSL or its associates might have received any compensation from the companies mentioned in the report during the period preceding twelve months from t date of this report for services in respect of managing or co-managing public offerings, corporate finance, investment banking or
merchant banking, brokerage services or other advisory service in a merger or specific transaction in the normal course of business.
HSL or its analysts did not receive any compensation or other benefits from the companies mentioned in the report or third party in connection with preparation of the research report. Accordingly, neither HSL nor Research Analysts have any material conflict of interest at the time of
publication of this report. Compensation of our Research Analysts is not based on any specific merchant banking, investment b anking or brokerage service transactions. HSL may have issued other reports that are inconsistent with and reach different conclusion from the information
presented in this report.
Research entity has not been engaged in market making activity for the subject company. Research analyst has not served as an officer, director or employee of the subject company. We have not received any compensation/benefits from the subject company or third party in connection
with the Research Report.
HDFC securities Limited, I Think Techno Campus, Building - B, "Alpha", Office Floor 8, Near Kanjurmarg Station, Opp. Crompton Greaves, Kanjurmarg (East), Mumbai 400 042 Phone: (022) 3075 3400 Fax: (022) 2496 5066
Compliance Officer: Binkle R. Oza Email: [email protected] Phone: (022) 3045 3600
HDFC Securities Limited, SEBI Reg. No.: NSE, BSE, MSEI, MCX: INZ000186937; AMFI Reg. No. ARN: 13549; PFRDA Reg. No. POP: 11092018; IRDA Corporate Agent License No.: CA0062; SEBI Research Analyst Reg. No.: INH000002475; SEBI Investment Adviser Reg. No.: INA000011538; CIN -
U67120MH2000PLC152193
Mutual Funds Investments are subject to market risk. Please read the offer and scheme related documents carefully before investing.


