Embed Size (px)
Citation preview
Maruti Suzuki Ltd.
1
Lorem ipsum dolor sit amet, consectetuer adipiscing elit, sed diam nonummy nibh euismod tincidunt ut laoreet dolore magna aliquam erat volutpat. Ut wisi enim ad minim veniam, quis nostrud exerci tation ullamcorper suscipit lobortis nisl ut aliquip ex ea commodo consequat. Duis autem vel eum iriure dolor in hendrerit in vulputate velit esse molestie consequat, vel illum dolore eu feugiat nulla
Lorem ipsum dolor sit amet, consectetuer adipiscing elit, sed diam nonummy
nibh euismod tincidunt ut laoreet dolore magna aliquam erat volutpat. Ut wisi enim ad minim veniam,
quis nostrud exerci tation ullamcorper suscipit lobortis nisl ut aliquip ex ea commodo consequat. Duis autem vel eum iriure dolor in hendrerit in vulputate velit esse molestie consequat,
vel illum dolore eu feugiat nulla facilisis at vero eros et accumsan et iusto odio dignissim qui blandit praesent luptatum zzril delenit augue duis dolore te feugait nulla facilisi. et iusto odio dignissim qui blandit praesent luptatum zzril delenit augue duis dolore te feugait nulla facilisLorem ipsum dolor sit amet,
Initiating Coverage
Maruti Suzuki Ltd. 24-September-2020
Maruti Suzuki Ltd.
2
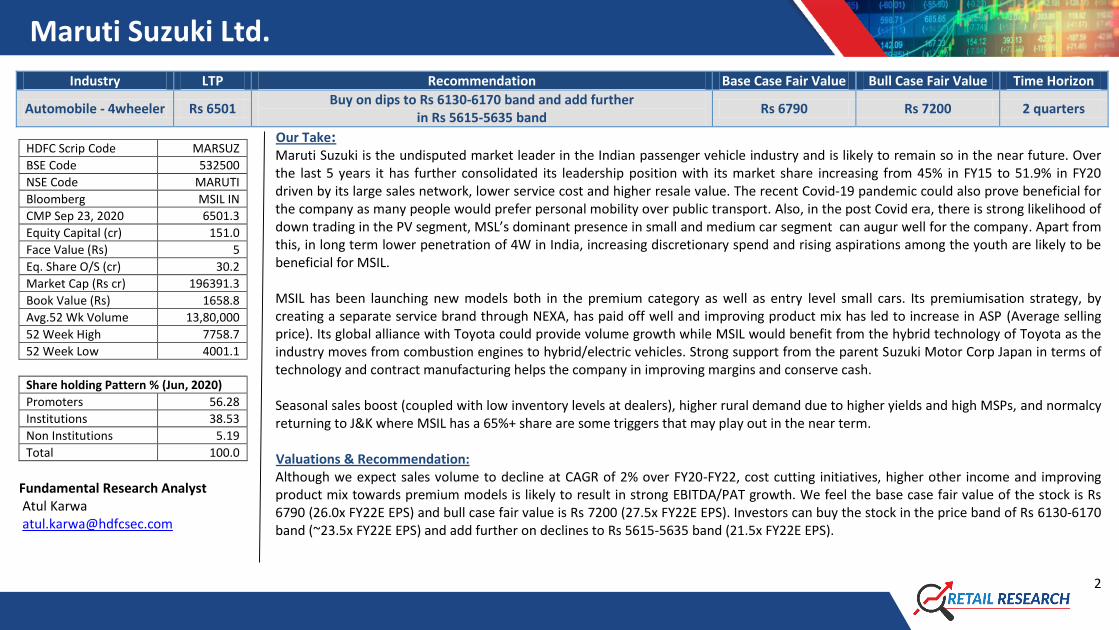
Industry LTP Recommendation Base Case Fair Value Bull Case Fair Value Time Horizon
Automobile - 4wheeler Rs 6501 Buy on dips to Rs 6130-6170 band and add further
in Rs 5615-5635 band Rs 6790 Rs 7200 2 quarters
Our Take:
Maruti Suzuki is the undisputed market leader in the Indian passenger vehicle industry and is likely to remain so in the near future. Over the last 5 years it has further consolidated its leadership position with its market share increasing from 45% in FY15 to 51.9% in FY20 driven by its large sales network, lower service cost and higher resale value. The recent Covid-19 pandemic could also prove beneficial for the company as many people would prefer personal mobility over public transport. Also, in the post Covid era, there is strong likelihood of down trading in the PV segment, MSL’s dominant presence in small and medium car segment can augur well for the company. Apart from this, in long term lower penetration of 4W in India, increasing discretionary spend and rising aspirations among the youth are likely to be beneficial for MSIL. MSIL has been launching new models both in the premium category as well as entry level small cars. Its premiumisation strategy, by creating a separate service brand through NEXA, has paid off well and improving product mix has led to increase in ASP (Average selling price). Its global alliance with Toyota could provide volume growth while MSIL would benefit from the hybrid technology of Toyota as the industry moves from combustion engines to hybrid/electric vehicles. Strong support from the parent Suzuki Motor Corp Japan in terms of technology and contract manufacturing helps the company in improving margins and conserve cash. Seasonal sales boost (coupled with low inventory levels at dealers), higher rural demand due to higher yields and high MSPs, and normalcy returning to J&K where MSIL has a 65%+ share are some triggers that may play out in the near term.
Valuations & Recommendation: Although we expect sales volume to decline at CAGR of 2% over FY20-FY22, cost cutting initiatives, higher other income and improving product mix towards premium models is likely to result in strong EBITDA/PAT growth. We feel the base case fair value of the stock is Rs 6790 (26.0x FY22E EPS) and bull case fair value is Rs 7200 (27.5x FY22E EPS). Investors can buy the stock in the price band of Rs 6130-6170 band (~23.5x FY22E EPS) and add further on declines to Rs 5615-5635 band (21.5x FY22E EPS).
HDFC Scrip Code MARSUZ
BSE Code 532500
NSE Code MARUTI
Bloomberg MSIL IN
CMP Sep 23, 2020 6501.3
Equity Capital (cr) 151.0
Face Value (Rs) 5
Eq. Share O/S (cr) 30.2
Market Cap (Rs cr) 196391.3
Book Value (Rs) 1658.8
Avg.52 Wk Volume 13,80,000
52 Week High 7758.7
52 Week Low 4001.1
Share holding Pattern % (Jun, 2020)
Promoters 56.28
Institutions 38.53
Non Institutions 5.19
Total 100.0
Fundamental Research Analyst Atul Karwa [email protected]
Maruti Suzuki Ltd.
3
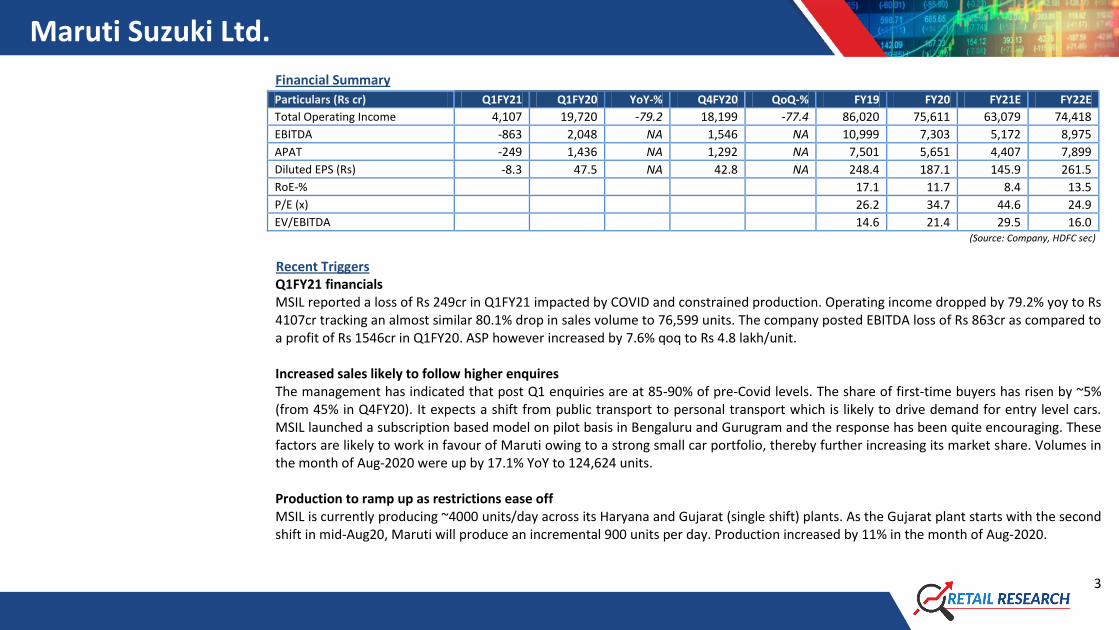
Financial Summary
Particulars (Rs cr) Q1FY21 Q1FY20 YoY-% Q4FY20 QoQ-% FY19 FY20 FY21E FY22E
Total Operating Income 4,107 19,720 -79.2 18,199 -77.4 86,020 75,611 63,079 74,418
EBITDA -863 2,048 NA 1,546 NA 10,999 7,303 5,172 8,975
APAT -249 1,436 NA 1,292 NA 7,501 5,651 4,407 7,899
Diluted EPS (Rs) -8.3 47.5 NA 42.8 NA 248.4 187.1 145.9 261.5
RoE-% 17.1 11.7 8.4 13.5
P/E (x) 26.2 34.7 44.6 24.9
EV/EBITDA 14.6 21.4 29.5 16.0 (Source: Company, HDFC sec)
Recent Triggers Q1FY21 financials MSIL reported a loss of Rs 249cr in Q1FY21 impacted by COVID and constrained production. Operating income dropped by 79.2% yoy to Rs 4107cr tracking an almost similar 80.1% drop in sales volume to 76,599 units. The company posted EBITDA loss of Rs 863cr as compared to a profit of Rs 1546cr in Q1FY20. ASP however increased by 7.6% qoq to Rs 4.8 lakh/unit. Increased sales likely to follow higher enquires The management has indicated that post Q1 enquiries are at 85-90% of pre-Covid levels. The share of first-time buyers has risen by ~5% (from 45% in Q4FY20). It expects a shift from public transport to personal transport which is likely to drive demand for entry level cars. MSIL launched a subscription based model on pilot basis in Bengaluru and Gurugram and the response has been quite encouraging. These factors are likely to work in favour of Maruti owing to a strong small car portfolio, thereby further increasing its market share. Volumes in the month of Aug-2020 were up by 17.1% YoY to 124,624 units. Production to ramp up as restrictions ease off MSIL is currently producing ~4000 units/day across its Haryana and Gujarat (single shift) plants. As the Gujarat plant starts with the second shift in mid-Aug20, Maruti will produce an incremental 900 units per day. Production increased by 11% in the month of Aug-2020.
Maruti Suzuki Ltd.
4
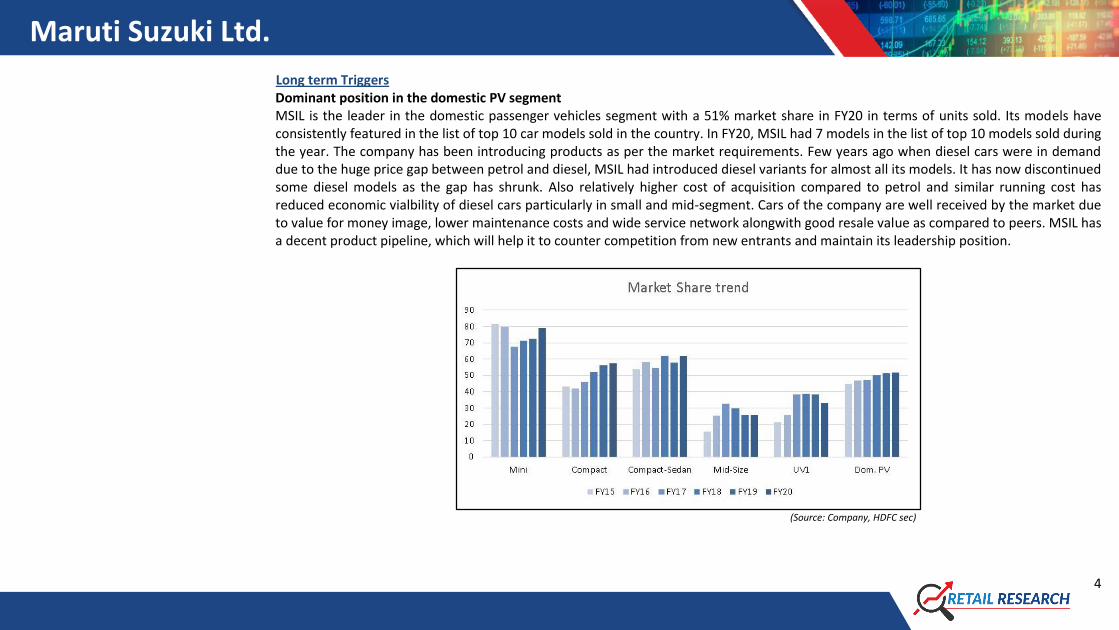
Long term Triggers Dominant position in the domestic PV segment MSIL is the leader in the domestic passenger vehicles segment with a 51% market share in FY20 in terms of units sold. Its models have consistently featured in the list of top 10 car models sold in the country. In FY20, MSIL had 7 models in the list of top 10 models sold during the year. The company has been introducing products as per the market requirements. Few years ago when diesel cars were in demand due to the huge price gap between petrol and diesel, MSIL had introduced diesel variants for almost all its models. It has now discontinued some diesel models as the gap has shrunk. Also relatively higher cost of acquisition compared to petrol and similar running cost has reduced economic vialbility of diesel cars particularly in small and mid-segment. Cars of the company are well received by the market due to value for money image, lower maintenance costs and wide service network alongwith good resale value as compared to peers. MSIL has a decent product pipeline, which will help it to counter competition from new entrants and maintain its leadership position.
(Source: Company, HDFC sec)
Maruti Suzuki Ltd.
5
Some of the expected launches are Jimny, Wagon R electric, 6/7-seater WagonR (to compete with Renault Triber, which has received a good response), Futuro-e, Vitara, 800cc small engine model etc. Besides the company would continue to facelift and introduce CNG variants of existing models in order to bridge the gap from diesel model discontinuation. Success of existing models, combined with expanding product portfolio and acceptance of its BS-VI models has solidified its dominant market position. Suzuki’s global alliance with Toyota is likely to benefit the company Toyota Motor Corporation and Suzuki Motor Corporation (SMC) have signed an agreement regarding a capital alliance to establish and promote a long-term partnership and to promote collaboration in new fields, including autonomous driving. The companies would engage in joint product development and collaboration in production, in addition to promoting the mutual supply of products, by bringing together Toyota’s strength in electrification technologies and Suzuki’s strength in technologies for small vehicles. The Toyota and Suzuki partnership has already seen the launch of the Toyota Glanza, which is essentially a rebadged Maruti Suzuki Baleno. The alliance will also see Maruti Suzuki supplying the Vitara Brezza, the Ciaz and the Ertiga to Toyota. The two Japanese carmakers will also make a big push for hybrid electric vehicles in the country with Toyota supplying its hybrid systems to Suzuki. Additionally, they will cooperate to develop a new Toyota C-segment MPV that will be supplied to Suzuki as well. Both companies are also exploring ways to expand their partnership in India beyond vehicle development to include joint sourcing of components as part of a strategy to cut costs, especially for their full hybrid offerings. Low penetration to aid long term growth Vehicle penetration in India stands at around 25-28 four-wheelers per 1000 people as per various estimates. Historically, vehicle sales in some of the key global markets have shown an inflexion point at a similar level of penetration. In countries such as South Korea, Japan and China, CAGR of car sales were in excess of 20% over the next 5 years once this level of penetration was achieved. This was supported by strong growth in GDP per capita. Barring the slowdown in last couple of years, India has been witnessing strong GDP growth driven by factors like increasing disposable incomes in the rural agriculture sector, presence of a large pool of skilled and semiskilled workers, and a strong educational system.
Maruti Suzuki Ltd.
6
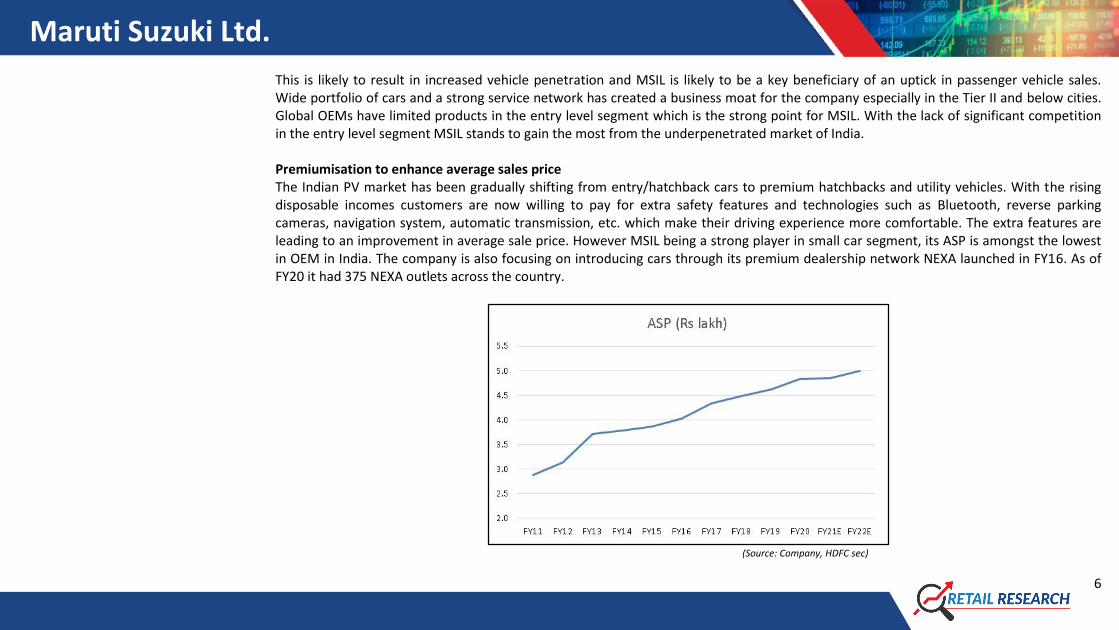
This is likely to result in increased vehicle penetration and MSIL is likely to be a key beneficiary of an uptick in passenger vehicle sales. Wide portfolio of cars and a strong service network has created a business moat for the company especially in the Tier II and below cities. Global OEMs have limited products in the entry level segment which is the strong point for MSIL. With the lack of significant competition in the entry level segment MSIL stands to gain the most from the underpenetrated market of India. Premiumisation to enhance average sales price The Indian PV market has been gradually shifting from entry/hatchback cars to premium hatchbacks and utility vehicles. With the rising disposable incomes customers are now willing to pay for extra safety features and technologies such as Bluetooth, reverse parking cameras, navigation system, automatic transmission, etc. which make their driving experience more comfortable. The extra features are leading to an improvement in average sale price. However MSIL being a strong player in small car segment, its ASP is amongst the lowest in OEM in India. The company is also focusing on introducing cars through its premium dealership network NEXA launched in FY16. As of FY20 it had 375 NEXA outlets across the country.
(Source: Company, HDFC sec)
Maruti Suzuki Ltd.
7
Strong support from parent MSIL receives valuable technological support from its parent SMC in rolling out new models, introducing new features and upgrading to new regulations. The company introduced two new models in FY20 - XL6 and S-Presso – and facelifted 6 models. The company has transitioned its entire portfolio into BS-VI compliant models far ahead of the competition. MSIL also sources vehicles from SMC’s wholly owned subsidiary Suzuki Motor Gujarat (SMG) under a contract manufacturing arrangement wherein the vehicles are sold to MSIL at cost. SMG currently has capacity to manufacture 5 lakh units and is looking to expand to 7.5 lakh units in FY21. The contract manufacturing arrangement has freed MSIL from expanding its own capacity and it can concentrate on marketing efforts. This would enable the company to improve its margins, return ratios and generate higher free cash flows. Resilient financial profile MSIL has maintained its strong financial risk profile with a net worth in excess of Rs 50,000cr and liquidity of over Rs 40,000cr as of FY20. The company has a strong cash generating ability and negligible debt levels. With the contract manufacturing arrangement with SMG, its cash flows can fund the capital expenditure and working capital needs. Financial flexibility is further enhanced by largely unutilised bank lines of Rs 3000cr. Due to the strong liquidity, MSIL is able to provide financial support to its dealer and vendors to tide over the challenging business environment. Reduction in GST on small cars could boost demand Recently industry has demanded and the Govt is favourably considering a cut in GST rates on small cars from 28%. However looking at the current fiscal situation it seems unlikely to happen soon. However as and when this happens, it would result in lower cost of ownership and higher demand. What could go wrong
Car buying is a discretionary purchase and affordability and sentiments are likely to play key roles in the near term for car sales due to the Covid-19 pandemic.
Raw material prices constitute ~65-70% of the selling price. Although commodity prices are at low levels currently due to lack of demand, a spike in prices of key raw materials like steel and aluminium can hurt margins.
Maruti Suzuki Ltd.
8
Indian PV segment is expected to witness strong growth. The number of players in this segment increased to 19 in fiscal 2020 from 7 in fiscal 2008. With more players and models vying for a share of the growing pie, competition in the domestic PV market will intensify.
We expect sales volume to decline by ~15% in FY21 and bounce back by ~13% in FY22. However a prolonged impact of Covid-19 could result in deeper slowdown or a slower pullback which might result in lower volumes.
MSIL is exposed to risks related to fluctuations in forex rates because of its large import, royalty payments, and exports. Direct and indirect raw material imports constituted around 15% of net sales. Besides, MSIL pays a part of its royalty in yen. Royalty on MSIL plus SMG models put together is ~5.4% of net sales.
If availability or cost of finance is impacted due to liquidity or other issues at NBFCs, then sales growth of all automobile companies (including MSIL) could get impacted.
Rapid adoption of EV in India could create challenge for MSIL in terms of demand for its ICE vehicles coming down and at the same time if it is not ready to participate in the EV market with reasonable priced cars, then its overall revenues and margins could get impacted.
Continued rise in petrol prices (despite crude oil price softening globally) could hurt demand for cars by first time users.
EBITDA margins for MSIL are on the downtrend over the last three years. This has to be reversed soon to avoid invetors from giving lower valuations.
Despite presence in the segment for many years, its share in UVs has been poor. Also post phasing out of diesel vehicles, it needs to replace sales of diesel vehicles by other vehicles. Also Its premium dealership channel Nexa is overly dependent on Baleno sales.
About the company Maruti Suzuki India Limited (MSIL), a subsidiary of Suzuki Motor Corporation (SMC), Japan, is India’s largest passenger car maker. It is credited with having ushered in the automobile revolution in the country. MSIL is engaged in the business of manufacturing and sale of passenger vehicles in India. Making a small beginning with the iconic Maruti 800 car, MSIL today has a vast portfolio of 16 car models with over 150 variants. The product range extends from entry level small cars like Alto 800, Alto K10 to the luxury sedan Ciaz. Other activities include facilitation of pre-owned car sales, fleet management, car financing.
Maruti Suzuki Ltd.
9
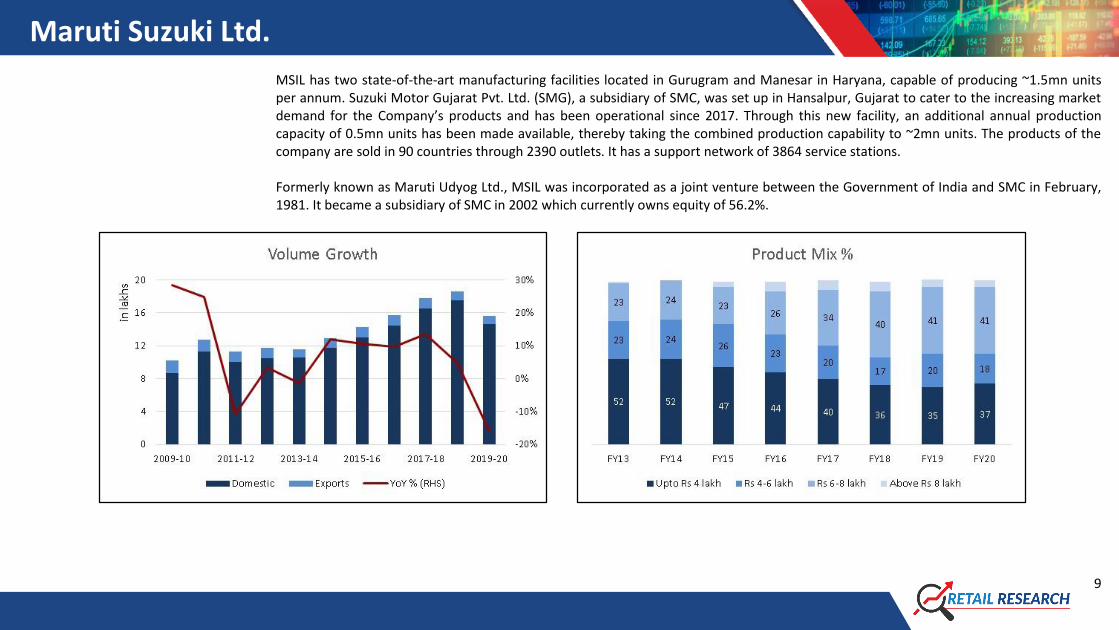
MSIL has two state-of-the-art manufacturing facilities located in Gurugram and Manesar in Haryana, capable of producing ~1.5mn units per annum. Suzuki Motor Gujarat Pvt. Ltd. (SMG), a subsidiary of SMC, was set up in Hansalpur, Gujarat to cater to the increasing market demand for the Company’s products and has been operational since 2017. Through this new facility, an additional annual production capacity of 0.5mn units has been made available, thereby taking the combined production capability to ~2mn units. The products of the company are sold in 90 countries through 2390 outlets. It has a support network of 3864 service stations. Formerly known as Maruti Udyog Ltd., MSIL was incorporated as a joint venture between the Government of India and SMC in February, 1981. It became a subsidiary of SMC in 2002 which currently owns equity of 56.2%.
Maruti Suzuki Ltd.
10
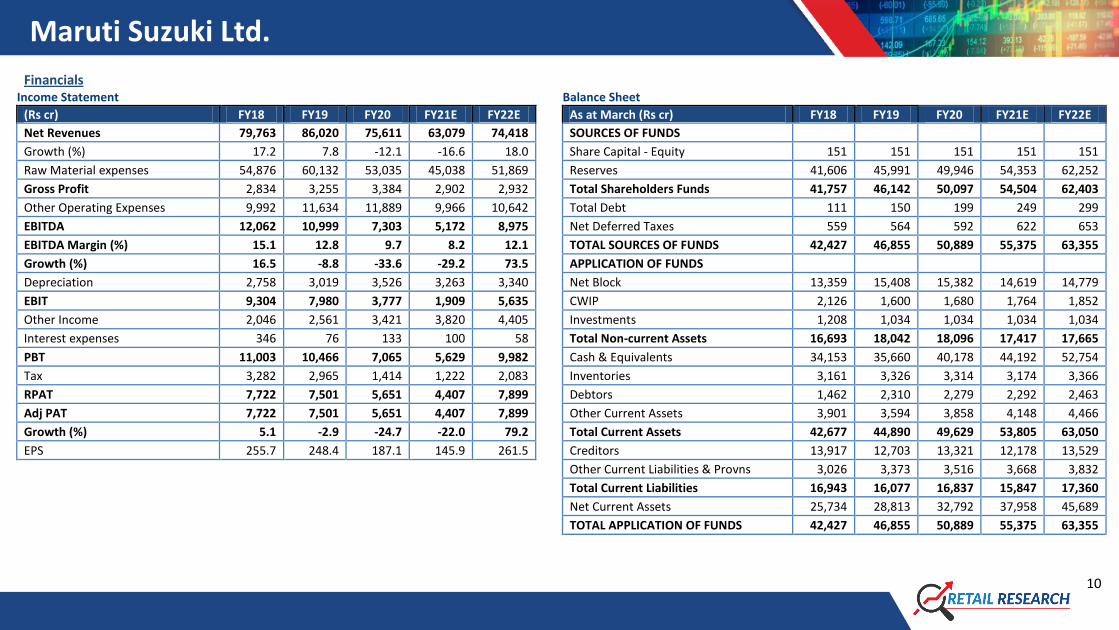
Financials Income Statement
Balance Sheet (Rs cr) FY18 FY19 FY20 FY21E FY22E
As at March (Rs cr) FY18 FY19 FY20 FY21E FY22E
Net Revenues 79,763 86,020 75,611 63,079 74,418
SOURCES OF FUNDS
Growth (%) 17.2 7.8 -12.1 -16.6 18.0
Share Capital - Equity 151 151 151 151 151
Raw Material expenses 54,876 60,132 53,035 45,038 51,869
Reserves 41,606 45,991 49,946 54,353 62,252
Gross Profit 2,834 3,255 3,384 2,902 2,932
Total Shareholders Funds 41,757 46,142 50,097 54,504 62,403
Other Operating Expenses 9,992 11,634 11,889 9,966 10,642
Total Debt 111 150 199 249 299
EBITDA 12,062 10,999 7,303 5,172 8,975
Net Deferred Taxes 559 564 592 622 653
EBITDA Margin (%) 15.1 12.8 9.7 8.2 12.1
TOTAL SOURCES OF FUNDS 42,427 46,855 50,889 55,375 63,355
Growth (%) 16.5 -8.8 -33.6 -29.2 73.5
APPLICATION OF FUNDS
Depreciation 2,758 3,019 3,526 3,263 3,340
Net Block 13,359 15,408 15,382 14,619 14,779
EBIT 9,304 7,980 3,777 1,909 5,635
CWIP 2,126 1,600 1,680 1,764 1,852
Other Income 2,046 2,561 3,421 3,820 4,405
Investments 1,208 1,034 1,034 1,034 1,034
Interest expenses 346 76 133 100 58
Total Non-current Assets 16,693 18,042 18,096 17,417 17,665
PBT 11,003 10,466 7,065 5,629 9,982
Cash & Equivalents 34,153 35,660 40,178 44,192 52,754
Tax 3,282 2,965 1,414 1,222 2,083 Inventories 3,161 3,326 3,314 3,174 3,366
RPAT 7,722 7,501 5,651 4,407 7,899
Debtors 1,462 2,310 2,279 2,292 2,463
Adj PAT 7,722 7,501 5,651 4,407 7,899
Other Current Assets 3,901 3,594 3,858 4,148 4,466
Growth (%) 5.1 -2.9 -24.7 -22.0 79.2 Total Current Assets 42,677 44,890 49,629 53,805 63,050
EPS 255.7 248.4 187.1 145.9 261.5 Creditors 13,917 12,703 13,321 12,178 13,529
Other Current Liabilities & Provns 3,026 3,373 3,516 3,668 3,832
Total Current Liabilities 16,943 16,077 16,837 15,847 17,360
Net Current Assets 25,734 28,813 32,792 37,958 45,689
TOTAL APPLICATION OF FUNDS 42,427 46,855 50,889 55,375 63,355
Maruti Suzuki Ltd.
11
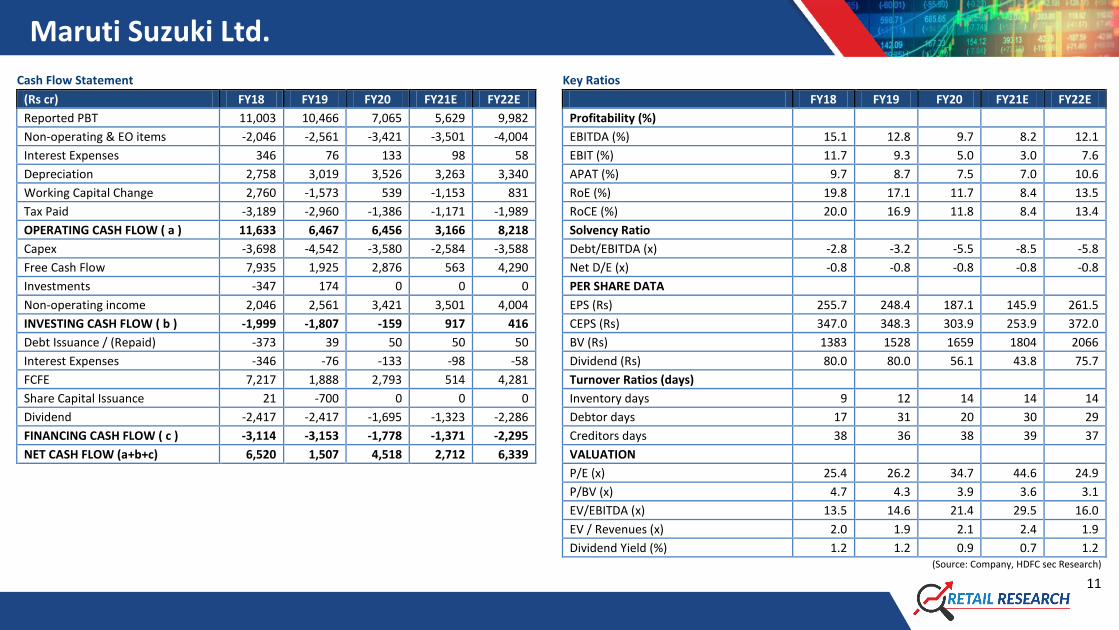
Cash Flow Statement
Key Ratios
(Rs cr) FY18 FY19 FY20 FY21E FY22E
FY18 FY19 FY20 FY21E FY22E
Reported PBT 11,003 10,466 7,065 5,629 9,982 Profitability (%)
Non-operating & EO items -2,046 -2,561 -3,421 -3,501 -4,004
EBITDA (%) 15.1 12.8 9.7 8.2 12.1
Interest Expenses 346 76 133 98 58
EBIT (%) 11.7 9.3 5.0 3.0 7.6
Depreciation 2,758 3,019 3,526 3,263 3,340
APAT (%) 9.7 8.7 7.5 7.0 10.6
Working Capital Change 2,760 -1,573 539 -1,153 831
RoE (%) 19.8 17.1 11.7 8.4 13.5
Tax Paid -3,189 -2,960 -1,386 -1,171 -1,989
RoCE (%) 20.0 16.9 11.8 8.4 13.4
OPERATING CASH FLOW ( a ) 11,633 6,467 6,456 3,166 8,218
Solvency Ratio
Capex -3,698 -4,542 -3,580 -2,584 -3,588
Debt/EBITDA (x) -2.8 -3.2 -5.5 -8.5 -5.8
Free Cash Flow 7,935 1,925 2,876 563 4,290
Net D/E (x) -0.8 -0.8 -0.8 -0.8 -0.8
Investments -347 174 0 0 0
PER SHARE DATA
Non-operating income 2,046 2,561 3,421 3,501 4,004
EPS (Rs) 255.7 248.4 187.1 145.9 261.5
INVESTING CASH FLOW ( b ) -1,999 -1,807 -159 917 416
CEPS (Rs) 347.0 348.3 303.9 253.9 372.0
Debt Issuance / (Repaid) -373 39 50 50 50
BV (Rs) 1383 1528 1659 1804 2066
Interest Expenses -346 -76 -133 -98 -58
Dividend (Rs) 80.0 80.0 56.1 43.8 75.7
FCFE 7,217 1,888 2,793 514 4,281
Turnover Ratios (days)
Share Capital Issuance 21 -700 0 0 0
Inventory days 9 12 14 14 14
Dividend -2,417 -2,417 -1,695 -1,323 -2,286
Debtor days 17 31 20 30 29
FINANCING CASH FLOW ( c ) -3,114 -3,153 -1,778 -1,371 -2,295
Creditors days 38 36 38 39 37
NET CASH FLOW (a+b+c) 6,520 1,507 4,518 2,712 6,339
VALUATION
P/E (x) 25.4 26.2 34.7 44.6 24.9
P/BV (x) 4.7 4.3 3.9 3.6 3.1
EV/EBITDA (x) 13.5 14.6 21.4 29.5 16.0
EV / Revenues (x) 2.0 1.9 2.1 2.4 1.9
Dividend Yield (%) 1.2 1.2 0.9 0.7 1.2 (Source: Company, HDFC sec Research)
Maruti Suzuki Ltd.
12
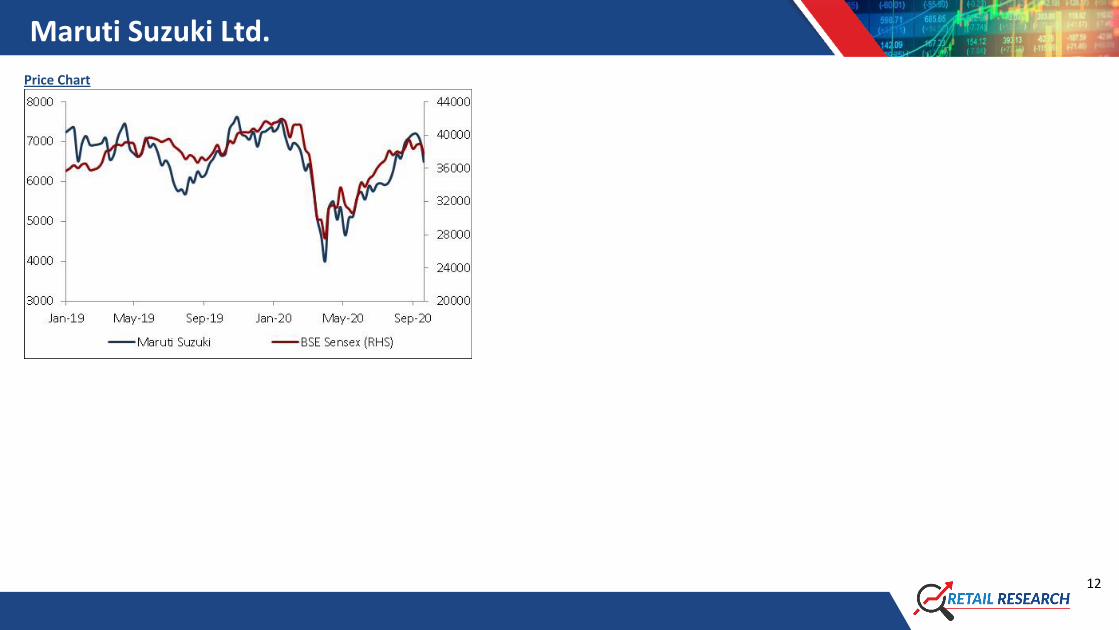
Price Chart
Maruti Suzuki Ltd.
13
Disclosure:
I, Atul Karwa, MMS, author and the names subscribed to this report, hereby certify that all of the views expressed in this research report accurately reflect our views about the subject issuer(s) or securities. HSL has no material adverse disciplinary history as on the date of publication of this report. We also
certify that no part of our compensation was, is, or will be directly or indirectly related to the specific recommendation(s) or view(s) in this report.
Research Analyst or his/her relative or HDFC Securities Ltd. does not have any financial interest in the subject company. Also Research Analyst or his relative or HDFC Securities Ltd. or its Associate does not have beneficial ownership of 1% or more in the subject company at the end of the month immediately
preceding the date of publication of the Research Report. Further Research Analyst or his relative or HDFC Securities Ltd. or its associate does not have any material conflict of interest.
Any holding in stock –No
HDFC Securities Limited (HSL) is a SEBI Registered Research Analyst having registration no. INH000002475.
Disclaimer:
This report has been prepared by HDFC Securities Ltd and is solely for information of the recipient only. The report must not be used as a singular basis of any investment decision. The views herein are of a general nature and do not consider the risk appetite or the particular circumstances of an individual
investor; readers are requested to take professional advice before investing. Nothing in this document should be construed as investment advice. Each recipient of this document should make such investigations as they deem necessary to arrive at an independent evaluation of an investment in securities of
the companies referred to in this document (including merits and risks) and should consult their own advisors to determine merits and risks of such investment. The information and opinions contained herein have been compiled or arrived at, based upon information obtained in good faith from sources
believed to be reliable. Such information has not been independently verified and no guaranty, representation of warranty, express or implied, is made as to its accuracy, completeness or correctness. All such information and opinions are subject to change without notice. Descriptions of any company or
companies or their securities mentioned herein are not intended to be complete. HSL is not obliged to update this report for such changes. HSL has the right to make changes and modifications at any time.
This report is not directed to, or intended for display, downloading, printing, reproducing or for distribution to or use by, any person or entity who is a citizen or resident or located in any locality, state, country or other jurisdiction where such distribution, publication, reproduction, availability or use would be
contrary to law or regulation or what would subject HSL or its affiliates to any registration or licensing requirement within such jurisdiction. If this report is inadvertently sent or has reached any person in such country, especially, United States of America, the same should be ignored and brought to the
attention of the sender. This document may not be reproduced, distributed or published in whole or in part, directly or indirectly, for any purposes or in any manner.
Foreign currencies denominated securities, wherever mentioned, are subject to exchange rate fluctuations, which could have an adverse effect on their value or price, or the income derived from them. In addition, investors in securities such as ADRs, the values of which are influenced by foreign currencies
effectively assume currency risk. It should not be considered to be taken as an offer to sell or a solicitation to buy any security.
This document is not, and should not, be construed as an offer or solicitation of an offer, to buy or sell any securities or other financial instruments. This report should not be construed as an invitation or solicitation to do business with HSL. HSL may from time to time solicit from, or perform broking, or other
services for, any company mentioned in this mail and/or its attachments.
HSL and its affiliated company(ies), their directors and employees may; (a) from time to time, have a long or short position in, and buy or sell the securities of the company(ies) mentioned herein or (b) be engaged in any other transaction involving such securities and earn brokerage or other compensation or
act as a market maker in the financial instruments of the company(ies) discussed herein or act as an advisor or lender/borrower to such company(ies) or may have any other potential conflict of interests with respect to any recommendation and other related information and opinions.
HSL, its directors, analysts or employees do not take any responsibility, financial or otherwise, of the losses or the damages sustained due to the investments made or any action taken on basis of this report, including but not restricted to, fluctuation in the prices of shares and bonds, changes in the currency
rates, diminution in the NAVs, reduction in the dividend or income, etc.
HSL and other group companies, its directors, associates, employees may have various positions in any of the stocks, securities and financial instruments dealt in the report, or may make sell or purchase or other deals in these securities from time to time or may deal in other securities of the companies /
organizations described in this report.
HSL or its associates might have managed or co-managed public offering of securities for the subject company or might have been mandated by the subject company for any other assignment in the past twelve months.
HSL or its associates might have received any compensation from the companies mentioned in the report during the period preceding twelve months from t date of this report for services in respect of managing or co-managing public offerings, corporate finance, investment banking or merchant banking,
brokerage services or other advisory service in a merger or specific transaction in the normal course of business.
HSL or its analysts did not receive any compensation or other benefits from the companies mentioned in the report or third party in connection with preparation of the research report. Accordingly, neither HSL nor Research Analysts have any material conflict of interest at the time of publication of this
report. Compensation of our Research Analysts is not based on any specific merchant banking, investment banking or brokerage service transactions. HSL may have issued other reports that are inconsistent with and reach different conclusion from the information presented in this report.
Research entity has not been engaged in market making activity for the subject company. Research analyst has not served as an officer, director or employee of the subject company. We have not received any compensation/benefits from the subject company or third party in connection with the Research
Report.
HDFC securities Limited, I Think Techno Campus, Building - B, "Alpha", Office Floor 8, Near Kanjurmarg Station, Opp. Crompton Greaves, Kanjurmarg (East), Mumbai 400 042 Phone: (022) 3075 3400 Fax: (022) 2496 5066 Compliance Officer: Binkle R. Oza Email: [email protected] Phone:
(022) 3045 3600
SEBI Registration No.: INZ000186937 (NSE, BSE, MSEI, MCX) |NSE Trading Member Code: 11094 | BSE Clearing Number: 393 | MSEI Trading Member Code: 30000 | MCX Member Code: 56015 | IN-DP-372-2018 (CDSL, NSDL) | CDSL DP ID: 12086700 | NSDL DP ID: IN304279 | AMFI Reg No.
ARN -13549 | PFRDA Reg. No - POP 11092018 | IRDA Corporate Agent Licence No.CA0062 | Research Analyst Reg. No. INH000002475 | Investment Adviser: INA000011538 | CIN-U67120MH2000PLC15219


