Embed Size (px)
Citation preview
1
Sep 03, 2015VIP Industries LtdConsumer Discretionary - Apparel, Footwear & Acc Design Sep 03, 2015
VIP Industries LtdIndia Research - Stock Broking BUYBloomberg Code: VIP IN
Recommendation (Rs.)
CMP (as on Sep 02, 2015) 77Target Price 92Upside (%) 20
Stock InformationMkt Cap (Rs.mn/US$ mn) 11029 / 17052-wk High/Low (Rs.) 130 / 763M Avg. daily volume (mn) 0.4Beta (x) 1.2Sensex/Nifty 25454 / 7717O/S Shares(mn) 141.3Face Value (Rs.) 2.0
Shareholding Pattern (%) Promoters 52.4FIIs 11.6DIIs 3.0Others 33.0
Stock Performance (%) 1M 3M 6M 12M
Absolute (17) (18) (22) (18)Relative to Sensex (11) (13) (13) (17)Source: Bloomberg
Relative Performance*
Source: Bloomberg; *Index 100
Analyst ContactUday Kiran Y040 - 3321 [email protected]
Happy Journey in VIP StyleCaprese, Skybags and Carlton to boost revenuesThe company derives 20%-25% of revenues from Skybags which are growing at 40% YoY. Carlton and Caprese contribute Rs.500 Mn each to the revenues of the company, which are growing at 50% YoY. The company is spending huge amount (5% to 7% of revenues) on advertising which can translate into revenues in the coming years.Caprese to contribute to revenues of Rs.1000 Mn by FY17EVIP is targeting to achieve Rs.1000 Mn of revenues by FY17E from Caprese, a ladies hand bag which currently contributes Rs.500 Mn to revenues. The company has brought on board brand ambassador for Caprese, actress Alia Bhatt to strengthen the brand. Flight from China to BangladeshTo reduce dependency on China, the company has taken a strategic decision to setup a soft luggage manufacturing facility in Bangladesh. Bangladesh manufacturing unit is a wholly owned subsidiary of the company which was started about one and half year ago, which is currently operating at 70% utilization and is likely to operate at 85% utilization by next year.VIP well positioned to benefit from discretionary spendingThe discretionary spending is likely to pick up on the back of expected strong economic recovery. VIP could be one of the beneficiaries of discretionary spending.
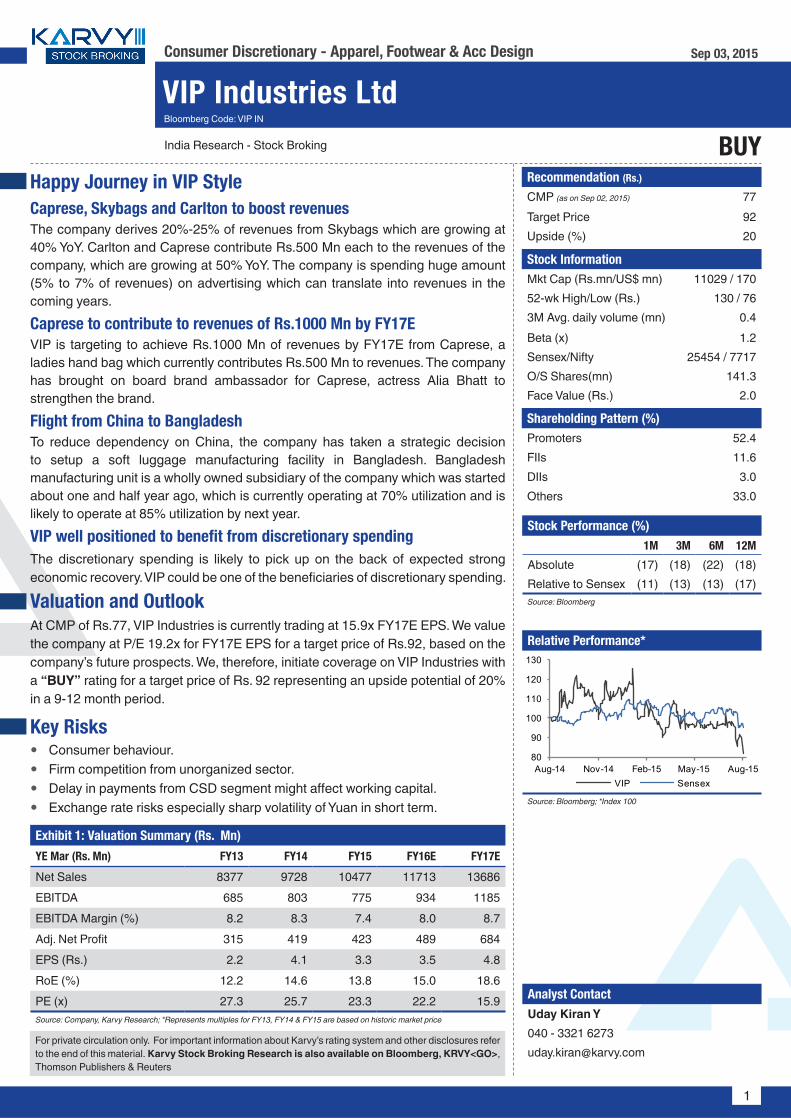
Valuation and Outlook At CMP of Rs.77, VIP Industries is currently trading at 15.9x FY17E EPS. We value the company at P/E 19.2x for FY17E EPS for a target price of Rs.92, based on the company’s future prospects. We, therefore, initiate coverage on VIP Industries with a “BUY” rating for a target price of Rs. 92 representing an upside potential of 20% in a 9-12 month period.
Key Risksyy Consumer behaviour.yy Firm competition from unorganized sector.yy Delay in payments from CSD segment might affect working capital.yy Exchange rate risks especially sharp volatility of Yuan in short term.
For private circulation only. For important information about Karvy’s rating system and other disclosures refer to the end of this material. Karvy Stock Broking Research is also available on Bloomberg, KRVY<GO>, Thomson Publishers & Reuters
Exhibit 1: Valuation Summary (Rs. Mn)
YE Mar (Rs. Mn) FY13 FY14 FY15 FY16E FY17E
Net Sales 8377 9728 10477 11713 13686EBITDA 685 803 775 934 1185EBITDA Margin (%) 8.2 8.3 7.4 8.0 8.7Adj. Net Profit 315 419 423 489 684EPS (Rs.) 2.2 4.1 3.3 3.5 4.8RoE (%) 12.2 14.6 13.8 15.0 18.6PE (x) 27.3 25.7 23.3 22.2 15.9Source: Company, Karvy Research; *Represents multiples for FY13, FY14 & FY15 are based on historic market price
80
90
100
110
120
130
Aug-14 Nov-14 Feb-15 May-15 Aug-15VIP Sensex
2
Sep 03, 2015VIP Industries Ltd
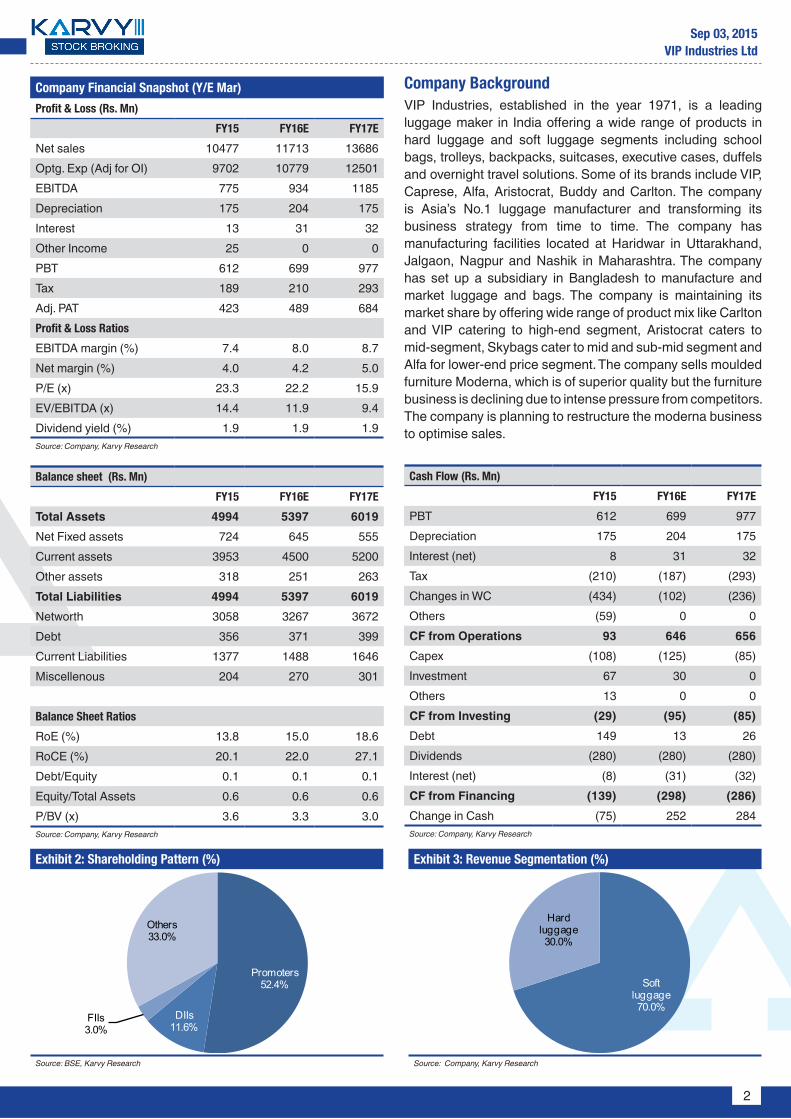
Company BackgroundVIP Industries, established in the year 1971, is a leading luggage maker in India offering a wide range of products in hard luggage and soft luggage segments including school bags, trolleys, backpacks, suitcases, executive cases, duffels and overnight travel solutions. Some of its brands include VIP, Caprese, Alfa, Aristocrat, Buddy and Carlton. The company is Asia’s No.1 luggage manufacturer and transforming its business strategy from time to time. The company has manufacturing facilities located at Haridwar in Uttarakhand, Jalgaon, Nagpur and Nashik in Maharashtra. The company has set up a subsidiary in Bangladesh to manufacture and market luggage and bags. The company is maintaining its market share by offering wide range of product mix like Carlton and VIP catering to high-end segment, Aristocrat caters to mid-segment, Skybags cater to mid and sub-mid segment and Alfa for lower-end price segment. The company sells moulded furniture Moderna, which is of superior quality but the furniture business is declining due to intense pressure from competitors. The company is planning to restructure the moderna business to optimise sales.
Exhibit 2: Shareholding Pattern (%)
Source: BSE, Karvy Research
Exhibit 3: Revenue Segmentation (%)
Source: Company, Karvy Research
Balance sheet (Rs. Mn)
FY15 FY16E FY17E
Total Assets 4994 5397 6019Net Fixed assets 724 645 555Current assets 3953 4500 5200Other assets 318 251 263Total Liabilities 4994 5397 6019Networth 3058 3267 3672Debt 356 371 399Current Liabilities 1377 1488 1646Miscellenous 204 270 301
Balance Sheet Ratios
RoE (%) 13.8 15.0 18.6RoCE (%) 20.1 22.0 27.1Debt/Equity 0.1 0.1 0.1Equity/Total Assets 0.6 0.6 0.6P/BV (x) 3.6 3.3 3.0Source: Company, Karvy Research
Cash Flow (Rs. Mn)
FY15 FY16E FY17E
PBT 612 699 977 Depreciation 175 204 175 Interest (net) 8 31 32 Tax (210) (187) (293)Changes in WC (434) (102) (236)Others (59) 0 0 CF from Operations 93 646 656 Capex (108) (125) (85)Investment 67 30 0 Others 13 0 0 CF from Investing (29) (95) (85)Debt 149 13 26 Dividends (280) (280) (280)Interest (net) (8) (31) (32)CF from Financing (139) (298) (286)Change in Cash (75) 252 284 Source: Company, Karvy Research
Company Financial Snapshot (Y/E Mar)
Profit & Loss (Rs. Mn)
FY15 FY16E FY17E
Net sales 10477 11713 13686Optg. Exp (Adj for OI) 9702 10779 12501EBITDA 775 934 1185Depreciation 175 204 175Interest 13 31 32Other Income 25 0 0PBT 612 699 977Tax 189 210 293Adj. PAT 423 489 684Profit & Loss Ratios
EBITDA margin (%) 7.4 8.0 8.7Net margin (%) 4.0 4.2 5.0P/E (x) 23.3 22.2 15.9EV/EBITDA (x) 14.4 11.9 9.4Dividend yield (%) 1.9 1.9 1.9Source: Company, Karvy Research
Promoters52.4%
DIIs11.6%
FIIs3.0%
Others33.0%
Soft luggage70.0%
Hard luggage30.0%
3
Sep 03, 2015VIP Industries Ltd
Exhibit 4: GDP Estimates (%)
Source: ADB, IMF, World Bank Estimates, Karvy Research
Exhibit 5: Revenue Break-up in India & Abroad
Source: Company, Karvy Research
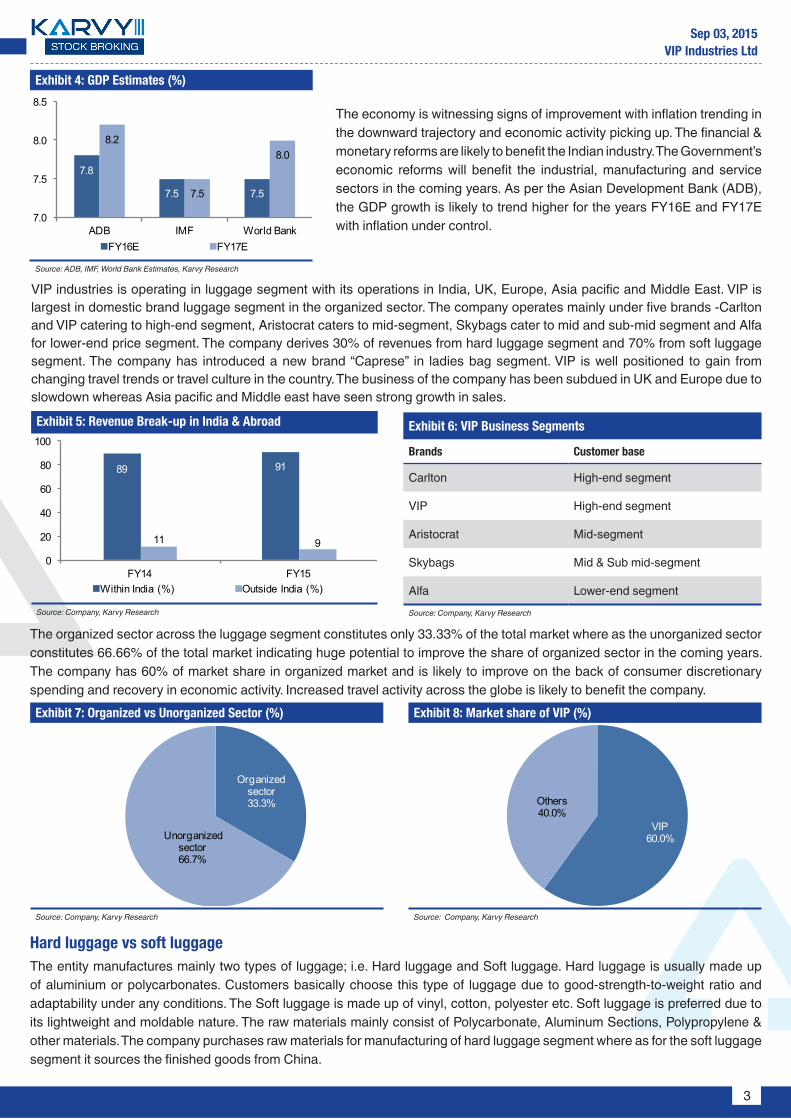
The economy is witnessing signs of improvement with inflation trending in the downward trajectory and economic activity picking up. The financial & monetary reforms are likely to benefit the Indian industry. The Government’s economic reforms will benefit the industrial, manufacturing and service sectors in the coming years. As per the Asian Development Bank (ADB), the GDP growth is likely to trend higher for the years FY16E and FY17E with inflation under control.
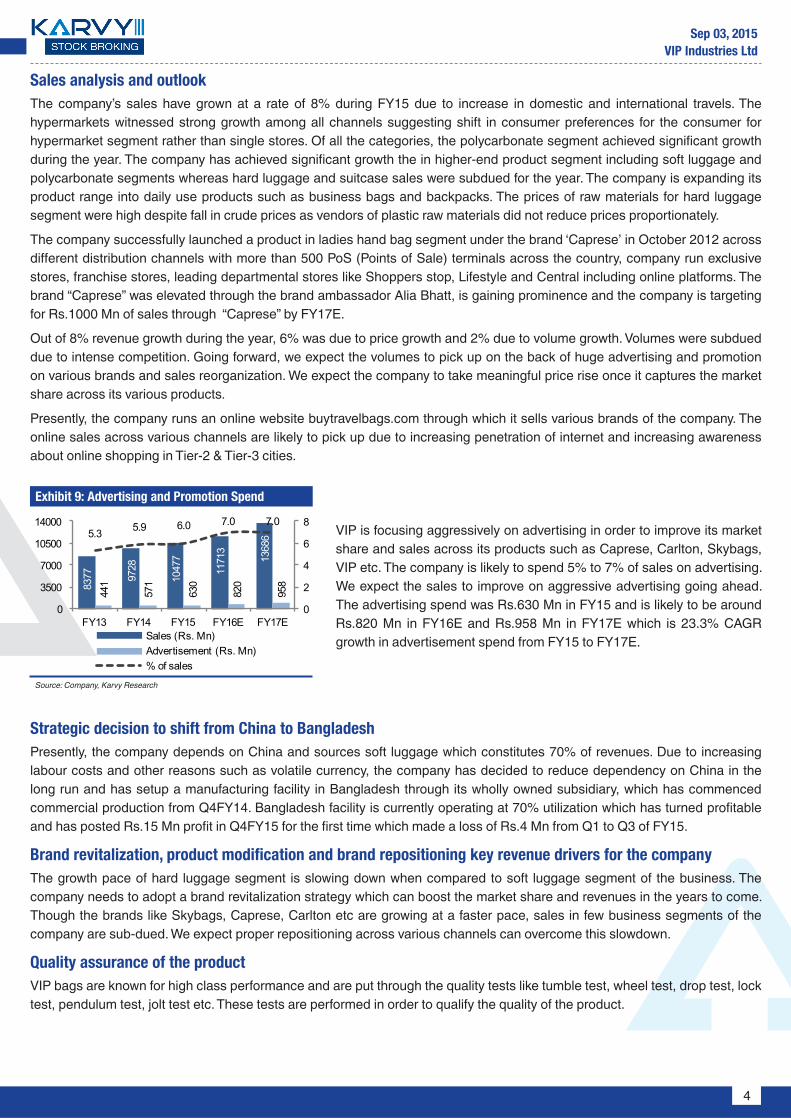
VIP industries is operating in luggage segment with its operations in India, UK, Europe, Asia pacific and Middle East. VIP is largest in domestic brand luggage segment in the organized sector. The company operates mainly under five brands -Carlton and VIP catering to high-end segment, Aristocrat caters to mid-segment, Skybags cater to mid and sub-mid segment and Alfa for lower-end price segment. The company derives 30% of revenues from hard luggage segment and 70% from soft luggage segment. The company has introduced a new brand “Caprese” in ladies bag segment. VIP is well positioned to gain from changing travel trends or travel culture in the country. The business of the company has been subdued in UK and Europe due to slowdown whereas Asia pacific and Middle east have seen strong growth in sales.
Hard luggage vs soft luggageThe entity manufactures mainly two types of luggage; i.e. Hard luggage and Soft luggage. Hard luggage is usually made up of aluminium or polycarbonates. Customers basically choose this type of luggage due to good-strength-to-weight ratio and adaptability under any conditions. The Soft luggage is made up of vinyl, cotton, polyester etc. Soft luggage is preferred due to its lightweight and moldable nature. The raw materials mainly consist of Polycarbonate, Aluminum Sections, Polypropylene & other materials. The company purchases raw materials for manufacturing of hard luggage segment where as for the soft luggage segment it sources the finished goods from China.
The organized sector across the luggage segment constitutes only 33.33% of the total market where as the unorganized sector constitutes 66.66% of the total market indicating huge potential to improve the share of organized sector in the coming years. The company has 60% of market share in organized market and is likely to improve on the back of consumer discretionary spending and recovery in economic activity. Increased travel activity across the globe is likely to benefit the company.Exhibit 7: Organized vs Unorganized Sector (%)
Source: Company, Karvy Research
Exhibit 8: Market share of VIP (%)
Source: Company, Karvy Research
Organized sector33.3%
Unorganized sector66.7%
VIP60.0%
Others40.0%
7.8
7.5 7.5
8.2
7.5
8.0
7.0
7.5
8.0
8.5
ADB IMF World BankFY16E FY17E
Exhibit 6: VIP Business Segments
Brands Customer base
Carlton High-end segment
VIP High-end segment
Aristocrat Mid-segment
Skybags Mid & Sub mid-segment
Alfa Lower-end segmentSource: Company, Karvy Research
89 91
11 90
20
40
60
80
100
FY14 FY15Within India (%) Outside India (%)
4
Sep 03, 2015VIP Industries Ltd
Sales analysis and outlookThe company’s sales have grown at a rate of 8% during FY15 due to increase in domestic and international travels. The hypermarkets witnessed strong growth among all channels suggesting shift in consumer preferences for the consumer for hypermarket segment rather than single stores. Of all the categories, the polycarbonate segment achieved significant growth during the year. The company has achieved significant growth the in higher-end product segment including soft luggage and polycarbonate segments whereas hard luggage and suitcase sales were subdued for the year. The company is expanding its product range into daily use products such as business bags and backpacks. The prices of raw materials for hard luggage segment were high despite fall in crude prices as vendors of plastic raw materials did not reduce prices proportionately.
The company successfully launched a product in ladies hand bag segment under the brand ‘Caprese’ in October 2012 across different distribution channels with more than 500 PoS (Points of Sale) terminals across the country, company run exclusive stores, franchise stores, leading departmental stores like Shoppers stop, Lifestyle and Central including online platforms. The brand “Caprese” was elevated through the brand ambassador Alia Bhatt, is gaining prominence and the company is targeting for Rs.1000 Mn of sales through “Caprese” by FY17E.
Out of 8% revenue growth during the year, 6% was due to price growth and 2% due to volume growth. Volumes were subdued due to intense competition. Going forward, we expect the volumes to pick up on the back of huge advertising and promotion on various brands and sales reorganization. We expect the company to take meaningful price rise once it captures the market share across its various products.
Presently, the company runs an online website buytravelbags.com through which it sells various brands of the company. The online sales across various channels are likely to pick up due to increasing penetration of internet and increasing awareness about online shopping in Tier-2 & Tier-3 cities.
Strategic decision to shift from China to BangladeshPresently, the company depends on China and sources soft luggage which constitutes 70% of revenues. Due to increasing labour costs and other reasons such as volatile currency, the company has decided to reduce dependency on China in the long run and has setup a manufacturing facility in Bangladesh through its wholly owned subsidiary, which has commenced commercial production from Q4FY14. Bangladesh facility is currently operating at 70% utilization which has turned profitable and has posted Rs.15 Mn profit in Q4FY15 for the first time which made a loss of Rs.4 Mn from Q1 to Q3 of FY15.
Brand revitalization, product modification and brand repositioning key revenue drivers for the companyThe growth pace of hard luggage segment is slowing down when compared to soft luggage segment of the business. The company needs to adopt a brand revitalization strategy which can boost the market share and revenues in the years to come. Though the brands like Skybags, Caprese, Carlton etc are growing at a faster pace, sales in few business segments of the company are sub-dued. We expect proper repositioning across various channels can overcome this slowdown.
Quality assurance of the productVIP bags are known for high class performance and are put through the quality tests like tumble test, wheel test, drop test, lock test, pendulum test, jolt test etc. These tests are performed in order to qualify the quality of the product.
Exhibit 9: Advertising and Promotion Spend
Source: Company, Karvy Research
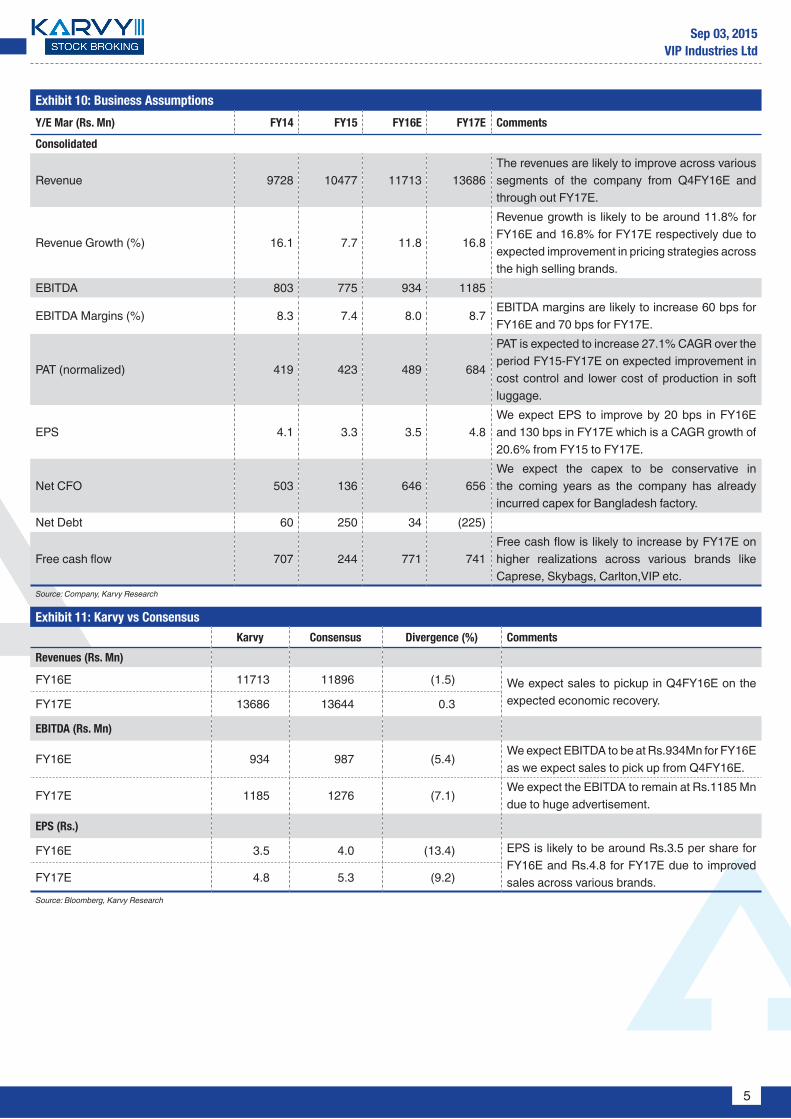
VIP is focusing aggressively on advertising in order to improve its market share and sales across its products such as Caprese, Carlton, Skybags, VIP etc. The company is likely to spend 5% to 7% of sales on advertising. We expect the sales to improve on aggressive advertising going ahead. The advertising spend was Rs.630 Mn in FY15 and is likely to be around Rs.820 Mn in FY16E and Rs.958 Mn in FY17E which is 23.3% CAGR growth in advertisement spend from FY15 to FY17E.
8377 97
28
1047
7
1171
3
1368
6
441
571
630
820
958
5.3 5.9 6.0 7.0 7.0
0
2
4
6
8
0
3500
7000
10500
14000
FY13 FY14 FY15 FY16E FY17ESales (Rs. Mn)Advertisement (Rs. Mn)% of sales
5
Sep 03, 2015VIP Industries Ltd
Exhibit 10: Business Assumptions
Y/E Mar (Rs. Mn) FY14 FY15 FY16E FY17E Comments
Consolidated
Revenue 9728 10477 11713 13686 The revenues are likely to improve across various segments of the company from Q4FY16E and through out FY17E.
Revenue Growth (%) 16.1 7.7 11.8 16.8
Revenue growth is likely to be around 11.8% for FY16E and 16.8% for FY17E respectively due to expected improvement in pricing strategies across the high selling brands.
EBITDA 803 775 934 1185
EBITDA Margins (%) 8.3 7.4 8.0 8.7 EBITDA margins are likely to increase 60 bps for FY16E and 70 bps for FY17E.
PAT (normalized) 419 423 489 684
PAT is expected to increase 27.1% CAGR over the period FY15-FY17E on expected improvement in cost control and lower cost of production in soft luggage.
EPS 4.1 3.3 3.5 4.8 We expect EPS to improve by 20 bps in FY16E and 130 bps in FY17E which is a CAGR growth of 20.6% from FY15 to FY17E.
Net CFO 503 136 646 656 We expect the capex to be conservative in the coming years as the company has already incurred capex for Bangladesh factory.
Net Debt 60 250 34 (225)
Free cash flow 707 244 771 741 Free cash flow is likely to increase by FY17E on higher realizations across various brands like Caprese, Skybags, Carlton,VIP etc.
Source: Company, Karvy Research
Exhibit 11: Karvy vs Consensus
Karvy Consensus Divergence (%) Comments
Revenues (Rs. Mn)
FY16E 11713 11896 (1.5) We expect sales to pickup in Q4FY16E on the expected economic recovery.FY17E 13686 13644 0.3
EBITDA (Rs. Mn)
FY16E 934 987 (5.4)We expect EBITDA to be at Rs.934Mn for FY16E as we expect sales to pick up from Q4FY16E.
FY17E 1185 1276 (7.1)We expect the EBITDA to remain at Rs.1185 Mn due to huge advertisement.
EPS (Rs.)
FY16E 3.5 4.0 (13.4) EPS is likely to be around Rs.3.5 per share for FY16E and Rs.4.8 for FY17E due to improved sales across various brands.FY17E 4.8 5.3 (9.2)
Source: Bloomberg, Karvy Research
6
Sep 03, 2015VIP Industries Ltd
Exhibit 12: Revenues (Rs. Mn) and Growth (%)
Source: Company, Karvy Research
Exhibit 14: Interest Coverage Ratio
Source: Company, Karvy Research
Exhibit 13: EBITDA (Rs. Mn) and EBITDA Margins (%)
Source: Company, Karvy Research
Exhibit 15: Debt - Equity Ratio
Source: Company, Karvy Research
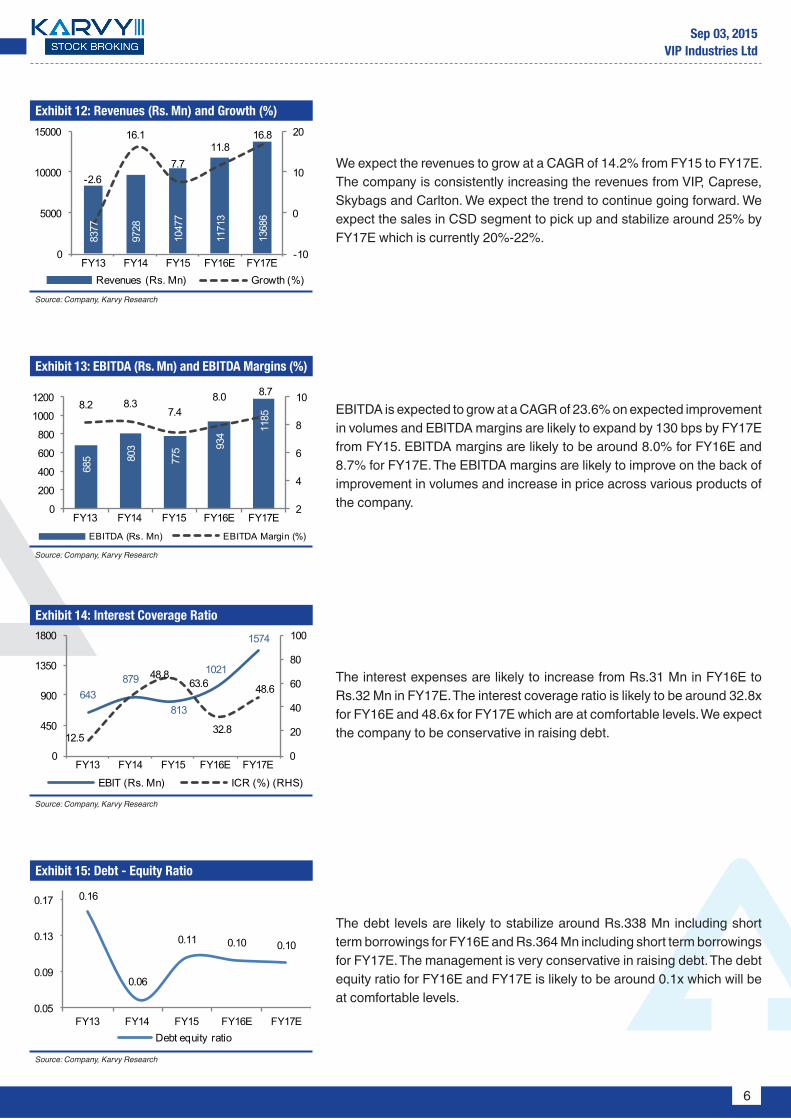
We expect the revenues to grow at a CAGR of 14.2% from FY15 to FY17E. The company is consistently increasing the revenues from VIP, Caprese, Skybags and Carlton. We expect the trend to continue going forward. We expect the sales in CSD segment to pick up and stabilize around 25% by FY17E which is currently 20%-22%.
The interest expenses are likely to increase from Rs.31 Mn in FY16E to Rs.32 Mn in FY17E. The interest coverage ratio is likely to be around 32.8x for FY16E and 48.6x for FY17E which are at comfortable levels. We expect the company to be conservative in raising debt.
EBITDA is expected to grow at a CAGR of 23.6% on expected improvement in volumes and EBITDA margins are likely to expand by 130 bps by FY17E from FY15. EBITDA margins are likely to be around 8.0% for FY16E and 8.7% for FY17E. The EBITDA margins are likely to improve on the back of improvement in volumes and increase in price across various products of the company.
The debt levels are likely to stabilize around Rs.338 Mn including short term borrowings for FY16E and Rs.364 Mn including short term borrowings for FY17E. The management is very conservative in raising debt. The debt equity ratio for FY16E and FY17E is likely to be around 0.1x which will be at comfortable levels.
8377
9728
1047
7
1171
3
1368
6
-2.6
16.1
7.711.8
16.8
-10
0
10
20
0
5000
10000
15000
FY13 FY14 FY15 FY16E FY17ERevenues (Rs. Mn) Growth (%)
643879
813
1021
1574
12.5
48.863.6
32.8
48.6
0
20
40
60
80
100
0
450
900
1350
1800
FY13 FY14 FY15 FY16E FY17E
EBIT (Rs. Mn) ICR (%) (RHS)
0.16
0.06
0.11 0.10 0.10
0.05
0.09
0.13
0.17
FY13 FY14 FY15 FY16E FY17EDebt equity ratio
685 80
3
775 93
4
1185
8.2 8.37.4
8.0 8.7
2
4
6
8
10
0
200
400
600
800
1000
1200
FY13 FY14 FY15 FY16E FY17E
EBITDA (Rs. Mn) EBITDA Margin (%)
7
Sep 03, 2015VIP Industries Ltd
Exhibit 18: Company Snapshot (Ratings)
Low High
1 2 3 4 5
Quality of Earnings 3 Domestic Sales 3 Exports 3 Net Debt/Equity 3 Working Capital Requirement 3 Quality of Management 3 Depth of Management 3 Promoter 3 Corporate Governance 3 Source: Company, Karvy Research
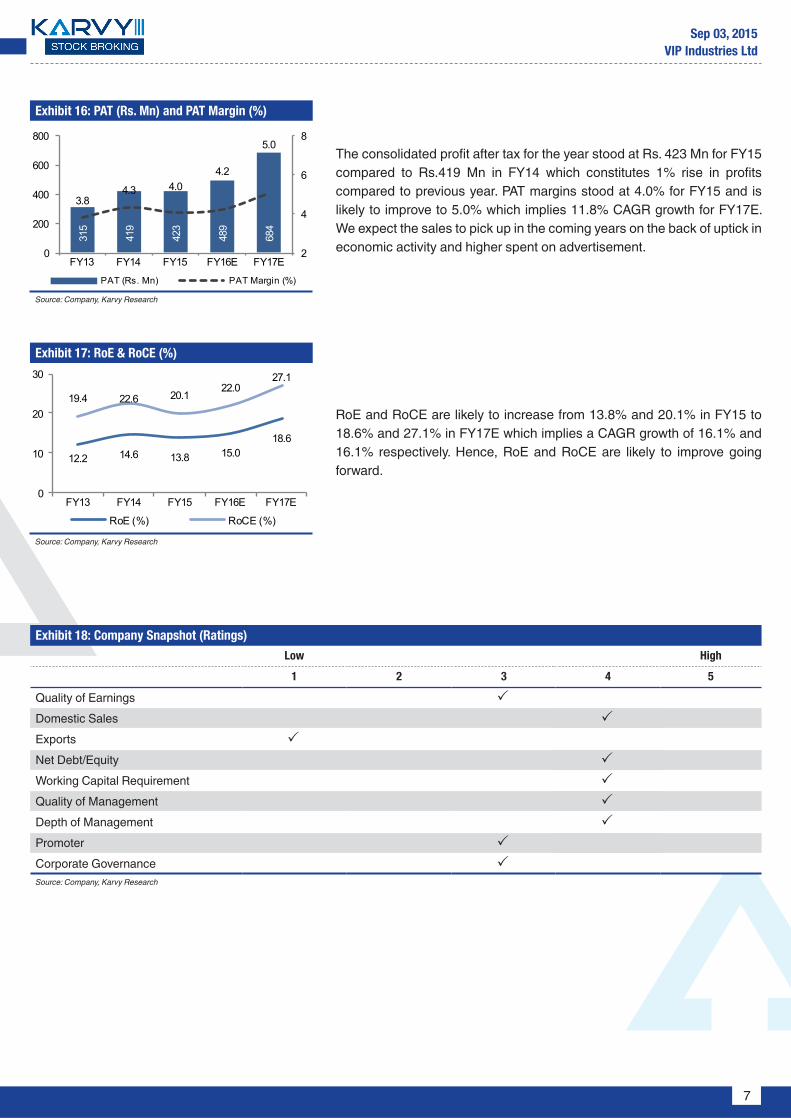
Exhibit 16: PAT (Rs. Mn) and PAT Margin (%)
Source: Company, Karvy Research
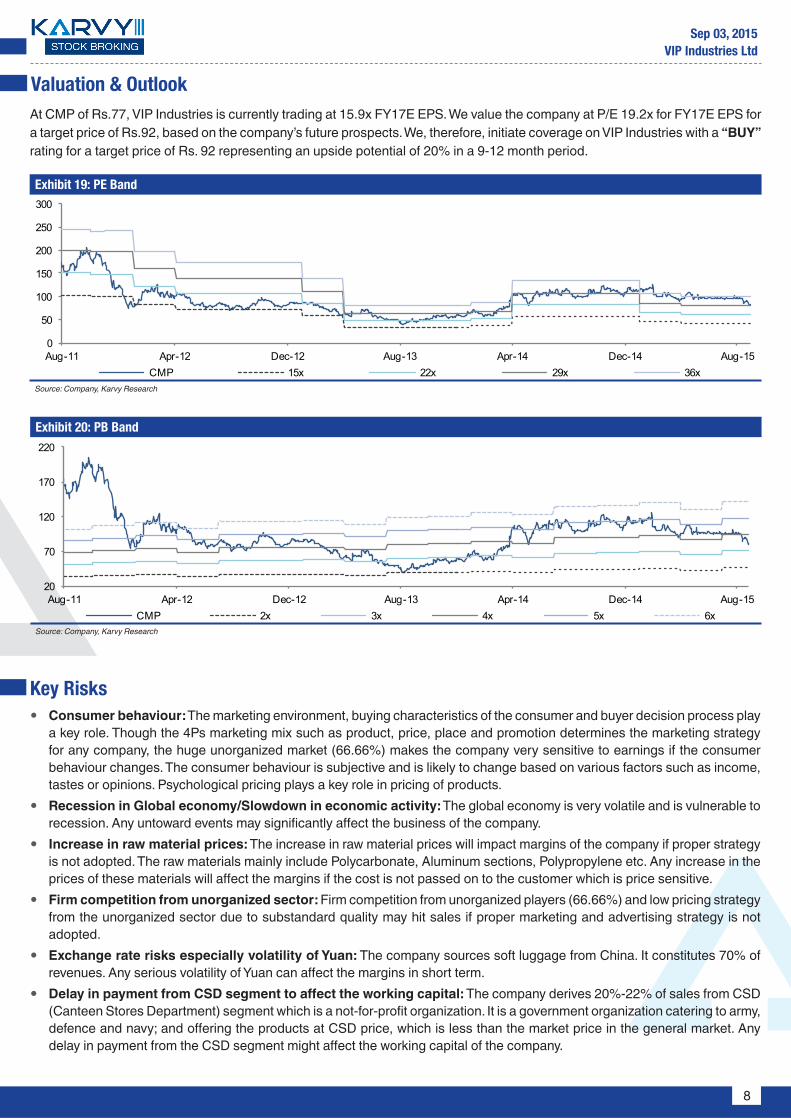
Exhibit 17: RoE & RoCE (%)
Source: Company, Karvy Research
The consolidated profit after tax for the year stood at Rs. 423 Mn for FY15 compared to Rs.419 Mn in FY14 which constitutes 1% rise in profits compared to previous year. PAT margins stood at 4.0% for FY15 and is likely to improve to 5.0% which implies 11.8% CAGR growth for FY17E. We expect the sales to pick up in the coming years on the back of uptick in economic activity and higher spent on advertisement.
RoE and RoCE are likely to increase from 13.8% and 20.1% in FY15 to 18.6% and 27.1% in FY17E which implies a CAGR growth of 16.1% and 16.1% respectively. Hence, RoE and RoCE are likely to improve going forward.
12.2 14.6 13.8 15.018.6
19.4 22.6 20.122.0
27.1
0
10
20
30
FY13 FY14 FY15 FY16E FY17E
RoE (%) RoCE (%)
315
419
423
489
684
3.84.3 4.0
4.2
5.0
2
4
6
8
0
200
400
600
800
FY13 FY14 FY15 FY16E FY17E
PAT (Rs. Mn) PAT Margin (%)
8
Sep 03, 2015VIP Industries Ltd
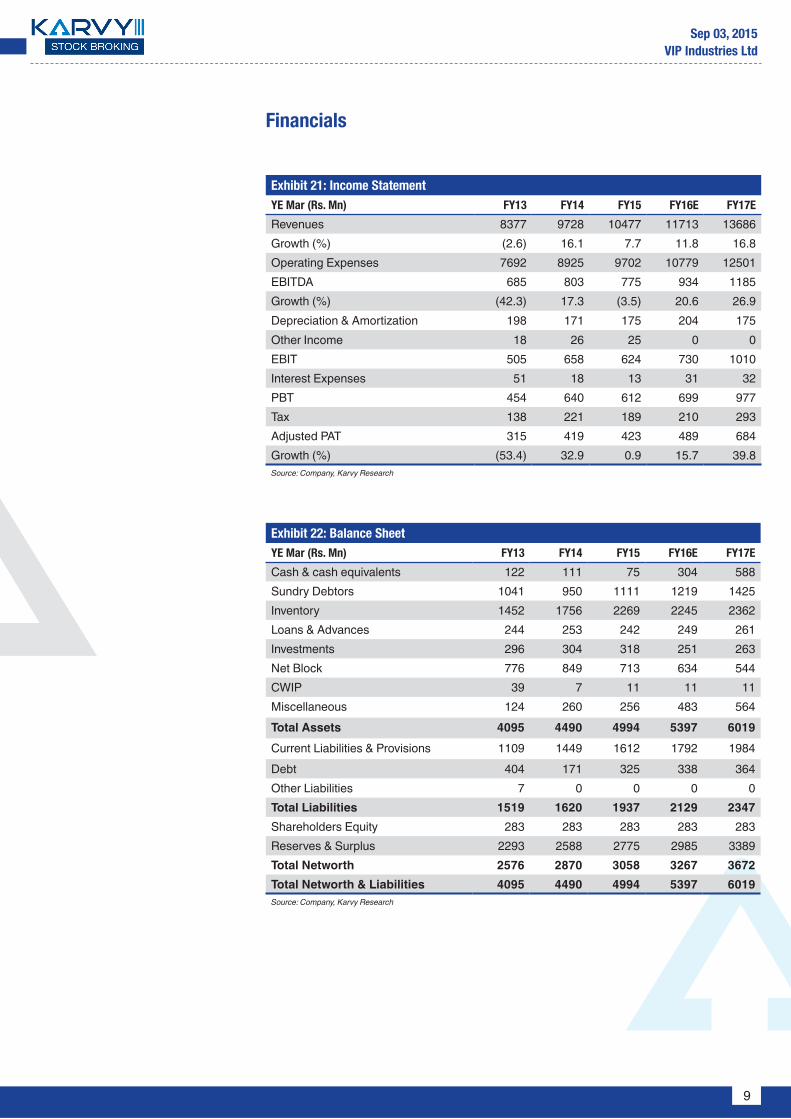
Valuation & OutlookAt CMP of Rs.77, VIP Industries is currently trading at 15.9x FY17E EPS. We value the company at P/E 19.2x for FY17E EPS for a target price of Rs.92, based on the company’s future prospects. We, therefore, initiate coverage on VIP Industries with a “BUY” rating for a target price of Rs. 92 representing an upside potential of 20% in a 9-12 month period.
Exhibit 19: PE Band
Source: Company, Karvy Research
Exhibit 20: PB Band
Source: Company, Karvy Research
0
50
100
150
200
250
300
Aug-11 Apr-12 Dec-12 Aug-13 Apr-14 Dec-14 Aug-15CMP 15x 22x 29x 36x
20
70
120
170
220
Aug-11 Apr-12 Dec-12 Aug-13 Apr-14 Dec-14 Aug-15CMP 2x 3x 4x 5x 6x
Key Risksyy Consumer behaviour: The marketing environment, buying characteristics of the consumer and buyer decision process play
a key role. Though the 4Ps marketing mix such as product, price, place and promotion determines the marketing strategy for any company, the huge unorganized market (66.66%) makes the company very sensitive to earnings if the consumer behaviour changes. The consumer behaviour is subjective and is likely to change based on various factors such as income, tastes or opinions. Psychological pricing plays a key role in pricing of products.
yy Recession in Global economy/Slowdown in economic activity: The global economy is very volatile and is vulnerable to recession. Any untoward events may significantly affect the business of the company.
yy Increase in raw material prices: The increase in raw material prices will impact margins of the company if proper strategy is not adopted. The raw materials mainly include Polycarbonate, Aluminum sections, Polypropylene etc. Any increase in the prices of these materials will affect the margins if the cost is not passed on to the customer which is price sensitive.
yy Firm competition from unorganized sector: Firm competition from unorganized players (66.66%) and low pricing strategy from the unorganized sector due to substandard quality may hit sales if proper marketing and advertising strategy is not adopted.
yy Exchange rate risks especially volatility of Yuan: The company sources soft luggage from China. It constitutes 70% of revenues. Any serious volatility of Yuan can affect the margins in short term.
yy Delay in payment from CSD segment to affect the working capital: The company derives 20%-22% of sales from CSD (Canteen Stores Department) segment which is a not-for-profit organization. It is a government organization catering to army, defence and navy; and offering the products at CSD price, which is less than the market price in the general market. Any delay in payment from the CSD segment might affect the working capital of the company.
9
Sep 03, 2015VIP Industries Ltd
Financials
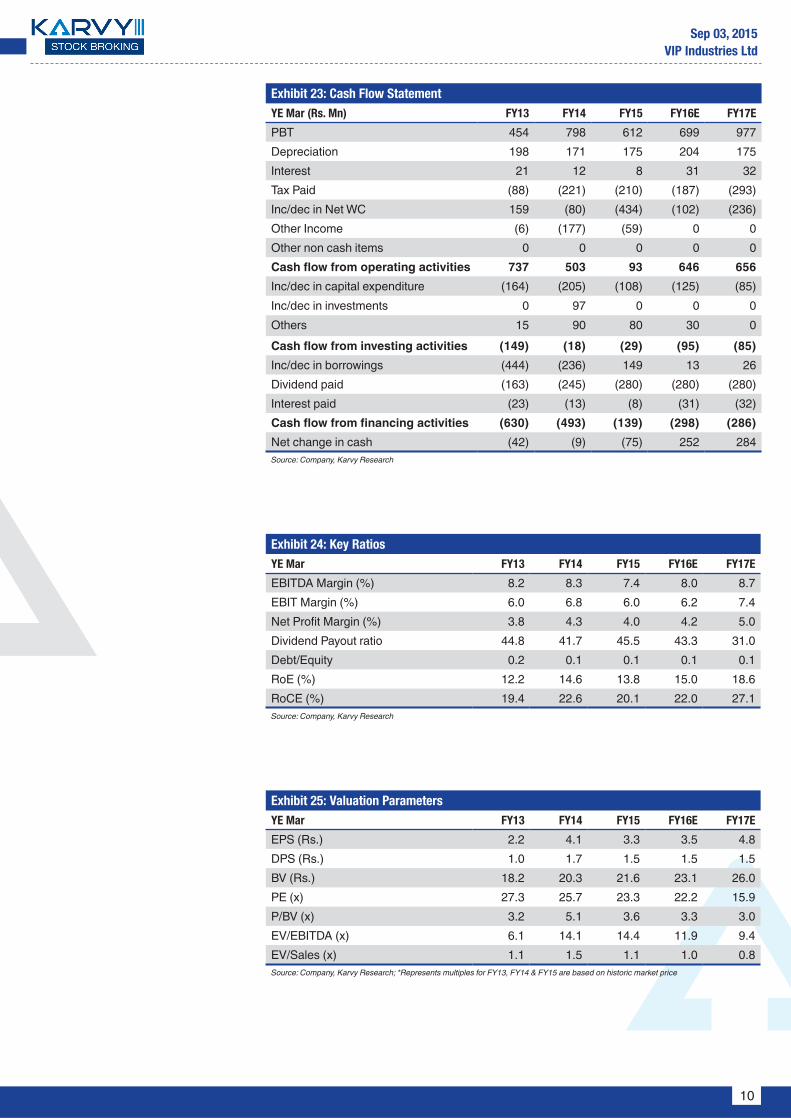
Exhibit 21: Income StatementYE Mar (Rs. Mn) FY13 FY14 FY15 FY16E FY17E
Revenues 8377 9728 10477 11713 13686 Growth (%) (2.6) 16.1 7.7 11.8 16.8 Operating Expenses 7692 8925 9702 10779 12501 EBITDA 685 803 775 934 1185 Growth (%) (42.3) 17.3 (3.5) 20.6 26.9 Depreciation & Amortization 198 171 175 204 175 Other Income 18 26 25 0 0 EBIT 505 658 624 730 1010 Interest Expenses 51 18 13 31 32 PBT 454 640 612 699 977 Tax 138 221 189 210 293 Adjusted PAT 315 419 423 489 684 Growth (%) (53.4) 32.9 0.9 15.7 39.8 Source: Company, Karvy Research
Exhibit 22: Balance SheetYE Mar (Rs. Mn) FY13 FY14 FY15 FY16E FY17E
Cash & cash equivalents 122 111 75 304 588Sundry Debtors 1041 950 1111 1219 1425Inventory 1452 1756 2269 2245 2362Loans & Advances 244 253 242 249 261Investments 296 304 318 251 263Net Block 776 849 713 634 544CWIP 39 7 11 11 11Miscellaneous 124 260 256 483 564Total Assets 4095 4490 4994 5397 6019Current Liabilities & Provisions 1109 1449 1612 1792 1984Debt 404 171 325 338 364Other Liabilities 7 0 0 0 0Total Liabilities 1519 1620 1937 2129 2347Shareholders Equity 283 283 283 283 283Reserves & Surplus 2293 2588 2775 2985 3389Total Networth 2576 2870 3058 3267 3672Total Networth & Liabilities 4095 4490 4994 5397 6019Source: Company, Karvy Research
10
Sep 03, 2015VIP Industries Ltd
Exhibit 23: Cash Flow StatementYE Mar (Rs. Mn) FY13 FY14 FY15 FY16E FY17E
PBT 454 798 612 699 977 Depreciation 198 171 175 204 175 Interest 21 12 8 31 32 Tax Paid (88) (221) (210) (187) (293)Inc/dec in Net WC 159 (80) (434) (102) (236)Other Income (6) (177) (59) 0 0 Other non cash items 0 0 0 0 0 Cash flow from operating activities 737 503 93 646 656 Inc/dec in capital expenditure (164) (205) (108) (125) (85)Inc/dec in investments 0 97 0 0 0 Others 15 90 80 30 0 Cash flow from investing activities (149) (18) (29) (95) (85)Inc/dec in borrowings (444) (236) 149 13 26 Dividend paid (163) (245) (280) (280) (280)Interest paid (23) (13) (8) (31) (32)Cash flow from financing activities (630) (493) (139) (298) (286)Net change in cash (42) (9) (75) 252 284 Source: Company, Karvy Research
Exhibit 24: Key RatiosYE Mar FY13 FY14 FY15 FY16E FY17E
EBITDA Margin (%) 8.2 8.3 7.4 8.0 8.7EBIT Margin (%) 6.0 6.8 6.0 6.2 7.4Net Profit Margin (%) 3.8 4.3 4.0 4.2 5.0Dividend Payout ratio 44.8 41.7 45.5 43.3 31.0Debt/Equity 0.2 0.1 0.1 0.1 0.1RoE (%) 12.2 14.6 13.8 15.0 18.6RoCE (%) 19.4 22.6 20.1 22.0 27.1Source: Company, Karvy Research
Exhibit 25: Valuation ParametersYE Mar FY13 FY14 FY15 FY16E FY17E
EPS (Rs.) 2.2 4.1 3.3 3.5 4.8DPS (Rs.) 1.0 1.7 1.5 1.5 1.5BV (Rs.) 18.2 20.3 21.6 23.1 26.0PE (x) 27.3 25.7 23.3 22.2 15.9P/BV (x) 3.2 5.1 3.6 3.3 3.0EV/EBITDA (x) 6.1 14.1 14.4 11.9 9.4EV/Sales (x) 1.1 1.5 1.1 1.0 0.8Source: Company, Karvy Research; *Represents multiples for FY13, FY14 & FY15 are based on historic market price
11
Sep 03, 2015VIP Industries Ltd
Stock Ratings Absolute ReturnsBuy : > 15%Hold : 5-15%Sell : <5%
Connect & Discuss More at
1800 425 8283 (Toll Free) [email protected] Live Chat f in YouTube
DisclaimerAnalyst certification: The following analyst(s), Uday Kiran Y, who is (are) primarily responsible for this report and whose name(s) is/are mentioned therein, certify (ies) that the views expressed herein accurately reflect his (their) personal view(s) about the subject security (ies) and issuer(s) and that no part of his (their) compensation was, is or will be directly or indirectly related to the specific recommendation(s) or views contained in this research report.Disclaimer: Karvy Stock Broking Limited [KSBL] is a SEBI registered Stock Broker, Depository Participant, Portfolio Manager and also distributes financial products. The subsidiaries and group companies including associates of KSBL provide services as Registrars and Share Transfer Agents, Commodity Broker, Currency and forex broker, merchant banker and underwriter, Investment Advisory services, insurance repository services, financial consultancy and advisory services, realty services, data management, data analytics, market research, solar power, film distribution and production, profiling and related services. Therefore associates of KSBL are likely to have business relations with most of the companies whose securities are traded on the exchange platform. The information and views presented in this report are prepared by Karvy Stock Broking Limited and are subject to change without any notice. This report is based on information obtained from public sources , the respective corporate under coverage and sources believed to be reliable, but no independent verification has been made nor is its accuracy or completeness guaranteed. The report and information contained herein is strictly confidential and meant solely for the selected recipient and may not be altered in any way, transmitted to, copied or distributed, in part or in whole, to any other person or to the media or reproduced in any form, without prior written consent of KSBL. While we would endeavor to update the information herein on a reasonable basis, KSBL is under no obligation to update or keep the information current. Also, there may be regulatory, compliance or other reasons that may prevent KSBL from doing so. The value and return on investment may vary because of changes in interest rates, foreign exchange rates or any other reason. This report and information herein is solely for informational purpose and shall not be used or considered as an offer document or solicitation of offer to buy or sell or subscribe for securities or other financial instruments. Though disseminated to all the customers simultaneously, not all customers may receive this report at the same time. KSBL will not treat recipients as customers by virtue of their receiving this report. Nothing in this report constitutes investment, legal, accounting and tax advice or a representation that any investment or strategy is suitable or appropriate to your specific circumstances. This material is for personal information and we are not responsible for any loss incurred based upon it. The investments discussed or recommended in this report may not be suitable for all investors. Investors must make their own investment decisions based on their specific investment objectives and financial position and using such independent advice, as they believe necessary. While acting upon any information or analysis mentioned in this report, investors may please note that neither KSBL nor any associate companies of KSBL accepts any liability arising from the use of information and views mentioned in this report. Investors are advised to see Risk Disclosure Document to understand the risks associated before investing in the securities markets. Past performance is not necessarily a guide to future performance. Forward-looking statements are not predictions and may be subject to change without notice. Actual results may differ materially from those set forth in projections.
y Associates of KSBL might have managed or co-managed public offering of securities for the subject company or might have been mandated by the subject company for any other assignment in the past twelve months.
y Associates of KSBL might have received compensation from the subject company mentioned in the report during the period preceding twelve months from the date of this report for investment banking or merchant banking or brokerage services from the subject company in the past twelve months or for services rendered as Registrar and Share Transfer Agent, Commodity Broker, Currency and forex broker, merchant banker and underwriter, Investment Advisory services, insurance repository services, consultancy and advisory services, realty services, data processing, profiling and related services or in any other capacity.
y KSBL encourages independence in research report preparation and strives to minimize conflict in preparation of research report. y Compensation of KSBL’s Research Analyst(s) is not based on any specific merchant banking, investment banking or brokerage service transactions. y KSBL generally prohibits its analysts, persons reporting to analysts and their relatives from maintaining a financial interest in the securities or derivatives of
any companies that the analysts cover. y KSBL or its associates collectively or Research Analysts do not own 1% or more of the equity securities of the Company mentioned in the report as of the
last day of the month preceding the publication of the research report. y KSBL or its analysts did not receive any compensation or other benefits from the companies mentioned in the report or third party in connection with
preparation of the research report and have no financial interest in the subject company mentioned in this report. y Accordingly, neither KSBL nor Research Analysts have any material conflict of interest at the time of publication of this report. y It is confirmed that KSBL and Research Analysts, primarily responsible for this report and whose name(s) is/ are mentioned therein of this report have not
received any compensation from the subject company mentioned in the report in the preceding twelve months. y It is confirmed that Uday Kiran Y, Research Analyst did not serve as an officer, director or employee of the companies mentioned in the report. y KSBL may have issued other reports that are inconsistent with and reach different conclusion from the information presented in this report. y Neither the Research Analysts nor KSBL have been engaged in market making activity for the companies mentioned in the report. y We submit that no material disciplinary action has been taken on KSBL by any Regulatory Authority impacting Equity Research Analyst activities.
Karvy Stock Broking LimitedPlot No.31, 6th Floor, Karvy Millennium Towers, Financial District, Nanakramguda, Hyderabad, 500 032, India
Tel: 91-40-2331 2454; Fax: 91-40-2331 1968For More updates & Stock Research, visit www.karvyonline.com