Embed Size (px)
Citation preview
On the Strong Ground Motion Attenuation in Spain
by Julio Mezcua, Rosa M. García Blanco, and Juan Rueda
Abstract In the last two decades, all earthquake hazard studies in Spain have beendone using the attenuation deduced from the isoseismal maps of the most importantearthquakes. However, it is well known that the preferred parameter to measure thesize of any shock is magnitude and, consequently, the knowledge of acceleration as afunction of magnitude and distance is basic to any new hazard determination.
The installation of a strong-motion network in Spain, with more than a hundreddigital instruments set up in the last 15 years, made possible the recording of morethan 447 shocks in the moment magnitude range of 1:3 ≤ M ≤ 6:3. However, only149 shocks were processed corresponding to magnitudes greater than 3 and a distanceof less than 100 km. Values of the maximum horizontal acceleration recorded on firmsoil permitted us to make a regression analysis, which has been compared with similarpreviously published relationships.
Additionally, the southwestern part of Spain is also affected by a marine sourcearea of different very low attenuation, but there are not enough recordings to attempt aregression analysis. In this case, the only strong-motion data gathered for the area waschecked against the two intensity attenuation relationships available after conversionof maximum intensity to moment magnitude, and intensity to acceleration, showing areasonable behavior of the newest intensity attenuation law gathered for the area.
Introduction
The attenuation of strong ground motion is one of thekey parameters in hazard studies. Up to now, all general ha-zard studies in Spain have been made using intensity data tocharacterize the seismicity and the seismic intensity decaywith distance obtained from the isoseismal maps. Since thefirst hazard determinations in Spain, several studies on inten-sity attenuation had been carried out from the intensity mapsgathered in Spain. Muñoz (1974), studying 129 earthquakeswith intensity maps, may be considered the first attempt toobtain a regionalization of intensity attenuation for the Iber-ian peninsula, obtaining five different zones for the territory,including the marine source of earthquakes to the southwestof Cape Saint Vincent on the most southwestern coast of Por-tugal. Mezcua (1982) published an isoseismal map catalogueof 261 earthquakes, and from this data, Martín (1984) made aselection of 27 earthquakes with Medvedev–Sponheuer–Karnik intensities in the range of VII–IX. From those shocks,a new set of four attenuation equations for different parts ofIberia was obtained (south, southeast, south–southeast, andsouthwest of Cape Saint Vincent, named in his article as theAzores region). Additionally, he also established a generalintensity attenuation equation for the whole territory. Veryrecently, López Casado et al. (2000) studied the intensity at-tenuation in the Iberian peninsula, considering not only thedata gathered by Mezcua (1982), but also taking into accounta total of 254 isoseismal maps (132 new isoseismal maps not
considered by Martín, 1984). In this study, they divide theIberian peninsula and surroundings into five regions accord-ing to their attenuation, named very-high, high, medium,low, and very-low attenuation.
At present, any hazard calculation made for the wholeterritory or any specific region is performed using any ofthose intensity attenuations (Jiménez et al., 1999; Peláez,2000; Earthquake Code Permanent Commission of Spain,2002, among others). However, the consideration of magni-tude as the characteristic parameter to assign the size of anyevent leads us to use the data for existent attenuation relation-ships or to calculate the specific relationship from the strong-motion data for Spain. There are in the literature severalground-motion attenuation relationships obtained in differentgeographical and tectonic regions of the world, which maybe applied due to their similarities to Spain, including a spe-cific study done for Spain and the Mediterranean region byCabañas et al. (2000). Ambraseys et al. (2005) and Berge-Thierry et al. (2003) examined relationships, which are ap-plicable to Europe and the Middle East; Sabetta and Pugliese(1987) did the same for Italy and also specifically for south-ern Spain; Douglas et al. (2006) used the composite modeldeveloped by Bommer et al. (2005). On the other hand, re-lationships for shallow crustal earthquakes in active tectonicregions such as those examined by Campbell (1997), Abra-hamson and Silva (1997), or Boore et al. (1997), among
1343
Bulletin of the Seismological Society of America, Vol. 98, No. 3, pp. 1343–1353, June 2008, doi: 10.1785/0120070169
others, may also be used in Spain due to the similar tectonicconditions of the data used in their studies. Moreover, thenew data in acceleration gathered in the last ten years inSpain leads us to attempt to develop an acceleration attenua-tion relationship valid for the Iberian peninsula in the mod-erate magnitude range.
In the case of the seismogenic zone affecting the Spanishterritory, the so-called Azores region, few values are recordedat present to be able to obtain an attenuation law for the re-gion, and no similar very-low attenuation values from tec-tonic regimes of a similar nature may be found from otherparts of the world. However, on 12 February 2007, a momentmagnitude M 6:1 shock occurred in this area, and it was re-corded in some strong-motion instruments at very largedistances (more than 300 km away) in the Iberian penin-sula, allowing for it to be checked against the two existingintensity attenuation relationships for the Azores region. Thisis performed by converting to acceleration the intensity val-ues through the relationship used in the Spanish buildingcode, and the maximum intensity to moment magnitudethrough out the proposed relationship for the area (Mezcuaet al., 2004).
The Strong-Motion Network in Spain
In the early 1980s, the Instituto Geografico Nacional ofSpain began the deployment of a network of digital strongground motion instruments, which is described by Carreñoet al. (1991). The initial instruments were SMA-2 fromKinemetrics, but in recent years, a new set of accelerographs
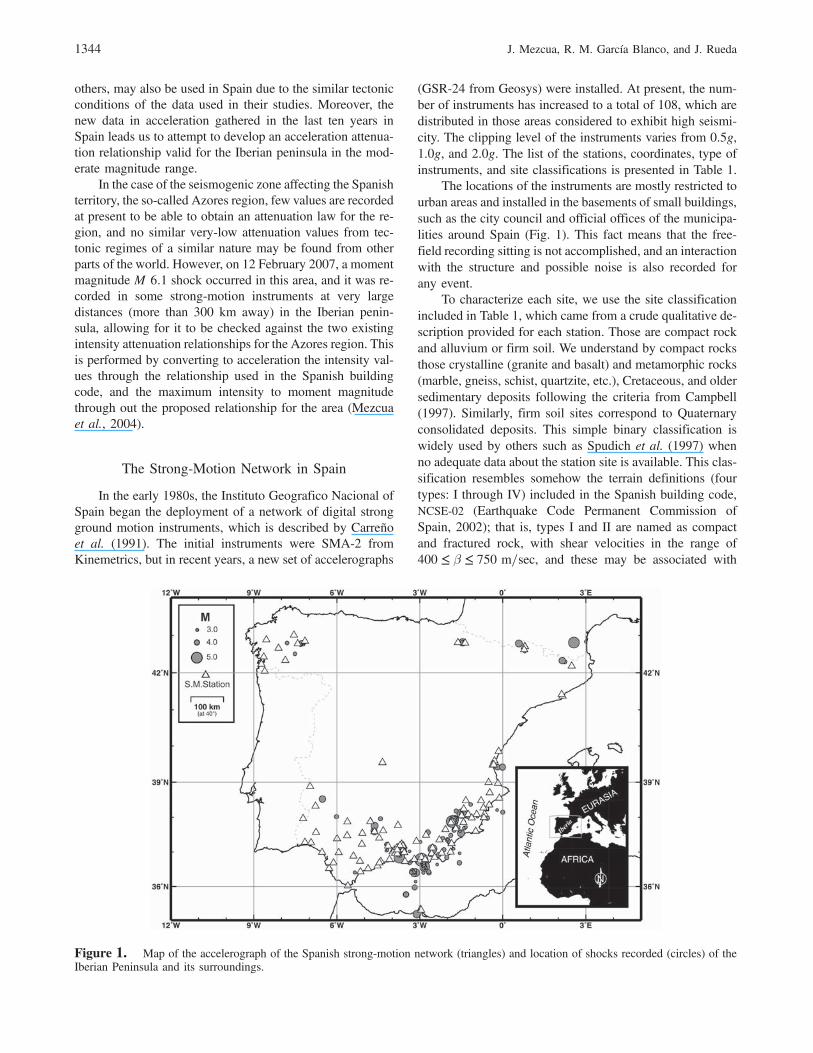
(GSR-24 from Geosys) were installed. At present, the num-ber of instruments has increased to a total of 108, which aredistributed in those areas considered to exhibit high seismi-city. The clipping level of the instruments varies from 0.5g,1.0g, and 2.0g. The list of the stations, coordinates, type ofinstruments, and site classifications is presented in Table 1.
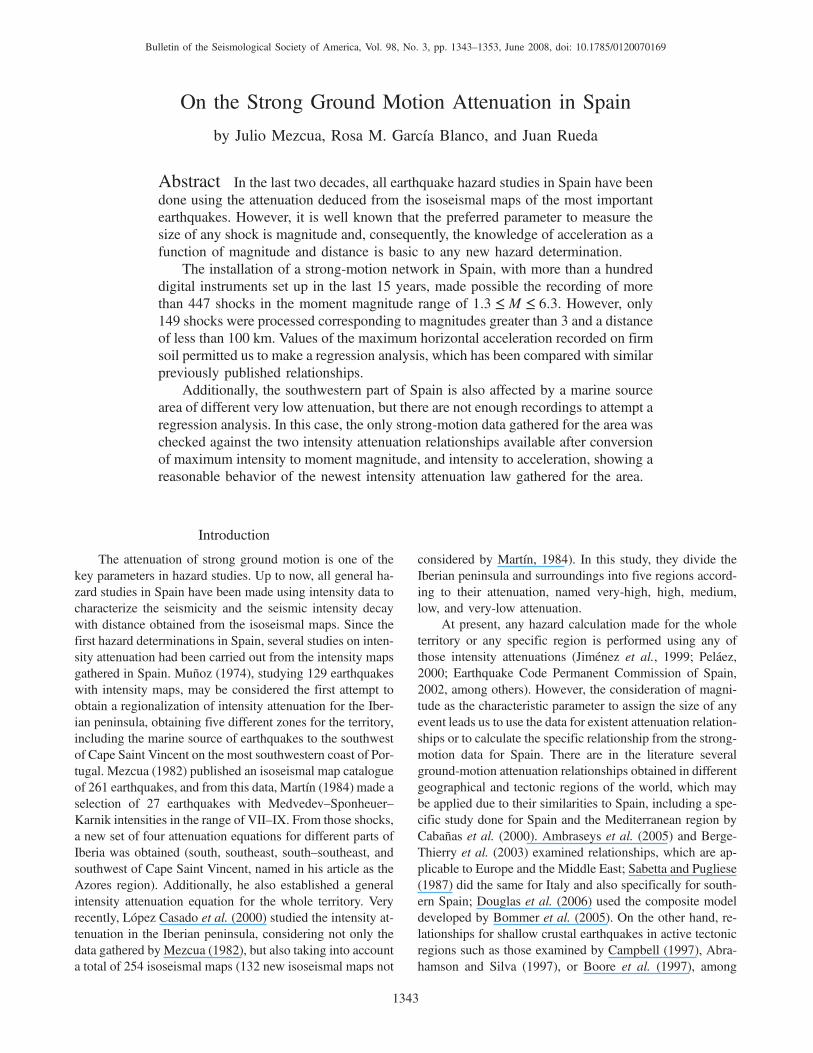
The locations of the instruments are mostly restricted tourban areas and installed in the basements of small buildings,such as the city council and official offices of the municipa-lities around Spain (Fig. 1). This fact means that the free-field recording sitting is not accomplished, and an interactionwith the structure and possible noise is also recorded forany event.
To characterize each site, we use the site classificationincluded in Table 1, which came from a crude qualitative de-scription provided for each station. Those are compact rockand alluvium or firm soil. We understand by compact rocksthose crystalline (granite and basalt) and metamorphic rocks(marble, gneiss, schist, quartzite, etc.), Cretaceous, and oldersedimentary deposits following the criteria from Campbell(1997). Similarly, firm soil sites correspond to Quaternaryconsolidated deposits. This simple binary classification iswidely used by others such as Spudich et al. (1997) whenno adequate data about the station site is available. This clas-sification resembles somehow the terrain definitions (fourtypes: I through IV) included in the Spanish building code,NCSE-02 (Earthquake Code Permanent Commission ofSpain, 2002); that is, types I and II are named as compactand fractured rock, with shear velocities in the range of400 ≤ β ≤ 750 m=sec, and these may be associated with
Figure 1. Map of the accelerograph of the Spanish strong-motion network (triangles) and location of shocks recorded (circles) of theIberian Peninsula and its surroundings.
1344 J. Mezcua, R. M. García Blanco, and J. Rueda
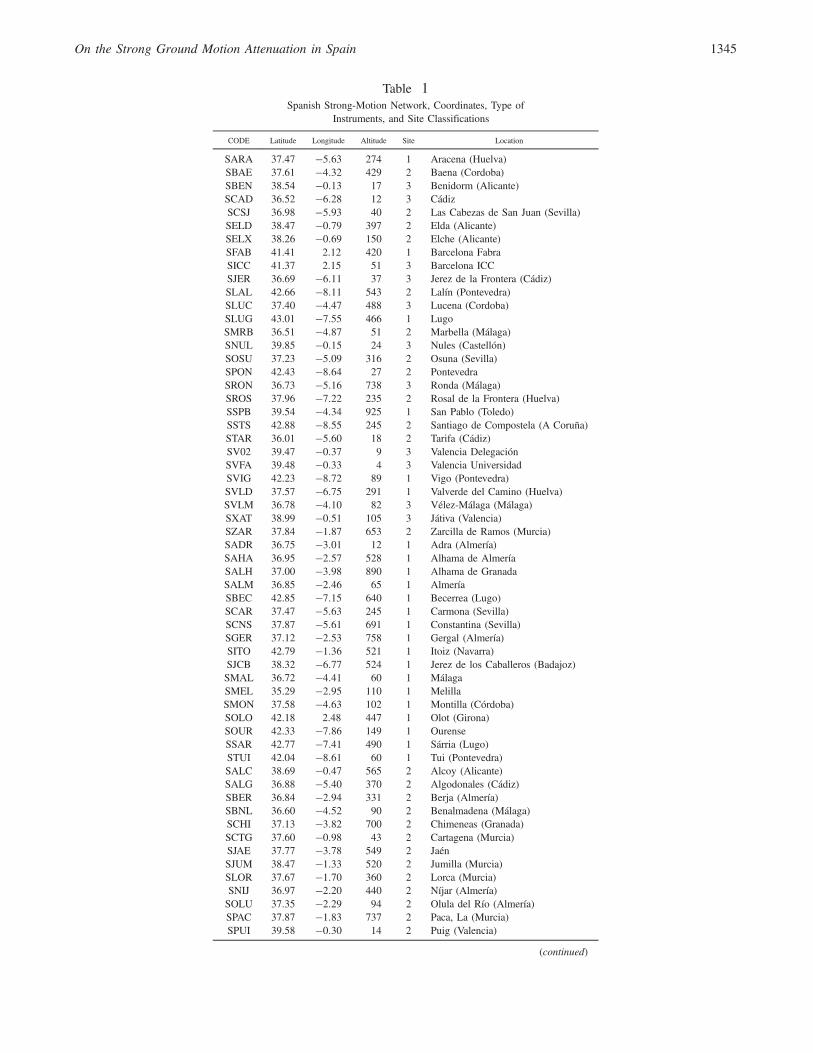
Table 1Spanish Strong-Motion Network, Coordinates, Type of
Instruments, and Site Classifications
CODE Latitude Longitude Altitude Site Location
SARA 37.47 �5:63 274 1 Aracena (Huelva)SBAE 37.61 �4:32 429 2 Baena (Cordoba)SBEN 38.54 �0:13 17 3 Benidorm (Alicante)SCAD 36.52 �6:28 12 3 CádizSCSJ 36.98 �5:93 40 2 Las Cabezas de San Juan (Sevilla)SELD 38.47 �0:79 397 2 Elda (Alicante)SELX 38.26 �0:69 150 2 Elche (Alicante)SFAB 41.41 2.12 420 1 Barcelona FabraSICC 41.37 2.15 51 3 Barcelona ICCSJER 36.69 �6:11 37 3 Jerez de la Frontera (Cádiz)SLAL 42.66 �8:11 543 2 Lalín (Pontevedra)SLUC 37.40 �4:47 488 3 Lucena (Cordoba)SLUG 43.01 �7:55 466 1 LugoSMRB 36.51 �4:87 51 2 Marbella (Málaga)SNUL 39.85 �0:15 24 3 Nules (Castellón)SOSU 37.23 �5:09 316 2 Osuna (Sevilla)SPON 42.43 �8:64 27 2 PontevedraSRON 36.73 �5:16 738 3 Ronda (Málaga)SROS 37.96 �7:22 235 2 Rosal de la Frontera (Huelva)SSPB 39.54 �4:34 925 1 San Pablo (Toledo)SSTS 42.88 �8:55 245 2 Santiago de Compostela (A Coruña)STAR 36.01 �5:60 18 2 Tarifa (Cádiz)SV02 39.47 �0:37 9 3 Valencia DelegaciónSVFA 39.48 �0:33 4 3 Valencia UniversidadSVIG 42.23 �8:72 89 1 Vigo (Pontevedra)SVLD 37.57 �6:75 291 1 Valverde del Camino (Huelva)SVLM 36.78 �4:10 82 3 Vélez-Málaga (Málaga)SXAT 38.99 �0:51 105 3 Játiva (Valencia)SZAR 37.84 �1:87 653 2 Zarcilla de Ramos (Murcia)SADR 36.75 �3:01 12 1 Adra (Almería)SAHA 36.95 �2:57 528 1 Alhama de AlmeríaSALH 37.00 �3:98 890 1 Alhama de GranadaSALM 36.85 �2:46 65 1 AlmeríaSBEC 42.85 �7:15 640 1 Becerrea (Lugo)SCAR 37.47 �5:63 245 1 Carmona (Sevilla)SCNS 37.87 �5:61 691 1 Constantina (Sevilla)SGER 37.12 �2:53 758 1 Gergal (Almería)SITO 42.79 �1:36 521 1 Itoiz (Navarra)SJCB 38.32 �6:77 524 1 Jerez de los Caballeros (Badajoz)SMAL 36.72 �4:41 60 1 MálagaSMEL 35.29 �2:95 110 1 MelillaSMON 37.58 �4:63 102 1 Montilla (Córdoba)SOLO 42.18 2.48 447 1 Olot (Girona)SOUR 42.33 �7:86 149 1 OurenseSSAR 42.77 �7:41 490 1 Sárria (Lugo)STUI 42.04 �8:61 60 1 Tui (Pontevedra)SALC 38.69 �0:47 565 2 Alcoy (Alicante)SALG 36.88 �5:40 370 2 Algodonales (Cádiz)SBER 36.84 �2:94 331 2 Berja (Almería)SBNL 36.60 �4:52 90 2 Benalmadena (Málaga)SCHI 37.13 �3:82 700 2 Chimeneas (Granada)SCTG 37.60 �0:98 43 2 Cartagena (Murcia)SJAE 37.77 �3:78 549 2 JaénSJUM 38.47 �1:33 520 2 Jumilla (Murcia)SLOR 37.67 �1:70 360 2 Lorca (Murcia)SNIJ 36.97 �2:20 440 2 Níjar (Almería)SOLU 37.35 �2:29 94 2 Olula del Río (Almería)SPAC 37.87 �1:83 737 2 Paca, La (Murcia)SPUI 39.58 �0:30 14 2 Puig (Valencia)
(continued)
On the Strong Ground Motion Attenuation in Spain 1345
our compact rock class; type III, with a shear velocity of200 ≤ β < 400 m=sec, is equivalent to our firm soil class.From Table 1, it can be seen that most of the instrumentsin the Spanish strong-motion network are located on firmsoil sites.
As the triggering for each instrument is very low(0.002g), we get acceleration values of shocks of a magni-tude as low as a 1.3 moment magnitude, and the maximumdistance recorded is around 650 km. However, we only con-sider for this study shocks in the epicentral distance range of
5 ≤ Δ ≤ 100 km and magnitudes ofM ≥3 (Fig. 2). A list ofthe 149 earthquakes that meet those characteristics is pre-sented with all their relevant data in Table 2.
Data Selection and Regression Technique Used
As some of the recent earthquakes that occurred after2004 are characterized not only by the mb�Lg� magnitude,but also for their moment magnitude (M) because a momenttensor inversion is routinely done by the Spanish seismic net-
Table 1 (Continued)CODE Latitude Longitude Altitude Site Location
STOR 37.99 �0:68 6 2 Torrevieja (Alicante)SVI2 42.70 0.79 994 2 Viella Túnel Norte (Lleida)SVI3 42.62 0.76 1582 2 Viella Túnel Sur (Lleida)SVLR 37.64 �2:07 848 2 Vélez-Rubio (Almería)SABU 36.79 �3:20 274 3 Albuñol (Granada)SAGR 37.03 �3:83 1058 3 Agrón (Granada)SAHM 37.85 �1:42 202 3 Alhama de MurciaSALB 37.23 �3:65 649 3 Albolote (Granada)SALI 38.35 �0:48 35 3 AlicanteSARE 36.95 �3:89 918 3 Arenas de Rey (Granada)SBAD 38.87 �6:97 185 3 BadajozSBAZ 37.49 �2:77 880 3 Baza (Granada)SCAB 37.17 �3:59 770 3 Granada AlhambraSCAC 37.06 �3:91 705 3 Cacín (Granada)SCBN 36.99 �1:89 19 3 Carboneras (Almería)SCHU 37.14 �3:64 656 3 Churriana (Granada)SCIE 38.23 �1:41 170 3 Cieza (Murcia)SCO2 37.87 �4:78 122 3 Córdoba SubdelegaciónSCOR 37.87 �4:78 102 3 Córdoba AlcázarSCTY 37.28 �7:15 24 3 Cartaya (Huelva)SDIL 37.07 �3:60 879 3 Dílar (Granada)SDUR 36.98 �3:56 790 3 Dúrcal (Granada)SECI 37.53 �5:08 114 3 Écija (Sevilla)SEJI 36.78 �2:81 24 3 El Ejido (Almería)SEST 36.42 �5:15 19 3 Estepona (Málaga)SFAC 37.18 �3:61 663 3 Granada FacultadSGAN 38.96 �0:17 40 3 Gandía (Valencia)SGDX 37.31 �3:12 908 3 Guadix (Granada)SGUA 38.09 �0:65 20 3 Guardamar de Segura (Alicante)SHUE 37.27 �6:93 38 3 HuelvaSJAY 36.95 �3:82 913 3 Jayena (Granada)SLOJ 37.17 �4:15 517 3 Loja (Granada)SLOQ 38.08 �1:25 115 3 Lorquí (Murcia)SM02 37.98 �1:12 44 3 MurciaSMOT 36.73 �3:53 6 3 Motril (Granada)SMPD 36.68 �4:45 7 3 Malaga M. CarpenaSMTC 36.99 �6:53 102 3 Almonte (Huelva)SMUL 38.04 �1:49 318 3 Mula (Murcia)SORI 38.08 �0:94 23 3 Orihuela (Alicante)SPAM 42.81 �1:62 478 3 Pamplona (Navarra)SSEV 37.38 �5:99 8 3 SevillaSSTF 37.19 �3:71 579 3 Santa Fe (Granada)SVEN 37.06 �3:82 856 3 Ventas de Huelma (Granada)SVER 37.24 �1:85 90 3 Vera (Almería)SVIE 42.71 0.80 1600 3 Viella (Lleida)
Type 1 corresponds to compact rocks formed by crystalline (granite and basalt) andmetamorphic rocks (marble, gneiss, schist, quartzite, etc.), Cretaceous, and older sedi-mentary deposits. Type 2, firm soil, corresponds to Quaternary consolidated deposits.Type 3 are soft sedimentary deposits.
1346 J. Mezcua, R. M. García Blanco, and J. Rueda
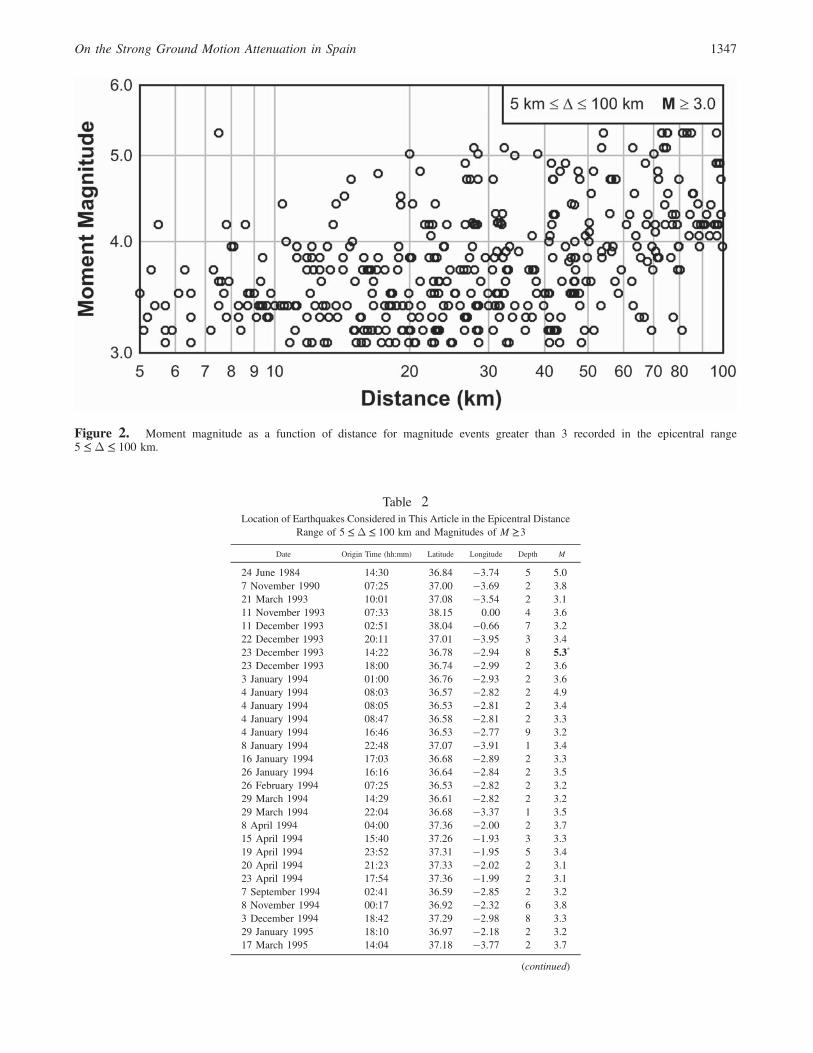
Figure 2. Moment magnitude as a function of distance for magnitude events greater than 3 recorded in the epicentral range5 ≤ Δ ≤ 100 km.
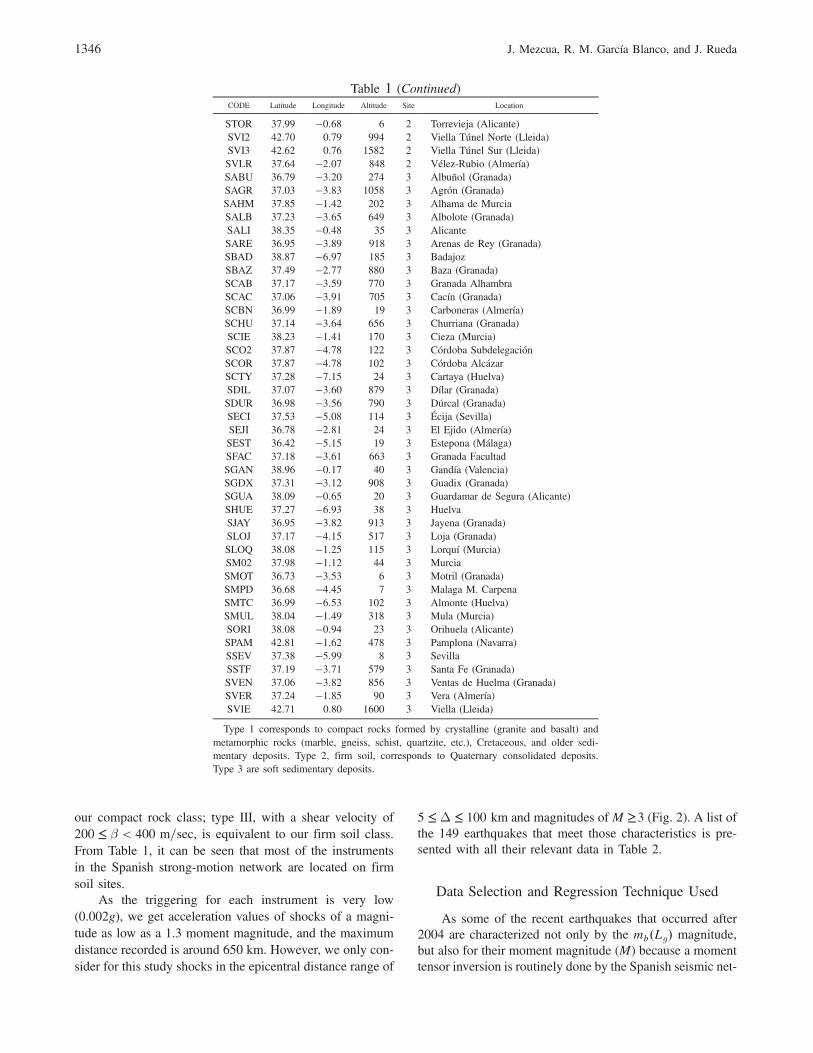
Table 2Location of Earthquakes Considered in This Article in the Epicentral Distance
Range of 5 ≤ Δ ≤ 100 km and Magnitudes of M ≥3Date Origin Time (hh:mm) Latitude Longitude Depth M
24 June 1984 14:30 36.84 �3:74 5 5.07 November 1990 07:25 37.00 �3:69 2 3.821 March 1993 10:01 37.08 �3:54 2 3.111 November 1993 07:33 38.15 0.00 4 3.611 December 1993 02:51 38.04 �0:66 7 3.222 December 1993 20:11 37.01 �3:95 3 3.423 December 1993 14:22 36.78 �2:94 8 5.3*
23 December 1993 18:00 36.74 �2:99 2 3.63 January 1994 01:00 36.76 �2:93 2 3.64 January 1994 08:03 36.57 �2:82 2 4.94 January 1994 08:05 36.53 �2:81 2 3.44 January 1994 08:47 36.58 �2:81 2 3.34 January 1994 16:46 36.53 �2:77 9 3.28 January 1994 22:48 37.07 �3:91 1 3.416 January 1994 17:03 36.68 �2:89 2 3.326 January 1994 16:16 36.64 �2:84 2 3.526 February 1994 07:25 36.53 �2:82 2 3.229 March 1994 14:29 36.61 �2:82 2 3.229 March 1994 22:04 36.68 �3:37 1 3.58 April 1994 04:00 37.36 �2:00 2 3.715 April 1994 15:40 37.26 �1:93 3 3.319 April 1994 23:52 37.31 �1:95 5 3.420 April 1994 21:23 37.33 �2:02 2 3.123 April 1994 17:54 37.36 �1:99 2 3.17 September 1994 02:41 36.59 �2:85 2 3.28 November 1994 00:17 36.92 �2:32 6 3.83 December 1994 18:42 37.29 �2:98 8 3.329 January 1995 18:10 36.97 �2:18 2 3.217 March 1995 14:04 37.18 �3:77 2 3.7
(continued)
On the Strong Ground Motion Attenuation in Spain 1347
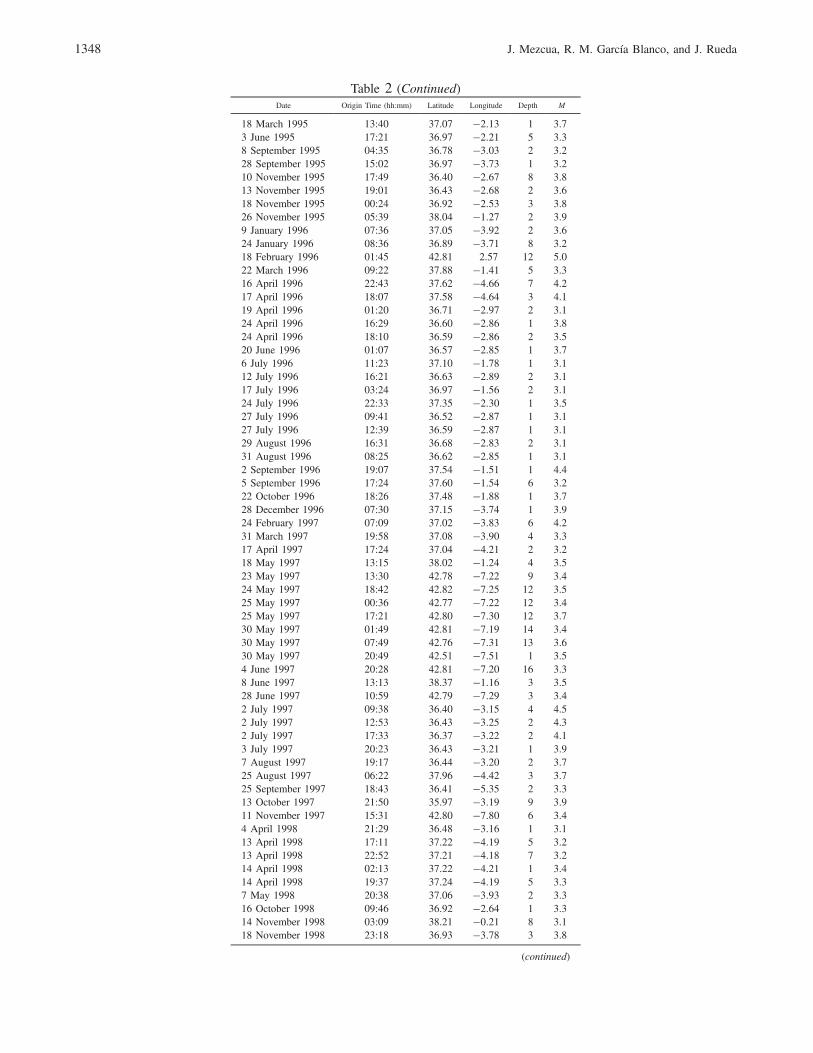
Table 2 (Continued)Date Origin Time (hh:mm) Latitude Longitude Depth M
18 March 1995 13:40 37.07 �2:13 1 3.73 June 1995 17:21 36.97 �2:21 5 3.38 September 1995 04:35 36.78 �3:03 2 3.228 September 1995 15:02 36.97 �3:73 1 3.210 November 1995 17:49 36.40 �2:67 8 3.813 November 1995 19:01 36.43 �2:68 2 3.618 November 1995 00:24 36.92 �2:53 3 3.826 November 1995 05:39 38.04 �1:27 2 3.99 January 1996 07:36 37.05 �3:92 2 3.624 January 1996 08:36 36.89 �3:71 8 3.218 February 1996 01:45 42.81 2.57 12 5.022 March 1996 09:22 37.88 �1:41 5 3.316 April 1996 22:43 37.62 �4:66 7 4.217 April 1996 18:07 37.58 �4:64 3 4.119 April 1996 01:20 36.71 �2:97 2 3.124 April 1996 16:29 36.60 �2:86 1 3.824 April 1996 18:10 36.59 �2:86 2 3.520 June 1996 01:07 36.57 �2:85 1 3.76 July 1996 11:23 37.10 �1:78 1 3.112 July 1996 16:21 36.63 �2:89 2 3.117 July 1996 03:24 36.97 �1:56 2 3.124 July 1996 22:33 37.35 �2:30 1 3.527 July 1996 09:41 36.52 �2:87 1 3.127 July 1996 12:39 36.59 �2:87 1 3.129 August 1996 16:31 36.68 �2:83 2 3.131 August 1996 08:25 36.62 �2:85 1 3.12 September 1996 19:07 37.54 �1:51 1 4.45 September 1996 17:24 37.60 �1:54 6 3.222 October 1996 18:26 37.48 �1:88 1 3.728 December 1996 07:30 37.15 �3:74 1 3.924 February 1997 07:09 37.02 �3:83 6 4.231 March 1997 19:58 37.08 �3:90 4 3.317 April 1997 17:24 37.04 �4:21 2 3.218 May 1997 13:15 38.02 �1:24 4 3.523 May 1997 13:30 42.78 �7:22 9 3.424 May 1997 18:42 42.82 �7:25 12 3.525 May 1997 00:36 42.77 �7:22 12 3.425 May 1997 17:21 42.80 �7:30 12 3.730 May 1997 01:49 42.81 �7:19 14 3.430 May 1997 07:49 42.76 �7:31 13 3.630 May 1997 20:49 42.51 �7:51 1 3.54 June 1997 20:28 42.81 �7:20 16 3.38 June 1997 13:13 38.37 �1:16 3 3.528 June 1997 10:59 42.79 �7:29 3 3.42 July 1997 09:38 36.40 �3:15 4 4.52 July 1997 12:53 36.43 �3:25 2 4.32 July 1997 17:33 36.37 �3:22 2 4.13 July 1997 20:23 36.43 �3:21 1 3.97 August 1997 19:17 36.44 �3:20 2 3.725 August 1997 06:22 37.96 �4:42 3 3.725 September 1997 18:43 36.41 �5:35 2 3.313 October 1997 21:50 35.97 �3:19 9 3.911 November 1997 15:31 42.80 �7:80 6 3.44 April 1998 21:29 36.48 �3:16 1 3.113 April 1998 17:11 37.22 �4:19 5 3.213 April 1998 22:52 37.21 �4:18 7 3.214 April 1998 02:13 37.22 �4:21 1 3.414 April 1998 19:37 37.24 �4:19 5 3.37 May 1998 20:38 37.06 �3:93 2 3.316 October 1998 09:46 36.92 �2:64 1 3.314 November 1998 03:09 38.21 �0:21 8 3.118 November 1998 23:18 36.93 �3:78 3 3.8
(continued)
1348 J. Mezcua, R. M. García Blanco, and J. Rueda
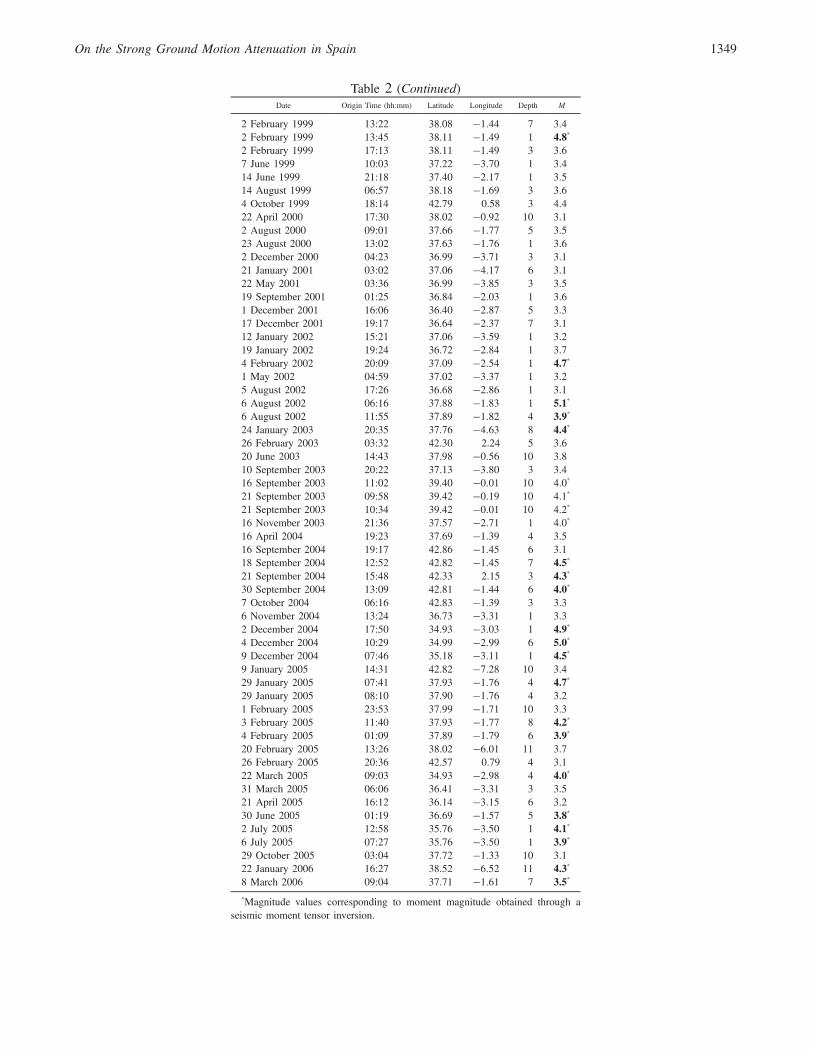
Table 2 (Continued)Date Origin Time (hh:mm) Latitude Longitude Depth M
2 February 1999 13:22 38.08 �1:44 7 3.42 February 1999 13:45 38.11 �1:49 1 4.8*
2 February 1999 17:13 38.11 �1:49 3 3.67 June 1999 10:03 37.22 �3:70 1 3.414 June 1999 21:18 37.40 �2:17 1 3.514 August 1999 06:57 38.18 �1:69 3 3.64 October 1999 18:14 42.79 0.58 3 4.422 April 2000 17:30 38.02 �0:92 10 3.12 August 2000 09:01 37.66 �1:77 5 3.523 August 2000 13:02 37.63 �1:76 1 3.62 December 2000 04:23 36.99 �3:71 3 3.121 January 2001 03:02 37.06 �4:17 6 3.122 May 2001 03:36 36.99 �3:85 3 3.519 September 2001 01:25 36.84 �2:03 1 3.61 December 2001 16:06 36.40 �2:87 5 3.317 December 2001 19:17 36.64 �2:37 7 3.112 January 2002 15:21 37.06 �3:59 1 3.219 January 2002 19:24 36.72 �2:84 1 3.74 February 2002 20:09 37.09 �2:54 1 4.7*
1 May 2002 04:59 37.02 �3:37 1 3.25 August 2002 17:26 36.68 �2:86 1 3.16 August 2002 06:16 37.88 �1:83 1 5.1*
6 August 2002 11:55 37.89 �1:82 4 3.9*
24 January 2003 20:35 37.76 �4:63 8 4.4*
26 February 2003 03:32 42.30 2.24 5 3.620 June 2003 14:43 37.98 �0:56 10 3.810 September 2003 20:22 37.13 �3:80 3 3.416 September 2003 11:02 39.40 �0:01 10 4.0*
21 September 2003 09:58 39.42 �0:19 10 4.1*
21 September 2003 10:34 39.42 �0:01 10 4.2*
16 November 2003 21:36 37.57 �2:71 1 4.0*
16 April 2004 19:23 37.69 �1:39 4 3.516 September 2004 19:17 42.86 �1:45 6 3.118 September 2004 12:52 42.82 �1:45 7 4.5*
21 September 2004 15:48 42.33 2.15 3 4.3*
30 September 2004 13:09 42.81 �1:44 6 4.0*
7 October 2004 06:16 42.83 �1:39 3 3.36 November 2004 13:24 36.73 �3:31 1 3.32 December 2004 17:50 34.93 �3:03 1 4.9*
4 December 2004 10:29 34.99 �2:99 6 5.0*
9 December 2004 07:46 35.18 �3:11 1 4.5*
9 January 2005 14:31 42.82 �7:28 10 3.429 January 2005 07:41 37.93 �1:76 4 4.7*
29 January 2005 08:10 37.90 �1:76 4 3.21 February 2005 23:53 37.99 �1:71 10 3.33 February 2005 11:40 37.93 �1:77 8 4.2*
4 February 2005 01:09 37.89 �1:79 6 3.9*
20 February 2005 13:26 38.02 �6:01 11 3.726 February 2005 20:36 42.57 0.79 4 3.122 March 2005 09:03 34.93 �2:98 4 4.0*
31 March 2005 06:06 36.41 �3:31 3 3.521 April 2005 16:12 36.14 �3:15 6 3.230 June 2005 01:19 36.69 �1:57 5 3.8*
2 July 2005 12:58 35.76 �3:50 1 4.1*
6 July 2005 07:27 35.76 �3:50 1 3.9*
29 October 2005 03:04 37.72 �1:33 10 3.122 January 2006 16:27 38.52 �6:52 11 4.3*
8 March 2006 09:04 37.71 �1:61 7 3.5*
*Magnitude values corresponding to moment magnitude obtained through aseismic moment tensor inversion.
On the Strong Ground Motion Attenuation in Spain 1349
work (Rueda and Mezcua, 2005), we used such a magnitudefor the whole set of events through a conversion ofmb�Lg� toM (given by Rueda and Mezcua, 2002) for the rest of events,with no calculated moment magnitude. In this way, we havea unified moment magnitude assignment to all events con-sidered, shown in Table 2, if the given value is a calculatedmoment magnitude (asterisk) or if this is obtained by con-version from mb�Lg�. All events ofM ≥3 used in this articleare also represented in Figure 1.
In relation to the source-to-site distance definition to beused in the regression, we have considered the hypocentraldistance instead as the most used closest distance to the ver-tical projection of the rupture, the so called Joyner–Booredistance. The main reason for this is that no details aboutplanes of rupture of each shock were available for mostof the events. The use of hypocentral distance limits the mo-tion at very close distances from the epicenter.
The type of faulting of each event has not been includedbecause only a few events after 2004, and in most cases be-fore that year, have information about this parameter.
Finally, as already mentioned, we only distinguish twotypes of local site conditions, it being only possible to makea regression model for those values recorded on firm soilsites because of the scarce number of values in the compactrock class.
Once the records were corrected, we considered thehorizontal peak ground acceleration (PGA) Y values, and aregression analysis was performed using the following sim-plified predictive form:
lnY � C1 � C2M� C3 lnR� C4R;
where M is the moment magnitude of each event, and R isthe hypocentral distance.
The distance attenuation terms C3 and C4 represent thegeometrical spreading for a simple point source model, andthe attenuation due to the anelastic properties of the medium,respectively.
As the magnitude range of earthquakes used is for smalland moderate shocks, those correspond to the weak-motiondata, and a unique size-dependent term coefficient C2 is pro-posed in the equation.
Most of the ground-motion attenuation studies havebeen performed using the ordinary least squares methodto obtain the coefficients of their equations, as shown inAmbraseys and Bommer (1991), and Spudich et al. (1999),among others. However, if we are interested in taking intoaccount the strong correlation between magnitude and dis-tance, which is observed in Figure 2, a two-step procedureintroduced by Joyner and Boore (1981) is the method mostwidely used. Nevertheless, in the intermediate distance rangewhere most of the data is usually gathered, the two-stage andthe one-stage methods produce similar results (Sabetta andPugliese, 1987; Boore et al., 1994; Sabetta and Pugliese,1996). In the present study, we have performed a least-squares estimation of coefficients in a one-stage method form
by inverting the matrix using the Lapack algorithm (Ander-son et al., 1999). The final results lead us to a new accelera-tion attenuation law for firm soil sites in Spain:
lnY � 0:125� 1:286M � 1:133 lnR;
with σ�lnY� � 0:69.Where Y is the horizontal PGA expressed in cm=sec. The
anelastic attenuation constant C4, with a value equal to zero,was not considered in this article. In other studies, such acoefficient is positive and very close to zero, and this resulthas been interpreted by Boore et al. (1997) as due to motionsthat attenuate less rapidly than 1=R in this distance range.They suggest that this is possibly due to the critical anglereflections at the Moho.
The number of the data used in this regression is 250acceleration values. The standard deviation is consideredhere as a constant, not dependent on M. The relatively highstandard deviation obtained may be a consequence of severalneglected parameters not included in the estimation of theearthquake ground motion, such as the focal mechanismtype, radiation pattern influence, directivity effects, focusing,and influence of the topography (Douglas, 2003), and pos-sibly also by the great variability of so weak a motion that isconsidered in this article.
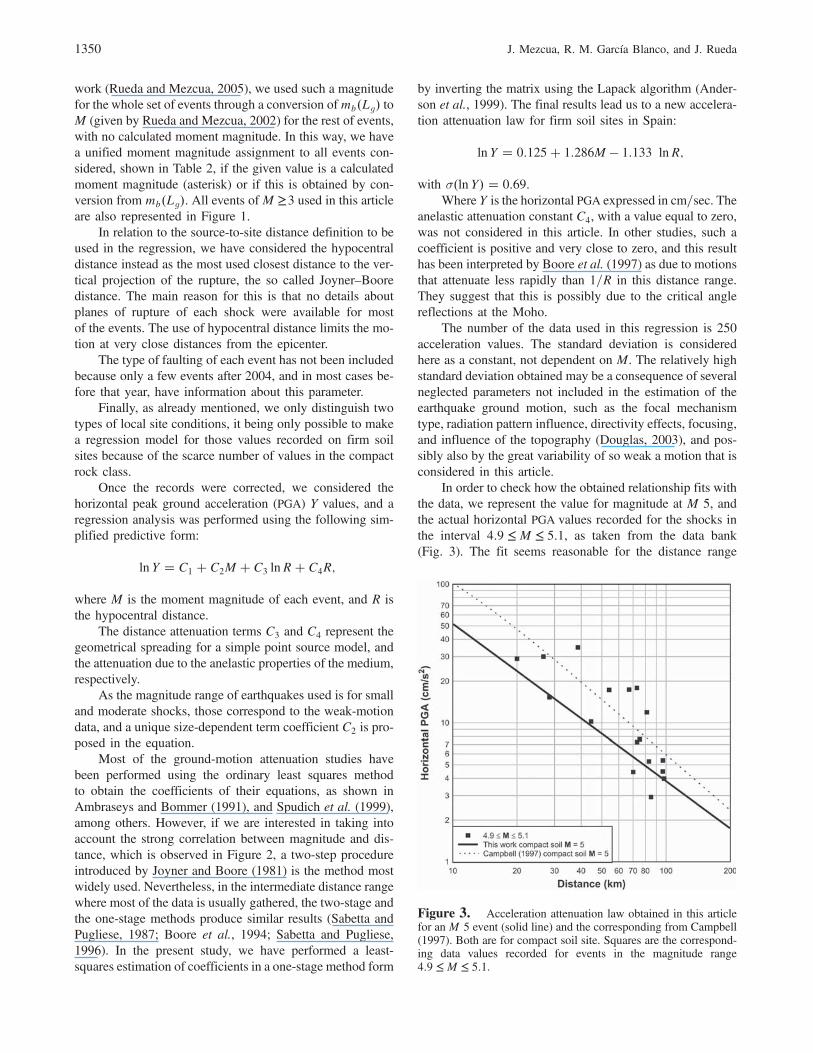
In order to check how the obtained relationship fits withthe data, we represent the value for magnitude at M 5, andthe actual horizontal PGA values recorded for the shocks inthe interval 4:9 ≤ M ≤ 5:1, as taken from the data bank(Fig. 3). The fit seems reasonable for the distance range
Figure 3. Acceleration attenuation law obtained in this articlefor an M 5 event (solid line) and the corresponding from Campbell(1997). Both are for compact soil site. Squares are the correspond-ing data values recorded for events in the magnitude range4:9 ≤ M ≤ 5:1.
1350 J. Mezcua, R. M. García Blanco, and J. Rueda
of 60–90 km, where most of the data is concentrated. In Fig-ure 3, we consider also the Campbell (1997) attenuationcurve forM 5, because this relationship is obtained for activetectonic regions similar to our region, with shallow crustalearthquakes mainly from California, and focal mechanismsof reverse and strike-slip focal solutions. It can be seen thatthe Campbell (1997) curve is more conservative than thatobtained in this article, but the data is better grouped toour relationship around the 80–100-km range. Moreover,the similarity of attenuation found has also been observedin the seismic intensity attenuation pattern detected for themost important historical events, both in California andthe Iberian peninsula (Mezcua et al., 2004).
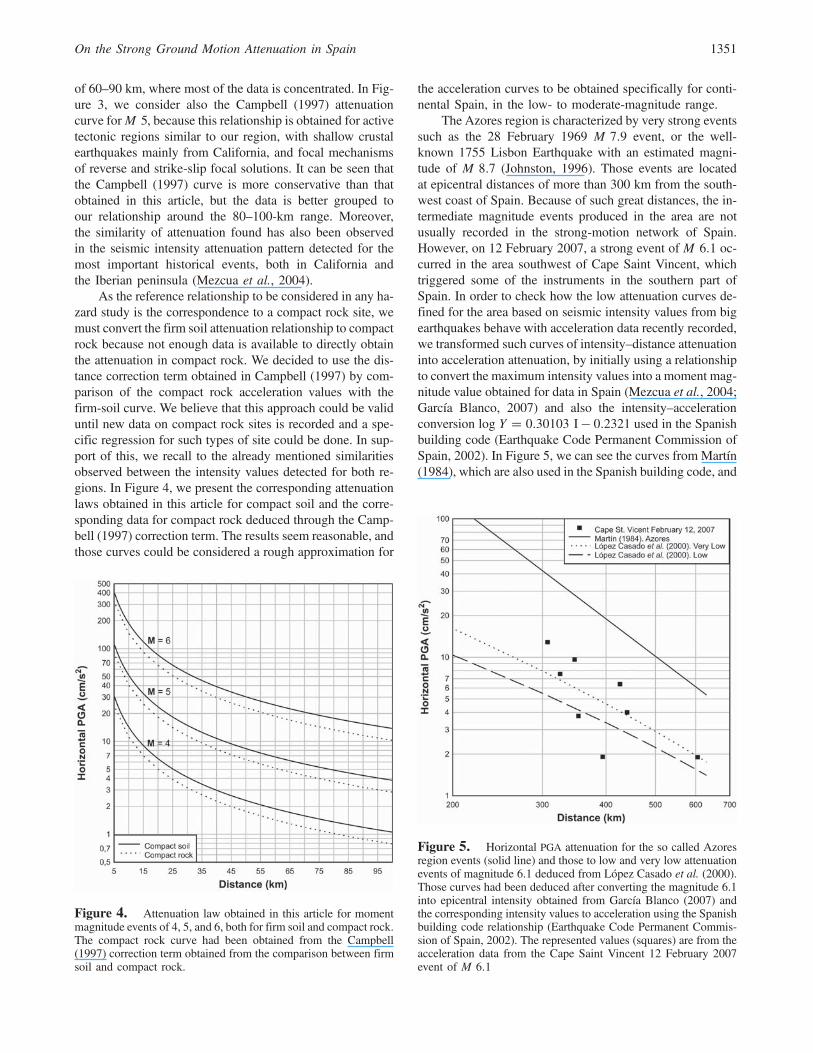
As the reference relationship to be considered in any ha-zard study is the correspondence to a compact rock site, wemust convert the firm soil attenuation relationship to compactrock because not enough data is available to directly obtainthe attenuation in compact rock. We decided to use the dis-tance correction term obtained in Campbell (1997) by com-parison of the compact rock acceleration values with thefirm-soil curve. We believe that this approach could be validuntil new data on compact rock sites is recorded and a spe-cific regression for such types of site could be done. In sup-port of this, we recall to the already mentioned similaritiesobserved between the intensity values detected for both re-gions. In Figure 4, we present the corresponding attenuationlaws obtained in this article for compact soil and the corre-sponding data for compact rock deduced through the Camp-bell (1997) correction term. The results seem reasonable, andthose curves could be considered a rough approximation for
the acceleration curves to be obtained specifically for conti-nental Spain, in the low- to moderate-magnitude range.
The Azores region is characterized by very strong eventssuch as the 28 February 1969 M 7:9 event, or the well-known 1755 Lisbon Earthquake with an estimated magni-tude of M 8:7 (Johnston, 1996). Those events are locatedat epicentral distances of more than 300 km from the south-west coast of Spain. Because of such great distances, the in-termediate magnitude events produced in the area are notusually recorded in the strong-motion network of Spain.However, on 12 February 2007, a strong event of M 6:1 oc-curred in the area southwest of Cape Saint Vincent, whichtriggered some of the instruments in the southern part ofSpain. In order to check how the low attenuation curves de-fined for the area based on seismic intensity values from bigearthquakes behave with acceleration data recently recorded,we transformed such curves of intensity–distance attenuationinto acceleration attenuation, by initially using a relationshipto convert the maximum intensity values into a moment mag-nitude value obtained for data in Spain (Mezcua et al., 2004;García Blanco, 2007) and also the intensity–accelerationconversion log Y � 0:30103 I � 0:2321 used in the Spanishbuilding code (Earthquake Code Permanent Commission ofSpain, 2002). In Figure 5, we can see the curves from Martín(1984), which are also used in the Spanish building code, and
Figure 4. Attenuation law obtained in this article for momentmagnitude events of 4, 5, and 6, both for firm soil and compact rock.The compact rock curve had been obtained from the Campbell(1997) correction term obtained from the comparison between firmsoil and compact rock.
Figure 5. Horizontal PGA attenuation for the so called Azoresregion events (solid line) and those to low and very low attenuationevents of magnitude 6.1 deduced from López Casado et al. (2000).Those curves had been deduced after converting the magnitude 6.1into epicentral intensity obtained from García Blanco (2007) andthe corresponding intensity values to acceleration using the Spanishbuilding code relationship (Earthquake Code Permanent Commis-sion of Spain, 2002). The represented values (squares) are from theacceleration data from the Cape Saint Vincent 12 February 2007event of M 6:1
On the Strong Ground Motion Attenuation in Spain 1351
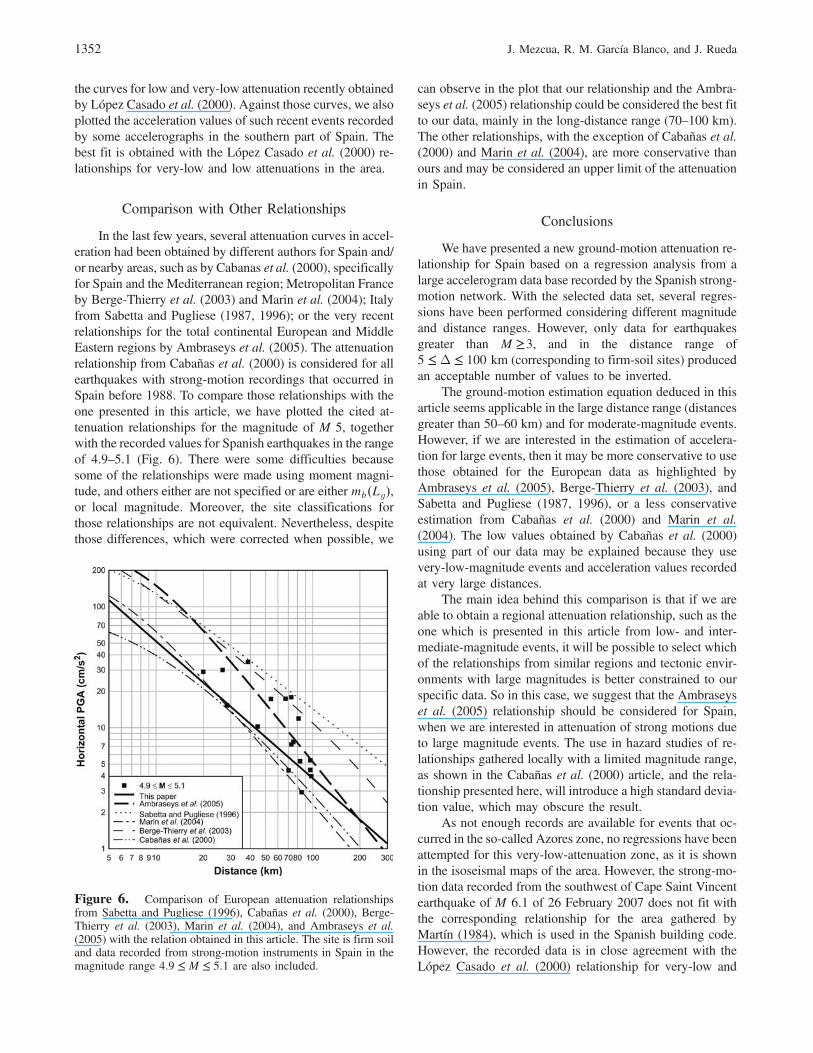
the curves for low and very-low attenuation recently obtainedby López Casado et al. (2000). Against those curves, we alsoplotted the acceleration values of such recent events recordedby some accelerographs in the southern part of Spain. Thebest fit is obtained with the López Casado et al. (2000) re-lationships for very-low and low attenuations in the area.
Comparison with Other Relationships
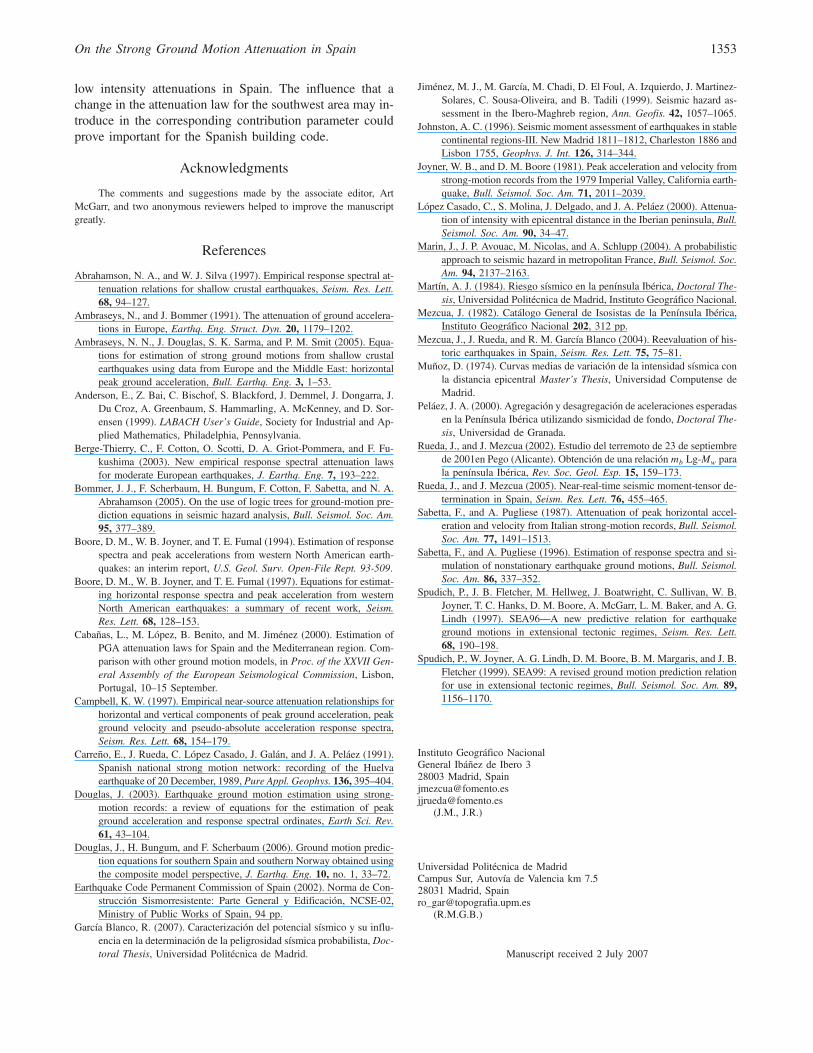
In the last few years, several attenuation curves in accel-eration had been obtained by different authors for Spain and/or nearby areas, such as by Cabanas et al. (2000), specificallyfor Spain and the Mediterranean region; Metropolitan Franceby Berge-Thierry et al. (2003) and Marin et al. (2004); Italyfrom Sabetta and Pugliese (1987, 1996); or the very recentrelationships for the total continental European and MiddleEastern regions by Ambraseys et al. (2005). The attenuationrelationship from Cabañas et al. (2000) is considered for allearthquakes with strong-motion recordings that occurred inSpain before 1988. To compare those relationships with theone presented in this article, we have plotted the cited at-tenuation relationships for the magnitude of M 5, togetherwith the recorded values for Spanish earthquakes in the rangeof 4.9–5.1 (Fig. 6). There were some difficulties becausesome of the relationships were made using moment magni-tude, and others either are not specified or are either mb�Lg�,or local magnitude. Moreover, the site classifications forthose relationships are not equivalent. Nevertheless, despitethose differences, which were corrected when possible, we
can observe in the plot that our relationship and the Ambra-seys et al. (2005) relationship could be considered the best fitto our data, mainly in the long-distance range (70–100 km).The other relationships, with the exception of Cabañas et al.(2000) and Marin et al. (2004), are more conservative thanours and may be considered an upper limit of the attenuationin Spain.
Conclusions
We have presented a new ground-motion attenuation re-lationship for Spain based on a regression analysis from alarge accelerogram data base recorded by the Spanish strong-motion network. With the selected data set, several regres-sions have been performed considering different magnitudeand distance ranges. However, only data for earthquakesgreater than M ≥3, and in the distance range of5 ≤ Δ ≤ 100 km (corresponding to firm-soil sites) producedan acceptable number of values to be inverted.
The ground-motion estimation equation deduced in thisarticle seems applicable in the large distance range (distancesgreater than 50–60 km) and for moderate-magnitude events.However, if we are interested in the estimation of accelera-tion for large events, then it may be more conservative to usethose obtained for the European data as highlighted byAmbraseys et al. (2005), Berge-Thierry et al. (2003), andSabetta and Pugliese (1987, 1996), or a less conservativeestimation from Cabañas et al. (2000) and Marin et al.(2004). The low values obtained by Cabañas et al. (2000)using part of our data may be explained because they usevery-low-magnitude events and acceleration values recordedat very large distances.
The main idea behind this comparison is that if we areable to obtain a regional attenuation relationship, such as theone which is presented in this article from low- and inter-mediate-magnitude events, it will be possible to select whichof the relationships from similar regions and tectonic envir-onments with large magnitudes is better constrained to ourspecific data. So in this case, we suggest that the Ambraseyset al. (2005) relationship should be considered for Spain,when we are interested in attenuation of strong motions dueto large magnitude events. The use in hazard studies of re-lationships gathered locally with a limited magnitude range,as shown in the Cabañas et al. (2000) article, and the rela-tionship presented here, will introduce a high standard devia-tion value, which may obscure the result.
As not enough records are available for events that oc-curred in the so-called Azores zone, no regressions have beenattempted for this very-low-attenuation zone, as it is shownin the isoseismal maps of the area. However, the strong-mo-tion data recorded from the southwest of Cape Saint Vincentearthquake of M 6:1 of 26 February 2007 does not fit withthe corresponding relationship for the area gathered byMartín (1984), which is used in the Spanish building code.However, the recorded data is in close agreement with theLópez Casado et al. (2000) relationship for very-low and
Figure 6. Comparison of European attenuation relationshipsfrom Sabetta and Pugliese (1996), Cabañas et al. (2000), Berge-Thierry et al. (2003), Marin et al. (2004), and Ambraseys et al.(2005) with the relation obtained in this article. The site is firm soiland data recorded from strong-motion instruments in Spain in themagnitude range 4:9 ≤ M ≤ 5:1 are also included.
1352 J. Mezcua, R. M. García Blanco, and J. Rueda
low intensity attenuations in Spain. The influence that achange in the attenuation law for the southwest area may in-troduce in the corresponding contribution parameter couldprove important for the Spanish building code.
Acknowledgments
The comments and suggestions made by the associate editor, ArtMcGarr, and two anonymous reviewers helped to improve the manuscriptgreatly.
References
Abrahamson, N. A., and W. J. Silva (1997). Empirical response spectral at-tenuation relations for shallow crustal earthquakes, Seism. Res. Lett.68, 94–127.
Ambraseys, N., and J. Bommer (1991). The attenuation of ground accelera-tions in Europe, Earthq. Eng. Struct. Dyn. 20, 1179–1202.
Ambraseys, N. N., J. Douglas, S. K. Sarma, and P. M. Smit (2005). Equa-tions for estimation of strong ground motions from shallow crustalearthquakes using data from Europe and the Middle East: horizontalpeak ground acceleration, Bull. Earthq. Eng. 3, 1–53.
Anderson, E., Z. Bai, C. Bischof, S. Blackford, J. Demmel, J. Dongarra, J.Du Croz, A. Greenbaum, S. Hammarling, A. McKenney, and D. Sor-ensen (1999). LABACH User’s Guide, Society for Industrial and Ap-plied Mathematics, Philadelphia, Pennsylvania.
Berge-Thierry, C., F. Cotton, O. Scotti, D. A. Griot-Pommera, and F. Fu-kushima (2003). New empirical response spectral attenuation lawsfor moderate European earthquakes, J. Earthq. Eng. 7, 193–222.
Bommer, J. J., F. Scherbaum, H. Bungum, F. Cotton, F. Sabetta, and N. A.Abrahamson (2005). On the use of logic trees for ground-motion pre-diction equations in seismic hazard analysis, Bull. Seismol. Soc. Am.95, 377–389.
Boore, D. M., W. B. Joyner, and T. E. Fumal (1994). Estimation of responsespectra and peak accelerations from western North American earth-quakes: an interim report, U.S. Geol. Surv. Open-File Rept. 93-509.
Boore, D. M., W. B. Joyner, and T. E. Fumal (1997). Equations for estimat-ing horizontal response spectra and peak acceleration from westernNorth American earthquakes: a summary of recent work, Seism.Res. Lett. 68, 128–153.
Cabañas, L., M. López, B. Benito, and M. Jiménez (2000). Estimation ofPGA attenuation laws for Spain and the Mediterranean region. Com-parison with other ground motion models, in Proc. of the XXVII Gen-eral Assembly of the European Seismological Commission, Lisbon,Portugal, 10–15 September.
Campbell, K. W. (1997). Empirical near-source attenuation relationships forhorizontal and vertical components of peak ground acceleration, peakground velocity and pseudo-absolute acceleration response spectra,Seism. Res. Lett. 68, 154–179.
Carreño, E., J. Rueda, C. López Casado, J. Galán, and J. A. Peláez (1991).Spanish national strong motion network: recording of the Huelvaearthquake of 20 December, 1989, Pure Appl. Geophys. 136, 395–404.
Douglas, J. (2003). Earthquake ground motion estimation using strong-motion records: a review of equations for the estimation of peakground acceleration and response spectral ordinates, Earth Sci. Rev.61, 43–104.
Douglas, J., H. Bungum, and F. Scherbaum (2006). Ground motion predic-tion equations for southern Spain and southern Norway obtained usingthe composite model perspective, J. Earthq. Eng. 10, no. 1, 33–72.
Earthquake Code Permanent Commission of Spain (2002). Norma de Con-strucción Sismorresistente: Parte General y Edificación, NCSE-02,Ministry of Public Works of Spain, 94 pp.
García Blanco, R. (2007). Caracterización del potencial sísmico y su influ-encia en la determinación de la peligrosidad sísmica probabilista, Doc-toral Thesis, Universidad Politécnica de Madrid.
Jiménez, M. J., M. García, M. Chadi, D. El Foul, A. Izquierdo, J. Martinez-Solares, C. Sousa-Oliveira, and B. Tadili (1999). Seismic hazard as-sessment in the Ibero-Maghreb region, Ann. Geofis. 42, 1057–1065.
Johnston, A. C. (1996). Seismic moment assessment of earthquakes in stablecontinental regions-III. New Madrid 1811–1812, Charleston 1886 andLisbon 1755, Geophys. J. Int. 126, 314–344.
Joyner, W. B., and D. M. Boore (1981). Peak acceleration and velocity fromstrong-motion records from the 1979 Imperial Valley, California earth-quake, Bull. Seismol. Soc. Am. 71, 2011–2039.
López Casado, C., S. Molina, J. Delgado, and J. A. Peláez (2000). Attenua-tion of intensity with epicentral distance in the Iberian peninsula, Bull.Seismol. Soc. Am. 90, 34–47.
Marin, J., J. P. Avouac, M. Nicolas, and A. Schlupp (2004). A probabilisticapproach to seismic hazard in metropolitan France, Bull. Seismol. Soc.Am. 94, 2137–2163.
Martín, A. J. (1984). Riesgo sísmico en la península Ibérica, Doctoral The-sis, Universidad Politécnica de Madrid, Instituto Geográfico Nacional.
Mezcua, J. (1982). Catálogo General de Isosistas de la Península Ibérica,Instituto Geográfico Nacional 202, 312 pp.
Mezcua, J., J. Rueda, and R. M. García Blanco (2004). Reevaluation of his-toric earthquakes in Spain, Seism. Res. Lett. 75, 75–81.
Muñoz, D. (1974). Curvas medias de variación de la intensidad sísmica conla distancia epicentral Master’s Thesis, Universidad Computense deMadrid.
Peláez, J. A. (2000). Agregación y desagregación de aceleraciones esperadasen la Península Ibérica utilizando sismicidad de fondo, Doctoral The-sis, Universidad de Granada.
Rueda, J., and J. Mezcua (2002). Estudio del terremoto de 23 de septiembrede 2001en Pego (Alicante). Obtención de una relaciónmb Lg-Mw parala península Ibérica, Rev. Soc. Geol. Esp. 15, 159–173.
Rueda, J., and J. Mezcua (2005). Near-real-time seismic moment-tensor de-termination in Spain, Seism. Res. Lett. 76, 455–465.
Sabetta, F., and A. Pugliese (1987). Attenuation of peak horizontal accel-eration and velocity from Italian strong-motion records, Bull. Seismol.Soc. Am. 77, 1491–1513.
Sabetta, F., and A. Pugliese (1996). Estimation of response spectra and si-mulation of nonstationary earthquake ground motions, Bull. Seismol.Soc. Am. 86, 337–352.
Spudich, P., J. B. Fletcher, M. Hellweg, J. Boatwright, C. Sullivan, W. B.Joyner, T. C. Hanks, D. M. Boore, A. McGarr, L. M. Baker, and A. G.Lindh (1997). SEA96—A new predictive relation for earthquakeground motions in extensional tectonic regimes, Seism. Res. Lett.68, 190–198.
Spudich, P., W. Joyner, A. G. Lindh, D. M. Boore, B. M. Margaris, and J. B.Fletcher (1999). SEA99: A revised ground motion prediction relationfor use in extensional tectonic regimes, Bull. Seismol. Soc. Am. 89,1156–1170.
Instituto Geográfico NacionalGeneral Ibáñez de Ibero 328003 Madrid, [email protected]@fomento.es
(J.M., J.R.)
Universidad Politécnica de MadridCampus Sur, Autovía de Valencia km 7.528031 Madrid, [email protected]
(R.M.G.B.)
Manuscript received 2 July 2007
On the Strong Ground Motion Attenuation in Spain 1353


