Embed Size (px)
Citation preview
2180
Bulletin of the Seismological Society of America, Vol. 95, No. 6, pp. 2180–2196, December 2005, doi: 10.1785/0120040223
E
Modeling Strong Ground Motion in the Wellington Metropolitan Area,
New Zealand
by Rafael Benites and Kim B. Olsen
Abstract The Wellington Metropolitan Area, New Zealand, about 35 km by10 km, is crossed by the southernmost segment of the Wellington fault, strikingroughly in the northeast–southwest direction. Numerical modeling of M 6.7 earth-quakes due to ruptures on this fault, intended to characterize the 3D effects of theregion’s main geological features on the ground motion, are performed by using afinite-differences scheme with staggered grid, for frequencies up to 1.5 Hz. We con-sider the part of the Wellington fault that crosses the Wellington Metropolitan Regionas an almost vertical strike-slip fault, 30 km long, and with slip distribution historytaken from the slip history of the 1992 M 7.3 Landers, California, earthquake. The3D stratigraphy of the region has been built by integrating all available geologicaland geophysical data. Results of the modeling show several dominant features. Whenthe fault ruptures from south to north, resonance occurs within a small area close tothe harbor, where the depth of the basin is largest. This resonance produces a trainof seismic waves traveling northward with dominant frequency of about 0.5 Hz. Asthe rupture propagates into the harbor, the radiated wavefield focuses on the LowerHutt Valley, to the north, due to the presence of a ridge that rises up from the bottomof the harbor to emerge as Somes Island. This effect considerably enhances theincident seismic energy in the valley, particularly the horizontal motions. Furtherfocusing occurs due to the triangular shape of the Lower Hutt Valley, whose alluvialdeposits exhibit large impedance contrasts with the surrounding bedrock. The com-bined focusing effects produce amplification factors in the valley of about 5 between0.5 Hz and 0.7 Hz. In Wellington City the amplification factors are between 0.5(deamplification) and 2, except for an area on reclaimed land in the harbor, whichshows an amplification factor as large as 9. After the rupture has stopped, higherfrequency waves, between 1 and 1.2 Hz, appear trapped (reverberating) in the harborfor the remaining duration of the seismograms, up to 60 sec. On the other hand,when the rupture is from north to south, none of the focusing effects occur. Only thelong-lasting reverberations in the harbor seem a characteristic of the wave propa-gation common to both rupture directions. Nevertheless, the amplification factors inthis north-to-south scenario are about the same as for the south-to-north rupture.
Online material: Movies of Wellington Fault rupture scenarios.
Introduction
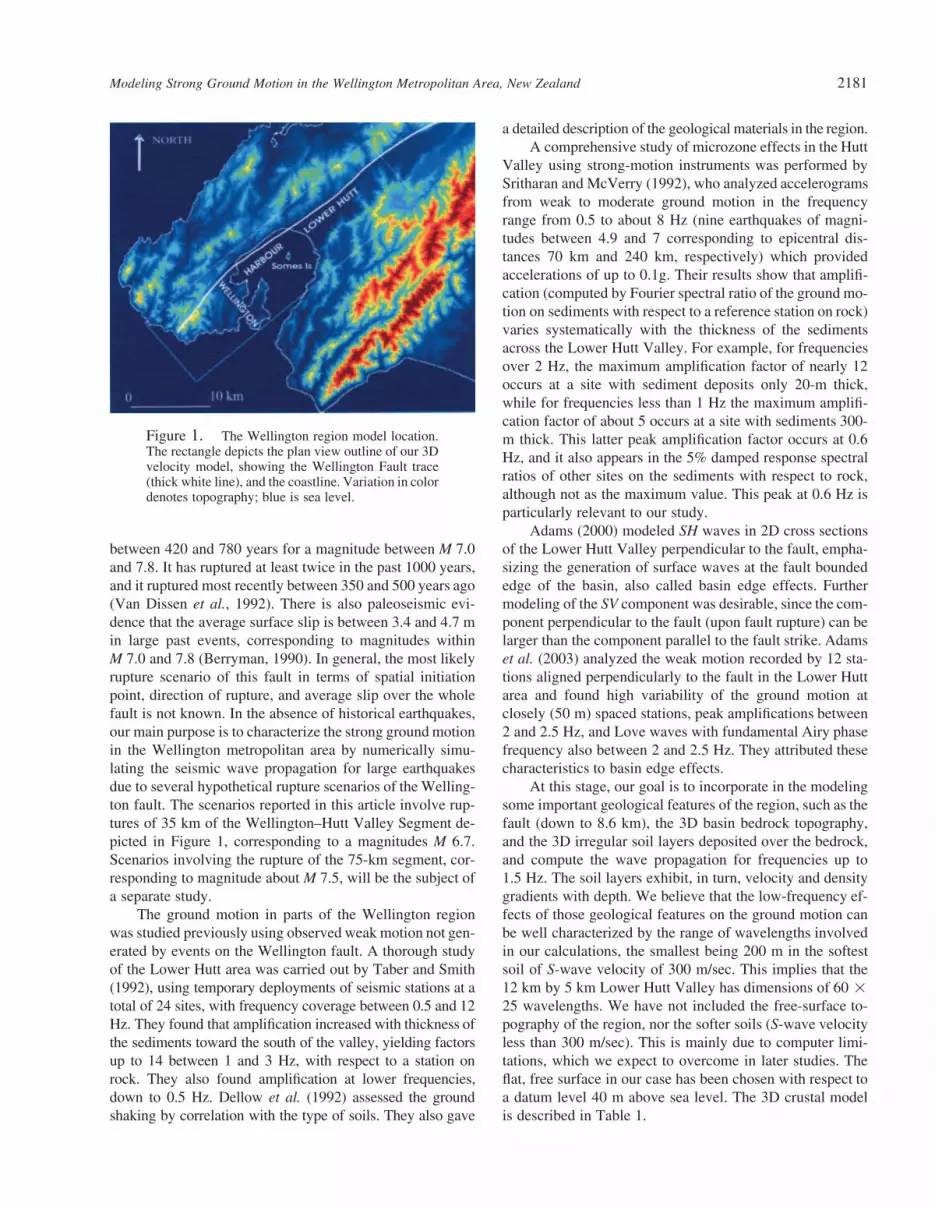
Our study considers the cities of Wellington and LowerHutt as the Wellington Metropolitan area, on the North Is-land of New Zealand. In plan view this is a rectangular areaof about 10 km by 35 km, with areas of modern urban de-velopment, business districts, and industrial infrastructure.Figure 1 shows the model location and the Wellington fault,enclosed by the white line rectangle, in the southern tip ofthe North Island. This region is crossed by the southernmost
segment of the Wellington fault, of about 75-km length,called the Wellington–Hutt Valley Segment (Langridge etal., 2005; Berryman, 1990).
There have been no major earthquakes on this fault seg-ment known to European settlers (since about 1840), butpaleoseismic studies reveal that this is an active fault, withan almost vertical fault plane extending to about 20-kmdepth, of strike-slip mechanism, and with a return period
Modeling Strong Ground Motion in the Wellington Metropolitan Area, New Zealand 2181
Figure 1. The Wellington region model location.The rectangle depicts the plan view outline of our 3Dvelocity model, showing the Wellington Fault trace(thick white line), and the coastline. Variation in colordenotes topography; blue is sea level.
between 420 and 780 years for a magnitude between M 7.0and 7.8. It has ruptured at least twice in the past 1000 years,and it ruptured most recently between 350 and 500 years ago(Van Dissen et al., 1992). There is also paleoseismic evi-dence that the average surface slip is between 3.4 and 4.7 min large past events, corresponding to magnitudes withinM 7.0 and 7.8 (Berryman, 1990). In general, the most likelyrupture scenario of this fault in terms of spatial initiationpoint, direction of rupture, and average slip over the wholefault is not known. In the absence of historical earthquakes,our main purpose is to characterize the strong ground motionin the Wellington metropolitan area by numerically simu-lating the seismic wave propagation for large earthquakesdue to several hypothetical rupture scenarios of the Welling-ton fault. The scenarios reported in this article involve rup-tures of 35 km of the Wellington–Hutt Valley Segment de-picted in Figure 1, corresponding to a magnitudes M 6.7.Scenarios involving the rupture of the 75-km segment, cor-responding to magnitude about M 7.5, will be the subject ofa separate study.
The ground motion in parts of the Wellington regionwas studied previously using observed weak motion not gen-erated by events on the Wellington fault. A thorough studyof the Lower Hutt area was carried out by Taber and Smith(1992), using temporary deployments of seismic stations at atotal of 24 sites, with frequency coverage between 0.5 and 12Hz. They found that amplification increased with thickness ofthe sediments toward the south of the valley, yielding factorsup to 14 between 1 and 3 Hz, with respect to a station onrock. They also found amplification at lower frequencies,down to 0.5 Hz. Dellow et al. (1992) assessed the groundshaking by correlation with the type of soils. They also gave
a detailed description of the geological materials in the region.A comprehensive study of microzone effects in the Hutt
Valley using strong-motion instruments was performed bySritharan and McVerry (1992), who analyzed accelerogramsfrom weak to moderate ground motion in the frequencyrange from 0.5 to about 8 Hz (nine earthquakes of magni-tudes between 4.9 and 7 corresponding to epicentral dis-tances 70 km and 240 km, respectively) which providedaccelerations of up to 0.1g. Their results show that amplifi-cation (computed by Fourier spectral ratio of the ground mo-tion on sediments with respect to a reference station on rock)varies systematically with the thickness of the sedimentsacross the Lower Hutt Valley. For example, for frequenciesover 2 Hz, the maximum amplification factor of nearly 12occurs at a site with sediment deposits only 20-m thick,while for frequencies less than 1 Hz the maximum amplifi-cation factor of about 5 occurs at a site with sediments 300-m thick. This latter peak amplification factor occurs at 0.6Hz, and it also appears in the 5% damped response spectralratios of other sites on the sediments with respect to rock,although not as the maximum value. This peak at 0.6 Hz isparticularly relevant to our study.
Adams (2000) modeled SH waves in 2D cross sectionsof the Lower Hutt Valley perpendicular to the fault, empha-sizing the generation of surface waves at the fault boundededge of the basin, also called basin edge effects. Furthermodeling of the SV component was desirable, since the com-ponent perpendicular to the fault (upon fault rupture) can belarger than the component parallel to the fault strike. Adamset al. (2003) analyzed the weak motion recorded by 12 sta-tions aligned perpendicularly to the fault in the Lower Huttarea and found high variability of the ground motion atclosely (50 m) spaced stations, peak amplifications between2 and 2.5 Hz, and Love waves with fundamental Airy phasefrequency also between 2 and 2.5 Hz. They attributed thesecharacteristics to basin edge effects.
At this stage, our goal is to incorporate in the modelingsome important geological features of the region, such as thefault (down to 8.6 km), the 3D basin bedrock topography,and the 3D irregular soil layers deposited over the bedrock,and compute the wave propagation for frequencies up to1.5 Hz. The soil layers exhibit, in turn, velocity and densitygradients with depth. We believe that the low-frequency ef-fects of those geological features on the ground motion canbe well characterized by the range of wavelengths involvedin our calculations, the smallest being 200 m in the softestsoil of S-wave velocity of 300 m/sec. This implies that the12 km by 5 km Lower Hutt Valley has dimensions of 60 !25 wavelengths. We have not included the free-surface to-pography of the region, nor the softer soils (S-wave velocityless than 300 m/sec). This is mainly due to computer limi-tations, which we expect to overcome in later studies. Theflat, free surface in our case has been chosen with respect toa datum level 40 m above sea level. The 3D crustal modelis described in Table 1.

2182 R. Benites and K. B. Olsen
Table 13D Crustal Model Specification
Description
S-WaveVelocity(m/sec)
Density(kg/m3)
Soft Last Glacial sediments 300 2200Stiff Last Interglacial sediments 330 2275Poorly consolidated Waimea sediments 460 2359Poorly consolidated Kororo Interglacial
sediments475 2365
Stiff Waimaunga Glacial sediments 610 2415Stiff Brunswick Interglacial sediments 615 2417Stiff weathered undifferentiated sediments 700 2421Lithified, fractured basement rock (graywacke) 1500 2744
The Wellington Fault and the MetropolitanRegion’s Crustal Model
We consider the Wellington Fault as a vertical strike-slip fault 35 km long and 8.6 km wide, that is, of area ofabout 301 km2, or 70% of the equivalent fault area that rup-tured during the 1994 M 6.7 Northridge, California, earth-quake. Such a length is just under one half of the total lengthof the Wellington–Hutt Valley fault segment, which is ex-pected to break in the event of a characteristic earthquake ofM 7". Both the 35-km length and the 8.6-km width of thefault are chosen here to comply with the computer limita-tions imposed by the maximum physical size of the model.In addition, this section of the fault has been divided into 13segments in order to accommodate the corresponding curvedsurface trace (Berryman, 1990).
The fault is embedded in a 3D stratigraphic model ofthe Wellington metropolitan area, generated from the inte-gration of all available geological and geophysical (bore-hole, bathymetry, gravity, and seismic) data, down to about800-m depth. This determines three irregular layers of sed-iments over bedrock (graywacke) in the Lower Hutt Valleyand the harbor areas, with S-wave velocity varying between300 m/sec and 500 m/sec in the top layer, 475 m/sec and700 m/sec in the middle layer, and 700 m/sec and 1500 m/sec in the bottom layer. The S-wave velocity of the bedrockis 1500 m/sec, and the depth of the basin–bedrock interfacevaries between 0 m (free surface) and 580 m. The bedrockinterface extends down to 900-m depth, where we incorpo-rate the standard Wellington 1D crustal model routinely usedfor hypocenter determination (Robinson, 1986) to representthe medium below, down to 10-km depth. From this modelwe have taken Vp # 5400 m/sec, Vs # 3200 m/sec, and q# 2744 kg/m3 as representative of the upper 5 km (Fig. 2).
The details of the soils in the basin are listed in Table1 and depicted in Figure 2; in all cases we have assumed aPoisson ratio of 0.25 and assigned values of density accord-ing to the values suggested by Grant and West, (1965) (theirfigures 7-1 and 7-7), assuming wet bulk density. In Figure2, (a) and (b) show the topography of the free surface of theregion (water not included) and the topography of the bed-
rock, respectively. The blue line in (a) is the datum leveltaken as the flat free-surface for the modeling. In betweenthese two surfaces are the layers of soils described above,illustrated by the interfaces in (c), cut along the line AB$ in(a). These are, from bottom to top, the graywacke bedrock(blue), the stiff Brunswick interglacial sediments (lightbrown), the poorly consolidated Waimea sediments (brown),and the soft Last Glacial sediments (gray). In (d) we illustratethe position of the bedrock topography of the Wellingtonregion model with respect to the 1D model of Robinson(1986).
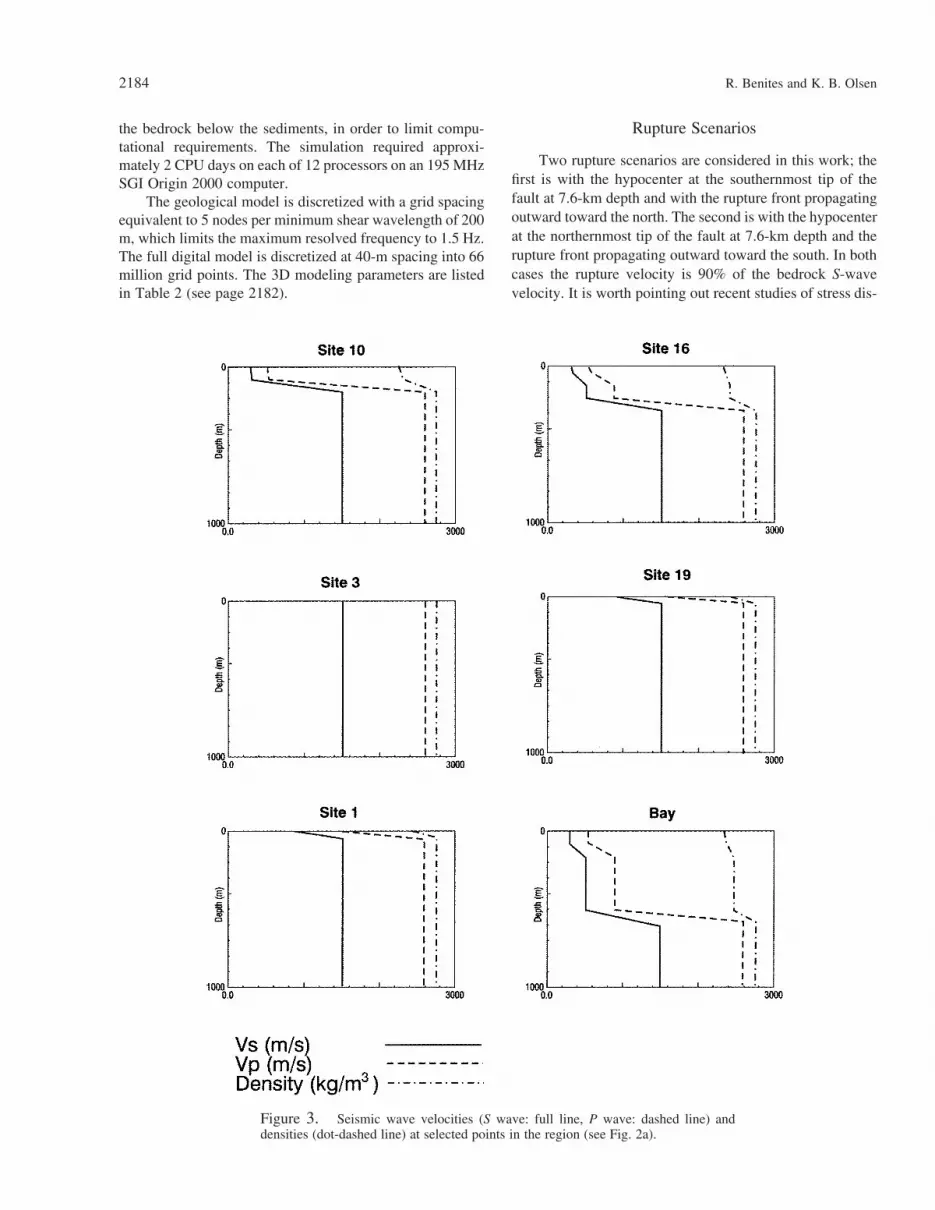
As pointed out above, the P and S velocities and densityprofiles of each layer of sediments exhibit gradients. The 3Dvariability of the seismic-wave velocities and density isshown in Figure 3, for five sites indicated in Figure 2a. Theprofile “Bay” is on the fault just below the profile AB, wherethe basin is deepest.
Method
Numerical modeling of earthquakes and seismic-wavepropagation in realistic, 3D geological structures to studystrong ground motion has become possible thanks to theadvent of large, efficient computers. The most commonlyused numerical method for that purpose is finite differences(e.g., Olsen, 1994; Graves 1996). In this work we use thefinite-differences scheme of Olsen (1994, 2000), with ac-curacy of fourth order in space and second order in time. Acoarse-grained viscoelasticity approach (Day, 1998) is usedto calculate anelastic attenuation (Q) in the part of the modelcontaining the sediments (0- to 900-m depth) that is imple-mented with stress relaxation independently for both P andS waves using a standard linear solid. We assume that Qs #0.02 Vs (m/sec) for Vs ! 1500 m/sec and Qs#0.1 Vs (m/sec)for Vs " 1500 m/sec, and Qp # 1.5Qs. This relationship wasfound to provide the best fit to observed peak velocities forthe 1994 Northridge earthquake in the Los Angeles basin(Olsen et al., 2003). A purely elastic scheme is applied to
Table 23D Modeling Parameters
Spatial discretization (m) 40Temporal discretization (sec) 0.0035Lowest P-wave velocity (km/sec) 0.52Lowest S-wave velocity (km/sec) 0.3Lowest density (kg/m3) 2,254Highest P-wave velocity (km/sec) 5.4Highest S-wave velocity (km/sec) 3.4Highest density (kg/m3) 2,744Number of grid points along 50# 955Number of grid points along 320# 290Number of grid points along vertical 240Hypocentral depth (km) 7.6Number of timesteps 17,143Simulation time (sec) 60

Modeling Strong Ground Motion in the Wellington Metropolitan Area, New Zealand 2183
Figure 2. (a) The full free-surface digitalmodel, the blue line is the shoreline, (b) bed-rock (graywacke) basin interface. The model is30 km long (north is up) and 10 km wide. Thegrid spacing is 40 m. (c) A cross section alongthe line AB$ in (a), crossing the harbour, touch-ing the southern tip of the Somes Island. Thereare three layers of soils (four interfaces) in be-tween the free-surface and the basin bedrocktopographies, depicted by the four plots, de-scribed in the text. In (d) we illustrate the po-sition of the bedrock interface with respect tothe 1-D model used for hypocenter location(Robinson, 1986).
2184 R. Benites and K. B. Olsen
the bedrock below the sediments, in order to limit compu-tational requirements. The simulation required approxi-mately 2 CPU days on each of 12 processors on an 195 MHzSGI Origin 2000 computer.
The geological model is discretized with a grid spacingequivalent to 5 nodes per minimum shear wavelength of 200m, which limits the maximum resolved frequency to 1.5 Hz.The full digital model is discretized at 40-m spacing into 66million grid points. The 3D modeling parameters are listedin Table 2 (see page 2182).
Rupture Scenarios
Two rupture scenarios are considered in this work; thefirst is with the hypocenter at the southernmost tip of thefault at 7.6-km depth and with the rupture front propagatingoutward toward the north. The second is with the hypocenterat the northernmost tip of the fault at 7.6-km depth and therupture front propagating outward toward the south. In bothcases the rupture velocity is 90% of the bedrock S-wavevelocity. It is worth pointing out recent studies of stress dis-
Figure 3. Seismic wave velocities (S wave: full line, P wave: dashed line) anddensities (dot-dashed line) at selected points in the region (see Fig. 2a).

Modeling Strong Ground Motion in the Wellington Metropolitan Area, New Zealand 2185
tributions (Han 2003) that show that the level of stress be-neath the Cook Strait section of the fault may be high, fa-voring a rupture direction from south to north.
The rupture scenarios are kinematically simulated byusing a variable slip distribution, as in Olsen (2000), withslip values taken from the kinematic inversion results ofWald and Heaton (1994) for the M 7.3, 1992 Landers, Cali-
fornia, earthquake. The slip distributions are incorporated on100 subfaults (5 ! 20). The slip rate function is of triangularshape, with a rise time of 2 sec. The source is implementedin the finite-difference grid by adding %Mij(t)/V to Sij(t),where Mij(t) is the ijth component of the moment tensor forthe earthquake, V # dx3 is the cell volume, and Sij(t) is theijth component of the stress tensor on the fault at time t. The
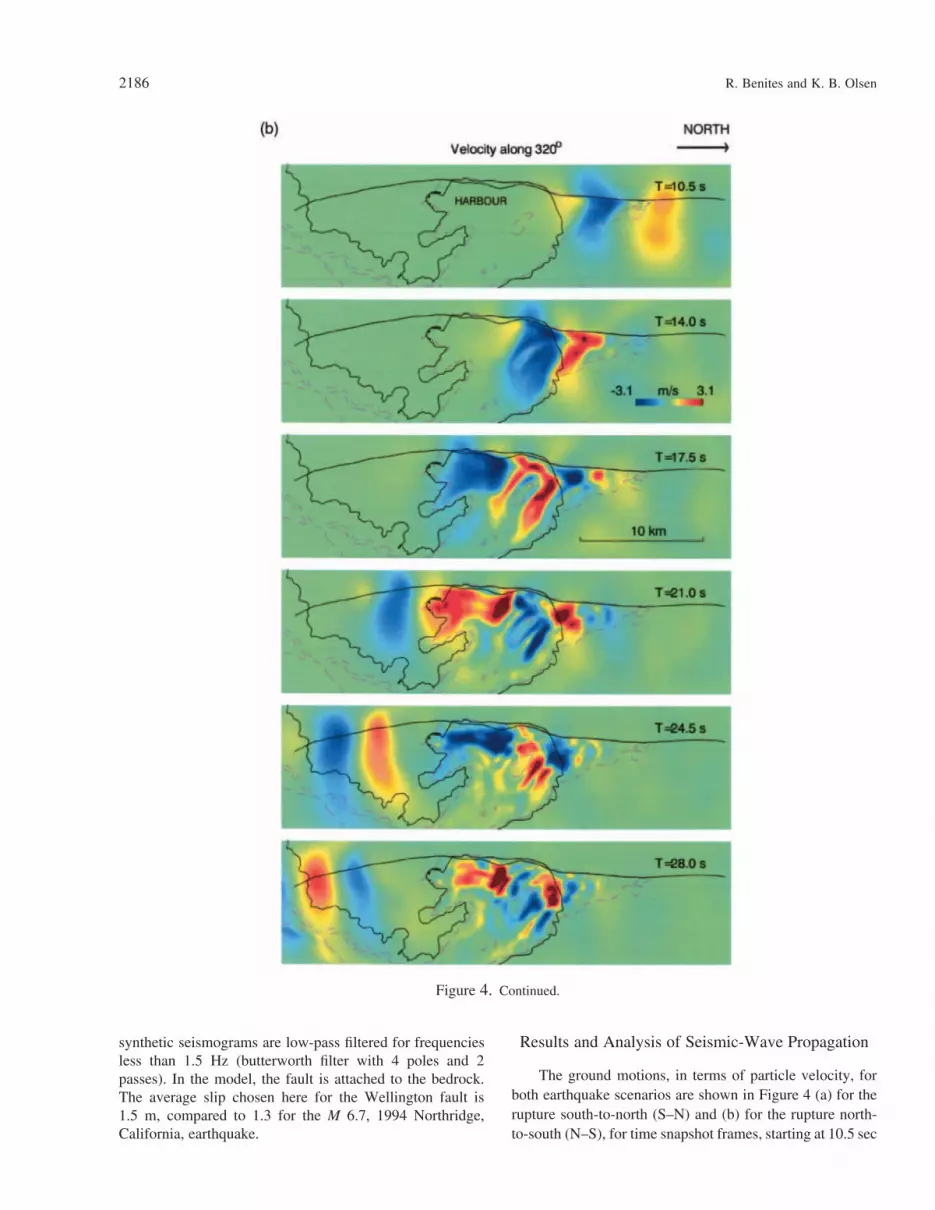
Figure 4. Time snapshots at five selectedtimes T of the ground motion in the Wellingtonregion, for the component perpendicular to thefault strike (320# from the true north). Thewhole region has been rotated 50# clockwisewith respect to the true north. (a) South-to-north rupture; (b) north-to-south rupture.
(continued on next page)
2186 R. Benites and K. B. Olsen
synthetic seismograms are low-pass filtered for frequenciesless than 1.5 Hz (butterworth filter with 4 poles and 2passes). In the model, the fault is attached to the bedrock.The average slip chosen here for the Wellington fault is1.5 m, compared to 1.3 for the M 6.7, 1994 Northridge,California, earthquake.
Results and Analysis of Seismic-Wave Propagation
The ground motions, in terms of particle velocity, forboth earthquake scenarios are shown in Figure 4 (a) for therupture south-to-north (S–N) and (b) for the rupture north-to-south (N–S), for time snapshot frames, starting at 10.5 sec
Figure 4. Continued.
Modeling Strong Ground Motion in the Wellington Metropolitan Area, New Zealand 2187
after the rupture initiation and at increments of 3.5 sec. Fordisplay purposes, we have rotated the plan view of the region(the white line represents the fault) 50# clockwise fromnorth, using the directions 50# and 320#, clockwise fromnorth, to describe the horizontal components of the groundmotion. In Figure 4 the motion in both cases corresponds tothe component perpendicular to the strike of the fault (i.e.,$320# from true north).
The snapshots show that the seismic response of theregion depends on the rupture direction, in particular for thelarge wavelengths (corresponding to periods " 1 sec). For
small wavelengths (periods ! 1 sec) the ground motionseems to be confined to the Wellington harbor only, wherethe duration of the seismograms is the largest, for both rup-ture directions.
In the case of a south–north rupture there are two dom-inant effects. The first is resonance, of periods between 2.4and 3.3 sec, toward the northern part of Wellington harbor,close to the fault, where the depth of the sediments is greatest(580 m) in the model. The second is focusing of the incidentwave on the Lower Hutt area due to the shape of the bedrock(like a prolated ridge) that emerges in the Wellington harbor
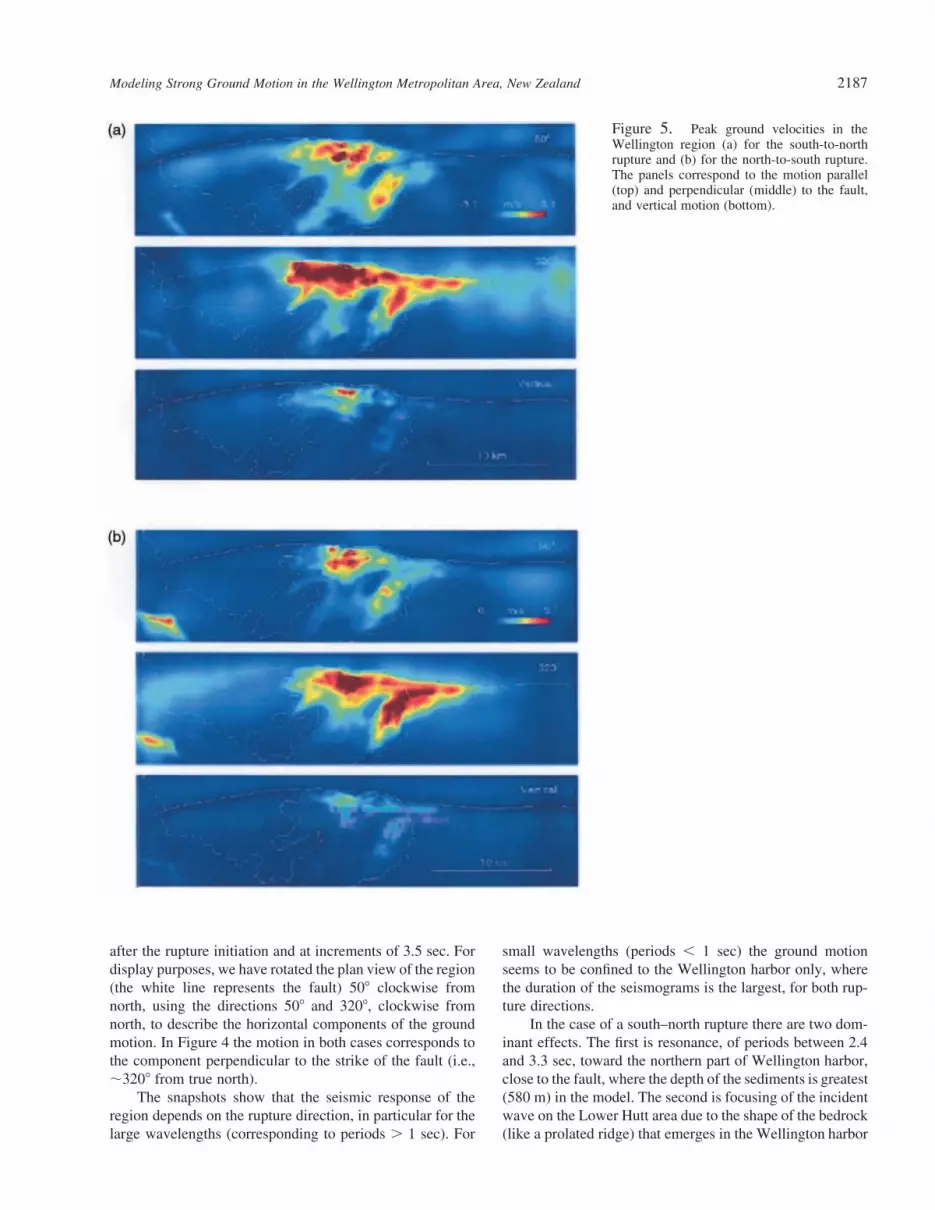
Figure 5. Peak ground velocities in theWellington region (a) for the south-to-northrupture and (b) for the north-to-south rupture.The panels correspond to the motion parallel(top) and perpendicular (middle) to the fault,and vertical motion (bottom).
2188 R. Benites and K. B. Olsen
as Somes Island. We note that the triangular shape of theLower Hutt Valley, with the bedrock pinching out towardthe north, may also impose focusing on the horizontal com-ponents of the wavefield, but quantifying this effect properlywould require further modeling. In the case of the north–south rupture, large amplitudes are also observed in the har-bor for the same periods as for the south–north rupture, anddeflection of the seismic energy by the Somes Island, asopposite to the focusing in the south–north case. Since thisis a rather descriptive characterization of the wave propa-gation, the reader is encouraged to observe the animationsin the supplement ( E available in the electronic edition ofBSSA.).
Considering the three components of motion, the am-plitudes of both the component parallel to the fault strike(50#) and the vertical component are, in general, about 10%larger for the south–north rupture than for the north–south,while the component perpendicular to the fault strike (320#)is about the same for both rupture directions. This can beseen in Figure 5, where the spatial distributions of maximumamplitudes for the three components are shown (a) for thesouth–north rupture and (b) for the north–south rupture. Wehave calculated the absolute peak values of the motion atevery grid point on the surface of the model. From theseresults we conclude that, in general, the maximum ampli-tudes of ground motion in the Wellington region are aboutthe same for both rupture directions, but their spatial distri-bution depends on the rupture direction. The seismic radia-tion from the fault is basically the same for both rupturedirections, except for slight differences imposed, in our case,by the assumed fault segmentation and by the slip distribu-tion on the fault plane.
The peak ground motions, in terms of particle velocity,rendered by the modeling are quite large, up to about 3 m/sec. The largest peak velocities occur mostly in the harborand most likely are due to the thicker soft sediments therethan elsewhere in the region. To our knowledge, one of thelargest reported peak ground velocities in the near field(within 5 km of the surface rupture) is for the Rinaldi re-ceiving station during the 1994 Mw 6.7 Northridge earth-quake of 1.77 m/sec, corresponding to 0.85g acceleration(Hall et al., 1995).
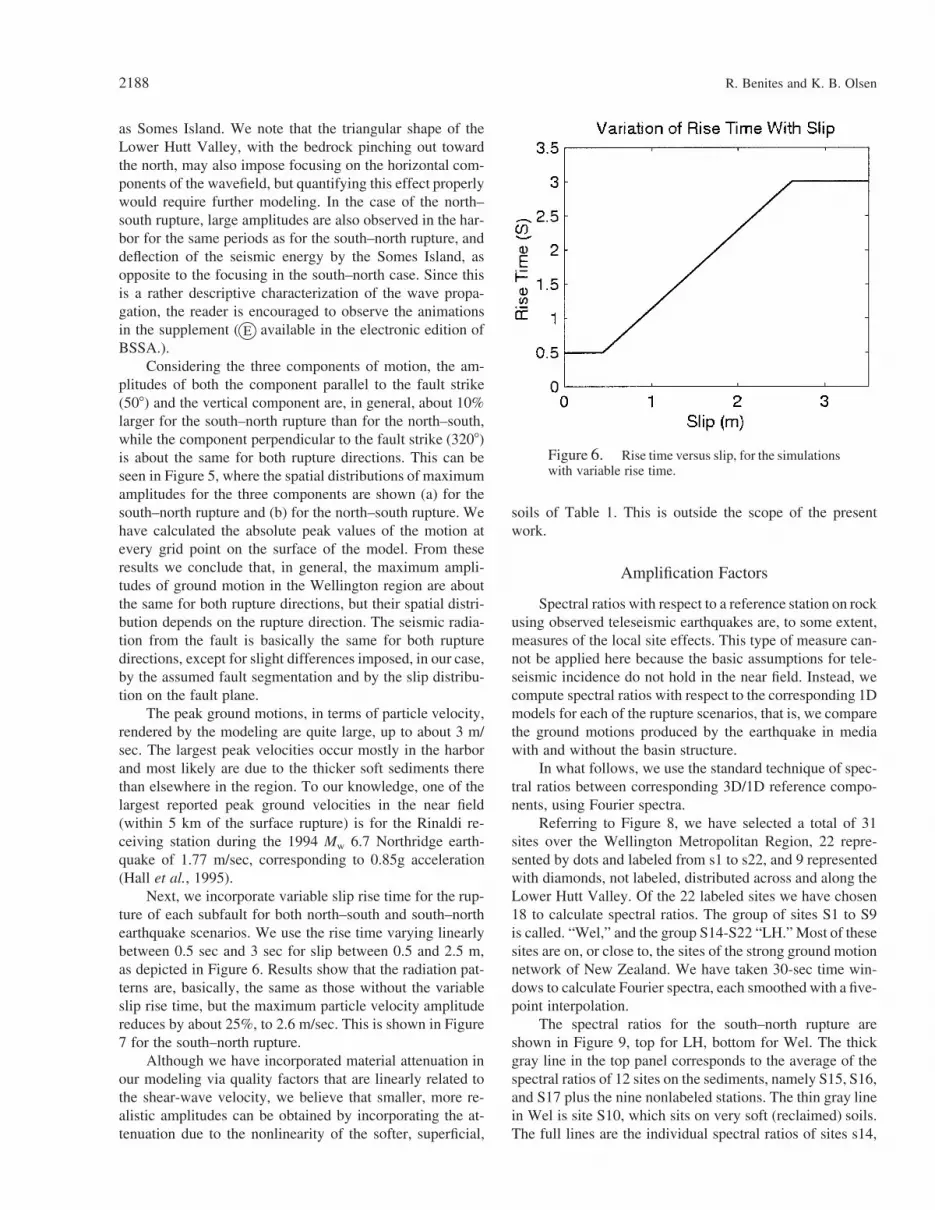
Next, we incorporate variable slip rise time for the rup-ture of each subfault for both north–south and south–northearthquake scenarios. We use the rise time varying linearlybetween 0.5 sec and 3 sec for slip between 0.5 and 2.5 m,as depicted in Figure 6. Results show that the radiation pat-terns are, basically, the same as those without the variableslip rise time, but the maximum particle velocity amplitudereduces by about 25%, to 2.6 m/sec. This is shown in Figure7 for the south–north rupture.
Although we have incorporated material attenuation inour modeling via quality factors that are linearly related tothe shear-wave velocity, we believe that smaller, more re-alistic amplitudes can be obtained by incorporating the at-tenuation due to the nonlinearity of the softer, superficial,
soils of Table 1. This is outside the scope of the presentwork.
Amplification Factors
Spectral ratios with respect to a reference station on rockusing observed teleseismic earthquakes are, to some extent,measures of the local site effects. This type of measure can-not be applied here because the basic assumptions for tele-seismic incidence do not hold in the near field. Instead, wecompute spectral ratios with respect to the corresponding 1Dmodels for each of the rupture scenarios, that is, we comparethe ground motions produced by the earthquake in mediawith and without the basin structure.
In what follows, we use the standard technique of spec-tral ratios between corresponding 3D/1D reference compo-nents, using Fourier spectra.
Referring to Figure 8, we have selected a total of 31sites over the Wellington Metropolitan Region, 22 repre-sented by dots and labeled from s1 to s22, and 9 representedwith diamonds, not labeled, distributed across and along theLower Hutt Valley. Of the 22 labeled sites we have chosen18 to calculate spectral ratios. The group of sites S1 to S9is called. “Wel,” and the group S14-S22 “LH.” Most of thesesites are on, or close to, the sites of the strong ground motionnetwork of New Zealand. We have taken 30-sec time win-dows to calculate Fourier spectra, each smoothed with a five-point interpolation.
The spectral ratios for the south–north rupture areshown in Figure 9, top for LH, bottom for Wel. The thickgray line in the top panel corresponds to the average of thespectral ratios of 12 sites on the sediments, namely S15, S16,and S17 plus the nine nonlabeled stations. The thin gray linein Wel is site S10, which sits on very soft (reclaimed) soils.The full lines are the individual spectral ratios of sites s14,
Figure 6. Rise time versus slip, for the simulationswith variable rise time.

Modeling Strong Ground Motion in the Wellington Metropolitan Area, New Zealand 2189
s18, s19, s20, s21, and s22 in LH, and s1, s2, s3, s4, s5, s7and s9 in Wel. In general, these full lines correspond to siteson or nearby rock.
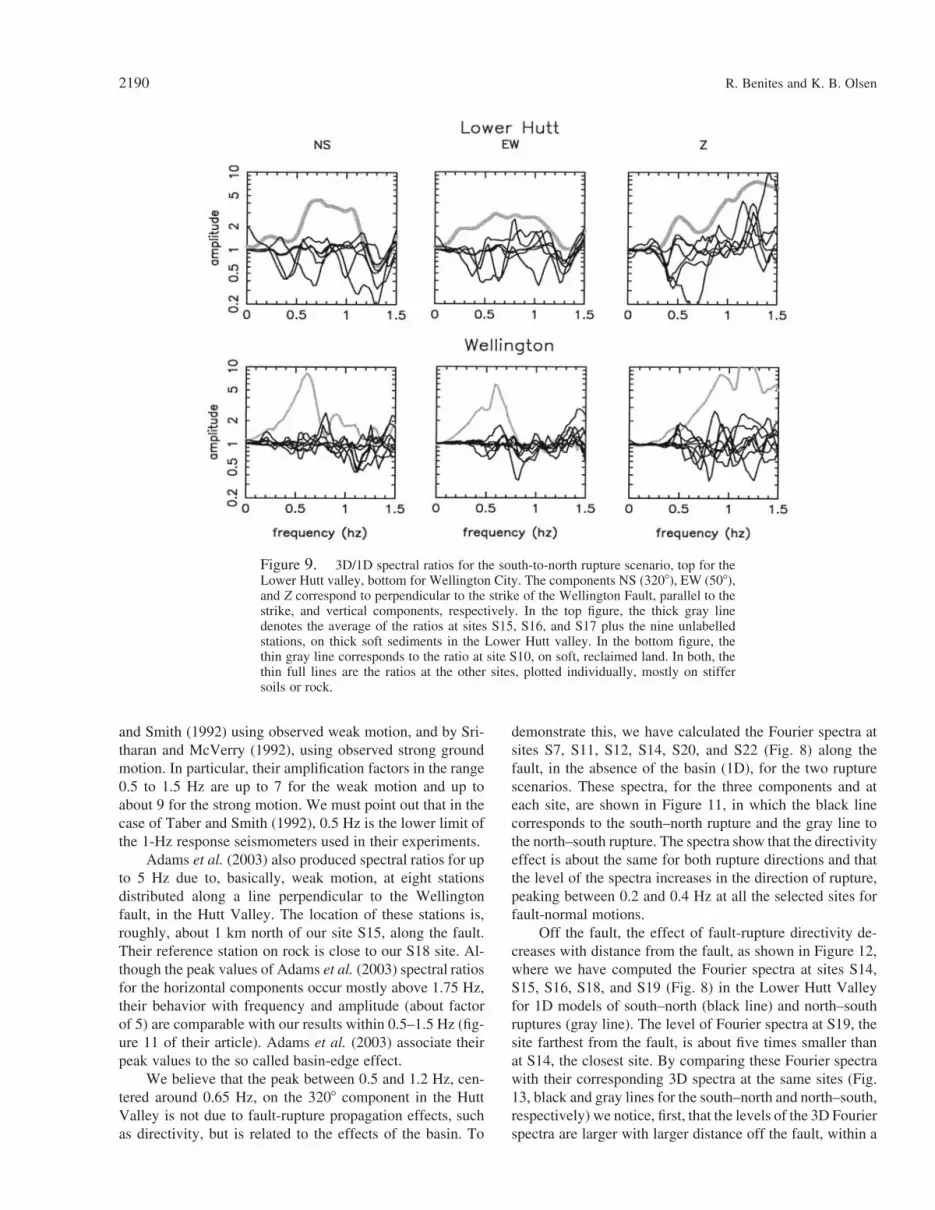
The peak of the average spectral ratios between 0.5 and1.2 Hz determines that the maximum amplification in theregion, a factor of 5, occurs on the sediments of the LowerHutt Valley, on the 320# component. A less prominent peakalso occurs for the other components, between 0.5 and1.2 Hz, yielding amplification factors of up to 3. The ratiosfor the other sites in Lower Hutt seldom exceed a factor of2, and on the 320# component the ratios show tendency tofall off below 1, suggesting deamplification. In Wellingtonthe responses are, basically, flat around 1, suggesting no am-plification. The exception is site s10, whose response is simi-lar to that of the Lower Hutt sediments.
The spectral ratios for the north–south rupture areshown in Figure 10, arranged in the same way as those inFigure 9. A peak between 0.5 and 1.0 Hz, centered around0.7 Hz, appears with amplitudes up to 3 on each of the hor-izontal components. The responses of the other sites in theLower Hutt Valley show similar variability as those for thesouth–north rupture, while the responses in Wellington showmore variability than those for the south–north rupture, in-dividually exceeding factors of 4. The response of site S10,again, has similar characteristics to that of the sediments inLower Hutt, peaking between 0.5 and 0.7 Hz, with maxi-mum amplitude 4 on the 320# component.
It must be noted that in the Lower Hutt Valley ampli-fication factors on the horizontal motion of over 10 at fre-quencies between 0.5 and 8 Hz have been reported by Taber
Figure 8. Selected sites in the Wellington Region used to calculate site effects.Colors denote free-surface topography (blue is sea level), and the white line the shoreof the harbor, along with the fault.
Figure 7. The ground motion for the south-to-north rupture using variable slip rise time(VSRT) for the ruptures at each subfault. Top,middle, and bottom panels are defined as inFigure 5. Note that the maximum amplitude issmaller than that without VSRT, in Figure 5.
2190 R. Benites and K. B. Olsen
and Smith (1992) using observed weak motion, and by Sri-tharan and McVerry (1992), using observed strong groundmotion. In particular, their amplification factors in the range0.5 to 1.5 Hz are up to 7 for the weak motion and up toabout 9 for the strong motion. We must point out that in thecase of Taber and Smith (1992), 0.5 Hz is the lower limit ofthe 1-Hz response seismometers used in their experiments.
Adams et al. (2003) also produced spectral ratios for upto 5 Hz due to, basically, weak motion, at eight stationsdistributed along a line perpendicular to the Wellingtonfault, in the Hutt Valley. The location of these stations is,roughly, about 1 km north of our site S15, along the fault.Their reference station on rock is close to our S18 site. Al-though the peak values of Adams et al. (2003) spectral ratiosfor the horizontal components occur mostly above 1.75 Hz,their behavior with frequency and amplitude (about factorof 5) are comparable with our results within 0.5–1.5 Hz (fig-ure 11 of their article). Adams et al. (2003) associate theirpeak values to the so called basin-edge effect.
We believe that the peak between 0.5 and 1.2 Hz, cen-tered around 0.65 Hz, on the 320# component in the HuttValley is not due to fault-rupture propagation effects, suchas directivity, but is related to the effects of the basin. To
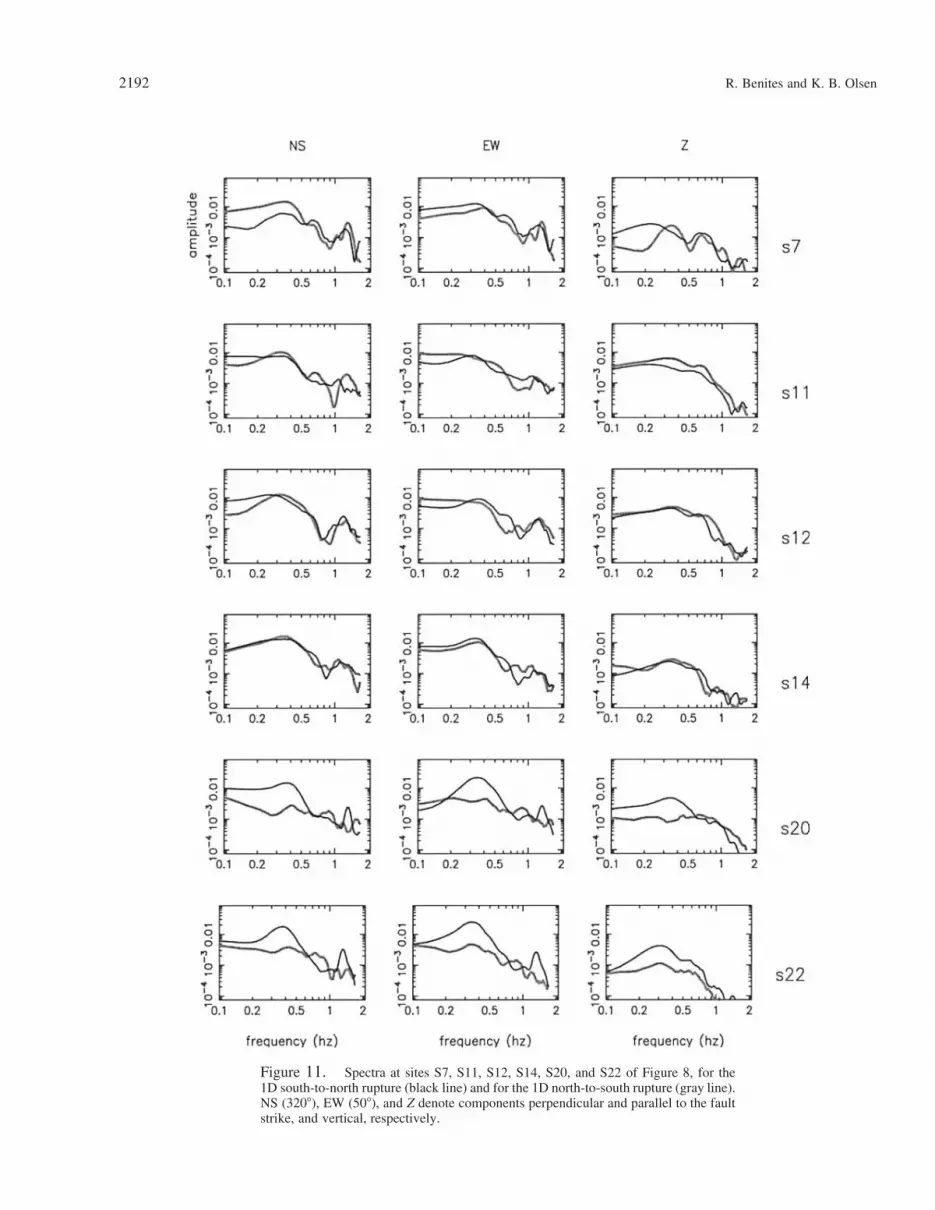
demonstrate this, we have calculated the Fourier spectra atsites S7, S11, S12, S14, S20, and S22 (Fig. 8) along thefault, in the absence of the basin (1D), for the two rupturescenarios. These spectra, for the three components and ateach site, are shown in Figure 11, in which the black linecorresponds to the south–north rupture and the gray line tothe north–south rupture. The spectra show that the directivityeffect is about the same for both rupture directions and thatthe level of the spectra increases in the direction of rupture,peaking between 0.2 and 0.4 Hz at all the selected sites forfault-normal motions.
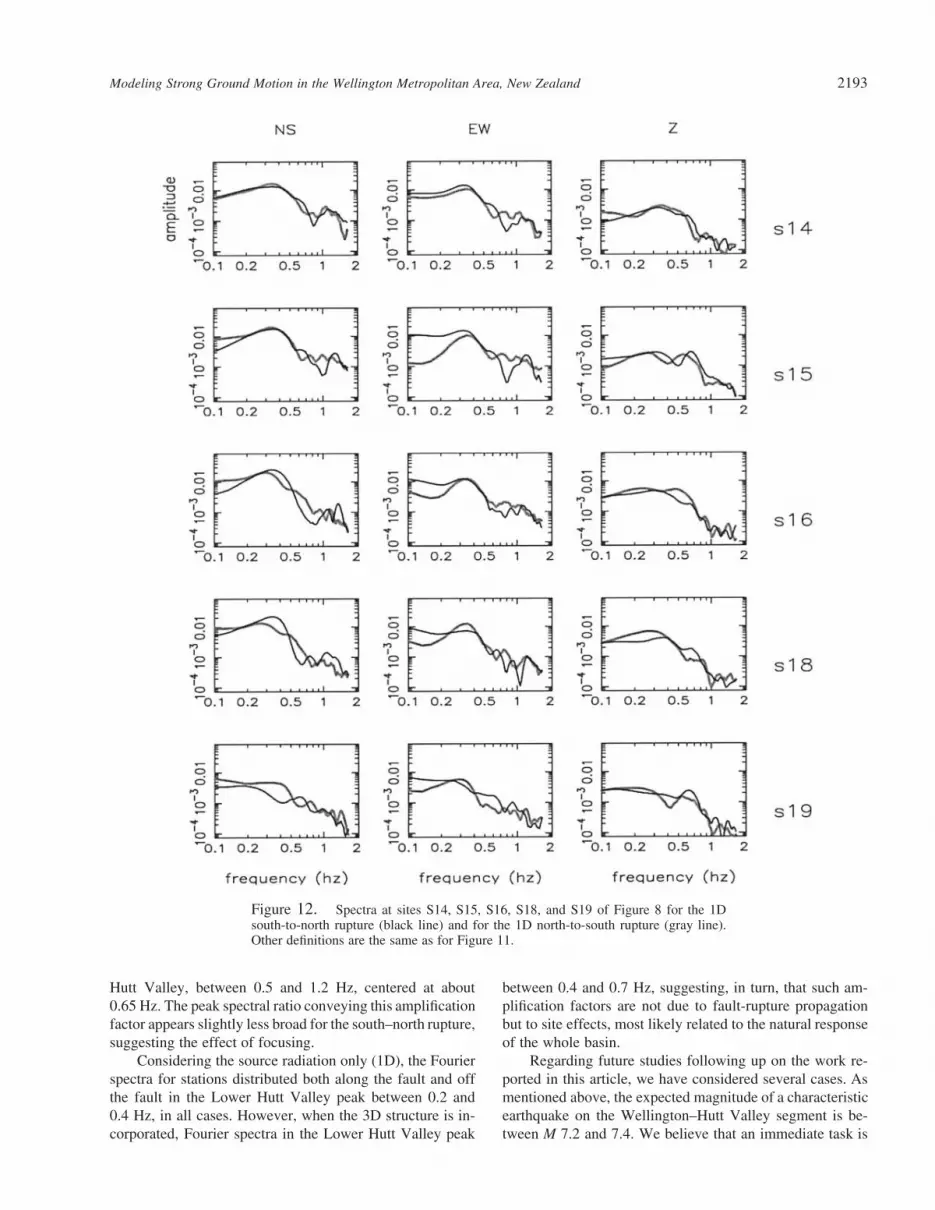
Off the fault, the effect of fault-rupture directivity de-creases with distance from the fault, as shown in Figure 12,where we have computed the Fourier spectra at sites S14,S15, S16, S18, and S19 (Fig. 8) in the Lower Hutt Valleyfor 1D models of south–north (black line) and north–southruptures (gray line). The level of Fourier spectra at S19, thesite farthest from the fault, is about five times smaller thanat S14, the closest site. By comparing these Fourier spectrawith their corresponding 3D spectra at the same sites (Fig.13, black and gray lines for the south–north and north–south,respectively) we notice, first, that the levels of the 3D Fourierspectra are larger with larger distance off the fault, within a
Figure 9. 3D/1D spectral ratios for the south-to-north rupture scenario, top for theLower Hutt valley, bottom for Wellington City. The components NS (320#), EW (50#),and Z correspond to perpendicular to the strike of the Wellington Fault, parallel to thestrike, and vertical components, respectively. In the top figure, the thick gray linedenotes the average of the ratios at sites S15, S16, and S17 plus the nine unlabelledstations, on thick soft sediments in the Lower Hutt valley. In the bottom figure, thethin gray line corresponds to the ratio at site S10, on soft, reclaimed land. In both, thethin full lines are the ratios at the other sites, plotted individually, mostly on stiffersoils or rock.

Modeling Strong Ground Motion in the Wellington Metropolitan Area, New Zealand 2191
narrow frequency band between 0.4 and 0.7 Hz, peaking atS16, and decreasing at S18. At S19 the 3D spectral level issmaller than its corresponding 1D Fourier spectra. This be-havior is similar for both rupture directions.
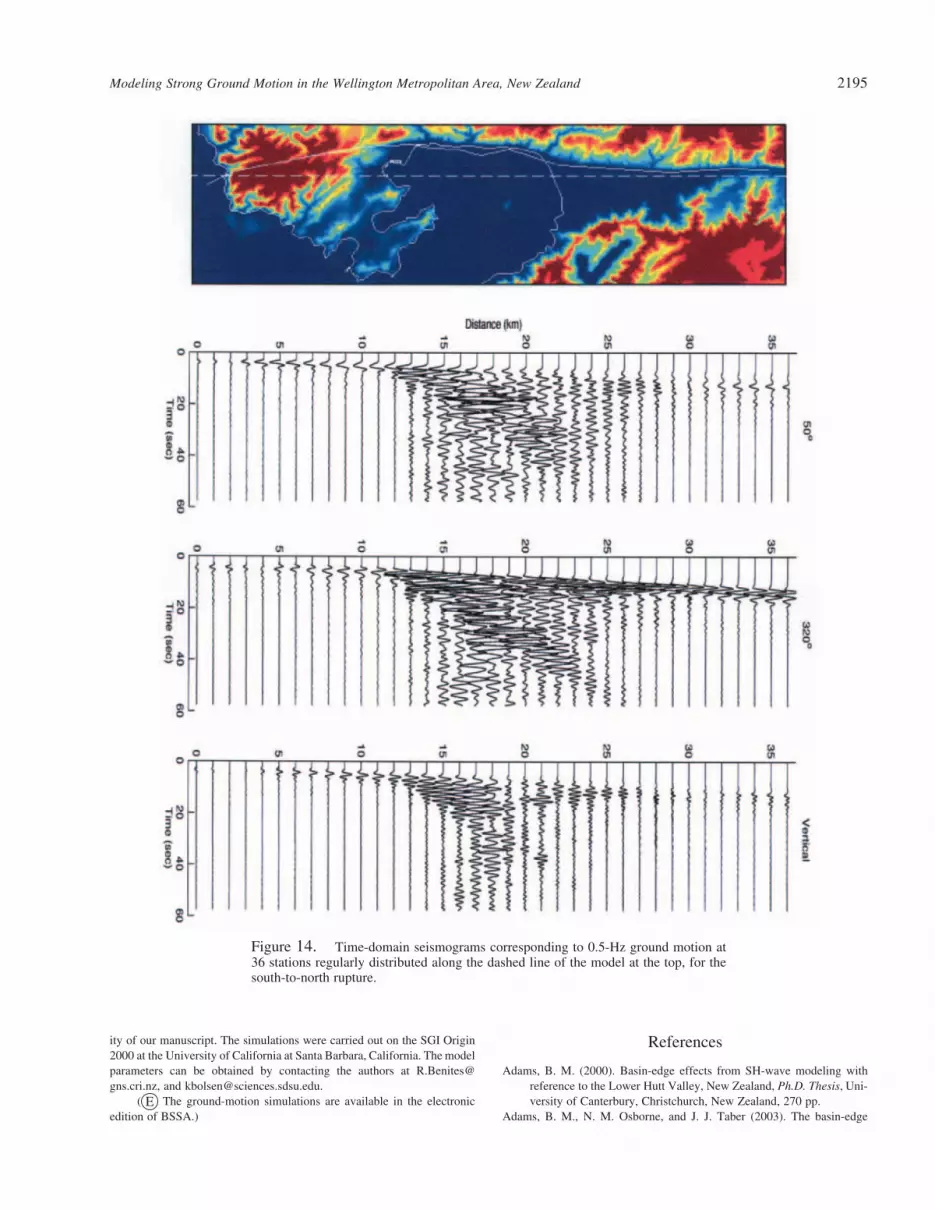
From those results, it is clear that the peak amplificationfactor between 0.5 and 1.2 Hz determined by spectral ratiosin the Lower Hutt Valley is due to site effects, most likelyrelated to its fundamental response. Let us emphasize theeffect of the basin by low-pass filtering the seismograms ofthe south–north rupture at 0.5 Hz. These are shown in Figure14, for 36 sites along the dashed line of the model at the topof the figure. Resonance appears at 12 km, close to the southshore of the harbor, and reaches maximum amplitude, of 109cm/sec on the 320# component (perpendicular to the fault),at 17 km, near the center of the harbor. It is clear from thefigure that the waves due to resonance in the harbor contrib-ute strongly to ground shaking, as far as about 25 km, towardthe Hutt Valley.
Conclusions
The ground motion in the Greater Wellington Region,New Zealand, upon the impact of M 6.7 earthquakes due toruptures of the Wellington fault has been numerically mod-eled for frequencies up to 1.5 Hz, and for two earthquakescenarios corresponding to ruptures in the south–north andnorth–south directions. These ruptures are kinematically
modeled by incorporating slip distributions on 100 subfaults(5 ! 20) distributed regularly over the total fault area andassuming variable slip rise time for each. The rupture frontvelocity is taken as equal to 90% of the bedrock S-wavevelocity.
The modeling reveals that the character of the 3Dseismic-wave propagation in the region varies with rupturedirection, exhibiting resonance at periods about 3 sec(0.34 Hz) and focusing upon the Lower Hutt Valley for thesouth–north scenario and deflection of seismic energy (asopposed to focusing) for the north–south scenario. A com-mon feature of wave propagation is the long-lasting rever-berations of the higher frequency waves (!1 Hz) in the har-bor, after the ruptures have stopped. Although both rupturedirections render comparable seismic-wave amplitudes, thespatial distributions of peak ground velocity are slightly dif-ferent. The maximum peak values (2.6 m/sec) appear dis-tributed over a more extended area of the Lower Hutt Valleyfor the north–south than for the south–north scenario. On theother hand, the maximum peak values are rather distributedover a narrow area along the fault for the south–northrupture.
In general, the characteristics of the spectral ratios inthe region are similar for both ruptures, and the major featureof the site response rendered by our modeling in the fre-quency range up to 1.5 Hz is a maximum amplification factorof about 4 in the horizontal ground motion of the Lower
Figure 10. 3D/1D spectral ratios for the north-to-south rupture scenario. Definitionsare the same as in Figure 9. Note that the peak between 0.5 Hz and 1 Hz is broaderthan for the south-to-north rupture, implying the effect of focusing in the latter.
2192 R. Benites and K. B. Olsen
Figure 11. Spectra at sites S7, S11, S12, S14, S20, and S22 of Figure 8, for the1D south-to-north rupture (black line) and for the 1D north-to-south rupture (gray line).NS (320#), EW (50#), and Z denote components perpendicular and parallel to the faultstrike, and vertical, respectively.
Modeling Strong Ground Motion in the Wellington Metropolitan Area, New Zealand 2193
Figure 12. Spectra at sites S14, S15, S16, S18, and S19 of Figure 8 for the 1Dsouth-to-north rupture (black line) and for the 1D north-to-south rupture (gray line).Other definitions are the same as for Figure 11.
Hutt Valley, between 0.5 and 1.2 Hz, centered at about0.65 Hz. The peak spectral ratio conveying this amplificationfactor appears slightly less broad for the south–north rupture,suggesting the effect of focusing.
Considering the source radiation only (1D), the Fourierspectra for stations distributed both along the fault and offthe fault in the Lower Hutt Valley peak between 0.2 and0.4 Hz, in all cases. However, when the 3D structure is in-corporated, Fourier spectra in the Lower Hutt Valley peak
between 0.4 and 0.7 Hz, suggesting, in turn, that such am-plification factors are not due to fault-rupture propagationbut to site effects, most likely related to the natural responseof the whole basin.
Regarding future studies following up on the work re-ported in this article, we have considered several cases. Asmentioned above, the expected magnitude of a characteristicearthquake on the Wellington–Hutt Valley segment is be-tween M 7.2 and 7.4. We believe that an immediate task is

2194 R. Benites and K. B. Olsen
Figure 13. Spectra at sites S14, S15, S16, S18, and S19 of Figure 8 for the 3Dmodel of rupture for south-to-north (black line) and for the north-to-south (gray line).These spectra are to be compared with the corresponding 1D spectra of Figure 12.
to compute strong ground motion in the Wellington Metro-politan Area for several characteristic earthquake scenarios,considering ruptures of the full length of the segment, 75 km,and by assigning a fault width of 20 km (Robinson, 1986).
The 3D digital model used in this work has been builtfrom all presently available data on the stratigraphy of theregion. We are aware that the 3D crustal model should beimproved, in particular if we want to increase our frequencyrange. It is of crucial importance to know, accurately, thetopography of the bedrock close to the fault-bounded edge
of the basin, since strong resonances seem to originate inthis area.
Acknowledgments
The authors are indebted to Peter R. Wood, who played a major rolein generating the Wellington Region digital model. Our thanks are also dueto Russell Robinson and Graeme McVerry for important discussions duringthe preparation of this manuscript. We extend our gratitude to Terry Webband to an unknown reviewer, whose suggestions greatly improved the qual-
Modeling Strong Ground Motion in the Wellington Metropolitan Area, New Zealand 2195
Figure 14. Time-domain seismograms corresponding to 0.5-Hz ground motion at36 stations regularly distributed along the dashed line of the model at the top, for thesouth-to-north rupture.
ity of our manuscript. The simulations were carried out on the SGI Origin2000 at the University of California at Santa Barbara, California. The modelparameters can be obtained by contacting the authors at [email protected], and [email protected].
( E The ground-motion simulations are available in the electronicedition of BSSA.)
References
Adams, B. M. (2000). Basin-edge effects from SH-wave modeling withreference to the Lower Hutt Valley, New Zealand, Ph.D. Thesis, Uni-versity of Canterbury, Christchurch, New Zealand, 270 pp.
Adams, B. M., N. M. Osborne, and J. J. Taber (2003). The basin-edge

2196 R. Benites and K. B. Olsen
effects from weak ground motions across the fault-bounded edge ofthe Lower Hutt Valley, New Zealand, Bull. Seism. Soc. Am. 93, 2703–2716.
Berryman, K. R. (1990). Late Quaternary movement of the WellingtonFault in the Upper Hutt area, New Zealand, New Zealand J. Geol.Geophys. 33, 257–270.
Bouchon, M. (1981). A simple method to calculate Green’s functions forelastic layered media, Bull. Seism. Soc. Am. 71, 959–971.
Day, S. M. (1998). Efficient simulation of constant Q using coarse-grainedmemory variables, Bull. Seism. Soc. Am. 88, 1051–1062.
Dellow, G. D., S. A. L. Read, J. G. Begg, R. J. Van Dissen, and N. D.Perrin (1992). Distribution of geological materials in Lower Hutt andPorirua, New Zealand: a component of a ground shaking hazard as-sessment, Bull. New Zealand Natl. Soc. Earthquake Eng. 25, no. 4,332–344.
Grant, F. S., and G. F. West (1965). Interpretation theory in applied geo-physics, in International Series in the Earth Sciences, R. R. Shrock(Consulting Editor), McGraw-Hill, New York, 583 pp.
Graves, R. W. (1996). Simulating seismic wave propagation in 3D elasticmedia using staggered-grid finite differences, Bull. Seism. Soc. Am.86, 1091–1106.
Hall, J. F., T. H. Heaton, M. W. Halling, and D. J. Wald (1995). Near-source ground motion and its effects on flexible buildings, EarthquakeSpectra 11, 569–605.
Han, Z. (2003). Possible reduction of earthquake hazard on the WellingtonFault, New Zealand, after the nearby 1855, M 8.2 Wairarapa earth-quake and implications for interpreting paleoearthquake intervals,Ann. Geophys., 46, 1141–1154.
Langridge, R. M., K. R. Berryman, and R. J. Van Dissen (2005). Definingthe geometric segmentation and Holocene slip rate of the WellingtonFault, New Zealand: the Pahiatua section, New Zealand J. Geol. Geo-phys. 48, 591–607.
Olsen, K. B. (1994). Simulation of three-dimensional wave propagation inthe Salt Lake Basin, Ph.D. Thesis, University of Utah, Salt Lake City,157 pp.
Olsen, K. B. (2000). Site amplification in the Los Angeles Basin from 3Dmodeling of strong ground motion, Bull. Seism. Soc. Am. 90, s77–s94.
Olsen, K. B., S. M. Day, and C. R. Bradley (2003). Estimation of Q forlong-period ("2 s) waves in the Los Angeles Basin, Bull. Seis. Soc.Am. 93, 627–638.
Robinson, R. (1986). Seismicity, structure, and tectonics of the Wellingtonregion, New Zealand, Geophys. J. R. Astron. Soc. 87, 379–409.
Sritharan, S., and G. H. McVerry (1992). Microzone effects in the HuttValley in records from a Strong-Motion Accelerograph array, Bull.New Zealand Natl. Soc. Earthquake Eng. 25, no. 4, 246–264.
Taber, J. J., and E. G. C. Smith (1992). Frequency dependent amplificationof weak ground motions in Porirua and Lower Hutt, New Zealand,Bull. New Zealand Natl. Soc. Earthquake Eng. 25, no. (4), 303–331.
Van Dissen, R. J., K. R. Berryman, J. R. Pettinga, and N. L. Hill (1992).Paleoseismicity of the Wellington–Hutt Valley segment of the Wel-lington Fault, New Zealand J. Geol. Geophys. 35, 165–176.
Wald, D. J., and T. H. Heaton (1994). Spatial and temporal distribution ofslip for the 28 June 1998 Landers, California, earthquake, Bull. Seism.Soc. Am. 84, 668–691.
Institute of Geological and Nuclear SciencesGracefield Research CentreP.O. Box 30-368Lower Hutt, New Zealand
(R.B.)
Department of Geological SciencesSan Diego State UniversitySan Diego California 92182-1020
(K.B.O.)
Manuscript received 23 November 2004.


