Embed Size (px)
Citation preview

ARTICLE IN PRESS
Soil Dynamics and Earthquake Engineering ] (]]]]) ]]]–]]]
Contents lists available at ScienceDirect
Soil Dynamics and Earthquake Engineering
0267-72
doi:10.1
� Corr
E-m
PleasSoil
journal homepage: www.elsevier.com/locate/soildyn
Characteristics of the strong ground motions from the 6 April 2009 L’Aquilaearthquake, Italy
Aybige Akinci a,�, Luca Malagnini a, Fabio Sabetta b
a Istituto Nazionale di Geofisica e Vulcanologia, Via di Vigna Murata 605, 00143 Roma, Italyb Dipartimento della Protezione Civile, Via Vitorchiano 4, 00189 Roma, Italy
a r t i c l e i n f o
Article history:
Received 17 July 2009
Received in revised form
29 November 2009
Accepted 11 December 2009
Keywords:
L’Aquila earthquake
Strong ground motions
Site effects
Directivity effect
Acceleration response spectra
Italy
61/$ - see front matter & 2009 Elsevier Ltd. A
016/j.soildyn.2009.12.006
esponding author.
ail address: [email protected] (A. Akinci).
e cite this article as: Akinci A, et al. CDyn Earthquake Eng (2010), doi:10.1
a b s t r a c t
An Mw 6.25 earthquake occurred on April 6, 2009 at 03:33 a.m. local time, in the Abruzzo region
(Central Italy), close to the city of L’Aquila. The earthquake ruptured a North-West (NW)–South-East
(SE) oriented normal fault dipping toward the South-West (SW), with the city of L’Aquila lying a few
kilometers away on the hanging wall.
The main shock has been recorded by fifty-eight accelerometric stations: the highest number of
digital recordings ever obtained in Italy for a single earthquake, one of the best-recorded earthquakes
with a normal fault mechanism. Very high values of peak ground acceleration (0.3–0.65 g) were
observed close to the center of L’Aquila (6 stations at zero JB distance from the fault). The earthquake
caused severe loss of lives (299 victims and 1500 injured) and damage (about 18000 unusable
buildings) in the epicentral area.
In this study we analyze the ground motion characteristics of both the main shock in terms of peak
ground acceleration (PGA), peak ground velocity (PGV), and pseudo-acceleration response spectra (5%
of damping ratio). In particular, we compare the pseudo-acceleration response spectra for horizontal
directions with the EC8 design spectrum and the new Italian building code (NTC08). In order to
understand the characteristics of the ground motions induced by L’Aquila earthquake, we also study the
source-related effects and site response of the strong motion stations that recorded the seismic
sequence. A novel method is used for the analysis of inter-station and site-specific H/V spectral ratios
for the main event and for 12 aftershocks.
& 2009 Elsevier Ltd. All rights reserved.
1. Introduction
The April 6, 2009 Abruzzo earthquake occurred at 03:33 a.m.local time in Central Italy with an epicenter at 42.4231N, 13.3951E,�5 km SW from the city of L’Aquila, and 95 km east of the city ofRome. According to the Istituto Nazionale di Geofisica e Vulcanologia(INGV), the earthquake nucleated at a shallow depth of 9 km, andhad a local magnitude Ml 5.8. A moment magnitude Mw 6.25 wascomputed using regional broadband waveforms (http://www.eas.slu.edu/Earthquake_Center/MECH.IT/). The earthquake occurred ona NW–SE oriented normal fault dipping toward the SW.
L’Aquila has a population of over 66,000, and was devastatedby the earthquake. The earthquake intensity reached IX EMS-98(European Macroseismic Scale) in the proximity of Aquila. Thereare 299 reported fatalities and over 1,500 injuries. The main eventleft a total of 64,812 people displaced from their homes withapproximately 32,100 people living in tents and 32,700 lodged inhotels along the Adriatic coast (as of May 8th 2009, Italian
ll rights reserved.
haracteristics of the strong016/j.soildyn.2009.12.006
Department of Civil Protection, DPC, http://www.protezionecivile.it). As of June 8, about 53,000 buildings had been inspected, bytechnical teams of specially trained engineers, outside of the mostdamaged areas that were subjected to mandatory evacuation.About 54% of the buildings were judged ready for occupancy and29% unsafe for occupancy (Italian Department of Civil Protection).The final figure of the unusable buildings is estimated to bearound 18000.
The close proximity of the causative fault to the city of L’Aquilacaused several collapses of historical masonry buildings in itstown center, including the town hall, the National Museum ofAbruzzo, and many major historic churches as the largestRenaissance church ‘‘Basilica of San Bernardino da Siena’’ andthe dome of the 18th-century ‘‘Chiesa delle Anime Sante’’. Whilemost of L’Aquila’s medieval structures were badly affected by theearthquake, many of its modern buildings suffered also asignificant level of damage. Smaller villages within a radius ofabout 50 km of the epicenter were also heavily damaged. Thehistoric centers of villages in the Aterno River valley southeast ofL’Aquila (Onna, Paganica, and Castelnuovo) were very badlydamaged, with shaking intensities of up to IX–X on the EMS scaleconversely; damage did not exceed EMS intensity VI nearly
ground motions from the 6 April 2009 L’Aquila earthquake, Italy.

ARTICLE IN PRESS
A. Akinci et al. / Soil Dynamics and Earthquake Engineering ] (]]]]) ]]]–]]]2
anywhere to the NW of L’Aquila. This south-eastward elongationof the damage pattern probably reflects a combination of rupturedirectivity and litostratigraphic amplification effects. The affectednew buildings are representative of construction types used inmany European countries, whereas the old constructions thatsuffered the most extensive damage are mostly representative ofthe traditional, poor Italian architecture.
The event struck a tectonically complex region, the CentralApennines, characterized by an extensional regime since thePliocene (i.e. about the last 5 million years). According tothis picture, most of the active faults are normal and NW, SEtrending ([1–4]). The extensive regime is due to the openingof a back-arc basin in the Tyrrhenian Sea, which is openingfaster than the collision between the African and the Eurasianplates.
The main shock was preceded by a prolonged swarm-likesequence of foreshocks that began in December 2008, and was notidentified as a warning sign for a large event, and that is unlikelyto have significantly increased the probability of the main event(http://www.bo.ingv.it/�earthquake/ITALY/forecasting/M5.5+/).Fig. 1 shows the aftershocks distribution of the Abruzzo sequencehighlighting the two strongest occurred on April 7 (17:47 UTC)near L’Aquila, SE of the town, with Mw 5.6 and on April 9 (00:52UTC) to the north of L’Aquila with Mw 5.4. There is a clearmigration of aftershocks to the SE and to the NW. Three largeaftershocks (Mw 5.1, 5.0 and 5.6) occurred on April 7 near L’Aquilaand SE of the town, close to the villages of Onna, Fossa and Ocre.None of the aftershocks of April 8th was larger than Mw 4.1. OnApril 9 an Mw 5.4 was located to the north of L’Aquila, close to thetowns of Barete, Pizzoli and Campotosto. A month after the mainevent, the record counted more than 100 significant aftershocks(3.0oMwo5), and several thousands events of lower magnitude.The focal mechanisms determined for the aftershocks (http://www.eas.slu.edu/Earthquake_Center/MECH.IT/) were dominantlynormal faulting.
Fig. 1. Main shock (yellow star) and two strongest aftershocks (green stars) of the Ab
([10]). Triangles indicate the RAN strong motion stations.
Please cite this article as: Akinci A, et al. Characteristics of the strongSoil Dyn Earthquake Eng (2010), doi:10.1016/j.soildyn.2009.12.006
L’Aquila has been assessed as an area of relatively high seismichazard ([5–8]). Based on the historical record, the town hassuffered intensity IX or higher at least three times (1349 A.D.,1461 A.D. and 1703 A.D., [9]). The 1703 event was part of aseismic sequence that struck the area.
In this paper we discuss the characteristics of strong groundmotion associated with L’Aquila seismic sequence. Availablestrong ground motion data are also described. Their attenuationand site properties are studied. Response spectra characteristics ofstrong motion data are covered with special emphasis on thecomparison with former and recent Italian building code.
2. Strong motion records
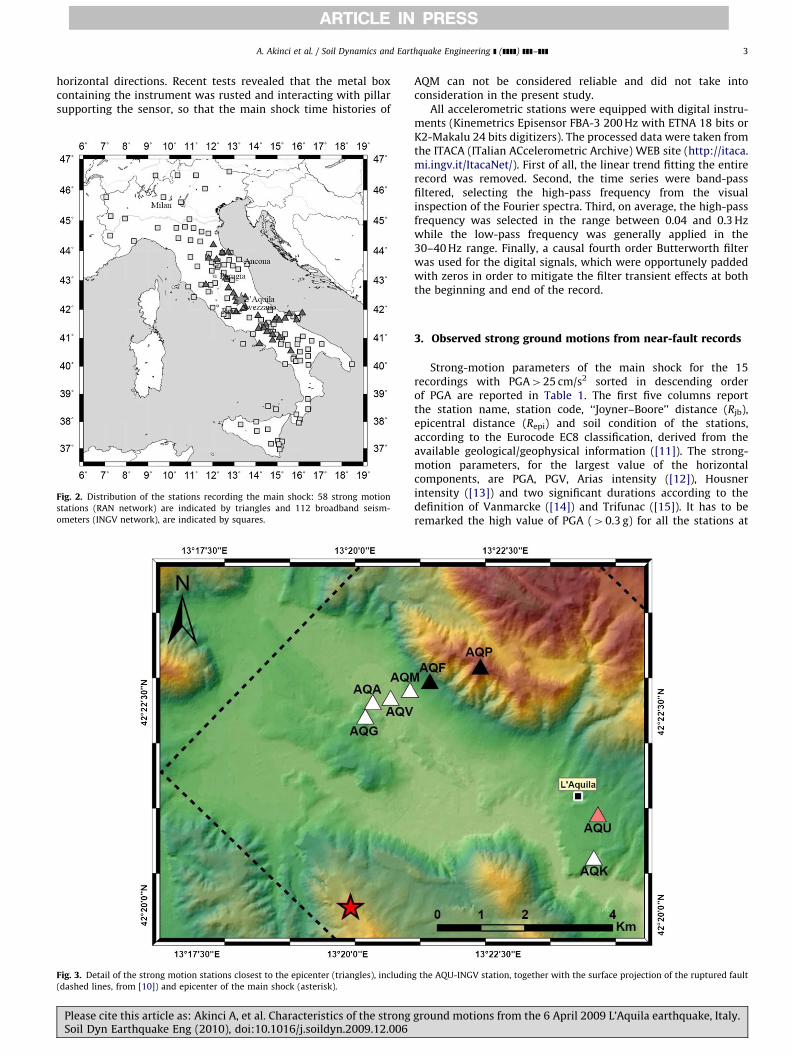
Fifty-eight accelerometric stations belonging to the Italianstrong motion network (RAN, Rete Accelerometrica Nazionale)were triggered by the main shock, as shown in Fig. 2. In addition,the broadband seismometers of the INGV network provided 112not saturated recordings, up to epicentral distances of more than700 km (Fig. 2). Finally, one of the very-broadband stationsoperated by INGV, AQU located in the center of L’Aquila, (redtriangle in Fig. 3), was also equipped with an accelerometer thatrecorded the main shock on-scale. Fig. 3 shows the locations ofthe strong motion stations closest to the epicenter together withthe surface projection of the ruptured fault ([10]). It has to beremarked that all these eight stations fall inside the hanging wallof the fault surface projection (‘‘Joyner–Boore’’ distance equal tozero) and, apart from AQU and AQK, correspond to the ‘‘valledell’Aterno’’ array. Only two of eight stations, AQF and AQP (blacktriangles in Fig. 3) did not record the main shock due to low powersupply of the solar panels during the April 6 night. The stationsAQP and AQF recorded the following aftershocks starting fromApril 7. Particular mention deserves the station AQM that, only forthe main shock, went off scale above 1 g both in the vertical and
ruzzo sequence. The white box indicates the surface projection of the fault plane
ground motions from the 6 April 2009 L’Aquila earthquake, Italy.
ARTICLE IN PRESS
A. Akinci et al. / Soil Dynamics and Earthquake Engineering ] (]]]]) ]]]–]]] 3
horizontal directions. Recent tests revealed that the metal boxcontaining the instrument was rusted and interacting with pillarsupporting the sensor, so that the main shock time histories of
Fig. 2. Distribution of the stations recording the main shock: 58 strong motion
stations (RAN network) are indicated by triangles and 112 broadband seism-
ometers (INGV network), are indicated by squares.
Fig. 3. Detail of the strong motion stations closest to the epicenter (triangles), includin
(dashed lines, from [10]) and epicenter of the main shock (asterisk).
Please cite this article as: Akinci A, et al. Characteristics of the strongSoil Dyn Earthquake Eng (2010), doi:10.1016/j.soildyn.2009.12.006
AQM can not be considered reliable and did not take intoconsideration in the present study.
All accelerometric stations were equipped with digital instru-ments (Kinemetrics Episensor FBA-3 200 Hz with ETNA 18 bits orK2-Makalu 24 bits digitizers). The processed data were taken fromthe ITACA (ITalian ACcelerometric Archive) WEB site (http://itaca.mi.ingv.it/ItacaNet/). First of all, the linear trend fitting the entirerecord was removed. Second, the time series were band-passfiltered, selecting the high-pass frequency from the visualinspection of the Fourier spectra. Third, on average, the high-passfrequency was selected in the range between 0.04 and 0.3 Hzwhile the low-pass frequency was generally applied in the30–40 Hz range. Finally, a causal fourth order Butterworth filterwas used for the digital signals, which were opportunely paddedwith zeros in order to mitigate the filter transient effects at boththe beginning and end of the record.
3. Observed strong ground motions from near-fault records
Strong-motion parameters of the main shock for the 15recordings with PGA425 cm/s2 sorted in descending orderof PGA are reported in Table 1. The first five columns reportthe station name, station code, ‘‘Joyner–Boore’’ distance (Rjb),epicentral distance (Repi) and soil condition of the stations,according to the Eurocode EC8 classification, derived from theavailable geological/geophysical information ([11]). The strong-motion parameters, for the largest value of the horizontalcomponents, are PGA, PGV, Arias intensity ([12]), Housnerintensity ([13]) and two significant durations according to thedefinition of Vanmarcke ([14]) and Trifunac ([15]). It has to beremarked the high value of PGA (40.3 g) for all the stations at
g the AQU-INGV station, together with the surface projection of the ruptured fault
ground motions from the 6 April 2009 L’Aquila earthquake, Italy.

ARTICLE IN PRESS
Ta
ble
1S
tro
ng
mo
tio
np
ara
me
ters
for
the
larg
est
ho
rizo
nta
lco
mp
on
en
to
fth
e1
5re
cord
ing
sw
ith
PG
A4
25
cm/s
2so
rte
din
de
sce
nd
ing
ord
er
of
PG
A.
Sta
tio
nn
am
eS
tati
on
cod
eR
jbd
ista
nce
(km
)E
pic
.d
ista
nce
(km
)
EC
8si
tecl
ass
PG
A(c
m/s
2)
PG
V(c
m/s
)A
ria
sin
ten
sity
(cm
/s)
Ho
usn
er
inte
nsi
ty(c
m)
Du
rati
on
Va
nm
.(s
)D
ura
tio
nT
rif.
(s)
V.
Ate
rno
–C
en
tro
Va
lle
AQ
V0
4.9
B6
46
.14
2.8
32
85
.79
4.5
3.1
7.8
V.
Ate
rno
–C
oll
eG
rill
iA
QG
04
.4A
50
6.9
35
.54
13
7.0
92
.22
.98
.6
V.
Ate
rno
–f.
Ate
rno
AQ
A0
4.6
A4
35
.63
2.0
31
75
.08
6.1
4.8
7.7
Aq
uil
ap
arc
he
gg
ioA
QK
05
.6B
34
7.2
36
.21
12
8.9
68
.14
.81
5.5
Aq
uil
aC
ast
ell
o(I
NG
V)
AQ
U0
5.8
A3
09
.53
5.0
07
1.0
78
.05
.07
.5
Gra
nS
ass
o(A
sse
rgi)
GS
A8
.61
8.0
A1
48
.29
.84
44
.01
7.8
3.6
8.9
Ce
lan
oC
LN2
0.0
31
.6A
89
.16
.64
9.5
14
.33
.97
.7
Av
ezz
an
oA
VZ
25
.13
4.9
C6
7.7
11
.28
9.7
27
.36
.51
9.0
Ort
ucc
hio
OR
C3
7.3
49
.3A
64
.25
.86
7.4
17
.85
.21
2.3
Mo
nte
rea
leM
TR
15
.92
2.4
B6
1.6
3.5
35
.89
.76
.91
5.4
Su
lmo
na
SU
L4
3.4
56
.4A
33
.63
.73
1.0
7.0
6.7
17
.7
Ch
ieti
CH
T5
2.2
67
.0B
29
.47
.91
3.8
10
.39
.53
1.7
Gra
nS
ass
o(L
ab
.IN
FN)
GS
G1
3.7
22
.6A
29
.43
.04
0.9
4.9
4.9
11
.7
Fam
ign
an
oFM
G1
6.6
19
.3A
26
.32
.61
1.2
6.4
8.4
21
.0
An
tro
do
coA
NT
19
.32
3.0
A2
6.0
2.4
71
.86
.98
.92
2.7
A. Akinci et al. / Soil Dynamics and Earthquake Engineering ] (]]]]) ]]]–]]]4
Please cite this article as: Akinci A, et al. Characteristics of the strongSoil Dyn Earthquake Eng (2010), doi:10.1016/j.soildyn.2009.12.006
zero distance from the fault and the very short duration (2–5 saccording to the Vanmarcke definition that does not overestimatethe ‘‘strong phase’’ duration as the Trifunac definition does)compatible with a high frequency content of the recordings thatwill be confirmed from the response spectra analysis.
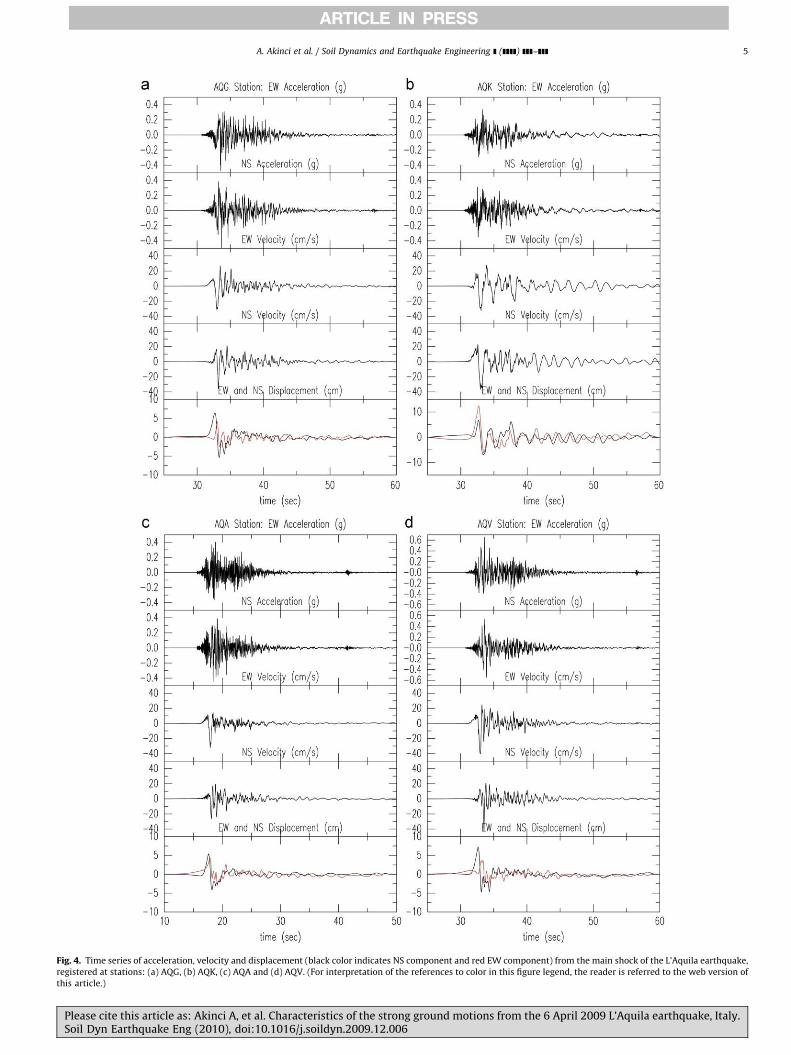
Corrected acceleration, velocity and displacement traces of themain shock for some of the stations (AQG, AQK, AQA and AQV)closest to the fault rupture (zero distance from the fault surfaceprojection 4–5 km epicentral distance) are presented in Fig. 4(a)–(d). These stations show a peak accelerations 40.3 g, with thelargest peak of 0.63 g in the EW component of station AQV. Near-fault strong pulses, possibly related to source effects and greatlycontributing to the building damage, are present in all the recordsand particularly evident in the velocity and displacement time-histories. Such velocity pulses occurring in the beginning of strongshaking are typical of near-fault motions and import significantinput energy to structural systems. The effect of site response canbe observed in L’Aquila (AQK) record which shows the highest lowfrequency content, as resulting from the literature ([16]) and fromthe H/V ratios discussed in the following, both indicating a strongresonance peak at 0.6 Hz, justifying the large value of PGD (around12 cm) (Fig. 4a) while the AQA record shows a higher frequencycontent (Fig. 4c). Significantly smaller values of PGD have beenfound at other stations, around 8 cm for AQG, AQV and 6 cm forAQA. It is also possible to recognize that the PGA of AQV is higherrespect the adjacent (400 m apart) station AQK, whereas PGV andPGD are of the same order in both stations.
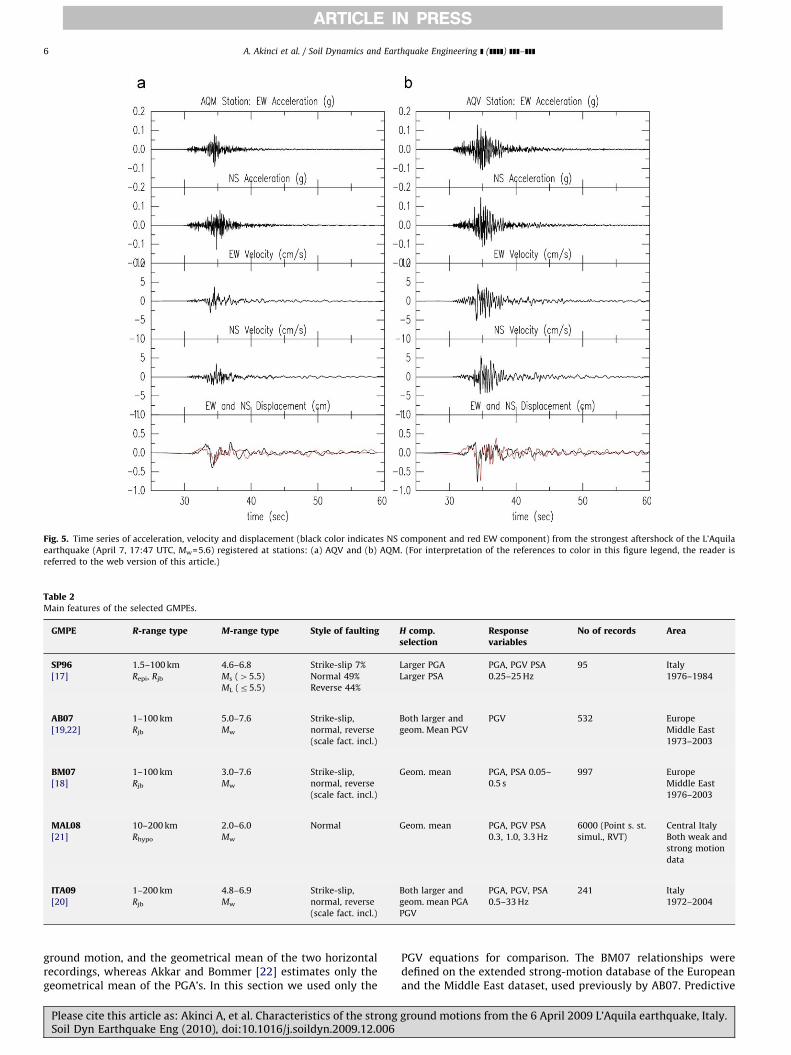
In Fig. 5a and b recordings of the same stations are shown forthe aftershock of April 7 at 5.47 p.m. (Mw 5.6). In this case and alsoin the following aftershocks the PGA of AQV is quite comparablewith those of other stations in Valle dell’Aterno, AQG, AQK andAQM (Fig. 5a). It is therefore reasonable to assume that the strongacceleration 0.63 g in the AQV station during the main shock isdue to a high frequency pulse generated by a source effect.
4. Comparison with ground motion prediction equations
Horizontal peak accelerations and velocities from processeddata of L’Aquila earthquake have been compared with someground motion prediction equations (GMPEs) developed on thebasis of both strong and weak motion data: Sabetta and Pugliese[17] (SP96); Bommer et al. [18] (BM07); Akkar and Bommer[19,22], (AB07); Bindi et al. [20] (ITA09); and Malagnini et al. [21](MAL08). The main features of the above relationships aresummarized in Table 2.
The SP96 relationships were calibrated considering 95 wave-forms recorded at 62 stations corresponding to 17 earthquakesthat occurred before 1985 in the magnitude range from 4.6 to 6.8(ML or MS) and valid for epicentral or Joyner–Boore distances up to100 km. The regression analysis of peak ground parameters wasperformed using both the vertical and the larger of the twohorizontal components of the motions. The Bindi et al. [20], ITA09,GMPE is based on a data set is composed by 241 three-componentwaveforms from 27 earthquakes with moment magnitude in therange M 4.8–6.9, occurred in Italy from 1972 to 2007 and recordedby 146 stations at distances up to 200 km. The equations arederived for PGA, PGV, and 5% damped spectral acceleration (SA) at18 periods from 0.03 to 2 s, considering both the larger horizontalmotion, and the geometrical mean of the two horizontalcomponents, as well as the vertical motion. The AB07 derivedempirical prediction equations for PGV using a total of 532strong-motion accelerograms from Europe and the Middle East,recorded at distances of up to 100 km from 131 earthquakes withmoment magnitudes ranging from M 5 to 7.6. The AB07 equationsare derived for both the larger horizontal component of the
ground motions from the 6 April 2009 L’Aquila earthquake, Italy.
ARTICLE IN PRESS
Fig. 4. Time series of acceleration, velocity and displacement (black color indicates NS component and red EW component) from the main shock of the L’Aquila earthquake,
registered at stations: (a) AQG, (b) AQK, (c) AQA and (d) AQV. (For interpretation of the references to color in this figure legend, the reader is referred to the web version of
this article.)
A. Akinci et al. / Soil Dynamics and Earthquake Engineering ] (]]]]) ]]]–]]] 5
Please cite this article as: Akinci A, et al. Characteristics of the strong ground motions from the 6 April 2009 L’Aquila earthquake, Italy.Soil Dyn Earthquake Eng (2010), doi:10.1016/j.soildyn.2009.12.006
ARTICLE IN PRESS
Fig. 5. Time series of acceleration, velocity and displacement (black color indicates NS component and red EW component) from the strongest aftershock of the L’Aquila
earthquake (April 7, 17:47 UTC, Mw=5.6) registered at stations: (a) AQV and (b) AQM. (For interpretation of the references to color in this figure legend, the reader is
referred to the web version of this article.)
Table 2Main features of the selected GMPEs.
GMPE R-range type M-range type Style of faulting H comp.selection
Responsevariables
No of records Area
SP96 1.5–100 km 4.6–6.8 Strike-slip 7% Larger PGA PGA, PGV PSA
0.25–25 Hz
95 Italy
[17] Repi, Rjb Ms (45.5) Normal 49% Larger PSA 1976–1984
ML (r5.5) Reverse 44%
AB07 1–100 km 5.0–7.6 Strike-slip,
normal, reverse
(scale fact. incl.)
Both larger and
geom. Mean PGV
PGV 532 Europe
[19,22] Rjb Mw Middle East
1973–2003
BM07 1–100 km 3.0–7.6 Strike-slip,
normal, reverse
(scale fact. incl.)
Geom. mean PGA, PSA 0.05–
0.5 s
997 Europe
[18] Rjb Mw Middle East
1976–2003
MAL08 10–200 km 2.0–6.0 Normal Geom. mean PGA, PGV PSA
0.3, 1.0, 3.3 Hz
6000 (Point s. st.
simul., RVT)
Central Italy
[21] Rhypo Mw Both weak and
strong motion
data
ITA09 1–200 km 4.8–6.9 Strike-slip,
normal, reverse
(scale fact. incl.)
Both larger and
geom. mean PGA
PGV
PGA, PGV, PSA
0.5–33 Hz
241 Italy
[20] Rjb Mw 1972–2004
A. Akinci et al. / Soil Dynamics and Earthquake Engineering ] (]]]]) ]]]–]]]6
ground motion, and the geometrical mean of the two horizontalrecordings, whereas Akkar and Bommer [22] estimates only thegeometrical mean of the PGA’s. In this section we used only the
Please cite this article as: Akinci A, et al. Characteristics of the strongSoil Dyn Earthquake Eng (2010), doi:10.1016/j.soildyn.2009.12.006
PGV equations for comparison. The BM07 relationships weredefined on the extended strong-motion database of the Europeanand the Middle East dataset, used previously by AB07. Predictive
ground motions from the 6 April 2009 L’Aquila earthquake, Italy.
ARTICLE IN PRESS
A. Akinci et al. / Soil Dynamics and Earthquake Engineering ] (]]]]) ]]]–]]] 7
equations are calibrated on 997 triaxial recordings generated by289 earthquakes with moment magnitudes ranging from M 3.0 to7.6 for the geometric mean of the two horizontal components.Malagnini et al. [21] used 6000 selected waveforms from bothweak and strong motion data of 476 small events (M 2–4.1),recorded at distances up to 200 km by 21 three-component digitalseismic stations together with the broadband seismograms fromthe Colfiorito sequence with moment magnitudes ranging from M
4 to 6. They predicted the absolute levels of ground shaking (PGA,PGV and spectral accelerations) for the Central Apennines byusing the crustal attenuation model, a Brune excitation term withthe static stress parameter, and the generic rock site amplificationof Boore and Joyner [23]. The generic rock site amplification, givenas a function of frequency (see Table 3 of [23]), is obtained by theaverage shear wave velocity from the surface to 30-m depth of620 m/s. It is then attenuated with their recommended high-frequency filter exp(�pk0f), with k0=0.035 s.
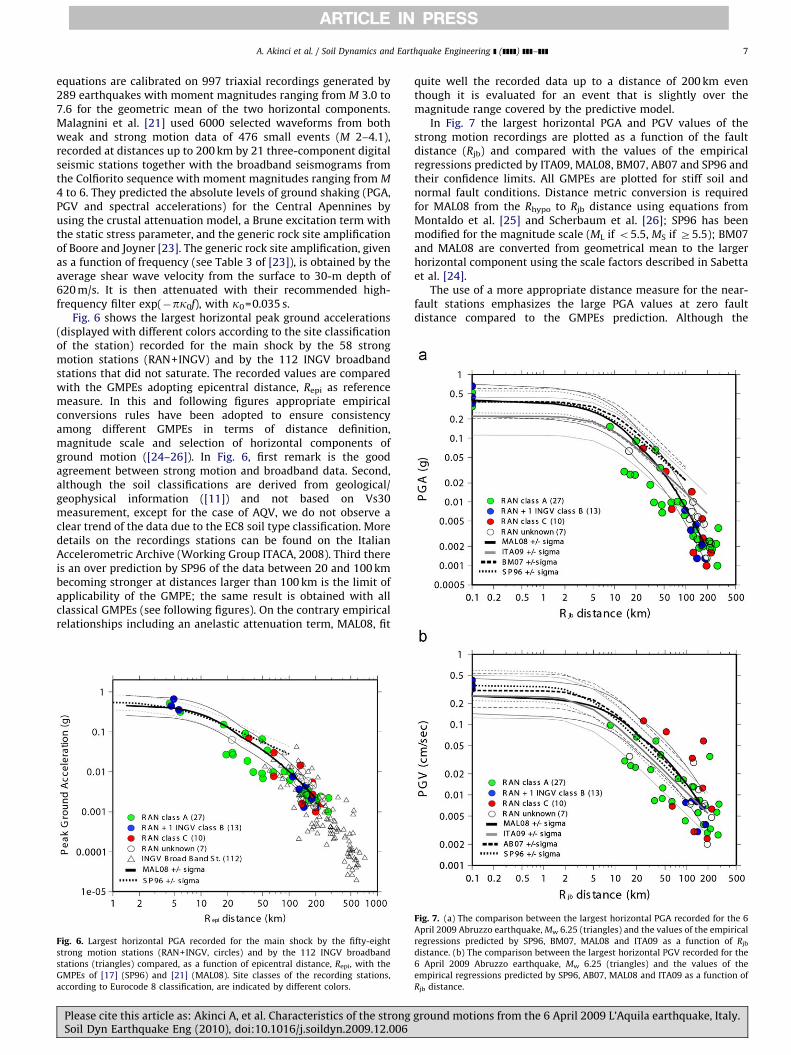
Fig. 6 shows the largest horizontal peak ground accelerations(displayed with different colors according to the site classificationof the station) recorded for the main shock by the 58 strongmotion stations (RAN+INGV) and by the 112 INGV broadbandstations that did not saturate. The recorded values are comparedwith the GMPEs adopting epicentral distance, Repi as referencemeasure. In this and following figures appropriate empiricalconversions rules have been adopted to ensure consistencyamong different GMPEs in terms of distance definition,magnitude scale and selection of horizontal components ofground motion ([24–26]). In Fig. 6, first remark is the goodagreement between strong motion and broadband data. Second,although the soil classifications are derived from geological/geophysical information ([11]) and not based on Vs30measurement, except for the case of AQV, we do not observe aclear trend of the data due to the EC8 soil type classification. Moredetails on the recordings stations can be found on the ItalianAccelerometric Archive (Working Group ITACA, 2008). Third thereis an over prediction by SP96 of the data between 20 and 100 kmbecoming stronger at distances larger than 100 km is the limit ofapplicability of the GMPE; the same result is obtained with allclassical GMPEs (see following figures). On the contrary empiricalrelationships including an anelastic attenuation term, MAL08, fit
Fig. 6. Largest horizontal PGA recorded for the main shock by the fifty-eight
strong motion stations (RAN+INGV, circles) and by the 112 INGV broadband
stations (triangles) compared, as a function of epicentral distance, Repi, with the
GMPEs of [17] (SP96) and [21] (MAL08). Site classes of the recording stations,
according to Eurocode 8 classification, are indicated by different colors.
Please cite this article as: Akinci A, et al. Characteristics of the strongSoil Dyn Earthquake Eng (2010), doi:10.1016/j.soildyn.2009.12.006
quite well the recorded data up to a distance of 200 km eventhough it is evaluated for an event that is slightly over themagnitude range covered by the predictive model.
In Fig. 7 the largest horizontal PGA and PGV values of thestrong motion recordings are plotted as a function of the faultdistance (Rjb) and compared with the values of the empiricalregressions predicted by ITA09, MAL08, BM07, AB07 and SP96 andtheir confidence limits. All GMPEs are plotted for stiff soil andnormal fault conditions. Distance metric conversion is requiredfor MAL08 from the Rhypo to Rjb distance using equations fromMontaldo et al. [25] and Scherbaum et al. [26]; SP96 has beenmodified for the magnitude scale (ML if o5.5, MS if Z5.5); BM07and MAL08 are converted from geometrical mean to the largerhorizontal component using the scale factors described in Sabettaet al. [24].
The use of a more appropriate distance measure for the near-fault stations emphasizes the large PGA values at zero faultdistance compared to the GMPEs prediction. Although the
Fig. 7. (a) The comparison between the largest horizontal PGA recorded for the 6
April 2009 Abruzzo earthquake, Mw 6.25 (triangles) and the values of the empirical
regressions predicted by SP96, BM07, MAL08 and ITA09 as a function of Rjb
distance. (b) The comparison between the largest horizontal PGV recorded for the
6 April 2009 Abruzzo earthquake, Mw 6.25 (triangles) and the values of the
empirical regressions predicted by SP96, AB07, MAL08 and ITA09 as a function of
Rjb distance.
ground motions from the 6 April 2009 L’Aquila earthquake, Italy.

ARTICLE IN PRESS
A. Akinci et al. / Soil Dynamics and Earthquake Engineering ] (]]]]) ]]]–]]]8
empirical relationships employed are generally applicable for sitedistances up to 100 km, a maximum site distance of at least300 km is preferred to provide a better comparison with data.MAL08 predicts quite well the peak accelerations observed in theL’Aquila earthquake at distances over 100 km, because their GMPEwas produced by using Italian data from the Central Apenninesrecorded at local and regional distances, well beyond 100 km.
At distance less than 10 km all of the empirical relationshipsunder estimate the acceleration data even though they arebounded by the plus and minus two standard deviation predic-tions. A reason responsible for the high accelerations may be therupture complexity, ([10]) and the relatively high stress drop inthe L’Aquila earthquake. Referring to the low observed values,with respect to the GMPEs predictions in the short andintermediate distance range (10–100 km), it has to be remarkedthat many of those recordings correspond to stations located
Fig. 8. (a) Some of the RAN stations recording the main shock. The gray triangles ind
direction) present low PGA and PGV values. Empty triangles indicate the stations locate
horizontal component of PGA compared with the ground-motion empirical predictive m
100 km. Gray and white circles present the observed PGA values in the backward (NW si
sedimentary alluvium are indicated by red circles. (c) The maximum horizontal compon
Rjb distances between 0 and 100 km. (For interpretation of the references to color in th
Please cite this article as: Akinci A, et al. Characteristics of the strongSoil Dyn Earthquake Eng (2010), doi:10.1016/j.soildyn.2009.12.006
along the NW direction, with respect to the fault, are thereforethey might be affected by backward directivity effects.
The agreement of GMPEs with the recorded data is muchbetter in case of PGV (Fig. 7b) underlying again the effect ofanelastic attenuation. The site effect becomes more evidentrespect to PGA: most of the highest values correspond to stationsbelonging to class C (180oVs30o300 m/s).
5. Directivity effect
Acceleration time series recorded at nearby stations (epicen-tral distances o70 km) show high variability in both amplitudeand duration with PGA values ranging between 0.67 to 0.01 g.Regarding directivity effects, stations located to the south-east ofthe source (namely, ORC, CNL, SUL) and the stations located to the
icate the stations located in the NW of the epicenter (in the backward directivity
d in the SE of the epicenter (in the forward directivity direction). (b) The maximum
odel of SP96, BM07, MAL08 and ITA09 as a function Rjb distances between 0 and
tes) and forward (SE) directivity direction, respectively. Stations located only on the
ent of PGV compared with the GMPE of SP96, AB07, MAL08 and ITA09 as a function
is figure legend, the reader is referred to the web version of this article.)
ground motions from the 6 April 2009 L’Aquila earthquake, Italy.

ARTICLE IN PRESS
A. Akinci et al. / Soil Dynamics and Earthquake Engineering ] (]]]]) ]]]–]]] 9
north-west (FGM, ANT, MMP) are particularly relevant (Fig. 8).These are characterized by the same soil category (class A) andlocated at similar distances. The gross feature of the rupturehistory of the L’Aquila earthquake has been also investigated byAlessandro Pino (2009, written communication) who derived theapparent source time functions as perceived by 2 broadbandstations triggered by the main shock. Ameri et al. [11] observedthat the attenuation of PGA with distance looks stronglyasymmetric, with higher decay rate towards the west(Tyrrhenian Sea), possibly indicating directivity effects in therupture propagation along the fault. Cirella et al. [10] imaged therupture history of the L’Aquila earthquake using a nonlinear jointinversion of strong motion and GPS data, and observed theheterogeneous and complex slip distribution along the fault. Theirmodel confirms the rupture directivity toward the SE, in thedirection where the largest slip patch is associated.
The effect on high frequency (f41 Hz) ground motion forsmall-to-moderate-magnitude earthquakes has been now widelyinferred from recorded data ([27–29]). Several papers on recentItalian moderate-magnitude earthquakes, such as the mainshocks (Mw 5.4–6.0) of the 1997 Umbria–Marche seismicsequence ([30,31]) or the events (Mw 5.8 and 5.7) of the 2002Molise sequence ([32]), showed that the observed ground motionswere affected by directivity effects.
In the present study, we have analyzed the available strong-motion data recorded during the moderate-magnitude earth-quake of the Abruzzo seismic sequence. The PGA and PGV valuesfrom processed acceleration and velocity time histories (see
Fig. 9. Comparison of the the acceleration response spectra at 5% damping ratio for two
that are located in the forward (red curves) and backward (black curves) directivity are
referred to the web version of this article.)
Please cite this article as: Akinci A, et al. Characteristics of the strongSoil Dyn Earthquake Eng (2010), doi:10.1016/j.soildyn.2009.12.006
previous section) are listed in Table 1, together with the distancesassociated with the earthquake and the site classification of thestations. Fig. 8 shows the maximum horizontal component of PGAand PGV compared with the ground-motion empirical predictivemodels of SP96, BM07, ITA09, AB07 and specific for the CentralApennines, MAL08, at distances between 0 and 100 km. In general,for the L’Aquila earthquake the comparison between empiricallypredicted and observed values (both PGA and PGV) shows that theempirical predictions overestimate the observed values (indicatedby gray dots) at some sites. In Fig. 8 we indicated those of low PGAand PGV values by gray triangle in the map. It can be easilynoticed that the stations located north-westward to the epicenter,in the backward directivity direction, give lower ground motionthan the sites located south-eastward to the epicenter (emptycircles and triangles), in the forward directivity direction. Most ofthe stations, presented in Fig. 8, are located on limestone andsandstone (site class A) with exception of AVZ (Rjb=25 km), CHT(Rjb=52 km) and SPC (Rjb= 63 km) that are located on Quaternarylacustrine alluvium and Holocene sandy–clayey recent alluvium,respectively, ([33]). In fact, at intermediate frequencies, stationslocated on sedimentary alluvium show higher peak groundvelocity than stations located on rock sites (red circles).
In Fig. 9 we compare the acceleration response spectra at 5%damping for the horizontal components (EW and NS) that areregistered at stations located both in the forward directivity,indicated by red curves, and backward directivity, indicated byblack curves, area. In order to avoid possible bias due to siteeffects, in Fig. 9, we show some selected response spectra
horizontal components (EW dashed line and NS solid line) registered at the stations
a. (For interpretation of the references to color in this figure legend, the reader is
ground motions from the 6 April 2009 L’Aquila earthquake, Italy.
ARTICLE IN PRESS
A. Akinci et al. / Soil Dynamics and Earthquake Engineering ] (]]]]) ]]]–]]]10
recorded by the stations on rock site. It is evident the largedifference in the observed values, depending on their azimuthswith respect to the earthquake fault strike. For example; eventhough both stations, GSA and FMG, are located on Miocenebreccias and Eocene limestone (site class A) with distance of Rjb 9and 16 km, respectively, GSA presents larger ground acceleration,0.6 g, which is located in the forward directivity area than thestation FMG, 0.08 g, located in the anti-directive direction. Again,both the CLN and ANT stations, which are located on Cretaceousand Triassic limestone, at distances Rjb 19 and 20 km, respectively,show quite different peak ground accelerations, depending ontheir azimuth, calculated with respect to the fault strike. Thestation CLN, which is located in the forward directivity area,presents larger ground acceleration (0.3 g) than the station ANT,which is located in the anti-directivity direction (0.1 g). Similarbehavior may be observed at larger distances; for example,stations SUL and SBC are deployed on Cretaceous and Miocene
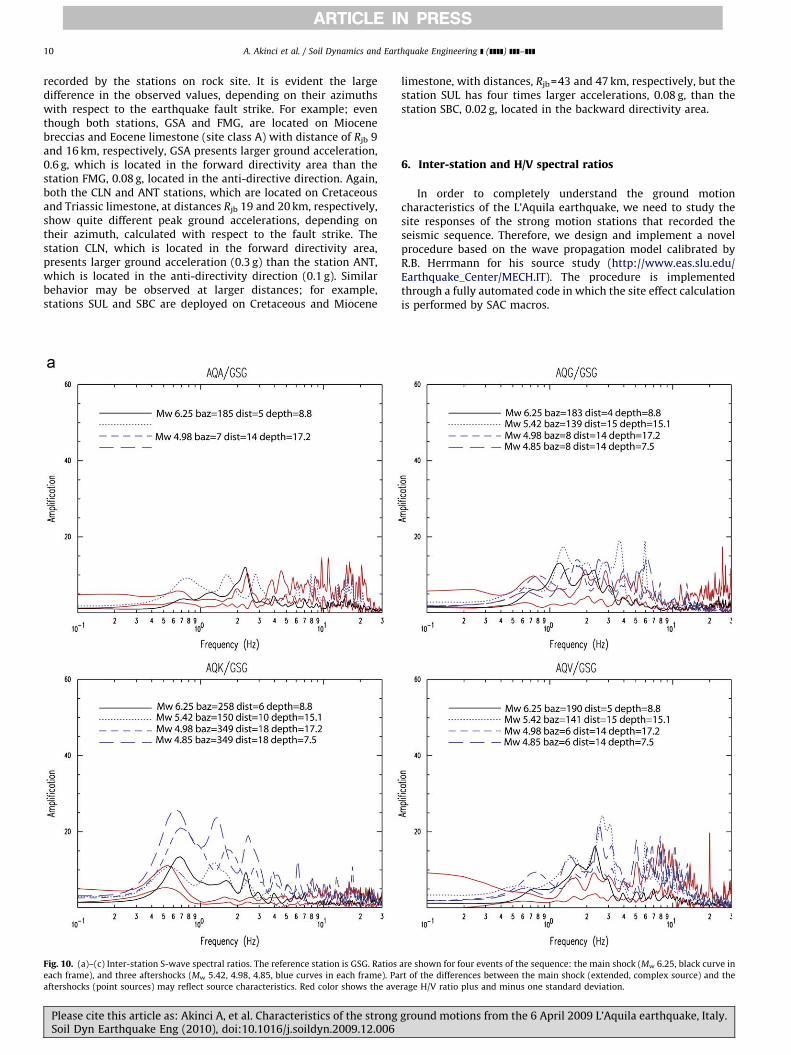
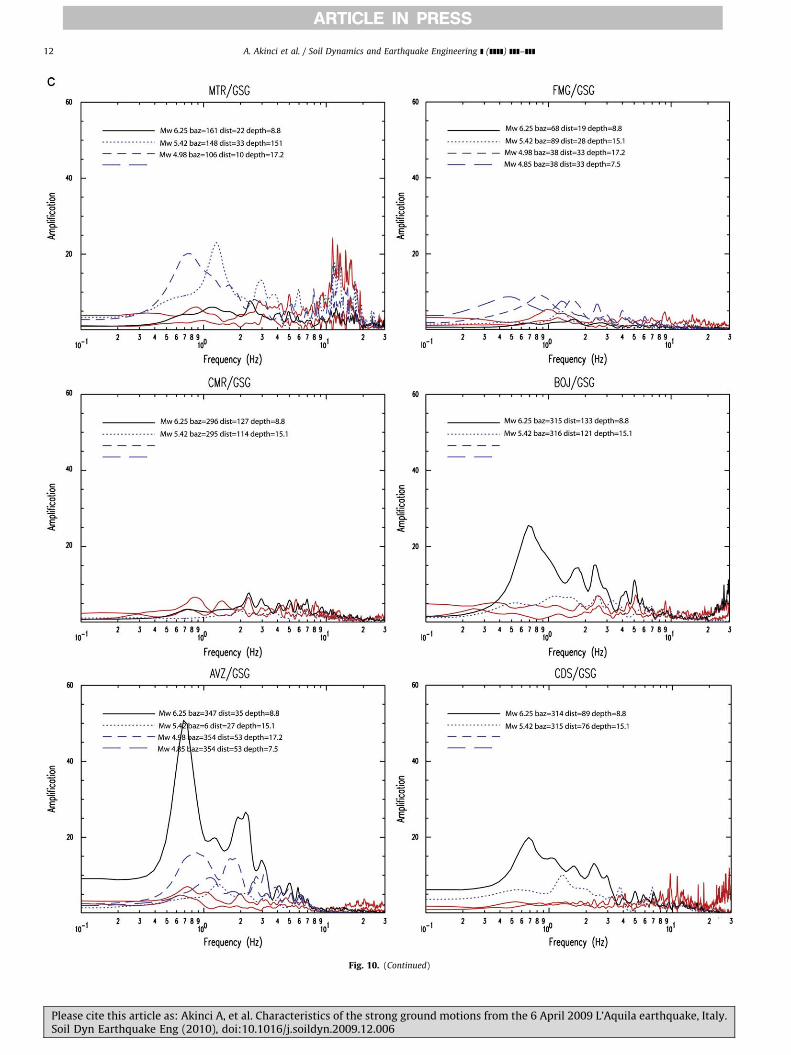
Fig. 10. (a)–(c) Inter-station S-wave spectral ratios. The reference station is GSG. Ratios
each frame), and three aftershocks (Mw 5.42, 4.98, 4.85, blue curves in each frame). Pa
aftershocks (point sources) may reflect source characteristics. Red color shows the ave
Please cite this article as: Akinci A, et al. Characteristics of the strongSoil Dyn Earthquake Eng (2010), doi:10.1016/j.soildyn.2009.12.006
limestone, with distances, Rjb=43 and 47 km, respectively, but thestation SUL has four times larger accelerations, 0.08 g, than thestation SBC, 0.02 g, located in the backward directivity area.
6. Inter-station and H/V spectral ratios
In order to completely understand the ground motioncharacteristics of the L’Aquila earthquake, we need to study thesite responses of the strong motion stations that recorded theseismic sequence. Therefore, we design and implement a novelprocedure based on the wave propagation model calibrated byR.B. Herrmann for his source study (http://www.eas.slu.edu/Earthquake_Center/MECH.IT). The procedure is implementedthrough a fully automated code in which the site effect calculationis performed by SAC macros.
are shown for four events of the sequence: the main shock (Mw 6.25, black curve in
rt of the differences between the main shock (extended, complex source) and the
rage H/V ratio plus and minus one standard deviation.
ground motions from the 6 April 2009 L’Aquila earthquake, Italy.

ARTICLE IN PRESS
Fig. 10. (Continued)
A. Akinci et al. / Soil Dynamics and Earthquake Engineering ] (]]]]) ]]]–]]] 11
Please cite this article as: Akinci A, et al. Characteristics of the strong ground motions from the 6 April 2009 L’Aquila earthquake, Italy.Soil Dyn Earthquake Eng (2010), doi:10.1016/j.soildyn.2009.12.006
ARTICLE IN PRESS
Fig. 10. (Continued)
A. Akinci et al. / Soil Dynamics and Earthquake Engineering ] (]]]]) ]]]–]]]12
Please cite this article as: Akinci A, et al. Characteristics of the strong ground motions from the 6 April 2009 L’Aquila earthquake, Italy.Soil Dyn Earthquake Eng (2010), doi:10.1016/j.soildyn.2009.12.006

ARTICLE IN PRESS
A. Akinci et al. / Soil Dynamics and Earthquake Engineering ] (]]]]) ]]]–]]] 13
First, we compute the S-wave Fourier spectra over wave trainsstarting 1.0 s before the manually-picked S-wave arrivals, andover a time window that does not include surface waves.The length of the time window depends on the dispersioncalculated by Malagnini et al. [21] at 2.0 Hz (arbitrary choice,but dispersion of narrow-band filtered time histories does notchange much between 1.0 and 10 Hz). The length of the timewindow is also slightly magnitude-dependent, in order to takeinto account the different source durations. The same windowlengths were used by Malagnini et al. (2009, unpublishedmaterial) in order to precisely evaluate moment magnitudes ofsmall events occurred in the region. After tapering, de-trending,and removing the average, the Fourier amplitude spectra arecomputed over the three component of the ground motion.
We then correct the S wave spectra for the geometric andanelastic attenuation experienced by the seismic waves through-out their paths from the source to the vicinity of the recording site([21]). H/V spectral ratios are taken between the horizontalFourier spectrum (vector summation of N-S and E-W spectra) andthe vertical one.
Finally, inter-station spectral ratios are corrected for thedifference in radiation pattern between the station at thenumerator, and the reference station. A frequency-dependentcorrection function is calculated by generating the Fourieramplitude spectra of synthetic seismograms computed atboth stations, correcting them for the geometric attenuation,and taking the spectral ratios. The inverse of such ratios are thecoefficients of radiation pattern correction. Synthetic seismo-grams are calculated by using the layered velocity structurecalibrated by R.B. Herrmann during the seismic sequence, withthe only difference that we use a perfectly elastic medium.Radiation pattern corrections are smoothly forced to get closer tounity, following the results by Takemura et al. [34], who statedthat, in their data set of Japanese strike-slip events, the radiationpatterns degrade with increasing frequency, due to crustalscattering, so that the seismic radiation becomes basicallyisotropic at frequencies higher than 5 Hz. Degradation of theradiation pattern needs to be included also for increasingepicentral distances.
We chose station GSG as our reference, since it is located�1.5 km below the free surface, adjacent to the Gran Sassohighway tunnel. As expected, GSG is characterized by a flat H/Vratio over the entire available frequency band of engineeringinterest (0.1–30 Hz). Results for some stations that recorded themain shock are given in Fig. 10(a) and (b) in terms of H/V andinter-station spectral ratios.
0
200
400
600
800
1000
1200
1400
1600
0.0 0.5 1.0 1.5 2.0 2.5 3.0T (s)
PSA
(cm
/s2 )
AQG EW soil=AAQV EW soil=BAQU EW soil=BAQK EW soil=BAB07 Mw=6.3 Rjb=0AB07+sigmaAB07-sigma
Fig. 11. Pseudo-acceleration response spectra at 5% damping of some of the
stations closest to the fault (AQG, AQV, AQU and AQK) compared with the
spectrum derived from AB07 for the same magnitude and distance. Dashed curves
correspond to the confidence limits of 71 standard deviation of the AB07
spectrum.
7. Site response and source-related effects
Source complexity may affect the inter-station spectral ratiostaken on the main shock recordings. Specifically, our techniquecannot take into account differences in the radiation pattern, nordirectivity-driven biases. In order to isolate some of these source-related details, we are to look for magnitude-dependent azi-muthal variations in the characters of the computed site effects.
The spectral ratio and the H/V procedures were applied to allthe events for which the strong-motion recordings were available.In addition to differences between the stations linear siteresponses, source complexity (e.g., directivity effects) may leadto large differences between the main shock’s and the aftershocks’inter-station spectral ratios. For some of the near-fault stations(for example; AQV and AQK), the inter-station spectral ratios tostation GSG are different as a function of magnitude; observedlower amplifications from the ratios of main shock compare tothose of aftershocks, suggesting the occurrence of nonlinear
Please cite this article as: Akinci A, et al. Characteristics of the strongSoil Dyn Earthquake Eng (2010), doi:10.1016/j.soildyn.2009.12.006
behaviors (Fig. 10a). Stations AQK and AQV are located onPleistocene conglomerates and coarse fluvial alluvium (site classB), respectively, AQK is characterized by a remarkable amplifica-tions at about 0.6 Hz which is also observed by De Luca et al. [16],whereas AQV amplifies in the frequency band between 2 and 3 Hz.
Moreover, spectral ratios computed on main shock recordingsat stations for example; CLN, ORC, SUL, CDS, BOJ and AVZ (locatedin the forward directivity area) show larger amplifications thanthose of ANT, LSS, SBC, MTR and FMG (located in the backwarddirectivity area, see Fig. 10(b) and (c)), a behavior that was notobserved for the aftershocks at any of those stations.
Stations AVZ and BOJ are located on Quaternary alluvium andfluvial deposits and are assigned to site class C. Even though thesestations have higher amplitudes in the main shock spectral ratios,BOJ did not show any dominant peak and amplification from theaftershocks spectral ratios. Only station AVZ has distinct domi-nant peak around 1.0 Hz with mean amplification of 10–15.
Horizontal-to-vertical ratios computed on S-wave trains at allavailable events are also presented in Fig. 10(a)–(c). In red we plotthe average H/V ratio plus and minus one standard deviation. Nosignificant differences were found between the H/V ratioscomputed on the main shock and on the aftershocks.
Unfortunately, a small data set is available at the moment, andwe could use only 12 aftershocks of Mw’s between 3.85 and 5.6. Asa consequence, not too many waveforms could be used for thisstudy (i.e., not very many stations were triggered).
8. Acceleration response spectra and comparison with theItalian building code
The EW component of the pseudo-acceleration responsespectra at 5% damping for the two stations closest to L’Aquila(AQK and AQU) and for the central station of ‘‘Valle dell’Aterno’’array AQG and AQV, are shown in Fig. 11 together with theresponse spectrum derived from AB07 for the same magnitudeand distance. Station AQV provides very high values at shortperiods, reaching about 1.6 g at 0.1 s, while AQK, with moremoderate values at short periods, also exhibits large values at longperiods in agreement with the previously discussed siteamplification at 0.6 Hz (1.66 s). The response spectra indicatethat the shaking is particularly strong at periods (0.1–0.5 s)that are typical of the 1–5 story buildings, both in L’Aquila andthroughout the region. It is interesting to note that the AB07
ground motions from the 6 April 2009 L’Aquila earthquake, Italy.
ARTICLE IN PRESS
A. Akinci et al. / Soil Dynamics and Earthquake Engineering ] (]]]]) ]]]–]]]14
spectrum, quite lower as median value respect to the recordedspectra, includes well, inside 71 sigma bounds, even the highestspectral values recorded at zero distance from the fault.
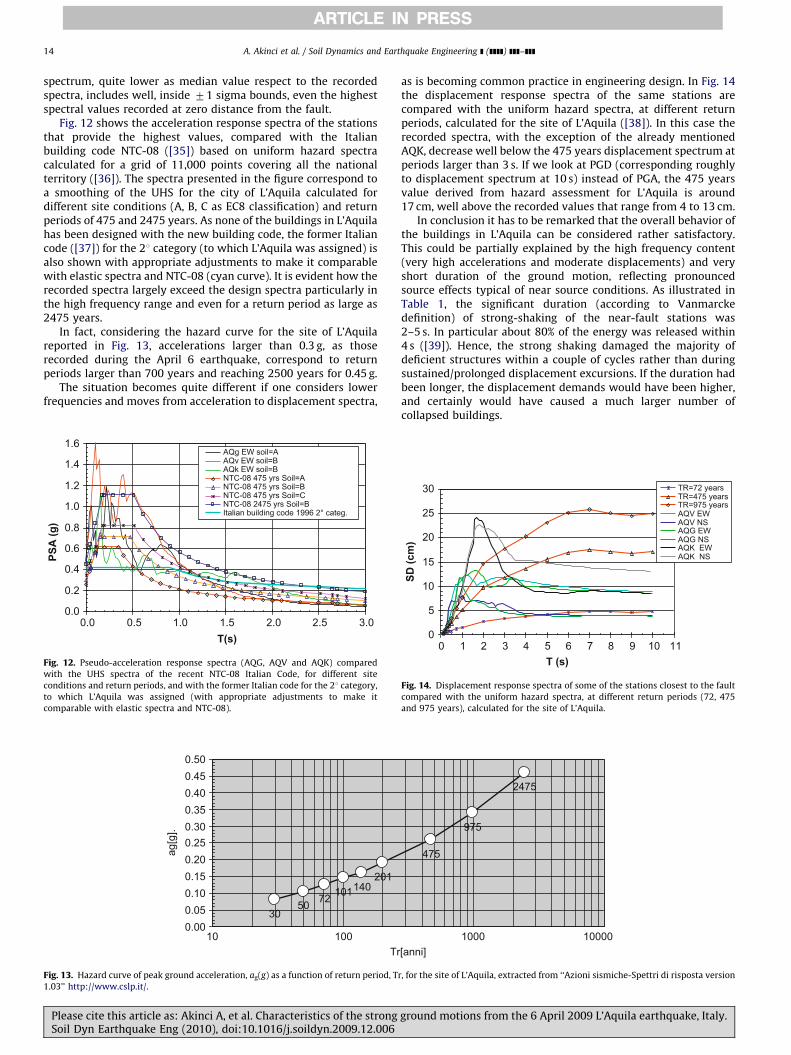
Fig. 12 shows the acceleration response spectra of the stationsthat provide the highest values, compared with the Italianbuilding code NTC-08 ([35]) based on uniform hazard spectracalculated for a grid of 11,000 points covering all the nationalterritory ([36]). The spectra presented in the figure correspond toa smoothing of the UHS for the city of L’Aquila calculated fordifferent site conditions (A, B, C as EC8 classification) and returnperiods of 475 and 2475 years. As none of the buildings in L’Aquilahas been designed with the new building code, the former Italiancode ([37]) for the 21 category (to which L’Aquila was assigned) isalso shown with appropriate adjustments to make it comparablewith elastic spectra and NTC-08 (cyan curve). It is evident how therecorded spectra largely exceed the design spectra particularly inthe high frequency range and even for a return period as large as2475 years.
In fact, considering the hazard curve for the site of L’Aquilareported in Fig. 13, accelerations larger than 0.3 g, as thoserecorded during the April 6 earthquake, correspond to returnperiods larger than 700 years and reaching 2500 years for 0.45 g.
The situation becomes quite different if one considers lowerfrequencies and moves from acceleration to displacement spectra,
0.0
0.2
0.4
0.6
0.8
1.0
1.2
1.4
1.6
0.0 0.5 1.0 1.5 2.0 2.5 3.0T(s)
PSA
(g)
AQg EW soil=AAQv EW soil=BAQk EW soil=BNTC-08 475 yrs Soil=ANTC-08 475 yrs Soil=BNTC-08 475 yrs Soil=CNTC-08 2475 yrs Soil=BItalian building code 1996 2° categ.
Fig. 12. Pseudo-acceleration response spectra (AQG, AQV and AQK) compared
with the UHS spectra of the recent NTC-08 Italian Code, for different site
conditions and return periods, and with the former Italian code for the 21 category,
to which L’Aquila was assigned (with appropriate adjustments to make it
comparable with elastic spectra and NTC-08).
3050 72 101140
201
0.000.050.100.150.200.250.300.350.400.450.50
10 100Tr
ag[g
].
Fig. 13. Hazard curve of peak ground acceleration, ag(g) as a function of return period, T
1.03’’ http://www.cslp.it/.
Please cite this article as: Akinci A, et al. Characteristics of the strongSoil Dyn Earthquake Eng (2010), doi:10.1016/j.soildyn.2009.12.006
as is becoming common practice in engineering design. In Fig. 14the displacement response spectra of the same stations arecompared with the uniform hazard spectra, at different returnperiods, calculated for the site of L’Aquila ([38]). In this case therecorded spectra, with the exception of the already mentionedAQK, decrease well below the 475 years displacement spectrum atperiods larger than 3 s. If we look at PGD (corresponding roughlyto displacement spectrum at 10 s) instead of PGA, the 475 yearsvalue derived from hazard assessment for L’Aquila is around17 cm, well above the recorded values that range from 4 to 13 cm.
In conclusion it has to be remarked that the overall behavior ofthe buildings in L’Aquila can be considered rather satisfactory.This could be partially explained by the high frequency content(very high accelerations and moderate displacements) and veryshort duration of the ground motion, reflecting pronouncedsource effects typical of near source conditions. As illustrated inTable 1, the significant duration (according to Vanmarckedefinition) of strong-shaking of the near-fault stations was2–5 s. In particular about 80% of the energy was released within4 s ([39]). Hence, the strong shaking damaged the majority ofdeficient structures within a couple of cycles rather than duringsustained/prolonged displacement excursions. If the duration hadbeen longer, the displacement demands would have been higher,and certainly would have caused a much larger number ofcollapsed buildings.
475
975
2475
1000 10000[anni]
r, for the site of L’Aquila, extracted from ‘‘Azioni sismiche-Spettri di risposta version
0
5
10
15
20
25
30
0 1 2 3 4 5 6 7 8 9 10 11T (s)
SD (c
m)
TR=72 yearsTR=475 yearsTR=975 yearsAQV EWAQV NSAQG EWAQG NSAQK EWAQK NS
Fig. 14. Displacement response spectra of some of the stations closest to the fault
compared with the uniform hazard spectra, at different return periods (72, 475
and 975 years), calculated for the site of L’Aquila.
ground motions from the 6 April 2009 L’Aquila earthquake, Italy.
ARTICLE IN PRESS
A. Akinci et al. / Soil Dynamics and Earthquake Engineering ] (]]]]) ]]]–]]] 15
9. Conclusions
Important findings can be summarized as follows:
(1)
PlSo
L’Aquila earthquake is the third strongest earthquake re-corded in Italy since 1972 after the 1976 Friuli (Mw 6.4), and1980 Irpinia (Mw 6.9). The earthquake caused severe losses(299 victims and 1500 injured) and damages (about 18000unusable buildings) in the epicentral area.
(2)
The earthquake produced very high accelerations at all thestations close to the fault, reaching up to 0.63 g at station AQVwith very short duration and high frequency content of therecordings. So rigid structures were subjected to very strongforces.(3)
The recordings of the main shock are strongly affected bysource effects and show a directivity effect towards SEdirection with a systematic decrease of PGA and PGV at siteslocated in the backward direction of the rupture propagation.In general, the comparison between empirically predictedrelationships and observed PGA shows that the empiricalpredictions underestimate the observed values closest to theepicenter and overestimate those in the backward directivitydirection (NW sites). The overestimation of far data by theempirical prediction is reduced when considering PGV andlower frequency response spectral values.Cirella et al. [10] investigated the rupture process of the 2009L’Aquila main shock, by jointly inverting seismic waveformsand GPS displacements. They observed two patches of slip;the largest one is located at nearly 8 km SE from thenucleation, and the second one, a smaller slip patch, is locatedabove the hypocenter at a shallower depth (nearly 3 km in theup-dip direction). Their model suggests that the rupture frontpropagation is faster along the up-dip direction than along-strike direction. They observe a quite low rupture velocity,around 2 km/s in the along-strike direction, and noted that thehigh velocities of the crustal structure near the nucleationarea can explain the retrieved difference in rupture speedbetween up-dip and along-strike propagation. These recentstudies confirm our results concerning the evidence ofrupture directivity.(4)
Stations AQV and AQK, located on Pleistocene conglomerateand coarse fluvial alluvium, respectively, show different siteamplifications for the main shock and aftershocks spectraratios. Both station show lower amplifications from the ratiosof the main shock, compared to those of the aftershocks,suggesting the occurrence of a nonlinear behavior.(5)
The inter-station spectral ratios taken on the main shockrecordings for stations in the SE direction (CNL, ORC, SUL, CDS,BOJ and AVZ) show larger amplifications than those in the NWdirection (ANT, LSS, SBC, MTR and FMG). Since sourcecomplexity affect the inter-station spectral ratios for themain shock recordings, this behavior may indicate directivityeffects in the rupture propagation along the fault.(6)
We did not observe any significant differences between the H/V ratios computed on the main shock and on the aftershocksrecordings.(7)
The horizontal and vertical seismic demands, evaluated bymeans of pseudo-acceleration spectral responses, are parti-cularly severe in the short period range. Moreover, the verticalspectral demands, although not generally considered in thedesign, played important role for this event, having, in somecases, recorded vertical accelerations comparable to horizon-tal accelerations ([40]). Generally, the acceleration spectraevaluated in the short period range are higher than thoseconsidered by the NTC-08 for the collapse preventionease cite this article as: Akinci A, et al. Characteristics of the strong grouil Dyn Earthquake Eng (2010), doi:10.1016/j.soildyn.2009.12.006
performance target. If a return period of 475 years isconsidered, the corresponding PGA derived from the hazardassessment of L’Aquila is considerably lower (0.25 g) than thevalues recorded in near fault conditions (0.3–0.65 g). On thecontrary, if the PGD is considered, the 475 years value (17 cm)is higher than those recorded close to the source (4–13 cm).
Acknowledgment
We would like to thank everybody who works at the ItalianDepartment of Civil Protection and Istituto Nazionale di Geofisicae Vulcanologia, INGV, for their efforts towards deploying seismicstations and for providing these data for our scientific researchand study. These recordings are the basis of our study. Authorsthank to Simone Atzori of INGV for providing the Fig. 3 of thepresent study. We thank Massimo Cocco, Antonella Cirella andAndr�e Herrer �o of INGV for their helpful discussions. We are verygrateful to Aldo Zollo and Sinan Akkar for reviewing the manu-script and providing valuable comments and constructive criti-cisms.
References
[1] CNR-PFG. Neotectonic map of Italy. Quad Ric Sci 1987:114.[2] Elter P, Grasso M, Parotto M, Vezzani L. Structural setting of the Apennine–
Maghrebian thrust belt. Episodes 2003;26:205–11.[3] Barchi M, Galadini F, Lavecchia G, Messina P, Michetti AM, Peruzza L, et al. (a
cura di). Sintesi delle conoscenze sulle faglie attive in Italia centrale.CNR—Rapporto del Gruppo Nazionale per la Difesa dai Terremoti; 2000.
[4] Galadini F, Galli P. Active tectonics in the Central Apennines (Italy)—inputdata for seismic hazard assessment. Nat Hazards 2000(22):225–70.
[5] Stucchi M, Akinci A, Faccioli E, Gasperini P, Malagnini L, Meletti C, et al.Mappa di Pericolosit�a sismica del territorioNazionale. 2004; http://zonesismiche.mi.ingv.it/documenti/rapporto_conclusivo.pdf (in italian).
[6] Olsen KB, Akinci A, Rovelli A, Marra F, Malagnini L. 3-D finite-differencemodeling of earthquakes in the City of Rome, Italy. Bull Seismol Soc Am2006;96(1):133–46.
[7] Akinci A, Galadini F, Pantosti D, Petersen M, Malagnini L, Perkins D. Effect oftime dependence on probabilistic seismic-hazard maps and deaggregation forthe Central Apennines, Italy. Bull Seismol Soc Am 2009;99(2A):585–610.
[8] Akinci A, Perkins D, Lombardi AM, Basili R. Uncertainties in probability ofoccurrence of strong earthquakes for fault sources in the Central Apennines,Italy. J Seismol 2009, doi:10.1007/s10950-008-9142-y.
[9] Boschi E, Guidoboni E, Ferrari G, Mariotti D, Valensise G, Gasperini P.Catalogue of strong Italian earthquakes from 461 B.C. to 1997. Ann Geofis2000(43):609–868.
[10] Cirella A, Piatanesi A, Cocco M, Tinti E, Scognamiglio L, Michelini A, et al.Rupture history of the 2009 L’Aquila earthquake from non-linear jointinversion of strong motion and GPS data. Geophys Res Lett 2009;36(19),doi:10.1029/2009GL039795.
[11] Ameri G, Augliera P, Bindi D, D’Alema E, Ladina C, Lovati S, et al.Strong-motion parameters of the M 6.3 Abruzzo (Central Italy) earthquake.2009. /http://esse4.mi.ingv.it/S.
[12] Arias A. A measure of earthquake intensity. In: Hansen R, editor. Seismicdesign for nuclear power plants. Cambridge, Massachusetts: MIT Press;1970. p. 438–83.
[13] Housner GW. Spectrum intensities of strong motion earthquakes. In:Proceedings of symposium on earthquake and blast effects on Structures.Earthquake Engineering Research Institute; 1952.
[14] Vanmarcke EH, Shih-Sheng P Lai. Strong-motion duration and RMS amplitudeof earthquake records. Bull Seismol Soc Am 1980;70(4):1293–307.
[15] Trifunac MD, Brady AG. A study of the duration of strong earthquake groundmotion. Bull Seismol Soc Am 1975;65:581–626.
[16] De Luca S, Marcucci G, Milana T, Sano’. Evidence of low-frequencyamplification in the City of L’Aquila, Central Italy, through a multidisciplinaryapproach including strong- and weak-motion data, ambient noise, andnumerical modeling. Bull Seismol Soc Am 2005(95):1469–81.
[17] Sabetta F, Pugliese A. Estimation of response spectra and simulation ofnon-stationary earthquake ground motions. Bull Seismol Soc Am 1996;86:337–52.
[18] Bommer JJ, Stafford P, Alarcon J, Akkar S. The influence of magnitude rangeon empirical ground-motion prediction. Bull Seismol Soc Am 2007;97(6):2152–70.
[19] Akkar S, Bommer JJ. Empirical prediction equations for peak ground velocityderived from strong-motion records from Europe and the Middle East. BullSeismol Soc Am 2007;97(2):511–30.
nd motions from the 6 April 2009 L’Aquila earthquake, Italy.
ARTICLE IN PRESS
A. Akinci et al. / Soil Dynamics and Earthquake Engineering ] (]]]]) ]]]–]]]16
[20] Bindi D, Luzi L, Pacor F. Inter-event and Inter-station variability computed forthe Italian accelerometric archive (ITACA). Bull Seismol Soc Am 2009;99(4):2471–2488, doi:10.1785/0120080209.
[21] Malagnini L, Scognamiglio L, Mercuri A, Akinci A, Mayeda K. Strong evidencefor non-similar earthquake source scaling in central Italy. Geophys Res Lett2008;35:L17303.
[22] Akkar S, Bommer JJ. Prediction of elastic displacement response spectra inEurope and the Middle East. Earthquake Eng Struct Dyn 2007;36:1275–301.
[23] Boore DM, Joyner WB. Site amplifications for generic rock sites. Bull SeismolSoc Am 1997;87:327–41.
[24] Sabetta F, Lucantoni A, Bommer J, Bungum H. Sensitivity of PSHA results toground motion prediction relations and logic-tree weights. Soil Dyn Earth-quake Eng 2005;25/4:317–29.
[25] Montaldo V, Faccioli E, Zonno G, Akinci A, Malagnini L. Treatment of ground-motion predictive relationships for the reference seismic hazard map of Italy.J Seismol 2005;9:295–316.
[26] Scherbaum F, Schmedes J, Cotton F. On the conversion of source-to sitedistance measures for extended earthquake source models. Bull Seismol SocAm 2004;94(3):1053–69.
[27] Boatwright J, Boore DM. Analysis of the ground accelerations radiated by the1980 Livermore Valley earthquakes for directivity and dynamic sourcecharacteristics. Bull Seismol Soc Am 1982;72(6):1843–65.
[28] Boatwright J. The persistence of directivity in small earthquakes. Bull SeismolSoc Am 2007;97(6):1850–61, doi:10.1785/0120050228.
[29] McGuire JJ. Estimating the finite source properties of small earthquakeruptures. Bull Seismol Soc Am 2004;94:377–93.
[30] Pino NA, Mazza S, Boschi E. Rupture directivity of the major shocks in the1997 Umbria–Marche (central Italy) sequence from regional broadbandwaveforms. Geophys Res Lett 1999;26(14):2101–4.
[31] Cultrera C, Pacor F, Franceschina G, Emolo A, Cocco M. Directivity effectsfor moderate-magnitude earthquakes (Mw 5.6–6.0) during the 1997
Please cite this article as: Akinci A, et al. Characteristics of the strongSoil Dyn Earthquake Eng (2010), doi:10.1016/j.soildyn.2009.12.006
Umbria–Marche sequence, central Italy. Tectonophysics, TECTO-1243552008; 11 p.
[32] Gorini A, Marcucci S, Marsan P, Milana G. Strong motion records of the 2002.Molise, Italy, earthquake sequence and stochastic simulation of the mainshock. Earthquake Spectra 2004;20(S1):S65–79.
[33] Di Capua G, Lanzo G, Luzi L, Pacor F, Paolucci R, Peppoloni S,et al. Caratteristiche geologiche e classificazione di sito delle stazioniaccelerometriche della RAN ubicate a L’Aquila. Internal INGV report, 2009;p. 28.
[34] Takemura S, Furumura T, Saito T. Distortion of the apparent S-waveradiation pattern in the high-frequency wavefield: Tottori-Ken Seibu, Japan,earthquake of 2000. Geophys J Int 2009, doi:10.1111/j.1365-246X.2009.04210.x.
[35] Decreto. Decreto 14/01/2008 del Ministero delle Infrastrutture. NormeTecniche per le Costruzioni, GU n.29 del 04/02/2008. 2008.
[36] Ordinanza. Ordinanza PCM 3519 del 28/04/2006. Criteri generali perl’individuazione delle zone sismiche e per la formazione e l’aggiornamentodegli elenchi delle medesime zone. 2006; G.U. n.108 del 11/05/2006.
[37] Decreto. D.M. 16/01/1996 Norme tecniche per le costruzioni in zonesismiche. 1996.
[38] Faccioli E, Rovelli A. Definizione dell’input sismico sulla base deglispostamenti attesi. Progetti sismologici di interesse per il DPC-Relazionescientifica finale. 2007. http://progettos5.stru.polimi.it.
[39] Sabetta F, Rovelli A, Celebi M, Rinaldis eD. Sequenza sismica dell’Abruzzo:analisi delle registrazioni accelerometriche. ENEA—Energ Ambiente Innova-zione 2009;3.
[40] Masi A, Chauizzi L. Preliminary analyses on the main shock of the Aquilanoearthquake occurred on April 6th, 2009. Comparison between responsespectra evaluated close to the source and elastic demand spectra according tothe 2008 Italian Seismic Code. 2009; ReLUIS, internal report, 22 p., http://www.reluis.it/doc/.
ground motions from the 6 April 2009 L’Aquila earthquake, Italy.


