Embed Size (px)
Citation preview
Durham E-Theses
Molecular ecology of southern elephant seals (miroungaleonina): mating system and population genetics
Fabiani, Anna
How to cite:
Fabiani, Anna (2002) Molecular ecology of southern elephant seals (mirounga leonina): mating system andpopulation genetics, Durham theses, Durham University. Available at Durham E-Theses Online:http://etheses.dur.ac.uk/4161/
Use policy
The full-text may be used and/or reproduced, and given to third parties in any format or medium, without prior permission orcharge, for personal research or study, educational, or not-for-pro�t purposes provided that:
• a full bibliographic reference is made to the original source
• a link is made to the metadata record in Durham E-Theses
• the full-text is not changed in any way
The full-text must not be sold in any format or medium without the formal permission of the copyright holders.
Please consult the full Durham E-Theses policy for further details.

Academic Support O�ce, Durham University, University O�ce, Old Elvet, Durham DH1 3HPe-mail: [email protected] Tel: +44 0191 334 6107
http://etheses.dur.ac.uk
2
Molecular ecology of southern
elephant seals {Mirounga leonina):
mating system and population genetics
by
Anna Fabiani
School of Biological and Biomedical Sciences
University of Durham
2002
This thesis is submitted in candidature for the degree of
Doctor of Philosophy
The copyright of this thesis rests with the author.
No quotation from it should be published without
his prior written consent and information derived 2 4 MAP 003
from it should be acknowledged.
Thesis abstract
The general aim of this research was the analysis of the mating system and the genetic structure o f the southern elephant seal {Mirounga leonina). The specific objectives were to: 1) estimate the distribution o f paternity and the relationship between behavioural and genetic indices o f male reproductive success; 2) quantify the level of kinship among seals and investigate the presence of any genetic pattern that might be a consequence of the social structure o f the population; 3) assess the genetic variation among and within the stocks o f the Southern Ocean and analyse the pattern o f individual dispersal.
The research was conducted at Sea Lion Island (SLI, Falklands), from 1996 to 1998. A l l breeding males of the colony, and females and pups belonging to seven harems (n = 455) were tissue sampled. The samples were analysed at nine microsatellite loci and likelihood based paternity analyses were conducted. Samples (n = 46) from Elephant Island (EI, South Shetlands) were also characterised at the same microsatellite loci, and the mtDNA control region (299bp) was sequenced in 57 seals from SLI and 30 from EI .
The success o f the paternity inference was very high, as a father was found for 95.3% of the pups. Out o f 183 assigned paternities, 151 (82.5%) were secure at the 95% confidence level and 32 (17.5%) at the 80% level. The distribution of paternities indicated an extremely polygynous system, with the majority o f males achieving zero paternities and the harem holders siring up to 96% o f the offspring in each harem (mean 78). Paternity was highly correlated with behavioural indices of mating success {R^ 0.80-0.99), and predicted individual paternities 60%-100% of the time in each harem.
Elevated relatedness values (R) within colony suggested some level of philopatry, though the low Fs, indicated female dispersal between SLI and EI . Females from SLI showed a general higher level of relatedness among each other than did males. However, the harem structuring did not lead to any detectable genetic substructure within the population.
Genetic differentiation was found both within and among putative colonies of the Southern Ocean. The differentiation at mitochondrial markers was higher than at nuclear markers, pointing to a difference in the pattern of breeding dispersal between sexes. Despite the extensive mitochondrial variation ((/>ST= 0.5), genetic evidence of male mediated gene f low was also found between SLI and Macquarie Island (MQ), as an adult male on SLI showed the same haplotype as a seal belonging to the very well defined M Q lineage. Given the pattern o f genetic diversity and patterns of fidelity and dispersal in elephant seals, the most parsimonious interpretation is that the male travelled f rom M Q to SLI. He successfully reproduced in 1996 on SLI, fathering at least 18 offspring. His exceptional migration demonstrates that even populations separated by wide genetic and geographic distances can remain linked, and it is an example of the potential homogenising effect that dispersal and mating system can have on the genetic patterns of a population.
Ill

D E C L A R A T I O N
The material contained in this thesis has not previously been submitted for a degree
at the University o f Durham or any other university. The research reported within
this thesis has been conducted by the author unless otherwise indicated.
© The copyright o f this thesis rests with the author. No quotation from it should be
published without her prior written consent and information derived from it should
be acknowledged.
Acknowledgments
There are many people that helped and supported me during these years of research,
and to all o f them I owe much gratitude.
I would like to firstly thank my supervisor, Dr. Rus Hoelzel, for providing
molecular and genetic advice during the years. His helpfiil comments and corrections
greatly improved the final version of this thesis.
I owe to Professor Luigi Boitani, who initially gave me the opportunity to
study elephant seals. He first stimulated my crifical sense for research and he has
always been a source o f enthusiastic support.
I started studying elephant seals in 1994, and for this I am much in debt to
Filippo Galimberti. He introduced me to his research and passed his great
enthusiasm for elephant seals and evolution on to me. He taught me a tremendous
amount, in all fields. Without our conversations and discussions during all these
years, his expert advice and suggestions, the result o f this research would have been
much different.
For help in the lab, I thank Ada Natoli, Ana Topf, Stefania Gaspari, Dimitris
Vassilakos, Dan Engelhaupt, Nathalie Walker, Courtney Nichols, Carlos De Luna
Lopez, Fiona Hatchell, Colin Nichols, who provided help and support in many
different ways. I am extremely grateful to Ada, for teaching me everything on lab
concerns since the beginning; to Ana, for her invaluable advice on lab and
sequencing matters, saving me weeks of trial and error. With Ana, Stefania, Ada and
Dimitris I shared days o f hard work in the lab and days o f great fun in Durham, Italy
and Canada. Their friendship has been precious in so many occasions, and essential
for the complefion o f this work. I also thank Vicky Kelly, Gillian Storey, Emma
Archer and Sarah Gibson for all their work in the D N A sequencing lab.
Wi th regards to the research on Sea Lion Island, I would like to thank Ilaria
Marzetti, Simona Sanvito, Alice Camplani, Alessia Gallastroni and Daniela Marasco
for their precious and tireless help with field-data collection; the Falkland Islands
Government for providing us with the research licence for the Falklands, and the
ZD

Falkland Islands Development Corporations for allowing the research on Sea Lion
Island. I also thank David and Pat Gray, for their kind and constant help during our
residence at the Sea Lion Lodge.
The samples from Elephant Island were kindly provided by Monica Muelbert,
from the Laboratorio de Mamiferos Marinhos, Brasil.
This project was partially funded by the National Research Council and the
Elephant Research Group of Italy.
I am very grateful to Sean Twiss, Sue Lewis, Ruth Cox, Ana Topf, Barbara
Gorgoni, Nei l EUwood and my sister, for kindly reading some of the chapters. Their
comments, suggestions and corrections greatly improved this thesis. Many thanks
also to Evelyn Coulthard for kindly accommodating me during the completion of
this thesis.
A huge 'thanks' goes to Nei l , to whom I owe most of these years' happiness.
For his suggestions and great help wi th the corrections, for his loving support during
more diff icult moments o f the past year. I honestly do not possess the language skill
to appropriately thank him for being there.
This research is part o f a very long project on elephant seals, and I owe a huge
debt to my parents, who supported me at the beginning o f this sometimes 'extreme'
experience and helped me all the way through these years, regardless of the quality
o f my decisions. This thesis is dedicated to them.
Table of contents
Declaration ii
Abstract i i i
Acknowledgements iv
Table of contents vi
List of figures xi
List of tables xiii
L Introduction 1
1.1 Genetics and reproduction 1
1.2 Site fidelity, dispersal and genetic structure 4
1.2.1 Female gregariousness 6
1.3 Background on Mirounga leonina: reproductive system and major life history
traits 7 1.3.1 Mating system 7
1.3.2 Pattern of growth and mortality 9
1.4 Objectives 11
/ / . Materials and Methods 16
I L l The study population and field site 16
I I . 1.1 Topography and spatial distribution 16
I I . 1.2 Relevant definitions 17
11.1.2.1 Generals 17
11.1.2.2 Male traits 21
IL2 Field work and behavioural methods 22
11.2.1 Population marking and censing 22
11.2.2 Behavioural observations 25
II.2.3 Sample collection 26
II.3 Behavioural and genetic analysis 27
II.3.Indices of male breeding performance 27
II.3.2 Statistics used 27
IL4. Molecular genetic methods 28
11.4.1 DNA extraction and visuahzation 28
11.4.2 Microsatellite DNA 30
11.4.2.1 Microsatellite markers for PGR amplification 30
7/.' . 2.2 PGR (Polymerase Ghain Reaction) 30
II.4.2.3 Microsatellite allele detection 32
II.4.3Mt DNA 33
II. 4.3.] MtDNA amplification 33
II. 4.3.2 MtDNA sequencing and alignment 34
I I . 5 Genetic analysis 35
11.5.1 Paternity analysis 35
II.5.1.1 Gharacterisation of microsatellite loci 35
//.5.1.2 Microsatellite identity check 35
77.5.1.3 Microsatellite null alleles 35
77.5.1.4 Paternity inference 36
11.5.2 SLI population relatedness 39
11.5.3 Population genetic structure 41
II. 5.3.1 Microsatellite population analysis 41
775.3.2 mtDNA population analysis 45
/ / / . Male reproductive success: behavioural estimates and paternity 49
I I I . l Introduction 49
I I I . 1.1 Behaviour and genetics 49
III 1.1.1 Mirounga 49
7777.2 Reproductive context on SLI 51
I I I . 1.3 Aims 54
in . 2 Results 55
III.2.1 Level and distribution of genetic diversity 55
7772.2.7 Identity checking 55
III. 2.1.2 Microsatellite characterisation 55
vn
111.2.2 Mating distribution and breeding perfonnance 57
111.2.2.1 Holders and non-holders 58
III. 2.2.2 Secondary and tertiary males 60
111.2.3 Mating distribution in the harems 61
/ / / . 2.3.1 Socionomy of the harems 61
III. 2.3.2 Mating performance in the harems 64
111.2.4 Paternity analysis 66
III. 2.4.1 Paternity distribution in the population 67
111.2.4.2 Paternity success in the harems 68
/ / / . 2.4.3 Mating performance and paternity 71
III.2.4.4 Behavioural/demographic indices and genetic data 71
I I I . 4 Discussion 76
111.4.1 Behavioural estimates of mating distribution in. Mirounga leonina 76
III. 4.1.1 Breeding performance in the harems 76
111.4.2 Paternity assignment 77
///.4.2.1 Paternities not assigned 77
111.4.3 Paternity and polygyny 80
111.4.3.1 Paternity success in the harems 80
Comparison with other Mirounga populations 80
111.4.4 Estimating paternity from behavioural data 83
/ / / . 4.4.1 Breeding performance 83
111.4.4.2 Behavioural/demographic data 83
III. 4.4.3 Discrepancy between behaviour and genetics 83
IV. Patterns of relatedness within the colony 87
I V . l Introduction 87
IV.1.2 Philopatry and site fidelity 88
rv . 1.2 Female and male movements within the colony of SLI 89
rv . 1.3 Aims 89
IV.2 Results 90
rV.2.1 Relatedness estimates from known relationships 90
IV.2.2 Kinship assessment in the population 92
IV.2.3 Genetic stmcture among harenw and areas 93
IV.2.4 Relatedness within and between harems 94
vin
IV.2.4.1 Females 94
IV.2.4.2 Females, harem holder and secondary males 97
IV. 2.4.3 Holder and peripheral males 99
rV.2.5 Relatedness among seals showing site fidelity 100
IV.2.5.1 Within-colony site fidelity and relatedness 101
IV. 3 Discussion 105
rV.3.1 Estimating relatedness from pairwise comparisons 105
IV. 3.2 Colony relatedness 106
IV. 3.2.1 Within colony relatedness 107
rV.3.3 Female and site fidehty 110
V. Population genetic structure 114
V . l Introduction 114
V. 1.1 Mirounga leonina genetic structure 114
V.1.2 Aims 117
V.2 Results 118
V.2.1 Microsatellite genetic variation 118
V. 2.1.1 Geographic variation of microsatellite allelic frequencies 118
V.2.2 Population differentiation 122
V.2.2.1 Allelic and genotypic distributions 122
V.2.2.2 Population structure 122
V.2.2.3 Population assignment test 123
V.2.3 MtDNA diversity 124
V.2.4 Differentiation and distribution of 299bp mtDNA genotypes 126
V.2.5 Genetic distance and relationship between populations 126
V.3 Discussion 132
V.3.1 Level of genetic variation 132
V.3.2 Genetic differentiation and population structure 132
V.3.2.1 Population structure within the South Georgia stock 132
V.3.3 Population structure among stocks 135
V.3.4 Southern elephant seal dispersal and its implications 137
IX
VL Discussion 139
V I . l Male reproductive success and behaviour 140
VI.2 Comparisons of variance in male mating and reproductive success 142
VI.2.1 Lifetime reproductive success 146
VI.3 Breeding system and genetic structure 149
VI.3.1 Female gregariousness and site fidehty 149
VI.3.2 Dispersal patterns 152
VIL References 157
APPENDIX A - Paternity Program CERVUS 180
APPENDIX B - Paternity assignment within harems 184
APPENDIX C - Behavioural estimates of individual reproductive
success 206
List of Figures
11. Introduction
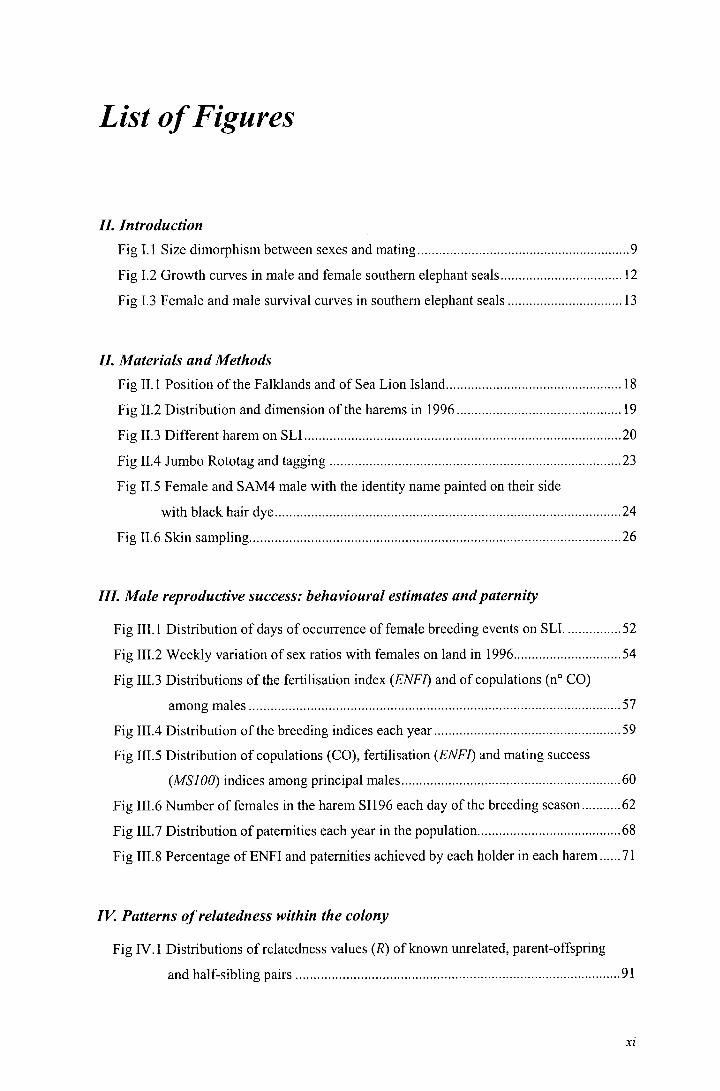
Fig 1.1 Size dimorphism between sexes and mating 9
Fig 1.2 Growth curves in male and female southern elephant seals 12
Fig 1.3 Female and male survival curves in southern elephant seals 13
/ / . Materials and Methods
Fig I I I Position of the Falklands and of Sea Lion Island 18
Fig II.2 Distribution and dimension of the harems in 1996 19
Fig II.3 Different harem on SLI 20
Fig II.4 Jumbo Rototag and tagging 23
Fig I I . 5 Female and SAM4 male with the identity name painted on their side
with black hair dye 24
Fig II.6 Skin sampling 26
/ / / . Male reproductive success: behavioural estimates and paternity
Fig I I I . l Distribution of days of occurrence of female breeding events on SLI 52
Fig III.2 Weekly variation of sex ratios with females on land in 1996 54
Fig I I I . 3 Distributions of the fertilisation index (ENFI) and of copulations (n° CO)
among males 57
Fig III.4 Distribution of the breeding indices each year 59
Fig III.5 Distribution of copulations (CO), fertilisation (ENFI) and mating success
(MSI 00) indices among principal males 60
Fig I I I . 6 Number of females in the harem SI 196 each day of the breeding season 62
Fig III.7 Distribution of paternities each year in the population 68
Fig I I I . 8 Percentage of ENFI and paternities achieved by each holder in each harem 71
IV. Patterns of relatedness within the colony
Fig r v . l Distributions of relatedness values (R) of known unrelated, parent-offspring
and half-sibling pairs 91
XI
Fig IV.2 Relatedness distribution among females within and between harems,
each year 95
Fig rv.3 Distribution of relatedness values (7?) for female pairs in each harem 96
Fig IV.4 Mean relatedness values of known and unknown relationships in the
populations 108
Fig rv.5 Mean relatedness values among different groups of seals within harems 111
V. Population genetic structure
Fig V . l Position and dimension of Mirounga leonina populations 115
Fig V.2 Polymorphic sites in the 299bp segment of mtDNA 128
Fig V.3 Median joining network of mtDNA sequences 129
Fig V.4 Maximum parsimony tree 131
xu
List of Tables
II. Materials and Methods
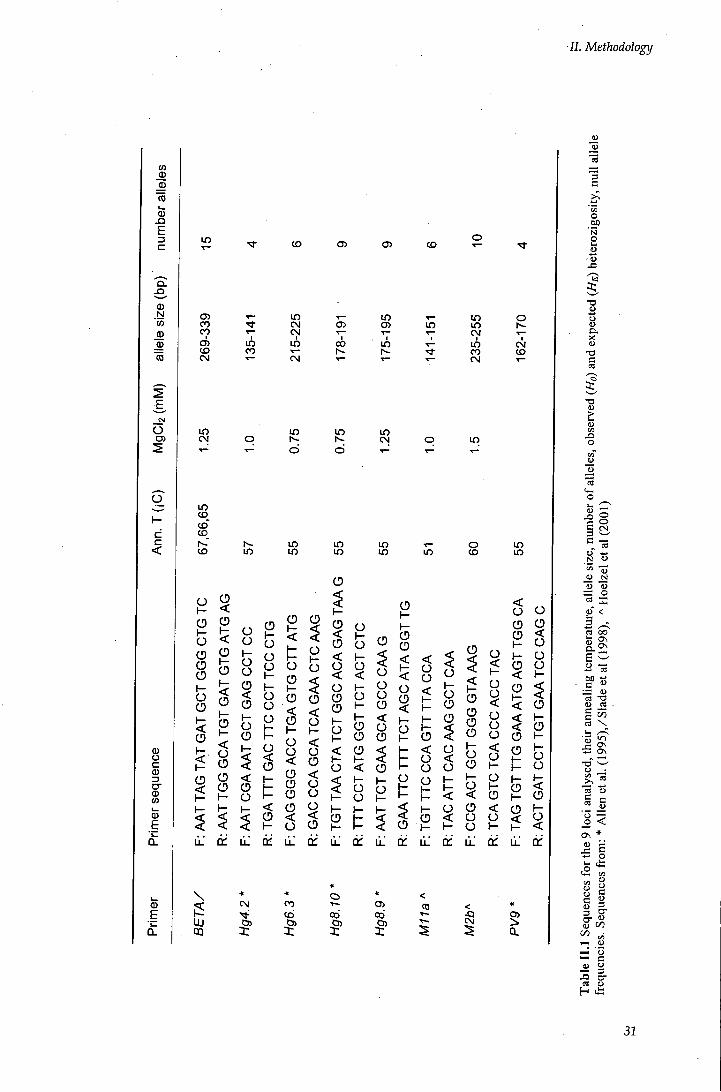
Table I I . 1 Sequences for the 9 loci analysed, their annealing temperature, allele size,
observed and expected heterozigosity, null allele frequencies 31
Table II.2 Values of parameters used in simulation of paternity inference with the
program CERVUS, for each year 39
/ / / . Male reproductive success: behavioural estimates and paternity
Table I I I . l Polymorphism characteristics for the microsatellites 56
Table III.2 AduU aduh allele frequencies and percentages for the primer Beta 56
Table III.3 Demographic and social details of the harems analysed 63
Table III.4 Distribution details of the behavioural indices in each harem 65
Table III.5 Critical A scores, percentages of paternity predicted to be solved by
simulation and paternity inference results in the two years 67
Table III.6 Distribution of paternities in each harem 69
Table III.7 Paternity distribution's statistics for each harem 70
Table I I I . 8 Coefficients of determination {R') between the three behavioural indices
and paternities in each harem 72
Table III.9 Level of congruence between behavioural indices and genetic paternity 74
Table I I I . 10 Coefficients of determination between paternity and each index 75
Table I I I . 11 Success of paternity inference in mammal mating systems 78
IV. Patterns of relatedness within the colony
Table IV. 1 Estimates of relatedness in the population of SLI 93
Table IV.2 7? values of females within and between harems 97
Table rV.3 7? values of female-harem holder pairs are given for each harem 98
Table rv.4 7? values between holder and peripheral males and between holder
and males not associated to his harem 100
Table rV.5 Returning females with high level of relatedness 102
Table rV.6 Relatedness for females belonging to the same harem for each season 103
xni
Table IV.7 Mean R values between returning females and those breeding
in the same or different harem (or area) 104
Table rv.8 Female site fidelity in different species of pinnipeds 113
V. Population genetic structure
Table V. 1 Polymorphism at each locus all sampled populations 119
Table V.2 Allele frequencies of microsatellites loci 120
Table V.3 Allele frequencies at the BETA loci 121
Table V.4 Genetic differentiation forRho and 6'between populations 123
Table V.5 Genetic distances between populations, DA and (S/jf 123
Table V.6 Assignment of individuals to the populations 124
Table V.7 Genetic variabihty based on mtDNA analysis (299 bp) 125
Table V.8 Differentiation among populations for mtDNA 126
Table V.9 Nei's D,y and Z)„ 127
xw
/ . INTRODUCTION
In recent years, molecular genetic methods have become increasingly sophisticated
and easily applied to studies at the species, population and subpopulation levels
(Avise 1994, Sugg et al. 1996). Their application to the investigation of mating
systems, reproductive success and relatedness between individuals in a population
has provided new important information about the biology o f many species,
including genetic structure (Paetkau et al. 1999; Girman et al. 2001), dispersal
(Lyrholm et al. 1999; Pardini et al. 2001), social structure and mating systems
(Pemberton et al. 1992; Lebas 2001).
Several factors are responsible for the differentiation of gene frequencies
among and within populations o f a species. These factors involve gene flow, random
genetic drift , various modes o f natural and sexual selection, and the opportunity for
recombination mediated by the mating system of the species (Avise 1994). In the
traditional approach o f population genetics, individuals mate randomly and
biodiversity is assessed using populations as discrete units. However, in many
species, random mating does not occur, dispersal and philopatry are sex biased and
social organisation restricts the access to potential mates to only a few individuals
(Sugg et al. 1996). Therefore, it is clear that genetic considerations require the study
of the biological parameters and the natural history traits relevant to each population.
I . l Genetics and reproduction
'Reproduction, in a word, is the central problem in the life sciences, for it is the issue
around which all other aspects of biology hinge" (Dunbar 1984).
Studies o f the variance in reproductive success are critical to understanding
demography, genetic structure and processes o f selection in natural populations
(Coltman et al. 1998). Sexual selection is the differences in reproduction that arise
f rom variation among individuals in traits that affect success in competition over
mates and fertilisations (Andersson 1994). High variance in reproductive success
between and within sexes can be an indicator of sexual selection and be a major
/ . Introduction
factor for the evolution o f life history traits, morphology and mating system characteristics (Emlen and Oring 1977; Andersson 1994). Reproductive variance within sex indicates a potential for selection among males and females, and different selective pressures between sexes allow the evolution of phenotypic traits in the sex where selection is stronger. In polygynous species, variance in male reproductive success is large and may affect the rate of loss of genetic variation and aher the genotypic proportions from those expected with panmixia (Chesser 1991). In fact, the degree of polygyny can strongly influence the effective population size and hence the rate at which genetic drift may operate (because the rate at which genetic variation is lost is inversely proportional to the effective population size Ng).
Mating systems describe the ways in which individuals o f both sexes interact
to maximise their reproductive success (Davies 1991), and are best viewed as the
outcome of the reproductive strategies o f individuals rather than population or
species characteristics (Glutton Brock 1989). Provided that only female parental care
is required, males should maximise fitness by competing for as many mates as
possible whereas females should maximise fitness by ensuring offspring survival and
choosing 'good mates' (Boness et al. 1993). The extent of variation in mating and
competitive behaviour, within and between populations, w i l l depend on the
adjustment o f individual behaviour to differences in the social and ecological
environment, and to variation in individual capabilities (Emlen and Oring 1977).
Wi th the application o f molecular techniques, much progress has been made in
the study o f mating systems at the level o f the individual (i.e. through the
identification o f paternity and maternity) and it is now commonplace to distinguish
between social and genetic mating systems. From the social point of view, mating
systems refer to different strategies of obtaining mates, to different forms of pair
bonding or mate guarding, which w i l l depend on the spatial dispersion and temporal
availability o f the l imiting sex (Emlen and Oring 1977; Grant et al. 1995). Genetic
mating systems describe which individuals are reproducing and with whom (Hughes
1998). They often differ, for example when animals that form long-term pair bonds
(social monogamy) produce extra-pair offspring (genetic polygamy) (Coltman et al.
1999a).
/ . Introduction
Unti l recently, estimates of male reproductive success have been based on behavioural indices (Dewsbury 1982). In polygynous animals, male mating success has traditionally been measured from the time during which a male has exclusive access to an oestrus females (e.g. for Cervus elaphus: Gibson and Guinness 1980), the dimension o f the harem (e.g. for Theropithecus gelada: Dunbar 1984), from observed matings (e.g. for Mirounga leonina: Le Boeuf 1974; Otaria byronia: Campagna et al. 1988) or number o f females guarded (e.g. Panthera leo: Packer et al. 1988). However, 'unconventional' and 'sneaky', less easy to observe mating tactics might exist (Hogg and Forbes 1997; Zamudio and Sinervo 2000). Alternative mating tactics might arise from different ways of achieving the same success or because not all individuals can successfiilly follow the best tactic. The payoff of any particular tactic may vary between individuals, for example between individuals of different quality. A common scenario is that success is unevenly distributed among individuals within a population, depending on body condition. In this case, some individuals may be more constrained than others in achieving the same success and hence adopt different tactics and make the best of their constrained situation (Cunningham and Birkhead 1998). Various elements can also reduce the reliability and the accuracy o f behavioural estimates:
• females may copulate more than once and with different males during their
oestrous period (Le Boeuf 1974);
• sperm competition might be present (M0ller and Birkhead 1989) and female
fertilisation dependent on mating order
• cryptic female choices might exist and show a female post-copulation control
(Eberhard and Cordero 1995).
Molecular methods, therefore, offer the opportunity to test whether observed patterns
of behaviour can be accurately translated into realised paternity. Combined with
behavioural data, they provide a fiandamental tool for the interpretation of mating
system structure and evolution.
I. Introduction
In a large number of apparently monogamous birds, extra-pair copulations represent a significant mating strategy and individuals show complex mating behaviours that greatly differ f rom those implied by socially monogamy (Burke et al. 1989). Molecular analyses showed that in indigo buntings {Passerina cyanea) extra-pair copulations were responsible for fertilising more than 14% of all offspring (Westneat 1987). In the emu (Dromaius novaehollandiae), the percentage of extra-pair copulations exceeded 50%, but sexual behaviour seemed to dynamically adapt to level o f competition o f mates at any time of the breeding season (Taylor et al. 2000). Studies on polygynous species have revealed widely different results. In some cases, dominance rank or copulation frequency reflected parentage (e.g. Cervus elaphus: Pemberton et al. 1992, Slate et al. 2000; Gorilla gorilla beringei: Robbins 1999). In these species, males usually guard groups of females, and there are relatively stable dominance hierarchies among males. Lower correlation may be present in species in which dominance relationships among males are less stable, where associations between females and males are brief and temporary, or where alternative tactics are possible (Coltman et al. 1999a,b). For example, males may fol low alternative tactics in agamid lizards (Ctenophorus ornatus: LeBas 2001), Soay rams {Ovis aries: Coltman et al. 1999a), grey seals (Halichoerus grypus: Amos et al. 1993), and fur seals (Arctocephalus gazella: Gemmell et al. 2001). In this context, accurate parentage assignment allows determination of the 'genetic payoff for observed behavioural strategies and calculation of both seasonal and lifetime reproductive success (Hughes 1998).
1.2 Site fidelity, dispersal and genetic structure
Dispersal is defined as the movement o f an individual from its point of origin to the
place where it reproduces or where it would have reproduced i f it had survived and
found a mate (Greenwood 1980). This differentiates dispersal events from feeding
excursions.
Fidelity to breeding site (i.e. return to the same site to breed) and philopatry
(i.e. return to the natal colony to breed) are common among mammals and they are
thought to confer considerable reproductive advantages. Nevertheless, the pattern of
fidelity and the extent o f dispersal vary, depending on the reproductive system of the
/ . Introduction
species and the sex o f the individual. In the majority of polygynous mammals dispersal is sex-biased, and males disperse while females show site fidelity and philopatry (Greenwood 1980). Such gender differences in dispersal can influence the genetic structure o f populations, particularly when the haploid and maternally inherited mitochondrial D N A is compared with the biparental nuclear genome. For example, significant differentiation in mtDNA but not in nuclear markers has been found between populations o f f i n whales {Balenoptera physalus: Berube et al. 1998), sperm whales {Physeter macrocephalus: Lyrholm et al. 1999) and white sharks (Carchsrodon carcharias: Pardini et al. 2001). In these cases, it was suggested that the variation was due to limited dispersal o f females and extensive dispersal of males.
Some of the most striking examples of site fidelity also come from marine
species, where highly mobile populations, in the presence of very few geographical
barriers, can indeed be strongly structured. Each reproductive season, female green
turtles {Chelonya mydas) migrate more than 2000 km from foraging grounds in
Brazil to nesting sites on Ascension Island (Bowen et al. 1992). In this species,
mitochondrial analysis found high structure both between oceans (Atlantic-
Mediterranean vs Indo-Pacific) and breeding rockeries, identifying both geographic
constraints (physical separation between oceans) and philopatric reproductive
behaviour (natal homing within ocean) as the factors influencing the genetic
structure o f the species. Haplotype differences were also found between groups of
humpback whales (Megaptera novaeangliae) that were following different patterns
of migration - between summer feeding grounds in subpolar or temperate areas to
winter breeding zones in the tropics (Baker et al. 1990). The authors interpreted the
spatial segregation o f genotypes as being the consequence o f female fidelity to
migratory destinations (Avise 1994).
Radio and satellite-tracking of pinnipeds have showed that seals and sea lions
can travel many thousands o f kilometres (Stewart and De Long 1994; McConnell
and Fedak 1996; Stevick et al. 2002), but the extent to which individuals move
between breeding sites is largely unknown. With such capability to travel long
distances, one might expect interchanges between different breeding colonies.
/ . Introduction
However, site fidelity is largely present in pinnipeds, especially among females, and individuals usually return to breed at the same colony after long foraging trips.
1.2.1 Female gregariousness
In Mirounga and many otariids the level o f female gregariousness is extreme during
the breeding season. Theorefical predictions propose the concept of inclusive fitness
(Hamilton 1964) to explain altruistic behaviours (i.e. behaviours that appear to
benefit recipients instead o f or more than the donor), though pinnipeds generally do
not exhibit co-operafive behaviour or social conditions that would suggest the
operation o f kin selection (Boness et al. 1993). Group breeding may involve
significant costs to females, as it can facilitate parasite and disease transmission, can
increase pup mortality and promote inter-female aggressiveness (Le Boeuf and
Briggs 1977). However, it is clear that in these species selective factors contribute to
the maintenance o f the female tendency to aggregate. One of the benefits o f breeding
in a group or harem is the defence from male aggressive mating tactics, through the
dilution effect o f grouping and the exclusion o f marginal males by higher-ranking
males (Bartholomew 1970). Female elephant seals are much smaller than males,
males have enlarged canines and they constantly show behavioural patterns of
herding and biting while interacting with the females. Hence male-female
interactions may be very risky for females. Female harassment is also a characteristic
o f other dimorphic pinnipeds (e.g. Halichoerus grypus: Boness et al. 1995;
Mirounga angustirostris: Le Boeuf and Mesnick 1990a,b; Otaria byronia:
Campagna et al. 1992) and it can involve serious injures for females and reduce their
reproductive success (Le Boeuf and Mesnick 1990a; Boness et al. 1995).
Site fidelity and philopatry can also contribute to female aggregation. Females
may return to the same site where they successfiiUy bred the previous season, or to
places where topographical features can benefit their breeding performance
(Pomeroy et al. 2001). I f females return to the same site to breed and aggregate in
groups, the level o f gene correlations might be higher within than between groups
(Chesser 1991a) and might in turn lead to some advantages, including reduction of
agonistic encounters or increase in likelihood o f altruistic behaviours like fostering
(Schaeff et al. 1999).
J. Introduction
Female philopatry and concomitant male dispersal can result in differing degrees o f genetic relatedness between male and female individuals within a population (Surridge et al. 1999). Similarly, it has been shown that polygyny coupled with female philopatry produces consistently high gene correlations among offspring and adults within social groups (Chesser 1991a). However, very few studies have investigated the pattern o f genetic relatedness in polygynous (or lightly polygynous) species (Oryctolagus cuniculus: Surridge et al. 1999; Phoca vitulina: Schaeff et al. 1999; Halichoerus grypus: Pomeroy et al. 2000). In particular, genetic relatedness has yet to be investigated in a high polygynous species such as Mirounga leonina, where females tend to return to the same breeding colony each year and aggregate in large and defined harems during a short period of reproduction.
1.3 Background on Mirounga leonina: reproductive system and major life
history traits
1.3.1 Mating system
Offshore marine feeding, terrestrial parturition and long fasting period have been
identified as major factors in the evolution of pinniped mating systems
(Bartholomew 1970). Many species are polygynous and sexually dimorphic; that is,
males are much larger than females. Others are monogamous, or at least serially
monogamous, in which case males and females are nearly the same size and look
very much alike.
Pinnipeds have diverse mating systems and they can be divided into three
categories according to breeding habitat (Riedman 1990): (1) those that breed on
land, (2) those that breed on pack ice (floating ice), (3) those that breed on fast ice
(ice attached to land). Of the 33 species o f pinnipeds, 20 breed on land, while the
remaining 13 breed on ice. A moderate to high degree of polygyny is found in all
otariids, in the walrus and in only four phocids. Eighteen o f the 20 species o f land-
breeding pinnipeds are polygynous and strictly sexually dimorphic, and breed in
moderate-sized to extremely large colonies. Highly or moderately polygynous land
breeding pinnipeds include all sea lions and fur seals and only three species o f
phocids: northern and southern elephant seals and grey seals. The remaining land
breeders (which are probably polygynous to some degree) are the harbour seal and
I. Introduction
two species o f monk seal. In contrast, 11 of the 13 species of ice-breeding seals appear to be either monogamous or serially monogamous, as well as monomorphic (the sexes are similar in size and appearance). The two ice breeders that do not fit the pattern, showing moderate polygyny, are the Weddell seal and the walrus. Except for the walruses, all o f the ice breeders are phocid seals.
Many factors may account for this range of mating strategies: the breeding
habitat and its ecological and climatic feature (Anderson et al. 1975; Le Boeuf 1991;
Campagna and Le Boeuf 1988), the capacity for prolonged fasting, the temporal and
spafial patterns o f female distribution, the level of female gregariousness (Jouventin
and Comet 1980; Boness 1991) and the synchrony of female oestrus (Boyd 1991). In
some species, males can control female movements and intensify their
gregariousness by herding. Herding is widespread among pinnipeds but rarely
effective. However, it is typical and effective in southern elephant seals. Harem
holders frequently recruit arriving or solitary females to the their harems (Galimberti
et al. 2000a), increasing the number o f females in their harem and hence the
potenfial reproducfive resource to which they w i l l have access. Their capacity of
herding females is a major factor in defining the degree o f polygyny of this mating
system, and the individual male capability is the first requirement for a high level of
mating monopolisation. Individual behavioural performance, coupled with the ability
of fasting for months, allows protracted control o f the females. Only a few males that
are able to control mafings during the entire breeding season w i l l exhibit the highest
reproductive success.
The breeding habitat can also have a strong effect in determining the level of
pinniped polygyny, most o f all because a reliable breeding environment encourages
female gregariousness (Bartholomew 1970). Female gregariousness offers a high
potential o f mating monopolisation and sexual selection, providing the opportunity
for some males to mate wi th many females. This results in intense competition
among males for mates, which in turn leads to sexually dimorphic traits and
polygyny. Among highly polygynous pinnipeds, males are much larger than females
and have developed secondary sexual characteristics (armaments), such as the
pendulous nose and frontal chest shield o f the elephant seal or the hooded seal's
balloon-like inflatable nasal sac.
/. Introduction
a)
Alpha male
Peripheral male
b)
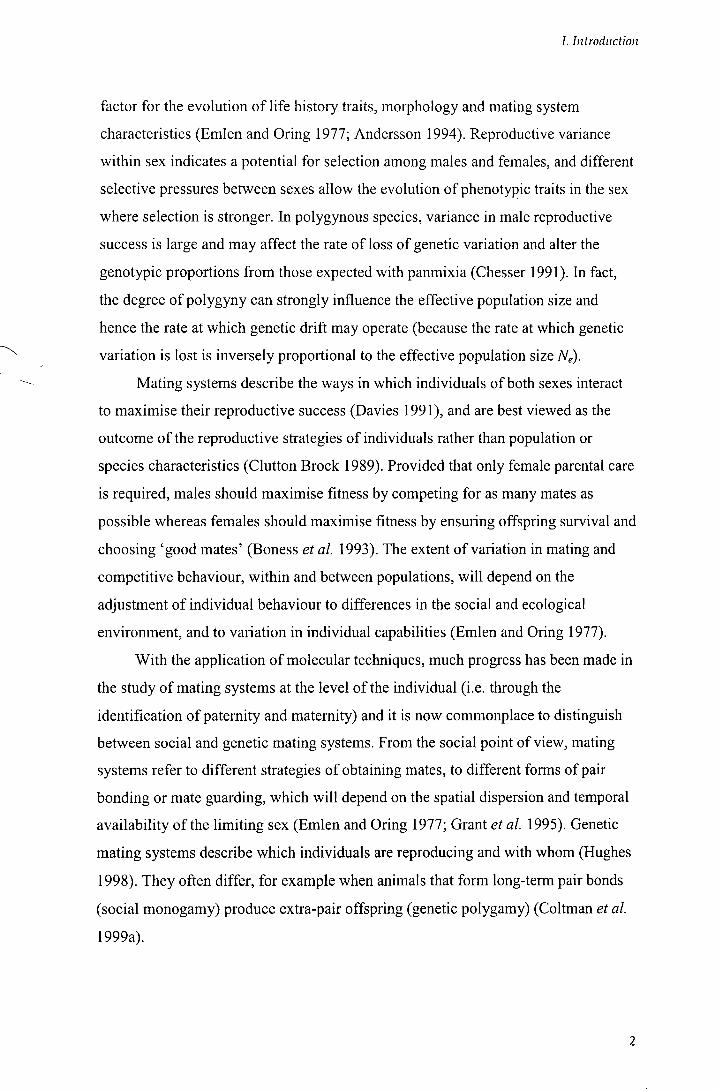
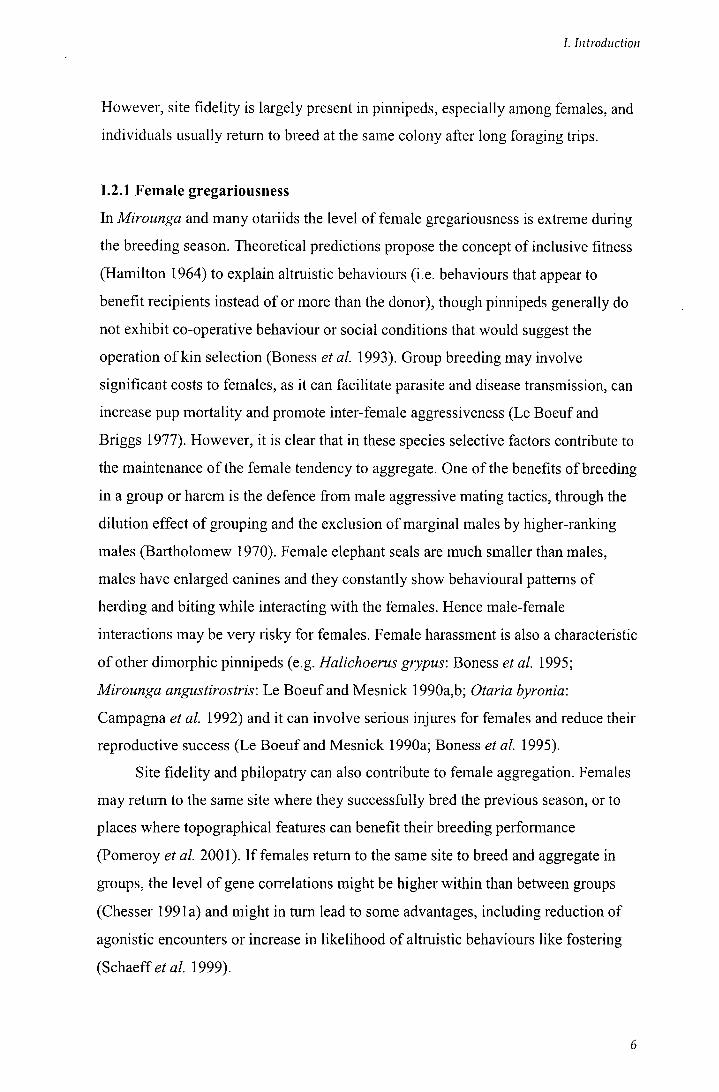
Fig 1.1 Size dimorphism between sexes and mating, a) a male southern elephant seal, age SAM4. with a medium-si/cd female, b) left: mating between an adull male and an oestrus female (oflcn ihc male bites the female during the copulation to prevent her from moving); right: a peripheral male sneaks" in the harem and mates with a female while the harem holder is copulating and cannot see him
7. Introduction
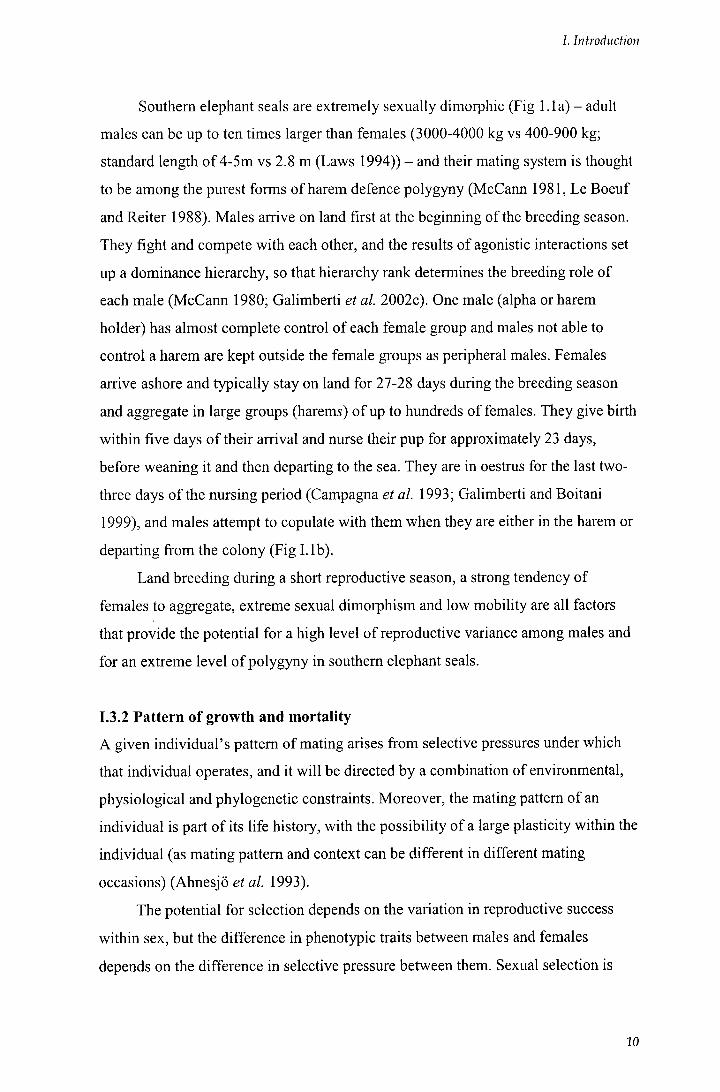
Southern elephant seals are extremely sexually dimorphic (Fig 1.1a) - adult males can be up to ten times larger than females (3000-4000 kg vs 400-900 kg; standard length o f 4-5m vs 2.8 m (Laws 1994)) - and their mating system is thought to be among the purest forms of harem defence polygyny (McCann 1981, Le Boeuf and Reiter 1988). Males arrive on land first at the beginning of the breeding season. They fight and compete with each other, and the results of agonistic interactions set up a dominance hierarchy, so that hierarchy rank determines the breeding role of each male (McCann 1980; Galimberti et al. 2002c). One male (alpha or harem holder) has almost complete control of each female group and males not able to control a harem are kept outside the female groups as peripheral males. Females arrive ashore and typically stay on land for 27-28 days during the breeding season and aggregate in large groups (harems) o f up to hundreds of females. They give birth within five days o f their arrival and nurse their pup for approximately 23 days, before weaning it and then departing to the sea. They are in oestrus for the last two-three days o f the nursing period (Campagna et al. 1993; Galimberti and Boitani 1999), and males attempt to copulate with them when they are either in the harem or departing f rom the colony (Fig I . lb ) .
Land breeding during a short reproductive season, a strong tendency o f
females to aggregate, extreme sexual dimorphism and low mobility are all factors
that provide the potential for a high level of reproductive variance among males and
for an extreme level o f polygyny in southern elephant seals.
1.3.2 Pattern of growth and mortality
A given individual's pattern of mating arises from selective pressures under which
that individual operates, and it w i l l be directed by a combination o f environmental,
physiological and phylogenetic constraints. Moreover, the mating pattern of an
individual is part o f its life history, with the possibility of a large plasficity within the
individual (as mating pattern and context can be different in different mating
occasions) (AhnQ&jo et al. 1993).
The potential for selection depends on the variation in reproductive success
within sex, but the difference in phenotypic traits between males and females
depends on the difference in selective pressure between them. Sexual selection is
10
I. Introduction
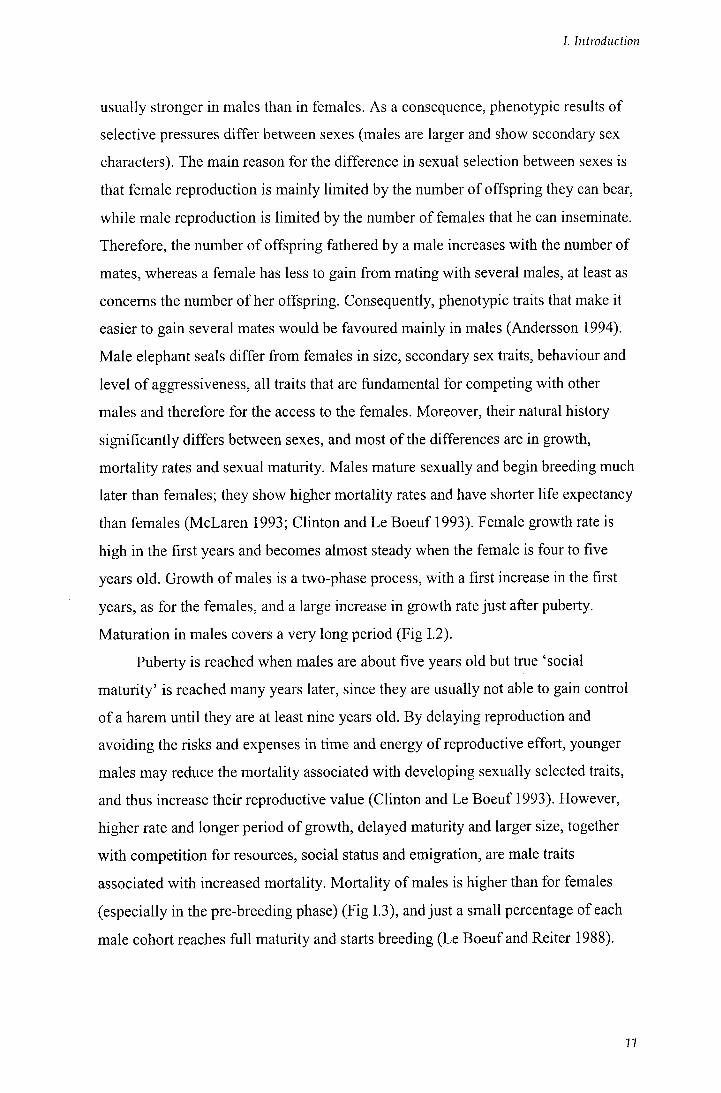
usually stronger in males than in females. As a consequence, phenotypic results of selective pressures differ between sexes (males are larger and show secondary sex characters). The main reason for the difference in sexual selection between sexes is that female reproduction is mainly limited by the number o f offspring they can bear, while male reproduction is limited by the number of females that he can inseminate. Therefore, the number o f offspring fathered by a male increases with the number of mates, whereas a female has less to gain from mating with several males, at least as concerns the number o f her offspring. Consequently, phenotypic traits that make it easier to gain several mates would be favoured mainly in males (Andersson 1994). Male elephant seals differ f rom females in size, secondary sex traits, behaviour and level o f aggressiveness, all traits that are fiandamental for competing with other males and therefore for the access to the females. Moreover, their natural history significantly differs between sexes, and most o f the differences are in growth, mortality rates and sexual maturity. Males mature sexually and begin breeding much later than females; they show higher mortality rates and have shorter life expectancy than females (McLaren 1993; Clinton and Le Boeuf 1993). Female growth rate is high in the first years and becomes almost steady when the female is four to five years old. Growth o f males is a two-phase process, with a first increase in the first years, as for the females, and a large increase in growth rate just after puberty. Maturation in males covers a very long period (Fig 1.2).
Puberty is reached when males are about five years old but true 'social
maturity' is reached many years later, since they are usually not able to gain control
o f a harem until they are at least nine years old. By delaying reproduction and
avoiding the risks and expenses in time and energy o f reproductive effort, younger
males may reduce the mortality associated with developing sexually selected traits,
and thus increase their reproductive value (Clinton and Le Boeuf 1993). However,
higher rate and longer period of growth, delayed maturity and larger size, together
wi th competition for resources, social status and emigration, are male traits
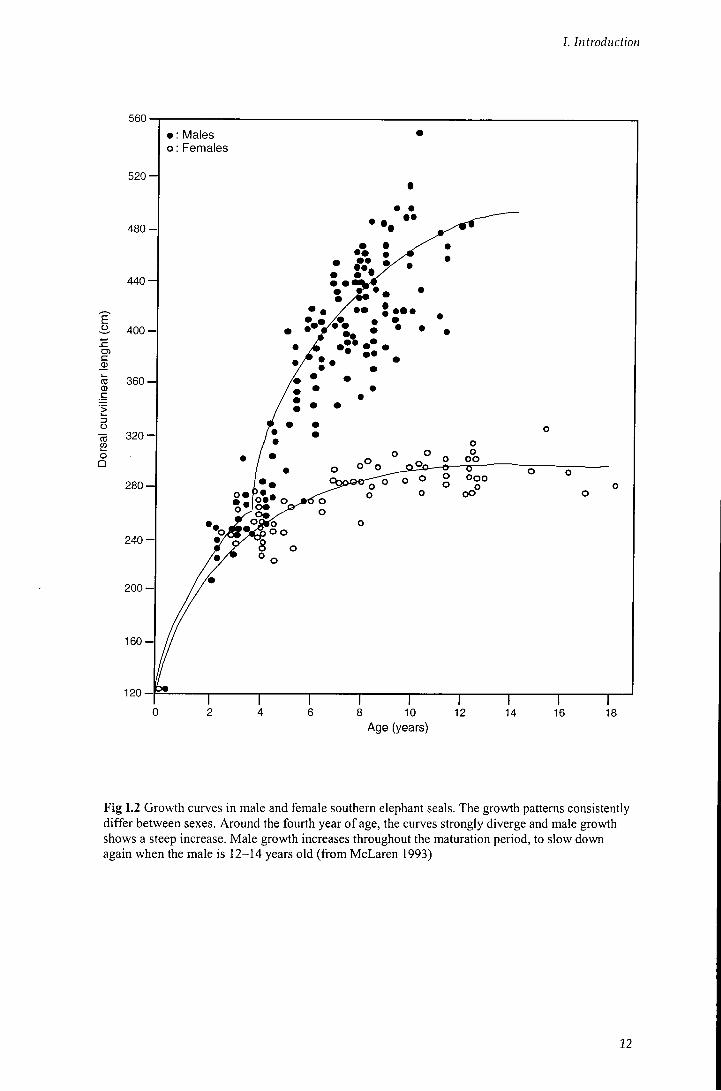
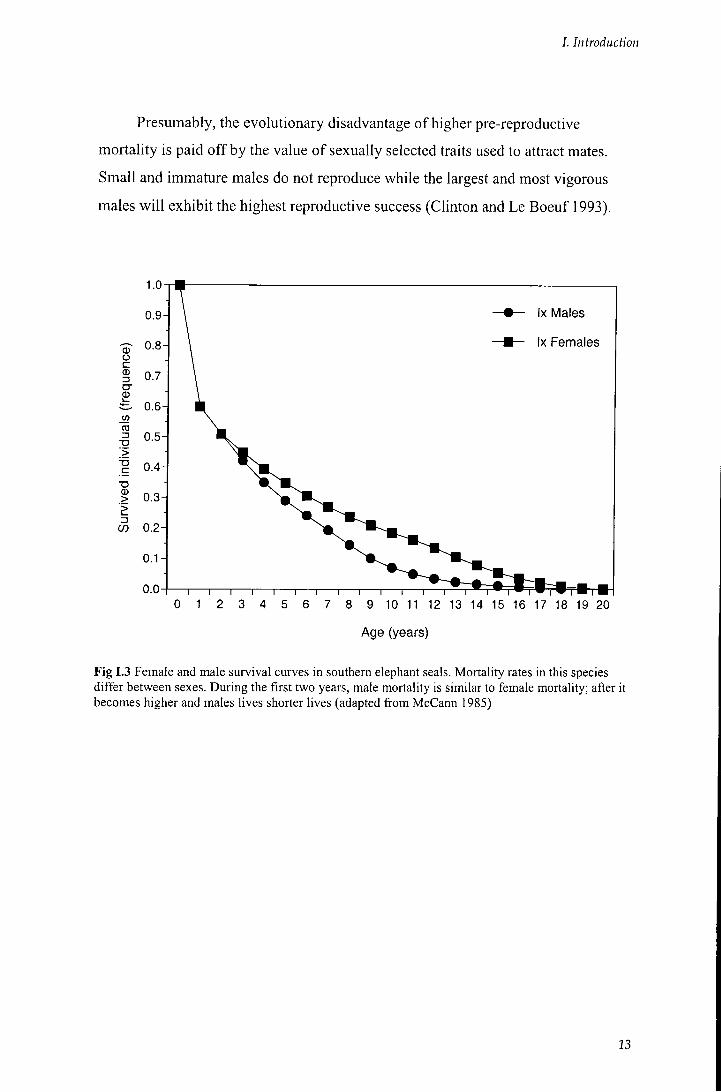
associated with increased mortality. Mortality o f males is higher than for females
(especially in the pre-breeding phase) (Fig 1.3), and just a small percentage of each
male cohort reaches Ml maturity and starts breeding (Le Boeuf and Reiter 1988).
n
I. Introduction
560'
5 2 0 -
480 -
4 4 0 -
^ 400 -
c
360-^ Q)
1 o ffl 3 2 0 -
o Q
2 8 0 -
2 4 0 -
2 0 0 -
1 6 0 -
• : M a l e s o : F e m a l e s
120-1 8 10
A g e (years) 12 14 16 18
Fig 1.2 Growth curves in male and female southern elephant seals. The growth patterns consistently differ between sexes. Around the fourth year of age, the curves strongly diverge and male growth shows a steep increase. Male growth increases throughout the maturation period, to slow down again when the male is 12-14 years old (from McLaren 1993)
12
/ . Introduction
Presumably, the evolutionary disadvantage o f higher pre-reproductive
mortality is paid o f f by the value o f sexually selected traits used to attract mates.
Small and immature males do not reproduce while the largest and most vigorous
males w i l l exhibit the highest reproductive success (Clinton and Le Boeuf 1993).
1.0-1
0.9-
CD 0.8-O c :3 0.7-cr 0)
H— 0.6-«3 CC 13
T3 0.5-> •
_c 0.4-•D CD > 0.3-
CO 0.2-
0.1-
0.0-
Ix Males
ix Females
Age (years)
Fig 1.3 Female and male survival curves in southern elephant seals. Mortality rates in this species differ between sexes. During the first two years, male mortality is similar to female mortality; after it becomes higher and males lives shorter lives (adapted from McCann 1985)
13
I. Introduction
1.4 Objectives
The general objective o f this research is the analysis of the genetic structure of the
southern elephant seal {Mirounga leonina). In particular, the mating system of the
species is investigated f rom a genetic perspective, molecular results are compared
with behavioural data, and individual genotype distributions are analysed within and
between breeding populations.
The different subjects are presented in the following chapters:
1) Male reproductive success: behavioural estimates and paternity
Elephant seals are among the most sexually dimorphic and polygynous species of all
mammals. Results f rom behavioural studies indicate extreme monopolisation of
matings by only a few males each breeding season; consequently, an extreme
variance in paternity success is expected. High variance in reproductive success can
be an indicator o f past sexual selection and a potential source for current sexual
selection. Hence, a good estimation o f individual success is fundamental in
understanding mating system evolution and, in this context, elephant seals represent
an ideal study species.
This chapter presents the distribution o f genetic paternity in the Sea Lion
Island's population o f elephant seals across two consecutive breeding seasons, and
quantifies the level o f polygyny and male reproductive variance in the population. It
describes the reproductive success o f males f rom seven different harems,
corresponding to seven independent breeding contexts. Finally, it compares genetic
results wi th behavioural estimates o f male mating success, in order to define the
effectiveness o f behavioural indices in predicting paternity.
2) Patterns of relatedness within the colony
Southern elephant seals are a highly gregarious species during the breeding season,
and site fidelity is present among both females and males. Social structuring and site
fidelity may lead to non-random mating patterns within and between groups, and
provide an addifional level at which genefic variation may be maintained.
Nevertheless, patterns of relatedness have yet to be invesfigated in this species.
14
/ . Introduction
This chapter presents data on the distribution of genetic relatedness in the population o f elephant seals of Sea Lion Island. First, the accuracy o f the genetic estimates is determined from the analysis of known relationships. Following this, the patterns o f kinship among seals are assessed to investigate the presence of any genetic pattern influencing the social structure o f the population, and to test whether site fidelity and philopatry are good predictors of relatedness.
3) Population genetic structure
In polygynous species, variance in male reproductive success may alter the
genotypic variation from that expected with panmixia. It w i l l reduce Ng within local
populations and hence local genetic diversity. In the absence of genetic dispersal
among colonies, local populations could highly differentiate among each other and
within populafion variation fiirther decrease. Genefic differences among southern
elephant seal breeding colonies have been previously detected, with most of the
geographic structure due to the divergent Macquarie and Peninsula Valdes
populations. Pronounced within-stock variation has been found between the
populations o f Peninsula Valdes and South Georgia. However, data from the
geographically intermediate Falklands have never been included in any population
comparison.
This chapter quantifies the genetic variation in the populations of Sea Lion
Island (Falklands) and Elephant Island (South Shetlands), and investigates it in the
context o f previous results from other colonies of the same South Georgia stock and
from the more distant Macquarie and Heard Islands. Finally, with the comparison of
mitochondrial and nuclear markers, it considers male and female patterns of
dispersal.
15
/ / . Materials and Methods
I I . l The study population and field site
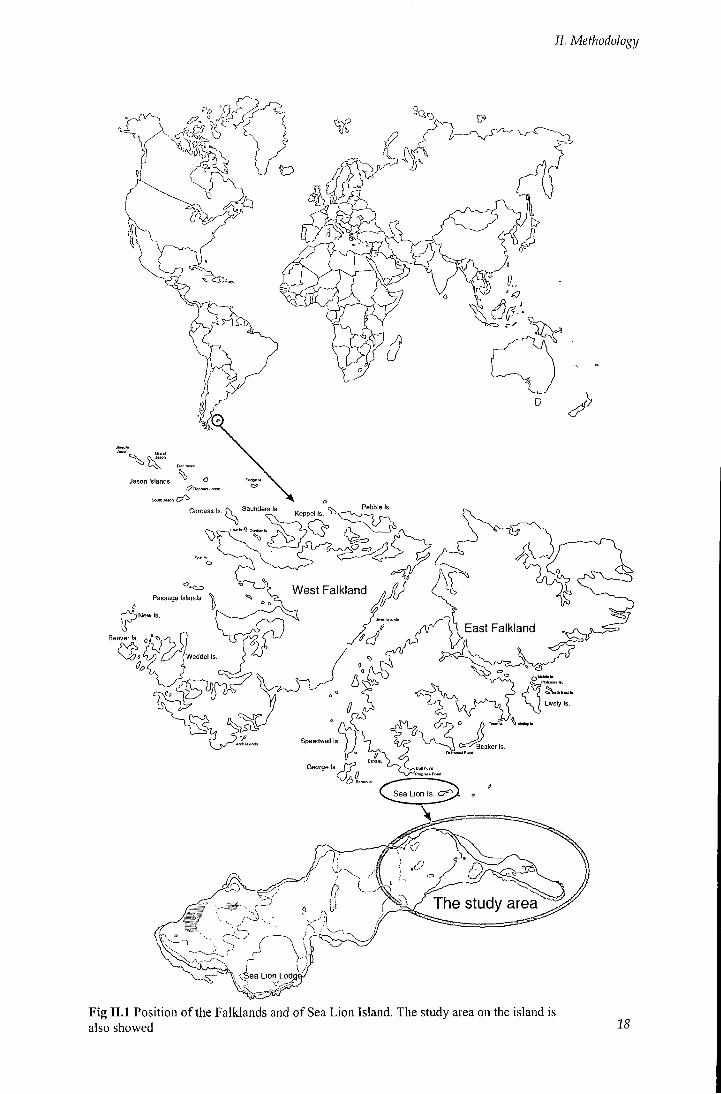
The fieldwork was carried out on Sea Lion Island (52°26' S; 59°05' W) during three
breeding seasons (September-November, from 1996 to 1998). Sea Lion Island is the
southernmost island o f the Falklands and the main breeding site for southern
elephant seals in the archipelago (Fig I I . 1).
The populafion on Sea Lion Island (SLI hereafter) is small and localised (i.e.
wi th no other breeding sites close to the island), estimated to be around 1820 seals o f
one or more years o f age (Galimberti and Sanvito 2001). During the study, the
population increased from 527 breeding females in 1996 to 567 in 1998.
I I . l . l Topography and spatial distribution
The study area covered the eastern point o f the island. The coastline is composed of
three continuous stretches o f sandy beaches divided by a rocky area; breeding units
occupied only sandy beaches (total length ca = 4.4 km, esfimated from aerial
photographs). Harems were scattered along the beaches and their spacing was
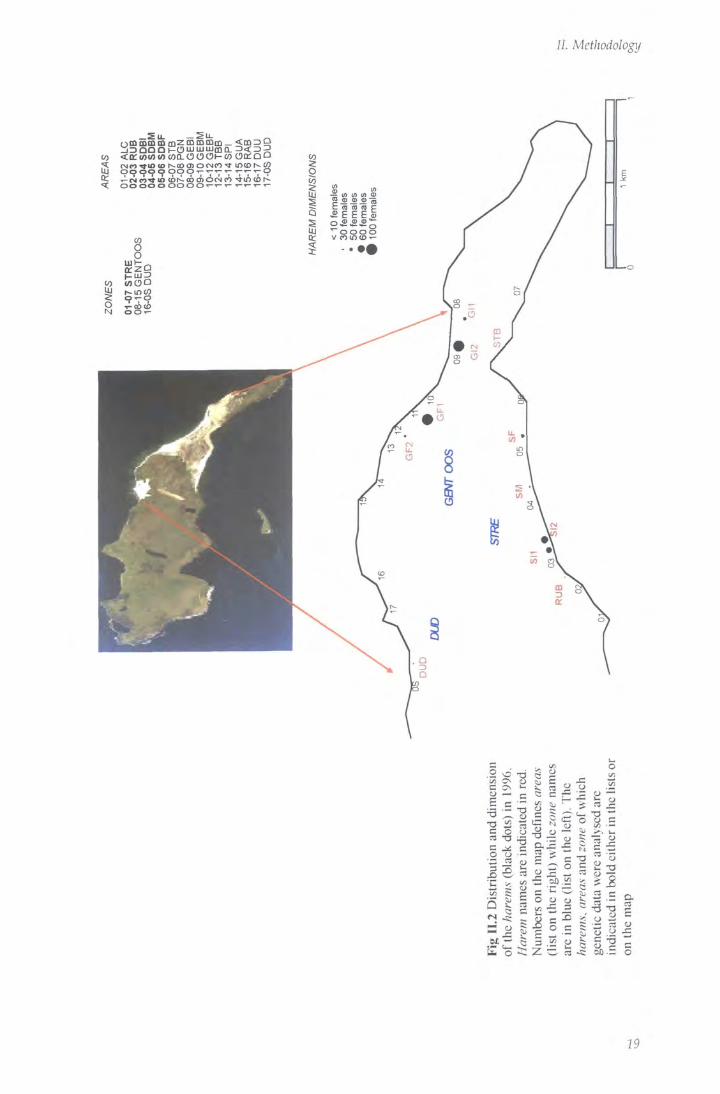
uneven, with long stretches o f beach with no females (Fig II.2).
The mean density o f females was 111 females per km of coastline suitable for
breeding, and eleven harems were formed in 1996 and twelve in 1997 and 1998.
There was extensive variation in the harem size within each season and among years
(for the three seasons: median = 35 females; median absolute deviation, MAD = 25;
M i n = 4; Max = 119).
Since detailed maps o f the island were not available, to have topographical
reference in locating individuals and harems, the whole study area was divided into
different zones and areas (see below for definitions) using topographical landmarks.
The position o f each landmark was identified using GPS receivers with differential
post-processing (precision < 3 meters RMS: Magellan System Corporation 1995.
Professional products: operation manual. San Dimas, CA) and located on a map
drawn f rom aerial photography (RAF Mount Pleasant Airport, Falkland Islands).
26
//. Methodology
The same area division and nomenclature were used each year by each observer and this gave the possibihty to identify the position of harems and individuals in detail.
11.1.2 Relevant deHnitions
77.7.2.7 General
- Breeding season: a 12-week period (beginning of September - end of November)
that included the arrival of the first breeding males and the return to sea of the last
breeding females. This period was centred on the peak haul out, the day on which
the maximum number of females on land was counted. The day is almost constant
across years (20" and 19" of October - see also Galimberti and Boitani 1999).
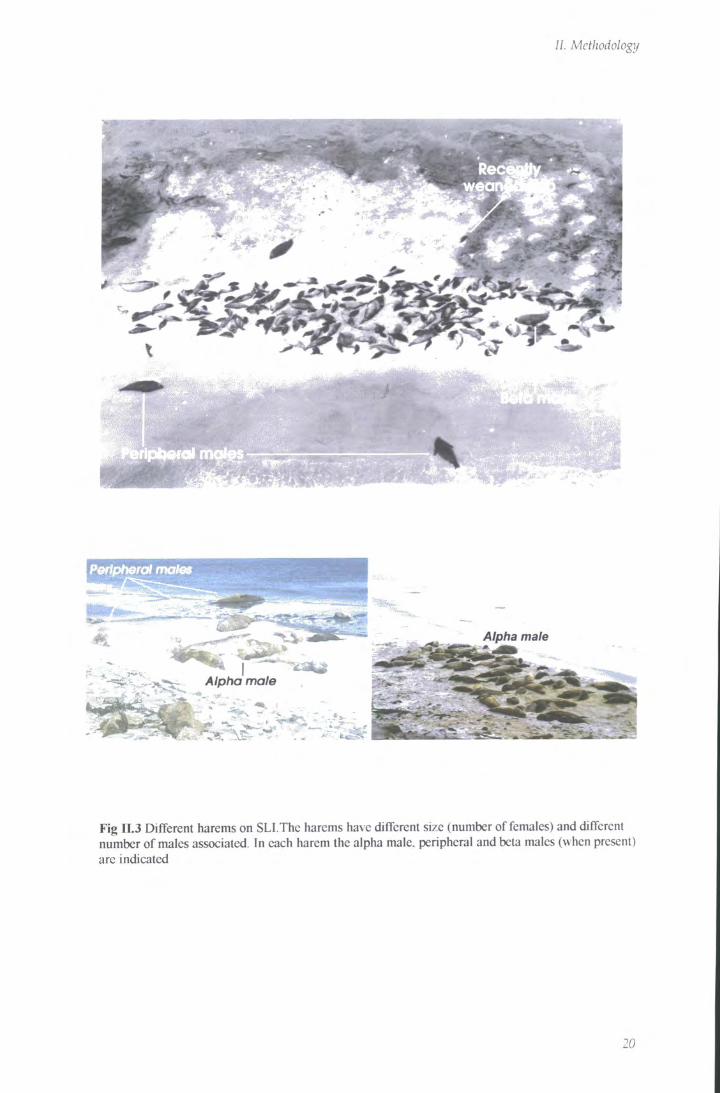
- Harem: a group of two or more females with a male in attendance (Fig II.3).
Females were considered grouped when their distance apart was less than or equal to
10 standard body lengths (SBL - American Society of Mammalogists 1967). Each
day, harem size was defined as the number of females in the harem based on daily
counts. Over the season, harem size was the maximum size reached over the
censuses the season (and different harems may reach maximum size on different
days).
- Breeding area: a continuous stretch of beach, separated from other areas by
evident landmarks (recorded with GPS, see above) and not by unsuitable breeding
habitat for elephant seals (rocks or cliffs). Breeding zone, on the contrary, was a
stretch of beach separated from oihtx zones by stretches of habitat not suitable for
elephant seals and not used for breeding. Areas and zones were delimited by the
same fixed landmarks each year; each area may include one or more haremr while
each zone comprised two or more areas. The study area was divided into three
zones: STRE (with 7 breeding areas), GENT (with 4 breeding areas), DUNE (with 2
breeding areas) (see Fig II.2).
- Breeding male: any male present in the breeding areas under daily observations and
classified as behaviourally active in reproduction.
- Breeding female: any female that belonged to a harem and produced a pup during
the season.
27
II. Methodology
Jason Islands
Pebb e s Carcass Is. ( \ Saunders Is
Falkland Islands
East Falkland Beaver
Wedde
Lively Is
C = : ^ a k e r Is Speedwell
Sea Lion Is.
Fig II.1 Position of the Falklands and of Sea Lion Island. The study area on the island is also showed 18
II. Methodologi/
offlmmm rnzcQCDCDm_ <[£iz>Q <(C WWW COtLOCDOl-CO O K Q Q
in tii u> o a © o- c 01 (Q n c ^ E £ E a
woo i^in W
.2 ^'-d y - c
•o 2 S c o o «-a g o o —
2 ,S S £ -8^
I ^ = c ^
- ° S
| l i
I I ^ C3 c
79
//. Methodology
Prntptterd mates
<^ Alpha male
Alpha male
Fig II.3 Different harems on SLI.The harems have different size (number of females) and different number of males associated. In each harem the alpha male, peripheral and beta males (when present) are indicated
II. Methodology
II. 1.2.2 Male traits
- Age classes: males were classified into age classes. Size was used to recognise
gross differences, but finer classification was achieved using external morphology
(spread of scars on the frontal shield and neck, appearance of the facial area and
development of proboscis) in order to obtain an estimate as independent from size as
possible. Eight age classes were recognised: yearling (F) estimated age 1 year;
estimated age 2 years {2Y); juveniles {JUV), age 3 years; sub-adults (SAMl to
SAM4), age from age 4 to 7 years; adults {AD), estimated age 8 yr or more (see
Galimberti and Boitani 1999 for consistency of the classification among different
observers).
- Tenure: the period that a male stayed on land for reproduction.
- Daily breeding status: male status was recorded during daily censuses and the
categories defined were based on the distance of the male from the closest female
group. Standard female body length (ca. 2.6 m) was estimated by eye as an
approximate measure of distance between individuals (Baldi et al. 1996) and used to
define the daily status of each male. Five categories were recognised: harem holder
(or alpha), i f the male was in the harem (0 distance), beta i f he was inside the female
group but with less females on his side than the harem holder; peripheral, i f 1 to 5
SBL distant from the most external female of the harem; marginal, i f 6 to 10 SBL
distant; solitary, i f more than 10 SBL distant.
- Seasonal breeding status: males were classified as principal males (or harem
holders) i f they gained control of a harem for more than 24 hours (at least two
consecutive censuses); secondary, i f they never got control of a harem for more than
24 hours but they were associated to a harem (as peripheral or marginal males);
tertiary, i f they were never observed associated to a harem. I f more than one male
during the breeding season controlled a harem, the male that held it for the longest
period was defined as the seasonal holder, while the others were defined as
temporary holders (usually keeping the control of the females for short periods).
- Opportunity of selection (I): an estimate of variability of success, denoted by /. It is
calculated as the variance in mating or reproductive success divided by the square of
the mean (s^/x ), following Arnold and Wade (1984). It is a measure of the potential
of selection, and it has been proposed as an index of the extent of variation that could
21
IJ. Methodology
be subject to selection in a given group, population or species (i.e. it describes the upper limit on changes in phenotj^^e that may be caused by selection or variation in each analysed system). / is proportional to the variance in reproductive success and its magnitude would indicate the potential for selection: small values would indicate little opportunity for selection, whereas large values would indicate greater opportunity for selection. Since / has no units, it has been used to make comparisons between sexes and species (Glutton-Brock 1988). Such comparisons may allow making inference regarding the relationship between opportunities of selection and mating systems, as increased opportunity for selection imply a greater potential for evolutionary change (Downhover et al. 1987). In this study, it has been used to describe and quantify the variance in male mating success and paternity. A truly monogamous mating system wil l show an opportunity of selection of zero, while a polygynous system wil l exhibit a larger value (i.e. 0.5-1.7 for red bishops, Friedl and Klump 1999; 0.56 for grey seals, Anderson et al. 1975; 1.31 for southern sea lions, Galimberti unpublished data; 2-3 for red deer, Glutton-Brock et al. 1988).
11.2 Field work and behavioural methods
11.2.1 Population marking and censing
Al l males and almost all females (>98% each season) were individually approached
and marked. Seals were at least double tagged in the interdigital membrane of the
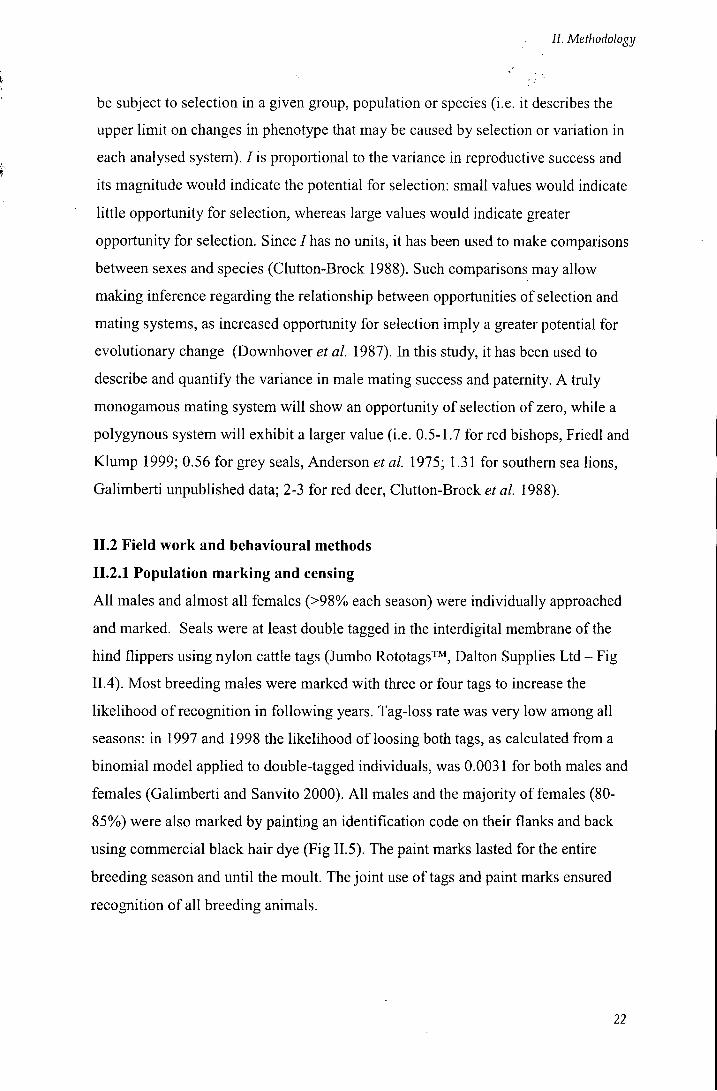
hind flippers using nylon cattle tags (Jumbo Rototags™, Dalton Supplies Ltd - Fig
II.4). Most breeding males were marked with three or four tags to increase the
likelihood of recognition in following years. Tag-loss rate was very low among all
seasons: in 1997 and 1998 the likelihood of loosing both tags, as calculated from a
binomial model applied to double-tagged individuals, was 0.0031 for both males and
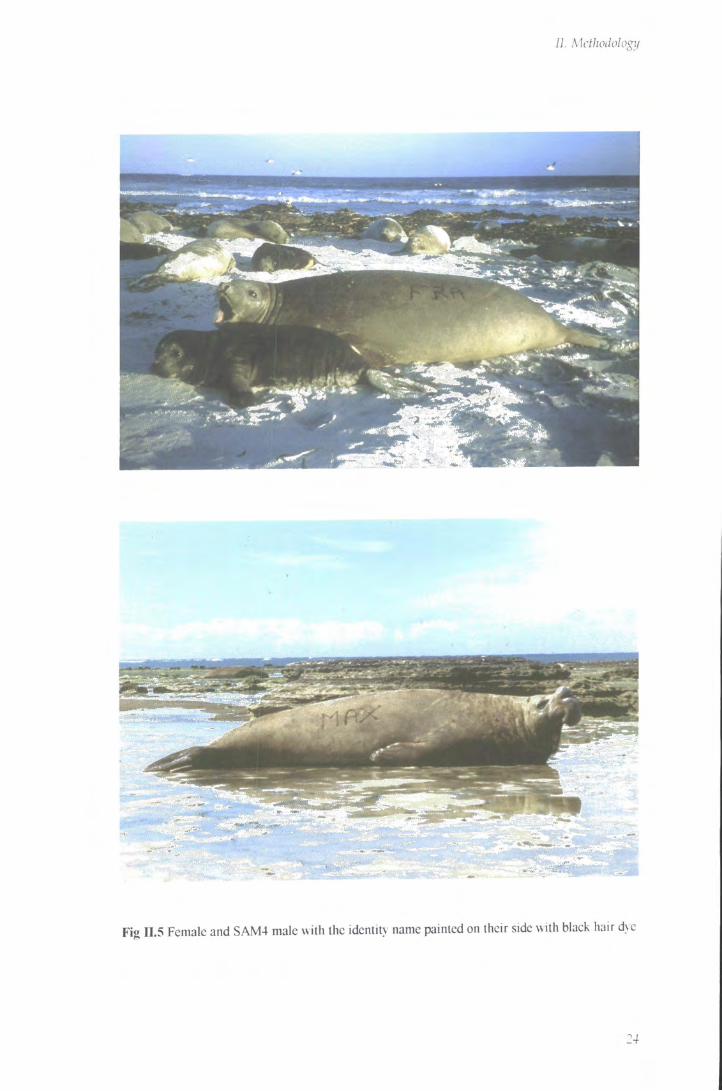
females (Galimberti and Sanvito 2000). Al l males and the majority of females (80-
85%) were also marked by painting an identification code on their flanks and back
using commercial black hair dye (Fig 11.5). The paint marks lasted for the entire
breeding season and until the moult. The joint use of tags and paint marks ensured
recognition of all breeding animals.
22
II. Methodology
o
Fig II.4 Left: Jumbo Rototag with a 3 digit numerical code; right: the tag is applied on a weaned pup, in the membrane of his hind flipper
The tagging also allowed an accurate estimate of the net production of
breeding, all pups were marked with one tag when they were still with their mothers
and then again after weaning.
On each of the 84 days of the breeding season, all seals were counted by
walking along all breeding beaches during low tide. From daily censuses three kinds
of data were obtained:
• counts of the number of individuals on land by sex and age class;
• data on the structure of the harems (number, identity and breeding status of
females; number, breeding status and position of alpha and associated males);
• data on breeding status and position of males and females not associated with any
harem.
To check for the presence of breeding individuals outside the main study area,
weekly censuses were also taken by walking the entire perimeter of the island. Only
two pups were bom outside the study area during the three breeding seasons.
23
/]. Mcthodolog}/
Fig II.5 Female and SAM4 male with the identit> name painted on their side with black hair d\c
JJ. Methodology
11.2.2 Behavioural observations
Each season four people carried out observations of the seal population. To gather
data on breeding activities, each observer recorded copulations (see Fig I.lb),
arrivals on land, departures to sea, births and weaning events (departure of the
mother and subsequent expulsion of the pup fi^om the harem). Data were collected by
each person during two-hour periods from fixed observation points overlooking one
or more harems. A standard 'all-occurrence' sampling technique was used (Altmann
1974) with continuous recording of events on log sheets. During the observation
periods, all male-male and male-female interactions (aggressive and mating
interactions) in the harems were recorded. Behavioural events were coded using a
standard ethogram (Fabiani 1996), analogous to the one described for the northern
elephant seal (Le Boeuf 1972 1974). The majority of observations were carried out
between 0600 and 2000 local time, but a limited number of night observations were
also conducted, using spot lights and night-viewing equipment. Since no difference
in seal activity was found between day and night (see also Baldi et al. 1996, and
Shipley and Strecker 1986 for the northern species), the observational effort was
concentrated during day-light.
The total number of hours of observation was 1,316 in 1996 and 1,156 in 1997.
To collect data in different breeding situations, all harems of the study area were
observed. Observational effort was balanced among the harems, except for small
harems that lasted for only short periods. Ten harems formed in 1996 and 11 in
1997; a mean of 131.6 ± 68 hrs of observation per harem were made in the first year
and of 105.5 ± 48 in the second.
For generic analysis, one zone (STRE) of the whole study area was chosen and
the observational data used were from five harems for 1996 and two for 1997. For
the seven harems, a total of 1,030 hrs of observation were conducted and 356
copulafions recorded (means per harem 147 and 51, in 1996 and 1997 respectively).
Males were very rarely seen moving among zones: movements of peripheral males
were occasional and almost zero for alpha males. By constrast, harems belonging to
the same breeding area were often connected through the movement of peripheral
25
II. Methodology
and marginal males. Occasionally alphas moved between harems in the same area and less frequently between areas.
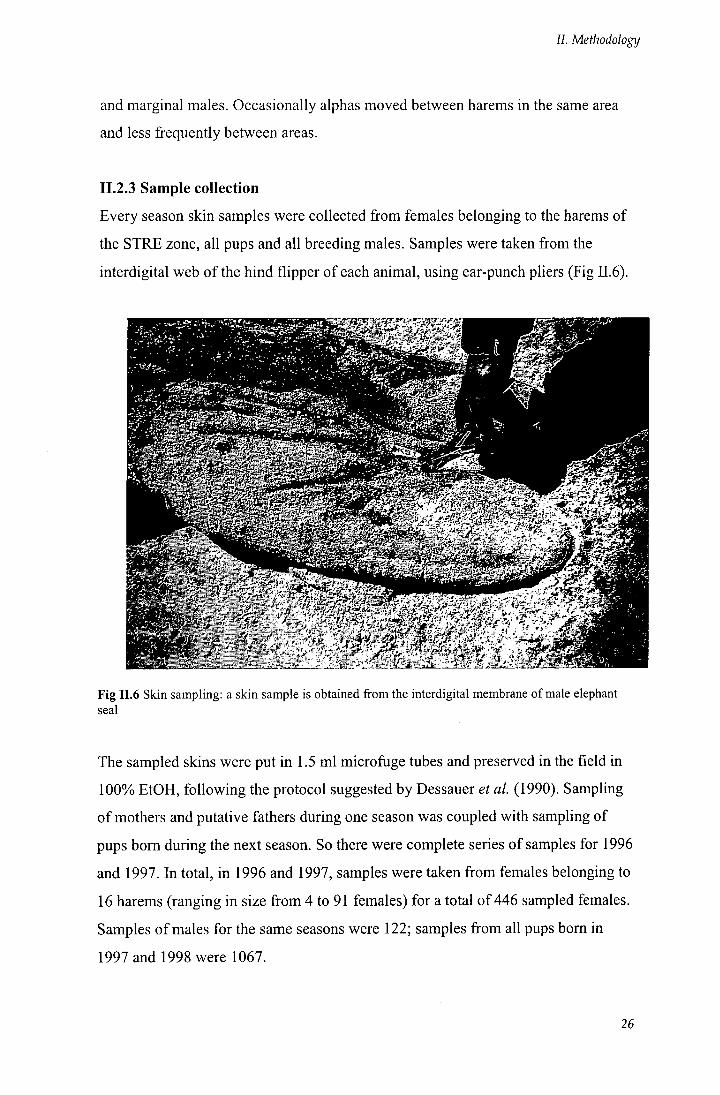
11.2.3 Sample collection
Every season skin samples were collected from females belonging to the harems of
the STRE zone, all pups and all breeding males. Samples were taken from the
interdigital web of the hind flipper of each animal, using ear-punch pliers (Fig II.6).
Fig II .6 Skin sampling: a skin sample is obtained fi"om the interdigital membrane of male elephant seal
The sampled skins were put in 1.5 ml microfuge tubes and preserved in the field in
100% EtOH, following the protocol suggested by Dessauer et al. (1990). Sampling
of mothers and putafive fathers during one season was coupled with sampling of
pups bom during the next season. So there were complete series of samples for 1996
and 1997. In total, in 1996 and 1997, samples were taken from females belonging to
16 harems (ranging in size from 4 to 91 females) for a total of 446 sampled females.
Samples of males for the same seasons were 122; samples from all pups bom in
1997 and 1998 were 1067.
26
II. Methodology
For the paternity analysis, only the females sampled in the seven harems of the STRE zone and their respective pups from the next season were considered (five harems for 1996 and two for 1997). Al l breeding males of the 1996 and 1997 breeding seasons were included in the paternity analysis. The sampling covered 95% of males for both years and 50 to 80 percent of the females that bred in each harem.
II.3 Behavioural and genetic analysis
II.3.Indices of male breeding performance
Three indices of male breeding performance were estimated from behavioural data:
• an index of female control (FFD), calculated as the sum of the females controlled
each day by a male throughout the breeding season (see "females/days index":
Clutton-Brock a/. 1982);
• an index of mating success (MSI 00), calculated as the number of copulations by a
male in 100 hours of observation (Fabiani 1996). Copulations were considered
successfiil only i f intromission lasted more than 60 seconds.
• an index of fertilization success (ENFI), calculated as the product between the
proportion of copulations achieved by a male in one harem and the number of
females that bred in that harem, summed over harems in which the male copulated
(Le Boeuf 1974).
II.3.2 Statistics used
Behavioural and genetic data from both years were pooled together in most cases,
after checking for homogeneity with a Mann-Whitney test. Paternity inference was,
instead, carried out separately on each year. The coefficient of determination (R^)
was used as measure of effectiveness of mating estimates in predicting paternity
(Pemberton et al. 1992; Coltman et al. 1999a). It represents the proportion of the
dependent variable's variability that is explained by the independent variable (with a
maximum value of 1; thus, an of 0.80 means that 80% of the dependent variable's
variation is explained by the independent variable).
27
//. Methodology
Statistics are presented as mean and standard deviation (sd), or median (med) and median absolute deviation (MAD) for asymmetrically distributed variables. The MAD is a measure of variability (or spread) analogous to the standard deviation. As standard deviation averages the variability of actual points from the mean, MAD takes the median of differences between points and the median; as median is less vulnerable to extreme data points than the mean, MAD is less vulnerable to outliers than standard deviation. The coefficient of variation (CV) is presented to describe the variability of the distributions, and the skewness value (gj) to show the level of asymmetry. Due to the high frequency of asymmetric distributions, non-parametric tests were mostly used. Parametric and non-parametric tests were run in StatView 5.0 (SAS Institute). Non-parametric randomisation tests were employed in StatXact Turbo 4.0 (Cytel Software Corporation), and in these cases the P value is shown with Monte Carlo resampling number (as subscript). Probability levels and 95% confidence limits for the coefficients of the determination were calculated with the R2 software (Steiger and Fouladi 1992 - available at: http://www.interchg.ubc.ca/steiger/r2.htm).
In case of tests with multiple comparisons, since simple Bonferroni correction
is known to be very conservative, the sequential method of Holm (1979)- also
known as 'sequendal Bonferroni'- was applied. The test was used to avoid losing
too much statistical power and it was implemented in the Multiplicity Program 2
(Brown and Russell 1996).
II.4. Molecular genetic methods
II.4.1 DNA extraction and visualization
The same protocol of Phenol/Chloroform extraction (Hoelzel 1998) was followed for
all samples. A small piece of skin without fat (2-3 millimetres width) was put in a
1.5 ml microcentrifiage tube with 500 \il of Digestion Buffer (100 mM NaCl, 10 mM
Tris-HCl pH8.0, 20mM EDTA) and chopped for few minutes until reduced to almost
powder-size pieces. Thirty \xl of proteinase K solution (10 mg/ml) was added, the
tube mixed gently for 1 min and incubated at 37°C overnight. Five hundred [il of
phenol was added to the mixture, the tube shaken moderately and centrifiiged for one
min at 13,000 rpm (Hettic Zentrifiigen - EBA 12). The aqueous phase was collected.
28
II. Methodology
transferred into a new microfuge tube and 500 | i l of phenol:chloroform:isoamyl alcohol (25:24:1) was added. The tube was shaken and centrifirged for 1 min. The aqueous phase was collected, transferred into a new microftige tube and 500 ^1 of chloroform:isoamyl alcohol (24:1) was added. The tube was shaken and centrifiiged for 1 min. The aqueous phase was again collected and mixed with 50 [i\ of 3M sodium acetate plus 500 |xl of cold 100% ethanol. The tube was gently mixed and placed in the freezer for one hour (or left at room temperature for 20 min i f any precipitate was visible). The sample was centrifiiged for 10 - 15 min and the supematant discarded (or the pellet removed with a sterile pipette). The pellet was washed in 1 ml of 70% ethanol, mixed and centrifuged for 10 min. The supematant was discarded as before and the pellet dried under vacuum. The pellet was dissolved in 500 )il of TE, or similar volume, to a final concentration of about 200 ngl\il. The sample was in a bath at 65°C for 10 - 15 minutes and stored at -20°C.
In total, 455 samples were extracted from the SLI population: 101 males, 162
females and 192 pups. Thirty-nine males and 30 females were present on the island
in both years. Thirty samples were also extracted from the population of Elephant
Island (EI), following the same procedure as for SLI individuals.
The extracted samples were visualised to estimate the presence and state of the
DNA. Electrophoresis of DNA samples was performed using 0.8 - 1.2 % agarose 0.5
X TBE (Tris-borate, EDTA) gels, with 0.5 x TBE as buffer. Two drops of a 50 |ig/ml
solution of ethidium bromide was added to the molten gel to allow DNA to be
visualized. DNA samples were prepared as: 2 \il of loading buffer (30% glycerol,
0.25% bromophenol blue, 0.25% xylene cyanol FF), 5 |xl of H2O and 5 ^1 of DNA.
Gels were mn horizontally (Bio Rad - Wide Mini-Sub™ Cell, Mini-Sub Cell GT) at
50 - 100 V and after visualised on Bio Rad gel Doc 2000 and analysed with the
software Quantity One 4.0.3. A l l the extracted samples (SLI and EI populations)
were visualized on gel.
29
Ji. Methodology
11.4.2 Microsatellite DNA
II. 4.2.1 Microsatellite markers for PCR amplification
Published microsatellite primers known to amplify for phocid species (Coltman et al.
1996, Gemmell et al. 1997; Goodman 1997a; Slade et al. 1998; Hoelzel etal. 1999)
were used. More than twenty sets of primers were tested by carrying out PCR
amplifications on the samples, so that the optimal conditions (annealing temperature
and magnesium concentrations) were found. Eight sets of primers were chosen out of
the 14 sets screened. These loci consisted of four isolated from grey seals Halicoerus
Grypus (Hg4.2, Hg6.3, Hg8.9, HgS.lO), one from the harbour seal Phoca vitulina
(Pv9) and three from southern elephant seal Mirounga leonina (BETA, M l la, M2b).
The eight primers showed clear amplification products and high variation, and
provided sufficient resolution to permit paternity testing and an assessment of
populafion genetic structure (Table I I . 1). Except for BETA, they all amplified
dinucleofide repeat sequences (size 130 to 340 bp) and for one locus. BETA
amplified pentanucleotide repeats (GGAAA)n and for two loci (four alleles).
Multiple alleles at a given size could be detected by the height of the peak, but
single-locus genotypes could not be determined (Slade et al. 1998). These two
related loci were treated as a single locus with four alleles and used separately from
the other microsatellites in the analysis.
II.4.2.2PCR (Polymerase Chain Reaction)
Each PCR amplification (10 - 20 \i\) was performed following standard conditions:
0.2mM dNTPs, 0.75 - 1.5 mM MgClj, 10 mM Tris-HCl PH8.4, 500mM KCl
(Hoelzel and Green 1998), 0.02U/^1 Taq polymerase, 250 pM, 150 - 250pM of each
primer, 5-50 ng|il of DNA. PCR reactions involved the following steps: 5 minutes
of denaturing at 95 °C; a cycle repeated 34 times consisting of 1 min 30 sec of the
annealing temperature (specific for each primer), 1 min 30 sec at 72°C extension
temperature and 45 sec at 94°C; then I min 30 sec at the annealing temperature and
8 min at 72°C. The samples were then kept in the machine at 4 - 8 °C. The primer
BETA had different PCR buffer and amplification. The buffer used was 500mM
KCl, lOOmM Tris Ph8, Nonidet P-40, Tween 20, 1.5mM MgCb. Cycling
parameters: 94°C for 5 min, then 40 sec at variable annealing temperatures.
30
JL Methodology
10
(i> J3 3 C
Q.
<D
O
O
<
0 o c
Q>
Q) E
E
ID
CO CO
d> CO CM
in CM
IT) CO co"
(O
CO
o <
o
CD
O 1-o o
m CO
CD
CM CM
I in T— CM
O ^
o o (3 <
o o h-H-o
CD
O O I - o O h-O I -
o o CD
i S i o
CD
< CD
in in
CD CD
O O
O CD < < CD O I - H O < O O < CD <
00
in
m
CD o < h-
o o < I -o o < < O I -
o o
in
in
m CM
in in
CD O O O
o o
o
CD I -
CD CD
i H O O
!-
o o o a < , o b
CD 1-H CD CD
O o <
i
CD
in
5
in
in in in CO CM
o CD
< o o <
< o o
il o <
o CD
o o
5 o o
o
5 § < < O CD < O H O
< o
< o 1-
Uj QQ
O CM CD
in m
^ O CD CD
1- O
o o < o o o o
CD O < 1-
< CD
CD
CD (-CD
CD I -I -O
o
CD
< a: LL Q; LL or
eg
5 00 CO
5" 00 00
5
< CO <
-Q CM
0.
3 c
o 60
'N O
5! a. X u
T3
C C3
•a (U
XI o
o
= O
ea 00
c3 -a
S C/0
5 a\
8 <
«i
— c
31
II. Methodology
extension at 72° for 2 min and 94°C for 45 sec. The annealing temperatures followed a "touchdown" procedure to reduce non-specific amplification and were 67°C for the first cycle, 66°C for the second cycle, and then 65°C for 25 cycles. The amplifications were all performed on one of the following PCR machines: MJ Research, INC-PTC-100™, Hybaid - PCREXPRESS™, Perkin Elmer - GeneAmp PCR system 2400™.
To visualize the product on a sequencing gel on the automated ABI system,
fluorescently labelled primers were used. The forward sequence of each primer was
labelled with 6-FAM, HEX, NED ABI dyes (each one visualizing a different colour)
and PCRs were run using 1/10'*' of fluorescent primer and 9/10" unlabelled forward
primer. The cycling conditions were the same as above.
Al l samples were amplified for all loci and visualized on 0.8 - 1.2% agarose
gel (see above for gel preparation), to verify the quality of the amplification. I f no
product was visible the sample was amplified again and PCR conditions adjusted as
necessary.
II.4.2.3 Microsatellite allele detection
The labelled PCR products were run on a sequencing 6%) polyacrilammide
denaturing gel and analysed for length variation on an automated ABI PRISM 377
DNA Sequencer (Applied Biosystems™). The different dyes have different
strengths, so the volume of PCR product to be loaded on the gel varied with the dye.
I used 0.2 ^il for 6-FAM-labelled products, 0.3 ^1 for HEX and 0.4 ^1 for NED-
labelled. PCR products with sizes that did not overlap or products with different
colours could be run in the same lane of a gel. In general, 7 to 10 primers were run in
each lane for 36-50 lanes. The gels were run at 41°C for 3 hours on an automated
sequencing machine, using filter set D. The dye ROX-500 was used as an internal
size standard: it is loaded in the same lane as the PCR products and it serves to give
precise band sizing between lanes.
Data from the gels were analysed using GeneScan™ Analysis 2.0 software.
The computer generates a gel image showing bands that are detected as peaks of
different colours, depending on the fluorescent used. The ROX-500 contains
products with peaks at 35, 50, 70, 100, 139, 150, 160, 200, 250, 300, 350, 400, 450,
32
iJ. Methodology
490, 500 bp. When using filter set D, 6-FAM appears blue, HEX green, NED yellow and ROX is red.
Each allele can be assigned an estimated size based on its migration relative to
the size standard so that D N A allele sizes (in base pairs) can be precisely estimated.
The data f rom the laser are collected in terms o f number o f scans that had been made
when peaks are detected. The internal size standard is used to convert number of
scans into base pairs within each lane in order to allow for lane to lane variation
which can occur when gels do not run straight. The software program recognises the
standard peaks and constructs a standard curve. The sizes of the product peaks are
then estimated based on their migration relative to the known standard.
The data were then transferred to the A B I software package, Genotyper™ 2.0.
Wi th this program all run lanes can be viewed together on an electropherogram, and
each detectable peak with its colour and its size can be scored in base pairs, h i the
electropherograms, the allele peaks often have reduced 'stutter' or 'shadow' bands
(David and Menotti-Raymond 1998) of variable magnitudes. The allele sizes were
easy to score the majority o f the time; otherwise the sample was run again on another
gel. The allele sizes shown by the program are not integers and there can be
variations within and among gels o f up to 0.6 base pair. The allele sizes were
therefore classified into allele categories, each one expressing the size as an integer
number. Because identical alleles can show little shifting in size across multiple gels,
a 'control sample' (a sample o f known size and previously run) was included on
each gel in order to confirm that the allele size estimation was consistent among gels.
IL4.3MtDNA
II. 4.3.1 MtDNA amplification
The mitochondrial D N A control region was amplified with universal primers,
M T C R f (5' - TTC CCC GGT GTA A A C C) and MTCRr (5' - A T T TTC AGT GTC
TTG CTT T) fol lowing Hoelzel et al. (1993). PGR reaction conditions: 0.2 dNTPs,
1.5 m M MgC12, lOmM Tris-HCl Ph8.4, 50mM K C l , 200 - 250pM of each primer,
0.02 U / | i l Taq polymerase and 3 - 6ng/^l o f DNA. The amplification involved the
steps: 4 minutes o f denaturation at 94°C and 35 cycles o f 1 min and 30 sec at 50°C
(annealing temperature), 1 min and 30 sec at 72°C, 45 sec at 90°C.
33
77. Methodology
11.4.3.2 MtDNA sequencing and alignment
PCR products were then purified with QIAgen PCR purification columns, and
sequenced directly using the dye-terminator method for the A B I system. The DNA
sequencing reactions were performed using standard conditions: 25 cycles of 10 sec
at 96°C, 7 sec at 50°C and 4 min at 60°C. M t D N A from 57 individuals from Sea
Lion Island (30 males and 27 females) was amplified and the amplifications resulted
in 450 - 650 bp o f sequence data. The analysis focussed on a highly variable 299 bp
subset, comprising all 264 bp o f control region I (CRI) and 35 bp of flanking
tRNApro sequence (Slade et al. 1998).
The sequenced products were run on a 6% denaturing polyacrilammide D N A
sequencing gel for fluorescent imagining on an automated A B I PRISM 377 DNA
sequencer. A t the end o f the sequence run, computer files are created for individual
lane scans and a D N A sequence file is generated. In each file both peaks at each
posidon and the nucleotide assigned by the instrument are defined. The sequence
files were then imported into the program Sequencher 3.0™ that allows viewing
multiple electropherograms simultaneously and a detailed checking. For each
sequence it displays the electropherogram as well as the D N A sequence, making it
possible to view regions o f overlap, to look at the actual peak, and manually solve
sequence ambiguities or change nucleotides mistakenly assigned by the sequencer
machine. After the sequence formatting, the sequences were aligned in Sequencher
3.0™ and a Consensus file was generated as input for the phylogenetic analysis.
To confirm the sequencing accuracy, a reverse amplification and sequencing
were run. To avoid sequencing the hypervariable region (Hoelzel et al. 1993b), a
new R primer was developed (5' GTA TGA TGT TOG T A A A T G A 3')- The
sequenced products (6 samples were sequenced) confirmed the previous results.
The mitochondrial D N A analysis also covered other populations of the South
Atlantic. Thirty elephant seals from Elephant Island (EI) were sequenced (450-650
bp), and the same 299 bp region was obtained from other colonies from published
data. Thirty-two sequences from Peninsula Valdes, Argentina, and 28 from South
Georgia were from Hoelzel et al (1993a), six sequences from Heard Island (HD)
and five f rom Macquarie Island (MQ) were from Slade et al. (1998).
34
n. Methodology
11.5 Genetic analysis
II.5.1 Paternity analysis
II.5.1.1 Characterisation of microsatellite loci
The pool o f adult genotype data from Sea Lion Island was investigated and
characterised. The level o f polymorphism was estimated as the number of alleles per
locus and the observed heterozygosity {Ho)- Observed heterozygosity was tested for
deviation from Hardy-Weinberg equilibrium (HWE) expectations for each locus
with the Fisher's exact test as implemented in GENEPOP 3.3 (Guo and Thompson
1992). Fisher's exact test was also used for the evaluation o f possible linkage
disequilibrium (genotypic disequilibrium) and to test for differences between male
and female allele and genotype distributions. A l l the analyses were performed in
GENEPOP 3.3 using the Markov chain method (demorization number, number of
batches, iteration per batch set at 1000) and applying the correction for multiple
comparisons (Brown and Russell 1996).
II. 5.1.2 Microsatellite identity check
Since the SLI samples o f this study were collected during two seasons and in often
diff icul t field conditions, an identity check analysis was performed in CERVUS 2.0
(Marshall et al. 1998) to find matching genotypes in the microsatellite genotype data
(i.e. individuals sampled in both years but differently identified). Any duplicate was
subsequently excluded from the genotype files prior to the paternity analysis.
II. 5.1.3 Microsatellite null alleles
The null allele fi^equencies were calculated for each locus using CERVUS 2.0. A null
allele is any allele that cannot be detected by the assay used to genotype individuals
at a particular locus. With microsatellite loci, a null allele most often occurs because
o f mutations in one or both primer binding sites, sufficient to prevent effective
amplification o f the microsatellite allele. A locus with a null allele at high frequency
usually shows a characteristic pattern o f repeated homozygote-homozygote
mismatches in known parent-offspring relationships. Mismatches o f this type are
identified in CERVUS 2.0 during parentage analysis. During the analysis CERVUS
2.0 treats mismatches generated by null alleles as i f they were typing errors. Loci
35
77. Methodology
with high null allele frequencies (0.05 or more) should be excluded from parentage analysis, while those with lower null allele frequencies should not cause any problems (Marshall et al. 1998).
II.5.1.4 Paternity inference
In classical paternity inference, for each offspring as many as candidate males
possible are excluded f rom paternity using the available genetic data. At the end of
the procedure, i f only one male is not excluded, the paternity is assigned to that
male. However, this method alone offers no help when there are either multiple
males who cannot be excluded as the father of a given offspring, or unsampled
males. Paternity was therefore assigned following a likelihood-based approach using
the program CERVUS 2.0 (Marshall et al. 1998). The program calculates the
likelihood o f each male being the true father of each pup, relative to the likelihood o f
it not being the true father (see Appendix A for a detailed description of the
program).
CERVUS 2.0 was chosen over other available methods such as Goodnight &
Queller's (1999) KINSHIP program or NEWPAT (Worthington Wilmer et al. 1999),
for several reasons. First, because o f its flexibility in assigning error rate, proportion
of possible fathers sampled and proportion o f loci used for genotyping. Second,
because o f the A statistic it uses to determine the most likely paternal candidate. This
statistic allows defining a level o f confidence for each paternity assigned (or not
assigned). Third, because it has been reported to be more robust in discriminating
between close relatives as possible fathers. Related potential parents can confound
parentage assignment (Thompson & Meagher 1987). CERVUS 2.0, however, is
robust to the confounding effects o f most types o f relatives, with only small over-
estimations o f confidence in most scenarios. The exception is when fuU-sibs of the
offspring are also considered as candidate parents (Marshall et al. 1998) and this
possibility was excluded in the analysis. Finally, it was chosen because of the
options it gives in organising the 'offspring file'. It gives the possibility o f choosing
a different set o f candidate fathers for each offspring and this was very useful since
the two loci from B E T A were used for a preliminary simple exclusion.
36
77. Methodology
Simulation of paternity
The simulation analysis o f CERVUS emulates the steps o f paternity inference using
allele frequencies o f the screened loci. Assuming Hardy-Weinberg equilibrium, a
maternal and a paternal genotype are generated f rom the allele frequencies observed,
and an offspring is derived by Mendelian sampling of the parental alleles. Genotypes
are also generated for a number o f unrelated candidate males. The genotypic data for
all individuals are then altered to reflect the existence o f unsampled males, missing
loci and incorrecfly typed loci. Then, each candidate male is considered in turn as the
potential father, and L O D score are calculated for all males for whom the genetic
data exist. The most-likely and the second-most-likely males are identified and the A
score calculated. Genetic data are generated and paternity tests carried out for a large
number o f simulated offspring in order to generate a distribution of A (10,000 tests).
The final stage o f the simulation is to find critical values of A so that the
significance o f A values found in the paternity inference can be tested. For example,
i f a criterion is required for A which gives 95% confidence, the program identifies
the value o f A such that 95% of A scores exceeding this value are obtained by true
fathers. When a male matching the 95% confidence criterion is assigned paternity of
an offspring, the father-offspring relationship is described as a 95% confident
paternity (Marshall et al. 1998). The simulation model needs some parameters in
order to make simulated genetic data realistic:
a) number o f candidate males: the number of males that are candidates for paternity
of the offspring analysed. This includes unsampled parents and should be estimated
from field observations;
b) proportion o f candidate males sampled: the proportion of males for whom
genotypic data are available;
c) proportion o f loci typed: the proportion o f loci typed averaged across all loci and
individuals. This parameter allows for missing data;
37
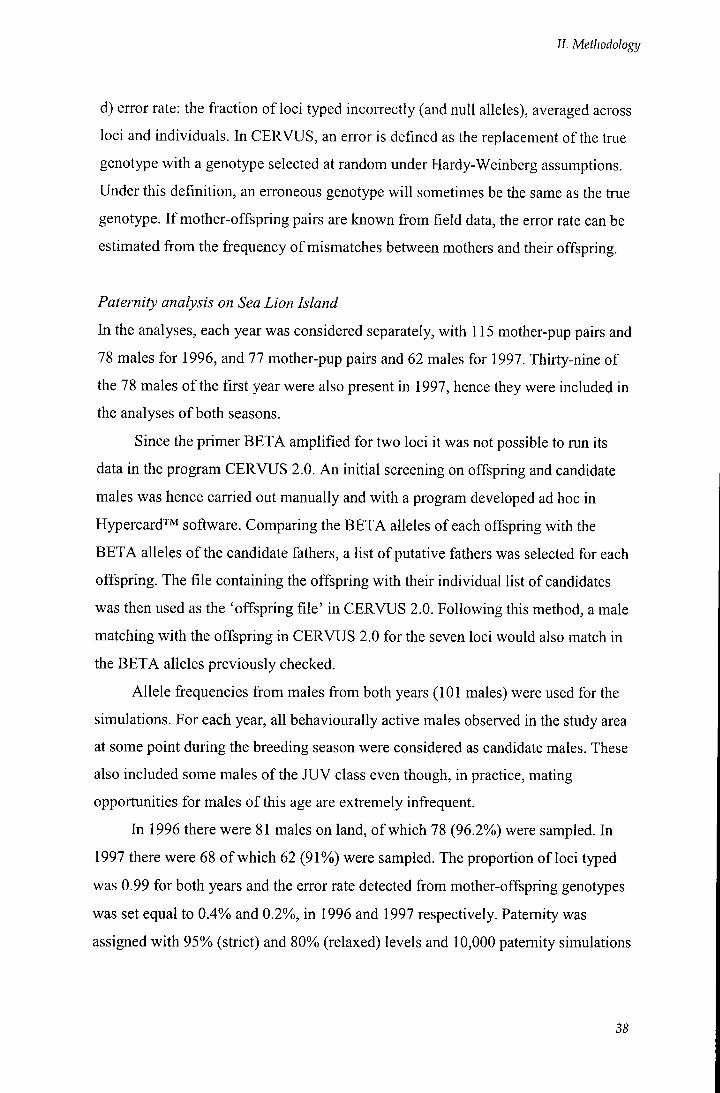
/ / . Methodology
d) error rate: the fraction o f loci typed incorrectly (and null alleles), averaged across loci and individuals, h i CERVUS, an error is defined as the replacement o f the true genotype with a genotype selected at random under Hardy-Weinberg assumptions. Under this definition, an erroneous genotype w i l l sometimes be the same as the true genotype. I f mother-offspring pairs are known from field data, the error rate can be estimated f rom the frequency o f mismatches between mothers and their offspring.
Paternity analysis on Sea Lion Island
In the analyses, each year was considered separately, with 115 mother-pup pairs and
78 males for 1996, and 77 mother-pup pairs and 62 males for 1997. Thirty-nine of
the 78 males o f the first year were also present in 1997, hence they were included in
the analyses o f both seasons.
Since the primer BETA amplified for two loci it was not possible to run its
data in the program CERVUS 2.0. A n initial screening on offspring and candidate
males was hence carried out manually and with a program developed ad hoc in
HyperCard™ software. Comparing the BETA alleles of each offspring with the
BETA alleles o f the candidate fathers, a list o f putative fathers was selected for each
offspring. The file containing the offspring with their individual list of candidates
was then used as the 'offspring file' in CERVUS 2.0. Following this method, a male
matching with the offspring in CERVUS 2.0 for the seven loci would also match in
the BETA alleles previously checked.
Allele frequencies from males from both years (101 males) were used for the
simulations. For each year, all behaviourally active males observed in the study area
at some point during the breeding season were considered as candidate males. These
also included some males o f the JUV class even though, in practice, mating
opportunities for males o f this age are extremely infrequent.
In 1996 there were 81 males on land, o f which 78 (96.2%) were sampled. In
1997 there were 68 o f which 62 (91%) were sampled. The proportion of loci typed
was 0.99 for both years and the error rate detected from mother-offspring genotypes
was set equal to 0.4% and 0.2%, in 1996 and 1997 respectively. Paternity was
assigned with 95% (strict) and 80% (relaxed) levels and 10,000 paternity simulations
38
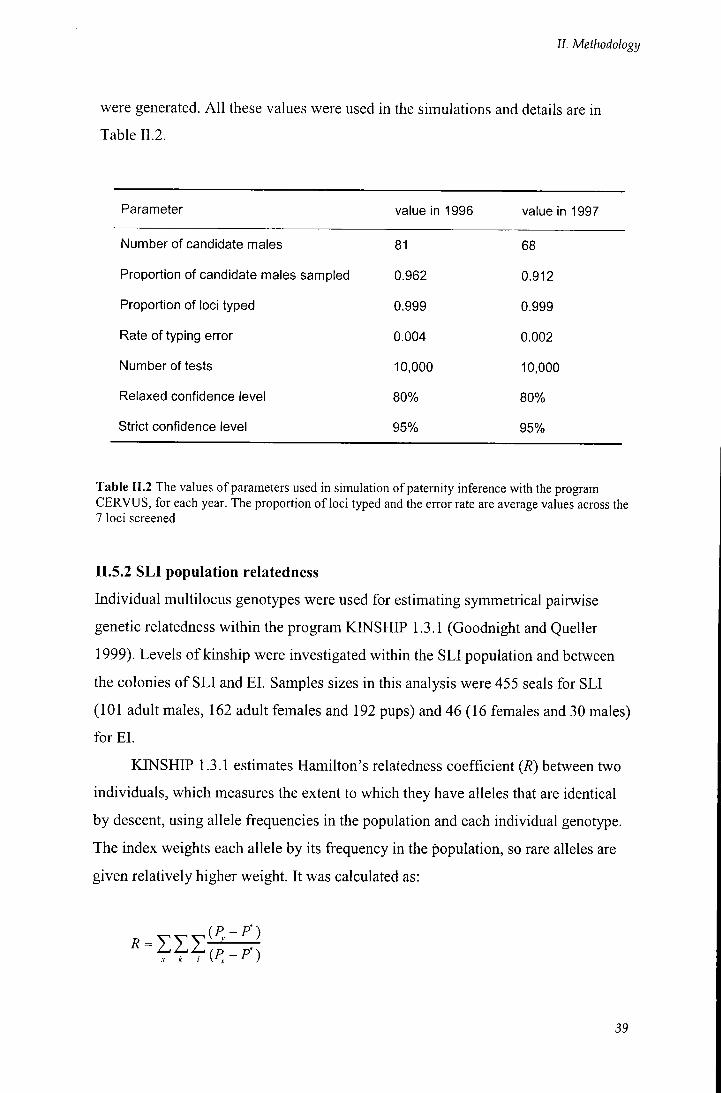
77. Methodology
were generated. A l l these values were used in the simulations and details are in
Table II.2.
Parameter value in 1996 value in 1997
Number of candidate males 81 68
Proportion of candidate males sampled 0.962 0.912
Proportion of loci typed 0.999 0.999
Rate of typing error 0.004 0.002
Number of tests 10,000 10,000
Relaxed confidence level 80% 80%
Strict confidence level 95% 95%
Table II.2 The values of parameters used in simulation of paternity inference with the program CERVUS, for each year. The proportion of loci typed and the error rate are average values across the 7 loci screened
II.5.2 SLI population relatedness
Individual multilocus genotypes were used for estimating symmetrical pairwise
genetic relatedness within the program KINSHIP 1.3.1 (Goodnight and Queller
1999). Levels o f kinship were investigated within the SLI population and between
the colonies o f SLI and EI . Samples sizes in this analysis were 455 seals for SLI
(101 adult males, 162 aduh females and 192 pups) and 46 (16 females and 30 males)
for EI .
KINSHIP 1.3.1 estimates Hamilton's relatedness coefficient (R) between two
individuals, which measures the extent to which they have alleles that are identical
by descent, using allele frequencies in the population and each individual genotype.
The index weights each allele by its frequency in the population, so rare alleles are
given relatively higher weight. It was calculated as:
39
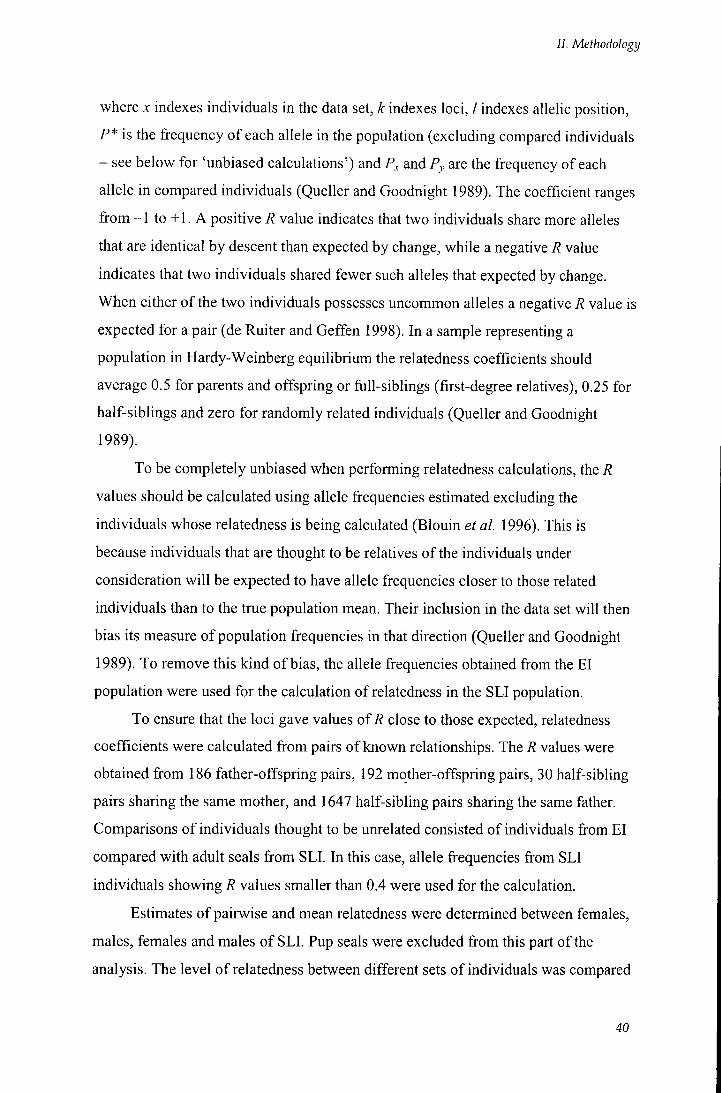
II. Methodology
where x indexes individuals in the data set, k indexes loci, / indexes allelic position, P* is the frequency o f each allele in the population (excluding compared individuals - see below for 'unbiased calculations') and P,^ and Py are the frequency of each allele in compared individuals (Queller and Goodnight 1989). The coefficient ranges f rom - 1 to +1 . A positive R value indicates that two individuals share more alleles that are identical by descent than expected by change, while a negative R value indicates that two individuals shared fewer such alleles that expected by change. When either o f the two individuals possesses uncommon alleles a negative R value is expected for a pair (de Ruiter and Geffen 1998). In a sample representing a population in Hardy-Weinberg equilibrium the relatedness coefficients should average 0.5 for parents and offspring or full-siblings (first-degree relatives), 0.25 for half-siblings and zero for randomly related individuals (Queller and Goodnight 1989).
To be completely unbiased when performing relatedness calculations, the R
values should be calculated using allele frequencies estimated excluding the
individuals whose relatedness is being calculated (Blouin et al. 1996). This is
because individuals that are thought to be relatives o f the individuals under
consideration w i l l be expected to have allele frequencies closer to those related
individuals than to the true population mean. Their inclusion in the data set w i l l then
bias its measure o f population frequencies in that direction (Queller and Goodnight
1989). To remove this kind o f bias, the allele frequencies obtained from the EI
population were used for the calculation of relatedness in the SLI population.
To ensure that the loci gave values o f close to those expected, relatedness
coefficients were calculated from pairs o f known relationships. The R values were
obtained f rom 186 father-offspring pairs, 192 mother-offspring pairs, 30 half-sibling
pairs sharing the same mother, and 1647 half-sibling pairs sharing the same father.
Comparisons o f individuals thought to be unrelated consisted o f individuals from EI
compared with adult seals f rom SLI. In this case, allele frequencies from SLI
individuals showing R values smaller than 0.4 were used for the calculation.
Estimates o f pairwise and mean relatedness were determined between females,
males, females and males o f SLI. Pup seals were excluded from this part of the
analysis. The level o f relatedness between different sets o f individuals was compared
40
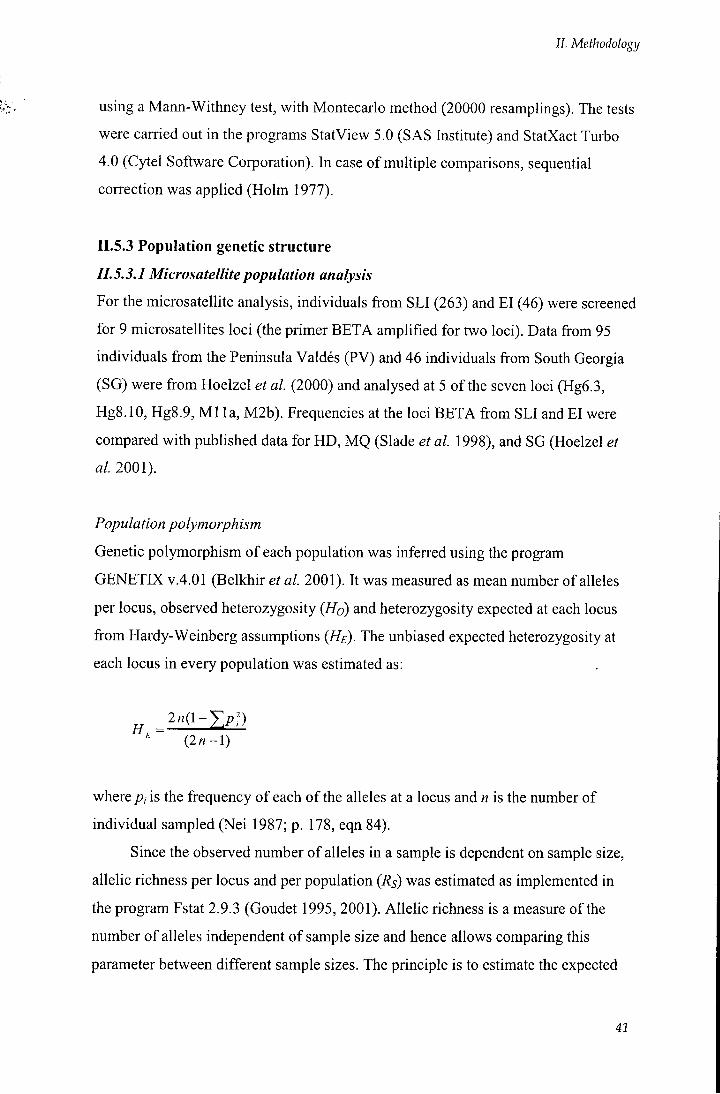
77. Methodology
using a Mann-Withney test, with Montecarlo method (20000 resamplings). The tests were carried out in the programs StatView 5.0 (SAS Institute) and StatXact Turbo 4.0 (Cytel Software Corporation). In case o f multiple comparisons, sequential correction was applied (Holm 1977).
II.5.3 Population genetic structure
II.5.3.1 Microsatellitepopulation analysis
For the microsatellite analysis, individuals from SLI (263) and EI (46) were screened
for 9 microsatellites loci (the primer BETA amplified for two loci). Data from 95
individuals from the Peninsula Valdes (PV) and 46 individuals from South Georgia
(SG) were f rom Hoelzel et al. (2000) and analysed at 5 o f the seven loci (Hg6.3,
Hg8.10, Hg8.9, M l la, M2b). Frequencies at the loci BETA from SLI and EI were
compared with published data for HD, M Q (Slade et al. 1998), and SG (Hoelzel et
al. 2001).
Population polymorphism
Genetic polymorphism of each population was inferred using the program
GENETIX v.4.01 (Belkhir et al. 2001). It was measured as mean number o f alleles
per locus, observed heterozygosity {Ho) and heterozygosity expected at each locus
from Hardy-Weinberg assumpfions {HE). The unbiased expected heterozygosity at
each locus in every population was estimated as:
2n{\-Yy:) {2n-l)
where pi is the frequency o f each o f the alleles at a locus and n is the number o f
individual sampled (Nei 1987; p. 178, eqn 84).
Since the observed number o f alleles in a sample is dependent on sample size,
allelic richness per locus and per population {Rs) was estimated as implemented in
the program Fstat 2.9.3 (Goudet 1995, 2001). Allelic richness is a measure o f the
number o f alleles independent of sample size and hence allows comparing this
parameter between different sample sizes. The principle is to esfimate the expected
41
II. Methodology
number o f alleles in a sub-sample of 2n genes, given that 2N genes have been sampled (A^> n). In Fstat 2.9.3, n is fixed as the smallest number o f individuals typed for a locus in a sample and Rs is calculated as:
2n 2N
\2nj
where Ni is the number o f alleles o f type i among the 2N genes. Each term under the
sum corresponds to the probability o f sampling allele / at least once in a sample of
size 2n. I f allele i is so common that it w i l l be certainly sampled, the ratio is
undefined but the probability o f sampling the allele is set to I .
To assess whether there was random mating within the populations (i.e. i f the
different populations were representative o f separated and independent breeding
colonies), the Wright's inbreeding coefficient, F[s, was calculated. It measures the
correlation o f genes within individuals belonging to the same subpopulations and it
was also calculated with the program Fstat 2.9.3. Weir and Cockerham's (1984)
estimator (/) o f Fis was calculated:
f--
where cfb is the between individual variance component and c^w the within
individual component.
Deviations from Hardy-Weinberg equilibrium (null hypothesis: random union
of gametes) were tested for each population using an exact test, available in
GENEPOP 3.3. The program uses a Markov chain method to estimates values of
Fisher's exact test (Raymond and Rousset 1995). Demorization number, number of
batches, iterafion per batch were all set at 1000 and correction for multiple tests was
applied (Brown and Russell 1996). Linkage disequilibrium (null hypothesis:
genotypes at one locus are independent f rom genotypes at the other locus) was tested
for each pair o f loci in the same program.
42
77. Methodology
Population differentiation
Population genetic differentiation was tested using three different approaches. First,
differences in allelic and genotypic distributions (null hypothesis: the allelic (or
genotypic) distribution is identical across populations) for all pairs o f populations
were evaluated in GENEPOP3.3, using Fisher's exact test.
Second, estimates o f Wright's fixation index, FST, were computed using the
program Fstat 2.9.3 (Goudet 2001), which estimates confidence intervals
bootstrapping over loci. The statistic is based on the variance in allele frequencies
and assumes an infinite mutation model (1AM). It describes the proportion of
variation in subpopulations relative to total variance:
where St and Sw are proportional to the total and within population variances,
respectively. This value relies on the assumption that all populations have descended
from a common ancestor, that they are maintained under the same conditions, and
that gene frequencies are at equilibrium (Balloux and Lugon-Moulin 2002). Weir
and Cockerham's estimator ( ^ o f F57-was calculated by the program as:
where c/a is the among sample variance component, c/^ is the between individual
variance component and c/w the within individual component.
Third, the unbiased RST statisfic was computed using the program RSTCALC
(Goodman 1997b). It is analogous to Fsr but it is based on the variance in repeat
number between alleles and is assumes the stepwise mutafion model (SMM) (Slatkin
1995):
''''
43
71. Methodology
where S, is twice the estimated variance in allele size across populations and Sw is twice the average o f the estimated variance in allele size within each population. This measure, however, assumes populations of equal sample size and that all loci have equivalent variance. RSTCALC deals with both sources of bias and calculates an unbiased estimate, Rhosr- This value represents the fraction of the total variance of allele sizes that is due to genetic differences between populations. RSTCALC calculates the statistical significance of Rhosr by permutation tests, and uses bootstrapping to provide 95%) confidence intervals. The number of interactions was set at 1000. Both FST and RST estimators range from 0, which signifies no differentiation, to 1, which indicates complete differentiation between populations.
Genetic distance between populations was estimated using Nei's unbiased
genefic distance. DA (Nei 1983), and (S/if (Goldstein et al. 1995). DA was calculated
with the program GeneDist (available at:
http://www.biologv.ualberta.ca/ibrzusto/GeneDist.htmn:
where xy and yij are the frequencies o f the zth allele at theyth locus in population X
and 7 respectively, m, is the number o f alleles at theyth locus and r is the number of
loci examined. DA is independent o f the mutational methods and computer
simulafion with the l A M has shown that this distance is more efficient than other
Nei's distances like Ds or D^ (Takezaki and Nei 1996).
The distance (Sfif was proposed by Goldstein et al. (1995). It was created for
microsatellite loci and incorporates features o f the stepwise mutation model. It was
calculated with the RSTCALC program and it is given by:
where /u.A and juB are the mean allele sizes in populations A and B respectively. The
program calculates them by first finding the average allele size at each locus in each
population. The squared difference in mean allele size is then averaged over loci. I f
44
77. Methodology
reproductive isolation, mutational drift equilibrium and stepwise mutation are
verified, then (S/u/ is a
(Goldstein a/. 1995).
verified, then (S/u/ is a linear fiinction o f the separation time between populations
Population assignment
To study the likelihood o f finding one o f the observed genotypes in each of the
populations (i.e. to determine how indicative an individual's genotype was of the
population in which it was sampled) an assignment test was implemented in the
program Doh (Paetkau et al. 1995; Waser and Strobeck 1998 - available at:
http://biologv.ualberta.ca/ibrzusto/Doh.htmD. The test calculates the likelihood of
finding a given genotype in each population and assigns each individual to the
population for which they had the highest likelihood. The calculation is based on the
observed distribufions o f the alleles and assumes random mating and HWE (null
hypothesis: populations are actually one well-mixed population in HWE). The null
hypothesis was tested with 3000 randomisations. To avoid likelihood values of zero
the correction suggested by Titterington et al. (1981) was used. The output of the
program consists also o f a matrix showing how often (i.e. in how many
randomisation datasets) the cross assignment f rom row (nominal population) to
column (assigned population) was at least as large as in the assignment test run
without randomisation. This number divided by the number o f randomisations gives
an estimate o f the probability o f observing at least as many cross assignments i f the
appropriate null hypothesis is true.
II.5.3.2 mtDNA population analysis
For the mtDNA analysis, samples from SLI (30 males and 27 females) and EI (15
males and 15 females) were sequenced and analysed. Sequences from SG (24
sequences f rom 28 seals) and PV (3 sequences f rom 32 seals) were from Hoelzel et
al. (2000) and were included in the analysis. Sequence from MQ (5 sequences from
5 seals) and H D (6 sequences from 6 seals) were f rom Slade et al. (1998) and they
were used in only part o f the analysis due to their small sample sizes.
45
17. Methodology
Level of polymorphism
Level o f polymorphism (TT) was measured as nucleotide diversity (Nei 1987),
assuming the Tamura-Nei (1993) model o f sequence evolution and heterogeneity in
the substitution rates across nucleotide sites following a gamma distribution with a
value o f a = 0.4. The Tamura-Nei correction assumes higher rate o f transitional
substitutions than that o f transversional substitutions and also allows for different
rates between purine (A and G) transitions and pyrimidine (T and C) transitions.
Nei's (1987) measure o f gene diversity ( / / ) was also calculated. It is the equivalent
of the expected heterozygosity for diploid data and it is defined as the probability
that two randomly chosen haplotypes are different in the population:
where n is the number o f gene copies, k is the number of haplotypes and p, is the
sample frequency o f the i-th haplotype. The calculations were run in the program
A R L E Q U I N 2.1 (Schneider et al. 2001).
A mismatch distribution test was run for each population. The test analyses the
observed distribution o f the nucleotide site differences between pairs of haplotypes
and compares it with the expected distribution. This is usually multimodal in
samples drawn f rom populations at demographic equilibrium and unimodal in
populations having passed through a recent demographic expansion (Rogers and
Harpending 1992). The test employed in A R L E Q U I N 2.1 uses a bootstrap approach
that was set to 1000 replicates. The program computes the raggedness index (r) of
the observed distribution, which takes larger values for multimodal distributions
commonly found in stationary populations than for unimodal and smother
distributions typical o f expanding populations.
Each population was analysed with Tajima's test o f selective neutrality, which
is based on the infinite-site model without recombination (Tajima 1989). Values of
Tajima's D were tested for the hypothesis o f selective neutrality and equilibrium in
DNASP 3.5.3 (Rozas and Rozas 1997) by generating 10000 random samples. It is
important to note that significant D values can also be due to factors other than
46
77. Methodology
selective effects, like population expansion, bottleneck or heterogeneity of mutation rates. A change in population size can result in deviations from the neutral patterns of nucleotide variation expected at equilibrium. In a population of constant size, variation at a neutrally evolving locus is expected to a have a D value of approximately zero. Following a reduction in population size, rare frequency mutations are lost more readily than are common mutations and transient positive D values are expected. On the confrary, following an increase in population size there is a temporary excess of new mutations segregating at rare frequencies, and negative D value are expected (Fay and W u 1999).
Fu's test (Fu 1997) o f selective neutrality was also run on each sample in the
same program, generating 10000 random samples. As for the Tajima's test, it is
based in the infinite-site model without recombination. It evaluates the probability o f
observing a random neutral sample with a number of alleles similar or smaller than
the observed value. The statistic Fs is very sensitive to population demographic
expansion, which generally leads to large negative Fs values (Schneider et al. 2001).
Genetic differentiation between populations
Genetic differentiation between populations was quantified and tested with the FST
statisdcs (estimator z sr)- Population pairwise were calculated in ARLEQUEN 2.1
on both sequence data (distance method: Tamura-Nei, a = 0.5) and sequence
haplotype frequencies (Weir 1990). Permutations for significance was set to 10000
and P-value represented the proportion of permutations showing a (f>sT greater or
equal to the observed one.
Genetic distances between populations were calculated using the program
DNASP 3.5.3. Uncorrected nucleotide divergence values {Dxy andZ)a) were
calculated by the program following Nei (1987; equations 10.20 and 10.21). D^y
represents the average number of nucleotide substitutions per site between
populations, and Da the number of net nucleotide substitutions per site between
populations (i.e. gross divergence minus within-population diversity). The total
number o f shared mutafions and the number of fixed differences between
populations (i.e. nucleotide sites at which all of the sequences in one population are
47
77. Methodology
different f rom all o f the sequences in the second population) were also calculated with the same program.
Phylogenetic relationships among the control region sequences were analysing
fol lowing different approaches. First, a maximum parsimony (MP) analysis was run
with PAUP 4.0bl0 (Swofford 1998), using a northern elephant seal sequence as
outgroup. A majority-rule consensus tree was constructed from 1000 bootstrap
replications and a 50% criterion for the retention o f nodes was applied. Some of the
mutations between sequences were transversions, therefore the
transition/transversion ratio was calculated and the value (6.27) used in the
phylogeny construction. Second, with the same computer program, a neighbour-
joining (NJ) tree was also constructed. It was constructed from 1000 bootstrap
replications and the distance matrix was based on the Tamura-Nei model and a
gamma distribution with a = 0.5. Finally, the pattern of sequence evolution was
illustrated wi th a network, in which sequences are the nodes of a network rather than
the terminal tips of a tree. A median joining network was constructed in the program
N E T W O R K 31000A (available at: www.fluxus-engineering.com) following Bandelt
et al. (1999). A n approach using networks has some advantages: the network can
predict haplotypes, it can show which sites mutated frequentiy, where the consensus
sequence is and it can specify mutational events (Bandelt et al. 1995). In the network
graphical display, each node represents either an observed haplotype or a
hypothetical intermediate haplotype; the area of the circle representing each
haplotype is proportional to the number of individuals with that haplotype; the length
of the links is proportional to the number o f mutations
48
in Male reproductive success:
behavioural estimates and paternity
m . l I N T R O D U C T I O N
I I I . l . l Behaviour and genetics
Studies in behavioural ecology are traditionally based on measures of individual
reproductive success to define the mating system of natural populations (Clutton-
Brock 1989) or on phenotypic and behavioural traits correlated to reproductive
success and under selective pressure (Dewsbury 1982). Analyses involving
molecular markers, however, have fi-equently demonstrated that mating behaviour
does not always reflect parentage and may indicate alternative mating tactics.
Previous studies on polygynous mammals have revealed different results. In a
red deer population {Cervus elaphus), behavioural data reflected parentage, but
slightly underestimated the variance in seasonal and life-time male reproductive
success (Pemberton et al. 1992). In Soay sheep {Ovis aries), census-based
observations were less good predictors o f paternity and the level of polygyny was
lower than expected (Coltman et al. 1999a). In Pirmipeds, studies on grey seals
(Worthington et al. 1999; Ambs et al. 1999) and Antarctic fur seals (Gemmell et al.
2001) showed notable discrepancy between genetics and behaviour. In both species,
behaviour-based measures over estimated male mating success and hence the level
o f polygyny in the study populations. These investigations show that the
effectiveness o f behavioural methods in assessing paternity varies with species and
population. Therefore the relationship between the behavioural and genetic data
should be carefully assessed in each study.
III. 1.1.1 Mirounga
Behavioural studies on Mirounga predict a high variance in both seasonal (Le Boeuf
1974; McCann 1981) and lifetime male reproductive success (Le Boeuf and Reiter
1988). In a harem, the holder is expected to achieve the majority of matings, and the
percentage he achieves is predicted to be greater in smaller harems, with lower
49
JJI Mating and paternity success
competition pressure, than in larger harems, that are usually frequented by many peripheral males. In a study where behavioural and genetic success of harem holders was compared for the two species of Mirounga (Hoelzel et al. 1999), behavioural estimates were most of the time consistent with genetics for harems of southern elephant seals (SES), while they tended to over estimate genetic paternity in harems of northern elephant seals (NES). SES holders from the Argentinean population were more successful than NES. In harems from 30 to 119 females SES holders achieved a mean of 58% paternities (range 50-70%; n paternities analysed for each harems = 2-19). In contrast, NES holders achieved a mean of 38.9% paternities per harem (range 0-100%; harem size = 9-224; n paternities analysed for each harem =1-18). Variance in NES holder reproductive success was lower than expected and reproductive success o f peripheral males greater.
For the SLI population, evidence f rom behavioural observations and previous
research (Fabiani 1996; unpublished data) support the hypothesis that the most
successful male mating tactic is to get the control of a harem. However, harems often
have peripheral males that always attempt to gain access to oestrous females by
adopting 'sneaky' tactics. It is thus possible that their reproductive success w i l l be
underestimated by behavioural observations. I f this was the case, the variance in
male reproductive success and the degree of polygyny w i l l be reduced and hence the
pressure o f sexual selection less pronounced.
Another important factor in investigating reproductive success is the local
demography of the population. In natural populations, different local demography
may result in a spatial variation o f sex ratio and in consequently variation in
distribution o f male mating success. Significant differences were found between the
elephant seal populations of Delgada (DEL, Peninsula Valdes) and Sea Lion Island
(SLI) when the local demography of the two populations was taken into account
(Galimberti et al. 2002a). When male mating success was analysed at harem level,
variance in male mating success and opportunity of selection (7) varied both between
colonies and among harems. I calculated among harems had a mean of 4.9 ± 2.3 at
SLI (n harems = 12, over four breeding seasons) and 7.8 ± 3.9 at DEL (n harems =
15, over 2 breeding seasons), and the difference between the two populations was
highly significant {P = 0.0281 - Details in Galimberti et al. 2002a).
50
/ / / . Mating and paternity success
In this study different harems from different breeding seasons were analysed, in order to evaluate the effectiveness o f behavioural measures in various contexts and to develop a more accurate picture o f the mating system in the population. Each harem was treated as an autonomous breeding unit, with its females, holder and peripheral males, when present. This was possible because usually females do not move to other harems after giving birth and holders rarely leave their female groups. This allowed the analysis of mating and paternity distributions for each harem, and to relate the distributions to the harem's reproductive context. Each harem has a different social composition, characterised by the presence of peripheral males, the eventual change of the holder, by the number o f breeding females and by the possible splitting or merging of the unit. The identity o f the holder can change during the breeding season i f a dominant male chases him and successfully take over the female control. Similarly small and close harems can increase in number and merge into a single big unit, or a large group of females can split into two groups, each one controlled by a single male.
Variation in male mating success and paternity is shown as standardised
variance (i.e. variance divided by the square o f the mean, as in Wade and Arnold
1980). This measure, opportunity of selection (I), represents the upper limit of the
potential action o f phenotypic selection in each analysed system (group, population,
species). It has been widely used for comparing mating systems both within and
among populations and species (Clutton-Brock 1988). Opportunity o f selection or a
similar measure (i.e. variance divided by the mean, see Boness et al. 1993) have also
been frequently calculated in studies o f pirmiped mating systems (Le Boeuf and
Reiter 1988, Coltmann et al. 1998, Twiss et al. 1998) and when levels of polygyny
were investigated in other species (Packer et al. 1988; Cheney et al. 1988; Altmann
et al. 1988). A truly monogamous mating system w i l l show a variance of zero, while
a mating system with high level of polygyny w i l l have a much larger value.
III. 1.2 Reproductive context on SLI
On SLI, females begin to haul out during the second week of September. Each year,
the daily variation in the number o f females on land follows a bell-shaped curve
(Galimberti and Sanvito 2001) with a maximum in the same (or almost the same)
51
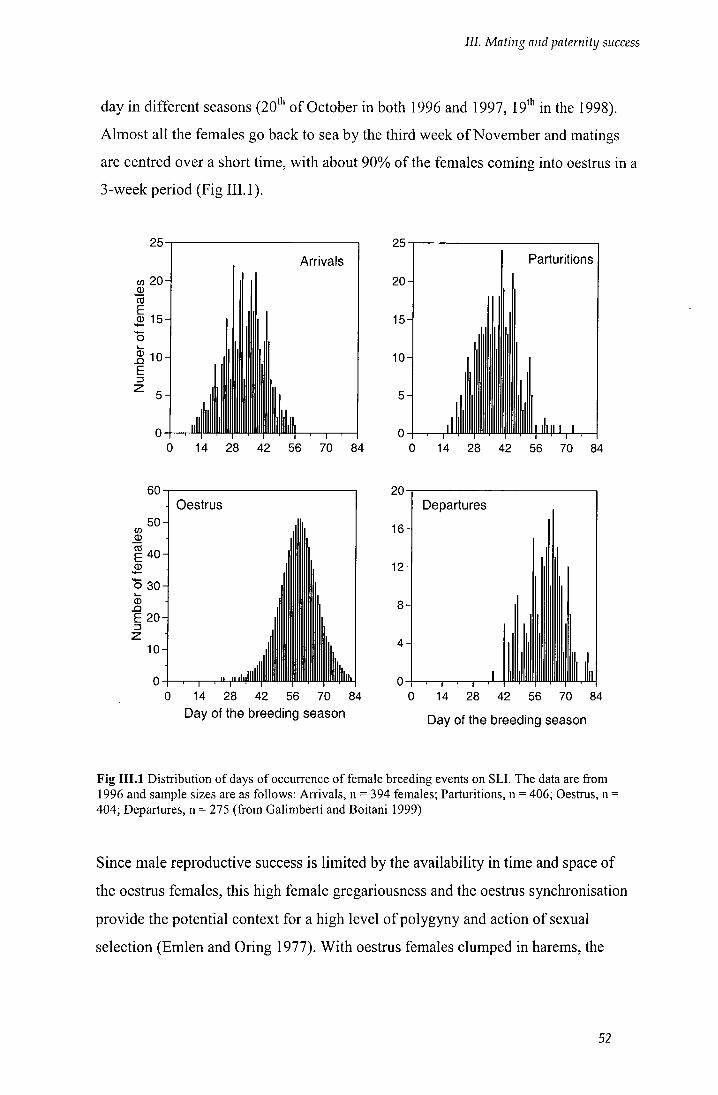
JJJ. Mating and paternity success
day in different seasons (20"" o f October in both 1996 and 1997, 19" in the 1998). Almost all the females go back to sea by the third week of November and matings are centred over a short time, with about 90% of the females coming into oestrus in a 3-week period (Fig I I I . l ) .
Arrivals Parturitions
0 14 28 42 56 70 84 0 14 28 42 56 70 84
Oestrus
E 20H
, I I .11 i l i i
0 14 28 42 56 70 84 Day of the breeding season
20
16
12-
Departures
^ i ' r 0 14 28 42 56 70 84
Day of the breeding season
Fig I I I . l Distribution of days of occurrence of female breeding events on SLI. The data are firom 1996 and sample sizes are as follows: Arrivals, n = 394 females; Parturitions, n = 406; Oestrus, n • 404; Departures, n = 275 (from Galimberti and Boitani 1999)
Since male reproductive success is limited by the availability in time and space of
the oestrus females, this high female gregariousness and the oestrus synchronisation
provide the potential context for a high level of polygyny and action of sexual
selection (Emlen and Oring 1977). With oestrus females clumped in harems, the
52
/ / / . Mating and paternity success
possibility arises for a reduced number o f males to monopolise them, and for variance in male reproductive success to be consequently large.
During the study breeding seasons, the seasonal breeding sex ratio {BSR =
number of breeding females/number of breeding males) followed the distribution of
females on land and seasonal means were 9.1 in 1996 and 10.1 in 1997. In a
polygynous species with a harem defence mating system a better measurement of the
actual sex ratio o f breeding individuals may be to consider only the harem holders,
since they should have almost unique breeding access to the females. On the island,
the mean seasonal ratio o f breeding females to harem holders was 46 and 47,
respectively. This value is very similar to the range of 41-53 reported for the colony
of Delgada in Peninsula Valdes (Galimberti et al. 2000a). It is intermediate between
the value for the entire Peninsula Valdes by Campagna et al. (1993) (11
females/harem holder) and those reported for subantarctic populations, e.g. 74.2
females per harem holder for South Georgia and 277 for Macquarie (McCann 1980).
However, data on sex ratio should be interpreted with caution because there may
also be a great variation in sex ratio within population, i.e. among different breeding
seasons. A more reliable measure that indicates the variation of male mating
opportunity during the breeding season is the operational sex ratio (OSR), which is
the ratio between fertilisable females and reproductive males at any given time
(Emlen and Oring 1977). Due to the female breeding synchronisation in southern
elephant seals, the number of females on land is not a good indicator o f the number
of oestrus females available for mating. In this context, this measure might have a
more important role than the simple BSR in influencing male mating behaviour
during the season. Very few females were estimated being in oestrus every day (for
1996: daily mean o f oestrus females = 12 ± 16, med = 3, M A D = 3, range 0-51) and
contrary to the BSR, the OSR distribution did not fol low the number o f females on
land (Fig III .2) .
53
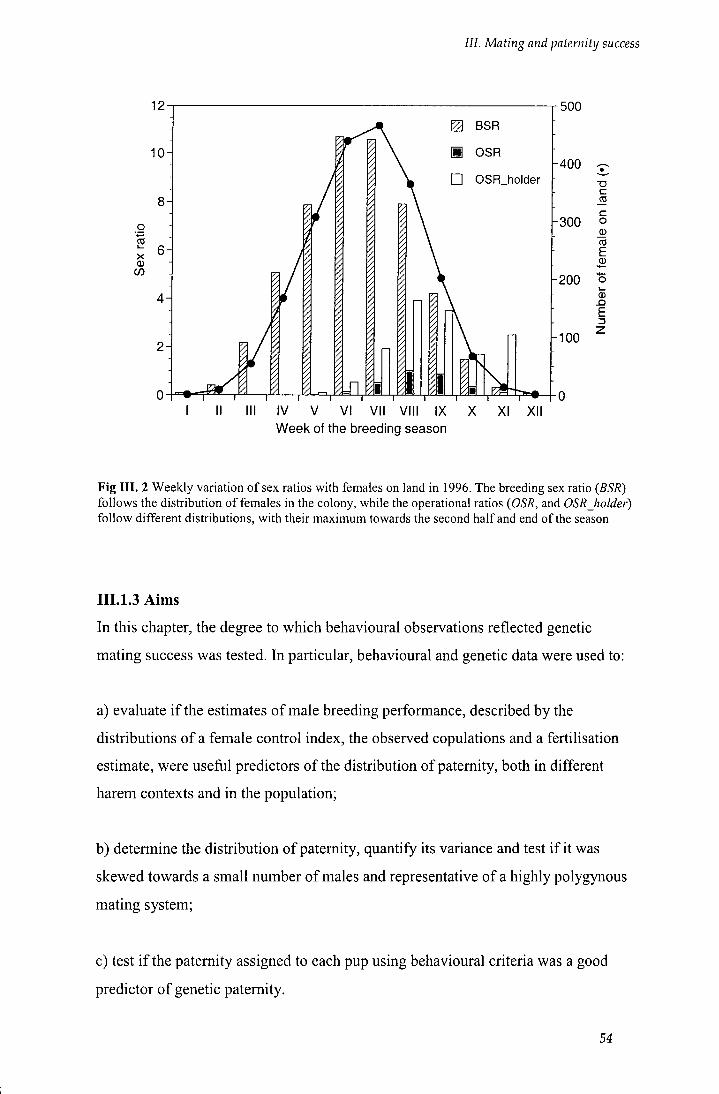
III. Mating and paternity success
BSR
OSR
• OSR_holder
500
400
h300
200
100
•a c ro c o o to E 0)
0 E z
IV V Week of the breeding season
Fig I I I . 2 Weekly variation of sex ratios with females on land in 1996. The breeding sex ratio {BSR) follows the distribution of females in the colony, while the operational ratios {OSR, and OSRJwlder) follow different distributions, with their maximum towards the second half and end of the season
I I I . 1.3 Aims
In this chapter, the degree to which behavioural observations reflected genetic
mating success was tested. In particular, behavioural and genetic data were used to:
a) evaluate i f the estimates of male breeding performance, described by the
distributions o f a female control index, the observed copulations and a fertilisation
estimate, were useful predictors of the distribution of paternity, both in different
harem contexts and in the population;
b) determine the distribution o f paternity, quantify its variance and test i f it was
skewed towards a small number o f males and representative of a highly polygynous
mating system;
c) test i f the paternity assigned to each pup using behavioural criteria was a good
predictor o f genetic paternity.
54
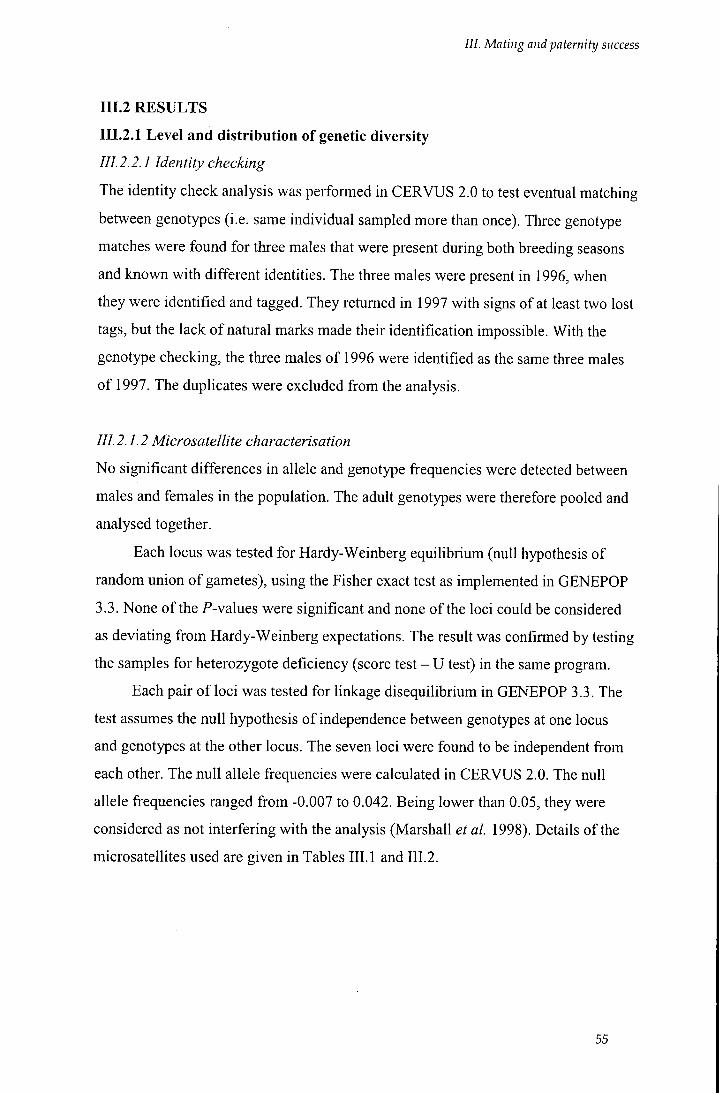
/ / / . Mating and paternity success
111.2 R E S U L T S
I1I.2.1 Level and distribution of genetic diversity
III.2.2.1 Identity checking
The identity check analysis was performed in CERVUS 2.0 to test eventual matching
between genotypes (i.e. same individual sampled more than once). Three genotype
matches were found for three males that were present during both breeding seasons
and known with different identities. The three males were present in 1996, when
they were identified and tagged. They returned in 1997 with signs of at least two lost
tags, but the lack o f natural marks made their identification impossible. With the
genotype checking, the three males o f 1996 were identified as the same three males
of 1997. The duplicates were excluded from the analysis.
III. 2.1.2 Microsatellite characterisation
No significant differences in allele and genotype frequencies were detected between
males and females in the population. The adult genotypes were therefore pooled and
analysed together.
Each locus was tested for Hardy-Weinberg equilibrium (null hypothesis o f
random union of gametes), using the Fisher exact test as implemented in GENEPOP
3.3. None of the P-values were significant and none of the loci could be considered
as deviating f rom Hardy-Weinberg expectations. The result was confirmed by testing
the samples for heterozygote deficiency (score test - U test) in the same program.
Each pair o f loci was tested for linkage disequilibrium in GENEPOP 3.3. The
test assumes the null hypothesis of independence between genotypes at one locus
and genotypes at the other locus. The seven loci were found to be independent from
each other. The null allele frequencies were calculated in CERVUS 2.0. The null
allele frequencies ranged from -0.007 to 0.042. Being lower than 0.05, they were
considered as not interfering with the analysis (Marshall et al. 1998). Details of the
microsatellites used are given in Tables I I I . l and III .2 .
55
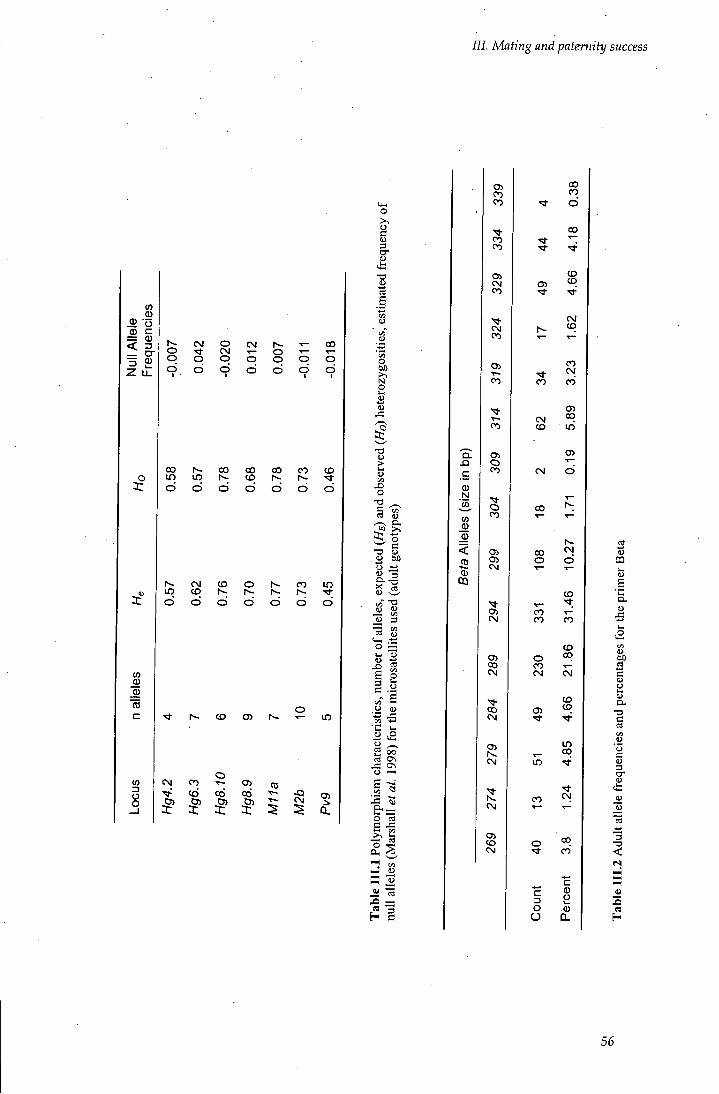
III. Mating and paternity success
3 2? CM o CM T — 00
o CM O o O O o O o o o d d CD d d d
CO 00 CO CO 00 CD i n CD d d d d d d d
CO
c
ID
O
o
CM CD o CO i n CO 1 ^
d d d d d d d
i n
CIS CM CO O i
CO oS 00
1 a: a: i
o >-. o c u
•s I
o M > N O
u
I O > u
X I
o c
-a (u o to
"1?
Q.
N
w 0) 0)
<
CO 00
CO CO
CM 00
00
C3>
00
CO
C35 CD 00
CO
Oi OM
OM
(3> CO OM
00 CM
N . OM
OsJ
C35 CO Ovj
C35
CO
CM CD
CO
CO O
CO CO
O CO
in
CO
o
o o
CD CD
Osl CD
CO OvI CO
CO
CM
CD
CO CO
CO CO
ID CO
CM
00 CO
©
D.
iS m
£ Q. (O
00
s c o o w u a. c
o c 3
56
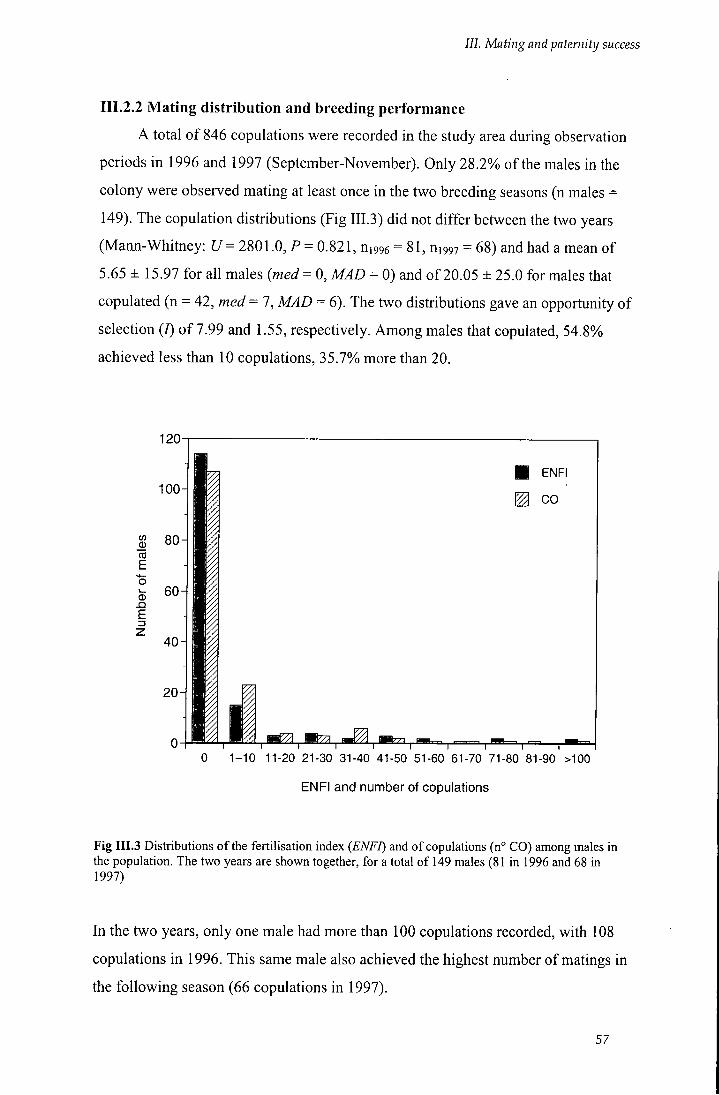
III. Mating and paternity success
IIL2 .2 Mating distribution and breeding performance
A total o f 846 copulations were recorded in the study area during observation
periods in 1996 and 1997 (September-November). Only 28.2% of the males in the
colony were observed mating at least once in the two breeding seasons (n males =
149). The copulation distributions (Fig III.3) did not differ between the two years
(Mann-Whitney: ^7= 2801.0, P = 0.821, mgge = 81, nigg? = 68) and had a mean of
5.65 ± 15.97 for all males (med = 0, MAD = 0) and o f 20.05 ± 25.0 for males that
copulated (n = 42, med = 7, MAD = 6). The two distributions gave an opportunity o f
selecfion (7) o f 7.99 and 1.55, respectively. Among males that copulated, 54.8%
achieved less than 10 copulations, 35.7%) more than 20.
120
100
CO
E
03
E 3
m7A 1 ^ T I I I I 1 1 r
1-10 11-20 21-30 31-40 41-50 51-60 61-70 71-80 81-90 >100
ENFI and number of copulations
Fig III .3 Distributions of the fertilisation index {ENFI) and of copulations (n° CO) among males in the population. The two years are shown together, for a total of 149 males (81 in 1996 and 68 in 1997)
In the two years, only one male had more than 100 copulations recorded, with 108
copulations in 1996. This same male also achieved the highest number of matings in
the following season (66 copulations in 1997).
57
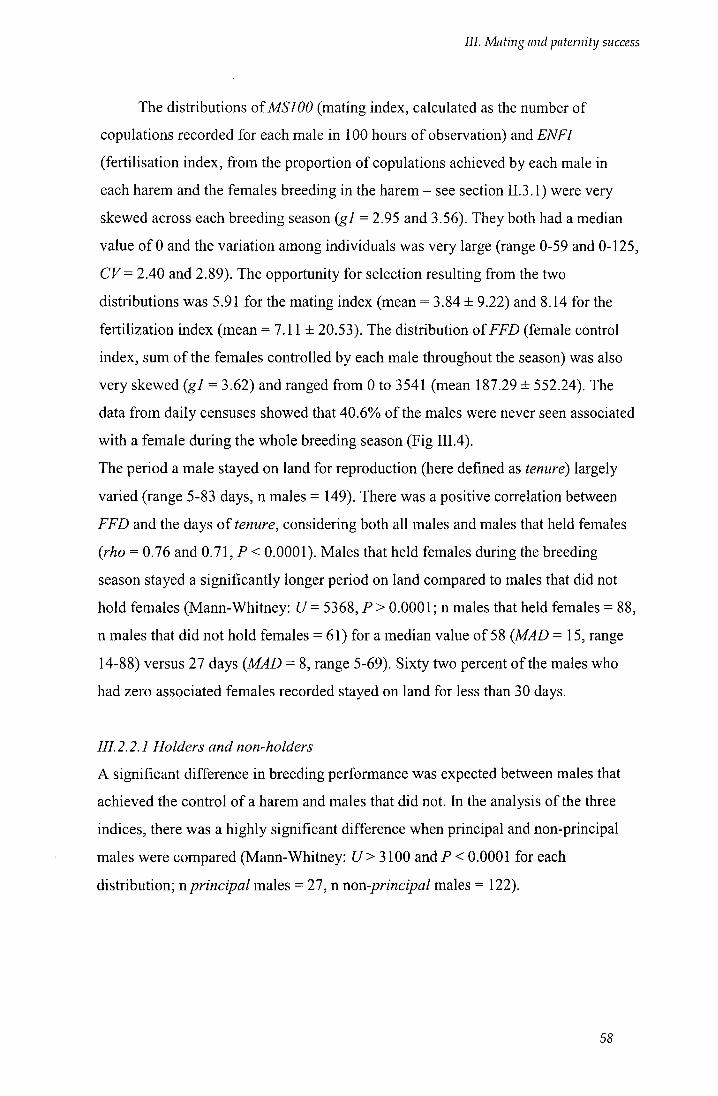
III. Mating and paternity success
The distributions of MS 100 (mating index, calculated as the number of copulations recorded for each male in 100 hours o f observation) and ENFJ (fertilisation index, f rom the proportion o f copulations achieved by each male in each harem and the females breeding in the harem - see section II.3.1) were very skewed across each breeding season (gl = 2.95 and 3.56). They both had a median value o f 0 and the variation among individuals was very large (range 0-59 and 0-125, CV= 2.40 and 2.89). The opportunity for selection resulting from the two distributions was 5.91 for the mating index (mean = 3.84 ± 9.22) and 8.14 for the fertilization index (mean = 7.11 ± 20.53). The distribution oiFFD (female control index, sum of the females controlled by each male throughout the season) was also very skewed (gl = 3.62) and ranged from 0 to 3541 (mean 187.29 ± 552.24). The data f rom daily censuses showed that 40.6% of the males were never seen associated with a female during the whole breeding season (Fig III .4) . The period a male stayed on land for reproduction (here defined as tenure) largely varied (range 5-83 days, n males = 149). There was a positive correlation between FFD and the days o f tenure, considering both all males and males that held females {rho = 0.76 and 0.71, P < 0.0001). Males that held females during the breeding season stayed a significantly longer period on land compared to males that did not hold females (Mann-Whitney: U= 5368, P > 0.0001; n males that held females = 88, n males that did not hold females = 61) for a median value of 58 {MAD = 15, range 14-88) versus 27 days (MAD = 8, range 5-69). Sixty two percent o f the males who had zero associated females recorded stayed on land for less than 30 days.
III. 2.2.1 Holders and non-holders
A significant difference in breeding performance was expected between males that
achieved the control o f a harem and males that did not. In the analysis of the three
indices, there was a highly significant difference when principal and non-principal
males were compared (Marm-Whitney: U > 3100 and P < 0.0001 for each
distribufion; n principal males = 27, n non-principal males = 122).
58
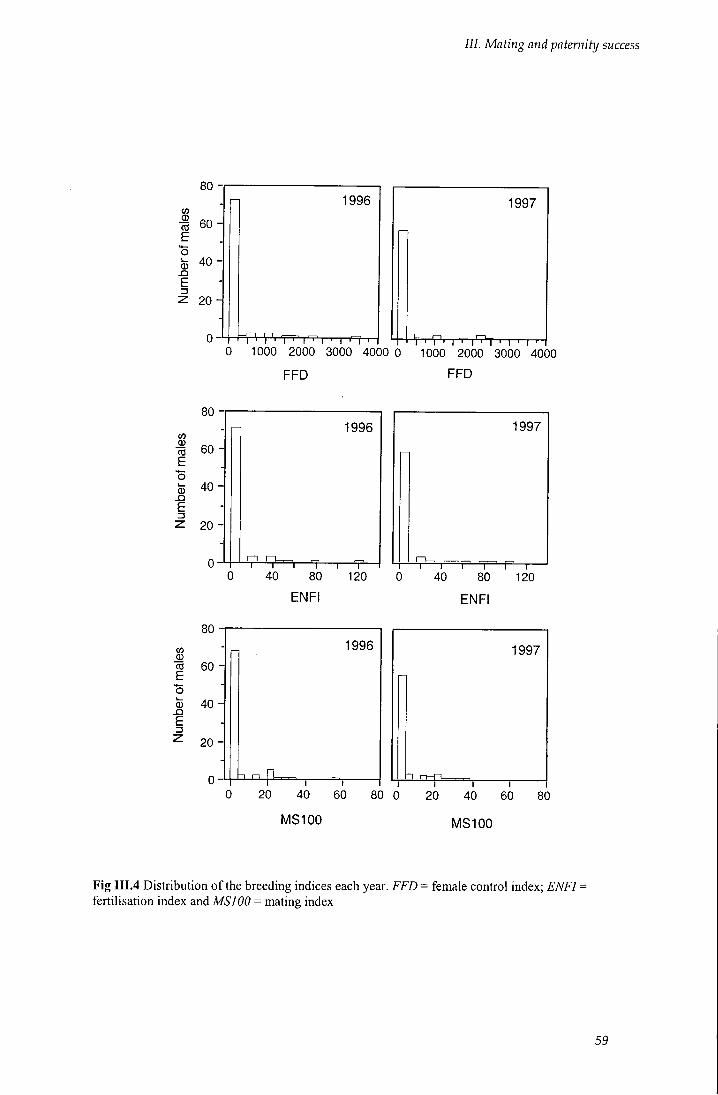
/ / / . Mating and paternity success
80
to
^ 60 E
0
E 3
40
20 H
1996 1997
0 1000 2000 3000 4000 0 1000 2000 3000 4000
FFD FFD
80
ffl 60
^ 4 0 -
20
T 1— 40
- 1 r -80
ENFI
1996
120 T T—
40 80
ENFI
1997
120
E
E 3
80
60
40 -
20 i
20 I
40
1996
I
60
MSI 00
h n-ru 80 0 T
20 I
40
1997
I
60
MS100
80
Fig III.4 Distribution of the breeding indices each year. FFD = female control index; ENFI --fertilisation index and MS 100 = mating index
59
III. Mating and paternity success
Variation in the mating performance was smaller, but still present, when only the
seasonal harem holders were considered. Five out of 20 harem holders (25%)
achieved twenty or less copulations, and the ENFI distribution had a mean of 49.9 ±
32.1 (med = 41, MAD = 20, CV= 0.64). The distribufions ofMSlOO and FFD were
similarly skewed and showed analogous variation {CV= 0.47 and 0.72) (Fig III.5).
There was no significant difference in any of the mating performance indices
between harem holders in the two years.
140
old 120 -
E -
to 100 -
"to -
o to 80 -CO 0 CO O)
on
60 -E CO CO
40 -0 40 -13
40 -CO > X ep 20 -
CO MS100 ENFI
Fig III.5 Distribution of copulations (CO), fertilisation {ENFI) and mating success {MSI 00) indices among principal males (i.e. males that gained the control of a harem for at least 24 hrs; n = 27 males)
III. 2.2.2 Secondary and tertiary males
Among males that did not gain the control of any harem, matings were not evenly
distributed. Males associated with a breeding unit (secondary males) had higher
success than males never observed associated with a harem (tertiary males) (for
MS 100: Mann-Whitney: U= 2226.0, P = 0.044; n secondary males = 68, n tertiary
males = 54). O f the 20% o f secondary males that mated at least once, two males had
seven and one had nine copulations recorded. Among the tertiary males, only one
60
III. Mating and paternity success
male achieved four copulations. His copulations were all recorded during the same observation period, when the harem holder was absent for a short period of time. The difference between associated and non-associated males was larger when the female control index (FFD) was considered (Mann-Whitney: U= 2862.5, P < 0.0001) but was not significant for ENFI (Mann-Whitney: U = 2096.5, P = 0.179). The MSI00 distributions had a mean of 0.69 (± 1.95) and 0.27 (± 2.00) for secondary and tertiary males respectively, while the equivalent £'7VF/values were 0.412 (± 1.14) and 0.056 (±0 .41) .
III.2.3 Mating distribution in the harems
For a more detailed analysis o f the relationships between behavioural and genetic
data, seven harems belonging to only one zone of the study area were chosen (five
for the first year and two for the second). The males associated with each harem
were recorded during the daily censuses, and their mating performances were
estimated from the data collected during the standard observation periods.
III. 2.3.1 Socionomy of the harems
As for the whole population (Galimberti and Sanvito 2001), the daily variation in the
number o f females in a harem was best described by a Gaussian distribution; the
peak o f the distribufion was defined as the harem size and represented almost 90% of
all the females that bred in the harem (Fig III .6).
The size of the seven harems ranged from 18 to 91 females (mean = 47.71 ±
27.52) and the number o f different associated males recorded during the whole
season for each harem ranged from 0 to 13 (mean 8.00 ± 5.53). Considering both the
harem holder and the males associated with the harem, the mean daily breeding sex
ratio (BSR = number o f breeding females/number of breeding males) ranged from
9.04 to 22.21, with a maximum o f 74. The variation in the mean daily number of
associated males was large both among (CV= 1.84) and within harems (CKrange
0.97-3.18). Data f rom censuses also showed a significant difference in the daily
number o f males associated with the seven harems (Kruskal-Wallis: KW= 84.98, df
= 6, P < 0.0001; 42-58 censuses on each harem). Details o f the breeding units are
given in Table I I I . 3.
61
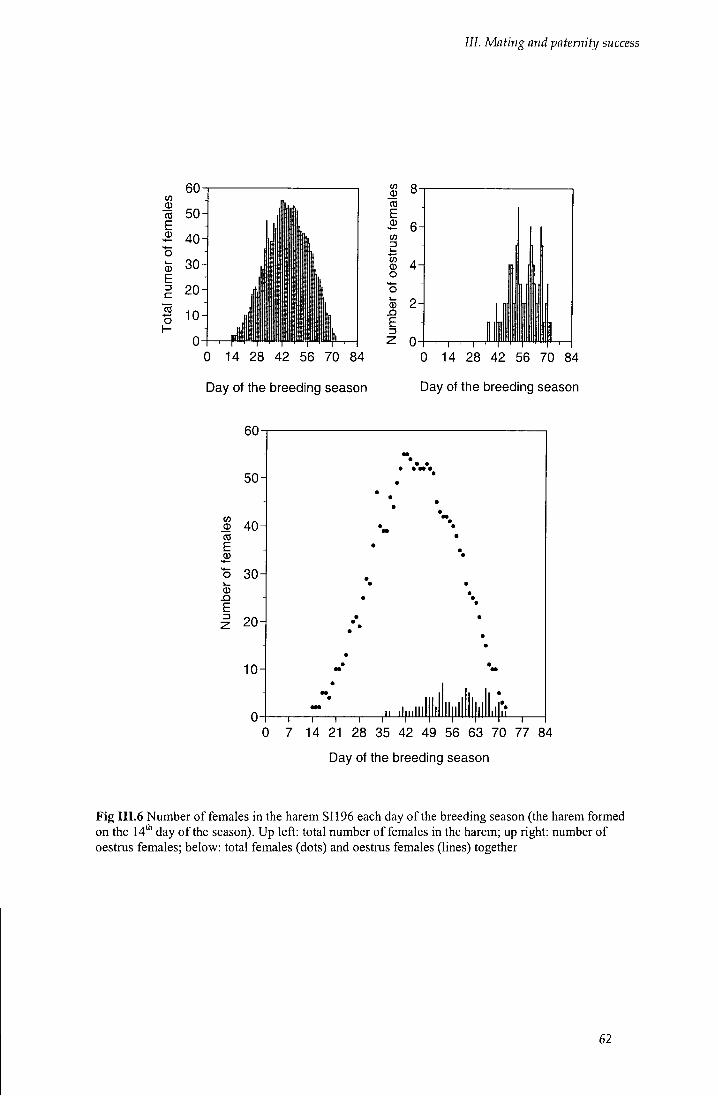
III. Mating and paternity success
CO
CO E 0
0 E C
o
0 14 28 42 56 70 84
Day of the breeding season
CO 0 CO
to
« 0 O
0 n E 13 T — ^ 1 • I
0 14 28 42 56 70 84
Day of the breeding season
0 40 CO
0
0
T I I I I I I I I i r
7 14 21 28 35 42 49 56 63 70 77 84
Day of the breeding season
Fig III.6 Number of females in the harem SI 196 each day of the breeding season (the harem formed on the 14* day of the season). Up left: total number of females in the harem; up right: number of oestrus females; below: total females (dots) and oestrus females (lines) together
62
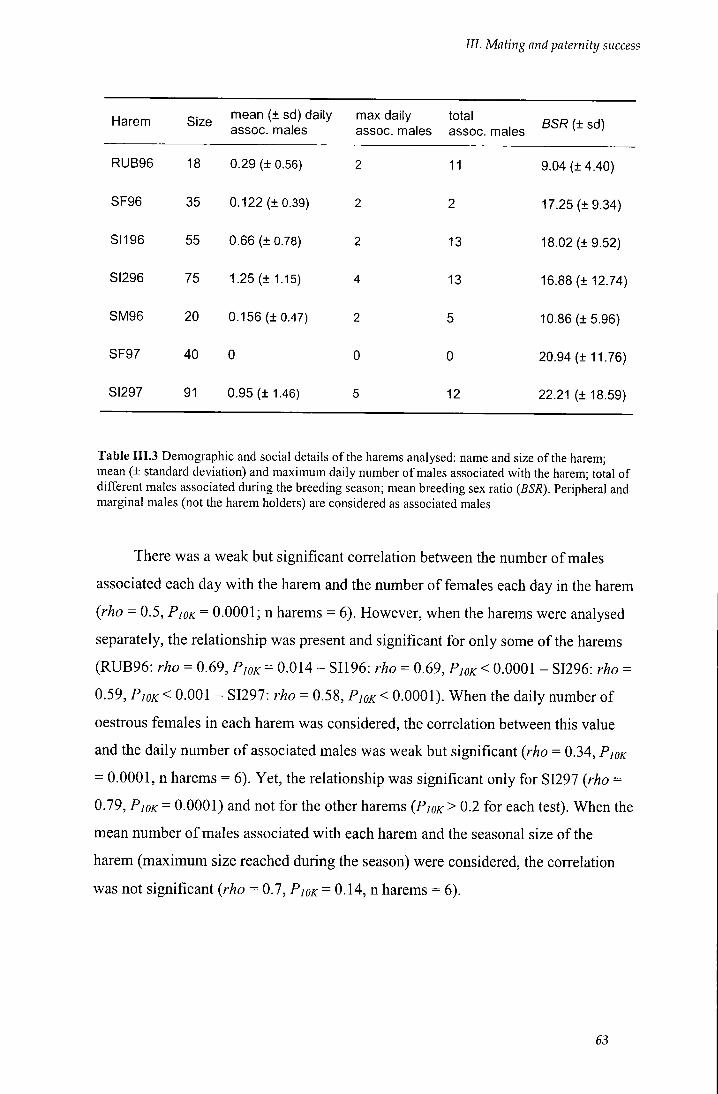
III. Mating and paternity success
Harem Size "lean (± sd) daily max daily total B S R (+sd) assoc. males assoc. males assoc. males
RUB96 18 0.29 (±0.56)
SF96 35 0.122 (±0.39)
SI196 55 0.66 (±0.78)
SI296 75 1.25 (±1.15)
SM96 20 0.156 (±0.47)
SF97 40 0
SI297 91 0.95 (±1.46)
11
2
13
13
5
0
12
9.04 (± 4.40)
17.25 (± 9.34)
18.02 (±9.52)
16.88 (± 12.74)
10.86 (±5.96)
20.94 (±11.76)
22.21 (± 18.59)
Table III.3 Demographic and social details of the harems analysed: name and size of the harem; mean (± standard deviation) and maximum daily number of males associated with the harem; total of different males associated during the breeding season; mean breeding sex ratio {BSR). Peripheral and marginal males (not the harem holders) are considered as associated males
There was a weak but significant correlafion between the number of males
associated each day with the harem and the number o f females each day in the harem
(rho = 0.5, PjoK = 0.0001; n harems = 6). However, when the harems were analysed
separately, the relationship was present and significant for only some of the harems
(RUB96: rho = 0.69, PIOK = 0.014 - SI196: rho = 0.69, PJOK < 0.0001 - SI296: rho =
0.59, PJOK < 0.001 - SI297: rho = 0.58, P,OK < 0.0001). When the daily number of
oestrous females in each harem was considered, the correlation between this value
and the daily number o f associated males was weak but significant (rho = 0.34, PIOK
= 0.0001, n harems = 6). Yet, the relationship was significant only for SI297 (rho =
0.79, PIOK = 0.0001) and not for the other harems (P/OK > 0.2 for each test). When the
mean number o f males associated with each harem and the seasonal size of the
harem (maximum size reached during the season) were considered, the correlation
was not significant (rho = 0.7, PIOK = 0.14, n harems = 6).
63
JJJ. Mating and paternity success
III. 2.3.2 Mating performance in the harems
The differences in the distributions of the breeding indices among the harems were
not significant {P > 0.7 in the three cases). In each harem, the holder always made
the majority o f matings, with a mean of 81%) (± 16.5) of the copulations, {med =
80%, MAD = 4, CV= 0.2, range 50%-100%), and there was no significant
correlation between the size o f the harem and the proportion o f copulations achieved
by its holder {rho = -0.7, PWK = 0.102).
A negative correlation was present between the success o f the holder
(percentage o f total copulations in the harem) and the number o f males associated
with his harem. The correlafion was strong and significant when either the mean
number o f daily associated males or the seasonal maximum number o f males was
considered (rho = -0.94, P/o^ = 0.015; rho = -0.86, 70 ^ = 0.0196). The correlation
was also present and significant when the total number o f different males associated
with each harem during the breeding season was taken into account (rho = -0.84,
Pyo^^ 0.043).
The distributions of the indices in each of the seven harems were asymmetric
and the variation among individuals large (CVENFI= L67 to 2.78, CVFFD = L73 to
3.72, CVMSIOO = 1-41 to 2.92). The mean of ENFI ranged from 1.75 ± 4.9 to 22.5 ±
31.8, the mean ofMSlOO from 1.108 ± 3.18 to 15 ± 25.1 and the female control
index (FFD) had a mean ranging from 33.67 ± 116.63 to 535 ± 753.8 (Table III .4).
64
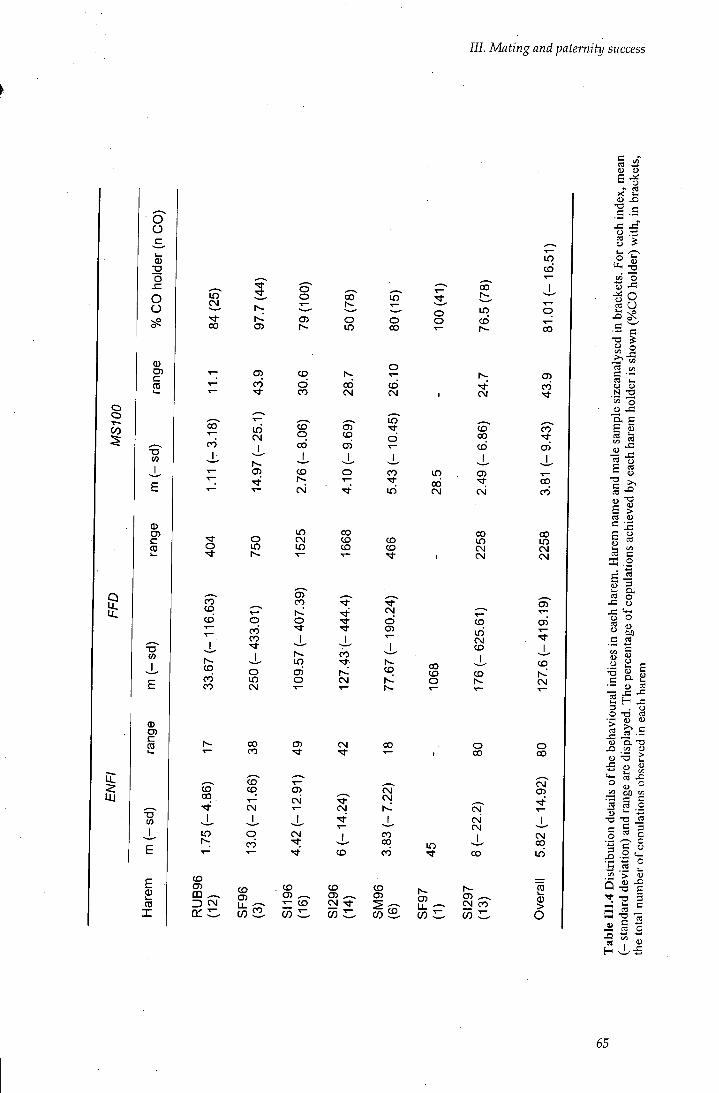
/ / / . Mating and paternity success
o
o o
o o o
0 c
-D CO
0)
c (0
T 3
c: TO
•a
E
E
03 X
(25)
.7 (4
4;
(100
)
(78)
in"
00 Oi C35 N-
o m o 00
CD N- o y CO CD
CO 0C3 CM
CD
-3.1
8)
(-25
.1)
- 8.
06)
-9.6
9)
- 10
.45)
^—' ^ — CD h~ o CO
c\i in
o O in 15
25
1668
CD CD
CO CO
N . CD CO CO
CD 0 0
o CO CO •<3-
O m CS)
0 0 CO
CD CD
CM
o o
c CO
o
in ai o
CN
CO
CM
CD
m 01
CM CD CD
CD
CD
CM
CM d CJ>
CO
0 0
CM CM
in q CM 1 CO CO 0 0
CO CO
CO c ^
CO
in 0 0 CM
0 0 CO o
in
CD L i . CO
0 0
in CD' r-
CM
CO 0 0
C D
C3)
CM
0 0
in CM
CO in CM CO
CD
O 0 0
CM CM
0 0
CT> CM CO
in CD
q
0 0
0 5
CO
00
ai
0 0
CO
0 0
in CM CM
Oi T—
ai
CD
CM
o 0 0
CM
a)
CM CO
CO 0) > O
l _ .
o T 3
« O
•g o
CO 1_
"o
I
S >
= IS i ^ 22 .2 S ' l
o J = < j
o o c« u
T3 2 " P
D . e 3 . U
0 -a M
" o ^
1 s | T3 -a J5 g § I
in > u Q (U X
3 !3 = "c
3 X)
a H
65
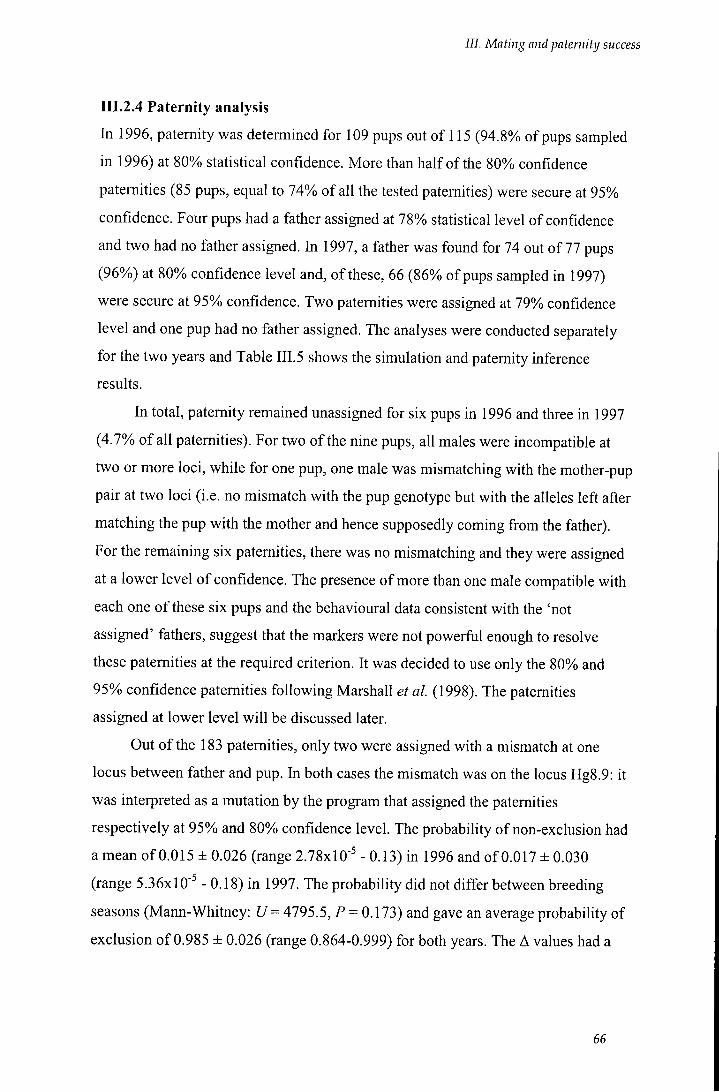
III. Mating and paternity success
111.2.4 Paternity analysis
In 1996, paternity was determined for 109 pups out of 115 (94.8% of pups sampled
in 1996) at 80% statistical confidence. More than half of the 80%) confidence
paternities (85 pups, equal to 74% of all the tested paternities) were secure at 95%
confidence. Four pups had a father assigned at 78% statistical level of confidence
and two had no father assigned. In 1997, a father was found for 74 out of 77 pups
(96%) at 80% confidence level and, of these, 66 (86% of pups sampled in 1997)
were secure at 95% confidence. Two paternities were assigned at 79% confidence
level and one pup had no father assigned. The analyses were conducted separately
for the two years and Table I I I . 5 shows the simulation and paternity inference
results.
In total, paternity remained unassigned for six pups in 1996 and three in 1997
(4.7%) of all paternities). For two of the nine pups, all males were incompatible at
two or more loci, while for one pup, one male was mismatching with the mother-pup
pair at two loci (i.e. no mismatch with the pup genotype but with the alleles left after
matching the pup with the mother and hence supposedly coming from the father).
For the remaining six paternities, there was no mismatching and they were assigned
at a lower level of confidence. The presence of more than one male compatible with
each one of these six pups and the behavioural data consistent with the 'not
assigned' fathers, suggest that the markers were not powerful enough to resolve
these paternities at the required criterion. It was decided to use only the 80%) and
95%) confidence paternities following Marshall et al. (1998). The paternities
assigned at lower level wil l be discussed later.
Out of the 183 paternities, only two were assigned with a mismatch at one
locus between father and pup. In both cases the mismatch was on the locus Hg8.9: it
was interpreted as a mutation by the program that assigned the paternities
respectively at 95%) and 80%o confidence level. The probability of non-exclusion had
a mean of 0.015 ± 0.026 (range 2.78x10"^ - 0.13) in 1996 and of 0.017 ± 0.030
(range 5.36x10"^ - 0.18) in 1997. The probability did not differ between breeding
seasons (Mann-Whitney: U = 4795.5, P = 0.173) and gave an average probability of
exclusion of 0.985 ± 0.026 (range 0.864-0.999) for both years. The A values had a
66
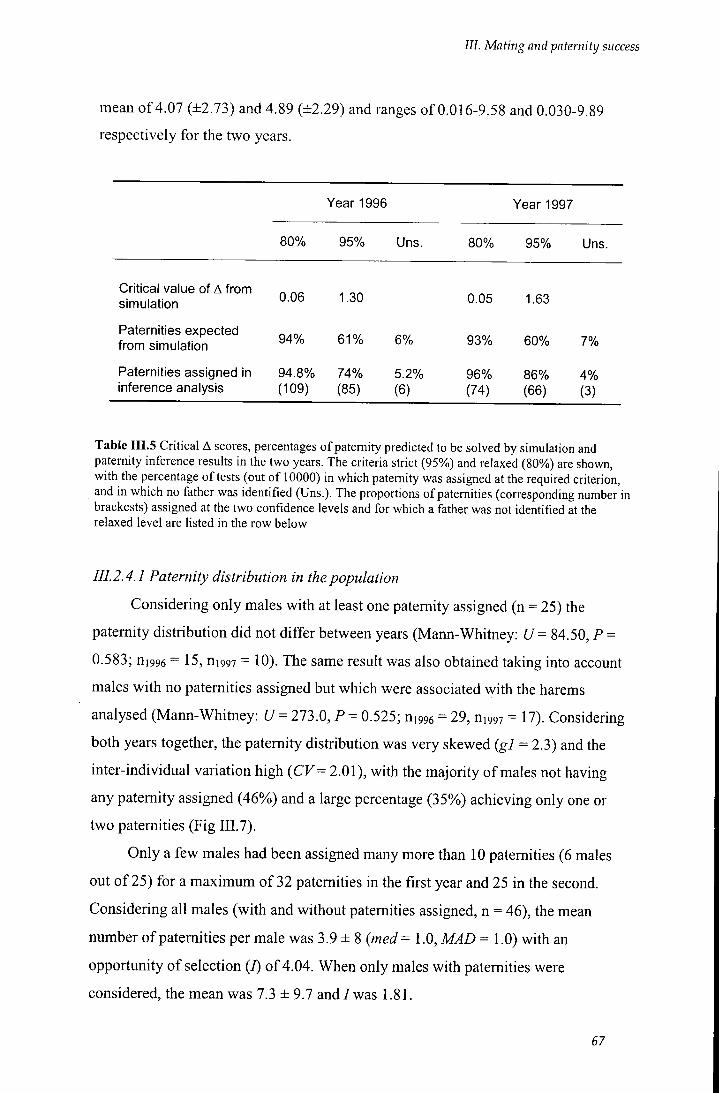
/ / / . Mating and paternity success
mean of 4.07 ( ± 2 . 7 3 ) and 4.89 ( ± 2 . 2 9 ) and ranges of 0.016-9.58 and 0.030-9.89 respectively for the two years.
Year 1996 Year 1997
80% 95% Uns. 80% 95% Uns.
Critical value of A from simulation 0.06 1.30 0.05 1.63
Paternities expected from simulation 94% 61% 6% 93% 60% 7%
Paternities assigned in 94.8% 74% 5.2% 96% 86% 4% inference analysis (109) (85) (6) (74) (66) (3)
Table III.5 Critical A scores, percentages of paternity predicted to be solved by simulation and paternity inference results in the two years. The criteria strict (95%) and relaxed (80%) are shown, with the percentage of tests (out of 10000) in which paternity was assigned at the required criterion, and in which no father was identified (Uns.). The proportions of paternities (corresponding number in brackests) assigned at the two confidence levels and for which a father was not identified at the relaxed level are listed in the row below
III. 2.4.1 Paternity distribution in the population
Considering only males with at least one paternity assigned (n = 25) the
paternity distribution did not differ between years (Mann-Whitney: U = 84.50, P =
0.583; ni996 = 15, nigg? = 10). The same result was also obtained taking into account
males with no paternities assigned but which were associated with the harems
analysed (Mann-Whitney: U = 273.0, P = 0.525; nigge = 29, nmi = 17). Considering
both years together, the paternity distribution was very skewed (gl = 2.3) and the
inter-individual variation high (CV= 2.01), with the majority of males not having
any paternity assigned (46%o) and a large percentage (35%) achieving only one or
two paternities (Fig III .7).
Only a few males had been assigned many more than 10 paternities (6 males
out of 25) for a maximum of 32 paternities in the first year and 25 in the second.
Considering all males (with and without paternities assigned, n = 46), the mean
number of paternities per male was 3.9 ± 8 (med = 1.0, MAD = 1.0) with an
opportunity of selection (/) of 4.04. When only males with paternities were
considered, the mean was 7.3 ± 9.7 and/was 1.81.
67
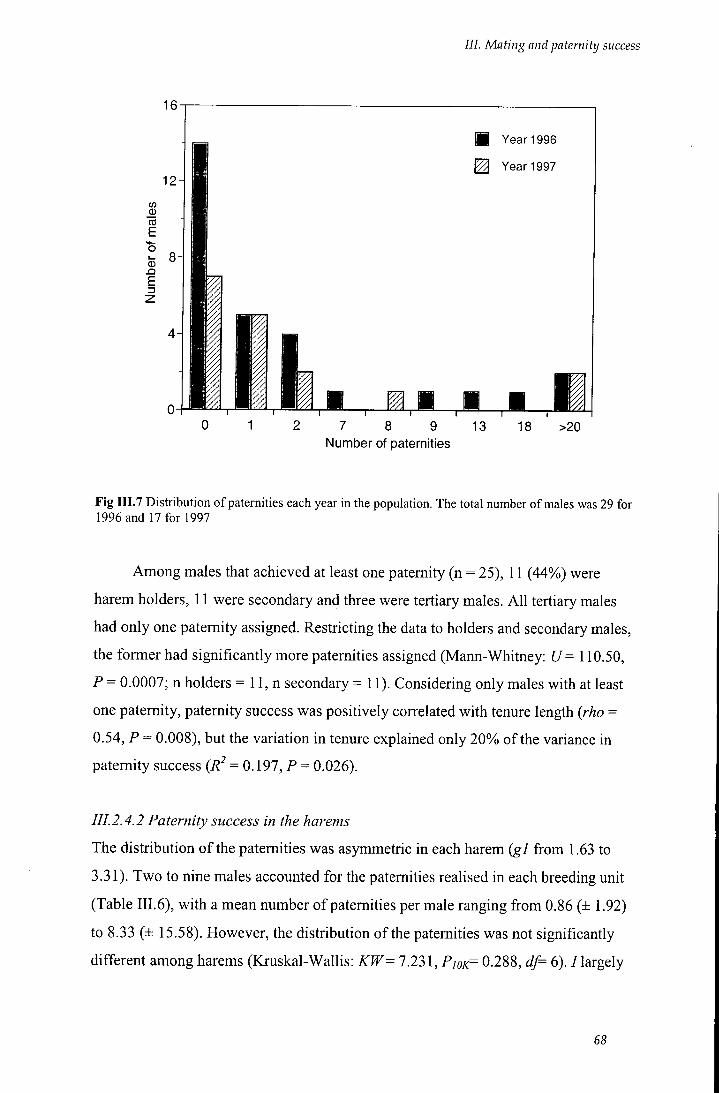
III. Mating and paternity success
16
12H CO 0 )
to
J3
4H
M
• Year 1996
^ Year 1997
~r i 1 r r 2 7 8 9 13 18 >20
Number of paternities
Fig III.7 Distribution of paternities each year in the population. The total number of males was 29 for 1996 and 17 for 1997
Among males that achieved at least one paternity (n = 25), 11 (44%) were
harem holders, 11 were secondary and three were tertiary males. Al l tertiary males
had only one paternity assigned. Restricting the data to holders and secondary males,
the former had significantly more paternities assigned (Mann-Whitney: U = 110.50,
P = 0.0007; n holders = 11, n secondary = 11). Considering only males with at least
one paternity, paternity success was positively correlated with tenure length (rho =
0.54, P = 0.008), but the variation in tenure explained only 20% of the variance in
paternity success (R^ = 0.197, P = 0.026).
III. 2.4.2 Paternity success in the harems
The distribution of the paternities was asymmetric in each harem {gl from 1.63 to
3.31). Two to nine males accounted for the paternities realised in each breeding unit
(Table III.6), with a mean number of paternities per male ranging from 0.86 (± 1.92)
to 8.33 (± 15.58). However, the distribution of the paternities was not significantly
different among harems (Kruskal-Wallis: KW^ 7.231, P,ok^ 0.288, df= 6). / largely
68
III. Mating and paternity success
varied across harems and, considering all males (with and without paternities), it had a mean of 5.6 ± 2.9 and ranged from 2.68 to 11.27 (Table III .7)
Number of males in each harem with/without paternities assigned
Number paternities RUB96 SF96 51196 SI296 SM96 SF97 SI297
0
1
2
7
8
12
18
21
24
32
Tot number of males
10
1
2
1
14
2
2
11
2
7
6
14 16 6 3
7
5
2
16
Table III.6 Distribution of paternities in each harem. Number of paternities (left) and the corresponding number of males for each unit are indicated. The total number of males analysed for each harem are shown
In each harem, the holder was assigned the largest proportion of paternities,
with a median value of 85 .7% (MAD = 10.3, range from 56 .8% to 96.0). There was
no correlation between the number of paternities assigned and either the size of the
harem or the total number of males associated with it (rho = -0 .071 , P/oa: = 0.90; rho
= -0.52, P/oK = 0.242). During the breeding season males other than the harem holder
sometimes gained the control of the harem. The period of the turnovers (i.e. the
length of time that the new male was able to keep the control of the harem) varied
from few hours to few days. To see how these turnovers affected the success of the
69
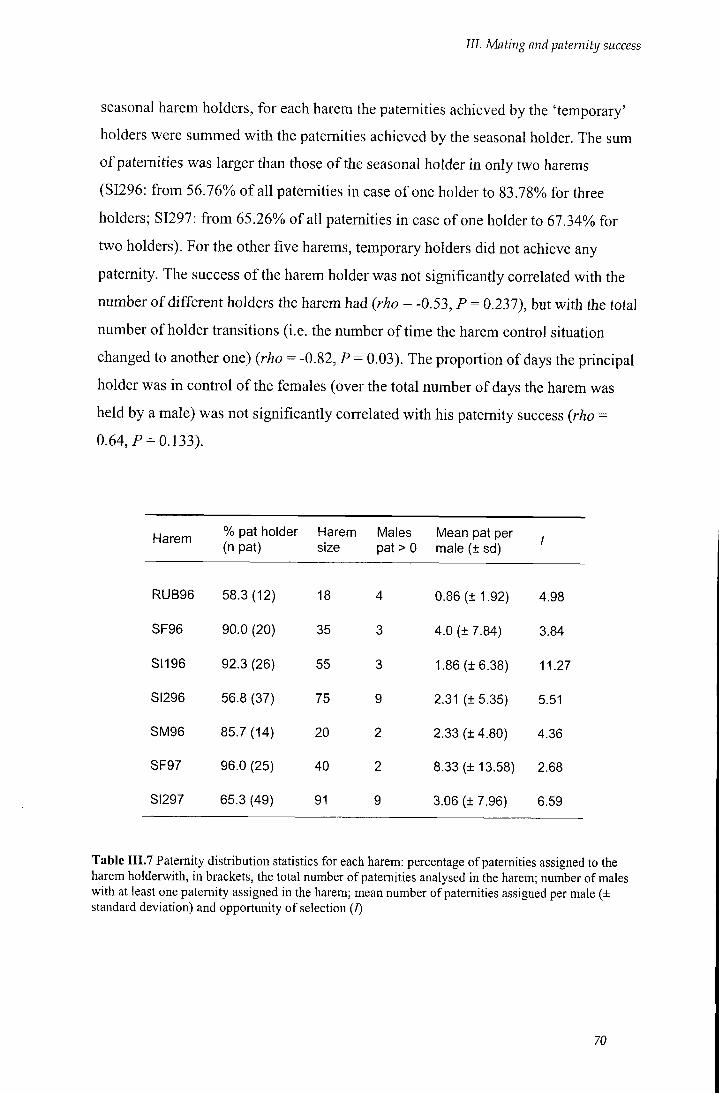
III. Mating and paternity success
seasonal harem holders, for each harem the paternities achieved by the 'temporary' holders were summed with the paternities achieved by the seasonal holder. The sum of paternities was larger than those of the seasonal holder in only two harems (S1296: from 56.16% of all paternities in case of one holder to 83.78% for three holders; SI297: from 65.26% of all paternities in case of one holder to 67.34% for two holders). For the other five harems, temporary holders did not achieve any paternity. The success of the harem holder was not significantly correlated with the number of different holders the harem had (rho = -0.53, P = 0.237), but with the total number of holder transitions (i.e. the number of time the harem control situation changed to another one) (rho ^ -0.82, P = 0.03). The proportion of days the principal holder was in control of the females (over the total number of days the harem was held by a male) was not significantly correlated with his paternity success (rho = 0.64, P = 0.133).
Harem % pat holder (n pat)
Harem size
Males pat>0
Mean pat per male (± sd) /
RUB96 58.3 (12) 18 4 0.86 (± 1.92) 4.98
SF96 90.0 (20) 35 3 4.0 (± 7.84) 3.84
SI196 92.3 (26) 55 3 1.86 (±6.38) 11.27
SI296 56.8 (37) 75 9 2.31 (± 5.35) 5.51
SM96 85.7 (14) 20 2 2.33 (± 4.80) 4.36
SF97 96.0 (25) 40 2 8.33 (± 13.58) 2.68
81297 65.3 (49) 91 9 3.06 (± 7.96) 6.59
Table III.7 Paternity distribution statistics for each harem: percentage of paternities assigned to the harem holderwith, in brackets, the total number of paternities analysed in the harem; number of males with at least one paternity assigned in the harem; mean number of paternities assigned per male (± standard deviation) and opportunity of selection (7)
70
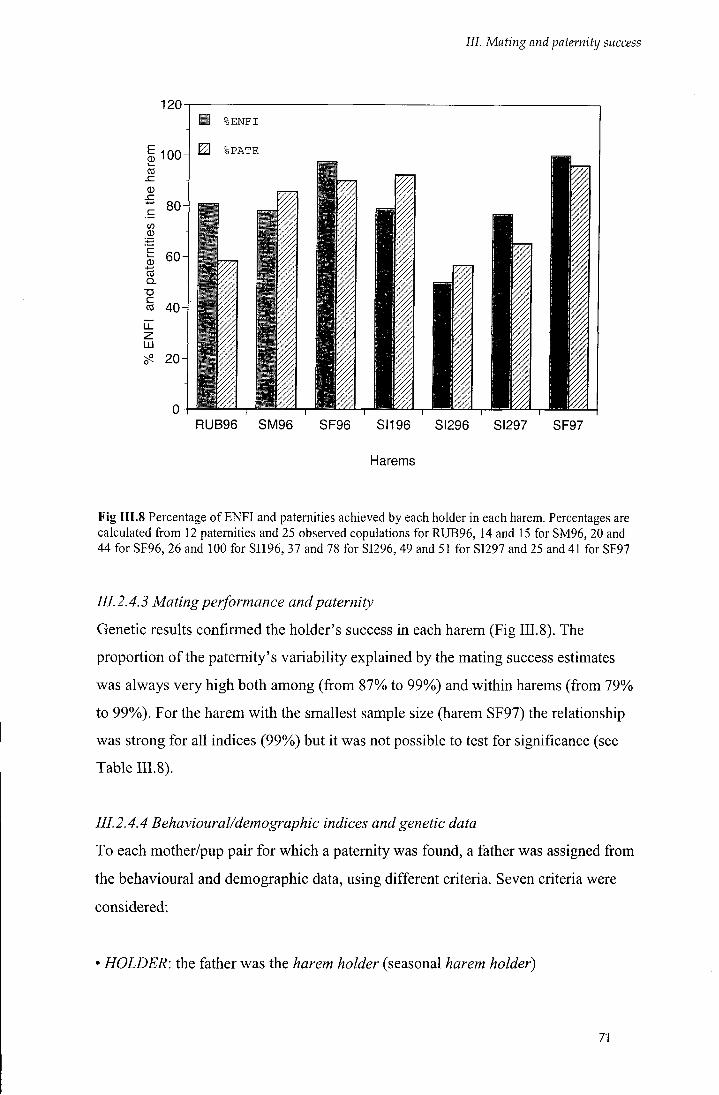
III. Mating and paternity success
120 %ENFI
d %PATE
CO 40
RUB96 SM96 SF96 SI196 SI296 SI297 SF97
Harems
Fig III.8 Percentage of ENFI and paternities achieved by each holder in each harem. Percentages are calculated from 12 paternities and 25 observed copulations forRUB96, 14 and 15 for SM96, 20 and 44 for SF96, 26 and 100 for SI196, 37 and 78 for SI296,49 and 51 for SI297 and 25 and 41 for SF97
III. 2.4.3 Mating performance and paternity
Genetic results confirmed the holder's success in each harem (Fig III.8). The
proportion of the paternity's variability explained by the mating success estimates
was always very high both among (from 87%) to 99%)) and within harems (from 19%
to 99%)). For the harem with the smallest sample size (harem SF97) the relationship
was strong for all indices (99%)) but it was not possible to test for significance (see
Table III.8).
III. 2.4.4 Behavioural/demographic indices and genetic data
To each mother/pup pair for which a paternity was found, a father was assigned from
the behavioural and demographic data, using different criteria. Seven criteria were
considered:
• HOLDER: the father was the harem holder (seasonal harem holder)
71
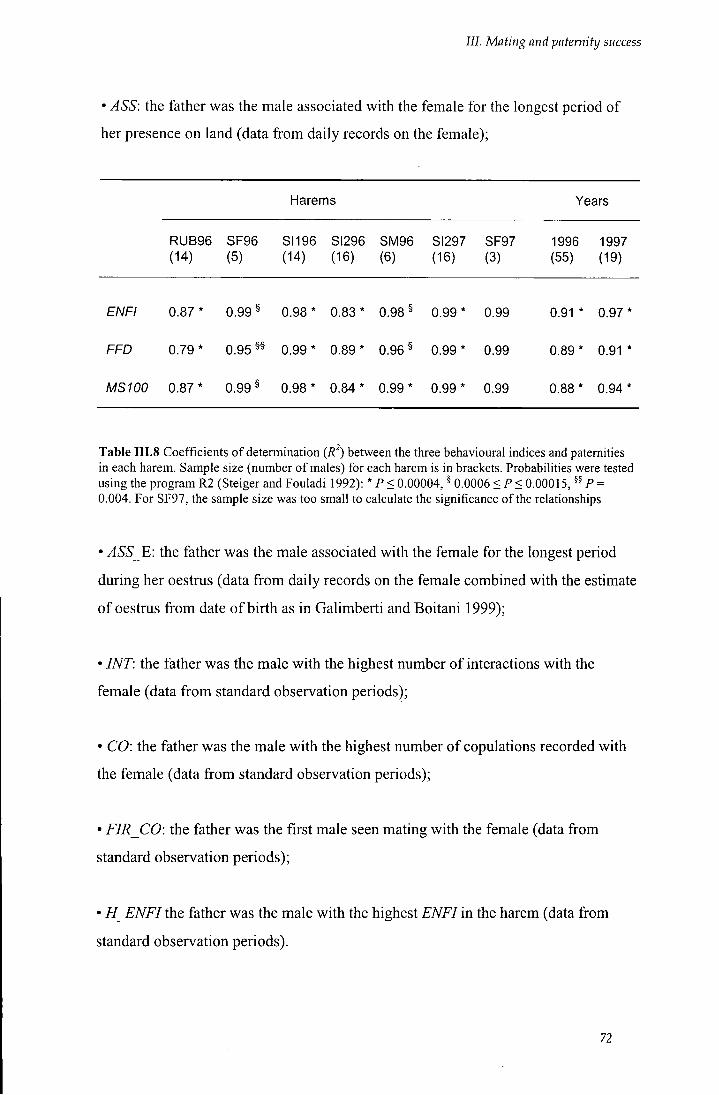
III. Mating and paternity success
• ASS: the father was the male associated with the female for the longest period of her presence on land (data from daily records on the female);
Harems Years
RUB96 SF96 SI196 SI296 SM96 SI297 SF97 1996 1997 (14) (5) (14) (16) (6) (16) (3) (55) (19)
ENFI 0.87 * 0.99 § 0.98 * 0.83 * 0.98 ^ 0.99 * 0.99 0.91 * 0.97 *
FFD 0.79 * 0.95 0.99 * 0.89 * 0.96 § 0.99 * 0.99 0.89 * 0.91 *
MS100 0.87* 0.99^ 0.98* 0.84* 0.99* 0.99* 0.99 0.88* 0.94 *
Table I1I.8 Coefficients of determination (R') between the three behavioural indices and paternities in each harem. Sample size (number of males) for each harem is in brackets. Probabilities were tested using the program R2 (Steiger and Fouladi 1992): * P< 0.00004, ^ 0.0006 <P< 0.00015, P = 0.004. For SF97, the sample size was too small to calculate the significance of the relationships
• ASS_E: the father was the male associated with the female for the longest period
during her oestrus (data from daily records on the female combined with the estimate
of oestrus from date of birth as in Galimberti and Boitani 1999);
• INT: the father was the male with the highest number of interactions with the
female (data from standard observation periods);
• CO: the father was the male with the highest number of copulations recorded with
the female (data from standard observation periods);
• FIR CO: the father was the first male seen mating with the female (data from
standard observation periods);
• HjENFI the father was the male with the highest ENFI in the harem (data from
standard observation periods).
72
III. Mating and paternity success
The data from these indices were then compared with the genetic results. To find out which index was a better predictor of paternity, each behavioural/demographic father was compared with the genetic assigned father. To have a general idea of congruence between behavioural and genetic results, a single father (5£'_i^^r//hereafter) for each mother/pup pair was chosen from the behavioural/demographic data. I f the behavioural/demographic fathers were not congruent (i.e. different fathers assigned with different criteria), the male assigned under most criteria was chosen as the behavioural father.
Out of 183 mother/pup pairs for which a genetic father was found, 56%) had a
father assigned with all seven behavioural criteria. The completeness of the
behavioural data was similar in the two seasons (Mann-Whitney: U = 4254, P =
0.484; n/pp5 = 109, n/997 = 74). There was a mean of 5.5 ± 1.4 criteria filled with a
father (minimum number of criteria = 2) and in 10.5% of the cases the criteria were
all congruent (i.e. same father for each criteria). In total, the BE_FATH for each pup
was assigned with a minimum of 50% and a mean of 90.2% (± 15.8%)) of all criteria.
The general congruence between behavioural and genetic data was very high, and a
very large proportion of the paternities assigned to a male with behavioural data was
assigned to the same male with genetic markers. The BEJFATH was the same as the
genetic father 83% of the time in 1996 and 81% in 1997. Considering the
behavioural criteria separately, the male assigned from behavioural data and the
genetic father were the same individual a mean of 69%) to 85%) of the time in each
harem. The data for each year and harem are shown in Table III.9.
To evaluate how well each behavioural/demographic index was approximating
paternity, a regression analysis was run for each index. The genetic paternities that
each male had assigned were used as dependent variable and the paternities assigned
with each behavioural index were used as independent. The proportion of paternity's
variability expressed by the behavioural/demographic indices was always very high,
ranging from a minimum of 88.2%) for H_ENFI and HOLDER to a maximum of
96.7% for .45'-S_E (n = 34, P < 0.000001 in all cases) (Table I I I . 10)
73
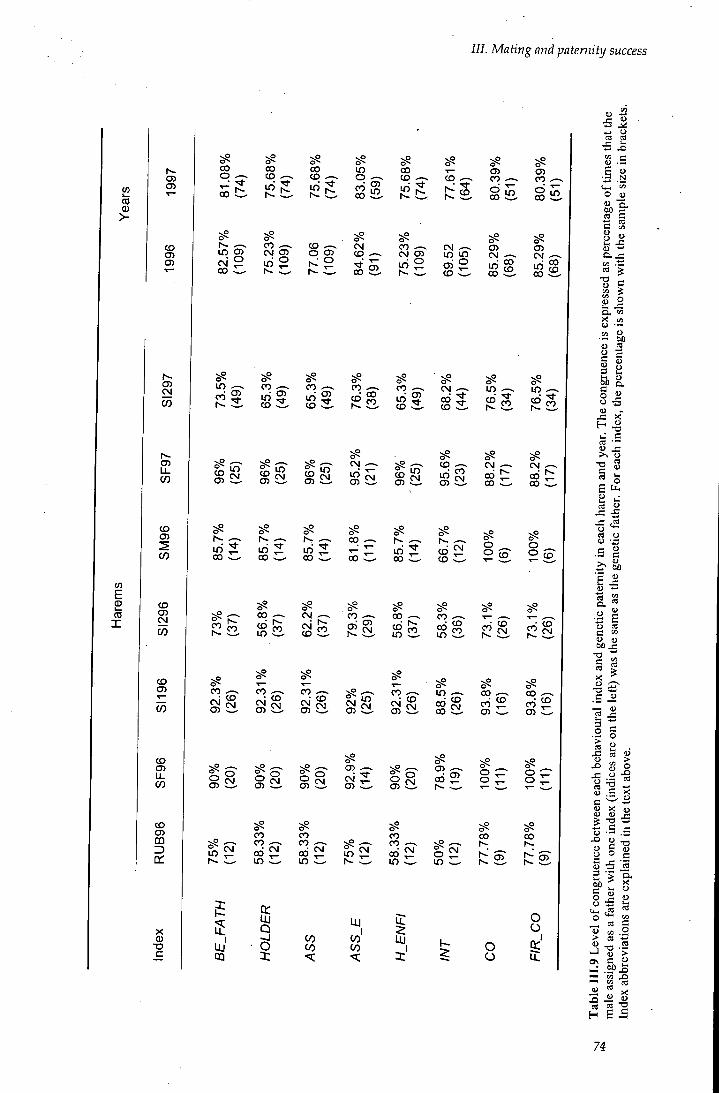
III. Mating and paternity success
CO 0)
>-
O)
CO CJ) O)
00 o
w E
X
CO
O)
CO
CD cn CO
CD CJ) CVI CO
CO
CO
CD O)
CO
CD CJ> m a:
X
o
CO
CO CD
in q>
CO
in
CM O) in °
00 m CD ^ o ^
O C3) CO .—.
00 CD CD
^ CM ^ CM g? in in
O) CO
in CO
in < o CD
vP Oi Oi CM CM in CO
00 CD iri
00 00 CD
m CO C3)
1^
in ? CO C
CO 3
m
CO in CD
CO CD CO
CO o i i Z . d) £i as
in CM in cvj
CM 00 CD
in ^ in
CD CM ,—^ CM in CT>
CO CM_ 00
00 00 00
1^
00 ^
1^ ^ i r i ^ 00
00
CO 00 C CD CO
; CM o _ o s- o
o CD
>5 00 -—. CM CO , — , 00 ^—, CO . . - ^ ^ .. CD m
CO CM CD CO ai >-
O) CM CD
in CO CO
in CD CO CO
1^ CD CM, CO
s-CD CM
CO CM CD
CM
CO ^ CD CM
m
o CM
CM
is
CO ^
CM
CO CO 00 in
CM CO CO CO in
CM
i f
in i}!
co m ,—1 CO ^—^ 00 rvi CJ5
CD CM 00
00 CD CM CO CO CO
CT) CD
CM
CO CO CO in
CM o in
o I I o o
CO CO 1^
05 CD
Q CO CO
co' CO O
O
O O
^ 1 • J O cs ca •S Jo g o
* j .N 'w
O o <a "Q. 60 c 3 8 .
1 1
X u
• - 00 o to ej c u 3 &) C o O - 3 o H . § ca
o - s
s s ^
cs u
.s S tJO
•51 a a C w <U u bO j=
.5 .2
- 2 U
I § g c ^
<U X «J
§ s
o J o
O W3
JJ M .2 J ^ • >
- H W X)
•Si « X
^ I I
74
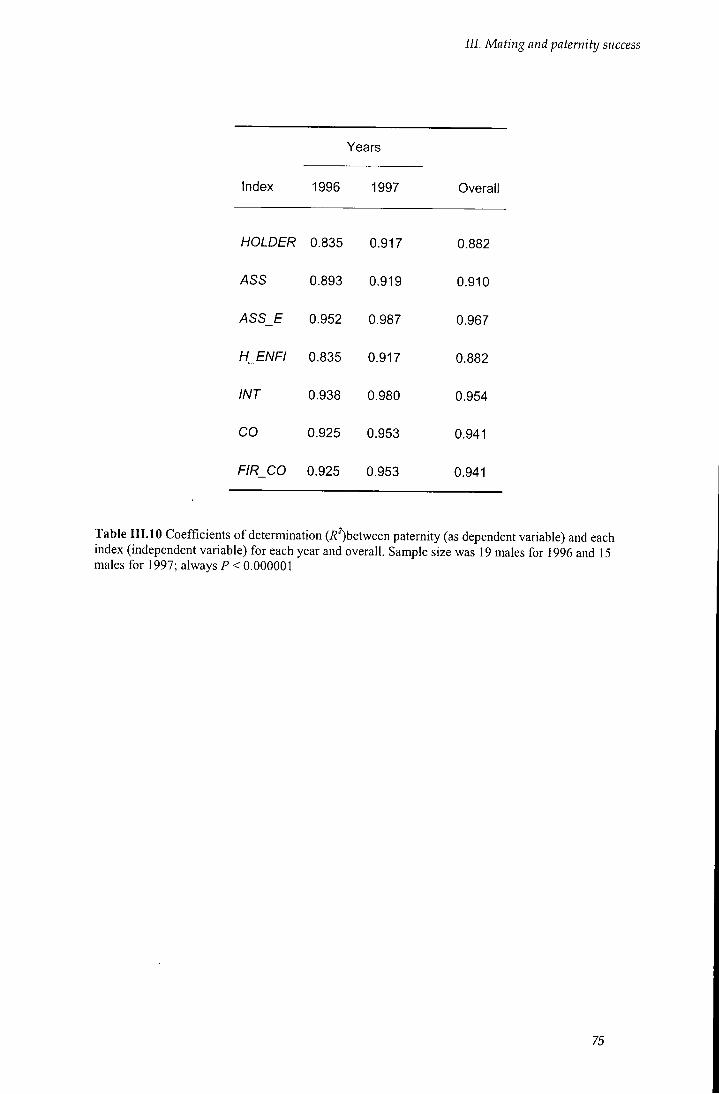
Years
Index 1996 1997
HOLDER 0.835 0.917
ASS 0.893 0.919
ASS_E 0.952 0.987
H ENFI 0.835 0.917
INT
CO
0.938 0.980
0.925 0.953
FIR_CO 0.925 0.953
III. Mating and paternity success
Overall
0.882
0.910
0.967
0.882
0.954
0.941
0.941
Table III.IO Coefficients of determination (i?^)between paternity (as dependent variable) and each index (independent variable) for each year and overall. Sample size was 19 males for 1996 and 15 males for 1997; always P < 0.000001
75
/ / / . Mating and paternity success
IIL4 DISCUSSION
111.4.1 Behavioural estimates of mating distribution in Miroiinga leonina
Behavioural data from the two years indicated a very high degree of polygyny in the
population. The level of mating monopolisation was high, with a large percentage of
breeding males that were not able to copulate or to control any female. Out of more
than a hundred breeding males, only three had more than 60 copulations assigned
and, of these, only one had more than 100 assigned. The mating asymmetry was
striking and it was also present among harem holders, supporting the hypothesis of a
situation with the majority of males achieving either none or low reproductive
success and only a very few showing extraordinary mating performance.
Holding a harem was the most successfiil mating tactic, in accordance with
previous studies on both species ofMirounga (Le Boeuf 1974; McCann 1981). Not
being able to control a female group strongly reduced the possibility for a male to
mate, and among non-harem holders the most rewarding tactic was to be associated
with a breeding unit. Only one tertiary male was recorded mating, while 20%) of the
secondary males achieved at least one copulation.
III. 4.1.1 Breeding performance in the harems
A detailed analysis showed no significant difference in the distribution of the mating
indices among the harems. The distribution asymmetry and the individual variation
in each harem were high, and the holder always achieved the majority of
copulations. For the success of the holder, the competition pressure (due to the
presence of other males around the harem) seemed to be more important than the
'resource value' (i.e. number of females in the harem). In fact, his success was not
correlated with harem size but with the number of associated males. The correlation
between harem size and number of associated males was very weak. This suggests
that capable holders (in control of larger harems) were able to keep other males
distant from their females regardless of harem size. On the other hand, less efficient
holders, not able to deter other males, were pressured by their presence and achieved
lower success than might be expected based on harem size.
76
/ / / . Mating and paternity success
1II.4.2 Paternity assignment
The success of paternity inference was very high. A father was found for 95.3%o of
the pups at 80%) confidence level and, out of these, 82%) were assigned with 95%
confidence (median probability of exclusion 0.997). The results suggest that the level
of polymorphism and the parameters used in the analysis were powerful enough to
discriminate almost the totality of paternities.
The inference success was similar to that reported for red deer with 84 loci
(Slate et al 2000) and much higher than in other paternity analyses of mammal
mating systems (Table I I l . l 1).
111.4.2.1 Paternities not assigned
Three pups did not have any compatible candidate in the pool sampled and for
another six pups it was not possible to assign a father at the chosen 80% confidence
level (see Appendix B). There are several possible explanations for the missing
paternities. First, it is possible that the actual fathers had not been sampled. This is
most likely the case for the three pups with no matching males. For both years, more
than 90%) of males were sampled each season, but it is possible that some males
were missed because they never came to land and that aquatic mating took place.
Aquatic mating seems to play an important role in other species of pirmipeds with
terrestrial mating, for example in the harbour seal (Phoca vitulina: Coltman et al
1998), in the grey seal {Halichoerus grypus: Worthington Wilmer et al. 1999) and in
the Antarctic fur seal {Arctocephalus gazella: Gemmell et al. 2001). In these
analyses, only about 30%) of the patemifies were assigned, and a very large
discrepancy between expected and assigned paternity was reported. Those results
supported evidence that aquatic mating may have a much larger importance than it
had been previously thought. For the three mother-pup pairs in this study, one female
(R4091 - season 1996) was seen mating while she was still nursing her pup and
before her oestrus period had started. She left the harem on the day her oestrus was
estimated to start. As she was still recepdve after leaving the island, it is possible that
a male intercepted her in the water and fertilised her. The second female (V0404D -
year 1996) was seen copulating with the holder of her harem during her oestrus
period, but two mismatches were present between that male and the mother/pup
77

III. Mating and paternity success
s
a:
E 2 O )
o
o
E (U o c 0 )
• D
W W
o o o CM
CO
0 <D 0) o O o c c c (U <u 0 )
T 3 • D •o I*— U— c c c:
o o o o o o
v P d ^
O i n O CO a> 0 0
CO CO CO D
> > > a: tr LU LU m O o o
CO
cn
c o •c 0 }
E <D CL
D 5
CD
T 3 C (0 OQ
CJ>
c
I O
O
O ) cn O )
0 ) c o
r
E 0
0 0
c to
o O
0 0 0 0 o o o o c c c c 0 0 0 0
• D • D T 3 T 3 i ^ * ^ i ^ c c C c
o o o o o o o o v P s P
d ^ d ^ d ^ d -O O O O CO 0 0 0 0 m CO CO CO CO
D > > > > a: a: LU UJ UJ LU o O o o
o o CM
0 E E 0 O
D.
LU
0 E
c o
< a. LU
•a c
ca E
-a
o ctf o .
"a o o
.£3
T 3 O C tlO
CO a.
T5 0 to 3
O o
CD «
2 o
E C3)
8 0
(D CO O k_
o E
0 0
c 0 2 Q .
CO I
CM
0 cn
< Q
o o
0 fS m 2 o E o
0
l0 "cD 05 O
o £
Ul o 0
o zym
to o c ,9 "(D
CD i n c T 3
! Q c E CD
o O
O O
o o
(D
o E
C D
O o
0 ID 0 ) o o E
0 0
o o
CD
2 o
E
o 0 0
C
a a.
8 a.
c/3
0 0 c la E ca £
•a 0 c O )
' to 05 03
"5 CL
05 92 o 0 Q .
CO
CM~ <35 T— CM
C D
>s d ^ d ^ CO d ^ CM Lfi 0 0 0 5 C D
J2 (D 0 O)
^ 2 CD . £ ^ c C L O 0 0
§ 8
0 3 _ o 5
CO S .
0 0 •o •o 0
01
to
s 0
i 0
o
5 0 0 C D
-c
t 1_ 0 0 M
'° I 0 Q
i n CD CO
CD
CO
ad
o..—.
05 CD
>>. to
CO !=i
CO i n
0 CO 0 .2 £ O) CD
CO i d
in m h~ 0 0 CM •<-CM ~—' ' ' "—' -sP d ^ d ^ d ^ CD 0 0 CO •<-
tD
0 3
3 <c o o J D O
I S
0 N <D
I D 0 CO 05 . 3 t; to
-s .y §• 2 s CD
CO CO CM
i n CO
I 05
i
Si
to 0 05
CB
E
o c
e « T 3
< -. ta
o cj
o o ^1 — 13 a> o 3 -3 « 2 H E
78
III. Mating and paternity success
genotypes, so the paternity was not assigned. For the third female (V2462D - year 1997), no data on mating behaviour were available, since she was a very difficult female to observe. She was always in the very centre of the harem (likely trying to avoid any contact with the holder) and no interactions between her and either the holder or any other male were recorded throughout the breeding season. Also the year before conceiving the pup she behaved atypically. In fact, in 1995 she was in the harem for only four days and, most important, she left the beaches without giving birth. This would support the hypothesis that aquatic mating can sporadically take place in this species.
A second possible explanation for the missing paternities could be a lower
efficiency in fertilisation by particular males. Of the three females above, two were
seen copulating with the same male (SILVIO). From his appearance and behaviour,
this male was estimated to be extremely old, and in some species sperm efficiency
declines with age. Unfortunately, data on elephant seal (or other pinniped species)
sperm are not available, because of their mating behaviour and the difficuUies in
manipulating the animals make them very difficult to obtain.
A third possibility is that more loci are needed to better discriminate some of
the paternities. Mutation and null alleles could be present and should be considered
in paternity inference (Marshall et al. 1988). From the total number of loci screened
in this analysis, it was chosen to allow only one mismatch. Screening more loci and
allowing the presence of mutations or null alleles at more than one locus would
likely improve the resuhs of the analysis (Slate et al 2000). This would also possibly
solve the six cases where a father was assigned only at lower confidence (78-79%)).
It was decided not to accept these paternities as true in order to have consistent
genetic results to analyse and compare with behavioural data. However, for all six
paternities, the behavioural father was assigned without mismatches and was either
the most or the second most likely genetic father (A between the first and the second
father within 1%) of the mean critical A value). It is very likely that for these
paternities the analysis was not powerfiil enough to discriminate a father among
candidates with similar genotypes.
79
/ / / . Mating and paternity success
II1.4.3 Paternity and polygyny
The genetic data confirmed the behavioural results that the distribution of paternities
was very asymmetric in the population, with the majority of males having no or one
paternity assigned. The inter-individual variation was high, and there were only very
few males with more than 20 of paternities assigned. The variance in paternity
success in the population was very similar to the variance estimated with behavioural
indices, and gave an opportunity of selection of 4.04, which denotes an elevated
level of polygny (Boness et al 1993). A significant correlation was present between
the reproducfive success and the period a male stayed on land, but the tenure length
explained only a small proportion of it.
III. 4.3.1 Paternity success in the harems
The paternities were very unevenly distributed within harems. There was variation in
the paternity distributions among the breeding units, but it was not significantly
different. In each harem the holder was assigned the highest proportion of patemities
(median 86%), maximum 96%)). As for the behavioural estimates, his paternity
success was not related to the harem size and efficient holders were able to control
large numbers of females. In contrast, the holder success was related to the number
of holder transitions, which can be considered as an index of harem stability. Some
harems go through splitting, joining and taking-overs, and these factors can strongly
influence the holder's success. The opportunity of selection differed among harems
(from 2.68 to 11.27), showing that the level of polygyny can vary locally, and in
some harems reached a value three or four-fold greater than the smallest value.
Comparison with other Mirounga populations
The proportions of patemities achieved by the holders at SLI were higher than those
reported for the population of Punta Delgada on Peninsula Valdes, Argentina
(Hoelzel et al. 1999). In five harems at DEL (harem size: 30-119; total patemities
per harem: 5-19; males tested per harem: 2-8) the holders achieved 50%) (n = 6) to
10% (n = 10) of the patemities in each harem (overall mean = 58%)) (Hoelzel et al.
1999). The range in harem size was similar to the range analysed on SLI (18-91
females; total patemities per harem: 12-49) and, from the comparison of these two
SO
III. Mating and paternity success
Studies, the strategies adopted by non-holder males seem to be more rewarding in the population of DEL than in the population of SLI. Different factors can influence the paternity patterns within harems. The holder's capacity for controlling a harem and keeping the other males distant, and the social and topographic environments are all fundamental aspects that can affect the likelihood of mating monopolisation among males.
The physical and behavioural resource holding potential {RHP) of a holder (i.e.
body size, dominance rank and fighting experience) strongly influences his capacity
for controlling females (Haley et al. 1994; Modig 1996). Moreover, the variation in
RHP between the holder and other males defines the likelihood that a holder can
dominate over other males and therefore monopolise the mating context in the
harem. Differences in size between holder and non-holder males were greater in the
SLI population during the seasons from 1995 to 1998 than in the population of DEL
during the 1993 and 1994 seasons (Fabiani 1996; Galimberti and Fabiani
unpublished data). As a likely consequence, on SLI harems had a significantly lower
number of associated males than on Punta Delgada (median = 0.212 vs 0.692 -
Galimberti et al. 2000a), and non-holder males achieved 22% vs 41% of the
paternities (n paternities =183 for SLI and n = 50 for Delgada). Hence, holders at
Sea Lion Island more efficiently manage the reproductive context, effectively keep
the other males far away from the harems and achieve a significant higher
reproductive success (Fisher exact test: Phi = 0.205, df= \,P = 0.0059).
The topographic environment was also different between the two analysed
colonies of southern elephant seals. Although the density of females is higher on SLI
than on DEL (111 vs 62 female/km^ - see Galimberti and Boitani 1999; Baldi et al.
1996), the tidal range differs between the two colonies. At DEL the tidal range is
very large, during low tides the beaches become much deeper and departing females
have to cover much longer distances to reach the sea. This is not the case at SLI,
where the tidal range is small and the distance between a harem and the sea is, on the
whole, short. As a consequence, a smaller percentage of female departures are
intercepted on SLI, departure events are shorter and less frequently involve
interaction with secondary males (Galimberti et al. 2000a). Hence, it is possible that
this is one of the environmental factors that influence the potential for polygyny in
81
/ / / . Mating and paternity success
the population, and that females intercepted during departure are effectively fertilised by secondary males. However, no genetic data are so far available to support and quantify the hypothesis that males copulating with departing females successfully inseminate the females.
In northern elephant seals (NES) harem holders report a mean low success
despite dominating mating. In seven harems of 32-224 females (total paternities per
harem: 7-18; number of males per harem: 3-15), the proportion of paternities
achieved by each holder ranged from 26.7% (n = 15) to 80% (n = 10) (Hoelzel et al.
1999). In the study of Hoelzel et al. (1999) SES holders were in general more
successful than NES holders. The authors suggested that success lower than
expected could be in part due to the recent bottleneck that the NES have recently
gone through. However they also suggested that different behaviours adopted by
either males or females at the two locations and topographical features could account
for the higher success in the southern species. Females at NES harems mate more
frequently and with more males than females in SES harems. Similarly, the number
of secondary males encountered by departing females may be greater for the
northern species.
Northern and southern elephant seals have a very similar mating system;
nevertheless differences are present both between the two species and between the
two SES populations. In both species, only a few males monopolise seasonal
matings; however, the range of monopolisation varies among populations, and the
pattern of male success are influenced by phenotypic, behavioural and environmental
factors. In this context, the northern species seems to represent the lower end of the
variation in polygyny level recorded in the genus Mirounga. On the contrary,
populations of southern elephant seals show higher levels of polygyny, with the seals
of SLI exhibiting a level of polygyny that can be considered as the most extreme in
the range analysed.
82
III. Mating and paternity success
III.4.4 Estimating paternity from behavioural data
III. 4.4.1 Breeding performance
The results showed that the behavioural indices of individual breeding performance
used were all good predictors of relative male reproductive success in the harems,
with coefficient of determination-(i?^) in the range 0.79-0.99. Both the mating
{MS 100 and ENFI) and the female control {FFD) estimates approximated well to the
paternity distribution in each harem, but sometimes the fertilisation and mating
indices worked better than the female control estimate.
III.4.4.2 Behavioural/demographic data
Fathers assigned to each mother/pup pair with behavioural data accurately identified
the true father in each harem. The level of congruence was always high, the two
fathers being the same a minimum 58.3% of the time (as HOLDER) and a maximum
of 100% (FIR CO). The effectiveness of the behavioural indices measured with
coefficient of determinations was high for all the indices (from 0.88 to 0.99). The
most effective were those that were less easy to collect, because related to the history
of each female and not to the history of each breeding unit. Therefore, the indices
FIR CO or ASS_E gave better predictions than the index HOLDER, and for the first
two it is necessary to follow each female during the breeding season (i.e. the data are
from observation periods), while for the third one it is enough to record the harem
holder during population censuses. Nevertheless, recording the holder of each harem
very well approximated the paternity success variance in the population {R^ = 0.88).
Further more, it was as effective as identifying the male with the highest ENFI in the
harem, which requires much more laborious data collection.
///. 4.4.3 Discrepancy between behaviour and genetics
The behavioural/demographic indices did not completely describe the paternity
distribution in the population, as each one failed to explain a small part of the
assigned paternities. This could indicate that different strategies were adopted by
either the males or the females in the population, or that genetic inference should
have been more powerful. Often, non-holder males are very close to the harems,
always trying to get matings with the females. Sometimes, a harem holder during
83
/ / / . Mating and paternity success
season, the correspondence HOLDER vs genetics would increase from 75 to 80% and FIR CO vs genetics from 85 to 93%). I f the second fathers were chosen for those paternities, the holder success would also increase and the paternity distribution in the harems would be more congruent with each harem's history. For RUB96, the success of the holder would change from 58% to 78%. Two of the paternities not assigned to the seasonal holder would be to the holder of the neighbour harem. This male was dominant to the RUB96's holder, the two harems were very close and he was seen moving to RUB96 and mating with females in the group. For SI296, the percentage of paternities assigned to the seasonal holder would increase from 57% to 65%). This harem was less stable than the others, and during the breeding season it experienced 10 holder transitions. The seasonal holder held the harem for only 55% of the 57 days that the harem lasted. Two other males held the harem for 22 days in total and achieved copulations with the females in the group. I f the 24 paternities assigned to the seasonal holder were added to the 10 assigned to the other two holders, they would represent 92% of the total paternities in the harem. For SI297, the holder success would increase fi"om 65%) to 69%). Also in this case, the small increase would be congruent with the history of this harem. It was a large group and it split into two smaller harems with two different holders (one being the holder of the initial big harem). Sixty percent of the paternities not assigned to the seasonal holder of SI297 were assigned to the holder of the newly-formed harem. Hence, taking into account the paternities of both males, they would represent 87% of the total paternities in the harem. Finally, for the harem SF96, i f the second most likely father was chosen for the paternity assigned by CERVUS with one mismatch (pup V3602I - see Appendix B), the holder would be assigned all but one paternity in his harem and his success would increase from 90%) to 95%. This male was very successfiil in keeping other males distant (max daily number of associated males = 2, see Table III.3) and controlling the females of his harem. Hence, his elevated relative reproductive success would reflect his performance during the breeding season.
These results strongly support the hypothesis that each harem represents an
almost independent breeding unit, defined by its social-demographic context. This is
characterised by the number of females, the number and personality of peripheral
85

/ / / . Mating and paternity success
and holder males and it strongly influences the distribution of paternities within the breeding group.
86
IV. Patterns of relatedness within the colony
I V . l INTRODUCTION
In classical models of population genetic structure, individuals mate randomly within
and between sub-populations. However, in some species, individuals associate in
groups within which mating and social behaviours may produce non-random mating
patterns within and between groups. In this context, social structuring may provide
an additional hierarchical level at which genetic variation may be maintained and
within which behaviours may minimise inbreeding (Sugg et al. 1996).
In many species, the identity, social status and relatedness of individuals can
play an important role in determining the outcome of behavioural interactions, which
often have reproductive consequences. The interaction of social, ecological and
demographic factors determines the reproductive opportunity available to an animal
and hence the strategies that an animal can pursue and their relative efficiencies
(Dunbar 1984). The importance of this socio-ecological context is most evident and
widely studied in species that form permanent or semi-permanent groups and long-
term relationships (e.g. in Lycaon pictus: Girman et al. 1997; Macaca fascicularis:
De Ruiter and Geffen 1998; Microcebus murinus: Radespiel et al. 2001).
Nevertheless, social context is also likely to be important for species that form short-
term aggregations (Pomeroy et al. 2001; Burland et al. 2001). For example, breeding
success can be influenced by the time an individual arrives at the breeding site and
the time it leaves it. Breeding success can also be affected by the individual's
position within a breeding group and, further, by the other individuals forming the
aggregation.
Female harassment by males in pinnipeds is common (McCann 1981;
Campagna et al. 1998; Le Boeuf and Mesnick 1990a,b; Boness et al 1995). Intense
harassment can reduce maternal performance and female reproductive success (Le
Boeuf and Mesnick 1990a; Boness et al. 1995). One female strategy of harassment
defence is the synchronisation of breeding (i.e. clustering of females during
reproduction), so that females that breed at the same time and in the same place can
benefit from the dilution effect of the presence of other females. Land breeding
87
IV. Patterns of relatedness
polygynous pinnipeds have concentrated breeding seasons (Riedman 1990, Boyd 1991) and females that breed out of the breeding peak (the central phase of the breeding season) are exposed to higher levels of harassment (Boness et al. 1995, Galimberti et al. 2000a) and can, as a consequence, show lower breeding success. In these circumstances, the breeding timing for a female is likely to influence her breeding performance and hence her reproductive success.
IV.1.2 Philopatry and site fidelity
Social organization of a species can result in non-random matings when one, or both,
sex exhibits strong philopatry (i.e. returns to the natal colony to breed) (Chesser
1991a). In many mammals, females are the philopatric sex and males tend to
disperse for breeding (Greenwood 1980). Female philopatry and site fidelity (i.e.
return to the same breeding colony in consecutive seasons) can result in high
relatedness between female members of a social group, and high relatedness may in
turn lead to a greater co-operation between group members. At the same time,
female philopatry coupled with male dispersal can result in differing degrees of
genetic relatedness within and between sexes (Surridge et al. 1999).
Southern elephant seal females become sexually mature at 3-4 years of age and
may have a reproductive lifespan of 21 years (Hindell and Littie 1998). Males reach
social reproductive maturity not before 9-10 years old and live on average up to 16
years (McCann 1985), with a documented maximum of 21 years (Ambom et al.
1992). I f a high level of philopatry is present in elephant seals, an overlap of
generations would be likely to happen. In this case, depending on the degree of
spatial and temporal synchronisation, female philopatry and site fidelity would result
in the presence of related mothers at the breeding site or within the breeding groups
(harems). At the same time, site fidelity of males, together with their longevity and
potential breeding life span, would lead to the possibility of repeated matings with
either the same or related partners.
Mark-recapture studies have reported site fidelity in both female and male
elephant seals, with males tending to disperse more than females (see Discussion in
Chapter V). On Sea Lion Island, females exhibit a high level of site fidelity (Fabiani
et al. in prep.). Furthermore, they display within-colony site fidelity, returning to the
IV. Patterns of relatedness
same part of the colony during consecutive seasons. From 1996 to 1999, out of 646 females that returned to the island for two to four breeding seasons, 72% (464) returned to the same breeding zone of the colony each year, and a mean of 37% (236) to the same breeding area (see Chapter I I for zone and area definitions). In contrast, males showed a more flexible strategy in choosing the breeding site, coming back to the same colony but less frequently to the same zone or area within it. In this case, of 84 males, 62% came back each season to the same zone of the island, and only 29% to the same area.
IV.1.2 Female and male movements within the colony of SLI
Females on SLI may change harem between arrival and parturition, but no females
have ever been recorded moving between harems after giving birth. The only
exception can be isolated females that, after giving birth in unsuitable places,
normally move to reach the closest harem and remain there for the rest of their
breeding season (Galimberti et al. 2000a). On the other hand, males may either
frequent a particular area of the colony or move among different harems and zones
during the breeding season (see map of the breeding colony in Fig II.2). Individual
movements within the colony could to a certain degree be affected by the relatedness
patterns among seals on the island. I f this was the case, the level of relatedness could
influence the way in which the colony develop and therefore could also have effect
on the individual reproductive success (i.e. through seal distribution and mating
opportunities).
IV.1.3 Aims
In this chapter the level of genetic relatedness among the seals in the colony was
assessed:
a) the accuracy of the relatedness estimate was determined by analysing pairs
whose relationship was known. For this analysis, both seals from Sea Lion Island
and Elephant Island were considered;
89
IV. Patterns of relatedness
b) kinship was assessed among seals of SLI to investigate whether levels of genetic relatedness within-colony reflected site fidelity and philopatry previously identified for this species;
c) relatedness was considered among different status-categories of males
(holders and secondary males) to see i f any pattern of relatedness was present among
males of different status.
IV.2 R E S U L T S
IV,2.1 Relatedness estimates from known relationships
To assess the accuracy of Queller-Goodnight R values in estimating relatedness
between individuals of unknown relationship, average R values for pairs of known
relatedness were calculated. As a sample of unrelated individuals (R = 0), adult seals
from SLI (n = 263) were compared with seals belonging to the EI colony (n = 46).
Mother-offspring pairs (n = 192) were identified fi-om behavioural data (and
confirmed by parentage analysis), while father-offspring pairs (n = 186) were
identified based on the parentage analyses (see Chapter III). Both sets of pairs were
predicted to show relatedness values of 0.5. Maternal half-siblings (R expected value
= 0.25) were available from 30 females that bred both years in the study harems.
Paternal half-sibling pairs were identified for each harem in both years (from 8 to 35
half-sibs in each harem), for a total of 1647 pairwise comparisons. Values of
relatedness for mother-offspring dyads did not differ fi-om those from father-
offspring so they were pooled together. The same procedure was followed for the
half-sibling dyads (Mann-Whitney: U> 20000, P > 0.9 both cases). Parental-
offspring pairs with a predicted relatedness of 0.5 (n dyads = 378) had a mean R
value of 0.52 ± 0.14 (SE = 0.007; 95% CI = 0.51, 0.54), while the mean R value for
half-sibling pairs (expected value: 0.25) was 0.34 ± 0.2 (SE = 0.005, 95% CI = 0.33,
0.35, n dyads = 1677). The mean relatedness for known unrelated individuals
(expected value: 0.0) was 0.004 ± 0.22 (SE = 0.002, 95% CI = 0.0002, 0.007, n
dyads = 13088). The three distributions strongly differentiated among each other (for
each pairwise comparison: Mann-Whitney: U>4S500, P < 0.0001).
90
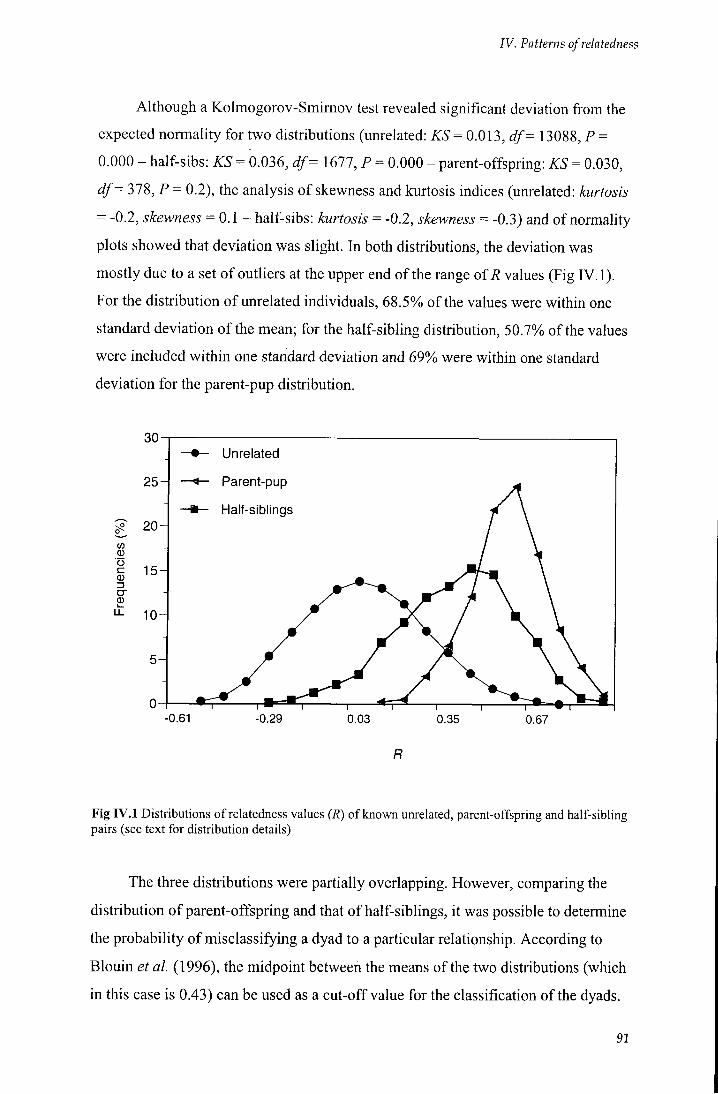
IV. Patterns of relatedness
Although a Kolmogorov-Smimov test revealed significant deviation from the expected normality for two distributions (unrelated: KS = 0.013, df = 13088, P = 0.000 - half-sibs: KS = 0.036, df= 1677, P = 0.000 - parent-offspring: KS = 0.030, df = 378, P = 0.2), the analysis of skewness and kurtosis indices (unrelated: kurtosis = -0.2, skewness = 0.1 - half-sibs: kurtosis = -0.2, ske^mess = -0.3) and of normality plots showed that deviation was slight. In both distributions, the deviation was mostly due to a set of outliers at the upper end of the range of R values (Fig IV. 1). For the distribution of unrelated individuals, 68.5% of the values were within one standard deviation of the mean; for the half-sibling distribution, 50.7% of the values were included within one standard deviation and 69% were within one standard deviation for the parent-pup distribution.
30
V)
0)
0)
25-
20-
Unrelated
Parent-pup
Half-siblings
0.03 0.35 0.67
R
Fig I V . l Distributions of relatedness values (R) of known unrelated, parent-offspring and half-sibling pairs (see text for distribution details)
The three distributions were partially overlapping. However, comparing the
distribution of parent-offspring and that of half-siblings, it was possible to determine
the probability of misclassifying a dyad to a particular relationship. According to
Blouin et al. (1996), the midpoint between the means of the two distributions (which
in this case is 0.43) can be used as a cut-off value for the classification of the dyads.
91
IV. Patterns of relatedness
A dyad with R < 0.43 would be included in the distribution of half-siblings, whereas a dyad with R > 0.43 would belong to the ftiU-sibling distribution. The percentage of the randomly generated half-sibs that fall to the right of the cut-off value would represent the type I error rate, while the percentage of parent-offspring that fall to the left of the cut-off value would be the type I I error rate. In this case, an expected percentage of 34% parent-offspring or full sib pairs would be misclassified as half-sibs, while 22%) of half-sib dyads would be classified as fiill sibs or parent-offspring. The overlapping region between these two distributions and that of unrelated individuals was smaller. The cut-off point between unrelated and half-sib relatedness distributions was 0.17, with an expected 18%o of half-sibs classified as unrelated and 22%) of unrelated seals classified as half-sibs. For the unrelated and parent-offspring distributions, 3.7%) of parent-offspring dyads would be misclassified as unrelated and 1 P/o of unrelated individuals would be classified as having a level of relatedness of 0.5 (cut-off point between the two distribution 0.26). Although the distributions were not completely separated, the data should not negate their use to deduce related dyads from not-related dyads in the population with an acceptable level of confidence (see De Ruiter and Geffen 1998; Kays et al. 2000; Lucchini et al. 2002).
IV.2.2 Kinship assessment in the population
The mean R value for all sampled seals of SLI was 0.077 (± 0.232, n dyads = 18528)
in 1996 and 0.074 (± 0.233, n dyads = 9453) in 1997. There was no difference
between the two years (Mann-Whitney: U = 88204516, P > 0.3). However, when
males and females were considered separately, relatedness was slightly different
between the two years both for males (Mann-Whitney: U= 2878272, P = 0.005) and
females (Mann-Whitney: U= 9871980, P = 0.022).
Each season, the mean relatedness level among females was higher than mean
relatedness level among males. However, the difference was significant in 1996
(Mann-Whitney: U= 10867933, P < 0.0001) but not in 1997 (Mann-Whitney: U =
2751021, P > 0.1). Males were more related to females than among each other, but,
as above, the difference was only significant in 1996 (1996: Mann-Whitney: U =
14228197, P < 0.0001 - 1997: Mann-Whitney: i7 = 4311455, P = 0.841). Details of
92
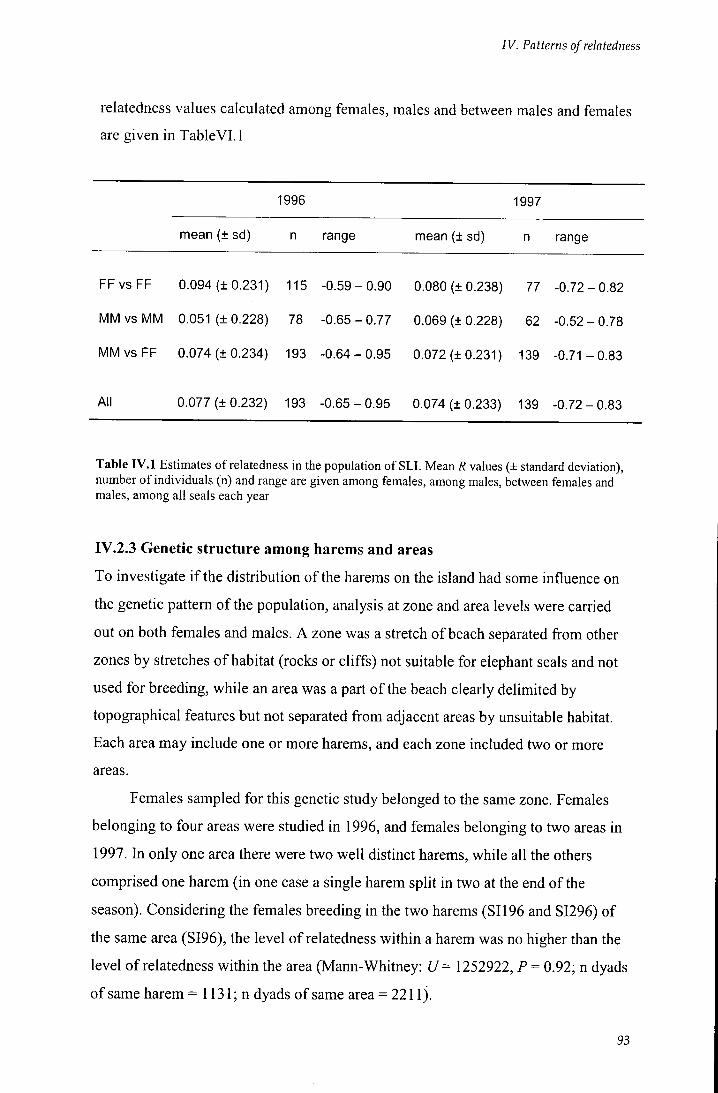
IV. Patterns of relatedness
relatedness values calculated among females, males and between males and females are given in TableVI. 1
1996 1997
mean (± sd) n range mean (± sd) n range
FF vs FF 0.094 (± 0.231) 115 -0.59 - 0.90 0.080 (± 0.238) 77 -0.72 - 0.82
MM vs MM 0.051 (± 0.228) 78 -0.65 - 0.77 0.069 (± 0.228) 62 -0.52 - 0.78
MM vs FF 0.074 (± 0.234) 193 -0.64 - 0.95 0.072 (± 0.231) 139 -0.71 - 0.83
All 0.077 (± 0.232) 193 -0.65 - 0.95 0.074 (± 0.233) 139 -0.72 - 0.83
Table I V . l Estimates of relatedness in the population of SLI. Mean R values (± standard deviation), number of individuals (n) and range are given among females, among males, between females and males, among all seals each year
IV.2.3 Genetic structure among harems and areas
To investigate i f the distribution of the harems on the island had some influence on
the genetic pattern of the population, analysis at zone and area levels were carried
out on both females and males. A zone was a stretch of beach separated from other
zones by stretches of habitat (rocks or cliffs) not suitable for elephant seals and not
used for breeding, while an area was a part of the beach clearly delimited by
topographical features but not separated from adjacent areas by unsuitable habitat.
Each area may include one or more harems, and each zone included two or more
areas.
Females sampled for this genetic study belonged to the same zone. Females
belonging to four areas were studied in 1996, and females belonging to two areas in
1997. In only one area there were two well distinct harems, while all the others
comprised one harem (in one case a single harem split in two at the end of the
season). Considering the females breeding in the two harems (SI196 and SI296) of
the same area (SI96), the level of relatedness within a harem was no higher than the
level of relatedness within the area (Mann-Whitney: U = 1252922, P = 0.92; n dyads
of same harem = 1131; n dyads of same area = 2211).
93
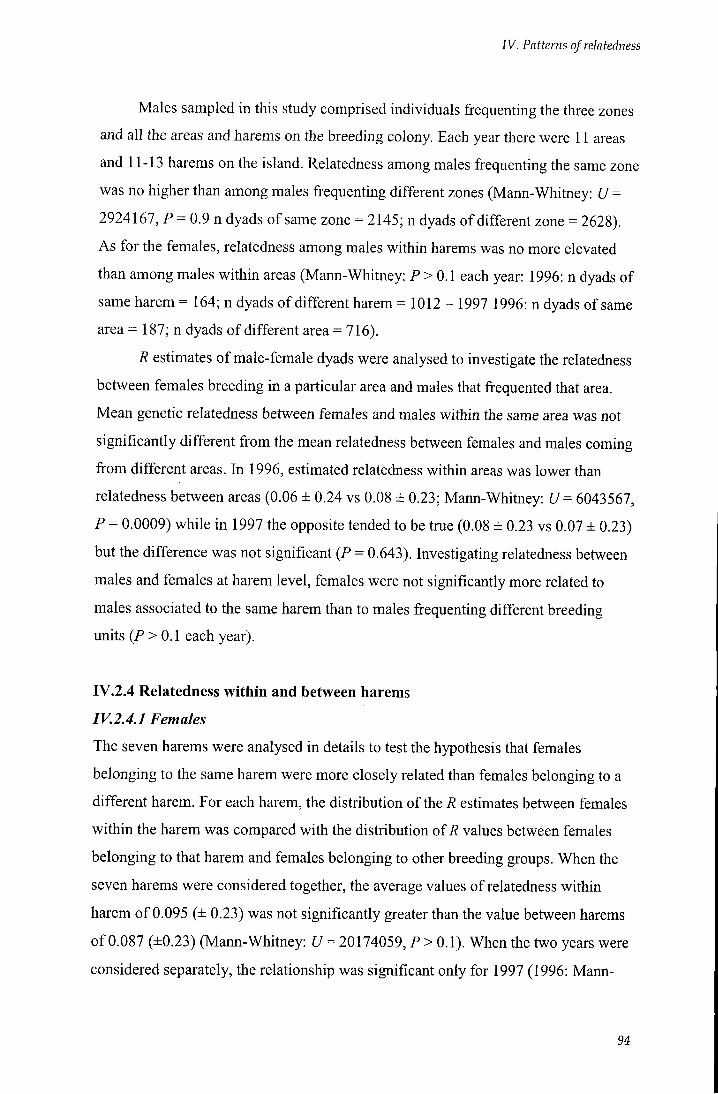
IV. Patterns of relatedness
Males sampled in this study comprised individuals frequenting the three zones and all the areas and harems on the breeding colony. Each year there were 11 areas and 11-13 harems on the island. Relatedness among males frequenting the same zone was no higher than among males frequenting different zones (Mann-Whitney: U = 2924167, P = 0.9 n dyads of same zone = 2145; n dyads of different zone = 2628). As for the females, relatedness among males within harems was no more elevated than among males within areas (Mann-Whitney: P>0.1 each year: 1996: n dyads of same harem = 164; n dyads of different harem = 1012 - 1997 1996: n dyads of same area = 187; n dyads of different area = 716).
R estimates of male-female dyads were analysed to investigate the relatedness
between females breeding in a particular area and males that frequented that area.
Mean genetic relatedness between females and males within the same area was not
significantly different from the mean relatedness between females and males coming
from different areas. In 1996, estimated relatedness within areas was lower than
relatedness between areas (0.06 ± 0.24 vs 0.08 ± 0.23; Mann-Whitney: U = 6043567,
P = 0.0009) while in 1997 the opposite tended to be true (0.08 ± 0.23 vs 0.07 ± 0.23)
but the difference was not significant (P = 0.643). Investigating relatedness between
males and females at harem level, females were not significantly more related to
males associated to the same harem than to males frequenting different breeding
units (P > 0.1 each year).
IV.2.4 Relatedness within and between harems
IV.2.4.1 Females
The seven harems were analysed in details to test the hypothesis that females
belonging to the same harem were more closely related than females belonging to a
different harem. For each harem, the distribution of the R estimates between females
within the harem was compared with the distribution of R values between females
belonging to that harem and females belonging to other breeding groups. When the
seven harems were considered together, the average values of relatedness within
harem of 0.095 (± 0.23) was not significantly greater than the value between harems
of 0.087 (±0.23) (Mann-Whitney: (7= 20174059, P > 0.1). When the two years were
considered separately, the relationship was significant only for 1997 (1996: Mann-
94
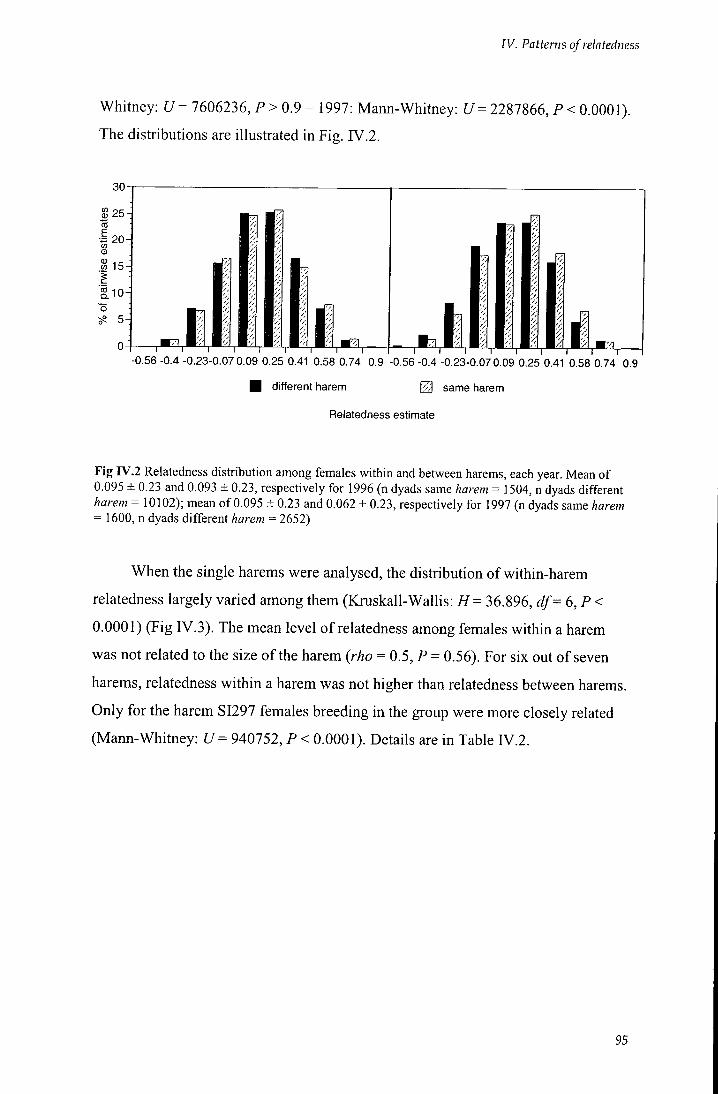
IV. Patterns of relatedness
Whitney: t / = 7606236,/'> 0.9 - 1997: Mann-Whitney: f / = 2287866, P < 0.0001). The distributions are illustrated in Fig. IV.2.
30
$ 2 5
• I -Sl5-
Q . l U -
o S? 5-
I 1 1 I ^ 1 1 ^ 1 1 I 1 -] \ - ] — — r 0.56 -0.4 -0.23-0.07 0.09 0.25 0.41 0.58 0.74 0.9 -0.56 -0.4 -0.23-0.07 0.09 0.25 0.41 0.58 0.74 0.9
• different harem same harem
Relatedness estimate
Fig IV.2 Relatedness distribution among females within and between harems, each year. Mean of 0.095 ± 0.23 and 0.093 ± 0.23, respectively for 1996 (n dyads same harem = 1504, n dyads different harem = 10102); mean of 0.095 ± 0.23 and 0.062 ± 0.23, respectively for 1997 (n dyads same harem = 1600, n dyads different harem = 2652)
When the single harems were analysed, the distribution of within-harem
relatedness largely varied among them (Kruskall-Wallis: / / = 36.896, df'^6,P<
0.0001) (Fig IV.3). The mean level of relatedness among females within a harem
was not related to the size of the harem {rho = 0.5, P = 0.56). For six out of seven
harems, relatedness within a harem was not higher than relatedness between harems.
Only for the harem SI297 females breeding in the group were more closely related
(Mann-Whitney: U= 940752, P < 0.0001). Details are in Table IV.2.
95
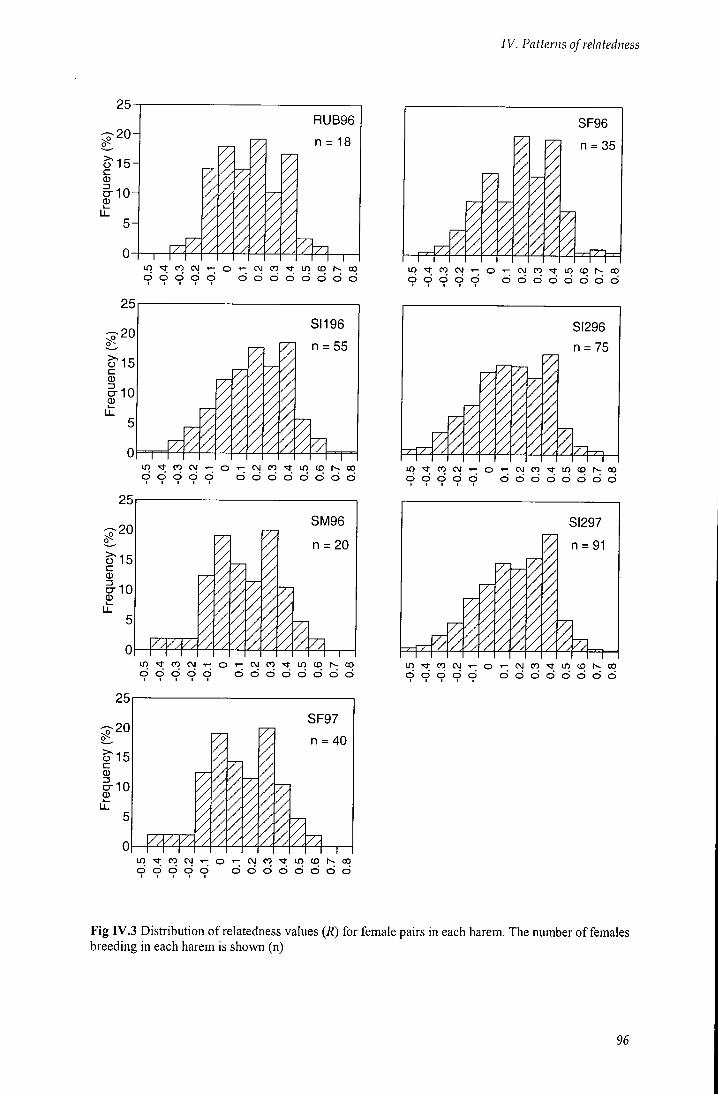
IV. Patterns of relatedness
RUB96
n = 18
I I I I I I I—1—I—1—I—I—r L n - 5 t C 0 C M - . - ; O - ' - ; C \ J < r 3 ' ^ i n C D r - . 0 0 o o o o o o o o o o o o o
n = 35
o d d o o d d d d d d d d
SI196
n = 55 n=:75
d d d d d d d d d d d d d i r t ' ^ c o c M i - O ' - c v i c o ' ^ t n c o i ^ c o d d d d d d d d d d d d d
SM96
n = 20
iq <ri <si -r- o -r- oj n IT) (D m d d d d d d d d d d d d d
SI297
M n = 91
d d d d d d d d d d d d d
n = 40
rt n 1^1 -r- o m in <D 03 d d d d d d d d d d d d d
Fig IV.3 Distribution of relatedness values (R) for female pairs in each harem. The number of females breeding in each harem is shown (n)
96
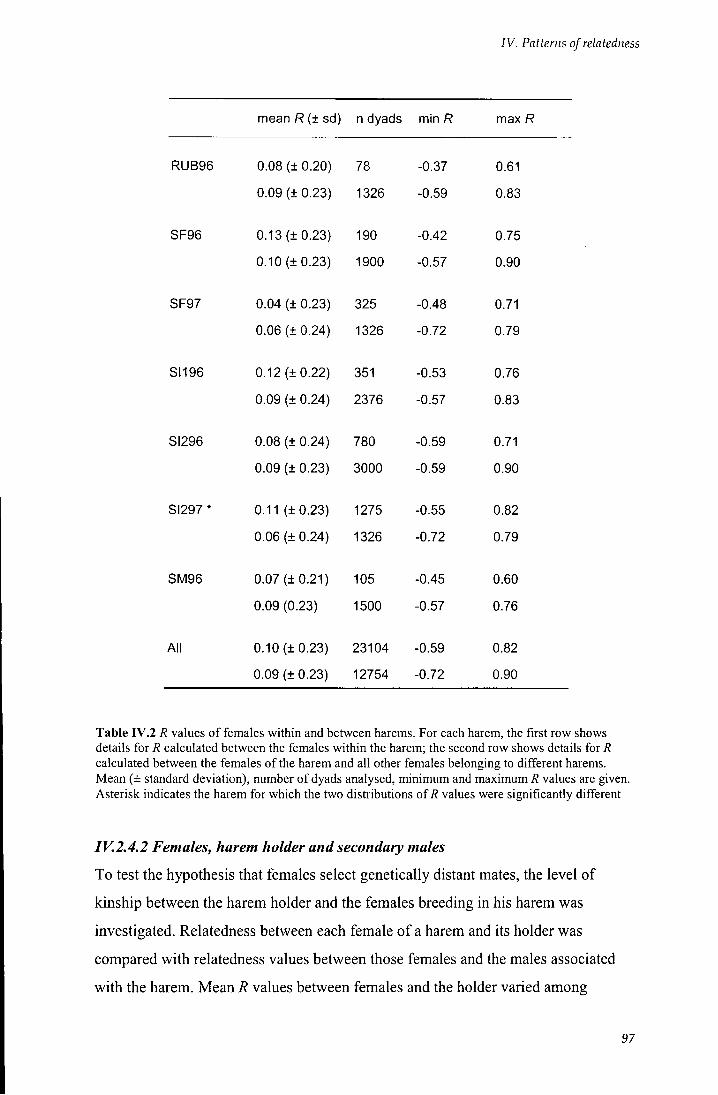
IV. Patterns of relatedness
mean R (± sd) n dyads min R max R
RUB96 0.08 (+ 0.20) 78 -0.37 0.61
0.09 (± 0.23) 1326 -0.59 0.83
SF96 0.13 (±0.23) 190 -0.42 0.75
0.10 (±0.23) 1900 -0.57 0.90
SF97 0.04 (± 0.23) 325 -0.48 0.71
0.06 (± 0.24) 1326 -0.72 0.79
SI196 0.12 (±0.22) 351 -0.53 0.76
0.09 (± 0.24) 2376 -0.57 0.83
SI296 0.08 (± 0.24) 780 -0.59 0.71
0.09 (± 0.23) 3000 -0.59 0.90
SI297 * 0.11 (±0.23) 1275 -0.55 0.82
0.06 (± 0.24) 1326 -0.72 0.79
SM96 0.07 (± 0.21) 105 -0.45 0.60
0.09 (0.23) 1500 -0.57 0.76
All 0.10 (±0.23) 23104 -0.59 0.82
0.09 (± 0.23) 12754 -0.72 0.90
Table IV.2 R values of females within and between harems. For each harem, the first row shows details for R calculated between the females within the harem; the second row shows details for R calculated between the females of the harem and all other females belonging to different harems. Mean (± standard deviation), number of dyads analysed, minimum and maximum R values are given. Asterisk indicates the harem for which the two distributions of R values were significantly different
IV.2.4.2 Females, harem holder and secondary males
To test the hypothesis that females select genetically distant mates, the level of
kinship between the harem holder and the females breeding in his harem was
investigated. Relatedness between each female of a harem and its holder was
compared with relatedness values between those females and the males associated
with the harem. Mean R values between females and the holder varied among
97
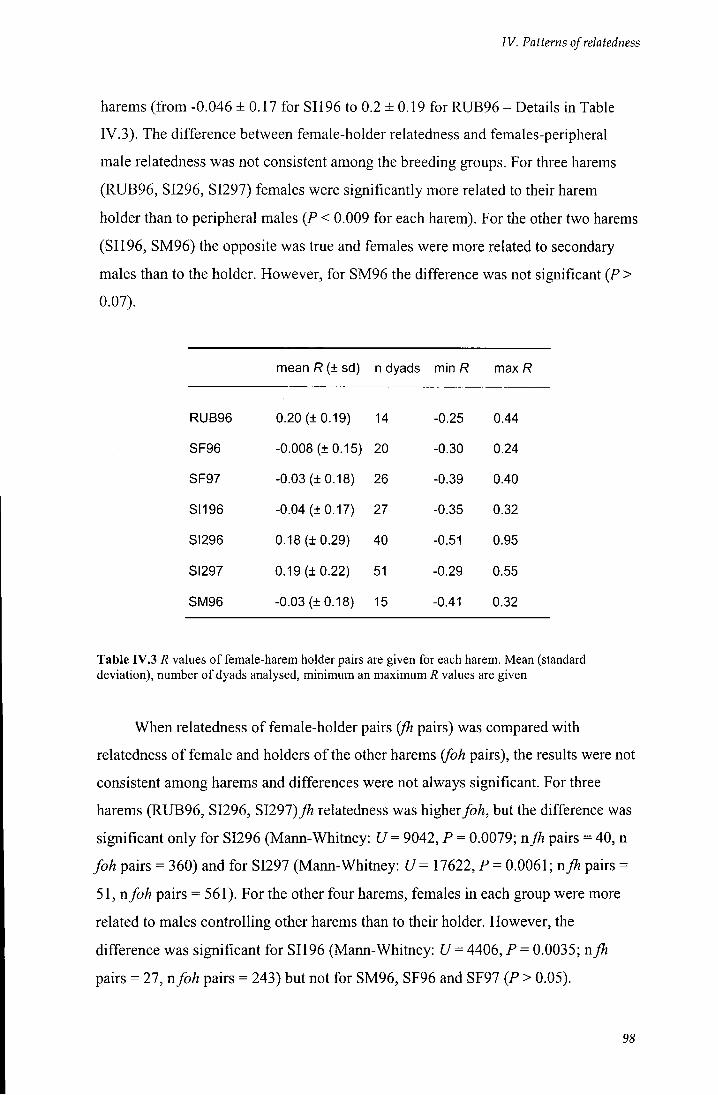
IV. Patterns of relatedness
harems (from -0.046 ±0.17 for SI 196 to 0.2 ±0.19 for RUB96 - Details in Table IV.3). The difference between female-holder relatedness and females-peripheral male relatedness was not consistent among the breeding groups. For three harems (RUB96, SI296, SI297) females were significantly more related to their harem holder than to peripheral males {P < 0.009 for each harem). For the other two harems (SI 196, SM96) the opposite was true and females were more related to secondary males than to the holder. However, for SM96 the difference was not significant (P > 0.07).
mean R (± sd) n dyads min R max R
RUB96 0.20 (±0 .19) 14 -0.25 0.44
SF96 -0.008 (±0.15) 20 -0.30 0.24
SF97 -0.03 (±0.18) 26 -0.39 0.40
SI196 -0.04 (± 0.17) 27 -0.35 0.32
SI296 0.18 (±0 .29) 40 -0.51 0.95
SI297 0.19 (± 0.22) 51 -0.29 0.55
SM96 -0.03 (±0 .18) 15 -0.41 0.32
Table IV.3 R values of female-harem holder pairs are given for each harem. Mean (standard deviation), number of dyads analysed, minimum an maximum R values are given
When relatedness of female-holder pairs {fh pairs) was compared with
relatedness of female and holders of the other harems (foh pairs), the results were not
consistent among harems and differences were not always significant. For three
harems (RUB96, SI296, SI297) jh relatedness was higher foh, but the difference was
significant only for SI296 (Mann-Whitney: U= 9042, P = 0.0079; n fli pairs = 40, n
foh pairs = 360) and for SI297 (Mann-Whitney: f / = 17622, P = 0.0061; n fh pairs =
51, n foh pairs = 561). For the other four harems, females in each group were more
related to males controlling other harems than to their holder. However, the
difference was significant for SI196 (Mann-Whitney: U = 4406, P = 0.0035; n fh
pairs = 27, nfoh pairs = 243) but not for SM96, SF96 and SF97 {P > 0.05).
98
IV. Patterns of relatedness
IV.2.4.3 Holder and peripheral males
Each harem had a principal holder and 1-14 associated males (see Chapter 11 for
definitions and behavioural observations). The hypothesis that males tend to
associate with a harem controlled by genetically related holders (and consequently
that a harem holder allows related males to mate in his harem) was tested. The level
of relatedness between the principal holder of each harem and the males associated
with that harem was investigated, comparing the R values between holder and
associated males with those between holder and males not associated to his harem.
No significant differences were found for any of the breeding units (Mann-Whitney:
U> no, P> O.l for each harem). The relatedness distributions were very different
among harems, as mean R values ranged from 0.037 (±0.25) to 0.19 (± 0.25). Results
did not exhibit consistency among either harems or years; holders were more related
to peripheral males in some harems and less related in others. Details are shown in
Table IV.4.
Relatedness was also assessed between each holder and his peripheral males
that had at least one paternity assigned (see Chapter I I I for paternity assignment).
The R values between holders and secondary males of their harem that achieved at
least one paternity were compared with R values between holders and secondary
males of their harems that did not report any paternity. For each harem, two to four
secondary males were identified as genetic fathers of pups bom in the harem. The
level of relatedness between those males (n = 21) and their respective harem holder
was not significantly different from the level of relatedness between the holders and
the other peripheral males of the harem (Mann-Whitney: (7= 461.5, / ' = 0.112, n =
35).
Harem holders were not significantly more related among each other than
other males in the colony. The degree of relatedness among harem holders showed a
mean of 0.059 ± 0.247 (n dyads = 18) in 1996 and of 0.16 ± 0.24 (n dyads = 3) in
1997. hi both years, the values were not significantly different from the level of
relatedness among non-holder males (Mann-Whitney: U > 3200, P > 0.4 each year;
1996: mean = 0.049 ± 0.23, n dyads of non-holders = 2556 - 1997: mean = 0.074, n
99
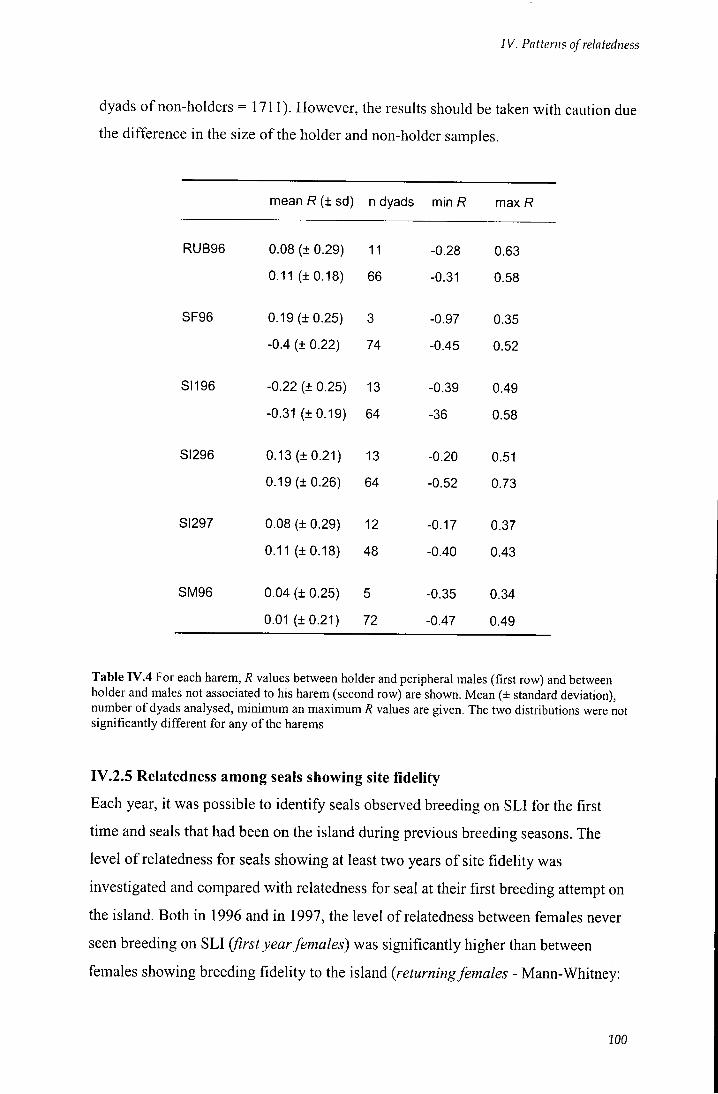
IV. Patterns of relatedness
dyads of non-holders = 1711). However, the results should be taken with caution due the difference in the size of the holder and non-holder samples.
mean R (± sd) n dyads min R max R
RUB96 0.08 (± 0.29) 11 -0.28 0.63
0.11 (±0.18) 66 -0.31 0.58
SF96 0.19 (±0.25) 3 -0.97 0.35
-0.4 (± 0.22) 74 -0.45 0.52
SI196 -0.22 (± 0.25) 13 -0.39 0.49
-0.31 (±0.19) 64 -36 0.58
SI296 0.13 (±0.21) 13 -0.20 0.51
0.19 (±0.26) 64 -0.52 0.73
SI297 0.08 (± 0.29) 12 -0.17 0.37
0.11 (± 0.18) 48 -0.40 0.43
SM96 0.04 (± 0.25) 5 -0.35 0.34
0.01 (±0.21) 72 -0.47 0.49
Table IV .4 For each harem, R values between holder and peripheral males (first row) and between holder and males not associated to his harem (second row) are shown. Mean (± standard deviation), number of dyads analysed, minimum an maximum R values are given. The two distributions were not significantly different for any of the harems
IV.2.5 Relatedness among seals showing site fidelity
Each year, it was possible to identify seals observed breeding on SLI for the first
time and seals that had been on the island during previous breeding seasons. The
level of relatedness for seals showing at least two years of site fidelity was
investigated and compared with relatedness for seal at their first breeding attempt on
the island. Both in 1996 and in 1997, the level of relatedness between females never
seen breeding on SLI {first year females) was significantly higher than between
females showing breeding fidelity to the island {returning females - Mann-Whitney:
100
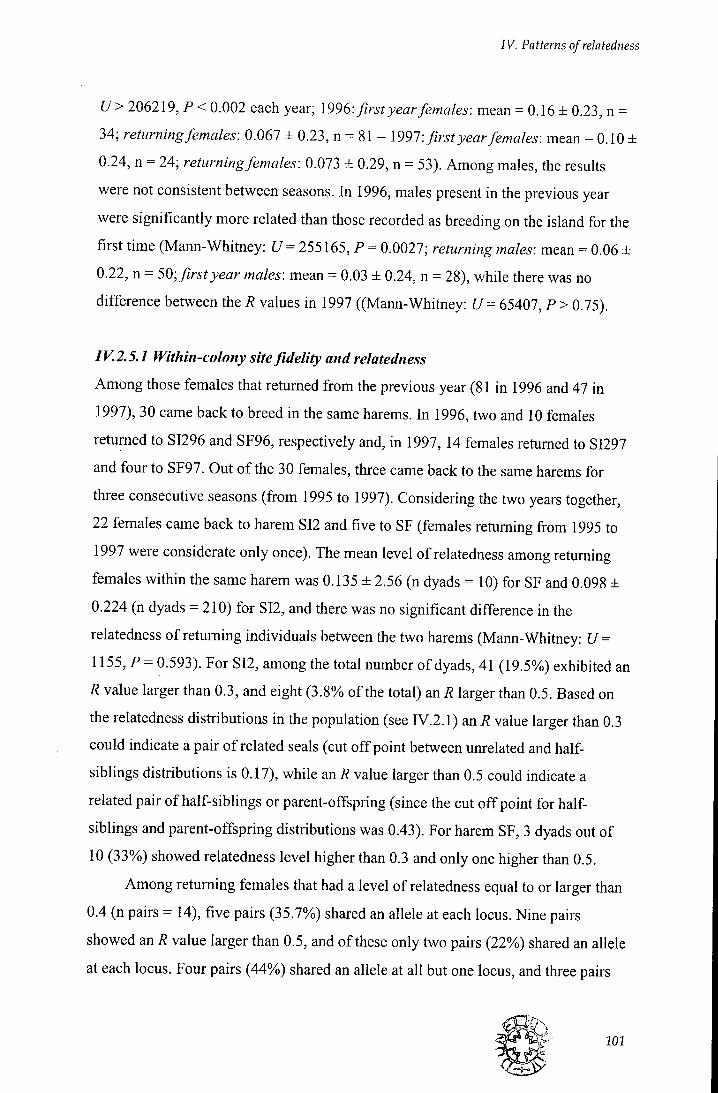
IV. Patterns of relatedness
t / > 206219, P < 0.002 each year; 1996: first year females: mean = 0.16 ± 0.23, n = 34; returning females: 0.067 ± 0.23, n = 81 - \991: first year females: mean = 0.10 ± 0.24, n = 24; returning females: 0.073 ± 0.29, n = 53). Among males, the results were not consistent between seasons. In 1996, males present in the previous year were significantly more related than those recorded as breeding on the island for the first time (Mann-Whitney: U = 255165, P = 0.0027; returning males: mean = 0.06 ± 0.22, n = 50; first year males: mean = 0.03 ± 0.24, n = 28), while there was no difference between the R values in 1997 ((Mann-Whitney: U = 65407, P > 0.75).
IV.2.5.1 Within-colony site fidelity and relatedness
Among those females that returned from the previous year (81 in 1996 and 47 in
1997), 30 came back to breed in the same harems. In 1996, two and 10 females
returned to SI296 and SF96, respectively and, in 1997, 14 females returned to S1297
and four to SF97. Out of the 30 females, three came back to the same harems for
three consecutive seasons (from 1995 to 1997). Considering the two years together,
22 females came back to harem SI2 and five to SF (females returning from 1995 to
1997 were considerate only once). The mean level of relatedness among returning
females within the same harem was 0.135 ± 2.56 (n dyads = 10) for SF and 0.098 ±
0.224 (n dyads = 210) for SI2, and there was no significant difference in the
relatedness of returning individuals between the two harems (Mann-Whitney: U =
1155, P = 0.593). For SI2, among the total number of dyads, 41 (19.5%) exhibited an
R value larger than 0.3, and eight (3.8% of the total) an R larger than 0.5. Based on
the relatedness distributions in the population (see IV.2.1) an R value larger than 0.3
could indicate a pair of related seals (cut off point between unrelated and half-
siblings distributions is 0.17), while an R value larger than 0.5 could indicate a
related pair of half-siblings or parent-offspring (since the cut off point for half-
siblings and parent-offspring distributions was 0.43). For harem SF, 3 dyads out of
10 (33%)) showed relatedness level higher than 0.3 and only one higher than 0.5.
Among returning females that had a level of relatedness equal to or larger than
0.4 (n pairs = 14), five pairs (35.7%) shared an allele at each locus. Nine pairs
showed an R value larger than 0.5, and of these only two pairs (22%) shared an allele
at each locus. Four pairs (44%) shared an allele at all but one locus, and three pairs
101
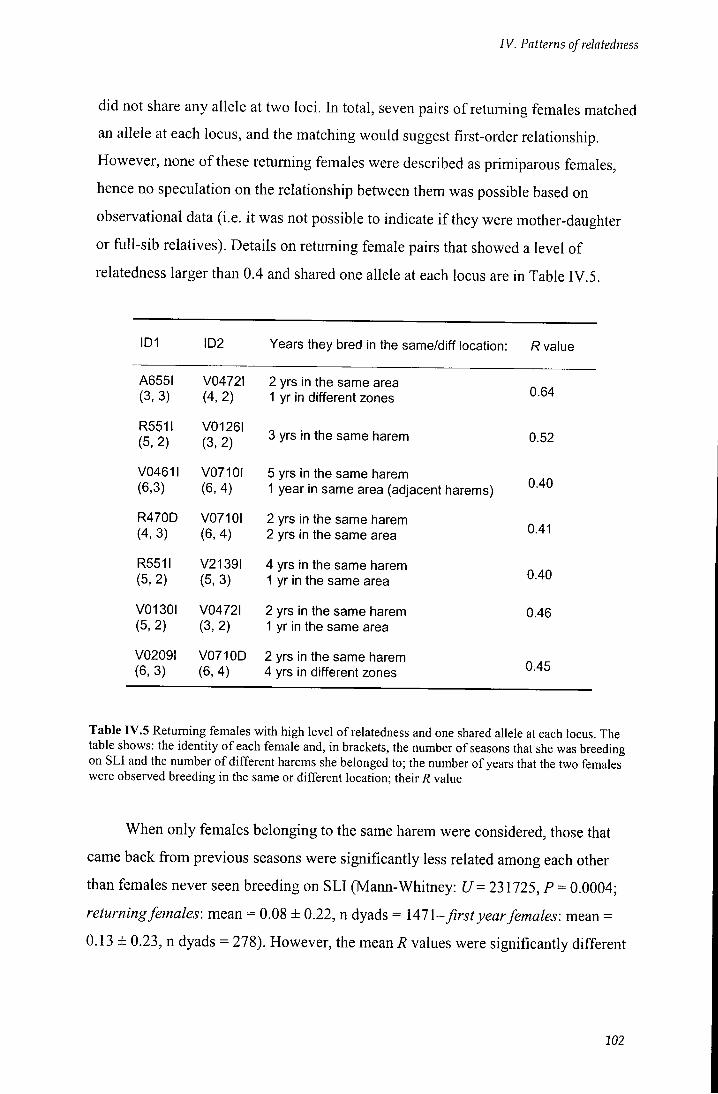
IV. Patterns of relatedness
did not share any allele at two loci. In total, seven pairs of returning females matched an allele at each locus, and the matching would suggest first-order relationship. However, none of these returning females were described as primiparous females, hence no speculation on the relationship between them was possible based on observational data (i.e. it was not possible to indicate i f they were mother-daughter or full-sib relatives). Details on returning female pairs that showed a level of relatedness larger than 0.4 and shared one allele at each locus are in Table IV.5.
ID1 ID2 Years they bred in the same/diff location: R value
A655I (3,3)
V0472I (4, 2)
2 yrs in the same area 1 yr in different zones 0.64
R551I (5, 2)
V0126I (3, 2) 3 yrs in the same harem 0.52
V0461I (6,3)
V0710I (6, 4)
5 yrs in the same harem 1 year in same area (adjacent harems) 0.40
R470D (4, 3)
V0710I (6, 4)
2 yrs in the same harem 2 yrs in the same area 0.41
R551I (5, 2)
V2139I (5, 3)
4 yrs in the same harem 1 yr in the same area 0.40
vo l 301 (5, 2)
V0472I (3, 2)
2 yrs in the same harem 1 yr in the same area
0.46
V0209I (6, 3)
V0710D (6, 4)
2 yrs in the same harem 4 yrs in different zones 0.45
Table IV.5 Returning females with high level of relatedness and one shared allele at each locus. The table shows: the identity of each female and, in brackets, the number of seasons that she was breeding on SLI and the number of different harems she belonged to; the number of years that the two females were observed breeding in the same or different location; their R value
When only females belonging to the same harem were considered, those that
came back from previous seasons were significantly less related among each other
than females never seen breeding on SLI (Mann-Whitney: U= 231725, P = 0.0004;
returning females: mean = 0.08 ± 0.22, n dyads = 1471-first year females: mean =
0.13 ± 0.23, n dyads = 278). However, the mean R values were significantly different
102
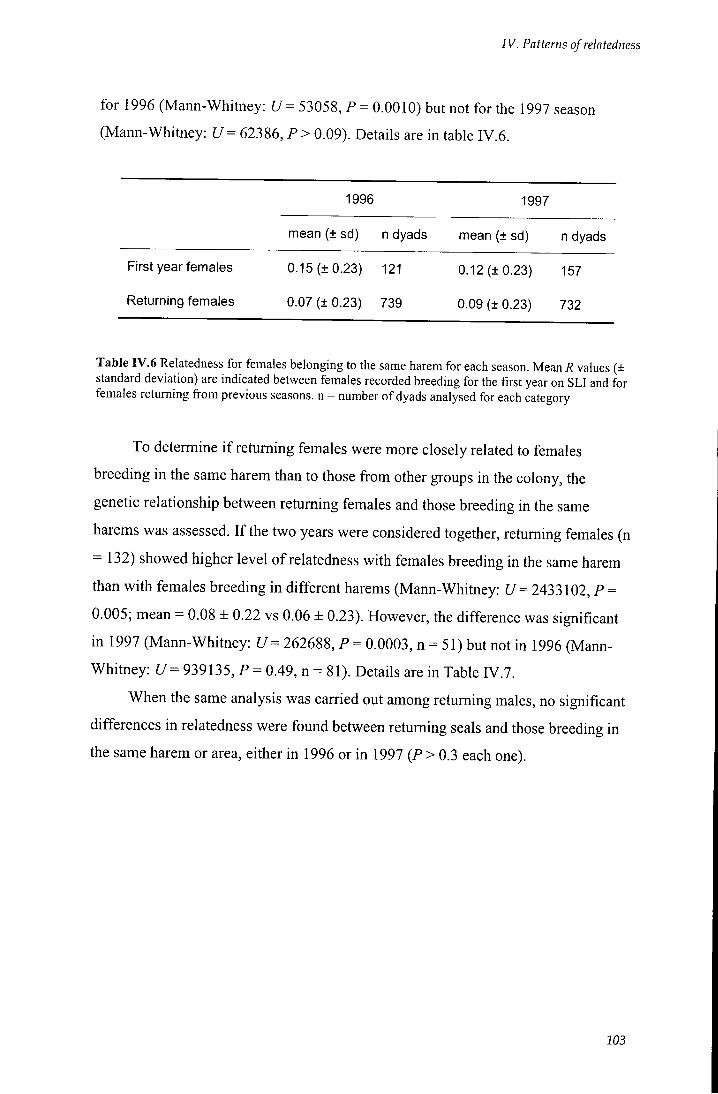
IV. Patterns of relatedness
for 1996 (Mann-Whitney: U= 53058, P = 0.0010) but not for the 1997 season (Mann-Whitney: U= 62386, P > 0.09). Details are in table IV.6.
1996 1997
mean (± sd) n dyads mean (± sd) n dyads
First year females 0.15 (± 0.23) 121 0.12 (±0.23) 157
Returning females 0.07 (± 0.23) 739 0.09 (± 0.23) 732
Table IV .6 Relatedness for females belonging to the same harem for each season. Mean R values (± standard deviation) are indicated between females recorded breeding for the first year on SLl and for females returning from previous seasons, n = number of dyads analysed for each category
To determine i f returning females were more closely related to females
breeding in the same harem than to those fi-om other groups in the colony, the
genefic relationship between returning females and those breeding in the same
harems was assessed. I f the two years were considered together, returning females (n
= 132) showed higher level of relatedness with females breeding in the same harem
than with females breeding in different harems (Mann-Whitney: U= 2433102, P =
0.005; mean = 0.08 ± 0.22 vs 0.06 ± 0.23). However, the difference was significant
in 1997 (Mann-Whitney: t / = 262688, P = 0.0003, n = 51) but not in 1996 (Mann-
Whitney: U-= 939135, P = 0.49, n = 81). Details are in Table IV.7.
When the same analysis was carried out among returning males, no significant
differences in relatedness were found between returning seals and those breeding in
the same harem or area, either in 1996 or in 1997 (P > 0.3 each one).
103
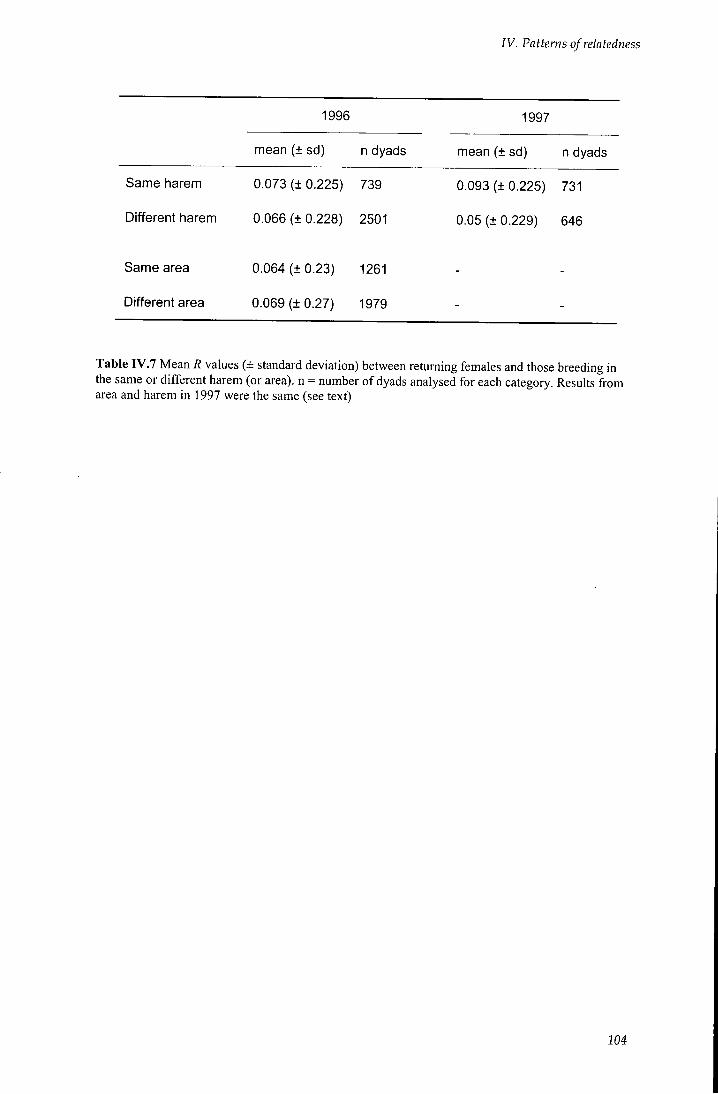
j y . Patterns of relatedness
Same harem
Different harem
1996
mean (± sd) n dyads
0.073 (± 0.225) 739
0.066 (± 0.228) 2501
1997
mean (± sd) n dyads
0.093 (± 0.225) 731
0.05 (± 0.229) 646
Same area
Different area
0.064 (+0.23) 1261
0.069 (±0 .27) 1979
Table IV .7 Mean R values (± standard deviation) between returning females and those breeding in the same or different harem (or area), n = number of dyads analysed for each category. Results from area and harem in 1997 were the same (see text)
104
IV. Pattenis of relatedness
IV.3 DISCUSSION
IV.3.1 Estimating relatedness from pairwise comparisons
Data generated by the seven microsatellite loci investigated in this study appeared to
give a useful resolution for relatedness assessment. A relatedness estimate can only
be obtained i f there is a set of unrelated individuals as a reference population.
Individuals between the study and the reference populations need to be genetically
different because they are unrelated only, and not because they have been sampled
from different, isolated populations that have diverged over time (Blouin et al. 1996;
de Ruiter and Geffen 1998). In this context, the Elephant Island colony was an ideal
reference population for measuring relatedness among seals of SLI (i.e. populations
were moderately differentiated at both microsatellite and mitochondrial markers -
see Chapter V).
The mean 7? values of known relationships well approximated the expected
values of unrelated pairs (SLI vs EI seals averaged 0.0) and parent-offspring (0.52),
though half-sib pairs averaged 0.34, higher than the expected 0.25. A possible
explanation would be that half-sibs are also related through either their mothers or
fathers (de Ruiter and Geffen 1998). Females in the colony reported an average
relatedness of 0.09 while males of only 0.05. However, males with assigned
paternities (see Chapter V) showed a higher level of mean relatedness (0.1). This,
together with female relatedness, could account for the over-estimation of the
relationship among half-sibs pairs, since 0.25 + (1/2 x 0.1) + (1/2 x 0.09) = 0.345,
which is equal to the R mean value exhibited by the half-sib pairs (de Ruiter and
Geffen 1998).
The higher relatedness among males identified as fathers could be related to
the paternity assignment. In this case, either the number of loci or their
polymorphism could be not high enough to provide the level of resolution needed in
the paternity analysis. In some harems, a few paternities were genetically assigned to
males other than the 'behavioural fathers' (for example for the harems RUB96 and
SI296 - see Discussion of Chapter III). In these paternities, the 'behavioural father',
who was also the harem holder, was assigned by CERVUS as the second most-likely
father without mismatches. This means that those males recognised as 'genetic
fathers' (and used in the calculation of relatedness of paternal half-sib pairs) showed
105
IV. Patterns of relatedness
genotypes very similar to those of the harem holders, which in turn were assigned the majority of the other paternities in the harem. Because of this genotype similarity among some males recognised as 'genetic fathers', the half-sibs would show a higher level of relatedness than the expected value of 0.25. This was also confirmed from the relatedness analysis of fathers and holders. In the first case, males identified as 'genefic fathers' were on average more related than other males in the colony (0.085 ± 0.25) while harem holders were not more closely related among each other than the other males (0.059 ± 0.25).
These results suggest that the number of loci may be large enough to
distinguish between half-sib and parent-offspring pairs (Goodnight and Queller
1999) but their level of polymorphism (number of alleles per locus = 4 -9, mean =
6.9) may not be sufficient. A study on the brown-headed cowbird (Alderson et al.
1999) overcame the same kind of problem by doubling the number of loci.
Therefore, increasing the number of loci would also increase the sensitivity of these
relatedness analyses. Nevertheless, after assessing the degree of overlap between the
distributions (unrelated, half-sibs and parent-offspring), the microsatellites provided
an adequate tool to classify unrelated and related pairs of seals.
IV.3.2 Colony relatedness
The populations of SLI and EI showed a level of relatedness comparable to that
expected from unrelated individuals (R = 0.0). Moreover, the level of relatedness
among seals fi-om SLI was significantly higher than the level of relatedness for SLI-
EI dyads. This result indicates a first level of distinction, on a geographic scale,
between the two colonies. Site fidelity has been documented for other populations of
this species (Lewis et al. 1996; NichoUs 1970; Hindell and Little 1988). hi this
context, the higher level of relatedness within each colony would support the idea of
site fidelity at colony level, as indicated by a mark-recapture study on the island
(Fabiani et al. in prep.).
106
IV. Patterns of relntedness
IV.3.2.1 Within colony relatedness
Results of relatedness within the population were not consistent either among years
or among harems. Yet, it was possible to identify some pattern of relatedness among
the seals of the island.
In elephant seals, as in other pinnipeds (Twiss et al. 1994), both males and
females show site fidelity to their colony. Males tend to forage over shorter distances
(McConnell and Fedak 1996; Campagna et al. 1999) and, at the same fime, they may
disperse more than females. In this context, seals from the same colony are expected
to show some level of relatedness and females should be more related than males. In
both years, females from SLI exhibited a higher level of relatedness among each
other than males (0.09 vs 0.05 and 0.08 vs 0.07), although the difference was only
significant for 1996. This result would be preliminary evidence that males also come
back to the same colony to breed, but the difference of relatedness within sex would
strengthen the evidence that females disperse less than males to breed. Fig IV.4
shows the mean relatedness values in the populafion, including comparisons among
males and among females.
I f seals on the island exhibited a certain degree of relatedness, then relatives
were distributed randomly throughout the colony rather than being confined in the
same breeding group or area. For both males and females, level of relatedness did
not increase from areas to harem. Further, males did not exhibit higher relatedness
with males (or females) from the same breeding unit than with males (or females)
from a different part of the colony. When each harem was analysed separately,
within harem relatedness values were on average higher than between harems for
only one out of the seven harems (harem SI297). For the other harems, within
relatedness was sometimes but not always larger than between harems, but the
difference was never significant. It is important to underline that the patterns of
kinship within harems strongly differed among harems (see Fig IV.3). Seven
different breeding contexts were analysed, though only in one of them was a pattern
in the relatedness distribution recognised. This seems to support the proposition that
closely related females are present in the colony (3-4% of the female-female dyads
had a values higher than 0.5 each year; n dyads = 11606 and 4252) but they do not
tend to cluster together. A different situafion was recognised in the grey seal
107
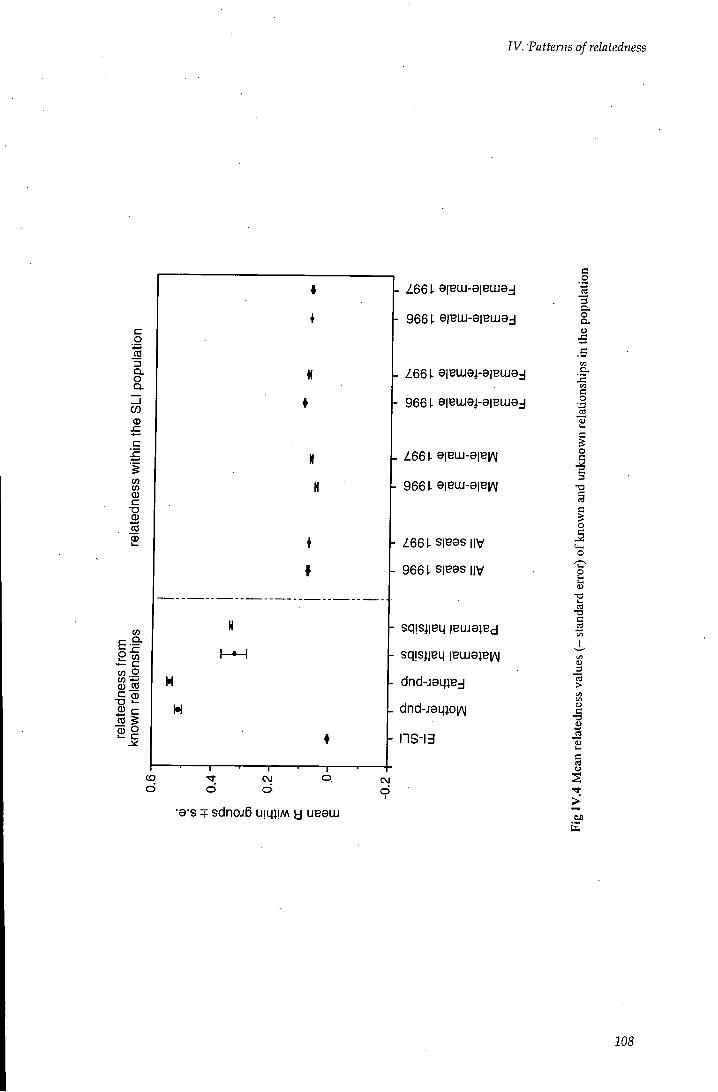
IV. Patterns of relatedness
c o 1 Q . O Q .
CO 0)
w 0 5
•o 0)
a>
to
. O
0) to C Q)
0)0
- /66 I . e|BUJ-e|BUJ9j
- 9661- e|BUJ-e|BLuej
- /66I - a|BLU9j-e|Baiej
* - 9661- e|BUJ9j-e|BLuej
N - /66 I . e|BLu-e|B|/\|
H - 9661- e|BLU-e|B|/\|
- /661. S|Bas | |v
f - 9661. S|Bes iiv
H
M H
- SqjSilBLJ |BUJ9}BcJ
- SqjSilBLJ |BUJ9}B1/\|
H - d n d - j e q } B j
H . dnd-J9Lj}oi^
• ns-13
U.D
-
0.4-
0.2- 0- CM
d 1
•a"s + sdnoj6 U I L I J I M y ueeiu
T 3 c
c
I
en
108
IV. Patterns of relatedness
(Pomeroy et al. 2001). For the colony of North Rona, the analyses of relatedness among females of one breeding season detected a fine-scale genetic structuring within the breeding colony, and locafions where on average females had higher than average relatedness to the colony were found. In this case, however, it was also possible to identify proximate benefits associated to those sites of the colony. They occurred close to access points and had particular topography characteristics (access to water, flat terrain), resources that likely influence the female reproductive performance (Twiss et al. 2000). On the contrary, elephant seal females on SLI breed on a homogeneous habitat (i.e. uniform sandy beaches with no relevant topographical features) and all harems are very close to the sea.
Previous kinship studies on pinnipeds concerned the assessment of
relationships among females (Shaeff et al. 1999; Pomeroy et al. 2000, 2001) or the
identification of pattern of paternal relatedness within a breeding colony
(Worthington Wilmer et al. 2000). In this study, genetic relationships among seals
were assessed to investigate any correspondence between genetic and social
structure. When the relationship between the females belonging to a harem and its
holder was analysed, no consistent results were found. In some harems, females were
more closely related to the holder than to other males frequenting the harem while, in
some others, the opposite was true. Similar results were obtained when the analysis
was restricted to harem holders only; relatedness between females and the holder of
the harem was not consistently different from that with other harem holders. It was
not possible to detect any clear pattern of genetic relatedness between females and
those males that achieved the highest level of reproductive success in the colony.
Neither there was evidence that females tended to mate with genetically diverse
males (Amos et al. 2001).
In species that are organised in long-term social groups with only one male
(the alpha) responsible for most of the paternities in the group (e. g. mLycaon
pictus: Girman et al. 1997; Canis lupus: Lucchini et al. 2002), females are usually
related to each other (often they also belong to the same matriline) but not to the
alpha male. On the other hand, subordinate males appear to be relatives and to have
higher level of relatedness with the alpha male. Kinship with a dominant member of
the group in case of the wild dog is the prerequisite of pack membership and also
109
IV. Patterns of relatedness
provides some reproductive value to subdominant males (Girman et al. 1997). In southern elephant seals of SLI, females do not show any pattern of relatedness with the male they are most likely to mate with (the harem holder). Similarly, secondary males that occasionally succeed in mating with females of a harem, and that are also subordinate to the harem holder (Fabiani 1996), are no more related to the holder than to other males. In this species, males do no participate in rearing the offspring and no co-operation has been documented among females of the same group. In a study on reproductive strategies of SLI females carried out during the same time as this study (Galimberti et al. 2000b), it was found that females tended to prefer larger harems at their arrival. In a sample of 205 females that settled in one harem at arrival and then moved to another harem for parturition, 10% shifted to larger harems. The grouping of females during the breeding season under the control of a single dominant male reduces the likelihood of encountering secondary males and reduces some of the short- and long-term breeding costs for the female (Le Boeuf 1991). The lack of any relatedness pattern between females and their harem holder in this population seems to suggest that male phenotype (and genefic relatedness) does not affect a female in choosing her breeding group (Galimberti et al. 2000b). Females seem to adopt the strategy of clustering in both time and space essentially to avoid high level of harassment and lower breeding success (Boness et al. 1995). They do not seem to adjust their harem choice on the phenotype of males that either control or frequent it.
IV.3.3 Female and site fidelity
This study identified general low mean R at SLI and found that the majority of
individuals within a harem were no more related to each other than to individuals
from different harems (Fig IV.5).
The mark-recapture study on this population from 1995 to 1999 reported both
site fidelity to the colony and a tendency to return to the same part of the island
during consecufive seasons (Fabiani et al. in prep.). Out of 646 females that came
back to the island to breed in two to four consecutive seasons, a mean of 12%
returned to the same zone each year, and 37%) returned to the same area. Eight-four
per cent of returning females gave birth within an average of 500 m from the
110
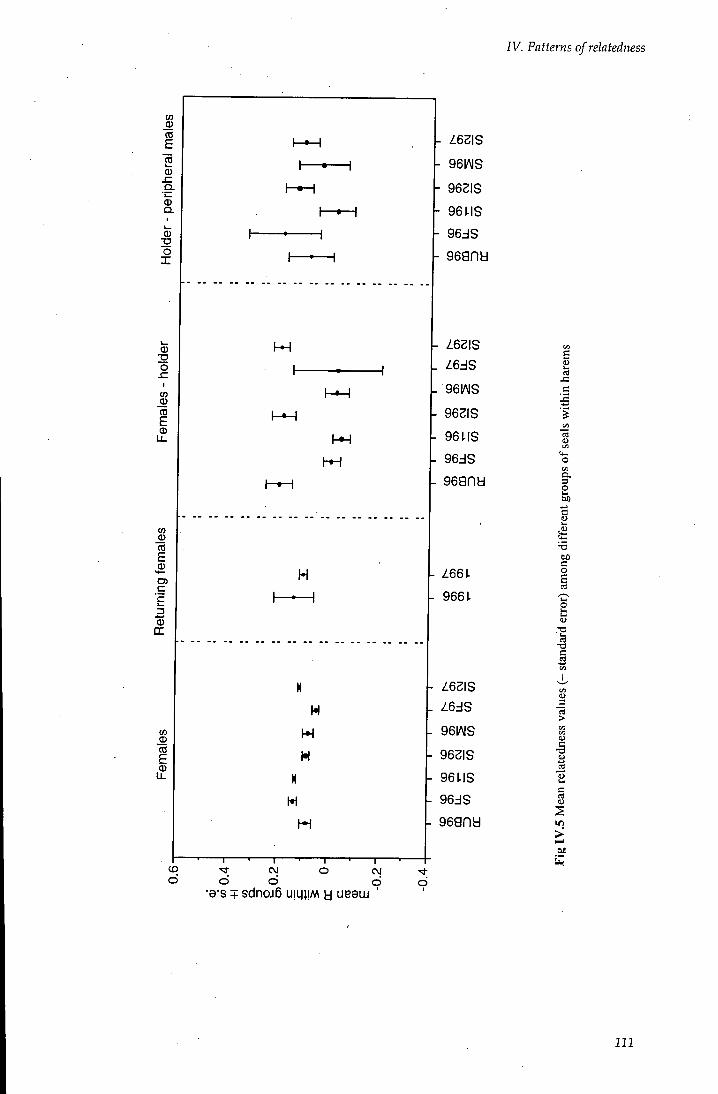
J V . Patterns of relatedness
w
to E
2 .9-'i— Q . I
:g o X
o
to CO £
to 0) to £
c £ 0) DC
0) (0 E 0)
U-
I —
h-»-H
H
H
H
H
N
W
•• 1 • 1 ' 1 ' r— CO CM O CM
o d d d •8's + sdnoj6 uiqjiM a ueeui
/6SIS
96iAiS
962IS
961.IS
96dS
969ny
Z62IS
l6dS 96m
962IS
96 US
96zlS
96and
Z661.
9661.
/62IS
/6dS
96IAIS
962IS
96US
96dS
96gnd
d
5
o 3 O
C o
§ <a
ra rS
-a c B
3
>
I in > 2
111
IV. Patterns of relatedness
previous year location, although only 8%) (n = 142) came back to the same area every year for five consecutive seasons. The SLI populafion displayed a level of site fidelity comparable to levels of site fidelity found in other pinnipeds (Table IV. 8), and higher than that recorded for the population of Peninsula Valdes (Lewis et al. 1996).
When the level of genetic relatedness between females that came back to the same
harem was investigated, R averaged 0.1 each year. Twenty percent of the dyads of
females within the same harem (n dyads = 220) showed an R value larger than 0.3
but only 4%, had an R value larger than 0.5. Furthermore, returning females show a
level of relatedness lower than that showed by females breeding on the island for the
first fime. In both years, the mean relatedness of females breeding for the first year
on SLI was higher than the mean relatedness of returning females. Data on female
philopatry of the study populafion (Fabiani et al. in prep.) showed that 63%) of the
females bom in 1995 (n = 38) came back to the same zone to breed in 1999. In this
context, a higher level of relatedness among females at their first breeding attempt
could be the result of those females being bom in the same harem and, therefore,
having the same father, i . e. the holder of the harem where their mothers were
breeding.
Among harbour seals of Sable Island, females showed high fidelity to the
breeding site but only a small percentage (30%) out of 36) returned within 500 m of
their previous pupping site, and related females seemed distributed randomly along
the beaches (Shaeff et al. 1999). Results from this study seem to support the
evidence that site fidelity and philopatry do not strongly affect the genetic stmcture
of the colony. Even i f females tend to come back to the same part of the island to
reproduce, the size of the harems are still sufficient to dilute the average relatedness
within them. As a consequence, the mating system of this populafion does not seem
to lead to any genetic sub-stmcture within the colony.
112
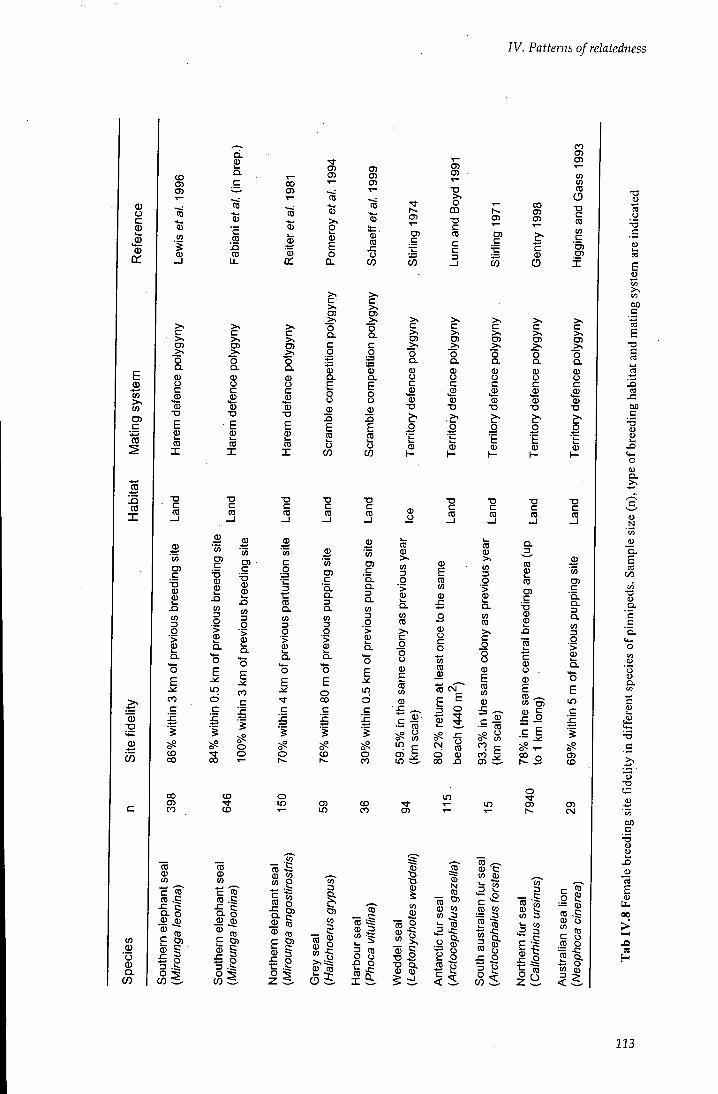
IV. Patterns of relatedness
s
E 0) "to >. ( O
C3) C
00
TO !5 CO
X
CD
o5
CO
0 'o 0 Q.
V)
CD CJJ CJ>
CD
5
I o Q. <S> O
c
s CD
•a E 0 }
-a c CO
0 5
c T 3 CD CD k-
. Q ( 0
g •> 0)
n c
CO CX)
CO CJ> CO
C i
Q .
c
m c 2 i s CD Li.
>< c >.
o Q .
s c cu
T 3
CO
X
T3 C CD
3 '35 O )
c
I CO .2 > Q .
d c
to CD c
T ) CD
£ .a CO
g > CD
Q .
O E
CO c In
1 5 o o
CD
s
C »
CD
'53
>< c >. a> >.
s c ( D
• D
E £ to I
CO CD 0) <U CO CO
c CD CD
ha U
lU ha
UlU
Q . o Q . o CD -32 CU •2 a>
CD <D
CD c i3) C i3)
:her
unc her
3un
.>.- 3 O s O
cn CO
'55 c o 1
to 3 g '> £ a. o E
•t c
o
O i n
.en I D -fc a> eg CO g CD o Q . c «? TO
S, C D )
a? 3
^ 5
cn
2 cu E o
D .
>>
c o
E o o
XI E £ o
CO
CO c:5 c
• Q . a. 3 CL cn 3 O >
O
E o CO
CD
C ^
to 3
i3)
- i s| ^1 £ 42
o 5.
cn CD
cu a=, cu CD
- C o
CO
c
>^ o Q . c o
••s "S Q . E
8 j2
E £ o
CO
• D •o T 3 C c C CD CD CD
_ l —I _ l
£ Q . O. 3 Q . CO 3 g > ( U
c
CO
C3> CD
i o m T 3 C CD C
c 3
1 ^ cn
c
CO
0 0 cn cn
c cu CD
O
E
d c
o CO
CD CO
CO
C D | <U 3 c o . ^
8 2 •P C3
8
CD <U > . CO 3 g > cu
CO CD > . c g 8 cu E CO
cu
:5 s 5 ^ (O
E cn 5 in sS
f CO 0}
- • D C5. (U 05
5 ^
cu E CD CO
<D sz
8 c o 'co CO 0
'to c<P c E
£ .5, o CD CU
CD 0)
>. ( 0 3 g > ( U
in CD
> % c o o o (U E to (O eu
c — CD
O (O
CO 5 CD CS
Q . 3
CO CU
c
1 £ .a I ' c 8 . tu E CO ^ CO o) cu c £ o
c E
?2 o
o CD
(U CO ( 0 5
i f iS o
CD ^ CU C (O Q)
CO CD CD
CO CO CD O
"8 CO to c
' cD CD
>, >. >, >. >. c c c c >. >. >, >. >. CD CD CD CD CD
>. >% >, o o o o O a. c^ c^ C I £2. cu cu cu (U eu o o o o o c c c c c s ^ s s s (U cu cu eu T3 T3 T3 •o •o
.£:• O o o o o
' C •"^ l _ k_ cu (U eu V eu
1- 1- H 1-
T 3 •D • o C C C c CD CD CD CO
_ J —I _ J _ l
C3J g
'a. CL 3
ta. 1 0 3
.s £ a .
c
CD CD
CD CM
2 to 3
seal
. C o £ CO se
al
3 CO ine
TO CO cu cn c
o - C o
3 cr
cu cn c CD
U
rcfo
csj
No
rth
ern
al
lorh
il
istr
alla
eo
ph
o
2 . No
rth
ern
O 3 <
2
1
em c
00 c
CI.
Q .
E C/3
C
-a a
>.
•a
Xi — a E <a
0 0
>•
113
V. Population genetic structure
V. Population genetic structure
V . l INTRODUCTION
Marine mammals have a high capacity for dispersal and inhabit an environment with
few geographic barriers. Pinnipeds, extremely well adapted to marine habitats, are
however still tied to land (or ice) for reproduction and moulting, and geographical
range, philopatry, dispersal potential and mating system are likely to be very
important factors in defining the genetic structure of the populations.
V.1.1 Mirounga leonina genetic structure
Mirounga leonina breeding colonies are concentrated on sub-Antarctic islands near
the Antarctic convergence. They are divided into three main stocks (i.e. group of
close colonies within each ocean), defined as the South Georgia stock (south Atlantic
ocean), the Kerguelen stock (south Mdian ocean) and the Macquarie Island stock
(south Pacific ocean) (Laws 1994). The South Georgia stock is numerically the
largest and includes, among other colonies. South Georgia (SG), South Shetland
Islands, Falklands and the colony of Peninsula Valdes (PV, Argentina). Heard Island
(HD) is part of the Kerguelen stock while Macquarie Island (MQ) is part of the
Macquarie stock (Fig V.I)
Inter-population studies on southern elephant seals began with Lydekker
(1909) who analysed skull characteristics and proposed three subspecies -
falclandicus, crosetensis and macquariensis - corresponding to the types found in
the South Atlantic, southern Indian and South Pacific, respectively. However,
Bryden (1968) explained some morphometric differences among those populations
as environmentally determined (Slade 1997). In a study on allozymes, Gales et al.
(1989) found significant differences between the Macquarie and Heard Island
colonies at four allozyme loci. Slade (1997) and Slade et al. (1998) confirmed the
differentiation between these two colonies for both mitochondrial and microsatellite
markers. They also found significant differentiation at mitochondrial DNA but not at
microsatellite markers between HD and SG. When the Peninsula Valdes colony was
compared with the other colonies at mitochondrial DNA, the differentiation was
124
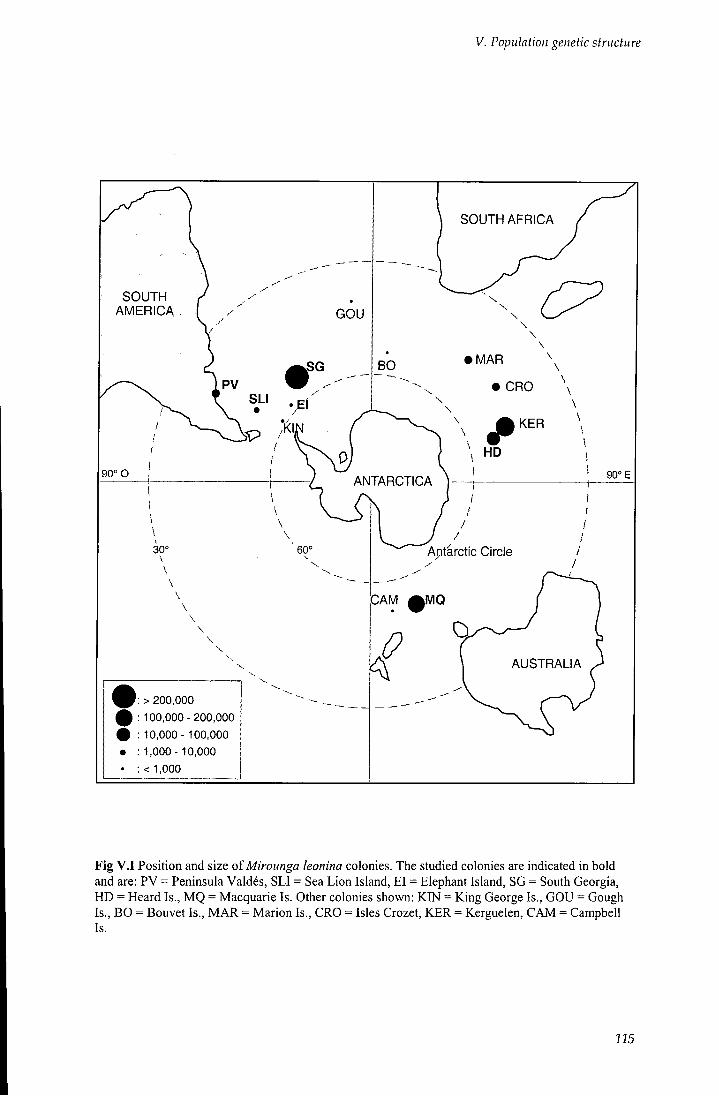
V. Population genetic structure
SOUTH AFRICA
SOUTH AMERICA
90° O ANTARCTICA
Antarctic Circ e
CAM A M Q
AUSTRALIA
> 200,000 100,000-200,000 10,000- 100,000 1,000- 10,000 < 1.000
Fig V . I Position and size ofMirounga leonina colonies. The studied colonies are indicated in bold and are: PV = Peninsula Valdes, SLl = Sea Lion Island, EI = Elephant Island, SG = South Georgia, HD = Heard Is., MQ = Macquarie Is. Other colonies shown: KIN = King George Is., GOU = Gough Is., BO = Bouvet Is., MAR = Marion Is., CRO = Isles Crozet, KER = Kerguelen, CAM = Campbell Is.
125
V. Population genetic structure
always very high. Therefore they suggested a common origin (separation estimated at the last ice-age, 18 000 years ago) and a divergence time of MQ and PV populations 200 000 - 300 000 years ago. In a more recent study (Hoelzel et al. 2001), PV and SG were analysed in more detail at both microsatellite and mtDNA loci, and morphological characters were also compared between the two populations. Differences between SG and PV were supported at both genetic and morphometric measures, and they were genetically confirmed also when compared with data from populations from MQ and HD. Haplotypes from MQ and PV formed separate and very distinct monophyletic lineages, while SG and HD shared haplotypes lineages and were polyphyletic. To explain the phylogeny structure, Hoelzel et al. (2001) suggested a female founding event for the PV population and no further female immigration to the colony.
Individuals from Sea Lion Island (SLI - Falklands) and from Elephant Island
(EI - South Shetlands) had never been analysed before. They are both part of the
South Georgia stock and could provide important evidence on the genetic
differentiation pattern present in the stock. In particular SLI, with its geographically
intermediate position, could serve as a conduit between the PV and the SG colonies
and hence would be expected to show intermediate differentiation between the two
colonies.
Long-distance excursions have been documented for individual of both sexes
and for different populations. For foraging frips, females tend to travel fiirther, while
males often forage near the breeding colonies (McConnell and Fedak 1996;
Campagna et al. 1998). A juvenile seal marked on MQ was resighted moulting on
Peter 1 0 Y (approximately 5200 km east of MQ) and again on MQ few months later
(Hindell and McMahon 2000). This illustrates that southern elephant seals have the
potential to disperse and to utilise all regions of the southern oceans. Subadult males
from PV have been resighted on Sea Lion Island during the mouhing season.
Movements of SLI seals during moulting periods have also been recorded between
SLI and both Livingston Island and King George Island, two islands that are part of
the South Shetland Archipelago some 1200 km away from SLI. A young male from
SLI has been also resighted on the fiirther distant Gough Island, more than 3000 km
from SLI (Galimberti unpublished data). The resighted animals were mostly males
216
V. Population genetic structure
tagged on SLI as non-reproductive males, apart from two adult females. The two females bred on SLI and were resighted after about two months from their departure on different islands. The first one was seen on Livingston Is. and the second one on King George Island.
Both females and males from Sea Lion Island showed a high level of site
fidelity, with females being more site-faithfial than males (Fabiani et al. in prep.).
However, during the mark-recapture study that has been carried out on SLI since
1995, one female fi-om SLI has been resighted at PV. The female came ashore for
breeding on SLI the first year, in 1995, she skipped one year and she was seen again
in 1997. She has not been seen again on SLI after 1997, but she was resighted
breeding at PV in 2000. This would be the first case of an adult female southern
elephant seal using two different colonies as breeding sites.
V.1.2 Aims
In this chapter, individuals fi-om SLI and EI were analysed at both
microsatellite and mtDNA markers. Then, the results fi-om these two colonies were
compared with data from other colonies of southern elephant seals, to:
a) quantify the genetic variation in two populations not previously studied (EI
and SLI);
b) assess the pattern of genetic variation and differentiation among the putative
populations of the Southern Ocean;
c) assess the pattern of dispersal of males and females and possible differences
between them.
217
V. Population genetic structure
V.2 R E S U L T S
MICROSATELLITE LOCI
V.2.1 Microsatellite genetic variation
Each pair of loci in each colony (SLI, EI, SG, PV) was tested for linkage
disequilibrium. No test was significant in any population, therefore independent
segregation of alleles at the different loci was assumed in subsequent analyses.
Hardy-Weinberg equilibrium was tested for each population at each locus, and no
significant deviation was found (P>0.1 for each test).
V.2.1.1 Geographic variation of microsatellite allelic frequencies
Al l seven loci showed similar levels of variation among populations. Observed
heterozygosity values ranged from 0.56 to 0.91. The most variable locus was M2b
with ten alleles and the least variable was Hg4.2 with four alleles. The total number
of alleles scored in each population was highest in SLI (39 alleles) and lowest in PV
(32), most probably due to the larger number of individuals analysed at Sea Lion.
Values of allele richness and polymorphism for each population and locus are
showed in Table V . l . F/s values were low for each marker, both within (from -0.178
to 0.112) and among p^- ilations (from -0.055 for SG to 0.008 for SLI) and none of
them was statistically significant (P> 0.1 always). Considering only the five markers
screened for the four populations, private alleles (i.e. alleles whose occurrence is
restricted to only one population) constituted 10% of all alleles. Four private alleles
were observed in the SLI population and one in the SG population. One more private
allele was present in SLI at the marker PV9. A l l private alleles occurred at very low
frequencies (P < 0.033) (Table V.2).
In Table V.3 the allele frequencies at the BETA loci in the SLI and EI
populations were compared with published data for HD, MQ (Slade et al. 1998), PV
and SG (Hoelzel et al. 2001). At these loci, the PV population was differentiated
from HD (G = 27.9, df= S,P = 0.0005), MQ (G = 46.23, df= S,P< 0.0001), EI (G
= 30.3, df= 10, P = 0.0008) and SLI (G = 33.63, df= 10, P = 0.0002). The
population of SG was differentiated from MQ {G = 26.72, df= 9,P = 0.0016) but
not significantly from the other populations (P > 0.1). SLI differentiated from MQ
(G = 45.8, df= S,P< 0.0001) and HD (G = 25.14, df= 9,P = 0.0028), but not from
118
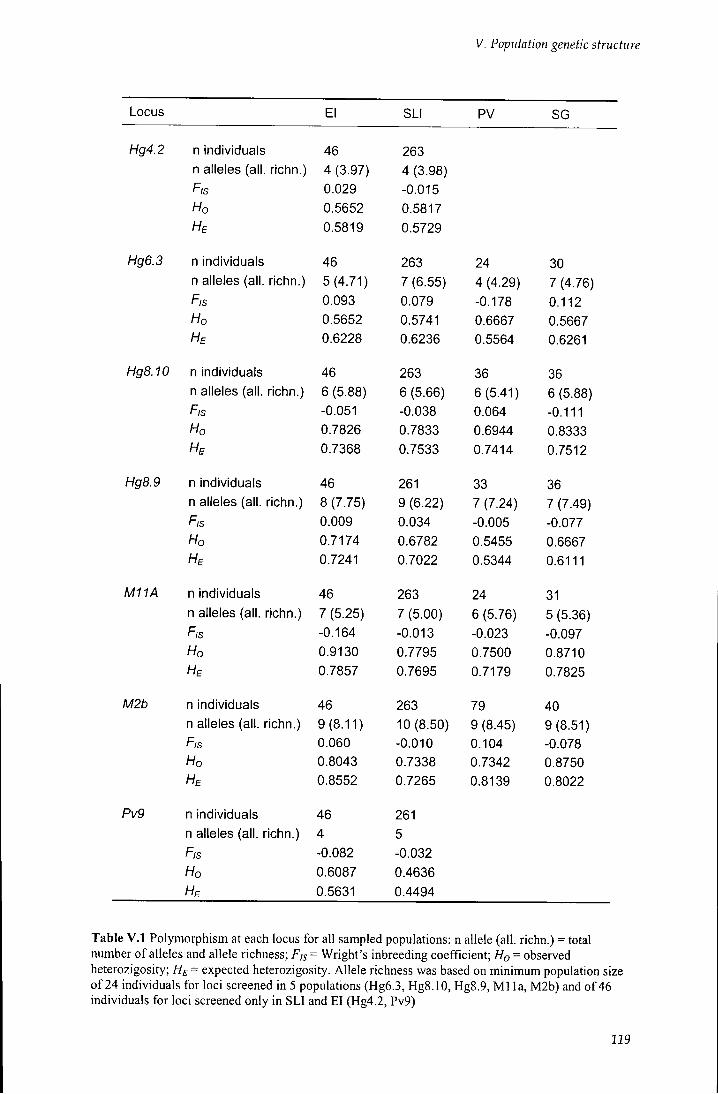
V. Population genetic structure
Locus El SLI PV SG
Hg4.2 n individuals 46 263 n alleles (all. richn.) 4 (3.97) 4 (3.98) F,s 0.029 -0.015 Ho 0.5652 0.5817 HE 0.5819 0.5729
Hg6.3 n individuals 46 263 24 30 n alleles (all. richn.) 5(4.71) 7(6.55) 4 (4.29) 7(4.76) F,s 0.093 0.079 -0.178 0.112 Ho 0.5652 0.5741 0.6667 0.5667 HE 0.6228 0.6236 0.5564 0.6261
Hg8.10 n individuals 46 263 36 36 n alleles (all. richn.) 6(5.88) 6(5.66) 6(5.41) 6(5.88) F,s -0.051 -0.038 0.064 -0.111 Ho 0.7826 0.7833 0.6944 0.8333 HE 0.7368 0.7533 0.7414 0.7512
Hg8.9 n individuals 46 261 33 36 n alleles (all. richn.) 8(7.75) 9(6.22) 7 (7.24) 7 (7.49) F/s 0.009 0.034 -0.005 -0.077 Ho 0.7174 0.6782 0.5455 0.6667 HE 0.7241 0.7022 0.5344 0.6111
M11A n individuals 46 263 24 31 n alleles (all. richn.) 7 (5.25) 7(5.00) 6(5.76) 5(5.36) F,s -0.164 -0.013 -0.023 -0.097 Ho 0.9130 0.7795 0.7500 0.8710 HE 0.7857 0.7695 0.7179 0.7825
M2b n individuals 46 n alleles (all. richn.) 9(8.11) F,s 0.060 Ho 0.8043 HE 0.8552
263 79 40 10(8.50) 9(8.45) 9(8.51) -0.010 0.104 -0.078 0.7338 0.7342 0.8750 0.7265 0.8139 0.8022
Pv9 n individuals 46 261 n alleles (all. richn.) 4 5 F,s -0.082 -0.032 Ho 0.6087 0.4636 HE 0.5631 0.4494
Table V . l Polymorphism at each locus for all sampled populations: n allele (all. richn.) = total number of alleles and allele richness; F,s = Wright's inbreeding coefficient; HQ = observed heterozigosity; HE = expected heterozigosity. Allele richness was based on minimum population size of 24 individuals for loci screened in 5 populations (Hg6.3, HgS.lO, Hg8.9, Ml la, M2b) and of 46 individuals for loci screened only in SLI and EI (Hg4.2, Pv9)
119
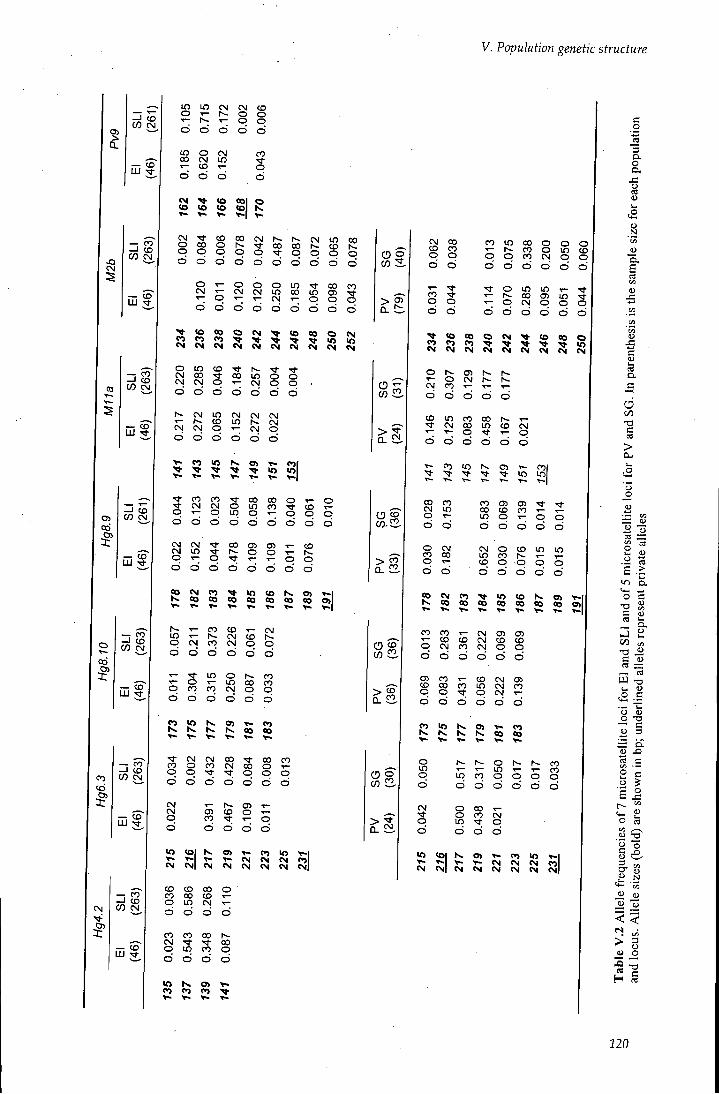
V. Population genetic structure
i
—1 CD CO CM
UJ
— CO
— CD LU T}-
^ ! CD CD CO
CD~ m
—1 CO Oi CO 00 C35
00 CO
I
— CO UJ
-• CO _J CO CO CNJ
— CD
— CO —I CO CO CN
— CD
— CO —I CO CO CM
— CD LU Tl-
lO LO CM CM CD O 1 - o O T - . O O
C) O C5 O d
in o CM CO 00 CM m T - CD T - O o d d d <N XT CO 0 0 1 O (O (O (O t o K
CM^rcDOOCNt^t^CN O O O O O rt O O
d d d d d d d d o o o O lO •"t CM T - CM CM to CO ir> ^ P T- CM T- O O C3 O O O C> O
• * < o o o o c s i r j . < o o o
e N C M C N t N t ^ C N e M ^
Irt CO CO o d o
CD 00 CO o d
o d
O o CO S
> s CM CM
o m CD CM CO 00 m o o CM CM O T— CM o o d d d d d d d N. CM m CM CM CM T ~ 1 CD in f- CM CM CM o T— CM o d d d d d d
s . o> c o l ^»
T -
•<r CO co 00 00 o o •>d- CM CM o in CO CD o o m o o o o d d d d d d d d d
CM CO CJ) cn CD CM lO 1 o o o r— o o o d d d d d d d d
CM C O C O 0 0 0 0 0 0 0 0 0 0 0 0 oo
^ CO CD CM to CM CD h-o CM CO CM O o d d d d d d
in o CO o T— m 00 CO o CO CO CM o o
d d d d d d
CO N . o> 0 0 N . Is . 0 0 0 0
C0-J2.
> S
CO J 2
> S
CM CM 00 -"d- 00 CO CO O CO CM CO O r-O O O O O o o o o
CM CM CD O CO d d d
t o l N . r -
CM CMI <M CM
CD CO 00 o CO CO CD o in CM r-d d d d
CO CO 00 1 CM 00 o CO o d d d d
l O o> CO CO CO
*-
o o o
o o d
< ~ C O lO T - l ( M CM CM C O
CO 2 -
CM CO CD CO O O d d
CO •rr o o d d
CO in 00 o o o t- CO o m CD P p CO CM o o d d d d d d I
o m m T-•<- 00 a> to Ti-p CM p o o
d d d d d d
2 ^ ^ o o o o e N ^ ^ < o o o o C O C O C O T l - ' ^ ' r j . ' ^ ' a - K
1 1 o CD O CM CM CO •>-; T- T-
d d d d d
CO lo CO 00 rs. T-CM 00 in CD CM - r - q T - o
o d d d d d •<~ CO in 1- o> T ~ coi in in
00 CO CM to O T-
d d
O CM CO 00 O 1 -
CO <D (35 T t 00 CD CO 1 -
in o 1 - o o d d d d d
CM o CO m m in CO N- T - T -co o o o o d d d d d
0 0 CM C I lO 0 0 0 0 0 0 0 0
CO CO ^ CM o T— CO CO CM CO o CM CO CM o d d d d d
CO CD CM CD 00 CO m CM o o o CM d d d d d
0 0
O o in T— in o m CO o d d d d
CM o CO o CO CM o m O
d d d d
< 0 | 1 ^
*• CM CM «NI CM CM CM
0 0
o d
CO 0 0
o d
CO CO o
c o
3 Q. O D. JS o
n. S u
0) •s o.
O C/3 •a a > CL,
o o
=; (u B o =« =:
E •> m D, Cm * j O C •o S
—I n)
O 0) o -o
.1 ! 0 X)
1 .£
'S o O CO
g e CT n)
< < > 3 « o
220
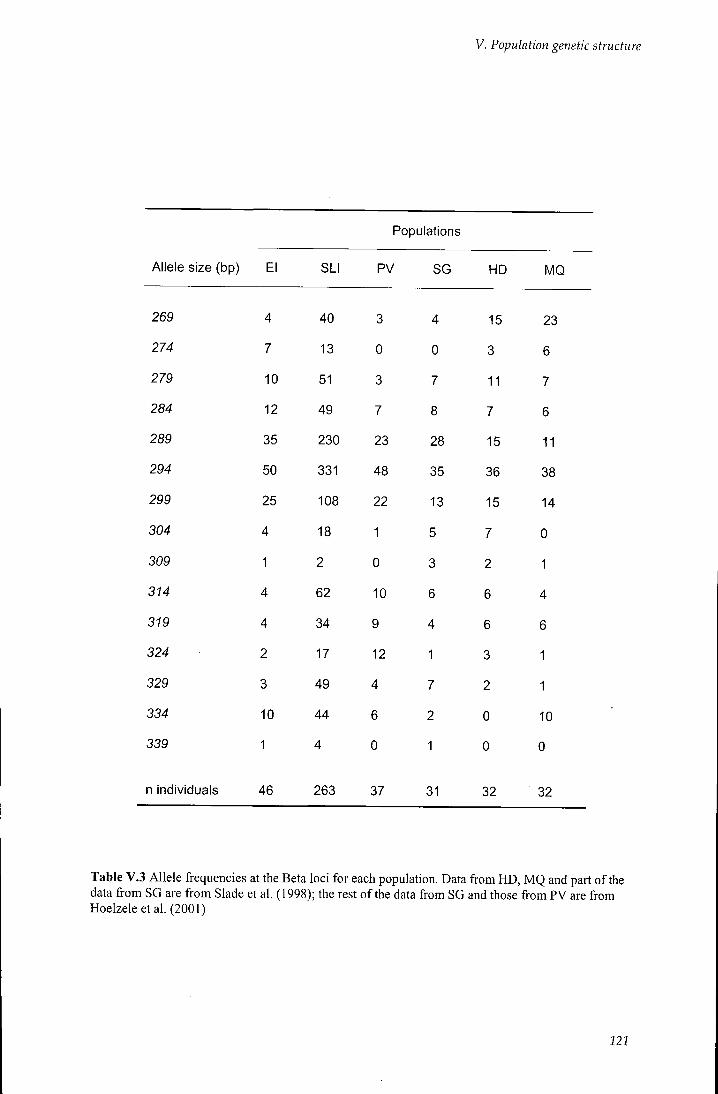
V. Population genetic structure
Populations
Allele size (bp) El SLI PV SG HD MQ
269 4 40 3 4 15 23
274 7 13 0 0 3 6
279 10 51 3 7 11 7
284 12 49 7 8 7 6
289 35 230 23 28 15 11
294 50 331 48 35 36 38
299 25 108 22 13 15 14
304 4 18 1 5 7 0
309 1 2 0 3 2 1
314 4 62 10 6 6 4
319 4 34 9 4 6 6
324 2 17 12 1 3 1
329 3 49 4 7 2 1
334 10 44 6 2 0 10
339 1 4 0 1 0 0
n individuals 46 263 37 31 32 32
Table V.3 Allele frequencies at the Beta loci for each population. Data from HD, MQ and part of the data from SG are from Slade et al. (1998); the rest of the data from SG and those from PV are from Hoelzele et al. (2001)
121
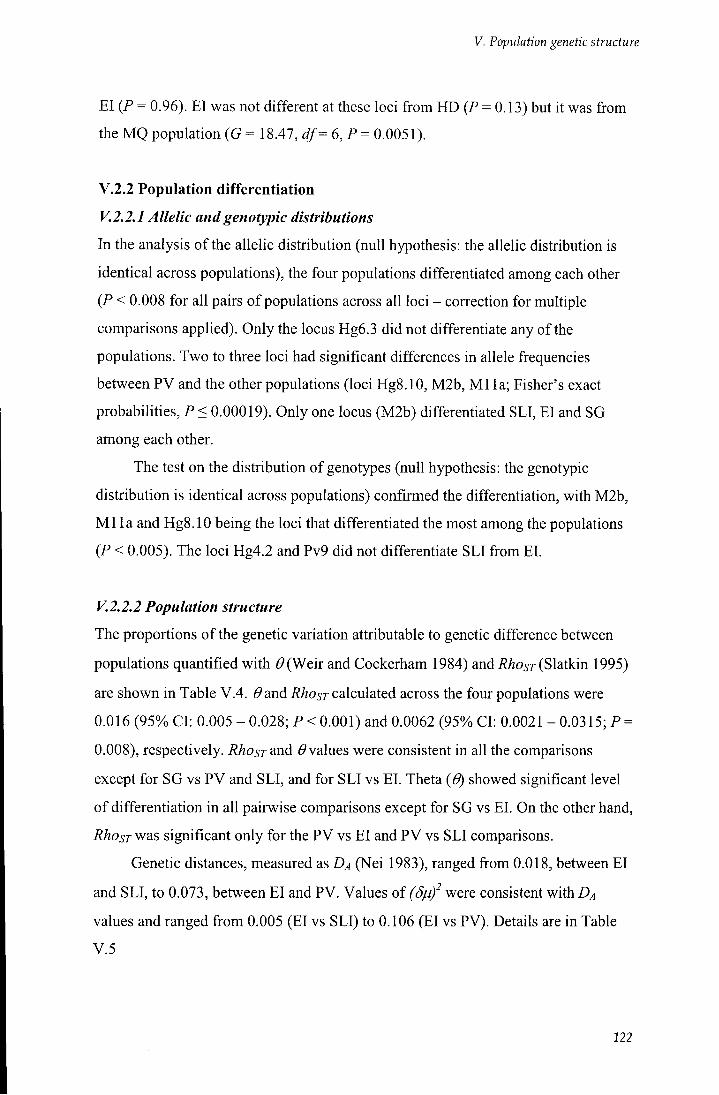
V. Population genetic structure
EI (P - 0.96). EI was not different at these loci from HD (P = 0.13) but it was from the MQ population (G = 18.47, df= 6, P = 0.0051).
V.2.2 Population differentiation
V.2.2.1 Allelic andgenotypic distributions
In the analysis of the allelic distribution (null hypothesis: the allelic distribution is
identical across populations), the four populations differentiated among each other
(P < 0.008 for all pairs of populations across all loci - correction for muhiple
comparisons applied). Only the locus Hg6.3 did not differentiate any of the
populations. Two to three loci had significant differences in allele frequencies
between PV and the other populations (loci Hg8.10, M2b, M l la; Fisher's exact
probabilities, P < 0.00019). Only one locus (M2b) differentiated SLI, EI and SG
among each other.
The test on the distribution of genotypes (null hypothesis: the genotypic
distribution is identical across populations) confirmed the differentiation, with M2b,
M l la and Hg8.10 being the loci that differentiated the most among the populations
(P < 0.005). The loci Hg4.2 and Pv9 did not differentiate SLI from EI.
V.2.2.2 Population structure
The proportions of the genetic variation attributable to genetic difference between
populations quantified with 6* (Weir and Cockerham 1984) and i?/205r (Slatkin 1995)
are shown in Table V.4. ^and Rhosr calculated across the four populations were
0.016 (95% CL 0.005 - 0.028; P < 0.001) and 0.0062 (95% CI: 0.0021 - 0.0315; P =
0.008), respectively. i?/zo57-and lvalues were consistent in all the comparisons
except for SG vs PV and SLI, and for SLI vs EI. Theta {0} showed significant level
of differentiation in all pairwise comparisons except for SG vs EI. On the other hand,
RhosT^as significant only for the PV vs EI and PV vs SLI comparisons.
Genefic distances, measured as DA (Nei 1983), ranged from 0.018, between EI
and SLI, to 0.073, between EI and PV. Values of (S/u)' were consistent with DA
values and ranged from 0.005 (EI vs SLI) to 0.106 (EI vs PV). Details are in Table
V.5
122
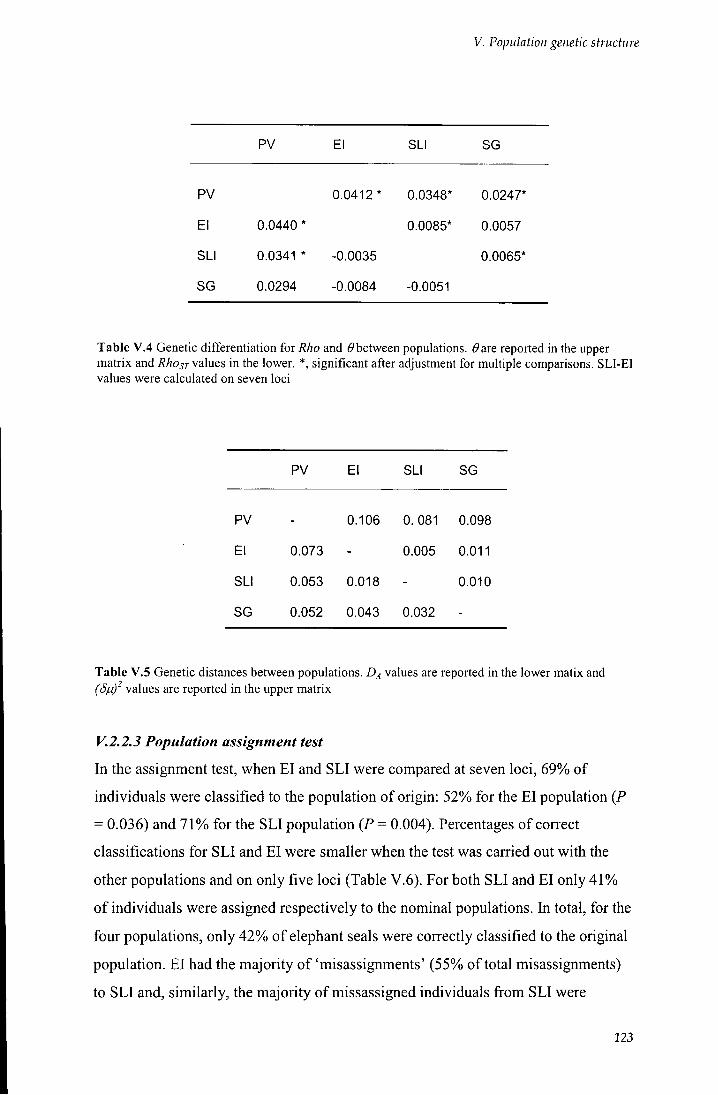
V. Population genetic structure
PV El SLI SG
PV 0.0412* 0.0348* 0.0247*
El 0.0440 * 0.0085* 0.0057
SLI 0.0341 * -0.0035 0.0065*
SG 0.0294 -0.0084 -0.0051
Table V.4 Genetic differentiation for Rho and 6* between populations, ^are reported in the upper matrix and iJ/jo^r values in the lower. *, significant after adjustment for multiple comparisons. SLI-EI values were calculated on seven loci
PV El SLI SG
PV - 0.106 0. 081 0.098
El 0.073 - 0.005 0.011
SLI 0.053 0.018 - 0.010
SG 0.052 0.043 0.032 -
Table V.5 Genetic distances between populations. values are reported in the lower matix and (5/j.f values are reported in the upper matrix
V.2.2.3 Population assignment test
In the assignment test, when EI and SLI were compared at seven loci, 69% of
individuals were classified to the population of origin: 52% for the EI population (P
= 0.036) and 71% for the SLI population (P = 0.004). Percentages of correct
classifications for SLI and EI were smaller when the test was carried out with the
other populations and on only five loci (Table V.6). For both SLI and EI only 41%
of individuals were assigned respectively to the nominal populations. In total, for the
four populations, only 42%) of elephant seals were correctly classified to the original
population. EI had the majority of 'misassignments' (55%) of total misassignments)
to SLI and, similarly, the majority of missassigned individuals from SLI were
123
V. Population genetic structure
allocated to EI (41%) of total SLI misassignments). For both populations, the smallest number of misassigned individuals was to PV. SG had only 36% of genotypes correctly classified (P = 0.10) and 25% assigned to SLI. PV had the highest proportion of individuals correctly assigned (56%), P = 0.0004) and the smallest numbers of misassignments from SLI and EI.
Assigned to population:
Nominal pop. PV El SLI SG n individuals Corr. (%)
PV 19 4 5 6 34 56%
El 4 19 15 8 46 41%
SLI 37 64 108 54 263 41%
SG 7 7 9 13 36 36%
Table V.6 Assignment of individuals to populations and percentage of correct classification, Corr. (%), based on microsatellite data
MITOCHONDRIAL DNA
V.2.3 MtDNA diversity
The sequences from SLI and EI were compared at the 299bp segment of the control
region with published data from SG, PV (after Hoelzel et al. 1993 a, 2001), MQ and
HD (after Slade fl/. 1998).
Forty-two variable sites defined 67 haplotypes for the 299bp control region
genotypes among the six populations. Six sites showed transversion substitutions,
while all the others showed transitions. Five transversions occurred in haplotypes of
SG, while one transversion occurred among seals sampled on EI. Al l MQ haplotypes
shared two fixed mutations (positions 185, 351). The two mutations were exclusive
to the MQ haplotypes with the remarkable exception of one seal sampled on SLI
(haplotype slijblob). The genotype sli blob was the only one that did not fit with the
other lineages represented at SLI, and it was instead well represented in the MQ
lineage. Al l PV haplotypes also shared two fixed mutafions (posifions 277, 290), and
in this case neither of them was found in any of the other sampled seals.
124
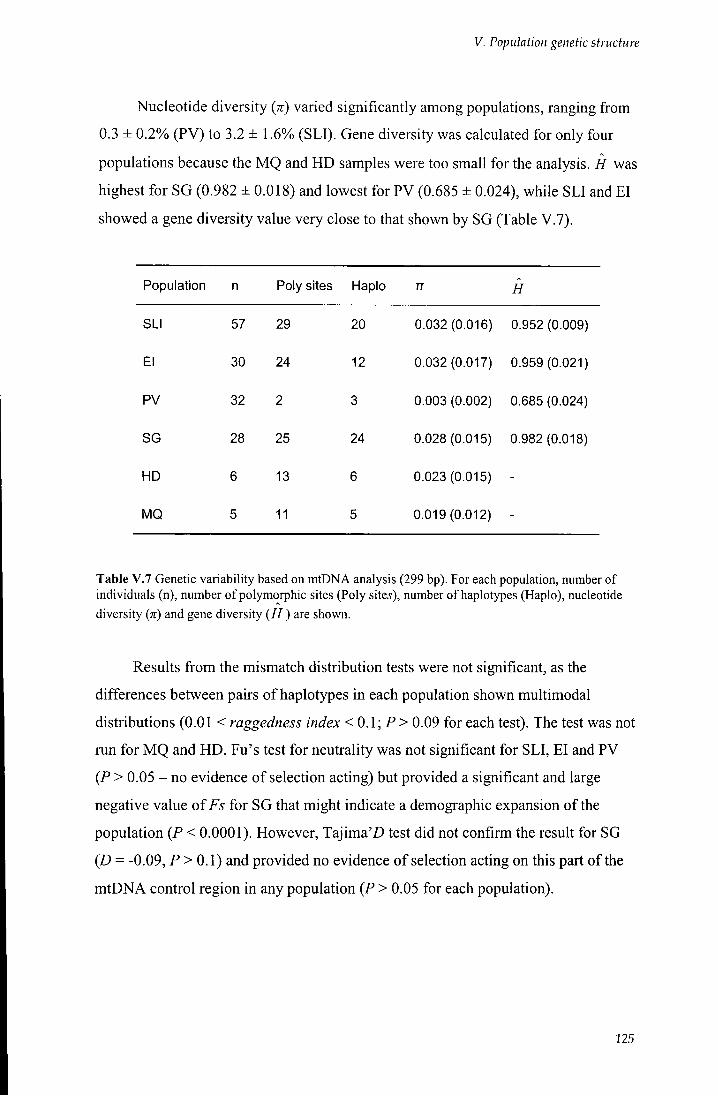
V. Population genetic structure
Nucleotide diversity (TT) varied significantly among populations, ranging from 0.3 ± 0.2%o (PV) to 3.2 ± 1.6% (SLI). Gene diversity was calculated for only four populations because the MQ and HD samples were too small for the analysis. H was highest for SG (0.982 ± 0.018) and lowest for PV (0.685 ± 0.024), while SLI and EI showed a gene diversity value very close to that shown by SG (Table V.7).
Population n Poly sites Hapio TT H
SLI 57 29 20 0.032 (0.016) 0.952 (0.009)
El 30 24 12 0.032 (0.017) 0.959 (0.021)
PV 32 2 3 0.003 (0.002) 0.685 (0.024)
SG 28 25 24 0.028 (0.015) 0.982 (0.018)
HD 6 13 6 0.023 (0.015) -
MQ 5 11 5 0.019(0.012) -
Table V.7 Genetic variability based on mtDNA analysis (299 bp). For each population, number of individuals (n), number of polymorphic sites (Poly site^), number of haplotypes (Haplo), nucleotide diversity (TT) and gene diversity {H) are shown.
Results from the mismatch distribution tests were not significant, as the
differences between pairs of haplotypes in each population shown multimodal
distributions (0.01 < raggedness index < 0.1; P > 0.09 for each test). The test was not
run for MQ and HD. Fu's test for neutrality was not significant for SLI, EI and PV
(P > 0.05 - no evidence of selecfion acting) but provided a significant and large
negative value of Fs for SG that might indicate a demographic expansion of the
population (P < 0.0001). However, Tajima'D test did not confirm the result for SG
(£) = -0.09, P > 0.1) and provided no evidence of selection acting on this part of the
mtDNA control region in any population (P > 0.05 for each population).
125
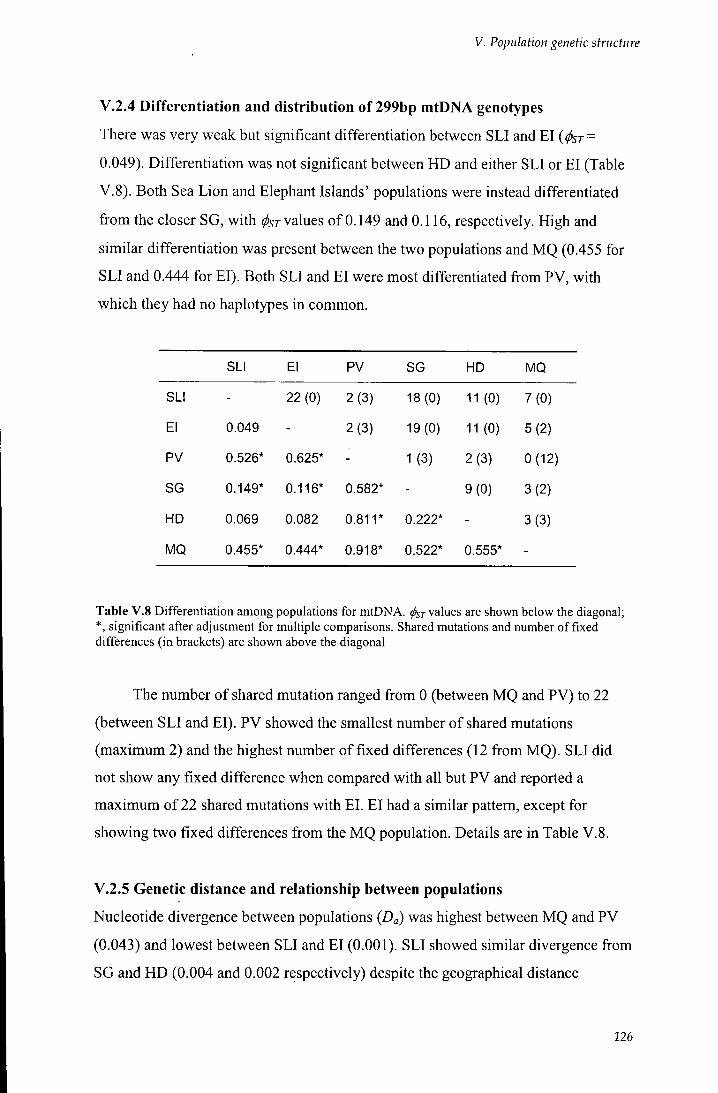
V. Population genetic structure
V.2.4 Differentiation and distribution of 299bp mtDNA genotypes
There was very weak but significant differentiafion between SLI and EI ((psr =
0.049). Differentiation was not significant between HD and either SLI or EI (Table
V.8). Both Sea Lion and Elephant Islands' populations were instead differentiated
from the closer SG, with ( 57-values of 0.149 and 0.116, respectively. High and
similar differentiation was present between the two populations and MQ (0.455 for
SLI and 0.444 for EI). Both SLI and EI were most differentiated from PV, with
which they had no haplotypes in common.
SLI El PV SG HD MQ
SLI - 22 (0) 2(3) 18(0) 11 (0) 7(0)
El 0.049 - 2(3) 19 (0) 11 (0) 5(2)
PV 0.526* 0.625* - 1(3) 2(3) 0(12)
SG 0.149* 0.116* 0.582* - 9(0) 3(2)
HD 0.069 0.082 0.811* 0.222* - 3(3)
MQ 0.455* 0.444* 0.918* 0.522* 0.555* -
Table V.8 Differentiation among populations for mtDNA. (2)57-values are shown below the diagonal; *, significant after adjustment for muhiple comparisons. Shared mutations and number of fixed differences (in brackets) are shown above the diagonal
The number of shared mutation ranged from 0 (between MQ and PV) to 22
(between SLI and EI). PV showed the smallest number of shared mutations
(maximum 2) and the highest number of fixed differences (12 from MQ). SLI did
not show any fixed difference when compared with all but PV and reported a
maximum of 22 shared mutations with EI. EI had a similar pattern, except for
showing two fixed differences from the MQ population. Details are in Table V.8.
V.2.5 Genetic distance and relationship between populations
Nucleotide divergence between populations (Da) was highest between MQ and PV
(0.043) and lowest between SLI and EI (0.001). SLI showed similar divergence from
SG and HD (0.004 and 0.002 respectively) despite the geographical distance
126
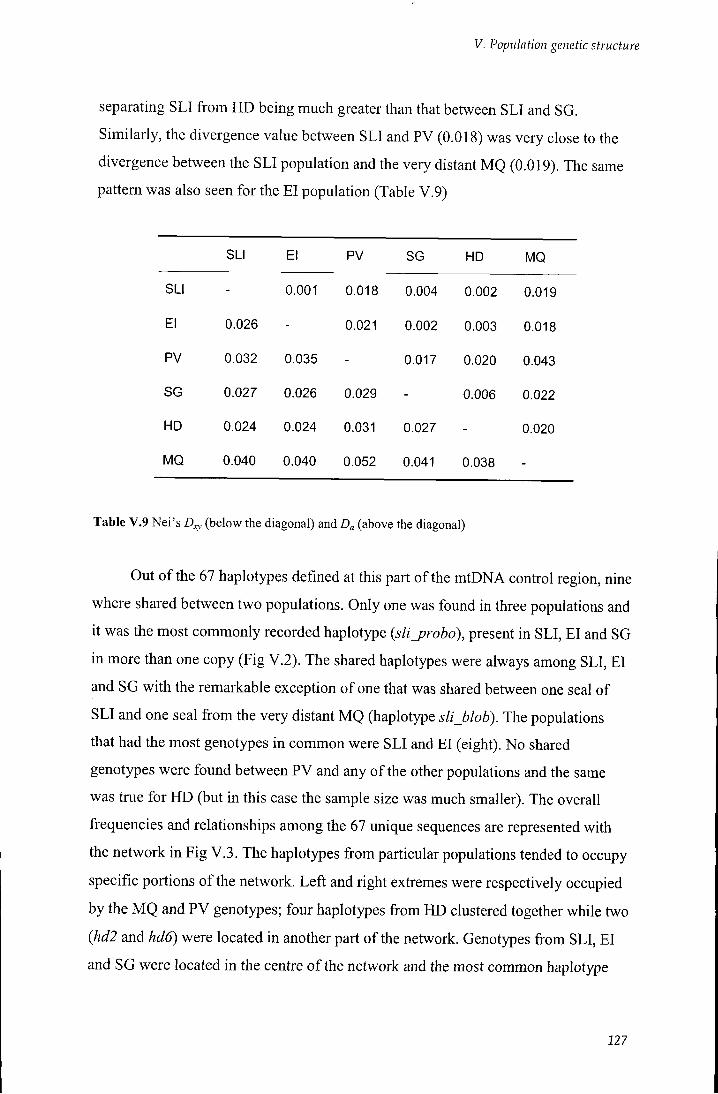
V. Population genetic structure
separating SLI from HD being much greater than that between SLI and SG. Similarly, the divergence value between SLI and PV (0.018) was very close to the divergence between the SLI population and the very distant MQ (0.019). The same pattern was also seen for the EI population (Table V.9)
SLI El PV SG HD MQ
SLI - 0.001 0.018 0.004 0.002 0.019
El 0.026 - 0.021 0.002 0.003 0.018
PV 0.032 0.035 - 0.017 0.020 0.043
SG 0.027 0.026 0.029 - 0.006 0.022
HD 0.024 0.024 0.031 0.027 - 0.020
MQ 0.040 0.040 0.052 0.041 0.038 -
Table V.9 Nei's D„, (below the diagonal) and (above the diagonal)
Out of the 67 haplotypes defined at this part of the mtDNA control region, nine
where shared between two populations. Only one was found in three populations and
it was the most commonly recorded haplotype {sli_probo), present in SLI, EI and SG
in more than one copy (Fig V.2). The shared haplotypes were always among SLI, EI
and SG with the remarkable exception of one that was shared between one seal of
SLI and one seal fi-om the very distant MQ (haplotype slijblob). The populations
that had the most genotypes in common were SLI and EI (eight). No shared
genotypes were found between PV and any of the other populations and the same
was true for HD (but in this case the sample size was much smaller). The overall
frequencies and relationships among the 67 unique sequences are represented with
the network in Fig V.3. The haplotjqjes from particular populations tended to occupy
specific portions of the network. Left and right extremes were respectively occupied
by the MQ and PV genotypes; four haplotypes from HD clustered together while two
(hcl2 and hd6) were located in another part of the network. Genotypes from SLI, EI
and SG were located in the centre of the network and the most common haplotype
227
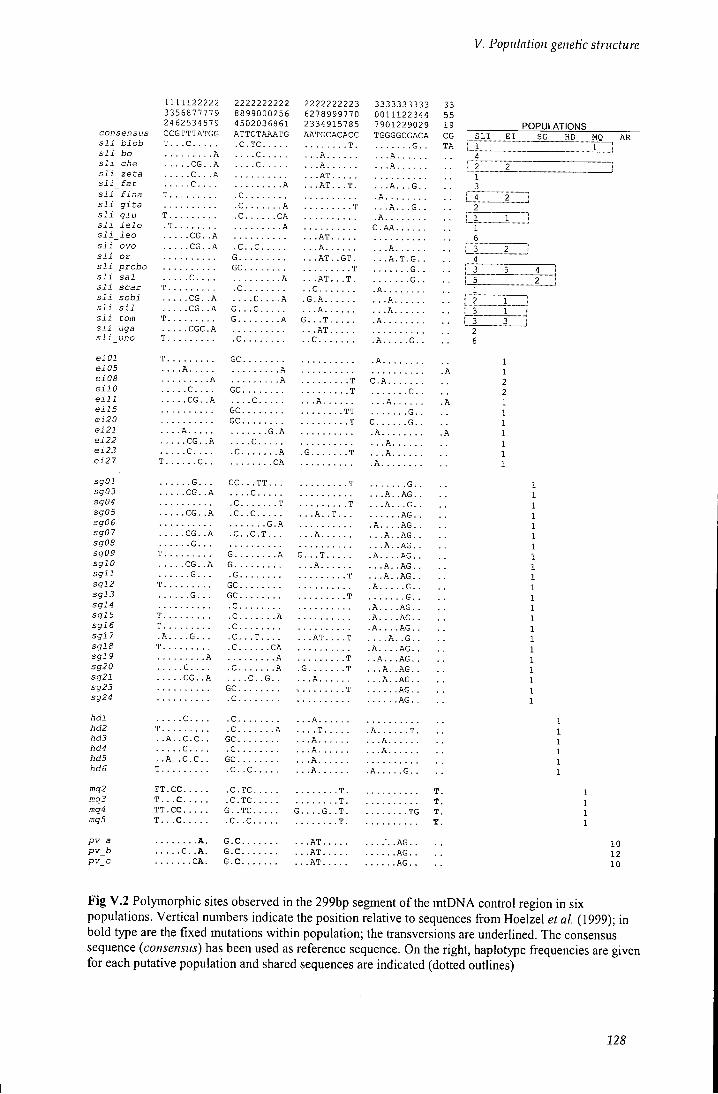
V. Population genetic structure
consensus sli blob
1 1 1 1 1 2 2 2 2 2 3 3 5 6 8 7 7 7 7 9 2 4 6 2 5 3 4 5 7 9 C C G T T T A T G G T . . . C
2 2 2 2 2 2 2 2 2 2 8 8 9 9 0 0 0 2 5 6 4 5 0 2 0 3 6 8 6 1 A T T C T A A A T G . C .• T C
2 2 2 2 2 2 2 2 2 3 6 2 7 8 9 9 9 7 7 0 2 3 3 4 9 1 5 7 8 5 A A T G C A C A C C _ . T
3 3 3 3 3 3 3 3 3 3 0 0 1 1 1 2 2 3 4 4 7 9 0 1 2 2 9 0 2 9 T G G G G C G A C A
n sli bo A . . . . c . . . . . A sli che C G . . A . . . . c . . A sli zeta . . C . . . A . . . A T sli fat . . C . . . . A . . . A T . . . T . Q sli~ fina T .c
. . . A T .
sli gi ta .c A T A Q sli gl u T .c C A sli ielo . T A C . A A sli leo . . C G . . A . . . A T .
C . A A
sli ovo . . C G . . A . c . . c . . . . . A . . sli oz G . . . A T . . G T .
T . . . A T G
sli probo G C . . . A T . . G T .
T Q sli sal . . C . . . . A . . . A T .
. .c . . T . Q
sli scar T .c . . . A T .
. .c sli sli
sebi sil
. . C G . . A
. . C G . . A . . . . c . . .
G . . . C . . . A . G . A . .
. . . A . . . . . A .
A sli torn T G A G . . . T A sli uga . . C G C . A . . . A T sli_ uno T .c c . A . . . . . G . .
eiOl T GC A ei05 . A A eiOS A A T C A eilO . . 0 G C T Q Bill . . C G . . A . . . . c . . . . . . A . . A eil5 G C T T Q ei20 G C T c . . G . . ei21 ei22 ei23 ei27
sgOl sg03 sg04 sg05 sg06 sg07 sgOa sg09 sglO sgll sgl2 sgl3 sgl4 sglS sgl6 sgl7 sglS sgl9 sg20 sg21 sg23 sg24
hdl hd2 hd3 hd4 hd5 hd6
mq2 mq3 mq4 mqS
pv_a pv_b pv_c
. . A . . .
. . . C G .
. . . C . . . . A . C A
3 3 5 5 19 C G T A
. . . . G . . . G C . . . T T . . . T Q
. . . C G . . A . . . . C . . . A . . A G . . Q . C T T A
. A G . . Q
. . . C G . . A . C . . c G . A . A . . . . A G . .
. A G . .
. A G . .
. A G . .
. A G . .
. . G . .
. . . C G . . A
. . . . G . . . . . . A .
. A G . .
. A G . .
. A G . .
. A G . .
. A G . .
. . G . .
T G A G T . A . . .
. A G . .
. A G . .
. A G . .
. A G . .
. A G . .
. . G . .
. . C G . . A G . . . A . . . A .
. A G . .
. A G . .
. A G . .
. A G . .
. A G . .
. . G . .
. . . G . . . . G T . . . A .
. A G . .
. A G . .
. A G . .
. A G . .
. A G . .
. . G . . T GC . A . . .
. A G . .
. A G . .
. A G . .
. A G . .
. A G . .
. . G . . . . . G . . . G C T Q
. C . A . . . . A G . . . A G . . . A G . . . . G . . . A G . . . A G . .
A G . .
A G . . A G . .
T . C A . A . . . . A G . . . A G . . . A G . . . . G . . . A G . . . A G . .
A G . .
A G . . A G . .
T . C . A . . .
. A G . .
. A G . .
. A G . .
. . G . .
. A G . .
. A G . . A G . .
A G . . A G . .
. A T
. . . G . . . . C . . . T . . . . . C C A
. . . A T . . . . T . . . . A . A . . .
. A G . .
. A G . .
. A G . .
. . G . .
. A G . .
. A G . . A G . .
A G . . A G . .
A A T . . A . .
. A G . .
. A G . .
. A G . .
. . G . .
. A G . .
. A G . . A G . .
A G . . A G . .
. . c . . . . . C A G T . . . A .
. A G . .
. A G . .
. A G . .
. . G . .
. A G . .
. A G . . A G . .
A G . . A G . .
. . C G . . A G C T
. A G . .
. A G . .
. A G . .
. . G . .
. A G . .
. A G . . A G . .
A G . . A G . . . C
. A G . .
. A G . .
. A G . .
. . G . .
. A G . .
. A G . . A G . .
A G . . A G . .
. .c . C . . . A . .
. A G . .
. A G . .
. A G . .
. . G . .
. A G . .
. A G . . A G . .
A G . . A G . .
T . C A . . . . T . A T . .A . . c . c . . G C . . . A . . A
. . c . . . . . C . . . A A . . A . . c . c . . G C . . . A . .
T . C . . C . . . A . A . . . . G . .
T T . cc , C . T C T T . T .c . C . T C T T . T T . cc G . - T C G . . . . G . T . T G T . T . 0 . c . . c T T .
A . G . C . . . A T . . . . A T . . . . A T .
A G . . A G . . A G . .
. . C . . A .
. . . , C A . G . C G . C
. . . A T .
. . . A T .
. . . A T .
A G . . A G . . A G . .
POPULATIONS S L I E I SG HD MQ
i 1 1 1 4
i 2 2
10 12 10
Fig V.2 Polymorphic sites observed in the 299bp segment of the mtDNA control region in six populations. Vertical numbers indicate the position relative to sequences from Hoelzel et al. (1999); in bold type are the fixed mutations within populafion; the transversions are underlined. The consensus sequence (consensus) has been used as reference sequence. On the right, haplotype frequencies are given for each putative population and shared sequences are indicated (dotted outlines)
128
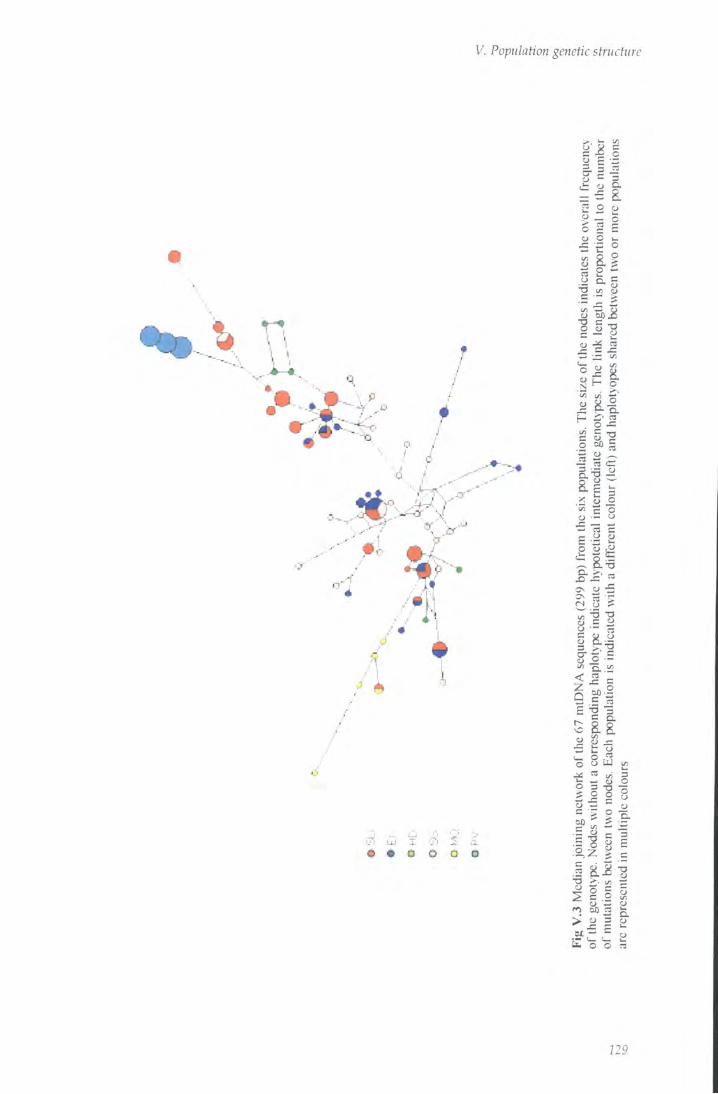
V. Population genetic structure
i " US I Cu ^ l i * « « o o «
CJ c w
5- = ^
5 2 o _ 6 g
:3
•5
O v.
I Q. = V3 P
•S ;S •=
H c5 o
.1 -1 l i s
E £ 2
I I I OS m 5
o c
1« 1/1
i l l s a l
^ 8 u o
o
• 2 , Z
^ 1 c
5
.2 i i i
l i i o —
CO 50 CO > I S t - c 1— L - l« t o o
£
=
329
V. Population genetic structure
was the centre o f a star-like structure, linked with rarer haplotypes belonging to SG and EI . Two SG genotypes were shared with SLI, both in multiple copies, while the remaining seals from SG had unique haplotypes. The majority o f them were linked among each other and few to genotypes from EI and SLI. Only three seals from SLI and nine f rom E I had unique haplotypes and SLI unique genotypes were concentrated to the central-right part o f the network.
M Q haplotypes were well separated from the central network, through a SLI -
E I haplotype (separated by 5 mutations). However, one genotype o f the M Q group
was shared with a male sampled on SLI. Also the Argentinean group was well apart
(6 mutations f rom the closest genotype, sli_zeta), with only three haplotypes equally
represented among 32 individuals. They were located on a single matrilineage where
the two external haplotypes could be derived from the third {arl, in central position)
by a single bp mutation.
Phylogenies derived using the neighbour-joining and the maximum parsimony
methods showed equivalent topology. The maximum parsimony consensus tree of
the 299bp control region is shown in Fig V.4. The tree showed a general 'comb-
structure'. However, three main lineages were recognised with bootstrap supports of
90%, 86% and 80%, respectively. The first one included all five haplotypes from
M Q , one o f which was the same as an individual haplotype from SLI {sli_blob); the
second lineage included the three PV genotypes, and the third one was represented
by two out o f the six H D haplotypes {hdS and hd5). The other four HD sequences
were positioned along the main structure. Pairs o f haplotypes were also separated
from the main structure though not strongly supported (bootstrap supports from 57%
to 67%). A l l but one were pairs o f multiple copies haplotypes and mixed
populations. Only one pair was represented by unique haplotypes belonging to only
one population {ei05 and ei21) and it was the pair more strongly supported (67%).
A l l the remaining haplotypes were distributed along the main structure o f the tree.
130
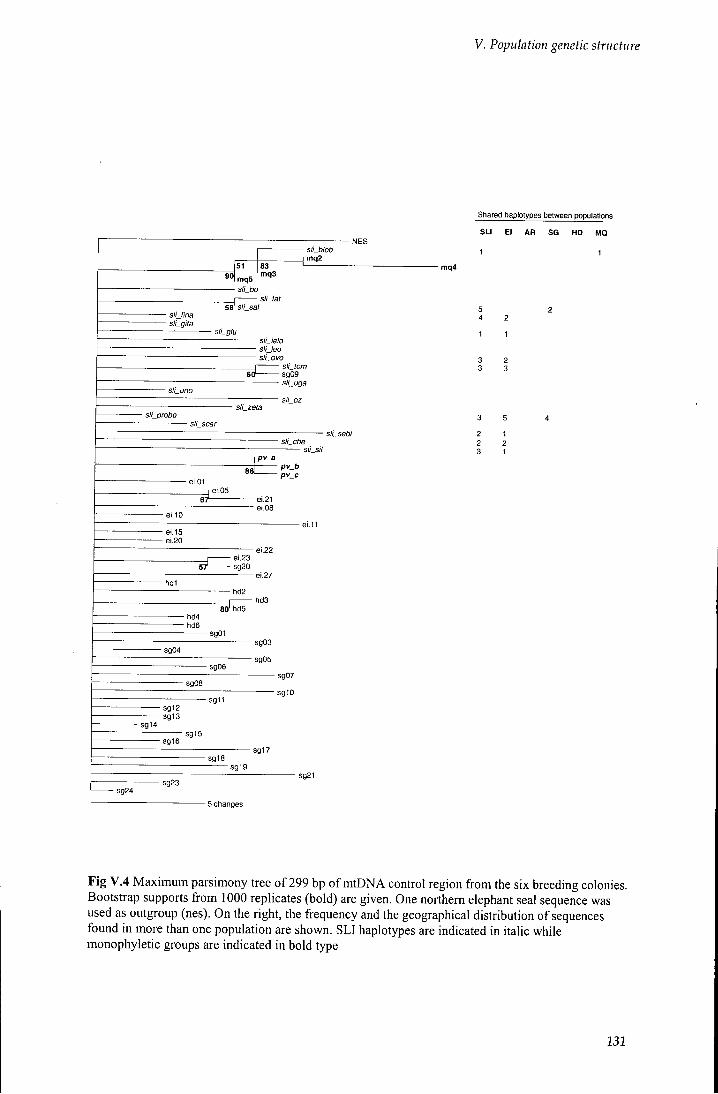
V. Population genetic structure
90 , 51 mq5
83 mq3
sli_blob mq2
- mq4
- St!_bO
• slijina sILgita
58' sILsal
- sILglu - slijelo • slijoo • sILovo
• sILuno
- slijom - s g 0 9 - sli_uga
- sli_oz
- sILprobo
sILche sli_sil
- pv_b -pv_c
- ei.21 - Gi.08
- ei.15 - ei 20
-e i .1 l
- ei.23 - sg20
• hd4 • hd6
hd2
^ h d 5
- s g O l
• sg04 - sg03
- sg05
-sg08
• sg14
- s g 1 2 - s g 1 3
•sg1t
- s g 0 7
- sg10
- sg16 -sg16
-sg18 - s g 1 7
- s g 1 9
- sg24 - s g 2 3
- 5 changes
Shared haplotypes between populations
SLI E l AR S G HD MQ
1 1
Fig V.4 Maximum parsimony tree of 299 bp of mtDN A control region from the six breeding colonies. Bootstrap supports from 1000 replicates (bold) are given. One northern elephant seal sequence was used as outgroup (nes). On the right, the frequency and the geographical distribution of sequences found in more than one population are shown. SLI haplotypes are indicated in italic while monophyletic groups are indicated in bold type
132
V. Population genetic structure
V.3 DISCUSSION
In this chapter, the genetic variation o f nuclear and mitochondrial loci in the
southern elephant seal populations of Sea Lion and Elephant Islands was assessed.
The pattern o f variation was investigated in the context o f previous results on
breeding colonies belonging to the same South Georgia stock and to the more distant
Heard and Macquarie Islands.
V.3.1 Level of genetic variation
The levels o f genetic variation detected in the populations of SLI and EI at both
microsatellite and mitochondrial markers were high and comparable with the
variation present in most other breeding colonies. Nucleotide diversity in the two
populations had the same value o f 3.2%, which is among the highest reported for a
mammal species (see Table 2 in Slade 1997). It was close to those reported for SG,
H D and M Q , and an order o f magnitude higher than for the PV population (Hoelzel
et al. 2001). The numbers o f haplotyopes found at the breeding colonies o f SLI and
EI were also elevated, respectively 20 (out o f 57 seals) with 29 polymorphic sites,
and 12 (out o f 30 seals) with 24 polymorphic sites. Both values were similar to those
reported for SG and much greater than the number o f haplotypes and mutations
screened for the geographically close PV colony. It thus seems to confirm that PV
might have had a different history compared to the other populations, and that there
is a very low gene f low between the Argentinean population and the nearby breeding
sites.
V.3.2 Genetic differentiation and population structure
V.3.2.1 Population structure within the South Georgia stock
In previous studies (Hoelzel et al. 1993a; Slade 1997; Slade et al. 1998; Hoelzel et
al. 2001), striking differences were found between SG and PV, similar to differences
found between SG and the very distant MQ. However, no data were available from
any o f the other colonies belonging to the same South Georgia stock. In this study,
equivalent genetic divergence was found between PV and all the island sites of the
stock.
132
V. Population genetic structure
Microsatellite data showed similar variation among the populations of SLI, EI , SG and PV and accounted for a between-population difference o f 1.6%. However, most of this variation was attributable to the genetic differences between PV and the other colonies, lvalues between PV and SLI (3.5%) and PV and EI (4.1%) were greater than those observed between the peninsular colony and SG (2.5%). This result is surprising, since SLI is geographically intermediate between PV and SG and it was hypothesised as a conduit for dispersal between SG and the Argentinean population (Hoelzel et al. 2001).
The extent of genetic differentiation of PV from SLI and EI was also high at
the mitochondrial locus. For the two islands, 53% and 63% of the genetic variance
was due to differences wi th PV, values very similar to that between SG and PV
(58%). The presence o f exclusive haplotypes at PV (Hoelzel et al. 1993a) was also
confirmed, since no genotypes were shared between the Argentinean colony and the
two islands. In a median joining network, the three PV haplotypes were not only on a
separate branch, but they were also at the very extreme of the network. Networks of
this kind frequently show common haplotypes in more central positions, linked with
more rare and external haplotypes (O'Corry-Crowe et al. 1997; Bandelt et al. 1999;
Girman et al. 2001). In this network, however, the PV genotypes followed a different
pattern: they all showed elevated frequencies and the two external ones could be
derived from the central one by only a single bp mutation. Hoelzel et al. (2001)
suggested a single founding event for PV with no further significant female
recruitment. The elevated differentiation between PV and SLI and EI , data from
genetic distance and divergence, and the absence of shared haplotypes between PV
and the two islands seem to support this evidence. The genetic distance between two
populations, in fact, gives a relative estimate of the time that has passed since the
two populations were a single cohesive unit. Small estimations o f distance may
indicate population substructure (i.e. subpopulations in which there is random
mating, but between which there is a reduced amount o f gene flow). However small
values o f distance may also be present because the populations are completely
isolated but have only been separated for a short period o f time.
High genetic similarity was instead found between SLI and EI , as geographic
structure was very weak at both microsatellite and mitochondrial loci. Genetic
233
V. Population genetic structure
similarity was also present between these two colonies and SG, but in this case the results showed discordance between the two marker sets. In fact, while the mtDNA data indicated significant genetic subdivision between SG and SLI and between SG and EI , results f rom microsatellite analysis showed very weak subdivision. These results suggest limited female dispersal between SG and the other two colonies and a more pronounced male-biased dispersal among the three colonies.
Weak or no differentiation between SLI and EI , at both microsatellite and
mitochondrial markers, suggests either a similar pattern o f dispersal between sexes
or a relatively short separation time between the two colonies (Slade 1997). Elephant
Island was under ice until the last ice-age (about 18 000 years ago) so it is plausible
that, becoming available as a breeding site, seals from the Falklands moved south
towards it. The two islands are about 1000 km apart, a distance well within the
known dispersal capacity o f the species (McConnell and Fedak 1996; Hindell and
McMahon 2000). Data on the colony of Sea Lion Island indicate that the population
size has remained almost constant since 1989 (Galimberti et al. 2001), although it
could represent what is left from a formerly larger population that used to occupy
other sites in the rest o f the Falklands (Galimberti and Boitani 1999). This could
support the hypothesis o f movements towards new breeding sites. Moreover,
resightings o f seals f rom SLI have been reported on other islands o f the South
Shetland Archipelago, on King George Island and Livingston Island, both about
1100-1200 km away f rom SLI (Galimberti unpublished data). The majority of them
were 2-3 year old males, while one was a female previously observed breeding on
SLI for three years (she returned to breed on SLI after being on Livingston Island).
The hypothesis o f movements o f seals between SLI and EI is also supported by the
data on genetic distances. The genetic distance (DA) between the two islands (1.8%)
was smaller than the distances between SG and either E I (4.3%) or SLI (3.2%). SG
might have been isolated from the two islands by the presence of ice. The ice might
have receded from EI and initially facilitated the breeding dispersal between the
South Shetlands and the Falklands, leaving the SG colony relatively isolated.
However, no evident factors seem to explain why patterns o f dispersal were
excluding the colony of SG.
234
V. Population genetic structure
Similar distribution o f genetic variation among SG, SLI and EI at microsatellite loci was also confirmed by the population assignment test. This test was carried out to assess whether there was sufficient differences between populations to make an individual's genotype characteristic o f the site where it was sampled. With this test, only about 40% of the individuals from each population were assigned to the colony where they were sampled. However, assignments were significantly more succesfiil between SLI and EI when seven markers instead o f five were considered.
V.3.3 Population structure among stocks
When M Q and H D were included in the analysis, the extent o f genetic differentiation
between colonies was not always related to the geographical distances between
them. Despite the geographical distances separating them, the mtDNA data indicated
greater similarity between SLI (or EI) and HD than between SLI (or EI) and SG,
where the geographical separation between populations is much smaller. Genetic
divergence between SLI and H D was the same as that estimated between SLI and
SG, but the geographical distances between the colonies are very different. SLI is
1500 km from SG, while it is some 7600-7700 km from HD. A similar genetic
pattern (and similar distance) was also shown by EI , which was as genetically distant
f rom SG as from H D (and geographically much more distant from the second than
from the first). Moreover, the levels o f genetic structure between SLI and HD and
between E I and H D were not significant while they were significant between each of
the two islands and SG ((f>sT o f 15% between SLI and SG, and of 12% between EI
and SG). However, the situation was different when the BETA loci were compared.
In this case, with data f rom a larger H D sample, the two loci were not able to
differenfiate among the four colonies (SLI, EI , SG and HD).
Even though none o f the H D mitochondrial genotypes were found in any of the
other populations, the data show higher genetic similarity between this island and the
South Georgia stock than previously thought (Slade et al. 1998). In the median
joining network, four o f the six H D haplotypes were grouped together and connected
to the same branch as the PV haplotypes. The other two H D haplotypes, however,
were positioned separately at the other end o f the network, among haplotypes
135
V. Population genetic structure
belonging to SLI, SG and EI . The number o f haplotypes available (and their frequencies) f rom H D was very small, hence results should be interpreted with caution. However, as the H D group was not well separated from the rest, it is plausible that other haplotypes from and increased sample from the same colony would occupy intermediate positions between these four and the other two.
The phylogenetic tree confirmed the pattern o f genotype distribution. In
previous studies (Slade 1997; Hoelzel et al. 2001), the group of four genotypes
clustered together into a lineage that included haplotypes sg22 and was closest to
PV. However, wi th the addition o f data from SLI and EI , the topography of the
phylogeny changed. Only two genotypes f rom H D clustered together but they were
as distant f rom the PV lineage as the other sequences o f the tree. The other HD
genotypes were positioned along the main structure with haplotypes belonging to the
other colonies o f the South Georgia stock.
A weak genetic structure between H D and the group of SG-SLI-EI is
surprising i f the physical distance separating these colonies and HD is considered
(HD is about 6500 km from SG and 7500 from SLI). However, other colonies in the
Kuerguelen stock (Prince Edward Islands, Crozet, Marion, Kerguelen) lie between
SG and HD, sometimes less than 1000 km distant from each other. The distance is
well within the dispersal capacity o f the seals and it is possible that they are used by
the seals to move between more distant sites, though no evidence has been found to
support this hypothesis. Since genetic similarity between SG and H D had already
been detected (Slade 1997; Slade et al. 1998), the weak genetic structure between
H D and the other two colonies of the stock was not unexpected. Slade (1997)
suggested a common origin for the H D and island populations o f the South Georgia
stock, with a separation during the last glacial maximum (18000 years ago). He
proposed that a founding colony could have existed o f f the coast of southern Africa.
Hoelzel et al. (2001) suggested instead that most islands might have remained
suitable for breeding throughout that Ice Age, or that seals temporarily relocated to
the more northern islands (Falklands, Kerguelen, Aukland Islands).
Another discordance between genetic and geographic distances was found
between SLI, PV and M Q . The subdivision between SLI and PV was greater than
that between SLI and the extremely distant M Q ((Z>sr o f 53% and 46%, respectively).
236
V. Population genetic structure
This underlines the high degree o f genetic structure within the South Georgia stock. The M Q sample showed extreme differentiation from all other colonies. The pattern was confirmed also for the populations of SLI and EI, at both mitochondrial and BETA loci. Nucleotide divergence between SLI and MQ was moderately elevated (0.019). However, one seal from SLI showed the same haplotype as one individual belonging to the M Q group (haplotype sli blob) (Fabiani et al. in press). This exception is extremely remarkable, since M Q genotypes clustered in a strongly supported lineage, separated f rom the other seals and defined by two fixed differences. No haplotypes from M Q have previously been found in any other colony, and SLI does not share the lineage o f M Q with any other seal than BLOB. Out o f 154 sampled individuals f rom five different colonies only this seal had the same haplotype as an individual sampled on MQ.
V.3.4 Southern elephant seal dispersal and its implications
The seal f rom SLI showing the ' M Q haplotype' was an adult male. It is very likely
that he was bom on M Q and that he covered the distance, some 8000-8500 km from
SLI. This is the greatest distance that an elephant seal has been recorded navigating
(see Stevick et al. 2002 for a review). Because males do not contribute their
mitochondrial genotype to the offspring, the haplotype carried by a male can only be
sampled during the animal's lifetime and only in the location at which he is present
at the moment o f sampling. I f the male migrates to a different population, so w i l l his
haplotype. I f it was his mother that migrated to a different population, she would
have passed her haplotype onto her offspring and hence more copies would have
been available for sampling.
The hypothesis o f female elephant seals being philopatric is supported by long-
term studies o f identified individuals (Lewis et al. 1996) although some degree of
female dispersal and transfer between colonies may occur. Both females and males
on SLI show site fidelity (Fabiani et al. in prep.), although males exhibit a more
flexible strategy in choosing the sites for breeding than females. Nevertheless, a
single female observed breeding on SLI for two years has been resighted breeding on
PV two years after her last record on SLI (Galimberti unpublished data). However,
the resighting effort on the two colonies is not constant all year around. The
137
y. Population genetic structure
population o f SLI is small and very well monitored during the breeding season (and at the beginning o f moulting), but constant monitoring is not carried out during other periods. On the other hand, the PV colony is much bigger (ca 160 km - Baldi et al. 1996) and much more dispersed. The majority o f the beaches used by the seals to breed are not under regular observation both during and out o f the breeding season, and it is therefore possible that some of the seal movement has been missed.
NichoUs (1970) reported that 60% of branded adult males and 77% of adult
females on M Q were found breeding within 4 km of their birthsites. Nevertheless, he
noted that males might show higher dispersal with age. Hindell and Little (1988)
reinforced the idea o f strong female philopatry, recording two 23 yr old females
breeding within 1 km of their birthsite on M Q . Southern elephant seals have been
recorded travelling up to 3000 km from breeding and moulting sites to remote
foraging areas (see Table 7, in Slade 1997). Telemetry data have indicated long
distance excursions for females and more restricted migrations for males
(McConnell and Fedak 1996; Campagna et al. 1999). Mark-recapture studies on the
other hand, have reported resightings o f males between different colonies and, more
frequently, o f young non-breeding males that come ashore for moulting. These data
suggest that males, as in the majority o f mammals (Dobson 1982), disperse more
than females, even i f females may forage over greater distance and deeper water than
males. The male that migrated from M Q to SLI was present on SLI for two breeding
seasons (1995 and 1996). He gained the control of a harem only in 1996 and
successfully reproduced, fathering at least 18 offspring. The migration of this male
and his elevated reproductive success is an example o f the potential homogenising
effect that dispersal and mating system can have on the genetic structure o f a
population.
138
VL Discussion
This study demonstrated that southern elephant seals on Sea Lion Island are
extremely polygynous, with only a few males fathering a large number o f offspring
and the majority o f males not reproducing at all. Female gregariousness partly
accounts for this despotic mating system. Their mating behaviour, ecological
features, and male capability o f herding and keeping the control of the females, are
among the major factors in shaping the mating system of this species. I f female
gregariousness creates the conditions for polygyny to develop, individual male
performance can realise the highest levels o f reproductive variance.
High reproducfive variance and site fidelity are common aspects in pinniped
mating systems. High reproductive variance can strongly affect the level o f genetic
variation in a population and, at the same time, social structuring can lead to a non-
random pattern o f generic relatedness among individuals and to levels of kinship that
are higher within than between groups. In addition, female site fidelity and
philopatry can contribute to a high gene correlation among offspring and adults
within social groups (Chesser 1991a). Only recently have studies been conducted on
the distribution o f genetic relatedness within pinniped colonies ( i . e. in harbour seals:
Schaeff et al. 1999; grey seals: Pomeroy et al. 2000). However, prior to this study,
the distribution o f genetic relatedness in a highly polygynous pinniped such as the
elephant seal had never been investigated, although female site fidelity had been
documented (Nicholls 1970; Hindell and Litfle 1998).
This research has demonstrated that elephant seals have a high genetic
diversity (i.e. HE f rom 0.57 to 0.77; nucleotide diversity o f 3.2%, among the highest
reported for mammal species), in spite o f the fact that Ne w i l l be reduced in local
populations by high male reproductive variance. Moreover, social organisation and
site fidelity o f females did not lead to any genetic significant sub-structure within the
SLI colony. These results suggest high rates o f genetic dispersal among colonies and
a high overall Ne for the species.
139
VI. Discussion
Although both males and females on SLI show a certain degree o f site fidelity (Fabiani et al. in prep.), individuals do move between colonies. Evidence of gene f low between SLI and other colonies of the stock has been found, although historical and geographical events might have made movements easier between some colonies than others. Despite the extensive mtDNA differentiation, gene flow has also been found between SLI and the very distant Macquarie Island, as the data suggest that a male bom on M Q travelled some 8000 kilometres to breed on SLI. His paternal success was high on SLI , and this illustrates the potential homogenising effect that dispersal and mating system can have on the genetic structure o f a population.
V L l Male reproductive success and behaviour
The level o f mating monopolisation was high in the SLI population, confirming
previous behavioural results. Moreover, not only were the distributions of observed
mating behaviours highly correlated with the distribution o f paternity, but also
indices based on female holding and copulatory behaviours were very good
predictors o f individual paternity.
Few studies have invesfigated the relafionship between behavioural and
genetic indices o f male success in polygynous mammals. In grey seals (Worthington
et al. 1999), fiir seals (Gemmell et al. 2001) and Soay sheep (Coltman et al. 1999a)
behaviour overestimated the variance in male reproductive success and level of
polygyny. In Soay rams, behavioural data explained only 22.4% of the variation in
the number o f offspring sired (Coltman et al. 1999a). Instead, in red deer, the
distributions o f behavioural indices well approximated that of paternity (around 90%
o f the variance in reproductive success could be predicted f rom behavioural data) but
they did not give an accurate measure of absolute mating success (Pemberton et al.
1992). In fact, their behavioural indices, calculated backdating the day of conception
from the date o f birth, underestimated true paternity for the most successful males
and overestimated it for less successfiil males. They suggested that the discrepancy
might arise because the indices were not precise enough: females were not observed
every day o f the season (and they might move between harems), and many males are
simply unsuccessful (even i f they can hold a harem for a period o f time).
240
VI. Discussion
In this study, behavioural indices were strongly correlated with paternity (coefficient o f determination, R' in the range 0.80-0.99), and predicted individual paternities 60%-100% o f the times in each harem. In each harem, the largest proportions o f paternities were predicted by identifying the first male seen copulating wi th the female (73%-100%), information that requires the record of each female's history during the whole breeding season. Lower accuracy, although elevated in the majority o f the harems (56-96%), was obtained by knowing the seasonal holder o f each harem. For harems where the level o f congruence was lower, the correspondence between behavioural and genetic data increased when probable errors in the paternity assignment (harems RUB96, SF96, SI296) were considered, or paternities from other holders (SI296, SI297) were added (see Discussion in Chapter I I I for details). This result may suggest important practical 'guidelines' for behavioural studies on this colony. It shows that behavioural observations are good predictor o f paternity and, consequently, that minimal behavioural observations (i.e. holder males during the peak of the season) can give a good estimate of the distribution o f reproductive success among males at SLI.
Quantifying variation in the lifetime mating and paternity success of
individuals is essenfial for determining the potential for sexual selection in a
population (Arnold and Wade 1984; Andersson 1994; Coltman et al. 1999c).
However, very few studies on mammals have measured mating success o f
individuals o f both sexes throughout their lifetime (see Clutton-Brock 1988). Most
published paternity studies consider only a few breeding seasons (see Coltman et al.
1999c; Worthington et al. 1999), even though reproductive success can be very
different among years. Social, demographic and ecological factors can change
among breeding seasons and hence affect the distribution o f seasonal male
reproductive success (Coltman et al. 1999c). Therefore, seasonal and prolonged
collection o f data is extremely important to identify patterns o f reproductive success
among males. The application o f genetic markers requires a great deal o f effort, as
the method requires regular coUecfion of large numbers of samples and long periods
o f lab work and data analysis. In this context, the possibility o f using behavioural
estimates collected in short periods o f the breeding season to accurately estimate the
141
VI. Discussion
distribution o f paternity would be an important methodological tool for carrying out long-term studies with fewer difficulties.
VL2 Comparisons of variance in male mating and reproductive success
Currently, only a few comparisons can be made with reported genetic variance of
male success, due to both the small number o f genefic studies available and the
differences in methodological measurements among them. In general, comparisons
between studies o f variance in reproductive success are difficult , because of
differences in methods (e.g. sampling strategy, individuals included in the analysis,
calculation o f the indices), in spatial and temporal scales or other criteria that may
generate bias (Coltman et al. 1999c). These differences should be kept in mind when
either species or populations are compared.
The opportunity o f selection / (the ratio of the variance in reproductive success
to the square o f mean), has frequently been used to compare mating systems between
species, mainly because of the easy availability of relevant parameters (mean and
variance o f reproductive success) for natural populations. However, the method
presents many potential drawbacks (Trail 1985; Downhower et al. 1987; Kokko et
al. 1999). As a ratio, it changes when either of its components changes; hence it is
dependent o f the mean. In particular, mean values less than 1 w i l l have a particularly
dramatic effect on / ( i . e . / w i l l increase greatly), thus comparisons of/between
systems with different mean fitness are questionable (Downhower et al. 1987). It is
also sensitive to the units o f fitness measurement, so / values calculated using
different fitness units should be compared with caution. Finally, there is no reference
value against which the values of / can be compared, i.e. / does not have a bounded
range (Kokko a/. 1999).
Mating variance can also vary within species, between and within populations
(Petrie and Kempenaers 1998), and among breeding seasons (Coltman et al. 1999c;
Galimberti et al. 2001). Galimberti et al. (2002a) used E'/ZF/measures (index of
fertilisation) to compare male mating success distributions between southern
elephant seals o f SLI wi th those o f Punta Delgada (DEL). They found that different
spatial scales o f analysis revealed different magnitudes o f variation between
populations, and concluded that optimal scales to calculate potential o f selection
242
VI. Discussion
could be different even in different populations of a same species. In this case, different propensities o f males to move between zones/areas/harems were observed between the two colonies. This was in part due to the different topographical and geographical characteristics o f the colonies. The SLI colony is small, almost isolated from other colonies, and males have very few opportunities to breed away from the island during the same breeding season (Galimberti and Boitani 1999). On the contrary, the population o f DEL is not isolated from the other breeding groups of the Peninsula (Campagna and Lewis 1992; Campagna et al. 1993) and males have plenty o f alternative sites to breed. Keeping in mind these differences, / from ENFI data was always larger on SLI than on DEL, but the significance of the difference varied depending on the spatial scale of the calculation of / . In the present study, the mating variance was confirmed with genetic data that gave an estimate of / for the SLI population of 4.04. Moreover, when independent harems were analysed, / greafly varied among them (from 2.68 to 11.27) reaching in some harems a value four-fold greater than the smallest value. These results confirm that the level of potential selection can vary locally, and that in elephant seals each harem defines a reproductive context wi th its level o f male competition and polygyny potential.
Although showing different levels of polygyny potential and holder success,
each breeding unit analysed confirmed that the level o f mating monopolisation in
this population is extremely high. Not only did the harem holders achieve the
majority o f paternities in each harem, but also their success did not decrease with
increasing harem size. This confirms previous behavioural results showing that,
while the likelihood o f monopolisation decreases with harem size in the DEL
population, this does not happen on SLI , where the proportion o f each holder
fertilisation is larger and the number of males achieving at least one fertilisation is
smaller (Galimberti et al. 2002b). This is mostly due to the large difference in
Resource Holding Potential (RHP - Parker 1974) between the holders of largest
harems and the rest o f males. Variation in RHP (structural and behavioural) is higher
at SLI than at D E L (Fabiani 1996; Gahmberti and Fabiani unpublished data). In
elephant seals, harem size interacts with individual phenotype to determine
reproductive behaviour o f males (Modig 1996). In the SLI population, some males
are able to get uncontested control of harems with more than one hundred females.
143
VI. Discussion
These harem holders are capable o f effectively managing the complexity of a social system that comprises hundred o f individuals, maintaining the access to females, even in unfavourable socionomic condifions (i.e. very large group of females to control and other males that constantly try to infiltrate the harem). The demographic and social environment is a crucial factor in defining the likelihood of mating monopolisation among males. The higher the RHP difference among males, the higher the likelihood for males wi th larger potenfial to monopolise the mating season (Dawkins and Krebs 1979). In the SLI populafion, the social context has been changing since 1999. In these recent years, a reducfion in the likelihood of monopolisation has been evident, mainly due to a reduction in RHP difference among males. More males similar in RHP have been present on the island and hence it has become more diff icul t for them to maintain the control of a harem for long periods (Galimberti unpublished data).
A t SLI, controlling a harem is by far the most rewarding reproductive strategy.
Nevertheless, males also pursue other strategies. They associate with harems waiting
for opportunities to infiltrate and mate, try to copulate with solitary females, or they
fol low and mate wi th departing females. However, these strategies are rarely
successfial. Females can mate with more than one male each season, but this study
showed genefic evidence that the first male seen mafing with a female is almost
always the father o f her pup (77% to 100% of the time in each harem). Since the
colony was not under observation 24hrs a day, it is likely that some females recorded
at their 'first copulation' had instead already been mated. Similarly, genefic
assignments might have been occasionally incorrect (Marshall et al. 1998, Coltman
et al. 1999c). Keeping this in mind, there is strong evidence that securing a female's
first copulation is the best strategy to put into effect, and that sperm competition
might act towards this direction. In this context, the harem holder strategy clearly
allows a male to dominate copulations and to control females during their oestrus
period. The other strategies rarely succeed, and males that adopt them seem be
forced to a role 'making the best of a bad job ' (Krebs and Davies 1993; Andersson
1994; Cunningham and Birkhead 1998).
Copulating with solitary females could in theory be rewarding, but solitary
females are extremely rare. In 1996 and 1997, 1.9% and 3.7% of the total females in
244
VI. Discussion
the colony (n = 527 and 563, respectively) were alone at parturition. Of these, the majority joined a harem before coming into oestrus (80% in 1996 and 67% in 1997), hence only a very small proportion of females remained alone during the whole nursing period (0.38% in 1996 and 1.2% in 1997 of the total number of females). Similarly, at the end o f the season, when only few females are left on the beaches, only 1.1-1.8% o f them were alone (Galimberti et al. 2000a). With so few females available, males pursuing this strategy caimot achieve a high reproductive success.
Mating with departing females does not seem to have relevant success,
although further investigation is needed. Almost all females mate before their
departure with either the harem holder or other males, and it is likely that those
males who mated first would father their offspring (R^ between FIR CO index and
paternity = 0.94; congruence 77-100%). Comparing with DEL, a smaller percentage
of female departures are intercepted at SLI than at DEL ( 4 1 % out of 229 at SLI and
59% out o f 120 at DEL) . The distance between the harems and the sea is small on
SLI, and the departure events tend to be shorter (mean of 15 minutes compared to 31
minutes on DEL) and involve the interaction with secondary males a smaller
percentage o f times (Galimberti et al. 2000a). The situation on SLI seems to be very
different from those exhibited in northern elephant seal colonies (see also Discussion
in Chapter I I I ) , where almost 100% of departing females are intercepted (Le Boeuf
and Mesnick 1991a).
Finally, males can associate with a harem and try to infiltrate the female group.
This strategy is likely to be more successfiil in larger harems. In large harems, the
holder might not be able to continuously control the situation, and secondary males
can take advantage o f moments when the vigilance is less strict and achieve some
copulations (Le Boeuf 1974). However, at SLI harem holders were extremely
efficient, and their success was not correlated with the size of the harem. Although
the strategy partly succeeded (9 out o f 51 secondary males were recorded mating and
17 were attributed a paternity at 80% confidence level), only three secondary males
obtained two paternities. This strategy appears to be the most rewarding among those
followed by non-holder males of SLI. Even so, the success achieved is still
extremely small i f compared with that obtained by holders. However, both DEL and
SLI are at the lower end o f the variation in harem size and density recorded for
145
VI. Discussion
southern elephant seals. Harems sizes are larger at South Georgia (mean = 74.2, range 6 to 232, McCann 1980), Macquarie Island (mean = 277, up to 1000, Carrick et al. 1962), and Kerguelen (mean = 102, range 5 to 1350, Van Aarde 1980). Therefore, in the case of much larger harems and more packed colonies, the level of monopolisation by the holder may be different and more affected by the number of females breeding in each unit. In northern elephant seal colonies, where individuals breed at higher density and form larger harems with several associated males, the percentages of copulations of the harem holders decrease with the harem size (Le Boeuf 1974; Le Boeuf and Reiter 1988).
Among other polygynous pinnipeds, the level of polygyny does not reach such
high values as those reported for southern elephant seals. In southern sea lions
{Otaria byronia) seasonal / estimated from copulations varied from 0.73 (Campagna
and Le Boeuf 1988) to 1.31 (Galimberti unpublished data) in two different
populations of the Peninsula Valdes, while in Juan Fernandez fur seals
(Arctocephalus philippii) a behavioural estimate of/over two seasons equalled 0.73
(Francis and Boness 1991). In grey seals {Halichoerus grypus), behavioural data
indicated a high variance in male reproductive success (Twiss 1991), but genetic
results showed a lower variance in paternity than predicted (Amos et al. 1993; Ambs
et al. 1999; Worthington Wilmer et al. 1999). In harbour seals (Phoca vitulina), the
variance in reproductive success was extremely low, with the population
approaching genetic monogamy (seasonal / from 0.05 to 0.18). The results partly
agreed with the authors' predictions, as aquatic mating is well documented in this
species. Besides, Harbour seals are only slightly dimorphic, though males cluster on
a scale such that polygyny is possible (Coltman et al. 1998). Genetic polygyny far
lower than expected was found in the Antarctic fur seal {Arctocephalus gazella),
where only 35 males out of 243 among two breeding seasons were assigned one
paternity, and only four males were assigned two (Gemmell et al. 2001).
Vl.2.1 Lifetime reproductive success
The variance in male mating success determined in this study can give indications on
the variance in male lifetime mating success on SLI. The data represent only an
approximation of the actual lifetime reproductive success of the analysed males, due
146
VI. Discussion
to the short duration of the project compared to the reproductive Hfespan of a male. In fact, since males reach reproductive maturity at around 8-10 years of age and live on average 16-18 years, it is possible that those males analysed were successful prior to the start of the project, or that they migrated to successfully breed elsewhere. In this case, the behavioural data available would be an under-estimate of their actual mating success. Preliminary data on lifetime mating success of males of SLI over six seasons (1995-2000) give values of ENFI ranging from 0 to 350 (Appendix C). The estimate is calculated on the number of breeding males present each year on land (i.e. it does not consider males on land but not participating in breeding activities, hence it is a conservative estimate). The range is an underestimate since the male (LEO) with the highest total 'TVF/reported (350; seasonal ENFI: 107, 118, 125) bred on SLI from 1995 to 1997, but very likely also held a harem before 1995 (the year when the study on island started). Among the other most successful males, two (OVO and TOM) were harem holders for four consecutive years (1995-1998) and achieved total ENFIs of 257 and 258 (seasonal ENFI: 10, 80, 78, 90 and 32, 36, 80, 110, respectively). A third male (SCAR) bred on SLI for six seasons (1995-2000). The first season he did not hold a harem (and he did not achieve any success), while in subsequent years he always got the control of a harem of 25-108 females. In 1996, his harem was not under behavioural observation hence his total observed ENFI is an underestimation of his success. Over the period 1997-2000 his total ENFI was 331 (seasonal ENFI: 64, 71, 92, 104).
The reproductive history of a successful male seems to generally follow an
increasing trend, as his success increases with his experience and he is able to hold
larger harems with the passing seasons. Hence LEO, who was highly experienced in
1995 and held a harem of 112 females, was very likely a harem holder in previous
seasons. In contrast, OVO was a beta male for the first part of the 1995 season and
held a harem of six females only at the end of it, while TOM held a harem of 32
females. Their experience clearly increased from 1995 to 1998, and it likely that
1995 was their first season as holders of harems. Similarly, SCAR was not
successfiil in 1995, when he was a peripheral male of a harem of 99 females. His
FA^F/increased during the consecutive seasons, as he held harems of 25, 40, 83, 65
and 108 females fi-om 1996 to 2000, respectively.
247
VI. Discussion
These ENFI estimates indicate that males at SLI can have a high seasonal success for many consecutive years; as a result, their lifetime success can be much higher than that reported for the northern elephant seals. In the Califomian population, Le Boeuf and Reiter (1988) estimated a hfetime ENFI on four cohorts ranging from 0 to 121. The male with the highest estimate (121) achieved an ENFI equal or higher than 30 during only two breeding seasons (seasonal ENFI: 1, 1, 6, 8, 30, 61, 14). Only two other males had a lifetime success estimate higher than 60 (63 and 97). In both cases they held a harem for only two breeding seasons, during which the estimates of their success were 20 and 26 for the first male and 30 and 66 for the second.
Compared to other mammal species, the elephant seal mating system is
probably most similar to that of the red deer (Cervus elaphus). In both species
breeding is seasonal, males compete vocally and physically for mating, and
dominant males monopolise harems of females. In a six-year study, total
reproductive success in red deer stags varied from 0 to 32 (Clutton-Brock et al
1988). The maximum value in red deer is hence one tenth the maximum value
reported in the SLI population, and clearly indicates that the level of polygyny in the
latter is much higher. The level of mating monopolisation in SLI harems is also
higher than that reported for lek species (i.e. different measures of inequality in
southern elephant seals were always larger when compared with lek species - see
Galimberti et al 2002b), and lek species are often considered among the most
'extreme' mating systems, in term of reproductive success variance and potential
action of sexual selection (Clutton-Brock 1989). Elephant seals are a classic
textbook example of polygyny and sexual selection but such a high level of mating
monopolizafion in the species should be considered far from expected, considering
that their harems are at least one order of magnitude larger than harems of other
polygynous mammals (Clutton-Brock 1989). The structured social behaviour of
elephant seals (McCann 1981), the large size of female groups, the concentrated
breeding season (Galimberti and Boitani 1999), and the persistence of non-holders in
trying to interact with females, produce a complex social network. Harem holders
exhibit an amazing capability to manage such a complex situation.
148
VI. Discussion
VI.3 Breeding system and genetic structure VI.3.1 Female gregariousness and site fidelity
'Any useful model for the evolution ofpinnipeds biology must account for extreme
gregariousness, because in the absence of gregariousness during the breeding
season, organised polygamy is obviously impossible' (Bartholomew 1970). The
potential for males to mate with many females is highest when receptive females are
moderately asynchronous and spatially clumped (Emlen and Oring 1977). A high
degree of sociality among females should enable dominant males to control access to
oestrus females, and high polygyny and social structuring of females can in turn
produce higher levels of kinship within than between groups (Chesser 1991b). This
study demonstrated that the high degree of polygyny in southern elephant seals does
not lead to any genetic sub-structure within the population. Furthermore, site fidelity
and philopatry were not predictors of the relatedness patterns in the population.
Female gregariousness during the breeding season is extremely high in the
genus Mirounga and in many otariids, but theoretical predictions on kin selection
have never found clear evidence in pinnipeds. For example, some species exhibit
fostering behaviour, but high levels of relatedness were not found between pups and
fostering females in harbour seals (Schaeff et al. 1995). What seems most probable
is that females that become separated from their pups (or loose them at birth) might
attempt to foster pups that are alone or also with other females. On SLI, females that
lose their pup or that do not give birth remain in the harem throughout the breeding
season and often try to approach other females' pups. In one case, a female that lost
her pup at birth fostered a weaned pup after his mother left the harem. Although very
rarely, females can give birth to two pups but do not always nurse both of them. In
these cases, the pup deserted by the mother can either be expelled from the harem or
fostered by another female. These occasional behaviours do not seem to be the
ultimate factors that promote female gregariousness and site fidelity.
Harem grouping can act as a defence from aggressive male mating behaviour
(Cassini 1999). Harassment by males may have important consequences in the
evolution of phenotypic and behavioural traits by promoting an arms race between
the sexes (Clutton-Brock et al. 1992; Glutton-Brock and Parker 1995). Through the
dilution effect of grouping and the exclusion of marginal males by higher-ranking
149
VI. Discussion
males, females in a group can suffer less harassment. In southern elephant seals, females breeding in a harem experience lower level of harassment than solitary females, and females in larger harems are less frequently harassed than females breeding in smaller groups (Galimberti et al 2000a). Galimberti et al (2000a) analysed 65 harems from DEL and SLI, ranging in size from 3 to 168 females, therefore their results provide a strong indication of the positive effect of female clustering on harassment reduction (i.e. in a multiple regression, weighed harassment rate was not related to the number of associated males but it was negatively related to harem size: beta = -0.6, P = 0.0072). Although sometimes intense, female harassment on SLI does not affect the likelihood of successfiiUy weaning a pup (Galimberti et al 2000a). However, in other populations and species, where harems are larger and beaches more crowded, it can involve serious injures to females and reduce their reproductive success (Le Boeuf and Mesnick 1990a; Boness et al 1995). Because it can involve severe costs for female fitness, harassment can therefore exert a significant selective pressure in shaping the female behaviour and hence the pinniped mating systems (Cassini 1999, 2000).
Site fidelity and philopatry are correlated with female gregariousness. From a
genetic point of view, females returning to the same site to breed and aggregating in
groups can show a higher level of kinship among each other than between
individuals of other groups (Chesser 1991a). Site fidelity is an important element of
mammal life history strategies (Greenwood 1980) and is typical of the breeding
biology of many land-breeding pinnipeds (e.g. Callorhinus ursinus: Baker et al
1995; Mirounga leonina: NichoUs 1970, Lewis et al 1996; Mirounga angustirostris:
Reiter et al 19SI; Halichoerus grypus: Pomeroy et al 1994; Phoca vitulina: Stanley
etal 1996, Schaeffe^a/. 1999).
Apart fi-om a generalized tendency to return to the same breeding colony,
female southern elephant seals from Sea Lion Island consistently choose the same
part of the colony for breeding during consecutive seasons. Of 646 females, 84%
gave birth within 500 m of their parturifion locafion in the previous year (70%
returned to the same breeding zone and 37%) to the same area). The degree of site
fidelity of Sea Lion Island's females is higher than that recorded for the elephant
seals of the close colony of DEL (the 3 km criterion adopted Lewis et al (1996) will
150
V/. Discussion
include almost 100% of the females i f applied to the Sea Lion Island's population). Similarly, it is comparable with the 71% reported for the northern species (Reiter et al. 1981).
The mating system of a species can strongly influence female movements and
patterns of individual site fidelity. In the territorial northern fiar seal, females return
to the same breeding site with an almost metric precision, favoured by the territorial
social organizafion and the topography of breeding sites (Gentry 1998). Such a
precise fidelity is not achievable in species that do not have a territorial social
system. The level of fidelity exhibited by southern elephant seals of SLI is
surprisingly high i f the structure of their mating system is considered. Females on
SLI come ashore on the beach and join a harem where they will stay for the rest of
the breeding season (only 20% out of 1151 females changed harem between arrival
and parturition). Therefore, their nursing location depends on the location (and
presence) of the harem, which, in turn, is constrained by social factors (i.e. number
and dispersion of the other females in the harem and the capability of the harem
holder to herd females). Moreover, SLI breeding habitat is extremely uniform. It
consists of open long and large beaches with no particular topographical features that
seem to attract females to specific areas of the colony, as has been reported for the
grey seal (Twiss et al. 2000; Pomeroy et al. 2001), or to preclude the formation of a
harem. Large parts of the beaches are free of females and the distance between
adjacent harems varied from 130 to 415 meters in 1997 (distances between harem
centres, Galimberti unpublished data). It is thus remarkable that, in this social and
spafial environment, females are able to give birth in the same area in different years.
At the colony of SLI, the higher level of mean relatedness among females than
among males supports the behavioural evidence of larger returning rates for females
than for males. However, the tendency of females to return to the same site of the
previous year does not lead to a higher level of kinship within harems. In fact,
among those females returning to the same harem, only seven pairs out of 220
showed a kinship level larger than 0.4, and among the other females no relationship
was detectable. These results illustrate that the mating system acts as a dilution
factor on the distribution of relatedness. Although females tend to come back to the
151
VI. Discussion
same part of the colony to reproduce, it appears that the size of the harems is sufficient to mitigate the effect of philopatry and fidelity.
The hypothesis of genetic mate selection, which has been advanced for grey
seals (Amos et al 2001), does not seem to be supported by the results of this study.
Females were in fact not found either more or less genetically similar to their holder
than to other males. However, the genetic data covered only three years and it was
not possible to compare partners of the same females among seasons, as Amos et al
(2001) did with 48 grey seal females. Nevertheless, the behavioural and genetic
results suggest that females do not choose their harem in response to the genotypic
relatedness they have with the harem holder (i.e. the male with whom they are likely
to mate). Once arrived on land, females may move harem before parturition and, i f
they do so, they tend to move towards larger harems (70% out of 207 females that
move harem - see Discussion in Chapter IV). Moreover, a harem can change its
holder during the season, females almost never move after giving birth (unless they
are isolated females and join a harem after parturition), and there is no indication that
they follow their holder to other harems (Galimberti et al. 2000a). Females tend to
choose the same part of the colony of previous years and their precision tends to
increase with their experience (Fabiani et al in prep.). However, their grouping does
not seem to be the result of 'genetic decisions' (i.e. towards higher kinship among
females or towards particular related males) but it seems instead a strategy mainly
adopted to avoid harassment from inexperienced males.
VI.3.2 Dispersal patterns
The degree of faithfiilness shown by mammals and birds to their natal or breeding
site is often gender-dependent (Greenwood 1980). One likely consequence of such
asymmetric dispersal is that a species may exhibit different patterns of geographic
population structure at genes with biparental transmission (i.e. nuclear markers such
as microsatellites) versus those at which transmission occurs through only one sex
(i.e. mtDNA and Y chromosome for mammals) (Avise 1994). In most mammalian
species, dispersal is male-biased, and higher female fidelity and more frequent male
dispersal are also frequently suggested from data for cetaceans (e.g. for Megaptera
novaeangliae: Baker et al 1990; Delphinapterus leucas: O'Corry-Crowe et al 1997;
152
VI. Discussion
Physeter macrocephalus: Lyrholm et al. 1999; Phocoenoides dalli: Escorza-Teviiio and Dizon 2000).
The genetic analysis of elephant seals of SLI and EI supported the concept of
female fidelity to breeding site, and showed genetic differentiation among colonies
both within and between stocks. However, female mediated gene flow was present
among colonies, with the apparent exception of Peninsula Valdes, confirming the
resuhs from Hoelzel et al. (1993). In particular, differentiafion at nuclear markers
was higher than at mitochondrial markers, suggesting a difference in the pattern of
breeding dispersal between sexes.
Differences in the characteristics of the mtDNA and nuclear markers, such as
mutation rate and/or rate of genetic drift, might also be responsible for the difference
in geographical structure found between them. The greater sensitivity of mtDNA to
genetic drift is usually explained by two factors: its smaller effective population size
and its higher rate of mutation. Given its haploid nature and its maternal inheritance,
mtDNA is 1/4 times the number of heritable copies and so potentially 1/4 the
diversity of any nuclear marker. Therefore, the effective size for mtDNA markers is
four times lower than that for nuclear markers. A smaller effective size increases the
rate of genetic drift and therefore the rate at which populations are expected to
exhibit differences in allele frequencies. In southern elephant seals female effective
population size has been calculated as being roughly equal to the population
effective size, hence the rate of drift of mtDNA is expected to be twice that of the
nuclear genome (Slade 1997). The higher mutation rate of the mtDNA can also
generate greater subdivisions for two major reasons. First, the population would
show a larger number of alleles at lower frequency than those exhibited by nuclear
genes. Second, isolated populations would have more chances to contain private
alleles (i.e. unique alleles that can occur within each population after separation).
However, these differences between mitochondrial and nuclear genomes do not
appear to be sufficient to explain the differences in the genetic structure found in this
study. Thus, a difference in the rate of gene flow for males and females seems to be
the major factor in determining the different patterns of genetic differentiafion.
Previous studies, revealing three main stocks among southern elephant seals
(Slade et al. 1998; Hoelzel et al 1993), were confirmed in this research, and the
153
VI. Discussion
populations of EI and SLI generally fit into the South Georgia stock structure. From the analysis of mitochondrial markers, striking differenfiation was found between EI and SLI and the close PV, while a few haplotypes were shared with SG. Given the presence of only one mtDNA lineage among the Argentinean seals, Hoelzel et al (2001) suggested a founding event on the peninsula with no fiirther significant female recruitment and a more frequent dispersal by males between the peninsula and the close islands. In fact, although differentiation between PV and other colonies was also present at nuclear markers, patterns of variation were similar within colonies. It is however surprising that the level of differentiation between PV and SLI was very similar to that of PV from SG ( ^^^= 0.53 and 0.58, respectively). The shorter geographical distance between PV and SLI does not seem to have lead to more frequent movements of individuals between the two colonies than between SG and PV.
Although no males or females marked on PV have been resighted as breeding
on SLI since 1995 during an extremely well monitored study (Galimberti and
Boitani 1999), the PV colony is much bigger and individuals more dispersed than on
SLI (Campagna and Lewis 1992). The topography of PV does not allow a constant
monitoring of the entire breeding population, i.e. not all individuals breeding on the
peninsula are tagged or otherwise marked, and daily censuses are carried out only on
a small part of the colony. It is then possible that unmarked seals on SLI have not
been identified as coming from PV, or that marked seals from SLI have not been
resighted on PV. Nevertheless, a female was recorded breeding both on SLI and PV
among six breeding seasons. She was first tagged as an adult breeding female on SLI
in 1995, she skipped the breeding season on the island in 1996 (and she was not
resighted elsewhere that year) and was recorded breeding again in the colony in
1997. After 1997 she did not breed anymore on SLI, but in 2000 she was resighted
breeding on PV, at the colony of Punta Delgada (DEL).
Despite the extensive mitochondrial variation {^T=0.5), genetic evidence of
male mediated gene flow was also found between SLI and MQ, as an adult male
(BLOB) showed the same haplotype as a seal belonging to the very well defined MQ
lineage (Fabiani et al in press). Elephant seals have been found to move
considerable distances during their foraging-moulting trips. Individuals from South
154
VI. Discussion
Georgia travelled up to 3000 km from their breeding to foraging sites (McConnell and Fedak 1996), while a juvenile tagged on MQ has been resighted moulting on Peter 1 0 Y , some 5200 km away from Macquarie (Hindell and McMahon 2000). Among pinnipeds, northern elephant seals can cover up to 11000 km during their round-trip post-breeding migrations (Stewart and De Long 1994), while harp seals can travel 4000 km from feeding to breeding grounds (Stevick et al. 2002). Individual variation in migrafion patterns is evident; however, up to now, a breeding migration distance of as long as 8000 km has never been recorded for any seal. This distance appears to be closer to those covered by whales during their migrations from feeding to breeding areas (6500 in sperm whales, 8000 km in humpback whales, 9000 km in grey whales, see Stevick et al. 2000 for a review).
It is very likely that BLOB was bom on MQ. A stepping-stone migration (i.e.
migrafion only between neighbour populafions) is possible but less likely. The MQ
lineage is very well supported and defined by two fixed differences. It is unique to
MQ, with the only exception of BLOB out of 154 sampled individuals coming from
five populafions. Given the pattern of genetic diversity shown by the six colonies
analysed, and the patterns of fidelity and dispersal in elephant seals (i.e. males
disperse more than females and females exhibit higher social and geographic
fidelity), the most parsimonious interpretation is that the male travelled from MQ to
SLI. I f his mother had migrated to different populations, she would have passed her
haplotype onto her offspring and more copies would have been available for
sampling. Moreover, a female would leave copies of her haplotypes in different
populations as she migrates and those offspring could also disperse to other
populations. Hence, females have a greater potential to homogenise populations
through dispersal, since their migrafion impacts not only females, but also the co-
migrating offspring regardless of its sex (Tiedemann et al. 2000). If, despite this,
females exhibit higher levels of genetic structure, it would only be 'conservative' to
assume that dispersal is male biased, meaning that males are moving, mating and
homogenising the populations (Escorza-Treviiio and Dizon 2000).
I f female dispersal can have a stronger impact on the genetic structure of a
population than male dispersal (Tiedemann et al. 2000), their effects are strongly
influenced by the population mating system. In case of high polygyny, not only will
155
VI. Discussion
just a few males reproduce, but also they will pass their genes to a high number of offspring, effectively increasing the genetic uniformity in the population. The effects of the mating system wil l , in turn, co-interact with life history traits (i.e. growth, mortality and productivity patterns), with 'condition' and 'quality' of reproductive individuals (McNamara and Houston 1996), and finally contribute to the genetic structure of the species.
The male BLOB was on SLI for only two seasons (1995 and 1996). He
successfiiUy reproduced only in 1996, gaining the control of a harem and fathering at
least 18 offspring. His excepfional migration may indicate that even populations
separated by wide genetic and geographic distances can be linked. His migration
combined with his reproductive performance is an example of the potential
homogenising effect that dispersal and mating system can have on the genetic
patterns of a population. At the same time, his dispersal might have contributed to
his reproductive success. In fact, he might have found better demographic and social
conditions on SLI than on MQ, as on Macquarie Island harems are on average some
five times larger than on SLI (270 vs 45 females), and density of individuals much
more elevated (McCann 1980).
Concluding, the comparison of behavioural and genetic data in assessing
genetic and dispersal patterns of a population, together with information from mating
system studies, provide important evidences. First, direct behavioural studies on
current populations may provide a misleading picture of the geographic distribution
of genetic patterns, because they fail to access the evolutionary aspects of population
dispersion and structural organisation revealed by genes. Second but no less
important, geographic distribution of genetic markers may provide a misleading
picture of current dispersal, gene flow or mating patterns, because they retain records
of evolutionary events and demographic contexts that may differ from those of the
present (Avise 1994). Therefore, a frill understanding of the population genetic
structure of a species, and of those factors significant for its evolutionary mating
patterns, requires investigations from both behavioural and genetic perspective.
156
VU. References
VIL References
Ahnesjo, I . , Vincent, A., Alatalo, R., Halliday, T. and Sutherland, W. J. (1993). The
role of females in influencing mating patterns. Behav. Ecol. 4 (2): 187-189.
Alderson, G. W., Gibbs, H. L. and Sealy, S. G. (1999). Parentage and kinship
studies in an obligate brood parasitic bird, the brown-headed cowbird (Molothrus
ater), using microsatellite DNA markers. The American Genetic Association 90:
182-190.
Allen, P. J., Amos, W., Pomeroy, P. P. and Twiss, S. D. (1995). Microsatellite
variation in grey seals {Halichoerus grypus) shows evidence of genetic
differentiation between two British breeding colonies. Mol. Ecol. 4: 653-662.
Altmann, J. (1974). Observational study of behaviour: sampling methods. Behaviour
49:227-267.
Altmann, J., Hausfater, G. and Altmann, S. A. (1988). Determinants of reproductive
success in savannah baboons, Papio cynocephalus. In: Reproductive success (ed.
Clutton-Brock, T. H.), pp. 403-418. Univ. Chicago Press, Chicago & London.
Ambs, S. M. , Boness, D. J., Bowen, W. D., Perry, E. A. and Fleischer, R. C. (1999).
Proximate factors associated with high level of extraconsort fertilization in
polygynous grey seals. Anim. Behav. 58: 527-535.
American Society of Mammalogists (1967). Standard measurements of seals. / .
Mammal. 48: 459-462.
257
VI/ . References
Amos, W., Twiss, S., Pomeroy, P. P. and Anderson, S. S. (1993). Male mating success and paternity in the grey seal, Halichoerus grypus: a study using DNA fingerprinting. Proc. Zool Soc. Land. B 252: 199-207.
Amos, W., Worthington Wilmer, J. and Kokko, H. (2001). Do female grey seals
select genetically diverse mates? Anim. Behav. 62 (1): 157-164.
Anderson, S. S., Burton, R. W. and Summers, C. F. (1975). Behaviour of grey seal
during a breeding season at North Rona. J. Zool Lond. Ill: 179-195.
Andersson, M . (1994). Sexual selection. Princeton Univ. Press, Princeton.
Ambom, T. A., Lunn, N. J., Boyd, I . L. and Barton, T. (1992). Aging hve Antarctic
fur seals and southern elephant seals. Mar. Mammal Set 8: 37-43.
Arnold, S. J. and Wade, M . J. (1984). On the measurement of natural and sexual
selection. I . Theory. Evolution 38: 709-734.
Avise, J. C. (1994). Molecular markers, natural history and evolution. Chapman
and Hall, London.
Baker, C. S., Palumbi, S. R., Lambertsen, R. H., Weinrich, M. T., Calambokidis, J.
and O'Brien, S. J. (1990). Influence of seasonal migration on geographic distribution
of mitochondrial DNA haplotypes in humpback whales. Nature 344: 238-240.
Baker, J. D., Antonelis, G. A. and York, A. E. (1995). Natal site fidelity in northern
fur seals, Callorhinus ursinus. Anim. Behav. 50 (1): 237-247.
Baldi, R., Campagna, C, Pedraza, S. and Le Boeuf, B. J. (1996). Social effects of
space availabihty of southern elephant seal in Patagonia. Anim. Behav. 51: 717-724.
158
VII. References
Balloux, F. and Luogon-Moulin, N. (2002). The estimation of population differentiation with microsatellite markers. Mo/. E'co/. 11: 155-165.
Bandelt, H., Forster, P., Sykes, B. C. and Richards, M. B. (1995). Mitochondrial
portraits of human populations using median networks. Genetics 141: 743-753.
Bandelt, H., Forster, P. and Rohl, A. (1999). Median-joining networks for inferring
intraspecific phylogenies. Mol. Biol. Evol. 16 (1): 37-48.
Bartholomew, G. A. (1970). A model for the evolution of pinniped polygyny.
Evolution 24: 546-559.
Belkhir, K., Borsa, P., Chikki, L., Raufaste, N. and Bonhomme, F. (2001). Genetix
4.02, logiciel sous Windows TMpour la genetique des populations. Laboratoire
Genome, populations. Interactions, CNRS UPR 9060, Universite de Montpellier n ,
Montpellier (France).
Berube, M. , Aguilar, A., Dendanto, D., Larsen, F., Notarbartolo di Sciara, G., Sears,
R., Sigurjonsson, J., Urban-R, and Palsboll, P. J. (1998). Population genetic
structure of North Atlantic, Mediterranean Sea and Sea of Cortez fin whales,
Balenoptera physalus (Linnaeus 1758): analysis of mitochondrial and nuclear loci.
Mol. Ecol. 7: 585-599.
Blouin, M. S., Parsons, M. , Lacaille, V. and Lotz, S. (1996). Use of microsatellite
loci to classify individuals by relatedness. Mol. Ecol. 5: 393-401.
Boness, D. J., Bowen, W. D. and Francis, J. M. (1993). frnplications of DNA
fingerprinting for mating systems and reproductive strategies of pinnipeds. Symp.
Zool. Sac. Lond 66: 61-93.
159
V// . References
Boness, D. J., Bowen, W. D. and Iverson, S. J. (1995). Does male harassment of females contribute to reproductive synchrony in the grey seal by affecting maternal performance? 5e/7fi[v. Ecol. Sociobiol 36: 1-10.
Boness, D. J. (1991). Determinants of mating systems in the Otariidae (Pinnipedia).
In: Behaviour of Pinnipeds (ed. Renouf, D.), pp. 1-44. Chapman and Hall, London.
Bowen, B. W., Meylan, J. P., Ross, J. P., Limpus, C. J., Balazs, G. H. and Avise, J.
C. (1992). Global population structure and natural history of the green turtle
(Chelonia mydas) in terms matriarchal phylogeny. Evolution 46: 865-881.
Boyd, I . L. (1991). Environmental and physiological factors controlling the
reproductive cycle of pinnipeds. Can. J. Zool 69: 1135-1148.
Brown, B. W. and Russell, K. (1996). Multiplicity program. Identifying important
results from multiple statistical tests. Version 2. University Of Texas, Houston.
Burke, T., Davies, N. B., Bruford, M . W. and Hatchwell, B. J. (1989). Parental care
and mating behaviour of polyandrous durmocks Prunella modularis related to
paternity by DNA fingerprinting. Nature 338: 249-251.
Buriand, T. M. , Barratt, E. M. , Nichols, R. A. and Racey, P. A. (2001). Mating
patterns, relatedness and the basis of natal philopatry in the brown long-eared bat,
Plecotus auritus. Mol Ecol 10: 1309-1321.
Campagna, C. and Le Boeuf, B. J. (1988). Reproductive behaviour of southern sea
Hon. Behaviour 104: 233-261.
Campagna, C. and Lewis, M . (1992). Growth and distribution of a southern elephant
seal colony. Mar. Mammal Scl 8 (4): 387-396.
160
VII. References
Campagna, C, Bisioli, C , Quintana, F., Perez, F. and Vila, A. (1992). Benefits of group breeding for female southern sea lions. Anim. Behav. 43: 541-548.
Campagna, C, Lewis, M . and Baldi, R. (1993). Breeding biology of southern
elephant seals in Patagonia. Mar. Mammal Sci. 9 (1): 34-47.
Campagna, C, Fedak, M . A. and McConnell, B. J. (1999). Postbreeding distribution
and diving behaviour of adult male southern elephant seals from Patagonia. J.
Mammal. 80: 1341-1352.
Carrick, R., Csordas, S. E. and Ingham, S. E. (1962). Studies on the southern
elephant seal, Mirounga leonina (L.). IV. Breeding and development. C.S.I.R.O.
Wildl. Res. 7: 161-197.
Cassini, M . H. (1999). Forum. The evolution of reproductive systems in pinnipeds.
Behav. Ecol. 10 (5): 612-616.
Cassini, M. H. (2000). A model on female breeding dispersion and the reproductive
systems of pinnipeds. Behavioural Processes 51: 93-99.
Cheney, D. L., Seyfarth, R. M. , Andelman, S. J. and Lee, P. C. (1988).
Reproductive success in vervet monkey. In: Reproductive success (ed. Clutton-
Brock, T. H.), pp. 384-402. Univ. Chicago Press, Chicago & London.
Chesser, R. K. (1991a). Gene diversity and female philopatry. Genetics 111: 437-
447.
Clinton, W. L. and Le Boeuf, B. J. (1993). Sexual selection's effects on male life
history and the pattern of male mortahty. Ecology 74: 1884-1892.
Clutton-Brock. T. H. and Parker, G. A. (1995). Sexual coercion in animal societies.
Anim. Behav. 49 (5): 1345-1365.
161
Vn. References
Clutton-Brock, T. H . , Guinness, F. E. and Albon, S. D. (1982). Red deer. Behaviour
and ecology of two sexes. Univ. Chicago Press, Chicago.
Clutton-Brock, T. H . (1988). Reproductive Success. Studies of individual variation
in contrasting breeding systems. Univ. Chicago Press, Chicago & London.
Clutton-Brock, T. H. , Albon, S. D . and Guinness, F. E. (1988). Reproductive
success in male and female red deer. In: Reproductive success (ed. Clutton-Brock, T.
H.) , pp. 325-343. Univ. Chicago Press, Chicago & London.
Clutton-Brock, T. H . , Price, O. F. and MacCoU, A. D. C. (1992). Mate retention,
harassment and the evolution o f ungulate leks. Behav. Ecol. 3 (3): 234-242.
Clutton-Brock, T. H . (1989). Mammalian mating systems. Proc. Roy. Soc. Lond. B
236: 339-372.
Coltman, D. W., Bowen, W. D. and Wright, J. M . (1996). PCR primers for harbour
seal microsatellites amphfy polymorphic loci in other pinniped species. Mol. Ecol. 5:
161-163.
Coltman, D. W., Bowen, W. D. and Wright, J. M . (1998). Male mating success in an
aquatically mating pinniped, the harbour seal (Phoca vitulina), assessed by
microsatellite D N A markers. Mol. Ecol. 7 (5): 627-638.
Coltman, D. W., Bancroft, D . R., Robertson, A. , Smith, J. A. , Clutton-Brock, T. H .
and Pemberton, J. M . (1999a). Male reproductive success in a promiscuous
mammal: behavioural estimates compared with genetic paternity. Mol. Ecol. 8:
1199-1209.
262
V/7. References
Coltman, D. W., Bowen, W. D. and Wright, J. M . (1999b). A multivariate analysis o f phenotype and paternity in male harbour seals, Phoca vitulina, at Sable Island, Nova Scotia. Behav. Ecol. 10 (2): 169-177.
Coltman, D. W., Smith, J. A. , Bancroft, D. R., Pilkington, J., MacColl, A. D. C ,
Clutton-Brock, T. H . and Pemberton, J. M . (1999c). Density-dependent variation in
lifetime breeding success and natural and sexual selection in Soay rams. Am. Nat.
154 (6): 730-746.
Cunningham, E. J. A . and Birkhead, T. R. (1998). Sex roles and sexual selection.
Anim. Behav. 56: 1311-1321.
David, V. and Menotti-Raymond, M . (1998). Automated D N A detection with
fluorescence-based technologies. In: Molecular genetic analysis of populations. A
practical approach (ed. Hoelzel, A . R.), pp. 337-370. Oxford Univ. Press, Oxford.
Davies, N . B. (1991). Mating systems. In: Behavioural ecology - III edition (eds.
Krebs, J. R. and Davies, N . B.), pp. 263-294. Blackwell, Oxford.
Dawkins, R. and Krebs, J. R. (1979). Arms races between and within species. Proc.
Roy. Soc. Loud. B 205: 489-511.
De Ruiter, J. R. and Geffen, E. (1998). Relatedness o f matrilines, dispersing males
and social groups in long-tailed macaques (Macaca fascicularis). Proc. R. Soc.
Lond. B 265: 79-87.
Dessauer, H . C , Cole, C. J. and Hafner, M . S. (1990). Collection and storage of
tissues. In: Molecular systematics (eds. Hill is , D. M . and Moritz, C ) , pp. 25-41.
Sinauer Associates, Sunderland (Mass.).
Dewsbury, D. A. (1982). Dominance rank, copulatory behaviour and differential
reproduction. Q. Rev. Biol. 57: 135-159.
263
VII. References
Downhower, J. F., Blumer, L . S. and Brown, L . (1987). Opportunity for selection:
an appropriate measure for evaluating variation in the potential for selection?
Evolution 41 (6): 1395-1400.
Dunbar, R. I . M . (1984). Reproductive decision. An economic analysis of gelada
baboon social strategies. Princeton Univ. Press, Princeton.
Eberhard, W. G. and Cordero, C. (1995). Sexual selection by cryptic female choice
on male seminal products - a new bridge between sexual selection and reproductive
physiology. TREE 10 (12): 493-496.
Emlen, S. T. and Oring, L . W. (1977). Ecology, sexual selection and the evolution
o f mating systems. Science 197: 215-223.
Escorza-Trevino, S. and Dizon, A . E. (2000). Phylogeography, intraspecific
structure and sex-biased dispersal o f Dall's porpoise, Phocoenoides dalli, revealed by
mitochondrial and microsatelhte D N A analyses. Mol. Ecol. 9: 1049-1060.
Fabiani, A. (1996). Aspetti strutturali e funzionali del comportamento agonistico
maschile nell'elefante marino del sud (Mirounga leonina) [Structural and functional
aspects o f male agonistic behaviour in southern elephant seals (Mirounga leonina)].
(First Degree dissertation). Universita Degli Studi D i Roma "La Sapienza", Roma.
Fabiani, A. , Galimberti, F., Sanvito, S. and Hoelzel, A . R. Breeding site fidelity and
genetic relatedness in southern elephant seals o f the Falkland Island. In prep.
Fabiani, A. , Hoelzel, A . R., Galimberti, F. and Muelbert, M . M . C. Long-range
paternal gene f low in the southern elephant seal. Science In press
264
VII. References
Fay, J. C. and Wu, C. (1999). A human population bottleneck can account for discordance between patterns o f mitochondrial versus nuclear D N A variation. Mo/. Biol. Evol. 16 (7): 1003-1005.
Francis, J. M . and Boness, D. J. (1991). The effect o f thermoregulatory behaviour
on the mating system o f the Juan Fernandez fur seal, Arctocephalus philippii.
Behaviour 119 (1-2): 104-126.
Friedl, T. W. P. and Klump, G. M . (1999). Determinants o f male mating success in
the red bishop (Euplectes orix). Behav. Ecol. Sociobiol. 46: 387-399.
Fu, Y . -X. (1997). Statistical tests o f neutrality o f mutations against population
growth, hitchhking and background selection. Genetics 147: 915-925.
Gales, N . J., Adams, M . and Burton, H . R. (1989). Genetic relatedness of two
populations o f the Southern elephant seal, Mirounga leonina. Mar. Mammal Sci. 5
(1): 57-67.
Galimberti, F. and Boitani, L . (1999). Demography and breeding biology o f a small,
localized population o f southern elephant seals (Mirounga leonina). Mar. Mammal
Sci. 15 (1): 159-178.
Galimberti, F., Boitani, L . and Marzetti, I . (2000a). The frequency and costs of
harassment in southern elephant seals. Ethol. Ecol. Evol. 12: 345-365.
Galimberti, F., Boitani, L . and Marzetti, I . (2000b). Female strategies of harassment
reduction in southern elephant seals. Ethol. Ecol. Evol. 12: 367-388.
Galimberti, F., Boitani, L . and Marzetti, I . (2000c). Harassment during arrival on
land and departure to sea in southern elephant seals. Ethol. Ecol. Evol. 12: 389-404.
265
VII. References
Gahmberti, F., Fabiani, A . and Boitani, L . (2002c). Socio-spatial levels in linearity analysis o f dominance hierarchies: a case study on elephant seals. Journal of Ethology. In press
Galimberti, F., Fabiani, A . and Sanvito, S. (2002a). Opportunity for selection in
southern elephant seals (Mirounga leonina): the effect o f spatial scale of analysis. / .
Zoo/. Lond. 256: 93-97.
Galimberti, F., Fabiani, A. and Sanvito, S. (2002b). Measure o f breeding inequality:
a case study in southern elephant seals. Canadian J. Zoology 80: 1240-1249.
Galimberti, F. and Sanvito, S. (2000). Marking o f southern elephant seals with
passive integrated transponders. Mar. Mammal Sci. 16 (2): 500-504.
Galimberti, F. and Sanvito, S. (2001). Modelling female haul out in southern
elephant seals (Mirounga leonina). Aquatic Mammals 27 (2): 92-104.
Galimberti, F., Sanvito, S., Boitani, L . and Fabiani, A . (2001). Viability of the
southern elephant seal population o f Falkland Islands. Animal Conservation 4: 81-
88.
Gemmell, N . J., Allen, P. J., Goodman, S. J. and Reed, J. Z. (1997). Literspecific
microsatelhte markers for the study o f pinniped populations. Mol. Ecol. 6 (7): 661-
666.
Gemmell, N . J., Burg, T. M . , Boyd, I . L . and Amos, W. (2001). Low reproductive
success in territorial male Antarctic fur seals (Arctocephalus gazella) suggests the
existence o f alternative mating strategies. Mol. Ecol. 10: 451-460.
Gentry, R. L . (1998). Behaviour and ecology of the northern fur seal. Princeton
Univ. Press, Princeton.
266
VII. References
Gibson, R. M . and Guinness, F. E. (1980). Differential reproduction among red deer (Cervus elaphus) stags on Rhum. J. Anim. Ecol. 49: 199-208.
Girman, D . J., Mi l l s , M . G. L . , Geffen, E. and Wayne, R. K . (1997). A molecular
genetic analysis o f social structure, dispersal, and interpack relationships o f the
African w i l d dog (Lycaonpictus). Behav. Ecol. Sociobiol. 40: 187-198.
Girman, D . J., Vi la , C , Geffen, E., Creel, S., Mil l s , M . G. L . , McNutt, J. W.,
Ginsberg, J., Kat, P. W., Mamiya, K. H . and Wayne, R. K. (2001). Patterns of
population subdivision, gene f low and genetic variability in the Africa wi ld dog
(Lycaon pictus). Mol. Ecol. 10: 1703-1723.
Goldstein, D . B. , Linares, A. , Cavalli-Sforza, L . L . and Felman, M . W. (1995). An
evaluation o f genetic distance for use with microsatellite loci. Genetics 139 (1): 463-
471.
Goodman, S. J. (1997a). Dinucleotide repeat polymorphism at 7 anonymous
microsatellite loci cloned from the European harbour seal (Phoca vitulina vitulina).
Animal Genetics 28: 310-311.
Goodman, S. J. (1997b). RSTCalc: a collection o f computer programs for
calculating estimates o f genetic differentiations from microsatellite data and
determining their significance. Mol. Ecol. 6: 881-885.
Goodnight, K. F. and Queller, D. C. (1999). Computer software for performing
likelihood tests o f pedigree relationship using genetic markers. Mol. Ecol. 8: 1231-
1234.
Goudet, J. (1995). Fstat version 1.2: a computer program to calculate F-statistics.
Heredity 86: 485-486.
267
VII. References
Goudet, J. (2001). FSTAT, a program to estimate gene diversities and fixation indices (version 2.9.3). Available from http://www.unil.ch/izea/softwares/fstat.html. Updated f rom Goudet (1995).
Grant, J. W. A. , Bryant, M . J. and Soos, C. E. (1995). Operational sex ratio,
mediated by synchrony o f female arrival, alters the variance o f male mating success
in Japanese medaka. Anim. Behav. 49 (2): 367-375.
Greenwood, P. J. (1980). Mating systems, philopatry and dispersal in birds and
mammals. Anim. Behav. 28: 1140-1162.
Guo, S. and Thompson, E. (1992). Performing the exact test of Hardy-Weinberg
proportion for multiple alleles. Biometrics 48: 361-372.
Haley, M . P., Deutsch, C. J. and Le Boeuf, B. J. (1994). Size, dominance and
copulatory success in male northern elephant seals, Mirounga angustirostris. Anim.
Behav. 48 (6): 1249-1260.
Hamilton, W. D. (1964). The genetical evolution o f social behaviour. I . J. theor.
Biol. 7: 1-16.
Hindell, M . A. and Little, G. J. (1988). Longevity, fertihty and philopatry o f two
females Southern elephant seals (Mirounga leonina) at Macquarie Island. Mar.
Mammal Sci. 4 (2): 168-171.
Hindell, M . A. and McMahon, C. R. (2000). Long distance movement o f a southern
elephant seal. Mar. Mammal Sci. 16: 504-507.
Hoelzel, A . R., Halley, J., O'Brien, S. J., Campagna, C , Ambom, T. R., Le Boeuf, B.
J., Ralls, K . and Dover, G. A. (1993a). Elephant seal genetic variation and the use o f
simulation models to investigate historical population bottlenecks. / . Heredity 84:
443-449.
168
VII. References
Hoelzel, A . R., Hancock, J. M . and Dover, G. A. (1993b). Generation o f VNTRs
and heteroplasmy by sequence turnover in the mitochondrial control region o f two
elephant seal species. J. Mol. Evol. 37 (2): 190-197.
Hoelzel, A . R. and Green, A. (1998). Analysis o f population-level variation by
sequencing PCR-amplified D N A . In: Molecular genetic analysis of populations. A
practical approach (ed. Hoelzel, A. R.), pp. 159-187. Oxford Univ. Press.
Hoelzel, A . R., Le Boeuf, B. J., Reiter, J. and Campagna, C. (1999). Alpha male
paternity i n elephant seals. Behav. Ecol. Sociobiol. 46: 298-306.
Hoelzel, A . R., Campagna, C. and Ambom, T. (2001). Genetic and morphometric
differentiation between island and mainland southern elephant seal populations.
Proc. R. Soc. Lond. 268: 1-8.
Hoelzel, A . R. (ed.) (1998). Molecular genetic analysis of populations. Oxford
Univ. Press, Oxford.
Holm, S. (1979). A simple sequentially rejective multiple test procedure. Scand. J.
Stat. 6: 65-70.
Hogg, J. T. and Forbes, S. H . (1997). Mating behaviour in bighorn sheep: frequent
male reproduction via a risk 'unconventional' tactic. Behav. Ecol. Sociobiol. 41: 33-
48.
Hughes, C. (1998). Integrating molecular techniques with field methods o f social
behaviour: a revolution results. Ecology 79: 383-399.
Jouventin, P. and Comet, A . (1980). The sociobiology o f pinnipeds. Adv. Study
Behav. 11: 121-141.
269
VII. References
Kays, R. W., Gittleman, J. L . and Wayne, R. K. (2000). Microsatellite analysis of kinkajou social organization. Mol. Ecol. 9: 743-751.
Kitchen, D . W. (1974). Social behaviour and ecology of the pronghom. Wildl.
Monogr. 38: 1-96.
Kokko, H . , Mackenzie, A. , Reynolds, J. D. , Lindstrom, J. and Sutherland, W. J.
(1999). Measures o f inequality are not equal. Am. Nat 154: 358-382.
Laws, R. M . 1994. History and present status o f southern elephant seal populations.
In: Elephant seals. Population ecology, behaviour and physiology (eds. Le Boeuf, B.
J. and Laws, R.M.), pp. 49-65. Univ. California Press, Berkeley (CA).
Le Boeuf, B. J. and Briggs, K. T. (1977). The cost o f living in a seal harem.
Mammalia 41: 167-195.
Le Boeuf, B . J. and Mesnick, S. (1990 a). Sexual behaviour o f male northern
elephant seals: I . Lethal injuries to adult females. Behaviour 116 (1-2): 143-162.
Le Boeuf, B. J. and Mesnick, S. (1990 b). Sexual behaviour o f male northem
elephant seals: n . Female response to potentially injurious encounters. Behaviour
117(3-4): 262-280.
Le Boeuf, B. J. and Reiter, J. (1988). Lifetime reproductive success in northem
elephant seals. In: Reproductive success (ed. Clutton-Brock, T. H.), pp. 344-362.
Univ. Chicago Press, Chicago & London.
Le Boeuf, B . J. (1974). Male-male competition and reproductive success in elephant
seals. Am. Zoo/. 14: 163-176.
270
VII. References
Le Boeuf, B . J. (1991). Pinniped mating systems on land, ice and in the water: Emphasis on Phocidae. In: Behaviour of Pinnipeds (ed. Renouf, D.), pp. 345-394. Chapman and Hall , London.
Lebas, N . R. (2001). Microsatellite determination o f male reproductive success in a
natural population o f the territorial ornate dragon lizard, Ctenophorus ornatus. Mol.
Ecol. 10: 193-203.
Lewis, M . , Campagna, C. and Quintana, F. (1996). Site fidehty and dispersion of
southern elephant seals from Patagonia. Mar. Mammal Sci. 12 (1): 138-147.
Lucchini, V. , Fabbri, E., Marucco, F., Ricci, S., Boitani, L . and Randi, E. (2002).
Noninvasive molecular tracking o f colonizing w o l f (Canis lupus) packs in the
western Itahan Alps. Mol. Ecol. 11: 857-868.
Lyrholm, T., Leimar, O., Johanneson, B. and Gyllensten, U . (1999). Sex-basied
dispersal in sperm whales: contrasting mitochondrial and nuclear genetic structure of
global populations. Proc. R. Soc. Lond. B 266: 347-354.
Marshall, T. C , Slate, J., Kruuk, E. B. and Pemberton, J. M . (1998). Statistical
confidence for likelihood-based paternity inference in natural populations. Mol.
Ecol. 7: 639-655.
McCann, T. S. (1980). Population structure and social organization o f Southern
elephant seals, Mirounga leonina (L.). Biol. J. Linn. Soc. 14: 133-150.
McCann, T. S. (1981). Aggression and sexual activity o f male Southern elephant
seals, Mirounga leonina. J. Zoo/. Lond. 195: 295-310.
McCann, T. S. (1985). Size, status and demography of Southern elephant seal
(Mirounga leonina) populations. In: Studies of sea mammals in the South Latitudes
(Ling, J. K . and Bryden, M . M . ) , pp. 1-17. South Austr. Museum, Sidney.
272
VII. References
McConnell, B. J. and Fedak, M . A. (1996). Movements o f southern elephant seals.
Can. J. Zoo/. 74: 1485-1496.
McLaren, I . A . (1993). Growth in pinnipeds. Biol. Rev. 68: 1-70.
McNamara, J. M . and Houston, A. I . (1996). State-dependent life histories. Nature
21:215-221.
Modig, A . O. (1996). Effects o f body size on male reproductive behaviour in the
southern elephant seal. Anim. Behav. 51: 1295-1306.
Moller, A . P. and Birkhead, T. R. (1989). Copulation behaviour in mammals:
evidence that sperm competition is widespread. Biol. J. Linn. Soc. 38: 119-131.
Nei, M . and Chesser, R. K . (1983). Estimation o f fixation indices and gene
diversities. Ann. Hum. Genet. 47: 253-259.
Nei, M . , Tajima, F. and Tateno, Y . (1983). Accuracy o f estimated phylogenetic trees
from molecular data. J. Mol. Evol. 19. 153-170.
Nei, M . (1987). Molecular Evolutionary Genetics. Columbia Univ. Press, New
York.
Nicholls, D . G. (1970). Dispersal and dispersion in relation to birthsite o f the
Southern elephant seal, Mirounga leonina (L.) o f Macquarie Island. Mammalia 34
(4): 598-616.
O'Corry-Crowe, G. M . , Suydam, R. S., Rosenberg, A., Frost, K. J. and Dizon, A. E.
(1997). Phylogeography, population structure and dispersal pattern of the beluga
whale Delphinapterus leucas in the western Nearctic revealed by mitochondrial
D N A . Mol. Ecol. 6: 955-970.
172
VII. References
Packer, C , Herbst, L . , Pusey, A. E., Bygott, J. D., Hanby, J. P., Cairns, S. J. and
Borgerhoff Mulder, M . (1988). Reproductive success o f lions. In: Reproductive
success (ed. Clutton-Brock, T. H.), pp. 363-383. Univ. Chicago Press, Chicago &
London.
Paetkau, D. , Calvert, W., Stirling, I . and Strobeck, C. (1995). Microsatellite analysis
o f population structure in Canadian polar bears. Mol. Ecol. 4: 347-354.
Paetkau, S. C , Amstrup, S. C , Bom, E. W., Calvert, W., Derocher, A. E., Gamer, G.
W., Messier, F., Stiriing, I . , Taylor, M . K. , Wiig , O. and Strobeck, C. (1999).
Genetic stmcture o f the world's polar bear populations. Mol. Ecol. 8: 1571-1584.
Pardini, A . T., Jones, C. S., Noble, L . R., Kreiser, B., Malcolm, H. , Bmce, B. D.,
Stevens, J. D. , Cif f , G., Scholl, M . C , Francis, M . , Duffy , C. A. J. and Martin, A. P.
(2001). Sex-biased dispersal o f great white sharks. Nature 412: 139-140.
Parker, G. A. (1974). Assessment strategy and the evolution o f fighting behaviour.
J. theor. Biol. 47: 223-243.
Pemberton, J. M . , Albon, S. D. , Guinness, F. E., Clutton-Brock, T. H . and Dover, G.
A. (1992). Behavioural estimates o f male mating success tested by D N A
fingerprinting in apolygynous mammal. Behav. Ecol. 3: 66-75.
Pemberton, J. M . , Slate, J., Bancroft, D . R. and Barrett, J. A . (1995). Nonamplifying
alleles at microsatellite loci: a caution for parentage and population studies. Mol.
Ecol. 4 (2): 249-252.
Petrie, M . and Kempenaers, B. (1998). Extra-pair paternity in birds: explaining
variation between species and populations. TREE 13 (2): 52-56.
273
VII. References
Pomeroy, P. P., Anderson, S. S., Twiss, S. D. and McConnell, B. J. (1994). Dispersion and site fidelity o f breeding female grey seals (Halichoerus grypus) on North Rona. J. Zoo/. Lond. 233: 429-448.
Pomeroy, P. P., Twiss, S. D . and Redman, P. (2000). Philopatry, site fidelity and
local k in associations within grey seal breeding colonies. Ethology 106: 899-919.
Pomeroy, P. P., Worthington Wilmer, J. W., Amos, W. and Twiss, S. D. (2001).
Reproductive performance links to fine-scale spatial patterns o f female grey seal
relatedness. Proc. R. Soc. Lond B 268: 711-717.
Queller, D. C. and Goodnight, K . F. (1989). Estimating relatedness using genetic
markers. Evolution 43: 258-275.
Radespiel, U . , Sarikaya, Z., Zimmermann, E. and Bruford, M . W. (2001).
Sociogenetic structure in a free-living nocturnal primate population: sex specific
differences in the grey mouse lemur (Microcebus murinus). Behav. Ecol. Sociobiol.
50: 493-502.
Raymond, M . and Rousset, F. (1995). GENEPOP (version - 1.2) - Population-
genetics software for exact test and ecumenicism. J. Heredity 86 (3): 248-249.
Reiter, J., Panken, K. J. and Le Boeuf, B. J. (1981). Female competition and
reproductive success in Northem elephant seal. Anim. Behav. 29: 670-687.
Rice, W. R. (1989). Analysing tables o f statistical tests. Evolution 43 (1): 223-225.
Riedman, M . 1990. The pinnipeds: seals, sea lions and walruses. Univ. Califomia
Press, Berkeley.
Robbins, M . M . (1999). Male mating pattems in wi ld multimale mountain gorilla
groups. ^«/m. Behav. 57: 1013-1020.
274
VII. References
Rozas, J. and Rozas, R. (1997). DNASP, Version 2.0: a novel software package for
extensive molecular population genetics analysis. Computer Applications in the
Biosciences 13: 307-311.
Schaeff, C. S., Boness, D . J. and Bowen, W. D. (1999). Female distribution, genetic
relatedness, and fostering behaviour in harbour seals (Phoca vitulina). Anim. Behav.
57: 427-434.
Schneider, S., Kueffen, J. - M . , Roessli, D . and Excoffier, L . (2001). ARLEQUIN,
ver. 2.100: a software for population genetic data analysis. Genetics and Biometry
Laboratory, University Of Geneva, Geneva, Switzerland.
Shaeff, C. M . , Boness, D. J. and Bowen, W. D. (1999). Female distribution, genetic
relatedness, and fostering behaviour in harbour seals, Phoca vitulina. Anim. Behav.
57: 427-434.
Shipley, C. and Strecker, G. (1986). Day and night pattems of vocal activity of
Northem Elephant Seal bulls. J. Mammal. 67 (4): 775-778.
Slade, R. W., Moritz, C , Hoelzel, R. A . and Burton, H . R. (1998). Molecular
population genetics o f the southem elephant seal, Mirounga leonina. Genetics 149:
1945-1957.
Slade, R. W. (1997). Genetic studies o f the Southem Elephant Seal Mirounga
leonina. In: Marine Mammal Research in the Southern Hemisphere, Vol.1: Status,
Ecology and Medicine (eds. Hindell, M . and Kemper, C ) , pp. 11-29. Surrey Beatty
& Sons, Chipping Norton.
Slate, J., Kmuk, L . E. B. , Marshall, T. C , Pemberton, J. M . and Clutton-Brock, T. H .
(2000). Inbreeding depression influences lifetime breeding success in a wi ld
population o f red deer (Cervus elaphus). Proc. R. Soc. Lond. B 267: 1657-1662.
275
VII. References
Slate, J., Marshall, T. and Pemberton, J. (2000). A retrospective assessment of the
accuracy o f the paternity inference program CERVUS. Mol. Ecol. 9: 801-808.
Slatkin, M . (1995). A measure of population subdivision based on microsatellite
allele frequencies. Genetics 139 (1): 457-462.
Stanley, H . F., Casey, S., Camahan, J. M . , Goodman, S., Harwood, J. and Wayne, R.
K . (1996). Worldwide pattems of mitochondrial D N A differentiation in the harbour
seal (Phoca vitulina). Mol. Biol. Evol. 13 (2): 368-382.
Steiger, J. H . and Fouladi, R. T. (1992). R2: a computer program for interval
estimation, power calculation, and hypothesis testing for the squared multiple
correlation: Behaviour Research Methods, Instruments and Computers 4: 581-581.
Stevick, P. T., McConnell, B . J. and Hammond, P. S. (2002). Pattems of movement.
In: Marine mammal biology. An evolutionary approach (ed. Hoelzel, A. R.), pp.
185-216. Blackwell, Oxford.
Stewart, B . S. and De Long, R. L . (1994). Postbreeding foraging migrations of
northem elephant seals. In: Elephant seals. Population ecology, behaviour and
physiology (eds. Le Boeuf, B. J. and Laws, R.M.), pp. 290-319. Univ. Califomia
Press, Berkeley (CA).
Stewart, B . S. and De Long, R. L . (1995). Double migrations o f the northem
elephant seal, Mirounga angustirostris. J. Mammal. 76 (1): 196-205.
Suggs, D . W., Chesser, R. K. , Dobson, F. S. and Hoogland, J. L . (1996). Population
genetics meets behavioural ecology. TREE 11 (8): 338-342.
276
VII. References
Surridge, A. K. , Bell , D. J. and Hewitt, G. M . (1999). From population stmcture to individual behaviour: genetic analysis o f social stmcture in the European rabbit (Oryctolagus cuniculus). Biol. J. Linn. Soc. 68: 57-71.
Swofford, D. L. (1998). PAUP* (Phylogenetic Analysis Using Parsimony), Version
4.0bl0. Smithsoninian Institution, Washington DC.
Tajima, F. (1989). Statistical method for testing the neutral mutation hypothesis by
D N A polymorphism. Genetics 123: 585-595.
Takezaki, N . and Nei, M . (1996). Genetic distances and reconstmction of
phylogenetic trees from microsatellite DNA. Genetics 144: 389-399.
Tamura, K. and Nei, M . (1993). Estimation o f the number o f nucleotide
substitutions in the control region o f mitochondrial D N A in humans and
chimpanzees. Mo/. Biol. Evol. 10: 512-526.
Taylor, E. L . , Blache, D. , Groth, D. , Wetherall, J. D. and Martin, G. B. (2000).
Genetic evidence for mixed parentage in nests o f the emu (Dromaius
novaehollandie). Behav. Ecol. Sociobiol. 47: 359-364.
Thompson, E. A. and Meagher, T. R. (1987). Parental and sib likelihood in
genealogy reconstmction. Biometrics 43: 585-600.
Tiedemann, R., Hardy, O., Vekemans, X. and Milinkovitch, M . C. (2000). Higher
impact o f female than male migration on population stmcture in large mammals.
Mol. Ecol. 9: 1159-1163.
Titterington, D . M . , Murray, G. D. , Murray, L. S., Spiegelhalter, D. J., Skene, A. M . ,
Habbema, J. D. F. and Gelpke, G. J. (1981). Comparison o f discrimination
techniques applied to a complex data set o f head injured patients. J. Royal Statistical
Society (A) 144: 145-175.
277
VII. References
Trail, P. W. (1985). The intensity of selection: intersexual and interspecific
comparisons require consistent measures. Am. Nat. 126 (3): 434-439.
Twiss, S. D. (1991). Behavioural and energetic determinants of individual mating
success in male grey seals (Halichoerus grypus, Fabricius 1791). (PhD dissertation).
University of Glasgow, Glasgow (Scotland).
Twiss, S. D., Pomeroy, P. P. and Anderson, S. S. (1994). Dispersion and site fidelity
of breeding male grey seals (Halichoerus grypus) on North Rona, Scotland. J. Zool.
233 (4): 683-693.
Twiss, S. D., Anderson, S. S. and Monaghan, P. (1998). Limited intra-specific
variation in male grey seal (Halichoerus grypus) dominance relationships in relation
to variation in male mating success and female availability. J. Zool. Lond. 246 (3):
259-267.
Twiss, S. D., Caudron, A., Pomeroy, P. P., Thomas, C. J. and Mills, J. P. (2000).
Fine scale topography correlates of behavioural investment in offspring by female
grey seals, Halichoerus grypus. Anim. Behav. 59: 327-338.
Van Aarde, R. J. (1980). Harem structure of the southern elephant seal Mirounga
leonina at Kerguelen Island. Rev. Ecol. 34: 31-44.
Waser, P. M. and Strobeck, C. (1998). Genetic signatures of interpopulation
dispersal. TREE 13 (2): 43-44.
Weir, B. S. and Cockerhman, C. C. (1984). Estimating F-statistics for the analysis of
population structure. Evolution 38(6): 1358-1370.
Weir, B. S. (1990). Intraspecific differentiation, hi: Molecular systematics (eds.
Hillis, D. M . and Moritz, C) , pp. 373-410. Sinauer Associates, Sunderland (Mass.).
178
VII. References
Westneat, D. F. (1987). Extra-pair fertilizations in a predominantly monogamous
bird: genetic evidence. Anim. Behav. 35: 877-886.
Worthington Wilmer, J. W., Overall, A. J., Pomeroy, P. P., Twiss, S. D. and Amos,
W. (2000). Patterns of paternal relatedness in British grey seal colonies. Mol. Ecol.
9: 283-292.
Worthington Wilmer, J., Allen, P. J., Pomeroy, P. P., Twiss, S. D. and Amos, W.
(1999). Where have all the fathers gone? An extensive microsatellite analysis of
paternity in the grey seal (Halichoerus grypus). Mol. Ecol. 8: 1417-1429.
Zamudio, K. R. and Sinervo, B. (2000). Polygyny, mate-guarding, and posthumous
fertilization as alternative male mating strategies. PNAS 97 (26): 14427-14432.
279
Appendix A
APPENDIX A - Paternity Program CERVUS
A general introduction (from Marshall et al. 1998) to the likelihood analysis
implemented in the program CERVUS is presented here. More detailed description
on the program can be found in Marshall et al. (1998) and in the references therein.
I f genetic data were perfect, a mismatch between a male and a putative offspring
should be treated as an evidence for exclusion of that male from paternity. However,
a mismatch could result either from a genuine non-relationship or from a laboratory
typing error. When microsatellites are used, mutations and null alleles (Pemberton et
al. 1995) may also generate mismatches between genuine relatives at measurable
frequencies. Because a series of loci are used in parentage analysis, the probability of
at least one mismatch between true relatives due to typing error across all loci and
individuals involved in a parentage test can be relatively high, even when the
frequency of typing error at any one locus is low.
Probability of exclusion
Parentage testing can take place either in the presence or in the absence of genetic
information from the other parent. CERVUS calculates the average probability of
excluding a single randomly selected unrelated candidate from parentage for each of
these two cases. It also calculates the combined exclusion probabihty across all loci:
this represents the combined power of the set of loci of excluding a single randomly-
chosen unrelated individual from parentage at one or more loci.
The exclusion probability (P/) for each locus and for the set of loci was calculated
using the allele frequency option of CERVUS. Two exclusion probabilities were
calculated. One is the probability to exclude a randomly-selected male from
paternity given only the genotype of the offspring. The second is the probability of
excluding a randomly-selected male from paternity when both the offspring and the
mother are sampled.
180
Appendix A
As in Marshall et al. (1998):
for one locus / with K codominant alleles and given only the genotype of the
offspring:
P| = a, - Aa^ + 4a^ - 3a + 2al
for one locus / with K codominant alleles and given the genotypes of the offspring
and other mother :
P, =a,-2a^ + a3+3(a^a3 -a^) -2(a^-a j
where
k
i=l
The combination exclusion probability across n independently inherited loci, P, was
calculated as performed in the program:
F = l - n [ l - P , ] 1=1
Error rate
The likelihood approach of CERVUS allows taking account of potential
imperfections of the data, and defines an error as a replacement of the true genotype
at a particular locus in n individual with a random genotype (Marshall et al. 1998).
Following this approach, a true parent that mismatches at one or two loci with the
offspring can still often be identified as the most-likely parent, providing that the
power of loci is reasonably high (i.e. large number of loci and high level of
polymorphism).
Allowing for typing errors also dramatically reduces the impact of two other possible
causes of mismatches in parent-offspring relationships: mutations and null alleles.
While it is not statistically ideal to treat mismatches arising from mutations and null
Appendix A
alleles as i f they were mismatches arising from typing errors, this is a very much better approximation than using such mismatches as a basis for parentage exclusion (Marshall et al. 1998). Unlike other simulation parameters (see after), the error rate is not only used to generate simulated genetic data, but also used directly in the likelihood calculations, both in the simulation and in parentage analysis.
Calculation of paternity likelihood
Assuming mating is random and that the mother's genotype is known, CERVUS
calculates the likelihood ratio for each male on each pup as the ratio of two
alternative hypotheses: (1) the mother and the alleged father are parents of the pup
(L(Hi)); (2) the mother is the parent and the father is not the true father but a
randomly chosen individual from the population (L(Ho)):
L(H,)/L(Ho) = — — — — — — P(gp/g„, ) -P(gn,) -P(ga)
where gp, gm and ga represent the pup, maternal, and alleged paternal genotypes.
This simphfies to:
and thus represents how much more likely it is that the alleged father, rather than an
arbitrary male, passed his genes to the offspring (Marshall et al. 1998).
Because several unlinked marker loci are used in the analysis, the program calculates
likelihood ratios for each male at each locus and takes the natural logarithm of the
product across all loci. This is called the LOD score. LOD score of zero implies that
the assumed father is as likely to be the father of the offspring as a randomly selected
male; a positive LOD score implies that he is more likely to be the father than a
randomly selected male; a negative LOD score may occur i f the assumed father and
offspring share a particularly common set of alleles (Marshall et al. 1998). Inference
about paternity is made by CERVUS according to the magnitude of the difference
between the LOD of the most-likely and the next most-likely father. It generates a
182

Appendix A
statistic, , defined as the difference in LOD between the top two candidate males, and uses a simulation based on the observed allele frequencies to determine the statistical significance of the value generated for each paternity (see chapter H for details on the simulation parameters used).
183
Appendix B
APPENDIX B - Paternity assignment within harems
The results of the paternity assignment for each harem are reported. In each table,
the first most-likely father (or the two most-likely fathers, i.e. single male or two
males with the highest LOD values) is indicated for each pup. The male with the
highest LOD and showing a confidence level > 80% for the paternity was recognised
as the 'genetic father' and used in the analyses. In case CERVUS identified a father
at confidence level <80%, the paternity was considered not assigned and was not
used in the analyses. Mother-pup pairs for which no male could be identified by the
program as father were also not used in the analyses.
Pup: ID of the pup
Pup loci: number of loci screened for the pup
Known mother: ID of the known mother of the pup
P-KM mism: number of mismatches between the pup and the mother
Prob non-exclusion: 1- probability of exclusion (i.e. probability of excluding a
randomly-selected male from paternity when both the offspring and the mother are
sampled)
Candidate father: ID of the male identified as the most likely father by CERVUS (or
of the two males identified as the two most likely fathers). The male identified as the
first most likely father by the program was considered in the analyses as the 'genetic
father', and it is shown in bold type. In some paternities, the 'behavioural father' is
assigned as the second most likely father, without mismatches and with a LOD very
similar to the LOD of the first most likely father (see Discussion in Chapter III). In
these cases, the 'behavioural father' is indicated in bold italic type.
Appendix B
CF Status: seasonal status of the male:
s holder: seasonal holder of the harem (he held the control of the harem for the
longest period)
t holder: temporary holder of the harem (he held the confrol for a short period)
oh holder: other harem holder (he was the holder of a different harem)
secondary: secondary male (either peripheral or marginal male)
tertiary: tertiary male (he was never observed associated to a harem)
Con lev: confidence level for the paternity:
*: 95%
+: 80%
-: <80%) (but still identified as the most likely father by the program)
•: no father identified
LOD: LOD score (see Appendix A)
Delta: difference in LOD between the top two candidate males (see Appendix A)
CF loci: number of loci screened for the candidate father
P-CF mism: number of mismatches between the pup and the candidate father. In
only two cases (pups V3602I and V3888I) the paternity was assigned with one
mismatch. In both cases, the program explained the mismatch with the presence of a
null allele in the candidate father.
185
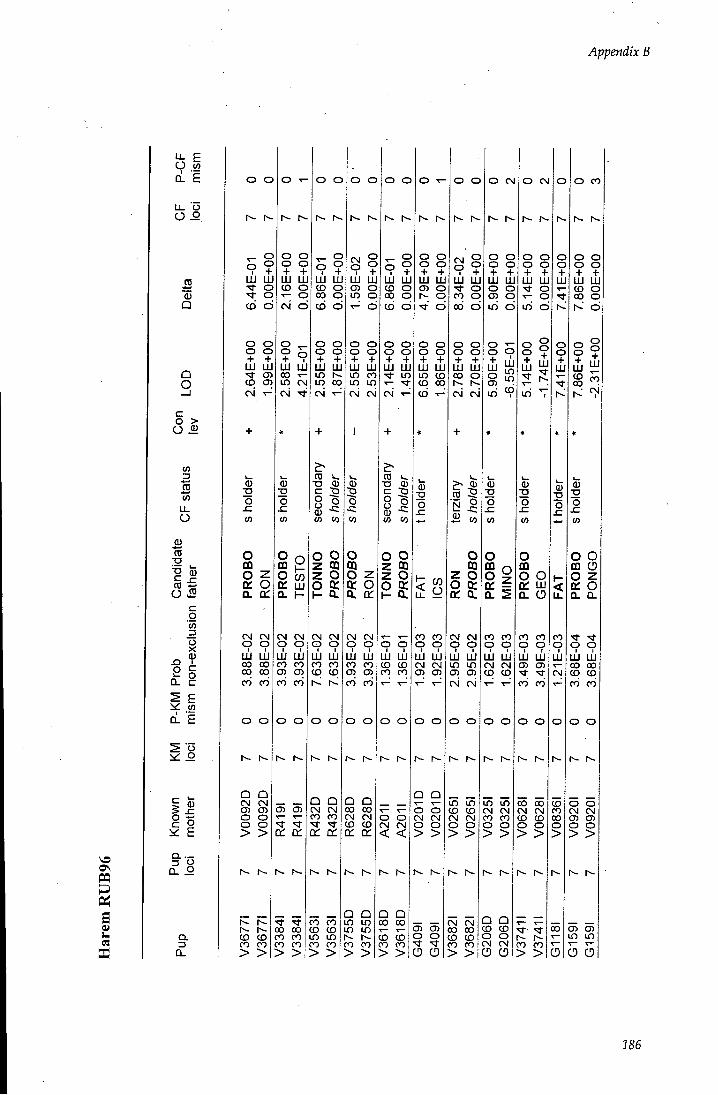
Appendix B
OS
g a
^ E O w ci. E
u_ o
0) Q
Q O
c o > O ^
03
u. O
0) CO
• - l _
O >2 c g
o X 0) c o c
J2 p
1 1 Q . 1 IB
1^ ifi E
Q .
Q .
o o
o o
LU ai
CO
o o o o + + LU ui
C35 CD C3)
<3>
o
o m o D.
O T -
o o o o + + LU LU CD O •>- O Cvi C D
O
? ° LU LU CO T -ID CM
O O
Lii LU
C D O
LU LU lO 00
CM CM Cp CD lii UJ 00 00 00 00 CO CO
o o
Q Q CM CN C3) (35 O O O O I
O O I I
LU LU CO CO
O O
•a
o o
LU LU
O O o o + + UJ UJ in CO in IT) CM csi
P o o O) to I CO
o o
o
m LU
o o o o + + LU LU m •<- ^
CD 1 . ,
•a 0)
CN CN CM CM
> >
CD CD CO CO > >
Q; a:
00 00 CO CO CO CO > >
Ljj Ljj CO CO C D CD
o o
Q Q CN CN CO CO a: a:
CO CO C D CD
in in CO CO, > > l
CN CN Cp O u!i U!J CO CO CO CO
o o
Q Q OO 00 CN CN
o 03 to
o
o o o o + + in UJ cn o N- o
LU UJ in CD CD CO CD
z 99 2 O \- a.
O CD LU UJ CD CD CO CO
O O
CD CD CN CN Q : < <
Q Q in in in in CO CO > >
Q Q CO OO CD CD CO CO > >
1 o
CO CO cp cp uj U!J CN CN 03 CJ3
O O
Q Q o o CN CN O O > >
O) (33 O O
o o
o o +
LU UJ
CN O
LU UJ CO O CN CN
O CM
1
O O O O + + UJ UJ o o 03 O in CD
N 9
m o o: = Q.
CN CN CO CO cp Cp uj uj in in C33 (33 CN CN
in in CD CD CM CN o o
> >
CN CN CO CO CD CD
cp CD
uj uj CN CN CD CD
O O
in in CN CM CO CO o o
> >
Q Q CD CD
~ „ O O CO CO CN CN > > o o
O CN
O O O O + + ULI UJ
O T - O Lf3 CD
o m o o a: LU Q. o
CO CO <? 9 UJ LU (33 (33
'!f CO CO
O O
CO 00 CN CN CD CD O O > >
CO CO > >
O CO
1
o o +
LU UJ O o
O O m O 0 Z 01 o a. CL
o cp uj OJ 00 00 CD CD CO CO
O O
o o CN CN 03 CJ)
03 (33 in in
186
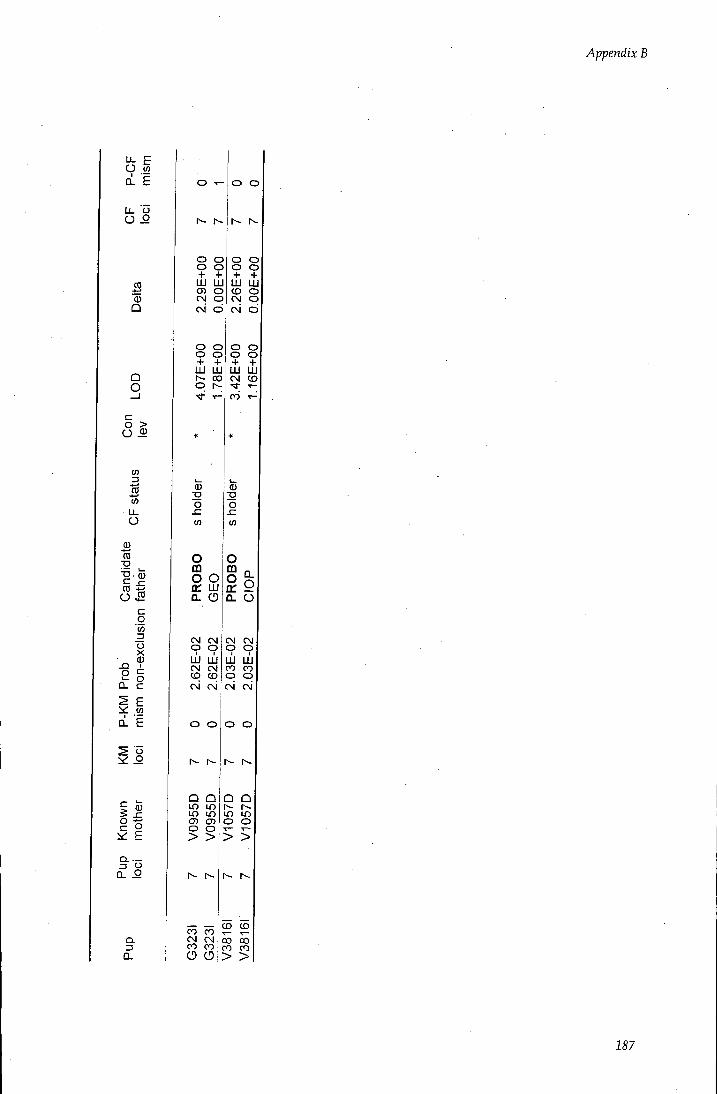
Appendix B
^ E O 0) Q. £
0) Q
Q O
c o > O ^
zi 3 in
O
TO •g
1-O ^
c o (0 o X (U
p
it: I
CL
O c E
E
Q. O
Q.
O T - o o 29
E+
00
OO
E+0
0 00+300
00+393
CN O CM O
,07E
+00
78E
+00
42
E+
00
16E
+00
* *
Ider
Ider
hoi
hoi
03 tn
PROB
O G
EO
PR
OBO
ClO
P
CN CM CD Cp CM CM CD O Ljj UJ CM CM CD CD
UJ uj CO CO O O
CN oj CM CN
O O O O
V09
55D
V
0955
D
V10
57D
V
1057
D
r-- r--
G32
3I
G32
3I
V38
16I
V38
16I
187
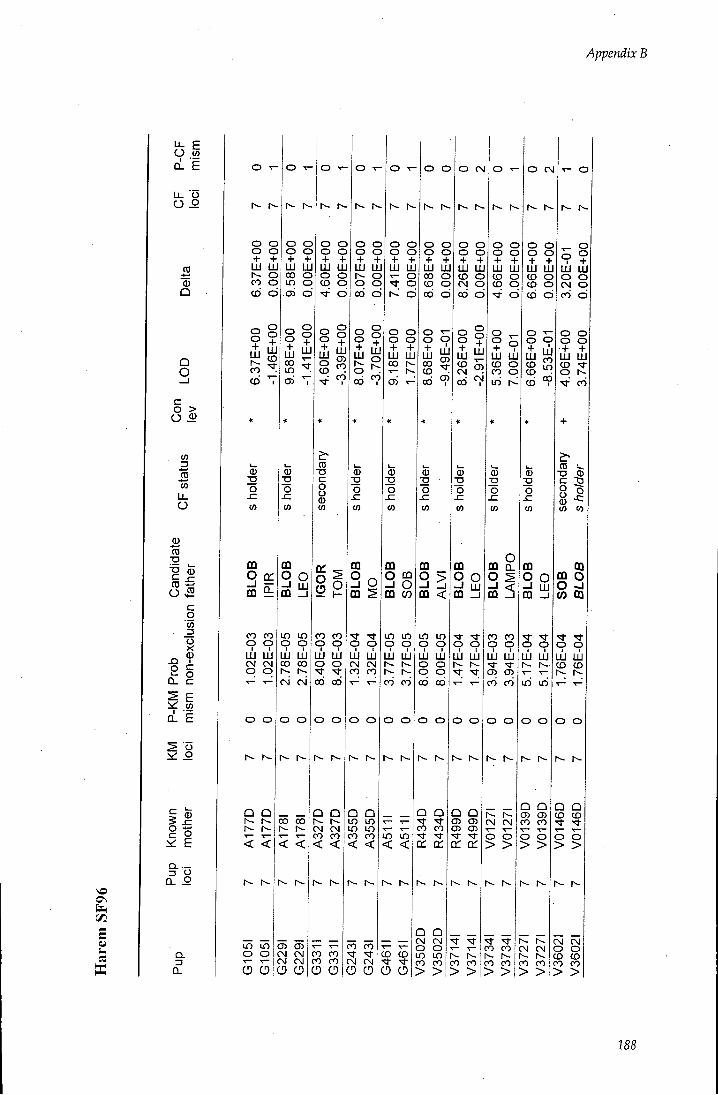
Appendix B
s
^ E O « CLE
LL O O o
<D Q
Q O
c o > O ^
I f )
.*-*
u. O
0)
ro Xi
o 3. 0
J3 O
a.
c o
o X 0)
I c o c E 03
^ 9.
g o i : E
CL
o o + Ul LU r-~ o CO CD
Ul CO CO
o
ui UJ CO o
m
CO CO cp CD UJ Ul CM CN O O
O O
Ul Ul o o
o o o o + + Ul LU
o o o CCl CD
i s
Q
< <
un in o o
m q o m _ i
in in CD CD UJ LU 00 oo CM CN
o o
ro c o o <D O)
00 CO
O O
Ul Ul T - O
o r ' d
UJ UJ 00 CD
i : i P CD
CO 00
< <
CO CO 9 9 ui ui o o 00 00
o o
CN CM CO CO < <
O) 03 CN CM CN CM O CD
CO CO CO CO o o
LU LU CM CN
o o
Q Q in in in in CO CO < <
LU UJ oo o
8 o
O CM
LU LU
O CM
UJ Ul CD O
CO CO CN CM CD O
m O CD -I o CO CO
in in O CD LU UJ CO CO
o o
I ? l i LU od ^
in in < <
CD CD t 'si-O O
in in CD CD LU LLI o o o o CO 00
o o
CO CO cc a:
Q Q CM CM o o in in CO CO > >
m q o CO —I
99 Ul Ul
o o
o o LU UJ
in
o o + Ul LU
CD O
0 -a o
SI
Q Q 03 cn 03 cn
a: ca
CO CO > >
CO CO 9 9 uj UIJ 03 03
O O
rg CM o o > >
q o m - J
9 9 UJ ui
in iri
o o
Q Q 03 CJ3 CO CO o o > >
CO CO r-- N -CO CO > >
CM CN CO CO > >
o 9 ? LU Ul CO O
UJ Ul CD ^
ro 1 ^
"D 03
03 03
O
o o I I
UJ Ul CD CD
O O
Q Q CD CD O O > >
CM CN O O CD CD CO CO >
188
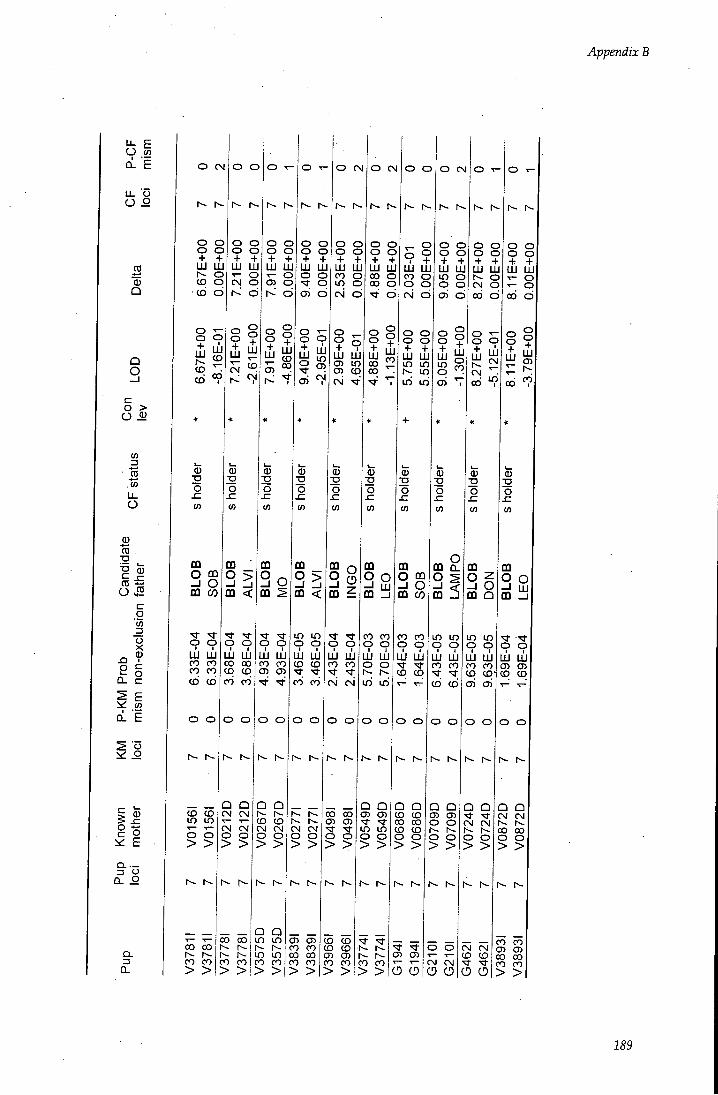
Appendix B
" J - E O w CL E
Ll. O O o
Q
Q O
o > O ^
03
3 w u. O
0) 00
"a Q5
™ ^ O 3 c g to D O X
Q. E
0)
i<: E
Q.
O CN
o o + UJ UJ o CD CD
o o
UJ LU 1 - o
S o
CD CD 00
o O o o O + o + UJ +
LU LU CD (D C33 00
CN 1 '
0)
o
m O 00 -I O m w|m <
o o o o + + UJ Ol T - O (33 O t-~.' CD
UJ UJ O O
O CN
+ o o | o UJ
m P >
9 9 LU LU CO CO CO CO CD CD
o o
CD CD m in o o > >
CO OO CO CO > >
o o I I
UJ UJ 00 00 CD CD CO CO
O O
Q Q CN CN CN CN
+ LU LU 03 in CJ3 CO csi ^"
m So m S
00 00
CO CO
> >
UJ UJ CO CO 03 03
O O
Q Q CD CD CN CN O O > >
Q Q in in in in CO CO > >
m <
in in o o I I
UJ UJ CO CD CO CO
o o
CN CN
03
O 03
m 2
O CN
o o o o + + LU UJ 00 O OO o
CD
O O + LU
00 $2 00 ^
o o
1^
. r - o 9 ? UJ LU CO O o o CN tD
UJ LU in in in in in
O CN
o o + + UJ UJ in o 03
I ? i s 03
C:3 (33 CO CO CO CO CO CO > >
UJ UJ CO CO CN CN
O O
CO CO (33 03 o o > >
CD CD CD CD CJ3 CD CO CO > >
m o o m _ i
CO CO 9 9 uj uj o o in in
o o
Q Q (33 CD in in
0)
o x:
m O CQ -I o m CO
CO CO 9 9 UJ LU S S
O O
Q Q (D CD OO OO (D CD
CO CO > >
OQ a.
^5
in in 9 9 uj uj CO CO CD CO
O O
Q Q CD 03 O O
o o + UJ UJ CM 00
S o +
in
OQ
m Q
in in o o I I
UJ UJ CO CO CO CD ai ai
o o
CM CN
^ 'vf I o o CD (33 T - CN CN O O CD O
CM CN CD (O
o o uj UJ
00 o
CO
OQ Q O OQ
UJ UJ (33 CJ3 CO CD
Q CM CM CO CO
CO CO CD CD CO 00 CO CO >
189
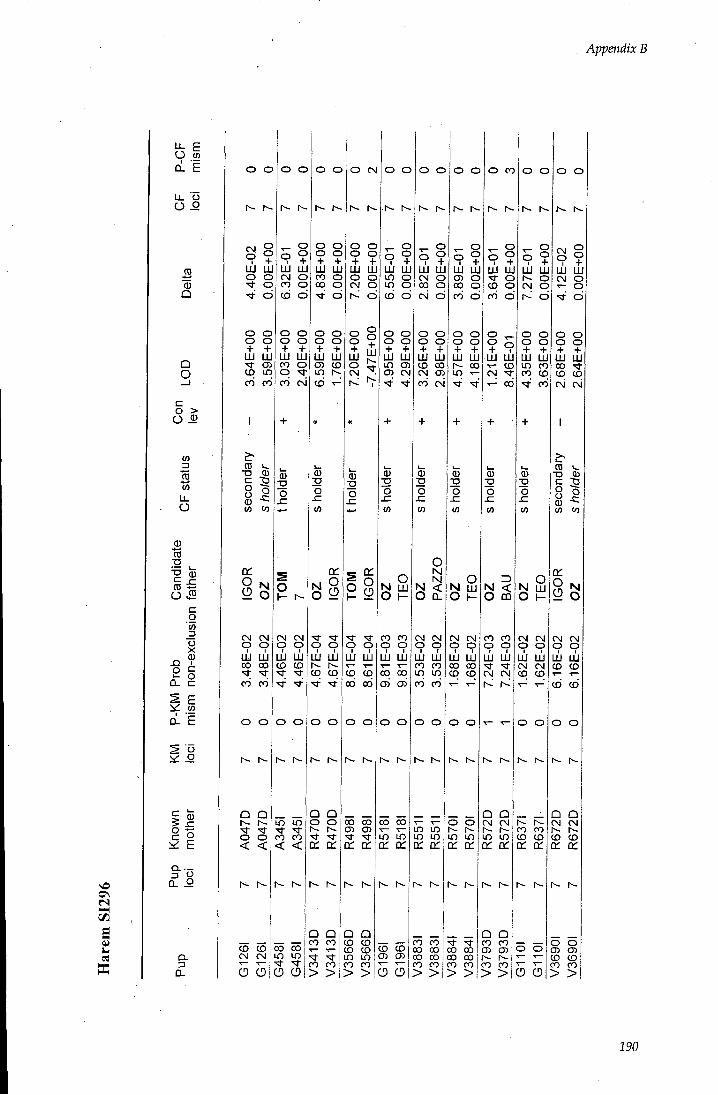
Appendix B
as
B
LI- E O w d. E
u. u O o
03 Q
Q O
c o > O ^
03 ro w u. O
ro ^ 03 ™ ^ O ^
c g
03
03 O
1 1 0. E
03 h ^ E
Q. O
a Q-
O O
O O Ul UJ CN O
O
o o +
o o
o 9 ? ui ui
Ul LU ^J- 03 CO m CO CO
2^ ro i>,
"O 03
03 03
or O N ^ o CN CN 9 9 Ul Ul CO OO "Sf ^ CO CO
O O
o o
Ul LU
LU Ul CO o o CO c\i
Q Q
o o < <
CD CD 00 00 CM CM in in T - T - ^ ^
O CD CD CD
o I-
CM CM o o
I I LU Ul CD CO
O O
O O O O + + UJ UJ C3 CD in r--
O CM
UJ ui o o
CD
in in
< <
s i
9 9 UIJ UJ CD CD
o o
Q Q 0 o 01 cc
9 9 UJ UJ
od 00
oo 00 03 03 a:
Q Q
CO CO
CO CO
> >
Q Q CD CD CD CO in in CO CO > >
o o
o 9 ? Ul LU CD O
O O O O + + LU UJ in cn 03 CN
o o
o 9 ? LU UJ CM O 00 O CN d)
0) -o o O)
N 2 O H CO CO 9 9 LU LU S OO cri cri
o o
LU Ul CD CO CM 03 CO CN
o o
o 9 ? UJ UJ 03 O 00 o CO C3
O O o o + + LU Ul r~~- 00 in
O CO
03 O sz 03
N 2 O t-
CN CM CM CN O O O O Ul UJ CO CO in in CO CO
o o
oo CO in in a: DC
CD CD CD 03 5 5
in in m lo tr tr
CO CO CO oo oo oo CO CO > >
UJ UJ oo oo CD CD
O O
1 r--
o o in in i r a:
oo oo CO oo CO CO > >
= 1 UJ Ul •sr o CO o CO d
o o UJ UJ - t - CD
N < O OQ
CO CO 9 9 Ul UJ CM CM
Q Q CM CM in in Q: DC
Q Q CO CO 03 C33 N- r--CO CO > >
o o
o 9 ? Ul UJ
Ul Ul in CO CO CD
CO
N 2 O I-
CN CM 9 9 UJ Ul CN CN CD CD
O O
CO CO CD CD a: DC
o o
5 O
o o
LU Ul CM O T - O
LU UJ CO CO CD CM CM
ro >^ T3 03
Q o o 0) 03 03
DC
88 CN CM 9 9 LU UJ CO CD CD CD
O O
Q Q CM CM co CO DC DC
o o 03 03 CO CO CO CO
> >
190
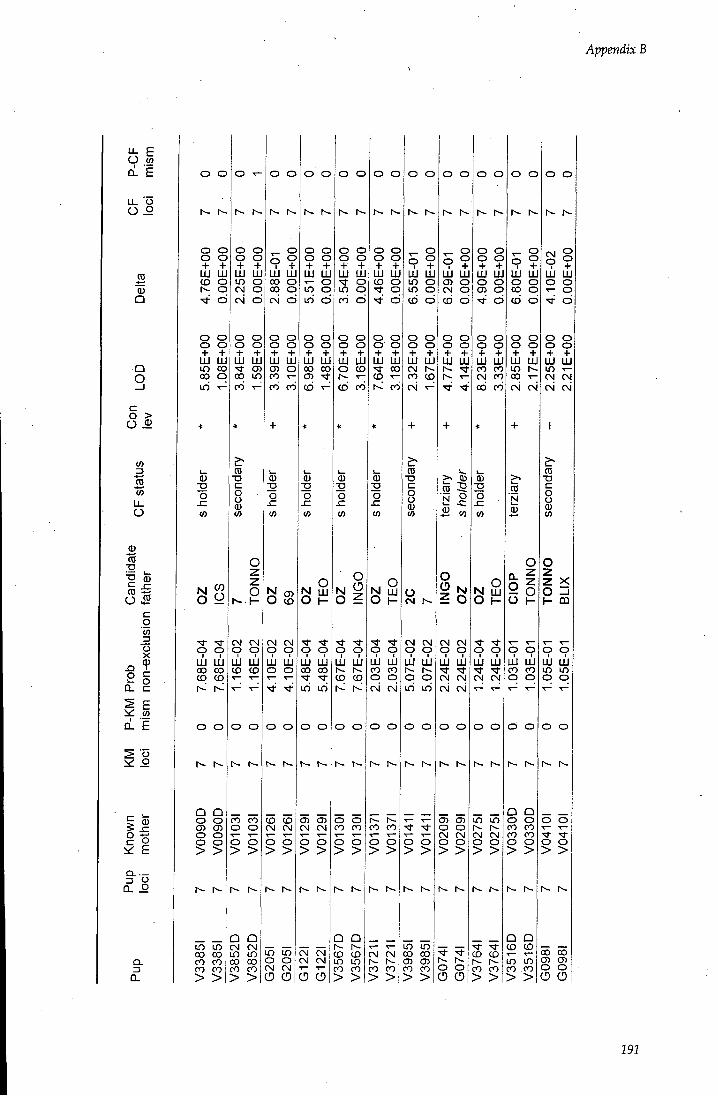
Appendix B
^ E O 03 ci. E
U_ o
(U Q
Q O
80
00 U. O
0)
— i _ T3 (p
o 3
03
o X <? c o o
^ _ a. c
ci. £
03
i f y; E
o o
0 0 0 0 0 0 0 0 + + + + UJ UJ LU UJ
CD 0 in 0 0 rsi 0 CD r \ i CD
o o o o + + UJ UJ in CO 00 o in -r-
0)
o
o o o o + + UJ UJ CD
00 m CO
T3 c o o <D O)
N ^
O o
o UJ UJ CO CO CO CD
o o
Q Q o o 03 03 o o 5 ^
CL D
CL
Q Q in in CN CN CO 00 in in CO CO 00 00 CO CO CO CO
> > > >
2 O
CN CN 9 9 uj uj CD CD
CO CO O O T — -C—
O o > >
o o
= 1 LU UJ CN O
UJ UJ C33 O CO T -
o 0 0 O
o o o o + + UJ UJ
T - O in o iri CD
o o o o + + UJ UJ
CO 00 (33 ^ l -CD
N 03 O CO
CN CN 9 9 uj uj O O
(D CD CM CN T — T -O O > >
in in o o (N CN (D O
N 2 O H
9 9 uj uj 00 00 ' J iri in
o o o o + + UJ LU •r o in q
CO CD
o o o o + + LU UJ O CO CD CO
03
o
CD CD CM CM T - T —
O o > >
CM CM CM CN o 5
o o
o o o o + + UJ UJ CD O ^ o
CD
O O o o + + UJ UJ S "
CO
O O
o 9 ? LU UJ
O S i
9 9 uj uj CD (D
o o CO CO o o > >
Q Q CD CO in in CO CO
> >
N 2 O I-
UJ UJ CO CO o o CN Csi
o o
CO CO
o o > >
cN rvj co CO > >
(O o
UJ UJ CN CO CO CN
^ CD
T3 c o o (U 03
o o
o 9 ? LU UJ (33 O CM O CD CD
UJ UJ
o CN h-
CN CN 9 9 uj LU o o
o o
i i
cn in CO 00 03 CD CO CO
> >
> . 03
o i s
CN CvJ 9 9 uj uj CM CM CM Cvi
03 03 o o r\i CN o o > >
o o
o o o o + + UJ UJ o o C33 O
o o o o + + UJ UJ CO CO CN CO 00 CO
N 2 O I-
9 9 uj uj CM Cvl
in in CM CM o o > >
o o
1^
o 9 ? lU UJ o o CO o CD CD
O O O O + + UJ UJ in h-CO CN CN
(D NI 03
2o O H
9 9 UJ UJ CO CO O O
o o
UJ UJ o o 1 - o
CD
O O o o + + UJ UJ in CM CM CN CM
o o O O
o o
Q Q o o CO CO CO CO
5 5
1^
Q Q CD (D
CD CD X—
1~- in in CO CO CO CO
> > > >
CD T3 C
8 0) 03
o z Z X o • H ca
9 9 uj uj in m o o
o o
o o
5 5
00 CO (33 03 o o O O
292
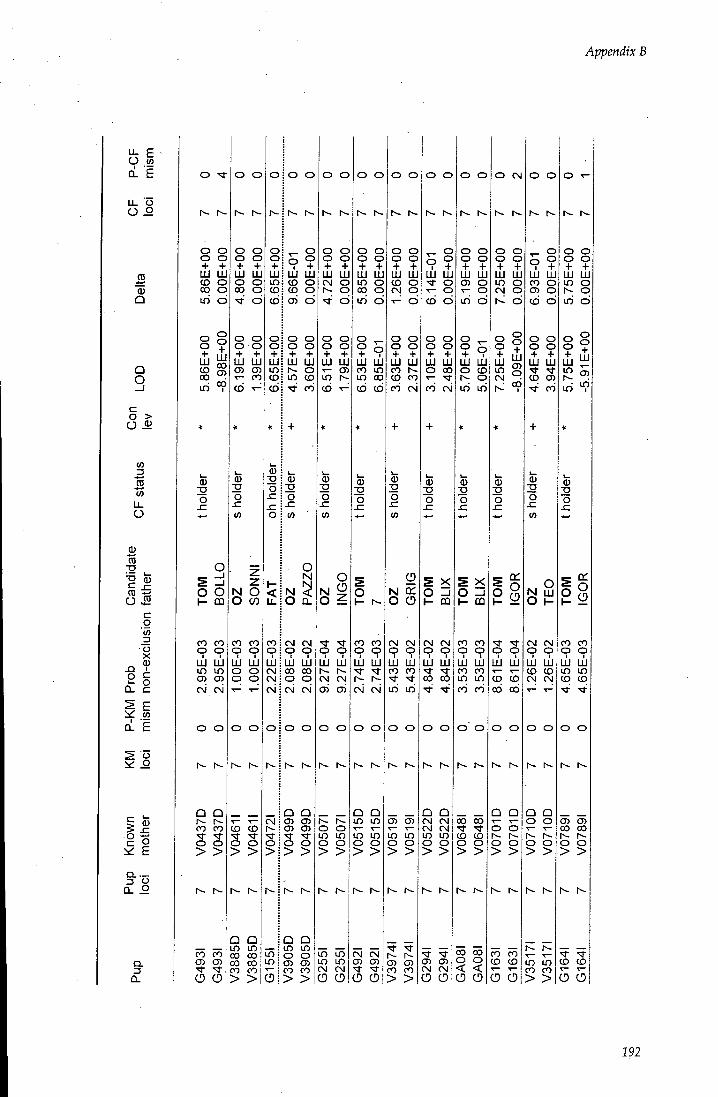
Appendix B
^ E O w Q. E
O o
0 Q
Q O c o > O 1>
03
ro 03 u. O
03 ro •g •o c O 3
a o 03 _g
<P c o c
0
p
iS^ 03
a. 1
i*: E
CL
CL
O ^
O O + Ul UI CO oo in
o o + Ul CD OO
0 O
o o
Ul UJ o o
UJ UJ 03 03 T - CO CD -"
o o
CO CO 9 9 UJ UJ in in 03 03 CN CN
o o
Q Q CO CO o o > >
N O O CO
CO CO o o
I I Ul UJ o o o o
CO CO 03 03 CD CD
CO CO
11
Q Q in in 00 00 CO 00 CO CO > >
o o
^ o 9 ? UJ LU
O O O O + + UJ LU 1^ O in CD •<3-' CO
o o
ui LU
o
UJ ui C33 in r--CD
o o
LU ui in o
o ? 9 UJ UJ CO m in oo CD CO
O N O CL
CM CN 9 9 UJ UJ OO 00 O O CN CM
Q Q (33 03 03 03
I I
Q Q in in o o 03 03 CO CO > >
9 9 Ul LU r-CN CM C3) 03
o o
1^ o o in in o o > >
in in in in CM CM O CD
H 1^
CO CO 9 9 Ul Ul Csi CN
Q Q in in in in o o > >
CM CN 03 03 O CD
o o
UJ ui
UJ UJ CO CD CO CO CN
CD N DC O O
CN CM 9 9 Ul UJ CO CO in in
o o
= 1 LU LU O 1 - O CD d
UJ Ul 03 O T - O in d
o o o o + + LU Ul o oo CO cMi in in
o ? 9 UJ UJ
0 :g p
CO
CM CM 9 9 UJ UJ
o o
cn 03 CN CM in in o o > >
CJ3 03 CO CO > >
CM CM in in
i^
CJ3 cn CM CN O CD
CQ
CO CO 9 9 UJ LU CO CO in in CO CO
o o
OO CO 'a- -sr CD CD o o > >
i^
OO CO o o < < O CD
O CM
o o o o + + UJ UJ in o CM o d
UJ i s i^ 9
o o
1^
o 9 ? UJ UJ
UJ Ul
s s CO
UJ Ul
in "?
5 ^
2§
UJ Ul CD CD od od
o o
Q Q T — T — O O o o > >
CO CO CD CD 5 O
N 2 O H
CM CM 9 9 Ul Ul CO CO CM CN
O O
Q Q o o o o > >
in in CO CO > >
5 °^
28
CO CO o o
I I Ul LU in in CD CD
C33 03 OO 00 o o > >
i^ h~
CD CD
5 o
292
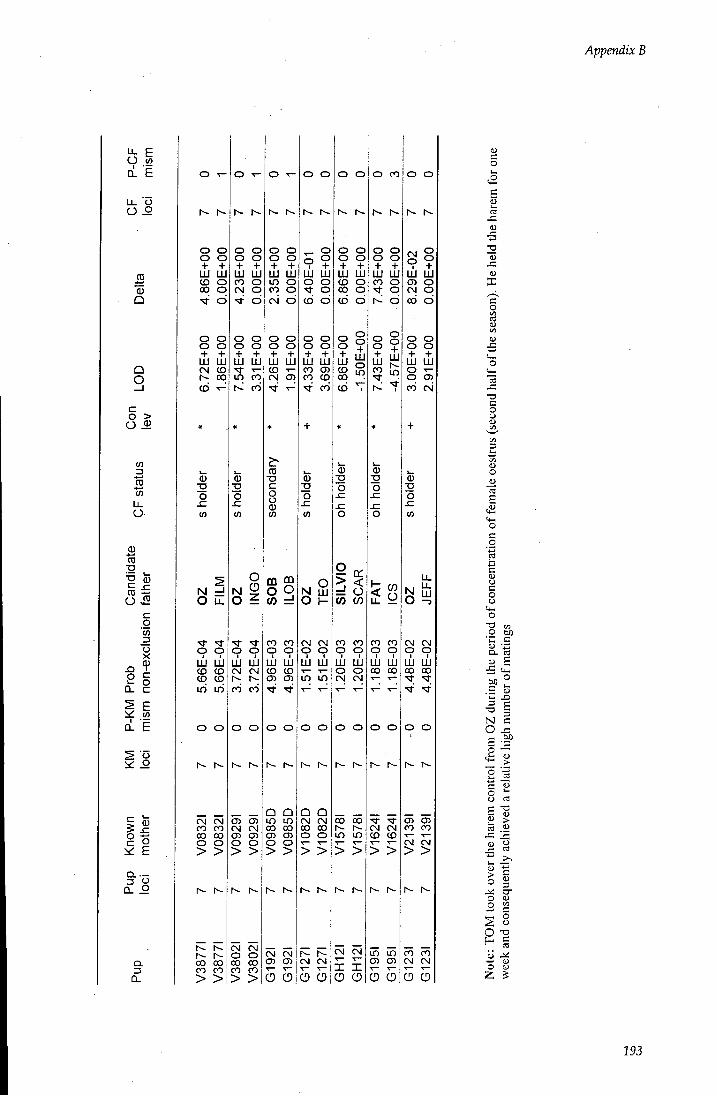
Appendix B
^ E O in ci. 1 u. o O o
Q
Q O
c o > O M
03 D s "to u. O
0) •g ^
™ ^ O v2 c g 03 _D O X <p c o c
JD O
I I ci. E
I -g o ^ E
CL O
o o o o + + UJ UJ CD O CO O
d
O O O O + + UJ UJ CM (D CO CD T-:
0) o 03
N d O u.
UJ UJ CD CD CD CD iri iri
o o
o o o o + + m UJ CO o
o o o o + + UJ UJ in CO
CO
O S i
CM CM O O £3. 00 00 CO CO D CO CO CO CO CL > > > >
LU UJ CN CN CO CO
o o
CN CN 03 CD CO CO CM CM 00 00 CD 03 O O O O > > > >
o o o o + + UJ UJ
CN O
UJ UJ CD CM 03
CD T3 c: 8 Q) 03
CQ m o g (0 d
CO CO 9 9 uj uj CD CD CD CD
Q Q in in 00 00 03 CD 5 5
CN CN C33 03 O 5
o 9 ? UJ UJ o o o CO CD
O O o o + + UJ UJ CO CJ3 CO CD
CO
N 2 O H
CM CM 9 9 LU uj in in
o o
Q Q CM CM OO 00 o o > >
CN CN
5 O
o o o o + + UJ UJ
CO o
CD
(0 CO
CO CO 9 9 oi uj o o CN CM
O O
00 CO in in > >
CM CM
CD O
o o o o + + UJ UJ CO o o
CD
+ +
u. y
CO CO 9 9 uj uj 00 OO
o o
CM CM CD CD > >
in in CO CO CD CD CM CM T—
CD CD CD CD
o o UJ UJ
CN o
UJ UJ o O (33 CO CN
CM CM 9 9 uj uj CO 00
o o
CD CJ3 CO CO CM CM > >
o
p 03
a
u •4-<
<u j = a X
o
CO
c o o o -a o ' C s 0) Q. n3 <U £
- "P. . = Hi I -
- i N c
0 j=
2 1 1 £ O 03
s "S — 03 O
> o o o
O -2
O <D Z S
193
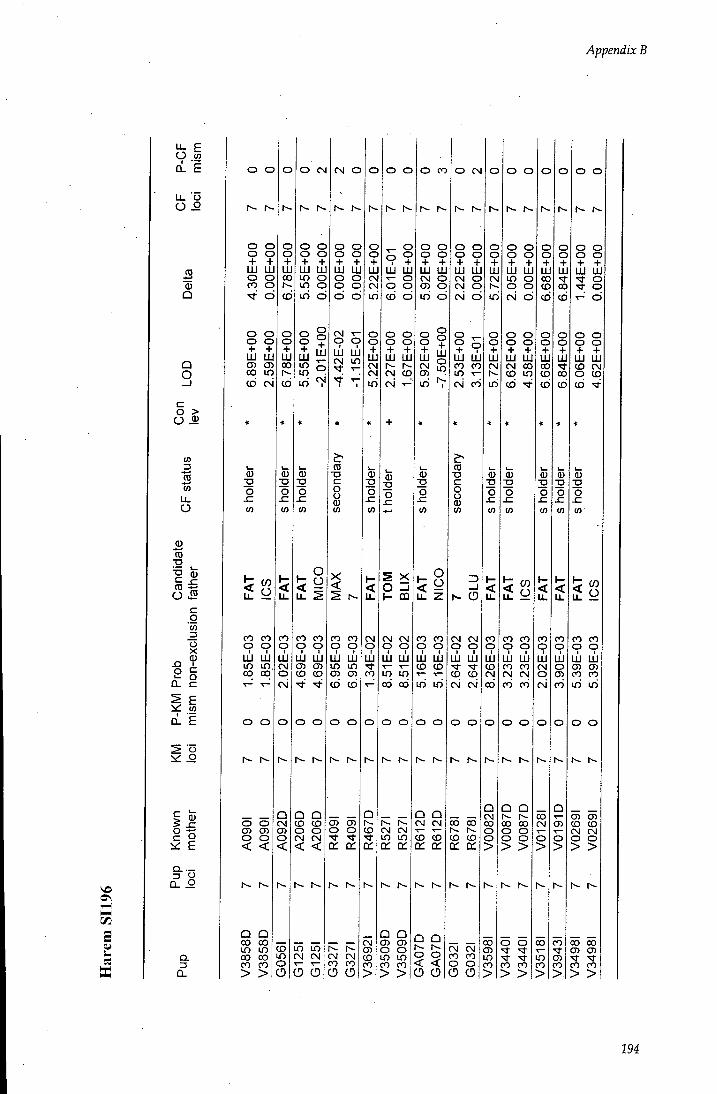
Appendix B
(/5
es
Li. E O Q. E
O o
(D Q
Q O
c o > O ^
TO
U. O
0
to •g
O J5 g 0) o X <p J3 O c o
i i ^ o
1^ g o i i : E
Q. O
C L
O O
o o o o + + LU LU o o CO o
d
o o o o + + LU UJ CO in (D o j
o
O CN
o o o o + + uj m in o in o in d
if O
CO CO
111 LU in in CO CO
o o
o o CD 05 o o < <
Q Q CO CO in in CO 00 CO CO > >
eg o
o o o o + + LU LU O O O O d d
eg 1-o o I I LU m CN in
LU UJ
5 8
CO CO
uj uj CO CD
o o
(0 T3 c 8 0) tn
Q Q CD CD o o CM eg < <
1 r-~
1
CO CO CD CD uj Ol in in cn cn CD CD
o o
05 C35 o o cm tr
in in h~ h~ CM CM CM CN •>- CO CO 0 0 0 0
o o o o + + LU UJ CM CD CM
O CO
S X o • I - CD
CM CM o o I I
UJ a i in in 06 CO
CO CO 9 9 LU UJ CD CD in in
o 0 0 o
1
CM CM in in 01 a:
Q Q CD 05 o o in in CO CO > >
Q Q CM CM S 5
a:
Q Q o o < <
0 CM 0 0 0 0 0 0 0
1 1
0 0 0 0 0 0 0 0 0 0 0 0 0 0 0 0 0 0 + + + + + + + + + LU UJ LU LU LU UJ UJ UJ UJ CM 0 CM in 0 00 0 CM 0 1 0 0 CD CO 0 CNi d iri csi d CD CD d
0 0 0 0 0 0 0 0 0 {—] 0 0 0 0 0 0 0 + 1 + + + + + + + LU UJ UJ LU UJ lU LU UJ LU CO CO CM CM 00 00 CD CM in CD m CD 00 0 CO CM CO iri CD CD (d CD
* * * * *
(D 1— •D 0 0 0) Q) 0 c T3 "a •a TD T3 0 0 0 0 0 0 0 0
JO sz JZ W) tn in 05
ZD 1 - to 1- H _ l < < UJ ( S < < < \tj
( "\ u. IL. LL Ll. w
CM CM CO CO CO CO CO CO CO CD 0 0 Cp 0 CD 0 0 0 uj uj uj uj uj Ul uj uj uj
CD CO CO CM 0 05 05 CD CO CM CM CM 0 05 CO CO CM CM 00 CO CO CM CO iri iri
0 0 0 0 0 0 0 0 0
N- N- t-~ h- r--
Q Q Q Q CM CO T— 05 05
to CO 00 00 00 CM 05 CO CD 0 0 0 T— T— CM CN CD co 0 0 0 0 0 0 tr cc > > > > > > >
00 0 0 CO CO 00 CO CM CM C35 T— 05 05 CO CO in in CJ5 0 0 CO CO CO CO CO CO CO 0 0 > > > > > > >
294
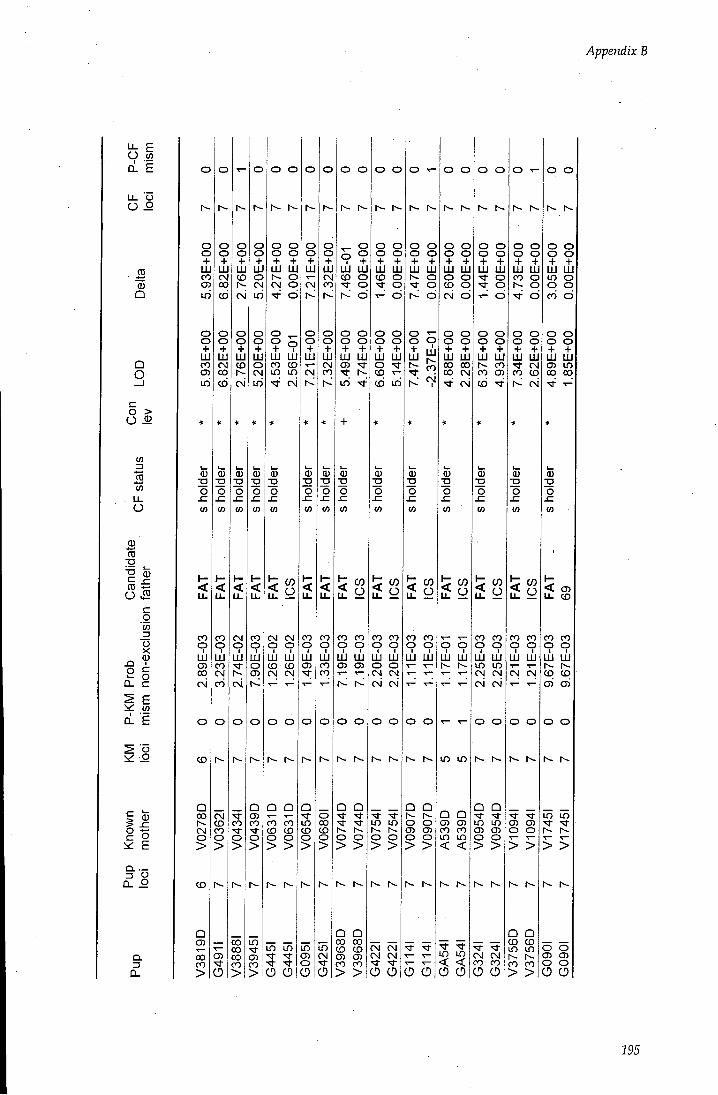
Appendix B
O m a. 1
u. o
0) Q
Q O
c o > O i2
TO LL O
CO
^§ O J5 c o in _5 o X 0)
p
11 Q. 1 S 9. ^ o
0)
^ E
Q. O
O o +
L U 00 in
o o + L U ro
0) O
Q .
C L
CD
Q CO CM O >
CD
Q CD 00 ro >
O JZ
<n I (o
< < U . LL
1
o o
LU LU O
O _ ? ° LU LJJ CO CD LD Ln
c\i
<1<
CM CM 9 9 LU LU CD CD CM CM
O O
Q Q CO CO CD CD
5^
O O
o f UJ LU CD O ^ O CD
UJ UJ
O O
r-. h-
o o o o + + UJ UJ CD O NT O T- CD
O O O O + + 111 LU O • ' t CD T-CD in
0) o
in m
CD O
if o
CO CO 9 9 uj U!J
o o
Q Q
o o > >
Q Q CO CO CD CD cn C5) CO CO > >
if O
CO CO 9 9 l i i uj o o CM CM Cvi CM
O O
h- 1
o o > >
CM CM CM CM
o o o o + + UJ UJ o
S o lit J3
o o
o o o o + + UJ UJ o o CD O rvj o
o o o o + + UJ UJ OO CO CO CM
CM
1 o
CO CO 9 9 LU UJ
o o
Q Q o o o o > >
o o
o o o o + + UJ UJ ^ o o
o o o o + + LU LU
CO CO a> CD ^
o T-
^ W ^ CO if y If y
o o I I LU UJ
Q Q <J> C35 CO CO m LD < <
CO CO o o
I I LU UJ in in CM CN CM CM
o o
Q Q
(35 O O > >
LU UJ
o
o o o o + + LU UJ CM CO CD
CM
•a
03
42 42 CM CM < < CO CO O O O O
u. 9
CO CO 9 9 UJ U!J CN CM
o o
(35 C3) o O > >
Q Q CD CD in in CO ro > >
o o
LU UJ
o o o o + + LU UJ C3) in CO CO
CO CO 9 9 111 lu CD CD cri cj)
o o
in in
> >
o o CJ) (3) o o O O
295
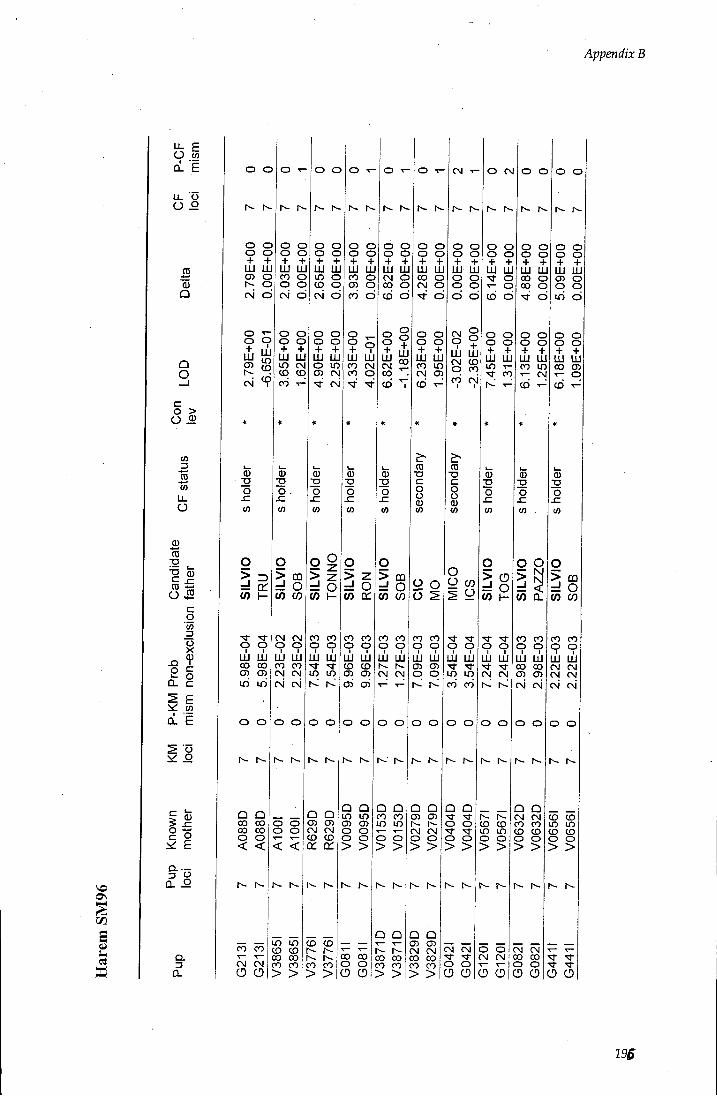
Appendix B
OS
s u es
O CL £
O o
0 Q
Q O
05 TO w LL o 0
^ 0
O ^ c: o '05
0 o c o
a 1
2 y
1 -g o i^: E
Q. O
Q .
o o
o o + UJ UJ CJ5 o CN
o o + LU cn CN
m UJ CO o
o o
o o o o + + UJ UJ in o CD o CM d
o o o o + + UJ LU in CN CD CD CO
0 o sz
g (0 H
o CN CM 9 9 UJ UJ CO CO 05 05 CM CM
iri iri rg CM
LU UJ CO oo
0 o U5
> CQ d O (0 CO
UJ UJ o in O) CM ^' CM
o o
Q Q 00 00 00 00 o o < <
CO CO
CM CM
o o
o o o o < <
in in CD CO oo 00 CO CO > >
i i d O CO I-
CO CO 9 9 uj uj
o o
Q Q 05 C35 CN CN CD CO
LU UJ
CO O
O O UJ Ol CO CN CO O
O > z d o (0 D :
CO CO 9 9 uj uj CD CD O) 05 05 d
o o
o o o o + + UJ UJ CM O 00 o CD d
O 1-
CD CD
CO CO
> >
o > m d O CO CO
CO CO 9 9 a i UJ
CN CN
o o
o o o o + + UJ UJ CO o CM O
d
o o o o + + UJ UJ CO in CN 05 CD
T3 C o o 0 05
^ O O 2
CO CO 9 9 UJ LU (J5 C35
CM
UJ UJ o o
9 ? LU UJ CM CD O CO CO CM
O CN
o o + + LU UJ
o •<- o CO d
o o o o + + UJ UJ in •<}• CO
h- h-
Q Q in in 05 05 o o
CO 00 O O
Q Q CO CO in in o o > >
Q Q OO 00 CO CO
o o
Q Q 05 05 r~- 1 CM CN o o > >
Q Q 05 05 CM CM 00 00 CO CO
(0 •D c 8 0 05
O O CO 5 o
LU LU in in CO CO
> > i > >
Q Q s s
'a-o o > >
O > CD d O CO h-
9 9 uj uj CM CN
o o
m UJ CO o
o o o o + + UJ UJ CO in T- CN CD
o o
o o + UJ LU
in o
o o o o + + LU UJ CO CJ5 T- o CD
g o d ^ CO CL
CO CO 9 9 uj uj CO OO 05 c:5 csi CN
o o
r>. r- r~- N-
CO CD in in o o > >
CM CM o o O O
o o CN CN
o 5
Q Q CN CM CO CO CD CD
CM CM 00 OO O O o o
g > CQ d o CO CO
CO CO 9 9 UJ UJ CM CM CM CM CN CN
CD CO in in CO CD
135
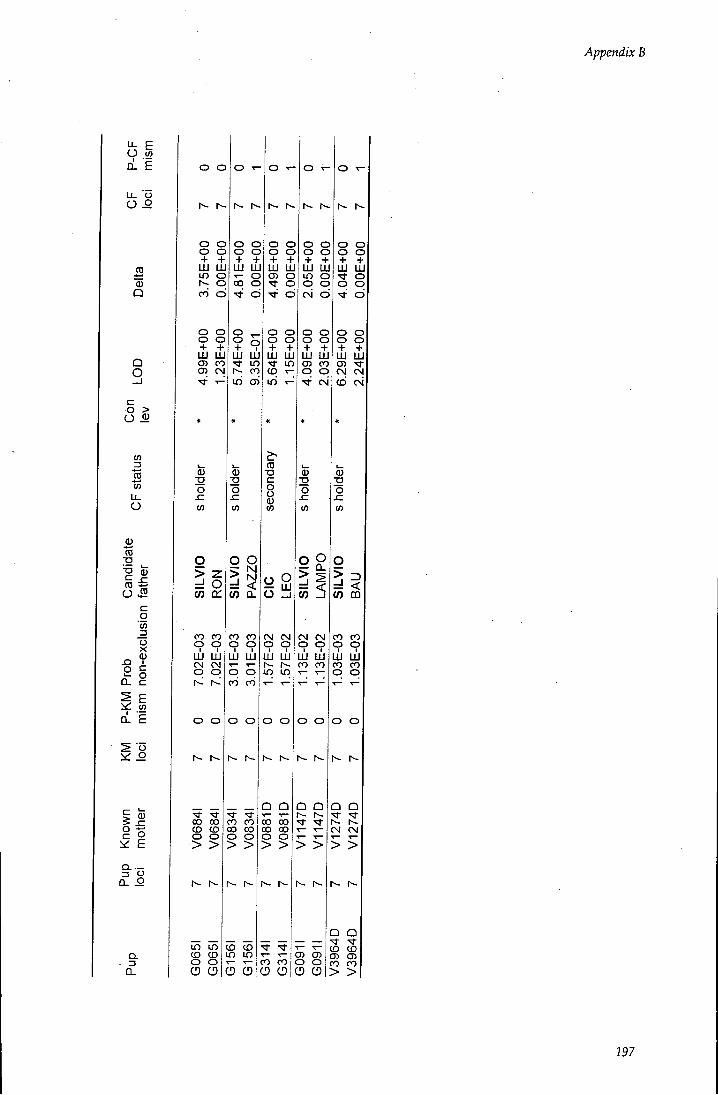
Appendix B
^ E O M d E
u. o O o
0 Q
Q O
o > O ^
3 w u. o B CD •g T3 c O >2
0
p
c o o X 0
g o i^: E
Q. D Q.
O O
o o + LU UJ in CO
o o +
O T- O
LU UJ CJ> CO cn CM
o sz in
O > z d o (0 a:
CO CO o o
I I LU UJ CM CM O O
o o
CD CD O O > >
o o o o + + LU UJ T- o 00 o • " t CD
o ^ ? 9 LU UJ
UJ UJ
o
o o o o + + LU UJ "d- in CD iri T-
0 o in
in in CD CD o o O O
CO CO 9 9 LU uj o o CO CO
O O
00 00
(T3 T3 C o o 0 in
o o — LU O ZJ
o o o o + + LU UJ in o o o CM CD
o o o o + + LU LU cn CO o o
CM
o o LU UJ
o o 0 o + + LU UJ 01 CM CM CD rsi
CN CM 9 9 LU uj in in
CD CD in in O 5
o o
Q Q CO 00 OO OO
i f (0 -3
CM CN 9 9 uj uj CO CO
CO CO
Q Q
> >
O
1 ? V) 00
CO CO 9 9 LU LU CO CO O O
CD CD O O O O
o o
Q Q
CM CM > >
CD CD CD CD CO CO > >
297
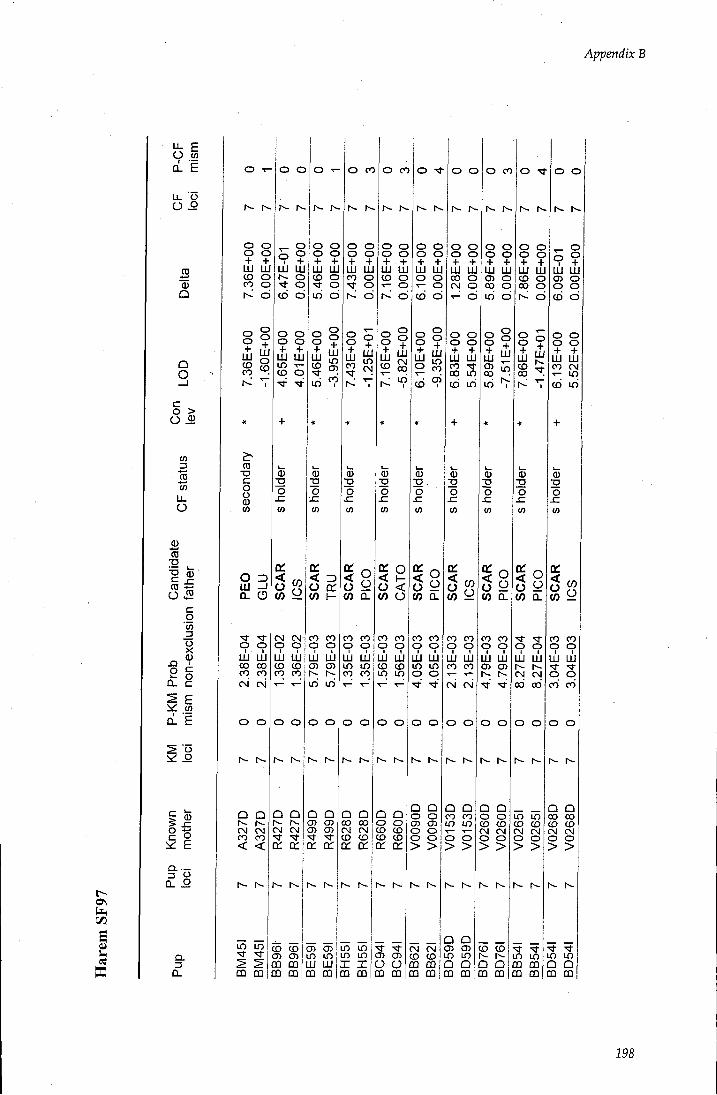
Appendix B
a es
^ E O in a. 1
u. o
0 Q
Q O
c o > O -9)
s u. O
0 CO
•g
c _ O ^
0
o
I Q.
c o CO
c o c E in
I -g o E
a —
Q. D D.
O •<- O O O
o o + UJ UJ CD CO
o
o o + LU CD CO
CD •D c o o 0 in
^ o 9 ? LU UJ
CD O
LU LU in T-
O CO O CO
LU UJ
in 9
UJ LU
I l l LU
O UJ a.
9 9 LU uj CO 00 CO CO CM CN
o o
Q Q r- 1 CM CM CO CO < <
in in
CO CD
(0 y
CM CN 9 9 UJ UJ CD CO CO CO
o o
Q Q CM CM
r-- 1
CD CO CD CD OQ CO CO CQ
< 3 O CC
CO CO 9 9 LU uj (3) CD
o o
Q Q O) CD CD CD
CD CD in m UJ UJ CD CQ
o 9 (0 CL
CO CO 9 9 LU uj in in CO CO
o o
o ^
1
o o o o + + UJ lU CD O T- O
(D
I ? <o 00
LU UJ O O T- O CD CD
O O
LU UJ 00 O CM
0 O
sz in
< h-o < (0 o
CO CO 9 9 uj uj CD CD in in
o o
0 o in
(0 Q-
CO CO 9 9 LU uj in in
o o o o + + UJ UJ CO - i-OO in CD iri
O CO
1
UJ UJ
in o
h~ h-
Q Q 00 00 CM CN CO CD
in in in in X X
Q Q O o CD CD CD CD a: a:
o o CQ m
Q Q o o CD CD O O O O > >
CM CN CD CD CQ CQ OQ CQ
0 O
sz
on
V) 9
CO CO 9 9 LU uj CO CO
O O
Q Q CO CO in to o o > >
o o o
r--
UJ UJ
^ o 9 ? LU UJ
O o LU UJ CO c ^ m CD ih
CO CO 9 9 LU uj (3) CD
o o
1
CO CD CM CM
Q Q CD CD in in Q Q CQ CQ
CD CD 1 Q Q
CQ CO
o 9 (0 Q.
9 9 uj uj CM CM od 00
o o
in in CD CD CM CM
5^
in in CD QQ CQ CQ
CO CO 9 9 LU uj
CO CO O O
Q Q OO OO CD CD CM CM
m i n Q Q CQ CO
29S
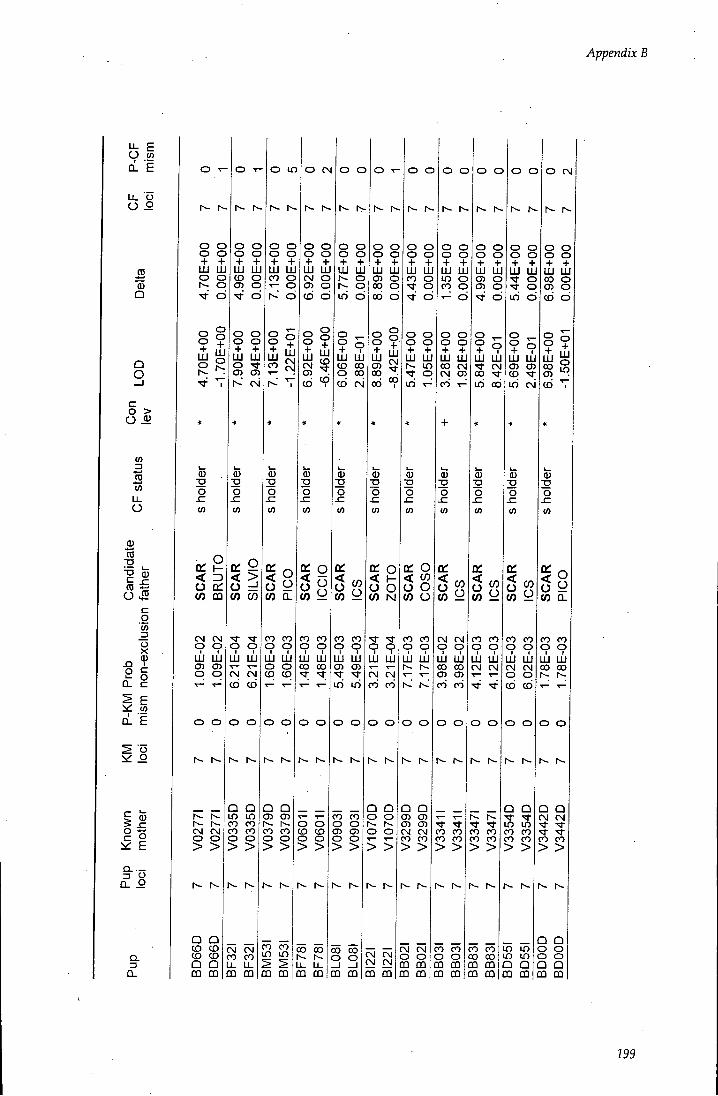
Appendix B
u- E O w CL E
O o
0 Q
Q O
o > O ^
05
05 O
0 •g
O 45 c g 05 o X
o c o
LL c
£L E
g o i<i E
£L O
Q. CL
o o o o + + lU LU o o o M-' d
m LU ^ o
o in
1 1
O CN
LU UJ CO o T- o
d
o + UJ o
0 o
< 3 o a: CO CO
CM CM 9 9 uj uj 05 05 O O
O O
CM CM
UJ UJ o ^ C35 05 r^' CM
0 o 05
o o o o + + UJ UJ CM O 05 O CD d
o o
UJ oi
CO CO CO CL
Q Q CD CD CD CD Q Q CQ m
9 9 uj uj CM CM CO CO
O O
CO CO CO CO
CO CO 9 9 UJ UJ o o CD CO
o o
in o
o o + UJ UJ CD CO O CO CD CM
o o
LU UJ 05 O
CO 2
CO CO o o
I I UJ UJ 00 CO
o o
CO !=:
CO CO 9 9 uj uj 05 05 iri iri
UJ UJ
o o
UJ UJ
UJ UJ
1-
Q Q Q Q in in 05 05 - - r-- •
CM CM CO CO u. u. CQ CQ
CO CO
CO CO in in CQ CQ
o o CD CD O O > >
oo oo u. u. CQ OQ
CO CO o o 05 05 o o > >
00 00 o o CQ CQ
< I -O O CO N
9 9 uj uj CN CN CO CO
O O
Q Q o o o o > >
CM CM CN CM CQ CQ
a: o < CO o o CO o CO CO 9 9 uj Ui
o o
Q Q 05 05 05 05 CM CM CO CO > >
CM CM O O CQ CQ CQ OQ
O O + + UJ UJ CO CM CM C35
O O
o o + LU UJ
a:
CO y
rg CM 9 9 UJ UJ CO oo 05 05 CO CO
O O
CO CO CO CO > >
CO CO o o
^ o
o o + LU UJ CM 00 'S-iri 00
CO y
CO CO 9 9 UJ UJ CN CM
o o
CO CO > > h- I--
CO CO 00 oo OQ OQ QQ CQ CQ CQ OQ CQ
O O
UJ UJ •"3- O
O O UJ UJ C35 cn CD iri CM
O CN
o o o o + + UJ UJ CO o 05 O CD d
0 o <n
a:
CO y
CO CO 9 9 uj uj CM CM o o CD CO
Q Q in in CO CO CO CO > >
in in in LD Q Q CQ m
CO Q.
CO CO 9 9 uj uj oo CO
o o
Q Q CM CM •<r CO CO > >
Q Q o o o o Q Q CQ CQ
199
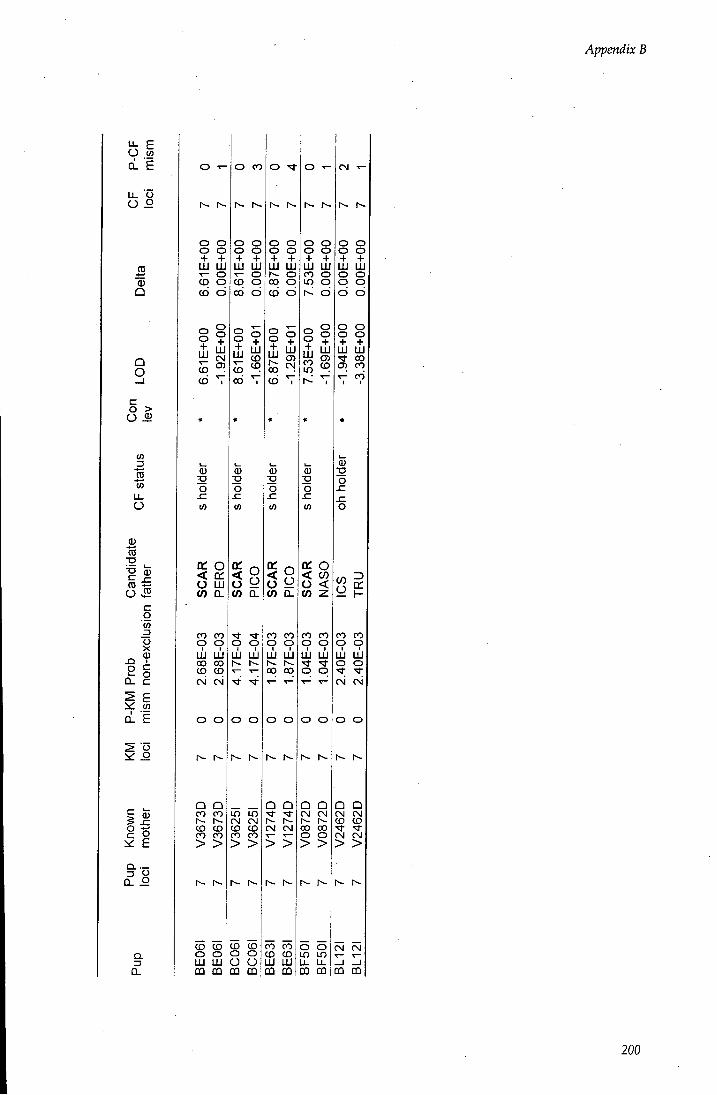
Appendix B
O in
Q. E
fe8
0 Q
Q O
o > O ^
in D s U. O
CD X3 ^ 0 ro
in
o X 0 XI
o
ci. E
o o
0
° g E
Q. O
Q. D Q.
1 1
O O o o + + LU LU T- O CD O CD c5
LU CD CD
0 O
O CO
5 o < CC O LU (0 CL
CO CO 9 9 LU uj OO OO CD CD CM CM
Q Q CO CO I--- 1 CD CD OO 00 > >
LU LU T- O
O ^
1
LU LU r-- o
00
CD CD o o LU LU CQ CQ
o 9 (0 CL
9 9 LU uj 1 1
o o
in in CN CM CD CD CO CO > >
CD CD o o o o CQ OQ
CD "7
0 o
o 9 (0 Q-
00 CO o o
I I LU UJ 1 OO OO
o o
Q Q CM CM > >
LU LU 00 o
CO CO CD CD LU LU OQ QQ
K O < CO o < (0 z
CO CO 9 9 LU uj
-"J o o
o o
I - -
Q Q CM CM 00 00 o o > >
1 r~-
o o o o + + LU LU o o o o CD CD
o o o o + + LU LU •5)- 00 CD CO T- CO
O O in in L L u. 03 CQ
CO CO 9 9 LU UJ o o CM CM
O O
Q Q rvj CM CD CD
CN CM
CQ CQ
200
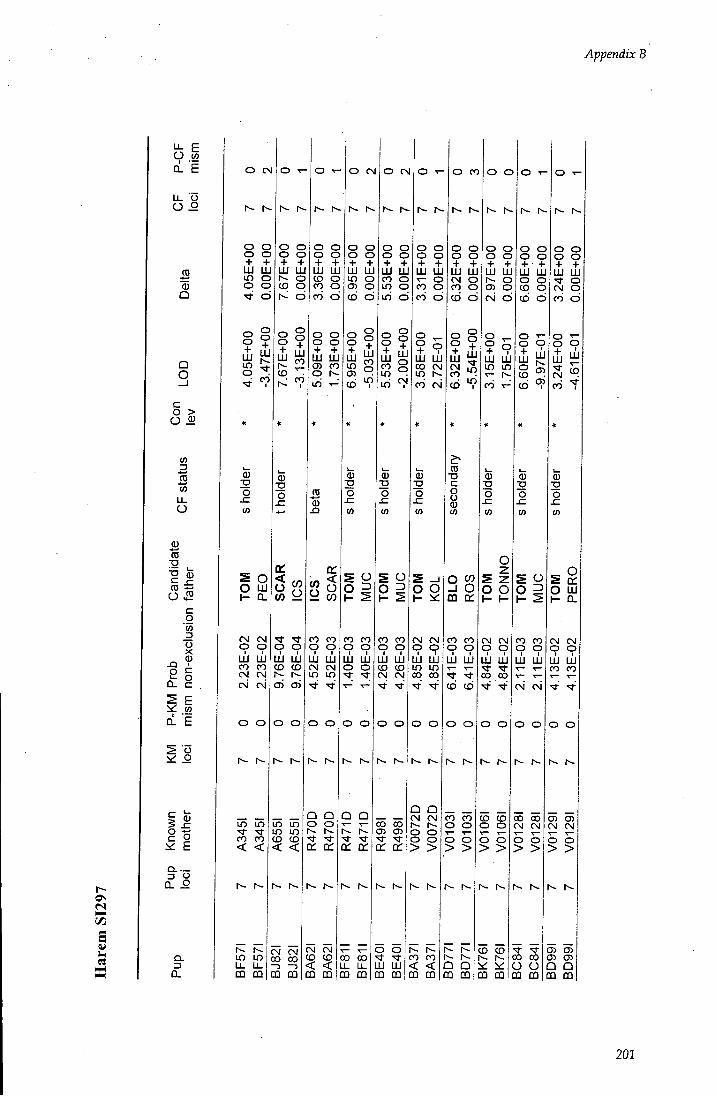
Appendix B
i/5
^ E O w d. E
u. o O o
0 Q
Q O
c o > O ^
in
3 "in u. O
s CD ^ 0
c g in _g CJ X 0
I c: o XJ o QI C 2 E CL E
g o i£: E
CL O
Q. D CL
O CM
o o + UJ UJ in o
UJ UJ 1 o
o
LU UJ
0 ;g o sz in
S O O UJ H CL
CM CM 9 9 LU LU CO 00 CM CM CM CM
UJ
00
LU UJ CD O
UJ UJ CD CO o i r i T-
tn in
< <
in in LL U-CQ CQ
0 :g o x:
V) 9
9 9 LU uj CD CD
o o
in in in in < <
CN CM OO 00 CQ CQ
en
9 CO
CO 00 9 9 uj uj CN CM m in
o o
Q Q o o NT ^ cn a:
O CM
LU LU
S 9 21 OO CO 9 9 LU UJ o o
o o
Q Q
O CM
o o o o + + LU UJ CO o in o iri o
O O 2
CO 00 9 9 LU uj CD CD CN CN
o o o o + + LU UJ 1- o 00 o CO
o ? 9 LU LU OO CM in CO CM
CM CM < < CD OQ
en en
OO CO u_ u. OQ CQ
OO OO CD CD a: a:
o o LU UJ CQ CQ
O O
CM CM 9 9 LU uj in in 00 00
o o
Q Q CM CM h- r--o o o o > >
OO CO CQ CQ
O 00
1
o o o o + + LU LU CM O CO O CO CD
8 f UJ iS i r i
(D T3 c o in
m cn
CO 00 9 9
LU UJ
CD CD
O O
o o
1
LU UJ o
o o LU UJ in in T- IV. CO
o T-
LU UJ o o
O
O O
CM CN 9 9 LU uj OO OO
O O
1 h-
OO CO o o
1 N-Q Q OQ OQ
CD CD O O
i i
CD CD
CQ OQ
UJ o CD CD
O O O O + + LU LU 'a- o CM O CO CD
s 9 O =5
CO OO 9 9 LU LU T— T—
CM CM
O O
OO CO CM CM O O > >
O UJ I - CL
CM CM 9 9 LU uj CO CO T— ^
O O
CD 05 CM CM o o > >
i-v
CD CD OO 00 0) CD O O Q Q CQ CQ OQ CQ
202
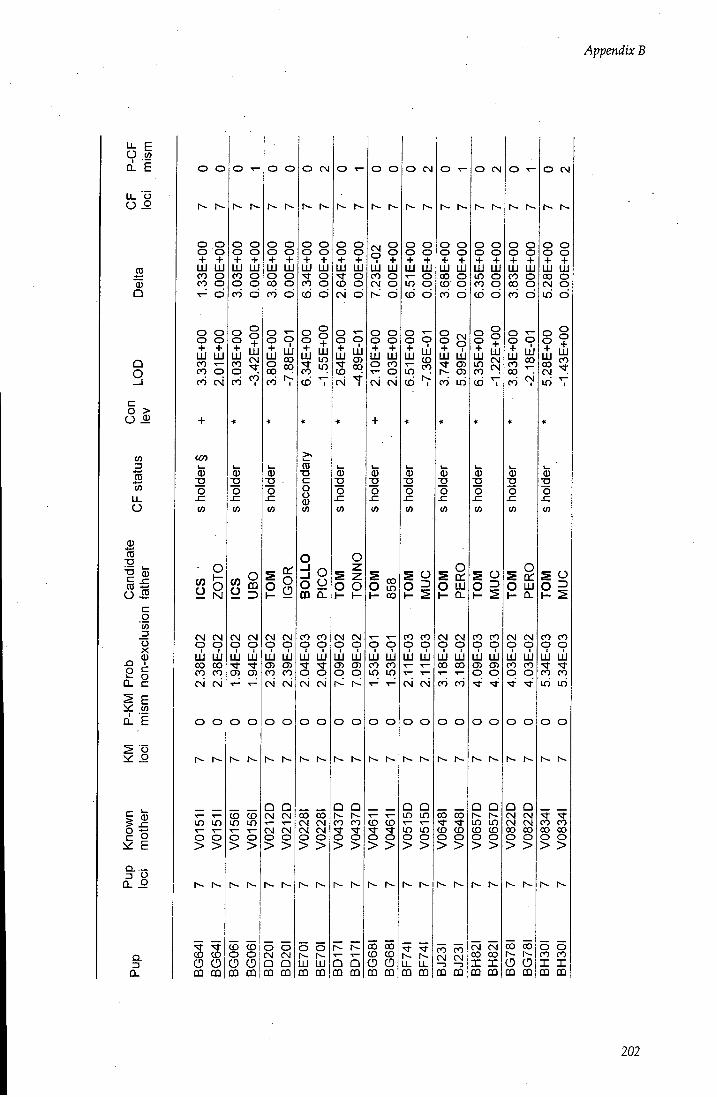
Appendix B
^ E O u) 0. E
LL O O o
0 Q
Q O
c o >
O) 3 B 05
LL O
0 TO
c O i5
0
g (/) _2 o X
CL c:
11 £L E
is: o
g o is: E
Q. O
o o
o o o o + + LU UJ CO o CO o
o o o o + + UJ UJ CO CO o CO CM
cen i—
0 o
53 o
CM CN 9 9 UJ lU CO CO CO CO CN CM
o o
Q-Q- CO OQ
o o o o + + UJ LU CO o o o CO d
8§
CM CM 9 9 UJ UJ 05 C35
O O
O O
o o o o + + UJ UJ o o 00 o CO d
o eg
o o o o + + UJ UJ •"3- O CO o CD d
T— CD CD in in in in — o o o o
> > > >
CD CD O O o o CQ CQ
CM CM 9 9 uj uj C35 C35 CO CO eg eg
Q Q CM eg CN eg o o > >
o o eg eg Q Q OQ OQ
•o c o o 0 01
O o m Q.
CO CO 9 9 uj uj 'd-o o eg eg
o o
CO oo CN eg eg eg o o > >
o o o o + + UJ m
o o
LU UJ
o o o o + + LU UJ O CO T- O CM CM
O O UJ UJ CQ OQ
o o I - H
eg CN 9 9 uj uj cn (35 o o
o o
Q Q CO CO o o > >
5 Q QQ OQ
O CM
o o o o + + UJ UJ •!- O m o CD d
O in I - CO
o o I I UJ UJ CO CO in in
o o
CD CD o o > >
CO CO CD CD O O OQ OQ
O d 2
CO CO 9 9 uj uj
eg eg
o o
Q Q in in U5 in
UJ UJ 00 o
O CM
o o UJ UJ CJ5 05 CO iri
E g O UJ I - CL
eg eg o o LU LU CO 00
O O
CO 00 CD CO o o > >
LL LL OQ OQICQ CD
CO CO eg eg
o o o o + + LU LU in o CO o CD d
0 o
O 2
CO CO o o
I I LU LU CJ5 CJ5
O O
N-
Q Q in in CD CD
eg CM oo oo X X CQ CQ
1 r--
o o o o + + UJ UJ CO o
O UJ H Q-
eg eg 9 9 uj uj CO CO o o
o o
Q Q eg eg CM CM 00 CO
CO CO O CD CQ CQ
O CM
UJ UJ OO o
f ? + I I I
CO CO 9 9 uj uj CO CO
o o
CO CO OO 00 5^
o o CO CO X X OQ OQ
202
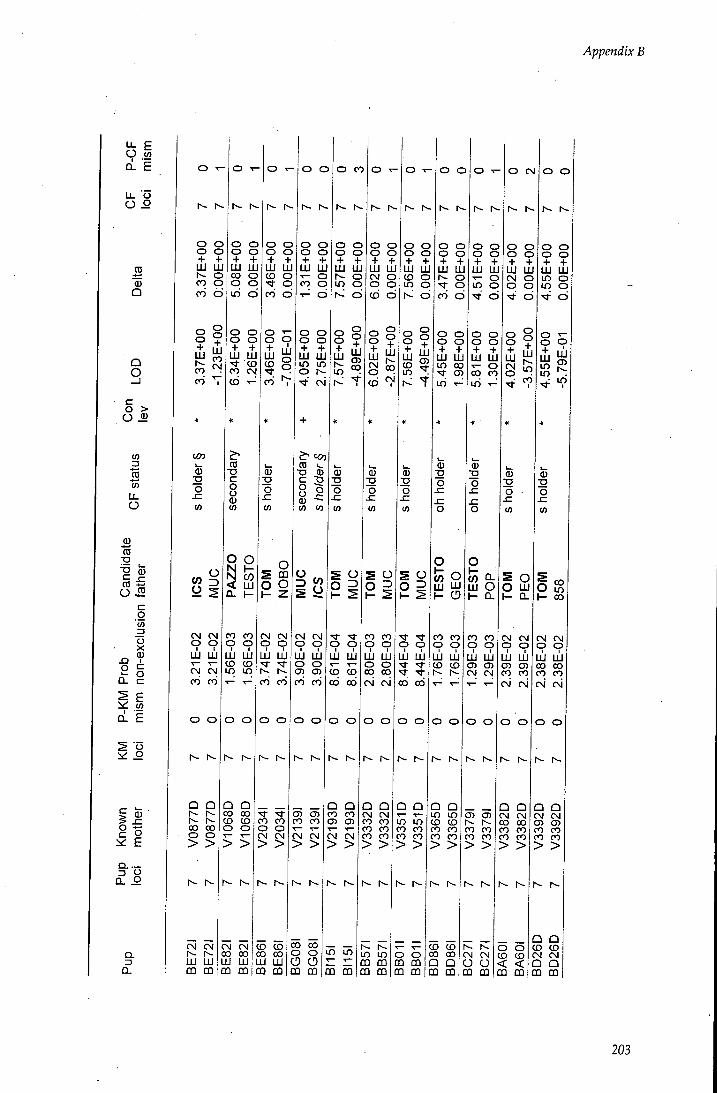
Appendix B
LL E O i d. E u. o O o
3 0 Q
Q O
c o > O ^
in
3 U) O
0 •g
ro O 3
0
XI o
c g in _g o X c o c
^ to ci. E
0 c: 5 _ g o
E
CL D CL
1
o o + LU UJ
o CO o 00 d
o o + UJ r~-co
un 0 o in
O 3
CM CM O O I I LU UJ CN CM CO CO
O O
Q Q
OO 00
5^
UJ UJ 00 o
LU LU CO CM (6
CD -a c o o 0 in
O O
< LU Q. H
00 CO 9 9 LU uj CD CD in in
o o
o o o o + + LU LU CD O •<a- o CO CD
Q Q 00 00 CD CD o o > >
CM CM 9 9
LU LU
00 CO
o o
o o
1
UJ UJ •>- o CO o
O CO
UJ UJ in m
UJ UJ 1 o in o
CD
CM CM UJ UJ CQ DQ
CN CM OO 00 LU UJ CD 0Q|
CO CO o o
CD CD OO 00 LU LU OQ OQ
(D I . .
8 I 0 in in
^8
CM CM O O I I LU UJ O O CJJ CD CO CO
O O
1
o o o o + + UJ UJ CM O O O CD CD
1
o o + + LU LU
o
UJ
CO CM
0 o
sz
CD CD OO CO
s 9
9 9 LU uj CD CD OC) 00
o o
Q Q CO OO CD CD
CM CM CM CM > > > >
1
OO CO o o O O OQ OQ
in in 5 m
2 9 O 2
00 00 9 9 UJ LU o o CO OO CN CM
O O
I- - h-
Q Q CM CM 00 CO CO CO OO CO > >
in in CQ CQ CQ OQ
9 9 LU Ljj
a6 o6
o o
Q Q
CO 00
^5
O O
UJ UJ o
UJ UJ tn OO (D
1
o o UJ UJ
o o o o UJ UJ o 00 OO
o
(0 O m UJ o
OO CO 9 9 LU uj CD CO
o o
Q Q m in CD CD 00 CO CO CO > >
o o CQ CQ CQ OQ
CO CD CO 00 Q Q DQ CQ
(0 Q-u j O I - Q-
CO 00 9 9 uj uj CD CD CM CM
O O
CD CD 00 00 00 00 > >
CM CM O O
O CM o o
UJ UJ
^ o
^ 9
o o o o + + LU UJ in o in o
CD
1
o O UJ CL
CM CN 9 9 LU uj CD CD 00 CO CM CM
O O
Q CM CN 00 OO CO 00 00 CO > >
1 h~
O CD CO
< CQ CQ|Q3 DQ
o S f - 00
CN CM O O I I LU UJ OO 00 CO CO CM CN
O O
Q Q CN CM CD CD CO CO OO 00 > >
1
Q Q CD CD CM CM Q Q OQ CQ
203
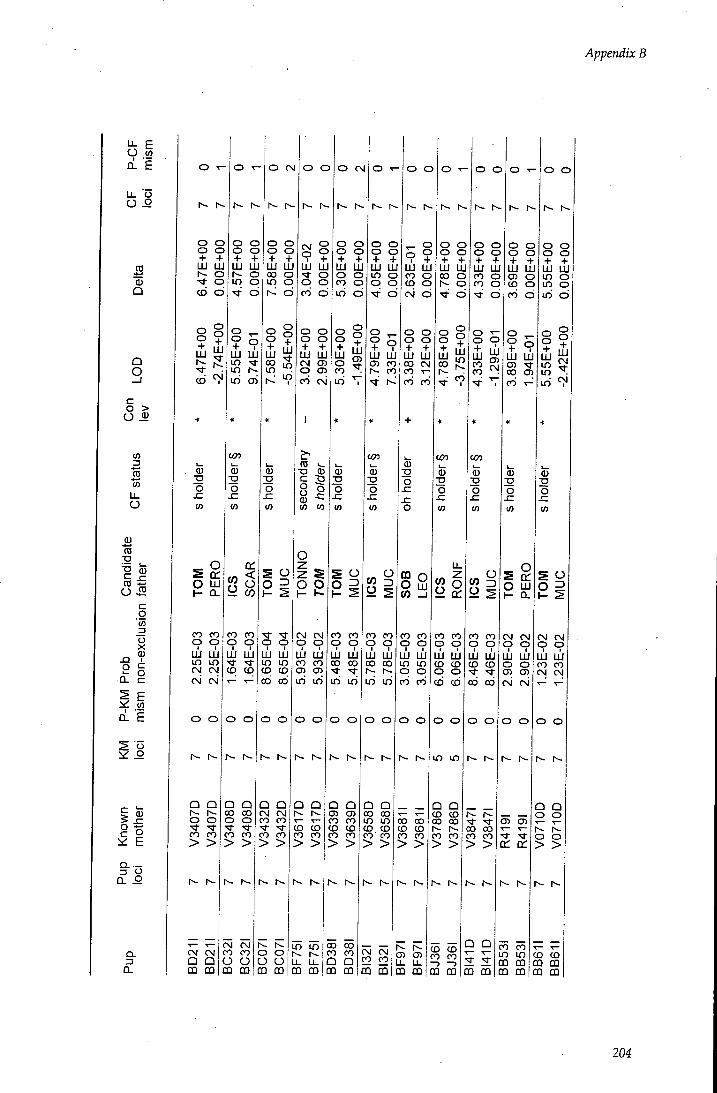
Appendix B
O w
LL O
0 Q
Q O
c o > O
w u. O
S CD "O 0
O B a q in _g o X 0 £1
p
ci. £
ii: o
g | ii: E
D. O
Q.
o o o o + + m UJ r- o '^f o CD d
UJ UJ r- o
o o +
UJ
CD
o ^ ? 9 LU UJ
O CM
o o o o + + UJ UJ oo o in o r--' d
0 o 05
O UJ H CL
0 o
o o + UJ
iri
a:
9 CO
o o
UJ UJ
CO o
O CM
m UJ o o
o 2
CO CO CO CO - o o UJ LU uj uj in in eg eg CO CD CM eg
o o
Q Q o o
55
eg eg Q Q CQ 03
o o
Q Q CO oo o o
> >
CN eg CO CO O O CQ OQI
UJ UJ in in CD CO
UJ UJ eg C35 O (35 CO eg
CD I -
8 o 0 05 05
eg eg 9 9 uj uj CO CO 05 (35
oo CO I iri iri
o o
Q Q eg eg CO CO > >
o o
o o o o + + UJ UJ in o o o
d
? = UJ UJ 05 CO h- CO
o o
^ o 9 ? UJ UJ CO o CO o evi d
UJ UJ oo eg CO T-CO CO
ccn 0 o
O O o o CQ OQ
CD CD CO CO > >
in in u. u. CQ OQ
CO CO 9 9 LU LU 00 oo ^ -St iri iri
o o
Q Q (35 CD CO CO CO CD CO CO > >
CO oo CO CO Q Q OQ OQ
8^
CO CO 9 9 uj uj CO oo iri iri
o o
Q Q CO oo in in CO CD CO CO > >
O LU CO _ J
CO CO 9 9 uj uj in in o o
UJ UJ CO o
I — 0 o 03
W O \d a:
CO CO 9 9 uj uj CD CD O O
O O
O O O O + + UJ UJ CO o CO o ^ d
CO CO CD CO
o o
CN CM CO CO CQ OQ
CO CO CD CD CO CO > >
05 (35 U. LL OQ OQ
o 4
Q Q CD CD CO 00 CO CO > >
CO CO
9 9 uj uj CO CD ^ l - 'if CO CO
o o
1 oo 00 CO CO > >
o •<-
UJ UJ (35 O
O o UJ UJ C35 CO 05 CO
O LU CL
CO CO CM CM CM CM
O O
O O O O + + UJ UJ in o in o iri d
o o + UJ eg
CM
0 o
CQ CQ 2 2 CQ CQ
9 9 uj uj O O CJ5 CD eg CM
o o
(35 CD
9 9 uj OJ CO CO eg eg
o o
CO CO in in CQ CQ CQ OQ
Q Q o o
o o > >
CD CO CQ CQ OQ OQ
204
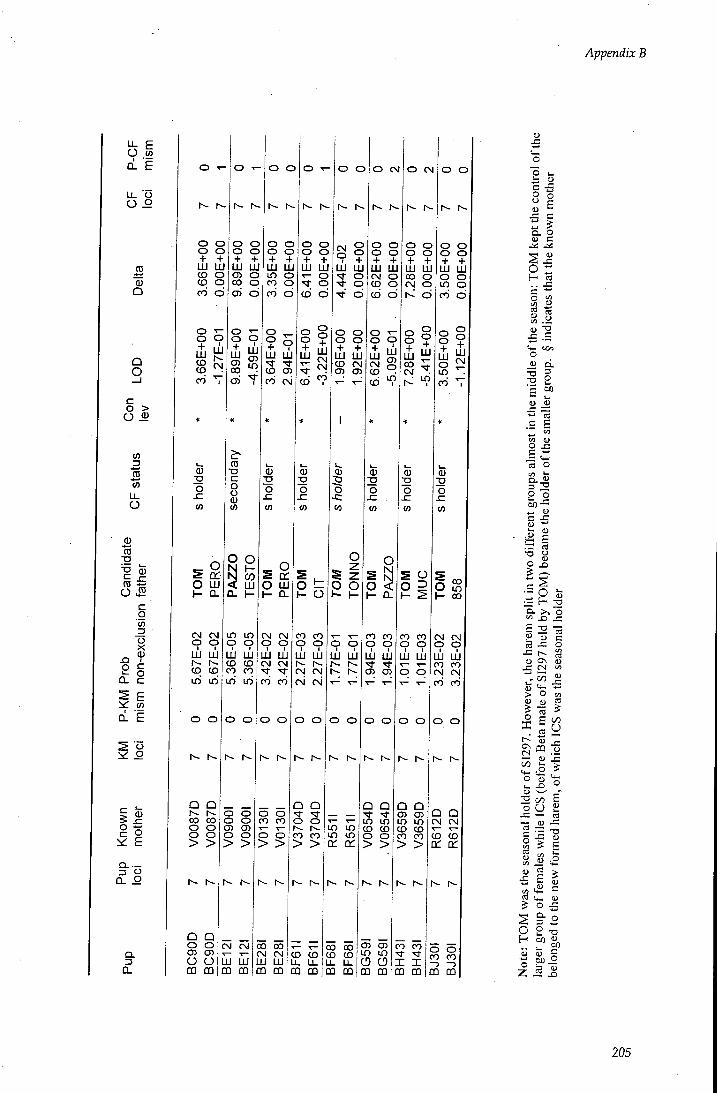
Appendix B
^ E O in
O o
0 Q
Q O
cz o > O 1^
in D 3 w U. O
CD •o T3 Q) O J5
c g CO o X 0 XI
p
ci. E
s y
g o i i i E
Q. O
Q. Q.
1
O O + LU UJ CD CO 00
S o + UJ CO CO 00
o o + + LU UJ
o I LU
0 o x: (0
O UJ I - CL
CM CN 9 9 uj uj CD CD i r i i r i
o o
Q Q OO 00 o o o o > >
I - -
Q Q o o CD CD O O CQ OQ
o
i s
£^ CD
ID
o o 0 in
O O < LU Q- I -
in in 9 9 LU uj CD CD CO CO t r i i r i
o o
1
o o o o CD CD o o > >
o o
1
o o o o + + LU UJ in o CO o CO CD
o O o + O 1 O +
UJ LU UJ 'S- •<3-CD CD CO CM CD
O T -
r-- 1
LU UJ o
o o
9 ? UJ UJ
o o + UJ CM
UJ UJ CQ OQ
o cr
O UJ CL
CM CM O O 1 I UJ LU CM CM
NT CO CO
O O
o o 00 CO
i i
0 o
JZ in
00 00 CM CM
°5 00 CO 9 9 LU LU CM CN CM CN
O O
Q Q •a- -a-
•T o
o o o o + + UJ LU CD CM CD (35
O CM O CM
LU UJ
CD O
i s CO
9 9 uj uj
0 o
sz in
99
CD CO UJ LU U. U. OQ CQ OQ OQ
O O
in in in in cn cn
O N < Q.
CO 00 9 9 uj uj CD CD
O O O O + + UJ LU CO o CN O 1 CD
in
o o
o o UJ UJ o in 00 o
OO OO CD CD LL LL CQ OQ
o o
Q Q m in CD CO
99
CO 00 9 9 uj uj
T — o o
o o
CD CD in in O O CQ OQ
Q Q 05 CD in in CO CD CO 00 > >
O S I - CO
CM CN 9 9 LU UJ OO PO CM CM
O O
Q Q CM CM S 5 cn cn
2 2 CD o ? ? CO CO X X - 5 - 3 CQ OQ CQ 03
c -S o o
i z I Q. O
u c
I -1.1 O U Q.
l i p so —
.= E g
(0 o " in
^ H 2 c > o « X2 .C
S 2
-= D On .C CM U .-> o
I g
On CD
o <u 1- X)
2 (/5 o U
CO c o w a
to C/3 U
o
e CO - — c O
u w (U
CO
CO
CO t^j u
P 2 -n
I S) I
205
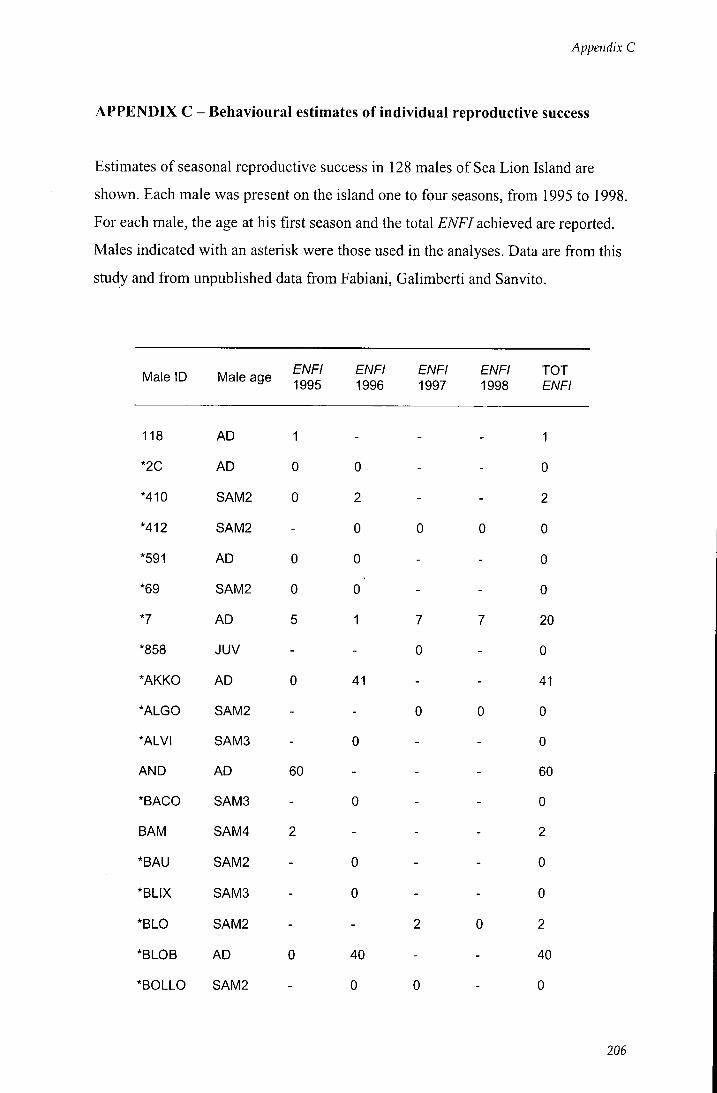
Appendix C
APPENDIX C - Behavioural estimates of individual reproductive success
Estimates of seasonal reproductive success in 128 males of Sea Lion Island are
shown. Each male was present on the island one to four seasons, from 1995 to 1998.
For each male, the age at his first season and the total ENFI achieved are reported.
Males indicated with an asterisk were those used in the analyses. Data are from this
study and from unpublished data from Fabiani, Galimberti and Sanvito.
Male ID Male age ENFI 1995
ENFI 1996
ENFI 1997
ENFI 1998
TOT ENFI
118 AD 1 - - - 1
*2C AD 0 0 - - 0
*410 SAM2 0 2 - - 2
M l 2 SAM2 - 0 0 0 0
*591 AD 0 0 - - 0
*69 SAM2 0 0 - - 0
*7 AD 5 1 7 7 20
*858 JUV - - 0 - 0
*AKKO AD 0 41 - - 41
*ALGO SAM2 - - 0 0 0
*ALVI SAMS - 0 - - 0
AND AD 60 - - - 60
*BACO SAMS - 0 - - 0
BAM SAM4 2 - - - 2
*BAU SAM2 - 0 - - 0
*BLIX SAMS - 0 - - 0
*BLO SAM2 - - 2 0 2
*BLOB AD 0 40 - - 40
*BOLLO SAM2 _ 0 0 0
206
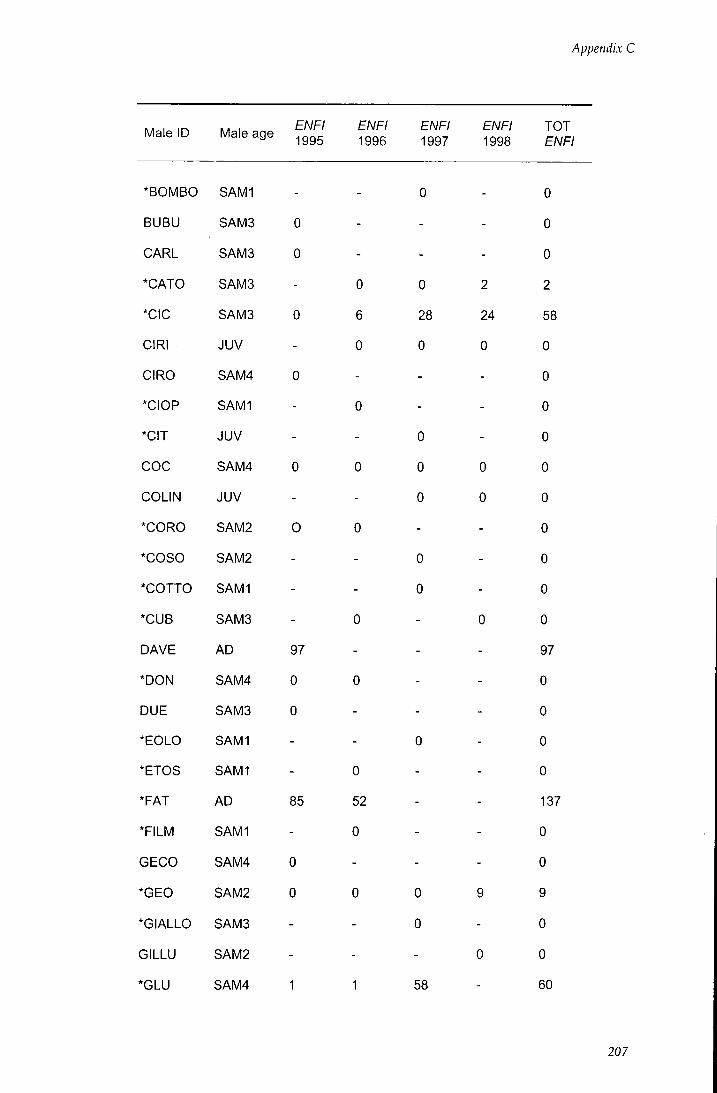
Appendix C
Male ID Male age ENFI 1995
ENFI 1996
ENFI 1997
ENFI
1998 TOT ENFI
*BOMBO SAM1 - - 0 - 0
BUBU SAMS 0 - - - 0
CARL SAMS 0 - - - 0
*CATO SAMS - 0 0 2 2
*GIC SAMS 0 6 28 24 58
GIRI JUV - 0 0 0 0
GIRO SAM4 0 - - - 0
*GIOP SAM1 - 0 - - 0
*GIT JUV - - 0 - 0
GOG SAM4 0 0 0 0 0
GOLIN JUV - - 0 0 0
*GORO SAM2 0 0 - - 0
*GOSO SAM2 - - 0 - 0
*GOTTO SAM1 - - 0 - 0
*GUB SAMS - 0 - 0 0
DAVE AD 97 - - - 97
*DON SAM4 0 0 - - 0
DUE SAMS 0 - - - 0
*EOLO SAM1 - - 0 - 0
*ETOS SAM1 - 0 - - 0
*FAT AD 85 52 - - 1S7
*FILM SAM1 - 0 - - 0
GEGO SAM4 0 - - - 0
*GEO SAM2 0 0 0 9 9
*GIALLO SAMS - - 0 - 0
GILLU SAM2 - - - 0 0
*GLU SAM4 1 1 58 _ 60
207
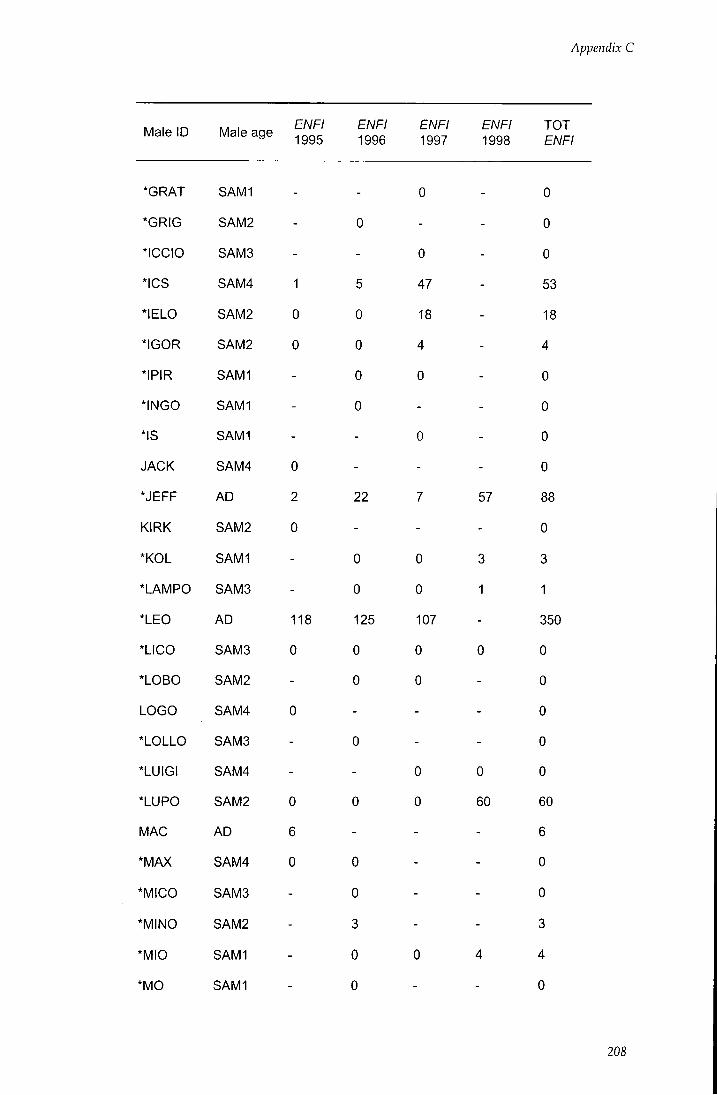
Appendix C
. ,n I ENFI ENFI ENFI ENFI TOT Male ID Male age ^gg^ ^ggg ^gg^ ^ggg ^^^1
*GRAT
*GR!G
*IGGIO
*IGS
*IELO
*IGOR
*IPIR
*INGO
*IS
JAGK
*JEFF
KIRK
*KOL
*LAMPO
*LEO
*LIGO
*LOBO
LOGO
*LOLLO
*LUIGI
*LUPO
MAG
*MAX
*MIGO
*MINO
*MIO
*M0
SAM1
SAM2
SAMS
SAM4
SAM2
SAM2
SAM1
SAM1
SAM1
SAM4
AD
SAM2
SAM1
SAMS
AD
SAMS
SAM2
SAM4
SAMS
SAM4
SAM2
AD
SAM4
SAMS
SAM2
SAM1
SAM1
1
0
0
0
2
0
118
0
0
6
0
5
0
0
0
0
22
0
0
125
0
0
0
0
3
0
0
0
47
18
4
0
0
0
107
0
0
0
0
57
S
1
0
60
0
0
0
5S
18
4
0
0
0
0
88
0
S
1
S50
0
0
0
0
0
60
6
0
0
S
4
0
20S
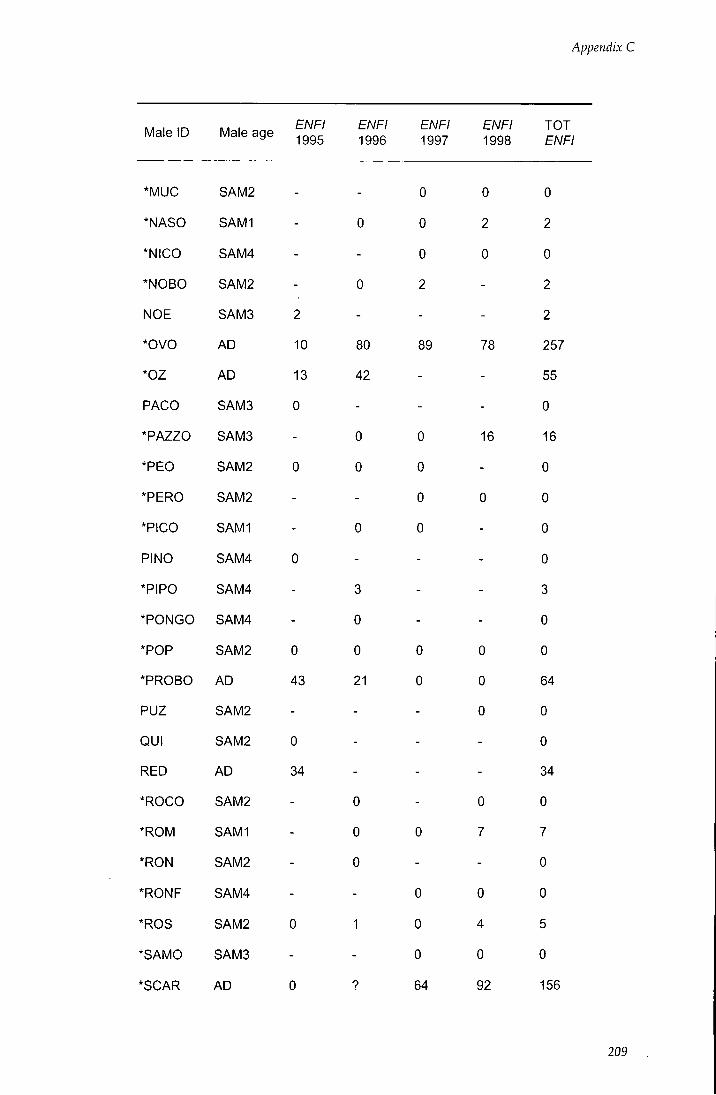
Appendix C
Male ID Male age ENFI 1995
ENFI 1996
ENFI 1997
ENFI 1998
TOT ENFI
*MUC
*NASO
*NICO
*NOBO
NOE
*0V0
*0Z
PACO
*PAZZO
*PEO
*PERO
*PiCO
PINO
*PIPO
*PONGO
*POP
*PROBO
PUZ
QUI
RED
*ROCO
*ROM
*RON
*RONF
*ROS
*SAMO
*SCAR
SAM2
SAM1
SAM4
SAM2
SAMS
AD
AD
SAM3
SAM3
SAM2
SAM2
SAM1
SAM4
SAM4
SAM4
SAM2
AD
SAM2
SAM2
AD
SAM2
SAM1
SAM2
SAM4
SAM2
SAM3
AD
2
10
13
0
0
43
0
34
80
42
0
0
3
0
0
21
0
0
0
0
0
0
2
89
0
0
0
0
0
0
0
0
0
64
0
2
0
78
16
0
0
0
0
7
0
4
0
92
0
2
0
2
2
257
55
0
16
0
0
0
0
3
0
0
64
0
0
34
0
7
0
0
5
0
156
209
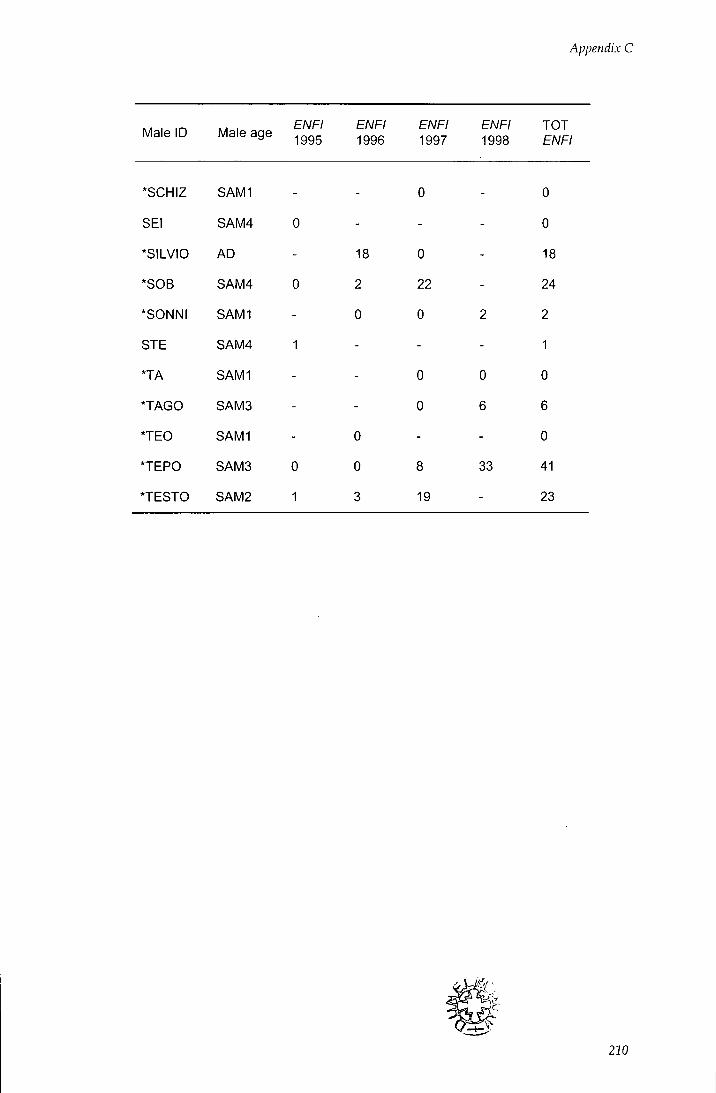
Appendix C
Male ID Male age ENFI 1995
ENFI 1996
ENFI 1997
ENFI 1998
TOT ENFI
*SCHIZ SAM1 - - 0 - 0
SEI SAM4 0 - - - 0
*SILVIO AD - 18 0 - 18
*SOB SAM4 0 2 22 - 24
*SONNI SAM1 - 0 0 2 2
STE SAM4 1 - - - 1
*TA SAM1 - - 0 0 0
*TAGO SAMS - - 0 6 6
*TEO SAM1 - 0 - - 0
*TEPO SAMS 0 0 8 3S 41
*TESTO SAM2 1 3 19 - 2S
220