Embed Size (px)
Citation preview
2014, pages 1–8BIOINFORMATICS ORIGINAL PAPER doi:10.1093/bioinformatics/btu400
Gene expression
Modeling time-dependent transcription effects of HER2 oncogene
and discovery of a role for E2F2 in breast cancer cell-matrix
adhesionAliccia Bollig-Fischer1,2,*, Luca Marchetti3,4, Cristina Mitrea5, Jiusheng Wu1,2, Ad�ele Kruger6,Vincenzo Manca3 and Sorin Dr�aghici5,6
1Barbara Ann Karmanos Cancer Institute and 2Department of Oncology, Wayne State University, Detroit, MI 48201,USA, 3Department of Computer Science, University of Verona, 37134 Verona, Italy, 4The Microsoft Research–Universityof Trento Centre for Computational and Systems Biology, 38068 Rovereto, Italy, 5Department of Computer Science,Wayne State University and 6Department of Obstetrics and Gynecology, Wayne State University, Detroit, MI 48201, USA
Associate Editor: Janet Kelso
ABSTRACT
Motivation: Oncogenes are known drivers of cancer phenotypes and
targets of molecular therapies; however, the complex and diverse sig-
naling mechanisms regulated by oncogenes and potential routes to
targeted therapy resistance remain to be fully understood. To this end,
we present an approach to infer regulatory mechanisms downstream
of the HER2 driver oncogene in SUM-225 metastatic breast cancer
cells from dynamic gene expression patterns using a succession of
analytical techniques, including a novel MP grammars method to
mathematically model putative regulatory interactions among sets of
clustered genes.
Results: Our method highlighted regulatory interactions previously
identified in the cell line and a novel finding that the HER2 oncogene,
as opposed to the proto-oncogene, upregulates expression of the
E2F2 transcription factor. By targeted gene knockdown we show
the significance of this, demonstrating that cancer cell-matrix adhe-
sion and outgrowth were markedly inhibited when E2F2 levels were
reduced. Thus, validating in this context that upregulation of E2F2
represents a key intermediate event in a HER2 oncogene-directed
gene expression-based signaling circuit. This work demonstrates
how predictive modeling of longitudinal gene expression data com-
bined with multiple systems-level analyses can be used to accurately
predict downstream signaling pathways. Here, our integrated method
was applied to reveal insights as to how the HER2 oncogene drives a
specific cancer cell phenotype, but it is adaptable to investigate other
oncogenes and model systems.
Availability and implementation: Accessibility of various tools is
listed in methods; the Log-Gain Stoichiometric Stepwise algorithm is
accessible at http://www.cbmc.it/software/Software.php.
Contact: [email protected]
Supplementary information: Supplementary data are available at
Bioinformatics online.
Received on April 10, 2014; revised on June 17, 2014; accepted on
June 18, 2014
1 INTRODUCTION
Cancer cells demonstrate unlimited and unmitigated prolifer-
ation and resistance to anti-proliferative and cell death cues,
phenotypes that set them apart from normal cells. Underlying
these cancer-specific phenotypes are aberrantly activated recon-
figured signaling networks that control malignant growth and
survival (Luo et al., 2009). Cancer-specific signaling networks
and carcinogenesis are governed by the activation of key
cancer driver genes, termed oncogenes. Based on this under-
standing, much progress has been made to develop anti-cancer
drugs, with great clinical gains made through efforts to target
oncogenes that possess kinase function; including the epidermal
growth factor receptor family member HER2 in the treatment of
breast cancer (BC; Sharma and Settleman, 2007). The advan-
tages of molecularly targeted systemic treatments over traditional
chemotherapy are clear: targeted treatments yield improved pa-
tient outcomes and lesser side effects (Jordan, 2008).Despite advancements made to improve cancer treatments,
targeted therapies eventually fail for patients, leading to de-
veloped drug resistance and cancer recurrence. A number of mo-
lecular mechanisms are described to underlie de novo and
developed resistance to drugs. Included among them is the
event of an activating mutation in an effector protein down-
stream of the targeted oncogenic kinase (Wagle et al., 2011).
The complexity of oncogene activation and the prevalence of
resistance underscore the fact that although it is appreciated
that activated oncogenes are the dominant drivers of malignant
progression in cancer, it remains unclear how activated onco-
genes regulate the expression of transformed phenotypes.
Beyond well-studied biochemical signaling pathways, it is espe-
cially true for yet unknown transcriptional regulatory networks.
Clearly, elucidating the signaling networks regulated by onco-
genes that result in cancer-specific phenotypes will provide in-
sight to improve therapeutic strategies and overcome resistance.To this end, biological processes are increasingly being
described by network modeling of gene expression data.
Various approaches have been used for purposes of investigating
transcription networks to identify expression-based classifiers
for cancer subtypes (Ramaswamy et al., 2001); or to integrate
DNA-level genetic variation and expression data to infer*To whom correspondence should be addressed.
� The Author 2014. Published by Oxford University Press. All rights reserved. For Permissions, please e-mail: [email protected] 1
Bioinformatics Advance Access published July 15, 2014 at :: on A
ugust 21, 2014http://bioinform
atics.oxfordjournals.org/D
ownloaded from

causality (Jornsten et al., 2011); or to model before and after
perturbation expression data to infer causality (Saeki et al.,
2009). In step with these efforts, an ever-increasing variety of
formalisms have been proposed for modeling and simulating
gene-interaction networks (Bansal et al., 2007).Here, we developed a multi-pronged approach to investigate
HER2 oncogene signaling mechanisms using perturbed, time-
dependent, gene expression data from microarray analysis. At
this stage in the development of our modeling system, clustering
of genes was required to reduce the dimensionality or complexity
of the data. Our working premises were that genes displaying
similar dynamic patterns of expression are similarly regulated
and functionally related, a concept supported in the literature
(Lockhart andWinzeler, 2000), and furthermore, that the expres-
sion level changes of a gene or genes in one cluster impacts the
expression level changes of genes in another. We started with a
method to cluster genes displaying similar expression dynamics
after HER2 oncogene signaling was inhibited in the HER2
amplified metastatic BC cell line SUM-225 (Forozan et al.,
1999; Kuperwasser et al., 2005). Then we derived mathematical
models to support predicted regulatory relationships among clus-
ters using a novel MP grammars method, which identifies alge-
braic notation that can simulate the dynamics of one cluster as
a function of the gene expression level changes displayed by an-
other cluster (Manca, 2008). Here, we have adapted the applica-
tion of P systems that was developed for the purpose of
expressing metabolic systems in discrete mathematical terms
(Manca, 2008, 2013). A promoter analysis reinforced indications
for relationships between clusters. A pathway impact analysis
was used to identify cancer pathways/functions specific to a clus-
tered gene set. All told, the analysis predicted a key intermediary
role for the E2F transcription factor 2 (E2F2) in HER2 oncogene
signaling. In follow-up functional studies to test the prediction,
targeted E2F2 expression knockdown and 3D on-top Matrigel
assays showed that matrix adhesion and outgrowth, which is
indicative of cancer cell potential for metastatic colonization
(Shibue and Weinberg, 2009), was significantly inhibited in
SUM-225 cells when E2F2 levels were reduced.
2 METHODS
2.1 Overview of gene expression data
Gene expression data for MCF10A, MCF10HER2 and SUM-225 cells
are from previous microarray analysis of global gene expression (Bollig-
Fischer et al., 2011). Briefly described here, cultures were treated with the
HER2 kinase inhibitor CP724 714 (1mM), and RNA was isolated from
parallel plated cultures at 0h and every 3h after addition of inhibitor for
45h, yielding 16 time points. Expression levels were determined by micro-
array analyses using the Illumina human Ref8v2 array (Illumina, San
Diego, CA). Data were processed for quality control in BeadStudio
and quantile normalized, and are available through NCBI’s Gene
Expression Omnibus accession numbers GSE22955, GSE23137 and
GSE23138 (http://www.ncbi.nlm.nih.gov/geo).
2.2 Modeling gene cluster regulatory interactions
Raw microarray data with a detection P� 0.01 were log2 transformed
and quantile normalized. The normalized time series data were further
filtered based on a curve fitting procedure that discards genes whose
expression does not exhibit time-dependent change (Marchetti and
Manca, 2012). For this purpose, we calculated polynomial models
approximating the gene expression profile, similar to work by Ramoni
et al. (2002), by using polynomial regression and least-square estimate.
These models were used to filter out genes that exhibit constant or chaotic
expression. The differences between the polynomial models and the gene
profiles can be because of error or lack of fit. These two types of differ-
ences were squared and summed up to values that follow two independ-
ent chi-square distributions. A Fisher F-test (P50.001) was then used to
select the best fit. Finally, genes that exhibited polynomial-like dynamics
were filtered according to their minimum–maximum log2 fold-change to
arrive at a gene set that well represents the three types of polynomial
shapes considered: polynomial of first degree (linear profiles, log2 fold-
change41), of second degree (parabolic profiles, log2 fold-change40.7)
and third degree (cubic profiles, log2 fold-change40.8). At the end of this
phase, the number of time series decreased from 420 000 to 1175
(Supplementary Table S1). Filtered genes were clustered according to
the similarity of their corresponding polynomial model using a method
based on a classic hierarchical clustering technique (Eisen et al., 1998;
Marchetti andManca, 2012). The clustering algorithm was wrapped in an
iterative procedure that ran the algorithm multiple times, arriving at dif-
ferent total numbers of clusters. Ultimately, the procedure chose the best
division among those computed according to a user-defined threshold for
the minimum number of genes in a single cluster (10 genes for this appli-
cation). Interactions among clusters were then explored by deriving an
MP grammar. This was achieved by application of the Log-Gain
Stoichiometric Stepwise (LGSS) algorithm, which infers system param-
eters from discrete observations (Manca and Marchetti, 2011, 2012). The
size of the systems of equations solved by LGSS depends on the number
of variables and potential number of rules of the system under examin-
ation. In the specific case of the application presented in this article, the
regression performed by LGSS calculated the MP grammar with a limi-
tation on the rules, such that genes in clusters fitting with polynomials of
lower degree (linear) were not regulated by genes fitting with polynomials
of high degree (for example, cubic). The LGSS algorithm and user guide
are accessible at http://www.cbmc.it/software/Software.php.
Promoter analysis of genes for experimentally verified transcription
factor binding site over-representation used the BioBase ExPlain 3.1
tool and TRANSFACVR
database (Beverly, MA). For this purpose, the
promoter region included 500 base pairs on each side of the transcrip-
tion start site. Gene-annotation enrichment analysis was done using
the Genes-to-Systems Breast Cancer Database (http://www.itb.cnr.it/
breastcancer/). The pathway impact analysis was implemented using the
Pathway-Express analysis package (Khatri et al., 2005). Further explan-
ation of MP grammars and MP grammar notation as well as BioBase,
Gene-to-Systems database and Impact Factor Analysis is also made
available in the Supplementary Description of Methods.
2.3 Cells, cell culture and E2F2 knockdown
SUM-225 cells were derived from a HER2-amplified BC described in
(Forozan et al., 1999). The MCF10A human mammary epithelial cell
line was developed at the Karmanos Cancer Institute, originally the
Michigan Cancer Foundation (Miller et al., 1993). The authenticity of
the cell lines was validated during the course of these studies by arrayed
comparative genomic hybridization, confirming HER2 amplification in
the SUM-225 cell line and lack thereof but amplification of FGFR1 in
MCF10A (Marella et al., 2009). Stable lentivirus-mediated shRNA
knockdown of E2F2 expression in SUM-225 and MCF10A cells was
done using the Expression Arrest GIPZ lentiviral shRNAmir system fol-
lowing manufacturer instruction (Thermo Scientific, Huntsville, AL).
GIPZ is a commercially available bicistronic vector that expresses green
fluorescent protein and the shRNA of interest. Further information
including culture conditions are detailed in Supplementary Description
of Methods.
2
A.Bollig-Fischer et al.
at :: on August 21, 2014
http://bioinformatics.oxfordjournals.org/
Dow
nloaded from
2.4 Cell proliferation, 3D on-top Matrigel assays,
immunoblot analysis and real-time RT-PCR
Analysis of cell adhesion and outgrowth on BD MatrigelTM (via 3D on-
top Matrigel assays) was done as described in (Shibue and Weinberg,
2009). Immunoblot analysis was done as previously described (Bollig-
Fischer et al., 2010). Greater detail surrounding 3D on-top Matrigel
assays, immunoblot analysis and real-time PCR that used TaqManVR
pri-
mers (Life Technologies, Carlsbad, CA) are given in Supplementary
Description of Methods.
3 RESULTS
3.1 Identifying genes regulated by the HER2 oncogene
The gene expression data that we analyzed in this study came
from time-course perturbation experiments that used the SUM-
225 BC cell line (Bollig-Fischer et al., 2011). The SUM-225 cell
line is derived from a chest wall recurrence of ductal carcinoma,
and SUM-225 cell proliferation is driven by HER2 amplification
and overexpression (Forozan et al., 1999). The cells exhibit
strong growth inhibition throughout treatment with the HER2-
specific small molecule kinase inhibitor CP724 714, and growth
inhibition is reversed when CP724 714 treatment is discontinued.
Gene expression data were from Illumina platform-based micro-
array analysis of RNA collected at 16 time points over the course
of 45h, before and after HER2 signaling was blocked by treat-
ment with CP724 714. During this time, cell counts were taken to
observe that CP724714 treatment was inhibiting the prolif-
eration of the HER2-amplified/overexpressed BC cell line
(Bollig-Fischer et al., 2010).
From the �20 000 genes analyzed by microarray, 1175 showed
significant time-dependent expression-level changes in the SUM-
225 cell line treated with CP724 714 (see Section 2 for filtering
algorithm), suggesting they were regulated, directly or indirectly,
by the HER2 oncogene. We found that the time-course expres-
sion signature for these genes could be reasonably divided into
eight clusters (see Section 2 for clustering details) represented by
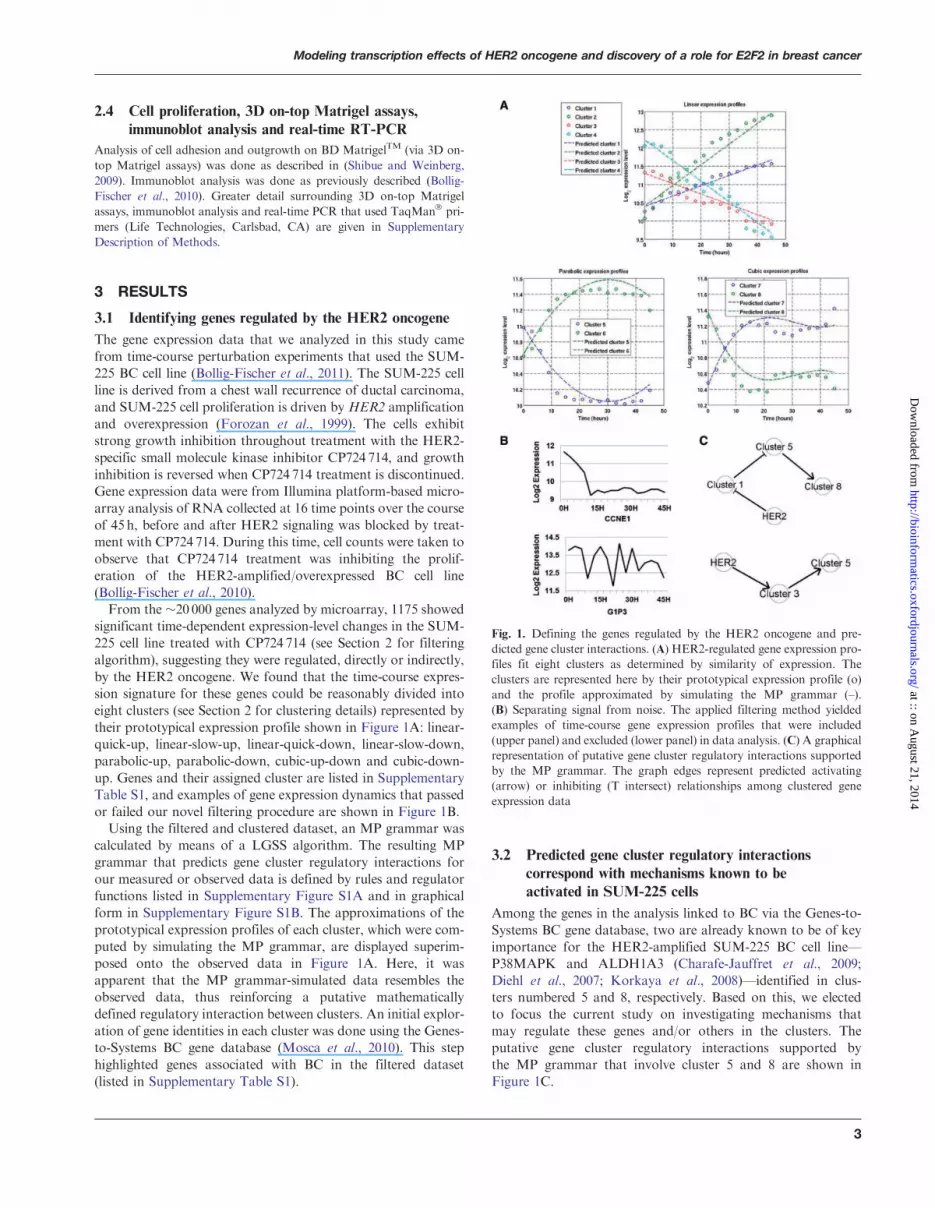
their prototypical expression profile shown in Figure 1A: linear-
quick-up, linear-slow-up, linear-quick-down, linear-slow-down,
parabolic-up, parabolic-down, cubic-up-down and cubic-down-
up. Genes and their assigned cluster are listed in Supplementary
Table S1, and examples of gene expression dynamics that passed
or failed our novel filtering procedure are shown in Figure 1B.Using the filtered and clustered dataset, an MP grammar was
calculated by means of a LGSS algorithm. The resulting MP
grammar that predicts gene cluster regulatory interactions for
our measured or observed data is defined by rules and regulator
functions listed in Supplementary Figure S1A and in graphical
form in Supplementary Figure S1B. The approximations of the
prototypical expression profiles of each cluster, which were com-
puted by simulating the MP grammar, are displayed superim-
posed onto the observed data in Figure 1A. Here, it was
apparent that the MP grammar-simulated data resembles the
observed data, thus reinforcing a putative mathematically
defined regulatory interaction between clusters. An initial explor-
ation of gene identities in each cluster was done using the Genes-
to-Systems BC gene database (Mosca et al., 2010). This step
highlighted genes associated with BC in the filtered dataset
(listed in Supplementary Table S1).
3.2 Predicted gene cluster regulatory interactions
correspond with mechanisms known to be
activated in SUM-225 cells
Among the genes in the analysis linked to BC via the Genes-to-
Systems BC gene database, two are already known to be of key
importance for the HER2-amplified SUM-225 BC cell line—
P38MAPK and ALDH1A3 (Charafe-Jauffret et al., 2009;
Diehl et al., 2007; Korkaya et al., 2008)—identified in clus-
ters numbered 5 and 8, respectively. Based on this, we elected
to focus the current study on investigating mechanisms that
may regulate these genes and/or others in the clusters. The
putative gene cluster regulatory interactions supported by
the MP grammar that involve cluster 5 and 8 are shown in
Figure 1C.
Fig. 1. Defining the genes regulated by the HER2 oncogene and pre-
dicted gene cluster interactions. (A) HER2-regulated gene expression pro-
files fit eight clusters as determined by similarity of expression. The
clusters are represented here by their prototypical expression profile (o)
and the profile approximated by simulating the MP grammar (–).
(B) Separating signal from noise. The applied filtering method yielded
examples of time-course gene expression profiles that were included
(upper panel) and excluded (lower panel) in data analysis. (C) A graphical
representation of putative gene cluster regulatory interactions supported
by the MP grammar. The graph edges represent predicted activating
(arrow) or inhibiting (T intersect) relationships among clustered gene
expression data
3
Modeling transcription effects of HER2 oncogene and discovery of a role for E2F2 in breast cancer
at :: on August 21, 2014
http://bioinformatics.oxfordjournals.org/
Dow
nloaded from
Molecular biology approaches previously demonstrated that
HER2 signaling in SUM-225 cells induces P38MAPK activity
that is important for cancer cell anchorage-independent growth
(Diehl et al., 2007). Here we report that HER2 signaling upre-
gulated expression of P38MAPK, the MAPK13 isoform specif-
ically, which was among genes assigned to cluster 5. To our
knowledge, it is not previously reported that P38MAPK gene
expression is regulated by the HER2 oncogene. Furthermore,
MP grammar modeling predicted that genes in cluster 1 would
negatively influence P38MAPK/cluster 5 gene expression
(Fig. 1C). In line with that prediction, repression of the dual
specificity phosphatase 1 gene (DUSP1, in cluster 1)—which pro-
motes p38MAPK phosphorylation, activity and expression
(Tibbles and Woodgett, 1999)—was observed in cluster 1.ALDH1A3 is a member of a family of aldehyde dehydrogen-
ase isozymes that are associated with stem cell-like characteristics
in BC cells. Although ALDH activity in SUM-225 cells was pre-
viously reported (Charafe-Jauffret et al., 2009; Korkaya et al.,
2008), our work here adds new understanding that ALDH1A3
mRNA expression is upregulated by an intracellular HER2
oncogene-directed signaling mechanism. The predicted signaling
circuit that P38MAPK upregulates ALDH1A3 gene expression
is already supported by the literature (Hanson et al., 2004; Norris
and Baldwin, 1999). The knowledge of these expression-level
targets for HER2 oncogene signaling is integrated into the MP
grammar predicted regulatory interaction model shown in
Figure 2.
3.3 Deriving a novel functional prediction from the
proposed gene cluster regulatory interactions
Moving past identifying support for what is already known for
HER2 signaling in SUM-225 cells and what is reinforcing the
robustness of the gene expression data, we next examined the
prediction that the upregulation of P38MAPK-containing cluster
(cluster 5) was also influenced by a gene or set of genes in cluster 3
as predicted by the MP grammar, depicted in Figure 1C. We
tested the promoters of genes in the P38MAPK-containing clus-
ter for transcription factor binding element enrichment. Results
from this analysis using the BioBase ExPlainTM 3.1 tool (Matys
et al., 2003), which uses the TRANSFACVR database of empirical
evidence, showed that the P38MAPK-associated cluster was sig-
nificantly enriched for genes that are regulated by E2F transcrip-
tion factor family members. Of the 196 total genes in cluster 5,
140 were identified to contain an E2F factor binding motif (listed
in Supplementary Table S1). The over-represented E2F binding
matrices identified in the promoters of this clustered gene set are
in Figure 3A. E2F matrices were over-represented and contrib-
uted 5 of the top 15 most significant binding motifs (Fig. 3A).
We examined genes in the putative upstream cluster (cluster 3)
and discovered the E2F transcription factor family member
E2F2 in that cluster. No other E2F family member was among
the total 1175 genes discovered to be regulated by HER2 signal-
ing. Members of the E2F family share binding motifs and func-
tional homology, and thus, the significance of the E2F1 binding
sequence shown in Figure 3A can also be attributed to the action
of E2F2 (Lees et al., 1993).We then investigated whether these similarly regulated clusters
of genes were functionally integrated too. Results of pathway
impact analysis, developed by us and described in (Draghici
et al., 2007), indicated that they were and identified the most
significant Kyoto Encyclopedia of Genes and Genomes
(KEGG) signaling pathways as adherens junction and cell
cycle and included pathways in cancer (Fig. 3B). The impact
analysis was used as implemented in the Pathway-Express ana-
lysis package (Khatri et al., 2005). This technique identifies the
most significantly affected canonical pathways by use of an
impact factor (IF), calculated for each identified pathway. The
IF incorporates parameters such as the normalized fold-change
of the differentially expressed genes, the statistical significance of
the set of pathway genes and the position and type of each gene
in the given pathway (see Section 2 for a complete description).
We further confirmed the significance of E2F2 specifically for
BC with a query of The Cancer Genome Atlas (TCGA) normal
breast and breast tumor-derived gene expression data using
OncomineTM (Rhodes et al., 2004). Results showed significant
E2F2 overexpression in invasive ductal breast carcinoma com-
pared with normal breast tissue (Fig. 3C, 3.8-fold increase in
cancer, P=5.05–15; 25 normal breast and 245 Invasive Ductal
Carcinoma). Also, the TCGA data query showed that E2F2
expression levels ranked among the top 4% of BC genes.
3.4 Evidence for the importance of E2F2 in
SUM-225 cells
To this point in our study, accumulating evidence suggested that
E2F2 was a key intermediary in a HER2 oncogene-driven sig-
naling circuit in SUM-225 cells. To test the significance of this,
we designed experiments to examine whether targeted knock-
down of E2F2 had a SUM-225 cancer cell-specific impact on
proliferation. Lentiviral-based shRNA vectors and methods
were used to stably knockdown E2F2 in the SUM-225 cell line
and in the non-transformed breast epithelial cell line—MCF10A.
The on-target effects of the shRNA vectors were confirmed by
real-time RT-PCR (Supplementary Fig. S2). And consistent with
a comparison of normal breast and breast tumor data from
TCGA, immunoblot analysis of E2F2 in cell lysates showed
that steady-state levels of E2F2 were lower in non-transformed
MCF10A cells than in SUM-225 cancer cells. Also, according to
immunoblot analysis, a substantial E2F2 knockdown was
achieved using targeted shRNA vectors in both cell lines
(Fig. 4A). Knockdown using either of two shRNA vectors
against E2F2 had no effect on the proliferation of SUM-225
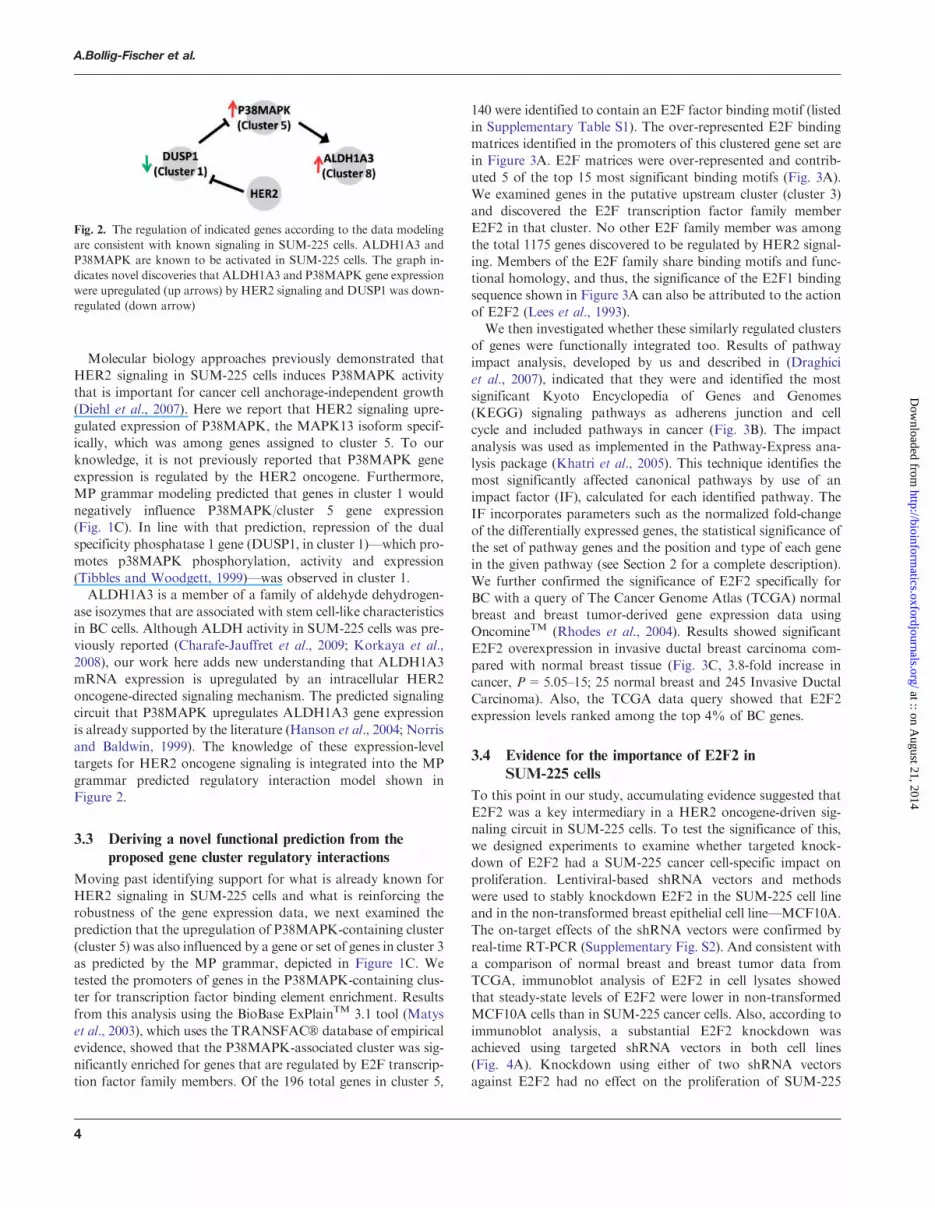
Fig. 2. The regulation of indicated genes according to the data modeling
are consistent with known signaling in SUM-225 cells. ALDH1A3 and
P38MAPK are known to be activated in SUM-225 cells. The graph in-
dicates novel discoveries that ALDH1A3 and P38MAPK gene expression
were upregulated (up arrows) by HER2 signaling and DUSP1 was down-
regulated (down arrow)
4
A.Bollig-Fischer et al.
at :: on August 21, 2014
http://bioinformatics.oxfordjournals.org/
Dow
nloaded from

or MCF10A cells growing on tissue culture plasticware
(Supplementary Fig. S3).
We then proceeded to test the impact of E2F2 knockdown on
SUM-225 cells cultured on BDMatrigelTM in a 3D on-top model
system. As such, Matrigel is used as a substrate to test cancer cell
extracellular matrix adhesion and outgrowth, and positive results
predict a metastatic phenotype (Ivanova et al., 2013; Shibue and
Weinberg, 2009). Non-transformed cells like MCF10A form
small growth-limited structures at low efficiencies on Matrigel
(Chakraborty et al., 2012; Pradeep et al., 2012). In contrast,
metastatic cancer cells like SUM-225 take shape as large-sized
expanding colonies and at relatively high efficiency when cul-
tured on Matrigel, as in Figure 4B left panel. Single cell suspen-
sions were plated equally, and results after 7 days showed that
E2F2 knockdown in SUM-225 cells reduced the numbers of ad-
herent colonies and caused a marked reduction in colony size
(Fig. 4B). The experiment using Matrigel was done twice
comprising three biological replicates of cultures independently
transduced with two unique E2F2-targeted shRNA sequence
vectors. Each time, for all replicates of each vector, the results
were the same, supporting a highly confident assessment that
HER2 oncogene-regulated E2F2 did not simply promote prolif-
eration but that E2F2 had a role in promoting the cancer
cell-specific matrix adhesion and outgrowth. The biologically
validated role of E2F2 is annotated in the updated HER2 onco-
gene signaling model in Figure 5.
3.5 Evidence for a HER2-E2F2 cancer-specific
signaling axis
To gain greater insight into the SUM-225 cancer cell-specific
effect of E2F2 knockdown, we compared the time-course gene
expression microarray data for E2F2 in non-transformed
MCF10A cells and SUM-225 BC cells, both before and after
Fig. 3. Analysis of the cluster 5 gene set and E2F2 expression. (A) Transcription factor binding site enrichment for genes in cluster 5. The results are
based on analysis using the BioBase ExPlainTM 3.1 tool and TRANSFACVR
database of empirical evidence. An enrichment of genes regulated by E2F
family of transcription factors and multiple E2F consensus binding matrices (5 of the top 15) was significant. Columns list the transcription factor
binding matrix overrepresented in the query set with respect to the background set (genes in all other clusters). Consensus sequence is the IUPAC
consensus of the transcription factor binding matrix. The Yes/No field is the ratio of the average number of putative binding sites per 1000bp for the
query set (Yes) and the average number of putative binding sites per 1000bp of the background set (No). The P-value is the significance of this
representation. False discovery rate (FDR)-adjusted P-values are listed as FDR. (B) Genes in cluster 5 are functionally enriched. Results of Pathway
Impact analysis ranking the most significantly enriched KEGG pathways for genes in cluster 5. Pathways are ranked according to highest IF with
corrected P-value in parentheses. (C) E2F2 expression levels in patient specimens. The OncomineTM data mining platform was used to query expression-
level data for normal breast (n=25) and breast tumor (n=245) tissue made available by TCGA consortium. Results showed that E2F2 is upregulated
3.8-fold in invasive ductal breast carcinoma compared with normal breast tissue (P=5.05–15)
5
Modeling transcription effects of HER2 oncogene and discovery of a role for E2F2 in breast cancer
at :: on August 21, 2014
http://bioinformatics.oxfordjournals.org/
Dow
nloaded from

treatment with HER2 inhibitor CP724714. By comparison, in
the context of SUM-225 cells where HER2 functions as a driver
oncogene, markedly high levels of E2F2 expression were
observed and were dependent on HER2 signaling (Fig. 6,
t=0). The relatively high expression levels in SUM-225 cells
were consistent with relatively high steady-state E2F2 protein
levels in lysates from SUM-225 cells compared with MCF10A
cells (Fig. 4A). Analysis of expression data from MCF10A cells
transduced to stably overexpress HER2 (referred to as
MCF10HER2 cells) showed that forced overexpression alone
did not result in the high E2F2 expression levels observed in
the cancer cells (Fig. 6). Moreover, treatment of all three cell
lines with the HER2 inhibitor produced a HER2-regulated
E2F2 time-dependent expression signature in SUM-225 cancer
cells that was distinct from an E2F2 expression signature that
was similar for MCF10A and MCF10HER2 cells (Fig. 6).
4 DISCUSSION
The success of driver oncogene-targeted therapeutic strategies
can be attributed to the fact that oncogene-directed signaling
promotes the many phenotypes that define the patho-biology
of cancer cells, termed the hallmarks of cancer that include
among others unrestricted growth, immune system evasion,
metabolic transformation, cancer cell tumorigenicity and the
various stages of metastases (Hanahan and Weinberg, 2011).
The challenge remains to understand the specifics for onco-
gene-directed signaling processes that contribute to each of
these phenotypes.
In earlier work using engineered cell lines to identify genes
whose expression is regulated by the driver HER2 oncogene
versus the proto-oncogene, we explored gene expression dy-
namics using a Bayesian clustering method (Bollig-Fischer
et al., 2010). This previous analysis revealed overlapping and
unique clusters of genes for each condition, suggesting that
driver oncogenes engage unique regulatory mechanisms that
cause distinguishing gene expression dynamics and signaling cir-
cuits in cancer cells. The work presented here represents consid-
erably advanced efforts to discover unknown regulatory paths
in transcription programs. The use of cell lines, where the
Fig. 4. Targeted E2F2 gene knockdown effects on SUM-225 cancer cell
growth. (A) Immunoblot analysis of E2F2 protein levels in cell lines
transduced with two unique E2F2-targeted shRNA expressing vectors
with respect to control levels (lanes 1 and 4). (B) The effect of E2F2
knockdown in SUM-225 cells cultured on Matrigel. E2F2 knockdown
caused a marked reduction in viable colony numbers and size (4� mag-
nification). The figure is representative of two independent experiments,
in triplicate. Viable cells were stained dark purple with MTT (3-
(4,5-Dimethylthiazol-2-yl)-2,5-diphenyltetrazolium bromide) reagent.
(C) Quantitation of the effect of E2F2 knockdown in SUM-225 cells
cultured on Matrigel. The graph shows the total number of viable
transduced colonies per well of a 96-well plate. Results are the mean of
three biological replicates and representative of replicated experiments
(bars, SD)
Fig. 5. Gene-annotated HER2-oncogene regulated signaling circuits pre-
dicted by the proposed network model. The indicated genes and their role
in HER2 oncogene signaling are supported by previously published data
(blue), or as in the case of E2F2, they are supported by computational
and in vivo cell biology experiments presented in this study (orange).
Black arrows indicate that according to our data, the gene expression
was upregulated (up arrow) or downregulated (down arrow) by HER2
signaling
Fig. 6. Cancer cell-specific HER2 oncogene regulation of E2F2 expres-
sion. Time-course E2F2 expression data before and after treatment with
the HER2-targeted inhibitor CP724714. Time-dependent (hours, H)
RNA levels from BC-derived cell line SUM-225 and non-transformed
MCF10A and MCF10A overexpressing HER2 (MCF10HER2) cell
lines demonstrate existence of a unique HER2-dependent expression pro-
file in cancer cells
6
A.Bollig-Fischer et al.
at :: on August 21, 2014
http://bioinformatics.oxfordjournals.org/
Dow
nloaded from

functional status of HER2 is known, is necessary to distinguish
and model gene expression features that were regulated, directly
or indirectly, by HER2 driver oncogene function. Time-course
perturbation studies were used because rigorous statistical ana-
lyses of gene expression changes over time can be applied to filter
noise (Ideker et al., 2011; Venet et al., 2011); also, algorithms that
reverse engineer gene networks from dynamic gene expression
data outperform classic clustering algorithms (Bansal et al.,
2007). Polynomial models were used for the purpose of curve
fitting analysis and were also used in the calculation of the
eight clusters, all necessary to reduce data complexity. This meth-
odology might be improved by using more complex clustering
algorithms based on machine learning techniques such as hidden
Markov models or Support Vector Machines, which hold poten-
tial to distinguish more refined clusters.Nevertheless, in the present iteration, our approach using
simple polynomial models to investigate HER2 oncogene signal-
ing networks in SUM-225 BC cells resulted in a model with
features that were concordant with both previous reported re-
sults and data from patient tumors. The integration of various
analytical tools such as Impact Factor analysis, BioBase/Explain
and Oncomine, with the results of MP grammar modeling sup-
ported specific predicted regulatory circuits and pointed to novel
insights surrounding oncogene regulation of P38MAPK,
ALDH1A3 and E2F2 genes in the HER2-amplified BC-derived
cell line. Definitive contributions of this study are that HER2
driver oncogene signaling upregulated the expression of E2F2,
and that E2F2 potentiated the HER2 oncogene signal for main-
taining a transformed phenotype.
The overwhelming focus of existing literature surrounding the
E2F family of transcription factors has characterized their func-
tion as master regulators of cell proliferation, but Chen and his
colleagues are correct to point out that knowledge is lacking as to
the biological processes that they collectively or individually
regulate in cancer (Chen et al., 2009). Among the limited litera-
ture specifically on E2F2 and its aberrant role in BC, work by
Miller et al. showed that an E2F2 activation signature correl-
ates with resistance to anti-estrogen treatment for estrogen re-
ceptor alpha (ER�)-positive BC (Miller et al., 2011). The study
herein now indicates the importance of E2F2 in a novel HER2
oncogene-directed signaling pathway where HER2 oncogene-
regulated E2F2 expression impacts cell-matrix adhesion func-
tion, with potential consequences for metastatic colonization
(Shibue and Weinberg, 2009).Another consideration arising from our study surrounds the
nature of oncogene activation and the status of HER2 as a driver
oncogene. Simply overexpressing the HER2 oncogene in the
non-transformed MCF10A cell did not cause the dominant regu-
latory effect for HER2 action on E2F2 expression as seen in
SUM-225 cells. These observations support the concept that
the status and function of a driver oncogene is not simply the re-
sult of signal amplification but that additional context-dependent
variables are involved to evoke aberrant pathway signaling.
Funding: United States Department of Defense (W81XWH-10-2-
0068) and National Institutes of Health (NIH P30CA022453)
awarded to the Karmanos Cancer Institute at Wayne State
University. Additional funding support was provided by the
NIH (RO1 DK089167 and STTR R42GM087013 to S.D.) andthe National Science Foundation (DBI-0965741 to S.D.).
Conflicts of Interest: none declared.
REFERENCES
Bansal,M. et al. (2007) How to infer gene networks from expression profiles. Mol.
Syst. Biol., 3, 78.
Bollig-Fischer,A. et al. (2010) HER-2 signaling, acquisition of growth factor inde-
pendence, and regulation of biological networks associated with cell transform-
ation. Cancer Res., 70, 7862–7873.
Bollig-Fischer,A. et al. (2011) Oncogene activation induces metabolic transform-
ation resulting in insulin-independence in human breast cancer cells. PLoS One,
6, e17959.
Chakraborty,G. et al. (2012) Semaphorin 3A suppresses tumor growth and metas-
tasis in mice melanoma model. PLoS One, 7, e33633.
Charafe-Jauffret,E. et al. (2009) Breast cancer cell lines contain functional cancer
stem cells with metastatic capacity and a distinct molecular signature. Cancer
Res., 69, 1302–1313.
Chen,H.Z. et al. (2009) Emerging roles of E2Fs in cancer: an exit from cell cycle
control. Nat. Rev. Cancer, 9, 785–797.
Diehl,K.M. et al. (2007) p38MAPK-activated AKT in HER-2 overexpressing
human breast cancer cells acts as an EGF-independent survival signal.
J. Surg. Res., 142, 162–169.
Draghici,S. et al. (2007) A systems biology approach for pathway level analysis.
Genome Res., 17, 1537–1545.
Eisen,M.B. et al. (1998) Cluster analysis and display of genome-wide expression
patterns. Proc. Natl Acad. Sci. USA, 95, 14863–14868.
Forozan,F. et al. (1999) Molecular cytogenetic analysis of 11 new breast cancer cell
lines. Br. J. Cancer, 81, 1328–1334.
Hanahan,D. and Weinberg,R.A. (2011) Hallmarks of cancer: the next generation.
Cell, 144, 646–674.
Hanson,J.L. et al. (2004) The nuclear factor kappaB subunits RelA/p65 and c-Rel
potentiate but are not required for Ras-induced cellular transformation. Cancer
Res., 64, 7248–7255.
Ideker,T. et al. (2011) Boosting signal-to-noise in complex biology: prior knowledge
is power. Cell, 144, 860–863.
Ivanova,I.A. et al. (2013) FER kinase promotes breast cancer metastasis by regulat-
ing �6- and �1-integrin-dependent cell adhesion and anoikis resistance.
Oncogene, 32, 5582–5592.
Jordan,V.C. (2008) Tamoxifen: catalyst for the change to targeted therapy. Eur. J.
Cancer, 44, 30–38.
Jornsten,R. et al. (2011) Network modeling of the transcriptional effects of copy
number aberrations in glioblastoma. Mol. Syst. Biol., 7, 486–503.
Khatri,P. et al. (2005) Recent additions and improvements to the Onto-Tools.
Nucleic Acids Res., 33, W762–W765.
Korkaya,H. et al. (2008) HER2 regulates the mammary stem/progenitor cell popu-
lation driving tumorigenesis and invasion. Oncogene, 27, 6120–6130.
Kuperwasser,C. et al. (2005) A mouse model of human breast cancer metastasis to
human bone. Cancer Res., 65, 6130–6138.
Lees,J.A. et al. (1993) The retinoblastoma protein binds to a family of E2F tran-
scription factors. Mol. Cell. Biol., 13, 7813–7825.
Lockhart,D.J. and Winzeler,E.A. (2000) Genomics, gene expression and DNA
arrays. Nature, 405, 827–836.
Luo,J. et al. (2009) Principles of cancer therapy: oncogene and non-oncogene ad-
diction. Cell, 136, 823–837.
Manca,V. (2008) The metabolic algorithm for P systems: principles and applica-
tions. Theor. Comput. Sci., 404, 142–155.
Manca,V. (2013) Infobiotics: Information in Biotic Systems. Vol. 3, Springer, Berlin
Heidelberg.
Manca,V. and Marchetti,L. (2011) Log-gain stoichiometric stepwise regression for
MP systems. Int. J. Found. Comput. Sci., 22, 97–106.
Manca,V. and Marchetti,L. (2012) Solving dynamical inverse problems by means of
metabolic P systems. Biosystems, 109, 78–86.
Marchetti,L. and Manca,V. (2012) A methodology based on MP theory for gene
expression analysis. Lect. Notes Comput. Sci., 7184, 300–313.
Marella,N.V. et al. (2009) Cytogenetic and cDNA microarray expression analysis of
MCF10 human breast cancer progression cell lines. Cancer Res., 69, 5946–5953.
Matys,V. et al. (2003) TRANSFAC: transcriptional regulation, from patterns to
profiles. Nucleic Acids Res., 31, 374–378.
7
Modeling transcription effects of HER2 oncogene and discovery of a role for E2F2 in breast cancer
at :: on August 21, 2014
http://bioinformatics.oxfordjournals.org/
Dow
nloaded from

Miller,F.R. et al. (1993) Xenograft model of progressive human proliferative breast
disease. J. Natl Cancer. Inst., 85, 1725–1732.
Miller,T.W. et al. (2011) ERalpha-dependent E2F transcription can mediate resist-
ance to estrogen deprivation in human breast cancer. Cancer Discov., 1,
338–351.
Mosca,E. et al. (2010) A multilevel data integration resource for breast cancer study.
BMC Syst. Biol., 4, 76.
Norris,J.L. and Baldwin,A.S. Jr. (1999) Oncogenic Ras enhances NF-kappaB tran-
scriptional activity through Raf-dependent and Raf-independent mitogen-acti-
vated protein kinase signaling pathways. J. Biol. Chem., 274, 13841–13846.
Pradeep,C.R. et al. (2012) Modeling ductal carcinoma in situ: a HER2-Notch3
collaboration enables luminal filling. Oncogene, 31, 907–917.
Ramaswamy,S. et al. (2001) Multiclass cancer diagnosis using tumor gene expres-
sion signatures. Proc. Natl Acad. Sci. USA, 98, 15149–15154.
Ramoni,M.F. et al. (2002) Cluster analysis of gene expression dynamics. Proc. Natl
Acad. Sci. USA, 99, 9121–9126.
Rhodes,D.R. et al. (2004) ONCOMINE: a cancer microarray database and inte-
grated data-mining platform. Neoplasia, 6, 1–6.
Saeki,Y. et al. (2009) Ligand-specific sequential regulation of transcription factors
for differentiation of MCF-7 cells. BMC Genomics, 10, 545–561.
Sharma,S.V. and Settleman,J. (2007) Oncogene addiction: setting the stage for mo-
lecularly targeted cancer therapy. Genes Dev., 21, 3214–3231.
Shibue,T. and Weinberg,R.A. (2009) Integrin beta1-focal adhesion kinase signaling
directs the proliferation of metastatic cancer cells disseminated in the lungs.
Proc. Natl Acad. Sci. USA, 106, 10290–10295.
Tibbles,L.A. and Woodgett,J.R. (1999) The stress-activated protein kinase path-
ways. Cell. Mol. Life Sci., 55, 1230–1254.
Venet,D. et al. (2011) Most random gene expression signatures are sig-
nificantly associated with breast cancer outcome. PLoS Comput. Biol., 7,
e1002240.
Wagle,N. et al. (2011) Dissecting Therapeutic Resistance to RAF Inhibition in
Melanoma by Tumor Genomic Profiling. J. Clin. Oncol., 29, 3085–3896.
8
A.Bollig-Fischer et al.
at :: on August 21, 2014
http://bioinformatics.oxfordjournals.org/
Dow
nloaded from