Embed Size (px)
Citation preview

1
Journal of Management – June 2006, vol. 32, no. 3, 360-380 doi: 10.1177/0149206305280789
---------------
Measuring the Relationship between
Managerial Competencies and Performance
ALEC R. LEVENSON – CONTACT AUTHOR Center for Effective Organizations
Marshall School of Business University of Southern California
3670 Trousdale Parkway, BRI-204 Los Angeles, CA 90089-0806
213-821-1095 213-740-4354 fax
WIM A. VAN DER STEDE Leventhal School of Accounting
Marshall School of Business University of Southern California
SUSAN G. COHEN
Center for Effective Organizations Marshall School of Business
University of Southern California
July 25, 2005 First version presented at the 2003 Academy of Management meetings. We thank the Editor, three anonymous referees, John Boudreau, David Finegold, Cristina Gibson, Ed Lawler, Dhinu Srinivasan, and Jim O’Toole for very helpful comments, and Nora Osganian, Sung-Han (Sam) Lee, Beth Neilson, and Alice Mark for outstanding research assistance.
2
Measuring the Relationship between
Managerial Competencies and Performance
Abstract
The use of competency systems to evaluate, reward, and promote managers has
become commonplace in many organizations in recent years. Yet despite their
popularity, there is little evidence that competency systems increase managerial
effectiveness. In this study, we estimate the relationship between managerial
competencies and performance at both the individual and organizational unit
levels. We find evidence that competencies are positively related to individual-
level performance and that individual managerial performance may be increased
by mentoring on a competency system. The evidence of a link between
competencies and unit-level performance is weaker.
Key words: competency; performance; management; manager effectiveness;
rewards.
3
Organizations’ use of competency systems to evaluate, reward, and promote employees is fairly
widespread (Briscoe & Hall, 1999; Lawler & McDermott, 2003). In essence, competency is an
employee’s ability to perform the skills required for a specific job (Spencer & Spencer, 1993).
Citing research that dates back half a century (McClelland, Baldwin, Bronfenbrenner &
Strodtbeck, 1958), competency advocates have argued that assessments of employees’
competencies provide an effective method for predicting job performance (McClelland, 1973;
Spencer & Spencer, 1993). Whether this argument can be extended to managerial jobs is an open
question, even though competency systems have been increasingly used for selecting, rewarding,
and promoting managers (Boyatzis, 1982; Goleman, Boyatzis & McKee, 2002; Zenger &
Folkman, 2002). Furthermore, even if competencies are related to job performance for
individuals, it is unclear if the use of a competency system can improve organizational
performance (Hollenbeck & McCall, 1997). In this paper we examine the relationship between
managerial competencies and performance at both the individual and unit levels.
Empirical evidence about the effectiveness of managerial competency systems is limited.
There is some evidence that competency assessments predict individual managerial success as
measured by 360-degree or supervisor ratings (Goldstein, Yusko & Nicolopoulos, 2001;
Spreitzer, McCall & Mahoney, 1997), or by career advancement (Bray, Campbell & Grant,
1974; Dulewicz & Herbert, 1996). Yet individual performance cannot necessarily be aggregated
to unit or organizational performance (DeNisi, 2000; Schneider, Smith & Sipe, 2000). Thus, the
aforementioned evidence does not demonstrate that organizations achieve better performance
through the use of competency systems as an evaluation tool.
The one exception is Russell (2001), who showed that competencies used to screen
general manager candidates in one organization were positively associated with subsequent unit

4
performance after the managers were promoted to general manager. This evidence is noteworthy
because, to our knowledge, it provides the only test of a relationship between managerial
competencies and unit-level performance. However, Russell (2001) examined general manager
competencies, whereas the relationship between competencies for a broader group of managers
(first-line and middle managers) and unit performance has remained untested.
In this study, we examine the relationship between competencies and managerial and unit
performance. Specifically, “competencies” in this study refer to the observed competency level
(beginning, intermediate, advanced) that managers occupy as a result of a competency evaluation
system. Therefore, we refer to the observed competency level as the “competency measure.” In
contrast to Russell (2001), we focus on competencies of first-line and middle managers. In
Russell’s case, because there is only one general manager in a unit, testing the relationship
between competencies and unit performance requires only a single level of analysis. For first-line
and middle managers, in contrast, we consider performance at both the individual level and unit
level, the latter requiring a consideration of the aggregate competencies represented by the group
of first-line and middle managers in the unit. We also consider how competencies compare to
economic human capital measures as predictors of performance at the individual and unit levels.
Moreover, we examine whether factors related to competency system implementation
(understanding, fairness, and mentoring) can help explain individual performance.
Theory
A primary goal of using competency assessments to evaluate individuals is to improve
job performance (Spencer & Spencer, 1993). Competencies are used for a variety of purposes,
including selection, performance management, compensation, and succession planning (Spencer

5
& Spencer, 1993). In the case of performance management, the use of competency assessments
appears to be fairly widespread (Lawler & McDermott, 2003).
The logic behind how competencies are identified and implemented in practice appears
straightforward: A single set of competencies for a job or family of jobs (e.g., all managerial jobs
at a certain level) is identified by examining the factors that differentiate the job performance of
those who are more successful vis-à-vis those who are less successful, and then used to identify,
reward, and promote others or future candidates (Briscoe & Hall, 1999; Spencer & Spencer,
1993). Yet there are concerns with applying this logic, particularly for managers. One concern is
that there are different routes to managerial effectiveness, so managerial evaluation models based
on a single set of competencies may be inadequate (Drucker, 1966; Hollenbeck & McCall, 1997,
2003; McKenna, 2002). A second concern is that most sets of competencies are static, and thus,
susceptible to changing leadership requirements (Hollenbeck & McCall, 1997). A third concern
is that competency identification efforts often produce similar competencies across organizations
(Hollenbeck & McCall, 1997; Zingheim, Ledford & Schuster, 1996), thus, limiting competency
systems’ potential to be a source of competitive advantage (Lawler, 2000).
Despite the first two concerns, there is still limited empirical evidence that competencies
are positively related to individual performance (Goldstein et al., 2001; Russell, 2001; Spreitzer
et al., 1997). Although the evidence is not overwhelming, there remains good reason to believe
that higher competencies will be related to higher individual performance. Thus, we expect:
Hypothesis 1: Competency measures are positively related to individual managerial
performance.
Even if competencies have the expected performance effects, the next question we
consider is whether they are better than, or just substitutes for, traditional human capital variables

6
in explaining performance. Human capital theory proposes that both formal education and
accumulated on-the-job experience can predict differences in labor market outcomes between
employees because they either measure directly, or are proxies for, differences between people in
the knowledge, skills, and abilities (KSAs) needed to succeed on the job (Becker, 1964; Mincer,
1974). Prior studies in labor economics (Becker, 1964; Mincer, 1974; Murphy & Welch, 1990)
and the careers literature (Judge, Cable, Boudreau & Bretz, 1995; Stroh, Brett & Reilly, 1992;
Tharenou, Latimer & Conroy, 1994) have demonstrated positive effects of these traditional
human capital variables on various measures of success that presumably derive from high job
performance, such as higher compensation and promotion.
The prevailing view of competencies suggests, however, that competency assessments
should capture more than just KSAs, such as personality traits of effective managers (Lawler,
2000; Spencer & Spencer, 1993). If that is the case, competency assessments should be able to
differentiate managerial performance above and beyond the standard human capital measures.
Thus, we test:
Hypothesis 2: Competency measures have stronger relationships with individual
managerial performance than traditional human capital measures have.
An additional consideration is the organizational context in which competencies are
evaluated and rewarded. Competencies in and of themselves are not performance (Ledford,
1995). Rather, competencies measure a means through which performance is achieved. For this
reason, organizations often explicitly incorporate competencies into performance management
and reward systems (Lawler & McDermott, 2003; Zingheim et al., 1996). We use the term
competency system to refer to the organizational mechanisms by which competencies are
evaluated and rewarded. It introduces the issue of whether the ways in which managers interact

7
with the system, and how the system is implemented, have an impact on performance. We
consider three elements: (a) the individual’s understanding of how the competency system
works; (b) the perceived fairness of the competency system; and (c) mentoring on how to
succeed in the competency system.
Given the complexity and subjectivity that often are involved in competency assessments,
confusion may arise regarding the link between competency demonstration and rewards. In the
context of performance appraisals, it has been shown that there is a relationship between the
degree of understanding of the system and attitudes about the system (Mount, 1983; St-Onge,
2000; Williams & Levy, 1992). Moreover, there is evidence from the role ambiguity literature
that understanding about performance criteria has a positive effect on job performance (Breaugh
& Colihan, 1994). Extending these arguments to competency systems, we therefore expect that:
Hypothesis 3: Competency system understanding is positively related to individual
performance.
A second issue is the perceived fairness of the competency system. The importance of
perceived fairness has been established in a number of different settings, including perceptions of
compensation (Scarpello & Jones, 1996; St-Onge, 2000) and survivors’ response to downsizing
(Mishra & Spreitzer, 1998). In particular, there is a direct link between perceived fairness of
rewards and job performance (Adams, 1963; Mowday, 1979; Janssen, 2001).
The early literature on fairness of performance management systems (Landy, Barnes &
Murphy, 1978; Lawler, 1967) did not distinguish different types of fairness (“justice”), though
more recent research has differentiated between distributive and procedural justice (Cohen-
Charash & Spector, 2001; Mishra & Spreitzer, 1998). Although there is good reason to believe
that procedural justice impacts attitudes about performance appraisal (Folger & Konovsky,

8
1989), we focus on distributive justice, which has been shown to be more closely related to
personal outcomes – including performance – than procedural justice is (Cohen-Charash &
Spector, 2001; McFarlin & Sweeney, 1992). We thus emphasize performance management
outcomes (distributive justice) rather than performance evaluation processes (procedural justice).
Considering this, and extending findings in prior contexts, we expect that:
Hypothesis 4: Competency system fairness is positively related to individual
performance.
Third, given the complexity of linking competencies to rewards, there are opportunities
for learning about the competency system to improve performance. Interactions with supervisors
regarding the details of performance management systems, and the learning that is implied by
such interaction (a form of mentoring), is a frequent theme in the literature (Dipboye & de
Pontbriand, 1981; Mount, 1984; Pooyan & Eberhardt, 1989). Supervisors’ multifaceted roles in
evaluating competencies and performance, and in determining rewards, mean they can provide
an important source of mentoring (Lankau & Scandura, 2002). Mentoring often leads to greater
rewards and career success (Richard, Taylor, Barnett & Nesbit, 2002), which are correlates of
performance. Moreover, frequency of feedback and development of action plans (both taking
place within the supervisor-supervisee relationship) are positively related to performance
appraisal satisfaction (Dipboye & de Pontbriand, 1981; Dobbins, Cardy & Platz-Vieno, 1990;
Landy et al., 1978; Pooyan & Eberhardt, 1989). Finally, supervisors can also model the desired
competency behaviors enabling vicarious learning of the desired skills and behaviors (Bandura,
1986; Gioia & Manz, 1985). Thus, we expect:
Hypothesis 5: Mentoring on a competency system is positively related to individual
performance.
9
A concern with using competency assessments to improve performance is that
differences in performance at the individual level do not necessarily translate into differences in
unit or organizational performance (DeNisi, 2000; Schneider et al., 2000). If competencies can
differentiate performance among managers (Hypothesis 1), then it is reasonable to expect that
units with more high-competency managers outperform those with fewer high-competency
managers. This is an additive performance argument (DeNisi, 2000).
Countering this is the possibility that the managerial actions and behaviors necessary for
improved unit-level performance are not just additive but interdependent, which may not be
adequately captured by individual competency assessments. However, managerial competency
systems that fail to capture the interdependent nature of managerial jobs (such as the leadership
and teamwork dimensions) probably could be viewed as missing their mark. Thus, aside from the
purely additive argument, it is reasonable to expect that an adequate managerial competency
system should contribute to organizational performance, not just individual performance, simply
because of the organizational dimensions of managerial jobs that it should be expected to
capture. Although there is little evidence to support this conjecture beyond Russell (2001), the
theory underlying the design and use of a valid managerial competency system suggests it should
have positive organizational consequences. Thus, we test:
Hypothesis 6: Aggregated managerial competencies are positively related to unit
performance.
Extending the additive performance argument (DeNisi, 2000) to human capital, unit-level
differences in stocks of managerial human capital should also differentiate unit-level
performance. Yet traditional human capital measures are generic, taking on the same form
regardless of the organization (i.e., measures of education and general labor market experience).

10
Competencies, in contrast, can be designed to consider organization-specific aspects of
managerial jobs beyond just education and experience (e.g., people skills). Therefore, at the unit
level, greater amounts of organization-specific competencies should be more closely related to
unit performance than greater amounts of traditional human capital. Thus, we expect:
Hypothesis 7: Aggregated managerial competencies have stronger relationships with unit
performance than aggregated human capital measures have.
Method
Sample
The data come from a major division of a Fortune 500 consumer products company. The
division is organized into 52 geographic units (sites) that are distributed throughout the United
States on the basis of population concentration. The division markets the same line of products to
all areas of the country, with very minor variations in product design and mix that reflect local
consumer preferences. The economies of scale in centralized production are small relative to the
distribution costs, so the types of products manufactured and distributed are close to uniform
across the different sites. Every site is a distribution center. Not all sites are manufacturing
centers. For the most part, manufacturing is located in the medium- and large-size sites.
Differences in the volume of products handled by each site also translate into differences across
sites in the number of first-line and middle managers.
Individual-Level Data
A web-based survey of 1,279 first-line and middle managers was conducted in 2002 to
assess managers’ perceptions of the competency system. Valid surveys were received from 807
respondents, for an effective response rate of 63 percent. The survey data were then matched
with individual archival data on competency and performance ratings. Excluding observations

11
with missing values for the variables included in the multivariate analyses reduces the sample
size to between 679 and 699, depending on the analysis.
Unit-Level Data
Each site is rated using three measures: (a) cost reduction, (b) productivity, and (c) injury
rates. These measures combine to produce an overall site score. We use the overall score for the
analysis. Data were available for 51 of the sites; one site was not used because of missing data.
The company benchmarks site processes to identify best practices and set targets for each
component of the site score considering the site’s history, product mix, technology, and other
performance factors beyond the direct control of site management. Thus, sites expected to do
better in terms of cost, productivity, and/or injury metrics do not start with an automatic
advantage in the site performance ratings. Rather, each site has its own set of stretch goals. Thus,
the site performance scores represent a relative ranking of performance within the management
team’s control using objective measures of performance. The main advantage for us is that the
site scores account for many determinants of site-level performance (e.g., differences in
technology or prior performance) that we would otherwise have to control for in the analysis.
The Competency System
The competency system at the division was introduced ten years prior to the study to
promote more inclusive management through enhanced teamwork and knowledge sharing. Prior
to the introduction of the competency system, promotions were primarily achieved via job- and
site-hopping. This encouraged job changes for the sake of increasing pay, hindering the creation
of a cohesive team of managers at a site. The division introduced the competency system and a
broadband pay system to enable rewarding managerial development and advancement without
unnecessary job changes. The competency system is used for first-line and middle managers at

12
each site; there is an additional small top management team at each site that is not part of the
competency system and whose salaries are determined outside the broadband.
The competency system has three levels. Advancement is rewarded by a salary increase.
Managers at higher competency levels also are eligible to receive larger annual target bonuses. A
manager has both a competency level (beginning, intermediate, or advanced) and a job title such
as production manager, quality manager, or warehouse manager. Managers can change roles (job
titles) while maintaining the same competency level and compensation.
Competency reviews and performance reviews are separate; both take place annually.
Performance ratings fluctuate from year-to-year, as would be expected. Competency ratings, in
contrast, can only go up, not down: once managers are promoted from the beginning level of the
competency system they are expected to continually demonstrate higher level competencies.
New managers are given a grace period of up to two years to demonstrate the competency
system’s basic skill levels. Failure to demonstrate competency mastery at the beginning level, as
well as failure to continually demonstrate higher competencies at the intermediate and advanced
levels, is treated as a performance management issue that can lead to termination.
The nature of advancement in the competency system means that changes in competency
level occur with much lower frequency than changes in performance rating: it typically takes 3-5
years for promotion from the beginning to intermediate level, and another 4-6 years for
promotion from the intermediate to advanced level. Promotion to the intermediate competency
level is expected as part of the manager’s ongoing development, though it is not guaranteed and
there is no set timeline. Promotion to the advanced level is encouraged but not expected.
Higher competency levels in this system represent two factors, notably, managers’ ability
to: (a) manage the people and processes under their direct control, and (b) influence the people

13
and processes under their peers’ control. The latter was designed to encourage a site-level focus
on teamwork among the managers below the site leadership team.
Research Design
We conduct the empirical analysis at two levels and in different stages. We use the
individual- and unit-level data to analyze the relationship between competency level and
performance, and to compare competencies to human capital variables in their strength of
association with performance. We also examine the effects on individual performance of the
three variables that measure the managers’ interactions with the competency system
(understanding, fairness, and mentoring). Thus, at the individual level, we use regression
analysis to estimate the following model:
INDIVIDUAL PERFORMANCE RATING = f(competency level; human capital variables;
understanding of competency system; perceived fairness of competency system;
mentoring on the competency system).
For the unit-level tests, we aggregate competency level and human capital variables to
test whether competencies at the individual level contribute to unit-level performance. This is
equivalent to testing whether a larger number of high-competency managers at a site is related to
better site-level performance. Given the variation in site size and number of managers across
sites, we use the percentage of first-line and middle managers at the site at each of the two
highest competency levels (intermediate and advanced). For the human capital variables we use
average values calculated across all managers at the site.
A feature of the way the competency system is implemented provides justification for our
empirical specification. Managers do not have to be at the advanced competency level to be
promoted out of the broadband. “Superstar” managers often are promoted directly from the

14
intermediate level to more senior leadership positions, bypassing the advanced level of the
broadband. Moreover, the pool of advanced managers contains a proportion of managers who
will not advance further in the organization. Consequently, the net impact on site performance
from substituting an advanced versus intermediate-level manager for a beginning-level manager
is an empirical question. For this reason, we estimate the site-level model with separate effects
for the proportions of managers at the intermediate and advanced levels. Because all sites are
largely identical except for their size, we also control for site size in the unit-level analysis. Thus,
at the unit level we use regression analysis to estimate the following model:
UNIT PERFORMANCE = f(aggregated competency measures; aggregated human capital
measures; site size).
Measures
Managerial competency level. The competency system’s three levels are beginning,
intermediate, and advanced. There are three categories of competency, and within each category
there are multiple dimensions: (a) technical/functional skills (e.g., technical expertise, func-
tional/business expertise, developing technical and business expertise in others); (b) basic
management skills (e.g., addressing job performance among direct reports, addressing customer
needs, designing strategic plans); and (c) leadership skills (e.g., accomplishing objectives
through influence, networking with peers, mentoring and developing others). There are separate
guidelines for beginning, intermediate, and advanced for each dimension within each category.
For example, within the leadership category, the beginning level includes “communicates point
of view to win support of others;” the intermediate level includes “addresses groups and/or cross-
functional groups effectively to communicate information and win the support of others;” and
the advanced level includes “influences individuals at all levels to affect the direction of the

15
organization.” These guidelines reflect that progression from the beginning to intermediate to
advanced levels implies that the managers’ actions have impacts further beyond their span of
immediate control, and throughout the entire site.
Each dimension in the competency system is scored as either “demonstrates” or “does not
demonstrate.” Promotion to the intermediate level requires consistent demonstration of at least
75 percent of the competency dimensions in each intermediate-level category (i.e., having 75
percent of the dimensions rated as “demonstrates”). The same holds for promotion to the
advanced level. This homogeneity of competency mastery means that overall competency level
(beginning, intermediate, advanced) is close to a sufficient statistic for competency mastery
across the variety of individual dimensions within each category. As discussed above, we
measure attainment of competency level by two indicator (0/1) variables: one for attainment of
the intermediate level, and one for attainment of the advanced level (see Table 2 for the means).
The competency data we use in the analysis are archival data, and are complete for each
site. This implies that the measured percentage of managers at the intermediate and advanced
competency levels in the site-level analysis is not affected by potential survey response biases.
Individual performance rating. Designed separately from the competency ratings,
individual performance ratings address the managers’ ability to meet performance objectives and
are used to determine annual bonuses and merit raises. Performance includes both business (e.g.,
manufacturing line uptime, defects, shipment accuracy) and people results (injury rates and other
objective personnel metrics), both rated from 1 (worst) to 5 (best). The business results are then
given double weight (in essence, multiplied by two) and summed with the people results. Thus,
performance ratings have a theoretical range of 3-15. (For those managers who returned the
16
survey, the range is 3-14, with a mean of 9.1; see Table 2.) The performance ratings come from
archival data, and were matched to individual survey responses for the individual-level analysis.
Site performance rating. The site performance score can range between 0 and 200. For
the year we analyze (2002), the range was 46 to 160. The scores come from archival data and are
a weighted average of the cost reduction, productivity, and injury goals (see discussion above).
Human capital variables. The standard human capital variables are education and
experience (Becker, 1964). We calculate years of education based on the highest level schooling
reported in the survey. We measure experience as total imputed labor market experience, equal
to age minus years of education minus six, a standard approach in the labor economics literature
(Murphy & Welch, 1990). We derive the aggregated human capital variables for the site-level
analyses by averaging the survey responses from each site.
Understanding of the competency system. We measure understanding by a three-item
scale consisting of the items listed in Table 1. The scale items range from strongly disagree (1) to
strongly agree (7). The scale has an alpha of .81, and is a variant of the scale used by Ledford &
Bergel (1991) and Ledford, Tyler & Dixey (1991).
Fairness of the competency system. We measure fairness with a three-item scale (see
Table 1), using the same anchors as the understanding scale. The scale’s alpha is .85.
Mentoring by supervisor on the competency system. The four-item mentoring scale
(Table 1) also uses the same anchors as the understanding scale, and has an alpha of .91.
Because these scales are new or adapted versions of existing scales, we use both
exploratory and confirmatory factor analysis to analyze their validity, both reported in Table 1.
The exploratory factor analysis reveals that each scale has an eigenvalue greater than 1, with
strong within-scale factor loadings and small cross-scale factor loadings. The total variance

17
explained by the three scales is 67.5 percent. The confirmatory factor analysis yields factor
loadings and model-fit statistics that support this factor structure.
— Insert Table 1 about here —
Site size. We measure site size by the total number of first-line and middle managers.
There is little variation in the spans of control of first-line and middle managers throughout the
division (e.g., a first-line manager typically is responsible for one shift of employees working on
one production line in a plant, or one shift of employees in one part of a warehouse). Thus, the
total number of managers below the site leadership team is a good proxy for site size.
Results
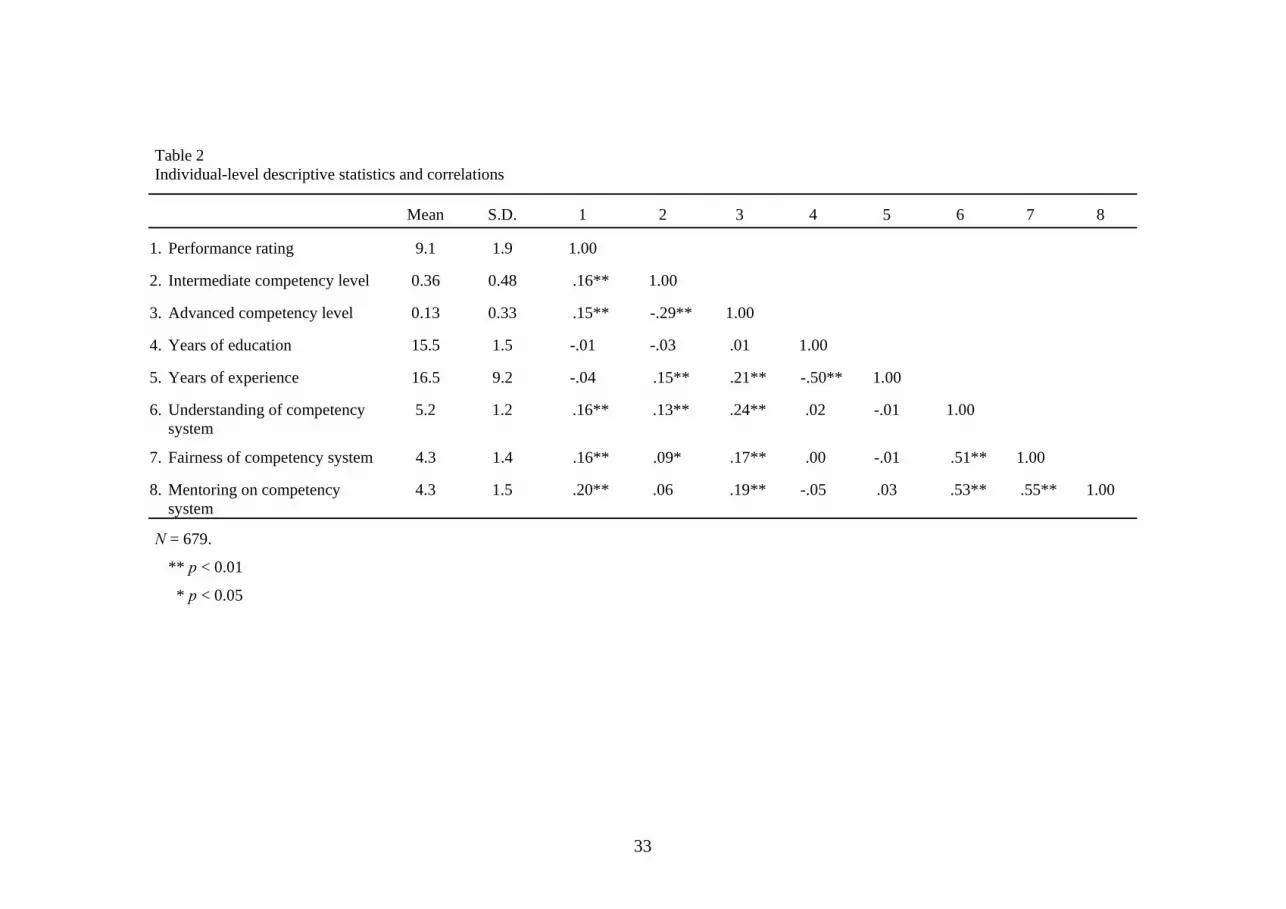
Table 2 reports the descriptive statistics and correlations among the individual-level
variables. Among the managers who responded to the survey, 36 percent are at the intermediate
competency level, and an additional 13 percent are at the advanced level.
— Insert Table 2 about here —
Competencies and Individual Performance
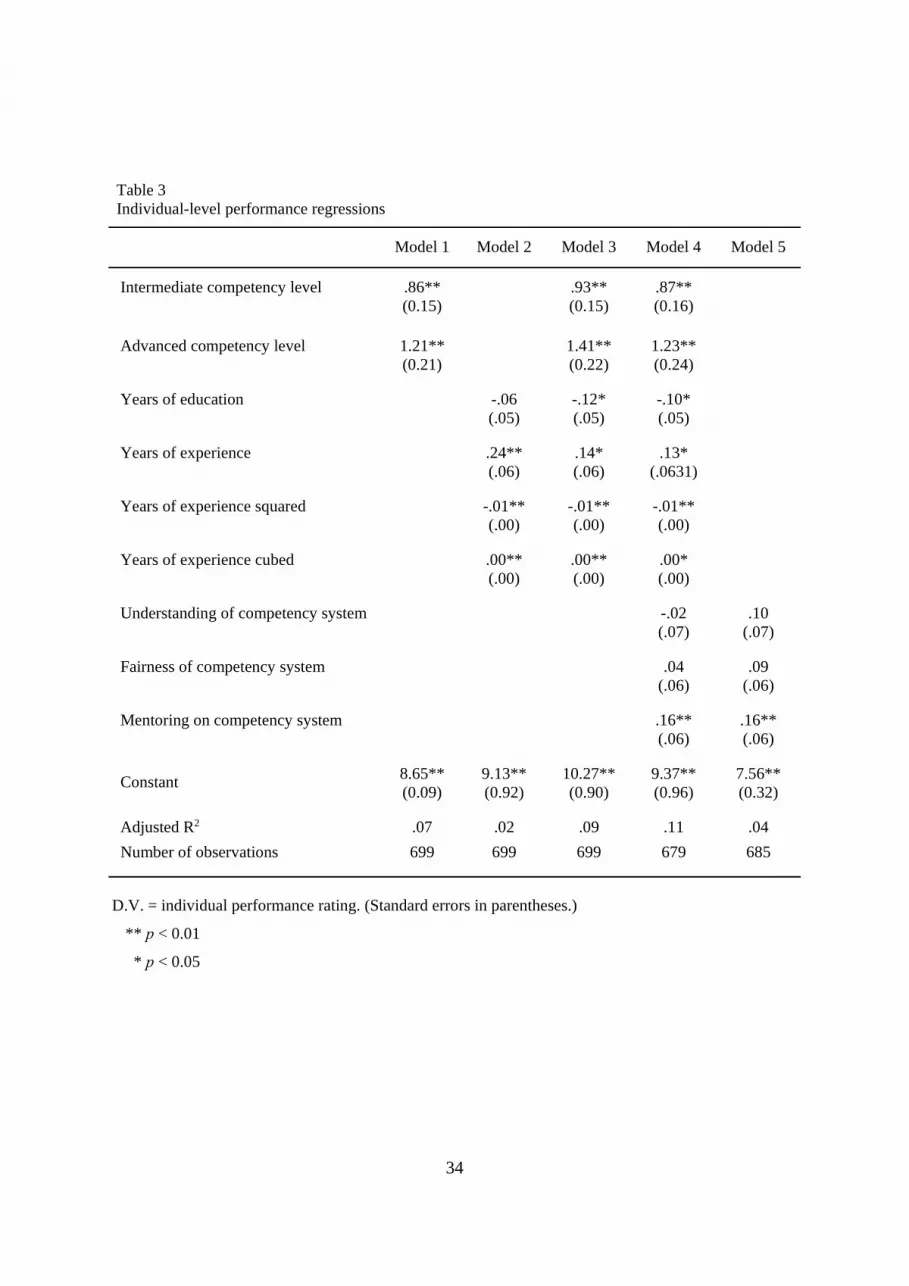
Table 3 shows the individual-level performance regressions. The results in Model 1,
including only the intermediate and advanced competency level variables, show that higher-level
competency managers have higher individual performance ratings, consistent with Hypothesis 1.
The results in Model 2, including only the human capital variables, show that years of
experience are positively correlated with individual performance. Consistent with prior findings
that the experience-performance relationship is nonlinear (Sturman, 2003), we use a cubic
polynomial in experience, as the human capital literature recommends (Murphy & Welch, 1990).
The results in Model 3, which includes both the competency and human capital variables,
show that the positive relationship between experience and performance attenuates slightly when

18
controlling for competency level, but remains statistically significant. The competency variables
also remain significant in Model 3 in the presence of the human capital variables, thus,
supporting Hypothesis 1.
Moreover, comparing the adjusted R2 of Model 1 (0.07) vs. Model 2 (0.02) shows that
Model 1 explains a greater portion of the variance. Using the test based on Vuong (1989) and
Dechow (1994), we find that this difference in R2 is significant at p = .06, just below
conventional significance levels. This provides weak support for Hypothesis 2.
— Insert Table 3 about here —
Comparing the coefficient estimates in the three models also reveals additional insights.
As mentioned above, the effect of years of experience on performance attenuates when
controlling for competency level. Figure 1 graphs the relationship between experience and
performance with and without controlling for competency level. When competency level is not
included, the highest performance is estimated for those with approximately 9-15 years of
experience. When competency level is included, the highest performance is estimated for those
with approximately 6-12 years of experience. This difference is due in part to the fact that
competency level and years of experience are positively correlated (Table 2). However, the
regression results in Table 3 indicate that the relationship between competency level and
performance gets stronger when controlling for the traditional human capital variables (Models 1
and 3), whereas the relationship between human capital and performance gets weaker when
controlling for the competency variables (Models 2 and 3). Thus, competency level appears to be
the stronger predictor of individual performance. This further bolsters support for Hypothesis 2.
— Insert Figure 1 about here —

19
Related, we note that when the competency variables are included in Model 3, the
coefficient on years of education goes from insignificant to significant negative. We interpret the
difference as follows. In Model 2, the results show that on average there is no relationship
between years of education and performance, holding constant years of experience. When
controlling for competency level in Model 3, the results suggest that, at any given competency
level, managers with more years of education on average have lower performance ratings than
those with fewer years of education. Although we do not want to put too much emphasis on this
pattern, given the overall lack of a significant relationship between education and performance in
Model 2, it does suggest that additional years of education do not appear to increase performance
among this group of managers when controlling for competency.
Finally, Model 4 adds understanding, fairness, and mentoring. Although all three
correlations with individual performance are positive (Table 2), only mentoring is positively
related to performance when all three variables are included in Model 4. Thus, we find support
for Hypothesis 5, but not for Hypotheses 3 and 4. Inferences are unchanged in Model 5 when we
run Model 4 without the competency and human capital variables. In other words, we find that
there is a direct impact of mentoring about the competency system on managers’ performance
above and beyond the impact of increasing competency levels.
Competencies and Site Performance
Table 4 reports the descriptive statistics and correlations for the site-level variables. The
site performance score is positively correlated with the percentage of managers at the
intermediate competency level and negatively correlated with the percentage at the advanced
competency level, though neither correlation is statistically significant.
— Insert Table 4 about here —

20
Table 5 reports the unit-level results. Model 1 includes only the percentages of managers
at the intermediate level and at the advanced level (controlling for site size). There is no
statistically significant relationship between these variables and unit performance. Model 2
substitutes the human capital for the competency variables. These, too, are not statistically
significantly related to unit performance. Model 3 includes both sets of variables, neither of
which is statistically significantly related to unit performance. Thus, we find no support for
Hypotheses 6 and 7 in Models 1 through 3.
— Insert Table 5 about here —
To this point, we have treated site size in Table 5 as a control variable. However, our
exploratory field work with the division revealed that the relationship between competencies and
performance might be different at the small and large sites. The size of the site leadership team is
relatively constant across sites, consisting of a site manager, HR manager, and 2-3 senior
managers. The size of this leadership team might be slightly smaller at the smallest sites and
slightly larger at the largest sites, but it does not vary as dramatically as the number of first-line
and middle managers, with an average of about 9 managers at the smallest third of sites, 22 at the
middle third, and 45 at the largest third (averages not reported in the tables). This means that the
leadership teams at the middle and large sites spend more of their time managing managers
instead of managing the production and distribution processes.
The greater complexity at larger sites and less available time of their leadership team
means that the first-line and middle managers who are part of the competency system have
greater opportunities to impact site performance. Because competency differences among first-
line and middle managers at the larger sites are more likely to impact performance than at the
smaller sites, we further explore an empirical model with site size as a moderating variable. This
21
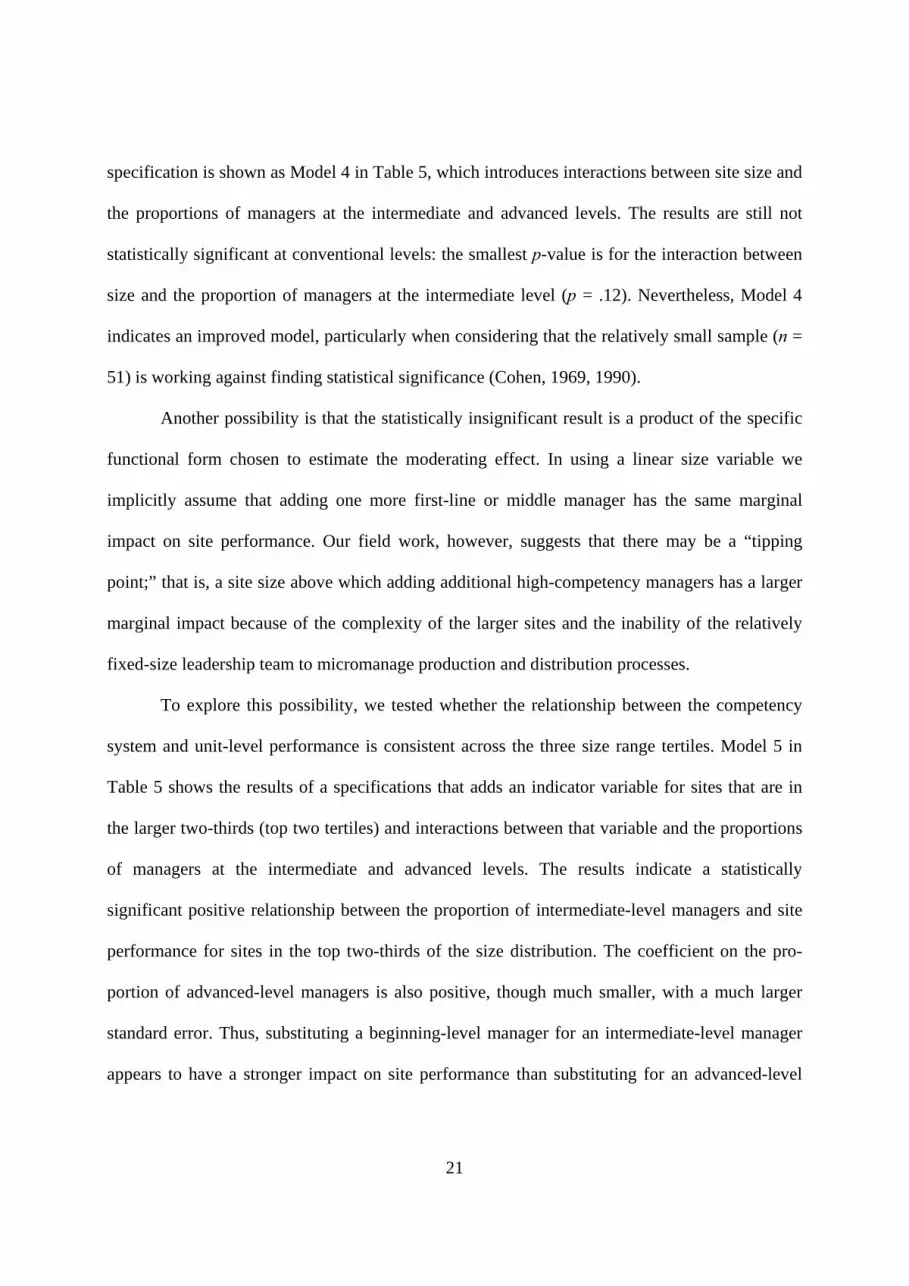
specification is shown as Model 4 in Table 5, which introduces interactions between site size and
the proportions of managers at the intermediate and advanced levels. The results are still not
statistically significant at conventional levels: the smallest p-value is for the interaction between
size and the proportion of managers at the intermediate level (p = .12). Nevertheless, Model 4
indicates an improved model, particularly when considering that the relatively small sample (n =
51) is working against finding statistical significance (Cohen, 1969, 1990).
Another possibility is that the statistically insignificant result is a product of the specific
functional form chosen to estimate the moderating effect. In using a linear size variable we
implicitly assume that adding one more first-line or middle manager has the same marginal
impact on site performance. Our field work, however, suggests that there may be a “tipping
point;” that is, a site size above which adding additional high-competency managers has a larger
marginal impact because of the complexity of the larger sites and the inability of the relatively
fixed-size leadership team to micromanage production and distribution processes.
To explore this possibility, we tested whether the relationship between the competency
system and unit-level performance is consistent across the three size range tertiles. Model 5 in
Table 5 shows the results of a specifications that adds an indicator variable for sites that are in
the larger two-thirds (top two tertiles) and interactions between that variable and the proportions
of managers at the intermediate and advanced levels. The results indicate a statistically
significant positive relationship between the proportion of intermediate-level managers and site
performance for sites in the top two-thirds of the size distribution. The coefficient on the pro-
portion of advanced-level managers is also positive, though much smaller, with a much larger
standard error. Thus, substituting a beginning-level manager for an intermediate-level manager
appears to have a stronger impact on site performance than substituting for an advanced-level

22
manager. Therefore, Model 5’s results support both Hypothesis 6 and the “superstar” conjecture.
In separate results (not reported), we tested Model 5’s results by using separate controls and
interactions for the middle and top tertiles. The results were similar.
Model 6 in Table 5 adds the aggregated human capital variables to Model 5: average
years of education and experience for the first-line and middle managers at the site. The results
show that (a) the human capital variables are not statistically significantly related to site
performance, and (b) the positive relationship between the percentage of managers at the
intermediate competency level and site performance becomes stronger, a similar pattern as the
individual-level results in Table 3. Thus, Models’ 5-6 results support Hypothesis 7.
We also examine the practical significance of the competency system in terms of its role
in improving site performance. In Table 5, Model 5, the estimated relationship between the
proportion of managers at the intermediate competency level and site performance is equal to
93.3 for the medium and large sites (derived by adding the coefficients in the first and ninth
rows: -37.3 + 130.6). We calculated the mean proportion of managers at the intermediate level to
be .315 (31.5%) for the medium and large sites, with a standard deviation of .11 (results not
reported in the table). Thus, a site with 11 percent more managers at the intermediate
competency level is predicted to have a .11 * 93.3 = 10.3 points higher site score, or about half a
standard deviation in site performance (23.3, from Table 4). Our interviews with the division’s
leadership indicated that one half of a standard deviation improvement in site performance is
practically significant. They consider the resources needed to develop managers from basic to
intermediate competency levels as on par with introducing new technologies or process
improvements that cut costs or boost productivity. Thus, the results in Model 5 appear to be both
statistically and practically significant.

23
Discussion
Our analysis of a first-line and middle manager competency system at a major division of
a Fortune 500 consumer products company revealed a positive relationship between higher
competency levels and individual-level performance, and a weaker relationship with site-level
performance. We found a positive relationship between mentoring on the competency system
and individual performance, suggesting a route through which organizations can use competency
systems to improve performance. We found no evidence of a link between understanding or
fairness of the competency system and individual performance. Our results also suggest that
competencies are more strongly related to performance than traditional human capital is.
Our finding that aggregated managerial competencies are positively related to site
performance only for the medium and large sites suggests a contingency interpretation of the
relationship between competencies and unit performance (Becker & Gerhart, 1996; Youndt,
Snell, Dean & Lepak, 1996). The contingency in this particular case may be the competencies of
the site leadership team. Russell’s (2001) evidence that general manager competencies are
positively related to unit performance and our results are consistent with a model of site
performance that is driven by two sets of managerial competencies: one set for the site leadership
team and one set for the site’s first-line and middle managers. Russell’s (2001) and our study
each has examined one of these two sets of competencies separately. Our contingency finding,
however, suggests that an examination of the relative importance of general manager/leadership
competencies relative to lower-level manager competencies is a promising avenue for future
research. We hope that subsequent research is able to address this limitation of the present study.
Moreover, one feature of the competency system in this case is worth emphasizing: the
spillover effect of managerial ability at higher competency levels. Managers are promoted within

24
the competency system only if they are able to positively impact their peers’ performance. It is
conceivable that this contributes to the better performance of sites with greater concentrations of
managers at the higher competency levels. It may also be related to our finding that there was no
link between the fraction of high-competency managers and unit performance at the small sites:
sites may not be able to reap all the benefits of peer learning when the number of peers is small.
To our knowledge, peer learning is not mentioned in previous writings on competencies.
The logic of peer learning, however, is rooted in a long line of leadership research, such as in
accomplishing objectives through influence (e.g., Kotter, 1982). This competency system
provides a case study of the principle, in which managers are rewarded for demonstrating those
behaviors. Although we must be careful to generalize beyond our setting, our results suggest that
peer learning among managers can help improve organizational performance, and so this feature
could represent an innovative design element for firms to consider in their competency systems.
We studied a competency system at one company for two reasons. First, the literature on
the impact of HR systems suggests that alignment with firm strategy can play an important role
in determining effectiveness (Youndt et al., 1996). A multi-firm approach would have to control
for both competency system characteristics and differential alignment of the system with strategy
and HR systems across firms. Second, our focus was on differences in site performance that can
be influenced by managerial actions and abilities (i.e., competencies), holding constant the role
of industry, production technology, and organization design. The benefit of this approach is that
we found a link between competencies and performance, which indicates that competencies can
help to differentiate performance within an organization. A limitation of this approach, however,
is that we do not know whether these results generalize to explaining between-company
differences in performance.
25
Further, while we find that competencies appear to predict performance better than
human capital measures, the additional variance explained is relatively low. Thus, we expect that
these results may not dissuade either side in the debate over whether it is worth the time it takes
to establish a competency system. Additional evidence is needed to determine whether
competencies are more strongly related to performance than human capital measures in a broader
range of jobs and organizations.
We also note that our evidence does not resolve the debate over using competency
systems for managerial development, selection, and performance management. Although our
results provide evidence of a positive relationship between a competency system and
performance, they do not document the competency system’s developmental impact. Our data
cannot differentiate whether the competency system operates primarily by encouraging skill
development, by allowing the company to select managers who are predisposed to develop into
better leaders, or both. Issues such as these offer promising avenues for future research.
26
References
Adams, J. S. 1963. Toward an understanding of inequity. Journal of Abnormal and Social
Psychology, 67(5): 422-436.
Bandura, A. 1986. Social foundations of thought and action: A social cognitive theory.
Englewood Cliffs, NJ: Prentice Hall.
Becker, B., & Gerhart, B. 1996. The impact of human resource management on organizational
performance: Progress and prospects. Academy of Management Journal, 39(4): 779-801.
Becker, G. S., 1964. Human capital. New York: Columbia University Press.
Boyatzis, R. E. 1982. The competent manager: A model for effective performance. New York:
John Wiley & Sons.
Bray, D. W., Campbell, R. J., & Grant, D. L. 1974. Formative years in business: A long-term
AT&T study of managerial lives. New York: John Wiley & Sons.
Breaugh, J. A., & Colihan, J. P. 1994. Measuring facets of job ambiguity: Construct validity
evidence. Journal of Applied Psychology, 79(2): 191-202.
Briscoe, J. P., & Hall, D. T. 1999. Grooming and picking leaders using competency frameworks:
Do they work? An alternative approach and new guidelines for practice. Organizational
Dynamics, 28: 37-52.
Cohen-Charash, Y., & Spector, P. E. 2001. The role of justice in organizations: A meta-analysis.
Organizational Behavior and Human Decision Processes, 86(2): 278-321.
Cohen, J. 1969. Statistical power analysis for the behavioral sciences. New York: Academic
Press.
Cohen, J. 1990. Things I have learned (so far). American Psychologist, 41(12): 1304-1312.

27
Dechow, P. M. 1994. Accounting earnings and cash flows as measures of firm performance: The
role of accounting accruals. Journal of Accounting and Economics, 18: 3-42.
DeNisi, A. S. 2000. Performance appraisal and performance management: A multilevel
approach. In K. J. Klein & S. W. J. Kozlowski (Eds.), Multilevel theory, research, and
methods in organizations: Foundations, extensions, and new directions: 121-156. San
Francisco: Jossey-Bass Publishers.
Dipboye, R. L., & de Pontbriand, R. 1981. Correlates of employee reactions to performance
appraisals and appraisal systems. Journal of Applied Psychology, 66(2): 248-251.
Dobbins, G. H., Cardy, R. L., & Platz-Vieno, S. J. 1990. A contingency approach to appraisal
satisfaction: An initial investigation of the joint effects of organizational variables and
appraisal characteristics. Journal of Management, 16(3): 619-632.
Drucker, P. F. 1966. The effective executive. New York: Harper & Row Publishers.
Dulewicz, V., & Herbert, P. 1996. General management competencies and personality: A 7-year
follow-up study. Working Paper Series 9621, Henley Management College.
Folger, R., & Konovsky, M. A. 1989. Effects of procedural and distributive justice on reactions
to pay raise decisions. Academy of Management Journal, 32(1): 115-130.
Gioia, D. A., & Manz, C. C. 1985. Linking cognition and behavior : A script processing
interpretation of vicarious learning. Academy of Management Review, 10(3): 527-539.
Goldstein, H. W., Yusko, K. P., & Nicolopoulos, V. 2001. Exploring black-white subgroup
differences of managerial competencies. Personnel Psychology, 54: 783-807.
Goleman, D., Boyatzis, R., & McKee, A. 2002. Primal leadership: Realizing the power of emo-
tional intelligence. Boston: Harvard Business School Press.

28
Hollenbeck, G. P., & McCall, M. W., Jr. 1997. Leadership development: Contemporary prac-
tices. In A. I. Kraut & A. K. Korman (Eds.), Evolving practices in human resource mana-
gement: 172-200. San Francisco: Jossey-Bass Publishers.
Janssen, O. 2001. Fairness perceptions as a moderator in the curvilinear relationships between
job demands, and job performance and job satisfaction. Academy of Management
Journal, 44(5): 1039-1050.
Judge, T. A., Cable, D. M., Boudreau, J. W., & Bretz, R. D., Jr. 1995. An empirical investigation
of the predictors of executive success. Personnel Psychology, 48: 485-519.
Kotter, J. P. 1982. The general managers. New York: The Free Press.
Landy, F. J., Barnes, J. L., & Murphy, K. R. 1978. Correlates of perceived fairness and accuracy
of performance evaluations. Journal of Applied Psychology, 63(6): 751-754.
Lankau, M. J., & Scandura, T. A. 2002. An investigation of personal learning in mentoring rela-
tionships: Content, antecedents, and consequences. Academy of Management Journal,
45(4): 779-790.
Lawler, III, E. E. 1967. The multi-trait multi-rater approach to measuring managerial job
performance. Journal of Applied Psychology, 51: 369-381.
Lawler, III, E. E. 2000. Rewarding excellence: Pay strategies for the new economy. San Fran-
cisco: Jossey-Bass Publishers.
Lawler, III, E. E., & McDermott, M. 2003. Current performance management practices: Exam-
ining the varying impacts. World at Work Journal, 12(2): 49-60.
Ledford, G. (1995). Paying for the skills, knowledge, and competencies of knowledge workers.
Compensation and Benefits Review, 27: 55-63.

29
Ledford, G. E., Jr., & Bergel, G. 1991. Skill-based pay case #1: General Mills. Compensation
and Benefits Review, 23: 24-38.
Ledford, G. E., Jr., Tyler, W. R., & Dixey, W. B. 1991. Skill-based pay case #3: Honeywell am-
munition assembly plant. Compensation and Benefits Review, 23: 57-77.
McClelland, D. C. 1973. Testing for competence rather than for “intelligence.” American
Psychologist, 28: 1-14.
McClelland, D. C., Baldwin, A. L., Bronfenbrenner, U., & Strodtbeck, F. L. 1958. Talent and
society. Princeton: Van Nostrand.
McFarlin, D. B., & Sweeney, P. D. 1992. Distributive and procedural justice as predictors of
satisfaction with personal and organizational outcomes. Academy of Management
Journal, 35(3): 626-637.
McKenna, S. 2002. Can knowledge of the characteristics of “high performers” be generalized?
Journal of Management Development, 21: 680-701.
Mincer, J. 1974. Schooling, experience, and earnings. New York: National Bureau of Economic
Research.
Mishra, A. K., & Spreitzer, G. M. 1998. Explaining how survivors respond to downsizing: The
roles of trust, empowerment, justice, and work redesign. Academy of Management
Review, 23(3): 567-588.
Mount, M. K. 1983. Comparisons of managerial and employee satisfaction with a performance
appraisal system. Personnel Psychology, 36(1): 99-110.
Mount, M. K. 1984. Satisfaction with a performance appraisal system and appraisal discussion.
Journal of Occupational Behavior, 5: 271-279.

30
Mowday, R. T. 1979. Equity theory predictions of behavior in organizations. In R. M. Steers &
L. W. Porter (Eds.), Motivation and Work Behavior (Second Edition): 124-146. New
York: McGraw-Hill Book Company.
Murphy, K. M., & Welch, F. 1990. Empirical age-earnings profiles. Journal of Labor
Economics, 8(2): 202-229.
Pooyan, A., & Eberhardt, B. J. 1989. Correlates of performance appraisal satisfaction among
supervisory and non-supervisory employees. Journal of Business Research, 19: 215-226.
Richard, O. C., Taylor, E. C., Barnett, T., & Nesbit, M. F. A. 2002. Procedural voice and
distributive justice: Their influence on mentoring career help and other outcomes.
Journal of Business Research, 55: 725-735.
Russell, C. J. 2001. A longitudinal study of top-level executive performance. Journal of Applied
Psychology, 86: 560-573.
Scarpello, V., & Jones, F. F. 1996. Why justice matters in compensation decision making.
Journal of Organizational Behavior, 17: 285-299.
Schneider, B., Smith, D. B., & Sipe, W. P. 2000. Personnel selection psychology: Multilevel
considerations. In K. J. Klein & S. W. J. Kozlowski (Eds.), Multilevel theory, research,
and methods in organizations: Foundations, extensions, and new directions: 91-120. San
Francisco: Jossey-Bass Publishers.
Spencer, L. M., Jr., & Spencer, S. M. 1993. Competence at work: Models for superior perform-
ance. New York: John Wiley & Sons, Inc.
Spreitzer, G. M., McCall, M. W., Jr., & Mahoney, J. D. 1997. Early identification of interna-
tional executive potential. Journal of Applied Psychology, 82: 6-29.

31
St-Onge, S. 2000. Variables influencing the perceived relationship between performance and pay
in a merit pay environment. Journal of Business and Psychology, 14(3): 459-479.
Stroh, L. K., Brett, J. M., & Reilly, A. H. 1992. All the right stuff: A comparison of female and
male managers’ career progression. Journal of Applied Psychology, 77(3): 251-260.
Sturman, M. C. 2003. Searching for the inverted U-shaped relationship between time and
performance: Meta-analyses of the experience/performance, tenure/performance, and
age/performance relationships. Journal of Management, 29(5): 609-640.
Tharenou, P., Latimer, S., & Conroy, D. 1994. How do you make it to the top? An examination
of influences on women’s and men’s managerial advancement. Academy of Management
Journal, 37(4): 899-931.
Vuong, Q. H. 1989. Likelihood ratio tests for model selection and non-nested hypotheses.
Econometrica, 57(2): 307-333.
Williams, J. R., & Levy, P. E. 1992. The effects of perceived system knowledge on the
agreement between self-rating and supervisor ratings. Personnel Psychology, 45: 836-
847.
Youndt, M. A., Snell, S. A., Dean, J. W., Jr., & Lepak, D. P. 1996. Human resource manage-
ment, manufacturing strategy, and firm performance. Academy of Management Journal,
39: 836-866.
Zenger, J. H., & Folkman, J. 2002. The extraordinary leader: Turning good managers into great
leaders. New York: McGraw-Hill.
Zingheim, P. K., Ledford, G. E., Jr., & Schuster, J. R. 1996. Competencies and competency
models: One size fits all? ACA Journal, 5: 56-65.

32
Table 1 Factor analyses
Exploratory1 Confirmatory2
Understanding of the competency system Factor 1 Factor 2 Factor 3 Factor 1 I understand how managers can get a promotion under the competency system
.01 .08 .79 .83
I have a real understanding of how the competency system works
.03 -.08 .73 .68
I understand the criteria used to determine movement from <beginning> to <intermediate> to <advanced>
-.00 .13 .71 .79
Fairness of the competency system Factor 2 Managers do not get promoted to <intermediate> or <advanced> unless they have really mastered that competency level
-.02 .92 -.07 .82
People promoted to <intermediate> and <advanced> continue to demonstrate the relevant competencies
.01 .72 .11 .80
It seems that the competency system is administered fairly .11 .70 .06 .81
Mentoring on the competency system Factor 3 My manager and I regularly talk about what I need to do to progress in the competency system
.92 -.02 -.08 .84
I get good feedback from my manager on where I stand in the competency system
.84 .01 .04 .87
My manager helps me develop plans to achieve the anchors in the competency system
.78 .14 -.03 .85
I have received good communication about how the competency system works from the manager to whom I report
.78 -.06 .15 .84
N = 807.
1 The second, third, and fourth columns report the Oblimin-rotated factor loadings from exploratory factor
analysis using Principal Axis Factoring. The total variance explained by the three scales is 67.5 percent.
2 The last column reports the standardized factor loadings from confirmatory factor analysis. Further, model
fit is adequate as indicated by χ2/df = 4.18 (< 5); CFI = 0.98 (> 0.95); and RMSEA = 0.06 (< 0.08).
33
Table 2 Individual-level descriptive statistics and correlations
Mean S.D. 1 2 3 4 5 6 7 8
1. Performance rating 9.1 1.9 1.00
2. Intermediate competency level 0.36 0.48 .16** 1.00
3. Advanced competency level 0.13 0.33 .15** -.29** 1.00
4. Years of education 15.5 1.5 -.01 -.03 .01 1.00
5. Years of experience 16.5 9.2 -.04 .15** .21** -.50** 1.00
6. Understanding of competency system
5.2 1.2 .16** .13** .24** .02 -.01 1.00
7. Fairness of competency system 4.3 1.4 .16** .09* .17** .00 -.01 .51** 1.00
8. Mentoring on competency system
4.3 1.5 .20** .06 .19** -.05 .03 .53** .55** 1.00
N = 679.
** p < 0.01
* p < 0.05
34
Table 3 Individual-level performance regressions
Model 1 Model 2 Model 3 Model 4 Model 5
Intermediate competency level .86** (0.15)
.93** (0.15)
.87** (0.16)
Advanced competency level 1.21** (0.21)
1.41** (0.22)
1.23** (0.24)
Years of education -.06 (.05)
-.12* (.05)
-.10* (.05)
Years of experience .24** (.06)
.14* (.06)
.13* (.0631)
Years of experience squared -.01** (.00)
-.01** (.00)
-.01** (.00)
Years of experience cubed .00** (.00)
.00** (.00)
.00* (.00)
Understanding of competency system -.02 (.07)
.10 (.07)
Fairness of competency system .04 (.06)
.09 (.06)
Mentoring on competency system .16** (.06)
.16** (.06)
Constant 8.65** (0.09)
9.13** (0.92)
10.27** (0.90)
9.37** (0.96)
7.56** (0.32)
Adjusted R2 .07 .02 .09 .11 .04
Number of observations 699 699 699 679 685
D.V. = individual performance rating. (Standard errors in parentheses.)
** p < 0.01
* p < 0.05

35
Table 4 Site-level descriptive statistics and correlations
Mean S.D. 1 2 3 4 5 6
1. Site performance 87.3 23.3 1.00
2. Proportion managers at intermediate competency level 0.31 0.13 .18 1.00
3. Proportion managers at advanced competency level 0.11 0.10 -.13 -.49** 1.00
4. Site size (measured by number of first-line and middle managers)
25.5 16.2 -.12 -.03 -.14 1.00
5. Years of education mean 15.5 0.5 -.11 .08 -.18 .12 1.00
6. Years of experience mean 16.7 3.8 .13 .07 .25 -.34* -.61** 1.00
N = 51.
** p < 0.01
* p < 0.05

36
Table 5 Unit-level performance regressions
Model 1 Model 2 Model 3 Model 4 Model 5 Model 6
Proportion of managers at intermediate level 24.8 (28.8)
22.5 (30.2)
-41.3 (49.7)
-37.3 (38.6)
-46.7 (39.6)
Proportion of managers at advanced level -18.4 (40.5)
-26.7 (42.8)
-58.8 (71.0)
-62.7 (49.7)
-74.8 (50.8)
Mean years of education -2.71 (8.16)
-4.10 (8.27)
-4.51 (8.48)
-6.1 (7.9)
Mean years of experience .401 (1.18)
.376 (1.23)
.595 (1.24)
.55 (1.1)
Site size -.178 (.208)
-.126 (.221)
-.139 (.222)
-1.34 (.843)
Proportion of managers at intermediate level * Site size
3.37 (2.10)
Proportion of managers at advanced level * Site size
.791 (3.76)
Site is in larger two-thirds (dummy variable)
-56.9 * (24.6)
-58.8 * (24.8)
Proportion of managers at intermediate level * Site is in larger two-thirds (dummy variable)
130.6 * (55.8)
142.8 * (56.5)
Proportion of managers at advanced level * Site is in larger two-thirds (dummy variable)
90.1 (84.3)
85.5 (84.6)
Constant 86.1 125.7 143.8 171.9 110.9 199.3
Adjusted R2 -.01 -.04 -.04 -.02 .06 .05
Number of observations 51 51 51 51 51 51
D.V. = Site performance score. (Standard errors in parentheses.)
** p < 0.01
* p < 0.05

37
3
4
5
6
7
8
9
10
11
12
13
14
15
1 2 3 4 5 6 7 8 9 10111213141516171819202122232425262728293031323334
Not Controlling forCompetencies
Controlling forCompetencies
Figure 1 Relationship between individual experience and performance

38
Biographical notes Alec R. Levenson is a research scientist at the Center for Effective Organizations in the Marshall School of Business at the University of Southern California. He received his Ph.D. in economics from Princeton University. His research and consulting focuses on the economics of human resources and organization design, including maximizing the effectiveness of HR and human capital metrics and analytics, and measuring and improving the links between individual contributions and organizational results. Wim A. Van der Stede is an assistant professor in the Leventhal School of Accounting in the Marshall School of Business at the University of Southern California. He received his Ph.D. in economics from the University of Ghent (Belgium). His research focuses on performance measurement, evaluation, and incentives in the context of organizational control from both an accounting and management perspective. Susan G. Cohen is a senior research scientist at the Center for Effective Organizations in the Marshall School of Business at the University of Southern California. She received her Ph.D. in Organizational Behavior from Yale University. She has researched and consulted on a variety of approaches to improving organizational effectiveness, including self-managing teams and team effectiveness, group empowerment, employee involvement, organization development and change, participative management, performance management, and implementation of information technology.


