Embed Size (px)
Citation preview
MAKING PERSONAL FINANCE DECISIONS2019 REVISED EDITION
Making Personal Finance Decisions©2019, Minnesota Council on Economic Education.
Developed in partnership with the Federal Reserve Bank of St. Louis.
Cover Images:
©Jupiterimages/Polka Dot/Thinkstock
©Dennis Beck/iStock/Thinkstock; ©boggy22/iStock/Thinkstock
©kosmos111/iStock/Thinkstock; ©LorenzoPatoia/iStock/Thinkstock; ©Mike Watson Images/moodboard/Thinkstock
©janischristieimages/iStock/Thinkstock; ©Feverpitched/iStock/Thinkstock; ©clean_fotos/iStock/Thinkstock; ©Monkey Business Images/Monkey Business/Thinkstock
These images are being used for illustrative purposes only. Any person(s) depicted in these images is a model.
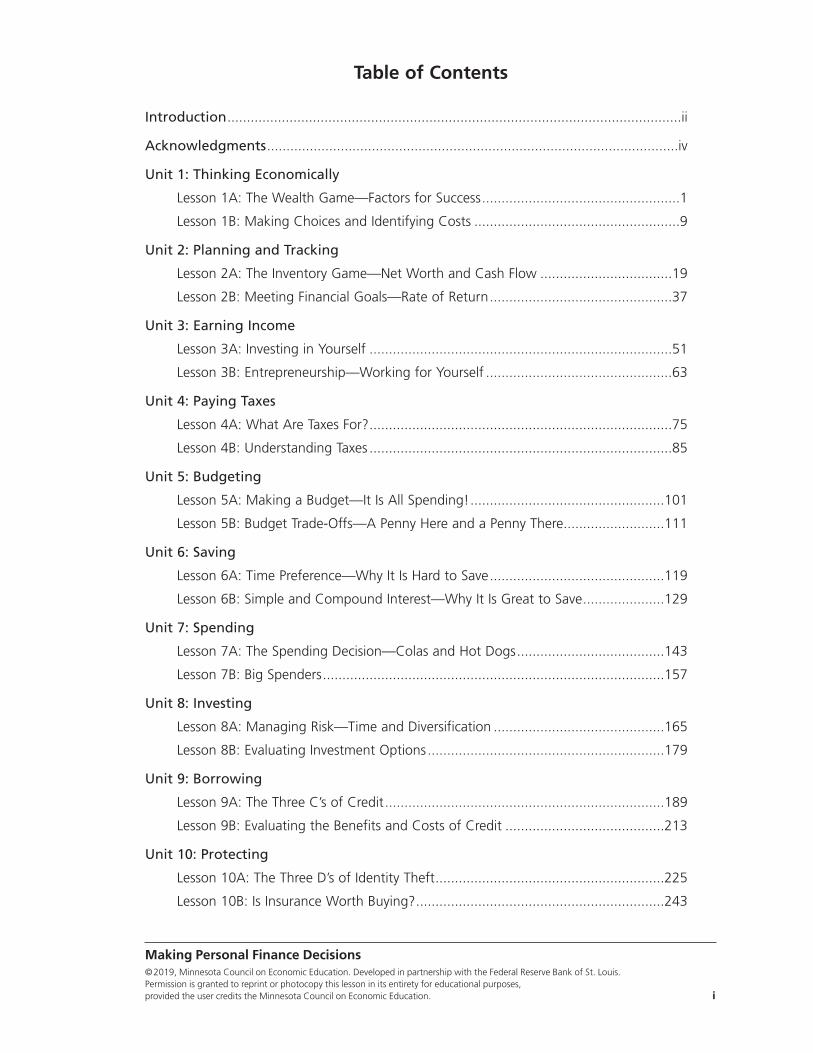
Table of Contents
Introduction.....................................................................................................................ii
Acknowledgments..........................................................................................................iv
Unit 1: Thinking Economically
Lesson 1A: The Wealth Game—Factors for Success...................................................1
Lesson 1B: Making Choices and Identifying Costs .....................................................9
Unit 2: Planning and Tracking
Lesson 2A: The Inventory Game—Net Worth and Cash Flow ..................................19
Lesson 2B: Meeting Financial Goals—Rate of Return...............................................37
Unit 3: Earning Income
Lesson 3A: Investing in Yourself ..............................................................................51
Lesson 3B: Entrepreneurship—Working for Yourself ................................................63
Unit 4: Paying Taxes
Lesson 4A: What Are Taxes For?..............................................................................75
Lesson 4B: Understanding Taxes ..............................................................................85
Unit 5: Budgeting
Lesson 5A: Making a Budget—It Is All Spending!..................................................101
Lesson 5B: Budget Trade-Offs—A Penny Here and a Penny There..........................111
Unit 6: Saving
Lesson 6A: Time Preference—Why It Is Hard to Save.............................................119
Lesson 6B: Simple and Compound Interest—Why It Is Great to Save.....................129
Unit 7: Spending
Lesson 7A: The Spending Decision—Colas and Hot Dogs......................................143
Lesson 7B: Big Spenders........................................................................................157
Unit 8: Investing
Lesson 8A: Managing Risk—Time and Diversification ............................................165
Lesson 8B: Evaluating Investment Options .............................................................179
Unit 9: Borrowing
Lesson 9A: The Three C’s of Credit........................................................................189
Lesson 9B: Evaluating the Benefits and Costs of Credit .........................................213
Unit 10: Protecting
Lesson 10A: The Three D’s of Identity Theft...........................................................225
Lesson 10B: Is Insurance Worth Buying?................................................................243
Making Personal Finance Decisions©2019, Minnesota Council on Economic Education. Developed in partnership with the Federal Reserve Bank of St. Louis. Permission is granted to reprint or photocopy this lesson in its entirety for educational purposes, provided the user credits the Minnesota Council on Economic Education. i
The Minnesota Council on Economic Education (MCEE) is pleased to partner withthe Federal Reserve Bank of St. Louis to bring you this curriculum.
MCEE thanks Curt Anderson, Professor Emeritus and Morse-Alumni DistinguishedTeacher of Economics and former Director of the Center for Economic Educationat the University of Minnesota, Duluth, for creating these lessons. Making PersonalFinance Decisions was many years in the making, and we’re excited to bring it toyou in this new format. MCEE also thanks the Federal Reserve Bank of St. Louisfor partnering with us on this project, allowing more teachers to have access tothis valuable resource.
The lessons are grounded in economic concepts and decisionmaking, with coreprinciples that have students identifying and evaluating options and consideringtrade-offs and opportunity costs in personal finance actions. And, as in all curricu-lum developed by MCEE and the Federal Reserve Bank of St. Louis, the lessons arehighly interactive, teaching personal finance concepts through simulations andhands-on activities.
We hope you find the curriculum as valuable as we do in teaching personalfinance concepts that students need to succeed in today’s complex economy.
Donald Liu, Ph.D.Executive Director, Minnesota Council on Economic EducationProfessor and Morse-Alumni Distinguished Teaching ProfessorDepartment of Applied EconomicsUniversity of Minnesota
Making Personal Finance Decisions©2019, Minnesota Council on Economic Education. Developed in partnership with the Federal Reserve Bank of St. Louis.
Permission is granted to reprint or photocopy this lesson in its entirety for educational purposes, ii provided the user credits the Minnesota Council on Economic Education.
Introduction from the Minnesota Council on Economic Education
The Making Personal Finance Decisions curriculum teaches valuable personalfinance lessons grounded in solid economic theory. The curriculum is dividedinto 10 units, with each unit containing two lessons. The 10 units follow alogical thought progression: Unit 1 establishes a solid foundation by introduc-ing key ideas such as trade-offs, opportunity costs, and the PACED decision-making model. These concepts provide the framework for the topics thatfollow: planning and tracking goals, earning income, paying taxes, budgeting,saving, spending, investing, borrowing, and protecting from fraud and loss.The order of the units is not random: Income is earned and then taxed, peo-ple plan (budget) from there—for saving (future spending), (current) spending,investing, borrowing when necessary (to increase net worth), and finally toprotect their health and assets with insurance and careful monitoring. Thisreasoned framework provides smooth transitions as students build and refinetheir personal finance skills.
These lessons were written by Curt Anderson, who has a gift for taking impor-tant concepts and turning them into active learning that results in “lightbulbmoments” for students. The lessons were published by the Minnesota Councilon Economic Education (MCEE) in 2012 and made available on their website.The economic education group at the Federal Reserve Bank of St. Louis(EconLowdown) approached the MCEE (and Curt) in 2016 about updatingand republishing the curriculum—happily they agreed. The 20 revised lessonsinclude these added components: essential questions; updated data; addi-tional instructional supports (procedure steps, handouts, and visuals); assess-ment questions (with answers); alignment with standards; and professionalediting, design, and layout.
EconLowdown and the MCEE share the conviction that personal finance isthe application of economic theory, not a separate discipline. This curriculumis an exemplar: In the process of learning solid personal finance lessons, stu-dents will also learn core economic concepts (scarcity, opportunity cost,human capital, stock and flow variables, marginal thinking, and diminishingreturns). As such, these lessons are appropriate for courses that might beidentified as either “economics” or “personal finance.”
We appreciate the dedication of the MCEE and the opportunity to partner onthis project. Specifically, we thank Donald Liu and Jane Stockman for theirwork on this project. We are proud of these lessons, and we hope that theyare useful to your work in the classroom.
Mary C. Suiter, Ph.D.Scott A. Wolla, Ph.D.Federal Reserve Bank of St. Louis
Making Personal Finance Decisions©2019, Minnesota Council on Economic Education. Developed in partnership with the Federal Reserve Bank of St. Louis. Permission is granted to reprint or photocopy this lesson in its entirety for educational purposes, provided the user credits the Minnesota Council on Economic Education. iii
Introduction from the Federal Reserve Bank of St. Louis
Author
Curt L. Anderson, Ph.D., University of Minnesota, Duluth
Editors
Mary S. Suiter, Ph.D., Federal Reserve Bank of St. LouisScott A. Wolla, Ph.D., Federal Reserve Bank of St. Louis
Copy Editors
Lydia H. Johnson, Federal Reserve Bank of St. LouisJudith A. Ahlers, Federal Reserve Bank of St. Louis
Designer
Donna M. Stiller, Federal Reserve Bank of St. Louis
Views expressed do not necessarily reflect official positions of the Federal Reserve System.
Making Personal Finance Decisions©2019, Minnesota Council on Economic Education. Developed in partnership with the Federal Reserve Bank of St. Louis.
Permission is granted to reprint or photocopy this lesson in its entirety for educational purposes, iv provided the user credits the Minnesota Council on Economic Education.
Acknowledgments
Lesson 1A:
The Wealth Game—Factors for Success
Lesson DescriptionStudents play “The Wealth Game” (based on “Market Exchange and Wealth Distri bu -tion: A Classroom Simulation” by Robert B. Williams, Journal of Economic Education,Fall 1993). Students are given an initial set of colored beads with defined values thatdetermine their wealth in one of three categories: poor, middle class, or rich. Their taskis to increase their wealth by trading their beads with other students. Individual stu-dent outcomes of the game are discussed in terms of the four primary determinantsof wealth: natural abilities, effort, motivation, and luck.
Standards and Benchmarks (see page 8)
Grade Level9-12
ConceptDeterminants of wealth: natural abilities, effort, motivation, and luck
Compelling QuestionHow do personal characteristics and skills affect a person’s financial wealth?
Unit 1
Thinking Economically
Making Personal Finance Decisions©2019, Minnesota Council on Economic Education. Developed in partnership with the Federal Reserve Bank of St. Louis. Permission is granted to reprint or photocopy this lesson in its entirety for educational purposes, provided the user credits the Minnesota Council on Economic Education. 1
Rule 1: Think before you act.Personal finance is largely about making decisions. Making good decisions involvesdetermining your options, evaluating those options based on what is important to you,considering trade-offs (“weighing the gain and the pain”), and understanding that alldecisions involve an opportunity cost. The lessons in Unit 1 introduce this process, whichwill be used in many of the Making Personal Finance Decisions units.
ObjectiveStudents will be able to describe personal characteristics and skills important forfinancial success.
Materials • 430 beads (for a class of 30) in 5 different colors and amounts: 140 orange, 120
blue, 90 yellow, 50 green, and 30 red (Other colors may be substituted, butnote that these colors are the ones listed on Handout 1.)
• 30 plastic sandwich/snack bags
• Large opaque bag (e.g., a paper grocery bag)
• Handout 1A.1: The Wealth Game, one copy for each student
• Handout 1A:2: Assessment, one copy for each student
• Optional: small prizes for winners in three categories
Time Required45 minutes
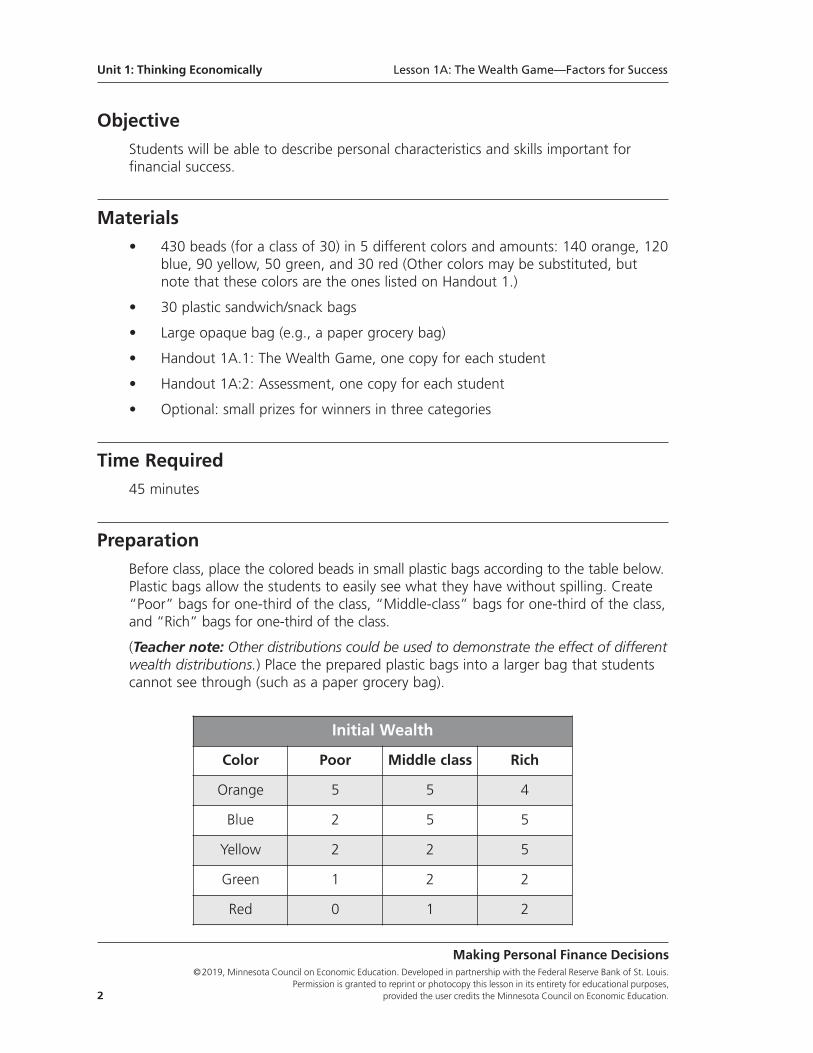
PreparationBefore class, place the colored beads in small plastic bags according to the table below.Plastic bags allow the students to easily see what they have without spilling. Create“Poor” bags for one-third of the class, “Middle-class” bags for one-third of the class,and “Rich” bags for one-third of the class.
(Teacher note: Other distributions could be used to demonstrate the effect of differentwealth distributions.) Place the prepared plastic bags into a larger bag that studentscannot see through (such as a paper grocery bag).
Unit 1: Thinking Economically Lesson 1A: The Wealth Game—Factors for Success
Making Personal Finance Decisions©2019, Minnesota Council on Economic Education. Developed in partnership with the Federal Reserve Bank of St. Louis.
Permission is granted to reprint or photocopy this lesson in its entirety for educational purposes, 2 provided the user credits the Minnesota Council on Economic Education.
Initial Wealth
Color Poor Middle class Rich
Orange 5 5 4
Blue 2 5 5
Yellow 2 2 5
Green 1 2 2
Red 0 1 2
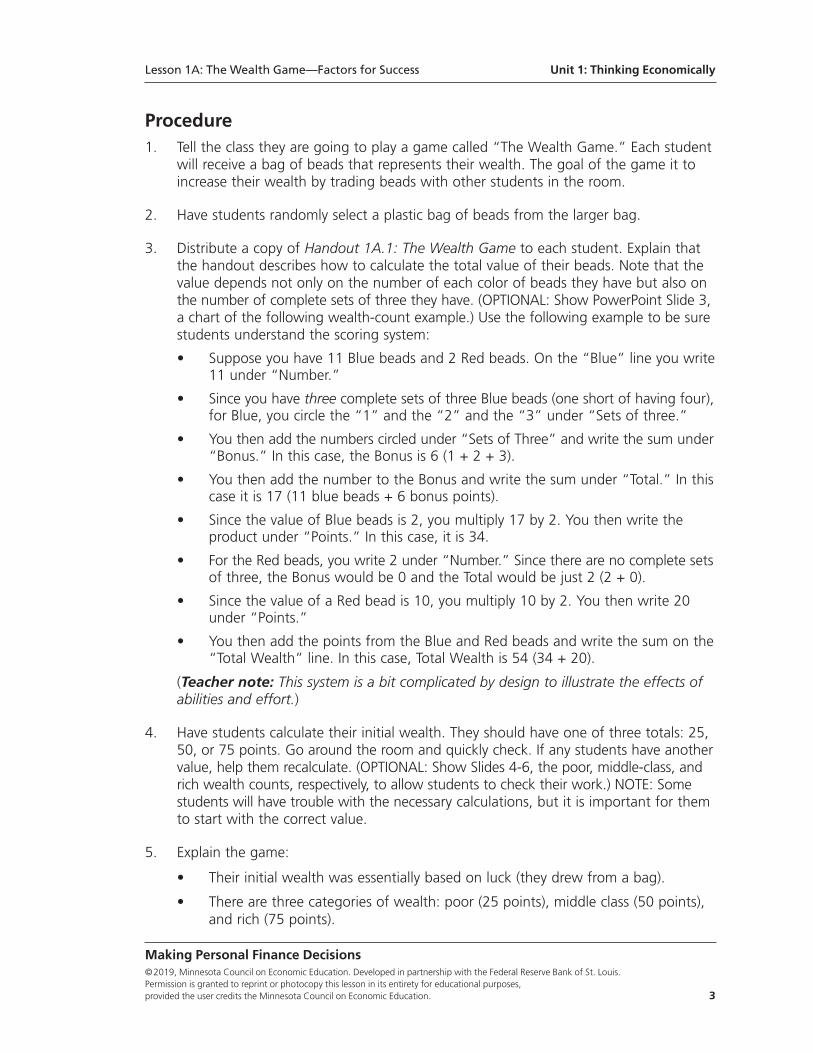
Procedure1. Tell the class they are going to play a game called “The Wealth Game.” Each student
will receive a bag of beads that represents their wealth. The goal of the game it toincrease their wealth by trading beads with other students in the room.
2. Have students randomly select a plastic bag of beads from the larger bag.
3. Distribute a copy of Handout 1A.1: The Wealth Game to each student. Explain thatthe handout describes how to calculate the total value of their beads. Note that thevalue depends not only on the number of each color of beads they have but also onthe number of complete sets of three they have. (OPTIONAL: Show PowerPoint Slide 3,a chart of the following wealth-count example.) Use the following example to be surestudents understand the scoring system:
• Suppose you have 11 Blue beads and 2 Red beads. On the “Blue” line you write11 under “Number.”
• Since you have three complete sets of three Blue beads (one short of having four),for Blue, you circle the “1” and the “2” and the “3” under “Sets of three.”
• You then add the numbers circled under “Sets of Three” and write the sum under“Bonus.” In this case, the Bonus is 6 (1 + 2 + 3).
• You then add the number to the Bonus and write the sum under “Total.” In thiscase it is 17 (11 blue beads + 6 bonus points).
• Since the value of Blue beads is 2, you multiply 17 by 2. You then write theproduct under “Points.” In this case, it is 34.
• For the Red beads, you write 2 under “Number.” Since there are no complete setsof three, the Bonus would be 0 and the Total would be just 2 (2 + 0).
• Since the value of a Red bead is 10, you multiply 10 by 2. You then write 20under “Points.”
• You then add the points from the Blue and Red beads and write the sum on the“Total Wealth” line. In this case, Total Wealth is 54 (34 + 20).
(Teacher note: This system is a bit complicated by design to illustrate the effects ofabilities and effort.)
4. Have students calculate their initial wealth. They should have one of three totals: 25,50, or 75 points. Go around the room and quickly check. If any students have anothervalue, help them recalculate. (OPTIONAL: Show Slides 4-6, the poor, middle-class, andrich wealth counts, respectively, to allow students to check their work.) NOTE: Somestudents will have trouble with the necessary calculations, but it is important for themto start with the correct value.
5. Explain the game:
• Their initial wealth was essentially based on luck (they drew from a bag).
• There are three categories of wealth: poor (25 points), middle class (50 points),and rich (75 points).
Lesson 1A: The Wealth Game—Factors for Success Unit 1: Thinking Economically
Making Personal Finance Decisions©2019, Minnesota Council on Economic Education. Developed in partnership with the Federal Reserve Bank of St. Louis. Permission is granted to reprint or photocopy this lesson in its entirety for educational purposes, provided the user credits the Minnesota Council on Economic Education. 3
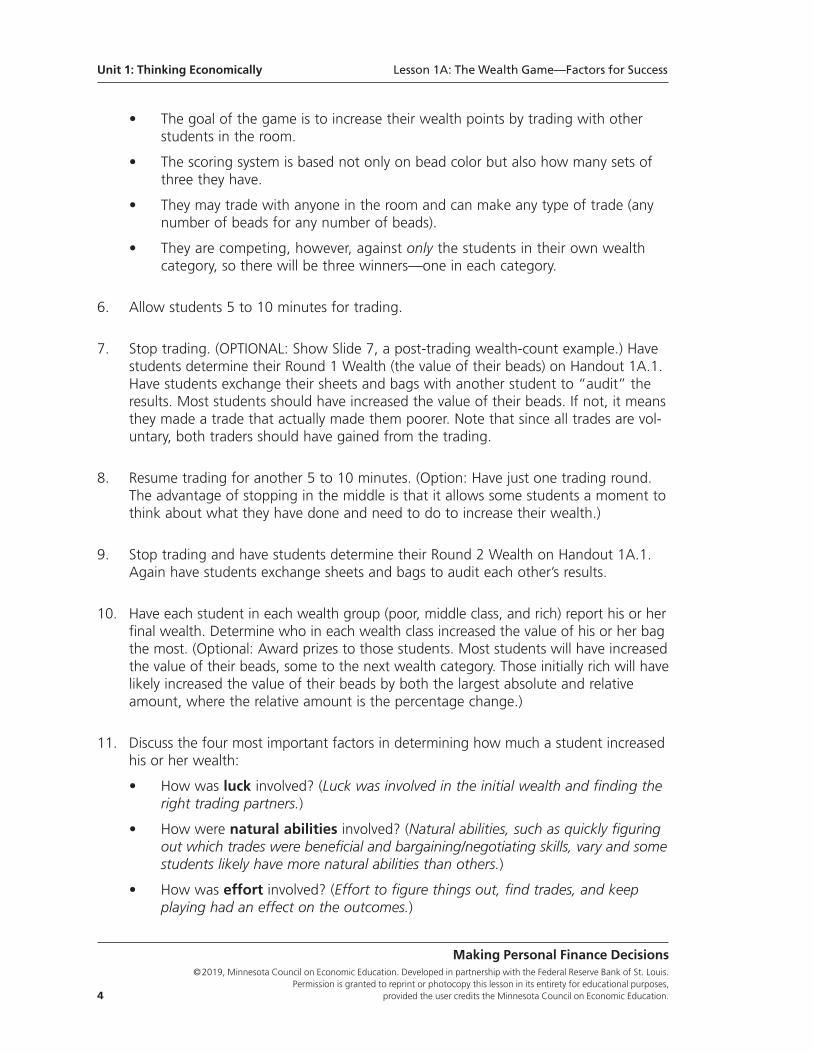
• The goal of the game is to increase their wealth points by trading with otherstudents in the room.
• The scoring system is based not only on bead color but also how many sets ofthree they have.
• They may trade with anyone in the room and can make any type of trade (anynumber of beads for any number of beads).
• They are competing, however, against only the students in their own wealthcategory, so there will be three winners—one in each category.
6. Allow students 5 to 10 minutes for trading.
7. Stop trading. (OPTIONAL: Show Slide 7, a post-trading wealth-count example.) Havestudents determine their Round 1 Wealth (the value of their beads) on Handout 1A.1.Have students exchange their sheets and bags with another student to “audit” theresults. Most students should have increased the value of their beads. If not, it meansthey made a trade that actually made them poorer. Note that since all trades are vol-untary, both traders should have gained from the trading.
8. Resume trading for another 5 to 10 minutes. (Option: Have just one trading round.The advantage of stopping in the middle is that it allows some students a moment tothink about what they have done and need to do to increase their wealth.)
9. Stop trading and have students determine their Round 2 Wealth on Handout 1A.1.Again have students exchange sheets and bags to audit each other’s results.
10. Have each student in each wealth group (poor, middle class, and rich) report his or herfinal wealth. Determine who in each wealth class increased the value of his or her bagthe most. (Optional: Award prizes to those students. Most students will have increasedthe value of their beads, some to the next wealth category. Those initially rich will havelikely increased the value of their beads by both the largest absolute and relativeamount, where the relative amount is the percentage change.)
11. Discuss the four most important factors in determining how much a student increasedhis or her wealth:
• How was luck involved? (Luck was involved in the initial wealth and finding theright trading partners.)
• How were natural abilities involved? (Natural abilities, such as quickly figuringout which trades were beneficial and bargaining/negotiating skills, vary and somestudents likely have more natural abilities than others.)
• How was effort involved? (Effort to figure things out, find trades, and keepplaying had an effect on the outcomes.)
Unit 1: Thinking Economically Lesson 1A: The Wealth Game—Factors for Success
Making Personal Finance Decisions©2019, Minnesota Council on Economic Education. Developed in partnership with the Federal Reserve Bank of St. Louis.
Permission is granted to reprint or photocopy this lesson in its entirety for educational purposes, 4 provided the user credits the Minnesota Council on Economic Education.
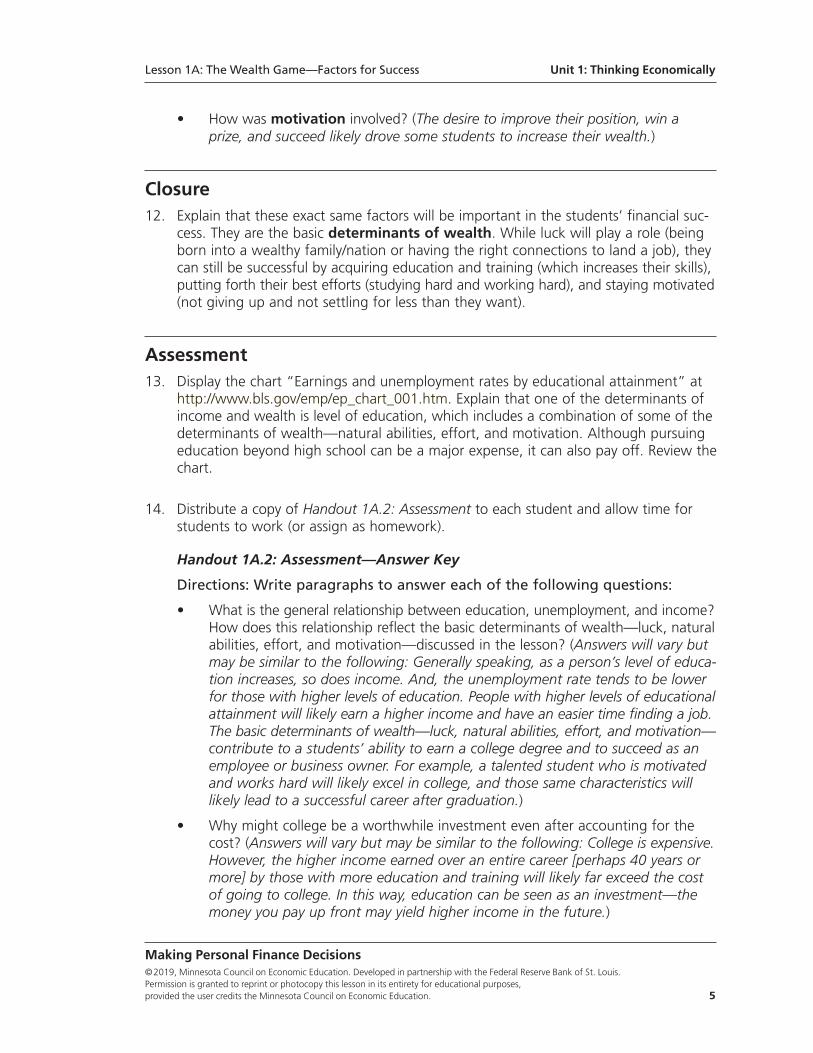
• How was motivation involved? (The desire to improve their position, win aprize, and succeed likely drove some students to increase their wealth.)
Closure12. Explain that these exact same factors will be important in the students’ financial suc-
cess. They are the basic determinants of wealth. While luck will play a role (beingborn into a wealthy family/nation or having the right connections to land a job), theycan still be successful by acquiring education and training (which increases their skills),putting forth their best efforts (studying hard and working hard), and staying motivated(not giving up and not settling for less than they want).
Assessment13. Display the chart “Earnings and unemployment rates by educational attainment” at
http://www.bls.gov/emp/ep_chart_001.htm. Explain that one of the determinants ofincome and wealth is level of education, which includes a combination of some of thedeterminants of wealth—natural abilities, effort, and motivation. Although pursuingeducation beyond high school can be a major expense, it can also pay off. Review thechart.
14. Distribute a copy of Handout 1A.2: Assessment to each student and allow time forstudents to work (or assign as homework).
Handout 1A.2: Assessment—Answer Key
Directions: Write paragraphs to answer each of the following questions:
• What is the general relationship between education, unemployment, and income?How does this relationship reflect the basic determinants of wealth—luck, naturalabilities, effort, and motivation—discussed in the lesson? (Answers will vary butmay be similar to the following: Generally speaking, as a person’s level of educa-tion increases, so does income. And, the unemployment rate tends to be lowerfor those with higher levels of education. People with higher levels of educationalattainment will likely earn a higher income and have an easier time finding a job.The basic determinants of wealth—luck, natural abilities, effort, and motivation—contribute to a students’ ability to earn a college degree and to succeed as anemployee or business owner. For example, a talented student who is motivatedand works hard will likely excel in college, and those same characteristics willlikely lead to a successful career after graduation.)
• Why might college be a worthwhile investment even after accounting for thecost? (Answers will vary but may be similar to the following: College is expensive.However, the higher income earned over an entire career [perhaps 40 years ormore] by those with more education and training will likely far exceed the costof going to college. In this way, education can be seen as an investment—themoney you pay up front may yield higher income in the future.)
Lesson 1A: The Wealth Game—Factors for Success Unit 1: Thinking Economically
Making Personal Finance Decisions©2019, Minnesota Council on Economic Education. Developed in partnership with the Federal Reserve Bank of St. Louis. Permission is granted to reprint or photocopy this lesson in its entirety for educational purposes, provided the user credits the Minnesota Council on Economic Education. 5
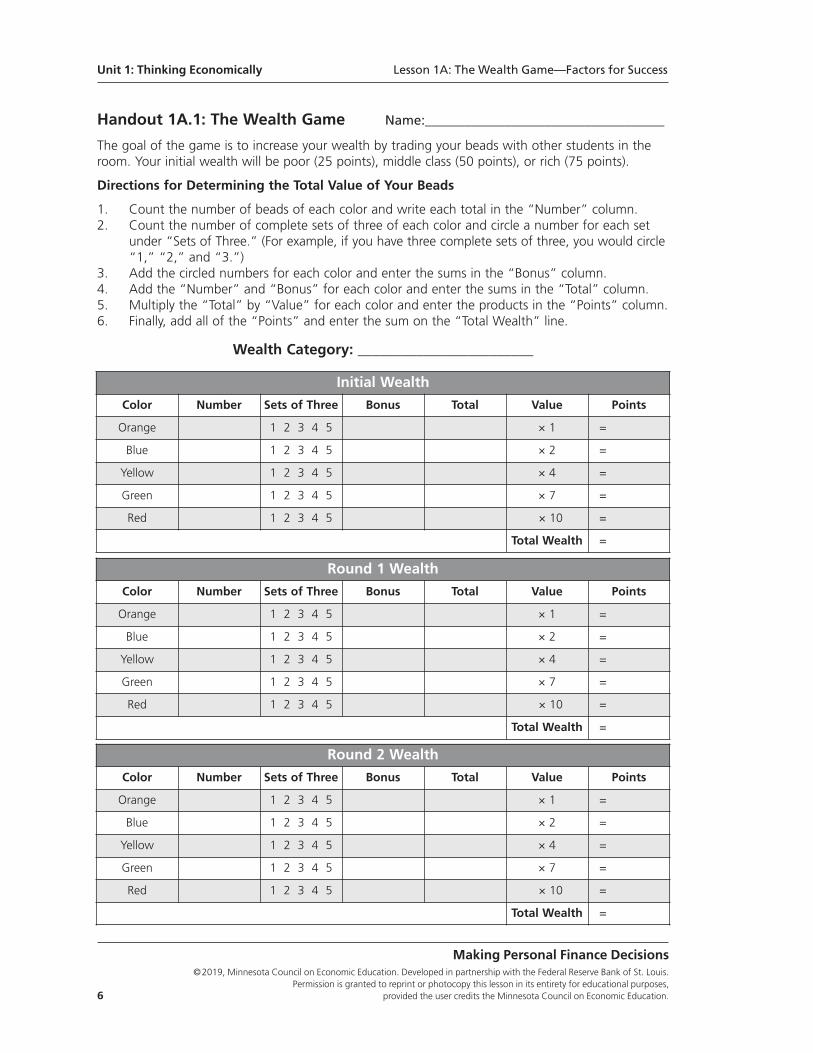
Handout 1A.1: The Wealth Game Name:____________________________________
The goal of the game is to increase your wealth by trading your beads with other students in theroom. Your initial wealth will be poor (25 points), middle class (50 points), or rich (75 points).
Directions for Determining the Total Value of Your Beads
1. Count the number of beads of each color and write each total in the “Number” column.2. Count the number of complete sets of three of each color and circle a number for each set
under “Sets of Three.” (For example, if you have three complete sets of three, you would circle“1,” “2,” and “3.”)
3. Add the circled numbers for each color and enter the sums in the “Bonus” column.4. Add the “Number” and “Bonus” for each color and enter the sums in the “Total” column.5. Multiply the “Total” by “Value” for each color and enter the products in the “Points” column.6. Finally, add all of the “Points” and enter the sum on the “Total Wealth” line.
Wealth Category: ________________________
Unit 1: Thinking Economically Lesson 1A: The Wealth Game—Factors for Success
Making Personal Finance Decisions©2019, Minnesota Council on Economic Education. Developed in partnership with the Federal Reserve Bank of St. Louis.
Permission is granted to reprint or photocopy this lesson in its entirety for educational purposes, 6 provided the user credits the Minnesota Council on Economic Education.
Initial Wealth
Color Number Sets of Three Bonus Total Value Points
Orange 1 2 3 4 5 × 1 =
Blue 1 2 3 4 5 × 2 =
Yellow 1 2 3 4 5 × 4 =
Green 1 2 3 4 5 × 7 =
Red 1 2 3 4 5 × 10 =
Total Wealth =
Round 1 Wealth
Color Number Sets of Three Bonus Total Value Points
Orange 1 2 3 4 5 × 1 =
Blue 1 2 3 4 5 × 2 =
Yellow 1 2 3 4 5 × 4 =
Green 1 2 3 4 5 × 7 =
Red 1 2 3 4 5 × 10 =
Total Wealth =
Round 2 Wealth
Color Number Sets of Three Bonus Total Value Points
Orange 1 2 3 4 5 × 1 =
Blue 1 2 3 4 5 × 2 =
Yellow 1 2 3 4 5 × 4 =
Green 1 2 3 4 5 × 7 =
Red 1 2 3 4 5 × 10 =
Total Wealth =
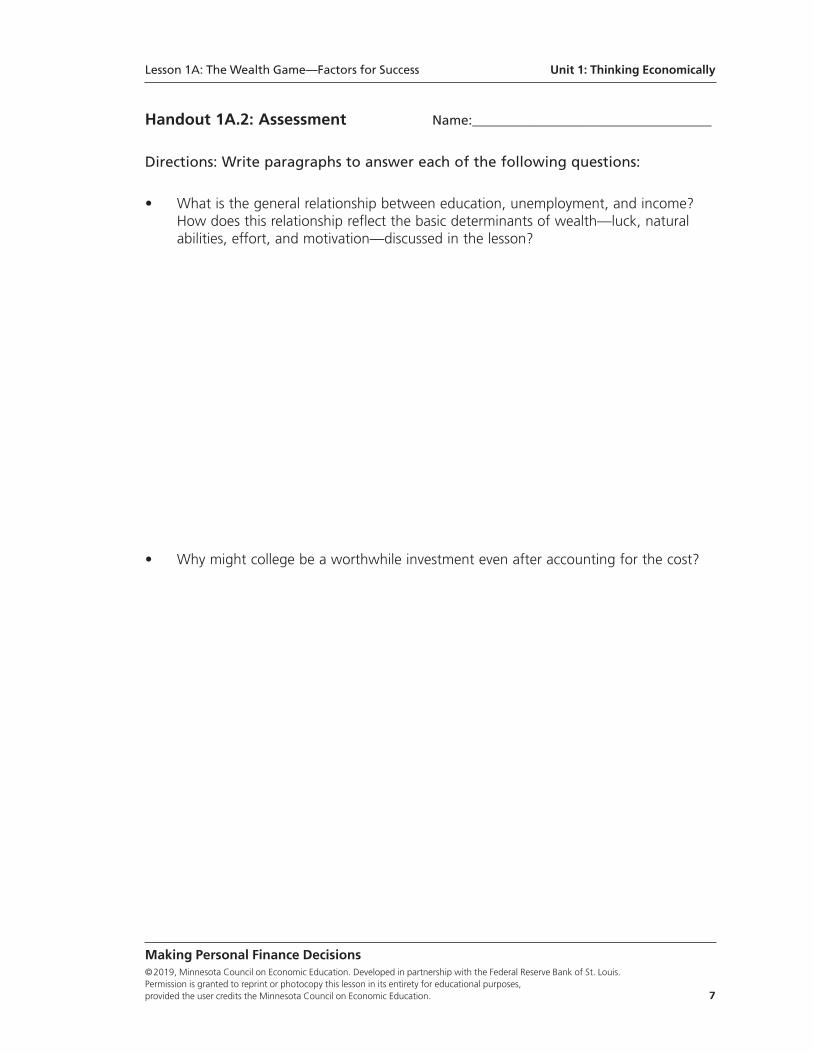
Handout 1A.2: Assessment Name:____________________________________
Directions: Write paragraphs to answer each of the following questions:
• What is the general relationship between education, unemployment, and income?How does this relationship reflect the basic determinants of wealth—luck, naturalabilities, effort, and motivation—discussed in the lesson?
• Why might college be a worthwhile investment even after accounting for the cost?
Lesson 1A: The Wealth Game—Factors for Success Unit 1: Thinking Economically
Making Personal Finance Decisions©2019, Minnesota Council on Economic Education. Developed in partnership with the Federal Reserve Bank of St. Louis. Permission is granted to reprint or photocopy this lesson in its entirety for educational purposes, provided the user credits the Minnesota Council on Economic Education. 7
Unit 1: Thinking Economically Lesson 1A: The Wealth Game—Factors for Success
Making Personal Finance Decisions©2019, Minnesota Council on Economic Education. Developed in partnership with the Federal Reserve Bank of St. Louis.
Permission is granted to reprint or photocopy this lesson in its entirety for educational purposes, 8 provided the user credits the Minnesota Council on Economic Education.
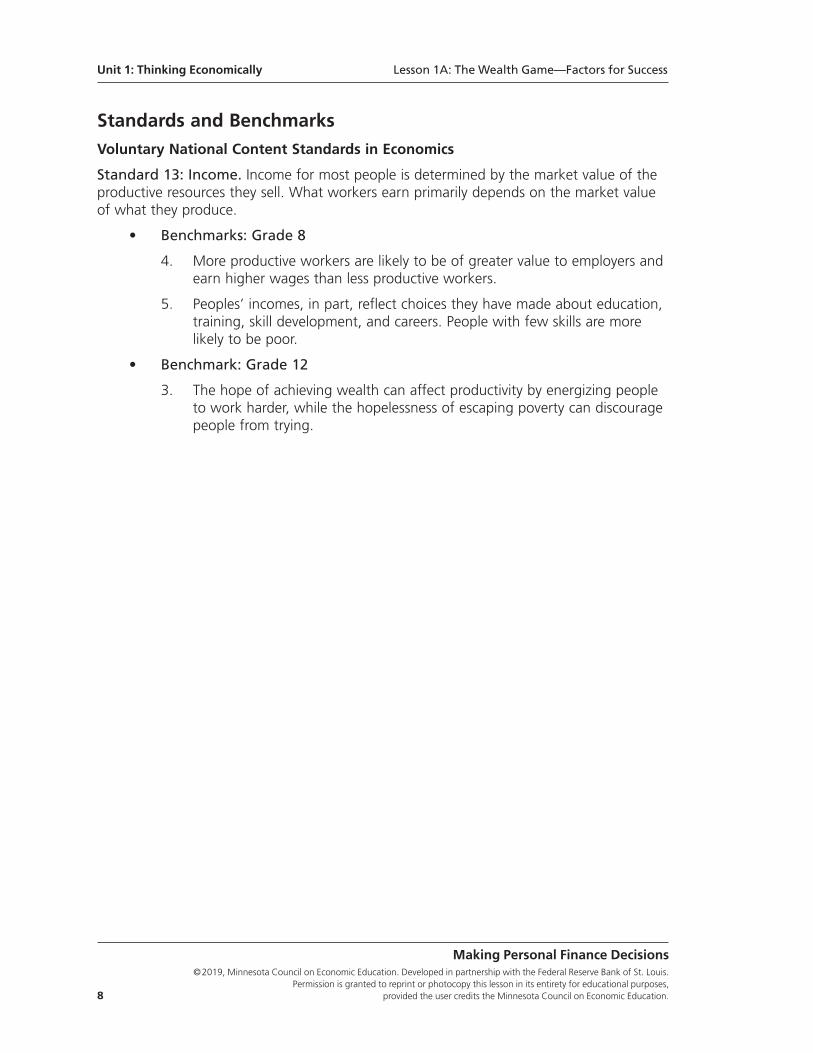
Standards and BenchmarksVoluntary National Content Standards in Economics
Standard 13: Income. Income for most people is determined by the market value of theproductive resources they sell. What workers earn primarily depends on the market valueof what they produce.
• Benchmarks: Grade 8
4. More productive workers are likely to be of greater value to employers and earn higher wages than less productive workers.
5. Peoples’ incomes, in part, reflect choices they have made about education, training, skill development, and careers. People with few skills are more likely to be poor.
• Benchmark: Grade 12
3. The hope of achieving wealth can affect productivity by energizing people to work harder, while the hopelessness of escaping poverty can discourage people from trying.
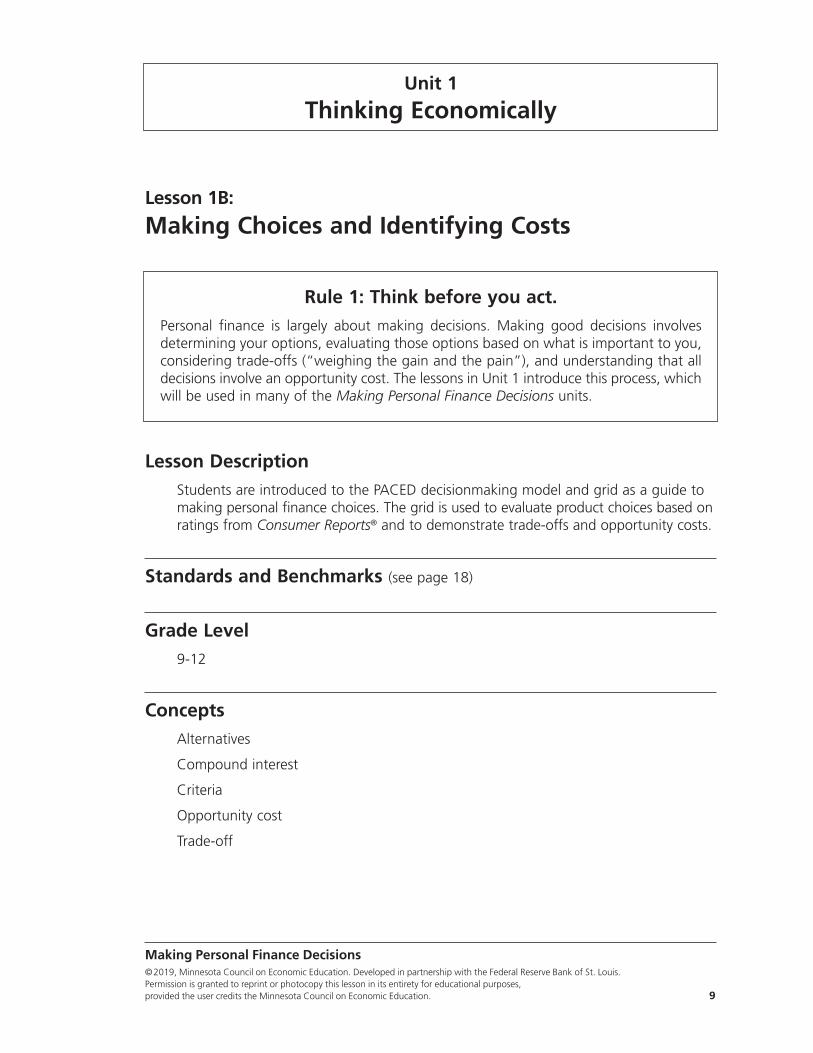
Lesson 1B:
Making Choices and Identifying Costs
Lesson DescriptionStudents are introduced to the PACED decisionmaking model and grid as a guide tomaking personal finance choices. The grid is used to evaluate product choices based onratings from Consumer Reports® and to demonstrate trade-offs and opportunity costs.
Standards and Benchmarks (see page 18)
Grade Level9-12
ConceptsAlternatives
Compound interest
Criteria
Opportunity cost
Trade-off
Making Personal Finance Decisions©2019, Minnesota Council on Economic Education. Developed in partnership with the Federal Reserve Bank of St. Louis. Permission is granted to reprint or photocopy this lesson in its entirety for educational purposes, provided the user credits the Minnesota Council on Economic Education. 9
Rule 1: Think before you act.Personal finance is largely about making decisions. Making good decisions involvesdetermining your options, evaluating those options based on what is important to you,considering trade-offs (“weighing the gain and the pain”), and understanding that alldecisions involve an opportunity cost. The lessons in Unit 1 introduce this process, whichwill be used in many of the Making Personal Finance Decisions units.
Unit 1
Thinking Economically
Compelling QuestionHow can a decisionmaking process help you make informed decisions?
ObjectivesStudents will be able to
• describe the five steps of the PACED decisionmaking model and illustrate it witha grid and
• distinguish the trade-offs associated with making choices by identifying opportu-nity costs of choices.
Materials• “Smart” by Shel Silverstein (The poem is in Where the Sidewalk Ends
[HarperCollins, 1974] and can be easily found with an internet search)
• Visual 1B.1: PACED Decisionmaking Model
• Visual 1B.2: Smoke or Be a Millionaire?
• Handout 1B.1: Assessment, one copy for each student and one copy for theteacher to use as a visual
• A product rating table copied from Consumer Reports to display for the class orcopies of such tables to be distributed to students
Time Required45 minutes
Procedure1. Read the poem, “Smart,” to the class. (This short poem humorously shows how a boy
turns a dollar given to him by his father into five pennies by making some questionablechoices.) Discuss the following:
• Did the boy think he had made good decisions when he traded? (Yes, the boythought his decisions were smart.)
• Did he make good decisions? (Most students will recognize that he clearly did not.)
2. Explain that there is a process that can help the students think through options to helpthem make good decisions.
3. Display Visual 1B.1: PACED Decisionmaking Model. Explain that PACED is an acronymfor the five steps: Problem, Alternatives, Criteria, Evaluation, and Decision. Discuss
Making Personal Finance Decisions©2019, Minnesota Council on Economic Education. Developed in partnership with the Federal Reserve Bank of St. Louis.
Permission is granted to reprint or photocopy this lesson in its entirety for educational purposes, 10 provided the user credits the Minnesota Council on Economic Education.
Unit 1: Thinking Economically Lesson 1B: Making Choices and Identifying Costs
each step of the PACED decisionmaking model as described on the visual and definethe following as mentioned:
• Alternatives are the different possibilities to choose from in a given situation.
• Criteria are a set of standards to consider when choosing among alternatives.Criteria are the things important to you when making a decision.
4. Display Handout 1B.1: Assessment. Explain that the grid illustrates the PACED decision-making model as follows:
• The problem is stated at the top.
• The alternatives are listed in the rows down the left side, while the criteria arelisted in the columns across the top.
• In each cell in the grid (where a row intersects a column), you evaluate how welleach alternative satisfies each criterion.
• This evaluation can be represented in different ways. For example, you could entera plus sign (+) if an alternative satisfies a criterion or a minus sign (–) if it doesn’t.You could also use a numerical rating system.
• Filling out the grid when you make a decision can help you decide which alter-native is the best choice.
5. Show a product rating from Consumer Reports (or distribute copies of such tables).Explain that these tables are examples of the PACED model:
• The problem for consumers is which model of a particular product they should buy.
• Along the left side of the table you see the alternatives. These are typically thevarious models or brands of a given product.
• Along the top of the table you see criteria that are factors consumers mightconsider important in ranking the alternatives.
• The cells of the table show how well each alternative meets each criterion accord-ing to some system of measurement. Some evaluations use colored circles andothers simply list the relevant data—price, size, and so on. These evaluations arebased on Consumer Reports tests (which are described at the bottom of thetable or in the accompanying article).
6. Discuss the following:
• Given this table and all its information, does everyone make the same choice?(Answers will vary, but most students will realize that they do not.)
• Why don’t people make the same choice? (People do not necessarily weight allthe criteria the same. Some may only be looking for the lowest price, others maybe looking for the highest quality rating, while others may consider two or moreof the criteria.)
Making Personal Finance Decisions©2019, Minnesota Council on Economic Education. Developed in partnership with the Federal Reserve Bank of St. Louis. Permission is granted to reprint or photocopy this lesson in its entirety for educational purposes, provided the user credits the Minnesota Council on Economic Education. 11
Lesson 1B: Making Choices and Identifying Costs Unit 1: Thinking Economically
7. Explain the following:
• The PACED decisionmaking grid allows people to consider the trade-offs involvedin their decisions.
• A trade-off exists when you give up some of one thing in order to gain someof something else. For example, in choosing a car, Model A might give you bet-ter gas mileage than Model B, but Model B might give you more horsepower ormore room.
• The evaluation in the body of the grid helps point out the trade-offs so that thedecision comes down to which alternative is more valuable to you. For example,better gas mileage or more horsepower or room?
• The choice depends on each person’s own tastes and preferences—some mightvalue better gas mileage, while others might value the extra horsepower or room.
• So, people end up making different choices, even though they may be lookingat the same trade-offs.
• Informed decisionmaking is not about finding the right choice for everyone, butidentifying and considering the relevant trade-offs and making the right choicefor you.
8. Define opportunity cost as the value of the next-best alternative when a decision ismade; it’s what is given up. Explain that in the earlier example, if you had chosen thecar with the better gas mileage, you would have given up the opportunity to enjoythe greater horsepower and room of the other model. Every time you make a choice,you have an opportunity cost. Discuss the following:
• What is the opportunity cost of you being in school today? (Answers will vary, buttheir opportunity cost would be whatever they would have chosen to do insteadof being in school—playing video games, hanging out with friends, going to amovie marathon, and so on.)
• Remind students that the benefit of being in school—learning new things anddeveloping valuable skills—is worth this cost!
9. Tell the students they are going to practice identifying opportunity costs. Discuss thefollowing scenarios:
• What is the opportunity cost of buying a new video game? (When you use yourmoney to buy a video game, you give up the opportunity to purchase other goodsand/or services with that money. The next-best goods and/or services you couldhave spent that money on would be the opportunity cost of the new game.)
• What is the opportunity cost of not paying your bills on time? (You lose theopportunity to have a good credit score and will end up paying higher interestrates on loans in the future. And, you give up the goods and services you mighthave purchased with the money you pay in penalties and fees.)
Making Personal Finance Decisions©2019, Minnesota Council on Economic Education. Developed in partnership with the Federal Reserve Bank of St. Louis.
Permission is granted to reprint or photocopy this lesson in its entirety for educational purposes, 12 provided the user credits the Minnesota Council on Economic Education.
Unit 1: Thinking Economically Lesson 1B: Making Choices and Identifying Costs
• What is the opportunity cost of spending your money now instead of saving?(You lose the opportunity to purchase even more goods and services later.)
10. Explain that in each of these decisions something is gained (education, video game,more money from not paying bills, and enjoying goods and services now), but some-thing is also lost. That loss is the opportunity cost, and it is important to consider if itis worth the gain in each case. Discuss the following:
• What is the opportunity cost of smoking? (Clearly there are health consequencesand a potentially shorter life span.)
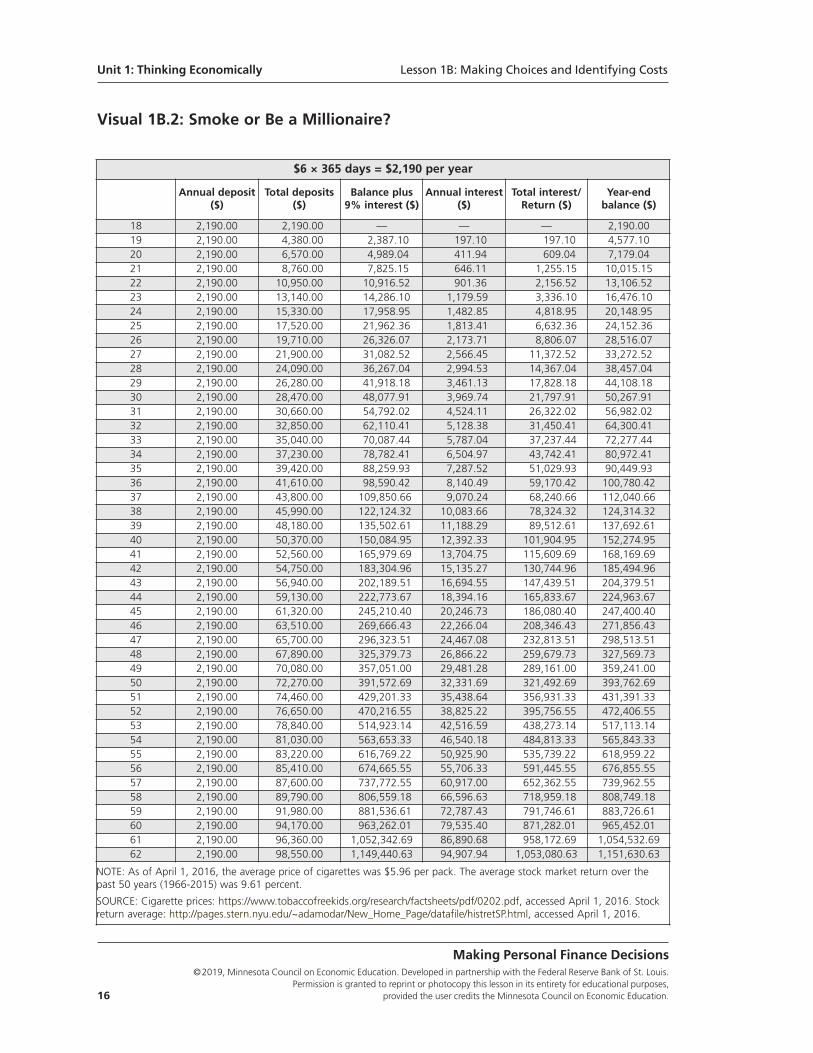
11. Display Visual 1B.2: Smoke or Be a Millionaire? Explain that when someone choosesto smoke, he or she may be giving up the opportunity to be a millionaire. The tableshows what would happen if, instead of starting to smoke one pack of cigarettes perday at age 18 (spending $6.00 per pack), a person saved that amount and invested itat a 9 percent annual interest rate and continued to do so until age 62 (a popularretirement age). This person would end up a millionaire by age 61 (and lower the riskfrom dying earlier) just by not smoking. Discuss the following:
• How much is deposited per year? ($2,190.00)
• After 45 years (age 62), how much money has been deposited? ($98,550.00)
• How much money is in the account at age 62, after 45 years of saving?($1,151,630.63)
• Where did the $1,053,080.63 difference between the amount deposited andthe final balance come from? (Interest, more specifically compound interest)
• Explain that compound interest is interest computed on the sum of the originalprincipal and accrued interest. So, with compound interest, when the saver leavesthe money in the account, the saver earns money on all the money deposited,plus all the interest earned in prior years.
• The “Annual deposit” column represents the money saved and deposited inthe account. The “Annual interest” column represents the amount of interestthe account earns per year. At what age does the earned interest contributemore annually to the account than the saver does? (At age 27, the saver earns$2,566.45 in interest, which is more than the $2,190.00 deposited.)
• How much interest does the account generate the year the saver is age 62?($94,907.94)
• Note that given the rising price of a pack of cigarettes, if the smoker insteadsaved a higher amount, at the same interest rate, the smoker would become amillionaire sooner or reach a million dollars sooner—even if the interest rate wasless than 9 percent!
• Another opportunity cost of smoking could be losing the chance to be a millionaire.
• Considering all the opportunity costs, the benefits of smoking need to be larger
Making Personal Finance Decisions©2019, Minnesota Council on Economic Education. Developed in partnership with the Federal Reserve Bank of St. Louis. Permission is granted to reprint or photocopy this lesson in its entirety for educational purposes, provided the user credits the Minnesota Council on Economic Education. 13
Lesson 1B: Making Choices and Identifying Costs Unit 1: Thinking Economically
and larger to make it a good choice.
• Consider the opportunity cost of a $6.00 latte every day. If you saved the moneyinstead, at a 9 percent interest rate, you could also be a millionaire at 62!
Closure12. Explain that good decisionmaking is essential for managing your personal finances
well—that is, how you will save and spend your money. The rest of this course willcover the following topics to help the students better understand how to make goodfinancial decisions:
• Budgeting—how to plan saving and spending to live within your means
• Saving—why it’s important to start early and how money can grow
• Investing in human capital—how education can increase your income andreduce your likelihood of unemployment
• Entrepreneurship—what it takes to be a successful entrepreneur
• Taxes—what they are and why we pay them
• Spending—how to get the best value for your money
• Investing—the potential risks and rewards
• Using credit (borrowing)—when it might be a good idea (e.g., for schooling or ahome) and when to use caution
• Maintaining good credit—how to do it and why it’s important
Assessment13. Distribute a copy of Handout 1B.1: Assessment to each student and allow time for
students to work (or assign as homework).
14. After students complete Handout 1B.1, discuss the following:
• Did you find the PACED model helpful? (Answers will vary.)
• What is the opportunity cost of your decision? (It will be the next-best alternative.)
• What trade-offs did you make as a result of your decision? (Answers will vary.)
Making Personal Finance Decisions©2019, Minnesota Council on Economic Education. Developed in partnership with the Federal Reserve Bank of St. Louis.
Permission is granted to reprint or photocopy this lesson in its entirety for educational purposes, 14 provided the user credits the Minnesota Council on Economic Education.
Unit 1: Thinking Economically Lesson 1B: Making Choices and Identifying Costs
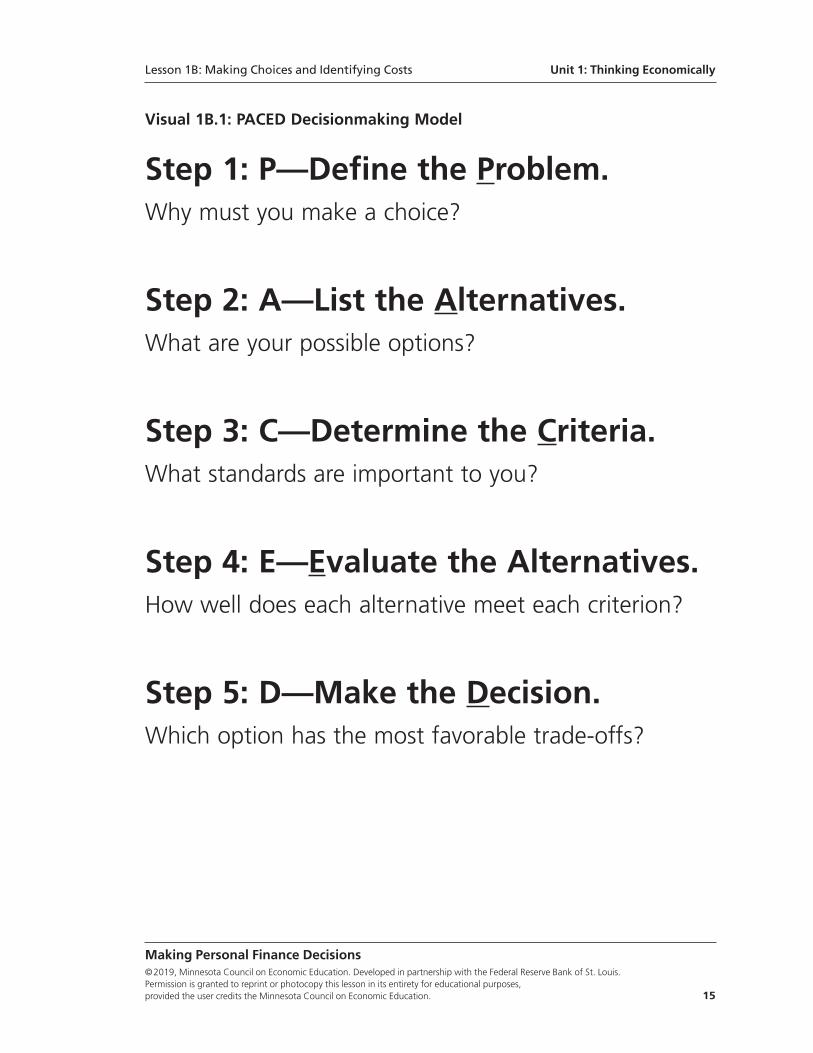
Visual 1B.1: PACED Decisionmaking Model
Step 1: P—Define the Problem.Why must you make a choice?
Step 2: A—List the Alternatives.What are your possible options?
Step 3: C—Determine the Criteria.What standards are important to you?
Step 4: E—Evaluate the Alternatives.How well does each alternative meet each criterion?
Step 5: D—Make the Decision.Which option has the most favorable trade-offs?
Making Personal Finance Decisions©2019, Minnesota Council on Economic Education. Developed in partnership with the Federal Reserve Bank of St. Louis. Permission is granted to reprint or photocopy this lesson in its entirety for educational purposes, provided the user credits the Minnesota Council on Economic Education. 15
Lesson 1B: Making Choices and Identifying Costs Unit 1: Thinking Economically
Visual 1B.2: Smoke or Be a Millionaire?
Making Personal Finance Decisions©2019, Minnesota Council on Economic Education. Developed in partnership with the Federal Reserve Bank of St. Louis.
Permission is granted to reprint or photocopy this lesson in its entirety for educational purposes, 16 provided the user credits the Minnesota Council on Economic Education.
$6 × 365 days = $2,190 per year
Annual deposit($)
Total deposits($)
Balance plus 9% interest ($)
Annual interest($)
Total interest/Return ($)
Year-end balance ($)
18 2,190.00 2,190.00 — — — 2,190.00 19 2,190.00 4,380.00 2,387.10 197.10 197.10 4,577.10 20 2,190.00 6,570.00 4,989.04 411.94 609.04 7,179.04 21 2,190.00 8,760.00 7,825.15 646.11 1,255.15 10,015.15 22 2,190.00 10,950.00 10,916.52 901.36 2,156.52 13,106.52 23 2,190.00 13,140.00 14,286.10 1,179.59 3,336.10 16,476.1024 2,190.00 15,330.00 17,958.95 1,482.85 4,818.95 20,148.95 25 2,190.00 17,520.00 21,962.36 1,813.41 6,632.36 24,152.36 26 2,190.00 19,710.00 26,326.07 2,173.71 8,806.07 28,516.07 27 2,190.00 21,900.00 31,082.52 2,566.45 11,372.52 33,272.52 28 2,190.00 24,090.00 36,267.04 2,994.53 14,367.04 38,457.04 29 2,190.00 26,280.00 41,918.18 3,461.13 17,828.18 44,108.18 30 2,190.00 28,470.00 48,077.91 3,969.74 21,797.91 50,267.91 31 2,190.00 30,660.00 54,792.02 4,524.11 26,322.02 56,982.02 32 2,190.00 32,850.00 62,110.41 5,128.38 31,450.41 64,300.41 33 2,190.00 35,040.00 70,087.44 5,787.04 37,237.44 72,277.44 34 2,190.00 37,230.00 78,782.41 6,504.97 43,742.41 80,972.41 35 2,190.00 39,420.00 88,259.93 7,287.52 51,029.93 90,449.93 36 2,190.00 41,610.00 98,590.42 8,140.49 59,170.42 100,780.42 37 2,190.00 43,800.00 109,850.66 9,070.24 68,240.66 112,040.66 38 2,190.00 45,990.00 122,124.32 10,083.66 78,324.32 124,314.32 39 2,190.00 48,180.00 135,502.61 11,188.29 89,512.61 137,692.61 40 2,190.00 50,370.00 150,084.95 12,392.33 101,904.95 152,274.95 41 2,190.00 52,560.00 165,979.69 13,704.75 115,609.69 168,169.69 42 2,190.00 54,750.00 183,304.96 15,135.27 130,744.96 185,494.96 43 2,190.00 56,940.00 202,189.51 16,694.55 147,439.51 204,379.51 44 2,190.00 59,130.00 222,773.67 18,394.16 165,833.67 224,963.67 45 2,190.00 61,320.00 245,210.40 20,246.73 186,080.40 247,400.40 46 2,190.00 63,510.00 269,666.43 22,266.04 208,346.43 271,856.43 47 2,190.00 65,700.00 296,323.51 24,467.08 232,813.51 298,513.51 48 2,190.00 67,890.00 325,379.73 26,866.22 259,679.73 327,569.73 49 2,190.00 70,080.00 357,051.00 29,481.28 289,161.00 359,241.00 50 2,190.00 72,270.00 391,572.69 32,331.69 321,492.69 393,762.69 51 2,190.00 74,460.00 429,201.33 35,438.64 356,931.33 431,391.33 52 2,190.00 76,650.00 470,216.55 38,825.22 395,756.55 472,406.55 53 2,190.00 78,840.00 514,923.14 42,516.59 438,273.14 517,113.14 54 2,190.00 81,030.00 563,653.33 46,540.18 484,813.33 565,843.33 55 2,190.00 83,220.00 616,769.22 50,925.90 535,739.22 618,959.22 56 2,190.00 85,410.00 674,665.55 55,706.33 591,445.55 676,855.55 57 2,190.00 87,600.00 737,772.55 60,917.00 652,362.55 739,962.55 58 2,190.00 89,790.00 806,559.18 66,596.63 718,959.18 808,749.18 59 2,190.00 91,980.00 881,536.61 72,787.43 791,746.61 883,726.61 60 2,190.00 94,170.00 963,262.01 79,535.40 871,282.01 965,452.01 61 2,190.00 96,360.00 1,052,342.69 86,890.68 958,172.69 1,054,532.69 62 2,190.00 98,550.00 1,149,440.63 94,907.94 1,053,080.63 1,151,630.63
NOTE: As of April 1, 2016, the average price of cigarettes was $5.96 per pack. The average stock market return over thepast 50 years (1966-2015) was 9.61 percent.
SOURCE: Cigarette prices: https://www.tobaccofreekids.org/research/factsheets/pdf/0202.pdf, accessed April 1, 2016. Stockreturn average: http://pages.stern.nyu.edu/~adamodar/New_Home_Page/datafile/histretSP.html, accessed April 1, 2016.
Unit 1: Thinking Economically Lesson 1B: Making Choices and Identifying Costs
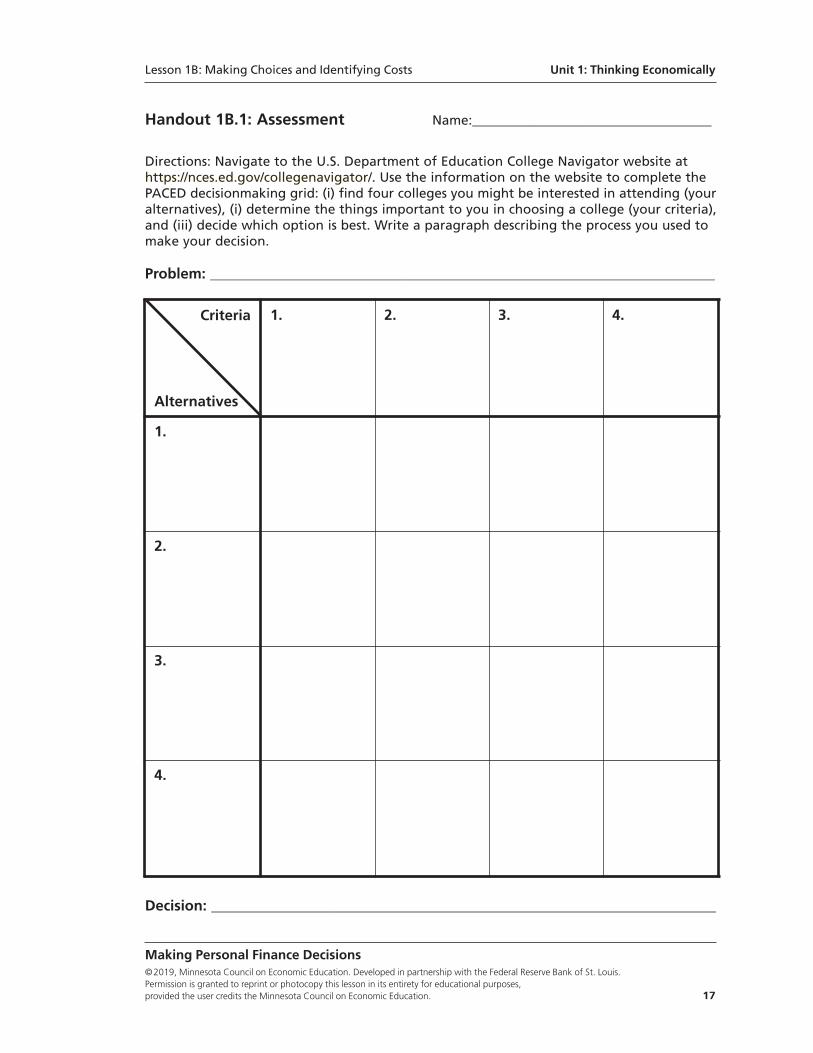
Handout 1B.1: Assessment Name:____________________________________
Directions: Navigate to the U.S. Department of Education College Navigator website athttps://nces.ed.gov/collegenavigator/. Use the information on the website to complete thePACED decisionmaking grid: (i) find four colleges you might be interested in attending (youralternatives), (i) determine the things important to you in choosing a college (your criteria),and (iii) decide which option is best. Write a paragraph describing the process you used tomake your decision.
Problem: _____________________________________________________________________
Decision: _____________________________________________________________________
Making Personal Finance Decisions©2019, Minnesota Council on Economic Education. Developed in partnership with the Federal Reserve Bank of St. Louis. Permission is granted to reprint or photocopy this lesson in its entirety for educational purposes, provided the user credits the Minnesota Council on Economic Education. 17
1. 2. 3. 4.
1.
2.
3.
4.
Criteria
Alternatives
Lesson 1B: Making Choices and Identifying Costs Unit 1: Thinking Economically
Standard and BenchmarksNational Standards for Financial Literacy
Standard 2: Buying Goods and Services. People cannot buy or make all the goods andservices they want; as a result, people choose to buy some goods and services but not others.People can improve their economic well-being by making informed spending decisions,which entails collecting information, planning, and budgeting.
• Benchmark: Grade 4
4. Whenever people buy something, they incur an opportunity cost. Opportunitycost is the value of the next-best alternative that is given up when a personmakes a choice.
• Benchmark: Grade 12
3. When buying a good, consumers may consider various aspects of the product including the product’s features. For goods that last for a longer period of time, the consumer should consider the product’s durability and maintenance costs.
Voluntary National Content Standards in Economics
Standard 1: Scarcity. Productive resources are limited. Therefore, people cannot have allthe goods and services they want; as a result, they must choose some things and give upothers.
• Benchmarks: Grade 8
2. Making good choices should involve trading off the expected value of one opportunity against the expected value of its best alternative.
4. The evaluation of choices and opportunity costs is subjective; such evaluationsdiffer across individuals and societies.
Standard 2: Decision Making. Effective decision making requires comparing the additionalcosts of alternatives with the additional benefits. Many choices involve doing a little moreor a little less of something: few choices are “all or nothing” decisions.
• Benchmarks: Grade 4
1. Choices involve getting more of one thing by giving up something else.
2. A cost is what you give up when you decide to do something. A benefit is what satisfies your wants.
Making Personal Finance Decisions©2019, Minnesota Council on Economic Education. Developed in partnership with the Federal Reserve Bank of St. Louis.
Permission is granted to reprint or photocopy this lesson in its entirety for educational purposes, 18 provided the user credits the Minnesota Council on Economic Education.
Unit 1: Thinking Economically Lesson 1B: Making Choices and Identifying Costs
Lesson 2A:
The Inventory Game—Net Worth and Cash Flow
Lesson DescriptionStudents physically move into and out of a “wallet” (a specified area in the room)and note the change in the number of students in the wallet over time, as well as theinflow and outflow rates. This demonstration is then related to the stock (an amountat a point in time) concepts of assets and liabilities and the flow (an amount per unitof time) concepts of income and expenses. Students use this distinction to determinenet worth, cash flow, and the relationship between them.
Standards and Benchmarks (see page 35)
Grade Level9-12
ConceptsAssetsCash flowExpensesFlowsIncomeLiabilitiesNet worthStocks
Unit 2
Planning and Tracking
Making Personal Finance Decisions©2019, Minnesota Council on Economic Education. Developed in partnership with the Federal Reserve Bank of St. Louis. Permission is granted to reprint or photocopy this lesson in its entirety for educational purposes, provided the user credits the Minnesota Council on Economic Education. 19
Rule 2: Have a Plan.Financial success depends primarily on two things: (i) developing a plan to meet yourestablished goals and (ii) tracking your progress with respect to that plan. Too often peo-ple set vague goals (“I want to be rich.”), make unrealistic plans, or never bother to assessthe progress toward their goals. These lessons look at important financial indicators youshould understand and monitor both in setting goals and attaining them.
Compelling QuestionHow do cash inflows and outflows affect a person’s net worth?
ObjectivesStudents will be able to
• distinguish between stock and flow concepts,
• describe net worth as the value of a person’s assets minus the value of the indi-vidual’s liabilities at a point in time,
• provide examples of assets and liabilities,
• describe cash flow as the difference between a person’s income and expensesover a given period, and
• provide examples of income and expenses over a given period.
Materials• Handout 2A.1: Classroom Station Signs, one copy cut into signs
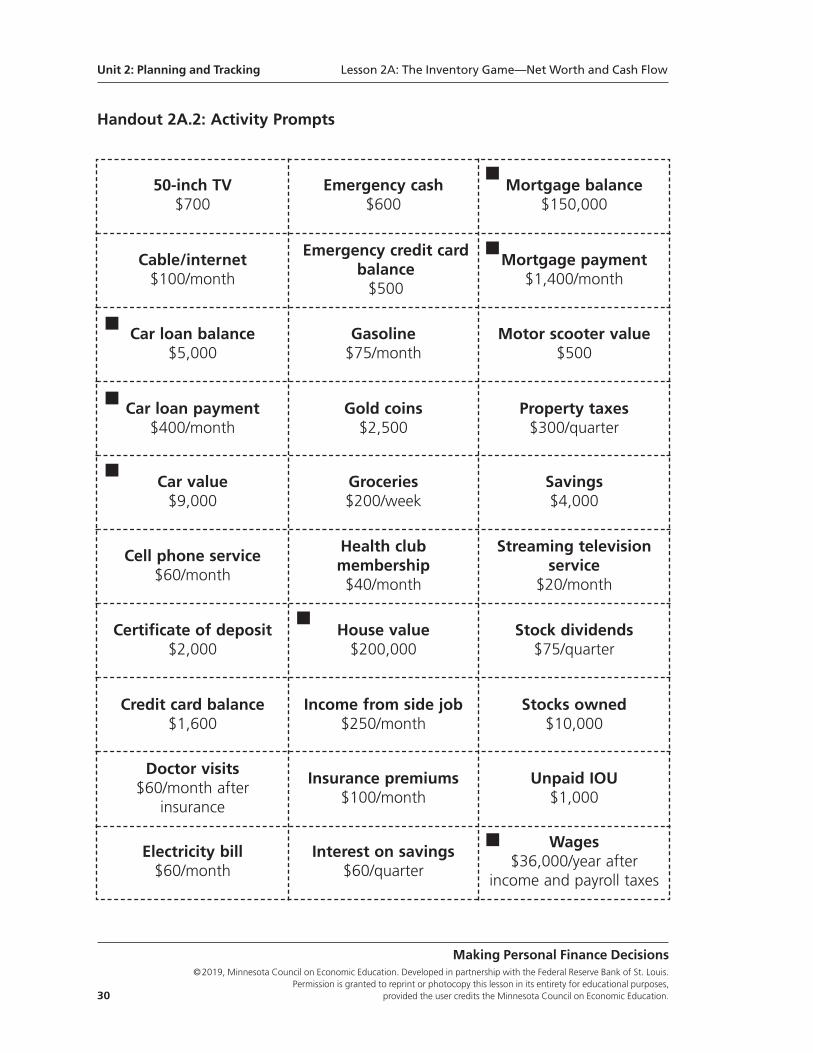
• Handout 2A.2: Activity Prompts, one copy cut into cards
• Handout 2A.3: Net Worth and Cash Flow, one copy for each student
• Handout 2A.3: Net Worth and Cash Flow—Answer Key
• Handout 2A.4: Assessment, one copy for each student
• Two timekeeping devices or a classroom clock that tracks seconds
• Masking tape to mark off an area on the classroom floor
• “IN” sign and “OUT” sign
Time Required45 minutes
PreparationUsing masking tape, mark off an area of the classroom large enough to hold one-thirdto one-half of the students in the class. Mark an entrance on one side of this areawith an “IN” sign and an exit on the opposite side with an “OUT” sign.
Unit 2: Planning and Tracking Lesson 2A: The Inventory Game—Net Worth and Cash Flow
Making Personal Finance Decisions©2019, Minnesota Council on Economic Education. Developed in partnership with the Federal Reserve Bank of St. Louis.
Permission is granted to reprint or photocopy this lesson in its entirety for educational purposes, 20 provided the user credits the Minnesota Council on Economic Education.
Procedure1. Tell students the designated (taped-off) area is a wallet. Explain the following:
• The class will be investigating the effect on the number of dollars in the wallet asa result of changing the rate at which dollars move into and out of the wallet.
• There will be five separate rounds of two minutes each.
• Each student represents one dollar.
• There will be two timekeepers, one at the “IN” entrance and one at the “OUT”exit.
• The timekeepers will tell students when to move into or out of the wallet bysaying “IN” or “OUT” at designated time intervals.
• Once students move out of the wallet, they are to get back in the line at the “IN”entrance.
• The same number of students (dollars) will start in the wallet at the beginning ofeach round.
2. Move students into position as follows:
• Have one-third to one-half of the students in the class stand in the wallet.(Remember, you will start each round with the same number of students/dollarsin the wallet.)
• Note the number of students in the wallet by writing it on the board.
• Assign one student with a watch (or view of a clock) to stand at the “IN” signand another student with a watch (or view of a clock) to stand at the “OUT” sign.
• Have the remainder of the class form a single-file line outside the “IN” entrance.
3. At the beginning of each two-minute round, tell the timekeepers the following timeintervals for the given round (the numbers in parentheses are the expected change inthe number of students in the wallet during that round). At the end of each round,record on the board the number of students in the wallet. (Option: Complete onlythe first four rounds and have the students predict the results of the fifth round giventhe rates already recorded.)
Round 1 IN: One every 12 seconds
OUT:One every 12 seconds
(0)
Round 2 IN: One every 10 seconds
OUT:One every 12 seconds
(+2)
Lesson 2A: The Inventory Game—Net Worth and Cash Flow Unit 2: Planning and Tracking
Making Personal Finance Decisions©2019, Minnesota Council on Economic Education. Developed in partnership with the Federal Reserve Bank of St. Louis. Permission is granted to reprint or photocopy this lesson in its entirety for educational purposes, provided the user credits the Minnesota Council on Economic Education. 21
Round 3 IN: One every 10 seconds
OUT: One every 15 seconds
(+4)
Round 4 IN: One every 15 seconds
OUT: One every 10 seconds
(–4)
Round 5 IN: Three every 20 seconds
OUT: Two every 10 seconds
(–6)
4. After the final round, discuss the following:
• What impact did changing the inflow and outflow rate of students/dollars haveon the number of students/dollars in the wallet? (When the inflow rate exceedsthe outflow rate [Rounds 2 and 3], the number of students/dollars in the walletgrows; conversely, when the outflow rate exceeds the inflow rate, the numberof students/dollars in the wallet falls [Rounds 4 and 5]. When the inflow andoutflow rates are equal, the number of students/dollars in the wallet remainsunchanged [Round 1].)
5. Explain that the wallet demonstration illustrated two economics concepts: flows andstocks. Flows are based on units of time. For example, a given number of students/dollars flowed into the wallet each minute. Stocks are the inventory, or stock, of dollarsat a given time. In this case, the stocks are the number of the students/dollars in thewallet at any given time.
6. Discuss the following:
• What are some examples of an inflow of money? (Answers will vary, but use thefollowing as an example: A person’s income from working—for example, $500per week—or the interest he or she earns on his or her savings account—for exam-ple, $50 per quarter—would be inflow. Note the time element of these payments.)
• What are some examples of an outflow of money? (Answers will vary, but usethe following as an example: Expenditures that a person makes—for example, acell phone bill of $40 per month, a rental payment of $400 per month, or an autoinsurance payment of $300 every six months—would be outflows. Again, empha-size the time element involved in these payments.)
7. Explain that the dollars in the wallet represent a person’s wealth. What does thedemonstration suggest about how you can grow your wealth over time? (Your inflow—or income—needs to exceed your outflows, or expenditures.)
Unit 2: Planning and Tracking Lesson 2A: The Inventory Game—Net Worth and Cash Flow
Making Personal Finance Decisions©2019, Minnesota Council on Economic Education. Developed in partnership with the Federal Reserve Bank of St. Louis.
Permission is granted to reprint or photocopy this lesson in its entirety for educational purposes, 22 provided the user credits the Minnesota Council on Economic Education.
8. Explain the following:
• Your wealth is typically measured by your net worth. Net worth is the value ofa person’s assets minus the value of his or her liabilities. Your assets are thingsthat you own such as a house, stocks, bonds, jewelry, cars, money in a savingsaccount, or cash.
• Your liabilities are things you owe, such as unpaid bills, a mortgage, a car loan,or unpaid taxes.
• Your cash flow is defined as your income (dollars coming in, usually from work-ing) minus your expenses (dollars going out, usually to buy goods and services).Since income and expenses are both flows, they often have a time elementassociated with them. If your cash flow is positive—that is, your income exceedsyour expenses over a given period—then, as the wallet demonstration showed,your net worth will tend to rise. Conversely, if your cash flow is negative, yournet worth will tend to fall.
• An important element of financial planning is keeping track of these two things:your net worth (a statement of your assets and liabilities) and your cash flow(your monthly budget or flow of funds).
9. Tape the signs (expenses, income, assets, and liabilities) from Handout 2A:1: ClassroomStation Signs in the four corners of the room.
10. Distribute one prompt card from Handout 2A:2: Activity Prompts to each student.NOTE: All prompts do not need to be used, but be sure to use all of the prompts witha black square. Instruct the students to read the prompt received, then think aboutwhether the text describes an expense, income, asset, or liability. After they decide,they should stand by the sign that best describes what is printed on their prompt.
11. Once students have found their stations, explain that all of the cards together representthe expenses, income, assets, and liabilities of one person. Have each student readwhat is printed on his or her prompt and explain why he or she chose the sign theyare standing by. If students are standing by the wrong sign, ask the other studentsfor guidance.
Lesson 2A: The Inventory Game—Net Worth and Cash Flow Unit 2: Planning and Tracking
Making Personal Finance Decisions©2019, Minnesota Council on Economic Education. Developed in partnership with the Federal Reserve Bank of St. Louis. Permission is granted to reprint or photocopy this lesson in its entirety for educational purposes, provided the user credits the Minnesota Council on Economic Education. 23
12. Instruct the groups to now calculate a total for their category. Remind the studentsthat some income and expenses will need to be converted to monthly values. Theinformation will then be used to calculate the person’s net worth and cash flow.
13. Allow time for the groups to work, then write “Net worth = Assets – Liabilities” and“Cash flow = Income – Expenses” on the board. Discuss the following:
• What are the person’s total assets and total liabilities? (If all prompts were used,as shown above, the total assets are $229,300 and total liabilities are $158,100.However, answers will vary depending on how many and which prompts wereused.)
• What is this person’s net worth? (If all prompts were used, $229,300 – $158,100= $71,200.)
Unit 2: Planning and Tracking Lesson 2A: The Inventory Game—Net Worth and Cash Flow
Making Personal Finance Decisions©2019, Minnesota Council on Economic Education. Developed in partnership with the Federal Reserve Bank of St. Louis.
Permission is granted to reprint or photocopy this lesson in its entirety for educational purposes, 24 provided the user credits the Minnesota Council on Economic Education.
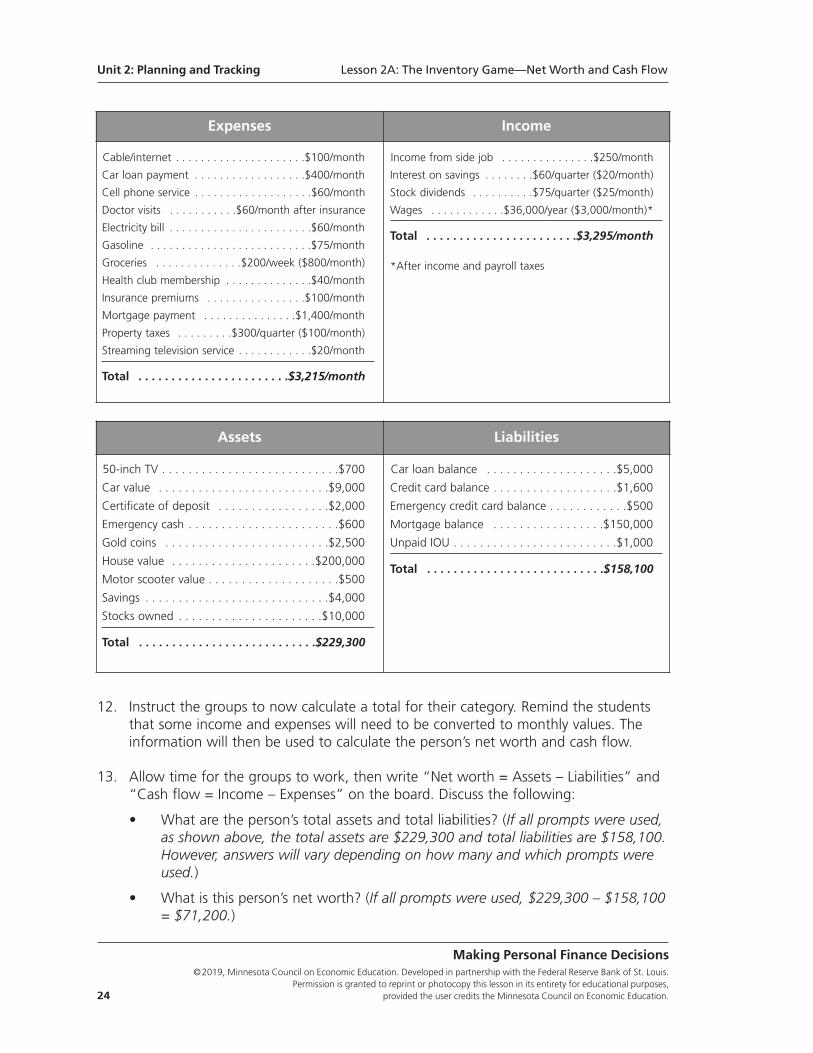
Expenses Income
Income from side job . . . . . . . . . . . . . . .$250/month
Interest on savings . . . . . . . .$60/quarter ($20/month)
Stock dividends . . . . . . . . . .$75/quarter ($25/month)
Wages . . . . . . . . . . . .$36,000/year ($3,000/month)*
Total . . . . . . . . . . . . . . . . . . . . . . .$3,295/month
*After income and payroll taxes
Cable/internet . . . . . . . . . . . . . . . . . . . . .$100/month
Car loan payment . . . . . . . . . . . . . . . . . .$400/month
Cell phone service . . . . . . . . . . . . . . . . . . .$60/month
Doctor visits . . . . . . . . . . .$60/month after insurance
Electricity bill . . . . . . . . . . . . . . . . . . . . . . .$60/month
Gasoline . . . . . . . . . . . . . . . . . . . . . . . . . .$75/month
Groceries . . . . . . . . . . . . . .$200/week ($800/month)
Health club membership . . . . . . . . . . . . . .$40/month
Insurance premiums . . . . . . . . . . . . . . . .$100/month
Mortgage payment . . . . . . . . . . . . . . .$1,400/month
Property taxes . . . . . . . . .$300/quarter ($100/month)
Streaming television service . . . . . . . . . . . .$20/month
Total . . . . . . . . . . . . . . . . . . . . . . .$3,215/month
Assets Liabilities
50-inch TV . . . . . . . . . . . . . . . . . . . . . . . . . . .$700
Car value . . . . . . . . . . . . . . . . . . . . . . . . . .$9,000
Certificate of deposit . . . . . . . . . . . . . . . . .$2,000
Emergency cash . . . . . . . . . . . . . . . . . . . . . . .$600
Gold coins . . . . . . . . . . . . . . . . . . . . . . . . .$2,500
House value . . . . . . . . . . . . . . . . . . . . . .$200,000
Motor scooter value . . . . . . . . . . . . . . . . . . . .$500
Savings . . . . . . . . . . . . . . . . . . . . . . . . . . . .$4,000
Stocks owned . . . . . . . . . . . . . . . . . . . . . .$10,000
Total . . . . . . . . . . . . . . . . . . . . . . . . . . .$229,300
Car loan balance . . . . . . . . . . . . . . . . . . . .$5,000
Credit card balance . . . . . . . . . . . . . . . . . . .$1,600
Emergency credit card balance . . . . . . . . . . . .$500
Mortgage balance . . . . . . . . . . . . . . . . .$150,000
Unpaid IOU . . . . . . . . . . . . . . . . . . . . . . . . .$1,000
Total . . . . . . . . . . . . . . . . . . . . . . . . . . .$158,100
• What are this person’s total income and total expenses? (If all prompts were used,total income is $3,295/month and total expenses are $3,215/month.)
• What is this person’s cash flow? (If all prompts were used, income exceedsexpenses by $80 per month.)
• Is this person’s net worth likely to increase or decrease over time? (If all promptswere used, the person’s net worth will likely increase because the person’s incomeexceeds expenses, which means savings will grow.)
14. Distribute a copy of Handout 2A.3: Net Worth and Cash Flow to each student. Dividethe class into small groups of three to four students and instruct them to completePart A of the handout.
15. Display Part A of Handout 2A.3: Net Worth and Cash Flow—Answer Key and discussthe answers. (Note that all income and expense items have a time period associatedwith them, while the asset and liability items do not.)
16. Have the groups complete Parts B and C of Handout 2A.3 (after correcting any errorsin Part A).
17. Display Parts B and C (page 2 of 2) of Handout 2A.3: Net Worth and Cash Flow—Answer Key and discuss the answers. Explain the following:
• Since this person’s monthly expenses (outflow) exceed his or her monthly income(inflow), his or her net worth will fall over time if nothing changes.
• The person will have to draw down his or her savings account, increase the bal-ance on his or her credit card, or get a new loan. If the cash-flow situation isn’tchanged, each of those options would lower the person’s net worth.
• If the value of this person’s assets or liabilities changes over time—for example,the value of his or her stock rises—then it is possible that the person’s net worthwill not fall. However, this is still not a good cash-flow situation if the personwants his or her net worth to grow.
18. Discuss the following:
• Why would people want to increase their net worth? (A larger net worth offersgreater financial security, which most people desire. Should unexpected expensesoccur, it provides a means to pay them. A larger net worth also provides greaterfinancial opportunities—for example, to take advantage of good deals, investin new opportunities, or even lower their insurance premiums by raising theirdeductibles.)
Lesson 2A: The Inventory Game—Net Worth and Cash Flow Unit 2: Planning and Tracking
Making Personal Finance Decisions©2019, Minnesota Council on Economic Education. Developed in partnership with the Federal Reserve Bank of St. Louis. Permission is granted to reprint or photocopy this lesson in its entirety for educational purposes, provided the user credits the Minnesota Council on Economic Education. 25
Unit 2: Planning and Tracking Lesson 2A: The Inventory Game—Net Worth and Cash Flow
Making Personal Finance Decisions©2019, Minnesota Council on Economic Education. Developed in partnership with the Federal Reserve Bank of St. Louis.
Permission is granted to reprint or photocopy this lesson in its entirety for educational purposes, 26 provided the user credits the Minnesota Council on Economic Education.
Closure19. Explain the following:
• In personal finance, it is important to know your financial situation. The twobasic measures of your financial situation are your net worth and cash flow.
• Your net worth is a stock, or inventory, that tells you where you currently standfinancially.
• Your cash flow is a measure that gives you a good indication of how the firstmeasure is likely to change over time.
• If your inflow (your income) exceeds your outflow (your expenses), your net worthis likely to rise over time.
• If, however, your outflow (your expenses) exceeds your inflow (your income), yournet worth is likely to fall over time.
20. Tell the students you will read three scenarios. They are to give a thumbs-up if theypredict that cash flow or net worth will increase or a thumbs-down if they predict thatcash flow or net worth will decrease. Tell them a pencil and paper might be useful.
• Sam has a part-time job earning $75 dollars after taxes each week. Sam spends$30 a week on gas, food, and entertainment.
◦� Is Sam’s cash flow positive (thumbs-up) or negative (thumbs-down)? (Positive—thumbs-up)
◦� What is likely to happen to Sam’s net worth as a result? (Increase—thumbs-up)
• Madison has a part time job during the school year. She earns $200 per month.Her cell phone bill is $75 per month, and she spends $50 per week on snacks,movies, and having fun with friends.
◦� Is Madison’s cash flow positive (thumbs-up) or negative (thumbs-down)? (Madison’s inflow is $200 per month; her outflow is $275 per month. Negative—thumbs-down)
◦� What is likely to happen to Madison’s net worth as a result? (Decrease—thumbs-down)
• Emma’s summer job pays her $200 per week. Her monthly expenses are a $250car payment, a $100 car insurance payment, a $75 cell phone bill, and $100 forliving expenses.
◦� For one month—four weeks—is Emma’s cash flow positive (thumbs-up) or negative (thumbs-down)? (Emma’s inflow is $800 per month, her outflow is $525 per month. Positive—thumbs-up)
◦� What is likely to happen to Emma’s net worth as a result? (Positive—thumbs-up).
Assessment21. Distribute a copy of Handout 2A.4: Assessment to each student and allow time for
students to work (or assign as homework).
Handout 2A.4: Assessment—Answer Key
Directions: Examine Part C of Handout 2A.3. How would you help this personchange his or her inflow (income) and outflow (expenses) to improve his orher financial health? Recommend ways for this person to increase his or herincome or decrease expenses. How would your plan change this person’s networth over time? Write a response that includes specific suggestions and calculations.
Answers should include specific recommendations. For example, a student might sug-gest that the person cancel cable service to reduce the cable/Internet/phone bill from$160 to $100 per month. They might also suggest trading the car for a less-expensivemodel, reducing the payment from $350 to $200 per month. These two changes wouldreduce monthly expenses by $210, to $2,490. In this new plan, monthly income (still$2,530) exceeds monthly expenses (now $2,490) by $40. This new plan would increasenet worth over time because the excess income could be used to pay down credit carddebt or added to savings.
Making Personal Finance Decisions©2019, Minnesota Council on Economic Education. Developed in partnership with the Federal Reserve Bank of St. Louis. Permission is granted to reprint or photocopy this lesson in its entirety for educational purposes, provided the user credits the Minnesota Council on Economic Education. 27
Lesson 2A: The Inventory Game—Net Worth and Cash Flow Unit 2: Planning and Tracking
Handout 2A.1: Classroom Station Signs (page 1 of 2)
Unit 2: Planning and Tracking Lesson 2A: The Inventory Game—Net Worth and Cash Flow
Making Personal Finance Decisions©2019, Minnesota Council on Economic Education. Developed in partnership with the Federal Reserve Bank of St. Louis.
Permission is granted to reprint or photocopy this lesson in its entirety for educational purposes, 28 provided the user credits the Minnesota Council on Economic Education.
Expenses
Income
Handout 2A.1: Classroom Station Signs (page 2 of 2)
Lesson 2A: The Inventory Game—Net Worth and Cash Flow Unit 2: Planning and Tracking
Making Personal Finance Decisions©2019, Minnesota Council on Economic Education. Developed in partnership with the Federal Reserve Bank of St. Louis. Permission is granted to reprint or photocopy this lesson in its entirety for educational purposes, provided the user credits the Minnesota Council on Economic Education. 29
Assets
Liabilities
Handout 2A.2: Activity Prompts
Unit 2: Planning and Tracking Lesson 2A: The Inventory Game—Net Worth and Cash Flow
Making Personal Finance Decisions©2019, Minnesota Council on Economic Education. Developed in partnership with the Federal Reserve Bank of St. Louis.
Permission is granted to reprint or photocopy this lesson in its entirety for educational purposes, 30 provided the user credits the Minnesota Council on Economic Education.
50-inch TV$700
Emergency cash$600
Mortgage balance$150,000
Cable/internet$100/month
Emergency credit cardbalance$500
Mortgage payment$1,400/month
Car loan balance$5,000
Gasoline$75/month
Motor scooter value$500
Car loan payment$400/month
Gold coins$2,500
Property taxes$300/quarter
Car value$9,000
Groceries$200/week
Savings$4,000
Cell phone service$60/month
Health club membership$40/month
Streaming televisionservice
$20/month
Certificate of deposit$2,000
House value$200,000
Stock dividends$75/quarter
Credit card balance$1,600
Income from side job$250/month
Stocks owned$10,000
Doctor visits$60/month after
insurance
Insurance premiums$100/month
Unpaid IOU$1,000
Electricity bill$60/month
Interest on savings$60/quarter
Wages$36,000/year after
income and payroll taxes
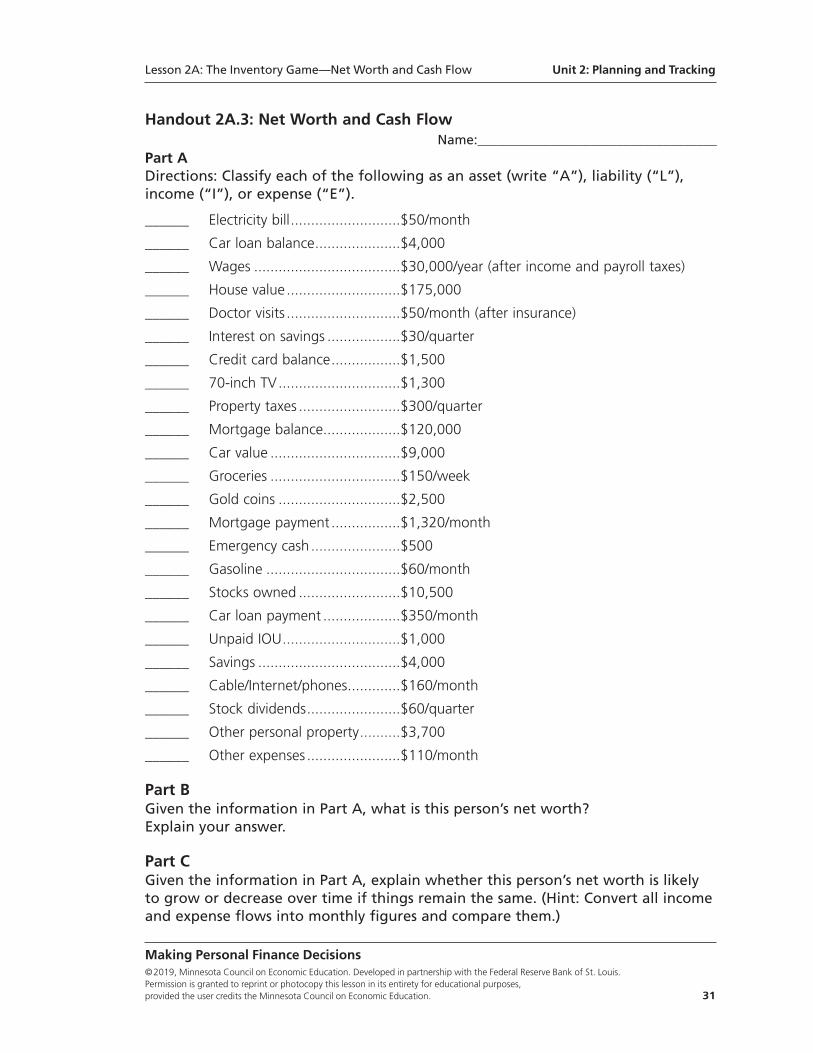
Handout 2A.3: Net Worth and Cash FlowName:____________________________________
Part ADirections: Classify each of the following as an asset (write “A”), liability (“L”),income (“I”), or expense (“E”).
______ Electricity bill...........................$50/month
______ Car loan balance.....................$4,000
______ Wages ....................................$30,000/year (after income and payroll taxes)
______ House value............................$175,000
______ Doctor visits ............................$50/month (after insurance)
______ Interest on savings ..................$30/quarter
______ Credit card balance.................$1,500
______ 70-inch TV..............................$1,300
______ Property taxes .........................$300/quarter
______ Mortgage balance...................$120,000
______ Car value ................................$9,000
______ Groceries ................................$150/week
______ Gold coins ..............................$2,500
______ Mortgage payment .................$1,320/month
______ Emergency cash......................$500
______ Gasoline .................................$60/month
______ Stocks owned .........................$10,500
______ Car loan payment ...................$350/month
______ Unpaid IOU.............................$1,000
______ Savings ...................................$4,000
______ Cable/Internet/phones.............$160/month
______ Stock dividends.......................$60/quarter
______ Other personal property..........$3,700
______ Other expenses .......................$110/month
Part BGiven the information in Part A, what is this person’s net worth?Explain your answer.
Part C Given the information in Part A, explain whether this person’s net worth is likelyto grow or decrease over time if things remain the same. (Hint: Convert all incomeand expense flows into monthly figures and compare them.)
Lesson 2A: The Inventory Game—Net Worth and Cash Flow Unit 2: Planning and Tracking
Making Personal Finance Decisions©2019, Minnesota Council on Economic Education. Developed in partnership with the Federal Reserve Bank of St. Louis. Permission is granted to reprint or photocopy this lesson in its entirety for educational purposes, provided the user credits the Minnesota Council on Economic Education. 31
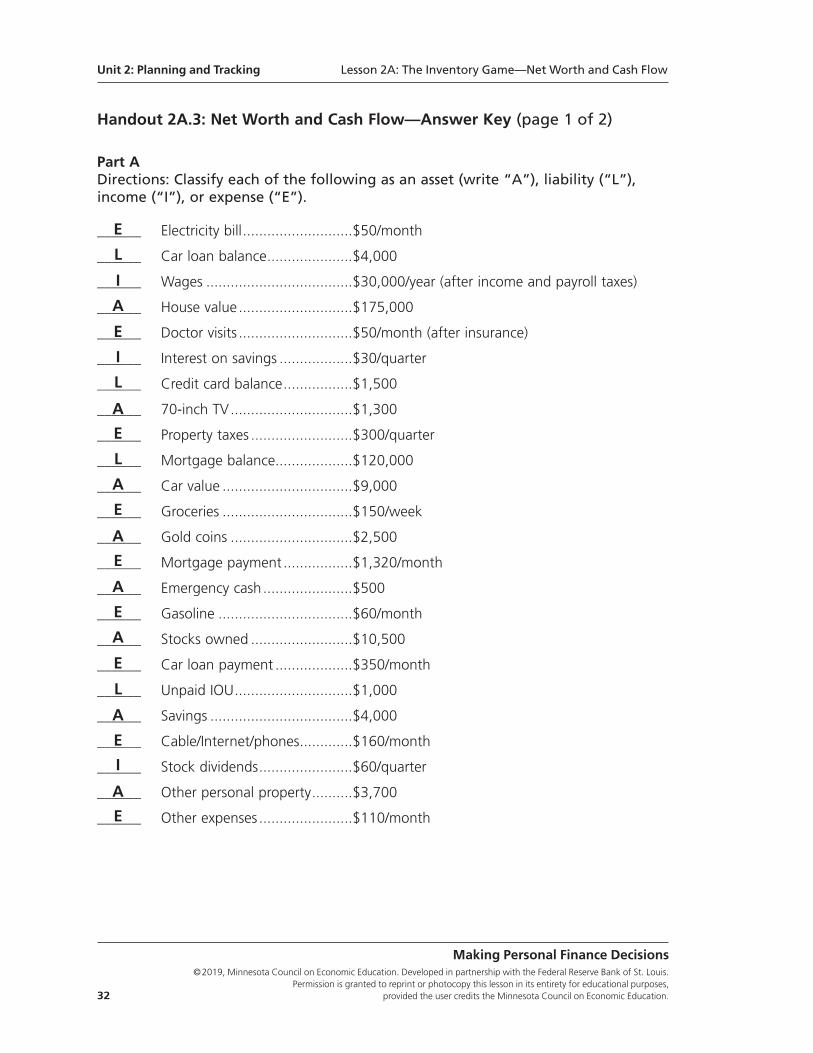
Handout 2A.3: Net Worth and Cash Flow—Answer Key (page 1 of 2)
Part ADirections: Classify each of the following as an asset (write “A”), liability (“L”),income (“I”), or expense (“E”).
______ Electricity bill...........................$50/month
______ Car loan balance.....................$4,000
______ Wages ....................................$30,000/year (after income and payroll taxes)
______ House value............................$175,000
______ Doctor visits ............................$50/month (after insurance)
______ Interest on savings ..................$30/quarter
______ Credit card balance.................$1,500
______ 70-inch TV..............................$1,300
______ Property taxes .........................$300/quarter
______ Mortgage balance...................$120,000
______ Car value ................................$9,000
______ Groceries ................................$150/week
______ Gold coins ..............................$2,500
______ Mortgage payment .................$1,320/month
______ Emergency cash......................$500
______ Gasoline .................................$60/month
______ Stocks owned .........................$10,500
______ Car loan payment ...................$350/month
______ Unpaid IOU.............................$1,000
______ Savings ...................................$4,000
______ Cable/Internet/phones.............$160/month
______ Stock dividends.......................$60/quarter
______ Other personal property..........$3,700
______ Other expenses .......................$110/month
Making Personal Finance Decisions©2019, Minnesota Council on Economic Education. Developed in partnership with the Federal Reserve Bank of St. Louis.
Permission is granted to reprint or photocopy this lesson in its entirety for educational purposes, 32 provided the user credits the Minnesota Council on Economic Education.
Unit 2: Planning and Tracking Lesson 2A: The Inventory Game—Net Worth and Cash Flow
E
L
I
A
E
I
L
A
E
L
A
E
A
E
A
E
E
A
I
E
A
L
E
A
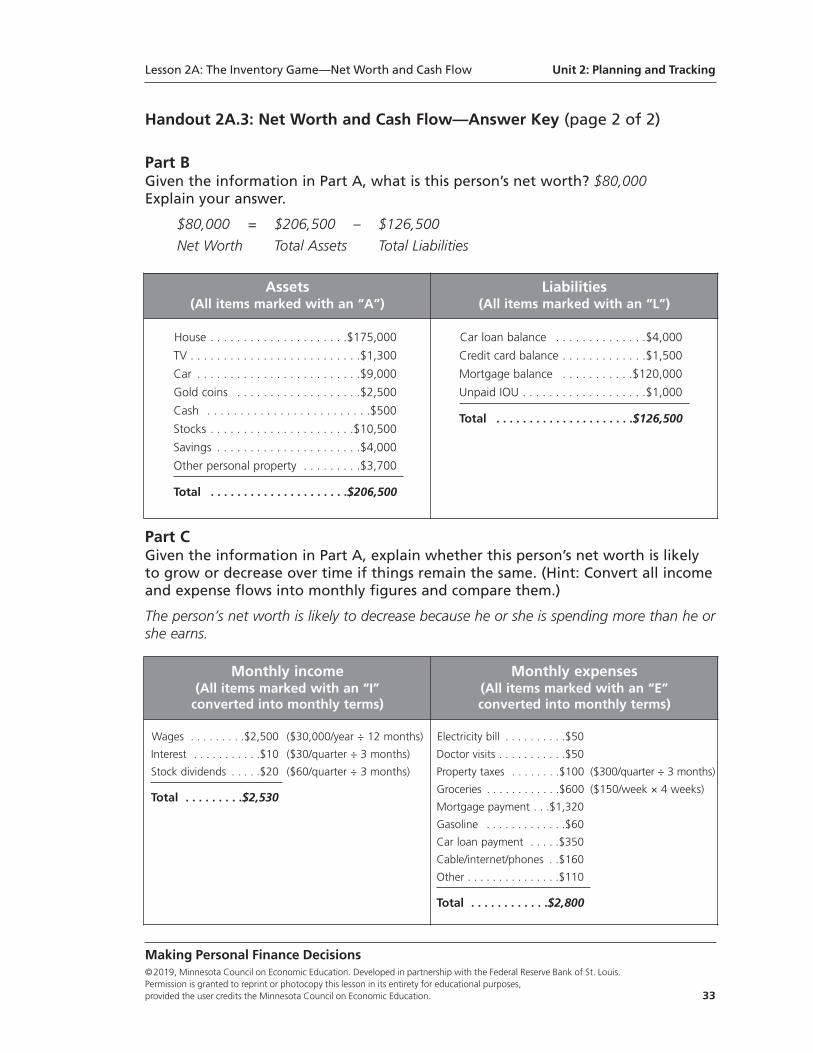
Handout 2A.3: Net Worth and Cash Flow—Answer Key (page 2 of 2)
Part BGiven the information in Part A, what is this person’s net worth? $80,000Explain your answer.
$80,000 = $206,500 – $126,500
Net Worth Total Assets Total Liabilities
Part C Given the information in Part A, explain whether this person’s net worth is likelyto grow or decrease over time if things remain the same. (Hint: Convert all incomeand expense flows into monthly figures and compare them.)
The person’s net worth is likely to decrease because he or she is spending more than he orshe earns.
Lesson 2A: The Inventory Game—Net Worth and Cash Flow Unit 2: Planning and Tracking
Making Personal Finance Decisions©2019, Minnesota Council on Economic Education. Developed in partnership with the Federal Reserve Bank of St. Louis. Permission is granted to reprint or photocopy this lesson in its entirety for educational purposes, provided the user credits the Minnesota Council on Economic Education. 33
Assets(All items marked with an “A”)
Liabilities(All items marked with an “L”)
House . . . . . . . . . . . . . . . . . . . . .$175,000
TV . . . . . . . . . . . . . . . . . . . . . . . . . .$1,300
Car . . . . . . . . . . . . . . . . . . . . . . . . .$9,000
Gold coins . . . . . . . . . . . . . . . . . . .$2,500
Cash . . . . . . . . . . . . . . . . . . . . . . . . .$500
Stocks . . . . . . . . . . . . . . . . . . . . . .$10,500
Savings . . . . . . . . . . . . . . . . . . . . . .$4,000
Other personal property . . . . . . . . .$3,700
Total . . . . . . . . . . . . . . . . . . . . .$206,500
Car loan balance . . . . . . . . . . . . . .$4,000
Credit card balance . . . . . . . . . . . . .$1,500
Mortgage balance . . . . . . . . . . .$120,000
Unpaid IOU . . . . . . . . . . . . . . . . . . .$1,000
Total . . . . . . . . . . . . . . . . . . . . .$126,500
Monthly income(All items marked with an “I” converted into monthly terms)
Monthly expenses(All items marked with an “E” converted into monthly terms)
Wages . . . . . . . . .$2,500 ($30,000/year ÷ 12 months)
Interest . . . . . . . . . . .$10 ($30/quarter ÷ 3 months)
Stock dividends . . . . .$20 ($60/quarter ÷ 3 months)
Total . . . . . . . . .$2,530
Electricity bill . . . . . . . . . .$50
Doctor visits . . . . . . . . . . .$50
Property taxes . . . . . . . .$100 ($300/quarter ÷ 3 months)
Groceries . . . . . . . . . . . .$600 ($150/week × 4 weeks)
Mortgage payment . . .$1,320
Gasoline . . . . . . . . . . . . .$60
Car loan payment . . . . .$350
Cable/internet/phones . .$160
Other . . . . . . . . . . . . . . .$110
Total . . . . . . . . . . . .$2,800
Handout 2A.4: Assessment Name:____________________________________
Directions: Examine Part C of Handout 2A.3. How would you help this person changehis or her inflow (income) and outflow (expenses) to improve his or her financialhealth? Recommend ways for this person to increase his or her income or decreaseexpenses. How would your plan change this person’s net worth over time? Write aresponse that includes specific suggestions and calculations.
Unit 2: Planning and Tracking Lesson 2A: The Inventory Game—Net Worth and Cash Flow
Making Personal Finance Decisions©2019, Minnesota Council on Economic Education. Developed in partnership with the Federal Reserve Bank of St. Louis.
Permission is granted to reprint or photocopy this lesson in its entirety for educational purposes, 34 provided the user credits the Minnesota Council on Economic Education.
Standards and BenchmarksNational Standards for Financial Literacy
Standard 1: Earning Income. Income for most people is determined by the market valueof their labor, paid as wages and salaries. People can increase their income and job oppor-tunities by choosing to acquire more education, work experience, and job skills. The decisionto undertake an activity that increases income or job opportunities is affected by the expectedbenefits and costs of such an activity. Income also is obtained from other sources such asinterest, rents, capital gains, dividends, and profits.
• Benchmark: Grade 4
2. People earn an income when they are hired by an employer to work at a job.
Standard 5: Financial Investing. Financial investment is the purchase of financial assetsto increase income or wealth in the future. Investors must choose among investments thathave different risks and expected rates of return. Investments with higher expected rates ofreturn tend to have greater risk. Diversification of investment among a number of choicescan lower investment risk.
• Benchmark: Grade 8
1. Financial assets include a wide variety of financial instruments including bank deposits, stocks, bonds, and mutual funds. Real estate and commodities are also often viewed as financial assets.
Making Personal Finance Decisions©2019, Minnesota Council on Economic Education. Developed in partnership with the Federal Reserve Bank of St. Louis. Permission is granted to reprint or photocopy this lesson in its entirety for educational purposes, provided the user credits the Minnesota Council on Economic Education. 35
Lesson 2A: The Inventory Game—Net Worth and Cash Flow Unit 2: Planning and Tracking
Unit 2: Planning and Tracking
Making Personal Finance Decisions©2019, Minnesota Council on Economic Education. Developed in partnership with the Federal Reserve Bank of St. Louis.
Permission is granted to reprint or photocopy this lesson in its entirety for educational purposes, 36 provided the user credits the Minnesota Council on Economic Education.
Lesson 2B:
Meeting Financial Goals—Rate of Return
Lesson DescriptionStudents are shown the two ways investments can earn a return and then calculatethe annual rate of return, the real rate of return, and the expected rate of return onvarious assets.
Standards and Benchmarks (see page 49)
Grade Level9-12
ConceptsAppreciation
Depreciation
Expected rate of return
Inflation
Inflation rate
Rate of return
Real rate of return
Return
Making Personal Finance Decisions©2019, Minnesota Council on Economic Education. Developed in partnership with the Federal Reserve Bank of St. Louis. Permission is granted to reprint or photocopy this lesson in its entirety for educational purposes, provided the user credits the Minnesota Council on Economic Education. 37
Rule 2: Have a Plan.Financial success depends primarily on two things: (i) developing a plan to meet yourestablished goals and (ii) tracking your progress with respect to that plan. Too often peo-ple set vague goals (“I want to be rich.”), make unrealistic plans, or never bother to assessthe progress toward their goals. These lessons look at important financial indicators youshould understand and monitor both in setting goals and attaining them.
Unit 2
Planning and Tracking
Compelling QuestionHow is an asset’s rate of return measured?
ObjectivesStudents will be able to
• describe two ways that an asset can earn a return and
• determine and distinguish among the rate of return on an asset, its real rate ofreturn, and its expected rate of return.
Materials• Visual 2B.1: Calculating the Annual Rate of Return
• Visual 2B.2: Expected Rate of Return
• Handout 2B.1: Calculating the Annual Rate of Return, one copy for each stu-dent
• Handout 2B.1: Calculating the Annual Rate of Return—Answer Key
• Handout 2B:2: Assessment, one copy for each student
• One small paper bag for each group of three to five students, with four identicalitems (e.g., poker chips or pieces of paper) in the bag in the following colors:one red, one white, two blue
• Paper and pen/pencil for each group of three to five students
Time required45 minutes
PreparationPrepare the bags as noted in the Materials section.
Procedure1. Begin the class by asking the students to provide examples of assets. (Answers will
vary but may include houses, cars, stocks, bonds, collectibles, land, jewelry, savingsaccount, certificates of deposit, cash, U.S. savings bonds, boats, or electronics.)
Making Personal Finance Decisions©2019, Minnesota Council on Economic Education. Developed in partnership with the Federal Reserve Bank of St. Louis.
Permission is granted to reprint or photocopy this lesson in its entirety for educational purposes, 38 provided the user credits the Minnesota Council on Economic Education.
Unit 2: Planning and Tracking Lesson 2B: Meeting Financial Goals—Rate of Return
2. Explain that assets such as those mentioned can increase your wealth in two ways: (i)The market value—or price of the asset—may increase and/or (ii) the asset can generateincome. Discuss the following:
• What are some assets that may increase in market value? (Answers will vary butmay include stocks, houses, collectibles [e.g., artwork or trading cards], or land.)
3. Define appreciation as an increase in the market value of an asset. Discuss the following:
• Can the market value of an asset go down? (Yes)
4. Define depreciation as a decrease in the market value of an asset. Explain that themarket value of all of the assets mentioned could also decrease. Assets that depreciateare less desirable as investment choices. Discuss the following:
• Which types of assets would you expect to depreciate? (Answers will vary butmay include cars, electronics, or boats.)
5. Explain that some assets generate income. Discuss the following examples:
• Money deposited in a savings account or used to purchase certificates of depositor bonds earns interest.
• Some companies pay dividends to those who own the company’s stocks.
• Houses and land can generate rental income.
6. Some assets may increase your wealth because their market value increases andbecause they generate income. Discuss the following examples:
• If you own a house that you rent, the market value or price of the house mayincrease over time and it generates monthly income when your tenants pay rent.
• The market value—or price—of a stock that you own may increase and thecompany may pay dividends on the stock.
7. Summarize by noting the following:
• Some assets can increase your wealth only if they appreciate—that is, their mar-ket value, or price, increases. For example, the market value of collectibles (suchas baseball cards or artwork) may increase.
• Some assets can increase your wealth only by generating income. For example,interest earned on savings accounts or certificates of deposit is income.
• Some assets can increase your wealth both ways—such as rental houses andsome stocks. They increase in market value and provide income.
Making Personal Finance Decisions©2019, Minnesota Council on Economic Education. Developed in partnership with the Federal Reserve Bank of St. Louis. Permission is granted to reprint or photocopy this lesson in its entirety for educational purposes, provided the user credits the Minnesota Council on Economic Education. 39
Lesson 2B: Meeting Financial Goals—Rate of Return Unit 2: Planning and Tracking
8. Display Visual 2B.1: Calculating the Annual Rate of Return. Explain that a usefulmeasure to compare how different assets may increase your wealth is the annualrate of return. Discuss the following:
• The return on an asset is the income the asset generates, if any, during a givenperiod (such as a year) plus any appreciation or depreciation in the market valueof the asset during that period.
• The rate of return is the return on an asset over a given period divided by themarket value (the price it can be sold for in a market) of the asset at the begin-ning of that period. This ratio is typically multiplied by 100 and expressed as apercentage.
• For example, suppose an asset had a market value of $200 a year ago but hasappreciated in value and is currently worth $205. In addition, suppose it alsogenerated $5 in income. The return would be the $5 in income generated plusthe $5 appreciation in the market value of the asset, or $10. The rate of returnwould be $10 divided by $200, or 0.05. Expressed as a percentage, this wouldbe a 5 percent annual rate of return.
9. Distribute a copy of Handout 2B.1: Calculating the Annual Rate of Return to eachstudent. Allow time for students to complete the handout and then discuss theiranswers using Handout 2B.1—Answer Key. (Note that for items G and H, the marketvalue of the assets depreciated. Also, item H is an example of a negative rate of return,which is possible when an asset’s market value depreciates.)
10. Ask students to reconsider case F in Handout 2B.1. Discuss the following:
• Although the rate of return was 0 percent, was there really no change in thewealth of the person who placed the cash under the mattress? (It depends. Ifthe prices of the goods and services this person wants to buy rise during the year,then the $1,000 would buy fewer goods and services at the end of the year thanit would have at the beginning of the year, making the person less wealthy.)
11. Define inflation as a general, sustained upward movement of prices for goods andservices in an economy. Explain that inflation is typically measured by the percentageincrease in the average price level of goods and services over a period of time. Thismeasurement is called the inflation rate. Thus, while investing can increase wealth,inflation tends to decrease wealth because the same amount of money buys fewergoods and services over time.
12. Define the real rate of return on an investment as the rate of return on the invest-ment minus the inflation rate. Explain that an asset must have a rate of return greaterthan the inflation rate to increase your wealth. Give the following example:
• Suppose you earn 4 percent on your savings account while the inflation rate is3 percent. Your real rate of return would be only 1 percent: 4 percent – 3 percent =1 percent.
Making Personal Finance Decisions©2019, Minnesota Council on Economic Education. Developed in partnership with the Federal Reserve Bank of St. Louis.
Permission is granted to reprint or photocopy this lesson in its entirety for educational purposes, 40 provided the user credits the Minnesota Council on Economic Education.
Unit 2: Planning and Tracking Lesson 2B: Meeting Financial Goals—Rate of Return
• For item F on Handout 2B.2, the real rate of return would be –3 percent if theinflation rate were 3 percent: 0 percent – 3 percent = –3 percent.
13. Discuss the following:
• If the inflation rate were 3 percent, which of the assets in Handout 2B.2 wouldhave a positive real rate of return? (Only B, C, E, and G)
• If the inflation rate were 6 percent, which assets would have a positive real rateof return? (Only C and E. C, with 1 percent [7 percent – 6 percent = 1 percent]and E with 4 percent [10 percent – 6 percent = 4 percent])
14. Explain the following:
• The change in the price, or market value, of the asset may vary from year to year.For example, a stock’s price may rise 20 percent one year, 10 percent the next,and then fall 4 percent the year after that.
• It could also vary because the income generated by the asset changes. For exam-ple, a company may change the amount of the dividend it pays on each share ofits stock, or a bank may change the interest rate that it pays on savings accounts.
15. Define the expected rate of return as the amount you anticipate receiving on aninvestment based on the probable rates of return (often based on how the asset per-formed in the past). Explain that people considering investing in a certain asset oftenconsider the expected rate of return. Discuss the following:
• It is important to realize that the actual rates of return for some assets can varyconsiderably from year to year.
• The expected rate of return on an asset is calculated as the weighted average ofall the possible actual rates of return, where each possibility is weighted by itslikelihood (or probability) of happening.
• Reassure students that although this sounds very technical, it is really quite simple,as will be demonstrated.
16. Arrange the class into small groups of three to five students. Give each group onebag (as prepared before class), each of which contains one red item, one white item,and two blue items. Tell the students to not look in the bags. Explain the followingdirections:
• Each group should label a sheet of paper from 1 to 10.
• Each group represents one particular asset (i.e., a stock or bond).
• In each of 10 rounds, without looking, each group will draw an item from its bagto determine the rate of return their asset will earn for that round as follows:
◦� Red item: 4 percent rate of return
Making Personal Finance Decisions©2019, Minnesota Council on Economic Education. Developed in partnership with the Federal Reserve Bank of St. Louis. Permission is granted to reprint or photocopy this lesson in its entirety for educational purposes, provided the user credits the Minnesota Council on Economic Education. 41
Lesson 2B: Meeting Financial Goals—Rate of Return Unit 2: Planning and Tracking
◦� White item: 8 percent rate of return
◦� Blue items: 12 percent rate of return.
17. After each round, each group should record its rate of return (4 percent, 8 percent,or 12 percent) and then return the item to the bag.
18. Conduct Round 1—have each group draw an item and record its result. Repeat forthe remaining 9 rounds.
19. Explain that these 10 rates represent the 10-year history of returns for each particularasset. Instruct the groups to add the 10 rates and then divide by 10 to determine theiraverage rate of return. Ask some groups to report their average. (While the values willvary, they will all be near 9 percent. Optional: Average all of the groups’ averages toget an overall class average, which would be even closer to 9 percent.)
20. Explain that around 9 percent is the expected rate of return for each of the group’sassets. Note that the expected rate of return does not equal any of the actual rates ofreturn in the given rounds. It is also closer to 12 percent than to 4 percent becausethere were 2 blue items in the bags and blue items represented a 12 percent rate ofreturn. As mentioned earlier, the expected rate of return is based on the weightedaverage of the possibilities.
21. Display Visual 2B.2: Expected Rate of Return. Explain the following:
• In this case, there were three possible rates of return: 4 percent, 8 percent, and12 percent.
• The chance of getting 4 percent was equal to the chance of drawing the red item,which was one in four, or 25 percent (1/4 = 0.25).
• The chance of getting 8 percent was also 25 percent.
• The chance of getting 12 percent was 50 percent.
• Multiplying each possible rate of return by its chance of occurring yields a 9 per-cent expected rate of return. (9 percent = [4 percent × 0.25] + [8 percent × 0.25]+ [12 percent × 0.50]).
Closure22. Review the important concepts in the lesson by discussion the following:
• What are the two ways an asset can earn a return? (By increasing in market valueor by generating income)
Making Personal Finance Decisions©2019, Minnesota Council on Economic Education. Developed in partnership with the Federal Reserve Bank of St. Louis.
Permission is granted to reprint or photocopy this lesson in its entirety for educational purposes, 42 provided the user credits the Minnesota Council on Economic Education.
Unit 2: Planning and Tracking Lesson 2B: Meeting Financial Goals—Rate of Return
• What is the real rate of return on an asset? (The rate of return minus the inflationrate)
• What is the expected rate of return on an asset? (The average rate of return youwould expect each period from the investment over many periods)
Assessment23. Distribute a copy of Handout 2B.2: Assessment to each student. Allow time for students
to work and then review the answers.
Handout 2B.2: Assessment—Answer Key
1. An asset you bought last year for $100 has increased $10 in value and earned$2 in interest.
a. Calculate the asset’s rate of return. 12 percent ([$12 / $100 = 0.12)
b. The inflation rate last year was 3 percent. Calculate the asset’s real rate of return. 9 percent (12 percent – 3 percent = 9 percent)
2. Assume you are considering investing in an asset that has a 50 percent chanceof producing a 10 percent profit and a 50 percent chance of producing a 5 per-cent loss.
a. Calculate the asset’s expected rate of return. The expected rate of return is 2.5 percent [(10 × 0.50) + (–5 × 0.50)].
b. Is the asset’s expected rate of return guaranteed? No. The expected rate of return is not guaranteed.
c. Would you invest in this asset?Investment risk is determined by the comfort level of the students. Some would buy this asset, while others would not.
Making Personal Finance Decisions©2019, Minnesota Council on Economic Education. Developed in partnership with the Federal Reserve Bank of St. Louis. Permission is granted to reprint or photocopy this lesson in its entirety for educational purposes, provided the user credits the Minnesota Council on Economic Education. 43
Lesson 2B: Meeting Financial Goals—Rate of Return Unit 2: Planning and Tracking
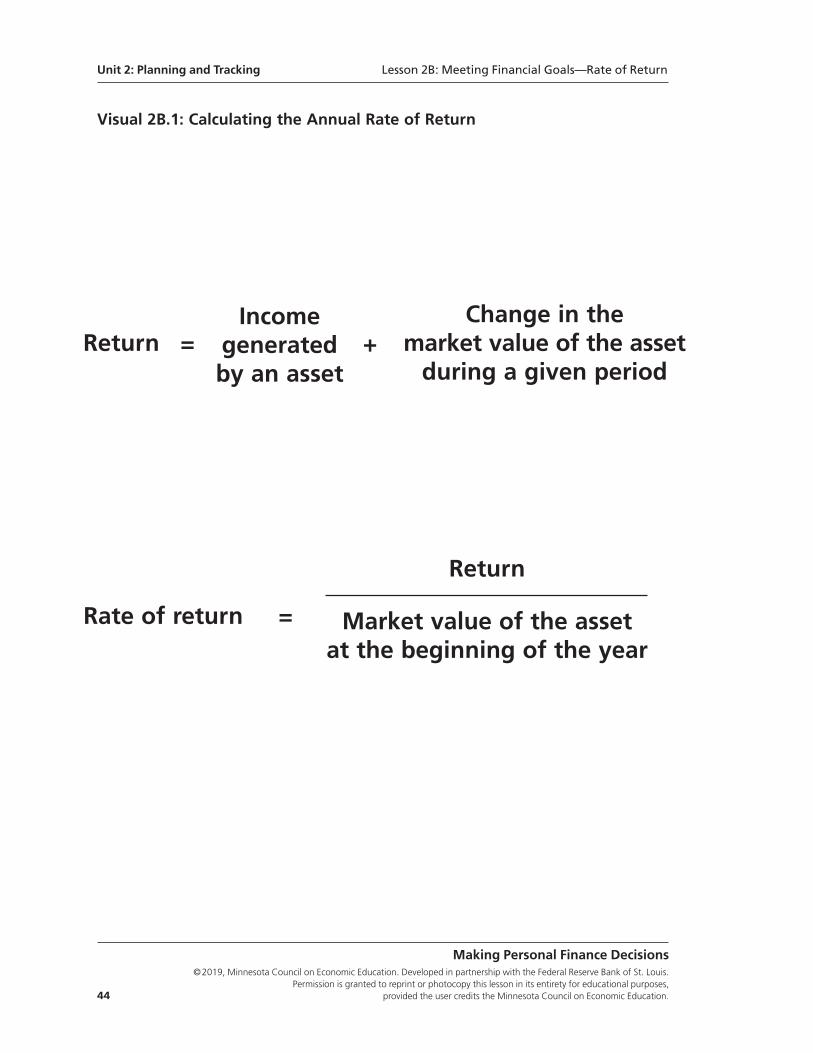
Visual 2B.1: Calculating the Annual Rate of Return
Making Personal Finance Decisions©2019, Minnesota Council on Economic Education. Developed in partnership with the Federal Reserve Bank of St. Louis.
Permission is granted to reprint or photocopy this lesson in its entirety for educational purposes, 44 provided the user credits the Minnesota Council on Economic Education.
ReturnIncomegenerated by an asset
Change in the market value of the assetduring a given period
Rate of return =
Return
Market value of the assetat the beginning of the year
= +
Unit 2: Planning and Tracking Lesson 2B: Meeting Financial Goals—Rate of Return
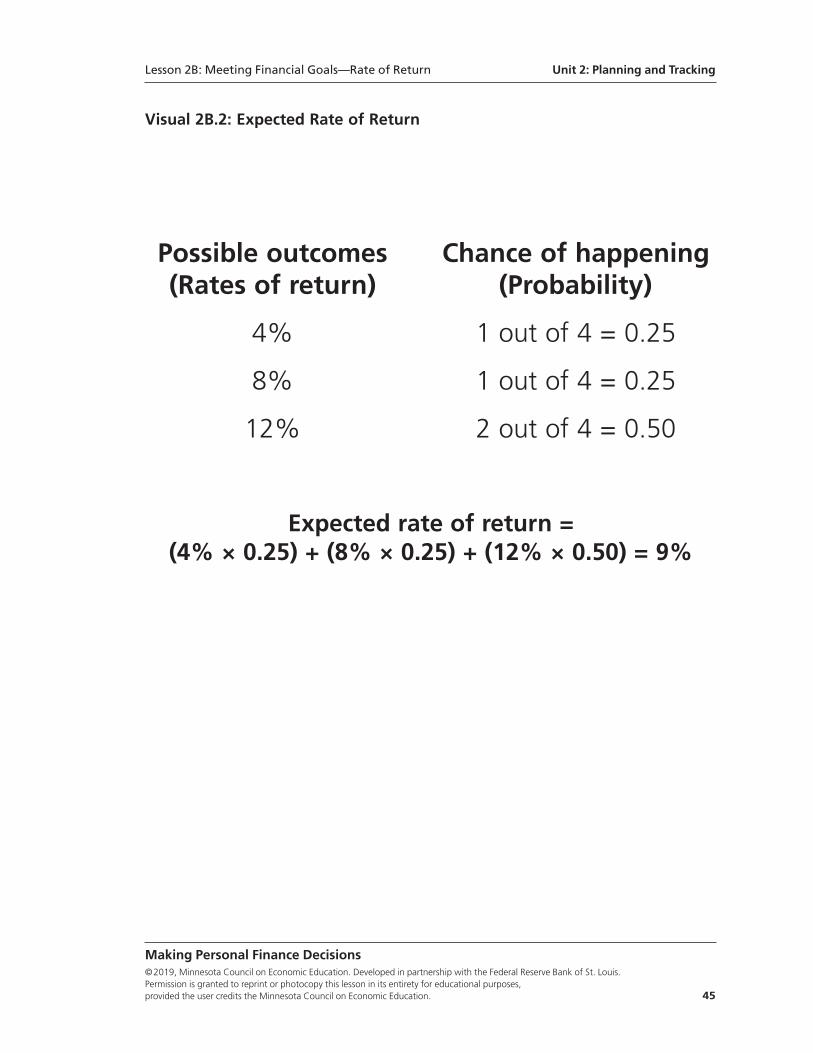
Visual 2B.2: Expected Rate of Return
Possible outcomes Chance of happening(Rates of return) (Probability)
4% 1 out of 4 = 0.25
8% 1 out of 4 = 0.25
12% 2 out of 4 = 0.50
Expected rate of return =(4% × 0.25) + (8% × 0.25) + (12% × 0.50) = 9%
Making Personal Finance Decisions©2019, Minnesota Council on Economic Education. Developed in partnership with the Federal Reserve Bank of St. Louis. Permission is granted to reprint or photocopy this lesson in its entirety for educational purposes, provided the user credits the Minnesota Council on Economic Education. 45
Lesson 2B: Meeting Financial Goals—Rate of Return Unit 2: Planning and Tracking
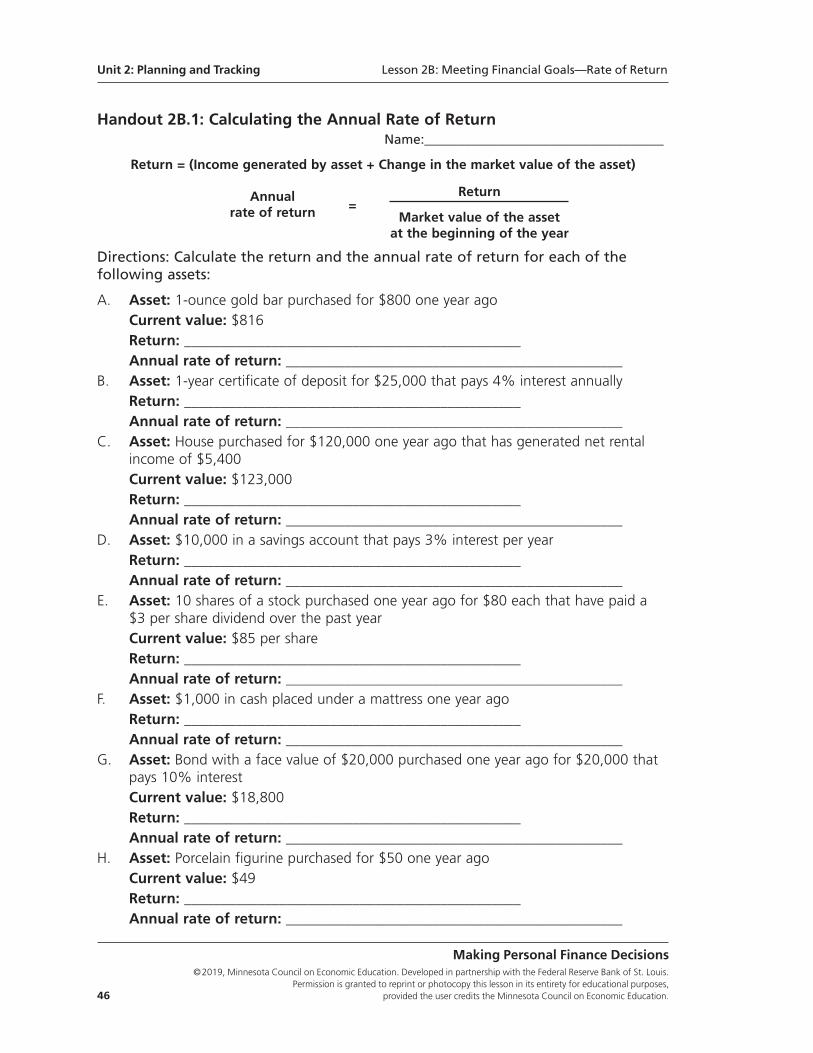
Handout 2B.1: Calculating the Annual Rate of ReturnName:____________________________________
Return = (Income generated by asset + Change in the market value of the asset)
Annual Return
rate of return =Market value of the asset at the beginning of the year
Directions: Calculate the return and the annual rate of return for each of the following assets:
A. Asset: 1-ounce gold bar purchased for $800 one year agoCurrent value: $816Return: ______________________________________________Annual rate of return: ______________________________________________
B. Asset: 1-year certificate of deposit for $25,000 that pays 4% interest annuallyReturn: ______________________________________________Annual rate of return: ______________________________________________
C. Asset: House purchased for $120,000 one year ago that has generated net rental income of $5,400Current value: $123,000 Return: ______________________________________________Annual rate of return: ______________________________________________
D. Asset: $10,000 in a savings account that pays 3% interest per yearReturn: ______________________________________________Annual rate of return: ______________________________________________
E. Asset: 10 shares of a stock purchased one year ago for $80 each that have paid a $3 per share dividend over the past yearCurrent value: $85 per share Return: ______________________________________________Annual rate of return: ______________________________________________
F. Asset: $1,000 in cash placed under a mattress one year agoReturn: ______________________________________________Annual rate of return: ______________________________________________
G. Asset: Bond with a face value of $20,000 purchased one year ago for $20,000 that pays 10% interest Current value: $18,800Return: ______________________________________________Annual rate of return: ______________________________________________
H. Asset: Porcelain figurine purchased for $50 one year ago Current value: $49Return: ______________________________________________Annual rate of return: ______________________________________________
Making Personal Finance Decisions©2019, Minnesota Council on Economic Education. Developed in partnership with the Federal Reserve Bank of St. Louis.
Permission is granted to reprint or photocopy this lesson in its entirety for educational purposes, 46 provided the user credits the Minnesota Council on Economic Education.
Unit 2: Planning and Tracking Lesson 2B: Meeting Financial Goals—Rate of Return
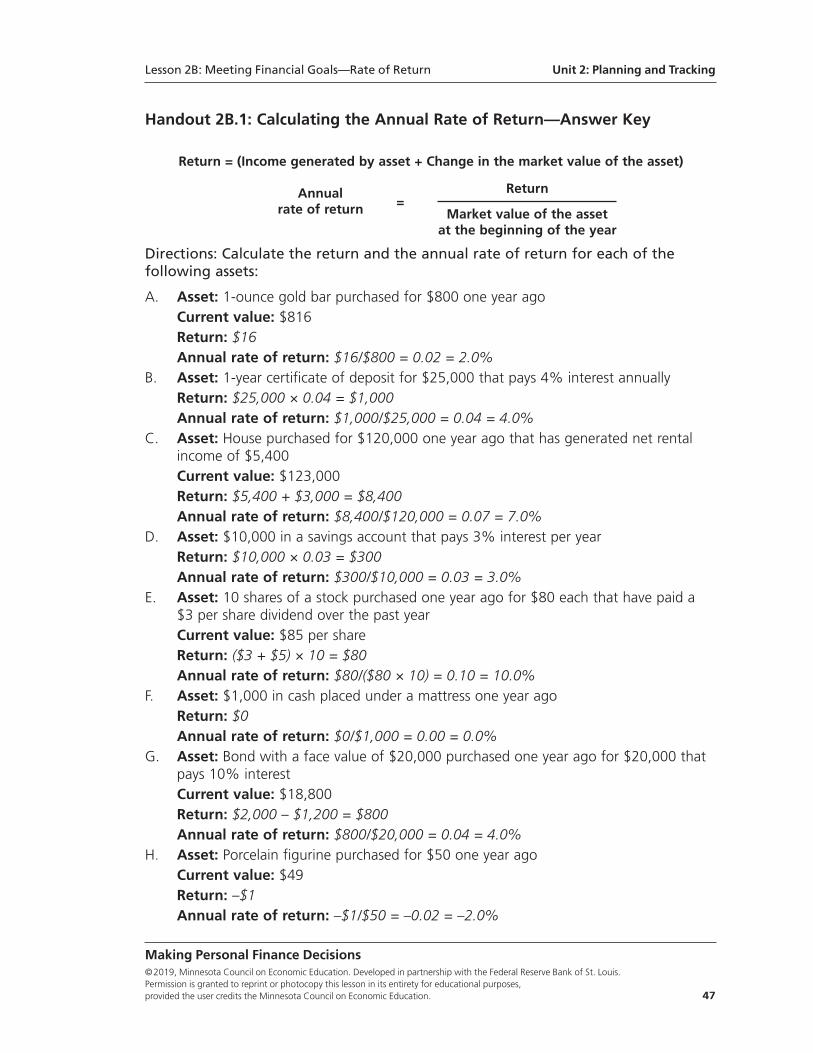
Handout 2B.1: Calculating the Annual Rate of Return—Answer Key
Return = (Income generated by asset + Change in the market value of the asset)
Annual Return
rate of return =Market value of the asset at the beginning of the year
Directions: Calculate the return and the annual rate of return for each of the following assets:
A. Asset: 1-ounce gold bar purchased for $800 one year agoCurrent value: $816Return: $16Annual rate of return: $16/$800 = 0.02 = 2.0%
B. Asset: 1-year certificate of deposit for $25,000 that pays 4% interest annuallyReturn: $25,000 × 0.04 = $1,000Annual rate of return: $1,000/$25,000 = 0.04 = 4.0%
C. Asset: House purchased for $120,000 one year ago that has generated net rental income of $5,400Current value: $123,000 Return: $5,400 + $3,000 = $8,400Annual rate of return: $8,400/$120,000 = 0.07 = 7.0%
D. Asset: $10,000 in a savings account that pays 3% interest per yearReturn: $10,000 × 0.03 = $300Annual rate of return: $300/$10,000 = 0.03 = 3.0%
E. Asset: 10 shares of a stock purchased one year ago for $80 each that have paid a $3 per share dividend over the past yearCurrent value: $85 per share Return: ($3 + $5) × 10 = $80Annual rate of return: $80/($80 × 10) = 0.10 = 10.0%
F. Asset: $1,000 in cash placed under a mattress one year agoReturn: $0Annual rate of return: $0/$1,000 = 0.00 = 0.0%
G. Asset: Bond with a face value of $20,000 purchased one year ago for $20,000 that pays 10% interest Current value: $18,800Return: $2,000 – $1,200 = $800Annual rate of return: $800/$20,000 = 0.04 = 4.0%
H. Asset: Porcelain figurine purchased for $50 one year ago Current value: $49Return: –$1Annual rate of return: –$1/$50 = –0.02 = –2.0%
Making Personal Finance Decisions©2019, Minnesota Council on Economic Education. Developed in partnership with the Federal Reserve Bank of St. Louis. Permission is granted to reprint or photocopy this lesson in its entirety for educational purposes, provided the user credits the Minnesota Council on Economic Education. 47
Lesson 2B: Meeting Financial Goals—Rate of Return Unit 2: Planning and Tracking
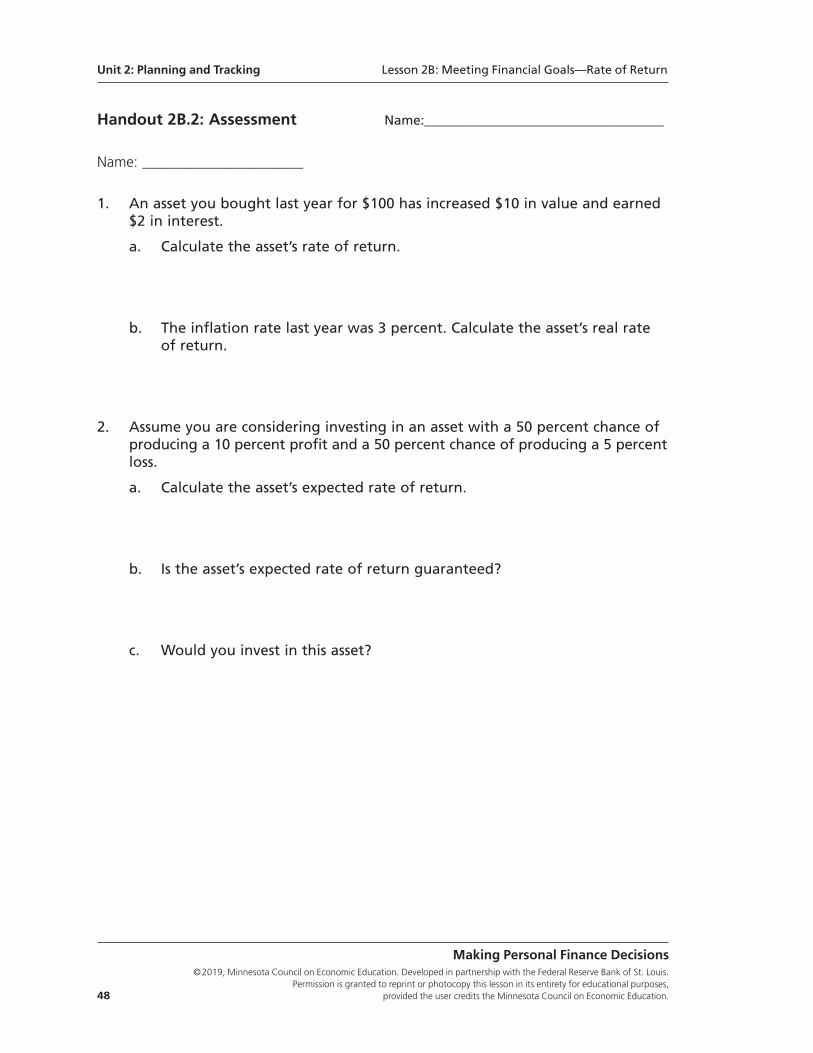
Handout 2B.2: Assessment Name:____________________________________
Name: ______________________
1. An asset you bought last year for $100 has increased $10 in value and earned $2 in interest.
a. Calculate the asset’s rate of return.
b. The inflation rate last year was 3 percent. Calculate the asset’s real rate of return.
2. Assume you are considering investing in an asset with a 50 percent chance of producing a 10 percent profit and a 50 percent chance of producing a 5 percentloss.
a. Calculate the asset’s expected rate of return.
b. Is the asset’s expected rate of return guaranteed?
c. Would you invest in this asset?
Making Personal Finance Decisions©2019, Minnesota Council on Economic Education. Developed in partnership with the Federal Reserve Bank of St. Louis.
Permission is granted to reprint or photocopy this lesson in its entirety for educational purposes, 48 provided the user credits the Minnesota Council on Economic Education.
Unit 2: Planning and Tracking Lesson 2B: Meeting Financial Goals—Rate of Return
Standards and BenchmarksNational Standards for Financial Literacy
Standard 5: Financial Investing. Financial investment is the purchase of financial assetsto increase income or wealth in the future. Investors must choose among investments thathave different risks and expected rates of return. Investments with higher expected rates ofreturn tend to have greater risk. Diversification of investment among a number of choicescan lower investment risk.
• Benchmarks: Grade 8
1. Financial assets include a wide variety of financial instruments including bank deposits, stocks, bonds, and mutual funds. Real estate and commodities are also often viewed as financial assets.
5. The rate of return on financial investments consists of interest payments, dividends, and capital appreciation expressed as a percentage of the amountinvested.
• Benchmark: Grade 12
1. The real return on a financial investment is the nominal return minus the rate of inflation.
Making Personal Finance Decisions©2019, Minnesota Council on Economic Education. Developed in partnership with the Federal Reserve Bank of St. Louis. Permission is granted to reprint or photocopy this lesson in its entirety for educational purposes, provided the user credits the Minnesota Council on Economic Education. 49
Lesson 2B: Meeting Financial Goals—Rate of Return Unit 2: Planning and Tracking

Making Personal Finance Decisions©2019, Minnesota Council on Economic Education. Developed in partnership with the Federal Reserve Bank of St. Louis.
Permission is granted to reprint or photocopy this lesson in its entirety for educational purposes, 50 provided the user credits the Minnesota Council on Economic Education.
Lesson 3A:
Investing in Yourself
Lesson DescriptionStudents perform calculations—with half the class given information to make thetask easier—to demonstrate the importance of human capital in increasing a person’sproductivity. They then look at the wages for various occupations and consider therole of human capital in explaining the differences in those wages.
Standards and Benchmarks (see page 62)
Grade Level9-12
ConceptsHuman capital
Income
Productivity
Wages
Unit 3Earning Income
Making Personal Finance Decisions©2019, Minnesota Council on Economic Education. Developed in partnership with the Federal Reserve Bank of St. Louis. Permission is granted to reprint or photocopy this lesson in its entirety for educational purposes, provided the user credits the Minnesota Council on Economic Education. 51
Rule 3: Invest in Yourself.The most important investment you will make in your life has nothing to do with buyinga house, a share of stock, or even gold. The most important investment you can make isin yourself. You will most likely earn income by working for someone else or by runningyour own business. In either case, you will need education, training, skills, experience,determination, and a positive attitude on an ongoing basis to earn a good wage or makea good profit. Without first investing in yourself, your ability to earn income falls, makingbudgeting, saving, investing, and reaching financial goals far more difficult. These lessonslook at the importance of building your human capital and explore personal attributeslikely to affect the career you choose.
Compelling QuestionHow are knowledge and skills related to income and unemployment?
ObjectivesStudents will be able to
• define human capital and describe ways to increase it and
• explain the relationship among human capital, wages, and the likelihood ofbeing unemployed.
Time Required45 minutes
Materials• Visual 3A.1: Wages by Occupation
• Visual 3A.2: Earnings and Unemployment by Education Level
• Handout 3A.1: Dividing by 9, one copy each for half the students in the class
• Handout 3A.2: Dividing by 9, one copy each for half the students in the class
• Handout 3A.3: Assessment, one copy for each student
• Internet access and computers for students to access the Occupational OutlookHandbook at http://www.bls.gov/ooh/ or provide one copy per student of severaloccupations from that website along with the median annual wage for all workers(To find the median annual wage for all workers, click the question mark by“Median Pay” on any occupation page.)
Procedure1. Begin the lesson by discussing the following:
• Why do people work? (Answers will vary but will likely include to earn money orto buy things.)
• Why do people want money? (Answers will vary but will likely include to buythings they want, to save to buy things they want in the future, or simply tosurvive.)
2. Point out that people desire goods and services to satisfy their wants. Because goodsand services are scarce, they have prices, making it necessary to earn income to pay
Unit 3: Earning Income Lesson 3A: Investing in Yourself
Making Personal Finance Decisions©2019, Minnesota Council on Economic Education. Developed in partnership with the Federal Reserve Bank of St. Louis.
Permission is granted to reprint or photocopy this lesson in its entirety for educational purposes, 52 provided the user credits the Minnesota Council on Economic Education.
for them. Income is the payment people earn for providing resources in the marketplace.
3. Explain that when people work, they provide human resources—labor—and in exchangeearn income in the form of wages (and salaries). Wages are the price producers payto use human resources. In the United States, 70 to 75 percent of all income earnedis in the form of wages.
4. Display Visual 3A.1: Wages by Occupation. Note the wide range of wages for differentoccupations. Tell the class you are going to conduct a little competition that will helpexplain these differences.
5. Distribute facedown a copy of Handout 3A.1: Dividing by 9 (the harder version) tostudents in the back half of the classroom and a copy of Handout 3A.2: Dividing by 9(the easier version) to students in the front half of the classroom. Although these twoactivities are different, act as if everyone in the class is getting the exact same activity.Give the following instructions:
• You may not turn over the handouts until I say “go.”
• When I say “go,” turn over the handout, read the directions, and then answeras many of the questions as you can.
• You must work independently and may not discuss the handout or share answers.
• When I say “stop,” immediately turn the handout facedown again.
• Finally, if you complete all of the problems before I say “stop,” turn the activityover and stand up at your seat.
6. Say “go” to start the activity. Allow the students to work until about one-half of thestudents with Handout 3A.2 (those in the front of the classroom with the easier version)are standing and then say “stop.” Have the class note which students are standingbefore asking them to sit down. (Most of the students standing will be in the fronthalf of the class, but there may also be some students standing in the other group.)Discuss the following:
• Why do you think some students were able to complete the questions faster thanothers? (Answers will vary but may include that the students have different mathabilities or that some students might not have been motivated to work hard.)
7. Tell the students that the two handouts were different—the students in the front halfof the class were given information that made it easier for them to answer the ques-tions. Read the directions on Handout 3A.2 (the easier version) to the class.
8. Have students exchange activities with each other for grading. (They may grade eitherhandout—the answers are the same for both.) Tell the students to record the correct
Lesson 3A: Investing in Yourself Unit 3: Earning Income
Making Personal Finance Decisions©2019, Minnesota Council on Economic Education. Developed in partnership with the Federal Reserve Bank of St. Louis. Permission is granted to reprint or photocopy this lesson in its entirety for educational purposes, provided the user credits the Minnesota Council on Economic Education. 53
answers as they are announced. Announce the answers and then instruct the studentsto pass the handouts back to the original owners.
Handouts 3A.1 and 3A.2: Dividing by 9—Answer Key
1. Yes 6. Yes
2. No 7. Yes
3. Yes 8. No
4. No 9. No
5. No 10. Yes
9. Have the students with Handout 3A.1 report their scores and write them on the board.Repeat for the students with Handout 3A.2. Calculate an average score for each group.
(Teacher note: The expected result is that those with Handout 3A.2 will have com-pleted more questions correctly—with typical results averaging about 5 for Handout3A.1 and 8 for Handout 3A.2. It is also likely that more students with Handout 3A.2stood up. Note that it is possible, however, that students without the extra informa-tion did as well because they either knew the extra information beforehand or weresimply very good at long division. It is also possible that students with the extra infor-mation did not do as well because they had trouble understanding it or were notmotivated to work quickly).
10. Explain that people’s ability to perform a task depends on their human capital. Definehuman capital as the knowledge and skills that people obtain through education,experience, and training. Human capital is also influenced by your natural talents, thephysical and mental shape of your body and mind, and your attitude toward work.Discuss the following:
• What effect does your human capital have on the wage you will be paid forworking? (Answers will vary, but students should recognize that greater humancapital will likely lead to higher wages.)
11. Remind students that wages are the income earned for providing human resources(labor) in the market. Wages are determined by supply and demand. As demonstratedby the activity, those students with more human capital—the extra knowledge—wereable to produce more correct calculations in the time allowed than those with lesshuman capital. Thus, increases in people’s human capital increase their productivity,or the amount of output that can be produced by those workers in a given amountof time.
12. Refer to the average number of correct responses for each group. Explain that if cor-rect answers were sold for $10 each, students in the group with greater human capitalwould be able to generate more correct answers, and thus more revenue, for a firmthat hires them.
Unit 3: Earning Income Lesson 3A: Investing in Yourself
Making Personal Finance Decisions©2019, Minnesota Council on Economic Education. Developed in partnership with the Federal Reserve Bank of St. Louis.
Permission is granted to reprint or photocopy this lesson in its entirety for educational purposes, 54 provided the user credits the Minnesota Council on Economic Education.
13. Multiply the averages for each group (calculated in Step 9) by $10 to show the revenuegenerated. (For example, if the averages were 8 and 5 correct answers, the averagerevenue generated would be $80 and $50, respectively.) Explain that firms would thusbe willing and able to pay more for the more productive workers. Or, in other words,the demand for these workers would be greater. Discuss the following:
• As you acquire more human capital, are there fewer or more other people whoare able to offer similar abilities and skills? Why? (Fewer. There are fewer peoplewith those skills and abilities because acquiring the human capital requires time,effort, and often money. Some people are willing and able to make the investmentof time, effort, and money, others are not.)
• If there are fewer people with particular skills and abilities, what is likely to happento the wages of those people? (The wages of those with particular human capitalare likely to be higher.)
14. Return to Visual 3A.1. Note that being a waitress or a cashier does not require a highlevel of human capital, so many people have these skills. A large supply of potentialworkers contributes to a lower wage. Meanwhile, the human capital required to be aphysician or engineer is much greater, so fewer people have these skills. A relativelysmall supply of potential workers contributes to a higher wage.
15. Display Visual 3A.2: and Unemployment by Education Level. Explain the following:
• A principal component of human capital is education. As would be expected,higher levels of education lead to greater human capital and thus higher wages.
• More human capital also leads to a lower likelihood of being unemployed.
• It is important to remember, however, that a college education is only one wayto increase your human capital. Skills may also be acquired through specializedvocational training (plumbing, welding, computer programming, and so on),developing and practicing a skill (art, music, sports, and so on), and/or acquiringwork experience.
Closure 16. Explain the following:
• Personal finance is about making decisions.
• Most personal finance decisions have to do with choosing how much to save,how to budget spending, what investments to make, and what insurance to buy.
• The starting point for all these decisions depends on how much income you areable to earn. The most important decision then is to decide how to invest in your-self by developing your human capital—you need to “learn to earn.”
Lesson 3A: Investing in Yourself Unit 3: Earning Income
Making Personal Finance Decisions©2019, Minnesota Council on Economic Education. Developed in partnership with the Federal Reserve Bank of St. Louis. Permission is granted to reprint or photocopy this lesson in its entirety for educational purposes, provided the user credits the Minnesota Council on Economic Education. 55
Assessment17. Distribute a copy of Handout 3A.3: Assessment to each student. If Internet access
is not available, provide copies of occupations as noted in the Materials section.Review the directions and allow students time to complete the handout (or assign as homework).
Handout 3A.3: Assessment—Answer Key
Direction: Pick an occupation that interests you from the Occupational OutlookHandbook at http://www.bls.gov/ooh/ (or the handout) and review the infor-mation for that occupation. If using the website, click the question mark nextto “Median Pay” to see the median annual wage for all workers. Answer thefollowing questions:
1. Which occupation did you choose?
2. What are the education requirements for that occupation?
3. What is the annual income of the occupation?
4. Is the pay for the occupation higher or lower than the median annual wage ofall workers?
5. Does the typical amount of training and education help explain why the wage ishigh or low?
6. Based on the pay and education requirements, would you expect people in thisoccupation to experience more or less unemployment?
Answers will vary based on the occupation chosen. In general, workers in occupationswith higher education requirements have higher median pay and are less likely to beunemployed. And, in general, workers in occupations with lower education require-ments have lower median pay and higher unemployment rates.
Unit 3: Earning Income Lesson 3A: Investing in Yourself
Making Personal Finance Decisions©2019, Minnesota Council on Economic Education. Developed in partnership with the Federal Reserve Bank of St. Louis.
Permission is granted to reprint or photocopy this lesson in its entirety for educational purposes, 56 provided the user credits the Minnesota Council on Economic Education.
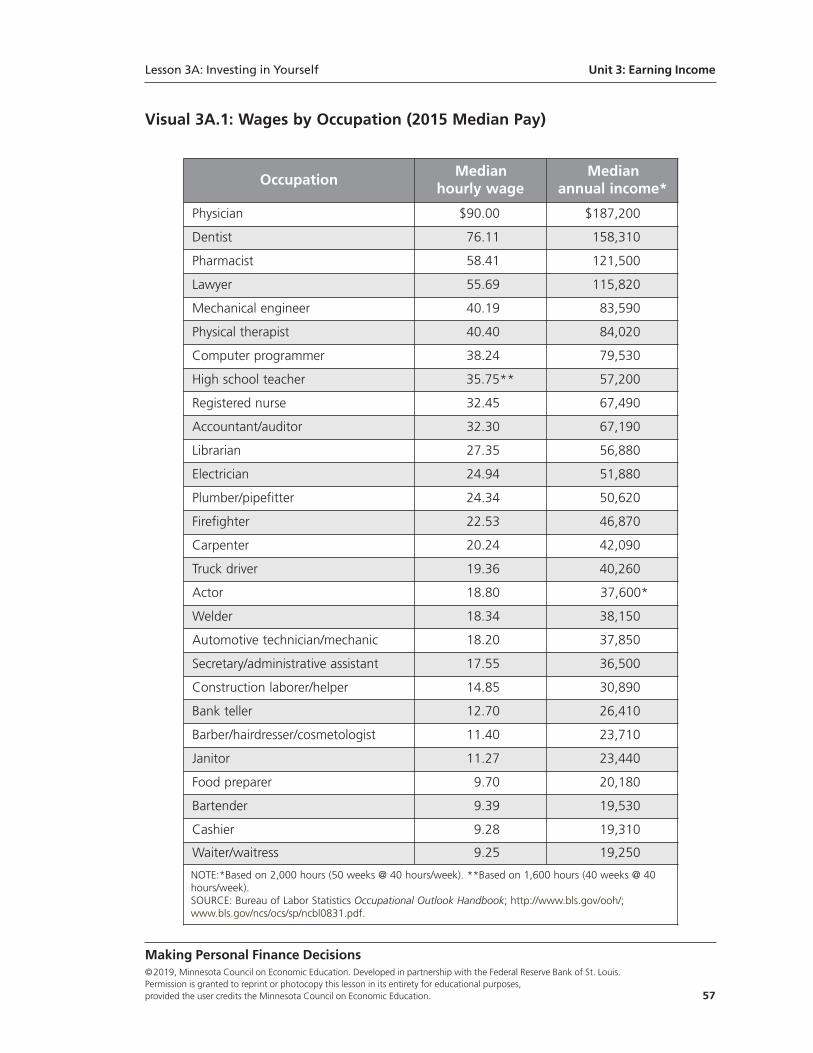
Visual 3A.1: Wages by Occupation (2015 Median Pay)
Lesson 3A: Investing in Yourself Unit 3: Earning Income
Making Personal Finance Decisions©2019, Minnesota Council on Economic Education. Developed in partnership with the Federal Reserve Bank of St. Louis. Permission is granted to reprint or photocopy this lesson in its entirety for educational purposes, provided the user credits the Minnesota Council on Economic Education. 57
OccupationMedian
hourly wageMedian
annual income*
Physician $90.00 $187,200
Dentist 76.11 158,310
Pharmacist 58.41 121,500
Lawyer 55.69 115,820
Mechanical engineer 40.19 83,590
Physical therapist 40.40 84,020
Computer programmer 38.24 79,530
High school teacher 35.75** 57,200
Registered nurse 32.45 67,490
Accountant/auditor 32.30 67,190
Librarian 27.35 56,880
Electrician 24.94 51,880
Plumber/pipefitter 24.34 50,620
Firefighter 22.53 46,870
Carpenter 20.24 42,090
Truck driver 19.36 40,260
Actor 18.80 37,600*
Welder 18.34 38,150
Automotive technician/mechanic 18.20 37,850
Secretary/administrative assistant 17.55 36,500
Construction laborer/helper 14.85 30,890
Bank teller 12.70 26,410
Barber/hairdresser/cosmetologist 11.40 23,710
Janitor 11.27 23,440
Food preparer 9.70 20,180
Bartender 9.39 19,530
Cashier 9.28 19,310
Waiter/waitress 9.25 19,250
NOTE:*Based on 2,000 hours (50 weeks @ 40 hours/week). **Based on 1,600 hours (40 weeks @ 40hours/week).SOURCE: Bureau of Labor Statistics Occupational Outlook Handbook; http://www.bls.gov/ooh/;www.bls.gov/ncs/ocs/sp/ncbl0831.pdf.
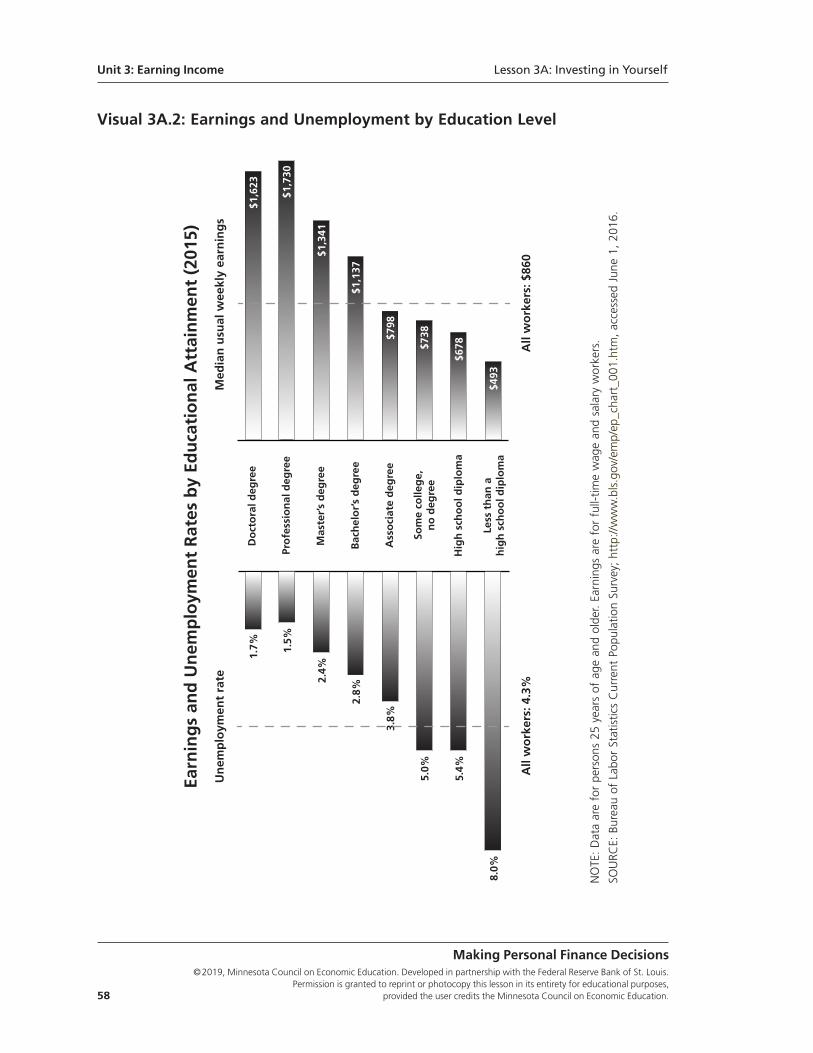
Unit 3: Earning Income Lesson 3A: Investing in Yourself
Making Personal Finance Decisions©2019, Minnesota Council on Economic Education. Developed in partnership with the Federal Reserve Bank of St. Louis.
Permission is granted to reprint or photocopy this lesson in its entirety for educational purposes, 58 provided the user credits the Minnesota Council on Economic Education.
Visual 3A.2: Earnings and Unemployment by Education Level
NOTE: Data are for persons 25 years of age and older. Earnings are for full-time wage and salary workers.
SOURCE: Bureau of Labor Statistics Current Population Survey; http://www.bls.gov/emp/ep_chart_001.htm, accessed June 1, 2016.
Pro
fess
ion
al d
egre
e
Do
cto
ral d
egre
e
Mas
ter’
s d
egre
e
Bac
hel
or’
s d
egre
e
Ass
oci
ate
deg
ree
Som
e co
lleg
e,n
o d
egre
e
Hig
h s
cho
ol d
iplo
ma
Less
th
an a
hig
h s
cho
ol d
iplo
ma
Med
ian
usu
al w
eekl
y ea
rnin
gs
Un
emp
loym
ent
rate
All
wo
rker
s: 4
.3%
All
wo
rker
s: $
860
1.7% 1.
5%
2.4%
2.8%
3.8%
5.0%
5.4%
8.0%
$1,6
23
$1,7
30
$1,3
41
$1,1
37
$798
$738
$678
$493
Earn
ing
s an
d U
nem
plo
ymen
t R
ates
by
Edu
cati
on
al A
ttai
nm
ent
(201
5)
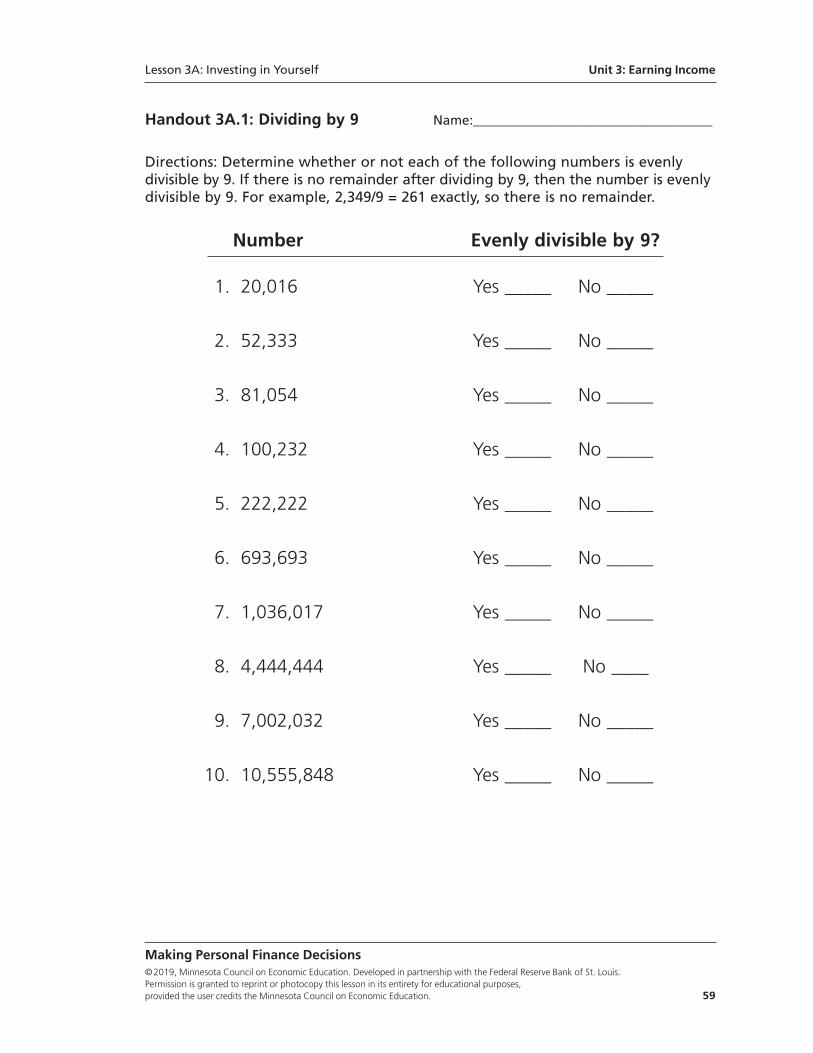
Handout 3A.1: Dividing by 9 Name:____________________________________
Directions: Determine whether or not each of the following numbers is evenlydivisible by 9. If there is no remainder after dividing by 9, then the number is evenlydivisible by 9. For example, 2,349/9 = 261 exactly, so there is no remainder.
Number Evenly divisible by 9?
1. 20,016 Yes _____ No _____
2. 52,333 Yes _____ No _____
3. 81,054 Yes _____ No _____
4. 100,232 Yes _____ No _____
5. 222,222 Yes _____ No _____
6. 693,693 Yes _____ No _____
7. 1,036,017 Yes _____ No _____
8. 4,444,444 Yes _____ No ____
9. 7,002,032 Yes _____ No _____
10. 10,555,848 Yes _____ No _____
Making Personal Finance Decisions©2019, Minnesota Council on Economic Education. Developed in partnership with the Federal Reserve Bank of St. Louis. Permission is granted to reprint or photocopy this lesson in its entirety for educational purposes, provided the user credits the Minnesota Council on Economic Education. 59
Lesson 3A: Investing in Yourself Unit 3: Earning Income
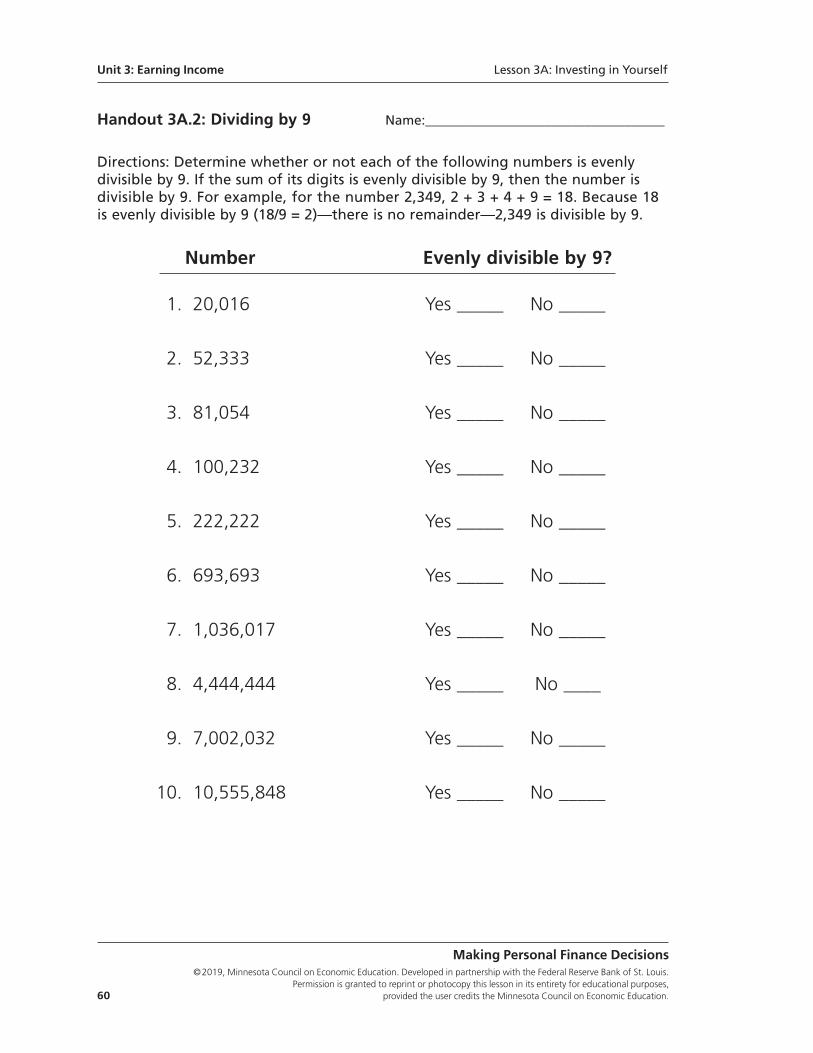
Handout 3A.2: Dividing by 9 Name:____________________________________
Directions: Determine whether or not each of the following numbers is evenlydivisible by 9. If the sum of its digits is evenly divisible by 9, then the number isdivisible by 9. For example, for the number 2,349, 2 + 3 + 4 + 9 = 18. Because 18is evenly divisible by 9 (18/9 = 2)—there is no remainder—2,349 is divisible by 9.
Number Evenly divisible by 9?
1. 20,016 Yes _____ No _____
2. 52,333 Yes _____ No _____
3. 81,054 Yes _____ No _____
4. 100,232 Yes _____ No _____
5. 222,222 Yes _____ No _____
6. 693,693 Yes _____ No _____
7. 1,036,017 Yes _____ No _____
8. 4,444,444 Yes _____ No ____
9. 7,002,032 Yes _____ No _____
10. 10,555,848 Yes _____ No _____
Unit 3: Earning Income Lesson 3A: Investing in Yourself
Making Personal Finance Decisions©2019, Minnesota Council on Economic Education. Developed in partnership with the Federal Reserve Bank of St. Louis.
Permission is granted to reprint or photocopy this lesson in its entirety for educational purposes, 60 provided the user credits the Minnesota Council on Economic Education.
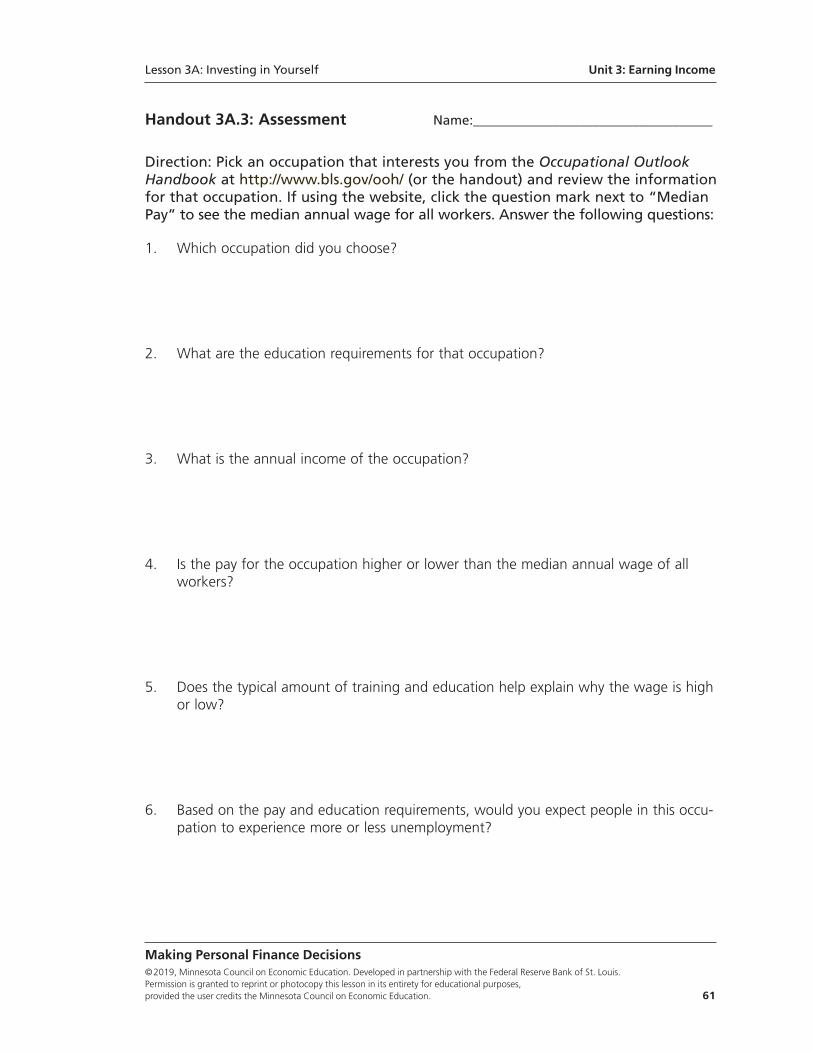
Handout 3A.3: Assessment Name:____________________________________
Direction: Pick an occupation that interests you from the Occupational OutlookHandbook at http://www.bls.gov/ooh/ (or the handout) and review the informationfor that occupation. If using the website, click the question mark next to “MedianPay” to see the median annual wage for all workers. Answer the following questions:
1. Which occupation did you choose?
2. What are the education requirements for that occupation?
3. What is the annual income of the occupation?
4. Is the pay for the occupation higher or lower than the median annual wage of allworkers?
5. Does the typical amount of training and education help explain why the wage is highor low?
6. Based on the pay and education requirements, would you expect people in this occu-pation to experience more or less unemployment?
Lesson 3A: Investing in Yourself Unit 3: Earning Income
Making Personal Finance Decisions©2019, Minnesota Council on Economic Education. Developed in partnership with the Federal Reserve Bank of St. Louis. Permission is granted to reprint or photocopy this lesson in its entirety for educational purposes, provided the user credits the Minnesota Council on Economic Education. 61
Standards and BenchmarksNational Standards for Financial Literacy
Standard 1: Earning Income. Income for most people is determined by the market valueof their labor, paid as wages and salaries. People can increase their income and job oppor-tunities by choosing to acquire more education, work experience, and job skills. The decisionto undertake an activity that increases income or job opportunities is affected by the expectedbenefits and costs of such an activity. Income also is obtained from other sources such asinterest, rents, capital gains, dividends, and profits.
• Grade 8 Benchmarks
2. People make many decisions over a lifetime about their education, jobs, and careers that affect their incomes and job opportunities.
3. Getting more education and learning new job skills can increase a person’s human capital and productivity.
4. People with less education and fewer job skills tend to earn lower incomes than people with more education and greater job skills.
5. Investment in education and training generally has a positive rate of return in terms of the income that people earn over a lifetime.
• Grade 12 Benchmarks
5. The wage or salary paid to workers in jobs is usually determined by the labor market. Businesses are generally willing to pay more productive workers higher wages or salaries than less productive workers.
Voluntary National Content Standards in Economics
Standard 13: Income. Income for most people is determined by the market value of theproductive resources they sell. What workers earn primarily depends on the market valueof what they produce.
• Grade 8 Benchmarks
4. More productive workers are likely to be of greater value to employers and earn higher wages than less productive workers.
5. Peoples’ incomes, in part, reflect choices they have made about education, training, skill development, and careers. People with few skills are more likely to be poor.
Unit 3: Earning Income Lesson 3A: Investing in Yourself
Making Personal Finance Decisions©2019, Minnesota Council on Economic Education. Developed in partnership with the Federal Reserve Bank of St. Louis.
Permission is granted to reprint or photocopy this lesson in its entirety for educational purposes, 62 provided the user credits the Minnesota Council on Economic Education.
Lesson 3B:
Entrepreneurship—Working for Yourself
Lesson DescriptionStudents are asked to volunteer for a potentially embarrassing task (which they ulti-mately do not have to perform) in return for a reward, which demonstrates a character-istic of entrepreneurs. They then take a personal assessment to discover other importantcharacteristics of entrepreneurs and determine how entrepreneurial they are based onthese characteristics.
Standards and Benchmarks (see page 73)
Grade Level9-12
ConceptEntrepreneurs
Making Personal Finance Decisions©2019, Minnesota Council on Economic Education. Developed in partnership with the Federal Reserve Bank of St. Louis. Permission is granted to reprint or photocopy this lesson in its entirety for educational purposes, provided the user credits the Minnesota Council on Economic Education. 63
Unit 3Earning Income
Rule 3: Invest in Yourself.The most important investment you will make in your life has nothing to do with buyinga house, a share of stock, or even gold. The most important investment you can make isin yourself. You will most likely earn income by working for someone else or by runningyour own business. In either case, you will need education, training, skills, experience,determination, and a positive attitude on an ongoing basis to earn a good wage or makea good profit. Without first investing in yourself, your ability to earn income falls, makingbudgeting, saving, investing, and reaching financial goals far more difficult. These lessonslook at the importance of building your human capital and explore personal attributeslikely to affect the career you choose.
Compelling QuestionWhat personal characteristics do entrepreneurs often have?
ObjectivesStudents will be able to
• define entrepreneurs and describe their role in the economy and
• describe personal characteristics entrepreneurs are likely to possess.
Time Required45 minutes
Materials• Visual 3B.1: Scoring Your Personal Assessment
• Visual 3B.2: Characteristics of Entrepreneurs
• Visual 3B.3: What Does Your Score Indicate?
• Handout 3B.1: My Personal Assessment, one copy for each student
• Handout 3B.2: Assessment, one copy for each student
• Container (e.g., hat or box) to hold slips of paper
• About 10 folded slips of paper (blank)
• Optional: small prizes (See Procedure Step 1)
PreparationPlace the folded slips of paper in the container.
Procedure1. Show the container filled with slips of paper. Explain that each slip of paper describes
an action that the person who draws the slip must perform in front of the class—someof the actions may be a bit embarrassing. Each volunteer who draws a slip and doeswhat it says will receive a prize (e.g., extra credit points or a treat of some kind). Inaddition, they will be allowed to create a new slip with a new action to place in the hat.
2. Ask for volunteers willing to select slips to come to the front of the class. (Usually therewill be some, but certainly not all students. Should no one volunteer, increase the
Making Personal Finance Decisions©2019, Minnesota Council on Economic Education. Developed in partnership with the Federal Reserve Bank of St. Louis.
Permission is granted to reprint or photocopy this lesson in its entirety for educational purposes, 64 provided the user credits the Minnesota Council on Economic Education.
Unit 3: Earning Income Lesson 3B: Entrepreneurship—Working for Yourself
prize.) Once the volunteers are assembled, tell the class they won’t really be playingthe game—you just wanted to see who would be willing. Reward each volunteer withthe prize offered without having them draw any slips. Have them remain standing infront of the class.
3. Explain that entrepreneurs are individuals willing to take risks to develop new prod-ucts and start new business. They recognize opportunities, enjoy working for themselves,and accept challenges. Discuss the following:
• How were the volunteers like entrepreneurs? (They were willing to take a risk,accept a challenge, and try something new.)
• What risk did they take? (They had no idea what was written on the slips ofpaper. Acting something out in front of the class could have been embarrassing.)
• What was their potential reward? (Extra credit points or whatever else was offered)
• Why are entrepreneurs important to the economy? (When entrepreneurs developnew products and start new businesses, it results in new, innovative productsfor consumers to buy and the production of these products provides new jobopportunities for workers. These products often increase productivity and con-tribute to economic growth.)
4. Point out that all of the volunteers took the risk of embarrassing themselves eitherbecause they thought the reward was worth it and/or because they were intrigued bywhat they might have to do or excited to create a new slip of their own. Thank thevolunteers and ask them to return to their seats.
5. Distribute a copy of Handout 3B.1: My Personal Assessment to each student. Instructthe students to complete the assessment by circling the answers that best describe howthey feel. Explain that there are no right or wrong answers. Allow time for students tocomplete the assessment.
6. Display Visual 3B.1: Scoring Your Personal Assessment. Instruct the students to scoreeach answer based on the points on the visual. For example, a “B” answer to ques-tion 1 would score 2 points. Write the scores for each question in the short blank nextto the number. They are to calculate the total and write it at the top of the page.Allow time for students to calculate their scores.
7. Display Visual 3B.2: Characteristics of Entrepreneurs. Instruct the students to workindependently or in groups to match each characteristic on the visual with the questionon the assessment that addresses that characteristic. Write the characteristic in thelong blank next to the score. Allow time for students to work and then review theanswers (provided below).
Making Personal Finance Decisions©2019, Minnesota Council on Economic Education. Developed in partnership with the Federal Reserve Bank of St. Louis. Permission is granted to reprint or photocopy this lesson in its entirety for educational purposes, provided the user credits the Minnesota Council on Economic Education. 65
Lesson 3B: Entrepreneurship—Working for Yourself Unit 3: Earning Income
1. Competitive 10. Sociable
2. Desires achievement 11. Creative
3. Willing to work hard 12. Doesn’t fear failure
4. Self-motivated 13. Able to plan and organize
5. Willing and able to lead 14. Willing and able to make decisions
6. Highly energetic 15. Willing and able to solve problems
7. Positive attitude 16. Willing to persevere
8. Willing to take risks 17. Self-reliant
9. Self-confident
8. Display Visual 3B.3: What Does Your Score Indicate? Explain that the higher thescore, the more entrepreneurial traits they tend to have. Also point out that being anentrepreneur is not for everyone. People can be rewarded and satisfied as much ormore by being successful managers or simply great employees.
Closure 9. Tell students that they can work for themselves or someone else. Either way they will
need to develop skills and attitudes (i.e., human capital) to be successful.
Assessment10. Distribute a copy of Handout 3B:2: Assessment to each student and allow time for
students to work (or assign as homework).
Handout 3B:2: Assessment—Answer Key
Directions: Write a few paragraphs explaining the following:
• What is an entrepreneur, and why are entrepreneurs important to the economy?
• Are you interested in developing new products or starting a business?
• What do your assessment results suggest about whether you might enjoy beingan entrepreneur?
Students should explain that entrepreneurs take risks to develop new products andstart new businesses. They are important to the economy because the new productsthey develop and new businesses they start create new jobs—thus income—for peo-ple. Students should then reflect on their personal preference for entrepreneurshipand their assessment results.
Making Personal Finance Decisions©2019, Minnesota Council on Economic Education. Developed in partnership with the Federal Reserve Bank of St. Louis.
Permission is granted to reprint or photocopy this lesson in its entirety for educational purposes, 66 provided the user credits the Minnesota Council on Economic Education.
Unit 3: Earning Income Lesson 3B: Entrepreneurship—Working for Yourself
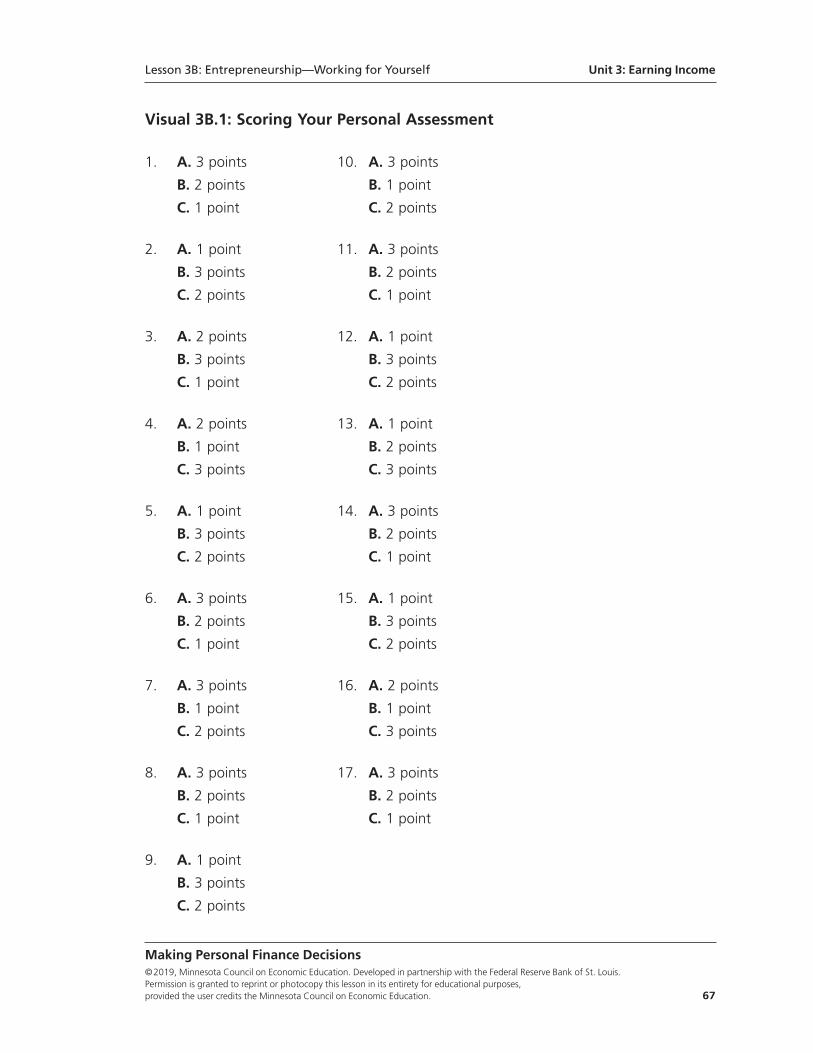
Visual 3B.1: Scoring Your Personal Assessment
1. A. 3 points 10. A. 3 points
B. 2 points B. 1 point
C. 1 point C. 2 points
2. A. 1 point 11. A. 3 points
B. 3 points B. 2 points
C. 2 points C. 1 point
3. A. 2 points 12. A. 1 point
B. 3 points B. 3 points
C. 1 point C. 2 points
4. A. 2 points 13. A. 1 point
B. 1 point B. 2 points
C. 3 points C. 3 points
5. A. 1 point 14. A. 3 points
B. 3 points B. 2 points
C. 2 points C. 1 point
6. A. 3 points 15. A. 1 point
B. 2 points B. 3 points
C. 1 point C. 2 points
7. A. 3 points 16. A. 2 points
B. 1 point B. 1 point
C. 2 points C. 3 points
8. A. 3 points 17. A. 3 points
B. 2 points B. 2 points
C. 1 point C. 1 point
9. A. 1 point
B. 3 points
C. 2 points
Making Personal Finance Decisions©2019, Minnesota Council on Economic Education. Developed in partnership with the Federal Reserve Bank of St. Louis. Permission is granted to reprint or photocopy this lesson in its entirety for educational purposes, provided the user credits the Minnesota Council on Economic Education. 67
Lesson 3B: Entrepreneurship—Working for Yourself Unit 3: Earning Income
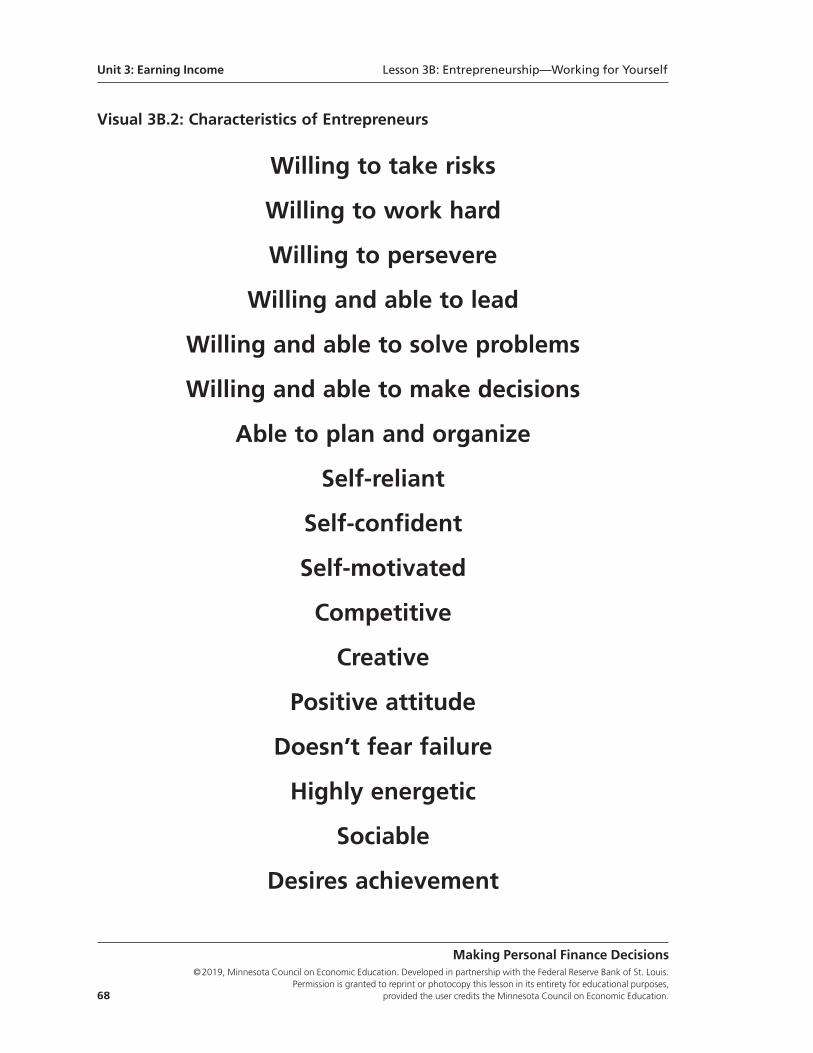
Visual 3B.2: Characteristics of Entrepreneurs
Willing to take risks
Willing to work hard
Willing to persevere
Willing and able to lead
Willing and able to solve problems
Willing and able to make decisions
Able to plan and organize
Self-reliant
Self-confident
Self-motivated
Competitive
Creative
Positive attitude
Doesn’t fear failure
Highly energetic
Sociable
Desires achievement
Making Personal Finance Decisions©2019, Minnesota Council on Economic Education. Developed in partnership with the Federal Reserve Bank of St. Louis.
Permission is granted to reprint or photocopy this lesson in its entirety for educational purposes, 68 provided the user credits the Minnesota Council on Economic Education.
Unit 3: Earning Income Lesson 3B: Entrepreneurship—Working for Yourself
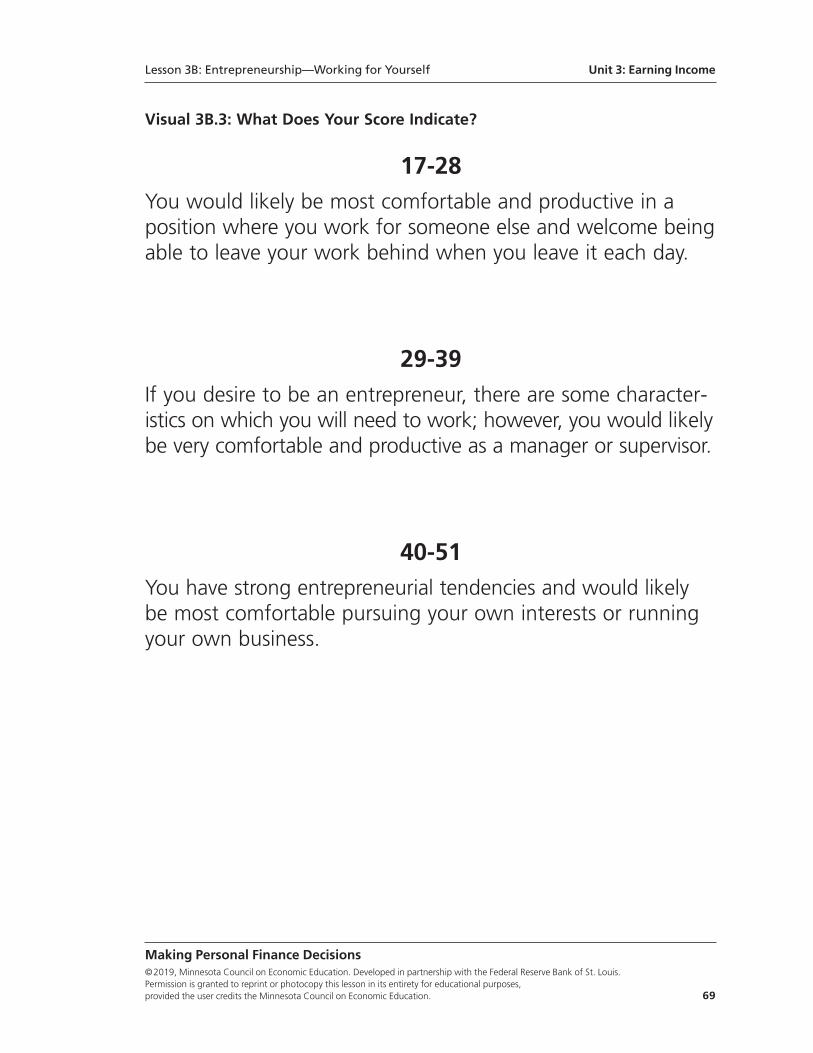
Visual 3B.3: What Does Your Score Indicate?
17-28You would likely be most comfortable and productive in aposition where you work for someone else and welcome beingable to leave your work behind when you leave it each day.
29-39If you desire to be an entrepreneur, there are some character-istics on which you will need to work; however, you would likelybe very comfortable and productive as a manager or supervisor.
40-51You have strong entrepreneurial tendencies and would likelybe most comfortable pursuing your own interests or runningyour own business.
Making Personal Finance Decisions©2019, Minnesota Council on Economic Education. Developed in partnership with the Federal Reserve Bank of St. Louis. Permission is granted to reprint or photocopy this lesson in its entirety for educational purposes, provided the user credits the Minnesota Council on Economic Education. 69
Lesson 3B: Entrepreneurship—Working for Yourself Unit 3: Earning Income
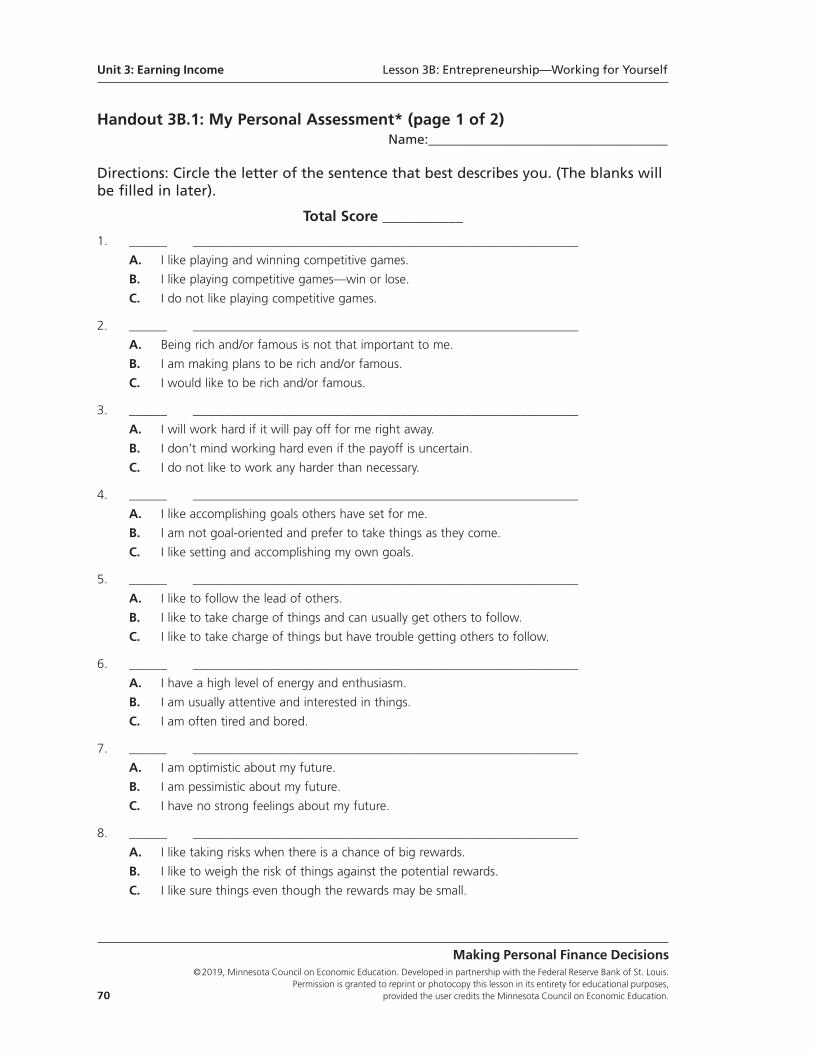
Handout 3B.1: My Personal Assessment* (page 1 of 2) Name:____________________________________
Directions: Circle the letter of the sentence that best describes you. (The blanks willbe filled in later).
Total Score ___________
1. ______ _____________________________________________________________
A. I like playing and winning competitive games.
B. I like playing competitive games—win or lose.
C. I do not like playing competitive games.
2. ______ _____________________________________________________________
A. Being rich and/or famous is not that important to me.
B. I am making plans to be rich and/or famous.
C. I would like to be rich and/or famous.
3. ______ _____________________________________________________________
A. I will work hard if it will pay off for me right away.
B. I don’t mind working hard even if the payoff is uncertain.
C. I do not like to work any harder than necessary.
4. ______ _____________________________________________________________
A. I like accomplishing goals others have set for me.
B. I am not goal-oriented and prefer to take things as they come.
C. I like setting and accomplishing my own goals.
5. ______ _____________________________________________________________
A. I like to follow the lead of others.
B. I like to take charge of things and can usually get others to follow.
C. I like to take charge of things but have trouble getting others to follow.
6. ______ _____________________________________________________________
A. I have a high level of energy and enthusiasm.
B. I am usually attentive and interested in things.
C. I am often tired and bored.
7. ______ _____________________________________________________________
A. I am optimistic about my future.
B. I am pessimistic about my future.
C. I have no strong feelings about my future.
8. ______ _____________________________________________________________
A. I like taking risks when there is a chance of big rewards.
B. I like to weigh the risk of things against the potential rewards.
C. I like sure things even though the rewards may be small.
Making Personal Finance Decisions©2019, Minnesota Council on Economic Education. Developed in partnership with the Federal Reserve Bank of St. Louis.
Permission is granted to reprint or photocopy this lesson in its entirety for educational purposes, 70 provided the user credits the Minnesota Council on Economic Education.
Unit 3: Earning Income Lesson 3B: Entrepreneurship—Working for Yourself
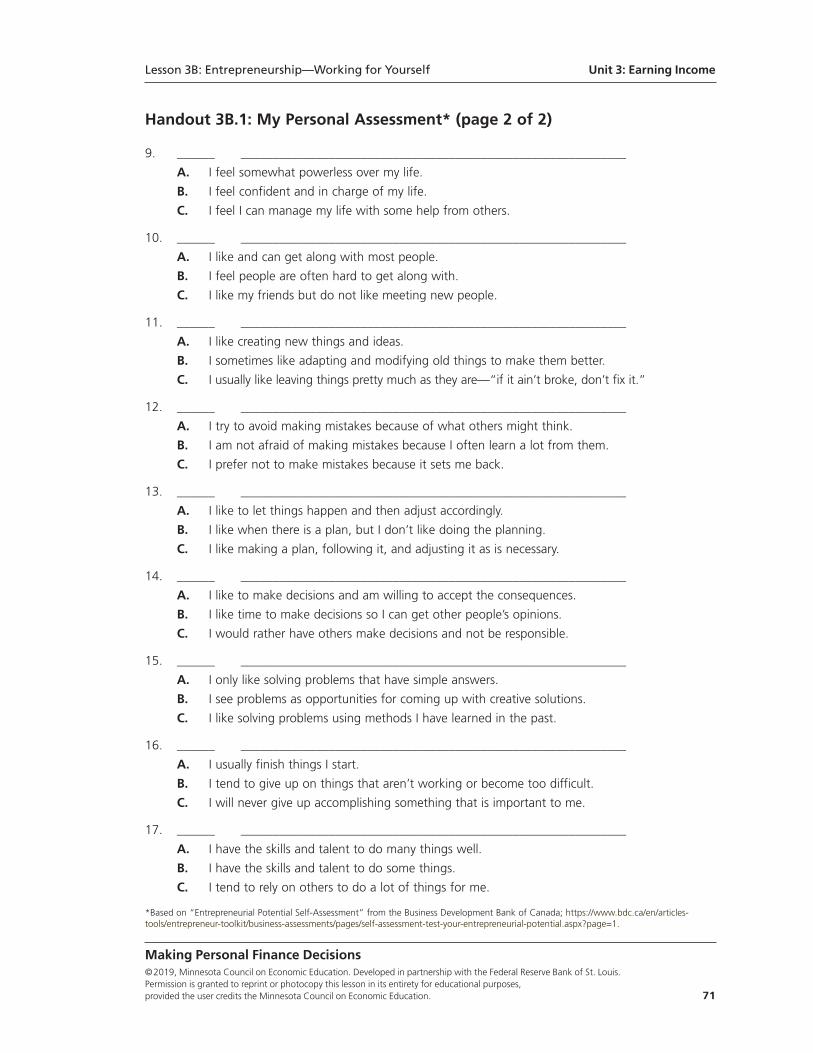
Handout 3B.1: My Personal Assessment* (page 2 of 2)
9. ______ _____________________________________________________________
A. I feel somewhat powerless over my life.
B. I feel confident and in charge of my life.
C. I feel I can manage my life with some help from others.
10. ______ _____________________________________________________________
A. I like and can get along with most people.
B. I feel people are often hard to get along with.
C. I like my friends but do not like meeting new people.
11. ______ _____________________________________________________________
A. I like creating new things and ideas.
B. I sometimes like adapting and modifying old things to make them better.
C. I usually like leaving things pretty much as they are—“if it ain’t broke, don’t fix it.”
12. ______ _____________________________________________________________
A. I try to avoid making mistakes because of what others might think.
B. I am not afraid of making mistakes because I often learn a lot from them.
C. I prefer not to make mistakes because it sets me back.
13. ______ _____________________________________________________________
A. I like to let things happen and then adjust accordingly.
B. I like when there is a plan, but I don’t like doing the planning.
C. I like making a plan, following it, and adjusting it as is necessary.
14. ______ _____________________________________________________________
A. I like to make decisions and am willing to accept the consequences.
B. I like time to make decisions so I can get other people’s opinions.
C. I would rather have others make decisions and not be responsible.
15. ______ _____________________________________________________________
A. I only like solving problems that have simple answers.
B. I see problems as opportunities for coming up with creative solutions.
C. I like solving problems using methods I have learned in the past.
16. ______ _____________________________________________________________
A. I usually finish things I start.
B. I tend to give up on things that aren’t working or become too difficult.
C. I will never give up accomplishing something that is important to me.
17. ______ _____________________________________________________________
A. I have the skills and talent to do many things well.
B. I have the skills and talent to do some things.
C. I tend to rely on others to do a lot of things for me.
Making Personal Finance Decisions©2019, Minnesota Council on Economic Education. Developed in partnership with the Federal Reserve Bank of St. Louis. Permission is granted to reprint or photocopy this lesson in its entirety for educational purposes, provided the user credits the Minnesota Council on Economic Education. 71
*Based on “Entrepreneurial Potential Self-Assessment” from the Business Development Bank of Canada; https://www.bdc.ca/en/articles-tools/entrepreneur-toolkit/business-assessments/pages/self-assessment-test-your-entrepreneurial-potential.aspx?page=1.
Lesson 3B: Entrepreneurship—Working for Yourself Unit 3: Earning Income
Handout 3B.2: Assessment Name:____________________________________
Directions: Write a few paragraphs explaining the following:
• What is an entrepreneur, and why are entrepreneurs important to the economy?
• Are you interested in developing new products or starting a business?
• What do your assessment results suggest about whether you might enjoy being anentrepreneur?
Making Personal Finance Decisions©2019, Minnesota Council on Economic Education. Developed in partnership with the Federal Reserve Bank of St. Louis.
Permission is granted to reprint or photocopy this lesson in its entirety for educational purposes, 72 provided the user credits the Minnesota Council on Economic Education.
Unit 3: Earning Income Lesson 3B: Entrepreneurship—Working for Yourself
Standards and BenchmarksVoluntary National Content Standards in Economics
Standard 14: Entrepreneurship. Entrepreneurs take on the calculated risk of starting newbusinesses, either by embarking on new ventures similar to existing ones or by introducingnew innovations. Entrepreneurial innovation is an important source of economic growth.
• Benchmark: Grade 8
2. Entrepreneurs organize resources to produce goods and services because they expect to earn profits.
• Benchmark: Grade 12
3. Productivity and efficiency gains that result from innovative practices of entrepreneurs foster long-term economic growth.
National Standards for Financial Literacy
Standard 1: Earning Income. Income for most people is determined by the market valueof their labor, paid as wages and salaries. People can increase their income and job opportu-nities by choosing to acquire more education, work experience, and job skills. The decisionto undertake an activity that increases income or job opportunities is affected by the expectedbenefits and costs of such an activity. Income also is obtained from other sources such asinterest, rents, capital gains, dividends, and profits.
• Benchmark: Grade 8
8. Entrepreneurs take the risk of starting a business because they expect to earnprofits as their reward, despite the fact that many new businesses can and do fail. Some entrepreneurs gain satisfaction from working for themselves.
Making Personal Finance Decisions©2019, Minnesota Council on Economic Education. Developed in partnership with the Federal Reserve Bank of St. Louis. Permission is granted to reprint or photocopy this lesson in its entirety for educational purposes, provided the user credits the Minnesota Council on Economic Education. 73
Lesson 3B: Entrepreneurship—Working for Yourself Unit 3: Earning Income

Making Personal Finance Decisions©2019, Minnesota Council on Economic Education. Developed in partnership with the Federal Reserve Bank of St. Louis.
Permission is granted to reprint or photocopy this lesson in its entirety for educational purposes, 74 provided the user credits the Minnesota Council on Economic Education.
Lesson 4A:
What Are Taxes For?
Lesson DescriptionStudents participate in an activity that demonstrates the difference between privateand public goods to show why it is necessary for the government to provide somegoods and services. They also participate in an activity to understand why the govern-ment redistributes some tax revenue as income to others.
Standards and Benchmarks (see page 84)
Grade Level9-12
ConceptsIncome distribution
Nonexcludability
Nonrivalry
Private goods
Public goods
Transfer payments
Unit 4
Paying Taxes
Making Personal Finance Decisions©2019, Minnesota Council on Economic Education. Developed in partnership with the Federal Reserve Bank of St. Louis. Permission is granted to reprint or photocopy this lesson in its entirety for educational purposes, provided the user credits the Minnesota Council on Economic Education. 75
Rule 4: Contribute your share.The difference between gross income and net income is the money that must be paid intaxes to various levels of government. People have a say in how taxes are collected andspent primarily through the people they elect to run the government. These lessons lookat what the government does with tax revenue—spends it on goods and services—andhow taxes are structured and collected.
Compelling Question Why does the government provide public goods and transfer payments?
ObjectivesStudents will be able to
• describe the characteristics of a public good or service and provide examples,
• explain why public goods are often provided by the government,
• explain why the government may wish to redistribute income, and
• explain that the government uses tax revenue to buy goods and services.
Time Required45 minutes
Materials• Visual 4A.1: Two Boxes
• Handout 4A:1: Assessment, one copy for each student
• Classroom $10 bills, two for each student
• One piece of blank paper for each student
Procedure1. Display Visual 4A.1: Two Boxes and instruct the students to draw two similar boxes
on a sheet of paper and label them “1” and “2.” Explain the following:
• Imagine you each have 10 tokens that can be placed into these boxes and turnedinto treats. You get to decide how many of your 10 tokens you wish to place ineach box.
• For each token you place in Box 1, you will receive 1 treat. So, if you place 7 ofyour 10 tokens in Box 1, you will receive 7 treats.
• The number of treats you will receive from Box 2 will depend on the total numberof tokens placed in Box 2 by the entire class. For every ____ tokens (this numbershould be half the class size, rounded to the next whole number if there is an oddnumber) placed in Box 2 by the class, each student in the class will receive onetreat—regardless of whether you placed any tokens in Box 2. For example, if theclass has 24 students, then for every 12 tokens placed in Box 2, each studentwould receive 1 treat. If the sum of the tokens placed in Box 2 were 64, theneach student would receive 5 treats (64/12 = 5.33, so 5 treats).
Unit 4: Paying Taxes Lesson 4A: What Are Taxes For?
Making Personal Finance Decisions©2019, Minnesota Council on Economic Education. Developed in partnership with the Federal Reserve Bank of St. Louis.
Permission is granted to reprint or photocopy this lesson in its entirety for educational purposes, 76 provided the user credits the Minnesota Council on Economic Education.
2. To clarify student understanding, discuss the following:
• How many treats will you receive if you put all of your tokens in Box 1? (10)
• How many treats will each of you receive if all of you put all of your tokens inBox 2? (Total students× 10)/Half the class size = Treats per student. For example,for a class of 24, the number of treats would be the following: [24 × 10]/12 = 20,or 240/12 = 20.)
3. Explain that Box 2 potentially pays off twice as well as Box 1—20 treats versus 10 treats.Discuss the following:
• Is everyone placing all of his or her tokens in Box 2 the best choice for everyonein the class? (Answers will vary.)
• Point out that if a student places all of her or his tokens in Box 1 while the restof the class places all their tokens in Box 2, the student would get 10 treats fromBox 1 plus likely more than 10 treats from Box 2. For one student in a class of24, this scenario would be calculated as follows:
Box 1 = 10 Tokens
Box 2 = 230/12 = 19.167 (so, 19 tokens)
10 + 19 = 29 Tokens
4. Instruct the students to write how many of their 10 tokens they wish to allocate toeach box—not allowing anyone to see their choices. Tell them to write their name atthe top of the paper and then fold the paper in half and turn it in.
5. Go through the papers and total the number of tokens allocated to Box 2, and thencalculate the number of treats Box 2 provides per student and announce it to the class:
______________________ ÷ ______________________ = ______________________
Total tokens in Box 2 Half the class size Total treats per student
6. Determine the total number of treats for each student by adding the number of treatsreceived from Box 2 to the number of treats received from Box 1. (Students who putmost of their tokens in Box 1 will end up with the most treats. However, because many[likely] chose to put their tokens in Box 1, the total number of treats each studentreceives is usually less than what they could have been earned had everybody puttheir tokens in Box 2.)
7. Calculate the total treats earned by the class based on their allocations as follows:Determine the number of treats generated from Box 2 (The answer in Step 5 timesthe number of students in the class). Add this to the total number of tokens allocatedto Box 1. To easily calculate the Box 1 total, determine the total number of tokens in
Lesson 4A: What Are Taxes For? Unit 4: Paying Taxes
Making Personal Finance Decisions©2019, Minnesota Council on Economic Education. Developed in partnership with the Federal Reserve Bank of St. Louis. Permission is granted to reprint or photocopy this lesson in its entirety for educational purposes, provided the user credits the Minnesota Council on Economic Education. 77
the class (10 times the number of students in the class) and subtract the total numberof tokens placed in Box 2 (which you determined in Step 5).
8. Compare the total treats generated by everyone in the class with what could havebeen generated (already determined in Step 2) had everyone put all their tokens inBox 2. (The number is generally less, sometimes significantly less.)
9. Explain that the class did not do a very good job of turning tokens into treats. Theycould have had more treats had everyone placed their tokens in Box 2. If they think ofthe tokens as “dollars” and the treats as “goods and services,” then what just hap-pened was not a very good deal—they could have gotten a lot more for their money.
10. Explain that the two boxes represent two different types of goods as follows:
• Box 1 represents private goods, while Box 2 represents public goods.
• A public good has two characteristics that make it different from a private good:
i. nonrivalry, which means one person’s benefit from a good or service doesn’t reduce the benefit available to others from that good or service, and
ii. nonexcludability, which means it isn’t possible to keep those who don’t pay for a good or service (free riders) from obtaining the benefits from thatgood or service.
11. Provide examples of public goods, emphasizing the two characteristics above. Examplesinclude national defense; public television; over-the-air radio/television broadcasts;natural environments (rainforests, parks, wildlife habitats, and wilderness areas); afireworks display; the services of lighthouses and highways; mosquito control; andstreet lighting. (For example, if someone decides to spray mosquito nesting areas toreduce mosquitoes in an area, no one in that area can be excluded from receiving thebenefits—even if they did not help pay for the service.)
12. Explain the following:
• People often assume that other people will buy public goods so that they canspend their own money on private goods and end up with both public and privategoods.
• For example, a person may watch public television and enjoy the programs butnever pledge money to support public television. Others do contribute. As a result,the non-supporter—the free rider—is able to benefit from the public televisionprogramming and spend what he or she might have contributed on other goodsand services.
Unit 4: Paying Taxes Lesson 4A: What Are Taxes For?
Making Personal Finance Decisions©2019, Minnesota Council on Economic Education. Developed in partnership with the Federal Reserve Bank of St. Louis.
Permission is granted to reprint or photocopy this lesson in its entirety for educational purposes, 78 provided the user credits the Minnesota Council on Economic Education.
• As the classroom activity demonstrated, we all have the same tendency. Becausethose who might provide public goods can’t exclude those who don’t pay forusing them, few people are willing to provide public goods or services themselves.
• The government typically provides public goods that are nonrival and nonexclud-able along with selected other goods and services that society wants. The govern-ment pays for these goods and services by collecting taxes.
• The government also makes transfer payments, which are payments made bythe government to people who do not supply goods or services or labor inexchange for those payments.
13. Distribute two classroom $10 bills to each student. Tell the students they are going toparticipate in an activity that will help them understand why the government transfersfunds to other groups of people in society. Explain the following:
• Each of you is going to choose two pizzas to buy—pepperoni and/or vegetarian.
• The pizzas are $10 each.
• You may buy either kind with your $20, but can afford only two pizzas each.
14. Ask each student what they would like to order and tally the orders by the two pizzatypes, noting the students’ names with their orders. Each student may order twopepperoni pizzas, two vegetarian pizzas, or one of each. Collect the money—$20 perstudent.
15. Report the results: ____ pepperoni; ____ vegetarian. (The sum should be equal to thenumber of $10 bills distributed.)
16. Redistribute the $10 bills. Give the students who chose the least-ordered pizza (likelyvegetarian) four to six bills and give the remaining students none or one $10 bill.
17. Again, ask each student how many of each kind of pizza they would like to buy, recorda tally on the board, and collect the money. (Students with more dollars will be ableto buy more pizzas—that is, a student with six $10 bills can buy six pizzas in any com-bination, while a student with no bills can’t buy any pizzas.)
18. Report the results: ____ pepperoni; ____ vegetarian. (Given that the vegetarian lovershad more money, more vegetarian pizzas will likely be ordered, although the totalsum of pizzas should still be the same—equal to the number of $10 bills.) Discuss thefollowing:
• How did the mix of pizzas change between pepperoni and vegetarian? (Most willsay something about how those with the most money got more of what theywanted.)
Lesson 4A: What Are Taxes For? Unit 4: Paying Taxes
Making Personal Finance Decisions©2019, Minnesota Council on Economic Education. Developed in partnership with the Federal Reserve Bank of St. Louis. Permission is granted to reprint or photocopy this lesson in its entirety for educational purposes, provided the user credits the Minnesota Council on Economic Education. 79
• How do you feel about this change? (Some might comment that the seconddistribution wasn’t “fair” because some students got more money than others.)
19. Explain that the activity shows how income distribution—the way income is distrib-uted among individuals in a society—affects the mix of goods and services producedand consumed in an economy. Essentially, each dollar of income or wealth a personspends is like one vote on what gets produced and consumed. Discuss the following:
• Is this type of “voting” fair? (Answers will vary. Some students will say “yes”because they believe those with more income or wealth earned it by workinghard or making good choices. Other students will say “no” because they believenot everyone has the same opportunities to earn income or that each person’sdesires should count equally.)
20. Remind students that a person’s income or wealth is based on the quality and quantityof resources they have to sell—most notably their human resources (labor). Explainthe following:
• For a variety of reasons, some people are not able to earn an income by usingtheir human resources: They may be too young or old to work, disabled andunable to work, or willing and able to work but unemployed because they cannotfind a job with the skills they have.
• In each case, these people likely earn little to no income. As demonstrated inthe pizza activity, they might be able to purchase only a few goods and servicesor possibly none at all.
• The government often taxes those with more income and redistributes the moneythrough transfer payments to those who have very little or no income.
• Transfer programs include welfare programs for the poor, unemployment benefitsfor the unemployed, and Social Security benefits for the disabled and elderly.
Closure21. Explain that the lesson has focused on two reasons the government collects taxes:
(i) to provide public goods and (ii) to redistribute income to the disadvantaged to pur-chase private goods and services. In both cases, taxes end up being used to buy goodsand services.
Assessment22. Distribute a copy of Handout 4A.1: Assessment to each student and allow time for
students to work (or assign as homework).
Unit 4: Paying Taxes Lesson 4A: What Are Taxes For?
Making Personal Finance Decisions©2019, Minnesota Council on Economic Education. Developed in partnership with the Federal Reserve Bank of St. Louis.
Permission is granted to reprint or photocopy this lesson in its entirety for educational purposes, 80 provided the user credits the Minnesota Council on Economic Education.
Handout 4A.1: Assessment—Answer Key
Directions: Write at least one paragraph for each numbered item.
1. The government collects taxes to pay for public goods.
• Summarize the characteristics of a public good. (Public goods are nonexclud-able and nonrival.)
• Explain how the government pays for public goods. (The government collectstaxes to pay for them.)
• Explain why the government is better suited to provide national defense thanopen a chain of fast-food restaurants. (National defense is a public good. Itis both nonexcludable and nonrival. As such, private firms will not produce national defense because they will not be able to earn a profit. Rather, private firms are well suited to produce private goods such as fast food, which is both excludable and rival.)
2. The government also collects taxes to redistribute income.
• Explain how the dollars spent by consumers act as votes for what producers decide to produce. (Producers produce what consumers want to buy becausethey want to earn a profit. So spending on a specific good or service provides an incentive for producers to produce that good or service.)
• How do transfer payments change what gets produced? (Transfer payments change the demand for what gets produced by reducing the “votes” of those with high incomes and wealth and increasing the votes of those withsmaller incomes and wealth.)
• Explain how some people see transfer payments as making society fairer, while others see this redistribution as unfair. (Some see income redistributionas a way to provide for those with little income and address income inequalityin society. It gives those with little or no income a higher standard of living and more opportunity than they would have had otherwise. Some see redistribution as unfair because it takes income from people who worked to earn it and gives it to people who did not work to earn it.)
Lesson 4A: What Are Taxes For? Unit 4: Paying Taxes
Making Personal Finance Decisions©2019, Minnesota Council on Economic Education. Developed in partnership with the Federal Reserve Bank of St. Louis. Permission is granted to reprint or photocopy this lesson in its entirety for educational purposes, provided the user credits the Minnesota Council on Economic Education. 81
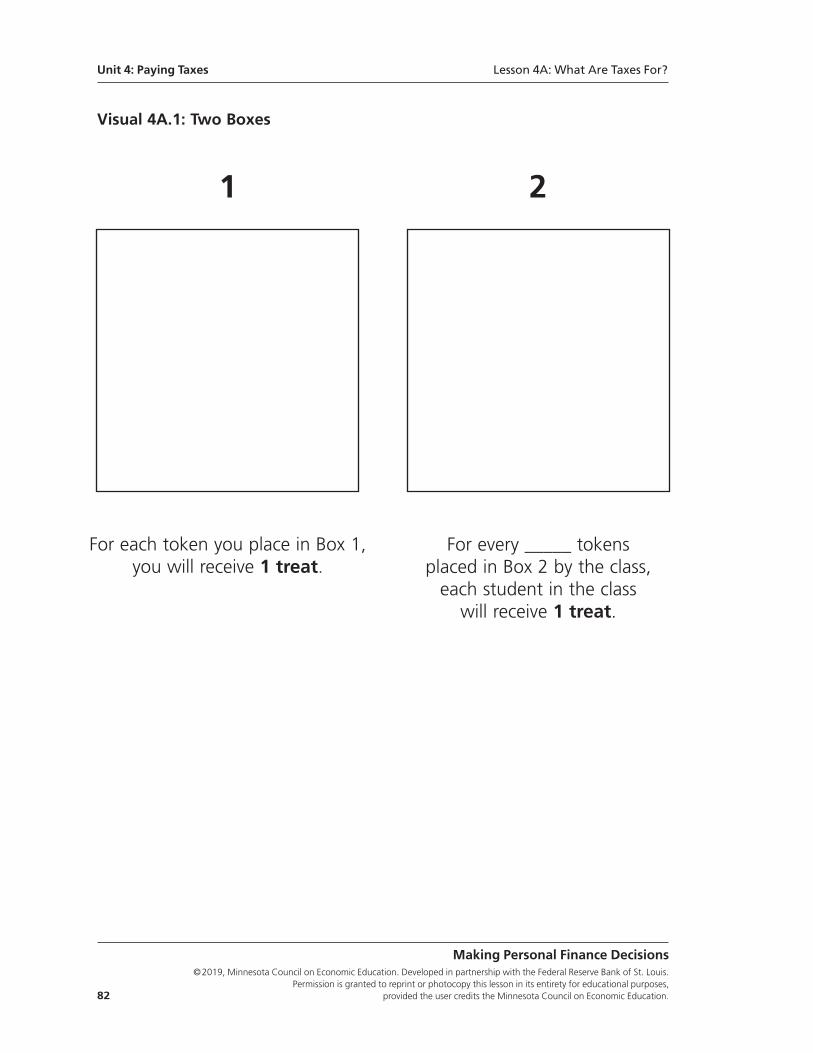
Unit 4: Paying Taxes Lesson 4A: What Are Taxes For?
Making Personal Finance Decisions©2019, Minnesota Council on Economic Education. Developed in partnership with the Federal Reserve Bank of St. Louis.
Permission is granted to reprint or photocopy this lesson in its entirety for educational purposes, 82 provided the user credits the Minnesota Council on Economic Education.
Visual 4A.1: Two Boxes
1 2
For each token you place in Box 1, you will receive 1 treat.
For every _____ tokens placed in Box 2 by the class, each student in the class
will receive 1 treat.
Handout 4A:1: Assessment Name:____________________________________
Directions: Write at least one paragraph for each numbered item.
1. The government collects taxes to pay for public goods.
• Summarize the characteristics of a public good.
• Explain how the government pays for public goods.
• Explain why government is better suited to provide national defense than opena chain of fast-food restaurants.
2. The government also collects taxes to redistribute income.
• Explain how the dollars spent by consumers act as votes for what producersdecide to produce.
• How do transfer payments change what gets produced?
• Explain how some people see transfer payments as making society fairer, whileothers see this redistribution as unfair.
Making Personal Finance Decisions©2019, Minnesota Council on Economic Education. Developed in partnership with the Federal Reserve Bank of St. Louis. Permission is granted to reprint or photocopy this lesson in its entirety for educational purposes, provided the user credits the Minnesota Council on Economic Education. 83
Lesson 4A: What Are Taxes For? Unit 4: Paying Taxes
Standards and BenchmarksVoluntary National Content Standards in Economics
Standard 16: Role of Government and Market Failure. There is an economic role forgovernment in a market economy whenever the benefits of a government policy outweighits costs. Governments often provide for national defense, address environmental concerns,define and protect property rights, and attempt to make markets more competitive. Mostgovernment policies also have direct or indirect effects on people’s incomes.
• Benchmarks: Grade 8
1. Public goods and services provide benefits to more than one person at a time, and their use cannot be restricted to only those people who have paidto use them.
2. If a good or service cannot be withheld from those who do not pay for it, producers expect to be unable to sell it and, therefore, will not produce it. Governments provide some of these goods and services.
• Benchmark: Grade 12
9. Governments often redistribute income directly when individuals or interestgroups are not satisfied with the income distribution resulting from markets;governments also redistribute income indirectly as side-effects of other government actions that affect prices or output levels for various goods and services.
National Standards for Financial Literacy
Standard 1: Earning Income. Income for most people is determined by the market valueof their labor, paid as wages and salaries. People can increase their income and job oppor-tunities by choosing to acquire more education, work experience, and job skills. The decisionto undertake an activity that increases income or job opportunities is affected by the expectedbenefits and costs of such an activity. Income also is obtained from other sources such asinterest, rents, capital gains, dividends, and profits.
• Benchmarks: Grade 12
5. The wage or salary paid to workers in jobs is usually determined by the labor market. Businesses are generally willing to pay more productive workers higher wages or salaries than less productive workers.
7. Taxes are paid to federal, state, and local governments to fund governmentgoods and services and transfer payments from government to individuals. The major types of taxes are income taxes, payroll (Social Security) taxes, property taxes, and sales taxes.
Unit 4: Paying Taxes Lesson 4A: What Are Taxes For?
Making Personal Finance Decisions©2019, Minnesota Council on Economic Education. Developed in partnership with the Federal Reserve Bank of St. Louis.
Permission is granted to reprint or photocopy this lesson in its entirety for educational purposes, 84 provided the user credits the Minnesota Council on Economic Education.
Lesson 4B:
Understanding Taxes
Lesson DescriptionStudents discuss factors that make various taxes different: bases, rates, structures,methods of collection, and the level of government imposing the tax. They learn asimple tax formula and information about four common types of taxes (income, payroll,sales, and property). Students apply this knowledge to calculate for three householdsthe total taxes paid and net income based on gross income and expenditures.
Standards and Benchmarks (see page 99)
Grade Level9-12
ConceptsGross income
Net income (disposable income)
Tax base
Tax rate
Tax structures (progressive, proportional, and regressive)
Types of taxes (income, payroll, sales, and property)
Making Personal Finance Decisions©2019, Minnesota Council on Economic Education. Developed in partnership with the Federal Reserve Bank of St. Louis. Permission is granted to reprint or photocopy this lesson in its entirety for educational purposes, provided the user credits the Minnesota Council on Economic Education. 85
Rule 4: Contribute your share.The difference between gross income and net income is the money that must be paid intaxes to various levels of government. People have a say in how taxes are collected andspent primarily through the people they elect to run the government. These lessons lookat what the government does with tax revenue—spends it on goods and services—andhow taxes are structured and collected.
Unit 4
Paying Taxes
Compelling Question How do various types of taxes affect people differently?
ObjectivesStudents will be able to
• define and use a simple tax formula (tax base × tax rate) to determine the amountof taxes paid;
• explain and recognize tax structures;
• describe the most common types of taxes—income, payroll, sales, and property;and
• calculate a household’s total taxes and net income based on that household’sgross income and expenditures.
Materials• Visuals 4.B1: Tax Structures
• Visual 4.B2: Characteristics of Common Taxes (Optional: One copy of Visual 4B.2for each student)
• Handout 4B.1: Calculating Taxes and Net Income, one copy for each student andone copy for the teacher to use as a visual
• Handout 4B.1 Calculating Taxes and Net Income—Part B Answer Key
• Handout 4B.2 Assessment, one copy for each student
• Handout 4B.2 Assessment—Answer Key
Time Required45 minutes
Procedure1. Begin the class by discussing the following:
• What taxes do people, including yourself, have to pay? (Answers will vary, butstudents will likely note sales taxes or many other taxes such as income taxes,excise taxes, tariffs, property taxes, or payroll taxes.)
• Are all these taxes the same? (No)
• What makes them different from each other? (Answers will vary but will likelyfocus on the tax rate, what the tax is collected for, or how and when the taxesare paid.)
Making Personal Finance Decisions©2019, Minnesota Council on Economic Education. Developed in partnership with the Federal Reserve Bank of St. Louis.
Permission is granted to reprint or photocopy this lesson in its entirety for educational purposes, 86 provided the user credits the Minnesota Council on Economic Education.
Unit 4: Paying Taxes Lesson 4B: Understanding Taxes
2. Explain that this lesson will look at the most common taxes people pay and how thesetaxes differ. For most taxes, the dollar amount paid is determined by multiplying thetax base by a tax rate.
3. Display Visual 4B.1: Tax Structures and refer to the equation at the top. Explain thefollowing:
• Capital B is the tax base—typically, the dollar value of something such as income,property, or an amount spent for a good or service.
• Lowercase t is the tax rate—usually expressed as a percentage or decimal, forexample, 6 percent or 0.06.
• Capital T is the amount of taxes paid. For example, if the tax base is $10,000 andthe tax rate is 5 percent (or 0.05), the taxes paid would be $500 ($10,000 × 0.05).Note that when writing the formula, the decimal expression of the tax rate is used.
• Taxes paid may differ based on the tax base and the tax rate.
• The tax structure describes how the tax rate changes as the size of the tax basechanges.
4. Refer to the three tax structures on Visual 4B.1: progressive, proportional (flat), andregressive. Explain each as follows:
Progressive Tax
• With a progressive tax, the tax rate increases as the base increases—People withhigher base amounts pay a larger percentage of the base in taxes than thosewith lower base amounts.
Proportional (Flat) Tax
• With a proportional tax, the tax rate stays the same for all tax base amounts.
• A proportional tax is also called a flat tax—everyone pays the same tax rateregardless of the amount of the tax base.
Regressive Tax
• With a regressive tax, the tax rate decreases as the tax base increases. That is,people with higher base amounts pay a lower percentage of the base in taxesthan those with lower base amounts.
• With a regressive tax, although those with higher bases pay a lower tax rate,they still pay more taxes in terms of dollars.
• The structure of the tax does not depend on the amount of taxes paid in dollarsbut on how the tax rate changes as the size of the tax base changes. (In eachexample on Visual 4B.2: Characteristics of Common Taxes, those with the highertax base pay more taxes in terms of dollars).
Making Personal Finance Decisions©2019, Minnesota Council on Economic Education. Developed in partnership with the Federal Reserve Bank of St. Louis. Permission is granted to reprint or photocopy this lesson in its entirety for educational purposes, provided the user credits the Minnesota Council on Economic Education. 87
Lesson 4B: Understanding Taxes Unit 4: Paying Taxes
5. Display Visual 4B.2. (Option: Distribute a copy of Visual 4B.2 to each student.) Explainthat the chart summarizes characteristics of four common taxes people pay with respectto the tax base, the tax structure (described in Step 4), how the tax is collected, andwhich level of government imposes the tax. Discuss each as follows:
Income Tax
• The tax base for income tax is the income, or money, people earn from any source.
• Most people earn income by working (providing their human resources in themarketplace), which is called wage or salary income. People can also earn incomein the form of interest on their savings, dividends from their stocks, rents on prop-erty owned, royalties on copyrighted material, profits from a small business, andother ways.
• Federal incomes taxes have a progressive rate structure, as do most state incometaxes.
Payroll Tax
• The tax base for payroll taxes is only wage and salary income—not all income.For example, income earned from interest is not subject to payroll taxes.
• Typically, both the wage earner—the employee—and his or her employer paypayroll taxes on the wages earned (and usually the tax rate paid by both is thesame, although it doesn’t have to be). For example, if a wage earner earned $400during a pay period and the payroll tax was 6 percent, $24 ($400 × 0.06) wouldbe deducted for payroll taxes from the employee’s check, and the employer wouldalso have to pay $24. The government would thus receive $48 in payroll taxes(which is 12 percent of the employee’s wages).
• Payroll taxes may be capped at a certain income level. Beyond that cap, neitherthe wage earner nor the employer pays any additional payroll taxes. For example,in 2016, the income cap on the Social Security portion of payroll taxes was$118,500. So, this tax would be proportional below $118,500 but regressive atwage levels above $118,500 (the tax rate would fall as wages earned exceededthe cap). For example, a person with wages of $237,000, which is twice the cap,would be paying half the stated payroll tax rate since only half of that person’sincome would be subject to the tax.
• In 2016, the Medicare portion of payroll taxes was uncapped and had a tax rateof 1.45 percent, making it a proportional tax.
Sales Tax
• The tax base for sales taxes is the purchase amount of the good and service.
• Sales tax is usually a fixed percentage. It is a proportional tax based on the pur-chase amount.
• Relative to income, however, sales taxes tend to be regressive because peoplewith lower incomes spend a larger percentage of their incomes on goods andservices.
Making Personal Finance Decisions©2019, Minnesota Council on Economic Education. Developed in partnership with the Federal Reserve Bank of St. Louis.
Permission is granted to reprint or photocopy this lesson in its entirety for educational purposes, 88 provided the user credits the Minnesota Council on Economic Education.
Unit 4: Paying Taxes Lesson 4B: Understanding Taxes
• For example, consider a 5 percent sales tax. A household with a $25,000 incomemight spend 80 percent of that income ($20,000) on goods and services andthus pay $1,000 ($20,000 × 0.05) in sales tax. In contrast, a household with a$100,000 income might spend 60 percent of that income ($60,000) on goodsand services and pay $3,000 ($60,000 × 0.05) in sales tax. Relative to theirincomes, the lower-income household would be paying 4 percent of its income($1,000/$25,000) in sales taxes, while the higher-income household would bepaying only 3 percent ($3,000/$100,000).
• Many states recognize that sales taxes are regressive and thus exclude some items(those most often purchased by lower-income households, such as food andclothing) from sales tax to make the tax less regressive.
• The federal government also collects taxes on the purchase of certain items, suchas cigarettes, tires, and gasoline. Such sales taxes on specific items are calledexcise taxes and have different tax rates for different items.
Property Tax
• The base for a property tax (also called a real estate or personal property tax) istypically the assessed value of the land and house a household owns.
• The assessed value is often based on the “market value,” which is the estimatedprice that the property would sell for. Property taxes are usually proportional.
6. Distribute a copy of Handout 4B.1: Calculating Taxes and Net Income to each student.Give the following example to show how to use the income tax table on the handoutto calculate taxes owed:
• Suppose a household has an income of $76,000.
• This amount is “over $40,000 but not over $100,000,” so the tax should becalculated using line 3 of the table.
• The income tax owed would be $7,000 plus 25 percent of the amount over$40,000.
• The amount over $40,000 is $36,000 ($76,000 – $40,000 = $36,000).
• $36,000 × 0.25 = $9,000.
• The total tax owed is $16,000 ($7,000 + $9,000).
7. Arrange students in small groups and instruct them to complete Part A of Handout 4B.1.Allow time for students to complete the activity and then review their answers.
Making Personal Finance Decisions©2019, Minnesota Council on Economic Education. Developed in partnership with the Federal Reserve Bank of St. Louis. Permission is granted to reprint or photocopy this lesson in its entirety for educational purposes, provided the user credits the Minnesota Council on Economic Education. 89
Lesson 4B: Understanding Taxes Unit 4: Paying Taxes
Handout 4B.1—Part A Answer Key
a. Proportional and progressive: The income tax is proportional up to $10,000 andthen progressive for all remaining income levels.
b. Proportional and regressive: The payroll tax is proportional for wage/salaryincome up to $100,000 and then regressive for wage/salary above $100,000.
c. Regressive: The payroll tax is regressive if the household has any non-wageincome (e.g., interest and dividends).
d. Proportional
e. Regressive: The sales tax is regressive relative to income, assuming lower-incomehouseholds spend a larger portion of their income on goods and services.
f. Proportional
8. Explain the following:
• Gross income is the amount people earn before any deductions or taxes arepaid.
• Net (or disposable) income is all income received (gross income) minus taxes.
• Households can basically do two things with their net income: spend it on goodsand services (including contributions to others to purchase goods and services)or save it.
• A household’s gross income is the sum of the taxes it pays, the amount it spends,and the amount it saves.
9. Choose one of the following options for students to complete Part B of Handout 4B.1:
• Have students work in groups of three, with one student assigned to each house-hold and students assisting each other as necessary. Allow time for students towork and then display Handout 4B.1—Part B Answer Key and review the answers.
• Assign Handout 4B.1 as homework. Discuss the answers the next day in classusing Handout 4B.1—Part B Answer Key.
Closure 10. Explain the following:
• The government imposes many different types of taxes.
• It is important to understand different tax types because they determine the netincome you have available to spend and/or save.
• Because of taxes, your net income will generally be less than the income youreceive from working and other sources.
Making Personal Finance Decisions©2019, Minnesota Council on Economic Education. Developed in partnership with the Federal Reserve Bank of St. Louis.
Permission is granted to reprint or photocopy this lesson in its entirety for educational purposes, 90 provided the user credits the Minnesota Council on Economic Education.
Unit 4: Paying Taxes Lesson 4B: Understanding Taxes
• The various levels of government set taxes, including what is taxed, and the taxbase, and tax rates. As such, the government determines the tax structure.
• Households choose the taxes they pay primarily through the people they elect torun the government.
Assessment11. Distribute a copy of Handout 4B.2: Assessment to each student. Review the directions
and allow time for students to work (or assign as homework). Review the answerswith Handout 4B.2—Answer Key.
Making Personal Finance Decisions©2019, Minnesota Council on Economic Education. Developed in partnership with the Federal Reserve Bank of St. Louis. Permission is granted to reprint or photocopy this lesson in its entirety for educational purposes, provided the user credits the Minnesota Council on Economic Education. 91
Lesson 4B: Understanding Taxes Unit 4: Paying Taxes
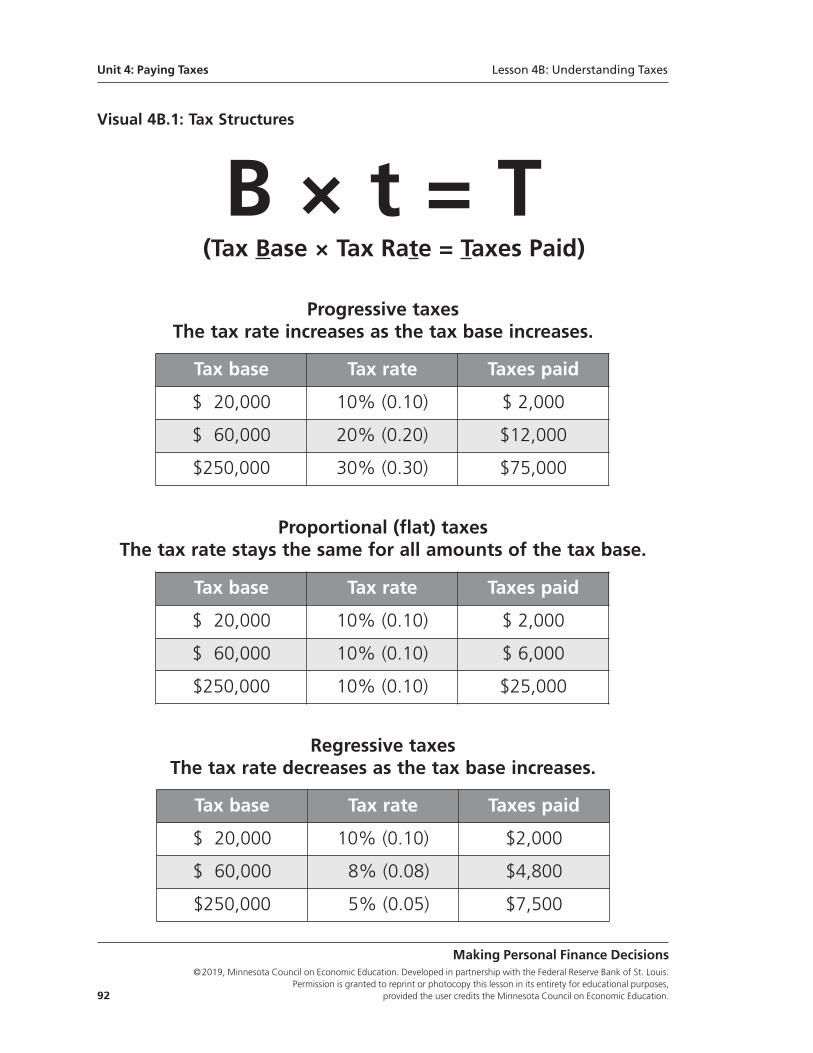
Visual 4B.1: Tax Structures
B × t = T(Tax Base × Tax Rate = Taxes Paid)
Making Personal Finance Decisions©2019, Minnesota Council on Economic Education. Developed in partnership with the Federal Reserve Bank of St. Louis.
Permission is granted to reprint or photocopy this lesson in its entirety for educational purposes, 92 provided the user credits the Minnesota Council on Economic Education.
Tax base Tax rate Taxes paid
$ 20,000 10% (0.10) $ 2,000
$ 60,000 20% (0.20) $12,000
$250,000 30% (0.30) $75,000
Tax base Tax rate Taxes paid
$ 20,000 10% (0.10) $ 2,000
$ 60,000 10% (0.10) $ 6,000
$250,000 10% (0.10) $25,000
Tax base Tax rate Taxes paid
$ 20,000 10% (0.10) $2,000
$ 60,000 8% (0.08) $4,800
$250,000 5% (0.05) $7,500
Progressive taxesThe tax rate increases as the tax base increases.
Proportional (flat) taxesThe tax rate stays the same for all amounts of the tax base.
Regressive taxesThe tax rate decreases as the tax base increases.
Unit 4: Paying Taxes Lesson 4B: Understanding Taxes
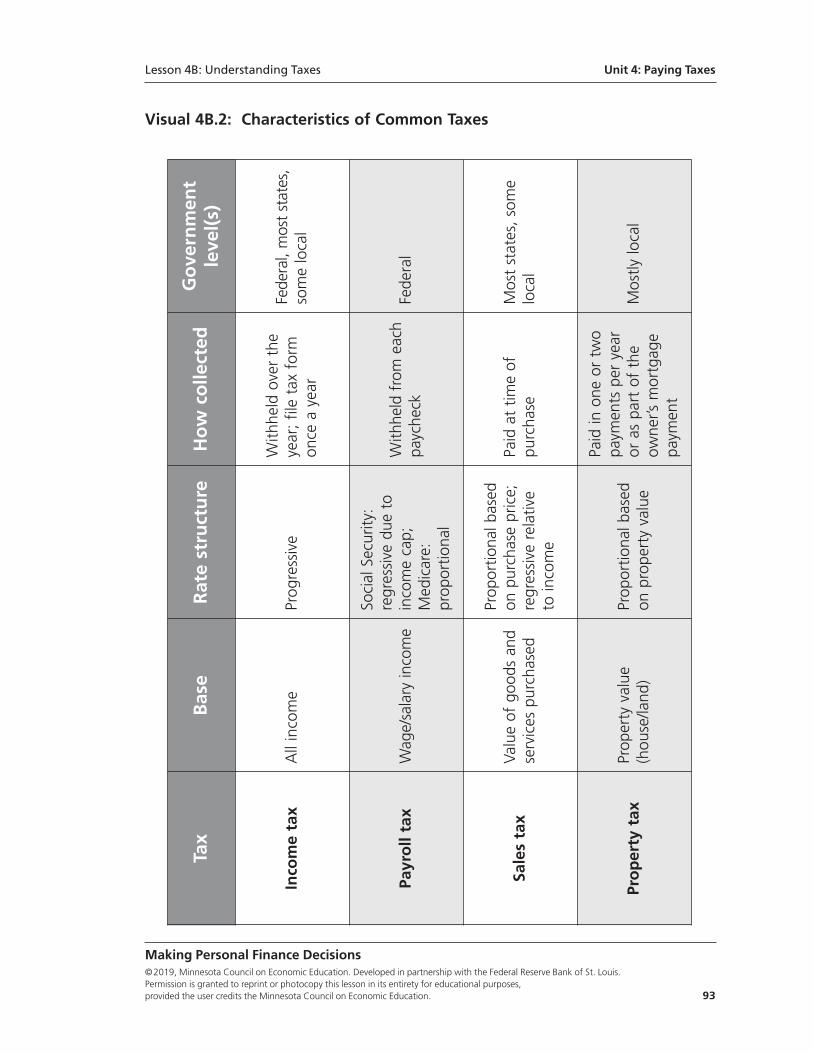
Visual 4B.2: Characteristics of Common Taxes
Making Personal Finance Decisions©2019, Minnesota Council on Economic Education. Developed in partnership with the Federal Reserve Bank of St. Louis. Permission is granted to reprint or photocopy this lesson in its entirety for educational purposes, provided the user credits the Minnesota Council on Economic Education. 93
Tax
Base
Rate structure
How colle
cted
Gove
rnmen
tleve
l(s)
Inco
me tax
All inco
me
Prog
ressive
With
held ove
r th
eye
ar; file tax fo
rmon
ce a yea
r
Fede
ral, mos
t states,
some loca
l
Payroll tax
Wag
e/salary in
come
Social Sec
urity
:regres
sive
due
to
inco
me ca
p;M
edicare:
prop
ortio
nal
With
held from eac
hpa
yche
ckFe
deral
Sales tax
Value of
goo
ds and
services
purch
ased
Prop
ortio
nal b
ased
on purch
ase pr
ice;
regres
sive
relative
to in
come
Paid at tim
e of
pu
rcha
seM
ost states
, so
me
loca
l
Property tax
Prop
erty value
(hou
se/la
nd)
Prop
ortio
nal b
ased
on prope
rty va
lue
Paid in
one
or tw
opa
ymen
ts per yea
ror
as pa
rt of th
eow
ner’s
mor
tgag
epa
ymen
t
Mos
tly lo
cal
Lesson 4B: Understanding Taxes Unit 4: Paying Taxes
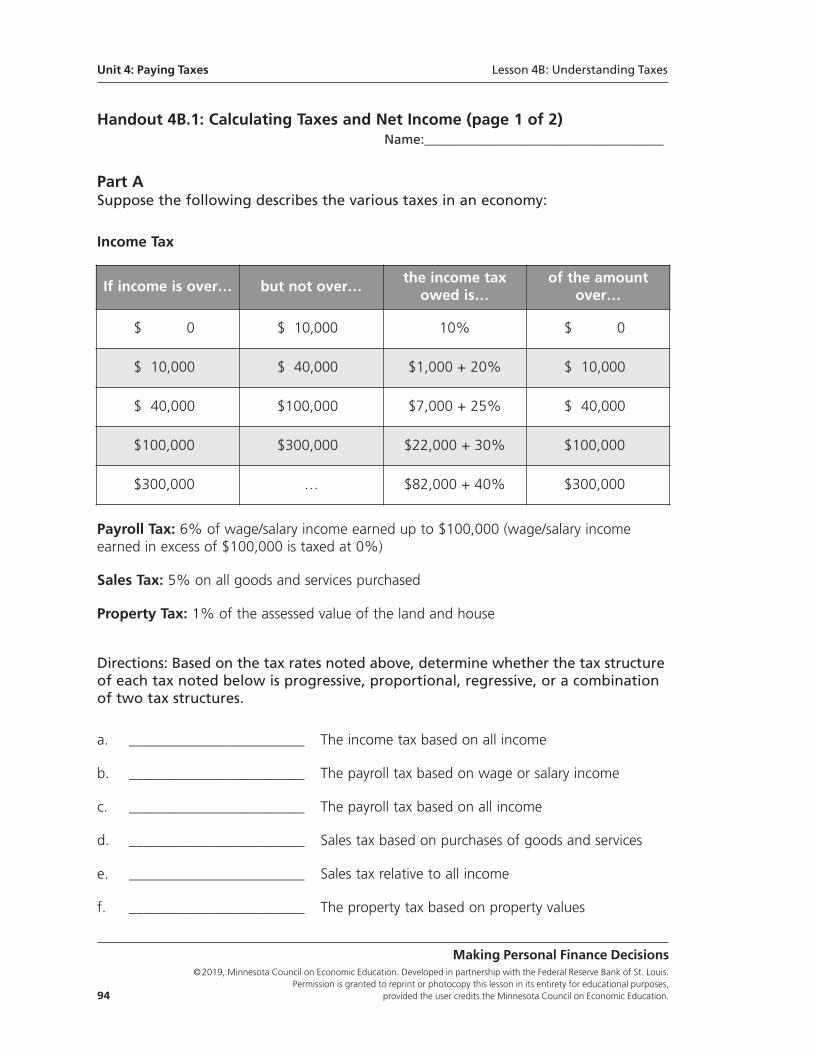
Handout 4B.1: Calculating Taxes and Net Income (page 1 of 2)Name:____________________________________
Part ASuppose the following describes the various taxes in an economy:
Income Tax
Payroll Tax: 6% of wage/salary income earned up to $100,000 (wage/salary incomeearned in excess of $100,000 is taxed at 0%)
Sales Tax: 5% on all goods and services purchased
Property Tax: 1% of the assessed value of the land and house
Directions: Based on the tax rates noted above, determine whether the tax structureof each tax noted below is progressive, proportional, regressive, or a combinationof two tax structures.
a. ________________________ The income tax based on all income
b. ________________________ The payroll tax based on wage or salary income
c. ________________________ The payroll tax based on all income
d. ________________________ Sales tax based on purchases of goods and services
e. ________________________ Sales tax relative to all income
f. ________________________ The property tax based on property values
Making Personal Finance Decisions©2019, Minnesota Council on Economic Education. Developed in partnership with the Federal Reserve Bank of St. Louis.
Permission is granted to reprint or photocopy this lesson in its entirety for educational purposes, 94 provided the user credits the Minnesota Council on Economic Education.
If income is over… but not over…the income tax
owed is…of the amount
over…
$ 0 $ 10,000 10% $ 0
$ 10,000 $ 40,000 $1,000 + 20% $ 10,000
$ 40,000 $100,000 $7,000 + 25% $ 40,000
$100,000 $300,000 $22,000 + 30% $100,000
$300,000 … $82,000 + 40% $300,000
Unit 4: Paying Taxes Lesson 4B: Understanding Taxes
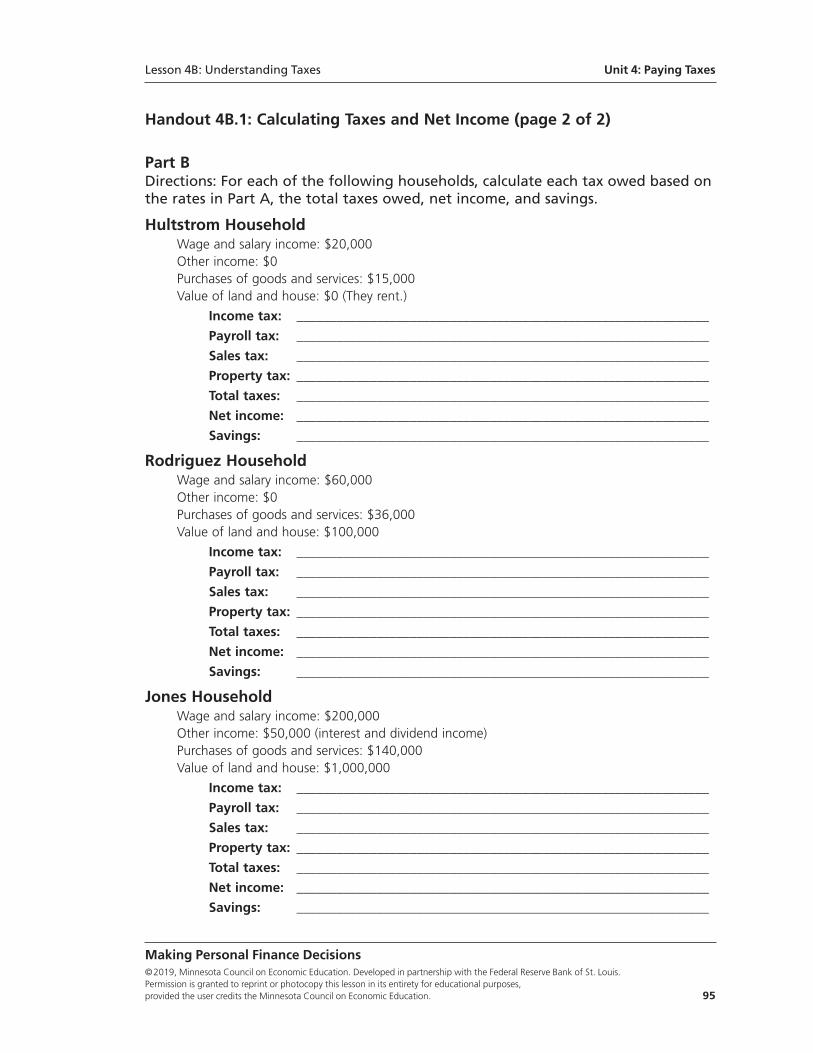
Handout 4B.1: Calculating Taxes and Net Income (page 2 of 2)
Part BDirections: For each of the following households, calculate each tax owed based onthe rates in Part A, the total taxes owed, net income, and savings.
Hultstrom HouseholdWage and salary income: $20,000Other income: $0Purchases of goods and services: $15,000Value of land and house: $0 (They rent.)
Income tax: ______________________________________________________________
Payroll tax: ______________________________________________________________
Sales tax: ______________________________________________________________
Property tax: ______________________________________________________________
Total taxes: ______________________________________________________________
Net income: ______________________________________________________________
Savings: ______________________________________________________________
Rodriguez HouseholdWage and salary income: $60,000Other income: $0Purchases of goods and services: $36,000Value of land and house: $100,000
Income tax: ______________________________________________________________
Payroll tax: ______________________________________________________________
Sales tax: ______________________________________________________________
Property tax: ______________________________________________________________
Total taxes: ______________________________________________________________
Net income: ______________________________________________________________
Savings: ______________________________________________________________
Jones HouseholdWage and salary income: $200,000Other income: $50,000 (interest and dividend income)Purchases of goods and services: $140,000Value of land and house: $1,000,000
Income tax: ______________________________________________________________
Payroll tax: ______________________________________________________________
Sales tax: ______________________________________________________________
Property tax: ______________________________________________________________
Total taxes: ______________________________________________________________
Net income: ______________________________________________________________
Savings: ______________________________________________________________
Making Personal Finance Decisions©2019, Minnesota Council on Economic Education. Developed in partnership with the Federal Reserve Bank of St. Louis. Permission is granted to reprint or photocopy this lesson in its entirety for educational purposes, provided the user credits the Minnesota Council on Economic Education. 95
Lesson 4B: Understanding Taxes Unit 4: Paying Taxes
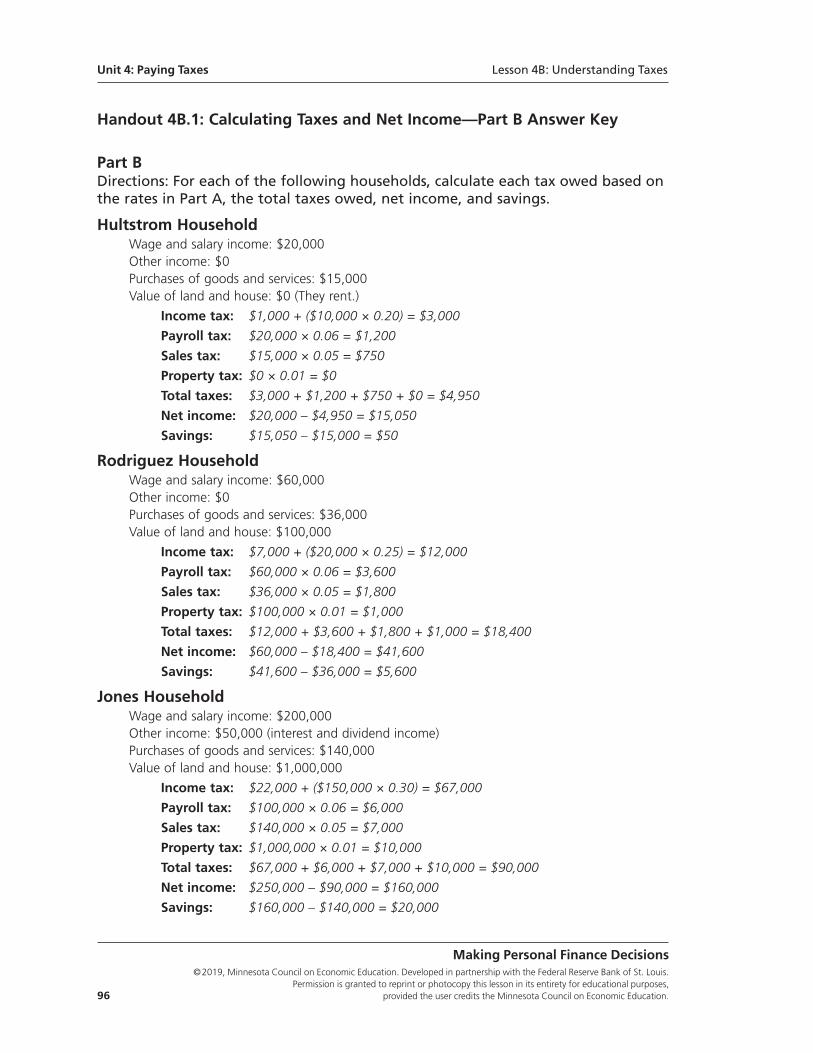
Handout 4B.1: Calculating Taxes and Net Income—Part B Answer Key
Part BDirections: For each of the following households, calculate each tax owed based onthe rates in Part A, the total taxes owed, net income, and savings.
Hultstrom HouseholdWage and salary income: $20,000Other income: $0Purchases of goods and services: $15,000Value of land and house: $0 (They rent.)
Income tax: $1,000 + ($10,000 × 0.20) = $3,000
Payroll tax: $20,000 × 0.06 = $1,200
Sales tax: $15,000 × 0.05 = $750
Property tax: $0 × 0.01 = $0
Total taxes: $3,000 + $1,200 + $750 + $0 = $4,950
Net income: $20,000 – $4,950 = $15,050
Savings: $15,050 – $15,000 = $50
Rodriguez HouseholdWage and salary income: $60,000Other income: $0Purchases of goods and services: $36,000Value of land and house: $100,000
Income tax: $7,000 + ($20,000 × 0.25) = $12,000
Payroll tax: $60,000 × 0.06 = $3,600
Sales tax: $36,000 × 0.05 = $1,800
Property tax: $100,000 × 0.01 = $1,000
Total taxes: $12,000 + $3,600 + $1,800 + $1,000 = $18,400
Net income: $60,000 – $18,400 = $41,600
Savings: $41,600 – $36,000 = $5,600
Jones HouseholdWage and salary income: $200,000Other income: $50,000 (interest and dividend income)Purchases of goods and services: $140,000Value of land and house: $1,000,000
Income tax: $22,000 + ($150,000 × 0.30) = $67,000
Payroll tax: $100,000 × 0.06 = $6,000
Sales tax: $140,000 × 0.05 = $7,000
Property tax: $1,000,000 × 0.01 = $10,000
Total taxes: $67,000 + $6,000 + $7,000 + $10,000 = $90,000
Net income: $250,000 – $90,000 = $160,000
Savings: $160,000 – $140,000 = $20,000
Making Personal Finance Decisions©2019, Minnesota Council on Economic Education. Developed in partnership with the Federal Reserve Bank of St. Louis.
Permission is granted to reprint or photocopy this lesson in its entirety for educational purposes, 96 provided the user credits the Minnesota Council on Economic Education.
Unit 4: Paying Taxes Lesson 4B: Understanding Taxes
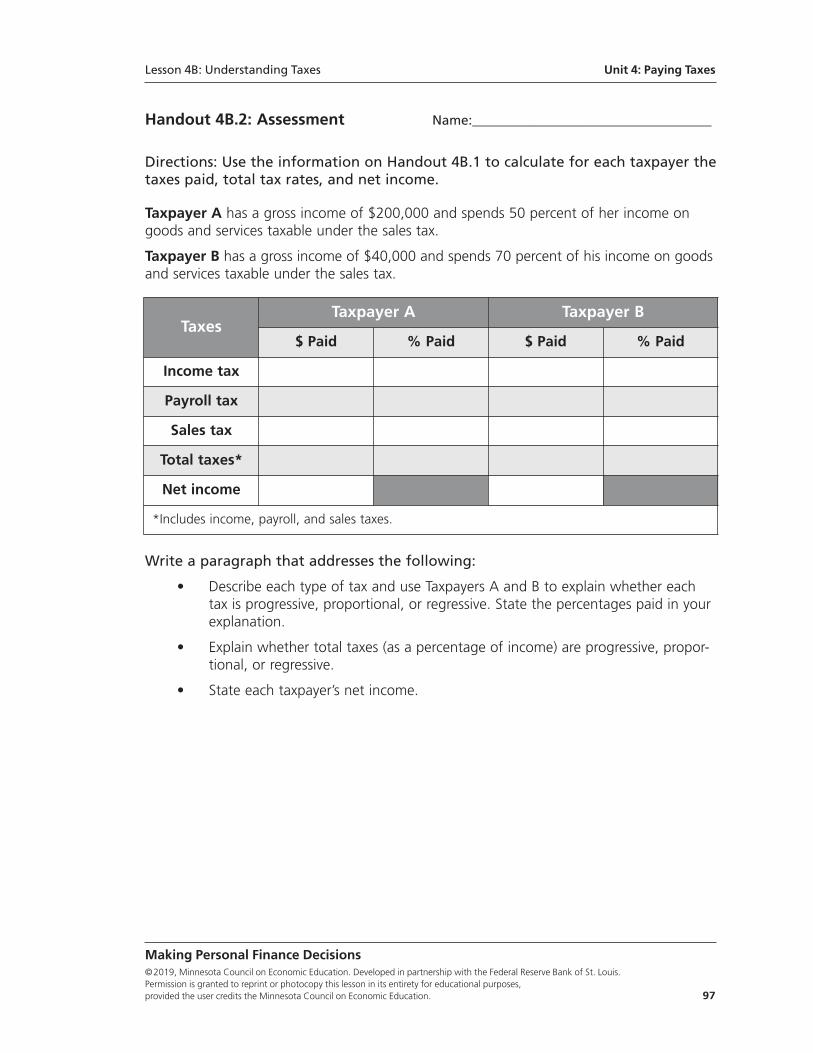
Handout 4B.2: Assessment Name:____________________________________
Directions: Use the information on Handout 4B.1 to calculate for each taxpayer thetaxes paid, total tax rates, and net income.
Taxpayer A has a gross income of $200,000 and spends 50 percent of her income ongoods and services taxable under the sales tax.
Taxpayer B has a gross income of $40,000 and spends 70 percent of his income on goodsand services taxable under the sales tax.
Write a paragraph that addresses the following:
• Describe each type of tax and use Taxpayers A and B to explain whether each tax is progressive, proportional, or regressive. State the percentages paid in your explanation.
• Explain whether total taxes (as a percentage of income) are progressive, propor-tional, or regressive.
• State each taxpayer’s net income.
Making Personal Finance Decisions©2019, Minnesota Council on Economic Education. Developed in partnership with the Federal Reserve Bank of St. Louis. Permission is granted to reprint or photocopy this lesson in its entirety for educational purposes, provided the user credits the Minnesota Council on Economic Education. 97
TaxesTaxpayer A Taxpayer B
$ Paid % Paid $ Paid % Paid
Income tax
Payroll tax
Sales tax
Total taxes*
Net income
*Includes income, payroll, and sales taxes.
Lesson 4B: Understanding Taxes Unit 4: Paying Taxes
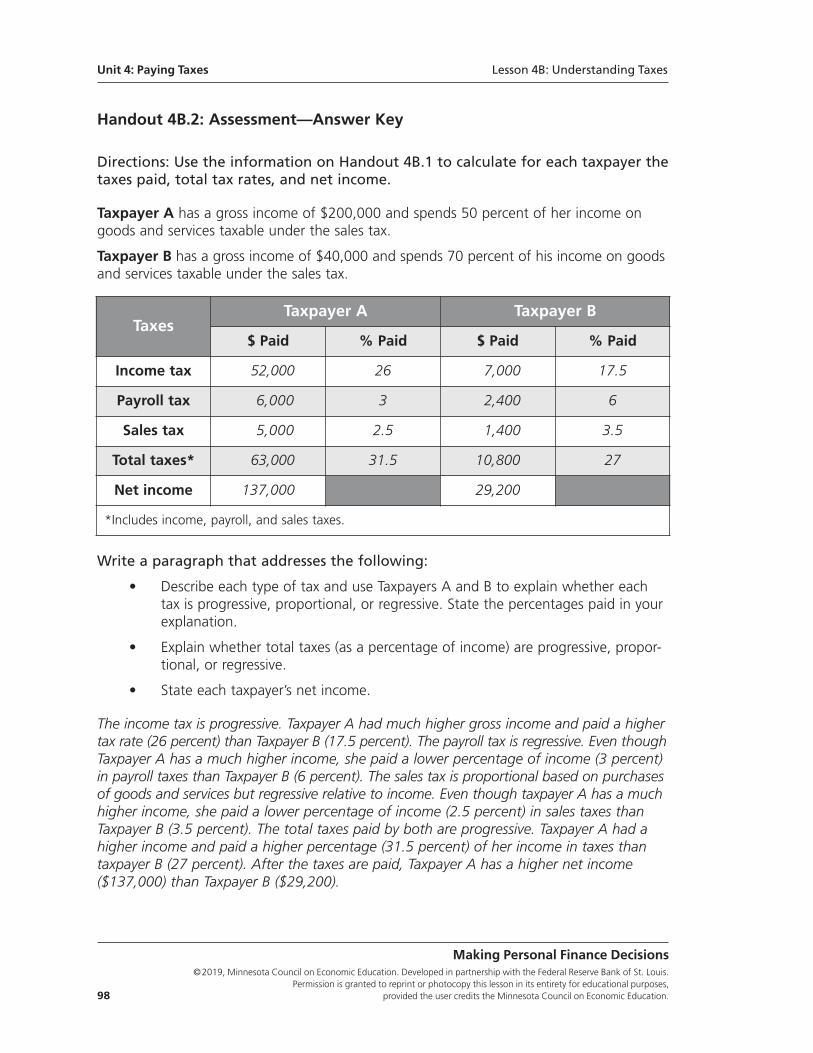
Handout 4B.2: Assessment—Answer Key
Directions: Use the information on Handout 4B.1 to calculate for each taxpayer thetaxes paid, total tax rates, and net income.
Taxpayer A has a gross income of $200,000 and spends 50 percent of her income ongoods and services taxable under the sales tax.
Taxpayer B has a gross income of $40,000 and spends 70 percent of his income on goodsand services taxable under the sales tax.
Write a paragraph that addresses the following:
• Describe each type of tax and use Taxpayers A and B to explain whether each tax is progressive, proportional, or regressive. State the percentages paid in your explanation.
• Explain whether total taxes (as a percentage of income) are progressive, propor-tional, or regressive.
• State each taxpayer’s net income.
The income tax is progressive. Taxpayer A had much higher gross income and paid a highertax rate (26 percent) than Taxpayer B (17.5 percent). The payroll tax is regressive. Even thoughTaxpayer A has a much higher income, she paid a lower percentage of income (3 percent)in payroll taxes than Taxpayer B (6 percent). The sales tax is proportional based on purchasesof goods and services but regressive relative to income. Even though taxpayer A has a muchhigher income, she paid a lower percentage of income (2.5 percent) in sales taxes thanTaxpayer B (3.5 percent). The total taxes paid by both are progressive. Taxpayer A had ahigher income and paid a higher percentage (31.5 percent) of her income in taxes thantaxpayer B (27 percent). After the taxes are paid, Taxpayer A has a higher net income($137,000) than Taxpayer B ($29,200).
Making Personal Finance Decisions©2019, Minnesota Council on Economic Education. Developed in partnership with the Federal Reserve Bank of St. Louis.
Permission is granted to reprint or photocopy this lesson in its entirety for educational purposes, 98 provided the user credits the Minnesota Council on Economic Education.
TaxesTaxpayer A Taxpayer B
$ Paid % Paid $ Paid % Paid
Income tax 52,000 26 7,000 17.5
Payroll tax 6,000 3 2,400 6
Sales tax 5,000 2.5 1,400 3.5
Total taxes* 63,000 31.5 10,800 27
Net income 137,000 29,200
*Includes income, payroll, and sales taxes.
Unit 4: Paying Taxes Lesson 4B: Understanding Taxes
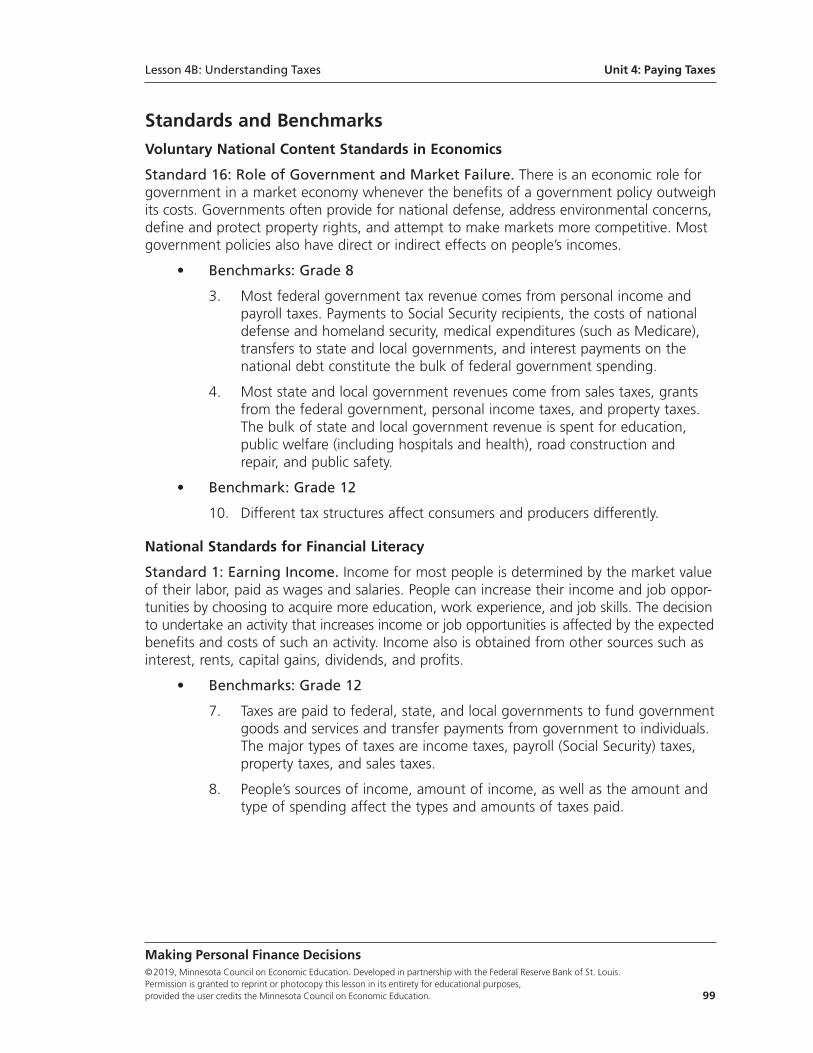
Standards and BenchmarksVoluntary National Content Standards in Economics
Standard 16: Role of Government and Market Failure. There is an economic role forgovernment in a market economy whenever the benefits of a government policy outweighits costs. Governments often provide for national defense, address environmental concerns,define and protect property rights, and attempt to make markets more competitive. Mostgovernment policies also have direct or indirect effects on people’s incomes.
• Benchmarks: Grade 8
3. Most federal government tax revenue comes from personal income and payroll taxes. Payments to Social Security recipients, the costs of national defense and homeland security, medical expenditures (such as Medicare), transfers to state and local governments, and interest payments on the national debt constitute the bulk of federal government spending.
4. Most state and local government revenues come from sales taxes, grants from the federal government, personal income taxes, and property taxes. The bulk of state and local government revenue is spent for education, public welfare (including hospitals and health), road construction and repair, and public safety.
• Benchmark: Grade 12
10. Different tax structures affect consumers and producers differently.
National Standards for Financial Literacy
Standard 1: Earning Income. Income for most people is determined by the market valueof their labor, paid as wages and salaries. People can increase their income and job oppor-tunities by choosing to acquire more education, work experience, and job skills. The decisionto undertake an activity that increases income or job opportunities is affected by the expectedbenefits and costs of such an activity. Income also is obtained from other sources such asinterest, rents, capital gains, dividends, and profits.
• Benchmarks: Grade 12
7. Taxes are paid to federal, state, and local governments to fund governmentgoods and services and transfer payments from government to individuals. The major types of taxes are income taxes, payroll (Social Security) taxes, property taxes, and sales taxes.
8. People’s sources of income, amount of income, as well as the amount and type of spending affect the types and amounts of taxes paid.
Making Personal Finance Decisions©2019, Minnesota Council on Economic Education. Developed in partnership with the Federal Reserve Bank of St. Louis. Permission is granted to reprint or photocopy this lesson in its entirety for educational purposes, provided the user credits the Minnesota Council on Economic Education. 99
Lesson 4B: Understanding Taxes Unit 4: Paying Taxes

Making Personal Finance Decisions©2019, Minnesota Council on Economic Education. Developed in partnership with the Federal Reserve Bank of St. Louis.
Permission is granted to reprint or photocopy this lesson in its entirety for educational purposes, 100 provided the user credits the Minnesota Council on Economic Education.
Lesson 5A:
Making a Budget—It Is All Spending!
Lesson DescriptionStudents discover that all elements of a budget are essentially spending on goods andservices. They are shown a process for establishing a budget.
Standards and Benchmarks (see page 110)
Grade Level9-12
ConceptsBudget
Financial investment
Gross income
Net income
Saving
Spending
Unit 5
Budgeting
Making Personal Finance Decisions©2019, Minnesota Council on Economic Education. Developed in partnership with the Federal Reserve Bank of St. Louis. Permission is granted to reprint or photocopy this lesson in its entirety for educational purposes, provided the user credits the Minnesota Council on Economic Education. 101
Rule 5: Live within your means.People work to earn income to purchase goods and services now (spending), later (saving),or for someone else (sharing). Because income is limited, the amount of goods andservices people can buy is limited. These lessons look at how to allocate, or budget, yourincome without exceeding the income you earn.
Compelling QuestionHow do people plan for regular, irregular, and future spending?
ObjectivesStudents will be able to
• distinguish among various types of spending: regular (variable and fixed), irregular,and future and
• follow a process to establish a budget.
Materials• Visuals 5A.1: Elements of a Budget or Spending Plan
• Visuals 5A.2: The Budgeting Process
• Handout 5A.1: Assessment, one copy for each student
Time Required30 minutes
Procedure1. Begin the lesson by asking the following:
• Why do people work? (To earn income to buy goods and services they want)
• Once you earn income, what are some of the things you can do with it?(Answers will vary but may include spending on goods and services, saving, pay-ing taxes, or sharing it with others.)
2. Explain that while we can do many things with money, these things have one thing incommon: They all represent spending. Spending is using some or all of your incometo buy things you want now. Buying a video game, a pizza, or a new car are examplesof what we generally think of as spending.
3. Discuss the following:
• Why do people save? (Usually so they can spend on goods and services later)
• Saving is not spending on current consumption. It involves giving up some currentconsumption for future consumption—that is, setting aside part of your incometoday for future spending on goods and services.
Unit 5: Budgeting Lesson 5A: Making a Budget—It Is All Spending!
Making Personal Finance Decisions©2019, Minnesota Council on Economic Education. Developed in partnership with the Federal Reserve Bank of St. Louis.
Permission is granted to reprint or photocopy this lesson in its entirety for educational purposes, 102 provided the user credits the Minnesota Council on Economic Education.
• People may invest part of their savings in hope of growing their wealth over timeso they can spend it on goods and services later, such as in retirement.
• What do people get from paying taxes? (They get government-provided goodsand services, such as roads, schools, police and fire protection, and nationaldefense. Through government transfer programs funded by taxes, people helpthe disadvantaged [e.g., the poor, unemployed, elderly, or disabled] buy goodsand services.)
• Why do people give to churches and charitable organizations? (Answers will varybut should include to help people who may be unable to buy or obtain goodsand services.)
• Emphasize that when people share their income, they are essentially spendingon goods and services for others.
4. Define a budget as a plan for managing income, spending, and saving during a givenperiod. It is an itemized summary of probable income and expenses for a given period.
5. Display Visual 5A.1: Elements of a Budget or Spending Plan. Define monthly grossincome as the total amount of income a person earns. Explain that before makingdecisions about how to spend income, you need to determine what your monthly netincome is (see Unit Four: Paying Taxes). Define net income as gross income minustaxes (and possibly other deductions, such as for insurance).
6. Explain the following and refer to the examples on Visual 5A.1:
• There are three ways to allocate monthly net income—that is, three ways tospend net income: regular spending, irregular spending, and future spending.
Regular Spending
• Regular spending is for goods and services normally or regularly purchased duringa month.
• Regular spending can be broken down further into fixed spending and variablespending.
• An expense is considered fixed if the amount spent is the same every month,such as a car or house payment.
• An expense is considered variable if it can vary from month to month, such asfor food, utilities, or entertainment.
Irregular Spending (Short-Term Saving)
• Irregular spending (also called periodic spending) is for goods and services thatare not normally purchased every month but on a different payment schedule(such as annually or semiannually) or on an irregular basis.
• Irregular spending is allocating income to what most people think of as short-termsaving.
Lesson 5A: Making a Budget—It Is All Spending! Unit 5: Budgeting
Making Personal Finance Decisions©2019, Minnesota Council on Economic Education. Developed in partnership with the Federal Reserve Bank of St. Louis. Permission is granted to reprint or photocopy this lesson in its entirety for educational purposes, provided the user credits the Minnesota Council on Economic Education. 103
• For example, a $600 fee might be charged annually. To prepare for this irregularspending, a person could save $50 per month.
Future Spending (Long-Term Saving)
• Future spending is for the purchase of goods and services in the future, typicallybeyond one year.
• Future spending is allocating income to what most people think of as long-termsaving or investing.
• For example, a person might save 10 percent of his or her income over an entirecareer (40 years or more) to spend in retirement.
7. Explain that the elements of a budget are all the ways your income can be spent.
8. Display Visual 5A.2: The Budgeting Process. Explain that the visual shows a four-stepprocess for creating a budget or spending plan—one of many ways to do so.
(Teacher note: The spending on Visual 5A.2 assumes a household with a gross annualincome of $54,000—a little more than the 2014 U.S. median household income of$53,657. For the most recent median household income data, see FRED® athttps://fred.stlouisfed.org/graph/?g=2khG.)
Step 1: Determine Your Monthly Net Income
• In Step 1, you determine your monthly net income, which is how much moneyyou have to allocate each month.
• Net income is calculated by subtracting taxes and other deductions, such as healthinsurance premiums, from your gross income (the actual amount you earned).
• Net income may also be called your “take-home” pay or disposable income—itis the income that you have available for spending.
• In the example, the household’s gross income is $4,500 per month and its deduc-tions are $1,000 (which include withholdings for income taxes, Social Securityand Medicare taxes, and other deductions), leaving the household a net incomeof $3,500 to decide how to spend.
Step 2: Plan Future Spending (Long-Term Savings)
• In Step 2, you “pay yourself first”—you set aside money—save—to meet yourlong-term goals (such as a down payment on a house or savings for retirement,college tuition, or to start a business).
• Not spending part of your current income is called saving.
• Long-term savings are usually used to buy assets such as stocks, bonds, and cer-tificates of deposit. The purchase of these assets is called financial investment.
• How much you set aside to meet your long-term goals depends on your financialplan (see Unit Two: Planning and Tracking).
Unit 5: Budgeting Lesson 5A: Making a Budget—It Is All Spending!
Making Personal Finance Decisions©2019, Minnesota Council on Economic Education. Developed in partnership with the Federal Reserve Bank of St. Louis.
Permission is granted to reprint or photocopy this lesson in its entirety for educational purposes, 104 provided the user credits the Minnesota Council on Economic Education.
• In this example, the household saves $500 for long-term goals, leaving $3,000.
Step 3: Plan Irregular Spending (Short-Term Savings)
• In Step 3, you set aside money—save—to meet your short-term irregular expenses.
• How much you need to set aside each month is based on your annual irregularexpenses divided by 12.
• This money is typically held in a savings account to pay for irregular expenses asthey come up during the year.
• In this example, the household is expecting $6,000 in irregular expenses for theyear, so they need to set aside $500 each month.
Step 4: Plan Regular Spending (Fixed and Variable)
• The remaining money is what you have left to meet your regular monthlyexpenses—both fixed and variable.
• It is best to think of the fixed expenses much like taxes and deductions in Step1: Fixed expenses are commitments to pay for specific items.
• Fixed expenses must be paid before making any choices about spending on vari-able expenses. In this example, housing and transportation are fixed expenses,but fixed expenses could also include things such as cable, Internet, and phoneservices.
Closure 9. Explain that if you go through this budgeting process and don’t have as much to
spend on variable expenses (in Step 4) as you would like, you need to reconsider eachof your expenditures as follows:
• Are your fixed expenses too high because, for example, you purchased (or rented)a house that is too big, a cable package that is too large, or a car that is too nice?
• Do you need to reduce some of your irregular expenses (such as the amountsallocated to vacations or gifts)?
• Do you need to rethink your long-term goals and decide if they are as valuableto you as having more money for variable spending now?
• Overall, what trade-offs should you consider for adjusting your budget based onyour income and your goals—both short-term and long-term goals.
Assessment10. Keep Visual 5A.2 displayed. Distribute a copy of Handout 5A.1: Assessment to each
student. Review the directions and allow time for students to work.
Lesson 5A: Making a Budget—It Is All Spending! Unit 5: Budgeting
Making Personal Finance Decisions©2019, Minnesota Council on Economic Education. Developed in partnership with the Federal Reserve Bank of St. Louis. Permission is granted to reprint or photocopy this lesson in its entirety for educational purposes, provided the user credits the Minnesota Council on Economic Education. 105
Handout 5A.1: Assessment—Answer Key
Directions: Imagine the information on Visual 5A.2 is your personal budget and answer the following questions.
1. What will happen to the “regular spending” part of your budget if you decideto allocate more money to future spending (long-term savings)?
If I allocate more to future spending (long-term savings), I will have less moneyfor regular spending.
2. How would you categorize an annual maintenance fee of $480 from your apart-ment landlord?
This expense occurs annually, so it would be considered irregular spending (short-term saving).
3. How would you categorize $200 per month set aside for retirement?
Setting aside $200 for retirement is future spending (long-term saving).
4. How can saving for retirement be considered “spending” even though you areactually saving the money?
The reason you save money is to spend it in the future.
Unit 5: Budgeting Lesson 5A: Making a Budget—It Is All Spending!
Making Personal Finance Decisions©2019, Minnesota Council on Economic Education. Developed in partnership with the Federal Reserve Bank of St. Louis.
Permission is granted to reprint or photocopy this lesson in its entirety for educational purposes, 106 provided the user credits the Minnesota Council on Economic Education.
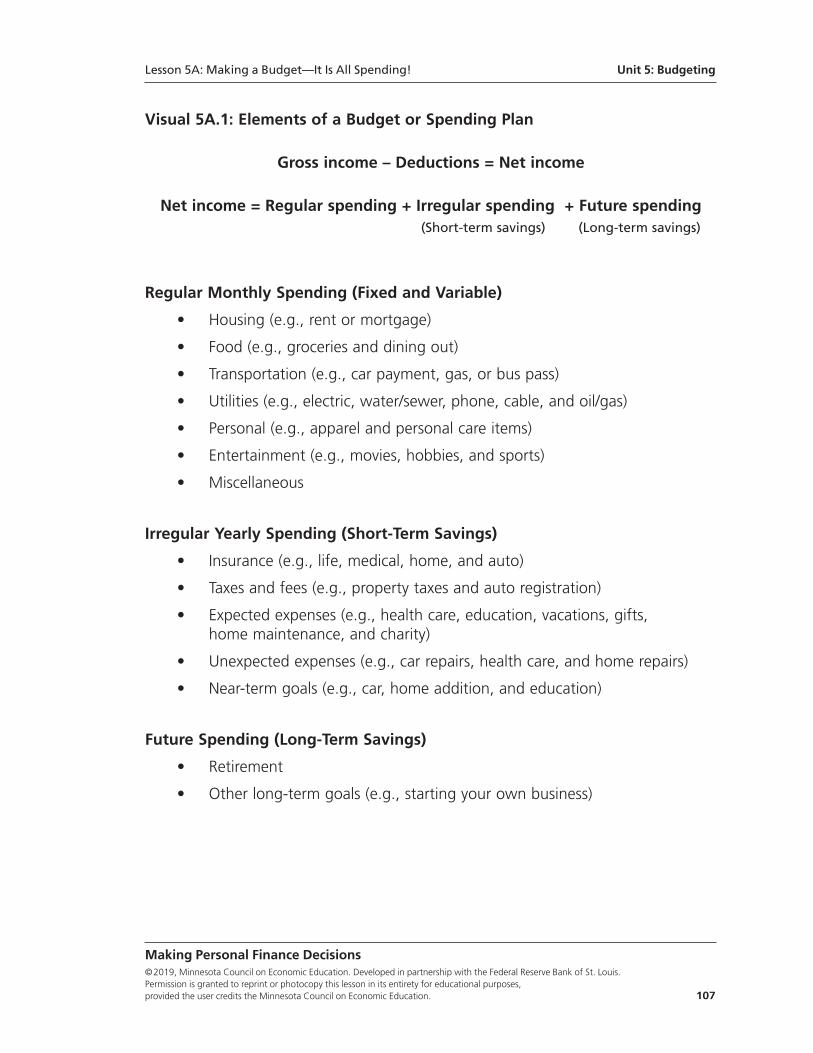
Visual 5A.1: Elements of a Budget or Spending Plan
Gross income – Deductions = Net income
Net income = Regular spending + Irregular spending + Future spending(Short-term savings) (Long-term savings)
Regular Monthly Spending (Fixed and Variable)
• Housing (e.g., rent or mortgage)
• Food (e.g., groceries and dining out)
• Transportation (e.g., car payment, gas, or bus pass)
• Utilities (e.g., electric, water/sewer, phone, cable, and oil/gas)
• Personal (e.g., apparel and personal care items)
• Entertainment (e.g., movies, hobbies, and sports)
• Miscellaneous
Irregular Yearly Spending (Short-Term Savings)
• Insurance (e.g., life, medical, home, and auto)
• Taxes and fees (e.g., property taxes and auto registration)
• Expected expenses (e.g., health care, education, vacations, gifts, home maintenance, and charity)
• Unexpected expenses (e.g., car repairs, health care, and home repairs)
• Near-term goals (e.g., car, home addition, and education)
Future Spending (Long-Term Savings)
• Retirement
• Other long-term goals (e.g., starting your own business)
Lesson 5A: Making a Budget—It Is All Spending! Unit 5: Budgeting
Making Personal Finance Decisions©2019, Minnesota Council on Economic Education. Developed in partnership with the Federal Reserve Bank of St. Louis. Permission is granted to reprint or photocopy this lesson in its entirety for educational purposes, provided the user credits the Minnesota Council on Economic Education. 107
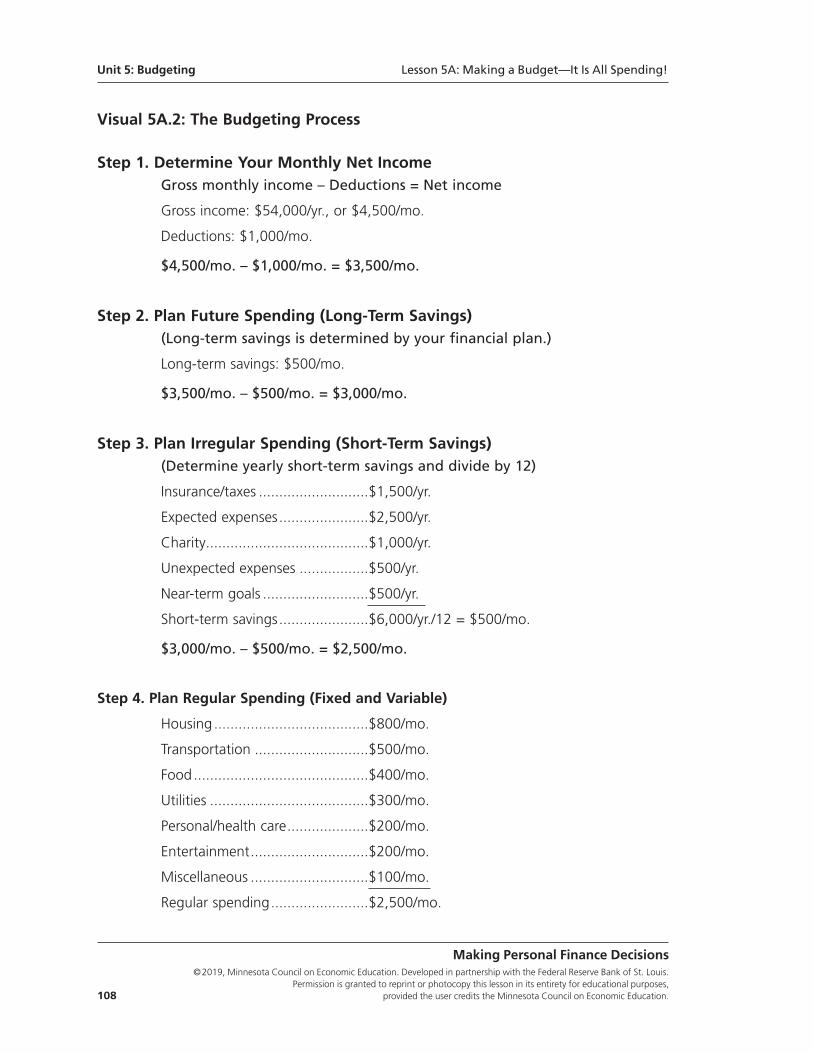
Unit 5: Budgeting Lesson 5A: Making a Budget—It Is All Spending!
Making Personal Finance Decisions©2019, Minnesota Council on Economic Education. Developed in partnership with the Federal Reserve Bank of St. Louis.
Permission is granted to reprint or photocopy this lesson in its entirety for educational purposes, 108 provided the user credits the Minnesota Council on Economic Education.
Visual 5A.2: The Budgeting Process
Step 1. Determine Your Monthly Net Income Gross monthly income – Deductions = Net income
Gross income: $54,000/yr., or $4,500/mo.
Deductions: $1,000/mo.
$4,500/mo. – $1,000/mo. = $3,500/mo.
Step 2. Plan Future Spending (Long-Term Savings)(Long-term savings is determined by your financial plan.)
Long-term savings: $500/mo.
$3,500/mo. – $500/mo. = $3,000/mo.
Step 3. Plan Irregular Spending (Short-Term Savings)(Determine yearly short-term savings and divide by 12)
Insurance/taxes ...........................$1,500/yr.
Expected expenses......................$2,500/yr.
Charity........................................$1,000/yr.
Unexpected expenses .................$500/yr.
Near-term goals ..........................$500/yr.
Short-term savings......................$6,000/yr./12 = $500/mo.
$3,000/mo. – $500/mo. = $2,500/mo.
Step 4. Plan Regular Spending (Fixed and Variable)
Housing......................................$800/mo.
Transportation ............................$500/mo.
Food...........................................$400/mo.
Utilities .......................................$300/mo.
Personal/health care....................$200/mo.
Entertainment.............................$200/mo.
Miscellaneous .............................$100/mo.
Regular spending........................$2,500/mo.
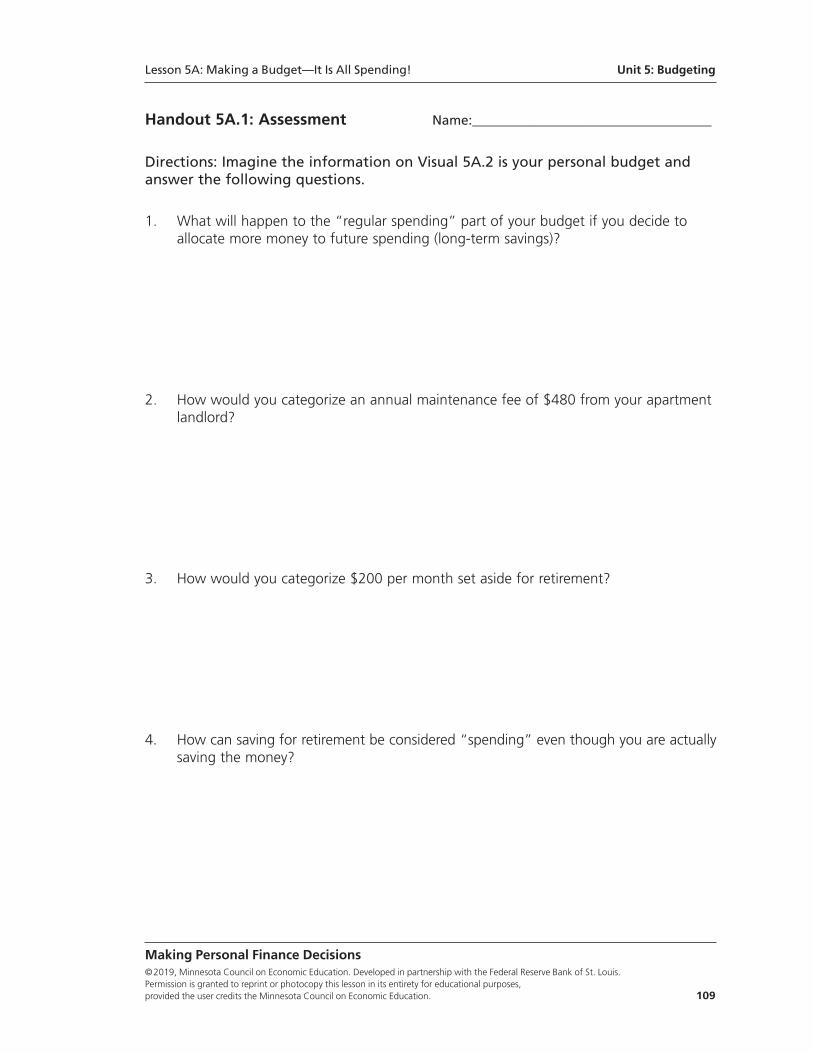
Handout 5A.1: Assessment Name:____________________________________
Directions: Imagine the information on Visual 5A.2 is your personal budget andanswer the following questions.
1. What will happen to the “regular spending” part of your budget if you decide to allocate more money to future spending (long-term savings)?
2. How would you categorize an annual maintenance fee of $480 from your apartment landlord?
3. How would you categorize $200 per month set aside for retirement?
4. How can saving for retirement be considered “spending” even though you are actuallysaving the money?
Making Personal Finance Decisions©2019, Minnesota Council on Economic Education. Developed in partnership with the Federal Reserve Bank of St. Louis. Permission is granted to reprint or photocopy this lesson in its entirety for educational purposes, provided the user credits the Minnesota Council on Economic Education. 109
Lesson 5A: Making a Budget—It Is All Spending! Unit 5: Budgeting
Standards and Benchmarks
National Standards for Financial Literacy
Standard 2: Buying Goods and Services. People cannot buy or make all the goods andservices they want; as a result, people choose to buy some goods and services but not others.People can improve their economic well-being by making informed spending decisions,which entails collecting information, planning, and budgeting.
• Benchmarks: Grade 8
5. A budget includes fixed and variable expenses, as well as income, savings, and taxes.
6. People may revise their budget based on unplanned expenses and changes in income.
• Benchmark: Grade 12
6. People may choose to donate money to charitable organizations and other not-for-profits because they gain satisfaction from donating.
Standard 3: Saving. Saving is the part of income that people choose to set aside for futureuses. People save for different reasons during the course of their lives. People make differentchoices about how they save and how much they save. Time, interest rates, and inflationaffect the value of savings.
• Benchmark: Grade 8
8. Different people save money for different reasons, including large purchases (such as higher education, autos, and homes), retirement, and unexpected events. People’s choices about how much to save and for what to save are based on their tastes and preferences.
• Benchmark: Grade 12
1. People choose between immediate spending and saving for future consump-tion. Some people have a tendency to be impatient, choosing immediate spending over saving for the future.
Unit 5: Budgeting Lesson 5A: Making a Budget—It Is All Spending!
Making Personal Finance Decisions©2019, Minnesota Council on Economic Education. Developed in partnership with the Federal Reserve Bank of St. Louis.
Permission is granted to reprint or photocopy this lesson in its entirety for educational purposes, 110 provided the user credits the Minnesota Council on Economic Education.
Lesson 5B:
Budget Trade-Offs—A Penny Here and a Penny There
Lesson DescriptionStudents participate in an activity that illustrates that budgeting is really an allocationproblem. They must decide how to allocate limited income among many alternatives,which requires trade-offs. For the activity, students are given pennies representingmonthly personal income to allocate for their living expenses—to purchase goods andservices for housing, food, transportation, and so on.
Standards and Benchmarks (see page 118)
Grade Level9-12
ConceptsBudget
Trade-off
Compelling QuestionWhy must consumers make trade-offs when allocating their income among differentspending options?
Making Personal Finance Decisions©2019, Minnesota Council on Economic Education. Developed in partnership with the Federal Reserve Bank of St. Louis. Permission is granted to reprint or photocopy this lesson in its entirety for educational purposes, provided the user credits the Minnesota Council on Economic Education. 111
Rule 5: Live within your means.People work to earn income to purchase goods and services now (spending), later (saving),or for someone else (sharing). Because income is limited, the amount of goods andservices people can buy is limited. These lessons look at how to allocate, or budget, yourincome without exceeding the income you earn.
Unit 5
Budgeting
ObjectivesStudents will be able to
• describe the trade-offs involved in making a budget and
• create a budget and adjust it based on different income levels.
Materials• 24 pennies for each student
• Handout 5B.1: Allocating Monthly Income, one copy for each student (or pairsof students) with the two pages copied onto separate sheets (so the students canlay the two pages side by side)
• Handout 5B.2: Assessment, one copy for each student
Time Required30 minutes
Procedure1. Remind students that decisionmaking involves trade-offs. Define a trade-off as giving
up some of one thing to gain some of something else. Explain this is especially truewhen making a budget, which is a plan for managing income, spending, and savingduring a given period.
2. Distribute Handout 5B.1: Allocating Monthly Income and 24 pennies to each student.(Option: Have the students work in pairs and share the 24 pennies.)
3. Explain that each penny represents about $100 in monthly gross income.
4. Have each student (or pair) set four pennies aside. Explain that these four penniesrepresent the taxes they must pay on their income. Therefore, each of them has $2,000to spend after taxes. This is their net income.
(Teacher note: $2,000 per month, or $24,000 per year, may sound like a lot of moneyto most students. The expenditure amounts listed in each category of Handout 5B.1,however, are based on reasonably realistic real-world figures. Student will quickly dis-cover that they cannot live as well as they might think.)
5. Explain that Handout 5B.1 shows various categories of spending common to mostconsumers. For each category, as you spend more, you generally get more or better-quality items.
Unit 5: Budgeting Lesson 5B: Budget Trade-Offs—A Penny Here and a Penny There
Making Personal Finance Decisions©2019, Minnesota Council on Economic Education. Developed in partnership with the Federal Reserve Bank of St. Louis.
Permission is granted to reprint or photocopy this lesson in its entirety for educational purposes, 112 provided the user credits the Minnesota Council on Economic Education.
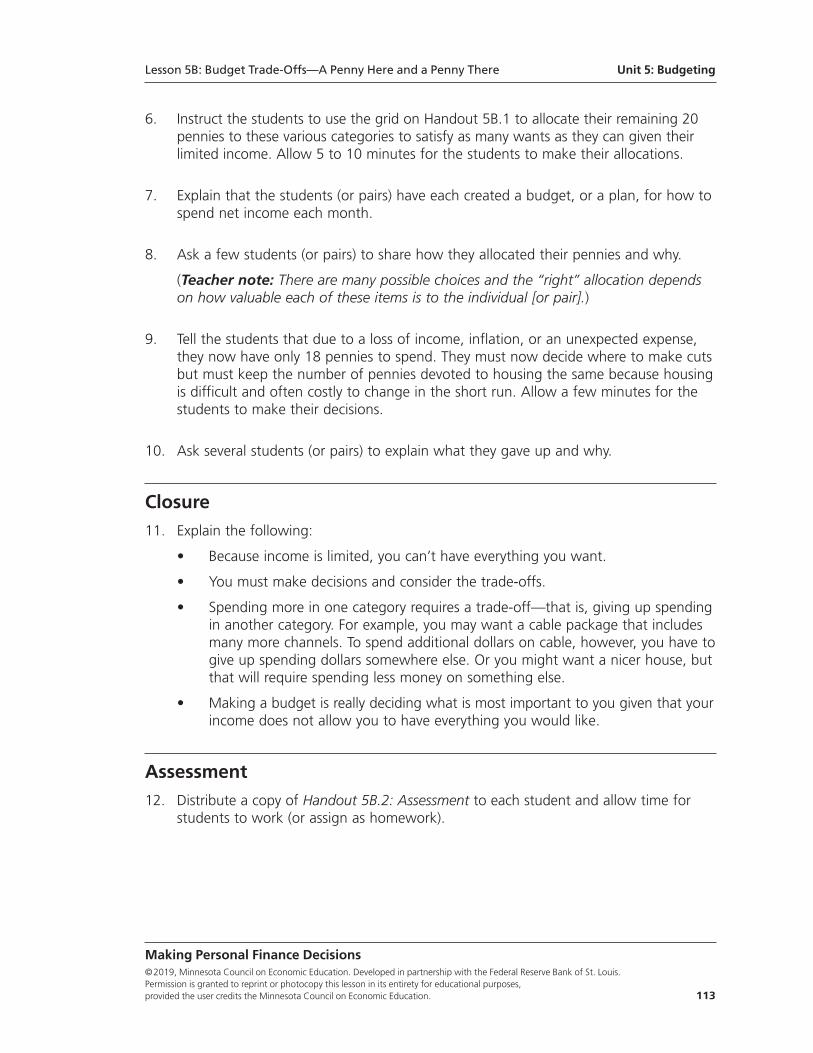
6. Instruct the students to use the grid on Handout 5B.1 to allocate their remaining 20pennies to these various categories to satisfy as many wants as they can given theirlimited income. Allow 5 to 10 minutes for the students to make their allocations.
7. Explain that the students (or pairs) have each created a budget, or a plan, for how tospend net income each month.
8. Ask a few students (or pairs) to share how they allocated their pennies and why.
(Teacher note: There are many possible choices and the “right” allocation dependson how valuable each of these items is to the individual [or pair].)
9. Tell the students that due to a loss of income, inflation, or an unexpected expense,they now have only 18 pennies to spend. They must now decide where to make cutsbut must keep the number of pennies devoted to housing the same because housingis difficult and often costly to change in the short run. Allow a few minutes for thestudents to make their decisions.
10. Ask several students (or pairs) to explain what they gave up and why.
Closure11. Explain the following:
• Because income is limited, you can’t have everything you want.
• You must make decisions and consider the trade-offs.
• Spending more in one category requires a trade-off—that is, giving up spendingin another category. For example, you may want a cable package that includesmany more channels. To spend additional dollars on cable, however, you have togive up spending dollars somewhere else. Or you might want a nicer house, butthat will require spending less money on something else.
• Making a budget is really deciding what is most important to you given that yourincome does not allow you to have everything you would like.
Assessment12. Distribute a copy of Handout 5B.2: Assessment to each student and allow time for
students to work (or assign as homework).
Making Personal Finance Decisions©2019, Minnesota Council on Economic Education. Developed in partnership with the Federal Reserve Bank of St. Louis. Permission is granted to reprint or photocopy this lesson in its entirety for educational purposes, provided the user credits the Minnesota Council on Economic Education. 113
Lesson 5B: Budget Trade-Offs—A Penny Here and a Penny There Unit 5: Budgeting
Handout 5B.2: Assessment—Answer Key
Directions: Using examples from the penny activity, write a paragraph to answerthe following questions to explain how a budget is a spending plan that con-siders trade-offs.
• What were the most difficult choices you had to make when allocating yourpennies?
• Which categories did you value the most? How did that affect your spending inthat category?
• When you spent more in one category, what did you give up in another category?Provide examples from your budget.
• How did you reallocate your spending when you had less income?
Answers may be something like the following:
I found it hard choosing between ________ and ________ and ________ and ________.The category I valued the most was ________, so I spent the most money in that cate-gory. I gave up ________ to spend more money elsewhere. To reduce spending, I spentless in the categories I valued the least. (Alternatively, students might list the specificcategories in which they reduced spending.)
Making Personal Finance Decisions©2019, Minnesota Council on Economic Education. Developed in partnership with the Federal Reserve Bank of St. Louis.
Permission is granted to reprint or photocopy this lesson in its entirety for educational purposes, 114 provided the user credits the Minnesota Council on Economic Education.
Unit 5: Budgeting Lesson 5B: Budget Trade-Offs—A Penny Here and a Penny There
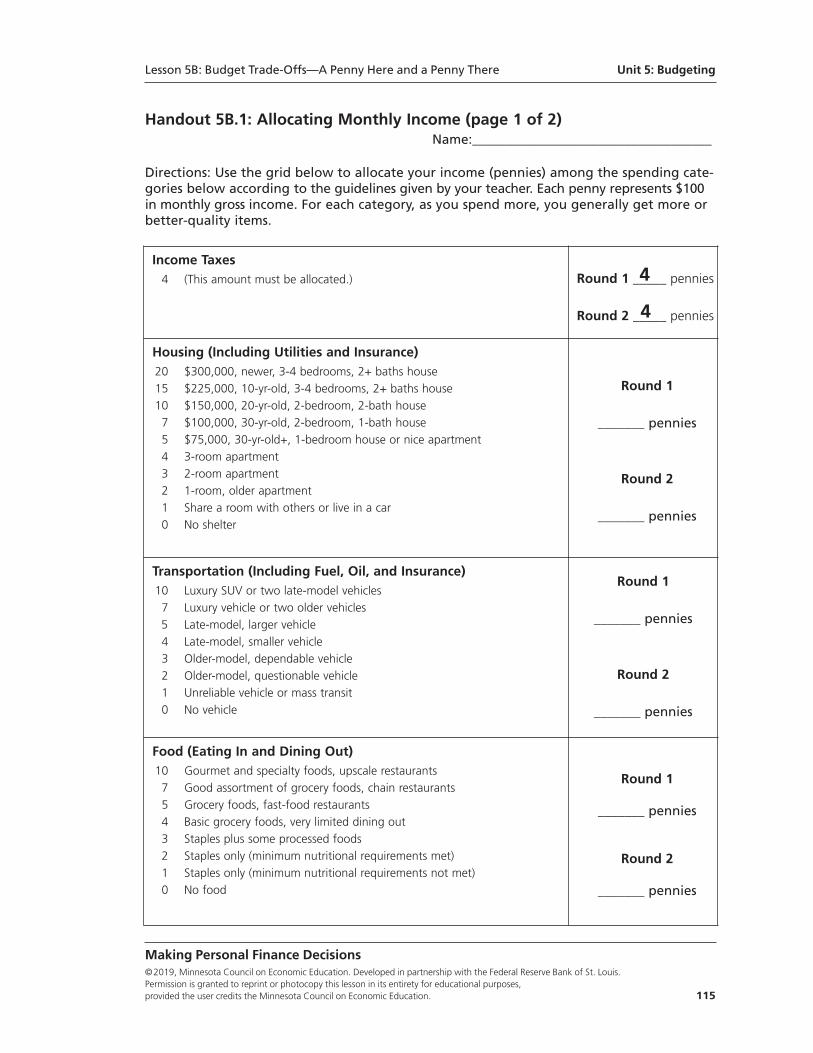
Handout 5B.1: Allocating Monthly Income (page 1 of 2)Name:____________________________________
Directions: Use the grid below to allocate your income (pennies) among the spending cate-gories below according to the guidelines given by your teacher. Each penny represents $100in monthly gross income. For each category, as you spend more, you generally get more orbetter-quality items.
Making Personal Finance Decisions©2019, Minnesota Council on Economic Education. Developed in partnership with the Federal Reserve Bank of St. Louis. Permission is granted to reprint or photocopy this lesson in its entirety for educational purposes, provided the user credits the Minnesota Council on Economic Education. 115
Income Taxes4 (This amount must be allocated.) Round 1 _____ pennies
Round 2 _____ pennies
Housing (Including Utilities and Insurance)20 $300,000, newer, 3-4 bedrooms, 2+ baths house15 $225,000, 10-yr-old, 3-4 bedrooms, 2+ baths house10 $150,000, 20-yr-old, 2- bedroom, 2-bath house7 $100,000, 30-yr-old, 2-bedroom, 1-bath house5 $75,000, 30-yr-old+, 1-bedroom house or nice apartment4 3-room apartment3 2-room apartment2 1-room, older apartment1 Share a room with others or live in a car0 No shelter
Round 1
_______ pennies
Round 2
_______ pennies
Transportation (Including Fuel, Oil, and Insurance)10 Luxury SUV or two late-model vehicles7 Luxury vehicle or two older vehicles5 Late-model, larger vehicle4 Late-model, smaller vehicle 3 Older-model, dependable vehicle2 Older-model, questionable vehicle1 Unreliable vehicle or mass transit0 No vehicle
Round 1
_______ pennies
Round 2
_______ pennies
Food (Eating In and Dining Out)10 Gourmet and specialty foods, upscale restaurants7 Good assortment of grocery foods, chain restaurants5 Grocery foods, fast-food restaurants4 Basic grocery foods, very limited dining out3 Staples plus some processed foods2 Staples only (minimum nutritional requirements met)1 Staples only (minimum nutritional requirements not met)0 No food
Round 1
_______ pennies
Round 2
_______ pennies
4
4
Lesson 5B: Budget Trade-Offs—A Penny Here and a Penny There Unit 5: Budgeting
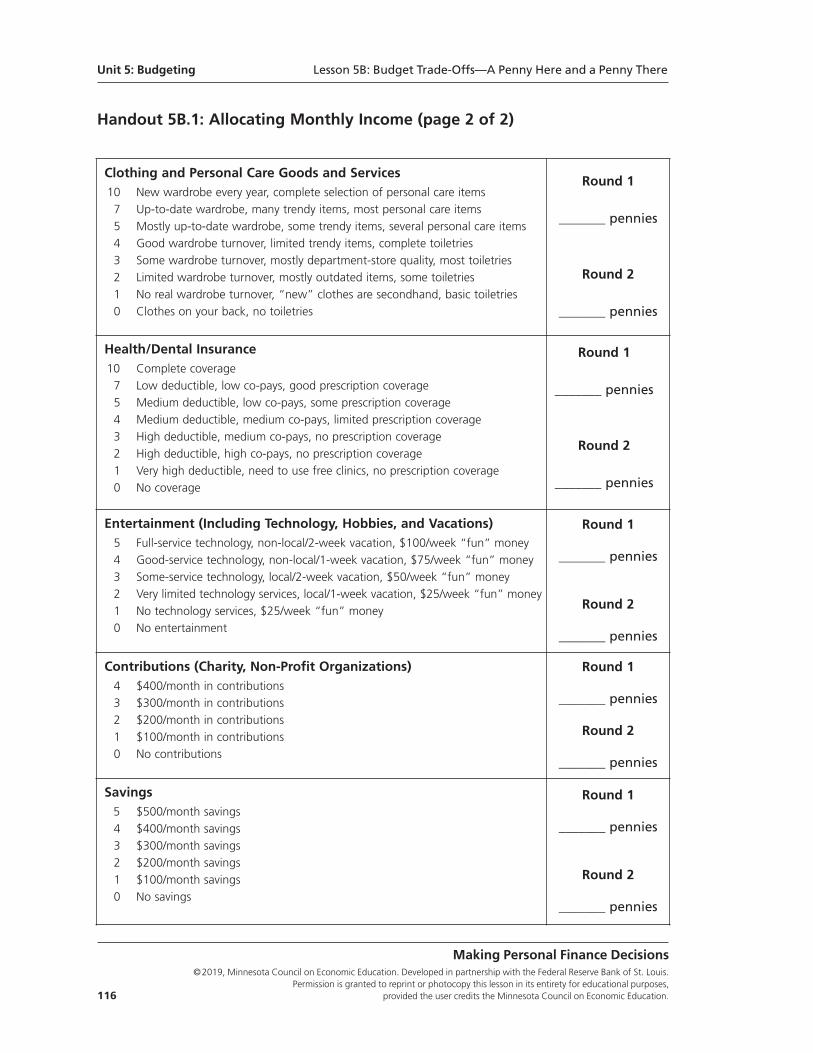
Handout 5B.1: Allocating Monthly Income (page 2 of 2)
Making Personal Finance Decisions©2019, Minnesota Council on Economic Education. Developed in partnership with the Federal Reserve Bank of St. Louis.
Permission is granted to reprint or photocopy this lesson in its entirety for educational purposes, 116 provided the user credits the Minnesota Council on Economic Education.
Clothing and Personal Care Goods and Services10 New wardrobe every year, complete selection of personal care items7 Up-to-date wardrobe, many trendy items, most personal care items5 Mostly up-to-date wardrobe, some trendy items, several personal care items4 Good wardrobe turnover, limited trendy items, complete toiletries3 Some wardrobe turnover, mostly department-store quality, most toiletries2 Limited wardrobe turnover, mostly outdated items, some toiletries1 No real wardrobe turnover, “new” clothes are secondhand, basic toiletries0 Clothes on your back, no toiletries
Round 1
_______ pennies
Round 2
_______ pennies
Health/Dental Insurance10 Complete coverage7 Low deductible, low co-pays, good prescription coverage5 Medium deductible, low co-pays, some prescription coverage4 Medium deductible, medium co-pays, limited prescription coverage3 High deductible, medium co-pays, no prescription coverage2 High deductible, high co-pays, no prescription coverage1 Very high deductible, need to use free clinics, no prescription coverage0 No coverage
Round 1
_______ pennies
Round 2
_______ pennies
Entertainment (Including Technology, Hobbies, and Vacations)5 Full-service technology, non-local/2-week vacation, $100/week “fun” money4 Good-service technology, non-local/1-week vacation, $75/week “fun” money3 Some-service technology, local/2-week vacation, $50/week “fun” money2 Very limited technology services, local/1-week vacation, $25/week “fun” money1 No technology services, $25/week “fun” money0 No entertainment
Round 1
_______ pennies
Round 2
_______ pennies
Contributions (Charity, Non-Profit Organizations)4 $400/month in contributions3 $300/month in contributions2 $200/month in contributions1 $100/month in contributions0 No contributions
Round 1
_______ pennies
Round 2
_______ pennies
Savings5 $500/month savings4 $400/month savings3 $300/month savings2 $200/month savings1 $100/month savings0 No savings
Round 1
_______ pennies
Round 2
_______ pennies
Unit 5: Budgeting Lesson 5B: Budget Trade-Offs—A Penny Here and a Penny There
Handout 5B.2: Assessment Name:____________________________________
Directions: Using examples from the penny activity, write a paragraph to answerthe following questions to explain how a budget is a spending plan that considerstrade-offs.
• What were the most difficult choices you had to make when allocating your pennies?
• Which categories did you value the most? How did that affect your spending in that category?
• When you spent more in one category, what did you give up in another category? Provide examples from your budget.
• How did you reallocate your spending when you had less income?
Making Personal Finance Decisions©2019, Minnesota Council on Economic Education. Developed in partnership with the Federal Reserve Bank of St. Louis. Permission is granted to reprint or photocopy this lesson in its entirety for educational purposes, provided the user credits the Minnesota Council on Economic Education. 117
Lesson 5B: Budget Trade-Offs—A Penny Here and a Penny There Unit 5: Budgeting
Standards and Benchmarks
National Standards for Financial Literacy
Standard 2: Buying Goods and Services. People cannot buy or make all the goods andservices they want; as a result, people choose to buy some goods and services but not others.People can improve their economic well-being by making informed spending decisions,which entails collecting information, planning, and budgeting.
• Benchmarks: Grade 8
5. A budget includes fixed and variable expenses, as well as income, savings, and taxes.
6. People may revise their budget based on unplanned expenses and changes in income.
• Benchmark: Grade 12
6. People may choose to donate money to charitable organizations and other not-for-profits because they gain satisfaction from donating.
Standard 3: Saving. Saving is the part of income that people choose to set aside for futureuses. People save for different reasons during the course of their lives. People make differentchoices about how they save and how much they save. Time, interest rates, and inflationaffect the value of savings.
• Benchmark: Grade 8
8. Different people save money for different reasons, including large purchases (such as higher education, autos, and homes), retirement, and unexpected events. People’s choices about how much to save and for what to save are based on their tastes and preferences.
• Benchmark: Grade 12
1. People choose between immediate spending and saving for future consump-tion. Some people have a tendency to be impatient, choosing immediate spending over saving for the future.
Making Personal Finance Decisions©2019, Minnesota Council on Economic Education. Developed in partnership with the Federal Reserve Bank of St. Louis.
Permission is granted to reprint or photocopy this lesson in its entirety for educational purposes, 118 provided the user credits the Minnesota Council on Economic Education.
Unit 5: Budgeting Lesson 5B: Budget Trade-Offs—A Penny Here and a Penny There
Lesson 6A:
Time Preference—Why It Is Hard to Save
Lesson DescriptionStudents investigate the decision to save as a choice between spending now or spend-ing later and how people’s natural preference to enjoy goods and services now affectsthis decision.
Standards and Benchmarks (see page 128)
Grade Level9-12
ConceptsIncome
Interest
Net income
Saving
Compelling QuestionHow do costs and benefits influence saving?
Unit 6
Saving
Making Personal Finance Decisions©2019, Minnesota Council on Economic Education. Developed in partnership with the Federal Reserve Bank of St. Louis. Permission is granted to reprint or photocopy this lesson in its entirety for educational purposes, provided the user credits the Minnesota Council on Economic Education. 119
Rule 6: Pay yourself first.Saving is making the decision to buy goods and services in the future rather than today.It can be difficult to save because people naturally prefer to enjoy things now and incurcosts later. Banks offer interest as an incentive for people to save. These lessons look atwhy it is hard to save and why it pays to save (the opportunity to earn compound interest).
ObjectivesStudents will be able to describe how the timing of benefits and costs can affect thechoice to save or spend.
Materials• Visual 6A.1: Personal Saving Rate (1959-2016)
• Visual 6A.2: The Timing of Benefits and Costs
• Handout 6A.1: Assessment, one copy for each student
Time Required20 minutes
Procedure1. Remind students that the main reason people work is to earn income to buy the
goods and services they want. Income is the payment people receive for providingresources in the marketplace. When people work, they provide human resources (labor)and in exchange receive income in the form of wages or salaries. People can also earnincome in the forms of rent, profit, and interest. Discuss the following:
• Once people receive income, what are the three basic things they end up allocat-ing it to? (Spending, paying taxes, and saving)
2. Explain the following:
• Spending, paying taxes, and saving are all different ways of buying goods andservices to satisfy your wants.
• Obviously, when you spend income, you receive goods and services now.
• When you pay taxes, you receive goods and services provided by the government,such as national defense, the legal system, highways, education, police and fireprotection, libraries, parks, and many other goods and services provided by fed-eral, state, and local governments.
• When you decide to save some of your income, you are choosing to buy goodsand services later.
• All income is fundamentally allocated to the purchase of goods and servicesbecause that is what gives people satisfaction and provides the incentive to work.
3. Define net income as gross income minus taxes. Explain that people have only a lim-ited amount of control over how much they pay in taxes (to the extent they can vote
Unit 6: Saving Lesson 6A: Time Preference—Why It Is Hard to Save
Making Personal Finance Decisions©2019, Minnesota Council on Economic Education. Developed in partnership with the Federal Reserve Bank of St. Louis.
Permission is granted to reprint or photocopy this lesson in its entirety for educational purposes, 120 provided the user credits the Minnesota Council on Economic Education.
for different candidates), so the basic question people face is how much of their netincome they will spend now and how much they will save to spend later.
4. Define saving as keeping some income to buy goods and services in the future.
5. Tell the students that the U.S. personal saving rate has fluctuated over time. DisplayVisual 6A.1: Personal Saving Rate (1959-2016) (or show students the current data onFRED® at https://fred.stlouisfed.org/graph/?g=3YaA.) Discuss the following:
• What has been the trend in personal saving over time? (Generally speaking, thepersonal saving rate has decreased over time.)
• What is the current personal saving rate? (See current data on FRED® athttps://fred.stlouisfed.org/graph/?g=3YaA. Mouse over the end of the trend lineto see a pop-up of the most recent rate.)
6. Explain that some households have negative savings, which means that they are notonly not saving but spending more than they earn.
• How is it possible for people to spend more than they earn? (They can spendsavings or borrow money.)
• Why do you think people save so little of their income? (Answers will vary.)
7. Write “Option 1: $100 today” and “Option 2: $100 one year from today” on theboard. Tell the students they may choose either option. Ask them to raise their handsif they would prefer Option 2. (None are likely to choose this option.)
8. Change Option 2 to “$102 a year from today” and repeat the question. (None arelikely to choose this option either.)
9. Continue raising the amount of Option 2 ($105, $110, $120, $150, $200, $500, etc.)and repeat the question until everyone (or almost everyone) chooses Option 2. (Somestudents may never choose Option 2. However, if pressed, most would admit theywould wait for $1 million a year from today if it were a serious offer.)
10. Explain that what is being demonstrated is people’s natural preference for when theyprefer to receive benefits. Basically, people prefer to receive benefits sooner ratherthan later. To persuade them to wait requires offering a benefit.
11. Return to the board and change Option 2 to the original option—“$100 one yearfrom today.” (Option 1 remains the same.) Tell the students that these now refer to apayment they must make. Ask them to raise their hands if they would prefer Option 2.(Most of the students will likely choose Option 2).
Lesson 6A: Time Preference—Why It Is Hard to Save Unit 6: Saving
Making Personal Finance Decisions©2019, Minnesota Council on Economic Education. Developed in partnership with the Federal Reserve Bank of St. Louis. Permission is granted to reprint or photocopy this lesson in its entirety for educational purposes, provided the user credits the Minnesota Council on Economic Education. 121
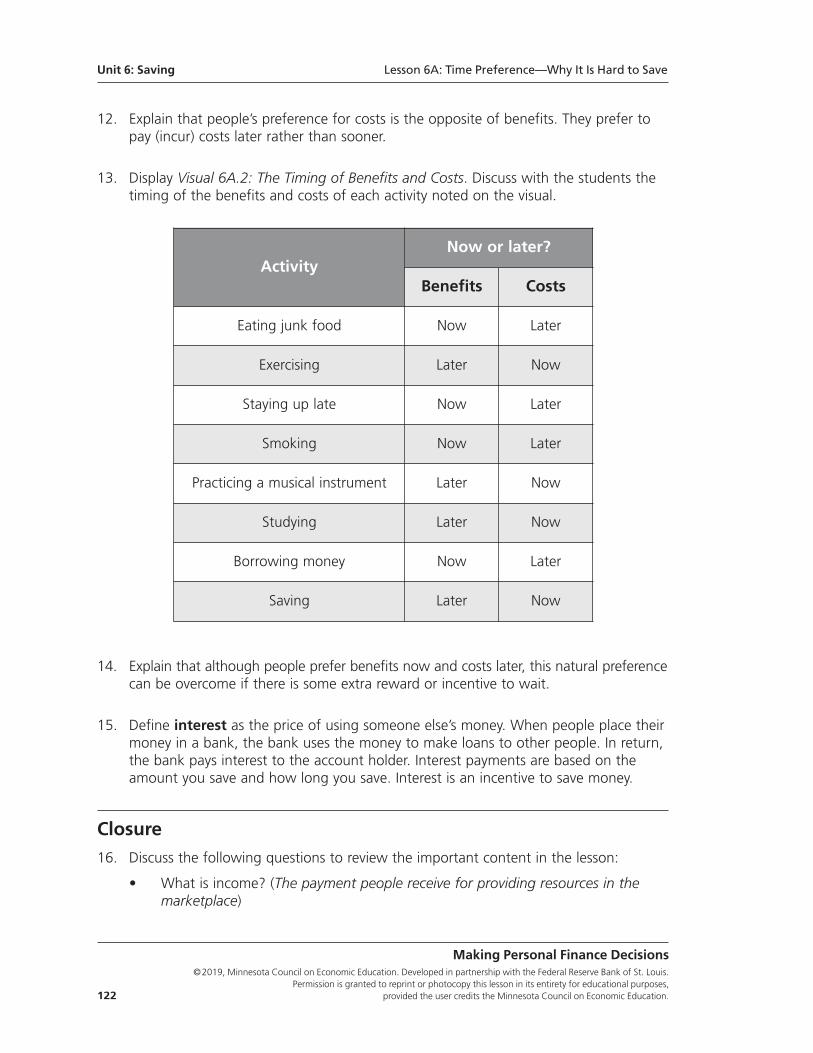
12. Explain that people’s preference for costs is the opposite of benefits. They prefer topay (incur) costs later rather than sooner.
13. Display Visual 6A.2: The Timing of Benefits and Costs. Discuss with the students thetiming of the benefits and costs of each activity noted on the visual.
Unit 6: Saving Lesson 6A: Time Preference—Why It Is Hard to Save
Making Personal Finance Decisions©2019, Minnesota Council on Economic Education. Developed in partnership with the Federal Reserve Bank of St. Louis.
Permission is granted to reprint or photocopy this lesson in its entirety for educational purposes, 122 provided the user credits the Minnesota Council on Economic Education.
ActivityNow or later?
Benefits Costs
Eating junk food Now Later
Exercising Later Now
Staying up late Now Later
Smoking Now Later
Practicing a musical instrument Later Now
Studying Later Now
Borrowing money Now Later
Saving Later Now
14. Explain that although people prefer benefits now and costs later, this natural preferencecan be overcome if there is some extra reward or incentive to wait.
15. Define interest as the price of using someone else’s money. When people place theirmoney in a bank, the bank uses the money to make loans to other people. In return,the bank pays interest to the account holder. Interest payments are based on theamount you save and how long you save. Interest is an incentive to save money.
Closure16. Discuss the following questions to review the important content in the lesson:
• What is income? (The payment people receive for providing resources in themarketplace)
• What type of income do most people earn? (Wages or salaries for providingtheir human resource [labor])
• What other types of income can people earn? (Rent, profit, or interest)
• What is net income? (Gross income minus taxes)
• What is spending? (Buying goods and services now)
• What is saving? (Keeping some income to buy goods and services in the future)
• What has been the trend in the personal saving rate over time in the UnitedStates? (It is decreasing: People have tended to save at a lower rate over time.)
• How do costs and benefits influence saving? (People prefer to enjoy things now[benefits] and pay costs later. This preference makes it difficult for people to save—to save they have to give up something [a cost] and buy goods and services inthe future [a benefit].)
• What is interest? (Interest is the price of using someone else’s money.)
• What does “the price of using someone else’s money mean? (People prefer toenjoy the benefits of having money now. If you use [borrow] someone’s money,you must compensate them with interest for making them wait to use it. Likewise,when you deposit money at a bank rather than spending it, the bank pays youinterest for the use of your money.) Point out that when banks pay interest theyare providing an incentive—a benefit—that might encourage people to save(that is, outweigh the cost of giving something up now.)
Assessment17. Distribute a copy of Handout 6A.1: Assessment to each student and allow time for
students to work (or assign as homework).
Handout 6A.1: Assessment—Answer Key
Directions: Use the knowledge you have learned in this lesson to write a para-graph for each numbered item below.
1. Explain people’s natural preferences for costs and benefits when receiving (buying) something. (People prefer to receive benefits now and incur costs in the future.)
• Describe how this natural reference plays out when a consumer decides whether to buy something with cash or with a credit card? (Credit cards allow consumers to have the benefit of the good now and pay the cost in the future.)
• If a credit card company increases the interest rate it charges, how might consumers with that card change how they use that credit card? (A higher credit card interest rate will increase the future cost of goods or services
Lesson 6A: Time Preference—Why It Is Hard to Save Unit 6: Saving
Making Personal Finance Decisions©2019, Minnesota Council on Economic Education. Developed in partnership with the Federal Reserve Bank of St. Louis. Permission is granted to reprint or photocopy this lesson in its entirety for educational purposes, provided the user credits the Minnesota Council on Economic Education. 123
purchased, so consumers with that card are more likely to pay with cash orfind a card with a lower rate.)
2. Explain how interest is the price of using some else’s money. (People prefer to enjoy the benefits of having their money now. If you use [borrow] someone’s money, you must compensate them with interest for making them wait to use it. Likewise, when you deposit money at a bank rather than spending it, the bank pays you interest for the use of your money.)
• Describe how interest acts an incentive for people to save. (People do not naturally postpone spending, but interest acts as an incentive to overcome that natural tendency.)
• What happens to the incentive to save as interest rates increase? (The higher the interest rate, the greater the incentive to save.)
Unit 6: Saving Lesson 6A: Time Preference—Why It Is Hard to Save
Making Personal Finance Decisions©2019, Minnesota Council on Economic Education. Developed in partnership with the Federal Reserve Bank of St. Louis.
Permission is granted to reprint or photocopy this lesson in its entirety for educational purposes, 124 provided the user credits the Minnesota Council on Economic Education.
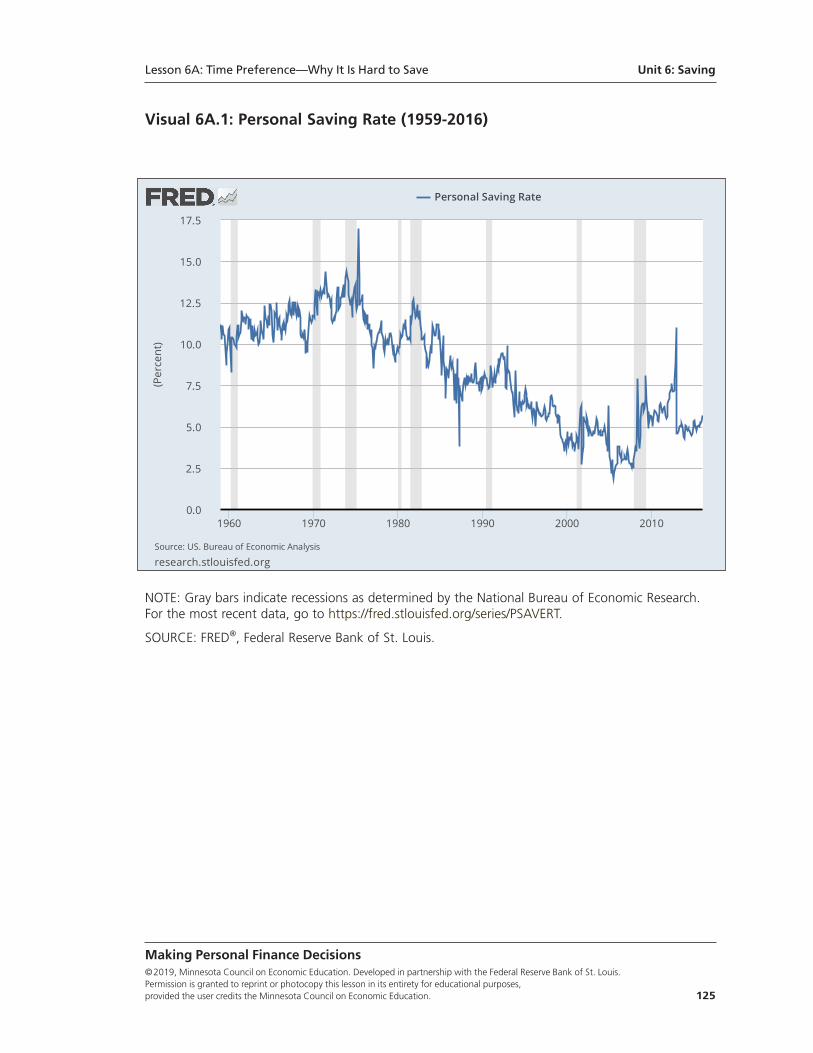
Visual 6A.1: Personal Saving Rate (1959-2016)
Lesson 6A: Time Preference—Why It Is Hard to Save Unit 6: Saving
Making Personal Finance Decisions©2019, Minnesota Council on Economic Education. Developed in partnership with the Federal Reserve Bank of St. Louis. Permission is granted to reprint or photocopy this lesson in its entirety for educational purposes, provided the user credits the Minnesota Council on Economic Education. 125
NOTE: Gray bars indicate recessions as determined by the National Bureau of Economic Research.For the most recent data, go to https://fred.stlouisfed.org/series/PSAVERT.
SOURCE: FRED®, Federal Reserve Bank of St. Louis.
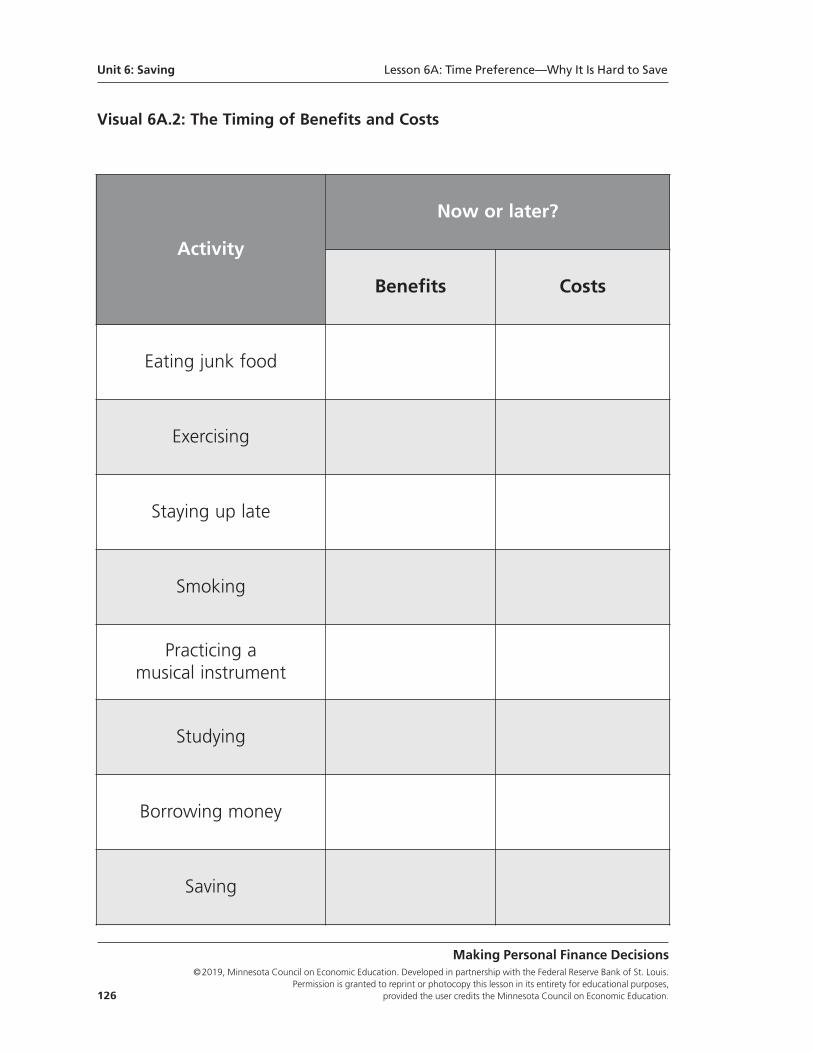
Unit 6: Saving Lesson 6A: Time Preference—Why It Is Hard to Save
Making Personal Finance Decisions©2019, Minnesota Council on Economic Education. Developed in partnership with the Federal Reserve Bank of St. Louis.
Permission is granted to reprint or photocopy this lesson in its entirety for educational purposes, 126 provided the user credits the Minnesota Council on Economic Education.
Visual 6A.2: The Timing of Benefits and Costs
Activity
Now or later?
Benefits Costs
Eating junk food
Exercising
Staying up late
Smoking
Practicing a musical instrument
Studying
Borrowing money
Saving
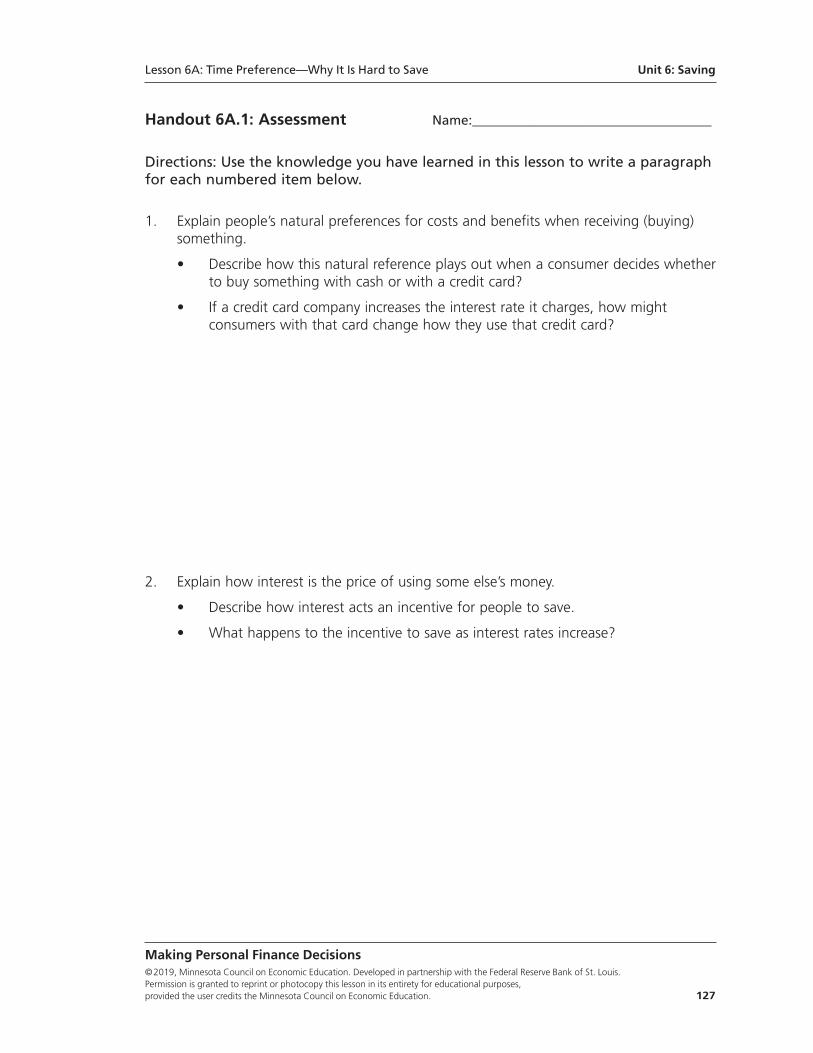
Handout 6A.1: Assessment Name:____________________________________
Directions: Use the knowledge you have learned in this lesson to write a paragraphfor each numbered item below.
1. Explain people’s natural preferences for costs and benefits when receiving (buying) something.
• Describe how this natural reference plays out when a consumer decides whetherto buy something with cash or with a credit card?
• If a credit card company increases the interest rate it charges, how might consumers with that card change how they use that credit card?
2. Explain how interest is the price of using some else’s money.
• Describe how interest acts an incentive for people to save.
• What happens to the incentive to save as interest rates increase?
Making Personal Finance Decisions©2019, Minnesota Council on Economic Education. Developed in partnership with the Federal Reserve Bank of St. Louis. Permission is granted to reprint or photocopy this lesson in its entirety for educational purposes, provided the user credits the Minnesota Council on Economic Education. 127
Lesson 6A: Time Preference—Why It Is Hard to Save Unit 6: Saving
Standards and Benchmarks
National Standards for Financial Literacy
Standard 3: Saving. Saving is the part of income that people choose to set aside for futureuse. People save for different reasons during the course of their lives. People make differentchoices about how they save and how much they save. Time, interest rates, and inflationaffect the value of savings.
• Benchmark: Grade 4
1. Income is saved, spent on goods and services, or used to pay taxes.
2. When people save money, they give up the opportunity to spend that money to buy things now in order to buy things later.
• Benchmark: Grade 8
4. When interest rates increase, people earn more on their savings and their savings grow more quickly.
• Benchmark: Grade 12
1. People choose between immediate spending and saving for future consump-tion. Some people have a tendency to be impatient, choosing immediate spending over saving for the future.
Unit 6: Saving Lesson 6A: Time Preference—Why It Is Hard to Save
Making Personal Finance Decisions©2019, Minnesota Council on Economic Education. Developed in partnership with the Federal Reserve Bank of St. Louis.
Permission is granted to reprint or photocopy this lesson in its entirety for educational purposes, 128 provided the user credits the Minnesota Council on Economic Education.
Lesson 6B:
Simple and Compound Interest—Why It Is Great to Save
Lesson DescriptionFormulas for simple and compound interest, as well as the Rule of 72, are explainedand used to illustrate the benefit of saving in general and the benefit of saving earlyin particular.
Standards and Benchmarks (see page 141)
Grade Level9-12
ConceptsAnnual interest rate
Compound interest
Principal
Rule of 72
Simple interest
Compelling QuestionHow can savers benefit from compound interest?
Making Personal Finance Decisions©2019, Minnesota Council on Economic Education. Developed in partnership with the Federal Reserve Bank of St. Louis. Permission is granted to reprint or photocopy this lesson in its entirety for educational purposes, provided the user credits the Minnesota Council on Economic Education. 129
Rule 6: Pay yourself first.Saving is making the decision to buy goods and services in the future rather than today.It can be difficult to save because people naturally prefer to enjoy things now and incurcosts later. Banks offer interest as an incentive for people to save. These lessons look atwhy it is hard to save and why it pays to save (the opportunity to earn compound interest).
Unit 6
Saving
ObjectivesStudents will be able to
• calculate the change in the value of an asset with (i) simple interest or (ii) com-pound interest and
• estimate the change in the value of an asset using the Rule of 72.
Materials• Visual 6B.1: Simple Interest
• Visual 6B.2: Compound Interest
• Visual 6B.3: The Rule of 72
• Visual 6B.4: Jack and Jill
• Handout 6B.1: Calculating Interest
• Handout 6B.2: Assessment
• A calculator for each student
Time Required45 minutes
Procedure1. Write “$100” on the board. Define simple interest as an annual payment based on
a percentage of the amount you save. This percentage is called the annual interestrate. The original amount of money you deposit or invest, excluding any interest ordividends, is called the principal.
2. Discuss the following:
• Suppose that you save $100 at an annual interest rate of 8 percent. (Add on to“$100” to have “$100 × 0.08 = $8.00” on the board).
• 8 percent written in decimal terms is 0.08. (Instruct the students to move thedecimal point in the percentage figure two places to the left.)
• $8 is the interest earned in one year, so you would have $108.00 after one year.
• $108 is the original $100 plus the interest. (Write the following on the board.):$100 × 0.08, or $100 + $100 (0.08),which can be written as $100 (1 + 0.08).
Making Personal Finance Decisions©2019, Minnesota Council on Economic Education. Developed in partnership with the Federal Reserve Bank of St. Louis.
Permission is granted to reprint or photocopy this lesson in its entirety for educational purposes, 130 provided the user credits the Minnesota Council on Economic Education.
Unit 6: Saving Lesson 6B: Simple and Compound Interest—Why It Is Great to Save
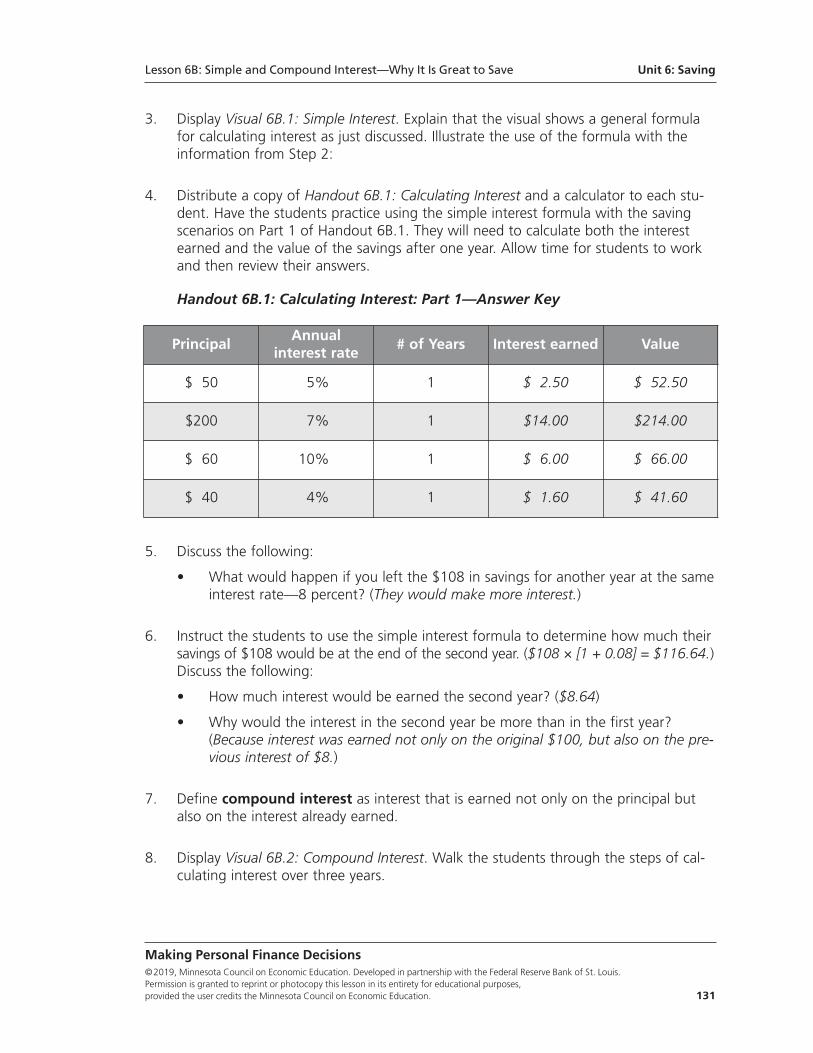
3. Display Visual 6B.1: Simple Interest. Explain that the visual shows a general formulafor calculating interest as just discussed. Illustrate the use of the formula with theinformation from Step 2:
4. Distribute a copy of Handout 6B.1: Calculating Interest and a calculator to each stu-dent. Have the students practice using the simple interest formula with the savingscenarios on Part 1 of Handout 6B.1. They will need to calculate both the interestearned and the value of the savings after one year. Allow time for students to workand then review their answers.
Handout 6B.1: Calculating Interest: Part 1—Answer Key
5. Discuss the following:
• What would happen if you left the $108 in savings for another year at the sameinterest rate—8 percent? (They would make more interest.)
6. Instruct the students to use the simple interest formula to determine how much theirsavings of $108 would be at the end of the second year. ($108 × [1 + 0.08] = $116.64.)Discuss the following:
• How much interest would be earned the second year? ($8.64)
• Why would the interest in the second year be more than in the first year?(Because interest was earned not only on the original $100, but also on the pre-vious interest of $8.)
7. Define compound interest as interest that is earned not only on the principal butalso on the interest already earned.
8. Display Visual 6B.2: Compound Interest. Walk the students through the steps of cal-culating interest over three years.
Making Personal Finance Decisions©2019, Minnesota Council on Economic Education. Developed in partnership with the Federal Reserve Bank of St. Louis. Permission is granted to reprint or photocopy this lesson in its entirety for educational purposes, provided the user credits the Minnesota Council on Economic Education. 131
Principal Annual
interest rate # of Years Interest earned Value
$ 50 5% 1 $ 2.50 $ 52.50
$200 7% 1 $14.00 $214.00
$ 60 10% 1 $ 6.00 $ 66.00
$ 40 4% 1 $ 1.60 $ 41.60
Lesson 6B: Simple and Compound Interest—Why It Is Great to Save Unit 6: Saving
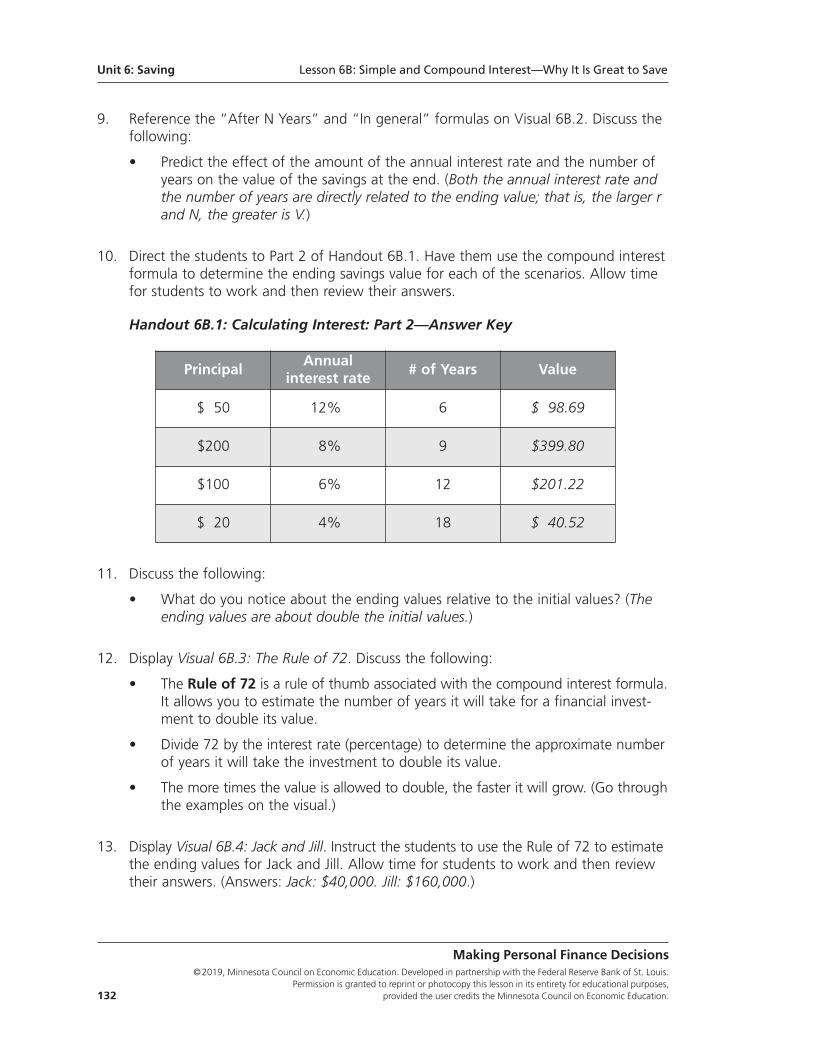
9. Reference the “After N Years” and “In general” formulas on Visual 6B.2. Discuss thefollowing:
• Predict the effect of the amount of the annual interest rate and the number ofyears on the value of the savings at the end. (Both the annual interest rate andthe number of years are directly related to the ending value; that is, the larger rand N, the greater is V.)
10. Direct the students to Part 2 of Handout 6B.1. Have them use the compound interestformula to determine the ending savings value for each of the scenarios. Allow timefor students to work and then review their answers.
Handout 6B.1: Calculating Interest: Part 2—Answer Key
11. Discuss the following:
• What do you notice about the ending values relative to the initial values? (Theending values are about double the initial values.)
12. Display Visual 6B.3: The Rule of 72. Discuss the following:
• The Rule of 72 is a rule of thumb associated with the compound interest formula.It allows you to estimate the number of years it will take for a financial invest-ment to double its value.
• Divide 72 by the interest rate (percentage) to determine the approximate numberof years it will take the investment to double its value.
• The more times the value is allowed to double, the faster it will grow. (Go throughthe examples on the visual.)
13. Display Visual 6B.4: Jack and Jill. Instruct the students to use the Rule of 72 to estimatethe ending values for Jack and Jill. Allow time for students to work and then reviewtheir answers. (Answers: Jack: $40,000. Jill: $160,000.)
Making Personal Finance Decisions©2019, Minnesota Council on Economic Education. Developed in partnership with the Federal Reserve Bank of St. Louis.
Permission is granted to reprint or photocopy this lesson in its entirety for educational purposes, 132 provided the user credits the Minnesota Council on Economic Education.
Principal Annual
interest rate # of Years Value
$ 50 12% 6 $ 98.69
$200 8% 9 $399.80
$100 6% 12 $201.22
$ 20 4% 18 $ 40.52
Unit 6: Saving Lesson 6B: Simple and Compound Interest—Why It Is Great to Save
14. Explain the following:
• With an 8 percent annual interest rate, both Jack’s and Jill’s savings double every9 years.
• Jill leaves her savings in for 45 years and it doubles five times. She ends up witharound $160,000.
• Jack leaves his savings in for far fewer years—27 years. His doubles only threetimes, and he ends up with $40,000.
• Although they both saved $5,000 and earn an 8 percent annual interest rate, Jillends up with four times more money than Jack simply because she saved earlier.
• What lesson is learned from Jack and Jill? (Start saving early to take advantageof compound interest.)
Closure 15. Discuss the following:
• What is simple interest? (Interest paid on the principal.)
• What is compound interest? (Interest paid on the principal as well as the interestearned previously.)
• What is the Rule of 72? (A rule of thumb associated with the compound interestformula that allows you to estimate the number of years it will take a financialinvestment to double its value)
16. Explain the following:
• While it can be difficult to put off spending, interest is the reward for saving.
• Because of the power of compound interest, the reward for saving can be verylarge.
• Jill gave up the opportunity to buy $5,000 worth of goods and services today,but she will be able to buy $160,000 worth of goods and services when she is65 years of age. While inflation will likely reduce the real value of her money, shewill still be able to buy and enjoy significantly more goods and services in thefuture than she could have bought with $5,000 today.
• For Jack, the opportunity cost of waiting to save was very large—he ended upable to buy only a fourth of what Jill could buy even though he saved the sameamount. For example, say you have a choice between buying a car now or savingthat money at an 8 percent interest rate and buying a car later. If you buy thecar now, that is what you have, one car. If you save, you could have enoughmoney to buy two cars 9 years from now or four cars 18 years from now, oreight cars (or a house!) 27 years from now.
Making Personal Finance Decisions©2019, Minnesota Council on Economic Education. Developed in partnership with the Federal Reserve Bank of St. Louis. Permission is granted to reprint or photocopy this lesson in its entirety for educational purposes, provided the user credits the Minnesota Council on Economic Education. 133
Lesson 6B: Simple and Compound Interest—Why It Is Great to Save Unit 6: Saving
• What important factors should a saver consider to maximize the benefits ofcompound interest? (Save often/regularly, start saving early, get the highestinterest rate possible, and leave your savings in the account)
• American humorist, Will Rogers, summed saving up this way: “The best way todouble your money is to fold it in half and put it in your pocket.”
Assessment17. Distribute a copy of Handout 6B.1: Assessment to each student and allow time for
students to work (or assign as homework).
Handout 6B.2: Assessment—Answer Key
Directions: Use what you have learned in this lesson to answer the followingquestions:
1. Imagine you receive a graduation gift of $5,000 from a wealthy uncle with a letterthat encourages you to save the money for your old age. Also imagine that youare able to average 9% interest on the principal.
a. How much (simple) interest will you receive on your savings after one year? ($450)
b. What will the value of your savings be after that one year? ($5,450)
c. What will the value be after 10 years (use the compound interest formula)?($11,836.82)
d. How many years will it take for your savings to double in value? (8 years)
e. Say you were 18 years of age when you deposited the money and you will withdraw it at 66 years of age. How many times will the money have dou-bled in value during that time? (6 times)
f. How much money will be in the account when you withdraw it at 66? ($320,000)
2. Now imagine you are 66 and have withdrawn your savings. You have decidedto gift $5,000 to your young nephew or niece for graduation. Write a letter toaccompany the check that explains why he or she should start saving early. (Theletter should explain that the best way to take advantage of compound interestis to save often/regularly, start early, get the highest interest rate possible, andleave the savings in the account).
Making Personal Finance Decisions©2019, Minnesota Council on Economic Education. Developed in partnership with the Federal Reserve Bank of St. Louis.
Permission is granted to reprint or photocopy this lesson in its entirety for educational purposes, 134 provided the user credits the Minnesota Council on Economic Education.
Unit 6: Saving Lesson 6B: Simple and Compound Interest—Why It Is Great to Save
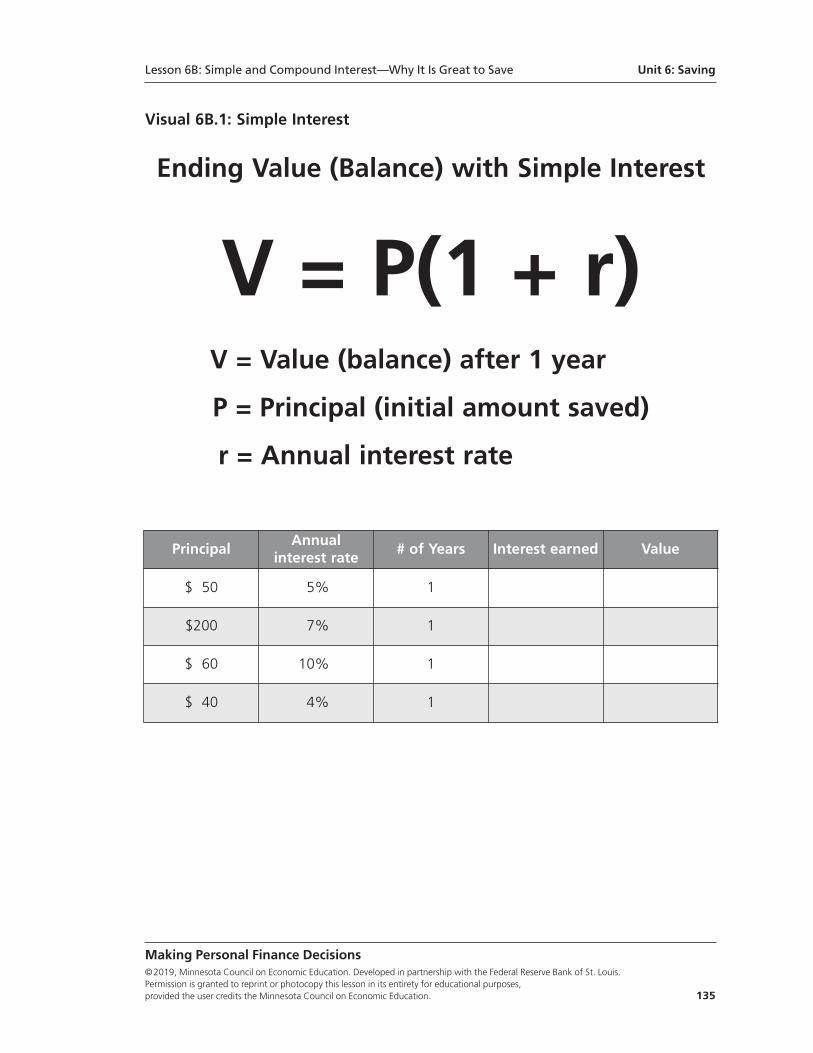
Visual 6B.1: Simple Interest
Ending Value (Balance) with Simple Interest
V = P(1 + r)V = Value (balance) after 1 year
P = Principal (initial amount saved)
r = Annual interest rate
Making Personal Finance Decisions©2019, Minnesota Council on Economic Education. Developed in partnership with the Federal Reserve Bank of St. Louis. Permission is granted to reprint or photocopy this lesson in its entirety for educational purposes, provided the user credits the Minnesota Council on Economic Education. 135
Principal Annual
interest rate # of Years Interest earned Value
$ 50 5% 1
$200 7% 1
$ 60 10% 1
$ 40 4% 1
Lesson 6B: Simple and Compound Interest—Why It Is Great to Save Unit 6: Saving
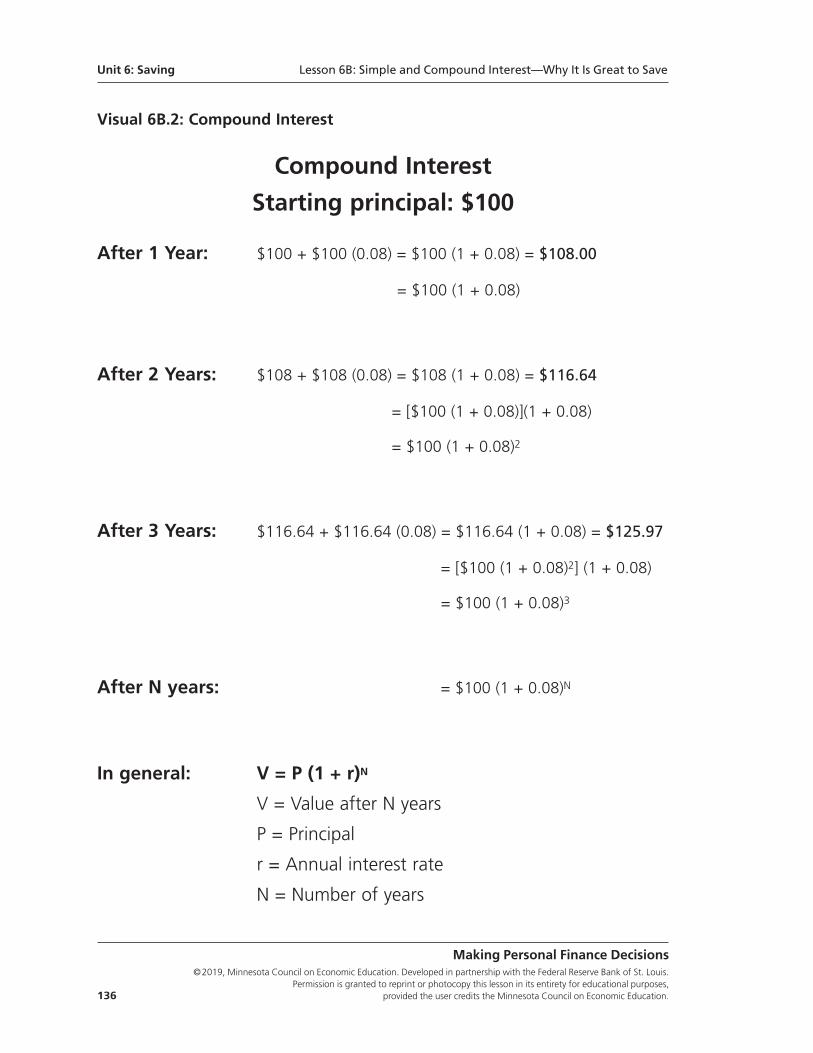
Visual 6B.2: Compound Interest
Compound Interest
Starting principal: $100
After 1 Year: $100 + $100 (0.08) = $100 (1 + 0.08) = $108.00
= $100 (1 + 0.08)
After 2 Years: $108 + $108 (0.08) = $108 (1 + 0.08) = $116.64
= [$100 (1 + 0.08)](1 + 0.08)
= $100 (1 + 0.08)2
After 3 Years: $116.64 + $116.64 (0.08) = $116.64 (1 + 0.08) = $125.97
= [$100 (1 + 0.08)2] (1 + 0.08)
= $100 (1 + 0.08)3
After N years: = $100 (1 + 0.08)N
In general: V = P (1 + r)N
V = Value after N years
P = Principal
r = Annual interest rate
N = Number of years
Making Personal Finance Decisions©2019, Minnesota Council on Economic Education. Developed in partnership with the Federal Reserve Bank of St. Louis.
Permission is granted to reprint or photocopy this lesson in its entirety for educational purposes, 136 provided the user credits the Minnesota Council on Economic Education.
Unit 6: Saving Lesson 6B: Simple and Compound Interest—Why It Is Great to Save
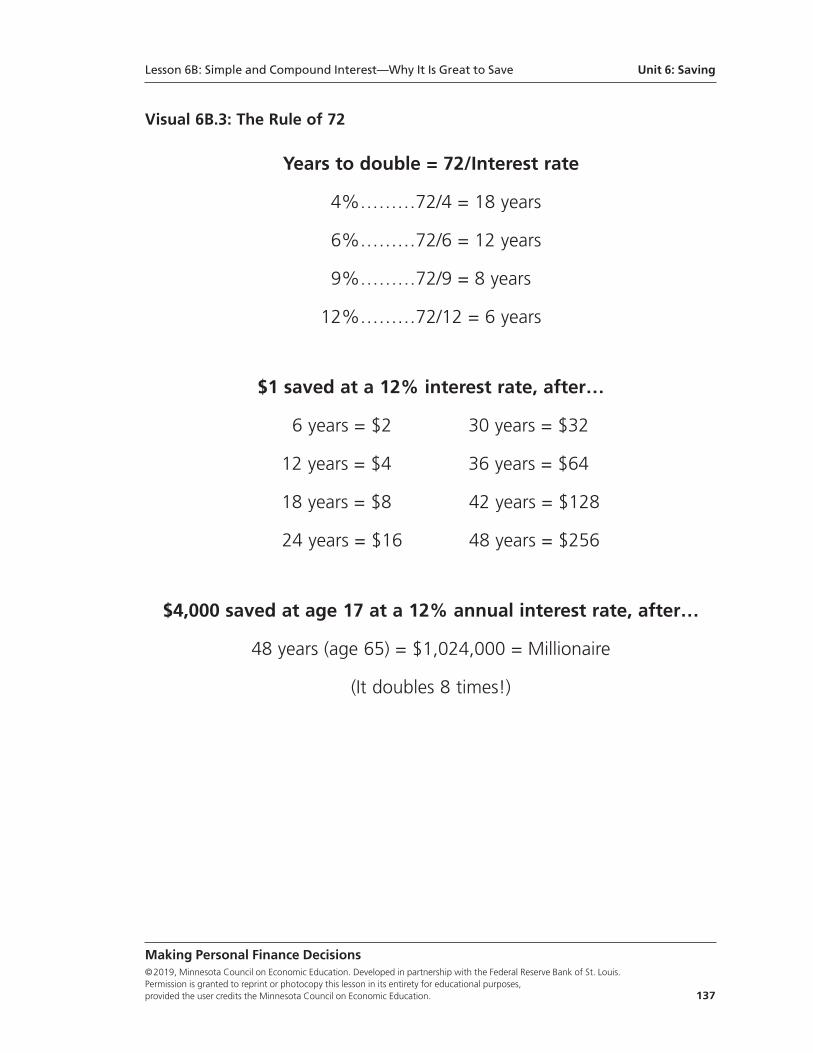
Visual 6B.3: The Rule of 72
Years to double = 72/Interest rate
4%………72/4 = 18 years
6%………72/6 = 12 years
9%………72/9 = 8 years
12%………72/12 = 6 years
$1 saved at a 12% interest rate, after…
6 years = $2 30 years = $32
12 years = $4 36 years = $64
18 years = $8 42 years = $128
24 years = $16 48 years = $256
$4,000 saved at age 17 at a 12% annual interest rate, after…
48 years (age 65) = $1,024,000 = Millionaire
(It doubles 8 times!)
Making Personal Finance Decisions©2019, Minnesota Council on Economic Education. Developed in partnership with the Federal Reserve Bank of St. Louis. Permission is granted to reprint or photocopy this lesson in its entirety for educational purposes, provided the user credits the Minnesota Council on Economic Education. 137
Lesson 6B: Simple and Compound Interest—Why It Is Great to Save Unit 6: Saving
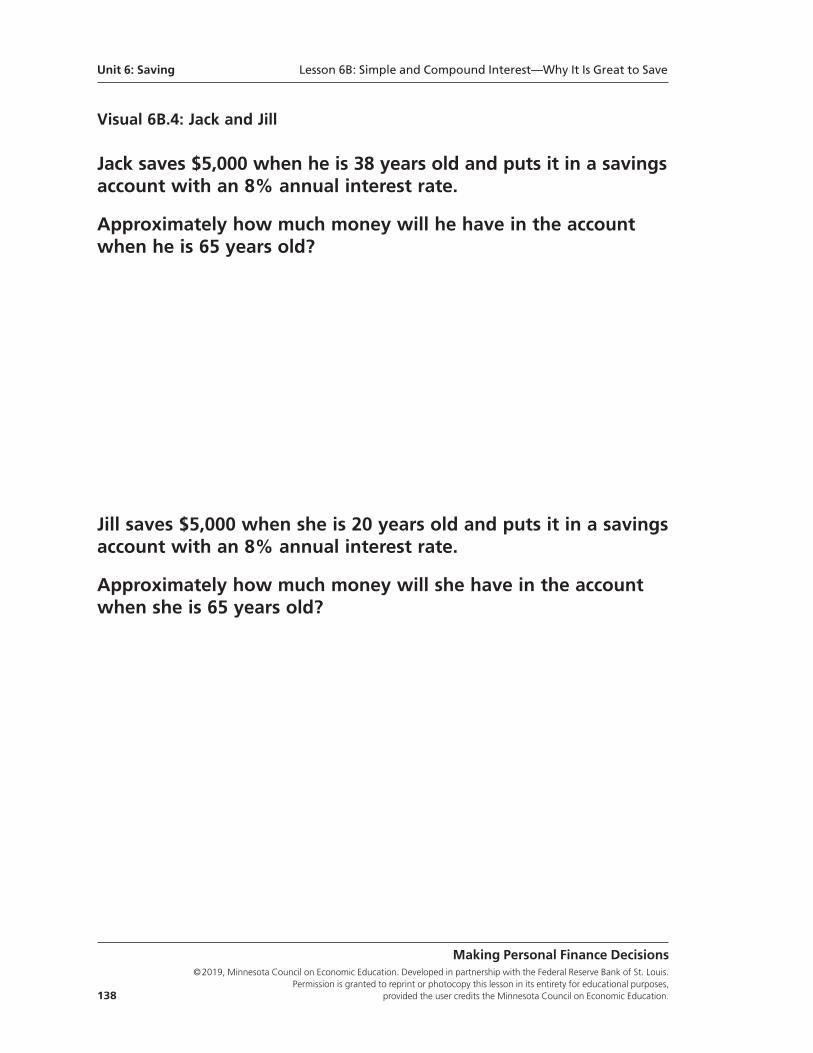
Visual 6B.4: Jack and Jill
Jack saves $5,000 when he is 38 years old and puts it in a savingsaccount with an 8% annual interest rate.
Approximately how much money will he have in the accountwhen he is 65 years old?
Jill saves $5,000 when she is 20 years old and puts it in a savingsaccount with an 8% annual interest rate.
Approximately how much money will she have in the accountwhen she is 65 years old?
Making Personal Finance Decisions©2019, Minnesota Council on Economic Education. Developed in partnership with the Federal Reserve Bank of St. Louis.
Permission is granted to reprint or photocopy this lesson in its entirety for educational purposes, 138 provided the user credits the Minnesota Council on Economic Education.
Unit 6: Saving Lesson 6B: Simple and Compound Interest—Why It Is Great to Save
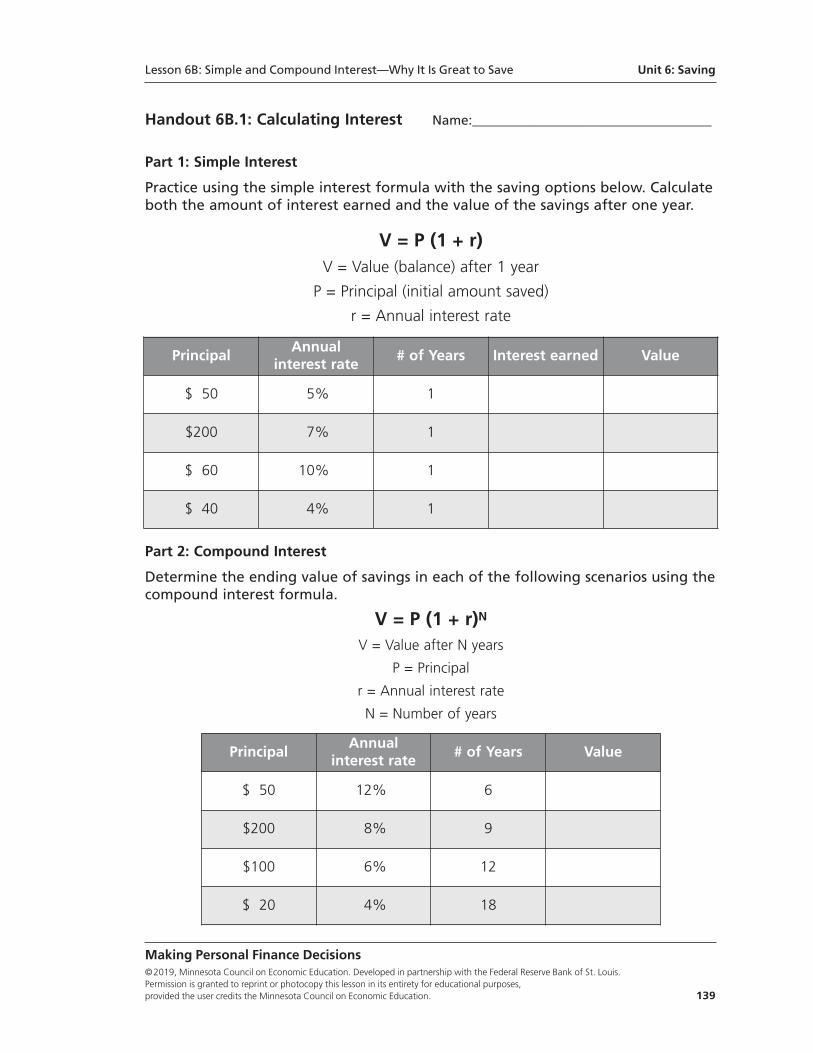
Handout 6B.1: Calculating Interest Name:____________________________________
Part 1: Simple Interest
Practice using the simple interest formula with the saving options below. Calculateboth the amount of interest earned and the value of the savings after one year.
V = P (1 + r)V = Value (balance) after 1 year
P = Principal (initial amount saved)
r = Annual interest rate
Part 2: Compound Interest
Determine the ending value of savings in each of the following scenarios using thecompound interest formula.
V = P (1 + r)N
V = Value after N years
P = Principal
r = Annual interest rate
N = Number of years
Making Personal Finance Decisions©2019, Minnesota Council on Economic Education. Developed in partnership with the Federal Reserve Bank of St. Louis. Permission is granted to reprint or photocopy this lesson in its entirety for educational purposes, provided the user credits the Minnesota Council on Economic Education. 139
Principal Annual
interest rate # of Years Interest earned Value
$ 50 5% 1
$200 7% 1
$ 60 10% 1
$ 40 4% 1
Principal Annual
interest rate # of Years Value
$ 50 12% 6
$200 8% 9
$100 6% 12
$ 20 4% 18
Lesson 6B: Simple and Compound Interest—Why It Is Great to Save Unit 6: Saving
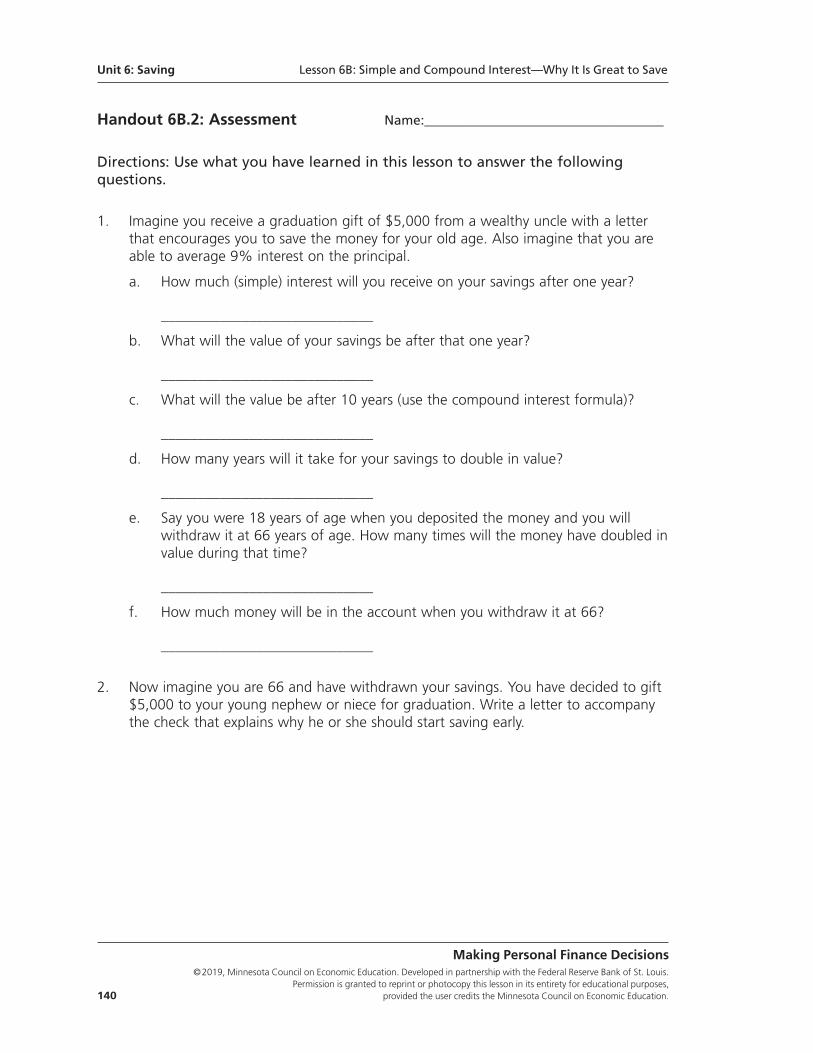
Handout 6B.2: Assessment Name:____________________________________
Directions: Use what you have learned in this lesson to answer the following questions.
1. Imagine you receive a graduation gift of $5,000 from a wealthy uncle with a letter that encourages you to save the money for your old age. Also imagine that you are able to average 9% interest on the principal.
a. How much (simple) interest will you receive on your savings after one year?
_____________________________
b. What will the value of your savings be after that one year?
_____________________________
c. What will the value be after 10 years (use the compound interest formula)?
_____________________________
d. How many years will it take for your savings to double in value?
_____________________________
e. Say you were 18 years of age when you deposited the money and you will withdraw it at 66 years of age. How many times will the money have doubled invalue during that time?
_____________________________
f. How much money will be in the account when you withdraw it at 66?
_____________________________
2. Now imagine you are 66 and have withdrawn your savings. You have decided to gift $5,000 to your young nephew or niece for graduation. Write a letter to accompany the check that explains why he or she should start saving early.
Making Personal Finance Decisions©2019, Minnesota Council on Economic Education. Developed in partnership with the Federal Reserve Bank of St. Louis.
Permission is granted to reprint or photocopy this lesson in its entirety for educational purposes, 140 provided the user credits the Minnesota Council on Economic Education.
Unit 6: Saving Lesson 6B: Simple and Compound Interest—Why It Is Great to Save
Standards and Benchmarks
National Standards for Financial Literacy
Standard 3: Saving. Saving is the part of income that people choose to set aside forfuture use. People save for different reasons during the course of their lives. People makedifferent choices about how they save and how much they save. Time, interest rates, andinflation affect the value of savings.
• Benchmark: Grade 4
2. When people save money, they give up the opportunity to spend that money to buy things now in order to buy things later.
• Benchmark: Grade 8
4. When interest rates increase, people earn more on their savings and their savings grow more quickly.
5. Principal is the initial amount of money upon which interest is paid.
6. Compound interest is the interest that is earned not only on the principal but also on the interest already earned.
7. The value of a person’s savings in the future is determined by the amount saved and the interest rate. The earlier people begin to save, the more savings they will be able to accumulate, all other things equal, as a result ofthe power of compound interest.
• Benchmark: Grade 12
1. People choose between immediate spending and saving for future consump-tion. Some people have a tendency to be impatient, choosing immediate spending over saving for the future.
Making Personal Finance Decisions©2019, Minnesota Council on Economic Education. Developed in partnership with the Federal Reserve Bank of St. Louis. Permission is granted to reprint or photocopy this lesson in its entirety for educational purposes, provided the user credits the Minnesota Council on Economic Education. 141
Lesson 6B: Simple and Compound Interest—Why It Is Great to Save Unit 6: Saving

Making Personal Finance Decisions©2019, Minnesota Council on Economic Education. Developed in partnership with the Federal Reserve Bank of St. Louis.
Permission is granted to reprint or photocopy this lesson in its entirety for educational purposes, 142 provided the user credits the Minnesota Council on Economic Education.
Lesson 7A:
The Spending Decision—Colas and Hot Dogs
Lesson DescriptionStudents help Joe, a guy at a baseball game, decide how many colas and hot dogs tobuy. Joe’s “best” choice is shown to depend on not only what Joe likes but also theamount of money he has and the prices charged.
Standards and Benchmarks (see page 156)
Grade Level9-12
ConceptsBudget (income) constraint
Diminishing returns
Marginal satisfaction
Satisfaction (happiness)
Compelling QuestionHow do people decide what combination of goods and services to buy?
Unit 7
Spending
Making Personal Finance Decisions©2019, Minnesota Council on Economic Education. Developed in partnership with the Federal Reserve Bank of St. Louis. Permission is granted to reprint or photocopy this lesson in its entirety for educational purposes, provided the user credits the Minnesota Council on Economic Education. 143
Rule 7: Spend wisely.Because income is limited, people must make decisions about which goods and servicesto buy to maximize the satisfaction (happiness) they get from their income. These lessonslook at things to consider when making choices about spending (What does it mean toget a “good deal”?) and show that “spending on saving” may be one of the best waysto spend more than may seem possible with a given income.
ObjectivesStudents will be able to
• describe a budget (income) constraint,
• determine which combination of goods provides the most satisfaction (happiness)given a budget (income) constraint, and
• describe how changes in prices may change consumer choices.
Materials• Visual 7A.1: Joe’s Satisfaction Index
• Visual 7A.2: Joe’s Satisfaction Alternatives
• Visual 7A.3: Joe’s Diminishing Returns
• Visual 7A.4: Joe’s Marginal Satisfaction
• Handout 7A.1: How Many Colas and Hot Dogs Should Joe Buy?, one copy foreach student
• Handout 7A.2: Assessment, one copy for each student
• Handout 7A.2: Assessment—Answer Key
Time Required45 minutes
Procedure1. Begin the class by telling the students they are going to help Joe, a hungry and thirsty
baseball lover at a baseball game, decide what to eat and drink. Colas are $2 eachand hot dogs are $1 each. Joe has only $8 to spend. When someone has a limitedamount of money to spend, we call the amount a budget, or income, constraint,because it constrains, or limits, what they can buy. Discuss the following:
• How should Joe decide how many colas and hot dogs to buy? (Answers will vary,but students will likely say that Joe should buy more of the good he likes themost.)
2. Display a copy of Visual 7A.1: Joe’s Satisfaction Index. Distribute a copy of Handout7A.1: How Many Colas and Hot Dogs Should Joe Buy? to each student. Explain thefollowing:
• The index on the visual (and on the handout) shows how much total satisfaction,or happiness, Joe gets from different amounts of colas and hot dogs.
Unit 7: Spending Lesson 7A: The Spending Decision—Colas and Hot Dogs
Making Personal Finance Decisions©2019, Minnesota Council on Economic Education. Developed in partnership with the Federal Reserve Bank of St. Louis.
Permission is granted to reprint or photocopy this lesson in its entirety for educational purposes, 144 provided the user credits the Minnesota Council on Economic Education.
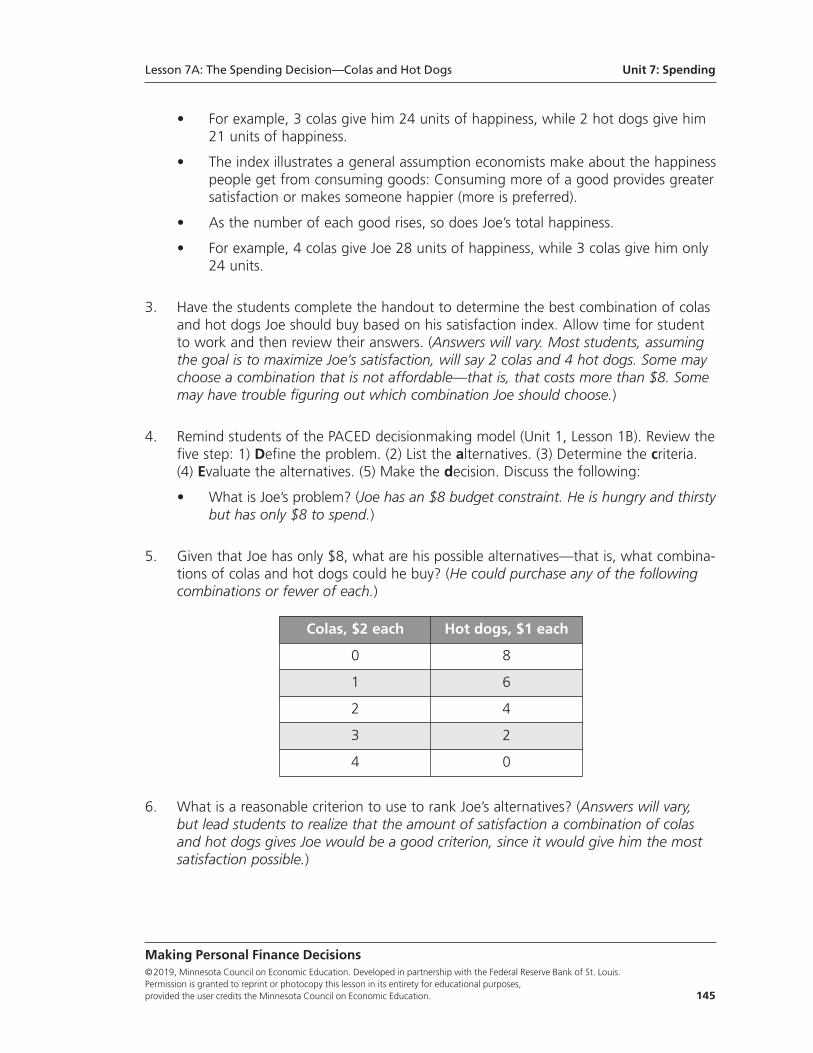
• For example, 3 colas give him 24 units of happiness, while 2 hot dogs give him21 units of happiness.
• The index illustrates a general assumption economists make about the happinesspeople get from consuming goods: Consuming more of a good provides greatersatisfaction or makes someone happier (more is preferred).
• As the number of each good rises, so does Joe’s total happiness.
• For example, 4 colas give Joe 28 units of happiness, while 3 colas give him only24 units.
3. Have the students complete the handout to determine the best combination of colasand hot dogs Joe should buy based on his satisfaction index. Allow time for studentto work and then review their answers. (Answers will vary. Most students, assumingthe goal is to maximize Joe’s satisfaction, will say 2 colas and 4 hot dogs. Some maychoose a combination that is not affordable—that is, that costs more than $8. Somemay have trouble figuring out which combination Joe should choose.)
4. Remind students of the PACED decisionmaking model (Unit 1, Lesson 1B). Review thefive step: 1) Define the problem. (2) List the alternatives. (3) Determine the criteria.(4) Evaluate the alternatives. (5) Make the decision. Discuss the following:
• What is Joe’s problem? (Joe has an $8 budget constraint. He is hungry and thirstybut has only $8 to spend.)
5. Given that Joe has only $8, what are his possible alternatives—that is, what combina-tions of colas and hot dogs could he buy? (He could purchase any of the followingcombinations or fewer of each.)
6. What is a reasonable criterion to use to rank Joe’s alternatives? (Answers will vary,but lead students to realize that the amount of satisfaction a combination of colasand hot dogs gives Joe would be a good criterion, since it would give him the mostsatisfaction possible.)
Lesson 7A: The Spending Decision—Colas and Hot Dogs Unit 7: Spending
Making Personal Finance Decisions©2019, Minnesota Council on Economic Education. Developed in partnership with the Federal Reserve Bank of St. Louis. Permission is granted to reprint or photocopy this lesson in its entirety for educational purposes, provided the user credits the Minnesota Council on Economic Education. 145
Colas, $2 each Hot dogs, $1 each
0 8
1 6
2 4
3 2
4 0
7. Refer again to Visual 7A.1. Note that in the PACED model, the step after determiningcriteria is evaluating the alternatives. Discuss the following:
• How much satisfaction would Joe get from each of the possible alternatives?
8. Display Visual 7A.2: Joe’s Satisfaction Alternatives
• Given that Joe is trying to get the most satisfaction (happiness) for his $8, whichcombination of colas and hot dogs should he buy? (2 colas and 4 hot dogs, sincethat combination yields him the most satisfaction—49 units)
9. Display Visual 7A.3: Joe’s Diminishing Returns. Explain the following:
• There is another way of calculating the best decision for Joe.
• There are now two additional columns: The third column shows the amount ofsatisfaction added by each additional cola or hot dog. For example, since 2 colasgive Joe 18 units of satisfaction and 1 only gives him 10 units, the second colaadds 8 units of satisfaction.
• This additional satisfaction is the marginal satisfaction; that is, the extra satis-faction from consuming 1 more unit of some good or service.
• Note that the amount of satisfaction added by each additional cola or hot dogconsumed decreases. This decrease is based on a second common assumptionmade by economists about people’s preferences: diminishing returns. Diminish -ing returns (with respect to satisfaction) means each additional unit of a goodadds less satisfaction than the one before it.
• In this example, the first hot dog would make Joe the happiest because he ishungry. As he continues to eat more hot dogs, he would get fuller, so each addi-tional hotdog would be less satisfying.
• The satisfaction Joe gets from each hot dog (or cola) is not the same—the firstones would give him more satisfaction than the later ones.
• The last column on the table is the amount of satisfaction each good adds dividedby the price of that good—it tells how much satisfaction Joe gets per dollar spenton each unit.
• For example, for colas, the first cola would give him 10 units of satisfaction. At$2 per cola, the first cola would give him 5 units of satisfaction per dollar spent.
• For example, for hot dogs, the first hot dog would give him 12 units of satisfaction.Since it would cost him only $1, he would get 12 units of satisfaction per dollarspent. (Provide additional examples as necessary.)
• While Joe is buying colas and hot dogs with his money, he is really buying satis-faction. Thus, it is important to know how much satisfaction he gets from eachdollar he spends.
Unit 7: Spending Lesson 7A: The Spending Decision—Colas and Hot Dogs
Making Personal Finance Decisions©2019, Minnesota Council on Economic Education. Developed in partnership with the Federal Reserve Bank of St. Louis.
Permission is granted to reprint or photocopy this lesson in its entirety for educational purposes, 146 provided the user credits the Minnesota Council on Economic Education.
10. Tell the students you are going to use the table to determine what Joe should buyand in what order. Discuss the following:
• Suppose Joe has just sat down at the game and wants to get the most satisfactionfor his $8. Which should he buy first, a cola or a hot dog? (The first hot dog,because it would give him 12 units of satisfaction per dollar spent, while thefirst cola would only give him 5 units.)
• What should he buy next? (The second hot dog, because it would give him 9 unitsof satisfaction per dollar, while the first cola would still only gives him 5 units ofsatisfaction)
• What should he buy next? (The third hot dog.)
• What should he buy next? (The choice is now between the fourth hot dog orthe first cola. Since the first cola would give him 5 units of satisfaction per dollarand the fourth hot dog only 4 units, he should now buy the first cola.)
• How much has Joe spent so far? ($5: 3 hotdogs at $1 each and 1 cola at $2)
• Since he still has money left, what should Joe buy next? (Both the fourth hot dogand the second cola give him 4 units of satisfaction per dollar, so it doesn’t matterwhich he chooses.)
• Suppose he chose the second cola, what should he buy next? (The fourth hotdog—note that it is a better deal than the third cola, 4 units per dollar versus 3units per dollar, but also note that he doesn’t have enough money left to buythe third cola.)
11. Explain that all of Joe’s money has now been spent and that he ended up with thesame combination as before—2 colas and 4 hot dogs. Explain that this must be thecombination that gives him the most satisfaction because at each step he bought thegreatest amount of satisfaction he could with his dollars.
12. Note that the amount of satisfaction generated by colas and hot dogs were fairly similar(for example, 5 colas generated 31 units of satisfaction, while 5 hot dogs generated33 units). So, these numbers suggest that Joe likes colas and hot dogs roughly thesame. Discuss the following:
• Given that Joe likes colas and hot dogs roughly the same, why did Joe end upbuying twice as many hot dogs as colas? (The price of colas was twice as muchas hot dogs, so colas were not as good of a deal in terms of satisfaction perdollar spent.)
13. Explain that hot dogs were “a better deal” because Joe could buy the same amountof satisfaction for half the cost. This is a fundamental point of making a good spend-ing decision: You should consider the amount of satisfaction you get per dollar spentwhen making a choice.
Lesson 7A: The Spending Decision—Colas and Hot Dogs Unit 7: Spending
Making Personal Finance Decisions©2019, Minnesota Council on Economic Education. Developed in partnership with the Federal Reserve Bank of St. Louis. Permission is granted to reprint or photocopy this lesson in its entirety for educational purposes, provided the user credits the Minnesota Council on Economic Education. 147
14. Display Visual 7A.4: Joe’s Marginal Satisfaction. Instruct the students to determineJoe’s best spending choices if hot dogs were $2 and colas were $1. (In this case, Joewould buy the first and second colas, then a cola and a hot dog, then a hot dog, andfinally another cola. He would end up buying 4 colas and 2 hot dogs—just the oppo-site of the other scenario!)
15. Explain that Joe’s purc1hases now—4 colas and 2 hotdogs—seem to suggest he likescolas more than hot dogs. This change in behavior, however, is not because his pref-erences have changed—he still gets the same amount of happiness from each colaand each hot dog as he did before. Hot dogs have simply become a relatively worsedeal as their price rises and the price of colas falls.
Closure 16. Explain the following:
• When making spending decisions, consider the amount of satisfaction you getfrom each good per dollar spent if you want to maximize the satisfaction youget from your budget.
• In other words, instead of thinking about buying particular goods such as colasor hot dogs, you should instead think about buying units of satisfaction and buythose goods that would give you the most satisfaction per dollar.
• Clearly, as the price of a good goes down, it becomes a better buy because youget the same amount of satisfaction for fewer dollars spent.
Assessment17. Distribute a copy of Handout 7A.2: Assessment to each student and allow time for
students to work (or assign as homework). Review answers with Handout 7A.2:Assessment—Answer Key.
Unit 7: Spending Lesson 7A: The Spending Decision—Colas and Hot Dogs
Making Personal Finance Decisions©2019, Minnesota Council on Economic Education. Developed in partnership with the Federal Reserve Bank of St. Louis.
Permission is granted to reprint or photocopy this lesson in its entirety for educational purposes, 148 provided the user credits the Minnesota Council on Economic Education.
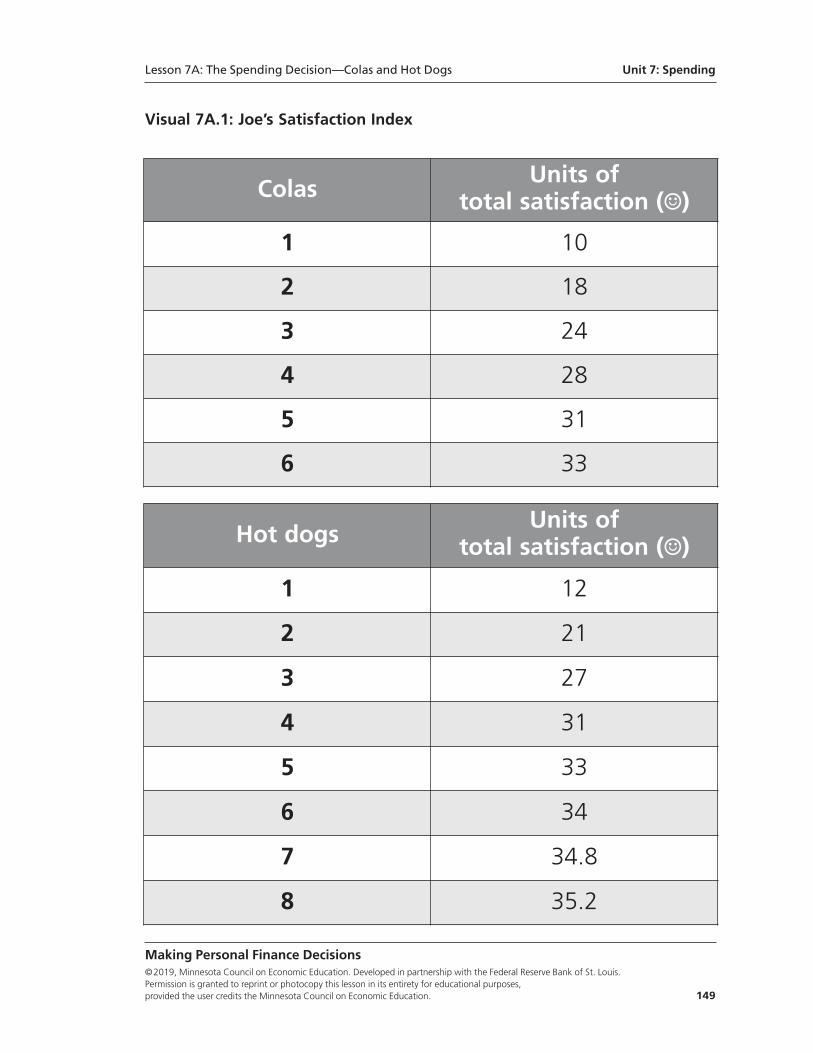
Visual 7A.1: Joe’s Satisfaction Index
Lesson 7A: The Spending Decision—Colas and Hot Dogs Unit 7: Spending
Making Personal Finance Decisions©2019, Minnesota Council on Economic Education. Developed in partnership with the Federal Reserve Bank of St. Louis. Permission is granted to reprint or photocopy this lesson in its entirety for educational purposes, provided the user credits the Minnesota Council on Economic Education. 149
ColasUnits of
total satisfaction (☺)1 10
2 18
3 24
4 28
5 31
6 33
Hot dogsUnits of
total satisfaction (☺)1 12
2 21
3 27
4 31
5 33
6 34
7 34.8
8 35.2
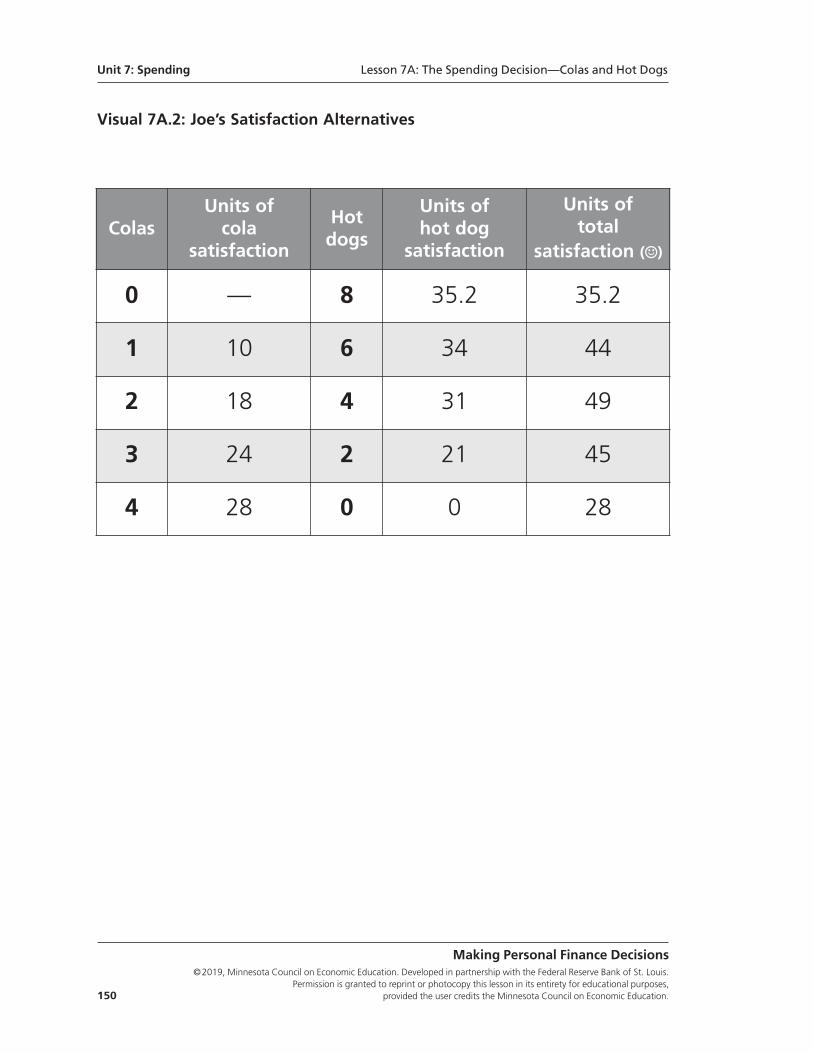
Unit 7: Spending Lesson 7A: The Spending Decision—Colas and Hot Dogs
Making Personal Finance Decisions©2019, Minnesota Council on Economic Education. Developed in partnership with the Federal Reserve Bank of St. Louis.
Permission is granted to reprint or photocopy this lesson in its entirety for educational purposes, 150 provided the user credits the Minnesota Council on Economic Education.
Visual 7A.2: Joe’s Satisfaction Alternatives
ColasUnits of cola
satisfaction
Hotdogs
Units of hot dog
satisfaction
Units of total
satisfaction (☺)
0 — 8 35.2 35.2
1 10 6 34 44
2 18 4 31 49
3 24 2 21 45
4 28 0 0 28
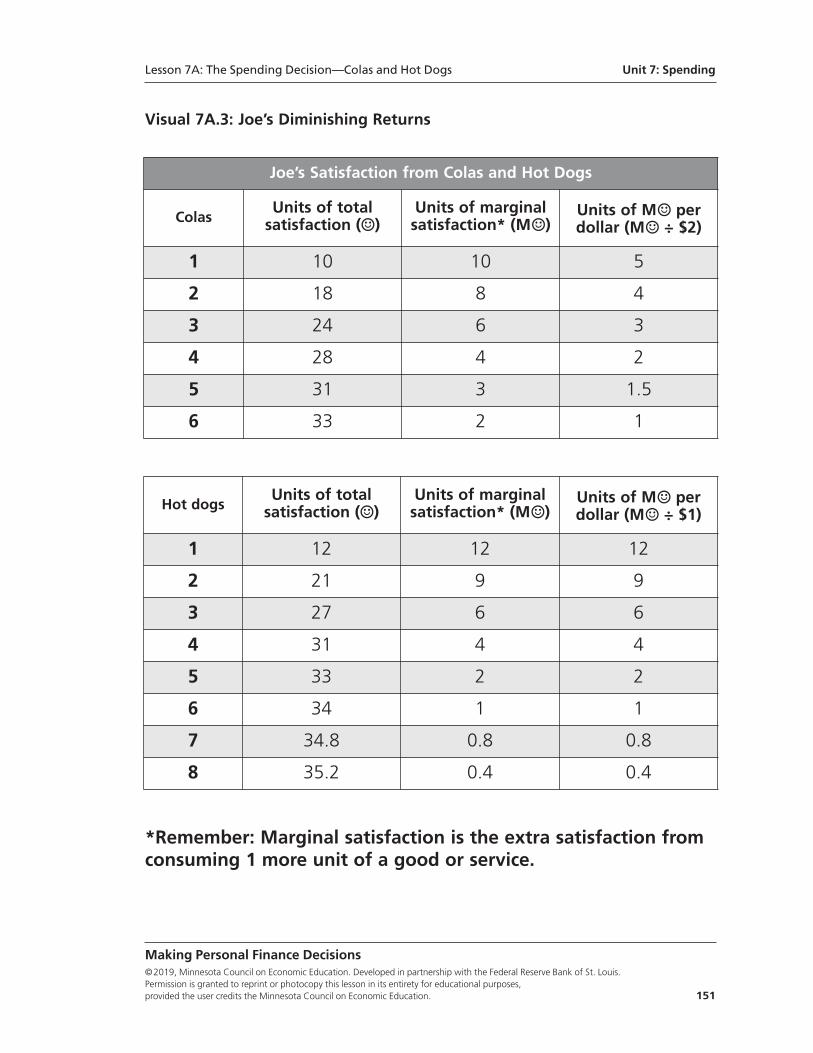
Visual 7A.3: Joe’s Diminishing Returns
Making Personal Finance Decisions©2019, Minnesota Council on Economic Education. Developed in partnership with the Federal Reserve Bank of St. Louis. Permission is granted to reprint or photocopy this lesson in its entirety for educational purposes, provided the user credits the Minnesota Council on Economic Education. 151
Joe’s Satisfaction from Colas and Hot Dogs
ColasUnits of total satisfaction (☺)
Units of marginal satisfaction* (M☺)
Units of M☺ per dollar (M☺ ÷ $2)
1 10 10 5
2 18 8 4
3 24 6 3
4 28 4 2
5 31 3 1.5
6 33 2 1
Hot dogsUnits of total satisfaction (☺)
Units of marginal satisfaction* (M☺)
Units of M☺ per dollar (M☺ ÷ $1)
1 12 12 12
2 21 9 9
3 27 6 6
4 31 4 4
5 33 2 2
6 34 1 1
7 34.8 0.8 0.8
8 35.2 0.4 0.4
*Remember: Marginal satisfaction is the extra satisfaction fromconsuming 1 more unit of a good or service.
Lesson 7A: The Spending Decision—Colas and Hot Dogs Unit 7: Spending
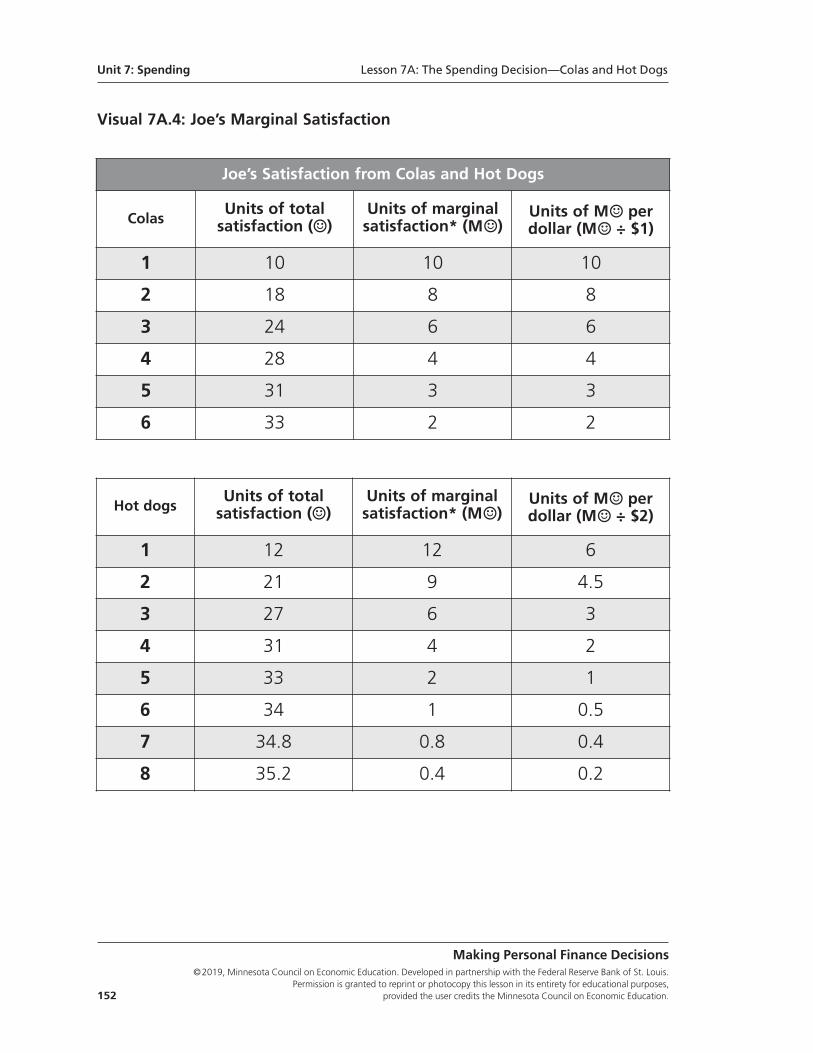
Visual 7A.4: Joe’s Marginal Satisfaction
Unit 7: Spending Lesson 7A: The Spending Decision—Colas and Hot Dogs
Making Personal Finance Decisions©2019, Minnesota Council on Economic Education. Developed in partnership with the Federal Reserve Bank of St. Louis.
Permission is granted to reprint or photocopy this lesson in its entirety for educational purposes, 152 provided the user credits the Minnesota Council on Economic Education.
Joe’s Satisfaction from Colas and Hot Dogs
ColasUnits of total satisfaction (☺)
Units of marginal satisfaction* (M☺)
Units of M☺ per dollar (M☺ ÷ $1)
1 10 10 10
2 18 8 8
3 24 6 6
4 28 4 4
5 31 3 3
6 33 2 2
Hot dogsUnits of total satisfaction (☺)
Units of marginal satisfaction* (M☺)
Units of M☺ per dollar (M☺ ÷ $2)
1 12 12 6
2 21 9 4.5
3 27 6 3
4 31 4 2
5 33 2 1
6 34 1 0.5
7 34.8 0.8 0.4
8 35.2 0.4 0.2
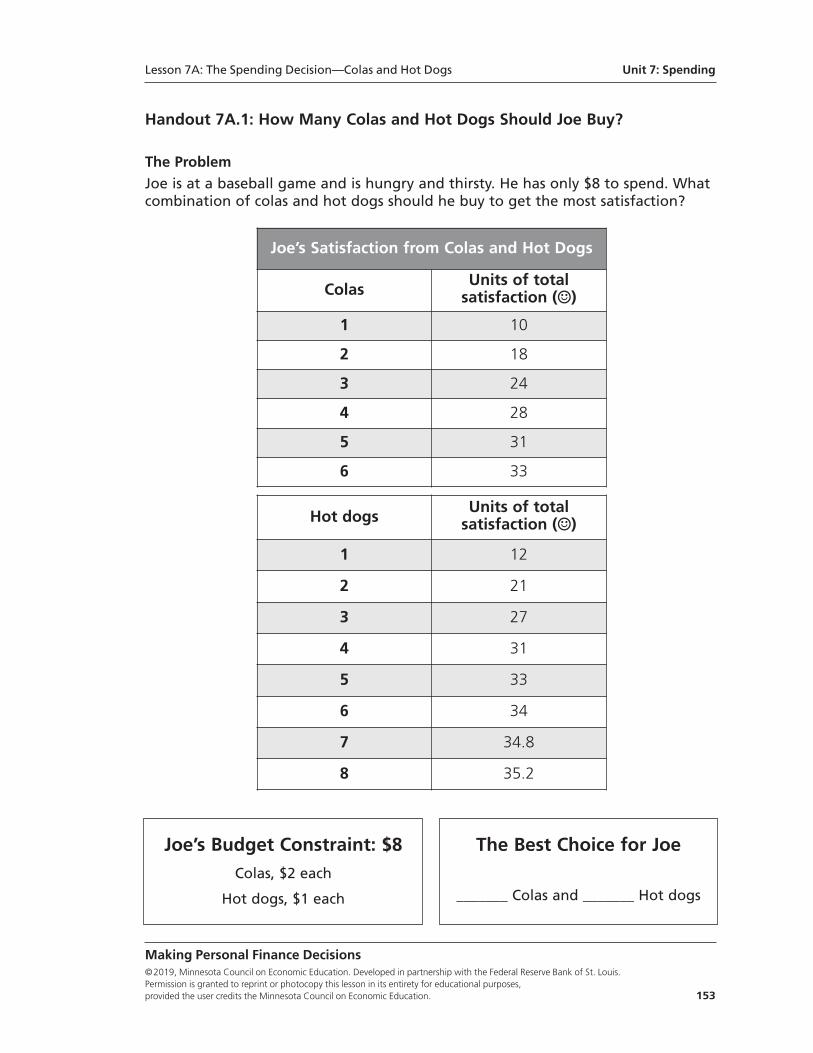
Handout 7A.1: How Many Colas and Hot Dogs Should Joe Buy?
The ProblemJoe is at a baseball game and is hungry and thirsty. He has only $8 to spend. Whatcombination of colas and hot dogs should he buy to get the most satisfaction?
Lesson 7A: The Spending Decision—Colas and Hot Dogs Unit 7: Spending
Making Personal Finance Decisions©2019, Minnesota Council on Economic Education. Developed in partnership with the Federal Reserve Bank of St. Louis. Permission is granted to reprint or photocopy this lesson in its entirety for educational purposes, provided the user credits the Minnesota Council on Economic Education. 153
Joe’s Satisfaction from Colas and Hot Dogs
ColasUnits of total satisfaction (☺)
1 10
2 18
3 24
4 28
5 31
6 33
Hot dogsUnits of total satisfaction (☺)
1 12
2 21
3 27
4 31
5 33
6 34
7 34.8
8 35.2
The Best Choice for Joe
_______ Colas and _______ Hot dogs
Joe’s Budget Constraint: $8Colas, $2 each
Hot dogs, $1 each
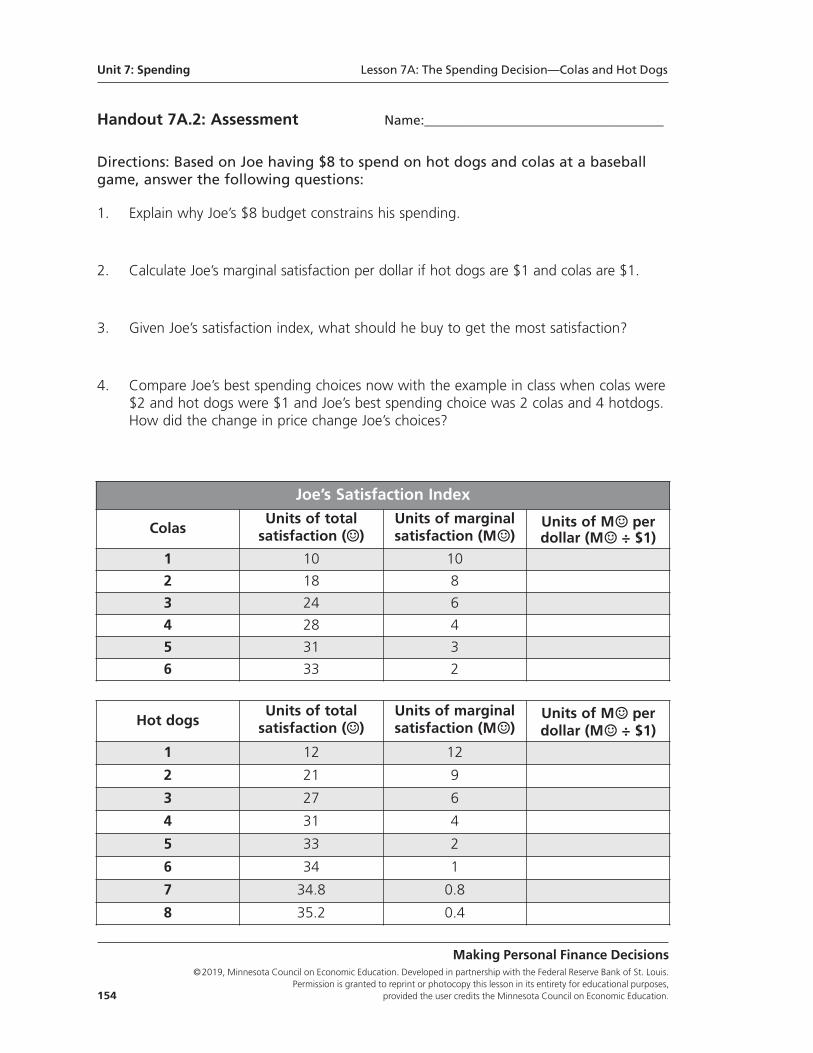
Handout 7A.2: Assessment Name:____________________________________
Directions: Based on Joe having $8 to spend on hot dogs and colas at a baseballgame, answer the following questions:
1. Explain why Joe’s $8 budget constrains his spending.
2. Calculate Joe’s marginal satisfaction per dollar if hot dogs are $1 and colas are $1.
3. Given Joe’s satisfaction index, what should he buy to get the most satisfaction?
4. Compare Joe’s best spending choices now with the example in class when colas were$2 and hot dogs were $1 and Joe’s best spending choice was 2 colas and 4 hotdogs. How did the change in price change Joe’s choices?
Unit 7: Spending Lesson 7A: The Spending Decision—Colas and Hot Dogs
Making Personal Finance Decisions©2019, Minnesota Council on Economic Education. Developed in partnership with the Federal Reserve Bank of St. Louis.
Permission is granted to reprint or photocopy this lesson in its entirety for educational purposes, 154 provided the user credits the Minnesota Council on Economic Education.
Joe’s Satisfaction Index
ColasUnits of total satisfaction (☺)
Units of marginalsatisfaction (M☺)
Units of M☺ perdollar (M☺ ÷ $1)
1 10 10
2 18 8
3 24 6
4 28 4
5 31 3
6 33 2
Hot dogsUnits of total satisfaction (☺)
Units of marginalsatisfaction (M☺)
Units of M☺ perdollar (M☺ ÷ $1)
1 12 12
2 21 9
3 27 6
4 31 4
5 33 2
6 34 1
7 34.8 0.8
8 35.2 0.4
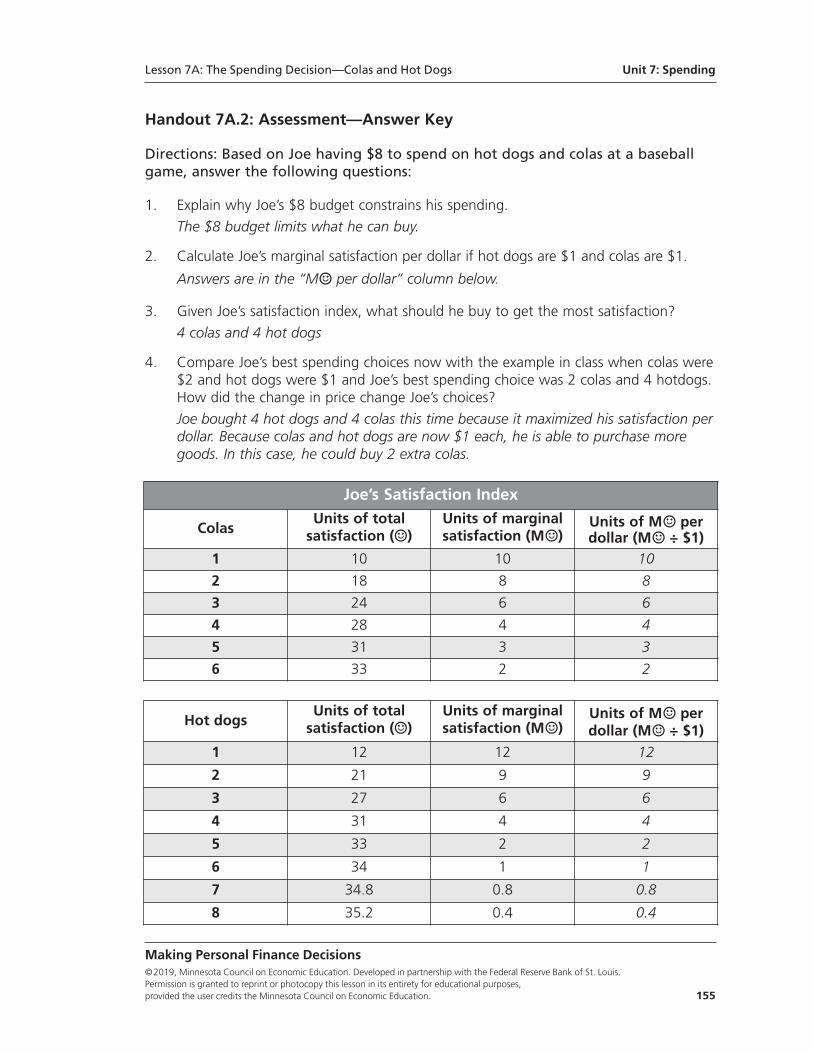
Handout 7A.2: Assessment—Answer Key
Directions: Based on Joe having $8 to spend on hot dogs and colas at a baseballgame, answer the following questions:
1. Explain why Joe’s $8 budget constrains his spending.
The $8 budget limits what he can buy.
2. Calculate Joe’s marginal satisfaction per dollar if hot dogs are $1 and colas are $1.
Answers are in the “M☺ per dollar” column below.
3. Given Joe’s satisfaction index, what should he buy to get the most satisfaction?
4 colas and 4 hot dogs
4. Compare Joe’s best spending choices now with the example in class when colas were$2 and hot dogs were $1 and Joe’s best spending choice was 2 colas and 4 hotdogs. How did the change in price change Joe’s choices?
Joe bought 4 hot dogs and 4 colas this time because it maximized his satisfaction perdollar. Because colas and hot dogs are now $1 each, he is able to purchase more goods. In this case, he could buy 2 extra colas.
Lesson 7A: The Spending Decision—Colas and Hot Dogs Unit 7: Spending
Making Personal Finance Decisions©2019, Minnesota Council on Economic Education. Developed in partnership with the Federal Reserve Bank of St. Louis. Permission is granted to reprint or photocopy this lesson in its entirety for educational purposes, provided the user credits the Minnesota Council on Economic Education. 155
Joe’s Satisfaction Index
ColasUnits of total satisfaction (☺)
Units of marginalsatisfaction (M☺)
Units of M☺ perdollar (M☺ ÷ $1)
1 10 10 10
2 18 8 8
3 24 6 6
4 28 4 4
5 31 3 3
6 33 2 2
Hot dogsUnits of total satisfaction (☺)
Units of marginalsatisfaction (M☺)
Units of M☺ perdollar (M☺ ÷ $1)
1 12 12 12
2 21 9 9
3 27 6 6
4 31 4 4
5 33 2 2
6 34 1 1
7 34.8 0.8 0.8
8 35.2 0.4 0.4
Unit 7: Spending Lesson 7A: The Spending Decision—Colas and Hot Dogs
Making Personal Finance Decisions©2019, Minnesota Council on Economic Education. Developed in partnership with the Federal Reserve Bank of St. Louis.
Permission is granted to reprint or photocopy this lesson in its entirety for educational purposes, 156 provided the user credits the Minnesota Council on Economic Education.
Standards and Benchmarks
National Standards for Financial Literacy
Standard 2: Buying Goods and Services. People cannot buy or make all the goods andservices they want; as a result, people choose to buy some goods and services and not buyothers. People can improve their economic well-being by making informed spending deci-sions, which entails collecting information, planning, and budgeting.
• Benchmark: Grade 4
1. Economic wants are desires that can be satisfied by consuming a good, a service, or a leisure activity.
3. People spend a portion of their income on goods and services in order to increase their personal satisfaction or happiness.
• Benchmark: Grade 12
1. Consumer decisions are influenced by the price of a good or service, the price of alternatives, and the consumer’s income as well as his or her preferences.
Making Personal Finance Decisions©2019, Minnesota Council on Economic Education. Developed in partnership with the Federal Reserve Bank of St. Louis. Permission is granted to reprint or photocopy this lesson in its entirety for educational purposes, provided the user credits the Minnesota Council on Economic Education. 157
Lesson 7B:
Big Spenders
Lesson DescriptionStudents compare the spending behavior of two families to see how a higher savingrate can lead to not only greater savings but greater spending.
Standards and Benchmarks (see page 163)
Grade Level9-12
ConceptSaving rate
Compelling QuestionHow does saving now affect future spending?
ObjectivesStudents will be able to calculate how different saving rates affect a savings balanceand the ability to spend in the future.
Rule 7: Spend wisely.Because income is limited, people must make decisions about which goods and servicesto buy to maximize the satisfaction (happiness) they get from their income. These lessonslook at things to consider when making choices about spending (What does it mean toget a “good deal”?) and show that “spending on saving” may be one of the best waysto spend more than may seem possible with a given income.
Unit 7
Spending
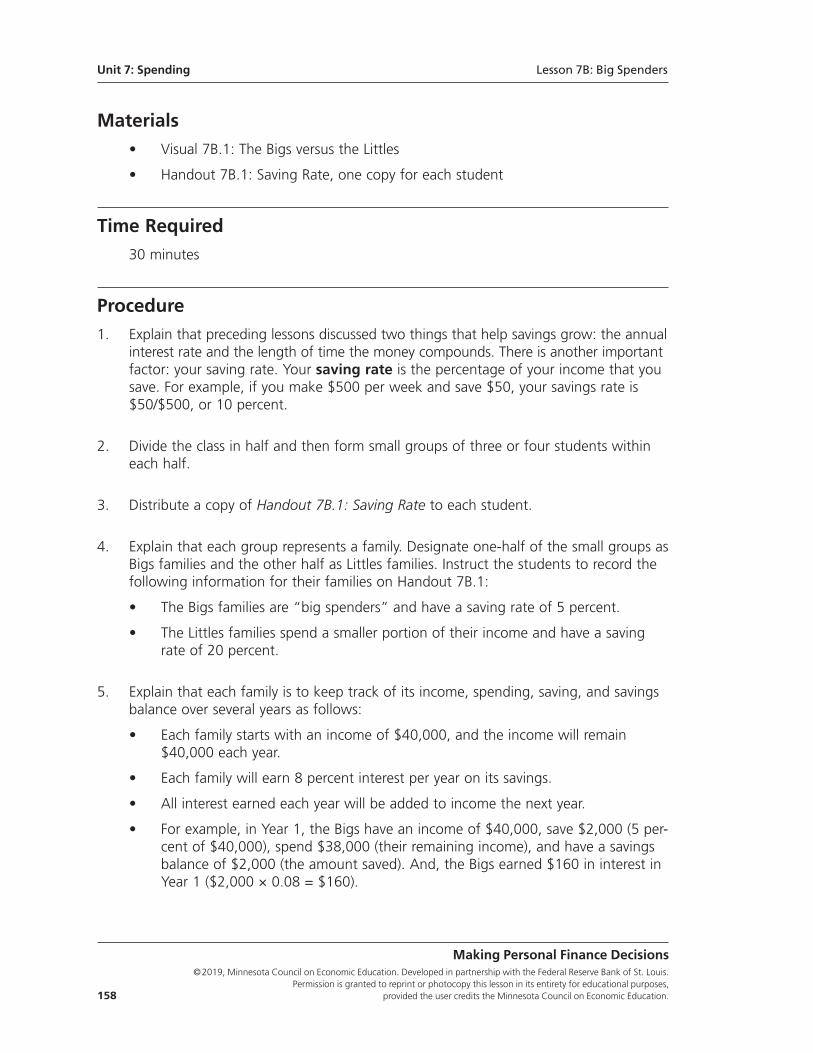
Making Personal Finance Decisions©2019, Minnesota Council on Economic Education. Developed in partnership with the Federal Reserve Bank of St. Louis.
Permission is granted to reprint or photocopy this lesson in its entirety for educational purposes, 158 provided the user credits the Minnesota Council on Economic Education.
Materials• Visual 7B.1: The Bigs versus the Littles
• Handout 7B.1: Saving Rate, one copy for each student
Time Required30 minutes
Procedure1. Explain that preceding lessons discussed two things that help savings grow: the annual
interest rate and the length of time the money compounds. There is another importantfactor: your saving rate. Your saving rate is the percentage of your income that yousave. For example, if you make $500 per week and save $50, your savings rate is$50/$500, or 10 percent.
2. Divide the class in half and then form small groups of three or four students withineach half.
3. Distribute a copy of Handout 7B.1: Saving Rate to each student.
4. Explain that each group represents a family. Designate one-half of the small groups asBigs families and the other half as Littles families. Instruct the students to record thefollowing information for their families on Handout 7B.1:
• The Bigs families are “big spenders” and have a saving rate of 5 percent.
• The Littles families spend a smaller portion of their income and have a savingrate of 20 percent.
5. Explain that each family is to keep track of its income, spending, saving, and savingsbalance over several years as follows:
• Each family starts with an income of $40,000, and the income will remain$40,000 each year.
• Each family will earn 8 percent interest per year on its savings.
• All interest earned each year will be added to income the next year.
• For example, in Year 1, the Bigs have an income of $40,000, save $2,000 (5 per-cent of $40,000), spend $38,000 (their remaining income), and have a savingsbalance of $2,000 (the amount saved). And, the Bigs earned $160 in interest inYear 1 ($2,000 × 0.08 = $160).
Unit 7: Spending Lesson 7B: Big Spenders
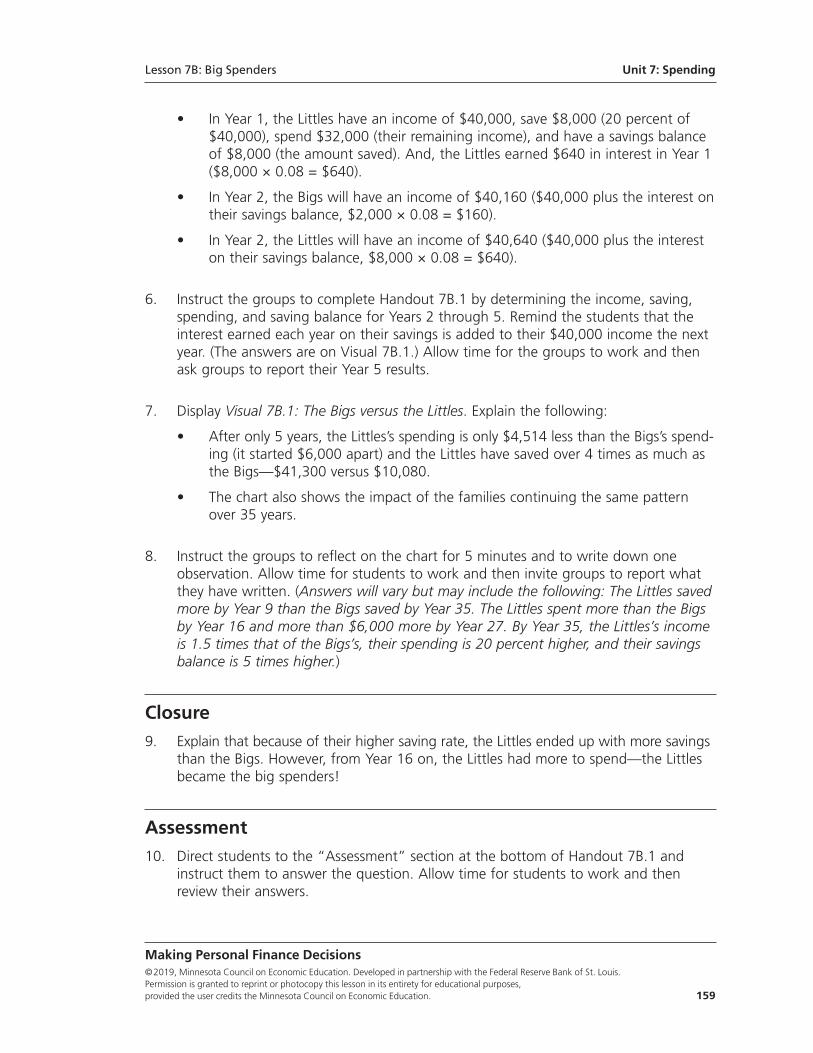
Making Personal Finance Decisions©2019, Minnesota Council on Economic Education. Developed in partnership with the Federal Reserve Bank of St. Louis. Permission is granted to reprint or photocopy this lesson in its entirety for educational purposes, provided the user credits the Minnesota Council on Economic Education. 159
• In Year 1, the Littles have an income of $40,000, save $8,000 (20 percent of$40,000), spend $32,000 (their remaining income), and have a savings balanceof $8,000 (the amount saved). And, the Littles earned $640 in interest in Year 1($8,000 × 0.08 = $640).
• In Year 2, the Bigs will have an income of $40,160 ($40,000 plus the interest ontheir savings balance, $2,000 × 0.08 = $160).
• In Year 2, the Littles will have an income of $40,640 ($40,000 plus the intereston their savings balance, $8,000 × 0.08 = $640).
6. Instruct the groups to complete Handout 7B.1 by determining the income, saving,spending, and saving balance for Years 2 through 5. Remind the students that theinterest earned each year on their savings is added to their $40,000 income the nextyear. (The answers are on Visual 7B.1.) Allow time for the groups to work and thenask groups to report their Year 5 results.
7. Display Visual 7B.1: The Bigs versus the Littles. Explain the following:
• After only 5 years, the Littles’s spending is only $4,514 less than the Bigs’s spend-ing (it started $6,000 apart) and the Littles have saved over 4 times as much asthe Bigs—$41,300 versus $10,080.
• The chart also shows the impact of the families continuing the same patternover 35 years.
8. Instruct the groups to reflect on the chart for 5 minutes and to write down oneobservation. Allow time for students to work and then invite groups to report whatthey have written. (Answers will vary but may include the following: The Littles savedmore by Year 9 than the Bigs saved by Year 35. The Littles spent more than the Bigsby Year 16 and more than $6,000 more by Year 27. By Year 35, the Littles’s incomeis 1.5 times that of the Bigs’s, their spending is 20 percent higher, and their savingsbalance is 5 times higher.)
Closure9. Explain that because of their higher saving rate, the Littles ended up with more savings
than the Bigs. However, from Year 16 on, the Littles had more to spend—the Littlesbecame the big spenders!
Assessment 10. Direct students to the “Assessment” section at the bottom of Handout 7B.1 and
instruct them to answer the question. Allow time for students to work and thenreview their answers.
Lesson 7B: Big Spenders Unit 7: Spending
Making Personal Finance Decisions©2019, Minnesota Council on Economic Education. Developed in partnership with the Federal Reserve Bank of St. Louis.
Permission is granted to reprint or photocopy this lesson in its entirety for educational purposes, 160 provided the user credits the Minnesota Council on Economic Education.
Handout 7B.1: Assessment—Answer Key
Based on the information in the chart, how does a high saving rate increase bothyour savings and spending over time? (Those with a higher rate of saving will earnmore interest. Because interest earned is income, interest contributes to both moremoney saved and more money available for spending over time.)
Unit 7: Spending Lesson 7B: Big Spenders
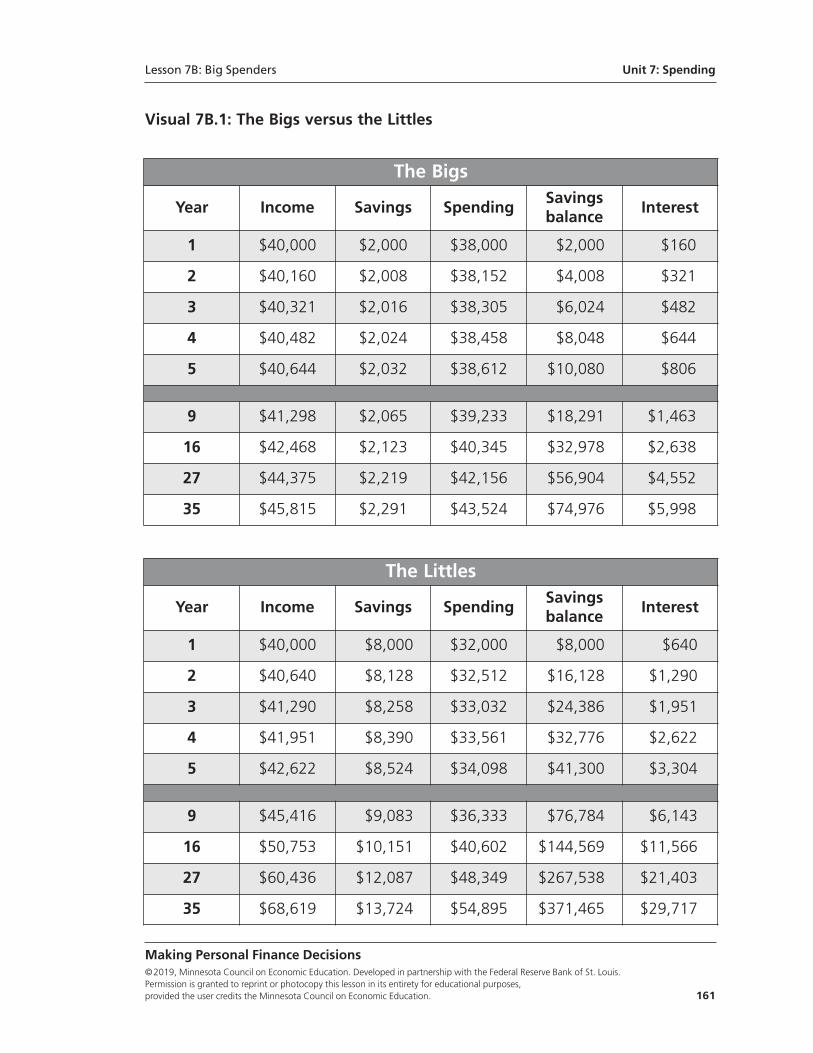
Making Personal Finance Decisions©2019, Minnesota Council on Economic Education. Developed in partnership with the Federal Reserve Bank of St. Louis. Permission is granted to reprint or photocopy this lesson in its entirety for educational purposes, provided the user credits the Minnesota Council on Economic Education. 161
Visual 7B.1: The Bigs versus the Littles
The Bigs
Year Income Savings SpendingSavingsbalance
Interest
1 $40,000 $2,000 $38,000 $2,000 $160
2 $40,160 $2,008 $38,152 $4,008 $321
3 $40,321 $2,016 $38,305 $6,024 $482
4 $40,482 $2,024 $38,458 $8,048 $644
5 $40,644 $2,032 $38,612 $10,080 $806
9 $41,298 $2,065 $39,233 $18,291 $1,463
16 $42,468 $2,123 $40,345 $32,978 $2,638
27 $44,375 $2,219 $42,156 $56,904 $4,552
35 $45,815 $2,291 $43,524 $74,976 $5,998
The Littles
Year Income Savings SpendingSavingsbalance
Interest
1 $40,000 $8,000 $32,000 $8,000 $640
2 $40,640 $8,128 $32,512 $16,128 $1,290
3 $41,290 $8,258 $33,032 $24,386 $1,951
4 $41,951 $8,390 $33,561 $32,776 $2,622
5 $42,622 $8,524 $34,098 $41,300 $3,304
9 $45,416 $9,083 $36,333 $76,784 $6,143
16 $50,753 $10,151 $40,602 $144,569 $11,566
27 $60,436 $12,087 $48,349 $267,538 $21,403
35 $68,619 $13,724 $54,895 $371,465 $29,717
Lesson 7B: Big Spenders Unit 7: Spending
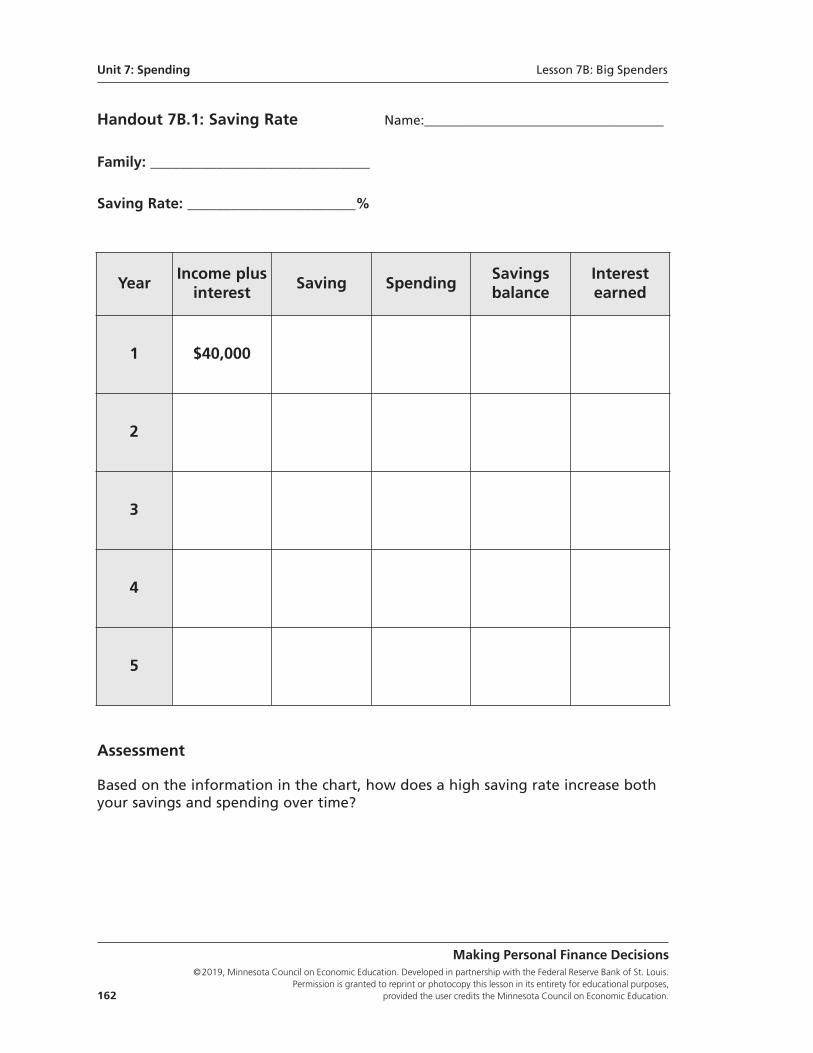
Making Personal Finance Decisions©2019, Minnesota Council on Economic Education. Developed in partnership with the Federal Reserve Bank of St. Louis.
Permission is granted to reprint or photocopy this lesson in its entirety for educational purposes, 162 provided the user credits the Minnesota Council on Economic Education.
Handout 7B.1: Saving Rate Name:____________________________________
Family: ______________________________
Saving Rate: _______________________%
YearIncome plusinterest
Saving SpendingSavings balance
Interest earned
1 $40,000
2
3
4
5
Assessment
Based on the information in the chart, how does a high saving rate increase bothyour savings and spending over time?
Unit 7: Spending Lesson 7B: Big Spenders
Standards and Benchmarks
National Standards for Financial Literacy
Standard 3: Saving. Saving is part of income that people choose to set aside for futureuses. People save for different reasons during the course of their lives. People make differentchoices about how they save and how much they save. Time, interest rates, and inflationaffect the value of saving.
• Benchmarks: Grade 8
2. For the saver, an interest rate is the price a financial institution pays for using a saver’s money and is normally expressed as an annual percentage of the amount saved.
• Benchmarks: Grade 12
1. People choose between immediate spending and saving for future consump-tion. Some people have a tendency to be impatient, choosing immediate spending over saving for the future.
Making Personal Finance Decisions©2019, Minnesota Council on Economic Education. Developed in partnership with the Federal Reserve Bank of St. Louis. Permission is granted to reprint or photocopy this lesson in its entirety for educational purposes, provided the user credits the Minnesota Council on Economic Education. 163
Lesson 7B: Big Spenders Unit 7: Spending

Making Personal Finance Decisions©2019, Minnesota Council on Economic Education. Developed in partnership with the Federal Reserve Bank of St. Louis.
Permission is granted to reprint or photocopy this lesson in its entirety for educational purposes, 164 provided the user credits the Minnesota Council on Economic Education.
Lesson 8A:
Managing Risk—Time and Diversification
Lesson DescriptionStudents are introduced to investment risk—the chance of losing some or all moneyinvested. That is, the actual rate of return on an investment may vary from the projectedrate of return and may even be negative. Students investigate the trade-off betweenthe expected rate of return on an investment and the risk. Finally, they play the role ofinvestors in a simulation that shows how time and diversification may lower risk.
Standards and Benchmarks (see page 178)
Grade Level9-12
ConceptsDiversification
Expected rate of return
Range
Risk
Risk averse
Unit 8
Investing
Making Personal Finance Decisions©2019, Minnesota Council on Economic Education. Developed in partnership with the Federal Reserve Bank of St. Louis. Permission is granted to reprint or photocopy this lesson in its entirety for educational purposes, provided the user credits the Minnesota Council on Economic Education. 165
Rule 8: Grow your wealth safely.Investing requires three simple steps: (i) saving a portion of your income each year toinvest, (ii) letting your investments grow (avoiding withdrawals), and (iii) managing yourinvestment risk. These lessons look at investment options, criteria for evaluating invest-ments (using the PACED decisionmaking model), and strategies for managing investmentrisk.
Compelling QuestionHow can investors reduce risk?
ObjectivesStudents will be able to
• define risk,
• evaluate risk as it applies to investment options, and
• describe ways of reducing investment risk.
Materials• Visual 8A.1: Risk and Return
• Visual 8A.2: The Impact of Time on Risk
• Handout 8A.1: Option 1 Cards, four copies cut apart and stacked into four separate sets
• Handout 8A.2: Option 2 Cards, four copies on colored paper, cut apart, andstacked into four separate sets
• Handout 8A.3: Assessment, one copy for each student
• Handout 8A.3: Assessment—Answer Key
Time required45 minutes
Procedure1. Review as necessary the definition and determination of an investment’s rate of return.
Explain that the rate of return on an investment can vary from year to year. For exam-ple, house and commodity prices can vary, interest rates on savings accounts can vary,stock dividends can vary, and so on.
2. Define the expected rate of return on an investment as the weighted average of allpossible rates of return, where each possibility is weighted by its chance, or probability,of occurring. Explain that if all possible rates of return the investment can earn areequally likely, then the expected rate of return is just the average of all the possiblerates of return.
Unit 8: Investing Lesson 8A: Managing Risk—Time and Diversification
Making Personal Finance Decisions©2019, Minnesota Council on Economic Education. Developed in partnership with the Federal Reserve Bank of St. Louis.
Permission is granted to reprint or photocopy this lesson in its entirety for educational purposes, 166 provided the user credits the Minnesota Council on Economic Education.
3. Display Visual 8A.1: Risk and Return. Explain each of the investment options as follows:
• Investment Option A has only one possible rate of return: 6%.
• Investment Option B has three possible rates of return that are each equally likely:5%, 6%, and 7%.
• Option C has five possible rates of return that again are equally likely: –4% (a neg-ative rate of return), 1%, 6%, 11%, and 16%.
• The expected rate of return on each of these options is the same: 6%. For exam-ple, for Investment Option B, the average of the three possibilities is 6%: (5% +6% + 7%)/3 = 18%/3 = 6%.
4. Discuss the following:
• Since each of these options has the same expected rate of return, would aninvestor be just as satisfied with any of them? (If an investor wants a 6 percentrate of return, it is possible that Options B and C could end up with less than that.In fact, Option C could lose money. Lead students toward the understanding thatOptions B and C are riskier than Option A because their rates of return could beless than 6 percent.)
5. Define risk as the chance of loss. Explain the following:
• Investments come with risk because the rate of return is not guaranteed.
• The risk of investing is that the actual rate of return can vary from its expectedrate of return and even be negative—you could lose money.
• One simple measure of variation in risk is the range (or spread) of the possibleoutcomes. The range is the difference between the largest possible return and thesmallest possible return. For example, for Option B, the range is 2% (7% – 5%).
6. Discuss the following:
• What is the range for Options A and C? (For Option A it is zero; for Option C itis 20%.)
7. Explain that Option A has no risk because there is only one possible outcome—there-fore the range is zero. The investor is certain to earn a 6% rate of return. However,with Option C the investor could earn as much as 16% but could also lose as muchas 4%. Thus, Option C is riskier—it has a larger range than Options A or B.
8. Ask students to choose their preferred investment option on Visual 8A.1 by raisingtheir hands. Call out each option and tally the results. (Answers will vary. Studentsoften select the riskier options because they tend to be greater risk-takers than thegeneral population and because they realize it is a hypothetical situation with no reallosses.)
Lesson 8A: Managing Risk—Time and Diversification Unit 8: Investing
Making Personal Finance Decisions©2019, Minnesota Council on Economic Education. Developed in partnership with the Federal Reserve Bank of St. Louis. Permission is granted to reprint or photocopy this lesson in its entirety for educational purposes, provided the user credits the Minnesota Council on Economic Education. 167
9. Explain that since these options all have the same expected return, but differentamounts of risk, the option an investor chooses will depend on how the investor feelsabout risk. Generally, investors tend to be risk averse, which means they would ratheravoid or lower the risk of loss. Thus, most investors would choose Option A or Option B.Discuss the following:
• Since risk-averse investors would view risk as a negative aspect of an investment,what positive aspect of an investment might offset this cost and make a riskyinvestment more attractive? (A higher expected rate of return)
10. Explain the following:
• There is often a trade-off between investment risk and the rate of return.
• Investments with greater risk usually have higher expected rates of return. Forexample, as the risk a company will default on its bonds rises, it must pay higherinterest rates on its bonds to induce investors to buy them.
• Conversely, U.S. Treasury and savings bonds tend to have lower interest ratesbecause the federal government has never defaulted on any of its obligations.
• One way to reduce risk is to choose investments with smaller ranges, but it isimportant to realize that the trade-off for less risk is a lower expected rate ofreturn.
11. Display Visual 8A.2: The Impact of Time on Risk. Explain that Investment Option 1 hasfive possible rates of return: 4%, 5%, 6%, 7%, or 8%. Investment Option 2 also hasfive possible rates of return: –4%, 2%, 8%, 14%, or 20%. There are several ways toreduce risk, and the next activity will explain two of them. Discuss the following:
• Which option has the higher expected rate of return? (Since each rate of returnis equally likely, the expected rate of return for both options is determined byaveraging the five rates.
◦ Option 1: [4% + 5% + 6% + 7% + 8%]/5 = 30%/5 = 6%.
◦ Option 2: [–4% + 2% + 8% + 14% + 20%]/5 = 40%/5 = 8%. So, the expected rate of return for Option 2 is higher.)
• Which option is riskier? (The range for Option A is 4%, a low of 4% to a high of8%, while the range for Option 2 is 24%, a low of –4% to a high of 20%. Usingrange as a measure of risk, Option B is riskier because it has the greater range.)
12. Divide the class in half and designate one half as Group 1 and the other as Group 2.Divide the groups in half again (or more groups if you wish) to create Groups 1A and 1Band Groups 2A and 2B. Give Groups 1A and 1B one set of cards from Handout 8A.1:Option 1 Cards. Give Groups 2A and 2B one set of cards from Handout 8A.2: Option 2Cards. Explain the following:
• Groups 1A and 1B will invest in Option 1. Groups 2A and 2B will invest inOption 2.
Unit 8: Investing Lesson 8A: Managing Risk—Time and Diversification
Making Personal Finance Decisions©2019, Minnesota Council on Economic Education. Developed in partnership with the Federal Reserve Bank of St. Louis.
Permission is granted to reprint or photocopy this lesson in its entirety for educational purposes, 168 provided the user credits the Minnesota Council on Economic Education.
• There will be several rounds of investing, with each round representing 1 year.
• During each round, each group will randomly draw one card from its own setof cards, which includes one card for each of the possible rates (outcomes). Thechosen rate will be the rate of return the group earns for that year. After record-ing the result, return the card to the deck.
• Each group’s rate of return will be recorded on the board as well as a runningaverage of the rates of return over the rounds (years).
13. Begin Round 1 by having the groups each draw a card from their given set. Recordthe results on the board.
14. Begin Round 2—have the groups each draw another card. Record the results on theboard and also record the average for each group after the two rounds. (For example,if a group from Option 1 drew 5% in Round 1 and 8% in Round 2, their averageafter two rounds would be (5% + 8%)/2 = 6.5%.)
15. Continue for three to six more rounds as time permits—the more rounds, the betterthe results of the simulation.
16. After the final round, review the average rates of return recorded on the board andask the students to draw some conclusions. (Two results should be evident: (i) For bothoptions, the average rate of return for all groups should be approaching or gettingcloser to the expected rate of return for that option and (ii) while the average rate ofreturn for Option 2 groups likely varied widely in the early rounds, they varied muchless toward the end of the rounds as they all approached 8%.)
17. Explain the following:
• The point of the demonstration was to show how time reduces the variability ofthe actual rate of return from the expected rate of return.
• The reduction in variability is also reduced risk.
• While the variability—or risk—may be great in any given year, the longer aninvestment is held, the lower the risk will likely be.
• Financial planners often advise young investors to invest in riskier investmentswith potentially higher rates of return because over time the rates of return aremore likely to approach the expected rates of return.
• Conversely, over a short investment horizon (i.e., you need the money soonerrather than later), less-risky investments are a better choice.
(Teacher note: Step 18 is optional.)
Lesson 8A: Managing Risk—Time and Diversification Unit 8: Investing
Making Personal Finance Decisions©2019, Minnesota Council on Economic Education. Developed in partnership with the Federal Reserve Bank of St. Louis. Permission is granted to reprint or photocopy this lesson in its entirety for educational purposes, provided the user credits the Minnesota Council on Economic Education. 169
18. Explain that as the demonstration showed, time tends to lower the difference betweenthe actual rate of return and the expected rate of return. Technically, it lowers thespread by a factor of 1/√n, where n is the number of years. Thus, for Option 2, after4 years (or rounds) the spread would only be 1/√4 = 1/2, or one-half of what it wasafter 1 year, so only 12% (24% × 1/2). Discuss the following:
• What would the spread be for Option 2 after 9 years? (8%; since 1/√9 = 1/3,the spread would be 24% × 1/3 = 8%.)
• What would the spread be for Option 2 after 36 years? (4%; since 1/√36 = 1/6,the spread would be 24% × 1/6 = 4%.) Note that this is exactly the same spreadOption 1 has after 1 year. Thus, holding on to investment Option 2 for 36 yearshas the same risk as holding investment Option 1 for 1 year, but it will haveearned a higher rate of return for those 36 years! (Remember that the expectedrate of return is 6 percent for Option A and 8 percent for Option B, as explainedin Step 11.)
19. Ask the class to suppose an investor has 1 year to invest and wants higher rates ofreturn than possible from Option B but not all the risk. Another way this investor couldreduce risk and still take advantage of investment options with higher rates of returnis to diversify. Define diversification as investing in various financial instruments toreduce risk. In other words, instead of investing totally in one asset, an investor investsin several assets, for example, both Option 1 and Option 2.
20. Refer students to Visual 8A.2. Discuss the following:
• If an investor invested half of his or her funds in Option 1 and half in Option 2,what would be the worst and best possible rates of return over 1 year? (Worstcase: 4% for Option 1 and –4% for Option 2. Best case: 8% for Option 1 and20% for Option 2.)
• What is the worst case and best case for an investor who invested $50 in eachoption?
◦� (Worst case: The return would be [$50 × 4%] + [$50 × –4%] = $2 – $2 = $0, so the rate of return would be $0/100, or 0%.
◦� Best case: The return would be [$50 × 8%] + [$50 × 20%] = $4 + $10 = $14,so the rate of return would be $14/$100, or 14%.
◦� Thus, the range would be 14% [14% – 0%].)
21. Explain that the range when diversifying and investing in each option is less thanthe range of investing in Option 2 alone, which was 20%. Thus, by diversifying, theinvestor is able to lower the risk. Risk could be lowered further by putting more thanhalf of the funds in Option 1. So, an investor can control his or her risk by diversifying.However, note that by diversifying, it is not possible to get a rate of return higher than14% (which was potentially possible with Option 2).
Unit 8: Investing Lesson 8A: Managing Risk—Time and Diversification
Making Personal Finance Decisions©2019, Minnesota Council on Economic Education. Developed in partnership with the Federal Reserve Bank of St. Louis.
Permission is granted to reprint or photocopy this lesson in its entirety for educational purposes, 170 provided the user credits the Minnesota Council on Economic Education.
Closure 22. Explain the following:
• Risk refers to the chance of loss. For financial investments, risk is the degree towhich the actual rate of return on an investment can vary from the expectedrate of return on the investment.
• There are three ways investors can lower the amount of risk on their investments:(i) choose investments with small expected rates of return ranges, (ii) hold invest-ments for longer periods of time, or (iii) diversify by holding several differentinvestments.
• Each of these options comes with a cost. Choosing investments with small rangesand diversification are likely to result in lower rates of return. By holding invest-ments for long periods, you will not be able to access your investment funds inthe short run. Investors must weigh the benefits of less risk against these costs.
Assessment23. Distribute a copy of Handout 8A.3: Assessment to each student and allow time for
students to work (or assign as homework). Review the answers with Handout 8A.3:Assessment—Answer Key.
Lesson 8A: Managing Risk—Time and Diversification Unit 8: Investing
Making Personal Finance Decisions©2019, Minnesota Council on Economic Education. Developed in partnership with the Federal Reserve Bank of St. Louis. Permission is granted to reprint or photocopy this lesson in its entirety for educational purposes, provided the user credits the Minnesota Council on Economic Education. 171
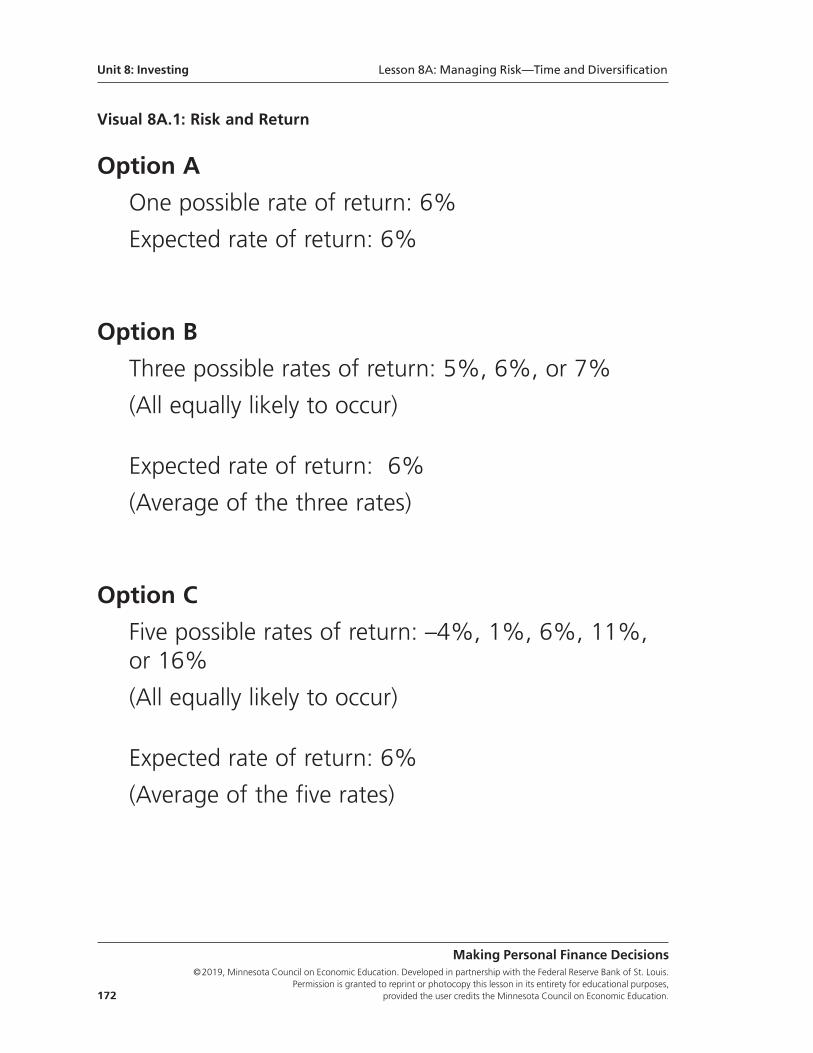
Unit 8: Investing Lesson 8A: Managing Risk—Time and Diversification
Making Personal Finance Decisions©2019, Minnesota Council on Economic Education. Developed in partnership with the Federal Reserve Bank of St. Louis.
Permission is granted to reprint or photocopy this lesson in its entirety for educational purposes, 172 provided the user credits the Minnesota Council on Economic Education.
Visual 8A.1: Risk and Return
Option A
One possible rate of return: 6%
Expected rate of return: 6%
Option B
Three possible rates of return: 5%, 6%, or 7%
(All equally likely to occur)
Expected rate of return: 6%
(Average of the three rates)
Option C
Five possible rates of return: –4%, 1%, 6%, 11%,or 16%
(All equally likely to occur)
Expected rate of return: 6%
(Average of the five rates)
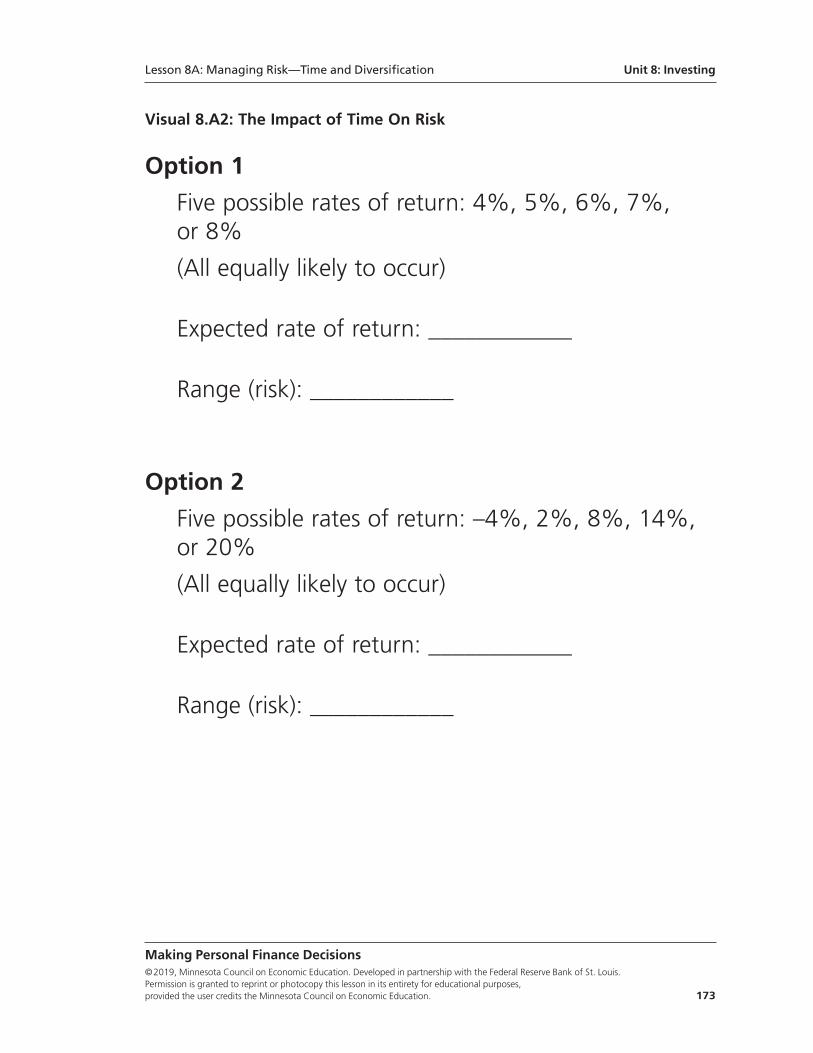
Visual 8.A2: The Impact of Time On Risk
Option 1
Five possible rates of return: 4%, 5%, 6%, 7%, or 8%
(All equally likely to occur)
Expected rate of return: ____________
Range (risk): ____________
Option 2
Five possible rates of return: –4%, 2%, 8%, 14%,or 20%
(All equally likely to occur)
Expected rate of return: ____________
Range (risk): ____________
Making Personal Finance Decisions©2019, Minnesota Council on Economic Education. Developed in partnership with the Federal Reserve Bank of St. Louis. Permission is granted to reprint or photocopy this lesson in its entirety for educational purposes, provided the user credits the Minnesota Council on Economic Education. 173
Lesson 8A: Managing Risk—Time and Diversification Unit 8: Investing
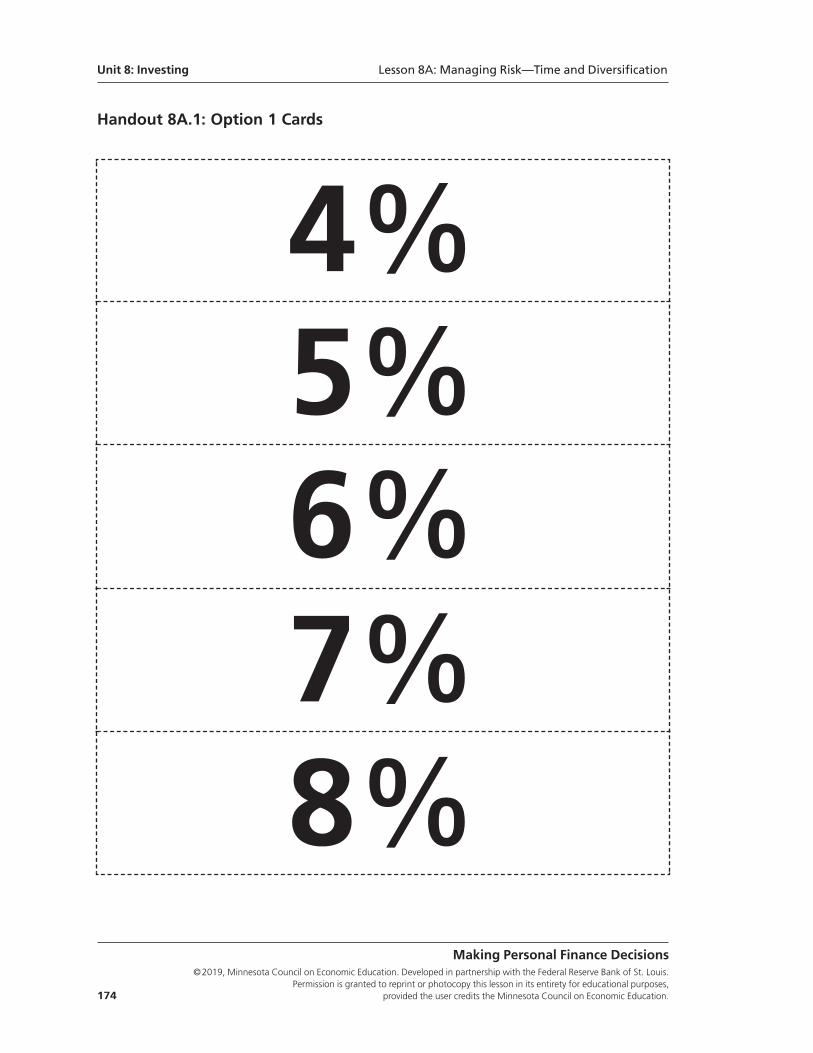
Handout 8A.1: Option 1 Cards
Unit 8: Investing Lesson 8A: Managing Risk—Time and Diversification
Making Personal Finance Decisions©2019, Minnesota Council on Economic Education. Developed in partnership with the Federal Reserve Bank of St. Louis.
Permission is granted to reprint or photocopy this lesson in its entirety for educational purposes, 174 provided the user credits the Minnesota Council on Economic Education.
4%5%6%7%8%
Handout 8A.2: Option 2 Cards
Lesson 8A: Managing Risk—Time and Diversification Unit 8: Investing
Making Personal Finance Decisions©2019, Minnesota Council on Economic Education. Developed in partnership with the Federal Reserve Bank of St. Louis. Permission is granted to reprint or photocopy this lesson in its entirety for educational purposes, provided the user credits the Minnesota Council on Economic Education. 175
–4%2%8%14%20%
Handout 8A.3: Assessment Name:____________________________________
1. What is risk?
2. Imagine you have two investment options with the noted possible rates of return:
Option 1: 2%, 3%, 4%, or 5%
Option 2: –2%, 2%, 8%, or 12%
a. Calculate the expected rate of return for each option.
• Option 1 rate of return:
• Option 2 rate of return:
b. To assess risk, calculate the range for each option, and then explain which optionis riskier and why.
• Option 1 range:
• Option 2 range:
c. If you were presented with investment Options 1 and 2, what strategies could youuse to reduce investment risk?
Unit 8: Investing Lesson 8A: Managing Risk—Time and Diversification
Making Personal Finance Decisions©2019, Minnesota Council on Economic Education. Developed in partnership with the Federal Reserve Bank of St. Louis.
Permission is granted to reprint or photocopy this lesson in its entirety for educational purposes, 176 provided the user credits the Minnesota Council on Economic Education.
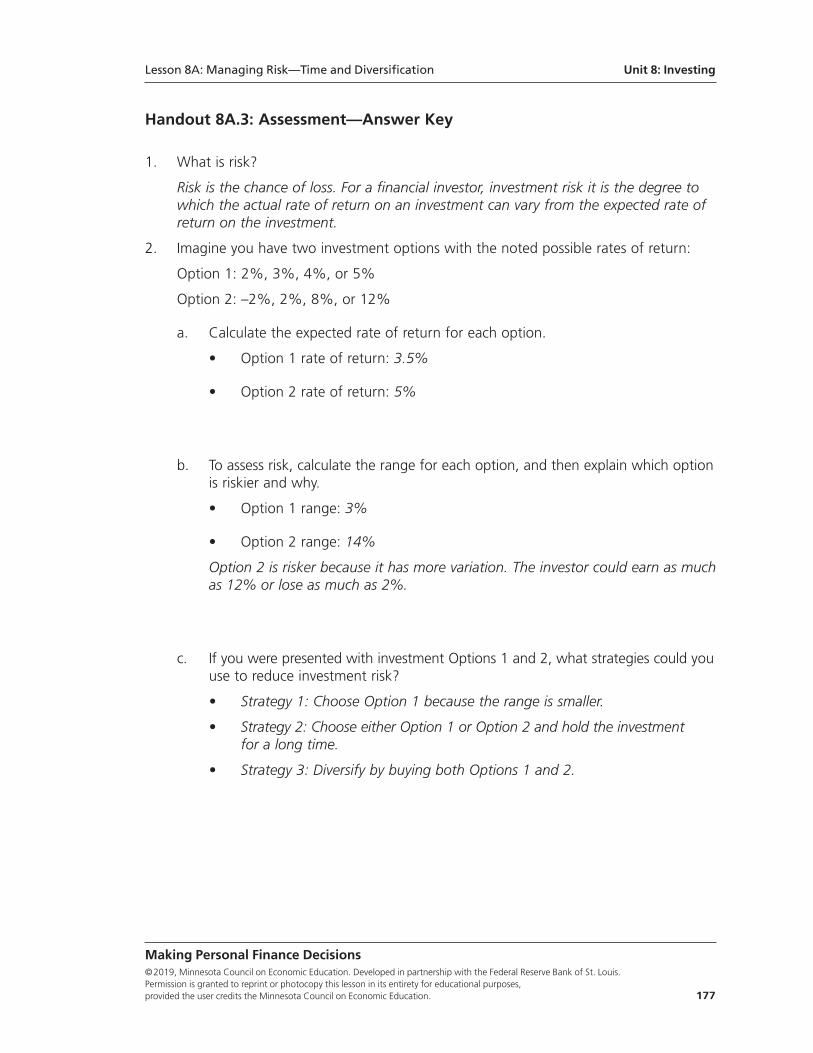
Handout 8A.3: Assessment—Answer Key
1. What is risk?
Risk is the chance of loss. For a financial investor, investment risk it is the degree towhich the actual rate of return on an investment can vary from the expected rate ofreturn on the investment.
2. Imagine you have two investment options with the noted possible rates of return:
Option 1: 2%, 3%, 4%, or 5%
Option 2: –2%, 2%, 8%, or 12%
a. Calculate the expected rate of return for each option.
• Option 1 rate of return: 3.5%
• Option 2 rate of return: 5%
b. To assess risk, calculate the range for each option, and then explain which optionis riskier and why.
• Option 1 range: 3%
• Option 2 range: 14%
Option 2 is risker because it has more variation. The investor could earn as muchas 12% or lose as much as 2%.
c. If you were presented with investment Options 1 and 2, what strategies could youuse to reduce investment risk?
• Strategy 1: Choose Option 1 because the range is smaller.
• Strategy 2: Choose either Option 1 or Option 2 and hold the investment for a long time.
• Strategy 3: Diversify by buying both Options 1 and 2.
Making Personal Finance Decisions©2019, Minnesota Council on Economic Education. Developed in partnership with the Federal Reserve Bank of St. Louis. Permission is granted to reprint or photocopy this lesson in its entirety for educational purposes, provided the user credits the Minnesota Council on Economic Education. 177
Lesson 8A: Managing Risk—Time and Diversification Unit 8: Investing
Standards and Benchmarks
National Standards for Financial Literacy
Standard 5: Financial Investing. Financial investment is the purchase of financial assetsto increase income or wealth in the future. Investors must choose among investments thathave different risks and expected rates of return. Investments with higher expected ratesof return tend to have greater risk. Diversification of investment among a number of choicescan lower investment risk.
• Benchmark: Grade 8
5. The rate of return on financial investments consists of interest payments, dividends, and capital appreciation expressed as a percentage of the amountinvested.
6. Financial risk means that a financial investment has a range of possible returns, including possibilities of actual losses. Higher-risk investments have a wider range of possible returns.
7. The rate of return earned from investments will vary according to the amount of risk. In general, a trade-off exists between the security of an investment and its expected rate of return.
• Benchmark: Grade 12
5. An investment with greater risk than another investment will commonly have a lower market price, and therefore a higher rate of return, than the other investment.
7. Diversification by investing in different types of financial assets can lower investment risk.
Unit 8: Investing Lesson 8A: Managing Risk—Time and Diversification
Making Personal Finance Decisions©2019, Minnesota Council on Economic Education. Developed in partnership with the Federal Reserve Bank of St. Louis.
Permission is granted to reprint or photocopy this lesson in its entirety for educational purposes, 178 provided the user credits the Minnesota Council on Economic Education.
Lesson 8B:
Evaluating Investment Options
Lesson DescriptionStudents use the PACED decisionmaking model to investigate the trade-offs involvedin choosing an investment.
Standards and Benchmarks (see page 188)
Grade Level9-12
ConceptsCosts (related to investment options)
Liquidity
PACED decisionmaking model
Rate of return
Risk
Compelling QuestionHow do people choose among investment options?
Making Personal Finance Decisions©2019, Minnesota Council on Economic Education. Developed in partnership with the Federal Reserve Bank of St. Louis. Permission is granted to reprint or photocopy this lesson in its entirety for educational purposes, provided the user credits the Minnesota Council on Economic Education. 179
Rule 8: Grow your wealth safely.Investing requires three simple steps: (i) saving a portion of your income each year toinvest, (ii) letting your investments grow (avoiding withdrawals), and (iii) managing yourinvestment risk. These lessons look at investment options, criteria for evaluating invest-ments (using the PACED decisionmaking model), and strategies for managing investmentrisk.
Unit 8
Investing
Making Personal Finance Decisions©2019, Minnesota Council on Economic Education. Developed in partnership with the Federal Reserve Bank of St. Louis.
Permission is granted to reprint or photocopy this lesson in its entirety for educational purposes, 180 provided the user credits the Minnesota Council on Economic Education.
ObjectivesStudents will be able to
• identify and describe criteria that would be important in choosing investments and
• use the PACED decisionmaking model and grid to choose investments.
Materials• Visual 8B.1: PACED Decisionmaking Model for Choosing Investments
• Visual 8B.1: PACED Decisionmaking Model for Choosing Investments—Answer Key
• Handout 8B.1: Evaluating an Investment Alternative, one copy for each student
• (optional) Handout 8B.2: Investment Alternatives, one copy for each student
• Handout 8B.3: Assessment, one copy for each student
Time RequiredSeveral class periods
Procedure1. Review the PACED decisionmaking model as necessary (see Lesson 1B). Remind
students of the five basic steps: (1) Define the problem. (2) List the alternatives. (3)Determine the criteria. (4) Evaluate the alternatives. (5) Make a decision. Discuss thefollowing:
• Once people have saved part of their income, what is the next question or prob-lem they will likely need to address? (Answers will vary, but lead students torealize that choosing investment options should be considered.)
• Using the PACED decisionmaking model, for Step 1, the defined problem is howto invest income.
• What is Step 2? (List the alternatives.)
• What are some investment alternatives? (List alternatives on the board.) (Answerswill vary. See the alternatives listed on Visual 8B.1: PACED Decisionmaking Modelfor Choosing Investments and note those students miss. Briefly describe eachalternative as needed; however, students will be asked to research these morefully below.)
• Step 3 is to determine the criteria. Criteria are factors that could be used to rankone alternative as being “better” than another. What criteria do people findimportant for choosing investments? (List the criteria on the board.) (Answerswill vary but will likely include the rate of return and amount of risk.)
Unit 8: Investing Lesson 8B: Evaluating Investment Options
Making Personal Finance Decisions©2019, Minnesota Council on Economic Education. Developed in partnership with the Federal Reserve Bank of St. Louis. Permission is granted to reprint or photocopy this lesson in its entirety for educational purposes, provided the user credits the Minnesota Council on Economic Education. 181
2. From the list below, add to the list on the board criteria students may have missed.Define each one as follows:
• Rate of return is the return on an asset over a given period divided by the mar-ket value (the price it can be sold for in a market) of the asset at the beginningof that period. This ratio is typically multiplied by 100 and expressed as a percent-age. (See Lesson 2B for more about the rate of return.)
• Risk is the chance of loss. For an investment, the risk is that the actual rate ofreturn may vary from the expected rate of return. (See Lesson 8A for more aboutrisk.).
• Liquidity is the quality that makes an asset easily converted into cash with littleloss of value in the conversion process—that is, how easy is it to liquidate theinvestment. For example, money in savings can easily be withdrawn for spending,but a house takes time to convert into cash—you need to find a buyer and com-plete the paperwork before the deal is closed and a check is received.
• Costs are charges, fees, or other expenses associated with buying, selling, orholding an investment. For example, such costs include account maintenancefees, broker charges for buying and selling stocks, closing costs for buying orselling a house, minimum balance requirements, and mutual fund managementfees, and so on.
3. Display Visual 8B.1: PACED Decisionmaking Model for Choosing Investments. Explainthat the grid lists alternatives down the left side and criteria across the top line. Remindthe class that Step 4 of the PACED model is evaluating the alternatives. Each cell ofthe grid needs to be filled in with an evaluation of how well each alternative meetseach criterion.
4. Distribute a copy of Handout 8B.1: Evaluating an Investment Alternative to each student. (Optional: Also distribute a copy of Handout 8B.2: Investment Alternatives toeach student.) Form 15 groups of students and assign each group one of the 15 alter-natives listed on Visual 8B.1. Explain the following and then allow students time tocomplete the assignment (one class period; roughly 40 minutes, should be sufficient):
• Each group is to research and evaluate its assigned investment alternative accord-ing to the four criteria given on Handout 8B.1 so that the findings will be com-parable: rate of return, risk, liquidity, and costs.
5. Have groups report their results and rationale, discuss any differences, and fill in thecells on Visual 8B.1. (See Visual 8B.1—Answer Key for a sample of how the grid maybe filled out.) NOTE: The information on the Answer Key is dated and subjective, sostudents will not have the exact values shown. What is important is that they providea reasonable rationale for their evaluation.
6. Point out that the class is now at Step 5 in the PACED decisionmaking model—makea decision. Discuss the following:
Lesson 8B: Evaluating Investment Options Unit 8: Investing
Making Personal Finance Decisions©2019, Minnesota Council on Economic Education. Developed in partnership with the Federal Reserve Bank of St. Louis.
Permission is granted to reprint or photocopy this lesson in its entirety for educational purposes, 182 provided the user credits the Minnesota Council on Economic Education.
• Given the information shown on Visual 8B.1, which alternative is the “best”choice? (Students should recognize that the best choice depends on which ofthe criteria are most important to the person choosing. For example, if the personis uncomfortable with risk, they would not want to choose alternatives with highrisk. On the other hand, a person interested only in a high rate of return wouldlikely choose one of the more risky alternatives.)
• Why might an investor wish to choose more than one investment alternative?(The investor may have multiple needs: They may want high liquidity to meetshort-term goals, a high rate of return to meet long-term goals, or to lower riskthrough diversification.)
Closure 7. Explain that most financial planners will ask their clients questions about how they
feel about various criteria to help them select the investment(s) that best suits theirdesires and needs. They basically apply the PACED decisionmaking model or a similarmodel.
Assessment8. Distribute a copy of Handout 8B.3: Assessment to each student and allow time for
students to work (or assign as homework).
Handout 8B.3—Answer Key
Directions: Use the PACED decisionmaking model to select an investment foreach of the investors below. For each investor, explain which of the four criteria(rate of return, risk, liquidity, and costs) were the most important factors inchoosing those investments.
1. Investor 1 is young with lots of time until retirement and is not afraid to take onrisk.
Answers will vary. Responses should emphasize that Investor 1 has the time totake on additional risk. As such, Investor 1 should likely pursue relatively riskierinvestments with a higher rate of return, such as corporate bonds, income stocks,growth stocks, real estate, commodities, collectibles, or mutual funds.
2. Investor 2 hopes to retire in three to five years and has a high level of anxietyabout fluctuating investment values.
Answers will vary. Responses should emphasize that Investor 2 has a short horizonfor investing and is risk averse. As a result, Investor 2 should likely pursue invest-ments with low risk and higher liquidity, such as certificates of deposit, U.S. sav-ings bonds and Treasury bonds, and money market mutual funds.
Unit 8: Investing Lesson 8B: Evaluating Investment Options
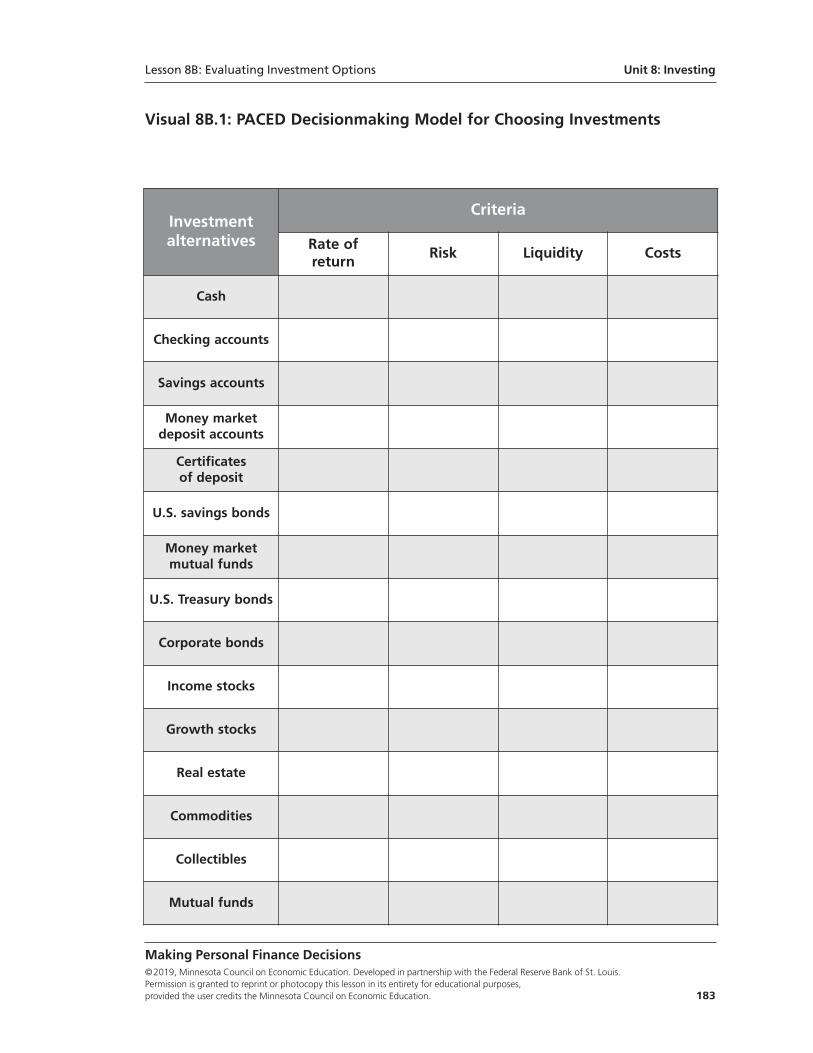
Making Personal Finance Decisions©2019, Minnesota Council on Economic Education. Developed in partnership with the Federal Reserve Bank of St. Louis. Permission is granted to reprint or photocopy this lesson in its entirety for educational purposes, provided the user credits the Minnesota Council on Economic Education. 183
Visual 8B.1: PACED Decisionmaking Model for Choosing Investments
Investmentalternatives
Criteria
Rate of return
Risk Liquidity Costs
Cash
Checking accounts
Savings accounts
Money marketdeposit accounts
Certificatesof deposit
U.S. savings bonds
Money marketmutual funds
U.S. Treasury bonds
Corporate bonds
Income stocks
Growth stocks
Real estate
Commodities
Collectibles
Mutual funds
Lesson 8B: Evaluating Investment Options Unit 8: Investing
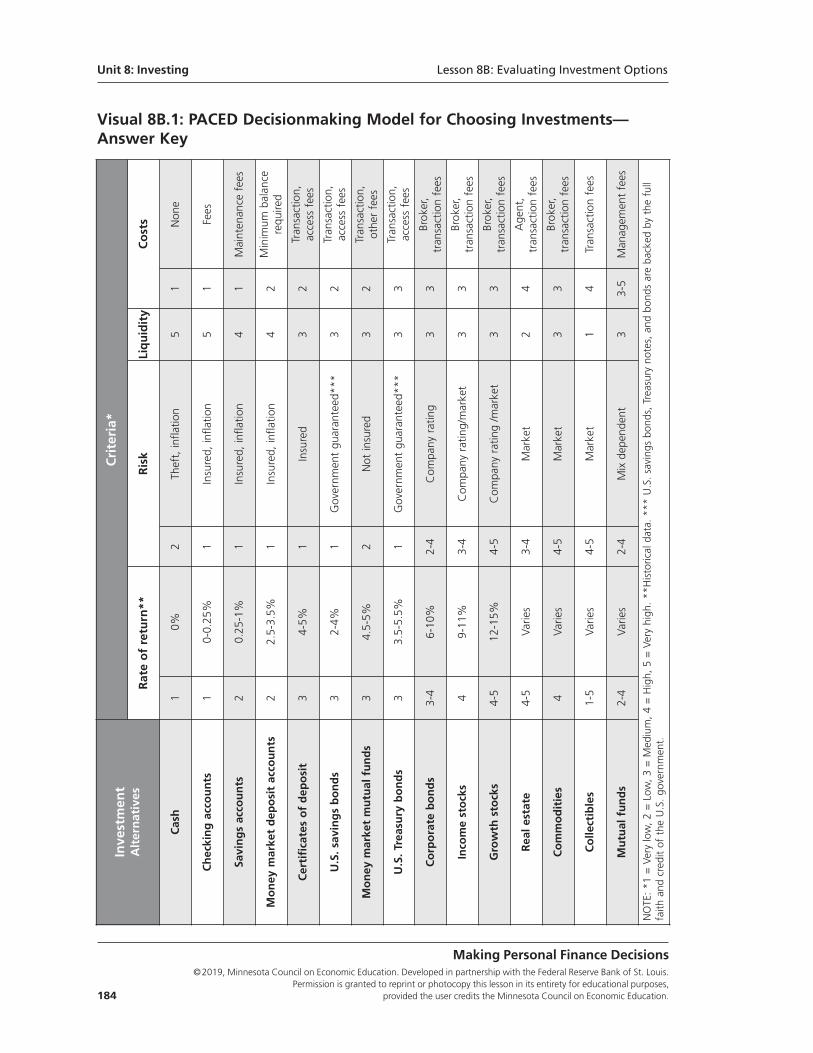
Making Personal Finance Decisions©2019, Minnesota Council on Economic Education. Developed in partnership with the Federal Reserve Bank of St. Louis.
Permission is granted to reprint or photocopy this lesson in its entirety for educational purposes, 184 provided the user credits the Minnesota Council on Economic Education.
Visual 8B.1: PACED Decisionmaking Model for Choosing Investments—Answer Key
Investmen
tAlternatives
Criteria*
Rate of return**
Risk
Liquidity
Costs
Cash
10%
2Th
eft, in
flatio
n5
1Non
e
Checking accounts
10-0.25
%1
Insured, in
flatio
n5
1Fees
Savings accounts
20.25
-1%
1Insured, in
flatio
n4
1Mainten
ance fees
Money m
arket dep
osit accounts
22.5-3.5%
1Insured, in
flatio
n4
2Minim
um balan
cerequ
ired
Certificates of dep
osit
34-5%
1Insured
32
Tran
saction,
access fees
U.S. savings bonds
32-4%
1Governm
ent gu
aran
teed
***
32
Tran
saction,
access fees
Money m
arket mutual funds
34.5-5%
2Not in
sured
32
Tran
saction,
othe
r fees
U.S. Treasury bonds
33.5-5.5%
1Governm
ent gu
aran
teed
***
33
Tran
saction,
access fees
Corporate bonds
3-4
6-10
%2-4
Com
pany rating
33
Brok
er,
tran
saction fees
Income stocks
49-11
%3-4
Com
pany rating/market
33
Brok
er,
tran
saction fees
Growth stocks
4-5
12-15%
4-5
Com
pany rating /m
arket
33
Brok
er,
tran
saction fees
Real e
state
4-5
Varie
s3-4
Market
24
Age
nt,
tran
saction fees
Commodities
4Va
ries
4-5
Market
33
Brok
er,
tran
saction fees
Colle
ctibles
1-5
Varie
s4-5
Market
14
Tran
saction fees
Mutual funds
2-4
Varie
s2-4
Mix dep
ende
nt3
3-5
Man
agem
ent fees
NOTE: *1
= Very low, 2 = Low
, 3 = M
edium, 4 = High, 5 = Very high
. **
Historical data. ***
U.S. saving
s bo
nds, Treasury no
tes, and
bon
ds are backed by the
full
faith
and
credit of the
U.S. go
vernmen
t.
Unit 8: Investing Lesson 8B: Evaluating Investment Options
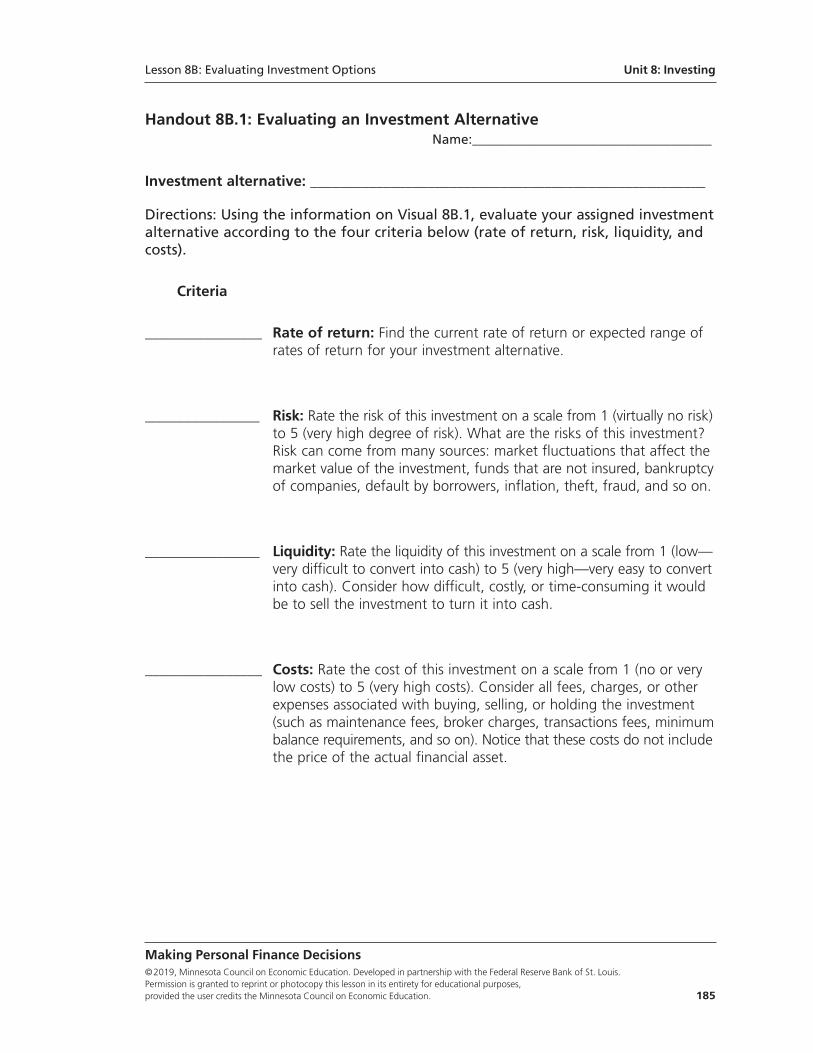
Making Personal Finance Decisions©2019, Minnesota Council on Economic Education. Developed in partnership with the Federal Reserve Bank of St. Louis. Permission is granted to reprint or photocopy this lesson in its entirety for educational purposes, provided the user credits the Minnesota Council on Economic Education. 185
Handout 8B.1: Evaluating an Investment AlternativeName:____________________________________
Investment alternative: ______________________________________________________
Directions: Using the information on Visual 8B.1, evaluate your assigned investmentalternative according to the four criteria below (rate of return, risk, liquidity, andcosts).
Criteria
________________ Rate of return: Find the current rate of return or expected range of rates of return for your investment alternative.
________________ Risk: Rate the risk of this investment on a scale from 1 (virtually no risk)to 5 (very high degree of risk). What are the risks of this investment? Risk can come from many sources: market fluctuations that affect the market value of the investment, funds that are not insured, bankruptcyof companies, default by borrowers, inflation, theft, fraud, and so on.
________________ Liquidity: Rate the liquidity of this investment on a scale from 1 (low—very difficult to convert into cash) to 5 (very high—very easy to convert into cash). Consider how difficult, costly, or time-consuming it would be to sell the investment to turn it into cash.
________________ Costs: Rate the cost of this investment on a scale from 1 (no or very low costs) to 5 (very high costs). Consider all fees, charges, or other expenses associated with buying, selling, or holding the investment (such as maintenance fees, broker charges, transactions fees, minimumbalance requirements, and so on). Notice that these costs do not includethe price of the actual financial asset.
Lesson 8B: Evaluating Investment Options Unit 8: Investing
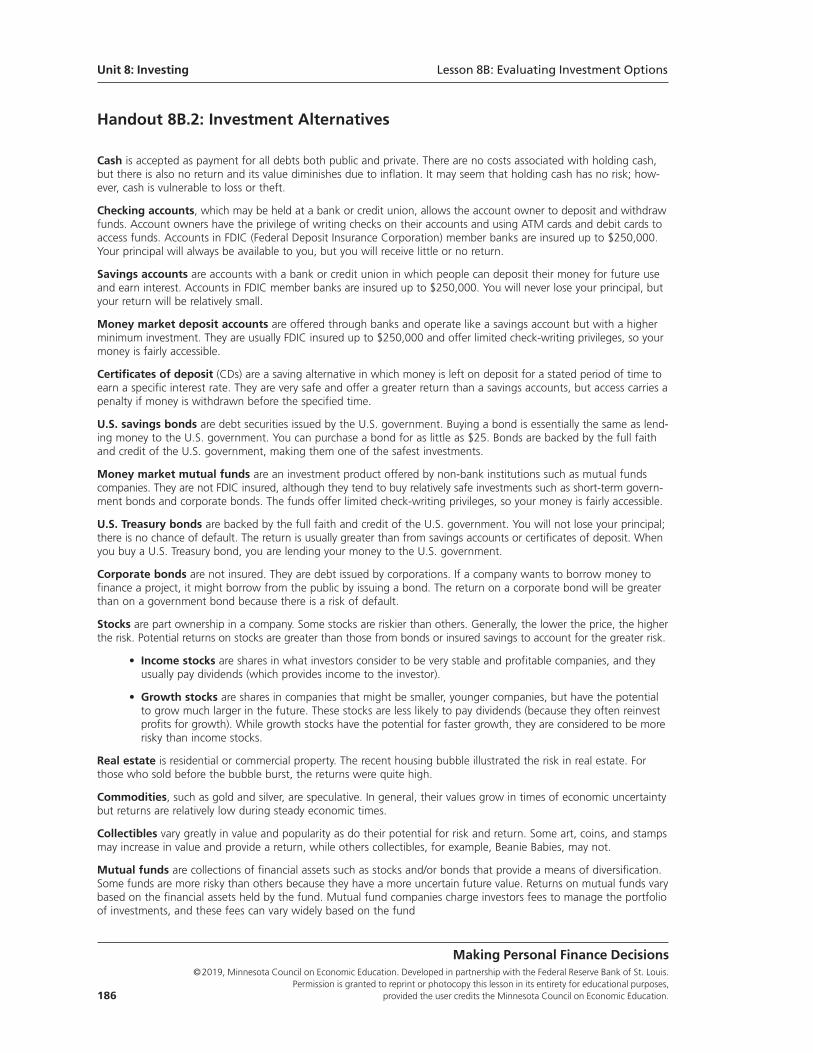
Handout 8B.2: Investment Alternatives
Cash is accepted as payment for all debts both public and private. There are no costs associated with holding cash,but there is also no return and its value diminishes due to inflation. It may seem that holding cash has no risk; how-ever, cash is vulnerable to loss or theft.
Checking accounts, which may be held at a bank or credit union, allows the account owner to deposit and withdrawfunds. Account owners have the privilege of writing checks on their accounts and using ATM cards and debit cards toaccess funds. Accounts in FDIC (Federal Deposit Insurance Corporation) member banks are insured up to $250,000.Your principal will always be available to you, but you will receive little or no return.
Savings accounts are accounts with a bank or credit union in which people can deposit their money for future useand earn interest. Accounts in FDIC member banks are insured up to $250,000. You will never lose your principal, butyour return will be relatively small.
Money market deposit accounts are offered through banks and operate like a savings account but with a higherminimum investment. They are usually FDIC insured up to $250,000 and offer limited check-writing privileges, so yourmoney is fairly accessible.
Certificates of deposit (CDs) are a saving alternative in which money is left on deposit for a stated period of time toearn a specific interest rate. They are very safe and offer a greater return than a savings accounts, but access carries apenalty if money is withdrawn before the specified time.
U.S. savings bonds are debt securities issued by the U.S. government. Buying a bond is essentially the same as lend-ing money to the U.S. government. You can purchase a bond for as little as $25. Bonds are backed by the full faithand credit of the U.S. government, making them one of the safest investments.
Money market mutual funds are an investment product offered by non-bank institutions such as mutual fundscompanies. They are not FDIC insured, although they tend to buy relatively safe investments such as short-term govern-ment bonds and corporate bonds. The funds offer limited check-writing privileges, so your money is fairly accessible.
U.S. Treasury bonds are backed by the full faith and credit of the U.S. government. You will not lose your principal;there is no chance of default. The return is usually greater than from savings accounts or certificates of deposit. Whenyou buy a U.S. Treasury bond, you are lending your money to the U.S. government.
Corporate bonds are not insured. They are debt issued by corporations. If a company wants to borrow money tofinance a project, it might borrow from the public by issuing a bond. The return on a corporate bond will be greaterthan on a government bond because there is a risk of default.
Stocks are part ownership in a company. Some stocks are riskier than others. Generally, the lower the price, the higherthe risk. Potential returns on stocks are greater than those from bonds or insured savings to account for the greater risk.
• Income stocks are shares in what investors consider to be very stable and profitable companies, and they usually pay dividends (which provides income to the investor).
• Growth stocks are shares in companies that might be smaller, younger companies, but have the potential to grow much larger in the future. These stocks are less likely to pay dividends (because they often reinvest profits for growth). While growth stocks have the potential for faster growth, they are considered to be more risky than income stocks.
Real estate is residential or commercial property. The recent housing bubble illustrated the risk in real estate. Forthose who sold before the bubble burst, the returns were quite high.
Commodities, such as gold and silver, are speculative. In general, their values grow in times of economic uncertaintybut returns are relatively low during steady economic times.
Collectibles vary greatly in value and popularity as do their potential for risk and return. Some art, coins, and stampsmay increase in value and provide a return, while others collectibles, for example, Beanie Babies, may not.
Mutual funds are collections of financial assets such as stocks and/or bonds that provide a means of diversification.Some funds are more risky than others because they have a more uncertain future value. Returns on mutual funds varybased on the financial assets held by the fund. Mutual fund companies charge investors fees to manage the portfolioof investments, and these fees can vary widely based on the fund
Making Personal Finance Decisions©2019, Minnesota Council on Economic Education. Developed in partnership with the Federal Reserve Bank of St. Louis.
Permission is granted to reprint or photocopy this lesson in its entirety for educational purposes, 186 provided the user credits the Minnesota Council on Economic Education.
Unit 8: Investing Lesson 8B: Evaluating Investment Options
Handout 8B.3: Assessment Name:____________________________________
Directions: Use the PACED decisionmaking model to select an investment for eachof the investors below. For each investor, explain which of the four criteria (rate ofreturn, risk, liquidity, and costs) were the most important factors in choosing thoseinvestments.
1. Investor 1 is young with lots of time until retirement and not afraid to take on risk.
2. Investor 2 hopes to retire in three to five years and has a high level of anxiety about fluctuating investment values.
Making Personal Finance Decisions©2019, Minnesota Council on Economic Education. Developed in partnership with the Federal Reserve Bank of St. Louis. Permission is granted to reprint or photocopy this lesson in its entirety for educational purposes, provided the user credits the Minnesota Council on Economic Education. 187
Lesson 8B: Evaluating Investment Options Unit 8: Investing
Standards and Benchmarks
National Standards for Financial Literacy
Standard 5: Financial Investing. Financial investment is the purchase of financial assetsto increase income or wealth in the future. Investors must choose among investments thathave different risks and expected rates of return. Investments with higher expected ratesof return tend to have greater risk. Diversification of investment among a number of choicescan lower investment risk.
• Benchmark: Grade 8
5. The rate of return on financial investments consists of interest payments, dividends, and capital appreciation expressed as a percentage of the amountinvested.
6. Financial risk means that a financial investment has a range of possible returns, including possibilities of actual losses. Higher-risk investments have a wider range of possible returns.
7. The rate of return earned from investments will vary according to the amount of risk. In general, a trade-off exists between the security of an investment and its expected rate of return.
• Benchmark: Grade 12
5. An investment with greater risk than another investment will commonly have a lower market price, and therefore a higher rate of return, than the other investment.
7. Diversification by investing in different types of financial assets can lower investment risk.
11. People vary in their willingness to take risks. The willingness to take risks depends on factors such as personality, income, and family situation.
Making Personal Finance Decisions©2019, Minnesota Council on Economic Education. Developed in partnership with the Federal Reserve Bank of St. Louis.
Permission is granted to reprint or photocopy this lesson in its entirety for educational purposes, 188 provided the user credits the Minnesota Council on Economic Education.
Unit 8: Investing Lesson 8B: Evaluating Investment Options
Lesson 9A:
The Three C’s of Credit
Lesson DescriptionStudents play the role of credit providers and assess the creditworthiness of an indi-vidual with a loan request and randomly selected borrower characteristics. Studentsclassify those characteristics based on the three C’s of credit (capacity, character, andcollateral), assess the riskiness of lending to that individual based on these character-istics, and then decide whether or not to approve or deny the loan request.
Standards and Benchmarks (see page 211)
Grade Level9-12
ConceptsThe three C’s of credit: capacity, character, and collateral
Credit score
Compelling QuestionHow do lenders evaluate the risk when making loans?
Unit 9
Borrowing
Making Personal Finance Decisions©2019, Minnesota Council on Economic Education. Developed in partnership with the Federal Reserve Bank of St. Louis. Permission is granted to reprint or photocopy this lesson in its entirety for educational purposes, provided the user credits the Minnesota Council on Economic Education. 189
Rule 9: Pay on time and in full.While borrowing has both benefits and costs, at times it is an indication that somethinghas gone wrong with your financial planning (spending too much and/or saving toolittle relative to your income). These lessons look at borrowing from both the lender’sand the borrower’s perspectives and discuss why it is wise to use credit sparingly andmanage the use of credit.
ObjectivesStudents will be able to
• describe the “three C’s of credit” (capacity, character, and collateral) and factorsused to measure or assess them;
• evaluate the riskiness of lending to an individual based on capacity, character,and collateral; and
• weigh the benefits and costs of approving a loan and make a decision toapprove or deny the loan; and
• define credit score.
Materials• Visual 9A.1: The Three C’s of Credit
• Handout 9A.1: Individual Characteristic Cards, with each page cut apart andplaced into an envelope labeled with the given category (There are 12 categories.)
• Handout 9A.2: Loan Request Cards, two copies cut into cards and placed intoan envelope labeled “Loan Requests”
• Handout 9A.3: Approve or Deny Credit?, one copy for each student
• Handout 9A.4: Assessment, one copy for each student
• 13 Standard envelopes (to use as noted above)
Time Required45 minutes
PreparationPlace the 12 envelopes with the Individual Characteristic Cards at stations around theroom (see Step 7 below).
(Teacher note: Having multiple stations around the room will help speed up this stepby reducing classroom congestion. For example, for a class of 30 there would be threestudents per group. In this case, it would be helpful to set up three stations with fourenvelopes each. So, three students from each group would go to one stations to selectcards. So, each member of a group would select four cards per station and then returnto his or her seat.)
Unit 9: Borrowing Lesson 9A: The Three C’s of Credit
Making Personal Finance Decisions©2019, Minnesota Council on Economic Education. Developed in partnership with the Federal Reserve Bank of St. Louis.
Permission is granted to reprint or photocopy this lesson in its entirety for educational purposes, 190 provided the user credits the Minnesota Council on Economic Education.
Procedure1. Explain to the students that they will be playing the role of lenders and deciding to
approve or deny individual loan requests. Discuss the following:
• What are some examples of credit or loan providers? (Answers will vary but mayinclude banks, credit unions, car dealers, credit-card companies, or departmentstores.)
• What are some things people often use credit or a loan to purchase? (Answerswill vary but may include a house, car, an education, medical expenses, or newelectronics.)
2. Explain that lenders expect all the money they lend to be fully repaid with interest.Thus, when deciding whether to make a loan or offer credit, lenders want to knowthe likelihood that the individual will repay the money. Discuss the following:
• What information about a person would you want to know before lending thatperson money? (Answers will vary. See Visual 9A.1: The Three C’s of Credit for alist.)
3. Display Visual 9A.1. Explain that the visual shows the three questions lenders general-ly want answered before granting a loan. They are known as the “Three C’s of Credit”:Capacity, Character, and Collateral:
(1) Capacity: What is the individual’s ability to repay the loan?
(2) Character: What is the individual’s reliability to repay the loan?
(3) Collateral: What assets does the individual own that could be sold to repay theloan?
4. Review the factors for each C and then explain the following:
• Each factor attempts to provide a measure to help answer each question.
• The results vary from person to person, with a wide range of possibilities.
Capacity
• The amount of debt a borrower has relative to his or her income is an indicationof “capacity,” that is, that person’s ability to repay debt.
• For example, an individual with debt payments that are a large percentage of hisor her monthly income would be less able to take on more debt than someonewith debt payments that are a smaller percentage of his or her income.
Character
• A credit score is an indication of “character” because it indicates a person’sreputation for paying bills and debts based on past behavior.
Lesson 9A: The Three C’s of Credit Unit 9: Borrowing
Making Personal Finance Decisions©2019, Minnesota Council on Economic Education. Developed in partnership with the Federal Reserve Bank of St. Louis. Permission is granted to reprint or photocopy this lesson in its entirety for educational purposes, provided the user credits the Minnesota Council on Economic Education. 191
• A credit score is a number based on information in a credit report, which indicatesa person’s credit risk.
• Credit scores are often called FICO scores. FICO is an abbreviation for Fair IsaacsCompany—the first company to develop credit scores.
• Credit scores generally range from 350 to 850, with 350 indicating low reliabilityand 850 indicating high reliability.
• A low credit score indicates that a person has not been responsible with credit inthe past.
Collateral
• Collateral is property required by a lender and offered by a borrower as a guar-antee of payment on a loan. Also, a borrower’s savings, investments, or the valueof the asset purchased that can be seized if the borrower fails to repay a debt.
• For example, a borrower who owns many other assets such as stocks, bonds, orreal estate would be able to sell some of those assets to repay a loan if necessary.As such, lenders will see the loan as less risky than a loan to someone with fewor no assets.
• How might the three C’s affect each other? (Having a favorable rating on one Cmay help you have favorable ratings on others; for example, capacity may makecollateral more likely.)
5. Tell the class that they will now use this type of background information to makesome lending decisions.
6. Divide the class into 10 groups as evenly as possible (it is not necessary for the groupsto be of equal size).
7. Have each group randomly select one card from each of the 12 Individual Characteristicenvelopes placed around the room at 12 stations. The groups must decide which groupmembers will go to each station so that only one card is taken from each envelope.
8. After all groups have selected their 12 Individual Characteristic cards, have one memberof each group come to the front of the room and randomly select a card from theLoan Requests envelope held by the teacher.
9. Instruct the groups to spread out their cards.
10. Distribute a copy of Handout 9A.3: Approve or Deny Credit? to each student. Instructthe groups to complete Part A of Handout 9A.3. Allow time for students to completethe activity and then review the answers.
Unit 9: Borrowing Lesson 9A: The Three C’s of Credit
Making Personal Finance Decisions©2019, Minnesota Council on Economic Education. Developed in partnership with the Federal Reserve Bank of St. Louis.
Permission is granted to reprint or photocopy this lesson in its entirety for educational purposes, 192 provided the user credits the Minnesota Council on Economic Education.
Handout 9A.3: Approve or Deny Credit?—Part A Answer Key
Capacity Annual Household Income Years Working for Current Employer EducationMonthly Debt Payments as a % of Monthly Income
Character FICO ScoreYears Living at Current AddressCriminal RecordLength of Credit History
Collateral Short-Term Financial Assets Long-Term Financial AssetsEquity in HomeMarket Value of Other Real Assets
11. Instruct the students to individually complete Part B of Handout 9A.3. After a fewminutes, instruct the groups to compare their answers, discuss any differences, andcome to an agreement on the rating given for each of the three C’s.
Handout 9A.3: Approve or Deny Credit?—Part B Answer Key
Each individual characteristic has five levels of risk that decrease from the top to bottomrows of the original, uncut Handout 9A.1 as follows: high risk, high-medium risk,medium risk, medium-low risk, and low risk. Handout 9A.1, however, offers only threeoptions: low, medium, and high. To get an overall rating for each individual character-istic, students should think about how they would rate each of the four individualcharacteristics that make up the given “C” and how important they believe each char-acteristic is relative to the others in that category.
12. Instruct the groups to discuss and complete Part C of Handout 9A.3.
(Teacher note: Should a group ask for more information about the individual such asage, character references, past loans, and so on, explain that although lenders wouldvalue such information, it is not possible to get complete information for everyone,so they have to work with the information they have.)
Handout 9A.3: Approve or Deny Credit?—Part C Answer Key
It is unlikely that all three of a group’s C’s are “low risk” or “high risk,” which wouldmake the decision fairly easy. Instead, groups will be faced with a mix of risk levelsand will have to weigh lower risk factors against higher risk factors. They should alsoconsider the size and nature of the loan: Lending $2,000 is very different from lending$150,000.
Lesson 9A: The Three C’s of Credit Unit 9: Borrowing
Making Personal Finance Decisions©2019, Minnesota Council on Economic Education. Developed in partnership with the Federal Reserve Bank of St. Louis. Permission is granted to reprint or photocopy this lesson in its entirety for educational purposes, provided the user credits the Minnesota Council on Economic Education. 193
13. Invite groups to report their loan request and whether they approved or denied theloan and why.
(Teacher note: Consider using the video "Understanding How a FICO Credit Score IsDetermined" as a follow-up. It provides an overview of credit reports and credit scoresin less than six minutes; https://www.stlouisfed.org/education/continuing-feducation-video-series/episode-1-understanding-how-a-fico-credit-score-is-determined.)
Closure 14. Discuss the following:
• What have you learned that may help you get a loan or credit some day?(Answers will vary, but students should recognize that they are in control of theirown individual characteristics: The lower their risk levels, the easier it will be forthem to get a loan or credit.)
Assessment15. Distribute a copy of Handout 9A.4: Assessment to each student and allow time for
students to work (or assign as homework).
Handout 9A.4: Assessment—Answer Key
1. Given an individual with the characteristics above, evaluate how likely it is thatthis person will repay the loan in each of the three categories. Give a rating of“low risk,” “medium risk,” or “high risk.”
Capacity: Low risk
Character: High risk
Collateral: High risk
2. Which factors support approving this individual’s loan request?
This person has a relatively high income, has been at her current job for anacceptable period of time (6 years), has a college degree, and has a low percentageof debt payments relative to income (10%).
3. Which factors support denying this individual’s loan request?
This person has a low credit score, has lived at her current address for a shortperiod of time, has one felony, and has very little collateral.
4. Would you approve or deny this individual’s loan request?
Approve / Deny (Circle one.) Explain your decision.
Students should deny this loan request. Although the person scores well oncapacity, she lacks character and collateral.
Unit 9: Borrowing Lesson 9A: The Three C’s of Credit
Making Personal Finance Decisions©2019, Minnesota Council on Economic Education. Developed in partnership with the Federal Reserve Bank of St. Louis.
Permission is granted to reprint or photocopy this lesson in its entirety for educational purposes, 194 provided the user credits the Minnesota Council on Economic Education.
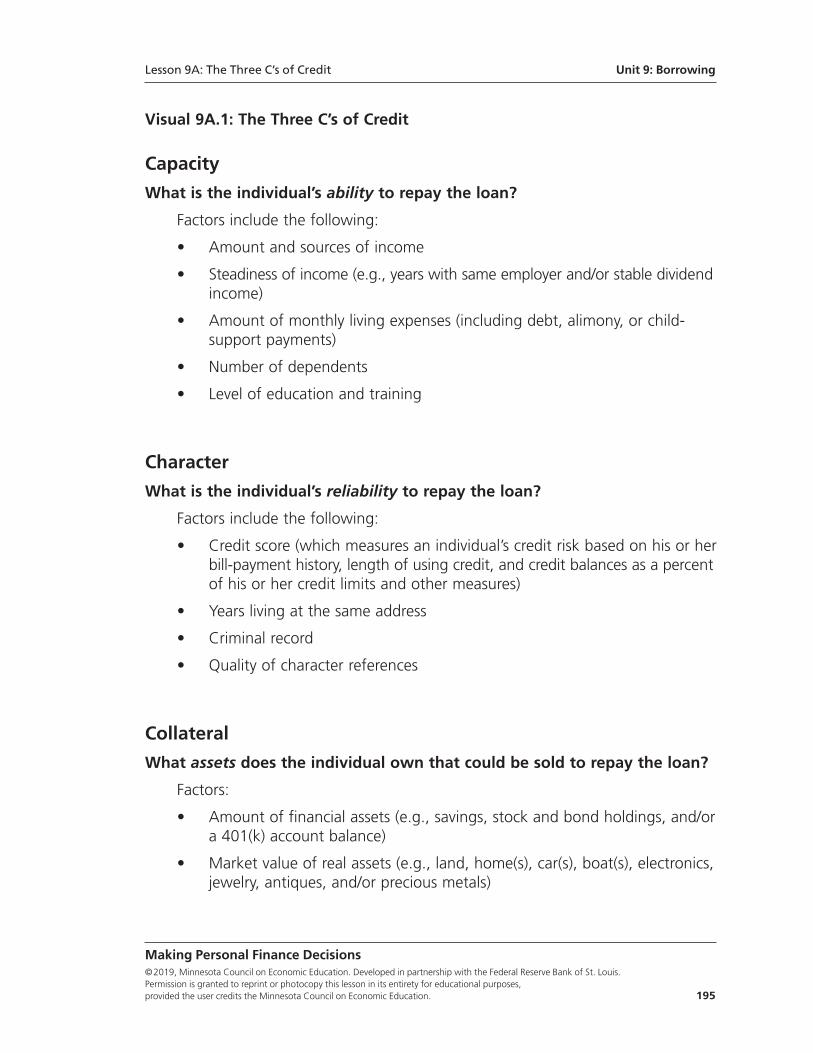
Visual 9A.1: The Three C’s of Credit
Capacity
What is the individual’s ability to repay the loan?
Factors include the following:
• Amount and sources of income
• Steadiness of income (e.g., years with same employer and/or stable dividendincome)
• Amount of monthly living expenses (including debt, alimony, or child-support payments)
• Number of dependents
• Level of education and training
Character
What is the individual’s reliability to repay the loan?
Factors include the following:
• Credit score (which measures an individual’s credit risk based on his or herbill-payment history, length of using credit, and credit balances as a percentof his or her credit limits and other measures)
• Years living at the same address
• Criminal record
• Quality of character references
Collateral
What assets does the individual own that could be sold to repay the loan?
Factors:
• Amount of financial assets (e.g., savings, stock and bond holdings, and/ora 401(k) account balance)
• Market value of real assets (e.g., land, home(s), car(s), boat(s), electronics,jewelry, antiques, and/or precious metals)
Lesson 9A: The Three C’s of Credit Unit 9: Borrowing
Making Personal Finance Decisions©2019, Minnesota Council on Economic Education. Developed in partnership with the Federal Reserve Bank of St. Louis. Permission is granted to reprint or photocopy this lesson in its entirety for educational purposes, provided the user credits the Minnesota Council on Economic Education. 195
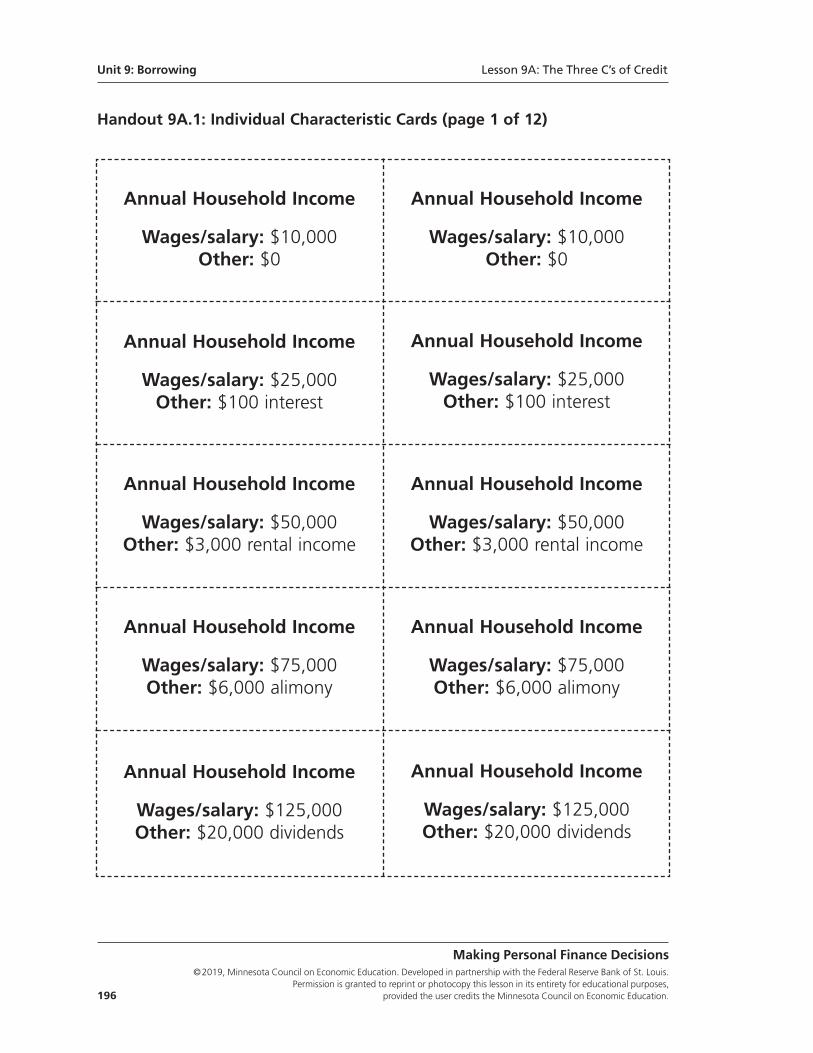
Unit 9: Borrowing Lesson 9A: The Three C’s of Credit
Making Personal Finance Decisions©2019, Minnesota Council on Economic Education. Developed in partnership with the Federal Reserve Bank of St. Louis.
Permission is granted to reprint or photocopy this lesson in its entirety for educational purposes, 196 provided the user credits the Minnesota Council on Economic Education.
Handout 9A.1: Individual Characteristic Cards (page 1 of 12)
Annual Household Income
Wages/salary: $10,000Other: $0
Annual Household Income
Wages/salary: $10,000Other: $0
Annual Household Income
Wages/salary: $25,000Other: $100 interest
Annual Household Income
Wages/salary: $25,000Other: $100 interest
Annual Household Income
Wages/salary: $50,000Other: $3,000 rental income
Annual Household Income
Wages/salary: $50,000Other: $3,000 rental income
Annual Household Income
Wages/salary: $75,000Other: $6,000 alimony
Annual Household Income
Wages/salary: $75,000Other: $6,000 alimony
Annual Household Income
Wages/salary: $125,000Other: $20,000 dividends
Annual Household Income
Wages/salary: $125,000Other: $20,000 dividends
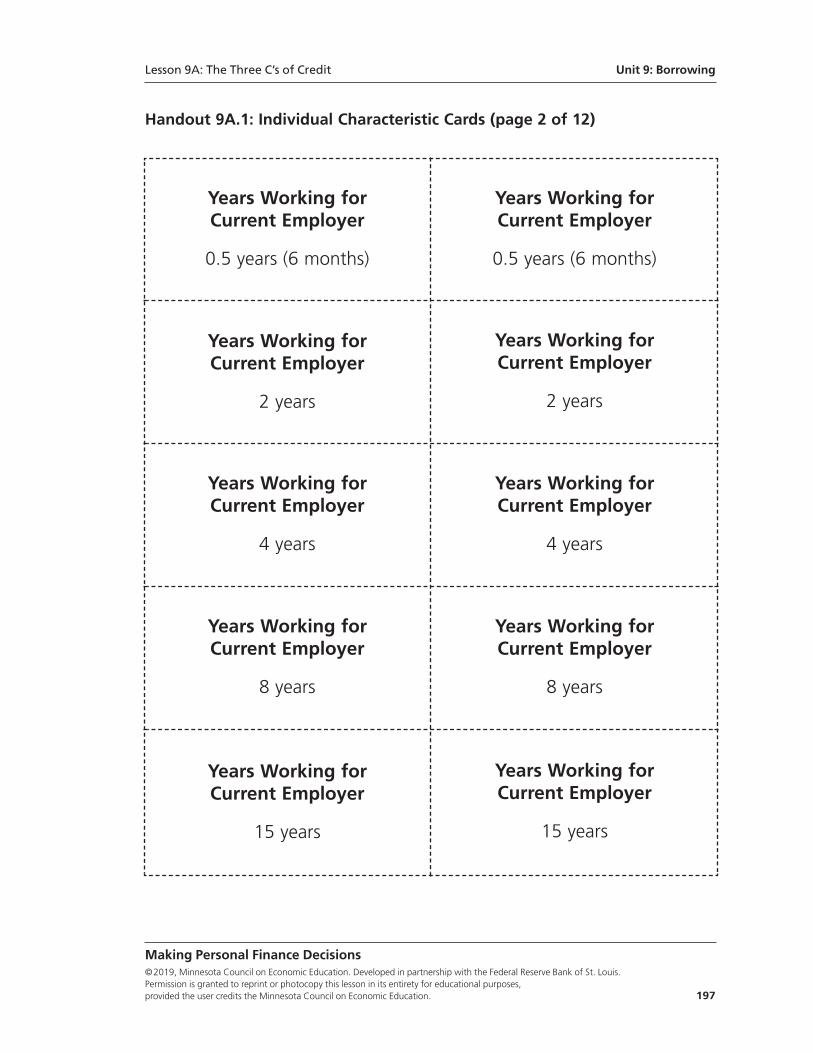
Handout 9A.1: Individual Characteristic Cards (page 2 of 12)
Making Personal Finance Decisions©2019, Minnesota Council on Economic Education. Developed in partnership with the Federal Reserve Bank of St. Louis. Permission is granted to reprint or photocopy this lesson in its entirety for educational purposes, provided the user credits the Minnesota Council on Economic Education. 197
Years Working forCurrent Employer
0.5 years (6 months)
Years Working forCurrent Employer
0.5 years (6 months)
Years Working forCurrent Employer
2 years
Years Working forCurrent Employer
2 years
Years Working forCurrent Employer
4 years
Years Working forCurrent Employer
4 years
Years Working forCurrent Employer
8 years
Years Working forCurrent Employer
8 years
Years Working forCurrent Employer
15 years
Years Working forCurrent Employer
15 years
Lesson 9A: The Three C’s of Credit Unit 9: Borrowing
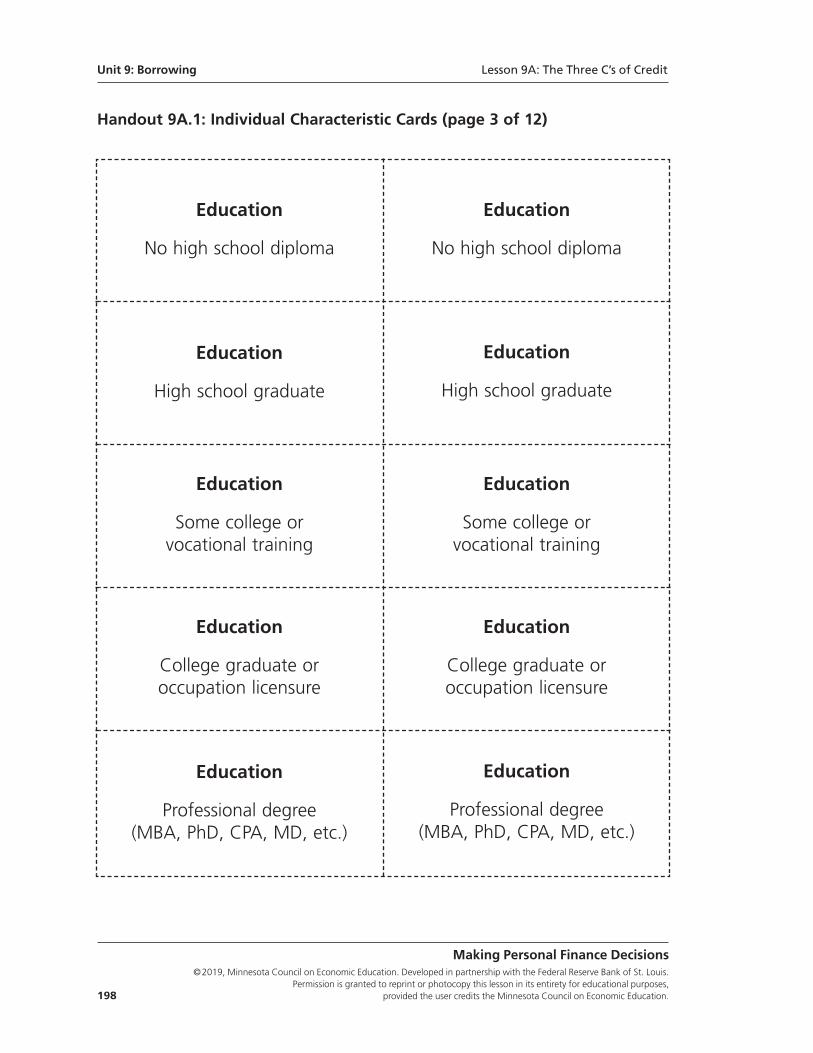
Handout 9A.1: Individual Characteristic Cards (page 3 of 12)
Unit 9: Borrowing Lesson 9A: The Three C’s of Credit
Making Personal Finance Decisions©2019, Minnesota Council on Economic Education. Developed in partnership with the Federal Reserve Bank of St. Louis.
Permission is granted to reprint or photocopy this lesson in its entirety for educational purposes, 198 provided the user credits the Minnesota Council on Economic Education.
Education
No high school diploma
Education
No high school diploma
Education
High school graduate
Education
High school graduate
Education
Some college orvocational training
Education
Some college orvocational training
Education
College graduate oroccupation licensure
Education
College graduate oroccupation licensure
Education
Professional degree(MBA, PhD, CPA, MD, etc.)
Education
Professional degree(MBA, PhD, CPA, MD, etc.)
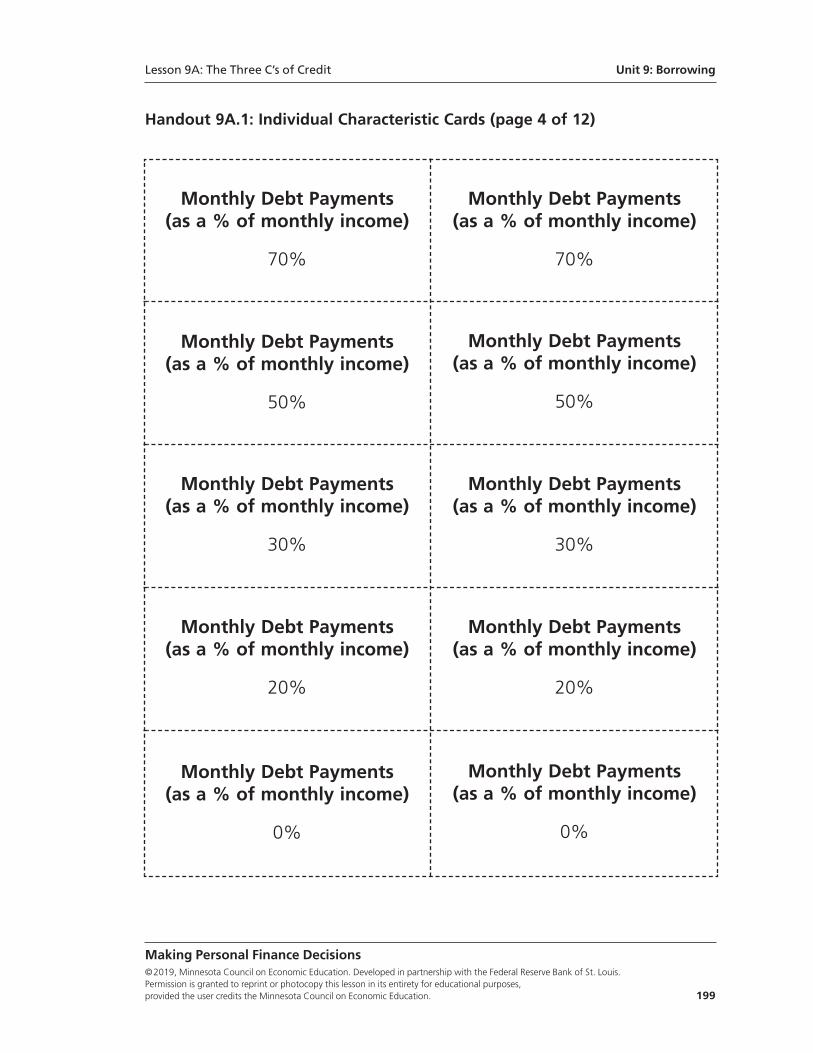
Handout 9A.1: Individual Characteristic Cards (page 4 of 12)
Lesson 9A: The Three C’s of Credit Unit 9: Borrowing
Making Personal Finance Decisions©2019, Minnesota Council on Economic Education. Developed in partnership with the Federal Reserve Bank of St. Louis. Permission is granted to reprint or photocopy this lesson in its entirety for educational purposes, provided the user credits the Minnesota Council on Economic Education. 199
Monthly Debt Payments(as a % of monthly income)
70%
Monthly Debt Payments(as a % of monthly income)
70%
Monthly Debt Payments(as a % of monthly income)
50%
Monthly Debt Payments(as a % of monthly income)
50%
Monthly Debt Payments(as a % of monthly income)
30%
Monthly Debt Payments(as a % of monthly income)
30%
Monthly Debt Payments(as a % of monthly income)
20%
Monthly Debt Payments(as a % of monthly income)
20%
Monthly Debt Payments(as a % of monthly income)
0%
Monthly Debt Payments(as a % of monthly income)
0%
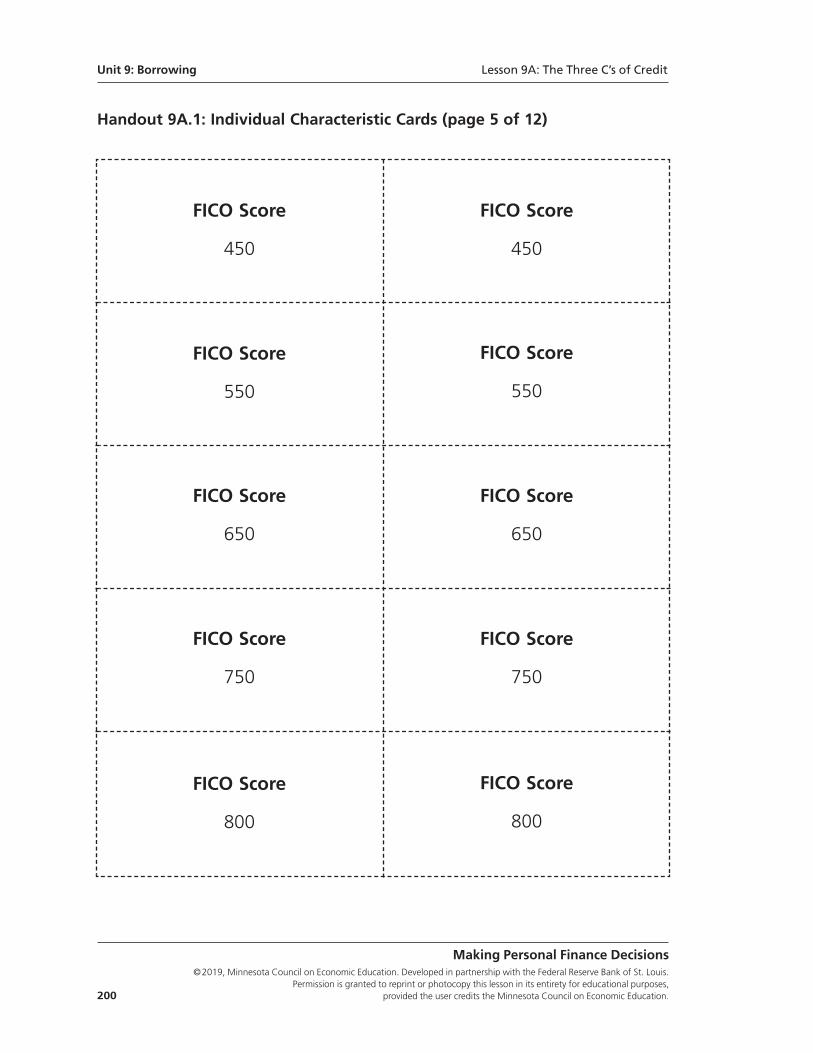
Handout 9A.1: Individual Characteristic Cards (page 5 of 12)
Unit 9: Borrowing Lesson 9A: The Three C’s of Credit
Making Personal Finance Decisions©2019, Minnesota Council on Economic Education. Developed in partnership with the Federal Reserve Bank of St. Louis.
Permission is granted to reprint or photocopy this lesson in its entirety for educational purposes, 200 provided the user credits the Minnesota Council on Economic Education.
FICO Score
450
FICO Score
450
FICO Score
550
FICO Score
550
FICO Score
650
FICO Score
650
FICO Score
750
FICO Score
750
FICO Score
800
FICO Score
800
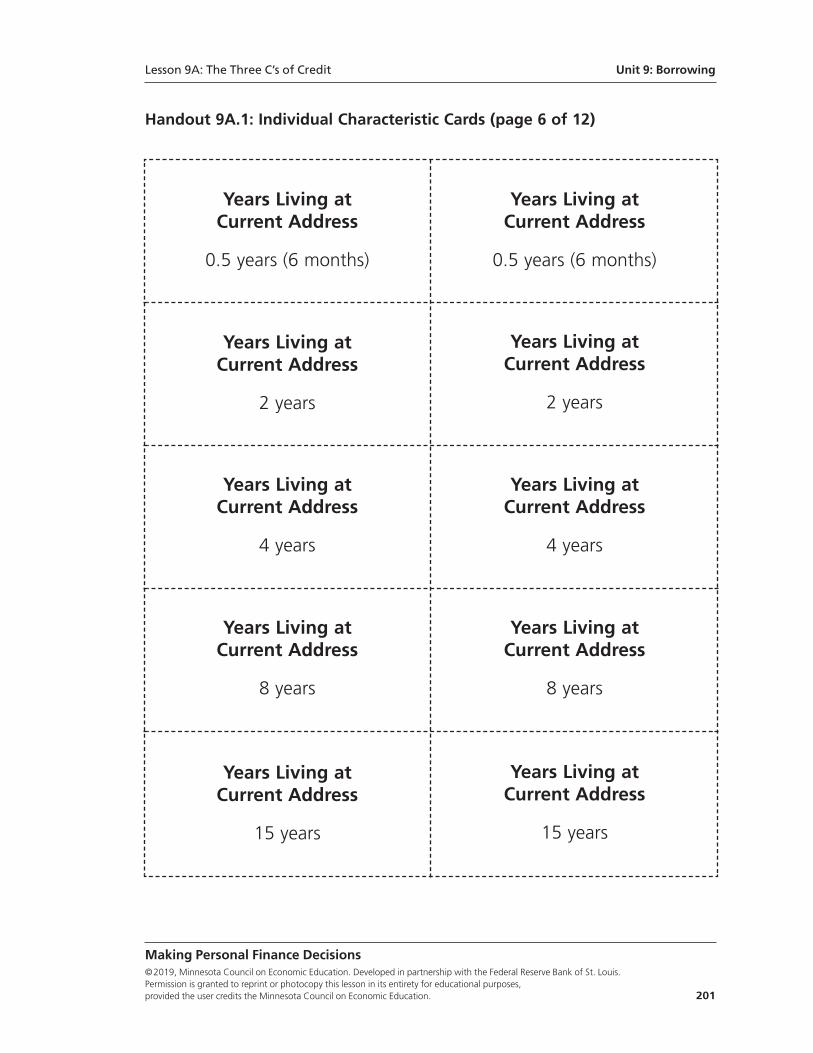
Handout 9A.1: Individual Characteristic Cards (page 6 of 12)
Making Personal Finance Decisions©2019, Minnesota Council on Economic Education. Developed in partnership with the Federal Reserve Bank of St. Louis. Permission is granted to reprint or photocopy this lesson in its entirety for educational purposes, provided the user credits the Minnesota Council on Economic Education. 201
Years Living atCurrent Address
0.5 years (6 months)
Years Living atCurrent Address
0.5 years (6 months)
Years Living atCurrent Address
2 years
Years Living atCurrent Address
2 years
Years Living atCurrent Address
4 years
Years Living atCurrent Address
4 years
Years Living atCurrent Address
8 years
Years Living atCurrent Address
8 years
Years Living atCurrent Address
15 years
Years Living atCurrent Address
15 years
Lesson 9A: The Three C’s of Credit Unit 9: Borrowing
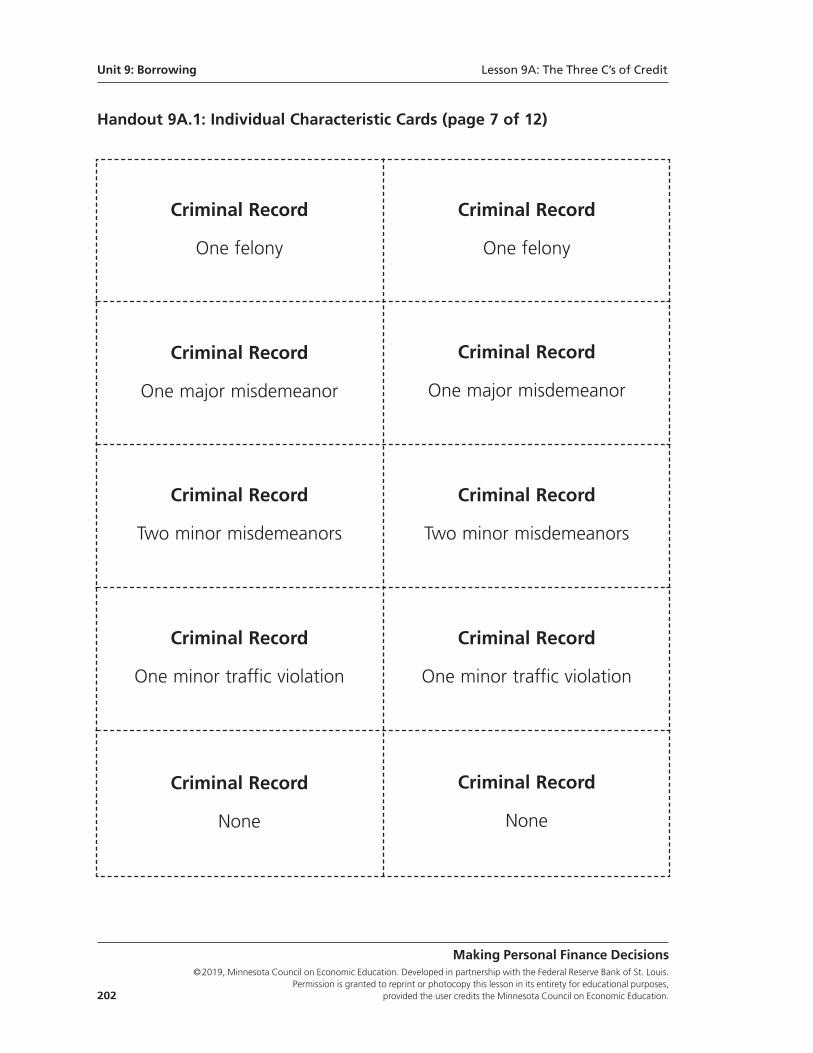
Handout 9A.1: Individual Characteristic Cards (page 7 of 12)
Unit 9: Borrowing Lesson 9A: The Three C’s of Credit
Making Personal Finance Decisions©2019, Minnesota Council on Economic Education. Developed in partnership with the Federal Reserve Bank of St. Louis.
Permission is granted to reprint or photocopy this lesson in its entirety for educational purposes, 202 provided the user credits the Minnesota Council on Economic Education.
Criminal Record
One felony
Criminal Record
One felony
Criminal Record
One major misdemeanor
Criminal Record
One major misdemeanor
Criminal Record
Two minor misdemeanors
Criminal Record
Two minor misdemeanors
Criminal Record
One minor traffic violation
Criminal Record
One minor traffic violation
Criminal Record
None
Criminal Record
None
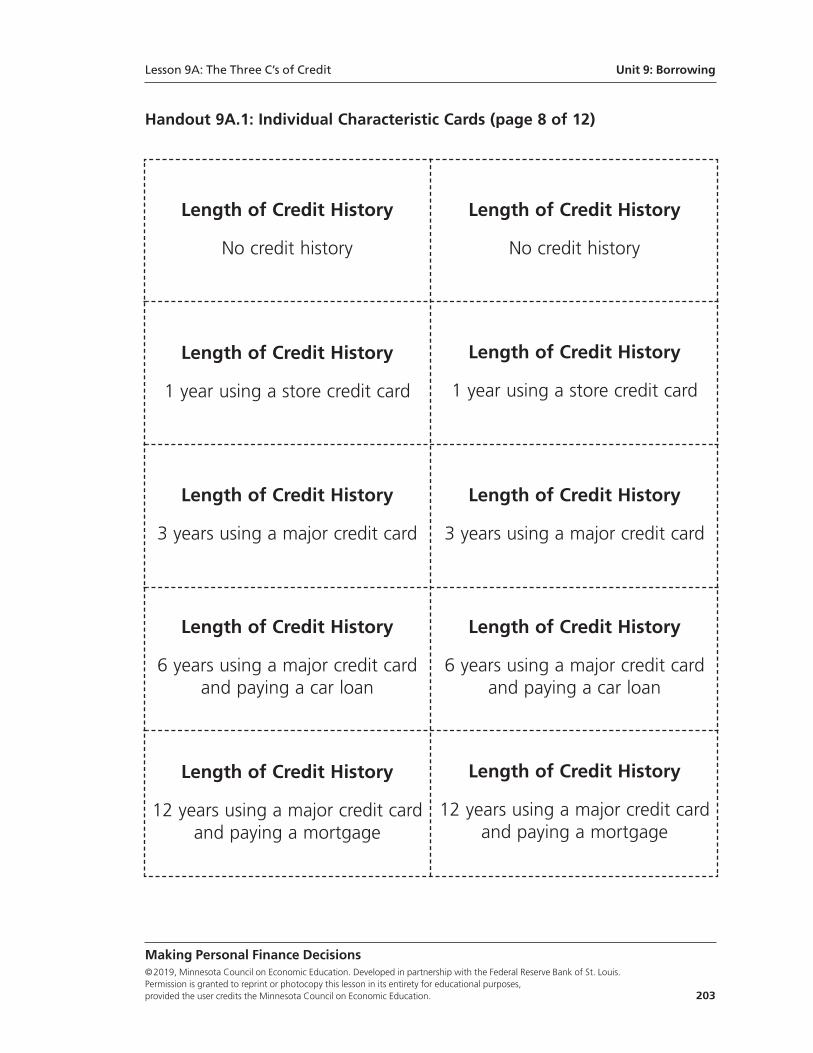
Handout 9A.1: Individual Characteristic Cards (page 8 of 12)
Making Personal Finance Decisions©2019, Minnesota Council on Economic Education. Developed in partnership with the Federal Reserve Bank of St. Louis. Permission is granted to reprint or photocopy this lesson in its entirety for educational purposes, provided the user credits the Minnesota Council on Economic Education. 203
Length of Credit History
No credit history
Length of Credit History
No credit history
Length of Credit History
1 year using a store credit card
Length of Credit History
1 year using a store credit card
Length of Credit History
3 years using a major credit card
Length of Credit History
3 years using a major credit card
Length of Credit History
6 years using a major credit cardand paying a car loan
Length of Credit History
6 years using a major credit cardand paying a car loan
Length of Credit History
12 years using a major credit cardand paying a mortgage
Length of Credit History
12 years using a major credit cardand paying a mortgage
Lesson 9A: The Three C’s of Credit Unit 9: Borrowing
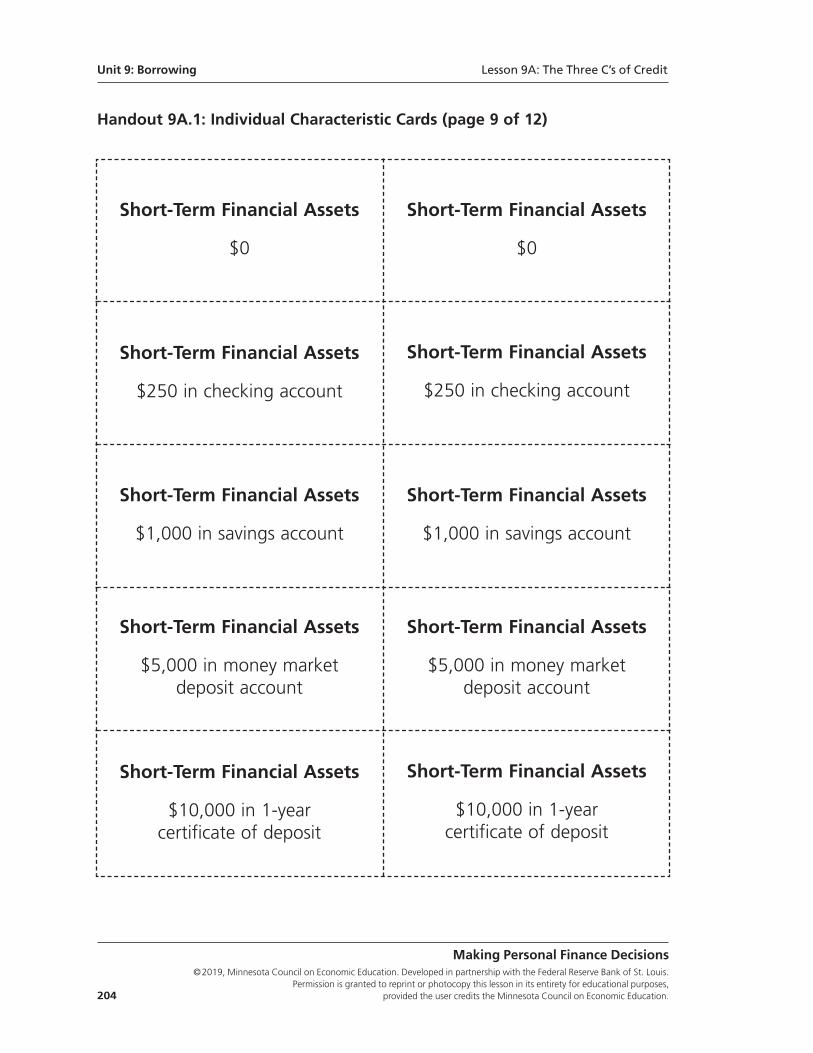
Unit 9: Borrowing Lesson 9A: The Three C’s of Credit
Making Personal Finance Decisions©2019, Minnesota Council on Economic Education. Developed in partnership with the Federal Reserve Bank of St. Louis.
Permission is granted to reprint or photocopy this lesson in its entirety for educational purposes, 204 provided the user credits the Minnesota Council on Economic Education.
Handout 9A.1: Individual Characteristic Cards (page 9 of 12)
Short-Term Financial Assets
$0
Short-Term Financial Assets
$0
Short-Term Financial Assets
$250 in checking account
Short-Term Financial Assets
$250 in checking account
Short-Term Financial Assets
$1,000 in savings account
Short-Term Financial Assets
$1,000 in savings account
Short-Term Financial Assets
$5,000 in money marketdeposit account
Short-Term Financial Assets
$5,000 in money marketdeposit account
Short-Term Financial Assets
$10,000 in 1-yearcertificate of deposit
Short-Term Financial Assets
$10,000 in 1-yearcertificate of deposit
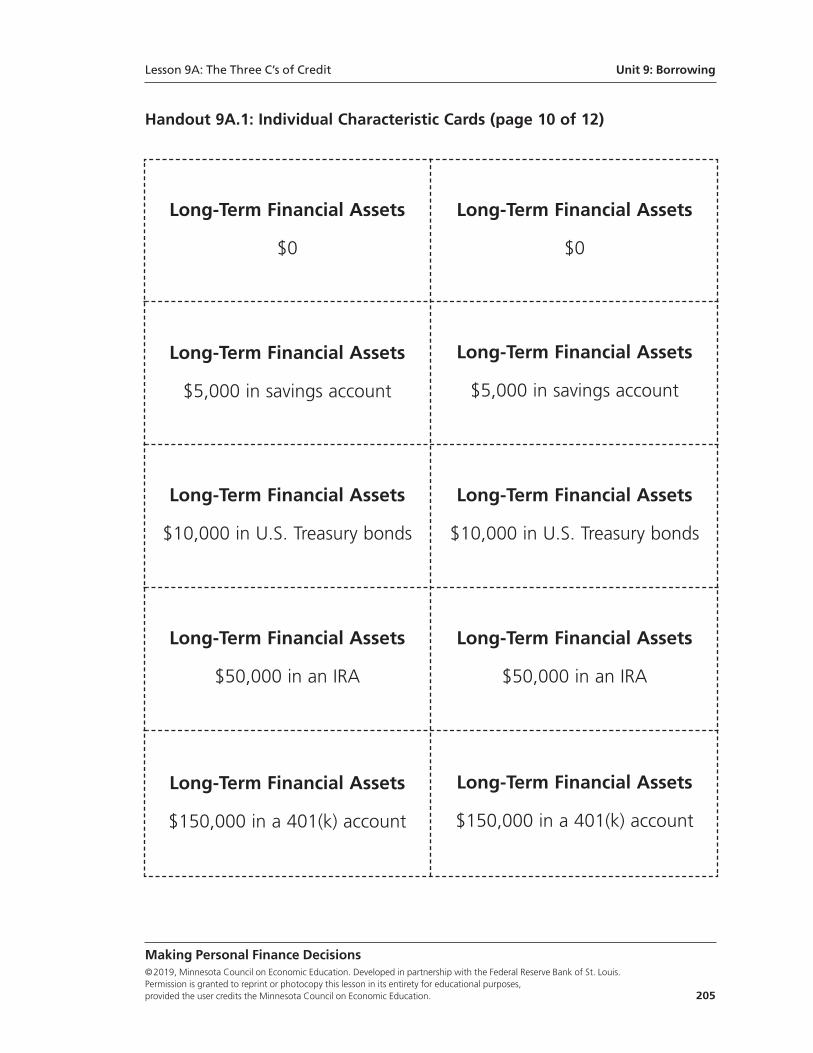
Lesson 9A: The Three C’s of Credit Unit 9: Borrowing
Making Personal Finance Decisions©2019, Minnesota Council on Economic Education. Developed in partnership with the Federal Reserve Bank of St. Louis. Permission is granted to reprint or photocopy this lesson in its entirety for educational purposes, provided the user credits the Minnesota Council on Economic Education. 205
Handout 9A.1: Individual Characteristic Cards (page 10 of 12)
Long-Term Financial Assets
$0
Long-Term Financial Assets
$0
Long-Term Financial Assets
$5,000 in savings account
Long-Term Financial Assets
$5,000 in savings account
Long-Term Financial Assets
$10,000 in U.S. Treasury bonds
Long-Term Financial Assets
$10,000 in U.S. Treasury bonds
Long-Term Financial Assets
$50,000 in an IRA
Long-Term Financial Assets
$50,000 in an IRA
Long-Term Financial Assets
$150,000 in a 401(k) account
Long-Term Financial Assets
$150,000 in a 401(k) account
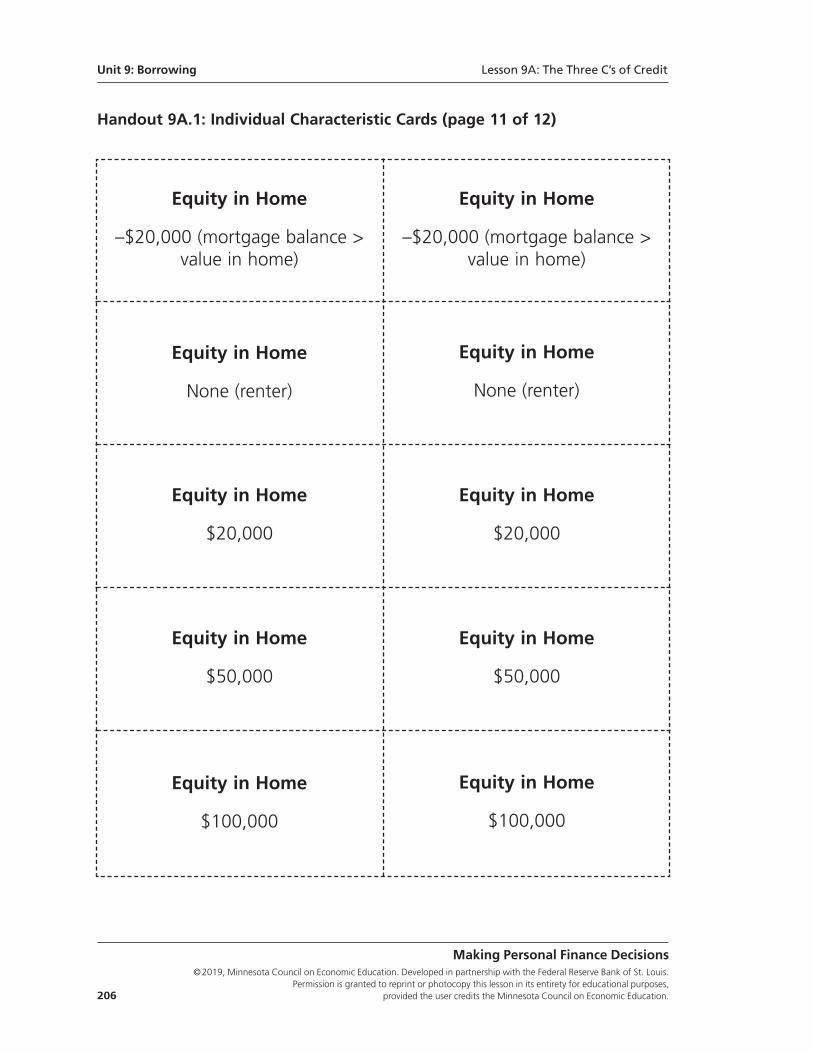
Unit 9: Borrowing Lesson 9A: The Three C’s of Credit
Making Personal Finance Decisions©2019, Minnesota Council on Economic Education. Developed in partnership with the Federal Reserve Bank of St. Louis.
Permission is granted to reprint or photocopy this lesson in its entirety for educational purposes, 206 provided the user credits the Minnesota Council on Economic Education.
Handout 9A.1: Individual Characteristic Cards (page 11 of 12)
Equity in Home
–$20,000 (mortgage balance >value in home)
Equity in Home
–$20,000 (mortgage balance >value in home)
Equity in Home
None (renter)
Equity in Home
None (renter)
Equity in Home
$20,000
Equity in Home
$20,000
Equity in Home
$50,000
Equity in Home
$50,000
Equity in Home
$100,000
Equity in Home
$100,000
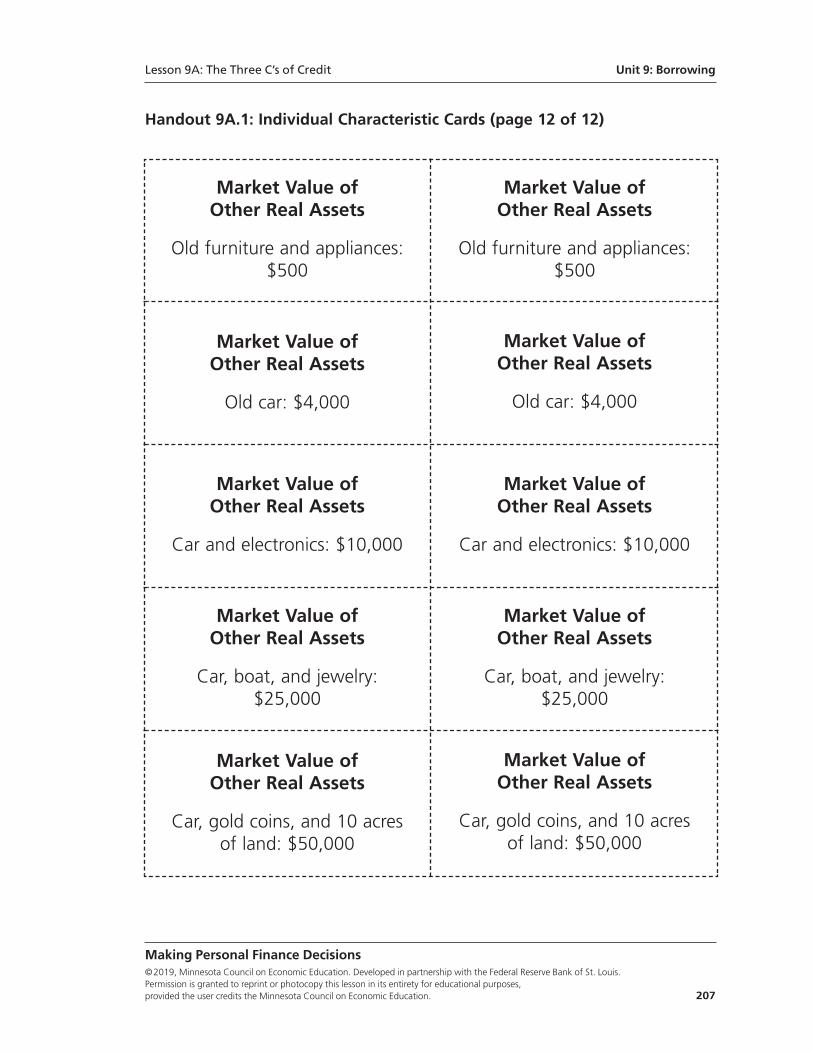
Lesson 9A: The Three C’s of Credit Unit 9: Borrowing
Making Personal Finance Decisions©2019, Minnesota Council on Economic Education. Developed in partnership with the Federal Reserve Bank of St. Louis. Permission is granted to reprint or photocopy this lesson in its entirety for educational purposes, provided the user credits the Minnesota Council on Economic Education. 207
Handout 9A.1: Individual Characteristic Cards (page 12 of 12)
Market Value ofOther Real Assets
Old furniture and appliances:$500
Market Value ofOther Real Assets
Old furniture and appliances:$500
Market Value ofOther Real Assets
Old car: $4,000
Market Value ofOther Real Assets
Old car: $4,000
Market Value ofOther Real Assets
Car and electronics: $10,000
Market Value ofOther Real Assets
Car and electronics: $10,000
Market Value ofOther Real Assets
Car, boat, and jewelry: $25,000
Market Value ofOther Real Assets
Car, boat, and jewelry: $25,000
Market Value ofOther Real Assets
Car, gold coins, and 10 acres of land: $50,000
Market Value ofOther Real Assets
Car, gold coins, and 10 acres of land: $50,000
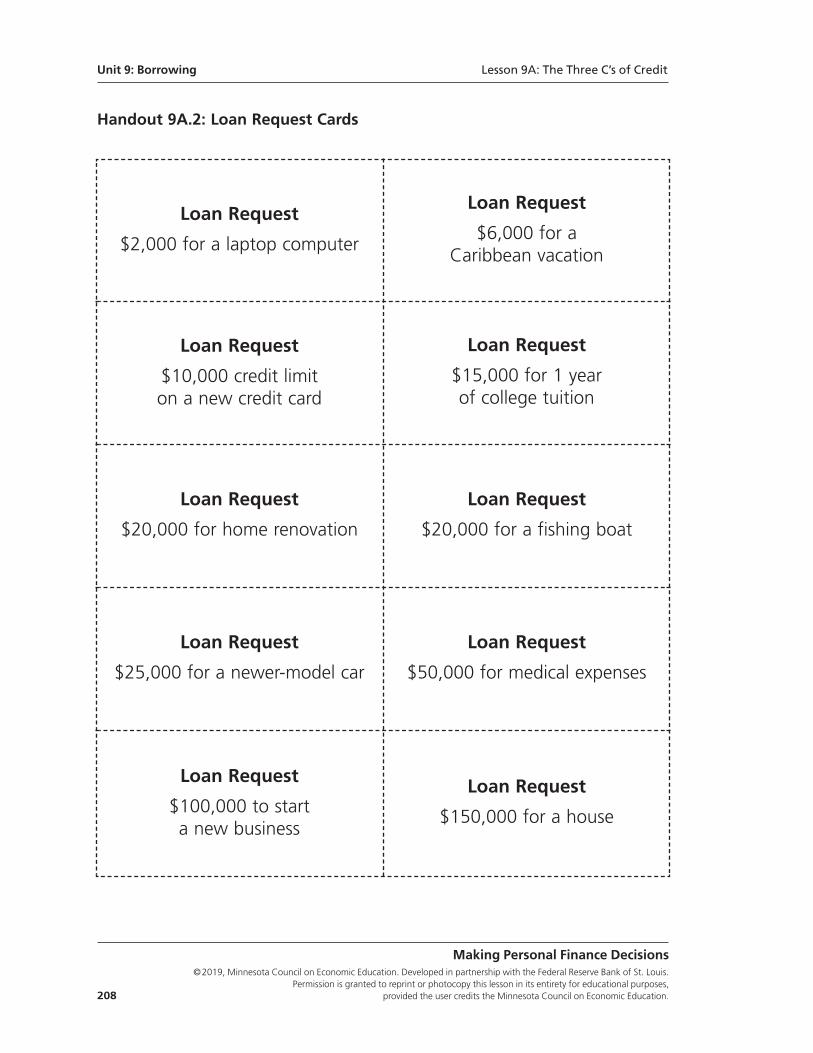
Unit 9: Borrowing Lesson 9A: The Three C’s of Credit
Making Personal Finance Decisions©2019, Minnesota Council on Economic Education. Developed in partnership with the Federal Reserve Bank of St. Louis.
Permission is granted to reprint or photocopy this lesson in its entirety for educational purposes, 208 provided the user credits the Minnesota Council on Economic Education.
Handout 9A.2: Loan Request Cards
Loan Request
$2,000 for a laptop computer
Loan Request
$6,000 for a Caribbean vacation
Loan Request
$10,000 credit limit on a new credit card
Loan Request
$15,000 for 1 year of college tuition
Loan Request
$20,000 for home renovation
Loan Request
$20,000 for a fishing boat
Loan Request
$25,000 for a newer-model car
Loan Request
$50,000 for medical expenses
Loan Request
$100,000 to start a new business
Loan Request
$150,000 for a house
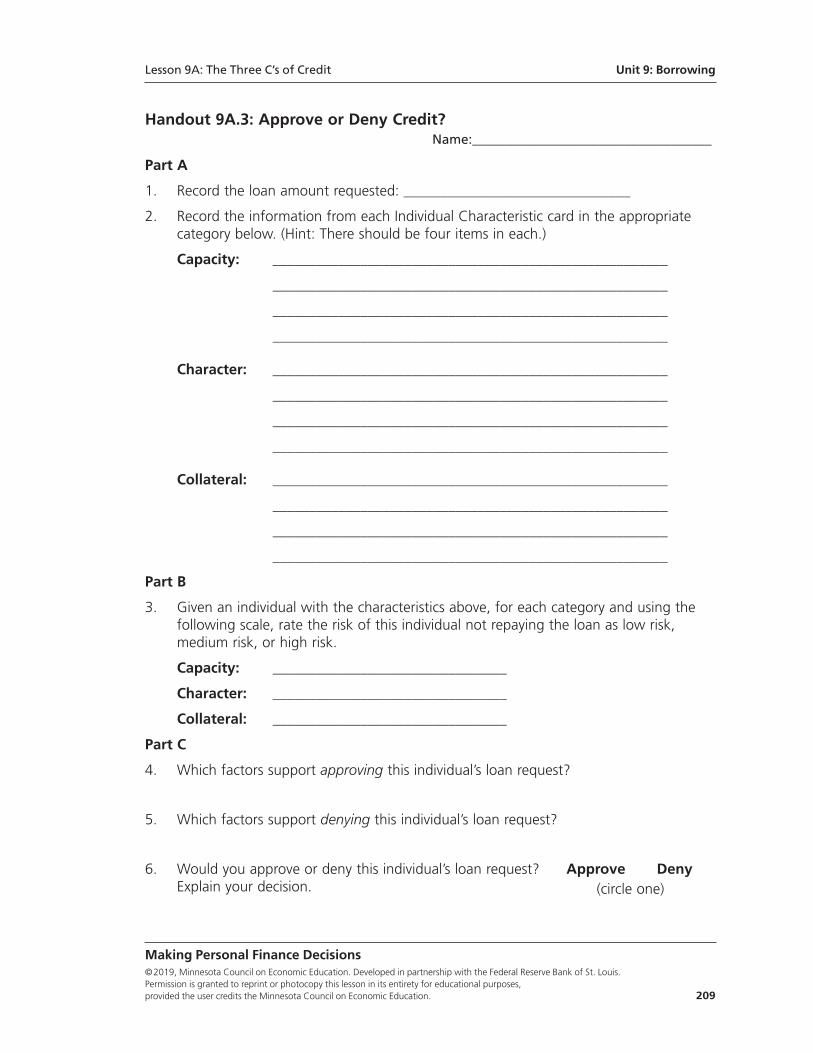
Lesson 9A: The Three C’s of Credit Unit 9: Borrowing
Making Personal Finance Decisions©2019, Minnesota Council on Economic Education. Developed in partnership with the Federal Reserve Bank of St. Louis. Permission is granted to reprint or photocopy this lesson in its entirety for educational purposes, provided the user credits the Minnesota Council on Economic Education. 209
Handout 9A.3: Approve or Deny Credit?Name:____________________________________
Part A
1. Record the loan amount requested: _______________________________
2. Record the information from each Individual Characteristic card in the appropriate category below. (Hint: There should be four items in each.)
Capacity: ______________________________________________________
______________________________________________________
______________________________________________________
______________________________________________________
Character: ______________________________________________________
______________________________________________________
______________________________________________________
______________________________________________________
Collateral: ______________________________________________________
______________________________________________________
______________________________________________________
______________________________________________________
Part B
3. Given an individual with the characteristics above, for each category and using the following scale, rate the risk of this individual not repaying the loan as low risk, medium risk, or high risk.
Capacity: ________________________________
Character: ________________________________
Collateral: ________________________________
Part C
4. Which factors support approving this individual’s loan request?
5. Which factors support denying this individual’s loan request?
6. Would you approve or deny this individual’s loan request? Approve DenyExplain your decision. (circle one)
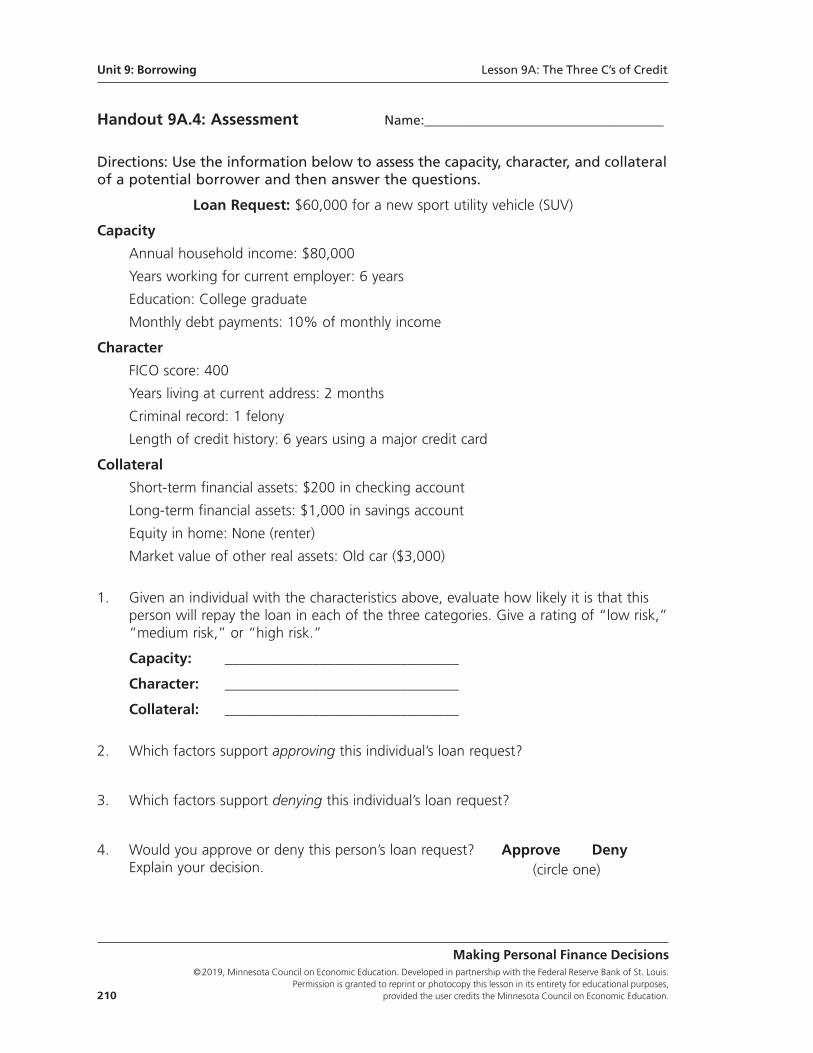
Handout 9A.4: Assessment Name:____________________________________
Directions: Use the information below to assess the capacity, character, and collateralof a potential borrower and then answer the questions.
Loan Request: $60,000 for a new sport utility vehicle (SUV)
Capacity
Annual household income: $80,000
Years working for current employer: 6 years
Education: College graduate
Monthly debt payments: 10% of monthly income
Character
FICO score: 400
Years living at current address: 2 months
Criminal record: 1 felony
Length of credit history: 6 years using a major credit card
Collateral
Short-term financial assets: $200 in checking account
Long-term financial assets: $1,000 in savings account
Equity in home: None (renter)
Market value of other real assets: Old car ($3,000)
1. Given an individual with the characteristics above, evaluate how likely it is that this person will repay the loan in each of the three categories. Give a rating of “low risk,”“medium risk,” or “high risk.”
Capacity: ________________________________
Character: ________________________________
Collateral: ________________________________
2. Which factors support approving this individual’s loan request?
3. Which factors support denying this individual’s loan request?
4. Would you approve or deny this person’s loan request? Approve DenyExplain your decision.
Unit 9: Borrowing Lesson 9A: The Three C’s of Credit
Making Personal Finance Decisions©2019, Minnesota Council on Economic Education. Developed in partnership with the Federal Reserve Bank of St. Louis.
Permission is granted to reprint or photocopy this lesson in its entirety for educational purposes, 210 provided the user credits the Minnesota Council on Economic Education.
(circle one)
Standards and Benchmarks
National Standards for Financial Literacy
Standard 4: Using Credit. Credit allows people to purchase goods and services that theycan use today and pay for those goods and services in the future with interest. People chooseamong different credit options that have different costs. Lenders approve or deny applica-tions for loans based on an evaluation of the borrower’s past credit history and expectedability to pay in the future. Higher-risk borrowers are charged higher interest rates; lower-risk borrowers are charged lower interest rates.
• Benchmark: Grade 4
4. Borrowers who repay loans as promised show that they are worthy of getting credit in the future. A reputation for not repaying a loan as promised can result in higher interest charges on future loans, if loans are available at all.
• Benchmark: Grade 12
3. Loans can be unsecured or secured with collateral. Collateral is a piece of property that can be sold by the lender to recover all or part of a loan if the borrower fails to repay. Because secured loans are viewed as having less risk,lenders charge a lower interest rate than they charge for unsecured loans.
5. Lenders make credit decisions based in part on consumer payment history. Credit bureaus record borrowers’ credit and payment histories and provide that information to lenders in credit reports.
6. Lenders can pay to receive a borrower’s credit score from a credit bureau. A credit score is a number based on information in a credit report and assesses a person’s credit risk.
Lesson 9A: The Three C’s of Credit Unit 9: Borrowing
Making Personal Finance Decisions©2019, Minnesota Council on Economic Education. Developed in partnership with the Federal Reserve Bank of St. Louis. Permission is granted to reprint or photocopy this lesson in its entirety for educational purposes, provided the user credits the Minnesota Council on Economic Education. 211
Unit 9: Borrowing
Making Personal Finance Decisions©2019, Minnesota Council on Economic Education. Developed in partnership with the Federal Reserve Bank of St. Louis.
Permission is granted to reprint or photocopy this lesson in its entirety for educational purposes, 212 provided the user credits the Minnesota Council on Economic Education.
Lesson 9B:
Evaluating the Benefits and Costs of Credit
Lesson DescriptionStudents are introduced to different types of credit and discuss some of the benefitsand costs of credit. They then consider how borrowing affects a person’s net worth.
Standards and Benchmarks (see page 223)
Grade Level9-12
ConceptsAssets
Borrow
Credit
Interest
Liabilities
Net worth
Compelling QuestionHow does using credit affect net worth?
Making Personal Finance Decisions©2019, Minnesota Council on Economic Education. Developed in partnership with the Federal Reserve Bank of St. Louis. Permission is granted to reprint or photocopy this lesson in its entirety for educational purposes, provided the user credits the Minnesota Council on Economic Education. 213
Rule 9: Pay on time and in full.While borrowing has both benefits and costs, at times it is an indication that somethinghas gone wrong with your financial planning (spending too much and/or saving toolittle relative to your income). These lessons look at borrowing from both the lender’sand the borrower’s perspectives and discuss why it is wise to use credit sparingly andmanage the use of credit.
Unit 9
Borrowing
ObjectivesStudents will be able to
• describe various types of loans or credit,
• describe some of the benefits and costs of credit, and
• determine how credit decisions are likely to impact their net worth over time.
Materials• Visual 9B.1: Types of Credit
• Handout 9B.1: Are These Goods Worth Buying With Credit?, one copy for eachstudent and one for the teacher to use as a visual
• Handout 9B.1: Are These Goods Worth Buying With Credit?—Answer Key
• Handout 9B.2: Assessment, one copy for each student
Time45 minutes
Procedure1. Begin the lesson by asking the following:
• If you borrow a video game from a friend, what does that friend likely expect?(Answers will vary, but students may say something like the friend will let themuse it for a certain period and expect them to return it.)
2. Explain the following:
• When you borrow money, there are expectations similar to borrowing somethingfrom a friend, but the process is typically more formal and costly.
• When you borrow money, you take it with the promise to repay it, usually withinterest, in the future.
• For example, for formal loans from a financial institution, your promise takes theform of a contract that lays out the terms of the loan.
• Interest is the price of using someone else’s money. That is, it is an additionalpayment of money for the right to use someone else’s money.
• Credit is the granting or money (or something else of value) in exchange for apromise of future repayment.
• You have credit when an institution approves an amount that you can borrow
Making Personal Finance Decisions©2019, Minnesota Council on Economic Education. Developed in partnership with the Federal Reserve Bank of St. Louis.
Permission is granted to reprint or photocopy this lesson in its entirety for educational purposes, 214 provided the user credits the Minnesota Council on Economic Education.
Unit 9: Borrowing Lesson 9B: Evaluating the Benefits and Costs of Credit
from them. For example, a credit card company may extend you credit by provid-ing you a credit card with a limit up to $1,000. You can then use that card toborrow up to $1,000 at any time. If you pay your credit card balance in full eachmonth, you pay no interest. However, if you don’t pay the balance in full eachmonth, you pay interest and perhaps fees.
3. Display Visual 9B.1: Types of Credit and review the different types. Discuss the following:
• What are some benefits of borrowing money (or using credit)? (Answers will varybut may include the following: getting goods and services now instead of later,paying for emergency expenses, enjoying payment convenience, getting in on adeal that may not be available later, acquiring assets that will increase your networth over time, building a credit record/history, it is less costly than using investedfunds, and so on.)
• What are some costs of borrowing money (or using credit)? (Answers will varybut may include the following: finance charges [interest plus any fees], creatingdebt and lowering your net worth, having less money to purchase goods andservices in the future, having less credit available in case of an emergency, havinggreater exposure to identity theft, and so on.)
4. Explain that all these benefits and costs should be considered when deciding whetherto use credit. The remainder of the lesson will focus on the impact of credit on a per-son’s net worth, which may not be as obvious as some of the other benefits and costs.
5. Remind students that a person’s net worth is the value of that person’s assets minusthe value of his or her liabilities. Assets are things that you own such as a house, stocks,bonds, jewelry, cash, money in a savings account, cars, or coins. Your liabilities arethings you owe, such as unpaid bills, a mortgage, a car loan, or unpaid taxes. (SeeUnit 2: Planning and Tracking.) Discuss the following:
• What are some examples of assets? (Answers will vary but may include houses,cars, gold coins, computers, jewelry, televisions, savings accounts, stocks, bonds,cash, and so on.)
• What are some examples of liabilities, or debt? (Answers will vary but may includehome mortgages, car loans, student loans, unpaid credit card balances, unpaidtaxes, and so on.)
6. Explain the following:
• Typically, people wish to grow their net worth, or wealth, over time because itincreases their financial security.
• One way to assess the desirability of taking out a loan or getting credit is toconsider how it will affect your net worth over time.
• Taking out a loan adds immediately to your debt, or liabilities, which has a nega-
Making Personal Finance Decisions©2019, Minnesota Council on Economic Education. Developed in partnership with the Federal Reserve Bank of St. Louis. Permission is granted to reprint or photocopy this lesson in its entirety for educational purposes, provided the user credits the Minnesota Council on Economic Education. 215
Lesson 9B: Evaluating the Benefits and Costs of Credit Unit 9: Borrowing
tive impact on your net worth.
• The question to ask is whether a loan or credit increases the value of your assetsenough over time to offset the initial increase in your liabilities (plus any futurefinance costs).
7. Distribute a copy of Handout 9B.1: Are These Worth Buying With Credit? to each student. Tell the students they are going to evaluate the current and possible futureeffects of using a loan or credit for various purchases. Review the directions and instructthe students to complete the handout individually (or assign groups). Allow time forstudents to complete the handout and then review answers as time permits.
8. Display Handout 9B.1—Answer Key and have students check their answers. Furtherexplain answers if necessary as follows:
• House: A house is an asset. The market value of houses has historically risenover time; however, it can also fall. (Note: Housing prices in many areas of thecountry did fall during the 2007-08 financial crisis.)
• Vacation: Using credit for a vacation does not create an asset now or in thefuture. Having to pay off the loan in the future will decrease your assets.
• Education: Although education is not a financial asset, because education buildsa person’s human capital, it is likely to lead to higher future income and a betterability to acquire assets in the future.
• Car: A car is an asset, but its market value tends to fall (depreciate) very quickly.If a car enables you to earn income (get to work), it could lead to a better abilityto acquire assets in the future.
• Furniture: Furniture is an asset; however, its market value tends to fall over time.
• Pizza: Buying and eating a pizza does not create an asset now or in the future.Having to pay off the credit card balance in the future will decrease your assets.
• Electronic gaming system: An electronic gaming system is an asset; however,its market value tends to fall very quickly. Having to pay off the credit card balancein the future will decrease you assets.
• Gasoline: Buying gasoline does not create an asset now or in the future. How -ever, you may need gasoline to travel to work. Having to pay off the credit cardbalance in the future (if you do not pay the balance in full each month) willdecrease your future assets.
9. Discuss the following:
• Which of the purchases on Handout 9B:1 seem like reasonable uses of creditregarding the future impact on assets? (Loans for a house and education are likelyto have long-term positive impacts on the value of your assets and net worth. Acar is a special case where a depreciating asset may be worth buying with credit.
Making Personal Finance Decisions©2019, Minnesota Council on Economic Education. Developed in partnership with the Federal Reserve Bank of St. Louis.
Permission is granted to reprint or photocopy this lesson in its entirety for educational purposes, 216 provided the user credits the Minnesota Council on Economic Education.
Unit 9: Borrowing Lesson 9B: Evaluating the Benefits and Costs of Credit
The other purchases would either not increase the value of your assets or wouldactually reduce it over time, decreasing your net worth.)
Closure10. Explain the following:
• With the exception of education, using credit for non-asset purchases (such as avacation, pizza, or cable TV service) will increase your liabilities and lower yournet worth.
• Similarly, except perhaps for a car, using credit to purchase assets that tend to fallin value (depreciate) quickly over time (such as furniture or an electronic gamingsystem) would also likely lower your net worth over time (as the loan balancewould likely exceed the value of the asset). Unless there are other benefits tooffset the costs of such purchases, credit may not be in your best interest.
Assessment11. Distribute a copy of Handout 9B.2: Assessment to each student and allow time for
students to work (or assign as homework).
Handout 9B.2: Assessment—Answer Key
Frank is facing a choice. He wants both a newer car and to spend a month in Europe;each costs $6,000. He has decided he will use credit now for one of his options andsave his money for three years to pay for the other.
Option 1: Use credit now to purchase a newer car and save for a vacation in threeyears.
Option 2: Use credit now to pay for a European vacation and save to purchase anewer car in three years.
Explain to Frank how each option will affect his net worth and then make a recommen-dation for which option he should choose.
Option 1: Borrowing $6,000 to buy a car would increase Frank’s liabilities, but it wouldadd assets equal to the value of the car ($6,000 at the time of purchase). Because thecar has value, the purchase will have minimal impact on Frank’s net worth.
Option 2: Borrowing $6,000 to spend a month in Europe will increase Frank’s liabilities,and it would add $0 to his assets. It will have a negative effect on Frank’s net worth.
Based on the effects of spending on Frank’s net worth, students should advise Frankthat Option 1 is a better choice.
Making Personal Finance Decisions©2019, Minnesota Council on Economic Education. Developed in partnership with the Federal Reserve Bank of St. Louis. Permission is granted to reprint or photocopy this lesson in its entirety for educational purposes, provided the user credits the Minnesota Council on Economic Education. 217
Lesson 9B: Evaluating the Benefits and Costs of Credit Unit 9: Borrowing
Visual 9B.1: Types of Credit (page 1 of 2)
Service Credit• Issuers: utility services (e.g., water, electricity, or Internet)
• Receive services for a given period (usually a month) and pay at the endof that period
• No interest charged if bill is paid on time
Installment Credit• Issuers: stores or companies
• Buy goods or services with equal payments over a set period (e.g., a year)
• Down payment often required
• Finance charges (interest) possible
• Example: Purchase a $700 bicycle at a bike shop and pay $100 (the downpayment) and $55 per month for a year at a 10% interest rate ($600 × 0.10= $60 and $660/12 = $55)
Charge Card• Issuers: stores or companies (e.g., American Express and department store
charge cards)
• Buy goods or services and repay in full at the end of the month
• Generally interest free
• Often an annual fee
Credit Card• Issuers: stores or companies (e.g., MasterCard, Discover, and VISA)
• Buy goods and services up to a given dollar limit, with a minimum paymentdue each month
• No interest charged if paid in full at the end of the month; interest chargedthe next month on the unpaid balance
• May have an annual fee
Making Personal Finance Decisions©2019, Minnesota Council on Economic Education. Developed in partnership with the Federal Reserve Bank of St. Louis.
Permission is granted to reprint or photocopy this lesson in its entirety for educational purposes, 218 provided the user credits the Minnesota Council on Economic Education.
Unit 9: Borrowing Lesson 9B: Evaluating the Benefits and Costs of Credit
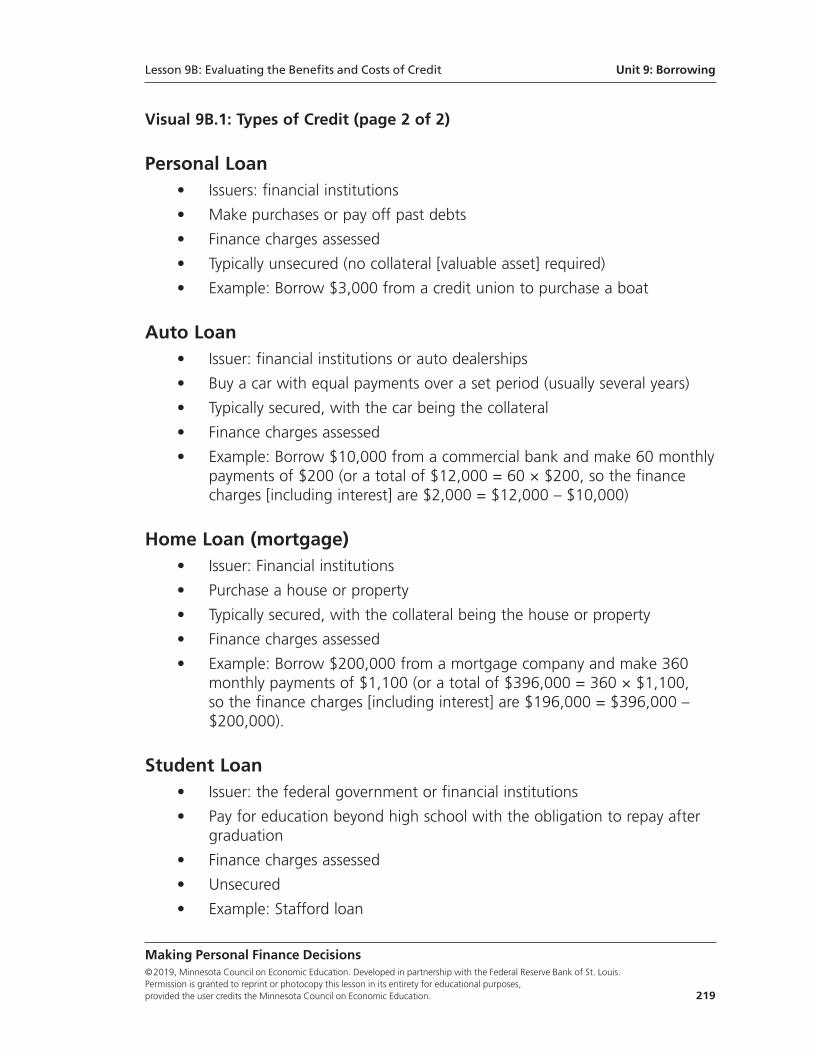
Visual 9B.1: Types of Credit (page 2 of 2)
Personal Loan• Issuers: financial institutions
• Make purchases or pay off past debts
• Finance charges assessed
• Typically unsecured (no collateral [valuable asset] required)
• Example: Borrow $3,000 from a credit union to purchase a boat
Auto Loan• Issuer: financial institutions or auto dealerships
• Buy a car with equal payments over a set period (usually several years)
• Typically secured, with the car being the collateral
• Finance charges assessed
• Example: Borrow $10,000 from a commercial bank and make 60 monthlypayments of $200 (or a total of $12,000 = 60 × $200, so the financecharges [including interest] are $2,000 = $12,000 – $10,000)
Home Loan (mortgage)• Issuer: Financial institutions
• Purchase a house or property
• Typically secured, with the collateral being the house or property
• Finance charges assessed
• Example: Borrow $200,000 from a mortgage company and make 360monthly payments of $1,100 (or a total of $396,000 = 360 × $1,100, so the finance charges [including interest] are $196,000 = $396,000 –$200,000).
Student Loan• Issuer: the federal government or financial institutions
• Pay for education beyond high school with the obligation to repay aftergraduation
• Finance charges assessed
• Unsecured
• Example: Stafford loan
Making Personal Finance Decisions©2019, Minnesota Council on Economic Education. Developed in partnership with the Federal Reserve Bank of St. Louis. Permission is granted to reprint or photocopy this lesson in its entirety for educational purposes, provided the user credits the Minnesota Council on Economic Education. 219
Lesson 9B: Evaluating the Benefits and Costs of Credit Unit 9: Borrowing
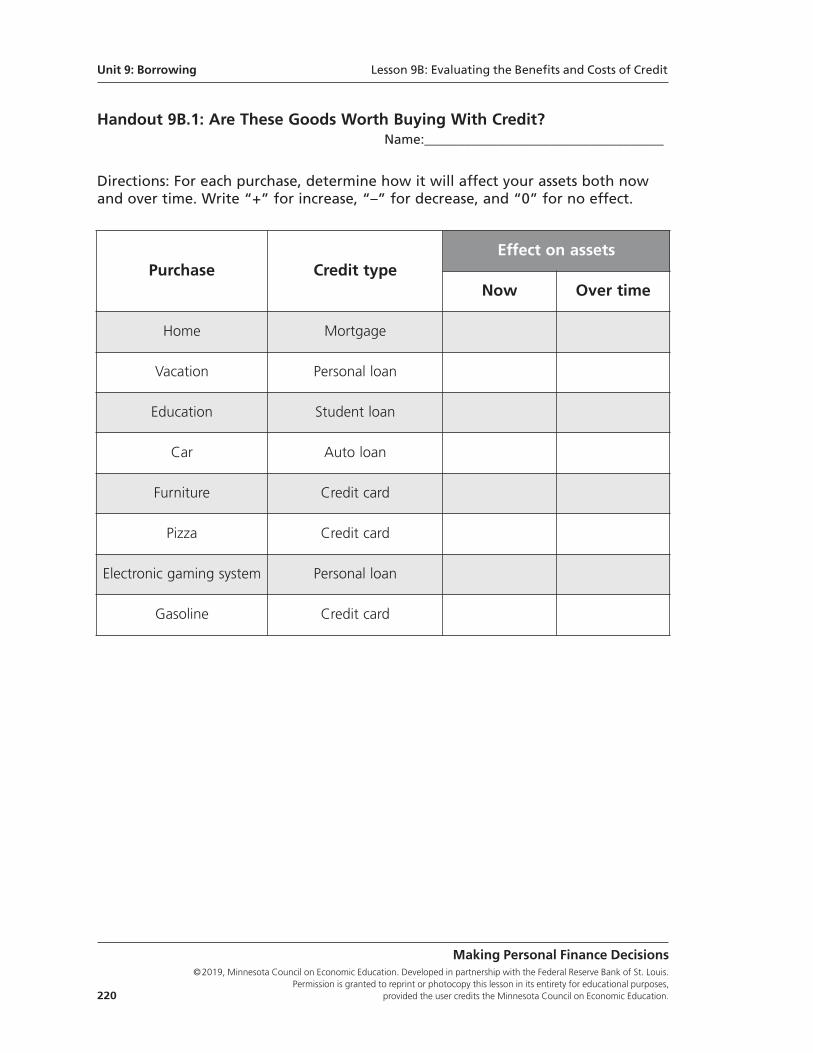
Handout 9B.1: Are These Goods Worth Buying With Credit?Name:____________________________________
Directions: For each purchase, determine how it will affect your assets both nowand over time. Write “+” for increase, “–” for decrease, and “0” for no effect.
Making Personal Finance Decisions©2019, Minnesota Council on Economic Education. Developed in partnership with the Federal Reserve Bank of St. Louis.
Permission is granted to reprint or photocopy this lesson in its entirety for educational purposes, 220 provided the user credits the Minnesota Council on Economic Education.
Purchase Credit typeEffect on assets
Now Over time
Home Mortgage
Vacation Personal loan
Education Student loan
Car Auto loan
Furniture Credit card
Pizza Credit card
Electronic gaming system Personal loan
Gasoline Credit card
Unit 9: Borrowing Lesson 9B: Evaluating the Benefits and Costs of Credit
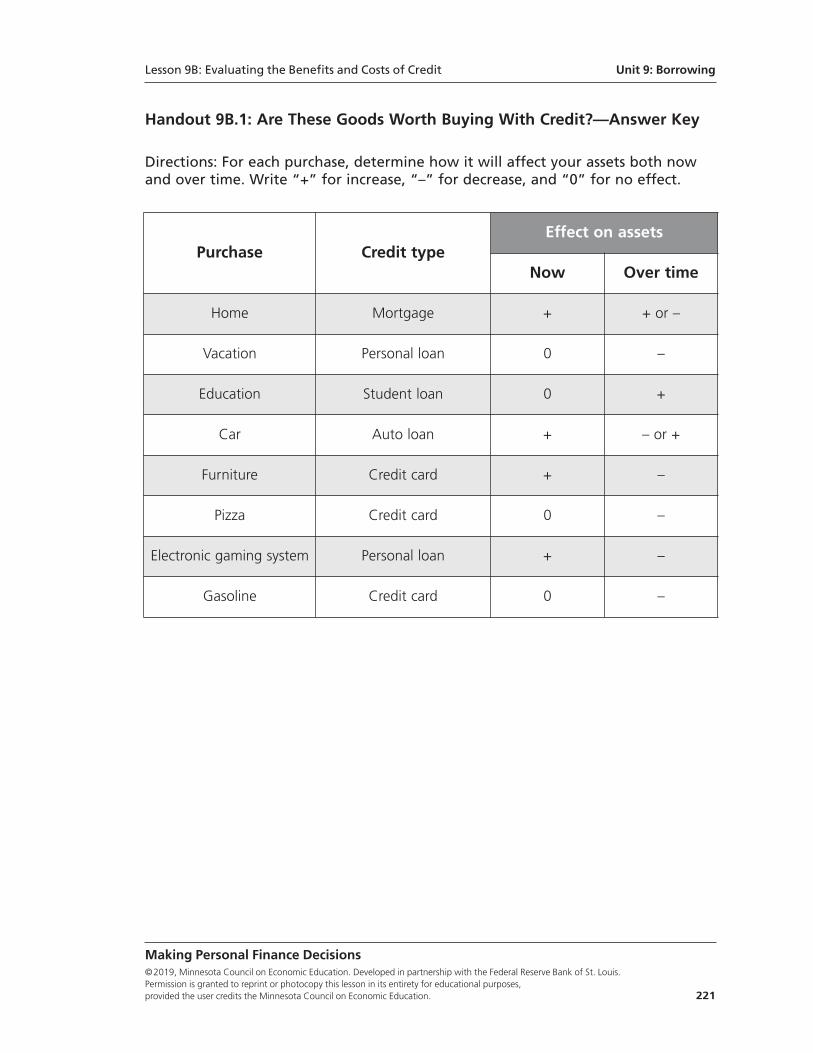
Handout 9B.1: Are These Goods Worth Buying With Credit?—Answer Key
Directions: For each purchase, determine how it will affect your assets both nowand over time. Write “+” for increase, “–” for decrease, and “0” for no effect.
Making Personal Finance Decisions©2019, Minnesota Council on Economic Education. Developed in partnership with the Federal Reserve Bank of St. Louis. Permission is granted to reprint or photocopy this lesson in its entirety for educational purposes, provided the user credits the Minnesota Council on Economic Education. 221
Purchase Credit typeEffect on assets
Now Over time
Home Mortgage + + or –
Vacation Personal loan 0 –
Education Student loan 0 +
Car Auto loan + – or +
Furniture Credit card + –
Pizza Credit card 0 –
Electronic gaming system Personal loan + –
Gasoline Credit card 0 –
Lesson 9B: Evaluating the Benefits and Costs of Credit Unit 9: Borrowing
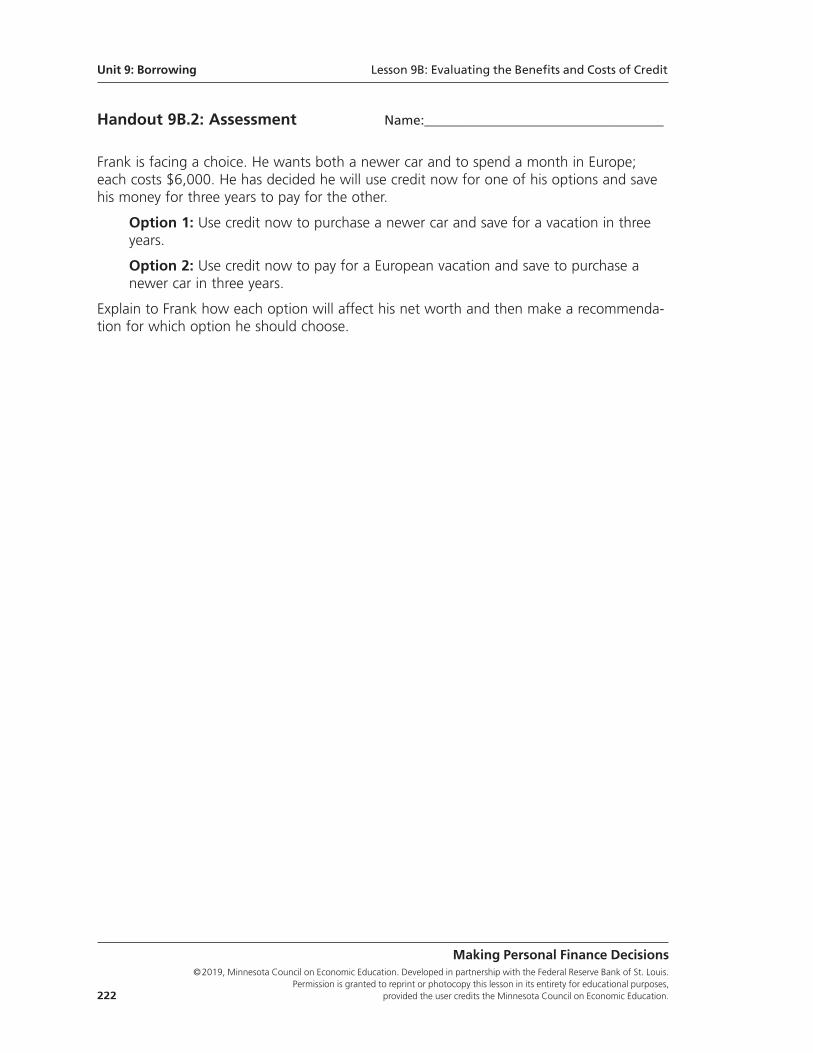
Handout 9B.2: Assessment Name:____________________________________
Frank is facing a choice. He wants both a newer car and to spend a month in Europe;each costs $6,000. He has decided he will use credit now for one of his options and savehis money for three years to pay for the other.
Option 1: Use credit now to purchase a newer car and save for a vacation in three years.
Option 2: Use credit now to pay for a European vacation and save to purchase a newer car in three years.
Explain to Frank how each option will affect his net worth and then make a recommenda-tion for which option he should choose.
Making Personal Finance Decisions©2019, Minnesota Council on Economic Education. Developed in partnership with the Federal Reserve Bank of St. Louis.
Permission is granted to reprint or photocopy this lesson in its entirety for educational purposes, 222 provided the user credits the Minnesota Council on Economic Education.
Unit 9: Borrowing Lesson 9B: Evaluating the Benefits and Costs of Credit
Standards and Benchmarks
National Standards for Financial Literacy
Standard 4: Using Credit. Credit allows people to purchase goods and services that theycan use today and pay for those goods and services in the future with interest. People chooseamong different credit options that have different costs. Lenders approve or deny applica-tions for loans based on an evaluation of the borrower’s past credit history and expectedability to pay in the future. Higher-risk borrowers are charged higher interest rates; lower-risk borrowers are charged lower interest rates.
• Benchmark: Grade 4
2. When people use credit, they receive something of value now and agree torepay the lender over time, or at some date in the future, with interest.
• Benchmark: Grade 8
4. Borrowers who use credit cards for purchases and who do not pay the full balance when it is due pay much higher costs for their purchases because interest is charged monthly. A credit card user can avoid interest charges bypaying the entire balance within the grace period specified by the financial institution.
8. People can use credit to finance investments in education and housing. Thebenefits of using credit in this way are spread out over a period of time andmay be large. The large costs of acquiring the education or housing are spread out over time as well. The benefits of using credit to make daily pur-chases of food or clothing are short-lived and do not accumulate over time.
• Benchmark: Grade 12
3. Loans can be unsecured or secured with collateral. Collateral is a piece of property that can be sold by the lender to recover all or part of a loan if the borrower fails to repay. Because secured loans are viewed as having less risk,lenders charge a lower interest rate than they charge for unsecured loans.
11. People often apply for a mortgage to purchase a home. A mortgage is a type of loan that is secured by real estate property as collateral.
Making Personal Finance Decisions©2019, Minnesota Council on Economic Education. Developed in partnership with the Federal Reserve Bank of St. Louis. Permission is granted to reprint or photocopy this lesson in its entirety for educational purposes, provided the user credits the Minnesota Council on Economic Education. 223
Lesson 9B: Evaluating the Benefits and Costs of Credit Unit 9: Borrowing

Making Personal Finance Decisions©2019, Minnesota Council on Economic Education. Developed in partnership with the Federal Reserve Bank of St. Louis.
Permission is granted to reprint or photocopy this lesson in its entirety for educational purposes, 224 provided the user credits the Minnesota Council on Economic Education.
Lesson 10A:
The Three D’s of Identity Theft
Lesson DescriptionStudents are introduced to various options for deterring and detecting identity theft.They then play a game about identity protection. They choose ways to protect theiridentity and then face random events where their identity will either remain safe orbe stolen. They learn that 100% identity protection is not possible and ways to defendthemselves if identity theft occurs.
Standards and Benchmarks (see page 242)
Grade Level9-12
ConceptsIdentity theft
The three D’s of identity theft: deter, detect, and defend
Phishing
Unit 10
Protecting
Making Personal Finance Decisions©2019, Minnesota Council on Economic Education. Developed in partnership with the Federal Reserve Bank of St. Louis. Permission is granted to reprint or photocopy this lesson in its entirety for educational purposes, provided the user credits the Minnesota Council on Economic Education. 225
Rule 10: Protect your finances.While financial risk is most often associated with investment risk, other risks can also keepyou from achieving your financial goals. For example, car accidents, medical issues, housefires, lawsuits, and theft (including identity theft) all represent potential obstacles. Theserisks can be managed by (i) reducing your potential exposure to identity theft or (ii) buyinginsurance. These lessons use games featuring random, unwelcome events to help studentsconsider ways to wisely manage risk.
Compelling QuestionHow can consumers reduce the risk of identity theft?
ObjectivesStudents will be able to
• identify strategies to protect their personal information,
• identify strategies used by identity thieves to steal their identity, and
• describe the three D’s of identity theft—deter, detect, and defend.
Materials• Visual 10A.1: Identity Protection Options
• Visual 10A.2: The Three D’s of Identity Theft
• Handout 10A.1: Safe or Not?
• Handout 10A.2: Events, one copy (21 events) cut apart for each group of fourto five students (or create larger groups if desired)
• Handout 10A.3: Deck One Cards, copied on colored paper and cut apart, withone copy for each group of four to five students (Each Deck One includes 19 SAFEcards and 1 IDENTITY STOLEN card.)
• Handout 10A.4: Deck Two Cards, copied on colored paper (a different color fromDeck One) and cut apart, with one copy for each group of four to five students(Each Deck Two includes 13 SAFE cards and 7 IDENTITY STOLEN cards.)
• Handout 10A.5: Assessment, one copy for each student
Time Required45 minutes
Procedure1. To begin the lesson, ask students what they know about “identity theft.” (Answers
will vary.)
2. Explain that identity theft is a form of stealing that results in someone gaining accessto another person’s personal information (such as name, address, driver’s license num-ber, credit card numbers, date of birth, birthplace, or Social Security number) to com-mit all or any of the following crimes:
Unit 10: Protecting Lesson 10A: The Three D’s of Identity Theft
Making Personal Finance Decisions©2019, Minnesota Council on Economic Education. Developed in partnership with the Federal Reserve Bank of St. Louis.
Permission is granted to reprint or photocopy this lesson in its entirety for educational purposes, 226 provided the user credits the Minnesota Council on Economic Education.
• gaining access to bank accounts to steal money,
• making purchases with credit or debit cards,
• opening credit, or
• engaging in other criminal behavior.
3. Explain that identity theft can be costly and time-consuming to correct and can haveadverse financial consequences, including
• loss of financial assets,
• a damaged credit score, and
• mistaken criminal charges.
4. Discuss the following:
• What types of personal information might be useful to an identity thief?(Answers will vary but may include Social Security numbers, computer passwords,credit and debit card numbers, personal identification numbers [PINs] for creditand debit accounts, banking account numbers, medical records, tax records,utility bill statements, and so on.)
5. Explain that one method identity thieves use to steal personal information is phishing.Phishing is when someone attempts to get your personal information by pretendingto work for a legitimate or legitimate-sounding organization, such as a bank or thegovernment. For example, you might get an email that looks like it is from your bankthat asks you to click a link and update your personal information, such as your pass-word, date of birth, or Social Security number. Explain that the principal way to protectyour personal information, is to deter thieves or detect their activities as quickly as pos-sible. Discuss the following:
• What are some ways to protect yourself from identity theft? (Answers will vary.See Visual 10A.1: Identity Protection Options for a list of ways.)
6. Display Visual 10A.1. Review each option. Discuss the following:
• What are some additional possibilities for protecting your identity? (Others mightinclude some noted earlier by students, plus using fewer paper checks, signingdebit and credit cards as soon as they are received, and checking receipts withbilling statements.)
7. Explain that doing all these things to protect your identity takes time, effort, and insome cases money (e.g., to buy a shredder or have a hard drive professionally erased).Because people’s time, effort, and money are limited, they are often unable to do allof these options all of the time.
Lesson 10A: The Three D’s of Identity Theft Unit 10: Protecting
Making Personal Finance Decisions©2019, Minnesota Council on Economic Education. Developed in partnership with the Federal Reserve Bank of St. Louis. Permission is granted to reprint or photocopy this lesson in its entirety for educational purposes, provided the user credits the Minnesota Council on Economic Education. 227
8. Distribute a copy of Handout 10A.1: Safe or Not? to each student. Tell the class thatthey are going to play a game called “Safe or Not?” using the protection options onVisual 10A.1.
9. Divide the class into small groups of four to five students (or create larger groups ifdesired). Give each group the following:
• One set of event strips from Handout 10A.2: Events. (Each set includes 21 strips).
• One set of shuffled Deck One cards from Handout 10A.3: Deck One Cards.(Each set includes 20 cards: 19 SAFE cards and 1 IDENTITY STOLEN card.)
• One set of shuffled Deck Two cards from Handout 10A.4: Deck Two Cards (Eachset should consist of 20 cards: 13 SAFE cards and 7 IDENTITY STOLEN cards).
10. Explain that since time, effort, and money are limited, as part of the game, each stu-dent may choose only 10 of the 20 protection options listed on Visual 10A.1. Instructthe students to write down the numbers of their choices in Part A of Handout 10A.1and a short description of each in their own words. Explain that the chances they willneed any of the listed protection options during the game are the same.
11. Explain the rules of the game as follows:
• There will be 10 rounds. At the end of each round, you will be either safe orhave your identity stolen. For each round, you will circle your outcome in Part Bof Handout 10A.1.
• At the beginning of each round, one student in each group will randomly selectan EVENT strip for the group and read it to the group.
• Each person in the group will then check to see whether you have the chosen aProtection Option that will protect you from the event selected for your group. Ifyou have the necessary Protection Option, you will draw a card from Deck One.If you do not have the necessary Protection Option, you will draw a card fromDeck Two. Moving to the right of the student who drew the event strip, eachgroup member is to draw from the appropriate deck. The cards will say either“SAFE” or “IDENTITY STOLEN.”
• Create discard piles for Deck One and Deck Two.
• Circle the outcome of each round on your handout.
• Even though you may have the necessary Protection Option, it is still possible todraw an “IDENTITY STOLEN” card from Deck One because no protection optionis likely to be followed 100% of the time and you can’t protect yourself fromsome events.
• Even though you might not have the necessary Protection Option and thereforemust draw from Deck Two, you still have a good chance of drawing a SAFE card,but there is a greater chance of drawing an IDENTITY STOLEN card.
Unit 10: Protecting Lesson 10A: The Three D’s of Identity Theft
Making Personal Finance Decisions©2019, Minnesota Council on Economic Education. Developed in partnership with the Federal Reserve Bank of St. Louis.
Permission is granted to reprint or photocopy this lesson in its entirety for educational purposes, 228 provided the user credits the Minnesota Council on Economic Education.
• One event has no Protection Option. If this event is drawn, all members of thegroup must draw from Deck Two.
• Once a deck is depleted, reshuffle and restack the cards.
(Teacher note: Given the number and types of cards in the decks, there is a 20%chance of drawing an IDENTITY STOLEN card and an 80% chance of drawing a SAFEcard. Note further that students are seven times more likely to have their identity stolenwithout protection than with it.)
12. Begin the game and have students record their results in Part B of Handout 10A.1.Play for 10 rounds.
13. After the game, instruct the students to complete Part C of Handout 10A.1. Allowstudents time to complete the assignment and then invite some students to share theiranswers.
Handout 10A.1: Safe or Not?—Part C Answer Key
1. How many times was your identity stolen?
Answers will vary.
2. Although it is important to protect your identity, explain why complete protectionis not possible.
Answers will vary but should be similar to the following: First, it is not possible to pursue every possible option to protect your identity. There is simply not enoughtime, effort, or money to do so. Second, it is not possible to be vigilant about identity protection 100% of the time—sometimes everyone lets his or her guarddown. Third, even when you have the necessary protection, you can still have your identity stolen. You simply can’t protect yourself against some events, such as a data breach at your bank or at a company you do business with.)
14. Display Visual 10A.2: The Three D’s of Identity Theft. Point out that the protectionoptions in the game represent two of the “Three D’s of Identity Theft.” Review thepoints under “Deter” and “Detect.” Explain that the third “D” is defend, whichrefers to actions to take if you suspect identity theft. Review the points under “Defend.”
(Teacher note: A fraud alert or freeze will make it more difficult for identity thievesto open new accounts in your name.)
Closure15. Explain the following:
• You can greatly reduce the likelihood of identity theft by protecting yourself.
• Some protection options have no cost, others do.
Lesson 10A: The Three D’s of Identity Theft Unit 10: Protecting
Making Personal Finance Decisions©2019, Minnesota Council on Economic Education. Developed in partnership with the Federal Reserve Bank of St. Louis. Permission is granted to reprint or photocopy this lesson in its entirety for educational purposes, provided the user credits the Minnesota Council on Economic Education. 229
• You must weigh the costs of your options and decide which options are best foryou.
• If you are very concerned about identity theft and its consequences, choosingseveral strategies for protecting personal information would make good sense.
• The more protection options you choose, the less likely you will have your identitystolen but the more costs you will incur.
• Unfortunately, no matter how many precautions you take, 100% identity pro-tection is not possible.
• You need to take action quickly if you suspect your identity has been stolen.
Assessment16. Distribute a copy of Handout 10A.5: Assessment to each student and allow time for
students to work (or assign as homework).
Handout 10.A.5: Assessment—Answer Key
1. List five strategies identity thieves use to steal your identity. Then list five strategies you can use to protect your personal information from these threats.
Students should provide examples such as those listed on Visuals 10.A1 and 10.A2.
2. The elderly tend to be susceptible to fraud and identity theft. Write a short paragraph below in which you describe what “phishing” is to a grandparent or elderly friend.
Answers will vary but may be similar to the following: Phishing is when someone attempts to get your personal information by pretending to work for a legitimateor legitimate-sounding organization, such as a bank or the government. You could be contacted by email or by phone or other ways. For example, you mightget an email that looks like it is from your bank that asks you to click a link and update your personal information, such as your password, date of birth, or SocialSecurity number. Do not click such links. When in doubt, call the organization directly.
3. Describe the three D’s of identity theft in your own words.
The three D’s of identity theft are deter, detect, and defend. Answers will vary, but should be similar to the following:“Deter” is to prevent identity theft by protecting personal information from others.“Detect” is to monitor or “keep an eye” on financial accounts—watching for unusual activity that might mean some-one has stolen your identity. “Defend” is to take action if you suspect your identityhas been compromised.
Unit 10: Protecting Lesson 10A: The Three D’s of Identity Theft
Making Personal Finance Decisions©2019, Minnesota Council on Economic Education. Developed in partnership with the Federal Reserve Bank of St. Louis.
Permission is granted to reprint or photocopy this lesson in its entirety for educational purposes, 230 provided the user credits the Minnesota Council on Economic Education.
Visual 10A.1: Identity Protection Options
1. Shred anything that includes your personal information (PI) before throwing itaway.
2. Be aware of your surroundings when inputting your PI.
3. Keep your Social Security number, PINs, and password information in a secureplace other than your wallet/purse.
4. Remove mail from your mailbox as soon as possible.
5. Keep all of your credit and debit cards secure, and do not swipe them in unfamiliar or questionable devices.
6. Use firewalls, anti-spyware, and anti-virus software on your computer.
7. Use strong passwords not associated with your PI.
8. Do not respond to email, phone, or mail requests for your PI.
9. Make sure online transactions are handled through a secure (“https”) site oruse encrypted code.
10. Remove all PI from any electronic device before disposal.
11. Limit the PI you share on social-networking sites.
12. Limit the PI you share in general (private and public).
13. Monitor all billing statements and financial accounts.
14. Shop only on websites that have strong privacy and protection policies.
15. Question when expected bills and statements do not arrive on time.
16. Question unexpected bills and statements for things you did not purchase.
17. Beware of “phishing” attempts to steal your PI through legitimate-lookingemails.
18. Inspect your credit report—from all three credit-reporting agencies, Equifax,Experian, and Trans Union—at least annually.
19. Question unsolicited employment offers that request your PI.
20. Limit the number of credit cards/accounts you have and close any accountsyou are not using.
Lesson 10A: The Three D’s of Identity Theft Unit 10: Protecting
Making Personal Finance Decisions©2019, Minnesota Council on Economic Education. Developed in partnership with the Federal Reserve Bank of St. Louis. Permission is granted to reprint or photocopy this lesson in its entirety for educational purposes, provided the user credits the Minnesota Council on Economic Education. 231
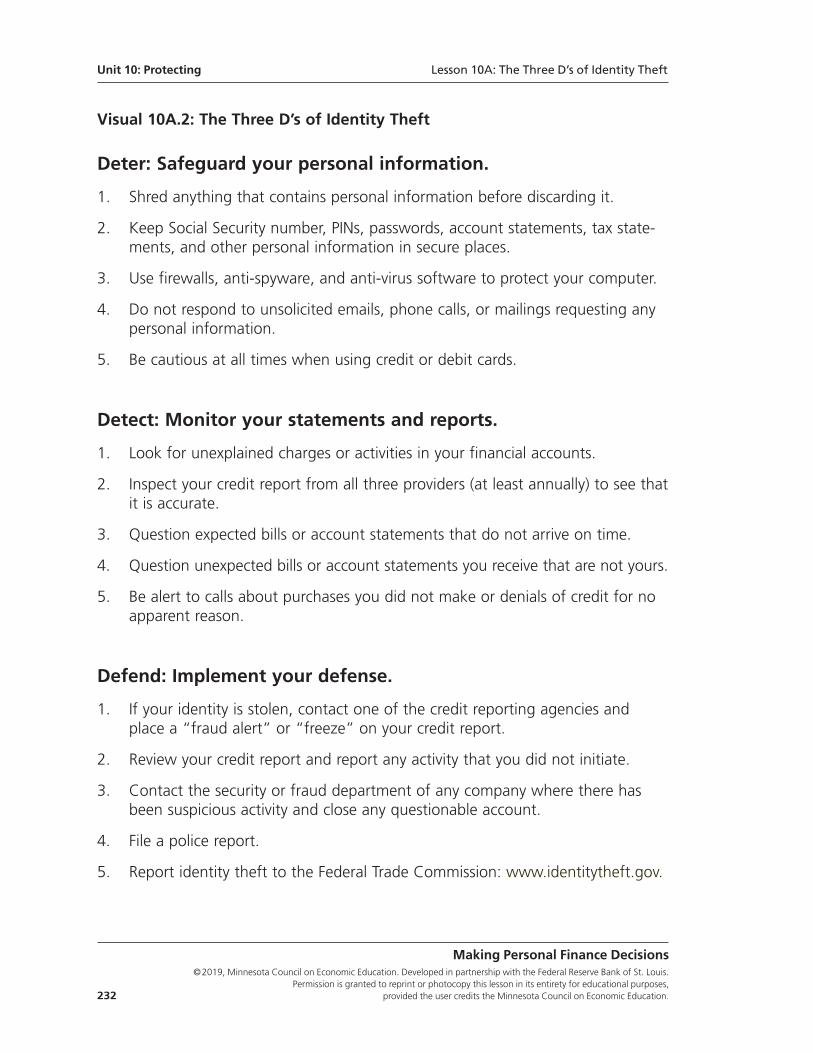
Unit 10: Protecting Lesson 10A: The Three D’s of Identity Theft
Making Personal Finance Decisions©2019, Minnesota Council on Economic Education. Developed in partnership with the Federal Reserve Bank of St. Louis.
Permission is granted to reprint or photocopy this lesson in its entirety for educational purposes, 232 provided the user credits the Minnesota Council on Economic Education.
Visual 10A.2: The Three D’s of Identity Theft
Deter: Safeguard your personal information.
1. Shred anything that contains personal information before discarding it.
2. Keep Social Security number, PINs, passwords, account statements, tax state-ments, and other personal information in secure places.
3. Use firewalls, anti-spyware, and anti-virus software to protect your computer.
4. Do not respond to unsolicited emails, phone calls, or mailings requesting anypersonal information.
5. Be cautious at all times when using credit or debit cards.
Detect: Monitor your statements and reports.
1. Look for unexplained charges or activities in your financial accounts.
2. Inspect your credit report from all three providers (at least annually) to see thatit is accurate.
3. Question expected bills or account statements that do not arrive on time.
4. Question unexpected bills or account statements you receive that are not yours.
5. Be alert to calls about purchases you did not make or denials of credit for noapparent reason.
Defend: Implement your defense.
1. If your identity is stolen, contact one of the credit reporting agencies andplace a “fraud alert” or “freeze” on your credit report.
2. Review your credit report and report any activity that you did not initiate.
3. Contact the security or fraud department of any company where there hasbeen suspicious activity and close any questionable account.
4. File a police report.
5. Report identity theft to the Federal Trade Commission: www.identitytheft.gov.
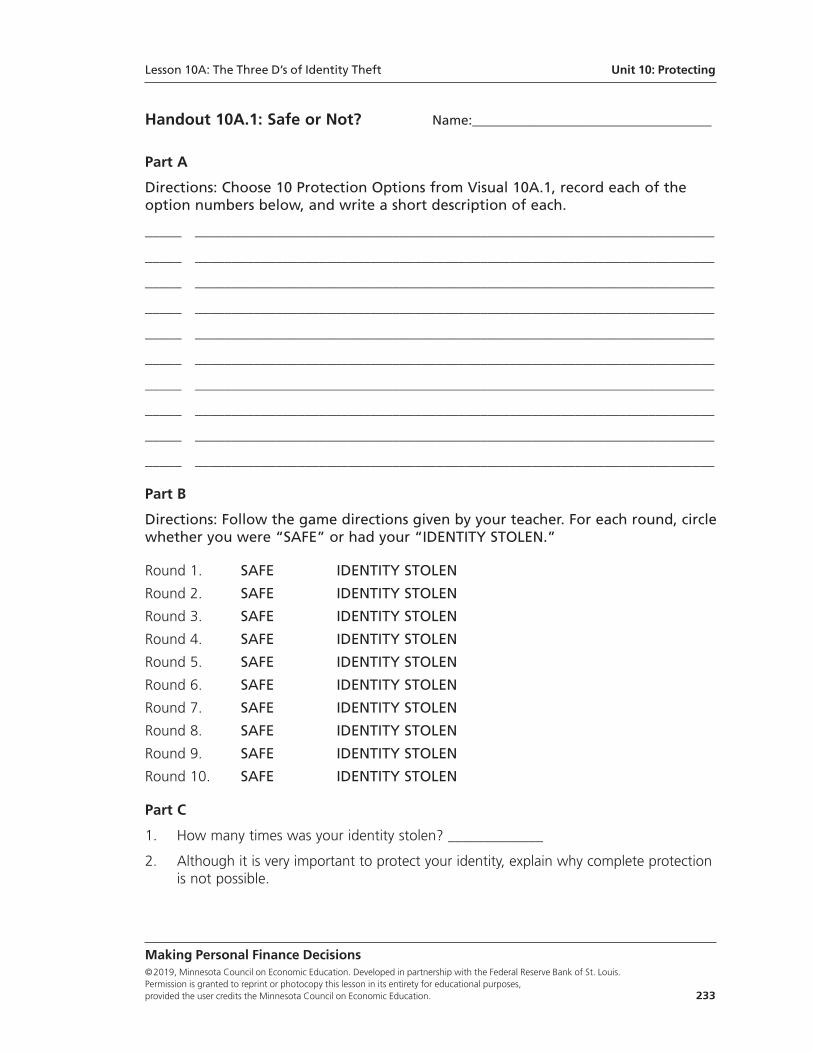
Handout 10A.1: Safe or Not? Name:____________________________________
Part A
Directions: Choose 10 Protection Options from Visual 10A.1, record each of theoption numbers below, and write a short description of each.
_____ _______________________________________________________________________
_____ _______________________________________________________________________
_____ _______________________________________________________________________
_____ _______________________________________________________________________
_____ _______________________________________________________________________
_____ _______________________________________________________________________
_____ _______________________________________________________________________
_____ _______________________________________________________________________
_____ _______________________________________________________________________
_____ _______________________________________________________________________
Part B
Directions: Follow the game directions given by your teacher. For each round, circlewhether you were “SAFE” or had your “IDENTITY STOLEN.”
Round 1. SAFE IDENTITY STOLEN
Round 2. SAFE IDENTITY STOLEN
Round 3. SAFE IDENTITY STOLEN
Round 4. SAFE IDENTITY STOLEN
Round 5. SAFE IDENTITY STOLEN
Round 6. SAFE IDENTITY STOLEN
Round 7. SAFE IDENTITY STOLEN
Round 8. SAFE IDENTITY STOLEN
Round 9. SAFE IDENTITY STOLEN
Round 10. SAFE IDENTITY STOLEN
Part C
1. How many times was your identity stolen? _____________
2. Although it is very important to protect your identity, explain why complete protection is not possible.
Making Personal Finance Decisions©2019, Minnesota Council on Economic Education. Developed in partnership with the Federal Reserve Bank of St. Louis. Permission is granted to reprint or photocopy this lesson in its entirety for educational purposes, provided the user credits the Minnesota Council on Economic Education. 233
Lesson 10A: The Three D’s of Identity Theft Unit 10: Protecting
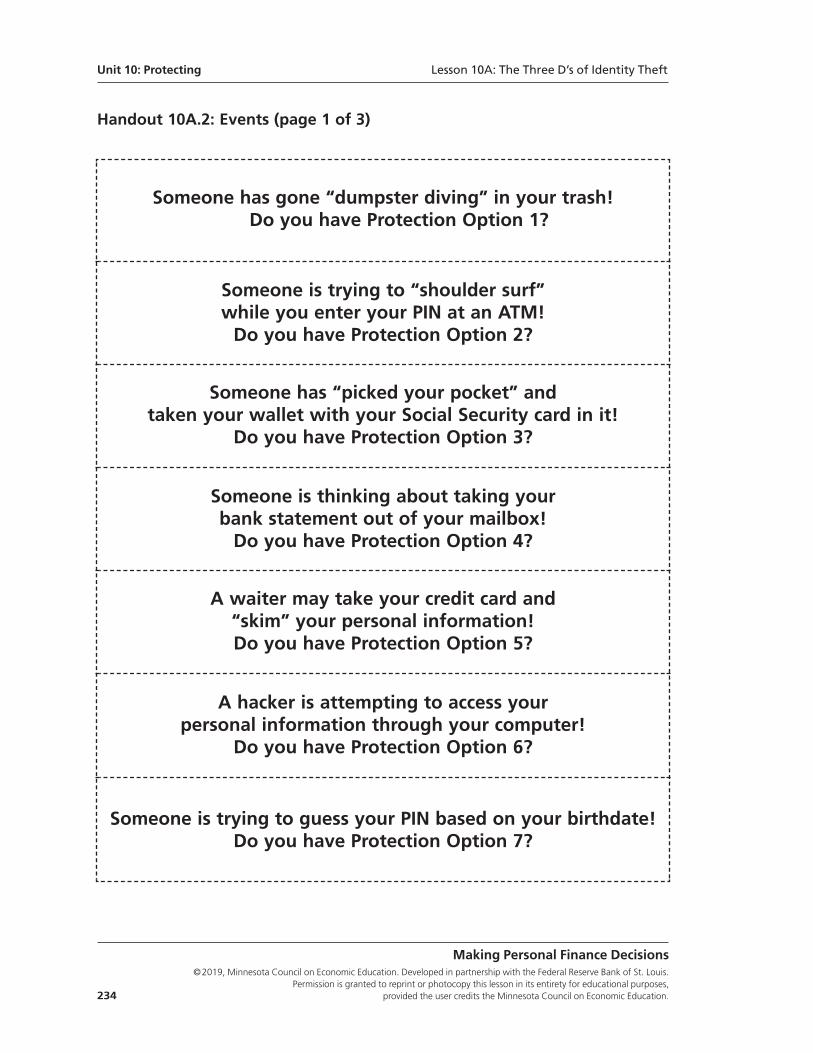
Handout 10A.2: Events (page 1 of 3)
Unit 10: Protecting Lesson 10A: The Three D’s of Identity Theft
Making Personal Finance Decisions©2019, Minnesota Council on Economic Education. Developed in partnership with the Federal Reserve Bank of St. Louis.
Permission is granted to reprint or photocopy this lesson in its entirety for educational purposes, 234 provided the user credits the Minnesota Council on Economic Education.
Someone has gone “dumpster diving” in your trash! Do you have Protection Option 1?
Someone is trying to “shoulder surf” while you enter your PIN at an ATM! Do you have Protection Option 2?
Someone has “picked your pocket” and taken your wallet with your Social Security card in it!
Do you have Protection Option 3?
Someone is thinking about taking your bank statement out of your mailbox! Do you have Protection Option 4?
A waiter may take your credit card and “skim” your personal information! Do you have Protection Option 5?
A hacker is attempting to access your personal information through your computer!
Do you have Protection Option 6?
Someone is trying to guess your PIN based on your birthdate!Do you have Protection Option 7?
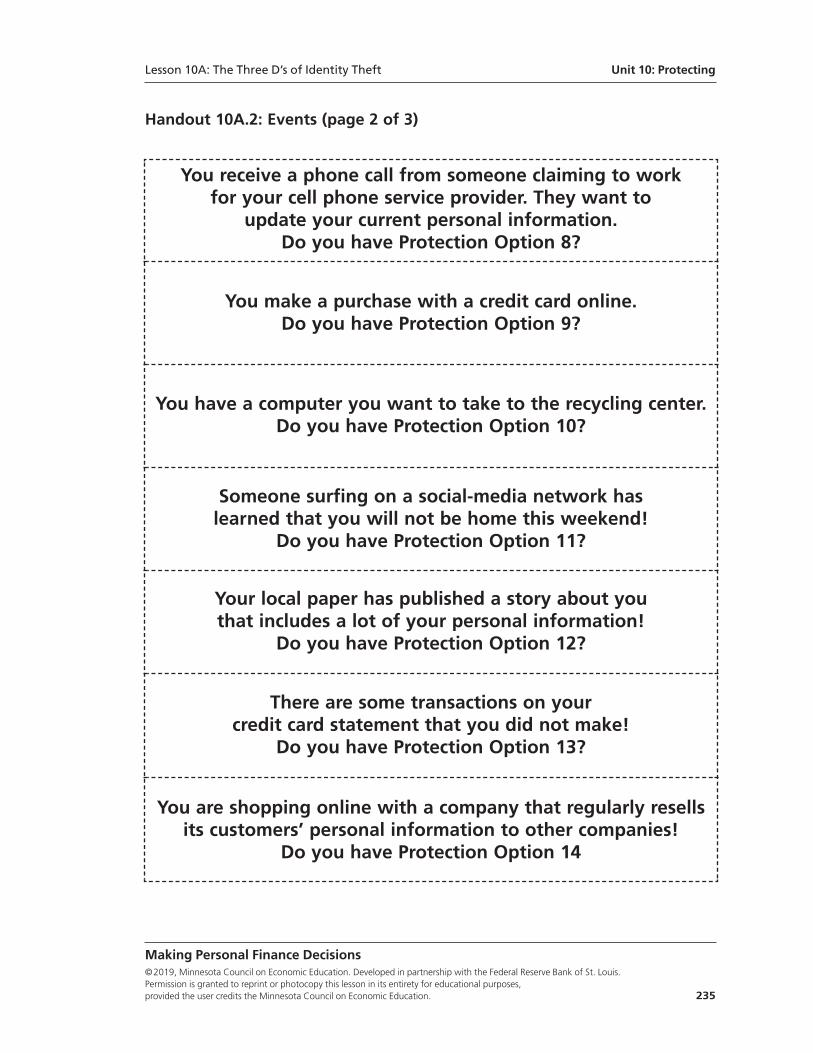
Handout 10A.2: Events (page 2 of 3)
Lesson 10A: The Three D’s of Identity Theft Unit 10: Protecting
Making Personal Finance Decisions©2019, Minnesota Council on Economic Education. Developed in partnership with the Federal Reserve Bank of St. Louis. Permission is granted to reprint or photocopy this lesson in its entirety for educational purposes, provided the user credits the Minnesota Council on Economic Education. 235
You receive a phone call from someone claiming to work for your cell phone service provider. They want to
update your current personal information. Do you have Protection Option 8?
You make a purchase with a credit card online. Do you have Protection Option 9?
You have a computer you want to take to the recycling center.Do you have Protection Option 10?
Someone surfing on a social-media network has learned that you will not be home this weekend!
Do you have Protection Option 11?
Your local paper has published a story about you that includes a lot of your personal information!
Do you have Protection Option 12?
There are some transactions on your credit card statement that you did not make!
Do you have Protection Option 13?
You are shopping online with a company that regularly resellsits customers’ personal information to other companies!
Do you have Protection Option 14
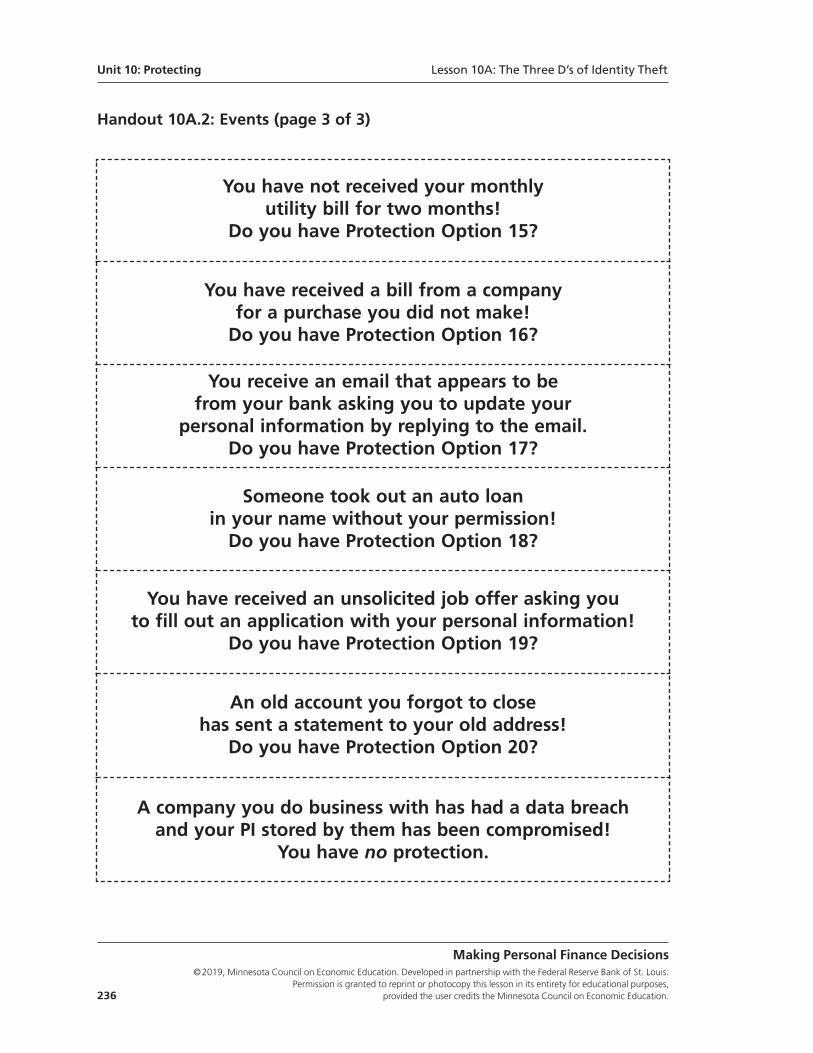
Handout 10A.2: Events (page 3 of 3)
Unit 10: Protecting Lesson 10A: The Three D’s of Identity Theft
Making Personal Finance Decisions©2019, Minnesota Council on Economic Education. Developed in partnership with the Federal Reserve Bank of St. Louis.
Permission is granted to reprint or photocopy this lesson in its entirety for educational purposes, 236 provided the user credits the Minnesota Council on Economic Education.
You have not received your monthly utility bill for two months!
Do you have Protection Option 15?
You have received a bill from a company for a purchase you did not make! Do you have Protection Option 16?
You receive an email that appears to be from your bank asking you to update your
personal information by replying to the email. Do you have Protection Option 17?
Someone took out an auto loan in your name without your permission!
Do you have Protection Option 18?
You have received an unsolicited job offer asking you to fill out an application with your personal information!
Do you have Protection Option 19?
An old account you forgot to close has sent a statement to your old address!
Do you have Protection Option 20?
A company you do business with has had a data breach and your PI stored by them has been compromised!
You have no protection.
Handout 10A.3: Deck One Cards (page 1 of 2)
Lesson 10A: The Three D’s of Identity Theft Unit 10: Protecting
Making Personal Finance Decisions©2019, Minnesota Council on Economic Education. Developed in partnership with the Federal Reserve Bank of St. Louis. Permission is granted to reprint or photocopy this lesson in its entirety for educational purposes, provided the user credits the Minnesota Council on Economic Education. 237
SAFE SAFE
SAFE SAFE
SAFE SAFE
SAFE SAFE
SAFE SAFE
Handout 10A.3: Deck One Cards (page 2 of 2)
Unit 10: Protecting Lesson 10A: The Three D’s of Identity Theft
Making Personal Finance Decisions©2019, Minnesota Council on Economic Education. Developed in partnership with the Federal Reserve Bank of St. Louis.
Permission is granted to reprint or photocopy this lesson in its entirety for educational purposes, 238 provided the user credits the Minnesota Council on Economic Education.
IDENTITYSTOLEN
SAFE SAFE
SAFE SAFE
SAFE SAFE
SAFE SAFE
SAFE
Handout 10A.4: Deck Two Cards (page 1 of 2)
Making Personal Finance Decisions©2019, Minnesota Council on Economic Education. Developed in partnership with the Federal Reserve Bank of St. Louis. Permission is granted to reprint or photocopy this lesson in its entirety for educational purposes, provided the user credits the Minnesota Council on Economic Education. 239
SAFE SAFE
SAFE SAFE
SAFE SAFE
SAFE SAFE
SAFE SAFE
Lesson 10A: The Three D’s of Identity Theft Unit 10: Protecting
Unit 10: Protecting Lesson 10A: The Three D’s of Identity Theft
Making Personal Finance Decisions©2019, Minnesota Council on Economic Education. Developed in partnership with the Federal Reserve Bank of St. Louis.
Permission is granted to reprint or photocopy this lesson in its entirety for educational purposes, 240 provided the user credits the Minnesota Council on Economic Education.
Handout 10A.4: Deck Two Cards (page 2 of 2)
IDENTITYSTOLEN
SAFE SAFE
SAFE
IDENTITYSTOLEN
IDENTITYSTOLEN
IDENTITYSTOLEN
IDENTITYSTOLEN
IDENTITYSTOLEN
IDENTITYSTOLEN
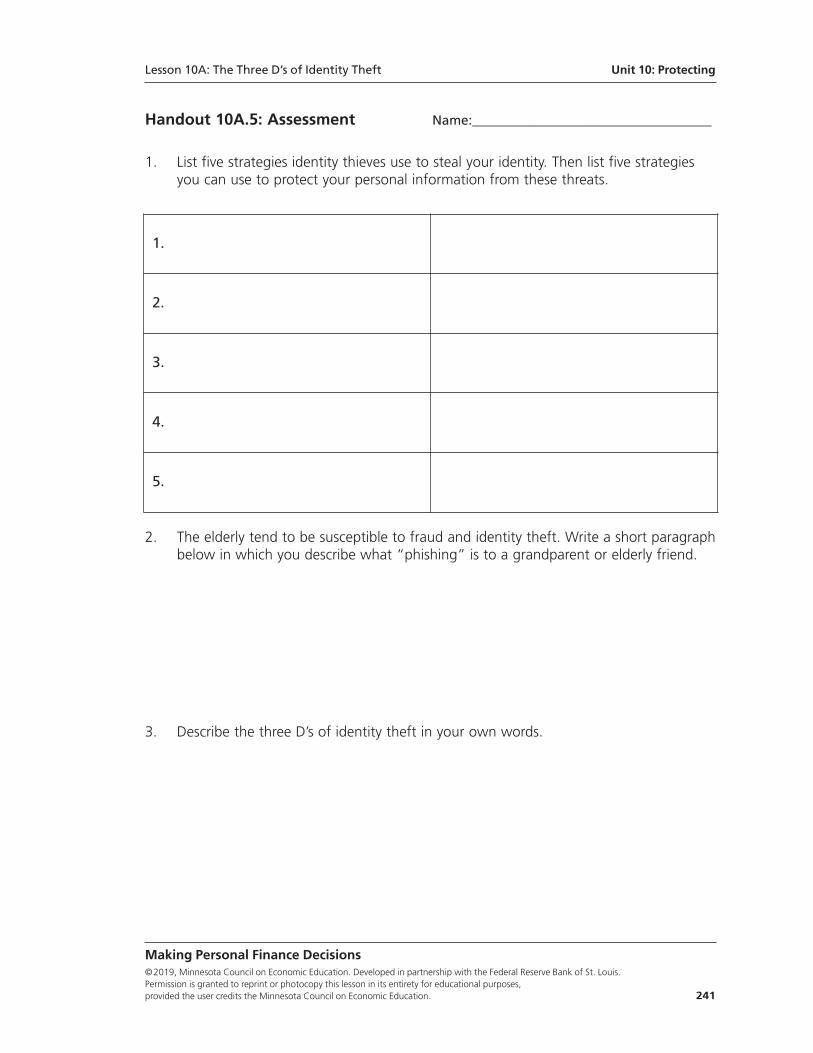
Lesson 10A: The Three D’s of Identity Theft Unit 10: Protecting
Making Personal Finance Decisions©2019, Minnesota Council on Economic Education. Developed in partnership with the Federal Reserve Bank of St. Louis. Permission is granted to reprint or photocopy this lesson in its entirety for educational purposes, provided the user credits the Minnesota Council on Economic Education. 241
Handout 10A.5: Assessment Name:____________________________________
1. List five strategies identity thieves use to steal your identity. Then list five strategiesyou can use to protect your personal information from these threats.
2. The elderly tend to be susceptible to fraud and identity theft. Write a short paragraphbelow in which you describe what “phishing” is to a grandparent or elderly friend.
3. Describe the three D’s of identity theft in your own words.
1.
2.
3.
4.
5.
Unit 10: Protecting Lesson 10A: The Three D’s of Identity Theft
Making Personal Finance Decisions©2019, Minnesota Council on Economic Education. Developed in partnership with the Federal Reserve Bank of St. Louis.
Permission is granted to reprint or photocopy this lesson in its entirety for educational purposes, 242 provided the user credits the Minnesota Council on Economic Education.
Standards and Benchmarks
National Standards for Financial Literacy
Standard 6: Protecting and Insuring. People make choices to protect themselves fromthe financial risk of lost income, assets, health, or identity. They can choose to accept risk,reduce risk, or transfer risk to others. Insurance allows people to transfer risk by paying afee now to avoid the possibility of a larger loss later. The price of insurance is influencedby an individual’s behavior.
• Benchmark: Grade 8
8. Social networking sites and other online activity can make individuals vulnerable to harm caused by identity theft or misuse of their personal information.
• Benchmarks: Grade 12
13. Loss of assets, wealth, and future opportunities can occur if an individual’s personal information is obtained by others through identity theft and then used fraudulently. By managing their personal information and choosing the environment in which it is revealed, individuals can accept, reduce, and insure against the risk of loss due to identity theft.
14. Federal and state regulations provide some remedies and assistance for victims of identity theft.
Making Personal Finance Decisions©2019, Minnesota Council on Economic Education. Developed in partnership with the Federal Reserve Bank of St. Louis. Permission is granted to reprint or photocopy this lesson in its entirety for educational purposes, provided the user credits the Minnesota Council on Economic Education. 243
Lesson 10B:
Is Insurance Worth Buying?
Lesson DescriptionStudents learn about insurance options and possible risks. They play a game wherethey first choose levels of insurance coverage and then face random events. They trackthe cost of their insurance choices (premiums plus lost investment income) and thebenefit of their choices (loss reduction) based on each event drawn. They determinewhether the insurance choices they made were financially beneficial or not and whyinsurance may be a good idea regardless.
Standards and Benchmarks (see page 256)
Grade Level9-12
ConceptsInsurance
Opportunity cost
Premium
Risk
Rule 10: Protect your plan.While financial risk is most often associated with investment risk, other risks can also keepyou from achieving your financial goals. For example, car accidents, medical issues, housefires, lawsuits, and theft (including identity theft) all represent potential obstacles. Theserisks can be managed by (i) reducing your potential exposure to identity theft or (ii) buyinginsurance. These lessons use games featuring random, unwelcome events to help studentsconsider ways to wisely manage risk.
Unit 10
Protecting
Making Personal Finance Decisions©2019, Minnesota Council on Economic Education. Developed in partnership with the Federal Reserve Bank of St. Louis.
Permission is granted to reprint or photocopy this lesson in its entirety for educational purposes, 244 provided the user credits the Minnesota Council on Economic Education.
Compelling QuestionHow can consumers reduce their risk of financial loss?
ObjectivesStudents will be able to
• define insurance, premium, deductible, copay, and liability;
• describe the benefits of insurance (loss reduction);
• describe the costs of insurance (premiums plus other opportunity costs); and
• explain why buying insurance may be a good idea even if the costs exceed thebenefits over a given period.
Materials• Visual 10B.1: Risks
• Handout 10B.1: Managing Risk, one copy for each student (NOTE: For ease ofuse, copy as separate pages, not back-to-back.)
• Handout 10B.1: Managing Risk—Answer Key, Part B: My Life Events
• Handout 10B.2: Assessment, one copy for each student
• Handout 10B.2: Assessment—Answer Key
• One regular deck of (52) cards
• Calculators (optional)
Time50 minutes
Procedure1. Distribute a copy of Handout 10B.1: Managing Risk to each student. Refer to Part A:
My Insurance Coverage (page 1 of 2) and explain the following:
• Insurance is protection from possible financial loss.
• Insurance is a product that allows people to pay a fee (called a premium) now totransfer the costs of a potential loss to a third party (an insurance company).
• Types of insurance include health, automobile, renters, disability, and life.
Unit 10: Protecting Lesson 10B: Is Insurance Worth Buying?
Making Personal Finance Decisions©2019, Minnesota Council on Economic Education. Developed in partnership with the Federal Reserve Bank of St. Louis. Permission is granted to reprint or photocopy this lesson in its entirety for educational purposes, provided the user credits the Minnesota Council on Economic Education. 245
• Each type of insurance offers several options with various amounts of coverage,or protection. The handout lists some potential options.
• The payment for insurance is a called a premium, and it covers you for a specificamount of time. For example, an annual premium covers you for one year.
• As the coverage gets better, the premium is higher because the insurance companywould have to pay more for a claim.
2. Review the meaning of each type of coverage as follows:
Health Insurance
• The co-pay is the amount you will have to pay for each office visit to a doctor.The insurance company will pay the rest.
• The hospitalization percentage is the amount of the bill the insurance companywill pay if you are hospitalized.
Automobile Insurance
• The deductible is the amount you will have to pay to repair your car if you havean accident. (Comprehensive and collision coverage are combined here for sim-plicity.) The insurance company will pay the cost above the deductible.
• Liability coverage protects you from having to pay for damage you cause if youhave an accident. The insurance company will pay up to the given limit, and youwill have to pay the rest.
Renters Insurance
• The deductible is the amount you will have to pay in the event of a loss. Theinsurance company will then cover—pay—up to the amount shown. Anythingabove that limit will be your responsibility.
Disability Insurance
• Each unit of coverage will pay a certain amount per month in the event of along-term injury or illness.
Life Insurance
• Each unit of coverage will pay your beneficiaries a specified amount if you die.That money could be used to cover funeral expenses, personal debts, or simplyas income for your beneficiaries.
3. Explain that the students will participate in a game where they will weigh the benefitsof insurance coverage against its costs and choose levels of coverage. The benefit ofinsurance is lower losses (less money to pay) when bad things happen.
4. Display Visual 10B.1: Risks. Define risk as the chance of loss. Explain that the visualshows potential events and the amount of loss (cost) each would bring. These eventswill be used in the game.
Lesson 10B: Is Insurance Worth Buying? Unit 10: Protecting
5. Divide the class into four to eight groups.
(Teacher note: Having more groups will result in more varied outcomes; however, theactivity would take more time since more cards would need to be drawn and reviewed.)
Explain the game as follows:
• Each round in the game will represent 1 year.
• Before the game begins, you will fill out Handout 10B.1, Part A: Your InsuranceCoverage to decide for yourselves how much insurance to purchase for each typeof insurance shown. Once chosen, the insurance levels cannot be changed.
• The letters and numbers on Visual 10B.1 correspond to cards in a regular deckof cards. J is for jack, Q is for queen, K is for king, and A is for ace.
• For each round, one member of each group will randomly select one card thatwill determine the life event that occurs for each member of that group that year.For example, if an “8” card is drawn, each person in the group had 10 visits totheir doctor costing $2,000 ($200 each visit) and a hospital stay costing $6,000.With no insurance, they would have to pay $8,000 each. How much each personactually pays will depend on the level of health insurance he or she chose.(Optional: The expected loss of each event is actually fairly easy to determine. Forexample, there is a 1 in 13 chance of drawing an “8,” or 0.077. This probabilitytimes the loss of $8,000 yields an expected loss of $616.)
• The two Js, Qs, Ks, and As on Visual 10B.1 (e.g., K-K) indicate back-to-backevents. If a group draws a jack, queen, king, or ace and then draws that sametype of card in the next round, then back-to-back events have occurred and thedouble-letter event applies. If a group draws the same type of card for the thirdtime, the single-letter event applies. Drawing back-to-back aces indicates deathand is the end of the game for that group.
6. Explain that the benefit of insurance is that it lowers your financial loss when suchevents occur. Discuss the following:
• What are the costs of insurance? (Most students will recognize premiums as animportant cost, but there are also opportunity costs.)
• If you pay $1,000 in insurance premiums, you lose the opportunity to invest thesefunds and earn what? (You lose the opportunity to earn interest, or a rate ofreturn. You also lose the opportunity to spend the $1,000 on something else.)
• If you could earn a 5 percent rate of return on invested funds, what would beyour total cost of buying $1,000 of insurance? ($1,050 = $1,000 [1 + 0.05].)
7. Direct the students to Part A of Handout 10B.1. Instruct them to choose a level ofcoverage for each insurance category based on the following directions:
• You may spend a total of $4,000 on insurance.
Making Personal Finance Decisions©2019, Minnesota Council on Economic Education. Developed in partnership with the Federal Reserve Bank of St. Louis.
Permission is granted to reprint or photocopy this lesson in its entirety for educational purposes, 246 provided the user credits the Minnesota Council on Economic Education.
Unit 10: Protecting Lesson 10B: Is Insurance Worth Buying?
• All states require basic liability automobile coverage, so you are required to chooseat least option 3 for auto insurance.
• Your goal is to buy enough on coverage to protect yourself from losses, but notso much that you spend far more on insurance than it is worth.
• Since you can’t know what will happen for sure, there is no way of determiningthe exact amount of coverage you will need (where the benefits of the insuranceexactly offset the costs).
• Compare the risks and the premiums and make the choices you are most com-fortable with.
8. Direct the students to Part B: My Life Events on Handout 10B.1. Explain the following,allowing the students time to complete each part as you go:
• First enter the “Total Annual Insurance Premiums” from the bottom of Part A ofHandout 10 B.1 on every line in Column (1) of Part B of Handout 10B.1. This willbe your premium payment for every round (year) of the activity—no changes willbe allowed.
• Next calculate the opportunity cost of lost interest due to making the premiumpayments—5 percent of the total in Column (1)—and enter it on every line ofColumn (2) of Part B. (So, for example, if a student decided to spend $4,000 onpremiums, he or she would enter $4,000 in Column (1) and $200 in Column (2).)
• Losses without insurance will be entered in Column (3). This is how much theevent will cost and will be determined by the card drawn. This amount will bethe same for all group members. Everyone is to write it down.
• Losses with insurance coverage will be entered into Column (4). This is how muchyou will have to pay yourself and will be based on the insurance coverage youchose. This amount will differ from group member to group member if insurancecoverage differs.
9. Provide the following example to illustrate how the game works:
• Suppose your group draws an “8” card.
• Everyone in your group should record “$8,000” in Column (3).
• The amount you enter in Column (4) is how much you have to pay. It will dependon the health insurance you chose as follows:
◦� Option 1: You would enter $100 in Column (4) for 10 office (doctor) visits with a $10 co-pay each, and $0 for the hospital stay because the insurancecompany pays 100% of hospitalization.
◦� Option 2: You would enter $1,400 in Column (4), which is $200 for 10 officevisits with a $20 co-pay each and $1,200 for the hospital stay, which is 20%of the $6,000 hospital bill. The insurance company would pay the other 80%,or $4,800.
Making Personal Finance Decisions©2019, Minnesota Council on Economic Education. Developed in partnership with the Federal Reserve Bank of St. Louis. Permission is granted to reprint or photocopy this lesson in its entirety for educational purposes, provided the user credits the Minnesota Council on Economic Education. 247
Lesson 10B: Is Insurance Worth Buying? Unit 10: Protecting
◦� Option 3: You would enter $2,000 in Column (4) for the office visits only. The hospital stay would be fully covered.
◦� Option 4: You would enter $8,000 in Column (4) because you do not have insurance and would have to pay the full amount.
10. Begin the game. Invite a member of each group to draw a card from the deck (replac-ing the card each time) to determine that group’s event for Year 1. Instruct each groupto complete Columns (3) and (4) as described above. Repeat for as many rounds astime allows (but at least four rounds is suggested to give students a better idea ofrisk over time).
Teacher note: Students may need help determining the cost for Column (4). Typically,other members in their group can help, but it may be helpful for you to summarizethe costs for different levels of coverage. See Handout 10B.1: Managing Risk—AnswerKey, Part B: My Life Events for costs.
11. Instruct the students to total the columns on Part B of Handout 10B.1 and completePart C: Did Insurance Pay?
12. Discuss the following:
• Who is really glad they bought insurance? (For groups with particularly costlyevents, those who bought more coverage will likely be glad. In their case, thelosses without insurance would have been much greater.)
• Who wishes they would have bought a lot less insurance? (For groups with fairlyinexpensive events, those who bought a lot of coverage will likely wish they hadn’t“wasted their money.” In their case, the losses without insurance would havebeen much less.)
13. Explain the following:
• Insurance works like this: Insurance companies collect a relatively small amountof money (premiums) from a large group of policyholders.
• These premiums are used to create a pool of funds to compensate policyholderswho experience a loss.
• The premium payments of those with minor or no losses help the insurancecompany cover the losses of those with major losses.
• Premiums are typically set by insurance companies based on the expected payoutsthey are likely to make—plus a profit, of course. (Note: The premiums in the gamehave been calculated as such.)
• Premiums are set so that most people will pay more in premiums than they receivein claims.
Making Personal Finance Decisions©2019, Minnesota Council on Economic Education. Developed in partnership with the Federal Reserve Bank of St. Louis.
Permission is granted to reprint or photocopy this lesson in its entirety for educational purposes, 248 provided the user credits the Minnesota Council on Economic Education.
Unit 10: Protecting Lesson 10B: Is Insurance Worth Buying?
• While some groups in the game may have had more costly events than others, ifmore rounds were played, the fortunes of the groups could have easily reversed.
• Even if insurance doesn’t seem worth it for a given period, it doesn’t mean itwon’t be later.
Closure14. Review the key points of the lesson by asking the following questions:
• What is insurance? (Protection against loss)
• What are common types of insurance? (Health, life, renters, automobile, anddisability)
• What do we call the payment we make for insurance? (A premium)
• What is a co-pay? (The amount a person with insurance pays for an office visitto the doctor)
• What is a deductible? (The amount an insured person pays in the event of a loss)
• What is the benefit of insurance? (Loss reduction)
• What are the costs of insurance? (The price of the premium plus opportunity costs)
• Why might buying insurance be a good idea even if the costs exceed the benefitsover a given period? (Things change over time. You can’t predict when an acci-dent or natural disaster might occur. So, in the long run, it is better to haveinsurance.)
Assessment15. Distribute a copy of Handout 10B.2: Assessment to each student. Allow time for
students to work (or assign as homework) and then review answers using Handout10B.2: Assessment—Answer Key.
Making Personal Finance Decisions©2019, Minnesota Council on Economic Education. Developed in partnership with the Federal Reserve Bank of St. Louis. Permission is granted to reprint or photocopy this lesson in its entirety for educational purposes, provided the user credits the Minnesota Council on Economic Education. 249
Lesson 10B: Is Insurance Worth Buying? Unit 10: Protecting
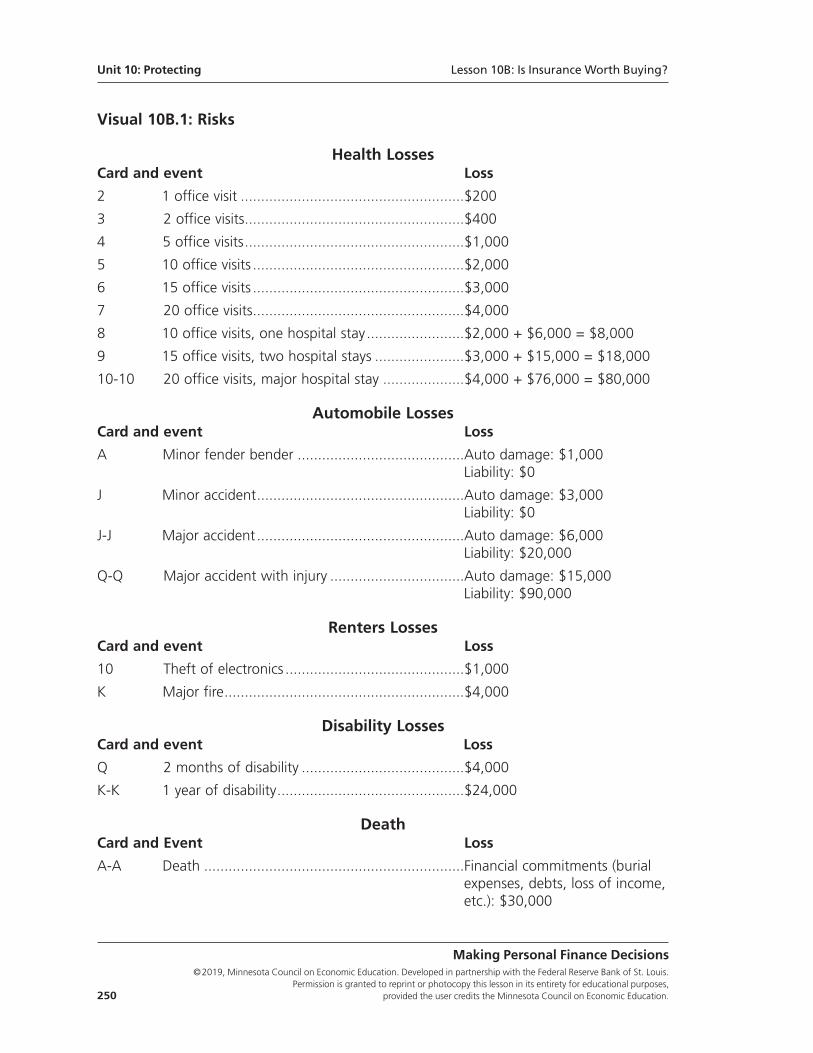
Visual 10B.1: Risks
Health Losses Card and event Loss
2 1 office visit .......................................................$200
3 2 office visits......................................................$400
4 5 office visits......................................................$1,000
5 10 office visits ....................................................$2,000
6 15 office visits ....................................................$3,000
7 20 office visits....................................................$4,000
8 10 office visits, one hospital stay........................$2,000 + $6,000 = $8,000
9 15 office visits, two hospital stays ......................$3,000 + $15,000 = $18,000
10-10 20 office visits, major hospital stay ....................$4,000 + $76,000 = $80,000
Automobile LossesCard and event Loss
A Minor fender bender .........................................Auto damage: $1,000Liability: $0
J Minor accident...................................................Auto damage: $3,000Liability: $0
J-J Major accident ...................................................Auto damage: $6,000Liability: $20,000
Q-Q Major accident with injury .................................Auto damage: $15,000Liability: $90,000
Renters LossesCard and event Loss
10 Theft of electronics ............................................$1,000
K Major fire...........................................................$4,000
Disability LossesCard and event Loss
Q 2 months of disability ........................................$4,000
K-K 1 year of disability..............................................$24,000
DeathCard and Event Loss
A-A Death ................................................................Financial commitments (burialexpenses, debts, loss of income,etc.): $30,000
Making Personal Finance Decisions©2019, Minnesota Council on Economic Education. Developed in partnership with the Federal Reserve Bank of St. Louis.
Permission is granted to reprint or photocopy this lesson in its entirety for educational purposes, 250 provided the user credits the Minnesota Council on Economic Education.
Unit 10: Protecting Lesson 10B: Is Insurance Worth Buying?
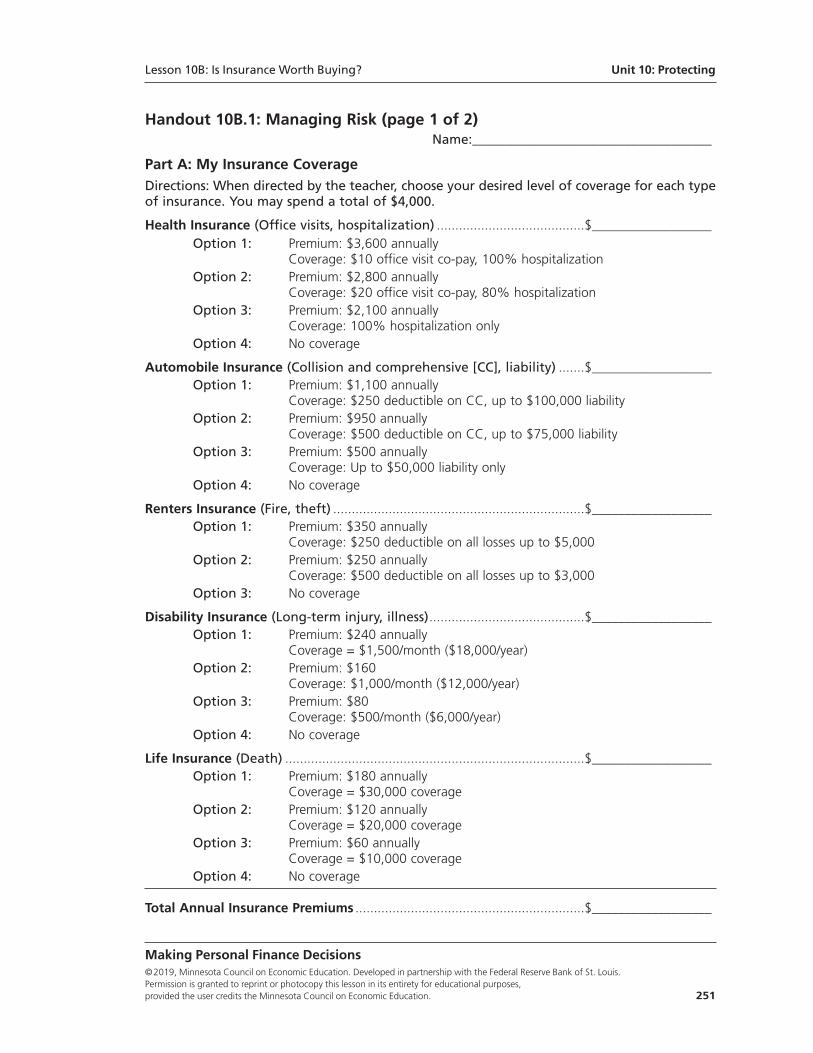
Handout 10B.1: Managing Risk (page 1 of 2)Name:____________________________________
Part A: My Insurance CoverageDirections: When directed by the teacher, choose your desired level of coverage for each typeof insurance. You may spend a total of $4,000.
Health Insurance (Office visits, hospitalization) ........................................$__________________Option 1: Premium: $3,600 annually
Coverage: $10 office visit co-pay, 100% hospitalizationOption 2: Premium: $2,800 annually
Coverage: $20 office visit co-pay, 80% hospitalizationOption 3: Premium: $2,100 annually
Coverage: 100% hospitalization onlyOption 4: No coverage
Automobile Insurance (Collision and comprehensive [CC], liability) .......$__________________Option 1: Premium: $1,100 annually
Coverage: $250 deductible on CC, up to $100,000 liabilityOption 2: Premium: $950 annually
Coverage: $500 deductible on CC, up to $75,000 liabilityOption 3: Premium: $500 annually
Coverage: Up to $50,000 liability onlyOption 4: No coverage
Renters Insurance (Fire, theft) ....................................................................$__________________Option 1: Premium: $350 annually
Coverage: $250 deductible on all losses up to $5,000Option 2: Premium: $250 annually
Coverage: $500 deductible on all losses up to $3,000Option 3: No coverage
Disability Insurance (Long-term injury, illness)..........................................$__________________Option 1: Premium: $240 annually
Coverage = $1,500/month ($18,000/year)Option 2: Premium: $160
Coverage: $1,000/month ($12,000/year)Option 3: Premium: $80
Coverage: $500/month ($6,000/year)Option 4: No coverage
Life Insurance (Death) .................................................................................$__________________Option 1: Premium: $180 annually
Coverage = $30,000 coverageOption 2: Premium: $120 annually
Coverage = $20,000 coverageOption 3: Premium: $60 annually
Coverage = $10,000 coverageOption 4: No coverage
Total Annual Insurance Premiums ..............................................................$__________________
Making Personal Finance Decisions©2019, Minnesota Council on Economic Education. Developed in partnership with the Federal Reserve Bank of St. Louis. Permission is granted to reprint or photocopy this lesson in its entirety for educational purposes, provided the user credits the Minnesota Council on Economic Education. 251
Lesson 10B: Is Insurance Worth Buying? Unit 10: Protecting
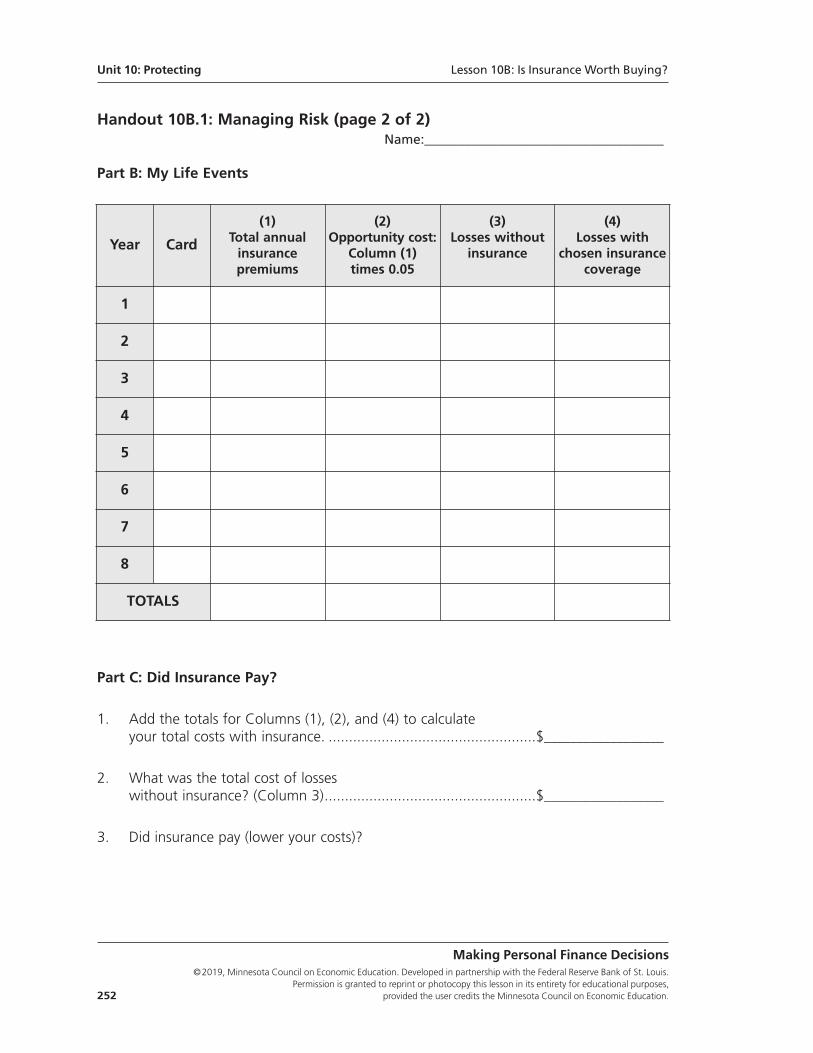
Handout 10B.1: Managing Risk (page 2 of 2)Name:____________________________________
Part B: My Life Events
Part C: Did Insurance Pay?
1. Add the totals for Columns (1), (2), and (4) to calculate your total costs with insurance. ...................................................$__________________
2. What was the total cost of losses without insurance? (Column 3)....................................................$__________________
3. Did insurance pay (lower your costs)?
Making Personal Finance Decisions©2019, Minnesota Council on Economic Education. Developed in partnership with the Federal Reserve Bank of St. Louis.
Permission is granted to reprint or photocopy this lesson in its entirety for educational purposes, 252 provided the user credits the Minnesota Council on Economic Education.
Year Card
(1)Total annualinsurance premiums
(2)Opportunity cost:
Column (1)times 0.05
(3)Losses without
insurance
(4)Losses with
chosen insurancecoverage
1
2
3
4
5
6
7
8
TOTALS
Unit 10: Protecting Lesson 10B: Is Insurance Worth Buying?
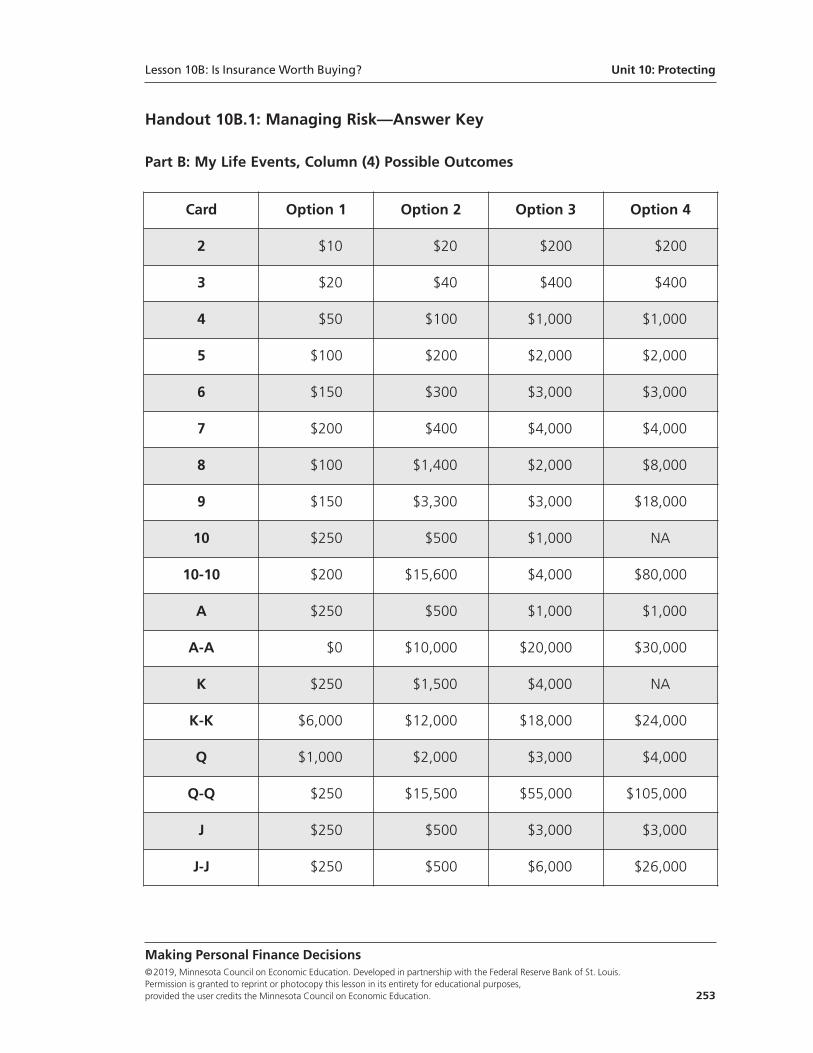
Handout 10B.1: Managing Risk—Answer Key
Part B: My Life Events, Column (4) Possible Outcomes
Making Personal Finance Decisions©2019, Minnesota Council on Economic Education. Developed in partnership with the Federal Reserve Bank of St. Louis. Permission is granted to reprint or photocopy this lesson in its entirety for educational purposes, provided the user credits the Minnesota Council on Economic Education. 253
Card Option 1 Option 2 Option 3 Option 4
2 $10 $20 $200 $200
3 $20 $40 $400 $400
4 $50 $100 $1,000 $1,000
5 $100 $200 $2,000 $2,000
6 $150 $300 $3,000 $3,000
7 $200 $400 $4,000 $4,000
8 $100 $1,400 $2,000 $8,000
9 $150 $3,300 $3,000 $18,000
10 $250 $500 $1,000 NA
10-10 $200 $15,600 $4,000 $80,000
A $250 $500 $1,000 $1,000
A-A $0 $10,000 $20,000 $30,000
K $250 $1,500 $4,000 NA
K-K $6,000 $12,000 $18,000 $24,000
Q $1,000 $2,000 $3,000 $4,000
Q-Q $250 $15,500 $55,000 $105,000
J $250 $500 $3,000 $3,000
J-J $250 $500 $6,000 $26,000
Lesson 10B: Is Insurance Worth Buying? Unit 10: Protecting
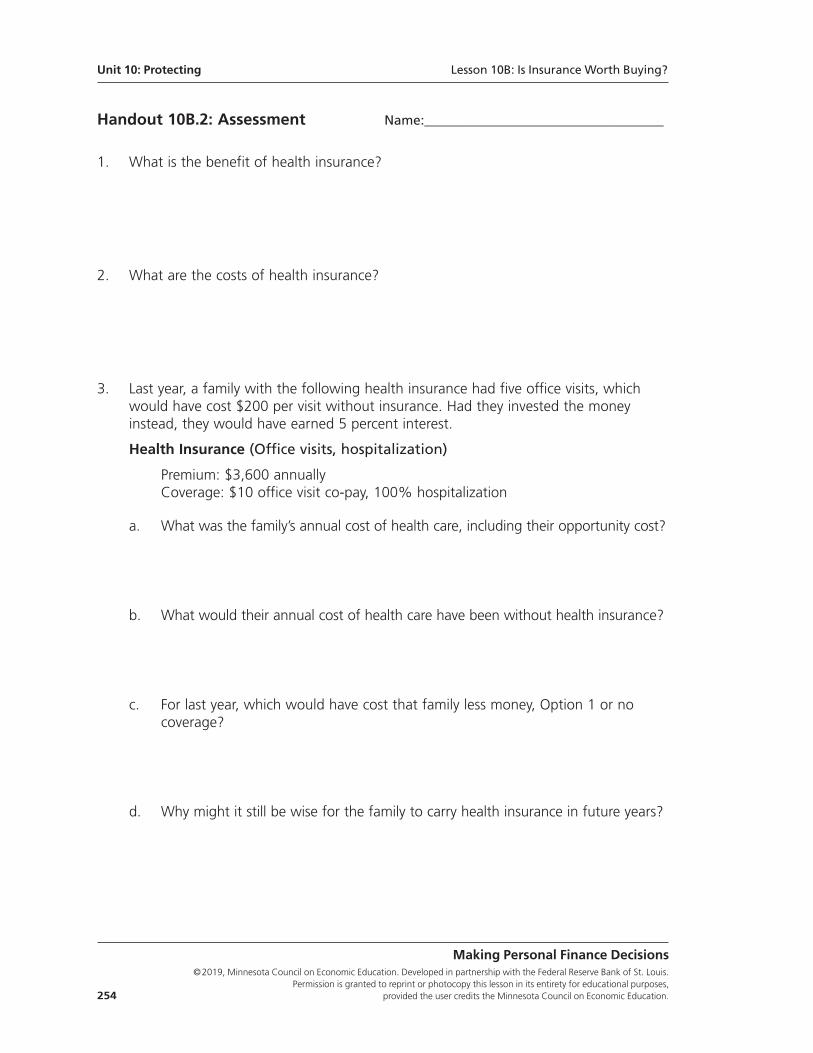
Handout 10B.2: Assessment Name:____________________________________
1. What is the benefit of health insurance?
2. What are the costs of health insurance?
3. Last year, a family with the following health insurance had five office visits, which would have cost $200 per visit without insurance. Had they invested the money instead, they would have earned 5 percent interest.
Health Insurance (Office visits, hospitalization)
Premium: $3,600 annuallyCoverage: $10 office visit co-pay, 100% hospitalization
a. What was the family’s annual cost of health care, including their opportunity cost?
b. What would their annual cost of health care have been without health insurance?
c. For last year, which would have cost that family less money, Option 1 or no coverage?
d. Why might it still be wise for the family to carry health insurance in future years?
Making Personal Finance Decisions©2019, Minnesota Council on Economic Education. Developed in partnership with the Federal Reserve Bank of St. Louis.
Permission is granted to reprint or photocopy this lesson in its entirety for educational purposes, 254 provided the user credits the Minnesota Council on Economic Education.
Unit 10: Protecting Lesson 10B: Is Insurance Worth Buying?
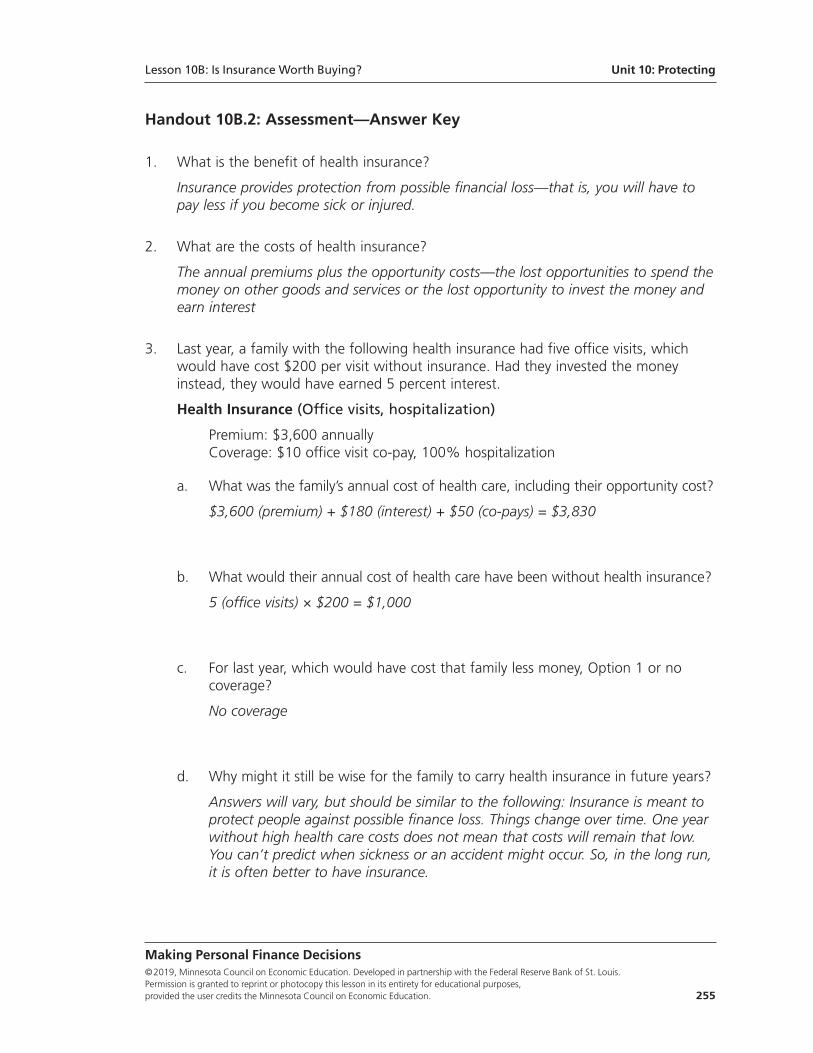
Handout 10B.2: Assessment—Answer Key
1. What is the benefit of health insurance?
Insurance provides protection from possible financial loss—that is, you will have to pay less if you become sick or injured.
2. What are the costs of health insurance?
The annual premiums plus the opportunity costs—the lost opportunities to spend themoney on other goods and services or the lost opportunity to invest the money and earn interest
3. Last year, a family with the following health insurance had five office visits, which would have cost $200 per visit without insurance. Had they invested the money instead, they would have earned 5 percent interest.
Health Insurance (Office visits, hospitalization)
Premium: $3,600 annuallyCoverage: $10 office visit co-pay, 100% hospitalization
a. What was the family’s annual cost of health care, including their opportunity cost?
$3,600 (premium) + $180 (interest) + $50 (co-pays) = $3,830
b. What would their annual cost of health care have been without health insurance?
5 (office visits) × $200 = $1,000
c. For last year, which would have cost that family less money, Option 1 or no coverage?
No coverage
d. Why might it still be wise for the family to carry health insurance in future years?
Answers will vary, but should be similar to the following: Insurance is meant to protect people against possible finance loss. Things change over time. One year without high health care costs does not mean that costs will remain that low. You can’t predict when sickness or an accident might occur. So, in the long run, it is often better to have insurance.
Making Personal Finance Decisions©2019, Minnesota Council on Economic Education. Developed in partnership with the Federal Reserve Bank of St. Louis. Permission is granted to reprint or photocopy this lesson in its entirety for educational purposes, provided the user credits the Minnesota Council on Economic Education. 255
Lesson 10B: Is Insurance Worth Buying? Unit 10: Protecting
Standards and Benchmarks
National Standards for Financial Literacy
Standard 6: Protecting and Insuring. People make choices to protect themselves fromthe financial risk of lost income, assets, health, or identity. They can choose to accept risk,reduce risk, or transfer risk to others. Insurance allows people to transfer risk by paying afee now to avoid the possibility of a larger loss later. The price of insurance is influencedby an individual’s behavior.
• Benchmarks: Grade 81. Personal financial risk exists when unexpected events can damage health,
income, property, wealth, or future opportunities.
2. Insurance is a product that allows people to pay a fee (called a premium) now to transfer the costs of a potential loss to a third party.
3. Insurance companies analyze the outcomes of individuals who face similar types of risks to create insurance contracts (policies). By collecting a relativelysmall amount of money, called a premium, from each policyholder on a regular basis, the company creates a pool of funds to compensate those individuals who experience a large loss.
4. Self-insurance is when an individual accepts a risk and saves money on a regular basis to cover a potential loss.
5. Insurance policies that guarantee higher levels of payment in the event of aloss (coverage) have higher prices.
6. Insurance companies charge higher premiums to cover higher-risk individualsand events because the risk of monetary loss is greater for these individualsand events.
7. Individuals can choose to accept some risk, to take steps to avoid or reducerisk, or to transfer risk to others through the purchase of insurance. Each option has different costs and benefits.
• Benchmarks: Grade 122. Individuals vary with respect to their willingness to accept risk. Most people
are willing to pay a small cost now if it means they can avoid a possible larger loss later.
4. People choose different amounts of insurance coverage based on their will-ingness to accept risk, as well as their occupation, lifestyle, age, financial profile, and the price of insurance.
9. Disability insurance is income insurance that provides funds to replace income lost while an individual is ill or injured and unable to work.
10. Property and casualty insurance (including renters insurance) pays for damageor loss to the insured’s property and often includes liability coverage for actions of the insured that cause harm to other people or their property.
11. Life insurance benefits are paid to the insured’s beneficiaries in the event ofthe policyholder’s death. These payments can be used to replace wages lostwhen the insured person dies.
Making Personal Finance Decisions©2019, Minnesota Council on Economic Education. Developed in partnership with the Federal Reserve Bank of St. Louis.
Permission is granted to reprint or photocopy this lesson in its entirety for educational purposes, 256 provided the user credits the Minnesota Council on Economic Education.
Unit 10: Protecting Lesson 10B: Is Insurance Worth Buying?