Embed Size (px)
Citation preview
LIVING THE VISIONA N N U A L R E P O R T 2 0 1 4 - 1 5
Forward-looking statementsIn this Annual Report, we have disclosed forward-looking information to enable investors to comprehend our prospects and take investment decisions. This report and other statements - written and oral – that we periodically make contain forward-looking statements that set out anticipated results based on the management’s plans and assumptions. We have tried wherever possible to identify such statements by using words such as ‘anticipate’, ‘estimate’, ‘expects’, ‘projects’, ‘intends’, ‘plans’, ‘believes’, and words of similar substance in connection with any discussion of future performance. We cannot guarantee that these forward-looking statements will be realised, although we believe we have been prudent in assumptions. The achievements of results are subject to risks, uncertainties, and even inaccurate assumptions. Should known or unknown risks or uncertainties materialise, or should underlying assumptions prove inaccurate, actual results could vary materially from those anticipated, estimated, or projected. Readers should keep this in mind. We undertake no obligation to publicly update any forward-looking statements, whether as a result of new information, future events or otherwise.
Contents
Corporate Overview
Statutory Reports
Financial Statements
02 Growing our value proposition
04 Strategic framework
05 Best-in-class facilities
06 Year at a glance
08 Message from the Managing Director
10 Conversation with the Chief Financial Officer
14 Animal health makes a difference to our lives
18 Human health is a consistently growing focus area
20 Customer insight drives global expansion
22 Thinking afresh builds a sustainable business
23 Our 360o quality approach follows clockwork precision
24 Product portfolio
26 Board of Directors
28 Management Discussion and Analysis
38 Directors’ Report
76 Corporate Governance Report
Standalone Financials
92 Independent Auditors’ Report
96 Balance Sheet
97 Statement of Profit and Loss
98 Cash Flow Statement
100 Notes
Consolidated Financials
121 Independent Auditors’ Report
126 Balance Sheet
127 Statement of Profit and Loss
128 Cash Flow Statement
130 Notes

We strengthened the prominence of Alivira, our animal health brand. We have an integrated platform (Animal Health API and formulations) to address the real-world challenges of those who raise and care for animals.
We are also expediting our growth in Human Health API with focus on niche molecules. These molecules involve low volumes, yet high levels of technological knowhow; and are hence margin accretive in a competitive market scenario.
As a future-focused business, our vision has always been to emerge as a valuable, independent and integrated player in the domains of Animal Health (APIs and finished dosage formulations), Human Health (APIs) and analytical services. Over the years, our strategies have always been aligned to this overarching objective.
FY 2014-15 saw us taking significant steps in that direction.
In line with our stated intent last year, we exited from non-core operations to channelise our energies on core business. We also raised capital to fund our growth momentum.
Not just that, we enhanced our investments and efforts in developing R&D expertise in our areas of focus. Our research efforts are focusing on the emerging priorities in the human and animal health sectors.
We are living the vision.
As the burgeoning global population, increasing middle class and rising urbanisation stimulate demand in our areas of focus, we are committed to create sustainable value and grow organically and inorganically.
We are working hard. We are making the most of the opportunity landscape.
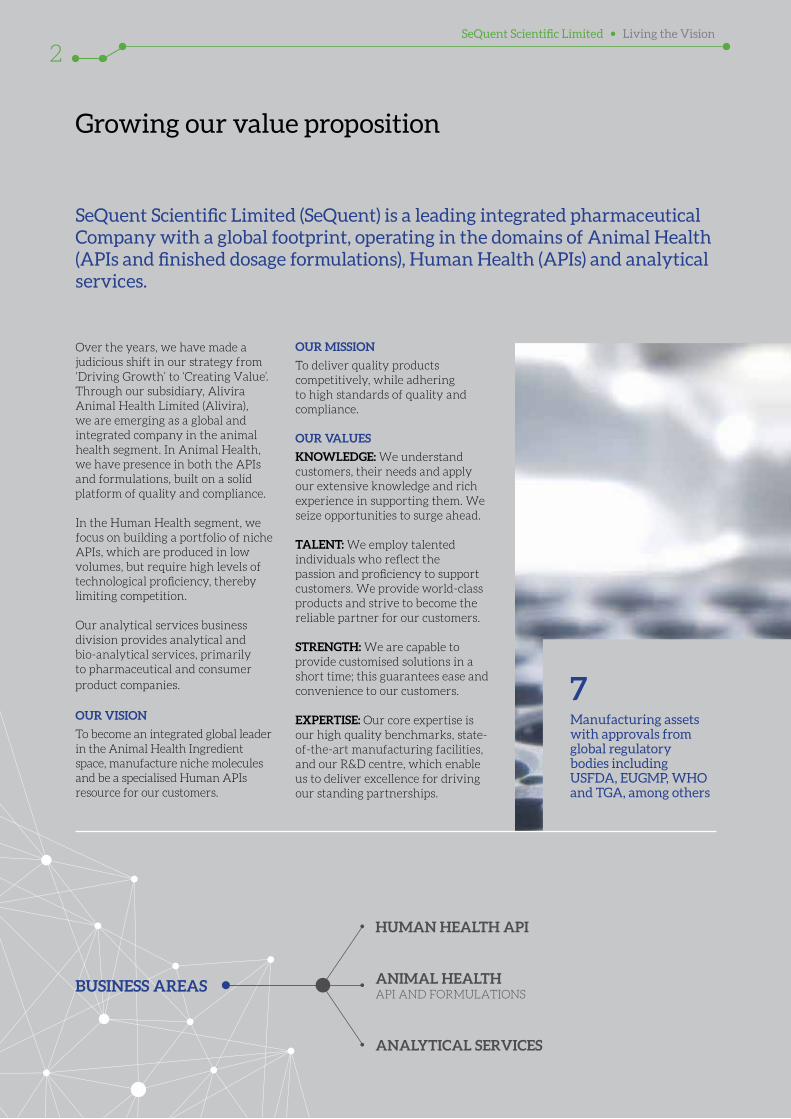
Growing our value proposition
Over the years, we have made a judicious shift in our strategy from ‘Driving Growth’ to ‘Creating Value’. Through our subsidiary, Alivira Animal Health Limited (Alivira), we are emerging as a global and integrated company in the animal health segment. In Animal Health, we have presence in both the APIs and formulations, built on a solid platform of quality and compliance.
In the Human Health segment, we focus on building a portfolio of niche APIs, which are produced in low volumes, but require high levels of technological proficiency, thereby limiting competition.
Our analytical services business division provides analytical and bio-analytical services, primarily to pharmaceutical and consumer product companies.
OUR VISION
To become an integrated global leader in the Animal Health Ingredient space, manufacture niche molecules and be a specialised Human APIs resource for our customers.
HUMAN HEALTH API
ANIMAL HEALTH API AND FORMULATIONS
ANALYTICAL SERVICES
SeQuent Scientific Limited (SeQuent) is a leading integrated pharmaceutical Company with a global footprint, operating in the domains of Animal Health (APIs and finished dosage formulations), Human Health (APIs) and analytical services.
OUR MISSION
To deliver quality products competitively, while adhering to high standards of quality and compliance.
OUR VALUES
KNOWLEDGE: We understand customers, their needs and apply our extensive knowledge and rich experience in supporting them. We seize opportunities to surge ahead.
TALENT: We employ talented individuals who reflect the passion and proficiency to support customers. We provide world-class products and strive to become the reliable partner for our customers.
STRENGTH: We are capable to provide customised solutions in a short time; this guarantees ease and convenience to our customers.
EXPERTISE: Our core expertise is our high quality benchmarks, state-of-the-art manufacturing facilities, and our R&D centre, which enable us to deliver excellence for driving our standing partnerships.
BUSINESS AREAS
Manufacturing assets with approvals from global regulatorybodies including USFDA, EUGMP, WHO and TGA, among others
7
SeQuent Scientific Limited Living the Vision
2
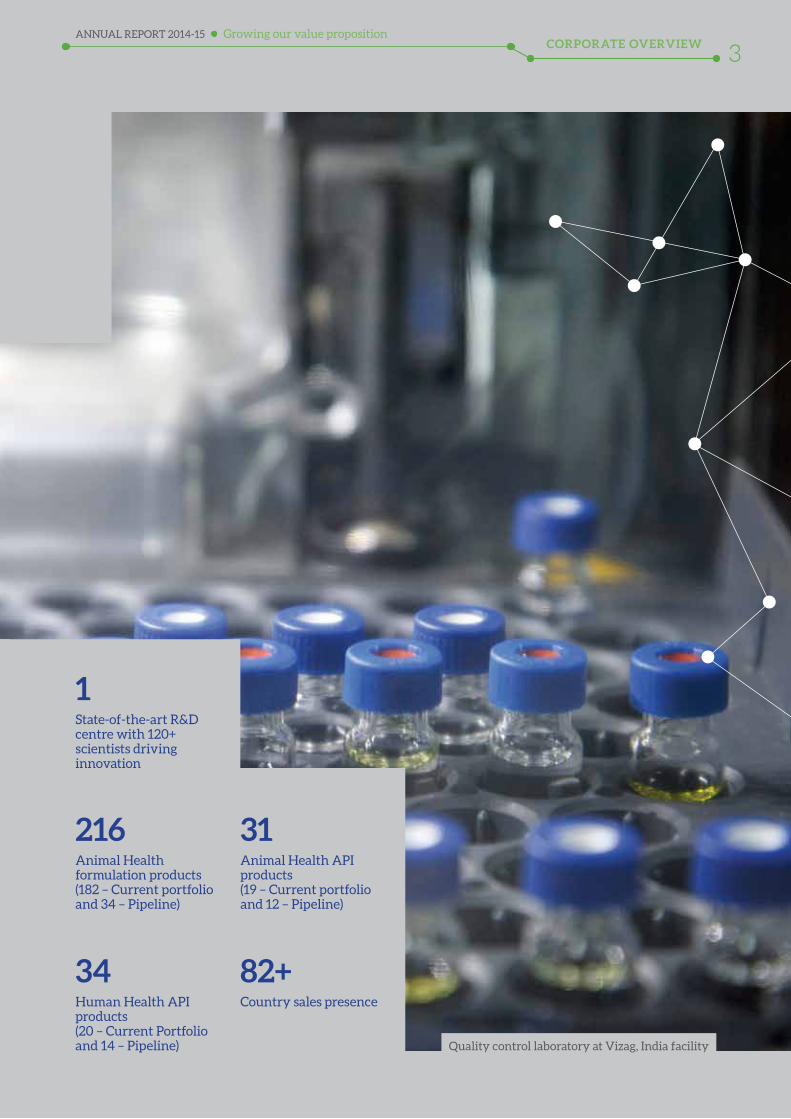
State-of-the-art R&D centre with 120+ scientists driving innovation
1
Animal Health formulation products(182 – Current portfolio and 34 – Pipeline)
Animal Health API products(19 – Current portfolio and 12 – Pipeline)
Human Health API products(20 – Current Portfolio and 14 – Pipeline)
Country sales presence
216 31
34 82+
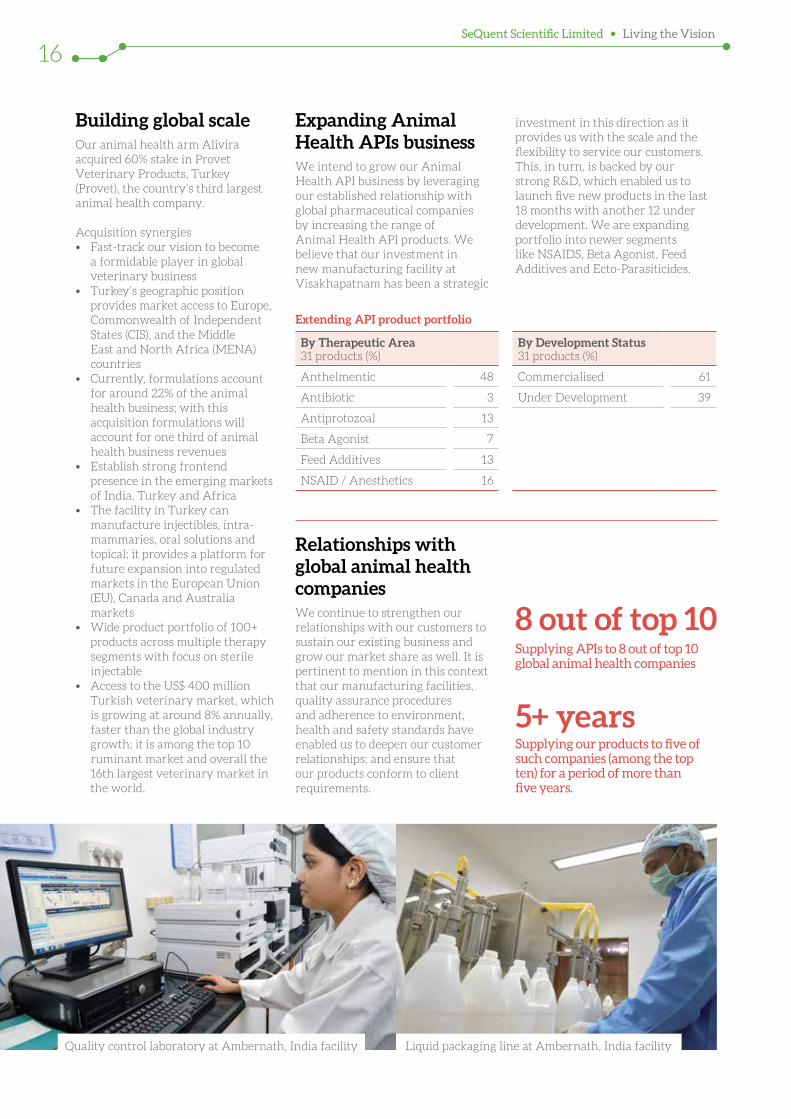
Quality control laboratory at Vizag, India facility
Growing our value propositionCORPORATE OVERVIEW
ANNUAL REPORT 2014-15
3
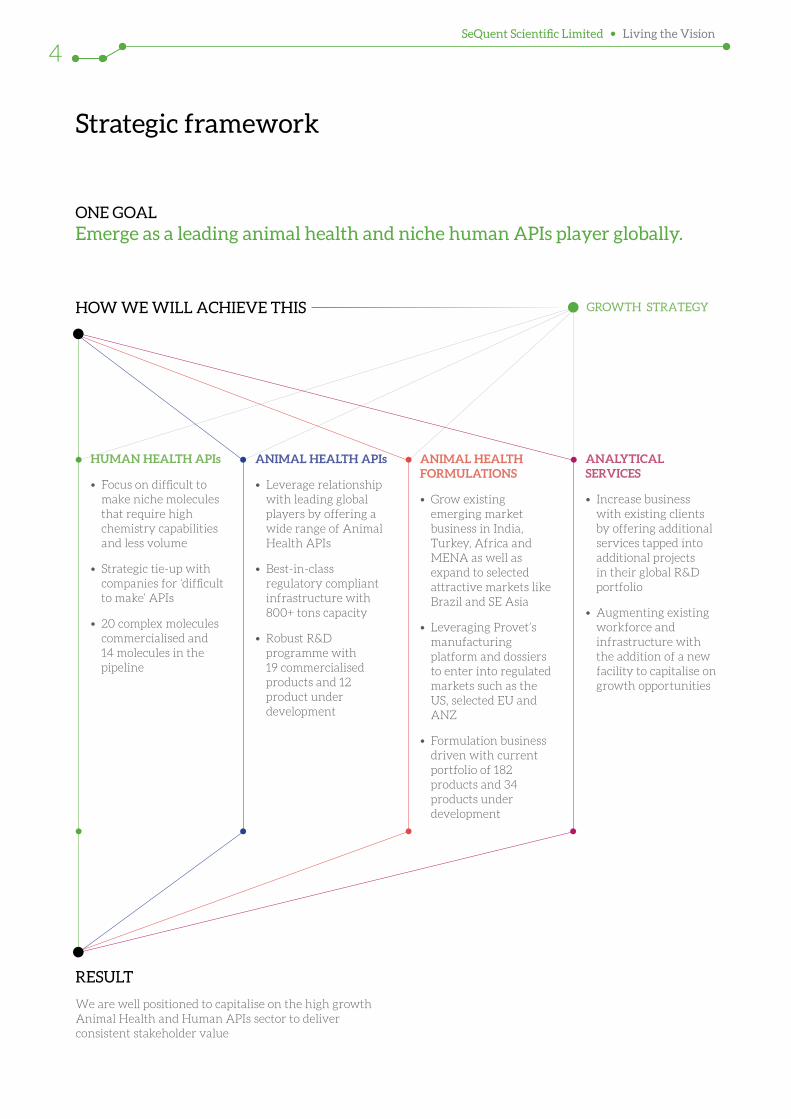
Strategic framework
ANIMAL HEALTH APIs
• Leverage relationship with leading global players by offering a wide range of Animal Health APIs
• Best-in-class regulatory compliant infrastructure with 800+ tons capacity
• Robust R&D programme with 19 commercialised products and 12 product under development
ANIMAL HEALTH FORMULATIONS
• Grow existing emerging market business in India, Turkey, Africa and MENA as well as expand to selected attractive markets like Brazil and SE Asia
• Leveraging Provet’s manufacturing platform and dossiers to enter into regulated markets such as the US, selected EU and ANZ
• Formulation business driven with current portfolio of 182 products and 34 products under development
HUMAN HEALTH APIs
• Focus on difficult to make niche molecules that require high chemistry capabilities and less volume
• Strategic tie-up with companies for ‘difficult to make’ APIs
• 20 complex molecules commercialised and 14 molecules in the pipeline
ANALYTICAL SERVICES
• Increase business with existing clients by offering additional services tapped into additional projects in their global R&D portfolio
• Augmenting existing workforce and infrastructure with the addition of a new facility to capitalise on growth opportunities
GROWTH STRATEGY HOW WE WILL ACHIEVE THIS
ONE GOAL
RESULT
We are well positioned to capitalise on the high growth Animal Health and Human APIs sector to deliver consistent stakeholder value
Emerge as a leading animal health and niche human APIs player globally.
SeQuent Scientific Limited Living the Vision
4
Strategic framework + Best-in-class facilities
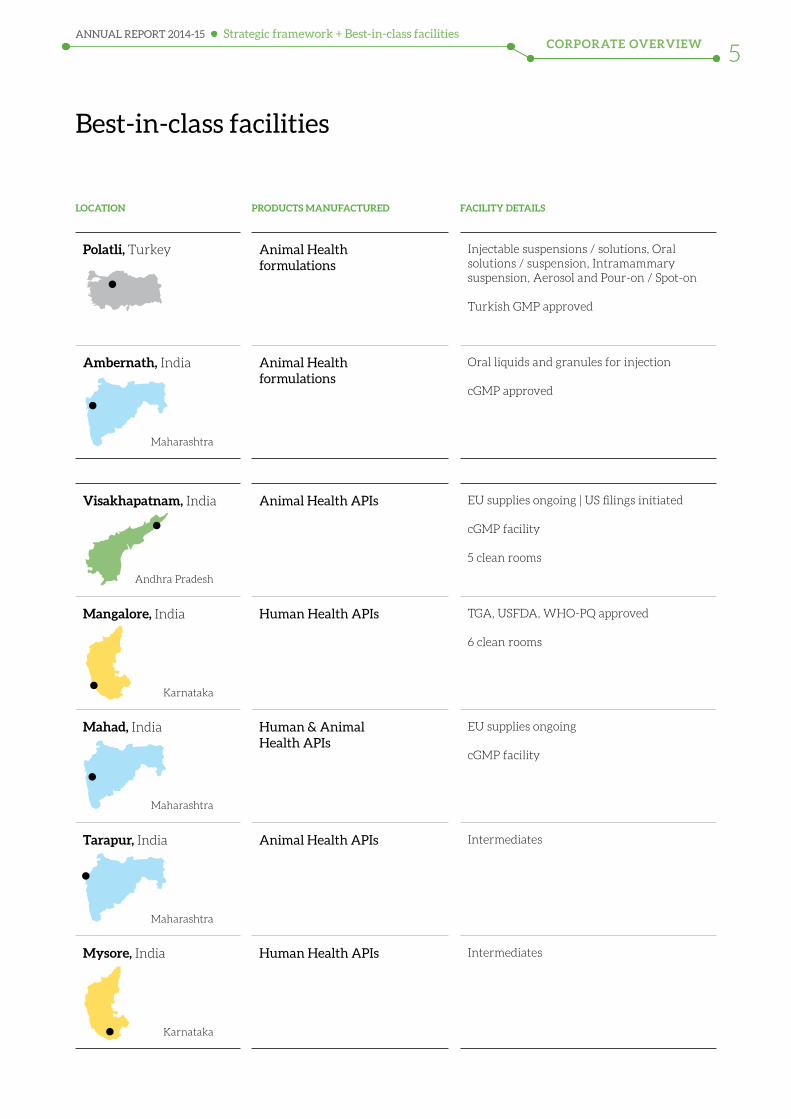
Best-in-class facilities
LOCATION PRODUCTS MANUFACTURED FACILITY DETAILS
Polatli, Turkey Animal Healthformulations
Injectable suspensions / solutions, Oral solutions / suspension, Intramammary suspension, Aerosol and Pour-on / Spot-on
Turkish GMP approved
Ambernath, India Animal Healthformulations
Oral liquids and granules for injection
cGMP approved
Visakhapatnam, India Animal Health APIs EU supplies ongoing | US filings initiated
cGMP facility
5 clean rooms
Mangalore, India Human Health APIs TGA, USFDA, WHO-PQ approved
6 clean rooms
Mahad, India Human & Animal Health APIs
EU supplies ongoing
cGMP facility
Tarapur, India Animal Health APIs Intermediates
Mysore, India Human Health APIs Intermediates
Maharashtra
Maharashtra
Maharashtra
Andhra Pradesh
Karnataka
Karnataka
CORPORATE OVERVIEWANNUAL REPORT 2014-15
5
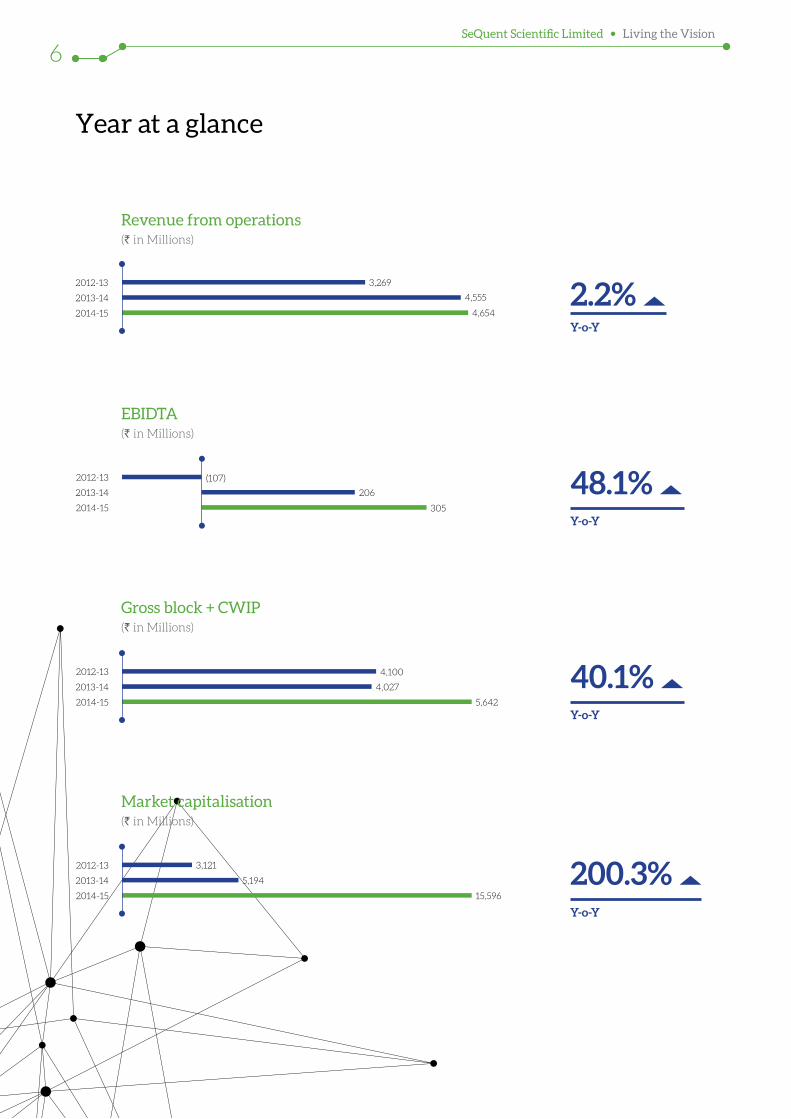
Year at a glance
2.2% Y-o-Y
48.1% Y-o-Y
40.1% Y-o-Y
200.3% Y-o-Y
2012-13
2013-14
2014-15 4,654
3,269
4,555
Revenue from operations(` in Millions)
2012-13
2013-14
2014-15
EBIDTA(` in Millions)
2012-13
2013-14
2014-15 5,642
4,100
4,027
Gross block + CWIP(` in Millions)
2012-13
2013-14
2014-15 15,596
3,121
5,194
Market capitalisation (` in Millions)
305
(107)
206
SeQuent Scientific Limited Living the Vision
6
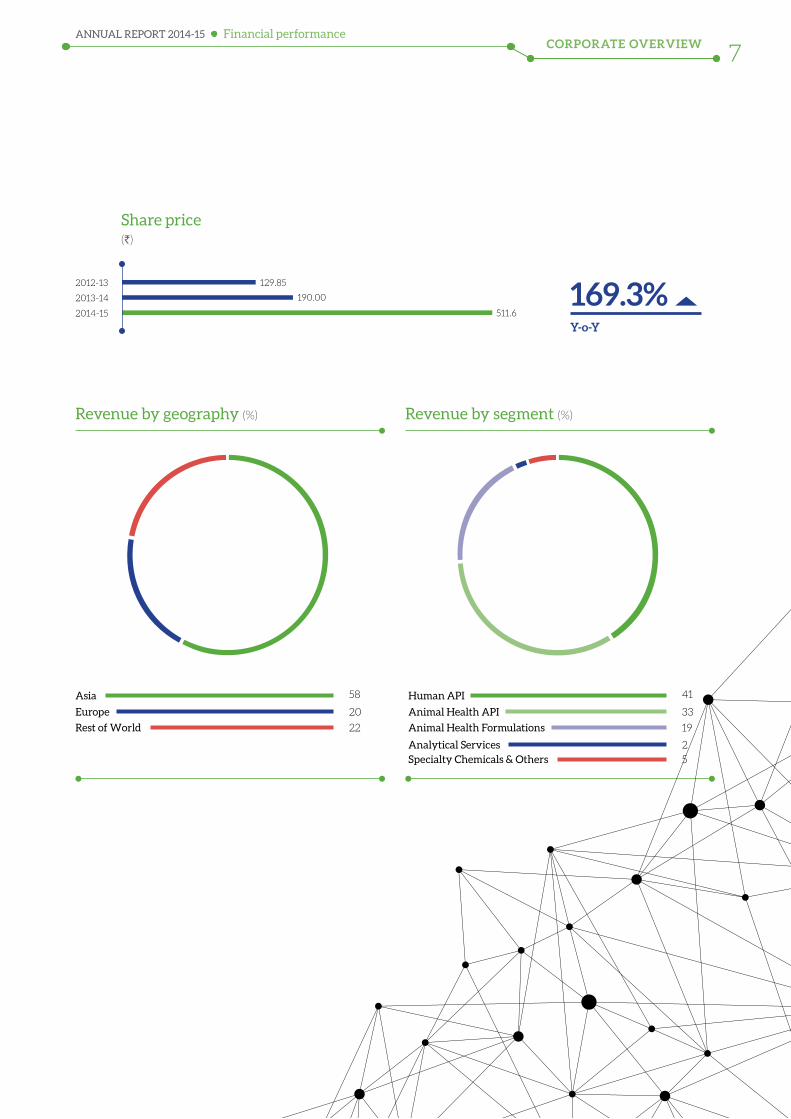
Asia 58
Rest of World 22
Europe 20
Human API 41
Animal Health Formulations
Analytical ServicesSpecialty Chemicals & Others
19
2
5
Animal Health API 33
Revenue by geography (%) Revenue by segment (%)
Financial performance
169.3% Y-o-Y
2012-13
2013-14
2014-15 511.6
129.85
190.00
Share price (`)
CORPORATE OVERVIEWANNUAL REPORT 2014-15
7
Dear Shareholders,
We have entered the new financial year 2016 with renewed confidence, strength and commitment. We believe FY 2015 was exciting, yet a remarkably eventful year for your Company. As FY 2014 came to a close, your Company had outlined its vision to drive business with a recalibrated model with a focus on core business. The outlying strategy of this model was to drive value rather than growth. I am happy to state that we have made significant progress in our efforts to be future ready and live our vision to become a leading, global and integrated company in the animal health segment, while also focussing on building core competence in niche Human Health APIs.
From a macro standpoint, the global economy in 2014 showed
Message from the Managing Director
signs of improvement, but a mix of geopolitical tensions and slow pace of reforms kept the overall growth in check. The pharmaceutical industry on the other side registered a healthy uptick for the global medicine sales on the back of momentum recovery in the developed pharmaceutical markets like the US, and significant contribution from emerging markets like China and India.
Globally, as the aging population is growing, the changing demographics, coupled with economic growth is likely to drive market to the new highs. This gives our Human Health API vertical enough upside to build a niche portfolio and maintain leadership position in it. The animal healthcare, which is a US$ 28 billion market and an important core of pharmaceutical business, is a growing industry for a couple of reasons. The industry focuses, both on the livestock and companion animals, therefore touching the life of billions of people and animals world over. The rising demand in quality animal meat and milk, changing pattern of animal diseases and increasing animal companionship has resulted in a fair growth during the course of 2015, and is expected to expand further to US$ 42 billion through 2019 at a CAGR of 7%. At SeQuent, animal health remains the mainstay and a dedicated business under the aegis of Alivira.
When you look at SeQuent in greater granularity, we strategised five key avenues as part of our effort to realign our business in the direction of profitability. I am glad to communicate that we have made headway in each of those focus areas as outlined below:
Create a valuable, independent, integrated and global animal health business In FY 2015, our veterinary business underwent a rebranding exercise to be christened as Alivira Animal Health. This was in keeping with our commitment to improve animal
Manish Gupta Managing Director
SeQuent Scientific Limited Living the Vision
8
well-being through our integrated platform addressing both the Animal Health API and formulations segment. The commissioning of our cGMP compliant API facility at Vizag was an important milestone in the lifecycle of the Company. This facility, with a total production capacity of 800 tons per annum, and adhering to exacting regulatory standards consolidates our global positioning in the world markets. In the finished dosage space, we acquired Provet (Turkey’s third largest animal health pharmaceutical company) to strengthen our presence in the emerging and regulated markets, including the US, RSA, the EU and Australia. We have announced our intent to acquire minority shares in Alivira as to make it a 100% subsidiary of SeQuent Scientific Limited. We are committed to make Alivira a globally leading animal healthcare company and the Company will leave no stone unturned to ensure that this goal is achieved.
Accelerate growth in Human Health API with focus on niche moleculesOur underlying strategy in Human Health APIs is to move away from the crowded API space and focus only on molecules, which are relatively low in volumes, need high chemistry capabilities and offer high margins. FY 2015 had been a great year with Human Health APIs singly registering over 20% of growth. From a strategic perspective, we increased the capacity in our Mangalore facility and also got into a long-term non-exclusive, royalty-free licensing agreement with Gilead for producing Sofosbuvir and Ledipasvir APIs, both used in the dosages curing Hepatitis C virus. Moreover, we completed our acquisition of manufacturing assets and business of Arvee Syntthesis, which we use for manufacturing intermediates for our Human Health pipeline. In addition, we have a land bank adjacent to our Mangalore facility for catering to the future growth.
Exit non-strategic business As we announced in the last fiscal, we have exited from non-core operations to channelise our energies on core business. We closed down our operations in Vietnam and Kenya, which were no longer strategic and also completed the divestment of our specialty chemicals division to Songwon Industrial Group in the period of August 2014. Post the commercialisation of facility at Vizag in Animal Health APIs, we discontinued operations at our manufacturing unit in Ambernath and the business of the same has already been transferred to Vizag.
Enhance our efforts in Research and Development (R&D)We have stepped up our investments and efforts in developing expertise in our areas of focus. Today, we are a 150+ team of scientists and intellectuals working both in the APIs and formulations space. The R&D team today has been pivotal in building our Animal Health API portfolio strong with 19 active products and a rich pipeline of 12 products. The Human Health API basket comprises 20 products with over 14 products under different stages of development. We have also increased our total regulatory filings to 19 Drug master files in the Human Health segment.
Scale our analytical services Through our subsidiary, Sequent Research Limited, we forayed into contract research services with our specialisation in Analytical and Bio Analytical Services. During the year, we registered a 14% uptick in sales. We enhanced the scope of services to our existing clientele and acquired new business with leading global companies. I believe, we are moving in the right direction and our focus continues to be the best-in-class analytical service provider for pharmaceutical (human and veterinary), nutraceutical and personal care industry.
Message from the Managing Director
While the financial performance of the Company was under pressure in FY 2015, we believe the Company has judiciously used its resources to carve way for smoother operations in the years to come. Going forward, we have the launch pad for the multi-billion dollar animal healthcare opportunity that we foresee. We intend to forge partnerships and collaboration with leading companies in the regulatory markets, and we are confident of a robust growth. In the Human Health, we have invested in facilities and strategic arrangements to safeguard our future business interest. We are focussed on the development and supply of high value, low volume APIs and grow both organically or inorganically
In the end, I would also like to thank our stakeholders for unstinting faith in your Company, its management and business. With your confidence, we have successfully closed a QIP of ` 4,000 million in the ongoing FY 2016. This QIP was an important milestone to augment our resources and fund our long-term capital expenditure. I also take this opportunity to thank our customers, employees, partners, suppliers, regulatory agencies and lenders for their continued trust and support.
Regards Manish
CORPORATE OVERVIEWANNUAL REPORT 2014-15
9
Q. Can you share the key aspects of financial performance of SeQuent in FY 2015?
A. We registered a topline of ` 4,531.8 million in FY 2015, which is nearly flat over the previous year. This was primarily due to divestment of our specialty chemical division during the course of year. Eliminating the effect of the discontinued operations from the previous year, we have grown over 13% from ` 3,988.4 million in FY 2014 to ` 4,531.8 million in FY 2015. The API business accounted for a moderate growth of 1.9%, as a result of headwinds in the animal APIs business. We acquired 60% stake in Turkey’s Provet Veterinary products, which catalysed our foray into global finished dosage markets. This resulted in a yearly growth of 98% in the finished dosage revenues
Conversation with the Chief Financial Officer
We have made some strategic moves to enhance our business capacity, and inorganic growth has been one such route. Our subsidiary, Alivira acquired the manufacturing facility at Visakhapatnam from Shasun Pharmaceuticals Limited, which serves as a facility for Animal Health business. We also entered into a transaction with M/s Arvee for the transfer of its business and facility of manufacturing pharmaceutical products at Mysore to our Company for our Human Health business.
Kannan PRChief Financial officer
SeQuent Scientific Limited Living the Vision
10
for the Company. The analytical services business contributed 2% in the overall business and the segment grew 14% over the previous year.
During the year, we sold our products in over 82 countries, globally. The economic downturn in the EU affected our revenues with our total revenues from Europe reducing by 8% to ` 949.5 million. The revenues from the rest of world (excluding Asia) witnessed a robust upswing of 62% from ` 623.9 million to ` 1,012.8 million. This was largely on account of our acquisition of Provet. The business in Asia registered a 7% downfall on account of divested business.
At the EBITDA level, we registered an upswing of 36% with EBITDA of ` 280.8 million against ` 206.3 million in the previous year. The Company’s net loss accounted for ` 107.4 million and it takes into account the exceptional net loss of ` 166.6 million, resulting from impairment of discontinuing our manufacturing operations at Ambernath API facility following the commencement of operations at Vizag.
Q. What have been the major corporate actions during the year?
A. We have made some strategic moves to enhance our business capacity and inorganic growth has been one such route. Our subsidiary, Alivira acquired the manufacturing facility at Visakhapatnam from Shasun Pharmaceuticals Limited, which serves as a facility for Animal Health business. We also entered into a transaction with M/s Arvee for the transfer of its business and facility of manufacturing pharmaceutical products at Mysore to our Company for our Human Health business.
In the finished dosage space, we acquired 60% of ordinary shares
of Provet (through its subsidiary – Alivira Ireland) pursuant to a share purchase agreement dated 9 September 2014. Provet is involved in the business of manufacturing animal health formulations in the Turkey; it also provides us with the commercial platform through which we intend to sell our Animal Health formulation products in regulated markets such as the US, the EU and Australia.
We believe that these corporate actions would be significant factors that will accelerate the growth of our product portfolio, the markets we operate in and finally on our financial performance.
Q. Can you elaborate on the divestment activity that was initiated in FY 2014?
A. To realign our business model as a part of our core strategy, we divested our Speciality Chemicals Division, along with all related assets and liabilities by means of a ‘going concern’ to Songwon for a consideration of ` 1,068.46 million. This sale was completed on 1 August 2014. We discontinued our manufacturing operations at Ambernath API facility in light of the commencement of operations at Visakhapatnam.
Q. What is the capital expenditure and amount invested in FY 2015?
A. In the last couple of years, we have been investing in facilities to augment our resource base and be future ready. We incurred significant expenditures in upgrading capacities at our manufacturing facilities. During FY 2015, the outflows in the form of purchase of fixed assets including capital advances were ` 909.3 million. As on 31 March 2015, we have tangible assets of ` 3,901.9 million against ` 2,168.7
million as on 31 March 2014. The net intangible assets stand at ` 131.8 million, compared to ` 112.7 million in 2014. We have a capital work-in- progress of ` 367.41 million with intangible assets under development of ` 23.2 million.
Going forward, to grow our Animal Health formulations business, we may incur significant expenditures on R&D; and for either setting up a new formulation manufacturing facility or for acquiring an existing formulation facility. We intend to fund these capital expenditures from the proceeds of QIP and through internal accruals.
Conversation with the Chief Financial OfficerCORPORATE OVERVIEW
ANNUAL REPORT 2014-15
11
VISION TO VALUE
Sharpening our capabilities and
extending global reach
Investing in innovation
Complying with stringent quality
standards the world over
Strengthening margins through
optimised manufacturing and
supply network
Building a global animal brand through strong customer relationships
Creating a niche portfolio of human APIs
Living the vision. Loving the journey.
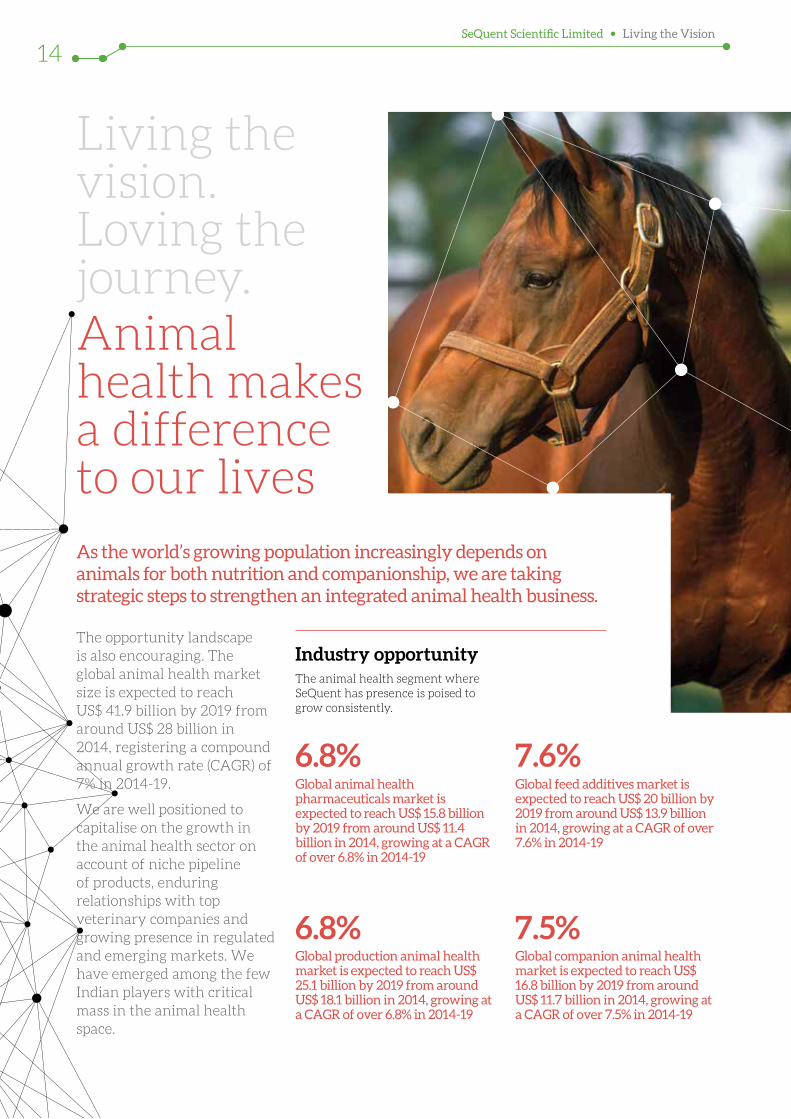
As the world’s growing population increasingly depends on animals for both nutrition and companionship, we are taking strategic steps to strengthen an integrated animal health business.
Animal health makes a difference to our lives
The opportunity landscape is also encouraging. The global animal health market size is expected to reach US$ 41.9 billion by 2019 from around US$ 28 billion in 2014, registering a compound annual growth rate (CAGR) of 7% in 2014-19.
We are well positioned to capitalise on the growth in the animal health sector on account of niche pipeline of products, enduring relationships with top veterinary companies and growing presence in regulated and emerging markets. We have emerged among the few Indian players with critical mass in the animal health space.
Industry opportunity The animal health segment where SeQuent has presence is poised to grow consistently.
Global animal health pharmaceuticals market is expected to reach US$ 15.8 billion by 2019 from around US$ 11.4 billion in 2014, growing at a CAGR of over 6.8% in 2014-19
Global production animal health market is expected to reach US$ 25.1 billion by 2019 from around US$ 18.1 billion in 2014, growing at a CAGR of over 6.8% in 2014-19
Global feed additives market is expected to reach US$ 20 billion by 2019 from around US$ 13.9 billion in 2014, growing at a CAGR of over 7.6% in 2014-19
Global companion animal health market is expected to reach US$ 16.8 billion by 2019 from around US$ 11.7 billion in 2014, growing at a CAGR of over 7.5% in 2014-19
6.8%
6.8%
7.6%
7.5%
SeQuent Scientific Limited Living the Vision
14
From thought to action
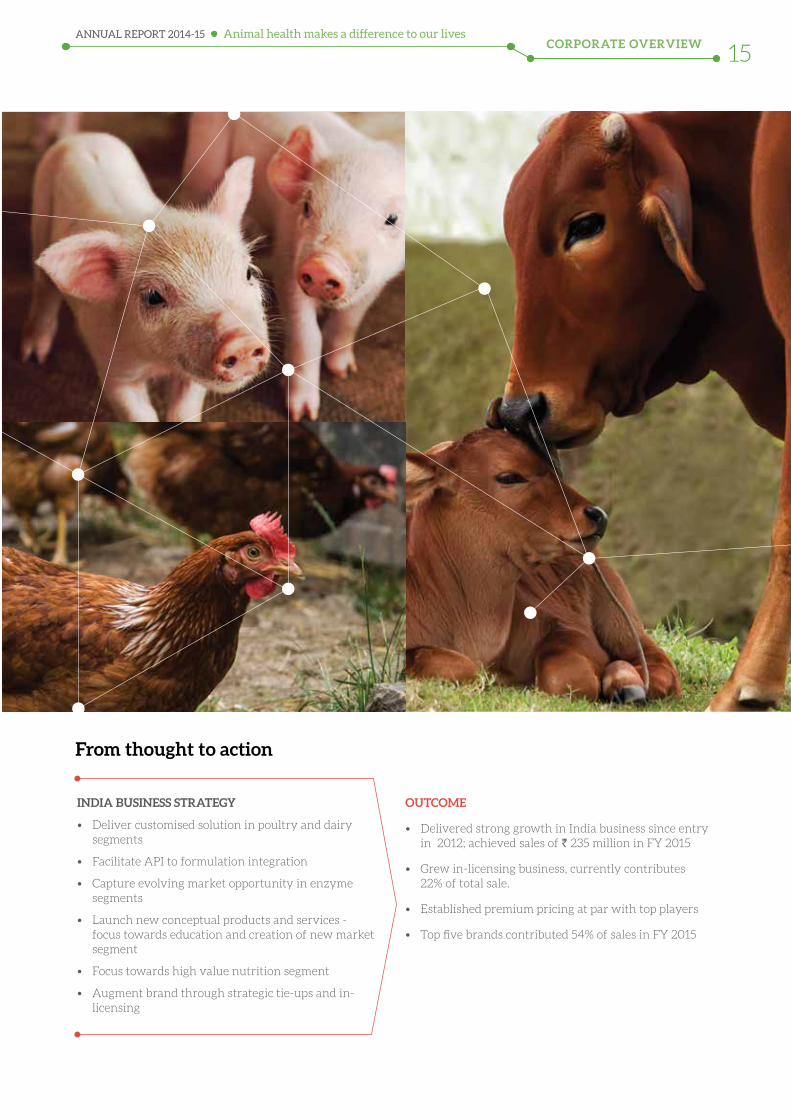
INDIA BUSINESS STRATEGY
• Deliver customised solution in poultry and dairy segments
• Facilitate API to formulation integration
• Capture evolving market opportunity in enzyme segments
• Launch new conceptual products and services - focus towards education and creation of new market segment
• Focus towards high value nutrition segment
• Augment brand through strategic tie-ups and in-licensing
OUTCOME
• Delivered strong growth in India business since entry in 2012; achieved sales of ` 235 million in FY 2015
• Grew in-licensing business, currently contributes 22% of total sale.
• Established premium pricing at par with top players
• Top five brands contributed 54% of sales in FY 2015
Animal health makes a difference to our livesCORPORATE OVERVIEW
ANNUAL REPORT 2014-15
15
Building global scale Our animal health arm Alivira acquired 60% stake in Provet Veterinary Products, Turkey (Provet), the country’s third largest animal health company.
Acquisition synergies• Fast-track our vision to become
a formidable player in global veterinary business
• Turkey’s geographic position provides market access to Europe, Commonwealth of Independent States (CIS), and the Middle East and North Africa (MENA) countries
• Currently, formulations account for around 22% of the animal health business; with this acquisition formulations will account for one third of animal health business revenues
• Establish strong frontend presence in the emerging markets of India, Turkey and Africa
• The facility in Turkey can manufacture injectibles, intra-mammaries, oral solutions and topical; it provides a platform for future expansion into regulated markets in the European Union (EU), Canada and Australia markets
• Wide product portfolio of 100+ products across multiple therapy segments with focus on sterile injectable
• Access to the US$ 400 million Turkish veterinary market, which is growing at around 8% annually, faster than the global industry growth; it is among the top 10 ruminant market and overall the 16th largest veterinary market in the world.
Expanding Animal Health APIs businessWe intend to grow our Animal Health API business by leveraging our established relationship with global pharmaceutical companies by increasing the range of Animal Health API products. We believe that our investment in new manufacturing facility at Visakhapatnam has been a strategic
By Therapeutic Area 31 products (%)
By Development Status 31 products (%)
Anthelmentic 48 Commercialised 61
Antibiotic 3 Under Development 39
Antiprotozoal 13
Beta Agonist 7
Feed Additives 13
NSAID / Anesthetics 16
investment in this direction as it provides us with the scale and the flexibility to service our customers. This, in turn, is backed by our strong R&D, which enabled us to launch five new products in the last 18 months with another 12 under development. We are expanding portfolio into newer segments like NSAIDS, Beta Agonist, Feed Additives and Ecto-Parasiticides.
Extending API product portfolio
Relationships with global animal health companiesWe continue to strengthen our relationships with our customers to sustain our existing business and grow our market share as well. It is pertinent to mention in this context that our manufacturing facilities, quality assurance procedures and adherence to environment, health and safety standards have enabled us to deepen our customer relationships; and ensure that our products conform to client requirements.
Supplying APIs to 8 out of top 10 global animal health companies
8 out of top 10
Supplying our products to five of such companies (among the top ten) for a period of more than five years.
5+ years
Quality control laboratory at Ambernath, India facility Liquid packaging line at Ambernath, India facility
SeQuent Scientific Limited Living the Vision
16
Way forwardAfter becoming a prominent player in India, Africa and Turkey, we are now enhancing our focus on regulated markets.
India• Launch new products including
calf milk replacer
• Establish direct to retail marketing for Over-the-counter (OTC / nutraceuticals
• Invested in best-in-class manufacturing unit to provide better quality assurance
Emerging markets• Facilitate portfolio maximisations
and new product development
• Pursue inorganic opportunities to enter Brazil, one of the fastest growing animal health markets
• Initiate market development across South East Asia, MENA and CIS
• Drive growth in feed supplement across select markets
Regulated markets• Offer a portfolio of 90+ products
for the regulated markets with 27 products in FY 2016
• Evaluate partnerships /collaborations to tap into the US and ANZ markets
• Explore opportunities for the acquisition of sales and marketing organisations in selected the EU markets
• Establish B2B arrangements in other regulated markets
Animal health makes a difference to our lives
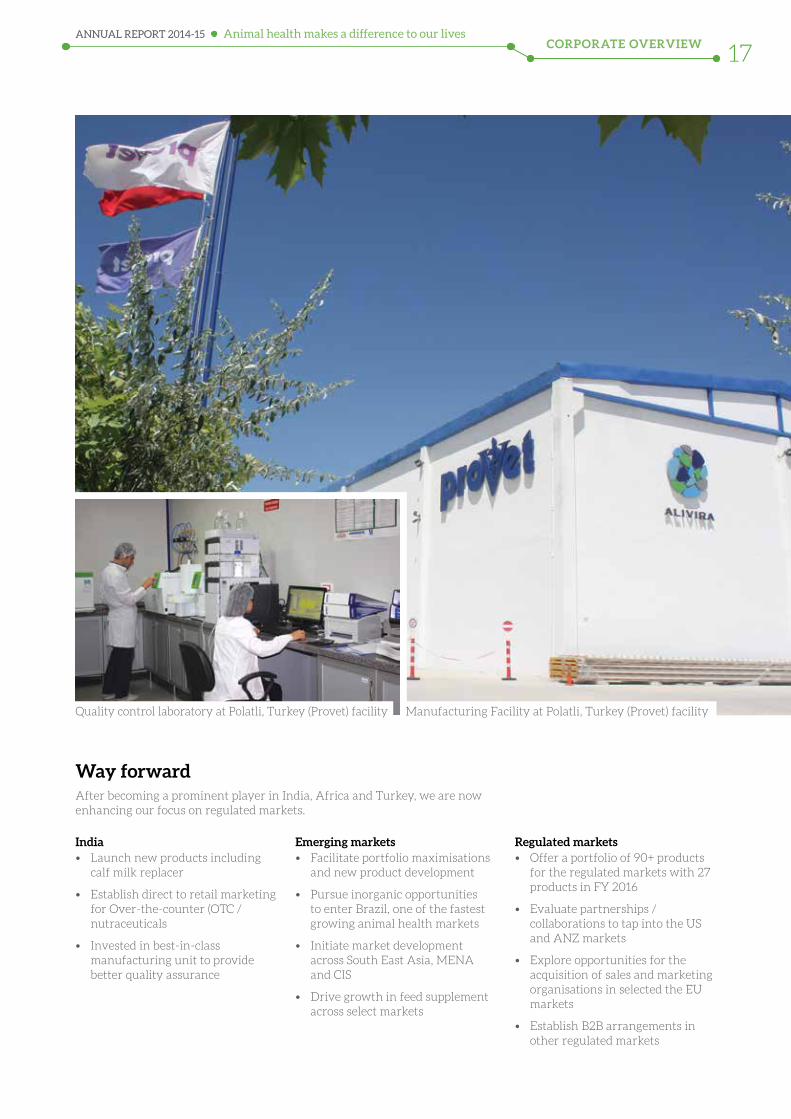
Quality control laboratory at Polatli, Turkey (Provet) facility Manufacturing Facility at Polatli, Turkey (Provet) facility
CORPORATE OVERVIEWANNUAL REPORT 2014-15
17

That’s the logical conclusion we can draw, when the global spending on medicine is expected to reach nearly US$ 1.3 trillion by 2018. It is growing at a CAGR of 4-7%. Ageing population, rising global population, growing lifestyle diseases and higher healthcare spending will drive pharmaceutical industry growth, going forward.
Human health is a consistently growing focus area
In the Human Health API business, we primarily focus on niche products. These products are produced in small volumes, but they entail technological complexity, potentially limiting competition products.
Of the current portfolio of 19 products, five have been commercialised in the US and the remaining 14 products are yet to be commercialised. We have an extensive presence across therapies like anti-malarial, anthelmintics, anti-infective, antiviral, CNS and dermatology.
We have invested in best-in-class technologies with an objective of creating an integrated, flexible unit capable of manufacturing several niche and complex APIs. The manufacturing facilities are capable of meeting the growing demand of our key products in the USFDA and WHO regulated markets.
From strength to strength
We have signed a non-exclusive royalty-free licensing agreement with Gilead to make APIs Sofosbuvir and Ledipasvir, which are used for manufacturing drugs used to treat Hepatitis C virus. Under the agreement, we will receive a complete technology pack from Gilead to enable us to scale up our production of APIs as quickly as possible. The formulations using these APIs can be distributed in 91 developing countries, which account for over 100 million people living with hepatitis C, globally.
Living the vision. Loving the journey.
SeQuent Scientific Limited Living the Vision
18
STRATEGY
• Focus on mature APIs with availability issues, low volumes and high margins
• Target high-growth markets with limited competition
• Produce technologically complex products with strong backward integration
OUTCOME
• Long-term supply agreements for two large volume APIs with two of the top global pharma companies
• Currently selling commercialised products predominantly across markets requiring WHO pre-qualification
• Recent commercialisation of five products in the US
• Possess a pipeline of 14 APIs under various stages of development
We entered into a memorandum of understanding (MoU) with Arch Pharma for operating the manufacturing facility at Medak, Andhra Pradesh and leverage their customer base.
We have also recently added new capacities at our Mangalore facility, which manufactures Human Health APIs and have acquired land near our facility at Mangalore. This we intend to use to expand our Human Health API facilities.
We have also acquired the manufacturing assets and business of Arvee at Mysore, which manufactures intermediates. These
Way forward
Going forward, we will consistently chase niche opportunities in the human API space. Moreover, we expanded our product range to service existing customer requirements in larger territories.
From thought to action
are,in turn, used to manufacture our Human Health API products. This facility has all necessary approvals and infrastructure with room for future expansion.
We have also entered into long-term contracts with two global pharmaceutical companies to supply Human Health APIs.
Addressing regulated and emerging markets Filings
USDMF 19
EDMF 1
CEP 4
WHO-GMP 7
TGA 3
Health Canada 3
Human health is a consistently growing focus areaCORPORATE OVERVIEW
ANNUAL REPORT 2014-15
19
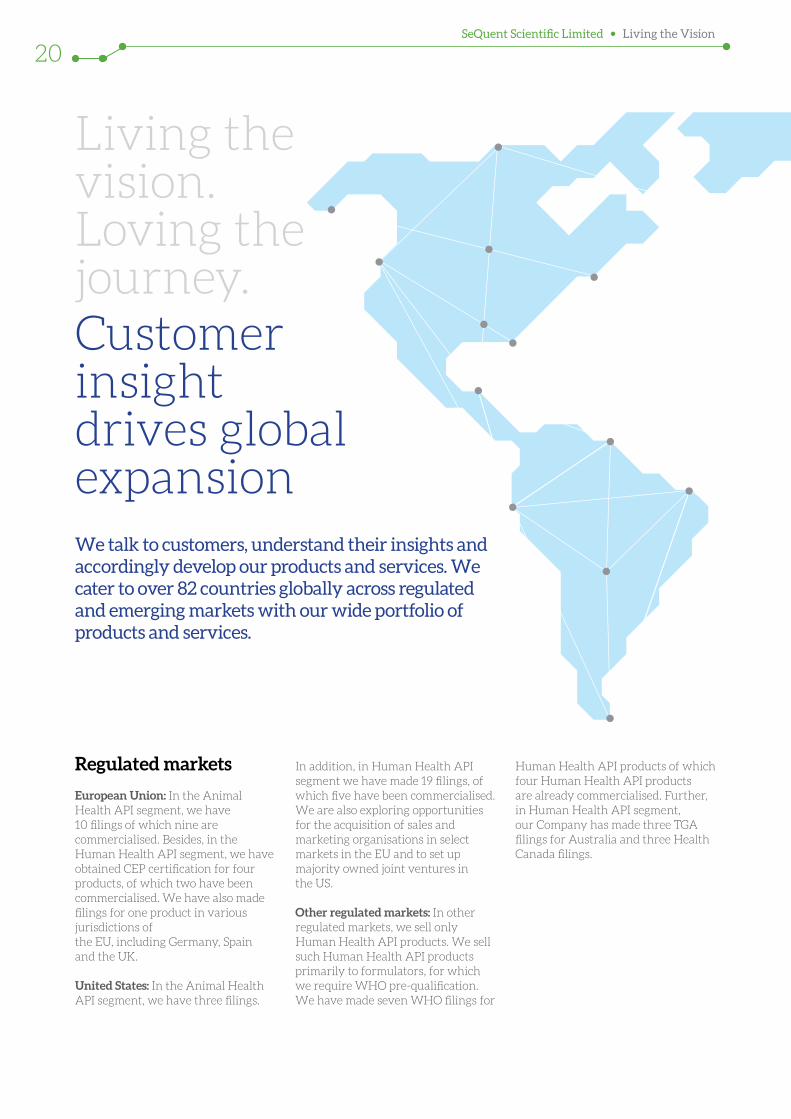
We talk to customers, understand their insights and accordingly develop our products and services. We cater to over 82 countries globally across regulated and emerging markets with our wide portfolio of products and services.
Customer insight drives global expansion
Regulated markets
European Union: In the Animal Health API segment, we have 10 filings of which nine are commercialised. Besides, in the Human Health API segment, we have obtained CEP certification for four products, of which two have been commercialised. We have also made filings for one product in various jurisdictions of the EU, including Germany, Spain and the UK.
United States: In the Animal Health API segment, we have three filings.
In addition, in Human Health API segment we have made 19 filings, of which five have been commercialised. We are also exploring opportunities for the acquisition of sales and marketing organisations in select markets in the EU and to set up majority owned joint ventures in the US.
Other regulated markets: In other regulated markets, we sell only Human Health API products. We sell such Human Health API products primarily to formulators, for which we require WHO pre-qualification. We have made seven WHO filings for
Human Health API products of which four Human Health API products are already commercialised. Further, in Human Health API segment, our Company has made three TGA filings for Australia and three Health Canada filings.
Living the vision. Loving the journey.
SeQuent Scientific Limited Living the Vision
20
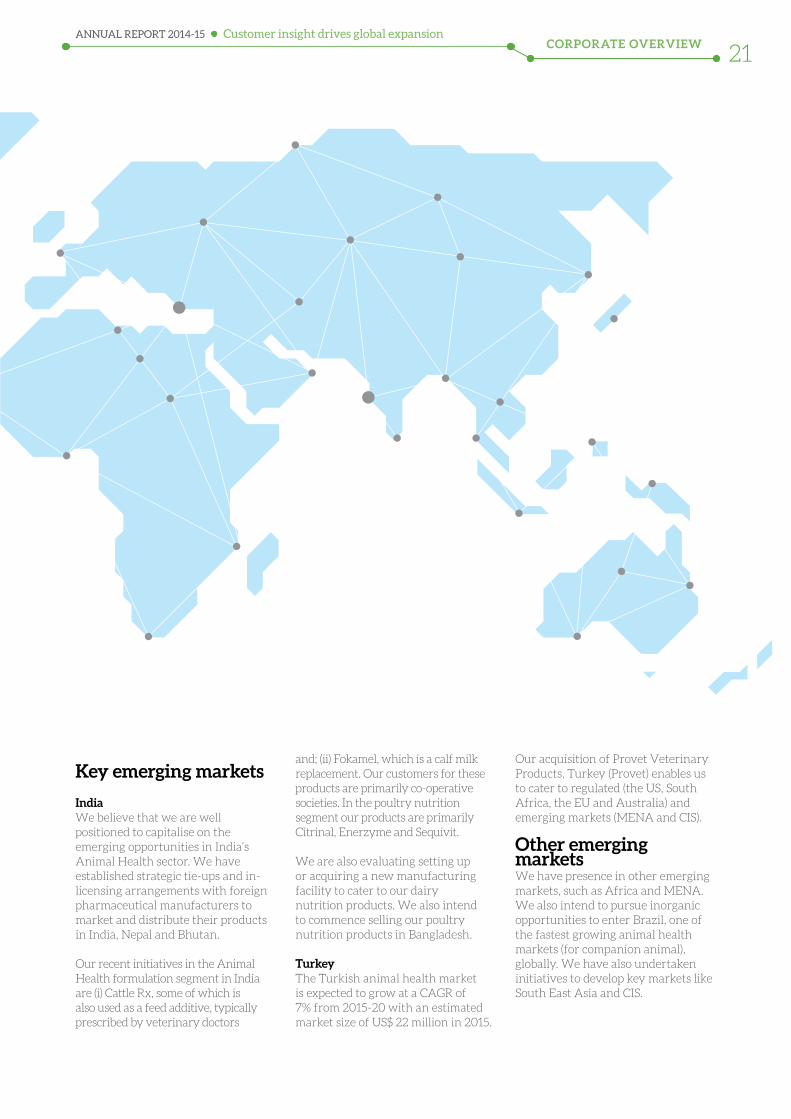
Key emerging markets
IndiaWe believe that we are well positioned to capitalise on the emerging opportunities in India’s Animal Health sector. We have established strategic tie-ups and in-licensing arrangements with foreign pharmaceutical manufacturers to market and distribute their products in India, Nepal and Bhutan.
Our recent initiatives in the Animal Health formulation segment in India are (i) Cattle Rx, some of which is also used as a feed additive, typically prescribed by veterinary doctors
and; (ii) Fokamel, which is a calf milk replacement. Our customers for these products are primarily co-operative societies. In the poultry nutrition segment our products are primarily Citrinal, Enerzyme and Sequivit.
We are also evaluating setting up or acquiring a new manufacturing facility to cater to our dairy nutrition products. We also intend to commence selling our poultry nutrition products in Bangladesh.
TurkeyThe Turkish animal health market is expected to grow at a CAGR of 7% from 2015-20 with an estimated market size of US$ 22 million in 2015.
Our acquisition of Provet Veterinary Products, Turkey (Provet) enables us to cater to regulated (the US, South Africa, the EU and Australia) and emerging markets (MENA and CIS).
Other emerging marketsWe have presence in other emerging markets, such as Africa and MENA. We also intend to pursue inorganic opportunities to enter Brazil, one of the fastest growing animal health markets (for companion animal), globally. We have also undertaken initiatives to develop key markets like South East Asia and CIS.
Customer insight drives global expansionCORPORATE OVERVIEW
ANNUAL REPORT 2014-15
21
Research and Development (R&D) is at the core of our efforts to provide innovation outcomes, globally. We try to anticipate our future industry needs and align our R&D priorities accordingly.
We have a dedicated R&D facility at Mangalore, which has over 120 scientists operating out of eight laboratories. Our R&D centre is recognised by the Department of Scientific and Industrial Research, Government of India. We have recently commissioned a pilot scale plant for faster product development. Our R&D team has expertise in carbohydrate chemistry and heterocyclic chemistry.
Our list of development, scale-ups and commercialisation of products involve the following chemical reactions:• Catalytic hydrogenation (noble
metal catalysis)• Hydride reductions• Organometallic reactions
(Grignard, diethyl zinc)• Hazardous reactions involving
cyanuric chloride methyl mercaptan, and so on
• Asymmetric synthesis and chiral separations
• High pressure and high temperature reactions
• Fluorinations (DAST, deoxyfluor)• Halogenations• Azide reactions• Friedel Crafts reactions• Suzuki Coupling
Living the vision. Loving the journey.Thinking afresh builds a sustainable business
Product category Animal Health Human Health
API Formulations
Commercialised products 19 182 20
Under development 12 34 14
Total 31 216 34
DMF filings 10 NA 19
Developing a sustainable pipeline
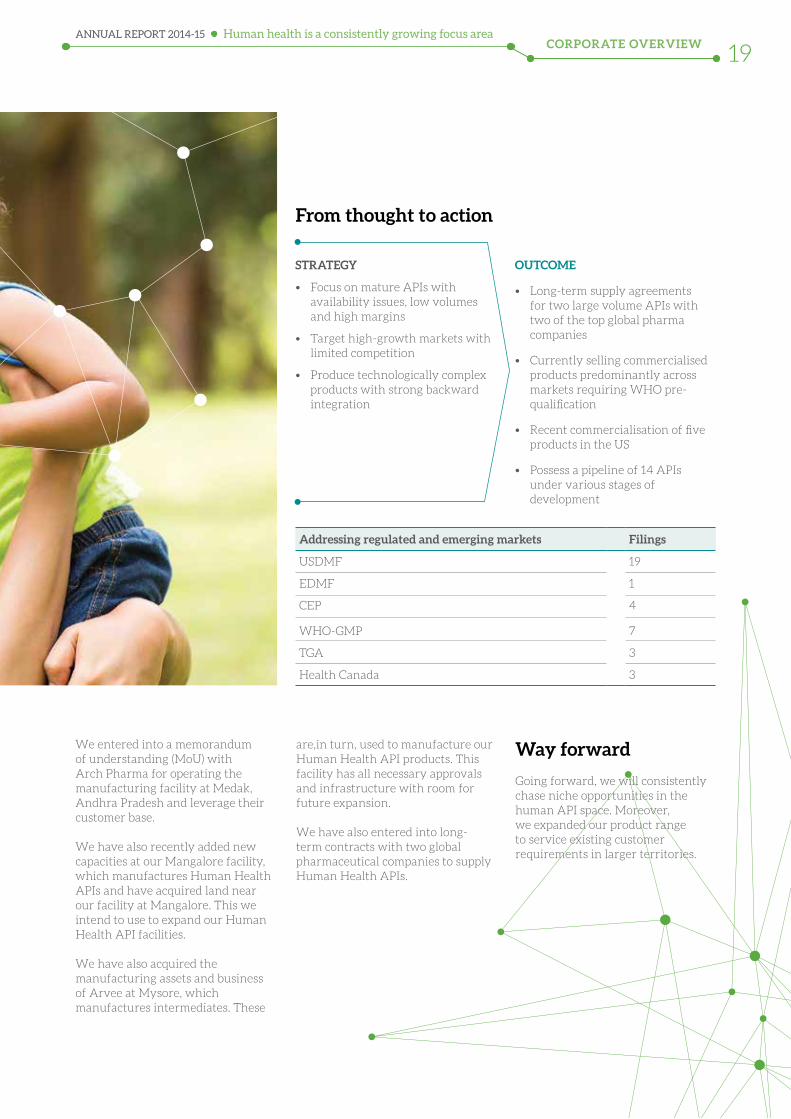
R&D laboratory at Mangalore, India
SeQuent Scientific Limited Living the Vision
22
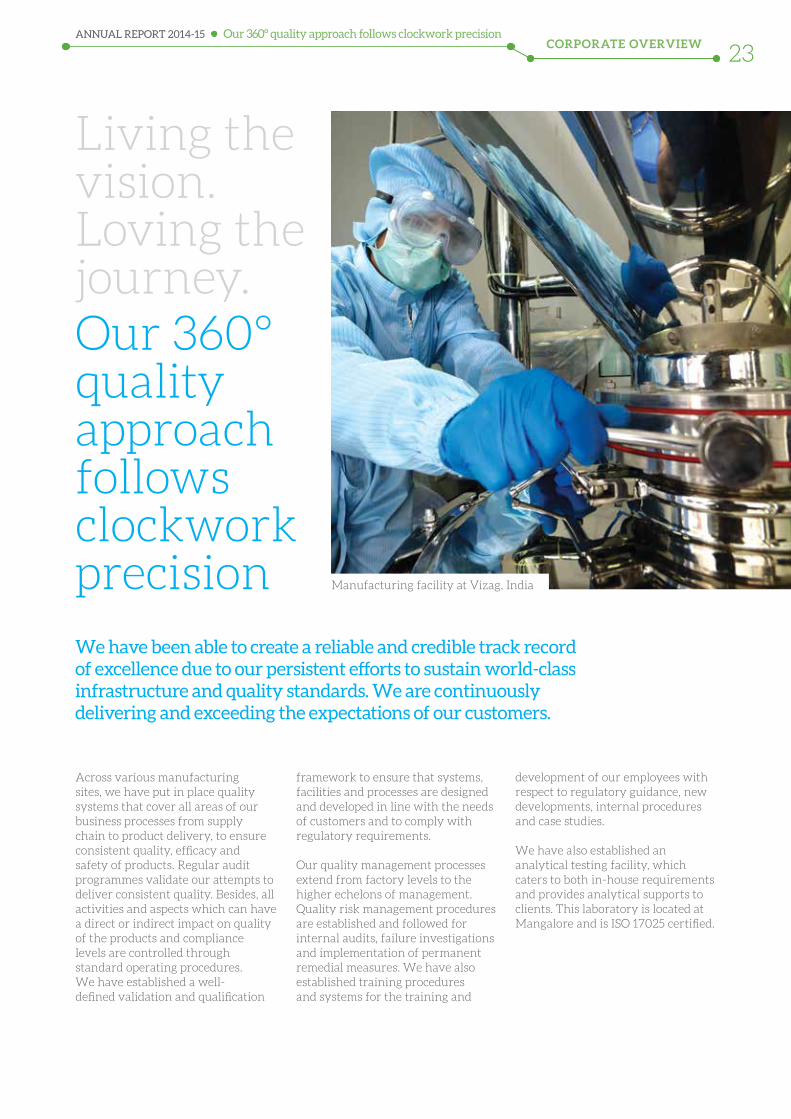
Across various manufacturing sites, we have put in place quality systems that cover all areas of our business processes from supply chain to product delivery, to ensure consistent quality, efficacy and safety of products. Regular audit programmes validate our attempts to deliver consistent quality. Besides, all activities and aspects which can have a direct or indirect impact on quality of the products and compliance levels are controlled through standard operating procedures. We have established a well-defined validation and qualification
We have been able to create a reliable and credible track record of excellence due to our persistent efforts to sustain world-class infrastructure and quality standards. We are continuously delivering and exceeding the expectations of our customers.
framework to ensure that systems, facilities and processes are designed and developed in line with the needs of customers and to comply with regulatory requirements.
Our quality management processes extend from factory levels to the higher echelons of management. Quality risk management procedures are established and followed for internal audits, failure investigations and implementation of permanent remedial measures. We have also established training procedures and systems for the training and
development of our employees with respect to regulatory guidance, new developments, internal procedures and case studies.
We have also established an analytical testing facility, which caters to both in-house requirements and provides analytical supports to clients. This laboratory is located at Mangalore and is ISO 17025 certified.
Living the vision. Loving the journey.Our 360° quality approach follows clockwork precision
Our 360° quality approach follows clockwork precision
Manufacturing facility at Vizag, India
CORPORATE OVERVIEWANNUAL REPORT 2014-15
23
Product portfolio
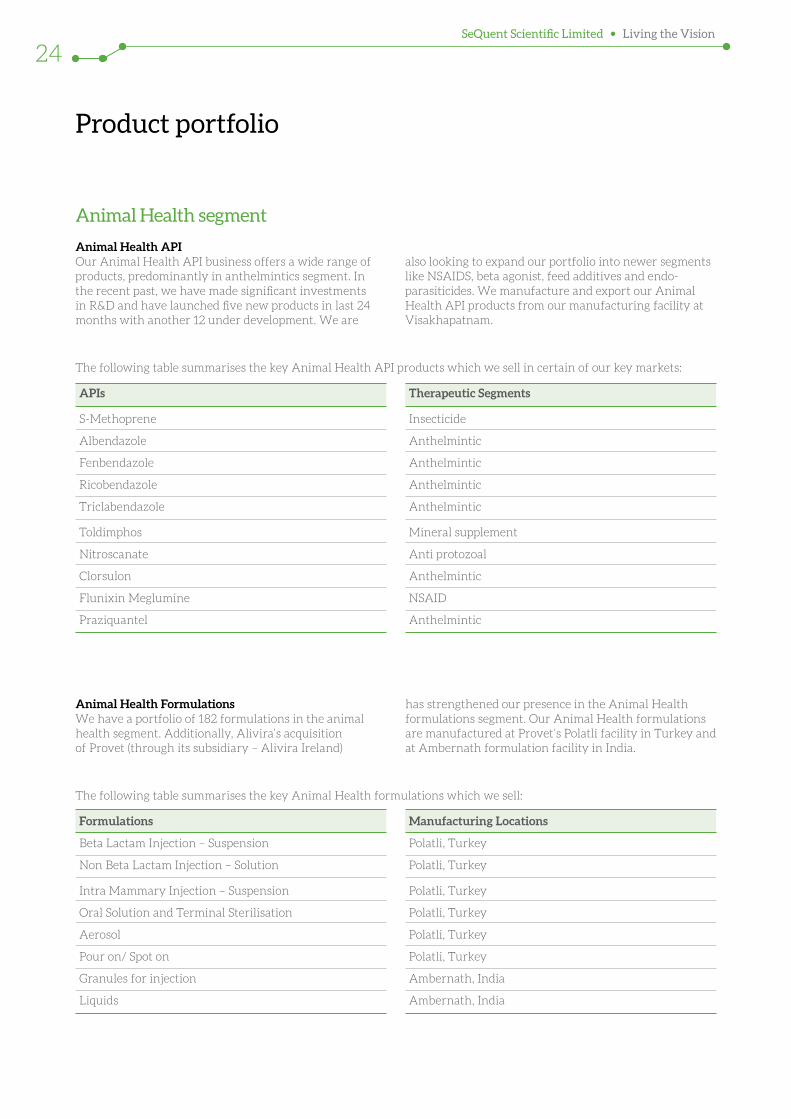
Animal Health segment
Animal Health API Our Animal Health API business offers a wide range of products, predominantly in anthelmintics segment. In the recent past, we have made significant investments in R&D and have launched five new products in last 24 months with another 12 under development. We are
APIs Therapeutic Segments
S-Methoprene Insecticide
Albendazole Anthelmintic
Fenbendazole Anthelmintic
Ricobendazole Anthelmintic
Triclabendazole Anthelmintic
Toldimphos Mineral supplement
Nitroscanate Anti protozoal
Clorsulon Anthelmintic
Flunixin Meglumine NSAID
Praziquantel Anthelmintic
Formulations Manufacturing Locations
Beta Lactam Injection – Suspension Polatli, Turkey
Non Beta Lactam Injection – Solution Polatli, Turkey
Intra Mammary Injection – Suspension Polatli, Turkey
Oral Solution and Terminal Sterilisation Polatli, Turkey
Aerosol Polatli, Turkey
Pour on/ Spot on Polatli, Turkey
Granules for injection Ambernath, India
Liquids Ambernath, India
Animal Health FormulationsWe have a portfolio of 182 formulations in the animal health segment. Additionally, Alivira’s acquisition of Provet (through its subsidiary – Alivira Ireland)
has strengthened our presence in the Animal Health formulations segment. Our Animal Health formulations are manufactured at Provet’s Polatli facility in Turkey and at Ambernath formulation facility in India.
also looking to expand our portfolio into newer segments like NSAIDS, beta agonist, feed additives and endo-parasiticides. We manufacture and export our Animal Health API products from our manufacturing facility at Visakhapatnam.
The following table summarises the key Animal Health API products which we sell in certain of our key markets:
The following table summarises the key Animal Health formulations which we sell:
SeQuent Scientific Limited Living the Vision
24
Product portfolio
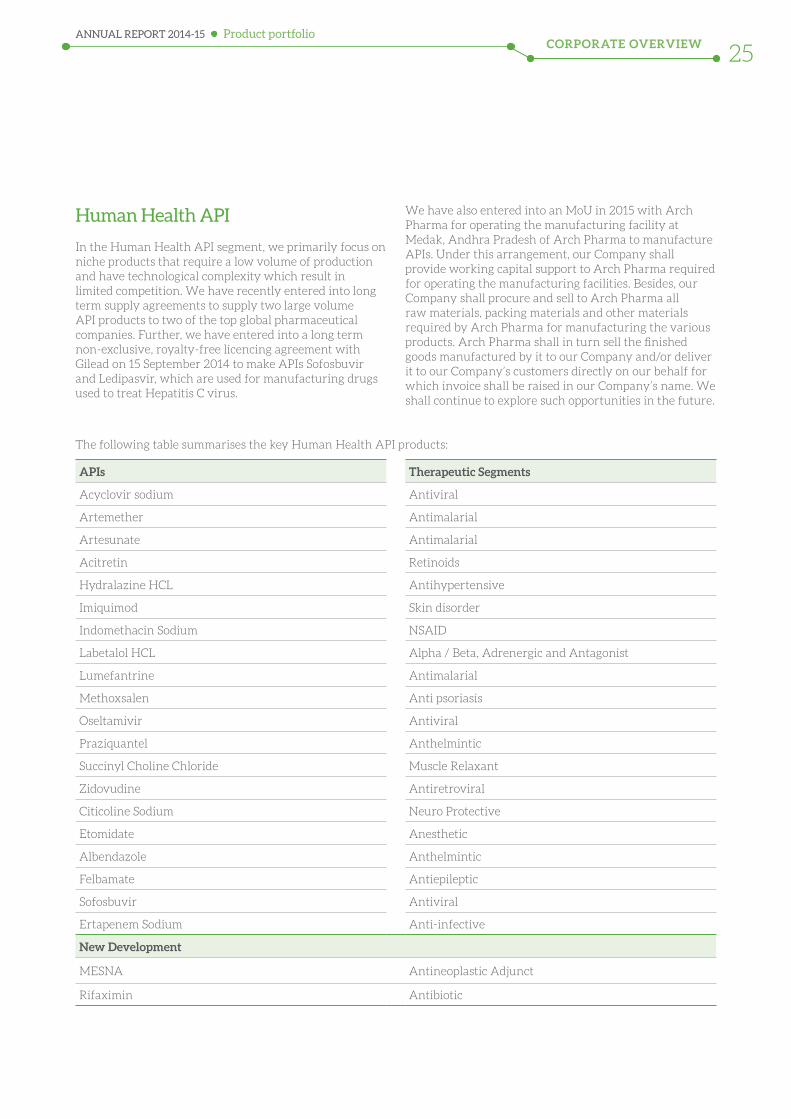
Human Health API
In the Human Health API segment, we primarily focus on niche products that require a low volume of production and have technological complexity which result in limited competition. We have recently entered into long term supply agreements to supply two large volume API products to two of the top global pharmaceutical companies. Further, we have entered into a long term non-exclusive, royalty-free licencing agreement with Gilead on 15 September 2014 to make APIs Sofosbuvir and Ledipasvir, which are used for manufacturing drugs used to treat Hepatitis C virus.
We have also entered into an MoU in 2015 with Arch Pharma for operating the manufacturing facility at Medak, Andhra Pradesh of Arch Pharma to manufacture APIs. Under this arrangement, our Company shall provide working capital support to Arch Pharma required for operating the manufacturing facilities. Besides, our Company shall procure and sell to Arch Pharma all raw materials, packing materials and other materials required by Arch Pharma for manufacturing the various products. Arch Pharma shall in turn sell the finished goods manufactured by it to our Company and/or deliver it to our Company’s customers directly on our behalf for which invoice shall be raised in our Company’s name. We shall continue to explore such opportunities in the future.
APIs Therapeutic Segments
Acyclovir sodium Antiviral
Artemether Antimalarial
Artesunate Antimalarial
Acitretin Retinoids
Hydralazine HCL Antihypertensive
Imiquimod Skin disorder
Indomethacin Sodium NSAID
Labetalol HCL Alpha / Beta, Adrenergic and Antagonist
Lumefantrine Antimalarial
Methoxsalen Anti psoriasis
Oseltamivir Antiviral
Praziquantel Anthelmintic
Succinyl Choline Chloride Muscle Relaxant
Zidovudine Antiretroviral
Citicoline Sodium Neuro Protective
Etomidate Anesthetic
Albendazole Anthelmintic
Felbamate Antiepileptic
Sofosbuvir Antiviral
Ertapenem Sodium Anti-infective
New Development
MESNA Antineoplastic Adjunct
Rifaximin Antibiotic
The following table summarises the key Human Health API products:
CORPORATE OVERVIEWANNUAL REPORT 2014-15
25
Board of Directors
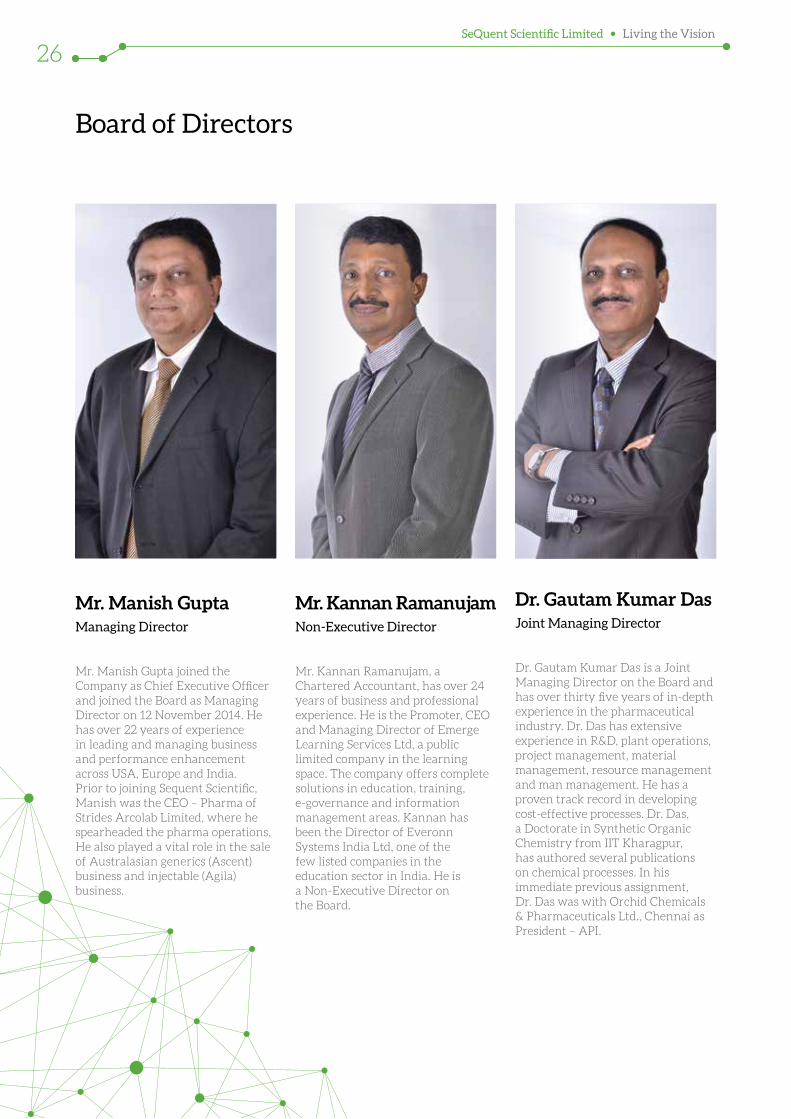
Mr. Manish GuptaManaging Director
Mr. Manish Gupta joined the Company as Chief Executive Officer and joined the Board as Managing Director on 12 November 2014. He has over 22 years of experience in leading and managing business and performance enhancement across USA, Europe and India. Prior to joining Sequent Scientific, Manish was the CEO – Pharma of Strides Arcolab Limited, where he spearheaded the pharma operations. He also played a vital role in the sale of Australasian generics (Ascent) business and injectable (Agila) business.
Mr. Kannan RamanujamNon-Executive Director
Mr. Kannan Ramanujam, a Chartered Accountant, has over 24 years of business and professional experience. He is the Promoter, CEO and Managing Director of Emerge Learning Services Ltd, a public limited company in the learning space. The company offers complete solutions in education, training, e-governance and information management areas. Kannan has been the Director of Everonn Systems India Ltd, one of the few listed companies in the education sector in India. He is a Non-Executive Director on the Board.
Dr. Gautam Kumar DasJoint Managing Director
Dr. Gautam Kumar Das is a Joint Managing Director on the Board and has over thirty five years of in-depth experience in the pharmaceutical industry. Dr. Das has extensive experience in R&D, plant operations, project management, material management, resource management and man management. He has a proven track record in developing cost-effective processes. Dr. Das, a Doctorate in Synthetic Organic Chemistry from IIT Kharagpur, has authored several publications on chemical processes. In his immediate previous assignment, Dr. Das was with Orchid Chemicals & Pharmaceuticals Ltd., Chennai as President – API.
SeQuent Scientific Limited Living the Vision
26
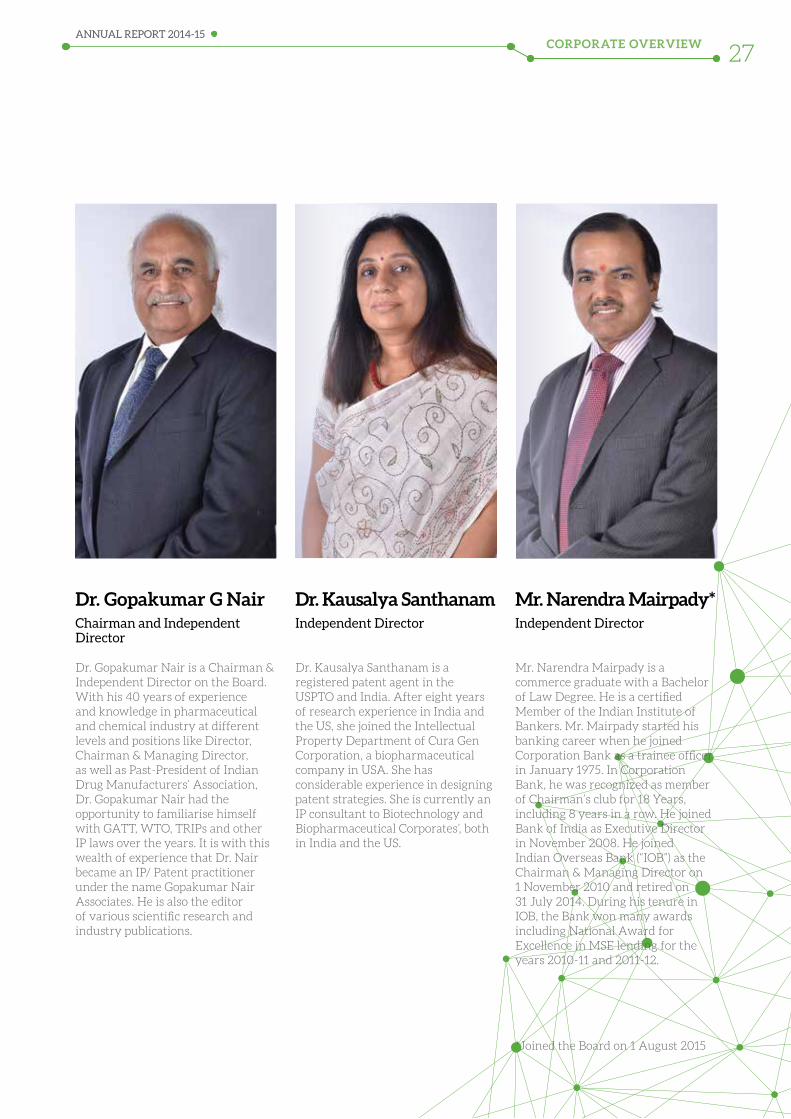
Dr. Gopakumar G NairChairman and Independent Director
Dr. Gopakumar Nair is a Chairman & Independent Director on the Board. With his 40 years of experience and knowledge in pharmaceutical and chemical industry at different levels and positions like Director, Chairman & Managing Director, as well as Past-President of Indian Drug Manufacturers’ Association, Dr. Gopakumar Nair had the opportunity to familiarise himself with GATT, WTO, TRIPs and other IP laws over the years. It is with this wealth of experience that Dr. Nair became an IP/ Patent practitioner under the name Gopakumar Nair Associates. He is also the editor of various scientific research and industry publications.
Dr. Kausalya SanthanamIndependent Director
Dr. Kausalya Santhanam is a registered patent agent in the USPTO and India. After eight years of research experience in India and the US, she joined the Intellectual Property Department of Cura Gen Corporation, a biopharmaceutical company in USA. She has considerable experience in designing patent strategies. She is currently an IP consultant to Biotechnology and Biopharmaceutical Corporates’, both in India and the US.
Mr. Narendra Mairpady*Independent Director
Mr. Narendra Mairpady is a commerce graduate with a Bachelor of Law Degree. He is a certified Member of the Indian Institute of Bankers. Mr. Mairpady started his banking career when he joined Corporation Bank as a trainee officer in January 1975. In Corporation Bank, he was recognized as member of Chairman’s club for 18 Years, including 8 years in a row. He joined Bank of India as Executive Director in November 2008. He joined Indian Overseas Bank (“IOB”) as the Chairman & Managing Director on 1 November 2010 and retired on 31 July 2014. During his tenure in IOB, the Bank won many awards including National Award for Excellence in MSE lending for the years 2010-11 and 2011-12.
*Joined the Board on 1 August 2015
CORPORATE OVERVIEWANNUAL REPORT 2014-15
27
SeQuent Scientific Limited Living the Vision
28
Management Discussion and Analysis
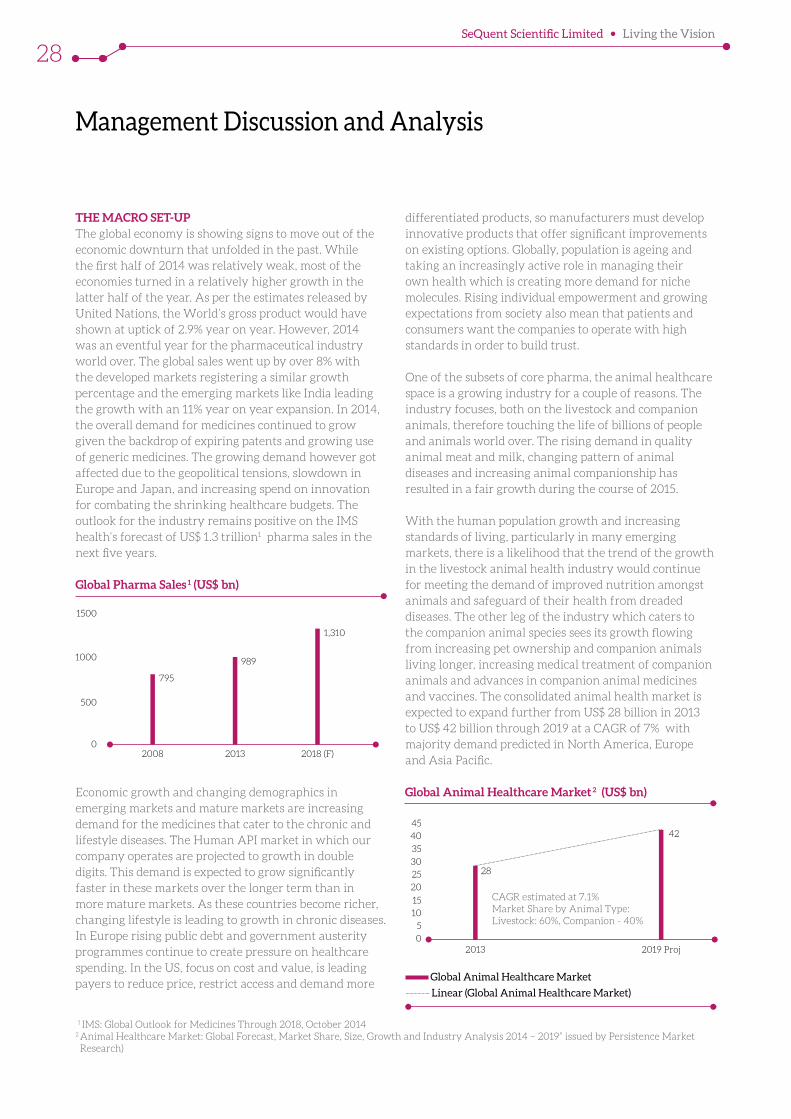
THE MACRO SET-UPThe global economy is showing signs to move out of the economic downturn that unfolded in the past. While the first half of 2014 was relatively weak, most of the economies turned in a relatively higher growth in the latter half of the year. As per the estimates released by United Nations, the World’s gross product would have shown at uptick of 2.9% year on year. However, 2014 was an eventful year for the pharmaceutical industry world over. The global sales went up by over 8% with the developed markets registering a similar growth percentage and the emerging markets like India leading the growth with an 11% year on year expansion. In 2014, the overall demand for medicines continued to grow given the backdrop of expiring patents and growing use of generic medicines. The growing demand however got affected due to the geopolitical tensions, slowdown in Europe and Japan, and increasing spend on innovation for combating the shrinking healthcare budgets. The outlook for the industry remains positive on the IMS health’s forecast of US$ 1.3 trillion1 pharma sales in the next five years.
Global Pharma Sales 1 (US$ bn)
795
989
1,310
2008 2013 2018 (F)
1500
1000
500
0
Economic growth and changing demographics in emerging markets and mature markets are increasing demand for the medicines that cater to the chronic and lifestyle diseases. The Human API market in which our company operates are projected to growth in double digits. This demand is expected to grow significantly faster in these markets over the longer term than in more mature markets. As these countries become richer, changing lifestyle is leading to growth in chronic diseases. In Europe rising public debt and government austerity programmes continue to create pressure on healthcare spending. In the US, focus on cost and value, is leading payers to reduce price, restrict access and demand more
differentiated products, so manufacturers must develop innovative products that offer significant improvements on existing options. Globally, population is ageing and taking an increasingly active role in managing their own health which is creating more demand for niche molecules. Rising individual empowerment and growing expectations from society also mean that patients and consumers want the companies to operate with high standards in order to build trust.
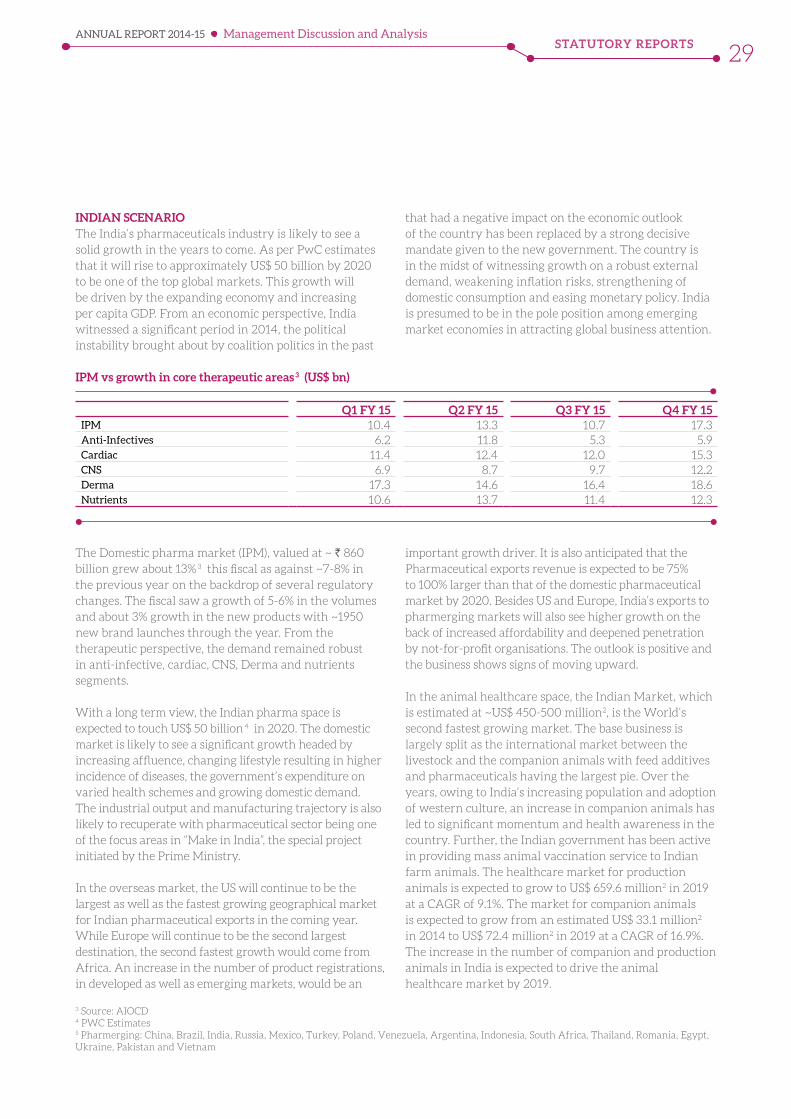
One of the subsets of core pharma, the animal healthcare space is a growing industry for a couple of reasons. The industry focuses, both on the livestock and companion animals, therefore touching the life of billions of people and animals world over. The rising demand in quality animal meat and milk, changing pattern of animal diseases and increasing animal companionship has resulted in a fair growth during the course of 2015.
With the human population growth and increasing standards of living, particularly in many emerging markets, there is a likelihood that the trend of the growth in the livestock animal health industry would continue for meeting the demand of improved nutrition amongst animals and safeguard of their health from dreaded diseases. The other leg of the industry which caters to the companion animal species sees its growth flowing from increasing pet ownership and companion animals living longer, increasing medical treatment of companion animals and advances in companion animal medicines and vaccines. The consolidated animal health market is expected to expand further from US$ 28 billion in 2013 to US$ 42 billion through 2019 at a CAGR of 7% with majority demand predicted in North America, Europe and Asia Pacific.
Global Animal Healthcare Market 2 (US$ bn)
1 IMS: Global Outlook for Medicines Through 2018, October 20142 Animal Healthcare Market: Global Forecast, Market Share, Size, Growth and Industry Analysis 2014 – 2019” issued by Persistence Market Research)
28
42
2013 2019 Proj0
5
10
15
20
25
30
35
40
45
CAGR estimated at 7.1%Market Share by Animal Type: Livestock: 60%, Companion - 40%
Global Animal Healthcare Market
Linear (Global Animal Healthcare Market)
STATUTORY REPORTSANNUAL REPORT 2014-15
29
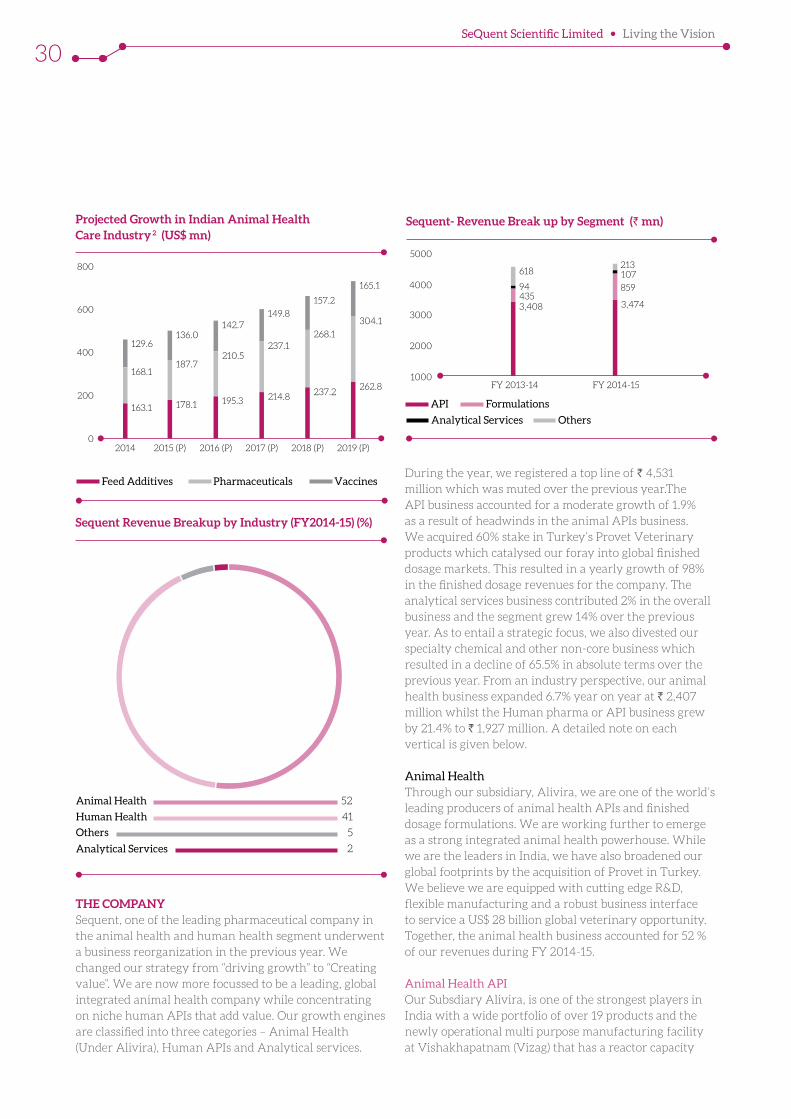
IPM vs growth in core therapeutic areas 3 (US$ bn)
INDIAN SCENARIOThe India’s pharmaceuticals industry is likely to see a solid growth in the years to come. As per PwC estimates that it will rise to approximately US$ 50 billion by 2020 to be one of the top global markets. This growth will be driven by the expanding economy and increasing per capita GDP. From an economic perspective, India witnessed a significant period in 2014, the political instability brought about by coalition politics in the past
that had a negative impact on the economic outlook of the country has been replaced by a strong decisive mandate given to the new government. The country is in the midst of witnessing growth on a robust external demand, weakening inflation risks, strengthening of domestic consumption and easing monetary policy. India is presumed to be in the pole position among emerging market economies in attracting global business attention.
The Domestic pharma market (IPM), valued at ~ ` 860 billion grew about 13% 3 this fiscal as against ~7-8% in the previous year on the backdrop of several regulatory changes. The fiscal saw a growth of 5-6% in the volumes and about 3% growth in the new products with ~1950 new brand launches through the year. From the therapeutic perspective, the demand remained robust in anti-infective, cardiac, CNS, Derma and nutrients segments.
With a long term view, the Indian pharma space is expected to touch US$ 50 billion 4 in 2020. The domestic market is likely to see a significant growth headed by increasing affluence, changing lifestyle resulting in higher incidence of diseases, the government’s expenditure on varied health schemes and growing domestic demand. The industrial output and manufacturing trajectory is also likely to recuperate with pharmaceutical sector being one of the focus areas in “Make in India”, the special project initiated by the Prime Ministry.
In the overseas market, the US will continue to be the largest as well as the fastest growing geographical market for Indian pharmaceutical exports in the coming year. While Europe will continue to be the second largest destination, the second fastest growth would come from Africa. An increase in the number of product registrations, in developed as well as emerging markets, would be an
important growth driver. It is also anticipated that the Pharmaceutical exports revenue is expected to be 75% to 100% larger than that of the domestic pharmaceutical market by 2020. Besides US and Europe, India’s exports to pharmerging markets will also see higher growth on the back of increased affordability and deepened penetration by not-for-profit organisations. The outlook is positive and the business shows signs of moving upward.
3 Source: AIOCD4 PWC Estimates5 Pharmerging: China, Brazil, India, Russia, Mexico, Turkey, Poland, Venezuela, Argentina, Indonesia, South Africa, Thailand, Romania, Egypt, Ukraine, Pakistan and Vietnam
Q1 FY 15 Q2 FY 15 Q3 FY 15 Q4 FY 15IPM 10.4 13.3 10.7 17.3Anti-Infectives 6.2 11.8 5.3 5.9Cardiac 11.4 12.4 12.0 15.3CNS 6.9 8.7 9.7 12.2Derma 17.3 14.6 16.4 18.6Nutrients 10.6 13.7 11.4 12.3
In the animal healthcare space, the Indian Market, which is estimated at ~US$ 450-500 million2, is the World’s second fastest growing market. The base business is largely split as the international market between the livestock and the companion animals with feed additives and pharmaceuticals having the largest pie. Over the years, owing to India’s increasing population and adoption of western culture, an increase in companion animals has led to significant momentum and health awareness in the country. Further, the Indian government has been active in providing mass animal vaccination service to Indian farm animals. The healthcare market for production animals is expected to grow to US$ 659.6 million2 in 2019 at a CAGR of 9.1%. The market for companion animals is expected to grow from an estimated US$ 33.1 million2 in 2014 to US$ 72.4 million2 in 2019 at a CAGR of 16.9%. The increase in the number of companion and production animals in India is expected to drive the animal healthcare market by 2019.
Management Discussion and Analysis
SeQuent Scientific Limited Living the Vision
30
THE COMPANYSequent, one of the leading pharmaceutical company in the animal health and human health segment underwent a business reorganization in the previous year. We changed our strategy from “driving growth” to “Creating value”. We are now more focussed to be a leading, global integrated animal health company while concentrating on niche human APIs that add value. Our growth engines are classified into three categories – Animal Health (Under Alivira), Human APIs and Analytical services.
During the year, we registered a top line of ` 4,531 million which was muted over the previous year.The API business accounted for a moderate growth of 1.9% as a result of headwinds in the animal APIs business. We acquired 60% stake in Turkey’s Provet Veterinary products which catalysed our foray into global finished dosage markets. This resulted in a yearly growth of 98% in the finished dosage revenues for the company. The analytical services business contributed 2% in the overall business and the segment grew 14% over the previous year. As to entail a strategic focus, we also divested our specialty chemical and other non-core business which resulted in a decline of 65.5% in absolute terms over the previous year. From an industry perspective, our animal health business expanded 6.7% year on year at ` 2,407 million whilst the Human pharma or API business grew by 21.4% to ` 1,927 million. A detailed note on each vertical is given below.
Animal HealthThrough our subsidiary, Alivira, we are one of the world’s leading producers of animal health APIs and finished dosage formulations. We are working further to emerge as a strong integrated animal health powerhouse. While we are the leaders in India, we have also broadened our global footprints by the acquisition of Provet in Turkey. We believe we are equipped with cutting edge R&D, flexible manufacturing and a robust business interface to service a US$ 28 billion global veterinary opportunity. Together, the animal health business accounted for 52 % of our revenues during FY 2014-15.
Animal Health APIOur Subsdiary Alivira, is one of the strongest players in India with a wide portfolio of over 19 products and the newly operational multi purpose manufacturing facility at Vishakhapatnam (Vizag) that has a reactor capacity
Projected Growth in Indian Animal Health Care Industry 2 (US$ mn)
165.1
304.1
262.8237.2
268.1
157.2
149.8
237.1
214.8195.3
210.5
142.7136.0
178.1
187.7
163.1
168.1
129.6
2014 2015 (P) 2016 (P) 2017 (P) 2018 (P) 2019 (P)
200
0
400
600
800
Feed Additives Pharmaceuticals Vaccines
Sequent Revenue Breakup by Industry (FY2014-15) (%)
Human Health
52
Analytical Services
5
Animal Health
41
2
Others
Sequent- Revenue Break up by Segment (` mn)
618213
94107
435859
3,408 3,474
FY 2013-14 FY 2014-15
5000
4000
3000
2000
1000
API Formulations
Analytical Services Others
STATUTORY REPORTSANNUAL REPORT 2014-15
31
of 224.6 KL (Equivalent to 800 Tons per annum). Today, we span over 82 countries including the key regulated markets such as US, Europe, and Latin America. While we are one of the largest producers of anthelmintic APIs in the World, we have a strong presence in leading therapies such as Non-steroidal anti-inflammatory drugs (NSAIDs), beta agonists, anti-protozoal and endo-paraciticides.
From an operational standpoint, FY 2014-15 was a year of strategic shift in the animal health APIs. In line with the plan carved during the previous fiscal, we successfully transitioned our business from Sequent Animal health division to the new subsidiary- Alivira. Given the backdrop of our business transaction with Shashun drugs, we acquired a state of the art facility at Vizag which during the course of FY 2014-15 was commissioned as a world class cGMP compliant API facility with readiness to regulatory audits world over. While there were some delays in commissioning due to cyclone that had hit Eastern part of India, the facility now is geared to produce over 800 tonnes of animal health APIs. During the year, we also succeeded in clearing more than 10 audits from leading animal health companies’ world over. We have also enabled the site transfers to Vizag from our existing API facility at Ambernath, which discontinued the operations as a result of reorganization efforts.
On the business front, the transitioning Animal Health API business registered a muted performance due to capacity scale up challenge and a couple of headwinds arising out of geopolitical tensions across MENA region and uncertain order pattern from customers. The business however gained some momentum during the close of financial year.
Looking at the future, we believe, we are well positioned to address established opportunities in the industry. We intend to grow our business based on our existing relationship with leading companies both by adding new products to the basket as well as adding new geographies that have a promising future. Our growth engine to this vision would be led by our strategic investment in scale (Vizag facility) and research which has enabled us with a strong pipeline of over 12 products that are into different stages of commercialization.
Animal Health FormulationsOur debut in the finished dosage space got registered in 2008, since then, we have carved out a niche portfolio of our products with dominant position largely in the cattle, dairy, poultry and swine products. While we have
attained fast growth in India, we have also scaled our presence in leading global markets within South East Asia, MENA and Turkey. Our therapeutic segments include feed supplements, antibiotics, anthelmintics, antibacterial, skincare (dermatology) products and disinfectants. We also acquired Provet Ltd. (Turkey’s third largest animal health pharmaceutical company) to strengthen and enable our positioning both in the emerging and the regulatory markets including US, RSA, EU and Australia.
The formulations segment including the revenues from Provet (Initiated in Q4) contributed over 18% to the total revenues of the company. Post our acquisition of Provet, we also registered a year on year growth of 97% in FY 2014-15. From the product perspective, we witnessed business traction in the nutrition segment both in poultry and dairy nutrition. We also launched our poultry products in the US therefore foraying to the market in this space. Amongst the operational developments we also completed the up-gradation of our facility at Ambernath. The facility also completed regulatory audit from the Cameroon authorities and WHO. Success of these audits also ensures our readiness to face any other audits from customers and authorities in the coming period.
We believe we have the launch pad for the multi-billion dollar animal healthcare opportunity that we foresee. Out of our portfolio of 182 animal health formulations, we have shortlisted 90 products which could be introduced in regulated markets over the next few years. We also intend to forge partnerships and collaboration with leading companies in the regulatory markets and we are confident of a robust growth.
Human APIsIn a crowded market for the pure-play API business, our portfolio comprises of niche molecules that require a low volume of production and high chemistry capabilities. While these are difficult to make APIs, it limits the competition and enable us to drive better margins. As a strategy, we focus on mature APIs that have substantial supply issues and fewer players and backed by our strong research support and chemistry capabilities, we qualify as one of the preferred source for leading generic and innovator companies. Our existing API business is driven by our FDA approved multi-purpose facility at Mangalore and as of today, we have a portfolio of 17 complex molecules across therapies like anti-malarial, anthelmintics, anti-infective, antiviral, CNS and dermatology.
Management Discussion and Analysis
SeQuent Scientific Limited Living the Vision
32
The Human Health APIs registered a 21% year on year growth in FY 2014-15. The segment also contributed over 55% in the overall API business of the company. While there were commercial and pricing issues in few of the molecules, we presented a very strong performance of the molecules launched in the recent time. We also increased the capacity in our Mangalore facility which augmented the capacity of Praziquantel by close to 70%. In FY 2014-15, we also entered into a long term non-exclusive, royalty-free licensing agreement with Gilead for producing APIs such as Sofosbuvir and Ledipasvir, both used in the dosages curing Hepatitis C virus. The Hepatitis C virus results in chronic infection and as per WHO estimates, about 130-150 million people world over have this infection and about half a million die each year due to the same. To optimise our business further, we also acquired the manufacturing assets and business of Arvee Synthesis, which we intend to use for manufacturing intermediates for our Human Health pipeline. We also forged a strategic arrangement (through an MOU) with Arch Pharma for manufacturing of our APIs at their facility in Medak, Andhra Pradesh.
SeQuent has invested in facilities and strategic arrangements to safeguard its future business interest. We are focussed on the development and supply of high value, low volume APIs and going forward, we would continue to find partners having common intent on profit sharing basis to manufacture these. On the back of a dedicated research wing and a team of over 100 scientists, we continue to focus on improving existing products and scale up our pipeline of over 16 molecules for a sustainable future.
Analytical ServicesThrough our subsidiary (Sequent Research), we specialise in servicing the API, Pharmaceutical, Personal Care and Nutraceutical companies in analytical and bio-analytical services. This segment is a new revenue stream for the company. The core business is to offer standardised quality, cost savings and shorter lead time to healthcare and personal care companies based on our technical capabilities. We have a GLP compliant facility Certified & approved by ISO, TGA, USFDA and WHO.
During the year, while we enhanced the scope of services to our existing clientele, we also acquired new business from 4 new companies. The segment therefore accounted for a revenue of ` 106.5 million registering a sales uptick of 14%. We also worked on our branding and represented us at CPHI in Paris. From the operational perspective, we also added Malvern particle Size analyser to broaden our capabilities.
Moving forward, our focus to be best-in-class analytical service provider for pharmaceutical (human & veterinary), nutraceutical and personal care industry. In this direction we have also initiated a new capacity at Bangalore and with this, we intend to add Beta lactam, Penicillin, Hormones to our portfolio.
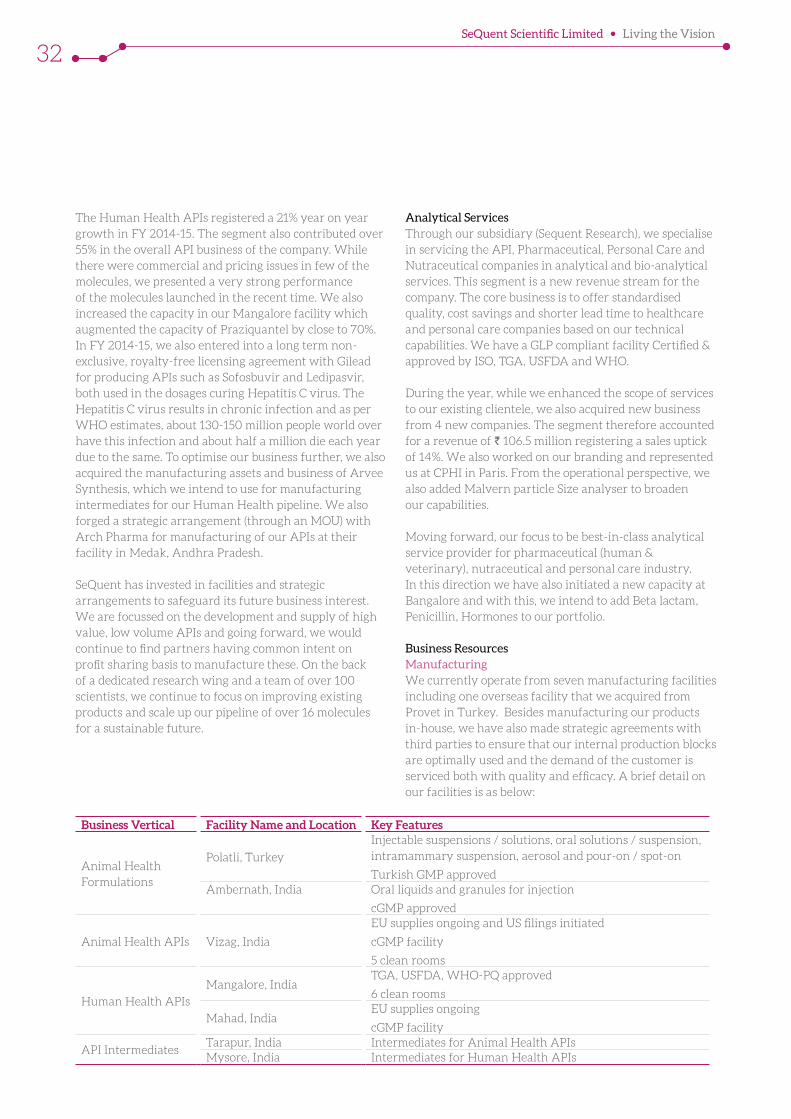
Business ResourcesManufacturingWe currently operate from seven manufacturing facilities including one overseas facility that we acquired from Provet in Turkey. Besides manufacturing our products in-house, we have also made strategic agreements with third parties to ensure that our internal production blocks are optimally used and the demand of the customer is serviced both with quality and efficacy. A brief detail on our facilities is as below:
Business Vertical Facility Name and Location Key Features
Animal Health Formulations
Polatli, Turkey
Injectable suspensions / solutions, oral solutions / suspension, intramammary suspension, aerosol and pour-on / spot-on
Turkish GMP approvedAmbernath, India Oral liquids and granules for injection
cGMP approved
Animal Health APIs Vizag, India
EU supplies ongoing and US filings initiated
cGMP facility
5 clean rooms
Human Health APIs
Mangalore, IndiaTGA, USFDA, WHO-PQ approved
6 clean rooms
Mahad, IndiaEU supplies ongoing
cGMP facility
API IntermediatesTarapur, India Intermediates for Animal Health APIsMysore, India Intermediates for Human Health APIs
STATUTORY REPORTSANNUAL REPORT 2014-15
33
R&DCollaborating in dynamic ways with innovation across our core areas is what we believe in. Our in-house research capabilities span with a DSIR recognized R&D centre based out of Mangalore. The facility has 10 Labs with 80 fume hoods and over 120 scientists. We have recently commissioned a pilot scale plant for faster product development. Our research and development team has expertise in carbohydrate chemistry and heterocyclic chemistry. During the FY 2015, we spent about ` 96.87 million in the research, which is 2.1% of our total revenues.
Going forward, we look to yield benefits from our pipeline of 12 products in animal health APIs, 34 products in the animal health formulations segment and over 14 human health APIs.
Quality Across various manufacturing sites, we have put in place quality systems that cover all areas of our business processes from supply chain to product delivery to ensure consistent quality, efficacy and safety of products. Regular audit programs validate our attempts to deliver consistent quality. Quality risk management procedures are established and followed for internal audits, failure investigations and implementation of permanent remedial measures. Some of the certifications that give a testimony to our quality commitment are approvals from EUGMP, TGA, USFDA, CEP and Health Canada.
IPRFrom a regulatory perspective, we are fully accomplished to encounter the challenges of modern-day Intellectual Property Management in Pharmaceutical Industry. We have a well-qualified and experienced team for IPR facilitates the development of intellectual wealth and supports to identify new potential and markets for API & formulations across the globe. In the animal health segment, we filed 3 DMFs in addition to EDMF for eight of our APIs. We also made CEP filing for four of our APIs. As on date, we also have 19 DMFs in the human health segment.
EmployeesHuman resource is one of the most important assets for us. We envisage in achieving organizational excellence by implementing sound HR Practices that align Human Capital with Corporate Vision and improve their satisfaction level and have positive impact on overall business performance. We have an employee base of about 1200 people including over 100 who are part of our overseas operations.
FY 2014-15 was a year of inception in terms of many processes and policies. Major of all to have a performance
driven culture, we designed and implemented robust performance management system at SeQuent group of companies. With Alivira, our focus was to have a uniform approach in Alivira and SeQuent. We value our employees and our culture. Employee engagement activities like MyVoice (open house sessions), Shopfloor communication, festival celebration and more helped us to strengthen our organizational culture and also helped employee’s to stay focused and connected with the organizational goals.
EHS We consider safety at first, therefore our endeavour is to ensure establishment of safe working conditions in all areas, to provide adequate protection for our employees, visitors and stakeholder. In this regard, a well-defined EHS policy is developed and in place. We also promote ongoing training for our staff and makes our best efforts to provide all technological resources and materials required to control the risks inherent to this business. Our motto is ‘tomorrow’s safety should be better than today’ and as part of that encouraged a) Walkthrough Survey by Line Management b) Reward and Recognition to the employees and workers who follows best safety practices c) EHS training programs by Line Management.
We focus on inculcating awareness on EHS among our employees and as part of that celebrated National Safety Week, Fire Services Week and World Environment day across all the manufacturing sites by conducting blood donation camp, sapling plantation, mock drills, fire drills etc. We are implementing sustainability initiatives such as energy conservation and water conservation and zero liquid discharge concept across all the manufacturing sites.
Global Presence and MarketingIn the APIs, we service to over 82 countries world over. While we do bulk of our business directly, we also have alternate supply arrangements through distributors, this not only ensures a greater span of coverage, but also helps us on getting better payment terms.
In addition to three long term supply agreements we have with our customers in human APIs, we also signed a non-exclusive agreement with Gilead to make APIs Sofosbuvir and Ledipasvir which are used for manufacturing drugs used to treat Hepatitis C virus. In the formulations space, we export to 22 countries across Africa and Asia and we have various distribution agreements with local distributors in Africa and Asia for distribution of our animal health formulation products. In India and Turkey, we have direct sales personnel to market our animal health formulation products in the respective markets.
Management Discussion and Analysis
SeQuent Scientific Limited Living the Vision
34
Shareholders’ FundsThe Company increased its share capital from ` 273.4 million to ` 304.9 million. During the year the company converted 3.2 million warrants issued in FY 2014 to equity shares at a conversion price of ` 135.3 per share.
Reserves and SurplusThe total reserves and surplus of the company increased to ` 319.8 million from ` 13.4 million in FY 2014. The
substantial increase in the reserves is due to receipt of ` 394.5 million in the share premium account received from the issue of warrants during the year.
Minority InterestThe minority interest increased to ` 1,469.3 million in FY 2015 largely on account of acquisition of 60% equity stake in Provet Veterinary Products A.S., Turkey with balance of 40% being minority interest.
(` in Million)Particulars FY 2014-15 FY 2013-141. EQUITY AND LIABILITIESA. Shareholders’ funds
(a) Share capital 304.9 267.4 (b) Reserves and surplus 319.8 13.4 (c) Money received against share warrants 288.0 106.5
Total Shareholder’s fund 912.7 387.3 2. Share application money pending allotment - 180.0 3. Minority Interest 1,469.3 45.8 4. Non-current liabilities
(a) Long-term borrowings 2,503.2 1,510.8 (b) Deferred tax liabilities (Net) 15.3 1.2 (c) Other Long term liabilities (d) Long-term provisions 99.8 80.3
Total Non-current liabilities 2,618.3 1,592.35. Current liabilities
(a) Short-term borrowings 2,043.1 2,266.0 (b) Trade payables 909.4 1,145.9 (c) Other current liabilities 1,074.3 568.0 (d) Short-term provisions 49.9 41.9
Total-Current liabilities 4,076.7 4,021.8 TOTAL EQUITY AND LIABILITIES 9,077.0 6,227.1 B. ASSETS1. Non-current assets
(a) Fixed assets 4,424.2 2,711.8 (b) Goodwill on consolidation 710.7 94.5 (c) Non-current investments 580.3 0.4 (d) Deferred tax assets (net)(e) Long-term loans and advances 249.2 775.1 (f) Other non-current assets 15.6 17.0
Total Non-current assets 5,980.0 3,598.7 2. Current assets
(a) Current investments 5.8 0.8 (b) Inventories 943.6 1,014.0 (c) Trade receivables 1,154.3 835.4 (d) Cash and cash equivalents 384.6 362.1 (e) Short-term loans and advances 445.9 381.1 (f) Other current assets 162.8 35.0
Total Current assets 3,097.0 2,628.4 Total – Assets 9,077.0 6,227.1
FinanceConsolidated Balance SheetThe following table details out the consolidated balance sheet as on 31 March 2015 (FY 2014-15) and 31 March 2014 (FY 2013-14)
STATUTORY REPORTSANNUAL REPORT 2014-15
35
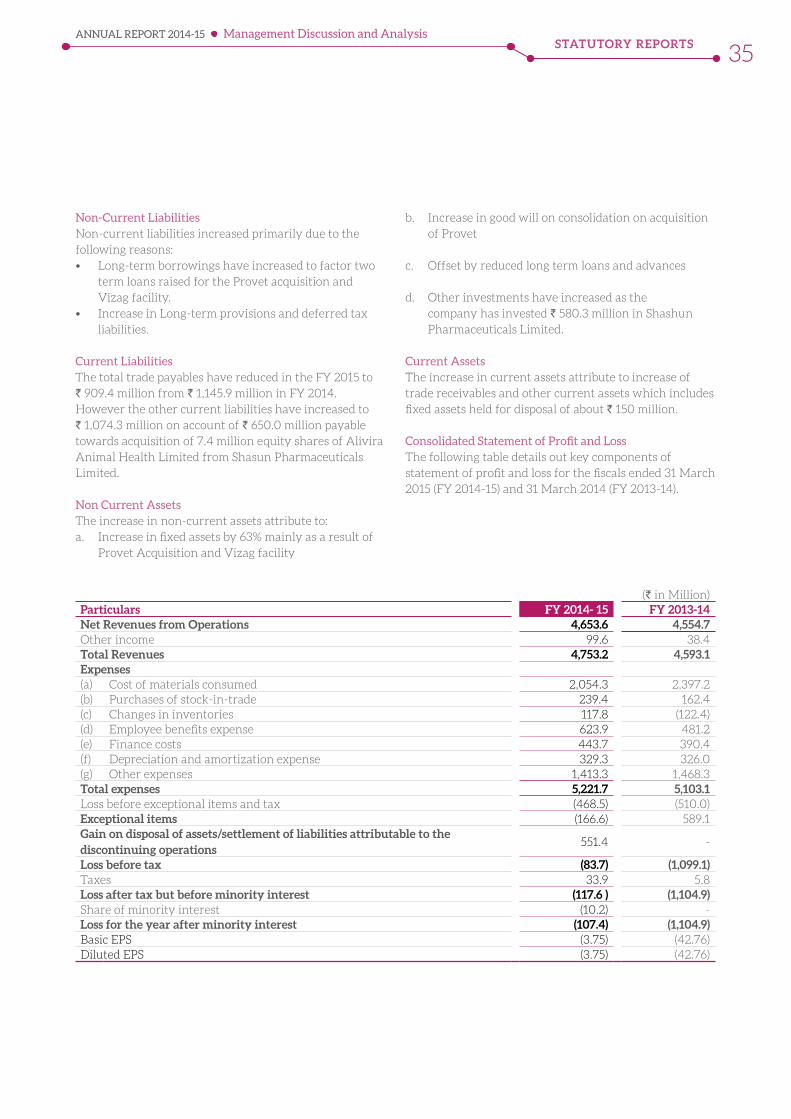
Non-Current LiabilitiesNon-current liabilities increased primarily due to the following reasons:• Long-term borrowings have increased to factor two
term loans raised for the Provet acquisition and Vizag facility.
• Increase in Long-term provisions and deferred tax liabilities.
Current LiabilitiesThe total trade payables have reduced in the FY 2015 to ` 909.4 million from ` 1,145.9 million in FY 2014. However the other current liabilities have increased to ` 1,074.3 million on account of ` 650.0 million payable towards acquisition of 7.4 million equity shares of Alivira Animal Health Limited from Shasun Pharmaceuticals Limited.
Non Current AssetsThe increase in non-current assets attribute to:a. Increase in fixed assets by 63% mainly as a result of
Provet Acquisition and Vizag facility
b. Increase in good will on consolidation on acquisition of Provet
c. Offset by reduced long term loans and advances
d. Other investments have increased as the company has invested ` 580.3 million in Shashun Pharmaceuticals Limited.
Current AssetsThe increase in current assets attribute to increase of trade receivables and other current assets which includes fixed assets held for disposal of about ` 150 million.
Consolidated Statement of Profit and Loss The following table details out key components of statement of profit and loss for the fiscals ended 31 March 2015 (FY 2014-15) and 31 March 2014 (FY 2013-14).
(` in Million)Particulars FY 2014- 15 FY 2013-14Net Revenues from Operations 4,653.6 4,554.7 Other income 99.6 38.4 Total Revenues 4,753.2 4,593.1 Expenses(a) Cost of materials consumed 2,054.3 2,397.2 (b) Purchases of stock-in-trade 239.4 162.4 (c) Changes in inventories 117.8 (122.4)(d) Employee benefits expense 623.9 481.2 (e) Finance costs 443.7 390.4 (f) Depreciation and amortization expense 329.3 326.0 (g) Other expenses 1,413.3 1,468.3 Total expenses 5,221.7 5,103.1 Loss before exceptional items and tax (468.5) (510.0)Exceptional items (166.6) 589.1 Gain on disposal of assets/settlement of liabilities attributable to the discontinuing operations
551.4 -
Loss before tax (83.7) (1,099.1)Taxes 33.9 5.8 Loss after tax but before minority interest (117.6 ) (1,104.9)Share of minority interest (10.2) - Loss for the year after minority interest (107.4) (1,104.9)Basic EPS (3.75) (42.76)Diluted EPS (3.75) (42.76)
Management Discussion and Analysis
SeQuent Scientific Limited Living the Vision
36
Operating RevenueThe Company’s revenues were nearly flat over the previous year. This was primarily due to divestment of our specialty chemical division during the course of year. Eliminating the effect of the discontinued operations from the previous year, we have grown over 14% from ` 3,988.4 million in FY 2014 to ` 4,531.8 million in the year under review. The API business accounted for a moderate growth of 1.9% as a result of headwinds in the animal APIs business. We acquired 60% stake in Turkey’s Provet Veterinary products which catalysed our foray into global finished dosage markets. This resulted in a yearly growth of 98% in the finished dosage revenues for the company. The analytical services business contributed 2% in the overall business and the segment grew 14% over the previous year.
Cost of Materials ConsumedThe Material costs consist of consumption of raw materials, traded goods and change in stock. Our expenses in relation to cost of raw materials consumed decreased by about 1.1%. This factors the divestment of Speciality Chemicals business and a better product mix of existing APIs. The closing stock was lower by ` 70.4 million for FY 2015.
Employee Benefit ExpensesThe Employee Benefit Expenses comprise of the salaries, wages, allowances and bonuses and contributions to statutory funds. These expenses have increased by ` 142.7 million (30%) largely on account of additional expenses from Provet and the commissioning of facility at Vizag.
Depreciation and AmortizationDepreciation and amortisation expense increased by 1% to ` 329.3 million for FY 2015. This factors sale of the Speciality Chemicals Division, which was partly offset by commencement of new manufacturing facility at Vizag.
Finance CostsThe finance costs increased by 14% to ` 443.7 million in FY 2015. This increase was mainly attributable to increase in long term borrowings for the acquisition of Provet and construction of our manufacturing facility at Vizag.
Exceptional ItemsThe Exceptional items during the year comprise of the following:A. Our Company discontinued its manufacturing
operations at Ambernath API Facility resulting in recognition of expected loss due held for disposal being lower of net book value and net realisable value of `140.3 million and ` 26.3 million towards other expenses incurred in closing the operations.
B. In FY 2014, our Company developed certain intellectual property in the area of Penems. However, the implementation of the project got delayed due to delays in environmental approvals from the government of India and change of control of our key customer for the business. We were uncertain of this customers continued interest in the project. Given the significant additional investments involved to complete the project, the company decided to discontinue the project and write-down the related project costs amounting to ` 539.1 million in FY 2014.
STATUTORY REPORTSANNUAL REPORT 2014-15
37
Tax ExpensesTax expenses are at ` 33.9 million in FY 2015 primarily due to tax on profits generated by Provet.
Risk Management and Internal ControlThe Company is responsible for establishing and maintaining adequate and effective internal financial controls and the preparation and presentation of the financial statements, in particular, the assertions on the internal financial controls in accordance with broader criteria established by the Company.
Because of the inherent limitations of internal financial controls, including the possibility of collusion or improper management override of controls, material misstatements in financial reporting due to error or fraud may occur and not be detected. Also, projections of any evaluation of the internal financial controls are subject to the risk that the internal financial control may become inadequate because of changes in conditions, or that the degree of compliance with the policies or procedures may deteriorate.
A robust, comprehensive internal control system is a prerequisite for an organization to function ethically and in commensuration with its abilities and objectives. We have established a strong internal control system for your company and its subsidiaries. This control system is aimed at providing assurance on the company’s effectiveness and efficiency of operations, compliance with laws and regulations, safeguarding of assets and reliability of financial and management reporting. The company is staffed with experienced and qualified people who play an important role in designing, implementing, maintaining and monitoring the internal control environment.
Further, an independent body of Chartered Accountants performs periodic internal audits to provide reasonable assurance over internal control effectiveness and advice on industry wide best practices. The Audit committee consisting of independent director’s review important issues raised by the Internal and Statutory auditors thereby ensuring that the risk is mitigated appropriately with appropriate rectification measures on a periodic basis.
Management Discussion and Analysis
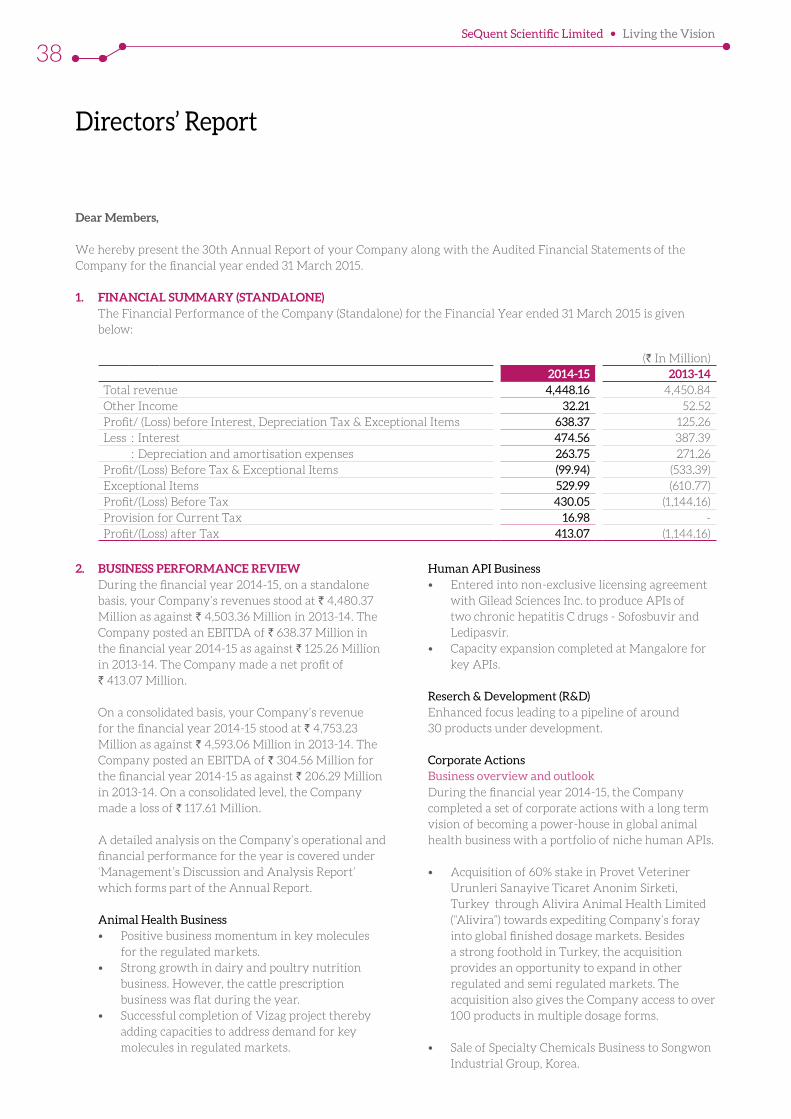
SeQuent Scientific Limited Living the Vision
38
Directors’ Report
Dear Members,
We hereby present the 30th Annual Report of your Company along with the Audited Financial Statements of the Company for the financial year ended 31 March 2015.
1. FINANCIAL SUMMARY (STANDALONE) The Financial Performance of the Company (Standalone) for the Financial Year ended 31 March 2015 is given
below:
(` In Million)2014-15 2013-14
Total revenue 4,448.16 4,450.84Other Income 32.21 52.52Profit/ (Loss) before Interest, Depreciation Tax & Exceptional Items 638.37 125.26Less : Interest 474.56 387.39 : Depreciation and amortisation expenses 263.75 271.26Profit/(Loss) Before Tax & Exceptional Items (99.94) (533.39)Exceptional Items 529.99 (610.77)Profit/(Loss) Before Tax 430.05 (1,144.16)Provision for Current Tax 16.98 -Profit/(Loss) after Tax 413.07 (1,144.16)
2. BUSINESS PERFORMANCE REVIEW During the financial year 2014-15, on a standalone
basis, your Company’s revenues stood at ` 4,480.37 Million as against ` 4,503.36 Million in 2013-14. The Company posted an EBITDA of ` 638.37 Million in the financial year 2014-15 as against ` 125.26 Million in 2013-14. The Company made a net profit of ` 413.07 Million.
On a consolidated basis, your Company’s revenue for the financial year 2014-15 stood at ` 4,753.23 Million as against ` 4,593.06 Million in 2013-14. The Company posted an EBITDA of ` 304.56 Million for the financial year 2014-15 as against ` 206.29 Million in 2013-14. On a consolidated level, the Company made a loss of ` 117.61 Million.
A detailed analysis on the Company’s operational and financial performance for the year is covered under ‘Management’s Discussion and Analysis Report’ which forms part of the Annual Report.
Animal Health Business • Positive business momentum in key molecules
for the regulated markets. • Strong growth in dairy and poultry nutrition
business. However, the cattle prescription business was flat during the year.
• Successful completion of Vizag project thereby adding capacities to address demand for key molecules in regulated markets.
Human API Business • Entered into non-exclusive licensing agreement
with Gilead Sciences Inc. to produce APIs of two chronic hepatitis C drugs - Sofosbuvir and Ledipasvir.
• Capacity expansion completed at Mangalore for key APIs.
Reserch & Development (R&D) Enhanced focus leading to a pipeline of around
30 products under development.
Corporate Actions Business overview and outlook During the financial year 2014-15, the Company
completed a set of corporate actions with a long term vision of becoming a power-house in global animal health business with a portfolio of niche human APIs.
• Acquisition of 60% stake in Provet Veteriner Urunleri Sanayive Ticaret Anonim Sirketi, Turkey through Alivira Animal Health Limited (“Alivira”) towards expediting Company’s foray into global finished dosage markets. Besides a strong foothold in Turkey, the acquisition provides an opportunity to expand in other regulated and semi regulated markets. The acquisition also gives the Company access to over 100 products in multiple dosage forms.
• Sale of Specialty Chemicals Business to Songwon Industrial Group, Korea.
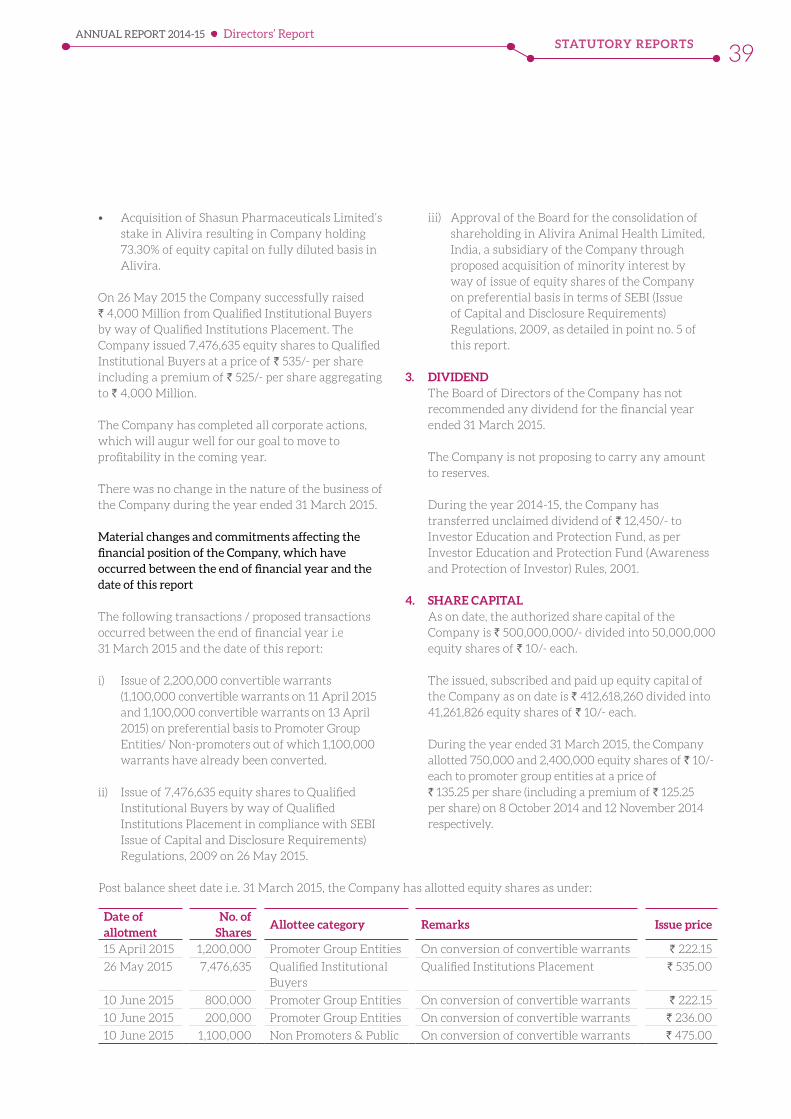
STATUTORY REPORTSANNUAL REPORT 2014-15
39
• Acquisition of Shasun Pharmaceuticals Limited’s stake in Alivira resulting in Company holding 73.30% of equity capital on fully diluted basis in Alivira.
On 26 May 2015 the Company successfully raised ` 4,000 Million from Qualified Institutional Buyers by way of Qualified Institutions Placement. The Company issued 7,476,635 equity shares to Qualified Institutional Buyers at a price of ` 535/- per share including a premium of ` 525/- per share aggregating to ` 4,000 Million.
The Company has completed all corporate actions, which will augur well for our goal to move to profitability in the coming year.
There was no change in the nature of the business of the Company during the year ended 31 March 2015.
Material changes and commitments affecting the financial position of the Company, which have occurred between the end of financial year and the date of this report
The following transactions / proposed transactions occurred between the end of financial year i.e 31 March 2015 and the date of this report:
i) Issue of 2,200,000 convertible warrants (1,100,000 convertible warrants on 11 April 2015 and 1,100,000 convertible warrants on 13 April 2015) on preferential basis to Promoter Group Entities/ Non-promoters out of which 1,100,000 warrants have already been converted.
ii) Issue of 7,476,635 equity shares to Qualified Institutional Buyers by way of Qualified Institutions Placement in compliance with SEBI Issue of Capital and Disclosure Requirements) Regulations, 2009 on 26 May 2015.
iii) Approval of the Board for the consolidation of shareholding in Alivira Animal Health Limited, India, a subsidiary of the Company through proposed acquisition of minority interest by way of issue of equity shares of the Company on preferential basis in terms of SEBI (Issue of Capital and Disclosure Requirements) Regulations, 2009, as detailed in point no. 5 of this report.
3. DIVIDEND The Board of Directors of the Company has not
recommended any dividend for the financial year ended 31 March 2015.
The Company is not proposing to carry any amount to reserves.
During the year 2014-15, the Company has transferred unclaimed dividend of ` 12,450/- to Investor Education and Protection Fund, as per Investor Education and Protection Fund (Awareness and Protection of Investor) Rules, 2001.
4. SHARE CAPITAL As on date, the authorized share capital of the
Company is ` 500,000,000/- divided into 50,000,000 equity shares of ` 10/- each.
The issued, subscribed and paid up equity capital of the Company as on date is ` 412,618,260 divided into 41,261,826 equity shares of ` 10/- each.
During the year ended 31 March 2015, the Company allotted 750,000 and 2,400,000 equity shares of ` 10/- each to promoter group entities at a price of ` 135.25 per share (including a premium of ` 125.25 per share) on 8 October 2014 and 12 November 2014 respectively.
Post balance sheet date i.e. 31 March 2015, the Company has allotted equity shares as under:
Date of allotment
No. of Shares
Allottee category Remarks Issue price
15 April 2015 1,200,000 Promoter Group Entities On conversion of convertible warrants ` 222.15
26 May 2015 7,476,635 Qualified Institutional Buyers
Qualified Institutions Placement ` 535.00
10 June 2015 800,000 Promoter Group Entities On conversion of convertible warrants ` 222.15
10 June 2015 200,000 Promoter Group Entities On conversion of convertible warrants ` 236.00
10 June 2015 1,100,000 Non Promoters & Public On conversion of convertible warrants ` 475.00
Directors’ Report
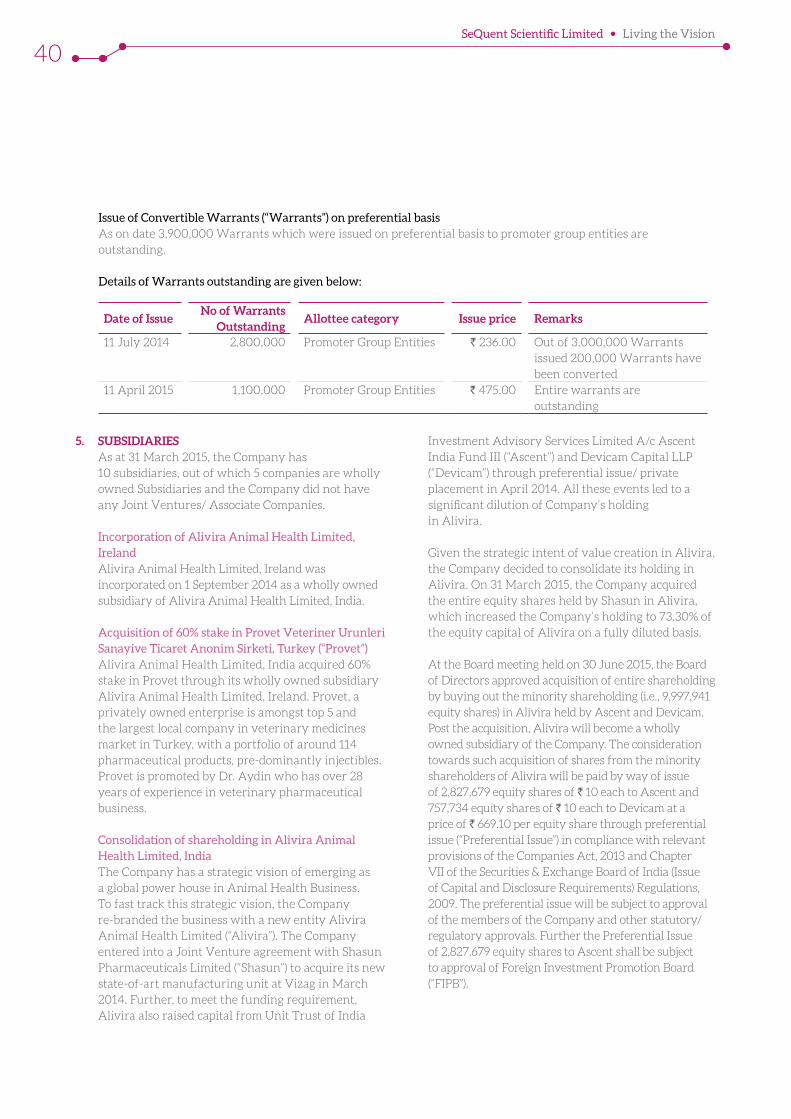
SeQuent Scientific Limited Living the Vision
40
Issue of Convertible Warrants (“Warrants”) on preferential basis As on date 3,900,000 Warrants which were issued on preferential basis to promoter group entities are
outstanding.
Details of Warrants outstanding are given below:
Date of IssueNo of Warrants
Outstanding Allottee category Issue price Remarks
11 July 2014 2,800,000 Promoter Group Entities ` 236.00 Out of 3,000,000 Warrants issued 200,000 Warrants have been converted
11 April 2015 1,100,000 Promoter Group Entities ` 475.00 Entire warrants are outstanding
5. SUBSIDIARIES As at 31 March 2015, the Company has
10 subsidiaries, out of which 5 companies are wholly owned Subsidiaries and the Company did not have any Joint Ventures/ Associate Companies.
Incorporation of Alivira Animal Health Limited, Ireland
Alivira Animal Health Limited, Ireland was incorporated on 1 September 2014 as a wholly owned subsidiary of Alivira Animal Health Limited, India.
Acquisition of 60% stake in Provet Veteriner Urunleri Sanayive Ticaret Anonim Sirketi, Turkey (“Provet”)
Alivira Animal Health Limited, India acquired 60% stake in Provet through its wholly owned subsidiary Alivira Animal Health Limited, Ireland. Provet, a privately owned enterprise is amongst top 5 and the largest local company in veterinary medicines market in Turkey, with a portfolio of around 114 pharmaceutical products, pre-dominantly injectibles. Provet is promoted by Dr. Aydin who has over 28 years of experience in veterinary pharmaceutical business.
Consolidation of shareholding in Alivira Animal Health Limited, India
The Company has a strategic vision of emerging as a global power house in Animal Health Business. To fast track this strategic vision, the Company re-branded the business with a new entity Alivira Animal Health Limited (“Alivira”). The Company entered into a Joint Venture agreement with Shasun Pharmaceuticals Limited (“Shasun”) to acquire its new state-of-art manufacturing unit at Vizag in March 2014. Further, to meet the funding requirement, Alivira also raised capital from Unit Trust of India
Investment Advisory Services Limited A/c Ascent India Fund III (“Ascent”) and Devicam Capital LLP (“Devicam”) through preferential issue/ private placement in April 2014. All these events led to a significant dilution of Company’s holding in Alivira.
Given the strategic intent of value creation in Alivira, the Company decided to consolidate its holding in Alivira. On 31 March 2015, the Company acquired the entire equity shares held by Shasun in Alivira, which increased the Company’s holding to 73.30% of the equity capital of Alivira on a fully diluted basis.
At the Board meeting held on 30 June 2015, the Board of Directors approved acquisition of entire shareholding by buying out the minority shareholding (i.e., 9,997,941 equity shares) in Alivira held by Ascent and Devicam. Post the acquisition, Alivira will become a wholly owned subsidiary of the Company. The consideration towards such acquisition of shares from the minority shareholders of Alivira will be paid by way of issue of 2,827,679 equity shares of ` 10 each to Ascent and 757,734 equity shares of ` 10 each to Devicam at a price of ` 669.10 per equity share through preferential issue (“Preferential Issue”) in compliance with relevant provisions of the Companies Act, 2013 and Chapter VII of the Securities & Exchange Board of India (Issue of Capital and Disclosure Requirements) Regulations, 2009. The preferential issue will be subject to approval of the members of the Company and other statutory/ regulatory approvals. Further the Preferential Issue of 2,827,679 equity shares to Ascent shall be subject to approval of Foreign Investment Promotion Board (“FIPB”).
STATUTORY REPORTSANNUAL REPORT 2014-15
41
Entities which ceased to be subsidiaries during the financial year ended 31 March 2015
During the year ended 31 March 2015 Vedic Fanxipang Pharma Chemic Company Limited, Vietnam and Elysian Life Sciences (Mauritius) Limited, Mauritius ceased to be subsidiaries of the Company.
Accounts of Subsidiaries In accordance with Section 129(3) of the Companies
Act, 2013, the Company has prepared a consolidated financial statement of the Company and all its subsidiary companies, which is forming part of the Annual Report. Statement containing salient features of the financial statements of Company’s subsidiaries, joint ventures and associate companies as required in Form AOC-1 is enclosed as Annexure 1 to this Report.
Further financial statements together with related reports and information of each of the subsidiary companies of the Company have been placed on the website of the Company www.sequent.in.
6. EXTRACT OF ANNUAL RETURN Extract of Annual Return in terms of Section 92(3) of
the Companies Act, 2013 in Form MGT- 9 is enclosed as Annexure 2 to this Report.
7. PUBLIC DEPOSIT During the financial year 2014-15 the Company has
not accepted or renewed any public deposits in terms of Sections 73 and 74 of the Companies Act, 2013 and rules framed thereunder.
8. BOARD OF DIRECTORS & KEY MANAGERIAL PERSONNEL
As on 30 July 2015 the Board comprises of 5 Directors consisting of 2 Executive Directors, 1 Non-Executive Director and 2 Independent Directors. Chairman of the Board is an Independent Director.
Dr. Kausalya Santhanam (DIN: 06999168) was appointed as an Additional Director on the Board of Directors of the Company on 28 October 2014 and members have approved her appointment as a Director and Independent Director at their Extraordinary General Meeting held on 2 March 2015.
Mr. Manish Gupta (DIN: 06805265) was appointed as an Additional Director and Managing Director on 12 November 2014 and members have approved his appointment as a Director and Managing Director at their Extraordinary General Meeting held on
2 March 2015. Mr. Manish Gupta was associated with the Company as Chief Executive Officer before joining the Board of the Company.
Mr. K R Ravishankar (DIN: 00084908) joined the Board of the Company on 27 April 2007, as Chairman and Managing Director. On 1 November 2013, he became a Non-Executive Chairman of the Company. Mr. K R Ravishankar was liable to retire by rotation at the 29th Annual General Meeting held on 29 September 2014 and due to health reasons, he did not seek re-appointment. Accordingly, Mr. K R Ravishankar ceased to be a Director of the Company with effect from 29 September 2014.
The Directors place on record their sincere appreciation and recognition of the valuable contribution and services rendered by Mr. K R Ravishankar during his tenure as a Director and Managing Director of the Company.
Mr. Kannan Ramanujam, Non-Executive Director (DIN: 00190637) retires by rotation at the ensuing Annual General Meeting and being eligible, offers himself for re-appointment. A brief profile of Mr. Kannan Ramanujam is given in the corporate governance report which forms part of this report.
At the Board Meeting held on 30 July 2015 the Board of Directors appointed Mr. Narendra Mairpady (DIN: 00536905) as an Additional Director (Independent Director) with effect from 1 August 2015. As per Section 161 of the Companies Act, 2013 (“the Act”), an Additional Director shall hold office up to the date of next Annual General Meeting or the last date on which the Annual General Meeting should have been held, whichever is earlier and his/ her appointment as a Director of the Company has to be approved by the members of the Company. Further as per Section 149 (4) of the Act read with amended Clause 49 of the Listing Agreement, the Company proposes to appoint Mr. Mairpady as an Independent Director to hold the office for a period of 5 (Five) years from 1 August 2015.
Board is of the opinion that Mr. Mairpady fulfills the criteria of independence as provided under section 149(6) of the Act and the Rules framed thereunder and is independent of the management.
The Company has received a declaration from him that he meets with the criteria of independence as prescribed under Section 149(6) of the Act.
Directors’ Report
SeQuent Scientific Limited Living the Vision
42
A proposal will be placed before the members at the ensuing Annual General Meeting for the appointment of Mr. Narendra Mairpady and re-appointment of Mr. Kannan Ramanujam. Your directors recommend their appointment/ re-appointment to the members of the Company.
As on date the Company has the following Key Managerial Personnel:
- Mr. Manish Gupta – Managing Director (DIN: 06805265)
- Dr. Gautam Kumar Das – Joint Managing Director (DIN: 02920990)
- Mr. Kannan P R, Chief Financial Officer - Mr. Preetham Hebbar, Company Secretary
Mr. Manish Gupta, Managing Director, Dr. Gautam Kumar Das, Joint Managing Director, Mr. Kannan P R, Chief Financial Officer and Mr. Preetham Hebbar, Company Secretary were designated as Key Managerial Personnel on 28 May 2014 in compliance with Section 203 of the Companies Act, 2013 read with rules framed thereunder.
The Company has received necessary declarations from each Independent Director that he/ she meets the criteria of independence laid down in Section 149 (6) of the Companies Act, 2013 and Clause 49 of the Listing Agreement.
Detailed data on composition of Board of Directors, Committees of Board of Directors, Meeting details, charter for each committee and attendance details forms part of the Corporate Governance Report.
9. MEETINGS OF THE BOARD During the year ended 31 March 2015, 11 (Eleven)
Board Meetings were held. These meetings were held on 23 April 2014 (2 meetings), 28 May 2014, 18 June 2014, 13 August 2014, 15 September 2014, 8 October 2014, 12 November 2014, 20 January 2015, 11 February 2015 and 2 March 2015.
10. POLICY ON DIRECTORS APPOINTMENT AND REMUNERATION
The Directors of the Company are appointed by members at the General Meetings of the Company.
As regards the appointment and tenure of Independent Directors, the Company has adopted the provisions of the Companies Act, 2013 read with Clause 49 of the Listing Agreement.
The Nomination and Remuneration Committee has adopted a policy namely Sequent Policy on Nomination and Remuneration (“the Policy”) in adherence to Section 178(3) of the Companies Act, 2013 and Clause 49 (IV) (B) (4) of the Listing Agreement as entered with stock exchange. The policy acts as a guideline on matters relating to the remuneration, appointment, removal and evaluation of performance of the Directors, Key Managerial Personnel and other employees of the Company. The policy is enclosed as Annexure 3 to this report.
11. EVALUATION OF BOARD OF DIRECTORS Pursuant to provisions of the Companies Act,
2013, Schedule IV of the Companies Act, 2013 and Clause 49 of the Listing Agreement, the Company has formulated a policy called as Sequent Board Performance Evaluation Policy (“the Policy”). Based on this the Company has prepared a questionnaire to carry out the evaluation of performance of every Director including the Independent Directors at regular intervals and at least on an annual basis. The questionnaire is structured to embed various parameters based on which the performance of a Board can be evaluated. Customized questionnaires are formulated for evaluating Independent Directors, Non-Executive Directors, Whole-time Directors, Chairperson of the Board and the Board, as a whole.
Based on the Policy the evaluation was conducted by the Company.
12. AUDIT COMMITTEE The Composition of Audit Committee of the
Company as on 30 July 2015 is given below: a. Dr. Gopakumar G Nair – Chairman b. Mr. Kannan Ramanujam – Member c. Dr. Kausalya Santhanam - Member
Board of the Company has accepted all recommendations given by the Audit Committee.
13. SECRETARIAL AUDIT REPORT Pursuant to the provisions of Section 204 (1) of
the Companies Act, 2013 and the Companies (Appointment and Remuneration of Managerial Personnel) Rules, 2014, the Company has appointed M/s. B.G & Associates, Practicing Company Secretaries to carry out the Secretarial Audit for the financial year 2014-15. The Secretarial Audit Report is annexed as Annexure 4 to this Report. There are
STATUTORY REPORTSANNUAL REPORT 2014-15
43
no qualifications, observations or adverse remarks in the Secretarial Audit Report.
14. STATUTORY AUDITORS At the Annual General Meeting held on
29 September 2014, M/s. Deloitte Haskins & Sells, Chartered Accountants, (Firm Registration Number 008072S) were appointed as Statutory Auditors of the Company for a period of 5 years from 29th Annual General Meeting till the conclusion of 34th Annual General Meeting. In terms of the first proviso to Section 139(1) of the Companies Act, 2013 (“the Act”), the appointment of auditors shall be placed for ratification at every Annual General Meeting. Accordingly, the appointment of M/s. Deloitte Haskins & Sells, Chartered Accountants, as Statutory Auditors of the Company will be placed for ratification by the members in the ensuing Annual General Meeting of the Company.
Pursuant to Section 148(3) of the Act and Companies (Cost records and audit) Rules, 2014, Mr. Girish Kambadaraya, Cost Accountant, has been appointed as the Cost Auditor for the financial year 2014-15. The due date for filing the Cost Audit Reports in XBRL mode for the financial year ended 31 March 2014 was 30 September 2014 and the Cost Audit reports were filed by the Cost Auditor on 22 September 2014.
The due date for filing the Cost Audit Reports for the financial year ended 31 March 2015 is 30 September 2015.
The Board at its meeting held on 30 July 2015 on recommendation of Audit Committee has appointed Mr. Girish Kambadaraya, Cost Accountant, as the Cost Auditor for the financial year 2015-16 in terms of Section 148(3) of the Act and Companies (Cost records and audit) Rules, 2014 as amended. As per the requirement of Companies Act, 2013 remuneration payable to Cost Auditors shall be placed for ratification of at the ensuing Annual General Meeting of the Company.
A proposal will be placed before the members for the ratification of remuneration payable to Mr. Girish Kambadarya, Cost Auditor of the Company for the year 2015-16.
15. AUDIT REPORT There are no qualifications, observations or adverse
remarks in the Audit Report issued by the Statutory Auditors of the Company for financial year ended 31 March 2015.
16. PARTICULARS OF EMPLOYEES The statement containing particulars of employees
as required under Section 197(12) of the Companies Act, 2013 read with Rule 5 (1) of the Companies (Appointment and Remuneration of Managerial Personnel) Rules, 2014, is provided as an Annexure 5 to this report except the report as per Rule 5 (2) of the Companies (Appointment and Remuneration of Managerial Personnel) Rules, 2014. In terms of Section 136 of the Companies Act, 2013 the said report is open for inspection at the Registered Office of the Company during working hours and any member interested in obtaining a copy of the same may write to the Company Secretary at the registered office of the Company.
17. VIGIL MECHANISM / WHISTLE BLOWER POLICY The Board of Directors of the Company at its
meeting held on 28 May 2014 has approved the implementation of Whistle Blower Policy namely “Sequent Whistle Blower Policy” (“the Policy”) throughout the Company in order to curb the unethical or improper behaviour/ practices or alleged wrongful conduct or violation of Code of Conduct of the Company or applicable laws, frauds, bribery, corruption, employee misconduct, illegality, health, safety & environmental issues or misappropriation of Company funds or assets within the Company or by the Company. This policy helps in providing a mechanism for personnel to report to the Authority concerns about unethical behaviour, actual or suspected fraud or violation of the company’s code of conduct or ethics policy.
The Policy ensures that strict confidentiality is maintained whilst dealing with concerns and also that no discrimination will be meted out to any person for a genuinely raised concern.
The Policy covering all employees, Directors and other persons having association with the Company is hosted on the Company’s website at www.sequent.in.
Directors’ Report
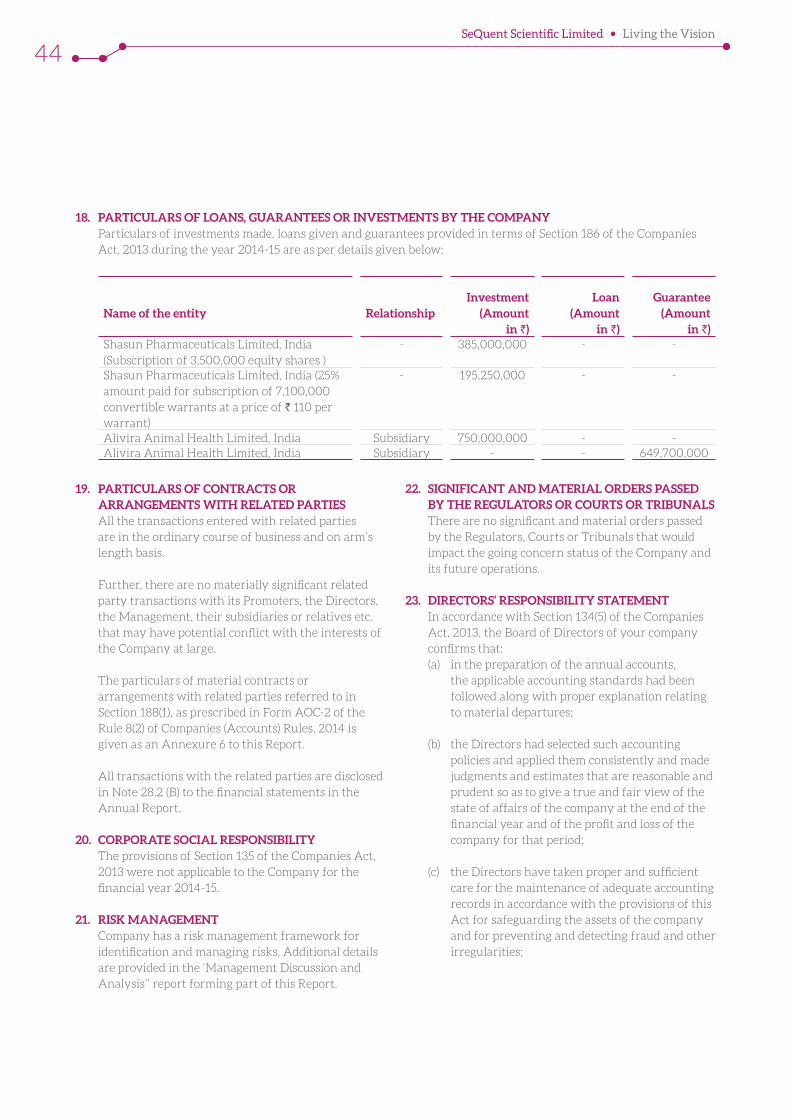
SeQuent Scientific Limited Living the Vision
44
Name of the entity RelationshipInvestment
(Amount in `)
Loan (Amount
in `)
Guarantee (Amount
in `)Shasun Pharmaceuticals Limited, India (Subscription of 3,500,000 equity shares )
- 385,000,000 - -
Shasun Pharmaceuticals Limited, India (25% amount paid for subscription of 7,100,000 convertible warrants at a price of ` 110 per warrant)
- 195,250,000 - -
Alivira Animal Health Limited, India Subsidiary 750,000,000 - -Alivira Animal Health Limited, India Subsidiary - - 649,700,000
18. PARTICULARS OF LOANS, GUARANTEES OR INVESTMENTS BY THE COMPANY Particulars of investments made, loans given and guarantees provided in terms of Section 186 of the Companies
Act, 2013 during the year 2014-15 are as per details given below:
19. PARTICULARS OF CONTRACTS OR ARRANGEMENTS WITH RELATED PARTIES
All the transactions entered with related parties are in the ordinary course of business and on arm’s length basis.
Further, there are no materially significant related party transactions with its Promoters, the Directors, the Management, their subsidiaries or relatives etc. that may have potential conflict with the interests of the Company at large.
The particulars of material contracts or arrangements with related parties referred to in Section 188(1), as prescribed in Form AOC-2 of the Rule 8(2) of Companies (Accounts) Rules, 2014 is given as an Annexure 6 to this Report.
All transactions with the related parties are disclosed in Note 28.2 (B) to the financial statements in the Annual Report.
20. CORPORATE SOCIAL RESPONSIBILITY The provisions of Section 135 of the Companies Act,
2013 were not applicable to the Company for the financial year 2014-15.
21. RISK MANAGEMENT Company has a risk management framework for
identification and managing risks. Additional details are provided in the ‘Management Discussion and Analysis’’ report forming part of this Report.
22. SIGNIFICANT AND MATERIAL ORDERS PASSED BY THE REGULATORS OR COURTS OR TRIBUNALS
There are no significant and material orders passed by the Regulators, Courts or Tribunals that would impact the going concern status of the Company and its future operations.
23. DIRECTORS’ RESPONSIBILITY STATEMENT In accordance with Section 134(5) of the Companies
Act, 2013, the Board of Directors of your company confirms that:
(a) in the preparation of the annual accounts, the applicable accounting standards had been followed along with proper explanation relating to material departures;
(b) the Directors had selected such accounting policies and applied them consistently and made judgments and estimates that are reasonable and prudent so as to give a true and fair view of the state of affairs of the company at the end of the financial year and of the profit and loss of the company for that period;
(c) the Directors have taken proper and sufficient care for the maintenance of adequate accounting records in accordance with the provisions of this Act for safeguarding the assets of the company and for preventing and detecting fraud and other irregularities;
STATUTORY REPORTSANNUAL REPORT 2014-15
45
(d) the annual accounts of the Company have been prepared on a going concern basis;
(e) the Directors, had laid down internal financial controls to be followed by the company and that such internal financial controls are adequate and were operating effectively.
(f) the Directors had devised proper systems to ensure compliance with the provisions of all applicable laws and that such systems were adequate and operating effectively.
24. CONSERVATION OF ENERGY, TECHNOLOGY ABSORPTION, FOREIGN EXCHANGE EARNINGS/ OUTGO AND RESEARCH & DEVELOPMENT
The particulars as prescribed under Section 134(3)(m) of the Companies Act, 2013 read with Rule 8(3) of the Companies (Accounts) Rules, 2014 is enclosed as an Annexure 7 to this Report.
Detailed write-up on Research and Development activity also forms part of this annexure.
25. CORPORATE GOVERNANCE The Company has complied with all the mandatory
requirements of Corporate Governance specified by the Securities and Exchange Board of India under Clause 49 of the Listing Agreement as entered with the Stock Exchange (“Listing Agreement”). As required by the said clause, a separate Report on Corporate Governance forms part of the Annual Report of the Company. A certificate from the Statutory Auditors of the Company regarding compliance with Corporate Governance requirements as stipulated in Clause 49 of the Listing Agreement also forms part of the Annual Report.
26. MANAGEMENT DISCUSSION AND ANALYSIS Pursuant to clause 49 of the Listing Agreement entered
into with the Stock Exchange, Management Discussion and Analysis Report forms part of this Report.
27. EMPLOYEE STOCK OPTION SCHEME The Company has formulated an Employee Stock
Option Plan titled ‘SSL ESOP Scheme 2010’ and the scheme is administered through a trust. As on date 700,000 shares have been issued to the trust. During the financial year 2014-15 the Compensation Committee has granted 380,000 options to identified employees, and 60,000 options lapsed due to resignation of employees. As at 31 March 2015, 772,500 Stock options are outstanding.
The ESOP scheme of the Company is in Compliance with the Securities and Exchange Board of India (Share Based Employee Benefits) Regulations, 2014.
Further disclosure under Section 62 of the Companies Act, 2013 read with Rule 12 of Companies (Share Capital and Debentures) Rules, 2014 and SEBI (Share Based Employee Benefits) Regulations, 2014 is enclosed as an Annexure 8 to this Report.
28. APPRECIATION Your Directors would like to express their
appreciation for the excellent support and co-operation received from the Members, Customers, Financial Institutions, Banks, Government Authorities, Reserve Bank of India, Securities and Exchange Board of India, Stock Exchanges, Manufacturers and Suppliers to the Company.
We would like to place on record our sincere appreciation for the total commitment, dedication, untiring efforts and hard work put in by the employees at all levels of the Company in realisation of the corporate goals in the years ahead.
For and on behalf of the Board of Directors
Dr. Gopakumar G Nair
Chairman
Place: Bangalore
Date: 30 July 2015
Directors’ Report
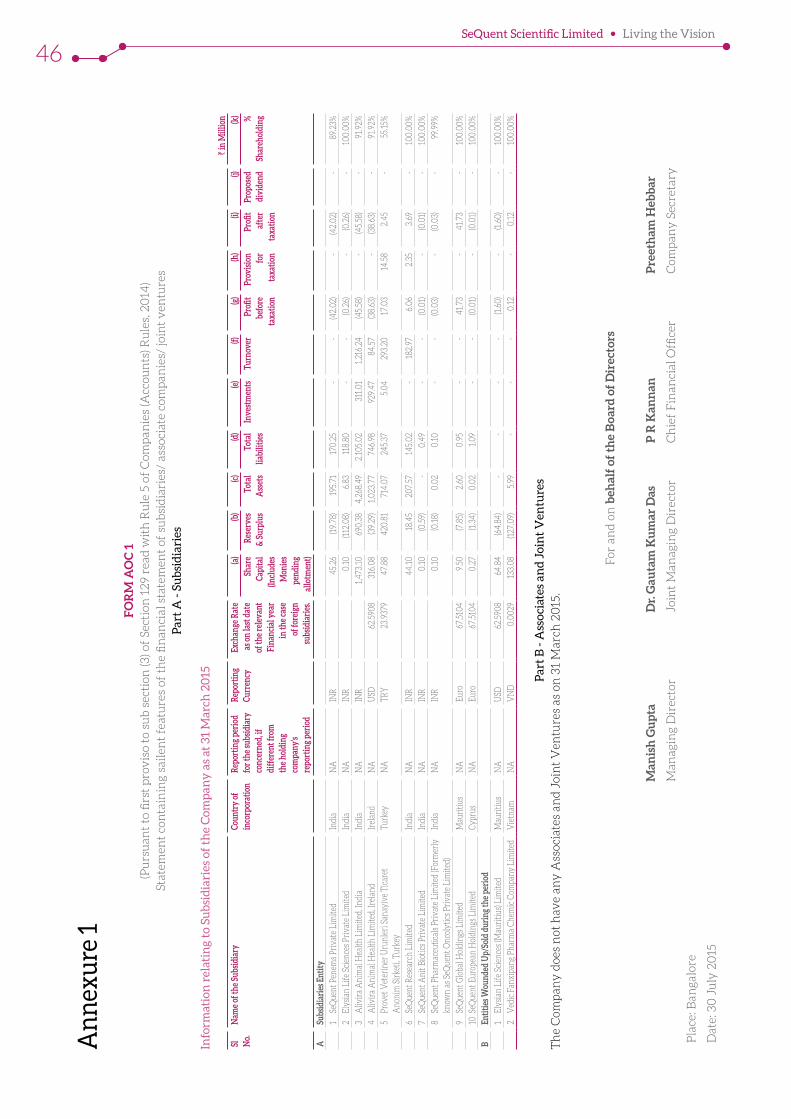
SeQuent Scientific Limited Living the Vision
46
An
nex
ure
1F
OR
M A
OC
1(P
urs
uan
t to
firs
t p
rov
iso
to s
ub
sec
tion
(3) o
f Se
ctio
n 1
29
read
wit
h R
ule
5 o
f C
omp
anie
s (A
ccou
nts
) Ru
les,
20
14)
Stat
emen
t co
nta
inin
g sa
ilen
t fe
atu
res
of t
he
fin
anci
al s
tate
men
t of
su
bsi
dia
ries
/ as
soci
ate
com
pan
ies/
join
t v
entu
res
Par
t A
- S
ub
sid
iari
es
Info
rmat
ion
rel
atin
g to
Su
bsi
dia
ries
of
the
Com
pan
y a
s at
31
Mar
ch 2
015
` in
Mill
ion
Sl
No.
Nam
e of
the
Subs
idia
ryCo
untr
y of
in
corp
orat
ion
Repo
rtin
g pe
riod
fo
r the
subs
idia
ry
conc
erne
d, if
di
ffer
ent f
rom
th
e ho
ldin
g co
mpa
ny’s
repo
rtin
g pe
riod
Repo
rtin
g Cu
rren
cyEx
chan
ge R
ate
as o
n la
st d
ate
of th
e re
leva
nt
Fina
ncia
l yea
r in
the
case
of
fore
ign
subs
idia
ries
.
(a)
(b)
(c)(d
)(e
)(f)
(g)
(h)
(i)(j)
(k
) Sh
are
Capi
tal
(Incl
udes
M
onie
s pe
ndin
g al
lotm
ent)
Res
erve
s &
Sur
plus
Tot
al
Ass
ets
Tot
al
liabi
litie
sIn
vest
men
ts
Tur
nove
r P
rofit
be
fore
ta
xatio
n
Pro
visi
on
for
taxa
tion
Pro
fit
afte
r ta
xatio
n
Prop
osed
di
vide
nd%
Sh
areh
oldi
ng
ASu
bsid
iari
es E
ntity
1 Se
Que
nt P
enem
s Pri
vate
Lim
ited
Indi
aN
AIN
R 4
5.26
(1
9.78
) 1
95.7
1 1
70.2
5 -
- (4
2.02
) -
(42.
02)
- 89
.23%
2 El
ysia
n Li
fe S
cien
ces P
riva
te L
imite
dIn
dia
NA
INR
0.1
0 (1
12.0
8) 6
.83
118
.80
- -
(0.2
6) -
(0.2
6) -
100.
00%
3 A
livir
a A
nim
al H
ealth
Lim
ited,
Indi
aIn
dia
NA
INR
1,4
73.1
0 6
90.3
8 4,
268.
49
2,1
05.0
2 3
11.0
1 1
,216
.24
(45.
58)
- (4
5.58
) -
91.9
2%
4 A
livir
a A
nim
al H
ealth
Lim
ited,
Irel
and
Irel
and
NA
USD
62.5
908
316
.08
(39.
29)
1,02
3.77
7
46.9
8 9
29.4
7 8
4.57
(3
8.63
) -
(38.
63)
- 91
.92%
5 Pr
ovet
Vet
erin
er U
runl
eri S
anay
ive
Tica
ret
Ano
nim
Sir
keti,
Tur
key
Turk
eyN
ATR
Y23
.937
9 4
7.88
4
20.8
1 7
14.0
7 2
45.3
7 5
.04
293
.20
17.
03
14.
58
2.4
5 -
55.1
5%
6 Se
Que
nt R
esea
rch
Lim
ited
Indi
aN
AIN
R 4
4.10
1
8.45
2
07.5
7 1
45.0
2 -
182
.97
6.0
6 2
.35
3.6
9 -
100.
00%
7 Se
Que
nt A
nit B
iotic
s Pri
vate
Lim
ited
Indi
aN
AIN
R 0
.10
(0.5
9) -
0.4
9 -
- (0
.01)
- (0
.01)
- 10
0.00
%
8 Se
Que
nt P
harm
aceu
tical
s Pri
vate
Lim
ited
(For
mer
ly
know
n as
SeQ
uent
Onc
olyt
ics P
riva
te L
imite
d)In
dia
NA
INR
0.1
0 (0
.18)
0.0
2 0
.10
- -
(0.0
3) -
(0.0
3) -
99.9
9%
9 Se
Que
nt G
loba
l Hol
ding
s Lim
ited
Mau
ritiu
sN
AEu
ro67
.510
4 9
.50
(7.8
5) 2
.60
0.9
5 -
- 4
1.73
-
41.
73
- 10
0.00
%
10 S
eQue
nt E
urop
ean
Hol
ding
s Lim
ited
Cypr
usN
AEu
ro67
.510
4 0
.27
(1.3
4) 0
.02
1.0
9 -
- (0
.01)
- (0
.01)
- 10
0.00
%
BEn
titie
s Wou
nded
Up/
Sold
dur
ing
the
peri
od1
Elys
ian
Life
Sci
ence
s (M
auri
tius)
Lim
ited
Mau
ritiu
sN
AU
SD62
.590
8 6
4.84
(6
4.84
) -
- -
- (1
.60)
- (1
.60)
- 10
0.00
%
2 V
edic
Fan
xipa
ng P
harm
a Ch
emic
Com
pany
Lim
ited
Vie
tnam
NA
VN
D0.
0029
133
.08
(127
.09)
5.9
9 -
- -
0.1
2 -
0.1
2 -
100.
00%
Par
t B
- A
sso
ciat
es a
nd
Joi
nt
Ven
ture
s T
he
Com
pan
y d
oes
not
hav
e an
y A
ssoc
iate
s an
d J
oin
t V
entu
res
as o
n 3
1 M
arch
20
15.
For
an
d o
n b
ehal
f of
th
e B
oar
d o
f D
irec
tors
Man
ish
Gu
pta
Dr.
Gau
tam
Ku
mar
Das
P R
Kan
nan
Pre
eth
am H
ebb
ar
Man
agin
g D
irec
tor
Join
t M
anag
ing
Dir
ecto
rC
hie
f F
inan
cial
Offi
cer
Com
pan
y S
ecre
tary
Pla
ce: B
anga
lore
Dat
e: 3
0 J
uly
20
15
STATUTORY REPORTSANNUAL REPORT 2014-15
47
Annexure 2
FORM NO. MGT-9EXTRACT OF ANNUAL RETURN
As on the financial year ended on March 31, 2015[Pursuant to section 92(3) of the Companies Act, 2013 and rule 12(1) of the Companies (Management and
Administration) Rules, 2014]
I. REGISTRATION AND OTHER DETAILS:
1. CIN L99999MH1985PLC0366852. Registration Date 28 June 19853. Name of the Company Sequent Scientific Limited
4.Category/Sub-Category of the Company
Company Limited by Shares/Indian Non-Government Company
5. Address of the Registered office and contact details
301, 3rd Floor, Dosti Pinnacle, Plot No.E7 Road No.22, Wagle Industrial Estate, Thane west -400 604, Maharashtra, IndiaTel No: +91 22 4111 4777Fax No: +91 22 4111 4754
6. Whether Listed Company Yes7. Name, Address and Contact details of
Registrar and Transfer Agent, if anyM/s. Adroit Corporate Services Private Limited19, Jaferbhoy Industrial Estate, 1st Floor, Makhwana Road , Marol Naka, Andheri (E), Mumbai- 400 059Tel No: +91 22 42270400Fax No:+91 22 28503748
II. PRINCIPAL BUSINESS ACTIVITIES OF THE COMPANY
Sr. No Name and Description of main products/services
NIC Code of the product/services % to total turnover of the Company
1. Pharmaceuticals 21001 95%
III. PARTICULARS OF HOLDING, SUBSIDIARY AND ASSOCIATE COMPANIES
Sr. No.
Name and Address of the Company
CIN/GLN Holding/Subsidiary/Associate
% of shares held
Applicable section under Companies Act, 2013
1 Alivira Animal Health Limited301, 3rd Floor, Dosti Pinnacle, Plot No.E7 Road No.22, Wagle Industrial Estate, Thane west - 400 604, Maharashtra, India
U74120MH2013PLC248708 Subsidiary 91.92 Section 2(87)
2 Sequent Research Limited120/A & B, Industrial Area Baikampady, Mangalore - 575001, Karnataka, India
U24232KA2007PLC042483 Subsidiary 100 Section 2(87)
3 Sequent Penems Private LimitedStar II, Opp. IIM, Bilekahalli, Bannerghatta Road, Bangalore - 560 076, Karnataka, India
U24233KA2010PTC053548 Subsidiary 89.23 Section 2(87)
Directors’ Report
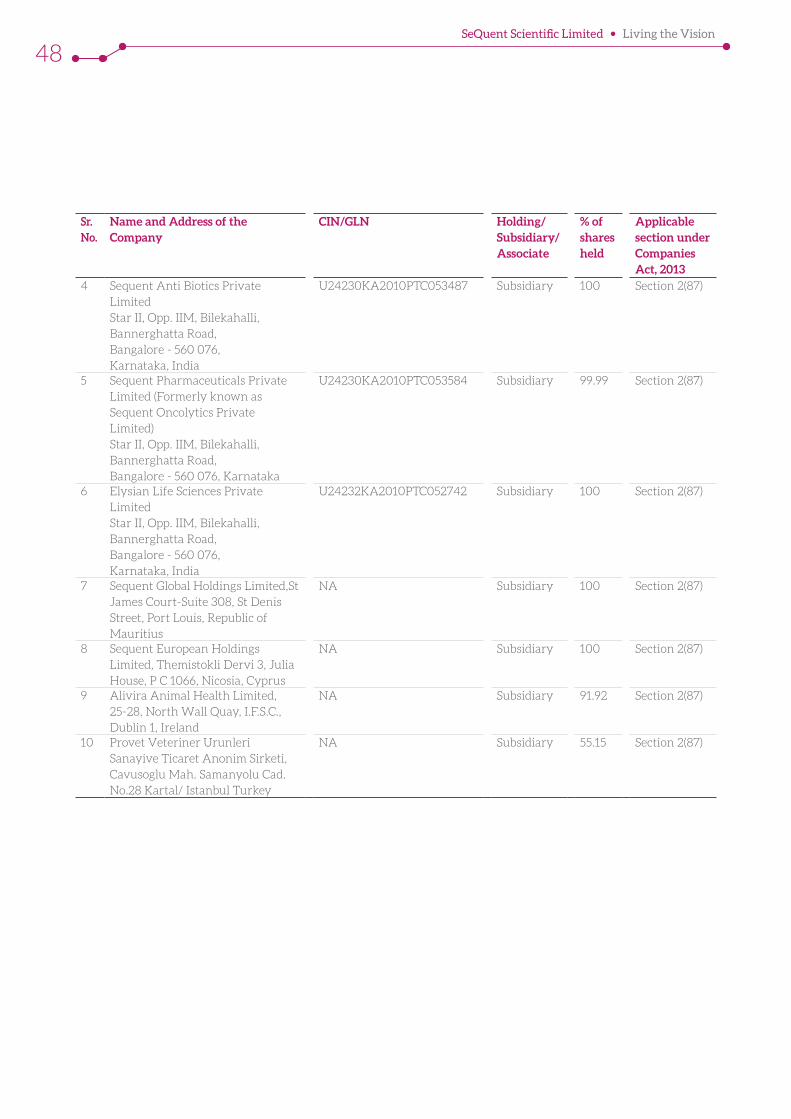
SeQuent Scientific Limited Living the Vision
48
Sr. No.
Name and Address of the Company
CIN/GLN Holding/Subsidiary/Associate
% of shares held
Applicable section under Companies Act, 2013
4 Sequent Anti Biotics Private LimitedStar II, Opp. IIM, Bilekahalli, Bannerghatta Road, Bangalore - 560 076, Karnataka, India
U24230KA2010PTC053487 Subsidiary 100 Section 2(87)
5 Sequent Pharmaceuticals Private Limited (Formerly known as Sequent Oncolytics Private Limited)Star II, Opp. IIM, Bilekahalli, Bannerghatta Road, Bangalore - 560 076, Karnataka
U24230KA2010PTC053584 Subsidiary 99.99 Section 2(87)
6 Elysian Life Sciences Private LimitedStar II, Opp. IIM, Bilekahalli, Bannerghatta Road, Bangalore - 560 076, Karnataka, India
U24232KA2010PTC052742 Subsidiary 100 Section 2(87)
7 Sequent Global Holdings Limited,St James Court-Suite 308, St Denis Street, Port Louis, Republic of Mauritius
NA Subsidiary 100 Section 2(87)
8 Sequent European Holdings Limited, Themistokli Dervi 3, Julia House, P C 1066, Nicosia, Cyprus
NA Subsidiary 100 Section 2(87)
9 Alivira Animal Health Limited, 25-28, North Wall Quay, I.F.S.C., Dublin 1, Ireland
NA Subsidiary 91.92 Section 2(87)
10 Provet Veteriner Urunleri Sanayive Ticaret Anonim Sirketi, Cavusoglu Mah. Samanyolu Cad. No.28 Kartal/ Istanbul Turkey
NA Subsidiary 55.15 Section 2(87)
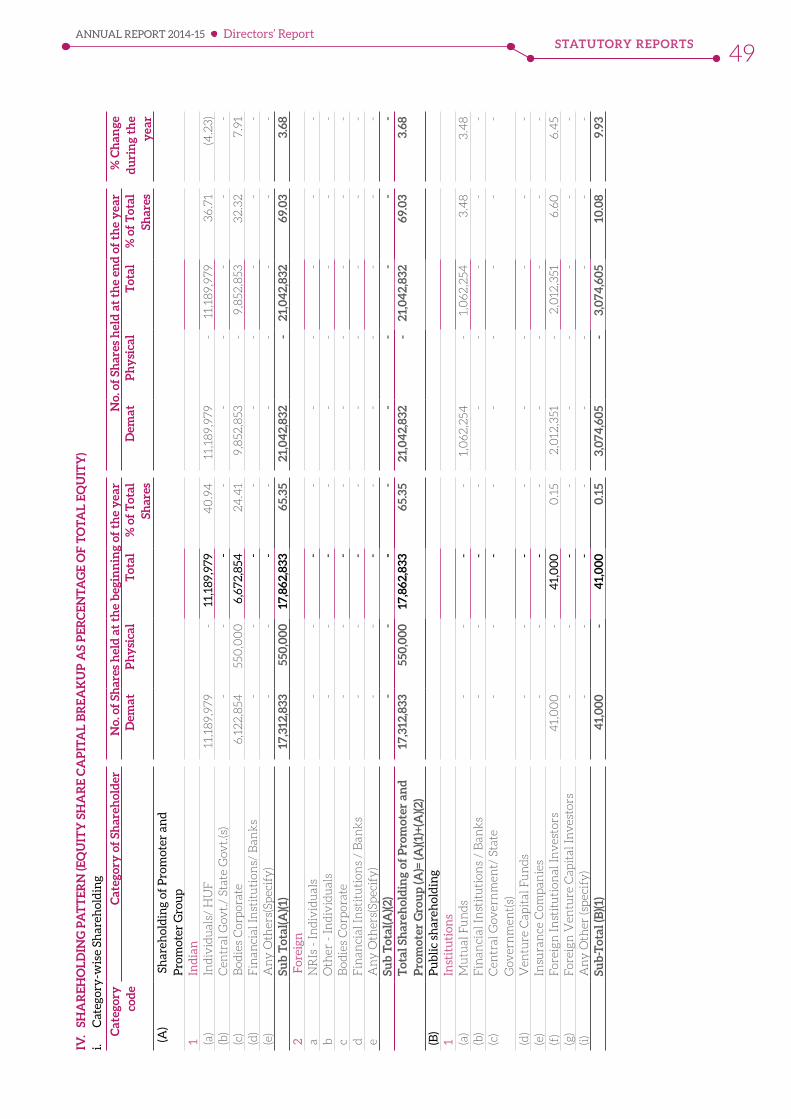
STATUTORY REPORTSANNUAL REPORT 2014-15
49IV
. SH
AR
EH
OL
DIN
G P
AT
TE
RN
(EQ
UIT
Y S
HA
RE
CA
PIT
AL
BR
EA
KU
P A
S P
ER
CE
NT
AG
E O
F T
OT
AL
EQ
UIT
Y)
i. C
ateg
ory
-wis
e Sh
areh
old
ing
Cat
egor
y
cod
e C
ateg
ory
of
Shar
ehol
der
N
o. o
f Sh
ares
hel
d a
t th
e b
egin
nin
g of
th
e y
ear
No.
of
Shar
es h
eld
at
the
end
of
the
yea
r %
Ch
ange
d
uri
ng
the
yea
r
Dem
at
Ph
ysi
cal
Tot
al
% o
f T
otal
Sh
ares
D
emat
P
hy
sica
l T
otal
%
of
Tot
al
Shar
es (A
) S
har
ehol
din
g of
Pro
mot
er a
nd
P
rom
oter
Gro
up
1In
dia
n(a
)In
div
idu
als/
HU
F 1
1,18
9,97
9 -
1
1,18
9,97
9 4
0.9
4
11,
189,
979
-
11,
189,
979
36.
71
(4.2
3)
(b)
Cen
tral
Gov
t./
Stat
e G
ovt.
(s)
-
-
-
-
-
-
-
-
-(c
)B
od
ies
Cor
por
ate
6,1
22
,854
5
50,0
00
6
,672
,854
2
4.4
1 9
,852
,853
-
9
,852
,853
3
2.3
2
7.9
1(d
)F
inan
cial
In
stit
uti
ons/
Ban
ks
-
-
-
-
-
-
-
-
-(e
)A
ny
Oth
ers(
Spec
ify
) -
-
-
-
-
-
-
-
-
Sub
Tot
al(A
)(1)
17,
312,
833
550
,00
0
17,
862,
833
65.
35
21,0
42,
832
- 21
,04
2,83
2 6
9.0
3 3
.68
2 F
orei
gna
NR
Is -
In
div
idu
als
-
-
-
-
-
-
-
-
-b
Oth
er -
In
div
idu
als
-
-
-
-
-
-
-
-
-c
Bo
die
s C
orp
orat
e -
-
-
-
-
-
-
-
-
dF
inan
cial
In
stit
uti
ons
/ B
ank
s -
-
-
-
-
-
-
-
-
eA
ny
Oth
ers(
Spec
ify
) -
-
-
-
-
-
-
-
-
Sub
Tot
al(A
)(2)
- -
- -
- -
- -
-T
otal
Sh
areh
old
ing
of P
rom
oter
an
d
Pro
mot
er G
rou
p (A
)= (A
)(1)+
(A)(2
) 1
7,31
2,83
3 5
50,0
00
1
7,86
2,83
3 6
5.35
21
,04
2,83
2 -
21,0
42,
832
69.
03
3.6
8
(B)
Pu
bli
c sh
areh
old
ing
1In
stit
uti
ons
(a)
Mu
tual
Fu
nd
s -
-
-
-
1
,062
,254
-
1
,062
,254
3
.48
3
.48
(b)
Fin
anci
al I
nst
itu
tion
s /
Ban
ks
-
-
-
-
-
-
-
-
-(c
)C
entr
al G
over
nm
ent/
Sta
te
Gov
ern
men
t(s)
-
-
-
-
-
-
-
-
-
(d)
Ven
ture
Cap
ital
Fu
nd
s -
-
-
-
-
-
-
-
-
(e)
Insu
ran
ce C
omp
anie
s -
-
-
-
-
-
-
-
-
(f)
For
eign
In
stit
uti
onal
In
ves
tors
41,
00
0
-
41,
00
0
0.1
5 2
,012
,351
-
2
,012
,351
6
.60
6
.45
(g)
For
eign
Ven
ture
Cap
ital
In
ves
tors
-
-
-
-
-
-
-
-
-(i)
An
y O
ther
(sp
ecif
y)
-
-
-
-
-
-
-
-
-Su
b-T
otal
(B)(1
) 4
1,0
00
-
41,
00
0
0.1
5 3
,074
,60
5 -
3,0
74,6
05
10
.08
9.9
3
Directors’ Report
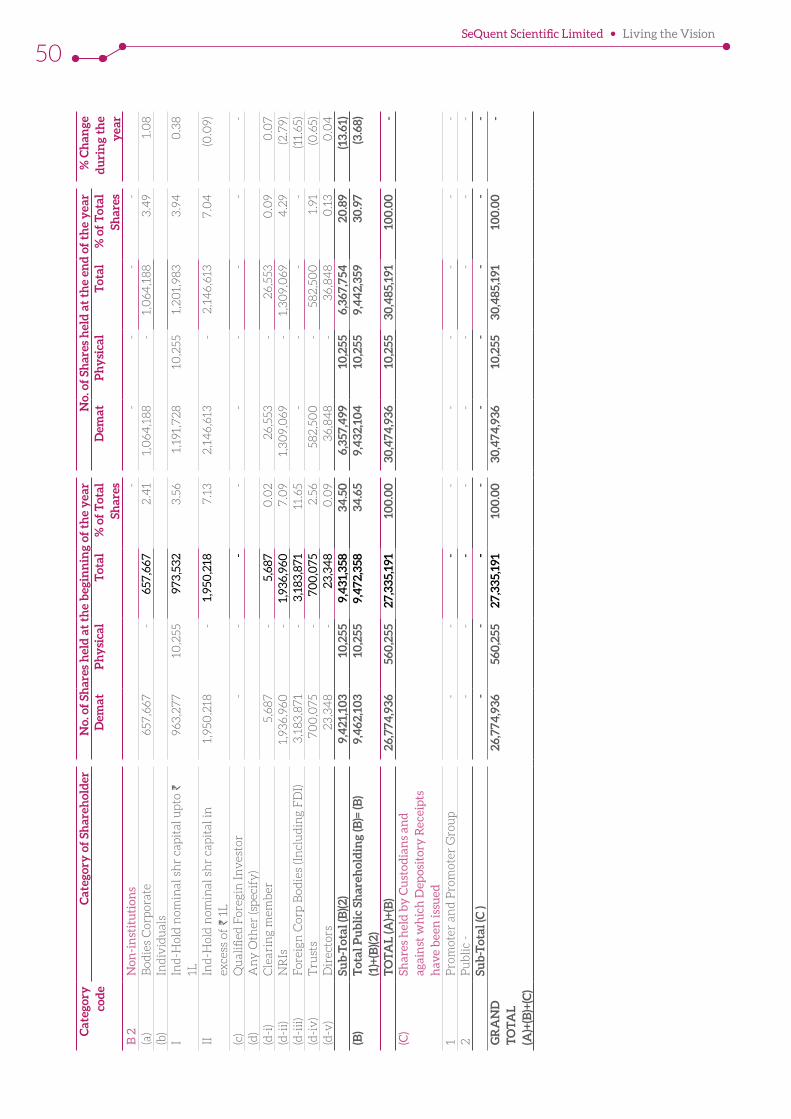
SeQuent Scientific Limited Living the Vision
50C
ateg
ory
co
de
Cat
egor
y o
f Sh
areh
old
er
No.
of
Shar
es h
eld
at
the
beg
inn
ing
of t
he
yea
r N
o. o
f Sh
ares
hel
d a
t th
e en
d o
f th
e y
ear
% C
han
ge
du
rin
g th
e y
ear
Dem
at
Ph
ysi
cal
Tot
al
% o
f T
otal
Sh
ares
D
emat
P
hy
sica
l T
otal
%
of
Tot
al
Shar
esB
2N
on-i
nst
itu
tion
s -
-
-
-
-
(a)
Bo
die
s C
orp
orat
e 6
57,6
67
-
657
,667
2
.41
1,0
64,1
88
-
1
,064
,18
8
3.4
9 1
.08
(b)
Ind
ivid
ual
sI
Ind
-Hol
d n
omin
al s
hr
cap
ital
up
to `
1L 9
63,2
77
1
0,2
55
973
,532
3
.56
1,1
91,7
28
1
0,2
55
1,2
01,
983
3
.94
0
.38
IIIn
d-H
old
nom
inal
sh
r ca
pit
al in
ex
cess
of
` 1L
1,9
50,2
18
-
1,9
50,2
18
7.1
3
2,1
46,
613
-
2
,14
6,61
3
7.0
4
(0.0
9)
(c)
Qu
alifi
ed F
oreg
in I
nv
esto
r -
-
-
-
-
-
-
-
-
(d)
An
y O
ther
(sp
ecif
y)
(d-i
)C
lear
ing
mem
ber
5,6
87
-
5
,687
0
.02
2
6,55
3
-
26,
553
0
.09
0.0
7(d
-ii)
NR
Is 1
,93
6,96
0
-
1,9
36,9
60
7.0
9 1
,30
9,0
69
-
1,3
09,
069
4
.29
(2.7
9)(d
-iii
)F
orei
gn C
orp
Bo
die
s (I
ncl
ud
ing
FD
I) 3
,18
3,8
71
-
3,1
83,8
71
11.
65
-
-
-
-
(11.
65)
(d-i
v)
Tru
sts
70
0,0
75
-
70
0,0
75
2.5
6 5
82
,50
0
-
58
2,5
00
1
.91
(0.6
5)(d
-v)
Dir
ecto
rs 2
3,3
48
-
2
3,34
8 0
.09
36,
84
8
-
36,
84
8
0.1
3 0
.04
Sub
-Tot
al (B
)(2)
9,4
21,1
03
10
,255
9
,431
,358
3
4.5
0
6,3
57,4
99
10
,255
6
,367
,754
2
0.8
9 (1
3.61
)(B
)T
otal
Pu
bli
c Sh
areh
old
ing
(B)=
(B)
(1)+
(B)(2
) 9
,462
,10
3 1
0,2
55
9,4
72,3
58
34
.65
9,4
32,1
04
1
0,2
55
9,4
42,
359
30
.97
(3.6
8)
TO
TA
L (A
)+(B
)26
,774
,936
5
60,2
55
27,
335,
191
10
0.0
0
30,4
74,9
36
10
,255
3
0,4
85,1
91
10
0.0
0
-(C
)Sh
ares
hel
d b
y C
ust
od
ian
s an
d
agai
nst
wh
ich
Dep
osit
ory
Rec
eip
ts
hav
e b
een
issu
ed1
Pro
mot
er a
nd
Pro
mot
er G
rou
p
-
-
-
-
-
-
-
-
-2
Pu
bli
c -
-
-
-
-
-
-
-
-
-Su
b-T
otal
(C )
- -
- -
- -
- -
-G
RA
ND
T
OT
AL
(A
)+(B
)+(C
)
26,7
74,9
36
560
,255
2
7,33
5,19
1 1
00
.00
30
,474
,936
1
0,2
55
30
,485
,191
1
00
.00
-
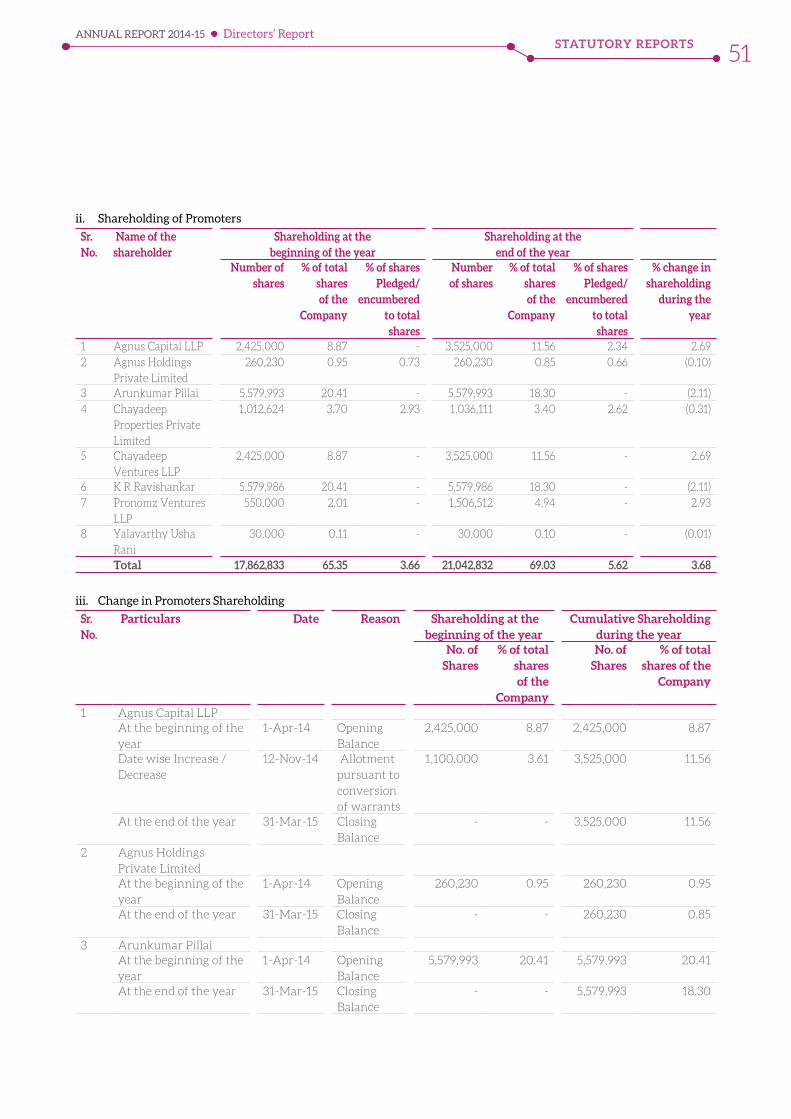
STATUTORY REPORTSANNUAL REPORT 2014-15
51
ii. Shareholding of Promoters
Sr. No.
Name of the shareholder
Shareholding at the beginning of the year
Shareholding at the end of the year
Number of shares
% of total shares of the
Company
% of shares Pledged/
encumbered to total shares
Number of shares
% of total shares of the
Company
% of shares Pledged/
encumbered to total shares
% change in shareholding
during the year
1 Agnus Capital LLP 2,425,000 8.87 - 3,525,000 11.56 2.34 2.692 Agnus Holdings
Private Limited 260,230 0.95 0.73 260,230 0.85 0.66 (0.10)
3 Arunkumar Pillai 5,579,993 20.41 - 5,579,993 18.30 - (2.11)4 Chayadeep
Properties Private Limited
1,012,624 3.70 2.93 1,036,111 3.40 2.62 (0.31)
5 Chayadeep Ventures LLP
2,425,000 8.87 - 3,525,000 11.56 - 2.69
6 K R Ravishankar 5,579,986 20.41 - 5,579,986 18.30 - (2.11)7 Pronomz Ventures
LLP 550,000 2.01 - 1,506,512 4.94 - 2.93
8 Yalavarthy Usha Rani
30,000 0.11 - 30,000 0.10 - (0.01)
Total 17,862,833 65.35 3.66 21,042,832 69.03 5.62 3.68
iii. Change in Promoters Shareholding
Sr. No.
Particulars Date Reason Shareholding at the beginning of the year
Cumulative Shareholding during the year
No. of Shares
% of total shares of the
Company
No. of Shares
% of total shares of the
Company
1 Agnus Capital LLPAt the beginning of the year
1-Apr-14 Opening Balance
2,425,000 8.87 2,425,000 8.87
Date wise Increase / Decrease
12-Nov-14 Allotment pursuant to conversion of warrants
1,100,000 3.61 3,525,000 11.56
At the end of the year 31-Mar-15 Closing Balance
- - 3,525,000 11.56
2 Agnus Holdings Private LimitedAt the beginning of the year
1-Apr-14 Opening Balance
260,230 0.95 260,230 0.95
At the end of the year 31-Mar-15 Closing Balance
- - 260,230 0.85
3 Arunkumar PillaiAt the beginning of the year
1-Apr-14 Opening Balance
5,579,993 20.41 5,579,993 20.41
At the end of the year 31-Mar-15 Closing Balance
- - 5,579,993 18.30
Directors’ Report
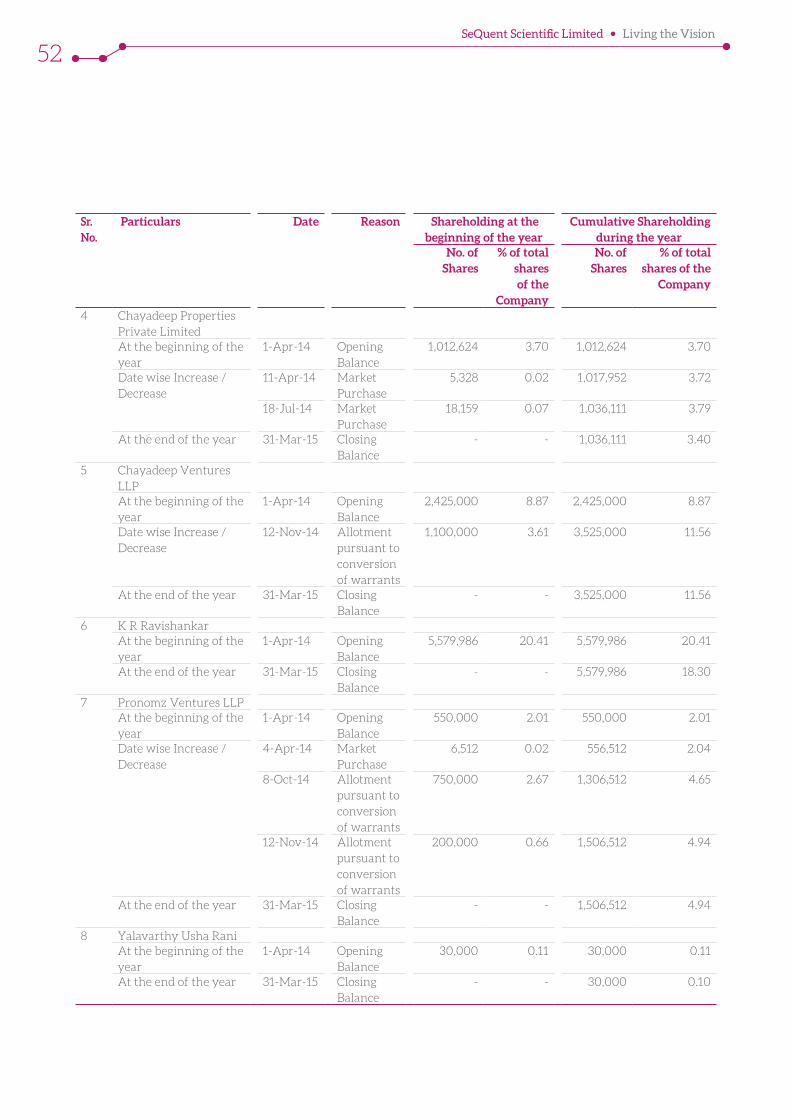
SeQuent Scientific Limited Living the Vision
52
Sr. No.
Particulars Date Reason Shareholding at the beginning of the year
Cumulative Shareholding during the year
No. of Shares
% of total shares of the
Company
No. of Shares
% of total shares of the
Company
4 Chayadeep Properties Private LimitedAt the beginning of the year
1-Apr-14 Opening Balance
1,012,624 3.70 1,012,624 3.70
Date wise Increase / Decrease
11-Apr-14 Market Purchase
5,328 0.02 1,017,952 3.72
18-Jul-14 Market Purchase
18,159 0.07 1,036,111 3.79
At the end of the year 31-Mar-15 Closing Balance
- - 1,036,111 3.40
5 Chayadeep Ventures LLPAt the beginning of the year
1-Apr-14 Opening Balance
2,425,000 8.87 2,425,000 8.87
Date wise Increase / Decrease
12-Nov-14 Allotment pursuant to conversion of warrants
1,100,000 3.61 3,525,000 11.56
At the end of the year 31-Mar-15 Closing Balance
- - 3,525,000 11.56
6 K R RavishankarAt the beginning of the year
1-Apr-14 Opening Balance
5,579,986 20.41 5,579,986 20.41
At the end of the year 31-Mar-15 Closing Balance
- - 5,579,986 18.30
7 Pronomz Ventures LLPAt the beginning of the year
1-Apr-14 Opening Balance
550,000 2.01 550,000 2.01
Date wise Increase / Decrease
4-Apr-14 Market Purchase
6,512 0.02 556,512 2.04
8-Oct-14 Allotment pursuant to conversion of warrants
750,000 2.67 1,306,512 4.65
12-Nov-14 Allotment pursuant to conversion of warrants
200,000 0.66 1,506,512 4.94
At the end of the year 31-Mar-15 Closing Balance
- - 1,506,512 4.94
8 Yalavarthy Usha RaniAt the beginning of the year
1-Apr-14 Opening Balance
30,000 0.11 30,000 0.11
At the end of the year 31-Mar-15 Closing Balance
- - 30,000 0.10
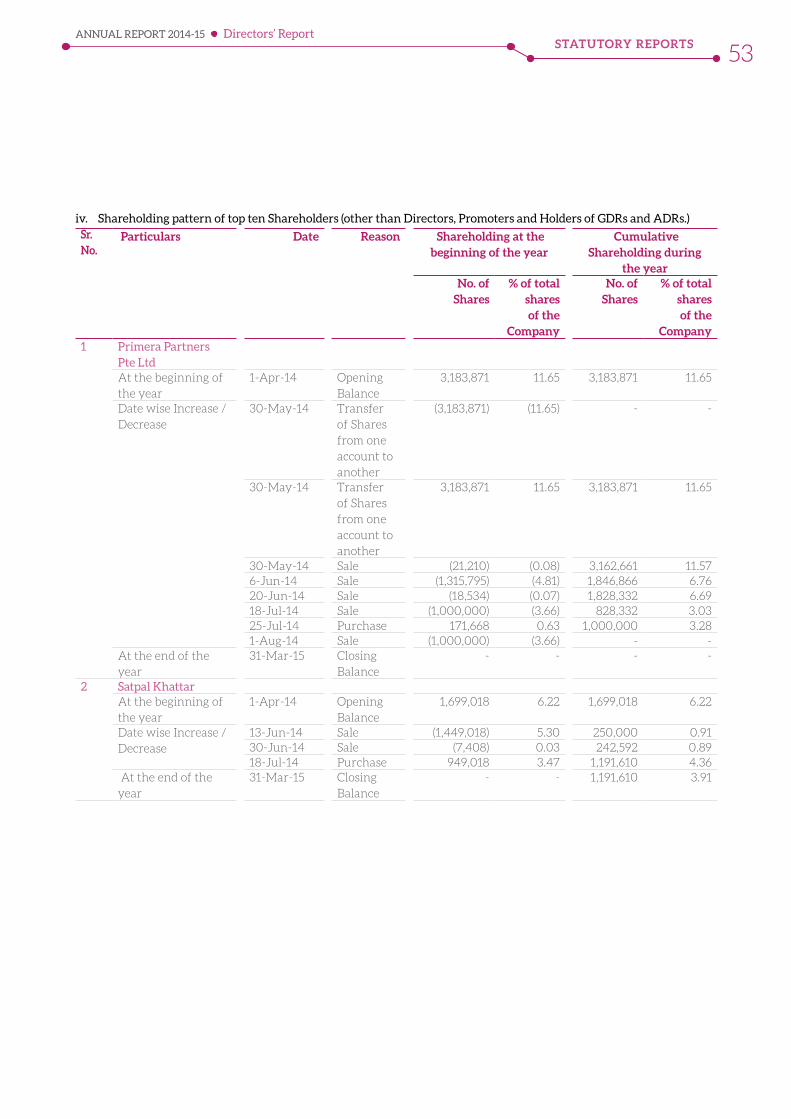
STATUTORY REPORTSANNUAL REPORT 2014-15
53
iv. Shareholding pattern of top ten Shareholders (other than Directors, Promoters and Holders of GDRs and ADRs.)Sr. No.
Particulars Date Reason Shareholding at the beginning of the year
Cumulative Shareholding during
the year No. of Shares
% of total shares of the
Company
No. of Shares
% of total shares of the
Company1 Primera Partners
Pte LtdAt the beginning of the year
1-Apr-14 Opening Balance
3,183,871 11.65 3,183,871 11.65
Date wise Increase / Decrease
30-May-14 Transfer of Shares from one account to another
(3,183,871) (11.65) - -
30-May-14 Transfer of Shares from one account to another
3,183,871 11.65 3,183,871 11.65
30-May-14 Sale (21,210) (0.08) 3,162,661 11.576-Jun-14 Sale (1,315,795) (4.81) 1,846,866 6.7620-Jun-14 Sale (18,534) (0.07) 1,828,332 6.6918-Jul-14 Sale (1,000,000) (3.66) 828,332 3.0325-Jul-14 Purchase 171,668 0.63 1,000,000 3.281-Aug-14 Sale (1,000,000) (3.66) - -
At the end of the year
31-Mar-15 Closing Balance
- - - -
2 Satpal KhattarAt the beginning of the year
1-Apr-14 Opening Balance
1,699,018 6.22 1,699,018 6.22
Date wise Increase / Decrease
13-Jun-14 Sale (1,449,018) 5.30 250,000 0.9130-Jun-14 Sale (7,408) 0.03 242,592 0.8918-Jul-14 Purchase 949,018 3.47 1,191,610 4.36
At the end of the year
31-Mar-15 Closing Balance
- - 1,191,610 3.91
Directors’ Report
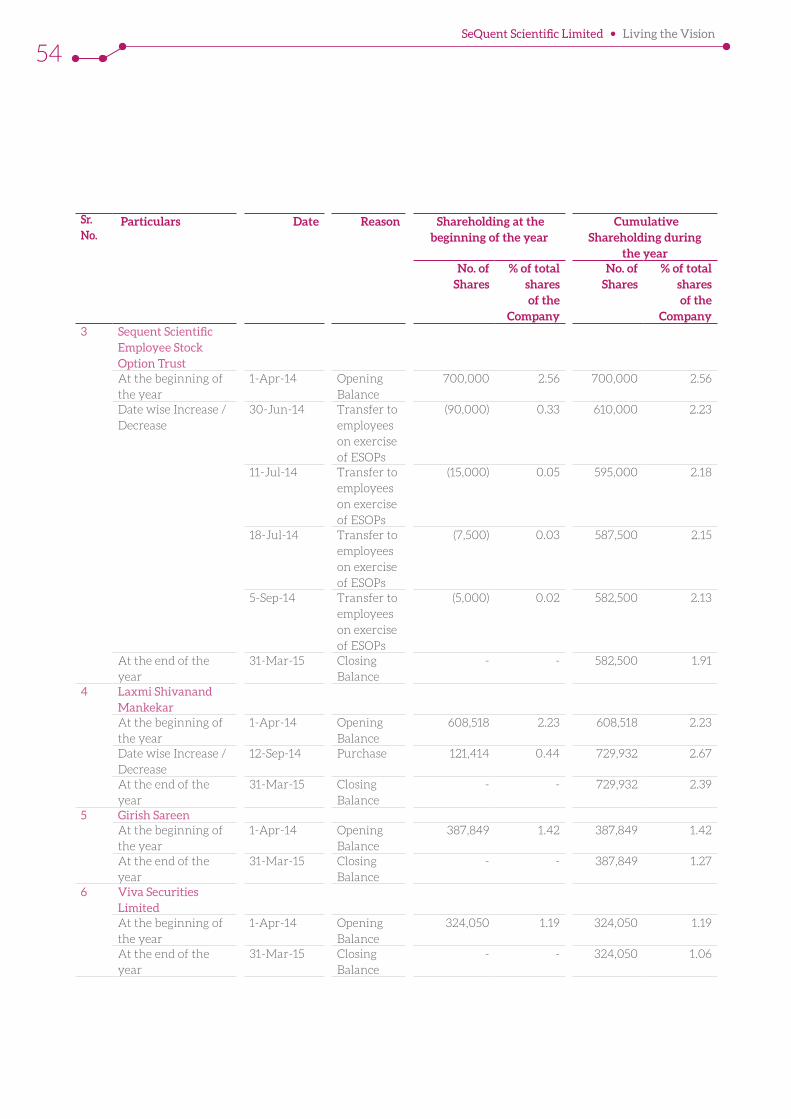
SeQuent Scientific Limited Living the Vision
54
Sr. No.
Particulars Date Reason Shareholding at the beginning of the year
Cumulative Shareholding during
the year No. of Shares
% of total shares of the
Company
No. of Shares
% of total shares of the
Company3 Sequent Scientific
Employee Stock Option TrustAt the beginning of the year
1-Apr-14 Opening Balance
700,000 2.56 700,000 2.56
Date wise Increase / Decrease
30-Jun-14 Transfer to employees on exercise of ESOPs
(90,000) 0.33 610,000 2.23
11-Jul-14 Transfer to employees on exercise of ESOPs
(15,000) 0.05 595,000 2.18
18-Jul-14 Transfer to employees on exercise of ESOPs
(7,500) 0.03 587,500 2.15
5-Sep-14 Transfer to employees on exercise of ESOPs
(5,000) 0.02 582,500 2.13
At the end of the year
31-Mar-15 Closing Balance
- - 582,500 1.91
4 Laxmi Shivanand MankekarAt the beginning of the year
1-Apr-14 Opening Balance
608,518 2.23 608,518 2.23
Date wise Increase / Decrease
12-Sep-14 Purchase 121,414 0.44 729,932 2.67
At the end of the year
31-Mar-15 Closing Balance
- - 729,932 2.39
5 Girish SareenAt the beginning of the year
1-Apr-14 Opening Balance
387,849 1.42 387,849 1.42
At the end of the year
31-Mar-15 Closing Balance
- - 387,849 1.27
6 Viva Securities LimitedAt the beginning of the year
1-Apr-14 Opening Balance
324,050 1.19 324,050 1.19
At the end of the year
31-Mar-15 Closing Balance
- - 324,050 1.06

STATUTORY REPORTSANNUAL REPORT 2014-15
55
Sr. No.
Particulars Date Reason Shareholding at the beginning of the year
Cumulative Shareholding during
the year No. of Shares
% of total shares of the
Company
No. of Shares
% of total shares of the
Company7 Mala Sareen
At the beginning of the year
1-Apr-14 Opening Balance
234,206 0.86 234,206 0.86
At the end of the year
31-Mar-15 Closing Balance
- - 234,206 0.77
8 Naresh GargAt the beginning of the year
1-Apr-14 Opening Balance
200,000 0.73 200,000 0.73
At the end of the year
31-Mar-15 Closing Balance
- - 200,000 0.66
9 Chaitanya Deepak VaidyaAt the beginning of the year
1-Apr-14 Opening Balance
134,510 0.49 134,510 0.49
Date wise Increase / Decrease
11-Apr-14 Purchase 2,000 0.01 136,510 0.5018-Apr-14 Sale (22,342) 0.08 114,168 0.4225-Apr-14 Sale (11,080) 0.04 103,088 0.382-May-14 Sale (14,510) 0.05 88,578 0.326-Jun-14 Sale (83,686) 0.31 4,892 0.0213-Jun-14 Purchase 273 0.00 5,165 0.0220-Jun-14 Sale (5,165) 0.02 - -23-Jan-15 Purchase 1,990 0.01 1,990 0.0130-Jan-15 Purchase 224 - 2,214 0.01
At the end of the year
31-Mar-15 Closing Balance
- - 2,214 0.01
10 Kruti Capital Services Private limitedAt the beginning of the year
1-Apr-14 Opening Balance
100,000 0.37 100,000 0.37
Date wise Increase / Decrease
6-Jun-14 Sale (15,000) 0.05 85,000 0.3113-Jun-14 Sale (5,000) 0.02 80,000 0.2919-Sep-14 Sale (5,000) 0.02 75,000 0.27
At the end of the year
31-Mar-15 Closing Balance
- - 75,000 0.25
Note: For the purpose of disclosure the shareholding of 10 ten shareholders as on April 1, 2014 is given.
Directors’ Report
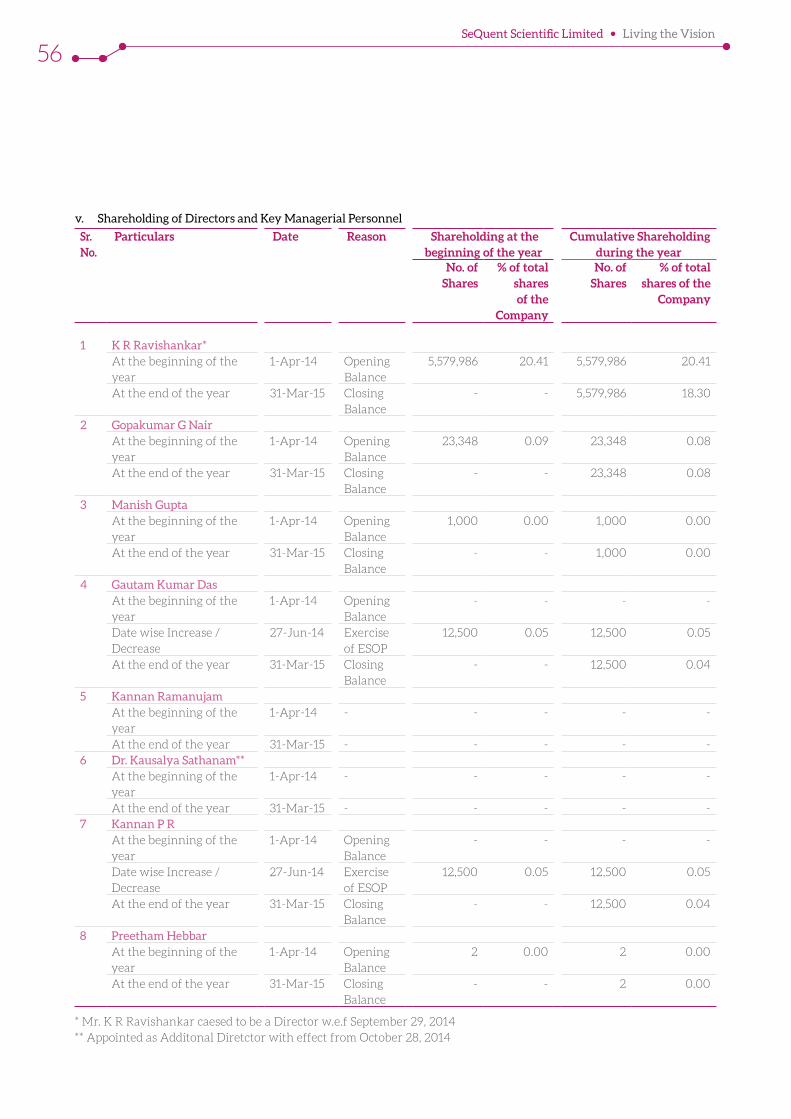
SeQuent Scientific Limited Living the Vision
56
v. Shareholding of Directors and Key Managerial Personnel
Sr. No.
Particulars Date Reason Shareholding at the beginning of the year
Cumulative Shareholding during the year
No. of Shares
% of total shares of the
Company
No. of Shares
% of total shares of the
Company
1 K R Ravishankar*At the beginning of the year
1-Apr-14 Opening Balance
5,579,986 20.41 5,579,986 20.41
At the end of the year 31-Mar-15 Closing Balance
- - 5,579,986 18.30
2 Gopakumar G NairAt the beginning of the year
1-Apr-14 Opening Balance
23,348 0.09 23,348 0.08
At the end of the year 31-Mar-15 Closing Balance
- - 23,348 0.08
3 Manish GuptaAt the beginning of the year
1-Apr-14 Opening Balance
1,000 0.00 1,000 0.00
At the end of the year 31-Mar-15 Closing Balance
- - 1,000 0.00
4 Gautam Kumar DasAt the beginning of the year
1-Apr-14 Opening Balance
- - - -
Date wise Increase / Decrease
27-Jun-14 Exercise of ESOP
12,500 0.05 12,500 0.05
At the end of the year 31-Mar-15 Closing Balance
- - 12,500 0.04
5 Kannan RamanujamAt the beginning of the year
1-Apr-14 - - - - -
At the end of the year 31-Mar-15 - - - - -6 Dr. Kausalya Sathanam**
At the beginning of the year
1-Apr-14 - - - - -
At the end of the year 31-Mar-15 - - - - -7 Kannan P R
At the beginning of the year
1-Apr-14 Opening Balance
- - - -
Date wise Increase / Decrease
27-Jun-14 Exercise of ESOP
12,500 0.05 12,500 0.05
At the end of the year 31-Mar-15 Closing Balance
- - 12,500 0.04
8 Preetham HebbarAt the beginning of the year
1-Apr-14 Opening Balance
2 0.00 2 0.00
At the end of the year 31-Mar-15 Closing Balance
- - 2 0.00
* Mr. K R Ravishankar caesed to be a Director w.e.f September 29, 2014** Appointed as Additonal Diretctor with effect from October 28, 2014
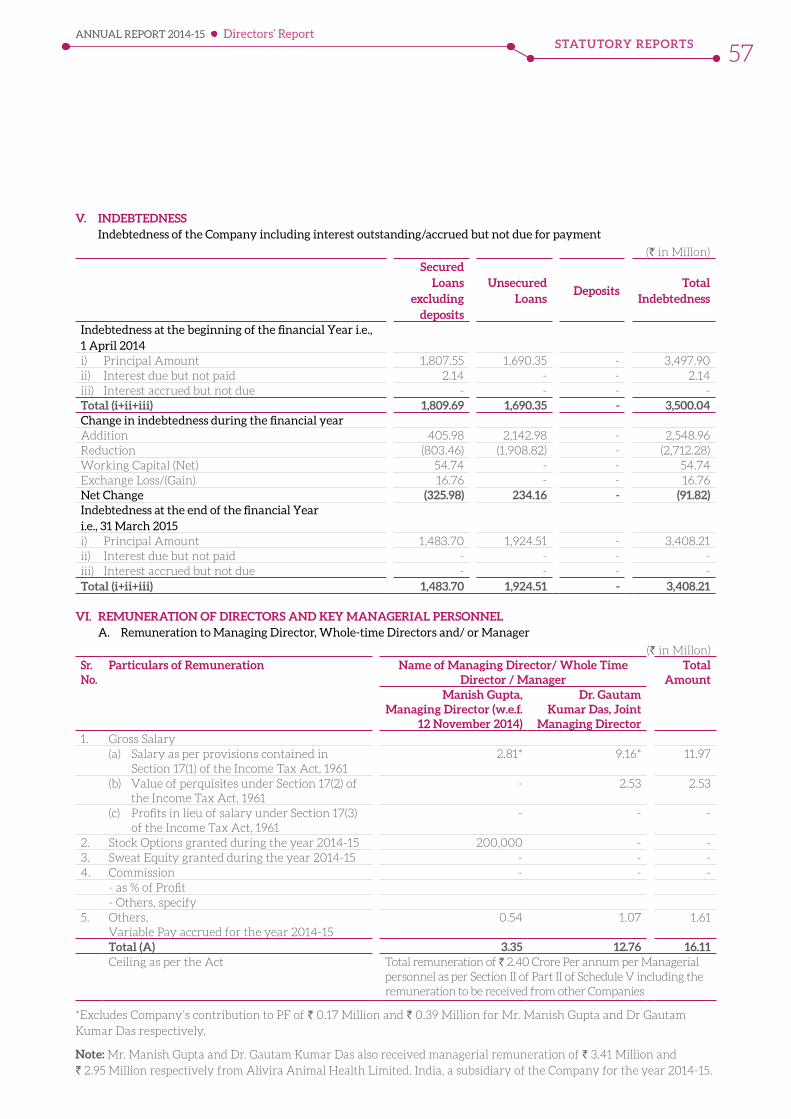
STATUTORY REPORTSANNUAL REPORT 2014-15
57
V. INDEBTEDNESS Indebtedness of the Company including interest outstanding/accrued but not due for payment
(` in Millon)Secured
Loans excluding
deposits
Unsecured Loans
DepositsTotal
Indebtedness
Indebtedness at the beginning of the financial Year i.e., 1 April 2014i) Principal Amount 1,807.55 1,690.35 - 3,497.90 ii) Interest due but not paid 2.14 - - 2.14 iii) Interest accrued but not due - - - - Total (i+ii+iii) 1,809.69 1,690.35 - 3,500.04 Change in indebtedness during the financial yearAddition 405.98 2,142.98 - 2,548.96 Reduction (803.46) (1,908.82) - (2,712.28)Working Capital (Net) 54.74 - - 54.74 Exchange Loss/(Gain) 16.76 - - 16.76 Net Change (325.98) 234.16 - (91.82)Indebtedness at the end of the financial Year i.e., 31 March 2015i) Principal Amount 1,483.70 1,924.51 - 3,408.21 ii) Interest due but not paid - - - - iii) Interest accrued but not due - - - - Total (i+ii+iii) 1,483.70 1,924.51 - 3,408.21
VI. REMUNERATION OF DIRECTORS AND KEY MANAGERIAL PERSONNEL A. Remuneration to Managing Director, Whole-time Directors and/ or Manager
(` in Millon)Sr. No.
Particulars of Remuneration Name of Managing Director/ Whole Time Director / Manager
Total Amount
Manish Gupta, Managing Director (w.e.f.
12 November 2014)
Dr. Gautam Kumar Das, Joint
Managing Director1. Gross Salary
(a) Salary as per provisions contained in Section 17(1) of the Income Tax Act, 1961
2.81* 9.16* 11.97
(b) Value of perquisites under Section 17(2) of the Income Tax Act, 1961
- 2.53 2.53
(c) Profits in lieu of salary under Section 17(3) of the Income Tax Act, 1961
- - -
2. Stock Options granted during the year 2014-15 200,000 - -3. Sweat Equity granted during the year 2014-15 - - -4. Commission - - -
- as % of Profit- Others, specify
5. Others,Variable Pay accrued for the year 2014-15
0.54 1.07 1.61
Total (A) 3.35 12.76 16.11Ceiling as per the Act Total remuneration of ` 2.40 Crore Per annum per Managerial
personnel as per Section II of Part II of Schedule V including the remuneration to be received from other Companies
*Excludes Company’s contribution to PF of ` 0.17 Million and ` 0.39 Million for Mr. Manish Gupta and Dr Gautam Kumar Das respectively.
Note: Mr. Manish Gupta and Dr. Gautam Kumar Das also received managerial remuneration of ` 3.41 Million and ` 2.95 Million respectively from Alivira Animal Health Limited, India, a subsidiary of the Company for the year 2014-15.
Directors’ Report
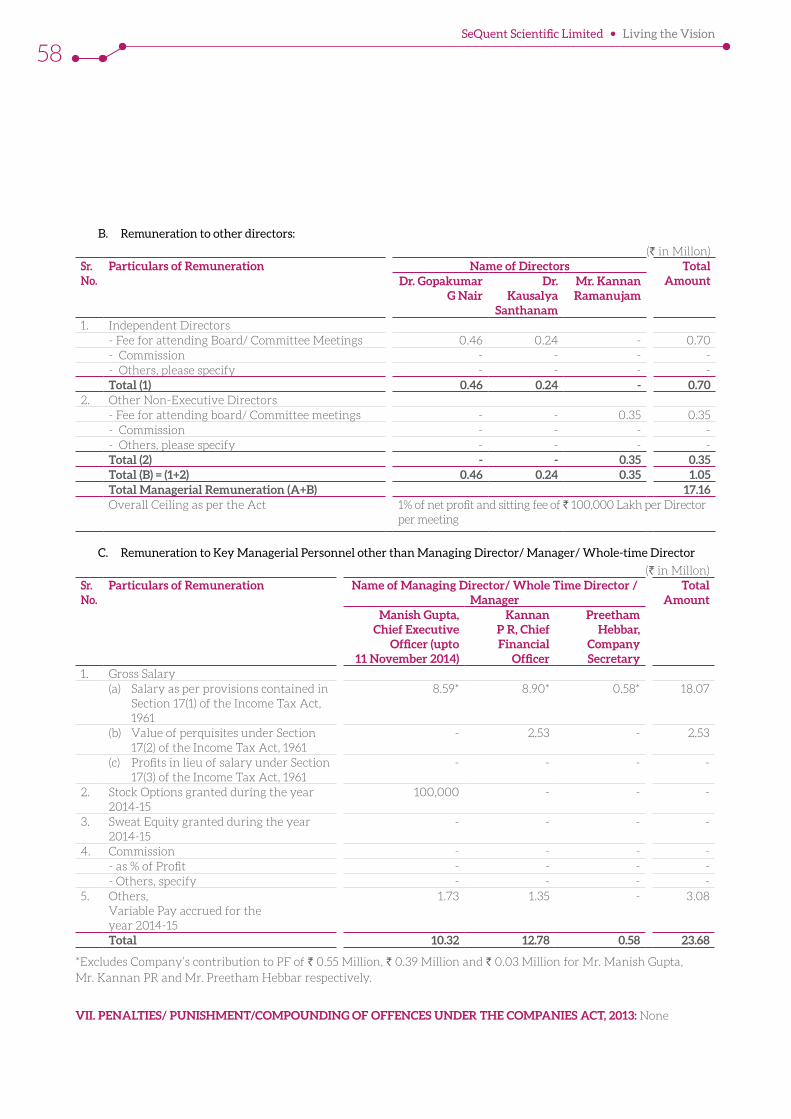
SeQuent Scientific Limited Living the Vision
58
B. Remuneration to other directors:
(` in Millon)Sr. No.
Particulars of Remuneration Name of Directors Total AmountDr. Gopakumar
G NairDr.
Kausalya Santhanam
Mr. Kannan Ramanujam
1. Independent Directors- Fee for attending Board/ Committee Meetings 0.46 0.24 - 0.70- Commission - - - -- Others, please specify - - - -Total (1) 0.46 0.24 - 0.70
2. Other Non-Executive Directors - Fee for attending board/ Committee meetings - - 0.35 0.35- Commission - - - -- Others, please specify - - - -Total (2) - - 0.35 0.35Total (B) = (1+2) 0.46 0.24 0.35 1.05Total Managerial Remuneration (A+B) 17.16Overall Ceiling as per the Act 1% of net profit and sitting fee of ` 100,000 Lakh per Director
per meeting
C. Remuneration to Key Managerial Personnel other than Managing Director/ Manager/ Whole-time Director
(` in Millon)Sr. No.
Particulars of Remuneration Name of Managing Director/ Whole Time Director / Manager
Total Amount
Manish Gupta, Chief Executive
Officer (upto 11 November 2014)
Kannan P R, Chief Financial
Officer
Preetham Hebbar,
Company Secretary
1. Gross Salary(a) Salary as per provisions contained in
Section 17(1) of the Income Tax Act, 1961
8.59* 8.90* 0.58* 18.07
(b) Value of perquisites under Section 17(2) of the Income Tax Act, 1961
- 2.53 - 2.53
(c) Profits in lieu of salary under Section 17(3) of the Income Tax Act, 1961
- - - -
2. Stock Options granted during the year 2014-15
100,000 - - -
3. Sweat Equity granted during the year 2014-15
- - - -
4. Commission - - - -- as % of Profit - - - -- Others, specify - - - -
5. Others,Variable Pay accrued for the year 2014-15
1.73 1.35 - 3.08
Total 10.32 12.78 0.58 23.68
*Excludes Company’s contribution to PF of ` 0.55 Million, ` 0.39 Million and ` 0.03 Million for Mr. Manish Gupta, Mr. Kannan PR and Mr. Preetham Hebbar respectively.
VII. PENALTIES/ PUNISHMENT/COMPOUNDING OF OFFENCES UNDER THE COMPANIES ACT, 2013: None
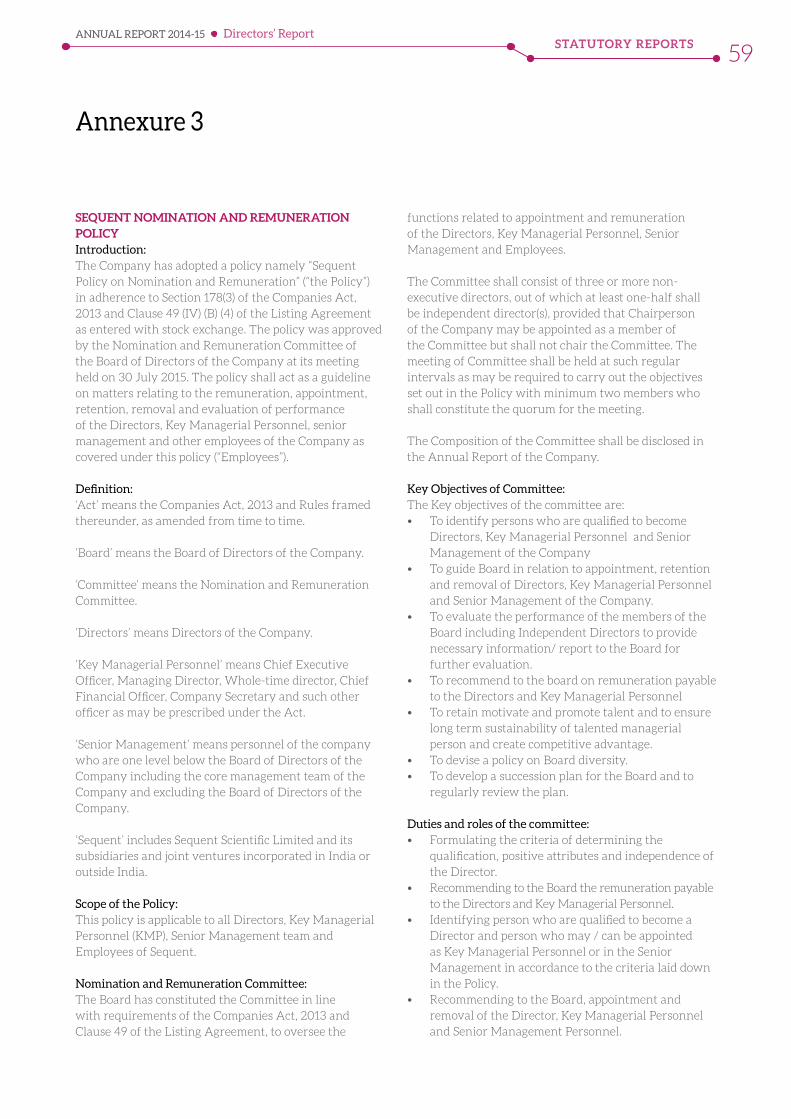
STATUTORY REPORTSANNUAL REPORT 2014-15
59
Annexure 3
SEQUENT NOMINATION AND REMUNERATION POLICYIntroduction:The Company has adopted a policy namely “Sequent Policy on Nomination and Remuneration” (“the Policy”) in adherence to Section 178(3) of the Companies Act, 2013 and Clause 49 (IV) (B) (4) of the Listing Agreement as entered with stock exchange. The policy was approved by the Nomination and Remuneration Committee of the Board of Directors of the Company at its meeting held on 30 July 2015. The policy shall act as a guideline on matters relating to the remuneration, appointment, retention, removal and evaluation of performance of the Directors, Key Managerial Personnel, senior management and other employees of the Company as covered under this policy (“Employees”).
Definition:‘Act’ means the Companies Act, 2013 and Rules framed thereunder, as amended from time to time.
‘Board’ means the Board of Directors of the Company.
‘Committee’ means the Nomination and Remuneration Committee.
‘Directors’ means Directors of the Company.
‘Key Managerial Personnel’ means Chief Executive Officer, Managing Director, Whole-time director, Chief Financial Officer, Company Secretary and such other officer as may be prescribed under the Act.
‘Senior Management’ means personnel of the company who are one level below the Board of Directors of the Company including the core management team of the Company and excluding the Board of Directors of the Company.
‘Sequent’ includes Sequent Scientific Limited and its subsidiaries and joint ventures incorporated in India or outside India.
Scope of the Policy:This policy is applicable to all Directors, Key Managerial Personnel (KMP), Senior Management team and Employees of Sequent.
Nomination and Remuneration Committee:The Board has constituted the Committee in line with requirements of the Companies Act, 2013 and Clause 49 of the Listing Agreement, to oversee the
functions related to appointment and remuneration of the Directors, Key Managerial Personnel, Senior Management and Employees.
The Committee shall consist of three or more non-executive directors, out of which at least one-half shall be independent director(s), provided that Chairperson of the Company may be appointed as a member of the Committee but shall not chair the Committee. The meeting of Committee shall be held at such regular intervals as may be required to carry out the objectives set out in the Policy with minimum two members who shall constitute the quorum for the meeting.
The Composition of the Committee shall be disclosed in the Annual Report of the Company.
Key Objectives of Committee:The Key objectives of the committee are:• To identify persons who are qualified to become
Directors, Key Managerial Personnel and Senior Management of the Company
• To guide Board in relation to appointment, retention and removal of Directors, Key Managerial Personnel and Senior Management of the Company.
• To evaluate the performance of the members of the Board including Independent Directors to provide necessary information/ report to the Board for further evaluation.
• To recommend to the board on remuneration payable to the Directors and Key Managerial Personnel
• To retain motivate and promote talent and to ensure long term sustainability of talented managerial person and create competitive advantage.
• To devise a policy on Board diversity.• To develop a succession plan for the Board and to
regularly review the plan.
Duties and roles of the committee:• Formulating the criteria of determining the
qualification, positive attributes and independence of the Director.
• Recommending to the Board the remuneration payable to the Directors and Key Managerial Personnel.
• Identifying person who are qualified to become a Director and person who may / can be appointed as Key Managerial Personnel or in the Senior Management in accordance to the criteria laid down in the Policy.
• Recommending to the Board, appointment and removal of the Director, Key Managerial Personnel and Senior Management Personnel.
Directors’ Report
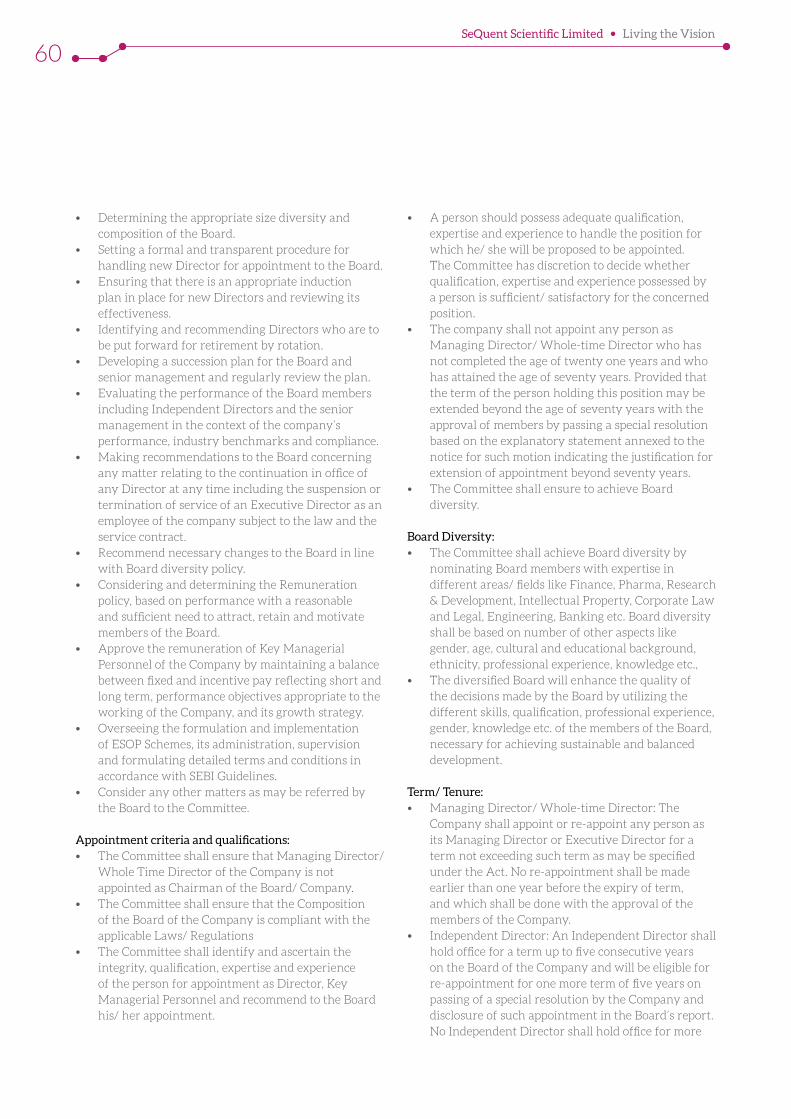
SeQuent Scientific Limited Living the Vision
60
• Determining the appropriate size diversity and composition of the Board.
• Setting a formal and transparent procedure for handling new Director for appointment to the Board.
• Ensuring that there is an appropriate induction plan in place for new Directors and reviewing its effectiveness.
• Identifying and recommending Directors who are to be put forward for retirement by rotation.
• Developing a succession plan for the Board and senior management and regularly review the plan.
• Evaluating the performance of the Board members including Independent Directors and the senior management in the context of the company’s performance, industry benchmarks and compliance.
• Making recommendations to the Board concerning any matter relating to the continuation in office of any Director at any time including the suspension or termination of service of an Executive Director as an employee of the company subject to the law and the service contract.
• Recommend necessary changes to the Board in line with Board diversity policy.
• Considering and determining the Remuneration policy, based on performance with a reasonable and sufficient need to attract, retain and motivate members of the Board.
• Approve the remuneration of Key Managerial Personnel of the Company by maintaining a balance between fixed and incentive pay reflecting short and long term, performance objectives appropriate to the working of the Company, and its growth strategy.
• Overseeing the formulation and implementation of ESOP Schemes, its administration, supervision and formulating detailed terms and conditions in accordance with SEBI Guidelines.
• Consider any other matters as may be referred by the Board to the Committee.
Appointment criteria and qualifications:• The Committee shall ensure that Managing Director/
Whole Time Director of the Company is not appointed as Chairman of the Board/ Company.
• The Committee shall ensure that the Composition of the Board of the Company is compliant with the applicable Laws/ Regulations
• The Committee shall identify and ascertain the integrity, qualification, expertise and experience of the person for appointment as Director, Key Managerial Personnel and recommend to the Board his/ her appointment.
• A person should possess adequate qualification, expertise and experience to handle the position for which he/ she will be proposed to be appointed. The Committee has discretion to decide whether qualification, expertise and experience possessed by a person is sufficient/ satisfactory for the concerned position.
• The company shall not appoint any person as Managing Director/ Whole-time Director who has not completed the age of twenty one years and who has attained the age of seventy years. Provided that the term of the person holding this position may be extended beyond the age of seventy years with the approval of members by passing a special resolution based on the explanatory statement annexed to the notice for such motion indicating the justification for extension of appointment beyond seventy years.
• The Committee shall ensure to achieve Board diversity.
Board Diversity: • The Committee shall achieve Board diversity by
nominating Board members with expertise in different areas/ fields like Finance, Pharma, Research & Development, Intellectual Property, Corporate Law and Legal, Engineering, Banking etc. Board diversity shall be based on number of other aspects like gender, age, cultural and educational background, ethnicity, professional experience, knowledge etc.,
• The diversified Board will enhance the quality of the decisions made by the Board by utilizing the different skills, qualification, professional experience, gender, knowledge etc. of the members of the Board, necessary for achieving sustainable and balanced development.
Term/ Tenure:• Managing Director/ Whole-time Director: The
Company shall appoint or re-appoint any person as its Managing Director or Executive Director for a term not exceeding such term as may be specified under the Act. No re-appointment shall be made earlier than one year before the expiry of term, and which shall be done with the approval of the members of the Company.
• Independent Director: An Independent Director shall hold office for a term up to five consecutive years on the Board of the Company and will be eligible for re-appointment for one more term of five years on passing of a special resolution by the Company and disclosure of such appointment in the Board’s report. No Independent Director shall hold office for more

STATUTORY REPORTSANNUAL REPORT 2014-15
61
than two consecutive terms, but such Independent Director shall be eligible for appointment after expiry of three years of ceasing to become an Independent Director. Provided that an Independent Director shall not, during the said three years, be appointed in or be associated with the Company in any other capacity, either directly or indirectly.
Succession Plan for Directors:The Committee shall assist the Board in identifying and selecting a new Directors in the event of an anticipated or an unanticipated vacancy in the Board.
The purpose of the Director Succession Plan is to ensure the orderly identification and selection of new Directors in the event of a vacancy on the Board, whether such vacancy exists by reason of an anticipated retirement, an unanticipated departure, the expansion of the size of the Board or otherwise. The Committee shall identify nominees for the position of director.
If a director position becomes vacant by reason of death or other unanticipated occurrence, the Committee shall convene a special meeting to identify and nominate a new Director on the Board of the Company.
Evaluation:The Company has formulated a policy called as Sequent Board Performance Evaluation Policy. Based on this the Company has prepared a questionnaire to carry out the evaluation of performance of every Director including the independent directors at regular intervals and at least on an annual basis. The questionnaire is structured to embed various parameters based on which the performance of a Board can be evaluated. Customised Questionnaires are formulated for evaluating Independent Directors, Non-Independent Directors & Whole-time Directors, Chairperson of the Board and the Board, as a whole.
The Committee may review and restructure the questionnaires and may also adopt other methods of evaluating the Board as and when necessary to achieve the better implementation of evaluation mechanism.
The Committee may review this policy as and when required.
RemovalDue to any disqualification as mentioned in the Act or under any other applicable Act, rules and regulations there under or for any other valid reason the committee
may recommend to the Board with reasons recorded in writing, removal of a Director, Key Managerial Personnel or any Senior Management Personnel subject to the provisions and compliance of the said Act, rules, regulations and service contract.
Retirement:The Director and Key Managerial Personnel shall retire at the age as per the applicable provisions of the Act or HR policy of the Company. The Board will have the discretion to retain the Director or Key Managerial Personnel in the same position/ remuneration or otherwise even after attaining the retirement age, if it is in the best interest of the Company.
Remuneration:The remuneration of the Managing Director/ Whole-time Director will be determined by the Committee and recommended to the Board for approval subject to approval of the members of the Company and Central Government, if required. The Committee will approve the remuneration of Key Managerial Personnel of the Company. The Company may place before the Committee if so necessary the remuneration payable to Senior Management for its approval.
The remuneration and commission including increments recommended to be paid to the Whole-time Director shall be in accordance with the percentage/ slabs/ conditions laid down as per the provisions of the Act. These would be subject to approval of the members of the Company.
• Remuneration to Whole-time Director / Executive Director / Managing Director and Key Managerial Personnel
• Fixed pay: Managing Director/ Whole-time Director/ shall be eligible for a monthly remuneration as may be approved by the Board/ Members on the recommendation of the Committee. The breakup of the pay scale and quantum of perquisites including, employer’s contribution to provident fund, pension scheme, medical expenses, club fees etc. shall be decided and approved by the Board and approved by the members and Central Government, wherever required. The Committee shall approve the remuneration for the Key Managerial Personnel.
• Minimum Remuneration: If, in any financial year, the Company has no profits or its profits are inadequate, the Company shall pay remuneration to its Managing Director/ Whole-time Director in accordance with the provisions of Schedule
Directors’ Report
SeQuent Scientific Limited Living the Vision
62
V of the Act and if it is not able to comply with such provisions, with the previous approval of the Central Government.
• Long-term rewards: These long-term rewards are linked to contribution to the performance of the Company based on relative position of the personnel in the organization. These rewards could be in the form/ nature of stock options and are based on level of employees and their criticality.
• Provisions for excess remuneration: If any Whole-time Director draws or receives, directly or indirectly by way of remuneration any such sums in excess of the limits prescribed under the Act or without the prior sanction of the Central Government, where required he/ she shall refund such funds to the Company and until such sum is refunded, hold it in trust for the Company. The Company shall not waive recovery of such sum refundable to it unless permitted by the Central Government.
• Variable Pay: The Company may give Variable pay to its Managing Director/ Whole Time Director and other Key Managerial Personnel as per the recommendation of the Committee.
• Remuneration to Non-Executive Director / Independent Director:
• Remuneration / Commission: The remuneration/ commission shall be fixed as per the limits mentioned in the Act, subject to approval from the members as applicable.
• Sitting Fees: The Non-Executive / Independent Director shall receive remuneration by way of fees for attending meetings of Board or Committee thereof as may be approved by the Board, provided that the amount of such fees shall not exceed such amount as may be prescribed by the Act or Central Government from time to time.
• Stock Options: An Independent Director and Promoter Director shall not be entitled to any stock option of the Company.
• The Non-Executive and Independent Directors are also entitled to claim reimbursement of all his/ her travelling, hotel and other incidental expenses incurred by him/ her in performance of duties as Director of the Company, as per the provisions of the Act.
• Remuneration to other employees of the Company The Remuneration to other employees shall be as
per the HR policy of the Company and shall be based on the role and position, professional experience, responsibility and the industrial standards. The break-up of the pay scale and quantum of perquisites including employer’s contribution to P.F, pension scheme, medical expenses, club fees etc. shall be as per the HR policy of the Company.
The other employees shall be eligible for annual increments based on the annual appraisal carried out by Head of the Departments of various departments.
Employee Stock Option Scheme:The Committee shall act as Compensation Committee to oversee the implementation, administration, supervision and formulation of detailed terms and conditions of ESOP Schemes of the Company in accordance with SEBI ESOP Guidelines.
The Committee shall identify the Directors/ Employees of the Company to whom the employee stock options can be granted based on the performance of the grantee and as per criteria mentioned in the Employee Stock Option Schemes of the Companies.
Amendments and Updations:The Nomination and Remuneration Committee periodically shall review this Policy and may recommend amendments to this Policy from time to time as it deems appropriate, which shall be in accordance with the provisions of the Companies Act, 2013. In case of any modifications or amendments which are inconsistent with the Act, the provisions of the Act and the rules framed thereunder would prevail over the Policy.
STATUTORY REPORTSANNUAL REPORT 2014-15
63
Annexure 4
FORM NO. MR-3SECRETARIAL AUDIT REPORT
For the Financial Year ended on 31st March, 2015[Pursuant to section 204(1) of the Companies Act, 2013 and Rule No. 9 of the Companies
(Appointment and Remuneration Personnel) Rules, 2014]
To,The Members,Sequent Scientific Limited
We have conducted the secretarial audit of the compliance of applicable statutory provisions and the adherence to good corporate practices by Sequent Scientific Limited (hereinafter called the Company). Secretarial Audit was conducted in a manner that provided us a reasonable basis for evaluating the corporate conducts/statutory compliances and expressing our opinion thereon.
Based on our verification of the Company’s books, papers, minute books, forms and returns filed and other records maintained by the Company and also the information provided by the Company, its officers, agents and authorized representatives during the conduct of secretarial audit, We hereby report that in our opinion, the company has, during the audit period covering the financial year ended on 31st March, 2015 complied with the statutory provisions listed hereunder and also that the Company has proper Board-processes and compliance- mechanism in place to the extent, in the manner and subject to the reporting made hereinafter:
We have examined the books, papers, minute books, forms and returns filed and other records maintained by Sequent Scientific Limited for the financial year ended on 31st March, 2015 according to the provisions of:
1. The Companies Act, 2013 (the Act) and the rules made thereunder;
2. The Securities Contracts (Regulation) Act, 1956 (‘SCRA’) and the rules made thereunder;
3. The Depositories Act, 1996 and the Regulations and Bye-laws framed thereunder;
4. Foreign Exchange Management Act, 1999 and the rules and regulations made thereunder to the extent of Foreign Direct Investment, Overseas Direct Investment and External Commercial Borrowings;
5. The Regulations and Guidelines prescribed under the Securities and Exchange Board of India Act, 1992 (‘SEBI Act’) viz. :-
a) The Securities and Exchange Board of India (Substantial Acquisition of Shares and Takeovers) Regulations, 2011;
b) The Securities and Exchange Board of India (Prohibition of Insider Trading) Regulations, 1992;
c) The Securities and Exchange Board of India (Issue of Capital and Disclosure Requirements) Regulations, 2009;
d) The Securities and Exchange Board of India (Employee Stock Option Scheme and Employee Stock Purchase Scheme) Guidelines, 1999 and The Securities and Exchange Board of India (Shares Based Employee Benefits) Regulation, 2014;
e) The Securities and Exchange Board of India (Issue and Listing of Debt Securities) Regulations, 2008; (Not Applicable to the Company during the Audit Period)
f) The Securities and Exchange Board of India (Registrars to an Issue and Share Transfer Agents) Regulations, 1993 regarding the Companies Act and dealing with client;
g) The Securities and Exchange Board of India (Delisting of Equity Shares) Regulations, 2009; (Not Applicable to the Company during Audit Period) and
h) The Securities and Exchange Board of India (Buyback of Securities) Regulations, 1998; (Not Applicable to the Company during Audit Period)
We further report that,having regard to the compliance system prevailing in the Company and on examination of the relevant documents and records in pursuance thereof, on test-check basis, the Company has complied with the following laws applicable specifically to the Company:i) Drugs & Cosmetics Act, 1940
Directors’ Report
SeQuent Scientific Limited Living the Vision
64
ii) Drugs (Prices Control) Order, 1995
iii) The Narcotic Drugs and Psychotropic Substances Rules, 1985
iv) Drugs and Magic Remedies (Objectionable Advertisement) Act, 1954 and Drugs and Magic Remedies (Objectionable Advertisement) Rules, 1955
v) Copyrights Act, 1957 and the Public Performance License (PPL)
vi) Trademarks Act, 1999 and Trademarks Rules, 2002
We have also examined compliance with the applicable clauses of the following:
(i) The Listing Agreement entered into by the Company with BSE Limited.
During the period under review the Company has complied with the provisions of the Act, Rules, Regulations, Guidelines, Standards, etc. mentioned above.
We further report that:
The Board of Directors of the Company is duly constituted with proper balance of Executive Directors,
Non-Executive Directors and Independent Directors. The changes in the composition of the Board of Directors that took place during the period under review were carried out in compliance with the provisions of the Act.
Adequate notice is given to all directors to schedule the Board Meetings, agenda and detailed notes on agenda were sent in advance and a system exists for seeking and obtaining further information and clarifications on the agenda items before the meeting and for meaningful participation at the meeting.
Majority decision is carried through and there were no dissenting members for any item.
We further report that there are adequate systems and processes in the Company commensurate with the size and operations of the company to monitor and ensure compliance with applicable laws, rules, regulations and guidelines.
We further report that during the audit period there were no instances of a. Redemption / buy-back of securities
b. Merger / amalgamation / reconstruction, etc.
c. Foreign technical collaborations
Binoy Chacko - Partner
B.G. & Associates
FCS No.: 4792
CP No.: 4221
Place: Bangalore
Date: 23 July 2015
This report is to be read with our letter of even date which is annexed as Annexure A and forms an integral part of this report.
STATUTORY REPORTSANNUAL REPORT 2014-15
65
To,The MembersSequent Scientific Limited
Our report of even date is to be read along with this letter.
1. Maintenance of secretarial record is the responsibility of the management of the company. Our responsibility is to express an opinion on these secretarial records based on our audit.
2. We have followed the audit practices and processes as were appropriate to obtain reasonable assurance about the correctness of the contents of the Secretarial records. The verification was done on test basis to ensure that correct facts are reflected in secretarial records. We believe that the processes and practices, we followed provide a reasonable basis for our opinion.
3. We have not verified the correctness and appropriateness of financial records and Books of Accounts of the company.
4. Wherever required, we have obtained the Management representation about the compliance of laws, rules and regulations and happening of events etc.
5. The compliance of the provisions of Corporate and other applicable laws, rules, regulations, standards is the responsibility of management. Our examination was limited to the verification of procedures on test basis.
6. The Secretarial Audit report is neither an assurance as to the future viability of the company nor of the efficacy or effectiveness with which the management has conducted the affairs of the company.
Binoy Chacko - Partner
B.G. & Associates
FCS No.: 4792
CP No.: 4221
Place: Bangalore
Date: 23 July 2015
Annexure A
Directors’ Report
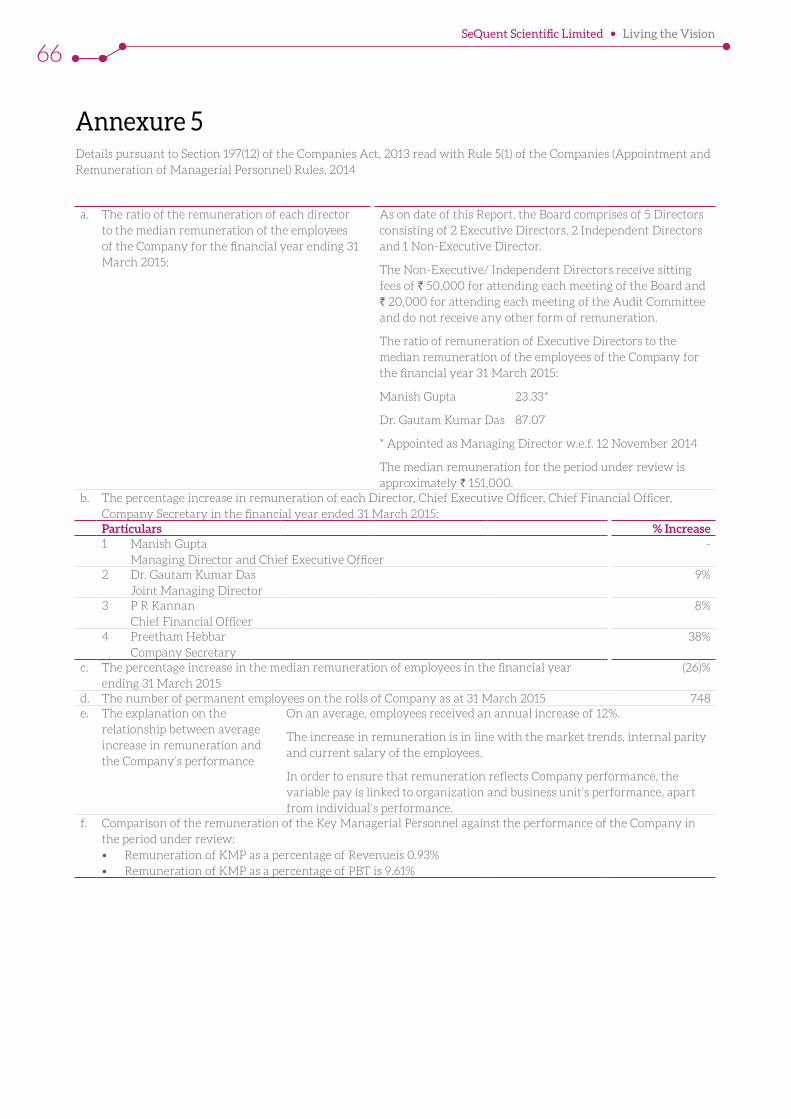
SeQuent Scientific Limited Living the Vision
66
Annexure 5Details pursuant to Section 197(12) of the Companies Act, 2013 read with Rule 5(1) of the Companies (Appointment and Remuneration of Managerial Personnel) Rules, 2014
a. The ratio of the remuneration of each director to the median remuneration of the employees of the Company for the financial year ending 31 March 2015:
As on date of this Report, the Board comprises of 5 Directors consisting of 2 Executive Directors, 2 Independent Directors and 1 Non-Executive Director.
The Non-Executive/ Independent Directors receive sitting fees of ` 50,000 for attending each meeting of the Board and ` 20,000 for attending each meeting of the Audit Committee and do not receive any other form of remuneration.
The ratio of remuneration of Executive Directors to the median remuneration of the employees of the Company for the financial year 31 March 2015:
Manish Gupta 23.33*
Dr. Gautam Kumar Das 87.07
* Appointed as Managing Director w.e.f. 12 November 2014
The median remuneration for the period under review is approximately ` 151,000.
b. The percentage increase in remuneration of each Director, Chief Executive Officer, Chief Financial Officer, Company Secretary in the financial year ended 31 March 2015:Particulars % Increase1 Manish Gupta
Managing Director and Chief Executive Officer-
2 Dr. Gautam Kumar DasJoint Managing Director
9%
3 P R KannanChief Financial Officer
8%
4 Preetham Hebbar Company Secretary
38%
c. The percentage increase in the median remuneration of employees in the financial year ending 31 March 2015
(26)%
d. The number of permanent employees on the rolls of Company as at 31 March 2015 748e. The explanation on the
relationship between average increase in remuneration and the Company’s performance
On an average, employees received an annual increase of 12%.
The increase in remuneration is in line with the market trends, internal parity and current salary of the employees.
In order to ensure that remuneration reflects Company performance, the variable pay is linked to organization and business unit’s performance, apart from individual’s performance.
f. Comparison of the remuneration of the Key Managerial Personnel against the performance of the Company in the period under review:• Remuneration of KMP as a percentage of Revenueis 0.93%• Remuneration of KMP as a percentage of PBT is 9.61%
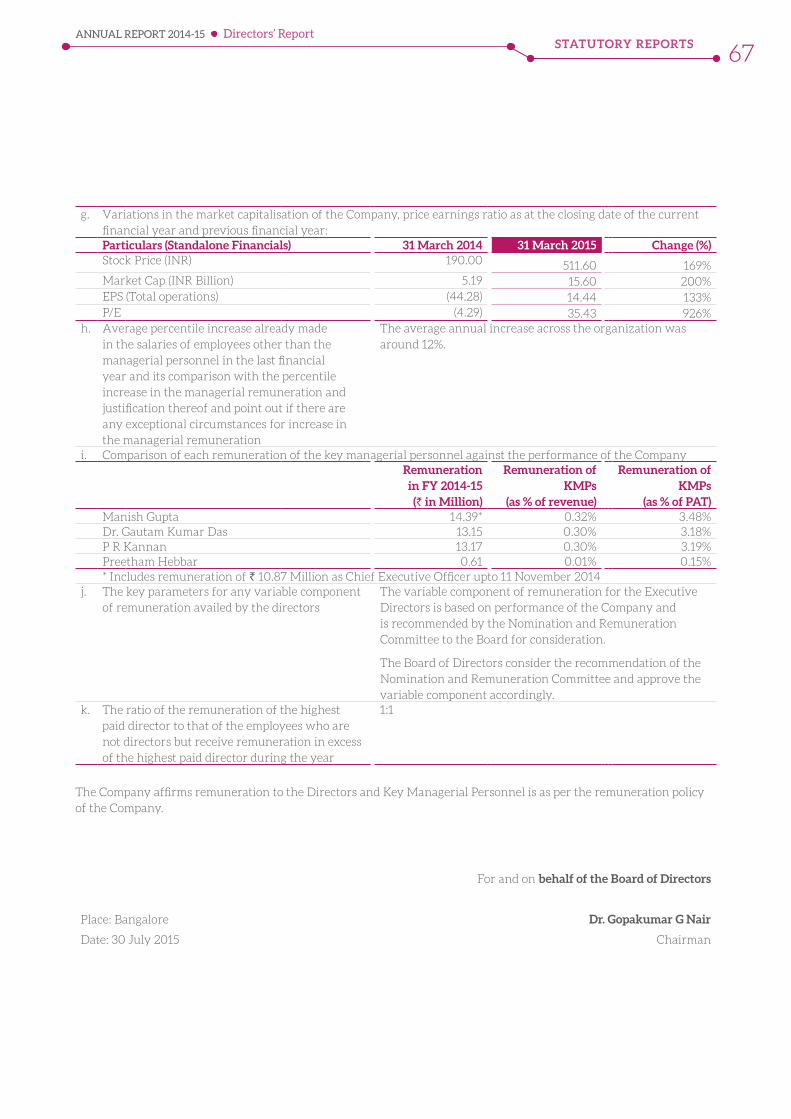
STATUTORY REPORTSANNUAL REPORT 2014-15
67
g. Variations in the market capitalisation of the Company, price earnings ratio as at the closing date of the current financial year and previous financial year:Particulars (Standalone Financials) 31 March 2014 31 March 2015 Change (%)Stock Price (INR) 190.00 511.60 169%Market Cap (INR Billion) 5.19 15.60 200%EPS (Total operations) (44.28) 14.44 133%P/E (4.29) 35.43 926%
h. Average percentile increase already made in the salaries of employees other than the managerial personnel in the last financial year and its comparison with the percentile increase in the managerial remuneration and justification thereof and point out if there are any exceptional circumstances for increase in the managerial remuneration
The average annual increase across the organization was around 12%.
i. Comparison of each remuneration of the key managerial personnel against the performance of the CompanyRemuneration in FY 2014-15 (` in Million)
Remuneration of KMPs
(as % of revenue)
Remuneration of KMPs
(as % of PAT)Manish Gupta 14.39* 0.32% 3.48%Dr. Gautam Kumar Das 13.15 0.30% 3.18%P R Kannan 13.17 0.30% 3.19%Preetham Hebbar 0.61 0.01% 0.15%* Includes remuneration of ` 10.87 Million as Chief Executive Officer upto 11 November 2014
j. The key parameters for any variable component of remuneration availed by the directors
The variable component of remuneration for the Executive Directors is based on performance of the Company and is recommended by the Nomination and Remuneration Committee to the Board for consideration.
The Board of Directors consider the recommendation of the Nomination and Remuneration Committee and approve the variable component accordingly.
k. The ratio of the remuneration of the highest paid director to that of the employees who are not directors but receive remuneration in excess of the highest paid director during the year
1:1
The Company affirms remuneration to the Directors and Key Managerial Personnel is as per the remuneration policy of the Company.
For and on behalf of the Board of Directors
Place: Bangalore Dr. Gopakumar G Nair
Date: 30 July 2015 Chairman
Directors’ Report
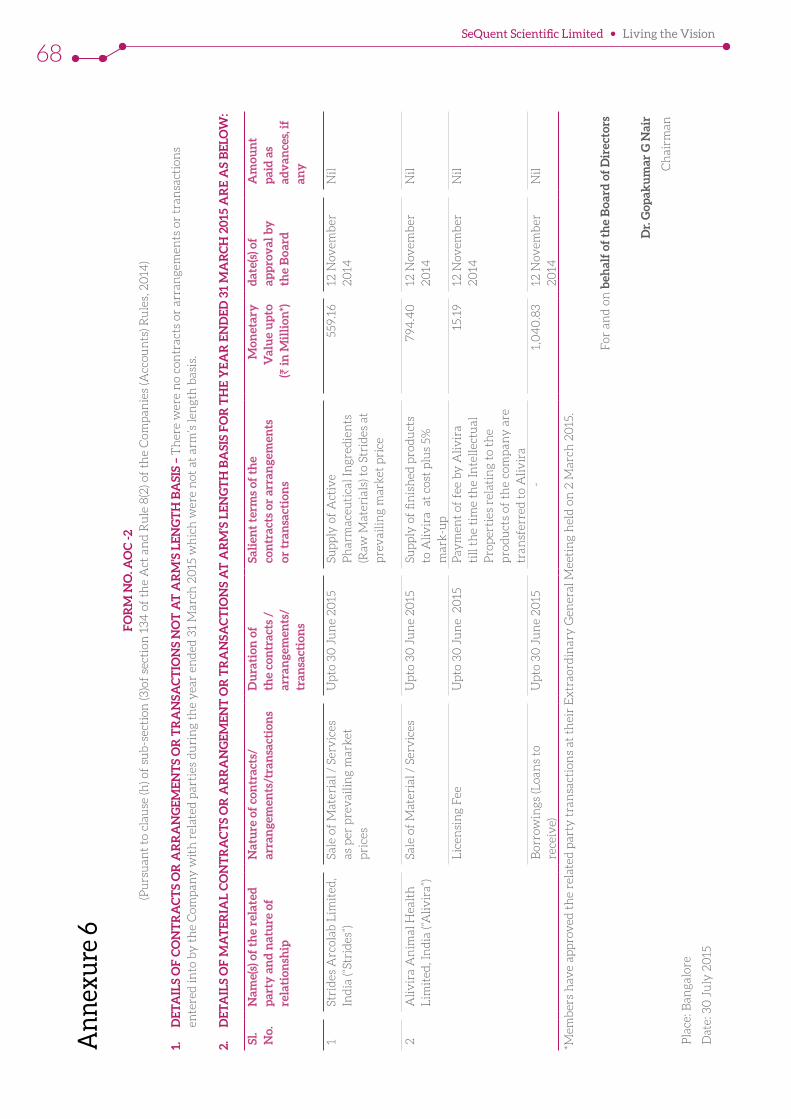
SeQuent Scientific Limited Living the Vision
68
An
nex
ure
6F
OR
M N
O. A
OC
-2(P
urs
uan
t to
cla
use
(h) o
f su
b-s
ecti
on (3
)of
sect
ion
13
4 o
f th
e A
ct a
nd
Ru
le 8
(2) o
f th
e C
omp
anie
s (A
ccou
nts
) Ru
les,
20
14)
1.
DE
TA
ILS
OF
CO
NT
RA
CT
S O
R A
RR
AN
GE
ME
NT
S O
R T
RA
NSA
CT
ION
S N
OT
AT
AR
M’S
LE
NG
TH
BA
SIS
– T
her
e w
ere
no
con
trac
ts o
r ar
ran
gem
ents
or
tran
sact
ion
s en
tere
d in
to b
y t
he
Com
pan
y w
ith
rel
ated
par
ties
du
rin
g th
e y
ear
end
ed 3
1 M
arch
20
15 w
hic
h w
ere
not
at
arm
’s le
ngt
h b
asis
.
2.
DE
TA
ILS
OF
MA
TE
RIA
L C
ON
TR
AC
TS
OR
AR
RA
NG
EM
EN
T O
R T
RA
NSA
CT
ION
S A
T A
RM
’S L
EN
GT
H B
ASI
S F
OR
TH
E Y
EA
R E
ND
ED
31
MA
RC
H 2
015
AR
E A
S B
ELO
W:
Sl.
No.
Nam
e(s)
of
the
rela
ted
p
arty
an
d n
atu
re o
f re
lati
onsh
ip
Nat
ure
of
con
trac
ts/
arra
nge
men
ts/t
ran
sact
ion
s D
ura
tion
of
the
con
trac
ts /
ar
ran
gem
ents
/tr
ansa
ctio
ns
Sali
ent
term
s of
th
e co
ntr
acts
or
arra
nge
men
ts
or t
ran
sact
ion
s
Mon
etar
y
Val
ue
up
to
(` in
Mil
lion
*)
dat
e(s)
of
app
rov
al b
y
the
Bo
ard
Am
oun
t p
aid
as
adv
ance
s, if
an
y
1St
rid
es A
rcol
ab L
imit
ed,
Ind
ia (“
Stri
des
”)Sa
le o
f M
ater
ial /
Ser
vic
es
as p
er p
rev
aili
ng
mar
ket
pri
ces
Up
to 3
0 J
un
e 2
015
Sup
ply
of
Act
ive
Ph
arm
aceu
tica
l In
gred
ien
ts
(Raw
Mat
eria
ls) t
o St
rid
es a
t p
rev
aili
ng
mar
ket
pri
ce
559.
1612
Nov
emb
er
20
14N
il
2A
liv
ira
An
imal
Hea
lth
L
imit
ed, I
nd
ia (“
Ali
vir
a”)
Sale
of
Mat
eria
l / S
erv
ices
U
pto
30
Ju
ne
20
15Su
pp
ly o
f fi
nis
hed
pro
du
cts
to A
liv
ira
at
cost
plu
s 5%
m
ark
-up
794
.40
12 N
ovem
ber
2
014
Nil
Lic
ensi
ng
Fee
Up
to 3
0 J
un
e 2
015
Pay
men
t of
fee
by
Ali
vir
a
till
th
e ti
me
the
Inte
llec
tual
P
rop
erti
es r
elat
ing
to t
he
pro
du
cts
of t
he
com
pan
y a
re
tran
sfer
red
to
Ali
vir
a
15.1
912
Nov
emb
er
20
14N
il
Bor
row
ings
(Loa
ns
to
rece
ive)
Up
to 3
0 J
un
e 2
015
-1,
04
0.8
312
Nov
emb
er
20
14N
il
*Mem
ber
s h
ave
app
rov
ed t
he
rela
ted
par
ty t
ran
sact
ion
s at
th
eir
Ex
trao
rdin
ary
Gen
eral
Mee
tin
g h
eld
on
2 M
arch
20
15.
For
an
d o
n b
ehal
f of
th
e B
oar
d o
f D
irec
tors
Dr.
Gop
aku
mar
G N
air
Ch
airm
an
Pla
ce: B
anga
lore
Dat
e: 3
0 J
uly
20
15
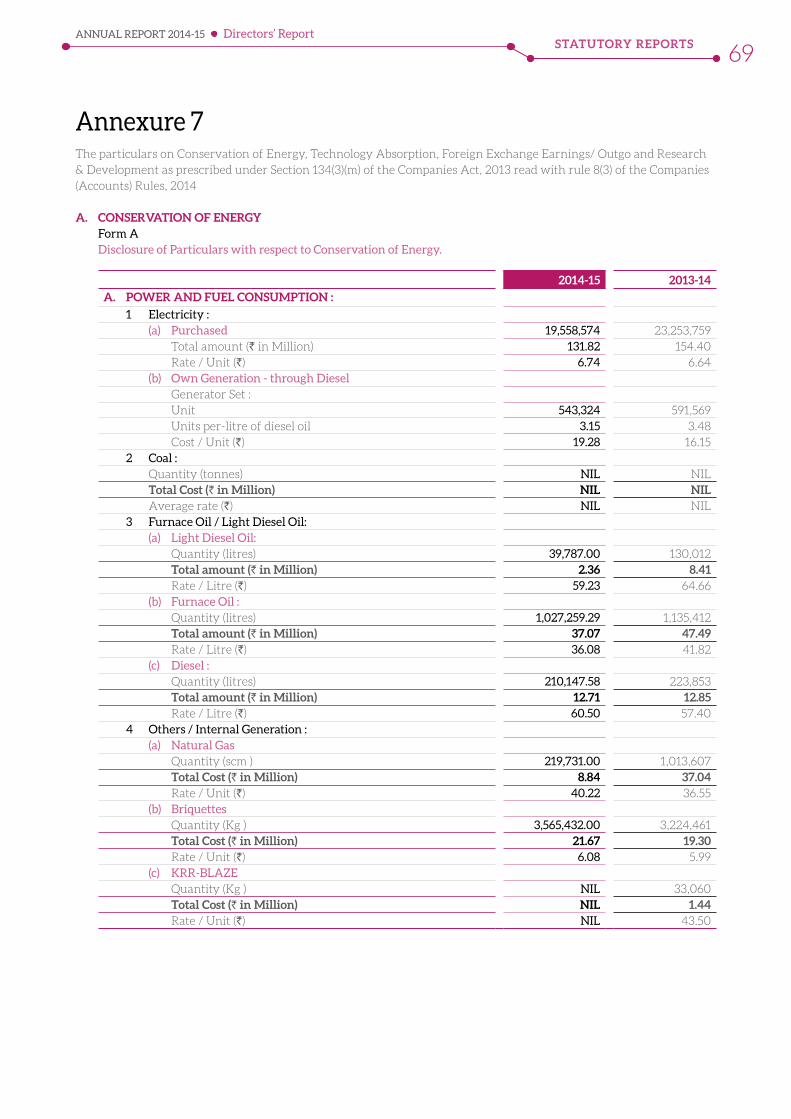
STATUTORY REPORTSANNUAL REPORT 2014-15
69
Annexure 7The particulars on Conservation of Energy, Technology Absorption, Foreign Exchange Earnings/ Outgo and Research & Development as prescribed under Section 134(3)(m) of the Companies Act, 2013 read with rule 8(3) of the Companies (Accounts) Rules, 2014
A. CONSERVATION OF ENERGY Form A Disclosure of Particulars with respect to Conservation of Energy.
2014-15 2013-14
A. POWER AND FUEL CONSUMPTION :
1 Electricity : (a) Purchased 19,558,574 23,253,759 Total amount (` in Million) 131.82 154.40 Rate / Unit (`) 6.74 6.64 (b) Own Generation - through Diesel Generator Set : Unit 543,324 591,569 Units per-litre of diesel oil 3.15 3.48 Cost / Unit (`) 19.28 16.15 2 Coal : Quantity (tonnes) NIL NIL Total Cost (` in Million) NIL NIL Average rate (`) NIL NIL 3 Furnace Oil / Light Diesel Oil: (a) Light Diesel Oil: Quantity (litres) 39,787.00 130,012 Total amount (` in Million) 2.36 8.41 Rate / Litre (`) 59.23 64.66 (b) Furnace Oil : Quantity (litres) 1,027,259.29 1,135,412 Total amount (` in Million) 37.07 47.49 Rate / Litre (`) 36.08 41.82 (c) Diesel : Quantity (litres) 210,147.58 223,853 Total amount (` in Million) 12.71 12.85 Rate / Litre (`) 60.50 57.40 4 Others / Internal Generation : (a) Natural Gas Quantity (scm ) 219,731.00 1,013,607 Total Cost (` in Million) 8.84 37.04 Rate / Unit (`) 40.22 36.55 (b) Briquettes Quantity (Kg ) 3,565,432.00 3,224,461 Total Cost (` in Million) 21.67 19.30 Rate / Unit (`) 6.08 5.99 (c) KRR-BLAZE Quantity (Kg ) NIL 33,060 Total Cost (` in Million) NIL 1.44 Rate / Unit (`) NIL 43.50
Directors’ Report
SeQuent Scientific Limited Living the Vision
70
Form B a. Measures taken for the year 2014 – 15 Mangalore and Mysore: 1. Temperature controller for CT fans, which
is expected to minimise the electrical consumption during the less ambient temperatures (winter season).
2. Automation of utility pumps (higher capacity) by providing Variable Frequency Drive (VFD) and pressure switch will switch off the pumps automatically during no requirement at plant. This will reduce the electrical consumption.
3. Improving solvent condensation/ recovery for the distillation reactors by enhancing the condenser capacity and/ or enhancing the condenser cooling capacity. This will increase the solvent recovery as well reduce the fresh solvent consumption.
4. Briquette fired thermo pack planned at Mangalore location will reduce operating cost and eliminate usage of fossil fuel (FO).
5. Replacement of starter of Air Handling Units (AHUs) and ventilation systems at Mangalore by suitable VFDs. This may lead to an estimated saving of 120 units of energy per day.
Mahad: 1. High vacuum distillation units, oil ring
vacuum pumps were replaced with Steam jet ejectors. This will result in saving of electricity as well regular replacement of oil in the oil ring vacuum pump.
2. Cooling tower fans, temperature controller installed which will shut the fan during the less load or during winters.
3. Water ring vacuum pumps having 10 motor, were replace with steam jet ejector.
4. Replaced the LDO fired hot oil unit with Briquette fired.
Tarapur: 1. Cooling tower fans, temperature controller
installed which will shut the fan during the less load or during winters.
2. All the 160 KWHPMV lighting bulbs in the manufacturing area to replace with low KW LED bulbs.
3. Reverse Osmosis (RO) plant installed in Effluent Treatment Plant (ETP) as tertiary treatment facility. The permeate water from the RO plant is used for the general purpose there by reducing the fresh water in-take from Maharashtra Industrial Development Corporation.
b. Steps taken or impact on conservation of energy 2015-16
Mangalore and Mysore: 1. Briquette fired Boiler of 4T/hr planned at
Mangalore location will reduce operating cost and eliminate usage of fossil fuel (FO).
2. Plant lights shall be replaced with LEDs at Mangalore saves about 50% of power compared to conventional lighting system.
3. Oil ring vacuum pumps shall be replaced with steam jet ejectors at Mangalore. This will eliminate the usage of oil in the vacuum pump and reduces operating cost.
4. Electrical power supply shall be done through power banking system from eco-friendly non –fossil fuel, private power generating units, resulting efficient and economical power supply.
5. Expansion of Effluent Treatment Plant (ETP) including Multiple Effect Evaporator to make Mangalore a Zero Discharge Unit.
Mahad: 1. All the 160 KWHPMV lighting bulbs in the
manufacturing area to replace with low KW LED bulbs.
2. Higher capacity Utility pumps, planned to install variable frequency Drive (VFD) and pressure switch which will switch OFF the pumps where there is no requirement in plant.
3. Manual Hot water system, planned to convert in Automation which will not allow the steam once the Hot water attains the required temperature.
STATUTORY REPORTSANNUAL REPORT 2014-15
71
4. Larger capacity reactor agitators, planned to replace the agitators with energy efficient which will reduce the power consumption.
5. Improving solvent condensation for the distillation reactors by enhancing the condenser capacity which will increase the solvent recovery as well reduce the fresh solvent consumption.
c. Steps taken by the company for utilizing alternate sources of energy 2015-16
1. Purchase of 60% to 80% of power requirement for Mangalore unit directly from eco-friendly, non-fossil fuel private generating units.
B. TECHNOLOGY ABSORPTION Research & Development (R&D): a. Core areas of R&D: 1. Development of cost effective, non-
infringing and eco-friendly technologies for API’s and intermediates that sets us apart in a competitive market place.
2. Development of complex API’s with strong backward integration.
3. Creation of intellectual property wealth.
4. Continuous process improvements for the existing API’s with a view to reduce the cost and improve the quality.
5. Development of analytical methods and specifications for non-compendia API’s and Impurity profiling.
b. Benefits derived as a result of R&D: 1. Introduction of new products to market
by speedy in-house development and commercialisation.
2. Enhancing the profit by process improvements of the products by their life cycle management.
3. Reduction of effluents by creating green technologies.
4. Reduction of time cycles by process simplifications to enhance the production capacity.
Future plan of action: 1. To focus on the development of niche API’s
and build pipeline for consistent growth.
2. Enhancing the product portfolio by development of Human and Veterinary API’s for regulated Market.
Expenditure on R&D:
(` In Million)2014-15 2013-14
Capital - 0.11Recurring 96.88 115.37Total 96.88 115.48
C. FOREIGN EXCHANGE EARNINGS AND OUTGO:
(` In Million)2014-15 2013-14
Earnings 1,403.42 1,950.20Outgo 790.09 1,143.49
For and on behalf of the Board of Directors
Dr. Gopakumar G Nair
Place: Bangalore Chairman
Date: 30 July 2015
Directors’ Report
SeQuent Scientific Limited Living the Vision
72
Annexure 8Disclosure under Section 62 of the Companies Act, 2013 read with Rule 12 of Companies (Share Capital and Debentures) Rules, 2014 and SEBI (Share Based Employee Benefits) Regulations, 2014 forming part of the Directors’ Report for the year ended 31 March 2015
A. DETAILS RELATED TO EMPLOYEE STOCK OPTION SCHEME
In the Extraordinary General Meeting held on 8 March 2008, the members approved the issue of options under the ESOP scheme. Options to be granted under the Scheme in any financial year shall not result in issue of equity shares of more than 7% of the issued and subscribed capital of the Company as at the date of grant of options. In accordance with the above, the Company established an ESOP trust to administer the scheme on 25 February 2010.
In the Board Meeting dated 29 March 2010, the Company has allotted 700,000 equity shares to the ESOP trust with a Face value of ` 10/- per share at a premium of ` 103/- per share. As at 31 March 2015, 582,500 equity shares (31 March 2014 - 700,000 equity shares) of ` 10/- each are reserved towards outstanding employee stock options granted / available for grant. Primary issuance is the source of shares of the ESOP Trust.
As per the scheme, the Compensation committee grants the options to the eligible employees. The exercise price and vesting period of each option shall be as decided by the compensation committee from time to time. The options granted would normally
vest over a maximum period of 4 years from the date of the grant in proportions specified in the scheme. Options may be exercised within a period of 4 years from the date of first vesting of the options.
During the current year, the Compensation Committee in its meeting held on 28 May 2014 and 12 November 2014 has granted 180,000 and 200,000 options respectively under SSL ESOP Scheme – 2010 (Sequent ESOP 2010) to certain eligible employees of the Company. The options allotted under Sequent ESOP 2010 are convertible into equal number of equity shares. During the previous year, the Compensation Committee in its meeting held on 30 May 2013 and 12 February 2014 has granted 540,000 and 100,000 options respectively under Sequent ESOP 2010 to certain eligible employees of the Company.
Employee stock options are accounted in accordance with the guidelines stipulated by Securities and Exchange Board of India (“SEBI”) and Guidance Note on Accounting for Employee Share-based Payments. The difference between the closing market price of the shares underlying the options granted on the date of grant of option and the option price is expensed under employee benefit expenses over the vesting period.
Option movement during the year 2014-15
Particulars Sequent ESOP 2010Number of options outstanding as at 1 April 2014 570,000Number of options granted during year 380,000Number of options forfeited / lapsed during the year 60,000Number of options vested during the year 142,500Number of options exercised during the year 117,500Number of shares arising as a result of exercise of options 117,500Loan repaid by the Trust during the year from exercise price received (Money realised by exercise of options during the year)
` 5,875,000
Number of options outstanding as at 31 March 2015 772,500Number of options exercisable as at 31 March 2015 25,000Variation of terms of options NilWeighted average exercise price of options `65Weighted average fair values of options ` 457.70Range of exercise price for options outstanding at the end of the year ` 50 to ` 80 per option
STATUTORY REPORTSANNUAL REPORT 2014-15
73
The impact on Earnings per Share if the ‘fair value’ of the options (on the date of the grant) were considered instead of the ‘intrinsic value’ is as under:
(` in Million)
ParticularsYear ended
31 March 2015 Net Profit / (loss) for the year (as reported) 413.07Add / (Less): stock based employee compensation (intrinsic value) 44.57Add / (Less): stock based compensation expenses determined under fair value method for the grants issued
(126.86)
Net Profit / (loss) for the year (proforma) 330.78Basic earnings per share (as reported) 14.44Basic earnings per share (proforma) 11.56Diluted earnings per share (as reported) 12.22Diluted earnings per share (proforma) 9.78
The fair value of the options has been determined under the Black-Scholes model. The significant assumptions used in this model for calculating fair value are as below:
(` in Million)
ParticularsYear ended
31 March 2015 Weighted average values of share price ` 411.60Weighted average values of exercise price ` 65Expected volatility 54.18%Expected option life 4 yearsExpected dividends NilRisk free interest date 7.74%
The volatility is calculated from the method of historical volatility, based on the three years data of closing market prices of the Company’s shares as per the data recorded by the Bombay Stock Exchange (BSE) and the average number of trading days during that period. It is the percentage co-efficient within the option pricing formulas.
B. EMPLOYEE-WISE DETAILS OF OPTIONS GRANTED DURING THE YEAR
Sl. No.
Name of employee Designation No. of options granted during the year
Exercise price
a. Key managerial personnel / Senior managerial personnel1 Manish Gupta Chief Executive
Officer & Managing Director
300,000 1st tranche ` 50 per option, 2nd tranche ` 60 per option, 3rd tranche ` 70 per option and 4th tranche ` 80 per option
b. Any other employees who received a grant in any one year of option amounting to 5% or more of options granted during the year1 Shreyan ML Associate Vice
President - Sales & Marketing
20,000 1st tranche ` 50 per option, 2nd tranche ` 60 per option, 3rd tranche ` 70 per option and 4th tranche ` 80 per option
2 Nilesh Khushalchand Doshi
Vice President – Outsourcing
20,000 1st tranche ` 50 per option, 2nd tranche ` 60 per option, 3rd tranche ` 70 per option and 4th tranche ` 80 per option
c.Identified employees who were granted option, during any one year, equal to or exceeding 1% of the issued capital (excluding outstanding warrants and conversion) of the Company at the time of grantGiven in point no. (a)(1) above
Directors’ Report
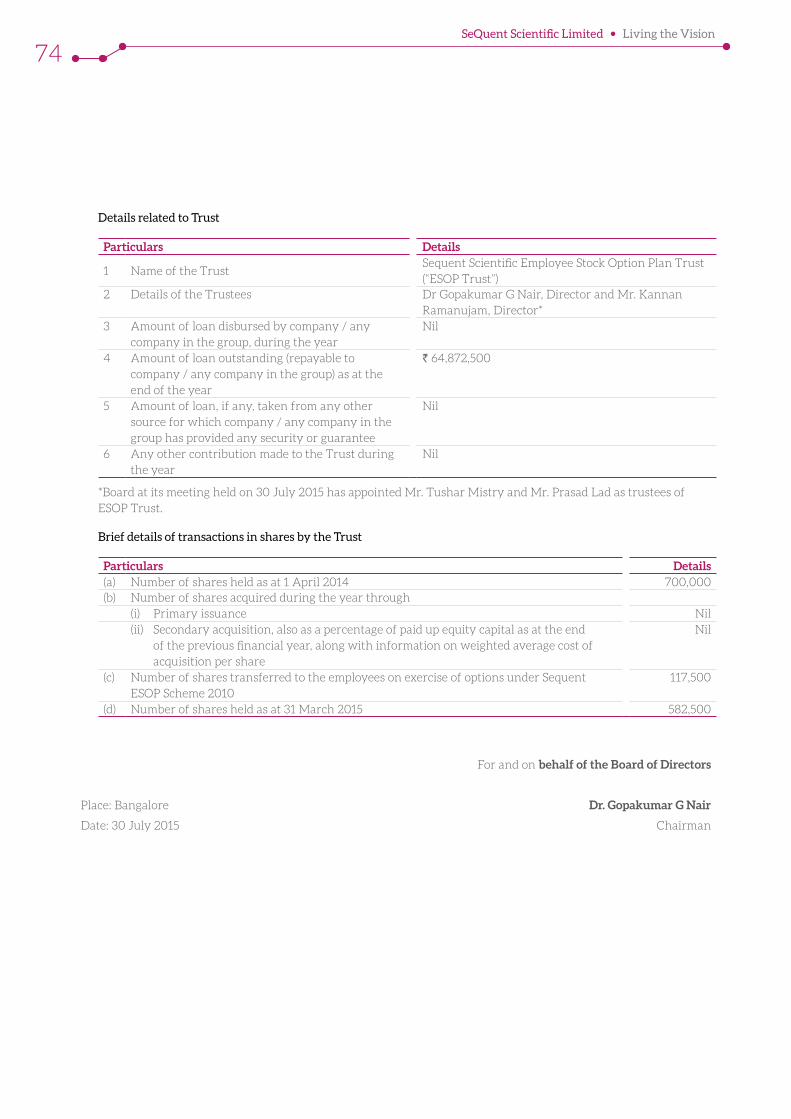
SeQuent Scientific Limited Living the Vision
74
Details related to Trust
Particulars Details
1 Name of the TrustSequent Scientific Employee Stock Option Plan Trust (“ESOP Trust”)
2 Details of the Trustees Dr Gopakumar G Nair, Director and Mr. Kannan Ramanujam, Director*
3 Amount of loan disbursed by company / any company in the group, during the year
Nil
4 Amount of loan outstanding (repayable to company / any company in the group) as at the end of the year
` 64,872,500
5 Amount of loan, if any, taken from any other source for which company / any company in the group has provided any security or guarantee
Nil
6 Any other contribution made to the Trust during the year
Nil
*Board at its meeting held on 30 July 2015 has appointed Mr. Tushar Mistry and Mr. Prasad Lad as trustees of ESOP Trust.
Brief details of transactions in shares by the Trust
Particulars Details(a) Number of shares held as at 1 April 2014 700,000(b) Number of shares acquired during the year through
(i) Primary issuance Nil(ii) Secondary acquisition, also as a percentage of paid up equity capital as at the end
of the previous financial year, along with information on weighted average cost of acquisition per share
Nil
(c) Number of shares transferred to the employees on exercise of options under Sequent ESOP Scheme 2010
117,500
(d) Number of shares held as at 31 March 2015 582,500
For and on behalf of the Board of Directors
Place: Bangalore Dr. Gopakumar G Nair
Date: 30 July 2015 Chairman
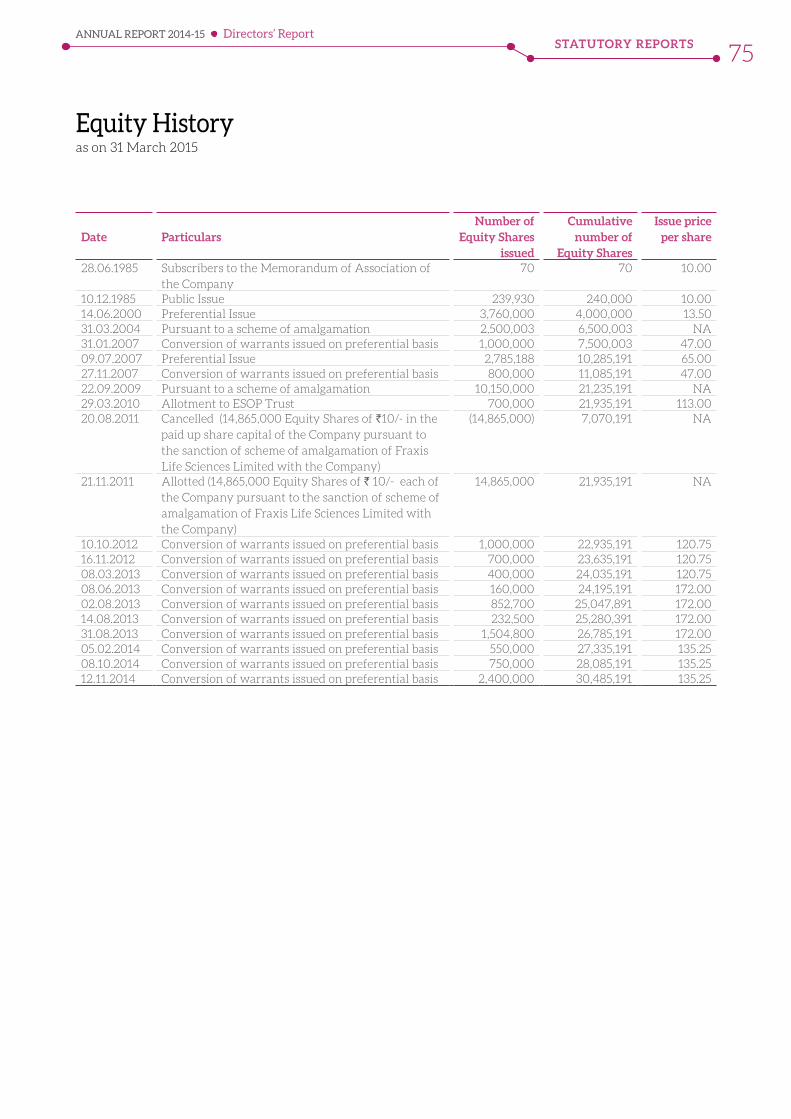
STATUTORY REPORTSANNUAL REPORT 2014-15
75
Equity History as on 31 March 2015
Date Particulars Number of
Equity Shares issued
Cumulative number of
Equity Shares
Issue price per share
28.06.1985 Subscribers to the Memorandum of Association of the Company
70 70 10.00
10.12.1985 Public Issue 239,930 240,000 10.0014.06.2000 Preferential Issue 3,760,000 4,000,000 13.5031.03.2004 Pursuant to a scheme of amalgamation 2,500,003 6,500,003 NA31.01.2007 Conversion of warrants issued on preferential basis 1,000,000 7,500,003 47.0009.07.2007 Preferential Issue 2,785,188 10,285,191 65.0027.11.2007 Conversion of warrants issued on preferential basis 800,000 11,085,191 47.0022.09.2009 Pursuant to a scheme of amalgamation 10,150,000 21,235,191 NA29.03.2010 Allotment to ESOP Trust 700,000 21,935,191 113.0020.08.2011 Cancelled (14,865,000 Equity Shares of `10/- in the
paid up share capital of the Company pursuant to the sanction of scheme of amalgamation of Fraxis Life Sciences Limited with the Company)
(14,865,000) 7,070,191 NA
21.11.2011 Allotted (14,865,000 Equity Shares of ` 10/- each of the Company pursuant to the sanction of scheme of amalgamation of Fraxis Life Sciences Limited with the Company)
14,865,000 21,935,191 NA
10.10.2012 Conversion of warrants issued on preferential basis 1,000,000 22,935,191 120.7516.11.2012 Conversion of warrants issued on preferential basis 700,000 23,635,191 120.7508.03.2013 Conversion of warrants issued on preferential basis 400,000 24,035,191 120.7508.06.2013 Conversion of warrants issued on preferential basis 160,000 24,195,191 172.0002.08.2013 Conversion of warrants issued on preferential basis 852,700 25,047,891 172.0014.08.2013 Conversion of warrants issued on preferential basis 232,500 25,280,391 172.0031.08.2013 Conversion of warrants issued on preferential basis 1,504,800 26,785,191 172.0005.02.2014 Conversion of warrants issued on preferential basis 550,000 27,335,191 135.2508.10.2014 Conversion of warrants issued on preferential basis 750,000 28,085,191 135.2512.11.2014 Conversion of warrants issued on preferential basis 2,400,000 30,485,191 135.25
Directors’ Report
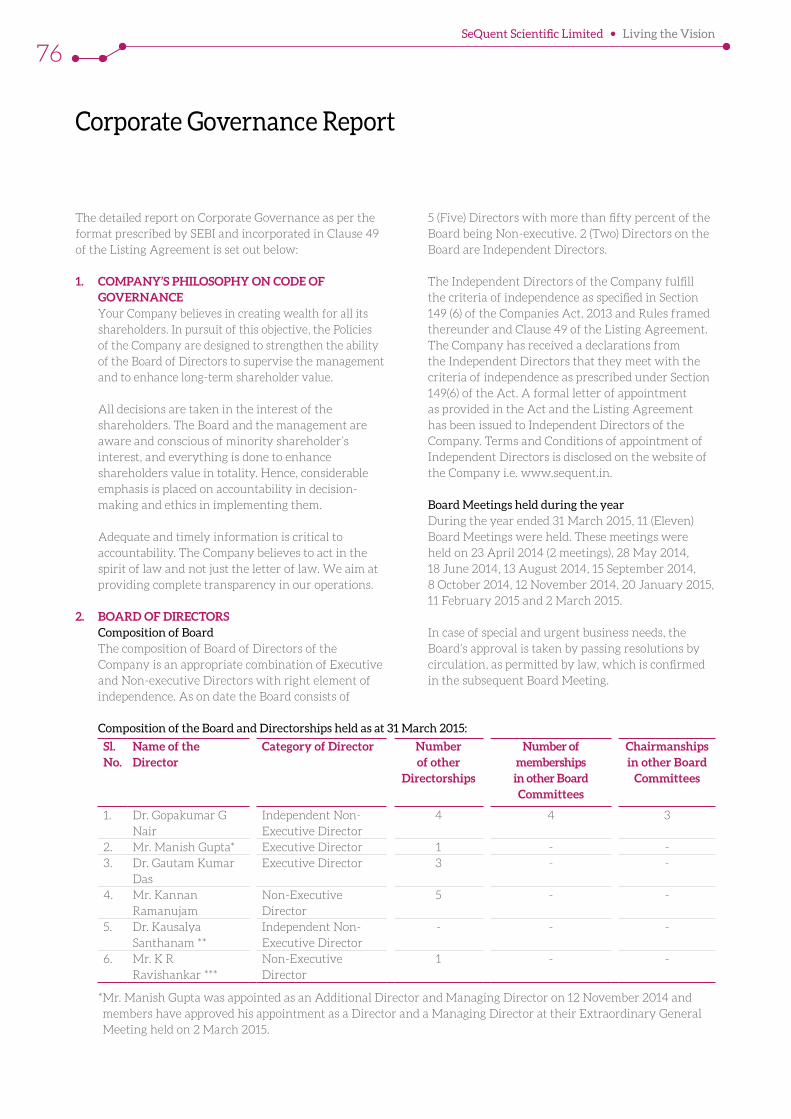
SeQuent Scientific Limited Living the Vision
76
Corporate Governance Report
The detailed report on Corporate Governance as per the format prescribed by SEBI and incorporated in Clause 49 of the Listing Agreement is set out below:
1. COMPANY’S PHILOSOPHY ON CODE OF GOVERNANCE
Your Company believes in creating wealth for all its shareholders. In pursuit of this objective, the Policies of the Company are designed to strengthen the ability of the Board of Directors to supervise the management and to enhance long-term shareholder value.
All decisions are taken in the interest of the shareholders. The Board and the management are aware and conscious of minority shareholder’s interest, and everything is done to enhance shareholders value in totality. Hence, considerable emphasis is placed on accountability in decision-making and ethics in implementing them.
Adequate and timely information is critical to accountability. The Company believes to act in the spirit of law and not just the letter of law. We aim at providing complete transparency in our operations.
2. BOARD OF DIRECTORS Composition of Board The composition of Board of Directors of the
Company is an appropriate combination of Executive and Non-executive Directors with right element of independence. As on date the Board consists of
5 (Five) Directors with more than fifty percent of the Board being Non-executive. 2 (Two) Directors on the Board are Independent Directors.
The Independent Directors of the Company fulfill the criteria of independence as specified in Section 149 (6) of the Companies Act, 2013 and Rules framed thereunder and Clause 49 of the Listing Agreement. The Company has received a declarations from the Independent Directors that they meet with the criteria of independence as prescribed under Section 149(6) of the Act. A formal letter of appointment as provided in the Act and the Listing Agreement has been issued to Independent Directors of the Company. Terms and Conditions of appointment of Independent Directors is disclosed on the website of the Company i.e. www.sequent.in.
Board Meetings held during the year During the year ended 31 March 2015, 11 (Eleven)
Board Meetings were held. These meetings were held on 23 April 2014 (2 meetings), 28 May 2014, 18 June 2014, 13 August 2014, 15 September 2014, 8 October 2014, 12 November 2014, 20 January 2015, 11 February 2015 and 2 March 2015.
In case of special and urgent business needs, the Board’s approval is taken by passing resolutions by circulation, as permitted by law, which is confirmed in the subsequent Board Meeting.
Composition of the Board and Directorships held as at 31 March 2015:
Sl. No.
Name of the Director
Category of Director Number of other
Directorships
Number of memberships in other Board Committees
Chairmanships in other Board
Committees
1. Dr. Gopakumar G Nair
Independent Non-Executive Director
4 4 3
2. Mr. Manish Gupta* Executive Director 1 - -3. Dr. Gautam Kumar
DasExecutive Director 3 - -
4. Mr. Kannan Ramanujam
Non-Executive Director
5 - -
5. Dr. Kausalya Santhanam **
Independent Non-Executive Director
- - -
6. Mr. K R Ravishankar ***
Non-Executive Director
1 - -
* Mr. Manish Gupta was appointed as an Additional Director and Managing Director on 12 November 2014 and members have approved his appointment as a Director and a Managing Director at their Extraordinary General Meeting held on 2 March 2015.
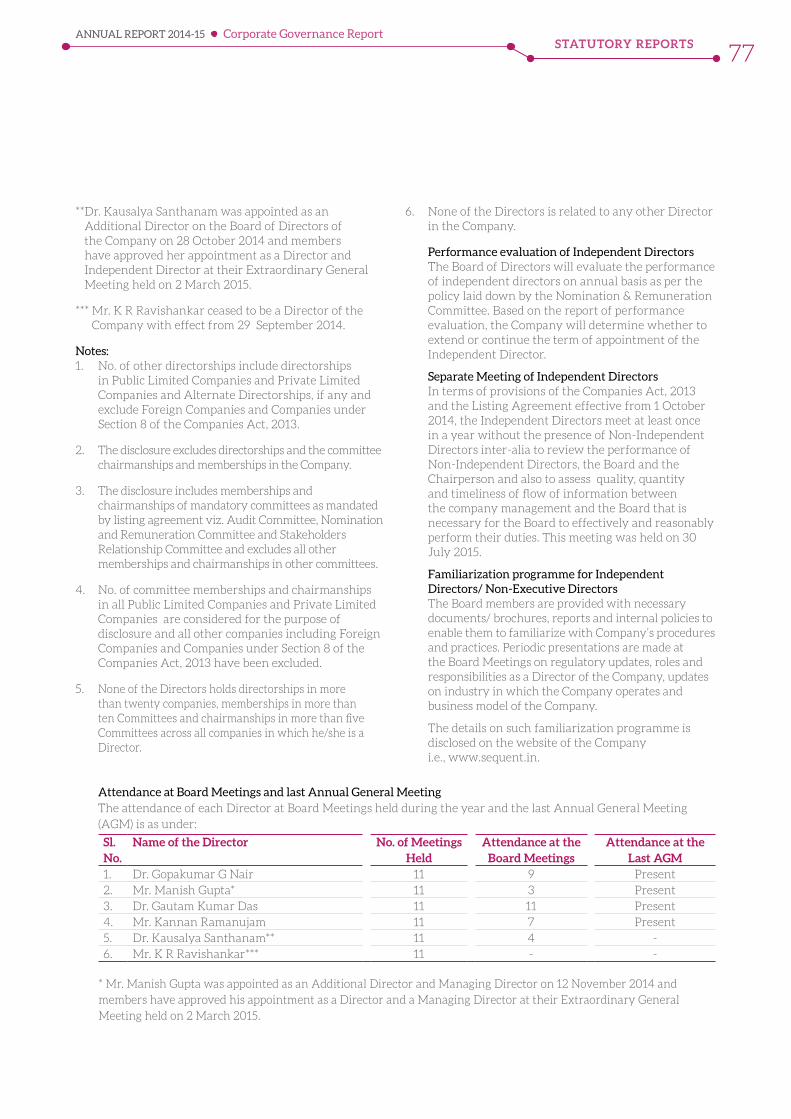
STATUTORY REPORTSANNUAL REPORT 2014-15
77
** Dr. Kausalya Santhanam was appointed as an Additional Director on the Board of Directors of the Company on 28 October 2014 and members have approved her appointment as a Director and Independent Director at their Extraordinary General Meeting held on 2 March 2015.
*** Mr. K R Ravishankar ceased to be a Director of the Company with effect from 29 September 2014.
Notes:1. No. of other directorships include directorships
in Public Limited Companies and Private Limited Companies and Alternate Directorships, if any and exclude Foreign Companies and Companies under Section 8 of the Companies Act, 2013.
2. The disclosure excludes directorships and the committee chairmanships and memberships in the Company.
3. The disclosure includes memberships and chairmanships of mandatory committees as mandated by listing agreement viz. Audit Committee, Nomination and Remuneration Committee and Stakeholders Relationship Committee and excludes all other memberships and chairmanships in other committees.
4. No. of committee memberships and chairmanships in all Public Limited Companies and Private Limited Companies are considered for the purpose of disclosure and all other companies including Foreign Companies and Companies under Section 8 of the Companies Act, 2013 have been excluded.
5. None of the Directors holds directorships in more than twenty companies, memberships in more than ten Committees and chairmanships in more than five Committees across all companies in which he/she is a Director.
6. None of the Directors is related to any other Director in the Company.
Performance evaluation of Independent Directors The Board of Directors will evaluate the performance
of independent directors on annual basis as per the policy laid down by the Nomination & Remuneration Committee. Based on the report of performance evaluation, the Company will determine whether to extend or continue the term of appointment of the Independent Director.
Separate Meeting of Independent Directors In terms of provisions of the Companies Act, 2013
and the Listing Agreement effective from 1 October 2014, the Independent Directors meet at least once in a year without the presence of Non-Independent Directors inter-alia to review the performance of Non-Independent Directors, the Board and the Chairperson and also to assess quality, quantity and timeliness of flow of information between the company management and the Board that is necessary for the Board to effectively and reasonably perform their duties. This meeting was held on 30 July 2015.
Familiarization programme for Independent Directors/ Non-Executive Directors
The Board members are provided with necessary documents/ brochures, reports and internal policies to enable them to familiarize with Company’s procedures and practices. Periodic presentations are made at the Board Meetings on regulatory updates, roles and responsibilities as a Director of the Company, updates on industry in which the Company operates and business model of the Company.
The details on such familiarization programme is disclosed on the website of the Company i.e., www.sequent.in.
Attendance at Board Meetings and last Annual General Meeting The attendance of each Director at Board Meetings held during the year and the last Annual General Meeting
(AGM) is as under:
Sl. No.
Name of the Director No. of Meetings Held
Attendance at the Board Meetings
Attendance at the Last AGM
1. Dr. Gopakumar G Nair 11 9 Present 2. Mr. Manish Gupta* 11 3 Present3. Dr. Gautam Kumar Das 11 11 Present4. Mr. Kannan Ramanujam 11 7 Present5. Dr. Kausalya Santhanam** 11 4 -6. Mr. K R Ravishankar*** 11 - -
* Mr. Manish Gupta was appointed as an Additional Director and Managing Director on 12 November 2014 and members have approved his appointment as a Director and a Managing Director at their Extraordinary General Meeting held on 2 March 2015.
Corporate Governance Report
SeQuent Scientific Limited Living the Vision
78
**Dr. Kausalya Santhanam was appointed as an Additional Director on the Board of Directors of the Company on 28 October 2014 and members have approved her appointment as a Director and Independent Director at their Extraordinary General Meeting held on 2 March 2015.
*** Mr. K R Ravishankar ceased to be a Director of the Company with effect from 29 September 2014 and he has not attended any of the meetings held during the financial year 2014-15 till his tenure as a Director of the Company due to health reasons.
3. AUDIT COMMITTEE: Terms of Reference The Company has an independent Audit Committee.
The composition, procedures, powers and role/ functions of the Audit Committee, constituted by the Company, comply with requirements of the Companies Act, 2013 and the Listing Agreement.
The Audit Committee has the following responsibilities/ powers:
1. To investigate any activity within its terms of reference.
2. To seek information from any employee.
3. To obtain outside legal or other professional advice.
4. To secure attendance of outsiders with relevant expertise, if it considers necessary.
Role of Audit Committee The role of the Audit Committee includes the following:
1. Oversight of the company’s financial reporting process and the disclosure of its financial information to ensure that the financial statement is correct, sufficient and credible;
2. Recommendation for appointment, remuneration and terms of appointment of auditors of the company;
3. Approval of payment to statutory auditors for any other services rendered by the statutory auditors;
4. Reviewing, with the management, the annual financial statements and auditor’s report thereon before submission to the Board for approval, with particular reference to:
a. Matters required to be included in the Director’s Responsibility Statement to be included in the Board’s report in terms of Clause (c) of sub-section 3 of Section 134 of the Companies Act, 2013.
b. Changes, if any, in accounting policies and practices and reasons for the same.
c. Major accounting entries involving estimates based on the exercise of judgment by management.
d. Significant adjustments made in the financial statements arising out of audit findings.
e. Compliance with listing and other legal requirements relating to financial statements.
f. Disclosure of any related party transactions.
g. Qualifications in the draft audit report.
5. Reviewing, with the management, the quarterly financial statements before submission to the board for approval;
6. Reviewing, with the management, the statement of uses / application of funds raised through an issue (public issue, rights issue, preferential issue, etc.), the statement of funds utilized for purposes other than those stated in the offer document/ prospectus / notice and the report submitted by the monitoring agency monitoring the utilization of proceeds of a public or rights issue, and making appropriate recommendations to the Board to take up steps in this matter;
7. Review and monitor the auditor’s independence and performance, and effectiveness of audit process;
8. Approval or any subsequent modification of transactions of the company with related parties;
9. Scrutiny of inter-corporate loans and investments;
10. Valuation of undertakings or assets of the company, wherever it is necessary;
11. Evaluation of internal financial controls and risk management systems;
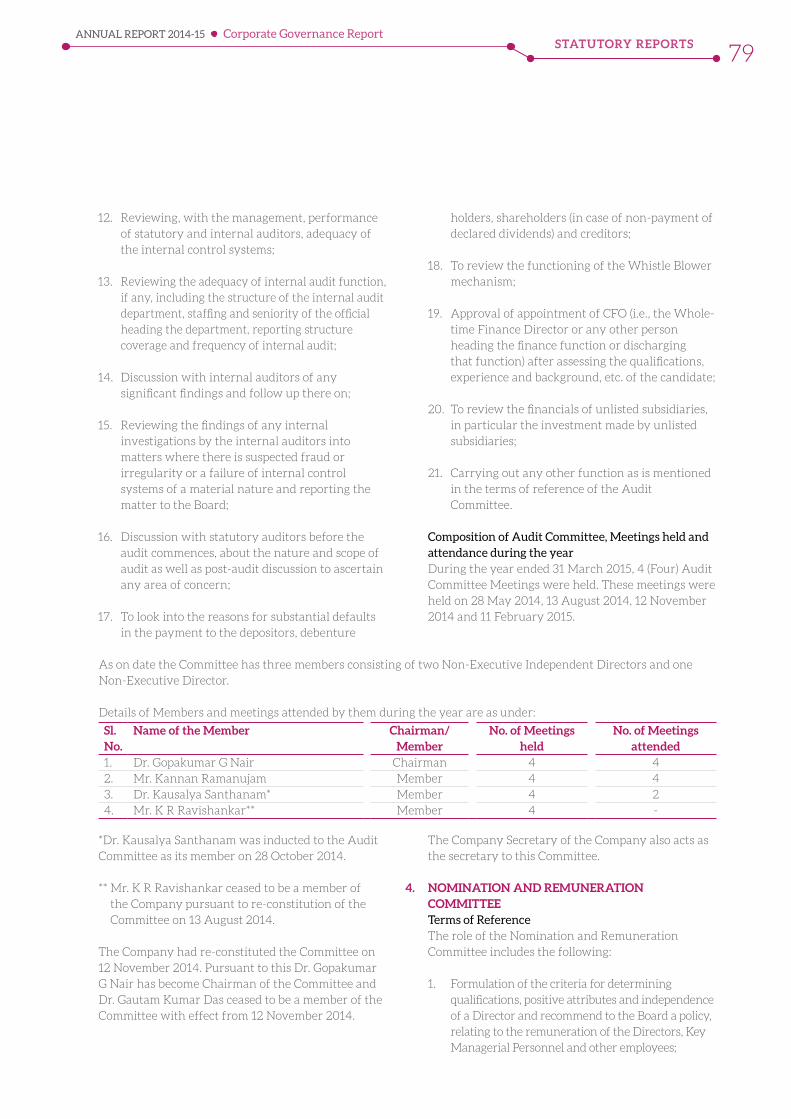
STATUTORY REPORTSANNUAL REPORT 2014-15
79
12. Reviewing, with the management, performance of statutory and internal auditors, adequacy of the internal control systems;
13. Reviewing the adequacy of internal audit function, if any, including the structure of the internal audit department, staffing and seniority of the official heading the department, reporting structure coverage and frequency of internal audit;
14. Discussion with internal auditors of any significant findings and follow up there on;
15. Reviewing the findings of any internal investigations by the internal auditors into matters where there is suspected fraud or irregularity or a failure of internal control systems of a material nature and reporting the matter to the Board;
16. Discussion with statutory auditors before the audit commences, about the nature and scope of audit as well as post-audit discussion to ascertain any area of concern;
17. To look into the reasons for substantial defaults in the payment to the depositors, debenture
holders, shareholders (in case of non-payment of declared dividends) and creditors;
18. To review the functioning of the Whistle Blower mechanism;
19. Approval of appointment of CFO (i.e., the Whole-time Finance Director or any other person heading the finance function or discharging that function) after assessing the qualifications, experience and background, etc. of the candidate;
20. To review the financials of unlisted subsidiaries, in particular the investment made by unlisted subsidiaries;
21. Carrying out any other function as is mentioned in the terms of reference of the Audit Committee.
Composition of Audit Committee, Meetings held and attendance during the year
During the year ended 31 March 2015, 4 (Four) Audit Committee Meetings were held. These meetings were held on 28 May 2014, 13 August 2014, 12 November 2014 and 11 February 2015.
As on date the Committee has three members consisting of two Non-Executive Independent Directors and one Non-Executive Director.
Details of Members and meetings attended by them during the year are as under:
Sl. No.
Name of the Member Chairman/ Member
No. of Meetings held
No. of Meetings attended
1. Dr. Gopakumar G Nair Chairman 4 42. Mr. Kannan Ramanujam Member 4 43. Dr. Kausalya Santhanam* Member 4 24. Mr. K R Ravishankar** Member 4 -
*Dr. Kausalya Santhanam was inducted to the Audit Committee as its member on 28 October 2014.
** Mr. K R Ravishankar ceased to be a member of the Company pursuant to re-constitution of the Committee on 13 August 2014.
The Company had re-constituted the Committee on 12 November 2014. Pursuant to this Dr. Gopakumar G Nair has become Chairman of the Committee and Dr. Gautam Kumar Das ceased to be a member of the Committee with effect from 12 November 2014.
The Company Secretary of the Company also acts as the secretary to this Committee.
4. NOMINATION AND REMUNERATION COMMITTEE
Terms of Reference The role of the Nomination and Remuneration
Committee includes the following:
1. Formulation of the criteria for determining qualifications, positive attributes and independence of a Director and recommend to the Board a policy, relating to the remuneration of the Directors, Key Managerial Personnel and other employees;
Corporate Governance Report
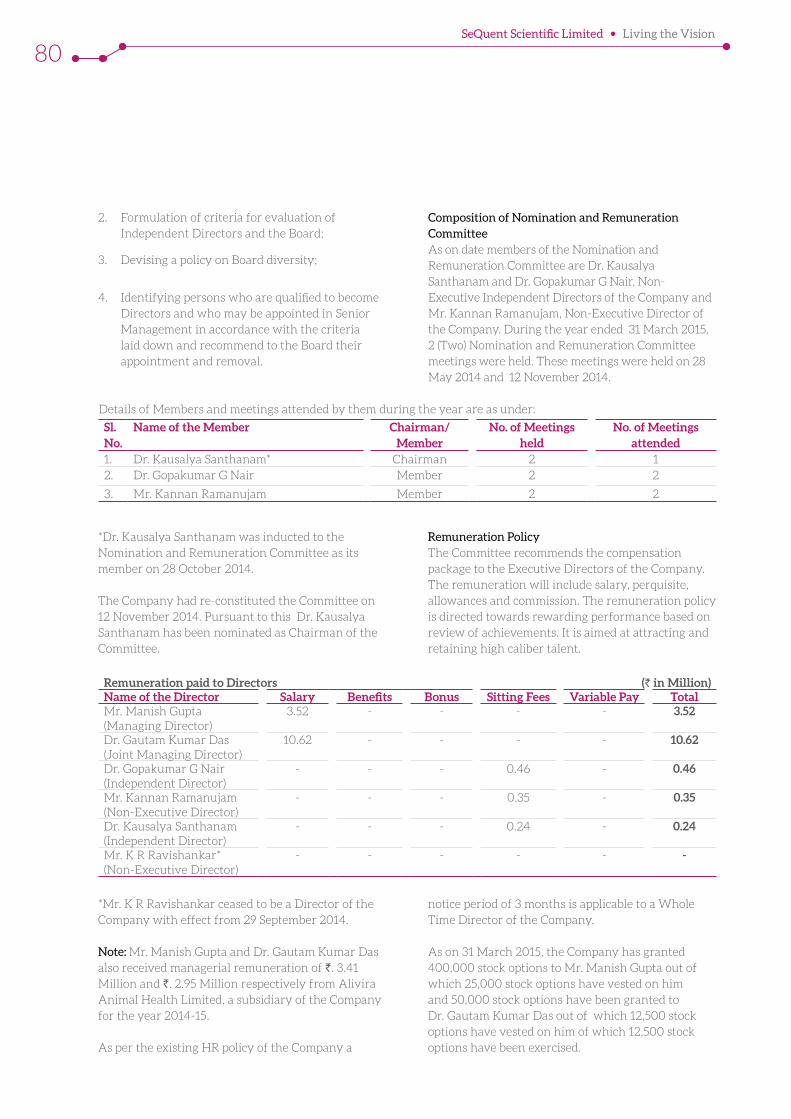
SeQuent Scientific Limited Living the Vision
80
Details of Members and meetings attended by them during the year are as under:
Sl. No.
Name of the Member Chairman/ Member
No. of Meetings held
No. of Meetings attended
1. Dr. Kausalya Santhanam* Chairman 2 12. Dr. Gopakumar G Nair Member 2 2
3. Mr. Kannan Ramanujam Member 2 2
*Dr. Kausalya Santhanam was inducted to the Nomination and Remuneration Committee as its member on 28 October 2014.
The Company had re-constituted the Committee on 12 November 2014. Pursuant to this Dr. Kausalya Santhanam has been nominated as Chairman of the Committee.
Remuneration Policy The Committee recommends the compensation
package to the Executive Directors of the Company. The remuneration will include salary, perquisite, allowances and commission. The remuneration policy is directed towards rewarding performance based on review of achievements. It is aimed at attracting and retaining high caliber talent.
Remuneration paid to Directors (` in Million)Name of the Director Salary Benefits Bonus Sitting Fees Variable Pay TotalMr. Manish Gupta (Managing Director)
3.52 - - - - 3.52
Dr. Gautam Kumar Das (Joint Managing Director)
10.62 - - - - 10.62
Dr. Gopakumar G Nair (Independent Director)
- - - 0.46 - 0.46
Mr. Kannan Ramanujam (Non-Executive Director)
- - - 0.35 - 0.35
Dr. Kausalya Santhanam (Independent Director)
- - - 0.24 - 0.24
Mr. K R Ravishankar* (Non-Executive Director)
- - - - - -
*Mr. K R Ravishankar ceased to be a Director of the Company with effect from 29 September 2014.
Note: Mr. Manish Gupta and Dr. Gautam Kumar Das also received managerial remuneration of `. 3.41 Million and `. 2.95 Million respectively from Alivira Animal Health Limited, a subsidiary of the Company for the year 2014-15.
As per the existing HR policy of the Company a
notice period of 3 months is applicable to a Whole Time Director of the Company.
As on 31 March 2015, the Company has granted 400,000 stock options to Mr. Manish Gupta out of which 25,000 stock options have vested on him and 50,000 stock options have been granted to Dr. Gautam Kumar Das out of which 12,500 stock options have vested on him of which 12,500 stock options have been exercised.
2. Formulation of criteria for evaluation of Independent Directors and the Board;
3. Devising a policy on Board diversity;
4. Identifying persons who are qualified to become Directors and who may be appointed in Senior Management in accordance with the criteria laid down and recommend to the Board their appointment and removal.
Composition of Nomination and Remuneration Committee
As on date members of the Nomination and Remuneration Committee are Dr. Kausalya Santhanam and Dr. Gopakumar G Nair, Non-Executive Independent Directors of the Company and Mr. Kannan Ramanujam, Non-Executive Director of the Company. During the year ended 31 March 2015, 2 (Two) Nomination and Remuneration Committee meetings were held. These meetings were held on 28 May 2014 and 12 November 2014.
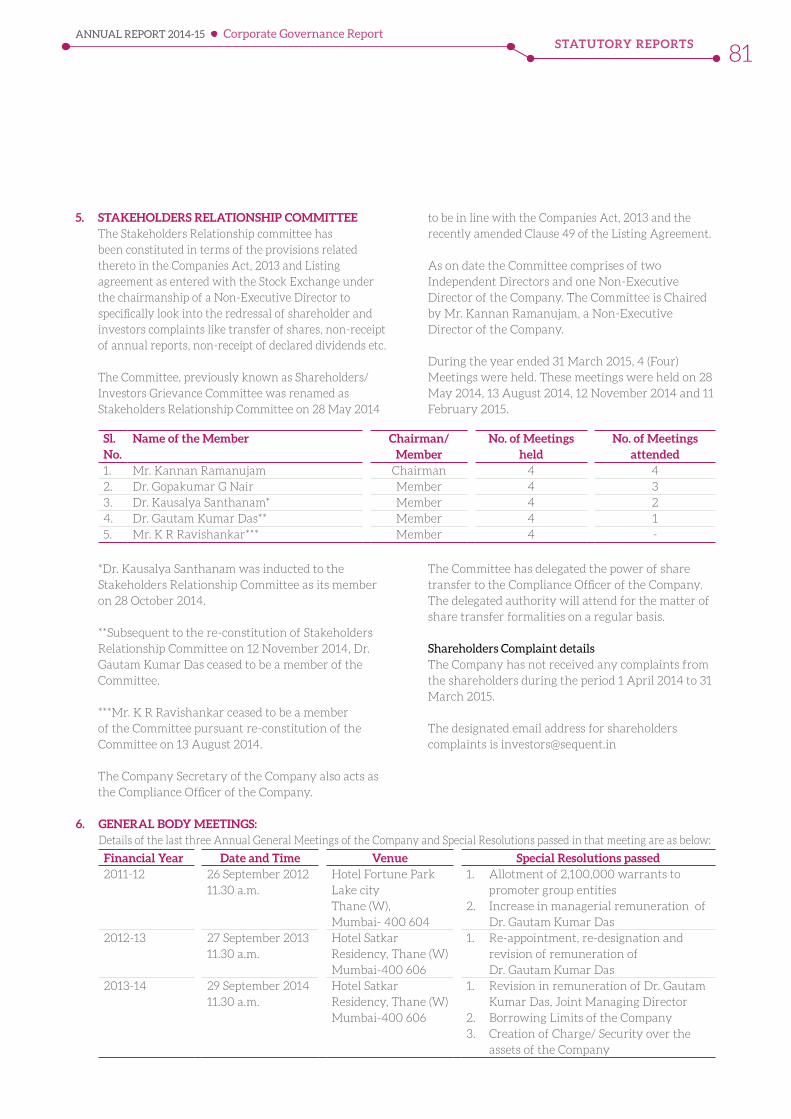
STATUTORY REPORTSANNUAL REPORT 2014-15
81
5. STAKEHOLDERS RELATIONSHIP COMMITTEE The Stakeholders Relationship committee has
been constituted in terms of the provisions related thereto in the Companies Act, 2013 and Listing agreement as entered with the Stock Exchange under the chairmanship of a Non-Executive Director to specifically look into the redressal of shareholder and investors complaints like transfer of shares, non-receipt of annual reports, non-receipt of declared dividends etc.
The Committee, previously known as Shareholders/ Investors Grievance Committee was renamed as Stakeholders Relationship Committee on 28 May 2014
to be in line with the Companies Act, 2013 and the recently amended Clause 49 of the Listing Agreement.
As on date the Committee comprises of two Independent Directors and one Non-Executive Director of the Company. The Committee is Chaired by Mr. Kannan Ramanujam, a Non-Executive Director of the Company.
During the year ended 31 March 2015, 4 (Four) Meetings were held. These meetings were held on 28 May 2014, 13 August 2014, 12 November 2014 and 11 February 2015.
Sl. No.
Name of the Member Chairman/ Member
No. of Meetings held
No. of Meetings attended
1. Mr. Kannan Ramanujam Chairman 4 42. Dr. Gopakumar G Nair Member 4 33. Dr. Kausalya Santhanam* Member 4 24. Dr. Gautam Kumar Das** Member 4 15. Mr. K R Ravishankar*** Member 4 -
*Dr. Kausalya Santhanam was inducted to the Stakeholders Relationship Committee as its member on 28 October 2014.
**Subsequent to the re-constitution of Stakeholders Relationship Committee on 12 November 2014, Dr. Gautam Kumar Das ceased to be a member of the Committee.
***Mr. K R Ravishankar ceased to be a member of the Committee pursuant re-constitution of the Committee on 13 August 2014.
The Company Secretary of the Company also acts as the Compliance Officer of the Company.
The Committee has delegated the power of share transfer to the Compliance Officer of the Company. The delegated authority will attend for the matter of share transfer formalities on a regular basis.
Shareholders Complaint details The Company has not received any complaints from
the shareholders during the period 1 April 2014 to 31 March 2015.
The designated email address for shareholders complaints is [email protected]
6. GENERAL BODY MEETINGS: Details of the last three Annual General Meetings of the Company and Special Resolutions passed in that meeting are as below:
Financial Year Date and Time Venue Special Resolutions passed2011-12 26 September 2012
11.30 a.m.Hotel Fortune Park Lake cityThane (W), Mumbai- 400 604
1. Allotment of 2,100,000 warrants to promoter group entities
2. Increase in managerial remuneration of Dr. Gautam Kumar Das
2012-13 27 September 201311.30 a.m.
Hotel Satkar Residency, Thane (W) Mumbai-400 606
1. Re-appointment, re-designation and revision of remuneration of Dr. Gautam Kumar Das
2013-14 29 September 201411.30 a.m.
Hotel Satkar Residency, Thane (W)Mumbai-400 606
1. Revision in remuneration of Dr. Gautam Kumar Das, Joint Managing Director
2. Borrowing Limits of the Company3. Creation of Charge/ Security over the
assets of the Company
Corporate Governance Report
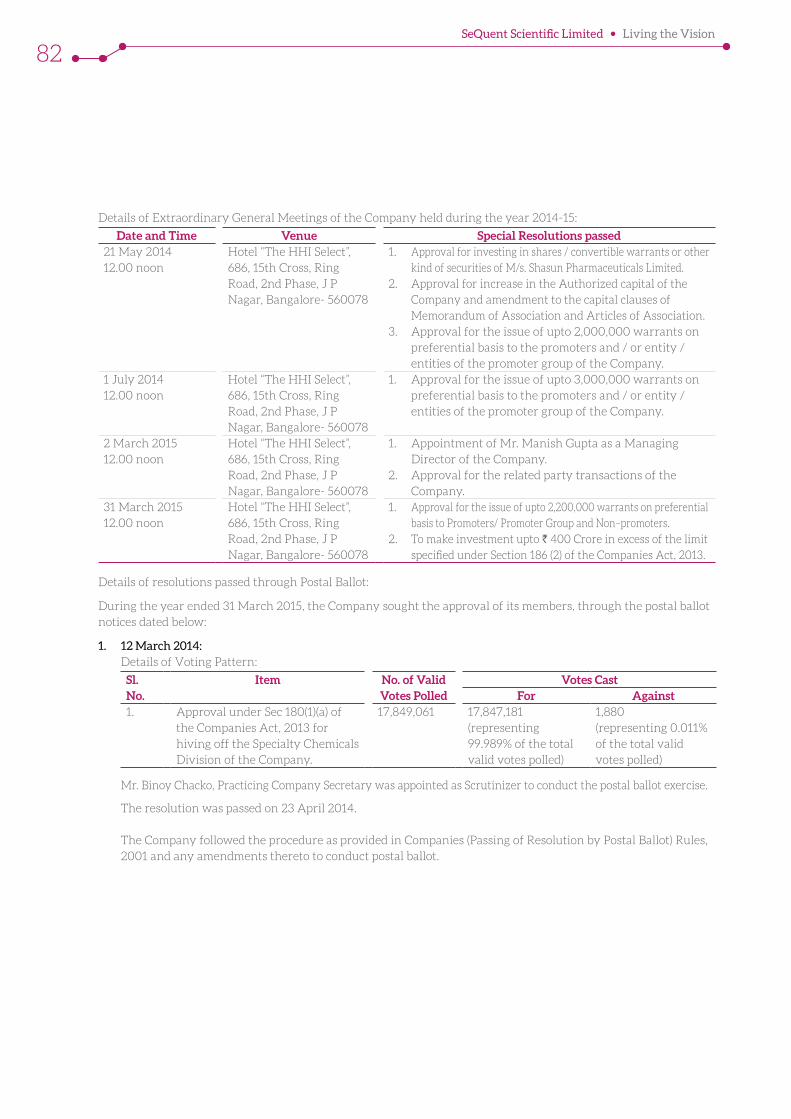
SeQuent Scientific Limited Living the Vision
82
Details of Extraordinary General Meetings of the Company held during the year 2014-15:
Date and Time Venue Special Resolutions passed21 May 2014 12.00 noon
Hotel “The HHI Select”, 686, 15th Cross, Ring Road, 2nd Phase, J P Nagar, Bangalore- 560078
1. Approval for investing in shares / convertible warrants or other kind of securities of M/s. Shasun Pharmaceuticals Limited.
2. Approval for increase in the Authorized capital of the Company and amendment to the capital clauses of Memorandum of Association and Articles of Association.
3. Approval for the issue of upto 2,000,000 warrants on preferential basis to the promoters and / or entity / entities of the promoter group of the Company.
1 July 201412.00 noon
Hotel “The HHI Select”, 686, 15th Cross, Ring Road, 2nd Phase, J P Nagar, Bangalore- 560078
1. Approval for the issue of upto 3,000,000 warrants on preferential basis to the promoters and / or entity / entities of the promoter group of the Company.
2 March 201512.00 noon
Hotel “The HHI Select”, 686, 15th Cross, Ring Road, 2nd Phase, J P Nagar, Bangalore- 560078
1. Appointment of Mr. Manish Gupta as a Managing Director of the Company.
2. Approval for the related party transactions of the Company.
31 March 201512.00 noon
Hotel “The HHI Select”, 686, 15th Cross, Ring Road, 2nd Phase, J P Nagar, Bangalore- 560078
1. Approval for the issue of upto 2,200,000 warrants on preferential basis to Promoters/ Promoter Group and Non–promoters.
2. To make investment upto ` 400 Crore in excess of the limit specified under Section 186 (2) of the Companies Act, 2013.
Details of resolutions passed through Postal Ballot:
During the year ended 31 March 2015, the Company sought the approval of its members, through the postal ballot notices dated below:
1. 12 March 2014: Details of Voting Pattern:
Sl. No.
Item No. of Valid Votes Polled
Votes CastFor Against
1. Approval under Sec 180(1)(a) of the Companies Act, 2013 for hiving off the Specialty Chemicals Division of the Company.
17,849,061 17,847,181 (representing 99.989% of the total valid votes polled)
1,880(representing 0.011% of the total valid votes polled)
Mr. Binoy Chacko, Practicing Company Secretary was appointed as Scrutinizer to conduct the postal ballot exercise.
The resolution was passed on 23 April 2014.
The Company followed the procedure as provided in Companies (Passing of Resolution by Postal Ballot) Rules, 2001 and any amendments thereto to conduct postal ballot.
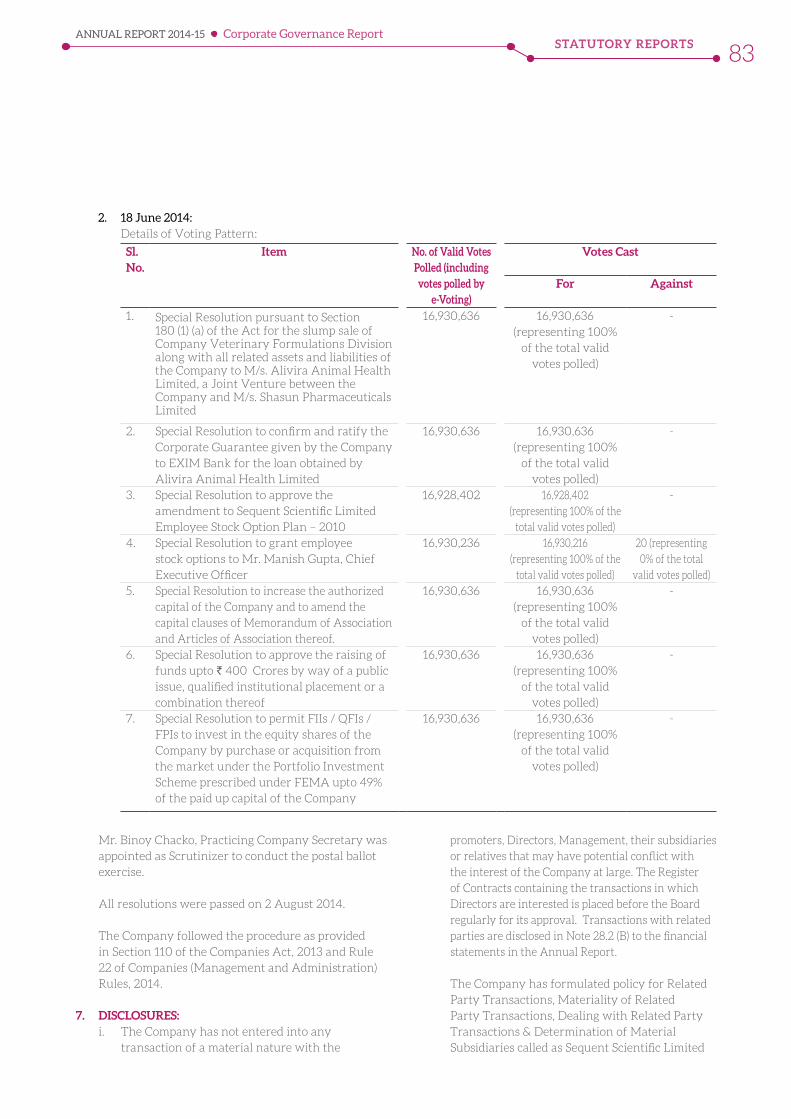
STATUTORY REPORTSANNUAL REPORT 2014-15
83
2. 18 June 2014: Details of Voting Pattern:
Sl. No.
Item No. of Valid Votes Polled (including votes polled by
e-Voting)
Votes Cast
For Against
1. Special Resolution pursuant to Section 180 (1) (a) of the Act for the slump sale of Company Veterinary Formulations Division along with all related assets and liabilities of the Company to M/s. Alivira Animal Health Limited, a Joint Venture between the Company and M/s. Shasun Pharmaceuticals Limited
16,930,636 16,930,636 (representing 100%
of the total valid votes polled)
-
2. Special Resolution to confirm and ratify the Corporate Guarantee given by the Company to EXIM Bank for the loan obtained by Alivira Animal Health Limited
16,930,636 16,930,636 (representing 100%
of the total valid votes polled)
-
3. Special Resolution to approve the amendment to Sequent Scientific Limited Employee Stock Option Plan – 2010
16,928,402 16,928,402(representing 100% of the
total valid votes polled)
-
4. Special Resolution to grant employee stock options to Mr. Manish Gupta, Chief Executive Officer
16,930,236 16,930,216(representing 100% of the
total valid votes polled)
20 (representing 0% of the total
valid votes polled)5. Special Resolution to increase the authorized
capital of the Company and to amend the capital clauses of Memorandum of Association and Articles of Association thereof.
16,930,636 16,930,636 (representing 100%
of the total valid votes polled)
-
6. Special Resolution to approve the raising of funds upto ` 400 Crores by way of a public issue, qualified institutional placement or a combination thereof
16,930,636 16,930,636 (representing 100%
of the total valid votes polled)
-
7. Special Resolution to permit FIIs / QFIs / FPIs to invest in the equity shares of the Company by purchase or acquisition from the market under the Portfolio Investment Scheme prescribed under FEMA upto 49% of the paid up capital of the Company
16,930,636 16,930,636 (representing 100%
of the total valid votes polled)
-
Mr. Binoy Chacko, Practicing Company Secretary was appointed as Scrutinizer to conduct the postal ballot exercise.
All resolutions were passed on 2 August 2014.
The Company followed the procedure as provided in Section 110 of the Companies Act, 2013 and Rule 22 of Companies (Management and Administration) Rules, 2014.
7. DISCLOSURES: i. The Company has not entered into any
transaction of a material nature with the
promoters, Directors, Management, their subsidiaries or relatives that may have potential conflict with the interest of the Company at large. The Register of Contracts containing the transactions in which Directors are interested is placed before the Board regularly for its approval. Transactions with related parties are disclosed in Note 28.2 (B) to the financial statements in the Annual Report.
The Company has formulated policy for Related Party Transactions, Materiality of Related Party Transactions, Dealing with Related Party Transactions & Determination of Material Subsidiaries called as Sequent Scientific Limited
Corporate Governance Report
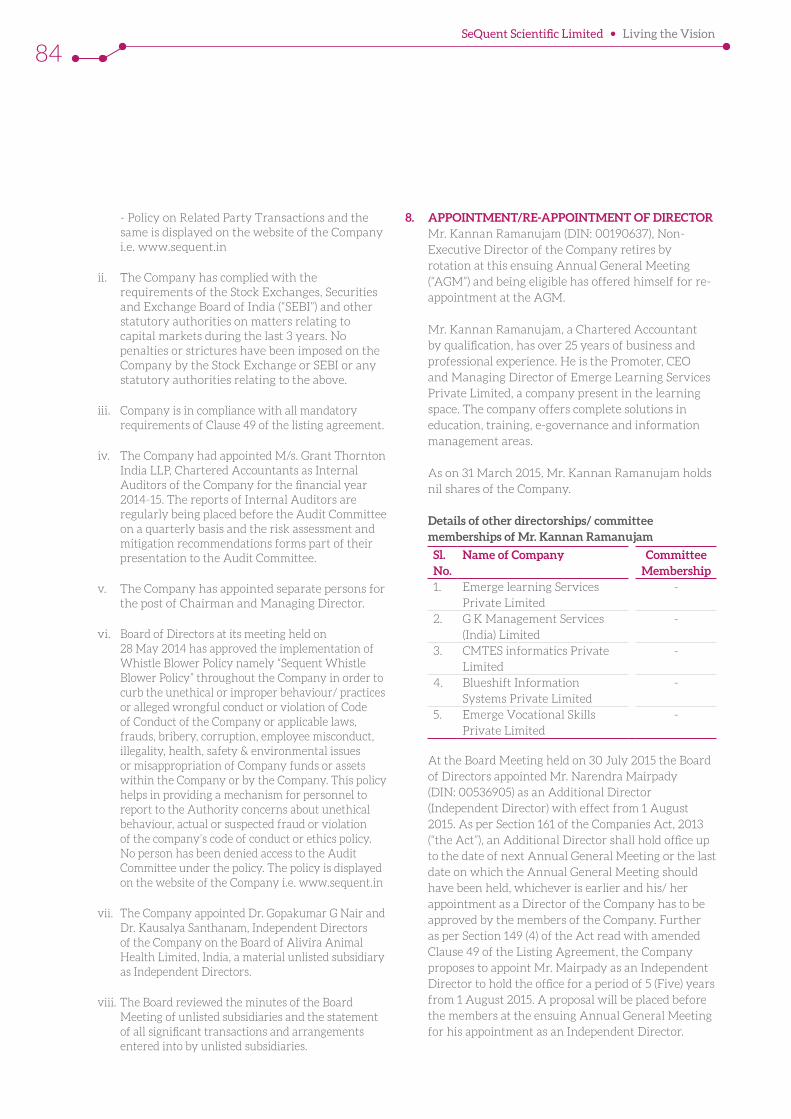
SeQuent Scientific Limited Living the Vision
84
- Policy on Related Party Transactions and the same is displayed on the website of the Company i.e. www.sequent.in
ii. The Company has complied with the requirements of the Stock Exchanges, Securities and Exchange Board of India (“SEBI”) and other statutory authorities on matters relating to capital markets during the last 3 years. No penalties or strictures have been imposed on the Company by the Stock Exchange or SEBI or any statutory authorities relating to the above.
iii. Company is in compliance with all mandatory requirements of Clause 49 of the listing agreement.
iv. The Company had appointed M/s. Grant Thornton India LLP, Chartered Accountants as Internal Auditors of the Company for the financial year 2014-15. The reports of Internal Auditors are regularly being placed before the Audit Committee on a quarterly basis and the risk assessment and mitigation recommendations forms part of their presentation to the Audit Committee.
v. The Company has appointed separate persons for the post of Chairman and Managing Director.
vi. Board of Directors at its meeting held on 28 May 2014 has approved the implementation of Whistle Blower Policy namely “Sequent Whistle Blower Policy” throughout the Company in order to curb the unethical or improper behaviour/ practices or alleged wrongful conduct or violation of Code of Conduct of the Company or applicable laws, frauds, bribery, corruption, employee misconduct, illegality, health, safety & environmental issues or misappropriation of Company funds or assets within the Company or by the Company. This policy helps in providing a mechanism for personnel to report to the Authority concerns about unethical behaviour, actual or suspected fraud or violation of the company’s code of conduct or ethics policy. No person has been denied access to the Audit Committee under the policy. The policy is displayed on the website of the Company i.e. www.sequent.in
vii. The Company appointed Dr. Gopakumar G Nair and Dr. Kausalya Santhanam, Independent Directors of the Company on the Board of Alivira Animal Health Limited, India, a material unlisted subsidiary as Independent Directors.
viii. The Board reviewed the minutes of the Board Meeting of unlisted subsidiaries and the statement of all significant transactions and arrangements entered into by unlisted subsidiaries.
8. APPOINTMENT/RE-APPOINTMENT OF DIRECTOR Mr. Kannan Ramanujam (DIN: 00190637), Non-
Executive Director of the Company retires by rotation at this ensuing Annual General Meeting (“AGM”) and being eligible has offered himself for re-appointment at the AGM.
Mr. Kannan Ramanujam, a Chartered Accountant by qualification, has over 25 years of business and professional experience. He is the Promoter, CEO and Managing Director of Emerge Learning Services Private Limited, a company present in the learning space. The company offers complete solutions in education, training, e-governance and information management areas.
As on 31 March 2015, Mr. Kannan Ramanujam holds nil shares of the Company.
Details of other directorships/ committee memberships of Mr. Kannan Ramanujam
Sl. No.
Name of Company Committee Membership
1. Emerge learning Services Private Limited
-
2. G K Management Services (India) Limited
-
3. CMTES informatics Private Limited
-
4. Blueshift Information Systems Private Limited
-
5. Emerge Vocational Skills Private Limited
-
At the Board Meeting held on 30 July 2015 the Board of Directors appointed Mr. Narendra Mairpady (DIN: 00536905) as an Additional Director (Independent Director) with effect from 1 August 2015. As per Section 161 of the Companies Act, 2013 (“the Act”), an Additional Director shall hold office up to the date of next Annual General Meeting or the last date on which the Annual General Meeting should have been held, whichever is earlier and his/ her appointment as a Director of the Company has to be approved by the members of the Company. Further as per Section 149 (4) of the Act read with amended Clause 49 of the Listing Agreement, the Company proposes to appoint Mr. Mairpady as an Independent Director to hold the office for a period of 5 (Five) years from 1 August 2015. A proposal will be placed before the members at the ensuing Annual General Meeting for his appointment as an Independent Director.
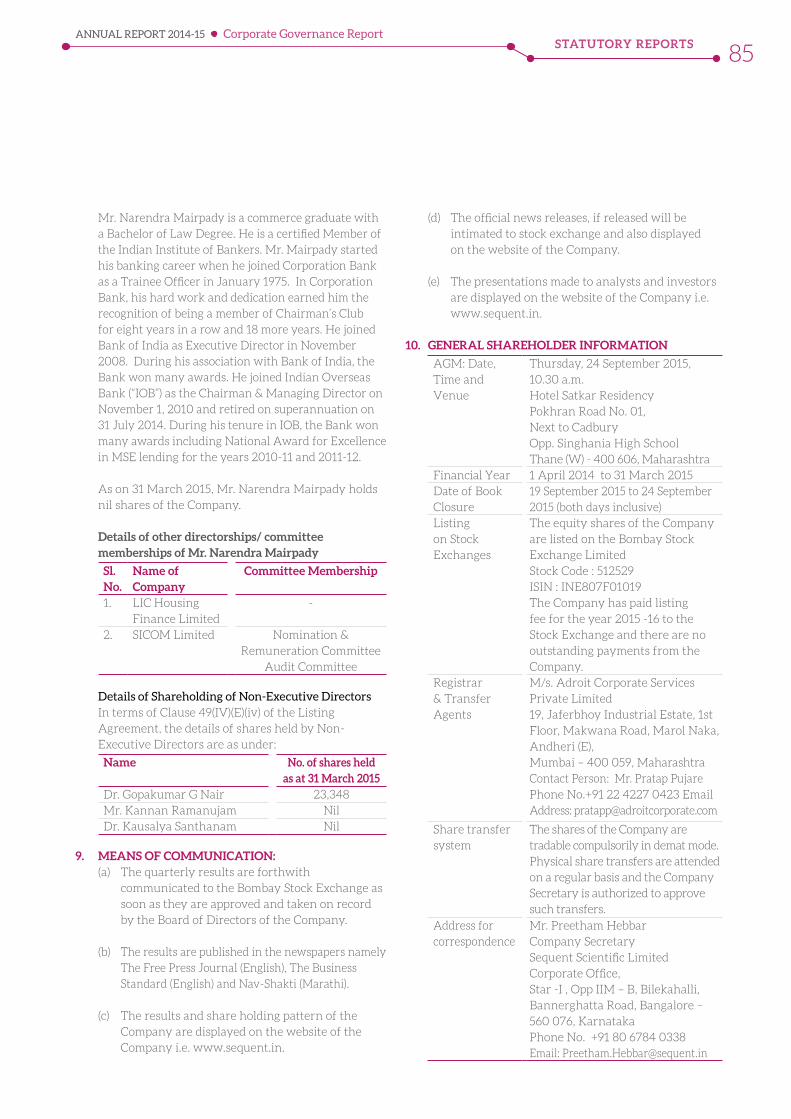
STATUTORY REPORTSANNUAL REPORT 2014-15
85
Mr. Narendra Mairpady is a commerce graduate with a Bachelor of Law Degree. He is a certified Member of the Indian Institute of Bankers. Mr. Mairpady started his banking career when he joined Corporation Bank as a Trainee Officer in January 1975. In Corporation Bank, his hard work and dedication earned him the recognition of being a member of Chairman’s Club for eight years in a row and 18 more years. He joined Bank of India as Executive Director in November 2008. During his association with Bank of India, the Bank won many awards. He joined Indian Overseas Bank (“IOB”) as the Chairman & Managing Director on November 1, 2010 and retired on superannuation on 31 July 2014. During his tenure in IOB, the Bank won many awards including National Award for Excellence in MSE lending for the years 2010-11 and 2011-12.
As on 31 March 2015, Mr. Narendra Mairpady holds nil shares of the Company.
Details of other directorships/ committee memberships of Mr. Narendra Mairpady
Sl. No.
Name of Company
Committee Membership
1. LIC Housing Finance Limited
-
2. SICOM Limited Nomination & Remuneration Committee
Audit Committee
Details of Shareholding of Non-Executive Directors In terms of Clause 49(IV)(E)(iv) of the Listing
Agreement, the details of shares held by Non-Executive Directors are as under:
Name No. of shares held as at 31 March 2015
Dr. Gopakumar G Nair 23,348Mr. Kannan Ramanujam NilDr. Kausalya Santhanam Nil
9. MEANS OF COMMUNICATION:(a) The quarterly results are forthwith
communicated to the Bombay Stock Exchange as soon as they are approved and taken on record by the Board of Directors of the Company.
(b) The results are published in the newspapers namely The Free Press Journal (English), The Business Standard (English) and Nav-Shakti (Marathi).
(c) The results and share holding pattern of the Company are displayed on the website of the Company i.e. www.sequent.in.
(d) The official news releases, if released will be intimated to stock exchange and also displayed on the website of the Company.
(e) The presentations made to analysts and investors are displayed on the website of the Company i.e. www.sequent.in.
10. GENERAL SHAREHOLDER INFORMATION
AGM: Date, Time and Venue
Thursday, 24 September 2015, 10.30 a.m.Hotel Satkar Residency Pokhran Road No. 01, Next to CadburyOpp. Singhania High School Thane (W) - 400 606, Maharashtra
Financial Year 1 April 2014 to 31 March 2015Date of Book Closure
19 September 2015 to 24 September 2015 (both days inclusive)
Listing on Stock Exchanges
The equity shares of the Company are listed on the Bombay Stock Exchange Limited Stock Code : 512529ISIN : INE807F01019The Company has paid listing fee for the year 2015 -16 to the Stock Exchange and there are no outstanding payments from the Company.
Registrar & Transfer Agents
M/s. Adroit Corporate Services Private Limited19, Jaferbhoy Industrial Estate, 1st Floor, Makwana Road, Marol Naka, Andheri (E), Mumbai – 400 059, MaharashtraContact Person: Mr. Pratap Pujare Phone No.+91 22 4227 0423 Email Address: [email protected]
Share transfer system
The shares of the Company are tradable compulsorily in demat mode.Physical share transfers are attended on a regular basis and the Company Secretary is authorized to approve such transfers.
Address for correspondence
Mr. Preetham Hebbar Company SecretarySequent Scientific LimitedCorporate Office,Star -I , Opp IIM – B, Bilekahalli, Bannerghatta Road, Bangalore – 560 076, KarnatakaPhone No. +91 80 6784 0338Email: [email protected]
Corporate Governance Report
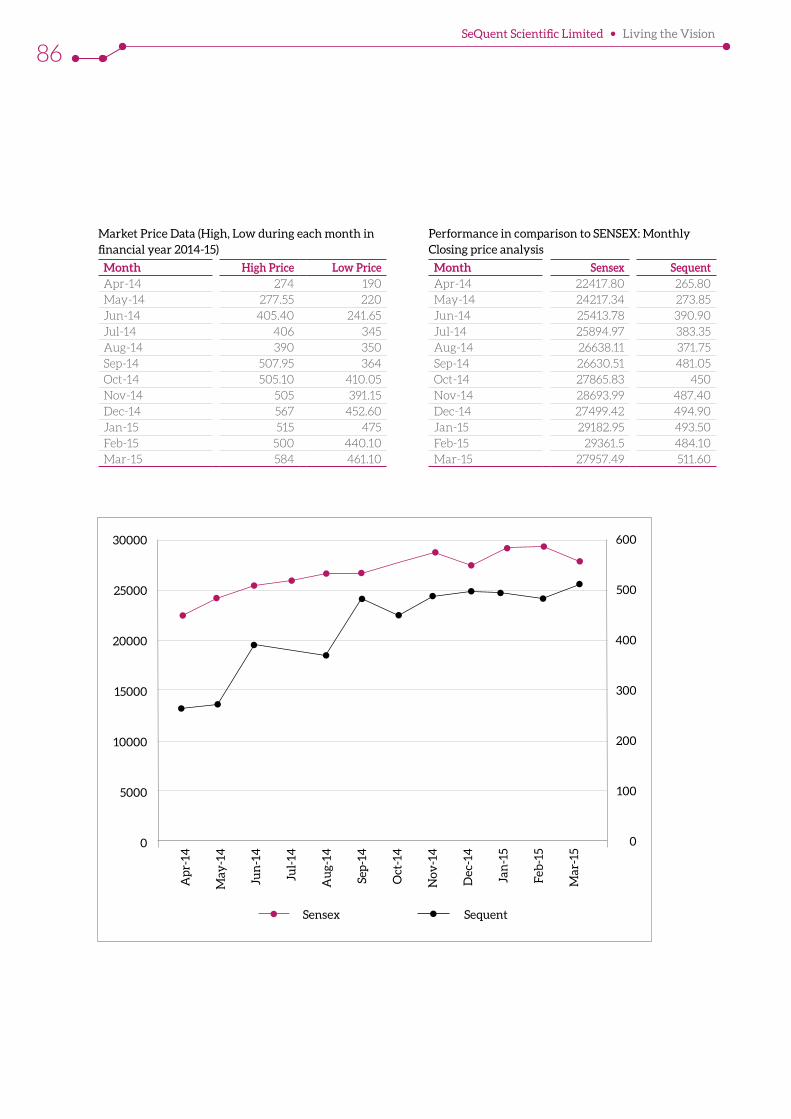
SeQuent Scientific Limited Living the Vision
86
Market Price Data (High, Low during each month in financial year 2014-15)
Month High Price Low PriceApr-14 274 190May-14 277.55 220Jun-14 405.40 241.65Jul-14 406 345Aug-14 390 350Sep-14 507.95 364Oct-14 505.10 410.05Nov-14 505 391.15Dec-14 567 452.60Jan-15 515 475Feb-15 500 440.10Mar-15 584 461.10
Performance in comparison to SENSEX: Monthly Closing price analysis
Month Sensex SequentApr-14 22417.80 265.80May-14 24217.34 273.85Jun-14 25413.78 390.90Jul-14 25894.97 383.35Aug-14 26638.11 371.75Sep-14 26630.51 481.05Oct-14 27865.83 450Nov-14 28693.99 487.40Dec-14 27499.42 494.90Jan-15 29182.95 493.50Feb-15 29361.5 484.10Mar-15 27957.49 511.60
SequentSensex
30000
25000
20000
15000
10000
5000
0
600
500
400
300
200
100
0
Ap
r-14
May
-14
Jun
-14
Jul-
14
Au
g-14
Sep
-14
Oct
-14
Nov
-14
Dec
-14
Jan
-15
Feb
-15
Mar
-15
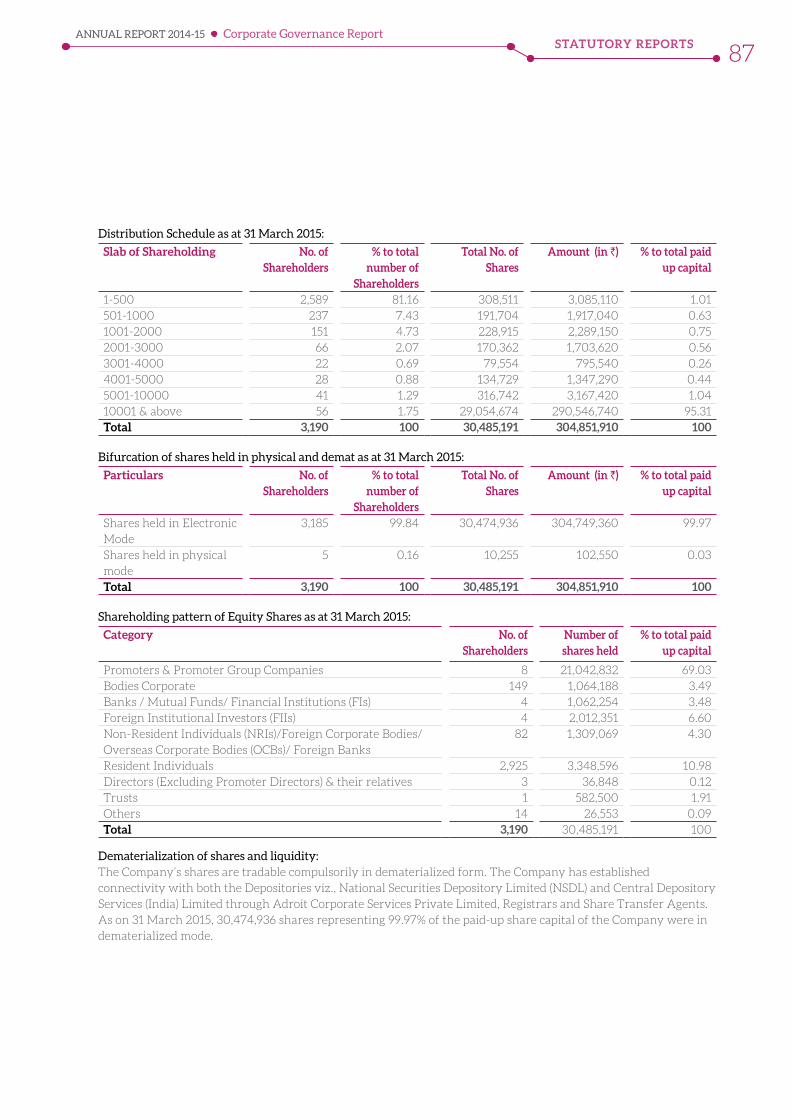
STATUTORY REPORTSANNUAL REPORT 2014-15
87
Distribution Schedule as at 31 March 2015:
Slab of Shareholding No. of Shareholders
% to total number of
Shareholders
Total No. of Shares
Amount (in `) % to total paid up capital
1-500 2,589 81.16 308,511 3,085,110 1.01501-1000 237 7.43 191,704 1,917,040 0.631001-2000 151 4.73 228,915 2,289,150 0.752001-3000 66 2.07 170,362 1,703,620 0.563001-4000 22 0.69 79,554 795,540 0.264001-5000 28 0.88 134,729 1,347,290 0.445001-10000 41 1.29 316,742 3,167,420 1.0410001 & above 56 1.75 29,054,674 290,546,740 95.31Total 3,190 100 30,485,191 304,851,910 100
Bifurcation of shares held in physical and demat as at 31 March 2015:
Particulars No. of Shareholders
% to total number of
Shareholders
Total No. of Shares
Amount (in `) % to total paid up capital
Shares held in Electronic Mode
3,185 99.84 30,474,936 304,749,360 99.97
Shares held in physical mode
5 0.16 10,255 102,550 0.03
Total 3,190 100 30,485,191 304,851,910 100
Shareholding pattern of Equity Shares as at 31 March 2015:
Category No. of Shareholders
Number of shares held
% to total paid up capital
Promoters & Promoter Group Companies 8 21,042,832 69.03Bodies Corporate 149 1,064,188 3.49Banks / Mutual Funds/ Financial Institutions (FIs) 4 1,062,254 3.48Foreign Institutional Investors (FIIs) 4 2,012,351 6.60Non-Resident Individuals (NRIs)/Foreign Corporate Bodies/Overseas Corporate Bodies (OCBs)/ Foreign Banks
82 1,309,069 4.30
Resident Individuals 2,925 3,348,596 10.98Directors (Excluding Promoter Directors) & their relatives 3 36,848 0.12Trusts 1 582,500 1.91Others 14 26,553 0.09Total 3,190 30,485,191 100
Dematerialization of shares and liquidity: The Company’s shares are tradable compulsorily in dematerialized form. The Company has established
connectivity with both the Depositories viz., National Securities Depository Limited (NSDL) and Central Depository Services (India) Limited through Adroit Corporate Services Private Limited, Registrars and Share Transfer Agents. As on 31 March 2015, 30,474,936 shares representing 99.97% of the paid-up share capital of the Company were in dematerialized mode.
Corporate Governance Report
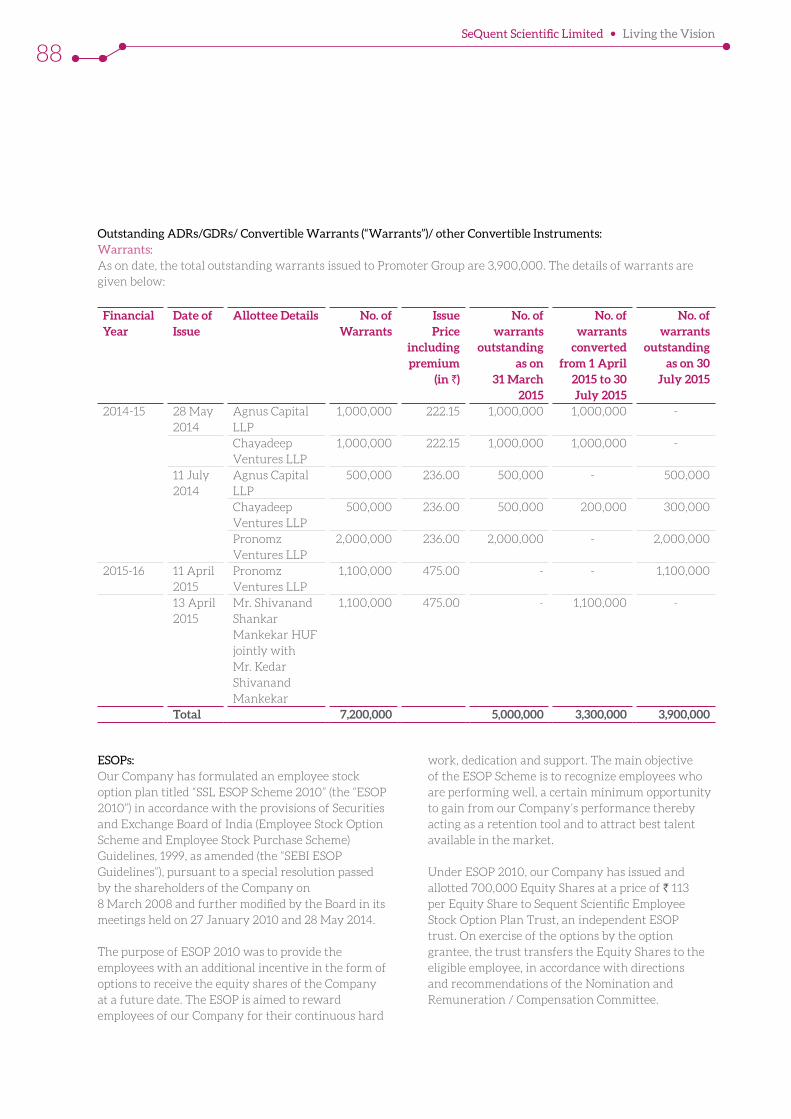
SeQuent Scientific Limited Living the Vision
88
Outstanding ADRs/GDRs/ Convertible Warrants (“Warrants”)/ other Convertible Instruments: Warrants: As on date, the total outstanding warrants issued to Promoter Group are 3,900,000. The details of warrants are
given below:
Financial Year
Date of Issue
Allottee Details No. of Warrants
Issue Price
including premium
(in `)
No. of warrants
outstanding as on
31 March 2015
No. of warrants
converted from 1 April
2015 to 30 July 2015
No. of warrants
outstanding as on 30
July 2015
2014-15 28 May 2014
Agnus Capital LLP
1,000,000 222.15 1,000,000 1,000,000 -
Chayadeep Ventures LLP
1,000,000 222.15 1,000,000 1,000,000 -
11 July 2014
Agnus Capital LLP
500,000 236.00 500,000 - 500,000
Chayadeep Ventures LLP
500,000 236.00 500,000 200,000 300,000
Pronomz Ventures LLP
2,000,000 236.00 2,000,000 - 2,000,000
2015-16 11 April 2015
Pronomz Ventures LLP
1,100,000 475.00 - - 1,100,000
13 April 2015
Mr. Shivanand Shankar Mankekar HUF jointly with Mr. Kedar Shivanand Mankekar
1,100,000 475.00 - 1,100,000 -
Total 7,200,000 5,000,000 3,300,000 3,900,000
ESOPs: Our Company has formulated an employee stock option plan titled “SSL ESOP Scheme 2010” (the “ESOP 2010”) in accordance with the provisions of Securities and Exchange Board of India (Employee Stock Option Scheme and Employee Stock Purchase Scheme) Guidelines, 1999, as amended (the “SEBI ESOP Guidelines”), pursuant to a special resolution passed by the shareholders of the Company on 8 March 2008 and further modified by the Board in its meetings held on 27 January 2010 and 28 May 2014.
The purpose of ESOP 2010 was to provide the employees with an additional incentive in the form of options to receive the equity shares of the Company at a future date. The ESOP is aimed to reward employees of our Company for their continuous hard
work, dedication and support. The main objective of the ESOP Scheme is to recognize employees who are performing well, a certain minimum opportunity to gain from our Company’s performance thereby acting as a retention tool and to attract best talent available in the market.
Under ESOP 2010, our Company has issued and allotted 700,000 Equity Shares at a price of ` 113 per Equity Share to Sequent Scientific Employee Stock Option Plan Trust, an independent ESOP trust. On exercise of the options by the option grantee, the trust transfers the Equity Shares to the eligible employee, in accordance with directions and recommendations of the Nomination and Remuneration / Compensation Committee.
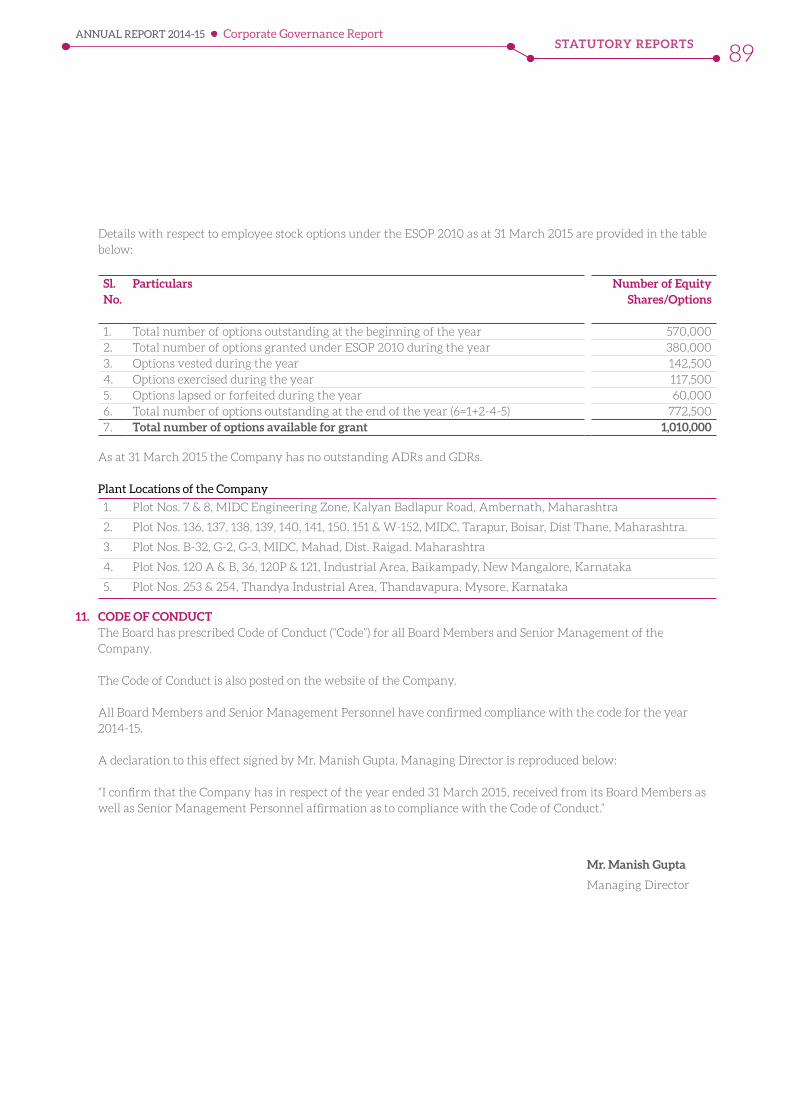
STATUTORY REPORTSANNUAL REPORT 2014-15
89
Details with respect to employee stock options under the ESOP 2010 as at 31 March 2015 are provided in the table below:
Sl. No.
Particulars Number of Equity Shares/Options
1. Total number of options outstanding at the beginning of the year 570,0002. Total number of options granted under ESOP 2010 during the year 380,0003. Options vested during the year 142,5004. Options exercised during the year 117,5005. Options lapsed or forfeited during the year 60,0006. Total number of options outstanding at the end of the year (6=1+2-4-5) 772,5007. Total number of options available for grant 1,010,000
As at 31 March 2015 the Company has no outstanding ADRs and GDRs.
Plant Locations of the Company
1. Plot Nos. 7 & 8, MIDC Engineering Zone, Kalyan Badlapur Road, Ambernath, Maharashtra
2. Plot Nos. 136, 137, 138, 139, 140, 141, 150, 151 & W-152, MIDC, Tarapur, Boisar, Dist Thane, Maharashtra.
3. Plot Nos. B-32, G-2, G-3, MIDC, Mahad, Dist. Raigad. Maharashtra
4. Plot Nos. 120 A & B, 36, 120P & 121, Industrial Area, Baikampady, New Mangalore, Karnataka
5. Plot Nos. 253 & 254, Thandya Industrial Area, Thandavapura, Mysore, Karnataka
11. CODE OF CONDUCT The Board has prescribed Code of Conduct (“Code”) for all Board Members and Senior Management of the
Company.
The Code of Conduct is also posted on the website of the Company.
All Board Members and Senior Management Personnel have confirmed compliance with the code for the year 2014-15.
A declaration to this effect signed by Mr. Manish Gupta, Managing Director is reproduced below:
“I confirm that the Company has in respect of the year ended 31 March 2015, received from its Board Members as well as Senior Management Personnel affirmation as to compliance with the Code of Conduct.”
Mr. Manish Gupta
Managing Director
Corporate Governance Report
SeQuent Scientific Limited Living the Vision
90
TO THE MEMBERS OF SEQUENT SCIENTIFIC LIMITED
We have examined the compliance of conditions of corporate governance by Sequent Scientific Limited (“the Company”) for the year ended on 31 March 2015, as stipulated in Clause 49 of the Listing Agreement of the said Company with the stock exchange.
The compliance of conditions of Corporate Governance is the responsibility of the management. Our examination has been limited to a review of the procedures and implementations thereof, adopted by the Company for ensuring compliance with the conditions of Corporate Governance. It is neither an audit nor an expression of opinion of the financial statements of the Company.
In our opinion and to the best of our information and according to the explanations given to us, and the representations made by the Directors and the management, we certify that the Company has complied with the conditions of Corporate Governance as stipulated in clause 49 of the above-mentioned Listing Agreement. We further state that such compliance is neither an assurance as to the future viability of the Company nor the efficiency or effectiveness with which the management has conducted the affairs of the Company.
For DELOITTE HASKINS & SELLS
Chartered Accountants
(Firm’s Registration No. 008072S)
V. Srikumar
Place: Bangalore Partner
Date: 30 July 2015 (Membership No. 84494)
ANNUAL REPORT 2014-15
91Standalone
92 Independent Auditors’ Report
96 Balance Sheet
97 Statement of Profit and Loss
98 Cash Flow Statement
100 Notes
121 Independent Auditors’ Report
126 Balance Sheet
127 Statement of Profit and Loss
128 Cash Flow Statement
130 Notes
Financial Statements
Standalone Financials
Consolidated Financials
SeQuent Scientific Limited Living the Vision
92
Independent Auditors’ Report
To The Members of Sequent Scientific Limited
REPORT ON THE STANDALONE FINANCIAL STATEMENTS We have audited the accompanying standalone financial statements of SEQUENT SCIENTIFIC LIMITED (“the Company”), which comprise the Balance Sheet as at March 31, 2015, the Statement of Profit and Loss and the Cash Flow Statement for the year ended March 31, 2015 and a summary of the significant accounting policies and other explanatory information.
MANAGEMENT’S RESPONSIBILITY FOR THE STANDALONE FINANCIAL STATEMENTSThe Company’s Board of Directors is responsible for the matters stated in Section 134(5) of the Companies Act, 2013 (“the Act”) with respect to the preparation of these standalone financial statements that give a true and fair view of the financial position, financial performance and cash flows of the Company in accordance with the accounting principles generally accepted in India, including the Accounting Standards specified under Section 133 of the Act, read with Rule 7 of the Companies (Accounts) Rules, 2014. This responsibility also includes maintenance of adequate accounting records in accordance with the provisions of the Act for safeguarding of the assets of the Company and for preventing and detecting frauds and other irregularities; selection and application of appropriate accounting policies; making judgments and estimates that are reasonable and prudent; and design, implementation and maintenance of adequate internal financial controls, that were operating effectively for ensuring the accuracy and completeness of the accounting records, relevant to the preparation and presentation of the financial statements that give a true and fair view and are free from material misstatement, whether due to fraud or error.
AUDITORS’ RESPONSIBILITYOur responsibility is to express an opinion on these standalone financial statements based on our audit.
We have taken into account the provisions of the Act, the accounting and auditing standards and matters which are required to be included in the audit report under the provisions of the Act and the Rules made thereunder.
We conducted our audit in accordance with the Standards on Auditing specified under Section 143(10) of the Act. Those Standards require that we comply with ethical requirements and plan and perform the audit to
obtain reasonable assurance about whether the financial statements are free from material misstatement.
An audit involves performing procedures to obtain audit evidence about the amounts and the disclosures in the financial statements. The procedures selected depend on the auditor’s judgment, including the assessment of the risks of material misstatement of the financial statements, whether due to fraud or error. In making those risk assessments, the auditor considers internal financial control relevant to the Company’s preparation of the financial statements that give a true and fair view in order to design audit procedures that are appropriate in the circumstances, but not for the purpose of expressing an opinion on whether the Company has in place an adequate internal financial controls system over financial reporting and the operating effectiveness of such controls. An audit also includes evaluating the appropriateness of the accounting policies used and the reasonableness of the accounting estimates made by the Company’s Directors, as well as evaluating the overall presentation of the financial statements.
We believe that the audit evidence we have obtained is sufficient and appropriate to provide a basis for our audit opinion on the standalone financial statements.
OPINIONIn our opinion and to the best of our information and according to the explanations given to us, the aforesaid standalone financial statements give the information required by the Act in the manner so required and give a true and fair view in conformity with the accounting principles generally accepted in India, of the state of affairs of the Company as at March 31, 2015, and its profit and its cash flows for the year ended on that date.
REPORT ON OTHER LEGAL AND REGULATORY REQUIREMENTS1. As required by the Companies (Auditor’s Report)
Order, 2015 (“the Order”) issued by the Central Government in terms of Section 143(11) of the Act, we give in the Annexure a statement on the matters specified in paragraphs 3 and 4 of the Order.
2. As required by Section 143 (3) of the Act, we report that:
(a) We have sought and obtained all the information and explanations which to the best of our knowledge and belief were necessary for the purposes of our audit.
FINANCIAL STATEMENTSANNUAL REPORT 2014-15
93Standalone
(b) In our opinion, proper books of account as required by law have been kept by the Company so far as it appears from our examination of those books.
(c) The Balance Sheet, the Statement of Profit and Loss, and the Cash Flow Statement dealt with by this Report are in agreement with the books of account.
(d) In our opinion, the aforesaid standalone financial statements comply with the Accounting Standards specified under Section 133 of the Act, read with Rule 7 of the Companies (Accounts) Rules, 2014.
(e) On the basis of the written representations received from the directors as on March 31, 2015 taken on record by the Board of Directors, none of the directors is disqualified as on March 31, 2015 from being appointed as a director in terms of Section 164 (2) of the Act.
(f) With respect to the other matters to be included in the Auditor’s Report in accordance with Rule 11 of the Companies (Audit and Auditors) Rules, 2014, in our opinion and to the best of our
Independent Auditors’ Report
information and according to the explanations given to us:
(i) The Company has disclosed the impact of pending litigations on its financial position in the financial statements. Refer note 27.2(i) of the financial statements;
(ii) The Company did not have any long-term contracts including derivative contracts for which there were any material foreseeable losses; and
(iii) There has been no delay in transferring amounts, required to be transferred, to the Investor Education and Protection Fund by the Company.
For Deloitte Haskins & Sells
Chartered Accountants(Firm’s Registration No. 008072S)
V. Srikumar
Partner(Membership No. 84494)
Bangalore, April 24, 2015
SeQuent Scientific Limited Living the Vision
94
(i) In respect of its fixed assets:
(a) The Company has maintained proper records showing full particulars, including quantitative details and situation of fixed assets.
(b) The fixed assets were physically verified during the previous year by the Management in accordance with a regular programme of verification which, in our opinion, provides for physical verification of all the fixed assets at reasonable intervals. According to the information and explanations given to us, no material discrepancies were noted on such verification.
(ii) In respect of its inventory (a) As explained to us, the inventories were
physically verified during the year by the Management at reasonable intervals.
(b) In our opinion and according to the information and explanations given to us, the procedures of physical verification of inventories followed by the Management were reasonable and adequate in relation to the size of the Company and the nature of its business.
(c) In our opinion and according to the information and explanations given to us, the Company has maintained proper records of its inventories and no material discrepancies were noticed on physical verification.
(iii) According to the information and explanations given to us, the Company has granted loans, secured or unsecured, to companies, firms or other parties covered in the Register maintained under Section 189 of the Companies Act, 2013. In respect of such loans:
(a) The receipts of principal amounts and interest have been regular.
(b) There is no overdue amount in excess of ` 1 lakh remaining outstanding as at the year-end.
(iv) In our opinion and according to the information and explanations given to us, having regard to the
Annexure to the Independent Auditors’ Report(Referred to in paragraph 1 under ‘Report on Other Legal and Regulatory Requirements’ section of our report of even date)
explanations that some of the items purchased are of special nature and suitable alternative sources are not readily available for obtaining comparable quotations, there is an adequate internal control system commensurate with the size of the Company and the nature of its business with regard to purchases of inventory and fixed assets and for the sale of goods and services. During the course of our audit, we have not observed any major weakness in such internal control system.
(v) According to the information and explanations given to us, the Company has not accepted any deposit during the year.
(vi) We have broadly reviewed the cost records maintained by the Company pursuant to the Companies (Cost Records and Audit) Rules, 2014, as amended and prescribed by the Central Government under sub-section (1) of Section 148 of the Companies Act, 2013, and are of the opinion that, prima facie, the prescribed cost records have been made and maintained. We have, however, not made a detailed examination of the cost records with a view to determine whether they are accurate or complete.
(vii) According to the information and explanations given to us, in respect of statutory dues:
(a) The Company has generally been regular in depositing undisputed statutory dues, including Provident Fund, Employees State Insurance, Income tax, Sales Tax, Wealth Tax, Service Tax, Customs Duty, Excise Duty, Value Added Tax, Cess and other material statutory dues applicable to it with the appropriate authorities.
(b) There were no undisputed amounts payable in respect of Provident Fund, Employees State Insurance, Income tax, Sales Tax, Wealth Tax, Service Tax, Customs Duty, Excise Duty, Value Added Tax, Cess and other material statutory dues in arrears as at March 31, 2015 for a period of more than six months from the date they became payable.
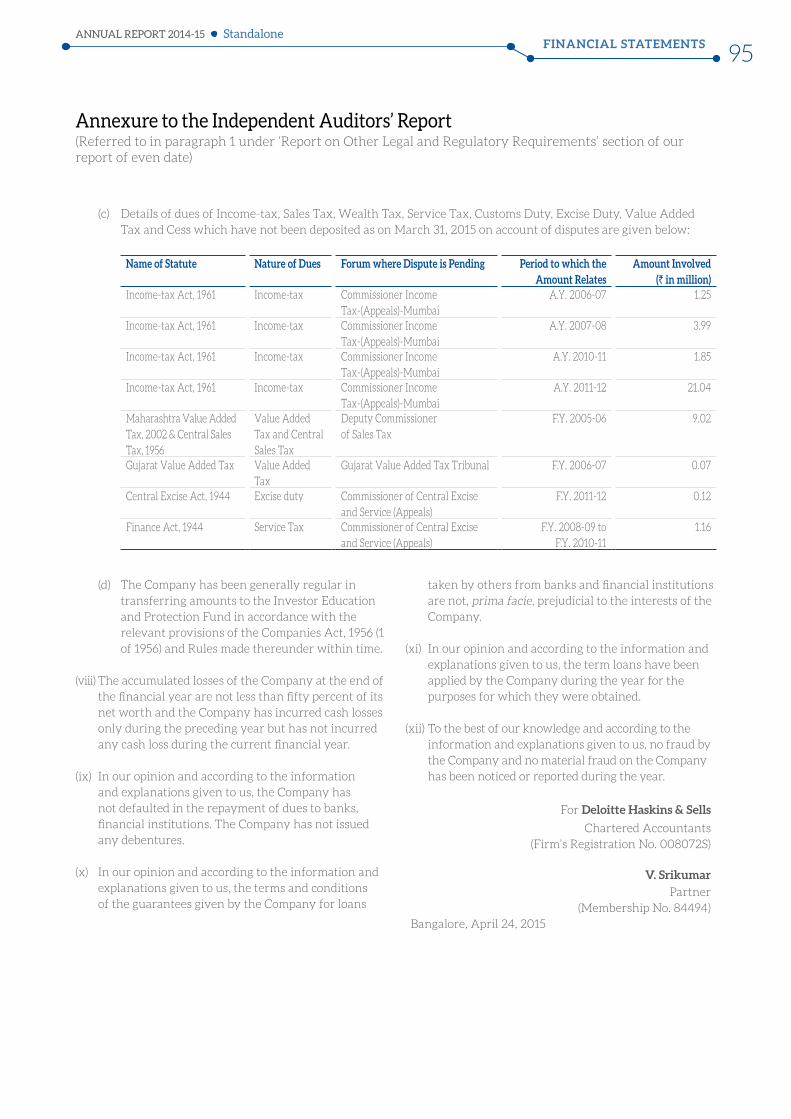
FINANCIAL STATEMENTSANNUAL REPORT 2014-15
95Standalone
Annexure to the Independent Auditors’ Report(Referred to in paragraph 1 under ‘Report on Other Legal and Regulatory Requirements’ section of our report of even date)
(c) Details of dues of Income-tax, Sales Tax, Wealth Tax, Service Tax, Customs Duty, Excise Duty, Value Added Tax and Cess which have not been deposited as on March 31, 2015 on account of disputes are given below:
Name of Statute Nature of Dues Forum where Dispute is Pending Period to which the Amount Relates
Amount Involved (` in million)
Income-tax Act, 1961 Income-tax Commissioner Income Tax-(Appeals)-Mumbai
A.Y. 2006-07 1.25
Income-tax Act, 1961 Income-tax Commissioner Income Tax-(Appeals)-Mumbai
A.Y. 2007-08 3.99
Income-tax Act, 1961 Income-tax Commissioner Income Tax-(Appeals)-Mumbai
A.Y. 2010-11 1.85
Income-tax Act, 1961 Income-tax Commissioner Income Tax-(Appeals)-Mumbai
A.Y. 2011-12 21.04
Maharashtra Value Added Tax, 2002 & Central Sales Tax, 1956
Value Added Tax and Central Sales Tax
Deputy Commissioner of Sales Tax
F.Y. 2005-06 9.02
Gujarat Value Added Tax Value Added Tax
Gujarat Value Added Tax Tribunal F.Y. 2006-07 0.07
Central Excise Act, 1944 Excise duty Commissioner of Central Excise and Service (Appeals)
F.Y. 2011-12 0.12
Finance Act, 1944 Service Tax Commissioner of Central Excise and Service (Appeals)
F.Y. 2008-09 to F.Y. 2010-11
1.16
(d) The Company has been generally regular in transferring amounts to the Investor Education and Protection Fund in accordance with the relevant provisions of the Companies Act, 1956 (1 of 1956) and Rules made thereunder within time.
(viii) The accumulated losses of the Company at the end of the financial year are not less than fifty percent of its net worth and the Company has incurred cash losses only during the preceding year but has not incurred any cash loss during the current financial year.
(ix) In our opinion and according to the information and explanations given to us, the Company has not defaulted in the repayment of dues to banks, financial institutions. The Company has not issued any debentures.
(x) In our opinion and according to the information and explanations given to us, the terms and conditions of the guarantees given by the Company for loans
taken by others from banks and financial institutions are not, prima facie, prejudicial to the interests of the Company.
(xi) In our opinion and according to the information and explanations given to us, the term loans have been applied by the Company during the year for the purposes for which they were obtained.
(xii) To the best of our knowledge and according to the information and explanations given to us, no fraud by the Company and no material fraud on the Company has been noticed or reported during the year.
For Deloitte Haskins & Sells
Chartered Accountants(Firm’s Registration No. 008072S)
V. Srikumar
Partner(Membership No. 84494)
Bangalore, April 24, 2015
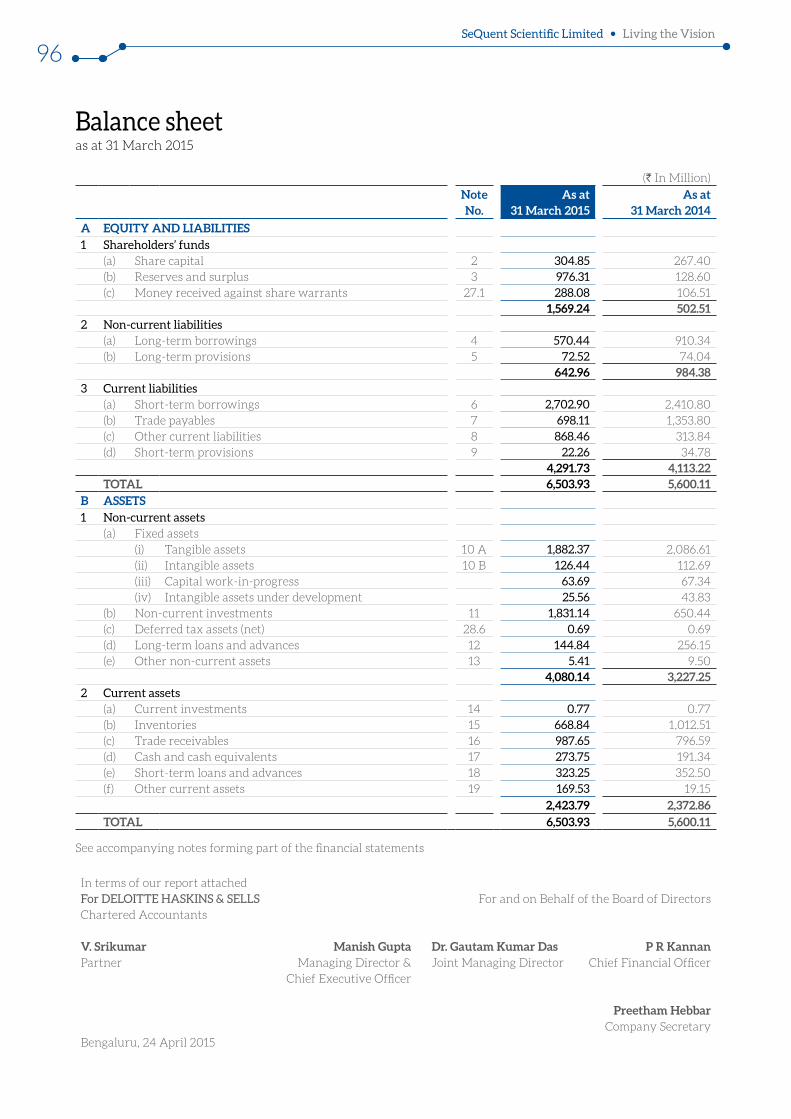
SeQuent Scientific Limited Living the Vision
96
(` In Million)
Note No.
As at 31 March 2015
As at 31 March 2014
A EQUITY AND LIABILITIES1 Shareholders’ funds
(a) Share capital 2 304.85 267.40 (b) Reserves and surplus 3 976.31 128.60 (c) Money received against share warrants 27.1 288.08 106.51
1,569.24 502.51 2 Non-current liabilities
(a) Long-term borrowings 4 570.44 910.34 (b) Long-term provisions 5 72.52 74.04
642.96 984.38 3 Current liabilities
(a) Short-term borrowings 6 2,702.90 2,410.80 (b) Trade payables 7 698.11 1,353.80 (c) Other current liabilities 8 868.46 313.84 (d) Short-term provisions 9 22.26 34.78
4,291.73 4,113.22 TOTAL 6,503.93 5,600.11
B ASSETS1 Non-current assets
(a) Fixed assets(i) Tangible assets 10 A 1,882.37 2,086.61 (ii) Intangible assets 10 B 126.44 112.69 (iii) Capital work-in-progress 63.69 67.34 (iv) Intangible assets under development 25.56 43.83
(b) Non-current investments 11 1,831.14 650.44 (c) Deferred tax assets (net) 28.6 0.69 0.69 (d) Long-term loans and advances 12 144.84 256.15 (e) Other non-current assets 13 5.41 9.50
4,080.14 3,227.25 2 Current assets
(a) Current investments 14 0.77 0.77 (b) Inventories 15 668.84 1,012.51 (c) Trade receivables 16 987.65 796.59 (d) Cash and cash equivalents 17 273.75 191.34 (e) Short-term loans and advances 18 323.25 352.50 (f) Other current assets 19 169.53 19.15
2,423.79 2,372.86 TOTAL 6,503.93 5,600.11
See accompanying notes forming part of the financial statements
In terms of our report attached For DELOITTE HASKINS & SELLS For and on Behalf of the Board of Directors Chartered Accountants
V. Srikumar Manish Gupta Dr. Gautam Kumar Das P R KannanPartner Managing Director &
Chief Executive OfficerJoint Managing Director Chief Financial Officer
Preetham HebbarCompany Secretary
Bengaluru, 24 April 2015
Balance sheetas at 31 March 2015
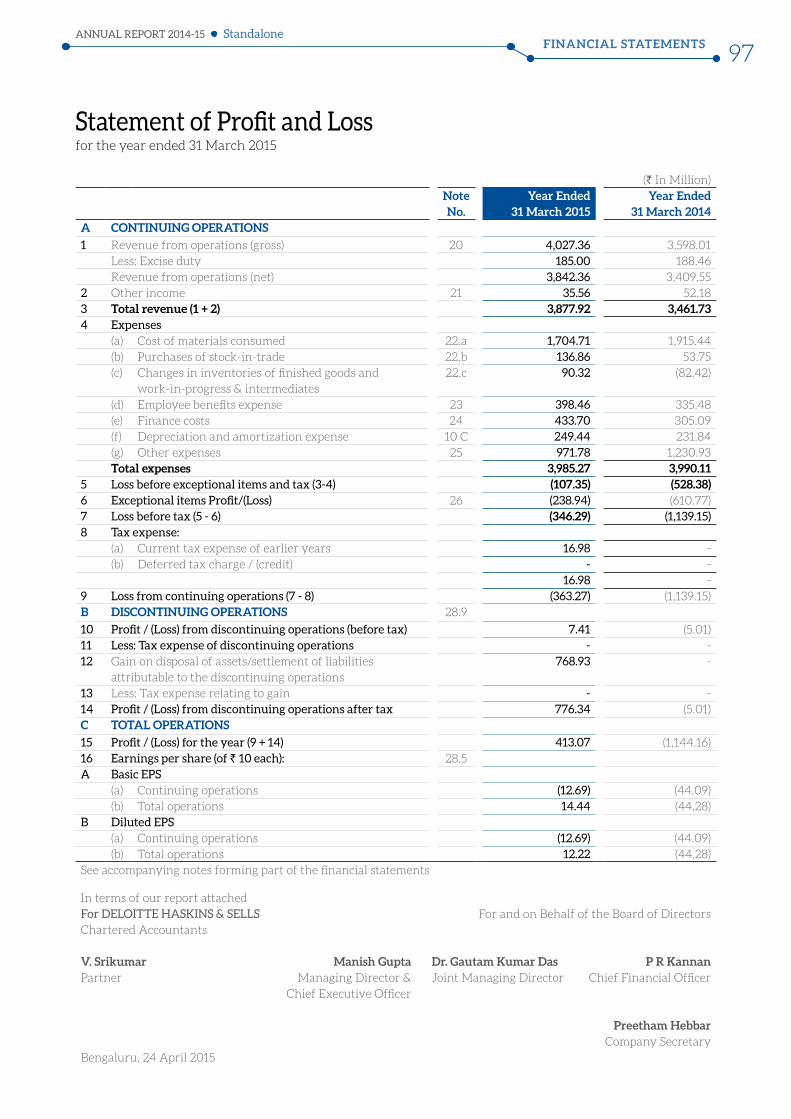
FINANCIAL STATEMENTSANNUAL REPORT 2014-15
97Standalone
In terms of our report attached For DELOITTE HASKINS & SELLS For and on Behalf of the Board of Directors Chartered Accountants
V. Srikumar Manish Gupta Dr. Gautam Kumar Das P R KannanPartner Managing Director &
Chief Executive OfficerJoint Managing Director Chief Financial Officer
Preetham HebbarCompany Secretary
Bengaluru, 24 April 2015
Statement of Profit and Lossfor the year ended 31 March 2015
(` In Million)Note No.
Year Ended 31 March 2015
Year Ended 31 March 2014
A CONTINUING OPERATIONS
1 Revenue from operations (gross) 20 4,027.36 3,598.01 Less: Excise duty 185.00 188.46 Revenue from operations (net) 3,842.36 3,409.55
2 Other income 21 35.56 52.18 3 Total revenue (1 + 2) 3,877.92 3,461.73 4 Expenses
(a) Cost of materials consumed 22.a 1,704.71 1,915.44 (b) Purchases of stock-in-trade 22.b 136.86 53.75 (c) Changes in inventories of finished goods and
work-in-progress & intermediates22.c 90.32 (82.42)
(d) Employee benefits expense 23 398.46 335.48 (e) Finance costs 24 433.70 305.09 (f) Depreciation and amortization expense 10 C 249.44 231.84 (g) Other expenses 25 971.78 1,230.93 Total expenses 3,985.27 3,990.11
5 Loss before exceptional items and tax (3-4) (107.35) (528.38)6 Exceptional items Profit/(Loss) 26 (238.94) (610.77)7 Loss before tax (5 - 6) (346.29) (1,139.15)8 Tax expense:
(a) Current tax expense of earlier years 16.98 - (b) Deferred tax charge / (credit) - -
16.98 -9 Loss from continuing operations (7 - 8) (363.27) (1,139.15)B DISCONTINUING OPERATIONS 28.9
10 Profit / (Loss) from discontinuing operations (before tax) 7.41 (5.01)11 Less: Tax expense of discontinuing operations - - 12 Gain on disposal of assets/settlement of liabilities
attributable to the discontinuing operations 768.93 -
13 Less: Tax expense relating to gain - - 14 Profit / (Loss) from discontinuing operations after tax 776.34 (5.01)C TOTAL OPERATIONS
15 Profit / (Loss) for the year (9 + 14) 413.07 (1,144.16)16 Earnings per share (of ` 10 each): 28.5A Basic EPS
(a) Continuing operations (12.69) (44.09)(b) Total operations 14.44 (44.28)
B Diluted EPS(a) Continuing operations (12.69) (44.09)(b) Total operations 12.22 (44.28)
See accompanying notes forming part of the financial statements
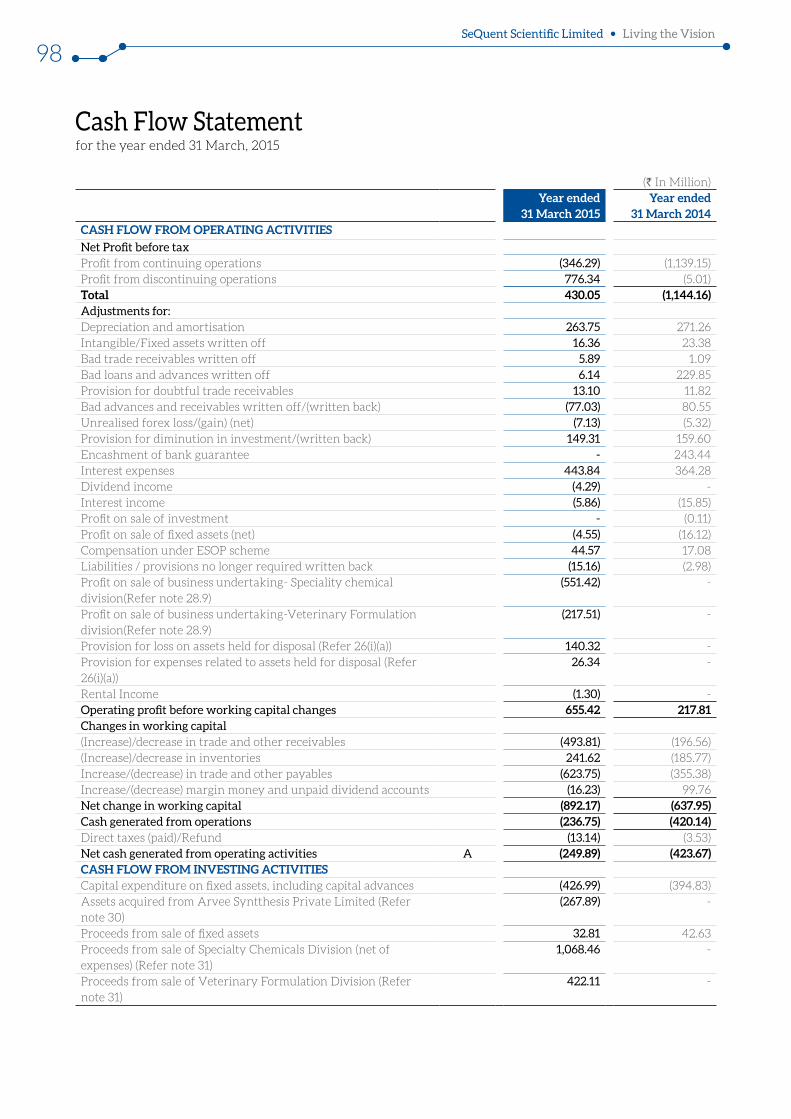
SeQuent Scientific Limited Living the Vision
98
Cash Flow Statementfor the year ended 31 March, 2015
(` In Million)Year ended
31 March 2015Year ended
31 March 2014CASH FLOW FROM OPERATING ACTIVITIES
Net Profit before tax Profit from continuing operations (346.29) (1,139.15)Profit from discontinuing operations 776.34 (5.01)Total 430.05 (1,144.16)Adjustments for:Depreciation and amortisation 263.75 271.26 Intangible/Fixed assets written off 16.36 23.38 Bad trade receivables written off 5.89 1.09 Bad loans and advances written off 6.14 229.85 Provision for doubtful trade receivables 13.10 11.82 Bad advances and receivables written off/(written back) (77.03) 80.55 Unrealised forex loss/(gain) (net) (7.13) (5.32)Provision for diminution in investment/(written back) 149.31 159.60 Encashment of bank guarantee - 243.44 Interest expenses 443.84 364.28 Dividend income (4.29) - Interest income (5.86) (15.85)Profit on sale of investment - (0.11)Profit on sale of fixed assets (net) (4.55) (16.12)Compensation under ESOP scheme 44.57 17.08 Liabilities / provisions no longer required written back (15.16) (2.98)Profit on sale of business undertaking- Speciality chemical division(Refer note 28.9)
(551.42) -
Profit on sale of business undertaking-Veterinary Formulation division(Refer note 28.9)
(217.51) -
Provision for loss on assets held for disposal (Refer 26(i)(a)) 140.32 - Provision for expenses related to assets held for disposal (Refer 26(i)(a))
26.34 -
Rental Income (1.30) - Operating profit before working capital changes 655.42 217.81 Changes in working capital(Increase)/decrease in trade and other receivables (493.81) (196.56)(Increase)/decrease in inventories 241.62 (185.77)Increase/(decrease) in trade and other payables (623.75) (355.38)Increase/(decrease) margin money and unpaid dividend accounts (16.23) 99.76 Net change in working capital (892.17) (637.95)Cash generated from operations (236.75) (420.14)Direct taxes (paid)/Refund (13.14) (3.53)Net cash generated from operating activities A (249.89) (423.67)CASH FLOW FROM INVESTING ACTIVITIESCapital expenditure on fixed assets, including capital advances (426.99) (394.83)Assets acquired from Arvee Syntthesis Private Limited (Refer note 30)
(267.89) -
Proceeds from sale of fixed assets 32.81 42.63 Proceeds from sale of Specialty Chemicals Division (net of expenses) (Refer note 31)
1,068.46 -
Proceeds from sale of Veterinary Formulation Division (Refer note 31)
422.11 -
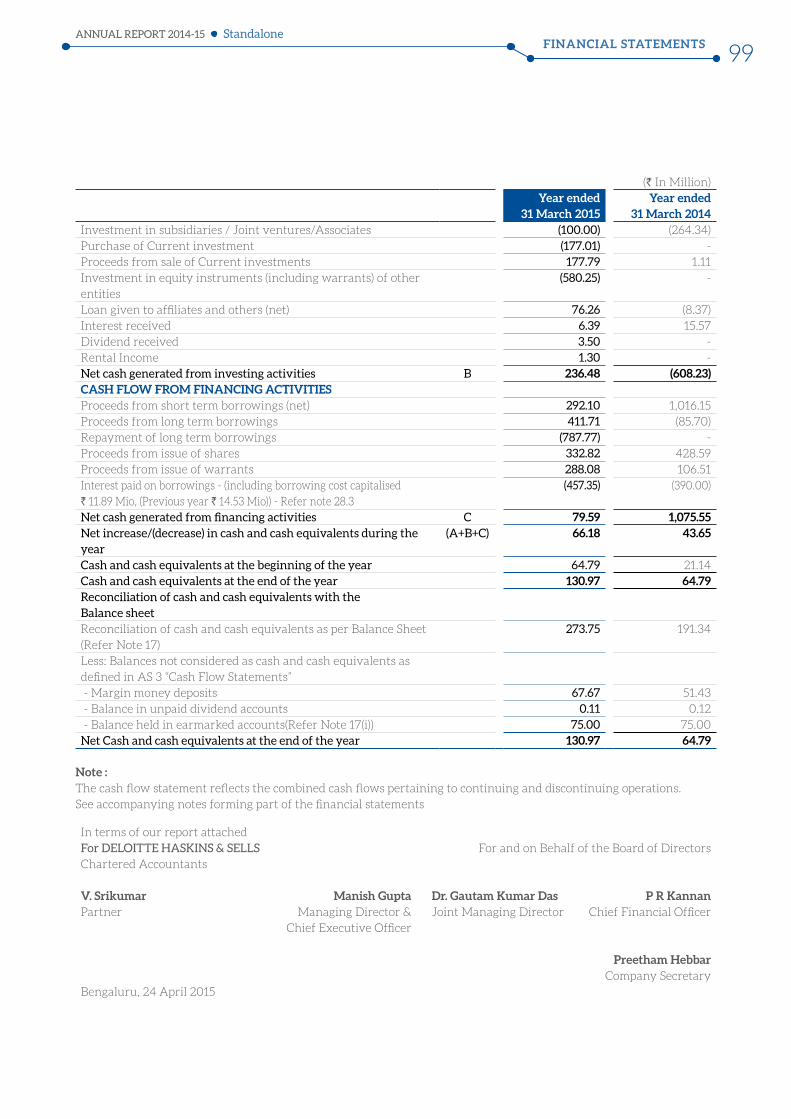
FINANCIAL STATEMENTSANNUAL REPORT 2014-15
99Standalone
(` In Million)Year ended
31 March 2015Year ended
31 March 2014Investment in subsidiaries / Joint ventures/Associates (100.00) (264.34)Purchase of Current investment (177.01) - Proceeds from sale of Current investments 177.79 1.11 Investment in equity instruments (including warrants) of other entities
(580.25) -
Loan given to affiliates and others (net) 76.26 (8.37)Interest received 6.39 15.57 Dividend received 3.50 - Rental Income 1.30 - Net cash generated from investing activities B 236.48 (608.23)CASH FLOW FROM FINANCING ACTIVITIESProceeds from short term borrowings (net) 292.10 1,016.15 Proceeds from long term borrowings 411.71 (85.70)Repayment of long term borrowings (787.77) - Proceeds from issue of shares 332.82 428.59 Proceeds from issue of warrants 288.08 106.51 Interest paid on borrowings - (including borrowing cost capitalised ` 11.89 Mio, (Previous year ` 14.53 Mio)) - Refer note 28.3
(457.35) (390.00)
Net cash generated from financing activities C 79.59 1,075.55 Net increase/(decrease) in cash and cash equivalents during the year
(A+B+C) 66.18 43.65
Cash and cash equivalents at the beginning of the year 64.79 21.14 Cash and cash equivalents at the end of the year 130.97 64.79 Reconciliation of cash and cash equivalents with the Balance sheetReconciliation of cash and cash equivalents as per Balance Sheet (Refer Note 17)
273.75 191.34
Less: Balances not considered as cash and cash equivalents as defined in AS 3 “Cash Flow Statements” - Margin money deposits 67.67 51.43 - Balance in unpaid dividend accounts 0.11 0.12 - Balance held in earmarked accounts(Refer Note 17(i)) 75.00 75.00 Net Cash and cash equivalents at the end of the year 130.97 64.79
Note :The cash flow statement reflects the combined cash flows pertaining to continuing and discontinuing operations. See accompanying notes forming part of the financial statements
In terms of our report attached For DELOITTE HASKINS & SELLS For and on Behalf of the Board of Directors Chartered Accountants
V. Srikumar Manish Gupta Dr. Gautam Kumar Das P R KannanPartner Managing Director &
Chief Executive OfficerJoint Managing Director Chief Financial Officer
Preetham HebbarCompany Secretary
Bengaluru, 24 April 2015
Notes forming part of the financial statements
SeQuent Scientific Limited Living the Vision
100
Note
1 SIGNIFICANT ACCOUNTING POLICIES 1.1 Basis of accounting and preparation of financial statements The financial statements of SeQuent Scientific Limited (‘the
Company’) have been prepared, in accordance with Generally Accepted Accounting principles in India (Indian GAAP), to comply with the Accounting Standards specified under Section 133 of the Companies Act, 2013, read with Rule 7 of the Companies (Accounts) Rules, 2014 and the relevant provisions of the Companies Act, 2013 (“the 2013 Act”) / Companies Act, 1956 (“the 1956 Act”), as applicable except for certain assets and liabilities which are measured on fair value basis as permitted by the Scheme of Arrangement approved by the Honorable High Court of Karnataka and the relevant provisions of the Companies Act, 2013. The Financial Statements have been prepared on accrual basis under the historical cost convention except for certain categories of fixed assets that are carried at revalued amounts. The accounting policies adopted in the preparation of the financial statements are consistent with those followed in the previous year.
1.2 Tangible fixed assets Fixed assets are carried at cost less accumulated depreciation and
impairment losses, if any. The cost of fixed assets includes interest on borrowings attributable to acquisition of qualifying fixed assets up to the date the asset is ready for its intended use and other incidental expenses incurred up to that date. Exchange differences arising on restatement / settlement of long-term foreign currency borrowings relating to acquisition of depreciable fixed assets are adjusted to the cost of the respective assets and depreciated over the remaining useful life of such assets. Subsequent expenditure relating to fixed assets is capitalised only if such expenditure results in an increase in the future benefits from such asset beyond its previously assessed standard of performance. Fixed assets retired from active use and held for disposal are stated at the lower of their net book value and net realisable value and are disclosed separately
Capital work-in-progress: Projects under which assets are not ready for their intended use and
other capital work-in-progress are carried at cost, comprising direct cost, related incidental expenses and attributable interest.
1.3 Intangible assets Intangible assets are carried at cost less accumulated amortisation
and impairment losses, if any. The cost of an intangible assets comprises its purchase price, including any import duties and other taxes (other than those subsequently recoverable from the taxing authorities), and any directly attributable expenditure on making the asset ready for its intended use and net of any trade discounts and rebates. Subsequent expenditure on an intangible assets after its purchase / completion is recognised as an expense when incurred unless it is probable that such expenditure will enable the asset to generate future economic benefits in excess of its originally assessed standards of performance and such expenditure can be measured and attributed to the asset reliably, in which case such expenditure is added to the cost of the asset. Refer Note 1.5 for accounting for research and development expenses.
1.4 Depreciation/amortisation Depreciation is provided under the straight-line method as per the
useful life prescribed in Schedule II to the Companies Act, 2013 except in respect of the following categories of assets, in whose case the life of the assets has been assessed as under based on technical advice, taking into account the nature of the asset, the estimated usage of the asset, the operating conditions of the asset, past history of replacement, anticipated technological changes, manufacturers warranties and maintenance support, etc.
Nature of the assets Useful life in years
Buildings 10 - 28
Plant and Machinery 5 - 12
Leasehold land 85 - 96
Leasehold property development
Over lease period
In the case of following intangible assets depreciation is provided/amortised under the straight line method over the useful life of assets as follows: Product and process development : 5 Years Acquired Software : 3 Years The estimated useful life of the intangible assets and its amortisation period are reviewed at the end of each financial year and the amortisation method is revised to reflect the changed pattern.
With respect to assets carried at revalued amounts as permitted under the Scheme of amalgamation, depreciation is recorded under the straight line method over the balance remaining useful life of the assets.
1.5 Research and development costs Revenue expenditure pertaining to research is charged to the
Statement of Profit and Loss. Development costs of products are also charged to the Statement of Profit and Loss unless a product’s technological feasibility has been established, in which case such expenditure is capitalised. The amount capitalised comprises expenditure that can be directly attributed or allocated on a reasonable and consistent basis to creating, producing and making the asset ready for its intended use. Fixed assets utilised for research and development are capitalised and depreciated in accordance with the policies stated for tangible fixed assets and intangible assets.
1.6 Impairment of assets As at each Balance Sheet date, the carrying amount of fixed assets is
tested for impairment if impairment conditions exist. An impairment loss is recognized when the carrying amount of an asset exceeds its recoverable amount. Recoverable amount is determined:
(a) in the case of an individual asset, at the higher of the net selling price and value in use.
(b) in the case of cash generating units, at the higher of the unit’s net selling price and the value in use.
Value in use is determined as the present value of estimated future cash flows from the continuing use of an asset and from its disposal at the end of its useful life.”
1.7 Investments Current investments are carried at lower of cost and fair market
value. Provision is made to recognize decline, if any, in the carrying value.
Long-term investments are carried individually at cost less provision for diminution, other than temporary in the value of the investment.
1.8 Inventory Inventories comprise raw materials, packing materials, consumables,
work in process, intermediates and finished goods. These are valued at the lower of cost and net realizable value. Cost is determined on First in First out basis as follows:
(i) Raw materials, packing materials and consumables At purchase cost including other cost incurred in bringing
materials/consumables to their present location and condition
(ii) Work in process and Intermediates At material cost, conversion costs and appropriate share of
production overheads
Notes forming part of the financial statements
FINANCIAL STATEMENTSANNUAL REPORT 2014-15
101Standalone
(iii) Finished goods At material cost, conversion costs and an appropriate share of
production overheads and excise duty, wherever applicable.
1.9 Revenue recognition Revenue from export sales is recognized when significant risks and
rewards of ownership is transferred on the basis of the shipping bills for exports. Revenue from domestic sales is recognized based on the transfer of significant risks and rewards of ownership which generally coincides with dispatch. Sales include excise duty and are stated net of discounts, other taxes, and sales returns.
Income from sale of technical know-how is recognized, when the risk and right to use is transferred to the buyer as per terms of contract.
Income from technical service and other management fees is recognized when the services are completed as per the terms of the agreement and when no significant uncertainty as to its determination or realization exists.
Dividend income is recognised when the right to receive the same is established.
Interest income is recognised on an accrual basis.
Export incentives are accrued for based on fulfilment of eligibility criteria for availing the incentives and when there is no uncertainty in receiving the same.
1.10 Employee benefits Short term employee benefits like provident fund, medical, leave
travel, employee state insurance scheme etc., are accrued based on the terms of employment when services are rendered by the employees and charged as an expense to the statement of profit and loss.
Leave balances standing to the credit of the employees that are expected to be availed in the short term are provided for on full cost basis. Liability for unavailed leave considered to be long term is carried based on an actuarial valuation carried out at the end of financial year.
Liability for gratuity is funded with LIC and SBI Life Insurance Company Limited. Gratuity expenses for the year are accounted based on actuarial valuation carried out using Projected Unit Credit Method as at the end of the fiscal year. The obligation recognised in the balance sheet represents the present value of the defined benefit obligation as adjusted for unrecognized past service cost, and as reduced by the fair value of scheme assets. Any asset resulting from this calculation is limited to past service cost, plus the present value of available refunds and reductions in future contributions to the scheme.
1.11 Foreign currency transactions Initial recognition Transactions in foreign currencies entered into by the Company
and its integral foreign operations are accounted at the exchange rates prevailing on the date of the transaction or at rates that closely approximate the rate at the date of the transaction.
Measurement of foreign currency monetary items at the Balance Sheet date
Foreign currency monetary items of the Company and its net investment in non-integral foreign operations outstanding at the Balance Sheet date are restated at the year-end rates. In the case of integral operations, monetary assets and monetary liabilities, are translated at the exchange rate prevailing on the balance sheet date. Non-monetary items are carried at historical cost. Revenue and expense are translated at the average exchange rates prevailing during the year. Exchange differences arising out of these translations are charged to the statement of profit and loss.
Treatment of exchange differences Exchange differences arising on settlement / restatement of
short-term foreign currency monetary assets and liabilities of the Company and its integral foreign operations are recognised as income or expense in the statement of profit and loss. The exchange differences on restatement / settlement of loans to non-integral foreign operations that are considered as net investment in such operations are accumulated in a Foreign currency translation reserve until disposal / recovery of the net investment. The exchange differences arising on restatement / settlement of long-term foreign currency monetary items are capitalised as part of the depreciable fixed assets to which the monetary item relates and depreciated over the remaining useful life of such assets.
Accounting of forward contracts Premium / discount on forward exchange contracts, which are not
intended for trading or speculation purposes, are amortised over the period of the contracts if such contracts relate to monetary items as at the Balance Sheet date.
1.12 Taxes on income Income Tax comprises the current tax provision and the net change
in the deferred tax asset or liability during the year. Deferred tax assets and liabilities are recognized for the future tax consequences arising out of temporary differences between the carrying values of the assets and liabilities and their respective tax bases. Deferred tax assets and liabilities are measured using enacted tax rates applicable on the Balance Sheet date. Deferred tax assets are recognised for timing differences of items other than unabsorbed depreciation and carry forward losses only to the extent that reasonable certainty exists that sufficient future taxable income will be available against which these can be realised. However, if there are unabsorbed depreciation and carry forward of losses, deferred tax assets are recognised only if there is virtual certainty that there will be sufficient future taxable income available to realise the assets. Deferred tax assets and liabilities are offset if such items relate to taxes on income levied by the same governing tax laws and the Company has a legally enforceable right for such set off. Deferred tax assets are reviewed at each balance sheet date for their reliability. Current tax is the amount of tax payable on the taxable income for the year as determined in accordance with the provisions of the Indian Income Tax Act, 1961. Minimum alternative tax (‘MAT’) paid in accordance to the tax laws, which gives rise to future economic benefits in the form of adjustment of future tax liability, is considered as an asset if there is convincing evidence that the Company will pay normal income tax in future years. Accordingly, MAT is recognized as an assets in the balance sheet when it is probable that the future economic benefit associated with it will flow to the Company and asset can be measured reliably.
1.13 Leases Lease arrangements, where the risks and rewards incident to
ownership of an asset substantially vest with the lessor, are classified as operating leases and the lease rentals thereon are recognised in the statement of profit and loss on straight line basis.
1.14 Employee stock option scheme Employee stock options are accounted in accordance with the
guidelines stipulated by SEBI and Guidance Note on Accounting for Employee Share-based Payments. The difference between the closing market price of the shares underlying the options granted on the date of grant of option and the option price is expensed under employee benefit expenses over the vesting period.
1.15 Earnings per share (EPS) In determining the Earnings per share, the Company considers
the net profit after tax. The number of shares used in computing
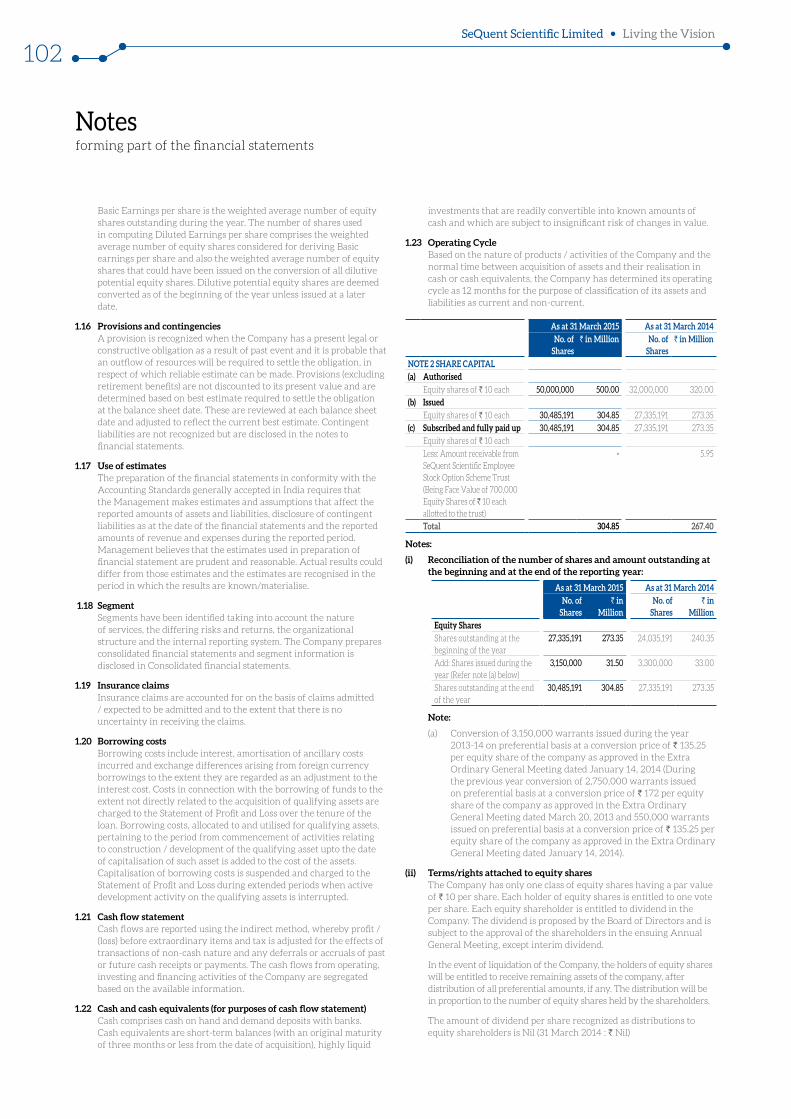
Notes forming part of the financial statements
SeQuent Scientific Limited Living the Vision
102
Basic Earnings per share is the weighted average number of equity shares outstanding during the year. The number of shares used in computing Diluted Earnings per share comprises the weighted average number of equity shares considered for deriving Basic earnings per share and also the weighted average number of equity shares that could have been issued on the conversion of all dilutive potential equity shares. Dilutive potential equity shares are deemed converted as of the beginning of the year unless issued at a later date.
1.16 Provisions and contingencies A provision is recognized when the Company has a present legal or
constructive obligation as a result of past event and it is probable that an outflow of resources will be required to settle the obligation, in respect of which reliable estimate can be made. Provisions (excluding retirement benefits) are not discounted to its present value and are determined based on best estimate required to settle the obligation at the balance sheet date. These are reviewed at each balance sheet date and adjusted to reflect the current best estimate. Contingent liabilities are not recognized but are disclosed in the notes to financial statements.
1.17 Use of estimates The preparation of the financial statements in conformity with the
Accounting Standards generally accepted in India requires that the Management makes estimates and assumptions that affect the reported amounts of assets and liabilities, disclosure of contingent liabilities as at the date of the financial statements and the reported amounts of revenue and expenses during the reported period. Management believes that the estimates used in preparation of financial statement are prudent and reasonable. Actual results could differ from those estimates and the estimates are recognised in the period in which the results are known/materialise.
1.18 Segment Segments have been identified taking into account the nature
of services, the differing risks and returns, the organizational structure and the internal reporting system. The Company prepares consolidated financial statements and segment information is disclosed in Consolidated financial statements.
1.19 Insurance claims Insurance claims are accounted for on the basis of claims admitted
/ expected to be admitted and to the extent that there is no uncertainty in receiving the claims.
1.20 Borrowing costs Borrowing costs include interest, amortisation of ancillary costs
incurred and exchange differences arising from foreign currency borrowings to the extent they are regarded as an adjustment to the interest cost. Costs in connection with the borrowing of funds to the extent not directly related to the acquisition of qualifying assets are charged to the Statement of Profit and Loss over the tenure of the loan. Borrowing costs, allocated to and utilised for qualifying assets, pertaining to the period from commencement of activities relating to construction / development of the qualifying asset upto the date of capitalisation of such asset is added to the cost of the assets. Capitalisation of borrowing costs is suspended and charged to the Statement of Profit and Loss during extended periods when active development activity on the qualifying assets is interrupted.
1.21 Cash flow statement Cash flows are reported using the indirect method, whereby profit /
(loss) before extraordinary items and tax is adjusted for the effects of transactions of non-cash nature and any deferrals or accruals of past or future cash receipts or payments. The cash flows from operating, investing and financing activities of the Company are segregated based on the available information.
1.22 Cash and cash equivalents (for purposes of cash flow statement) Cash comprises cash on hand and demand deposits with banks.
Cash equivalents are short-term balances (with an original maturity of three months or less from the date of acquisition), highly liquid
investments that are readily convertible into known amounts of cash and which are subject to insignificant risk of changes in value.
1.23 Operating Cycle Based on the nature of products / activities of the Company and the
normal time between acquisition of assets and their realisation in cash or cash equivalents, the Company has determined its operating cycle as 12 months for the purpose of classification of its assets and liabilities as current and non-current.
As at 31 March 2015 As at 31 March 2014 No. of
Shares` in Million No. of
Shares` in Million
NOTE 2 SHARE CAPITAL(a) Authorised
Equity shares of ` 10 each 50,000,000 500.00 32,000,000 320.00
(b) IssuedEquity shares of ` 10 each 30,485,191 304.85 27,335,191 273.35
(c) Subscribed and fully paid up 30,485,191 304.85 27,335,191 273.35
Equity shares of ` 10 each
Less: Amount receivable from SeQuent Scientific Employee Stock Option Scheme Trust (Being Face Value of 700,000 Equity Shares of ` 10 each allotted to the trust)
- 5.95
Total 304.85 267.40
Notes:
(i) Reconciliation of the number of shares and amount outstanding at the beginning and at the end of the reporting year:
As at 31 March 2015 As at 31 March 2014No. of
Shares` in
MillionNo. of
Shares` in
MillionEquity SharesShares outstanding at the beginning of the year
27,335,191 273.35 24,035,191 240.35
Add: Shares issued during the year (Refer note (a) below)
3,150,000 31.50 3,300,000 33.00
Shares outstanding at the end of the year
30,485,191 304.85 27,335,191 273.35
Note:
(a) Conversion of 3,150,000 warrants issued during the year 2013-14 on preferential basis at a conversion price of ` 135.25 per equity share of the company as approved in the Extra Ordinary General Meeting dated January 14, 2014 (During the previous year conversion of 2,750,000 warrants issued on preferential basis at a conversion price of ` 172 per equity share of the company as approved in the Extra Ordinary General Meeting dated March 20, 2013 and 550,000 warrants issued on preferential basis at a conversion price of ` 135.25 per equity share of the company as approved in the Extra Ordinary General Meeting dated January 14, 2014).
(ii) Terms/rights attached to equity shares The Company has only one class of equity shares having a par value
of ` 10 per share. Each holder of equity shares is entitled to one vote per share. Each equity shareholder is entitled to dividend in the Company. The dividend is proposed by the Board of Directors and is subject to the approval of the shareholders in the ensuing Annual General Meeting, except interim dividend.
In the event of liquidation of the Company, the holders of equity shares will be entitled to receive remaining assets of the company, after distribution of all preferential amounts, if any. The distribution will be in proportion to the number of equity shares held by the shareholders.
The amount of dividend per share recognized as distributions to equity shareholders is Nil (31 March 2014 : ` Nil)
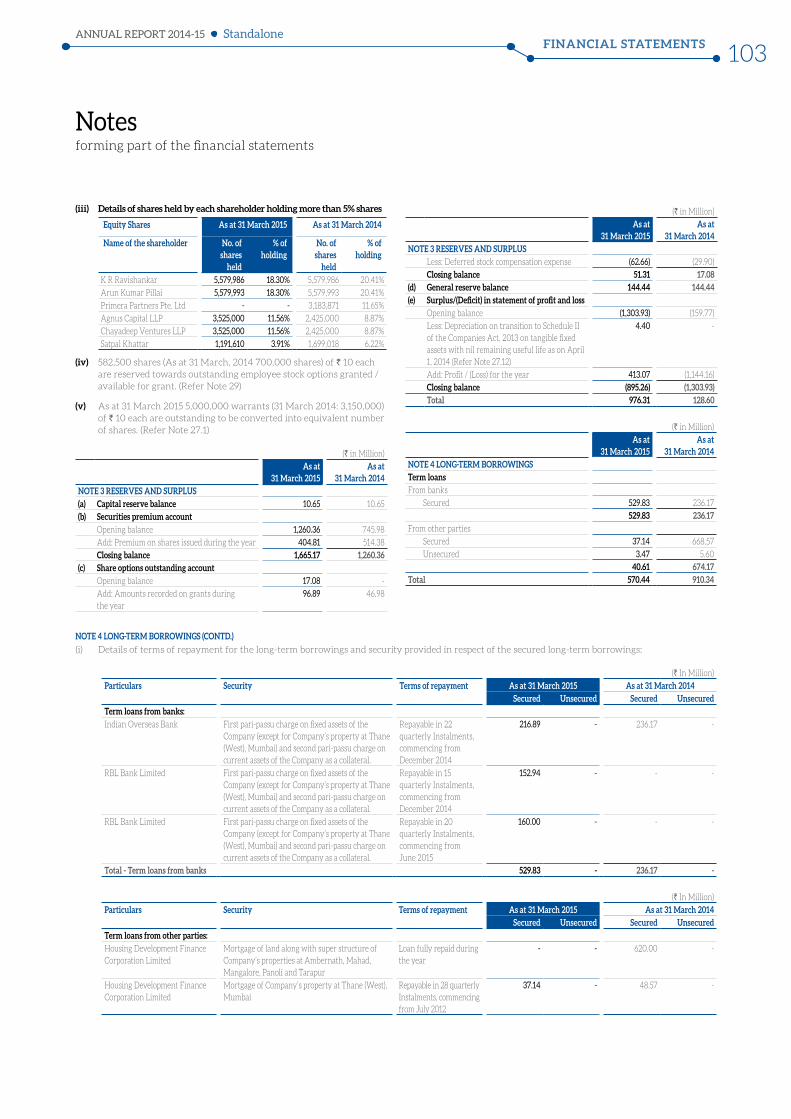
Notes forming part of the financial statements
FINANCIAL STATEMENTSANNUAL REPORT 2014-15
103Standalone
(iii) Details of shares held by each shareholder holding more than 5% shares
Equity Shares As at 31 March 2015 As at 31 March 2014
Name of the shareholder No. of shares
held
% of holding
No. of shares
held
% of holding
K R Ravishankar 5,579,986 18.30% 5,579,986 20.41%
Arun Kumar Pillai 5,579,993 18.30% 5,579,993 20.41%
Primera Partners Pte. Ltd - - 3,183,871 11.65%
Agnus Capital LLP 3,525,000 11.56% 2,425,000 8.87%
Chayadeep Ventures LLP 3,525,000 11.56% 2,425,000 8.87%
Satpal Khattar 1,191,610 3.91% 1,699,018 6.22%
(iv) 582,500 shares (As at 31 March, 2014 700,000 shares) of ` 10 each are reserved towards outstanding employee stock options granted / available for grant. (Refer Note 29)
(v) As at 31 March 2015 5,000,000 warrants (31 March 2014: 3,150,000) of ` 10 each are outstanding to be converted into equivalent number of shares. (Refer Note 27.1)
(` in Million)
As at 31 March 2015
As at 31 March 2014
NOTE 3 RESERVES AND SURPLUS (a) Capital reserve balance 10.65 10.65
(b) Securities premium accountOpening balance 1,260.36 745.98
Add: Premium on shares issued during the year 404.81 514.38
Closing balance 1,665.17 1,260.36 (c) Share options outstanding account
Opening balance 17.08 -
Add: Amounts recorded on grants during the year
96.89 46.98
(` in Million)
As at 31 March 2015
As at 31 March 2014
NOTE 3 RESERVES AND SURPLUS Less: Deferred stock compensation expense (62.66) (29.90)
Closing balance 51.31 17.08 (d) General reserve balance 144.44 144.44 (e) Surplus/(Deficit) in statement of profit and loss
Opening balance (1,303.93) (159.77)
Less: Depreciation on transition to Schedule II of the Companies Act, 2013 on tangible fixed assets with nil remaining useful life as on April 1, 2014 (Refer Note 27.12)
4.40 -
Add: Profit / (Loss) for the year 413.07 (1,144.16)
Closing balance (895.26) (1,303.93)Total 976.31 128.60
(` in Million)
As at 31 March 2015
As at 31 March 2014
NOTE 4 LONG-TERM BORROWINGSTerm loans From banks
Secured 529.83 236.17
529.83 236.17From other parties
Secured 37.14 668.57
Unsecured 3.47 5.60
40.61 674.17 Total 570.44 910.34
NOTE 4 LONG-TERM BORROWINGS (CONTD.)
(i) Details of terms of repayment for the long-term borrowings and security provided in respect of the secured long-term borrowings:
(` In Million)
Particulars Security Terms of repayment As at 31 March 2015 As at 31 March 2014Secured Unsecured Secured Unsecured
Term loans from banks:Indian Overseas Bank First pari-passu charge on fixed assets of the
Company (except for Company’s property at Thane (West), Mumbai) and second pari-passu charge on current assets of the Company as a collateral.
Repayable in 22 quarterly Instalments, commencing from December 2014
216.89 - 236.17 -
RBL Bank Limited First pari-passu charge on fixed assets of the Company (except for Company’s property at Thane (West), Mumbai) and second pari-passu charge on current assets of the Company as a collateral.
Repayable in 15 quarterly Instalments, commencing from December 2014
152.94 - - -
RBL Bank Limited First pari-passu charge on fixed assets of the Company (except for Company’s property at Thane (West), Mumbai) and second pari-passu charge on current assets of the Company as a collateral.
Repayable in 20 quarterly Instalments, commencing from June 2015
160.00 - - -
Total - Term loans from banks 529.83 - 236.17 -
(` In Million)
Particulars Security Terms of repayment As at 31 March 2015 As at 31 March 2014Secured Unsecured Secured Unsecured
Term loans from other parties:Housing Development Finance Corporation Limited
Mortgage of land along with super structure of Company’s properties at Ambernath, Mahad, Mangalore, Panoli and Tarapur
Loan fully repaid during the year
- - 620.00 -
Housing Development Finance Corporation Limited
Mortgage of Company’s property at Thane (West), Mumbai
Repayable in 28 quarterly Instalments, commencing from July 2012
37.14 - 48.57 -
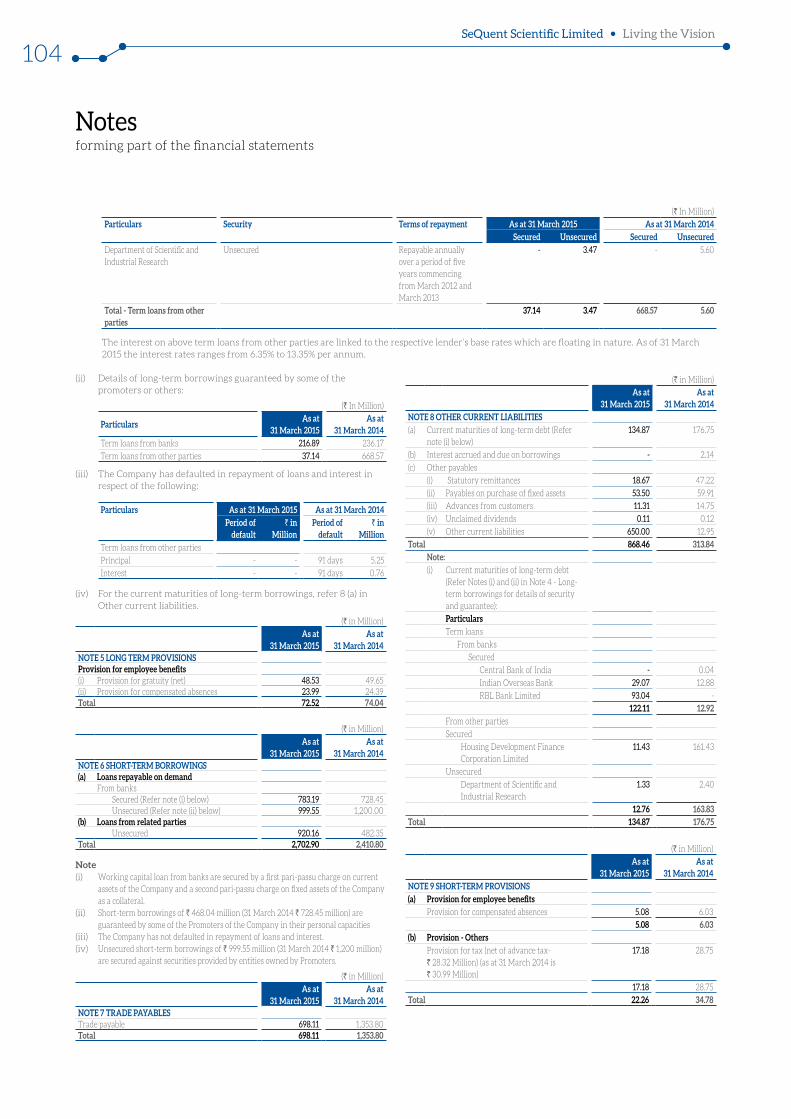
Notes forming part of the financial statements
SeQuent Scientific Limited Living the Vision
104
(` In Million)
Particulars Security Terms of repayment As at 31 March 2015 As at 31 March 2014Secured Unsecured Secured Unsecured
Department of Scientific and Industrial Research
Unsecured Repayable annually over a period of five years commencing from March 2012 and March 2013
- 3.47 - 5.60
Total - Term loans from other parties
37.14 3.47 668.57 5.60
The interest on above term loans from other parties are linked to the respective lender’s base rates which are floating in nature. As of 31 March 2015 the interest rates ranges from 6.35% to 13.35% per annum.
(ii) Details of long-term borrowings guaranteed by some of the promoters or others:
(` In Million)
Particulars As at
31 March 2015 As at
31 March 2014 Term loans from banks 216.89 236.17
Term loans from other parties 37.14 668.57
(iii) The Company has defaulted in repayment of loans and interest in respect of the following:
Particulars As at 31 March 2015 As at 31 March 2014Period of
default` in
MillionPeriod of
default ` in
Million Term loans from other parties
Principal - - 91 days 5.25
Interest - - 91 days 0.76
(iv) For the current maturities of long-term borrowings, refer 8 (a) in Other current liabilities.
(` in Million)
As at 31 March 2015
As at 31 March 2014
NOTE 5 LONG TERM PROVISIONS Provision for employee benefits (i) Provision for gratuity (net) 48.53 49.65 (ii) Provision for compensated absences 23.99 24.39 Total 72.52 74.04
(` in Million)
As at 31 March 2015
As at 31 March 2014
NOTE 6 SHORT-TERM BORROWINGS (a) Loans repayable on demand
From banksSecured (Refer note (i) below) 783.19 728.45 Unsecured (Refer note (ii) below) 999.55 1,200.00
(b) Loans from related parties Unsecured 920.16 482.35
Total 2,702.90 2,410.80
Note (i) Working capital loan from banks are secured by a first pari-passu charge on current
assets of the Company and a second pari-passu charge on fixed assets of the Company as a collateral.
(ii) Short-term borrowings of ` 468.04 million (31 March 2014 ` 728.45 million) are guaranteed by some of the Promoters of the Company in their personal capacities
(iii) The Company has not defaulted in repayment of loans and interest. (iv) Unsecured short-term borrowings of ` 999.55 million (31 March 2014 ` 1,200 million)
are secured against securities provided by entities owned by Promoters.
(` in Million)
As at 31 March 2015
As at 31 March 2014
NOTE 7 TRADE PAYABLES Trade payable 698.11 1,353.80 Total 698.11 1,353.80
(` in Million)
As at 31 March 2015
As at 31 March 2014
NOTE 8 OTHER CURRENT LIABILITIES(a) Current maturities of long-term debt (Refer
note (i) below) 134.87 176.75
(b) Interest accrued and due on borrowings - 2.14
(c) Other payables
(i) Statutory remittances 18.67 47.22
(ii) Payables on purchase of fixed assets 53.50 59.91
(iii) Advances from customers 11.31 14.75
(iv) Unclaimed dividends 0.11 0.12
(v) Other current liabilities 650.00 12.95
Total 868.46 313.84 Note:(i) Current maturities of long-term debt
(Refer Notes (i) and (ii) in Note 4 - Long-term borrowings for details of security and guarantee):
ParticularsTerm loans
From banks
Secured
Central Bank of India - 0.04
Indian Overseas Bank 29.07 12.88
RBL Bank Limited 93.04 -
122.11 12.92 From other parties
Secured
Housing Development Finance Corporation Limited
11.43 161.43
Unsecured
Department of Scientific and Industrial Research
1.33 2.40
12.76 163.83 Total 134.87 176.75
(` in Million)
As at 31 March 2015
As at 31 March 2014
NOTE 9 SHORT-TERM PROVISIONS (a) Provision for employee benefits
Provision for compensated absences 5.08 6.03
5.08 6.03 (b) Provision - Others
Provision for tax (net of advance tax- ` 28.32 Million) (as at 31 March 2014 is ` 30.99 Million)
17.18 28.75
17.18 28.75
Total 22.26 34.78
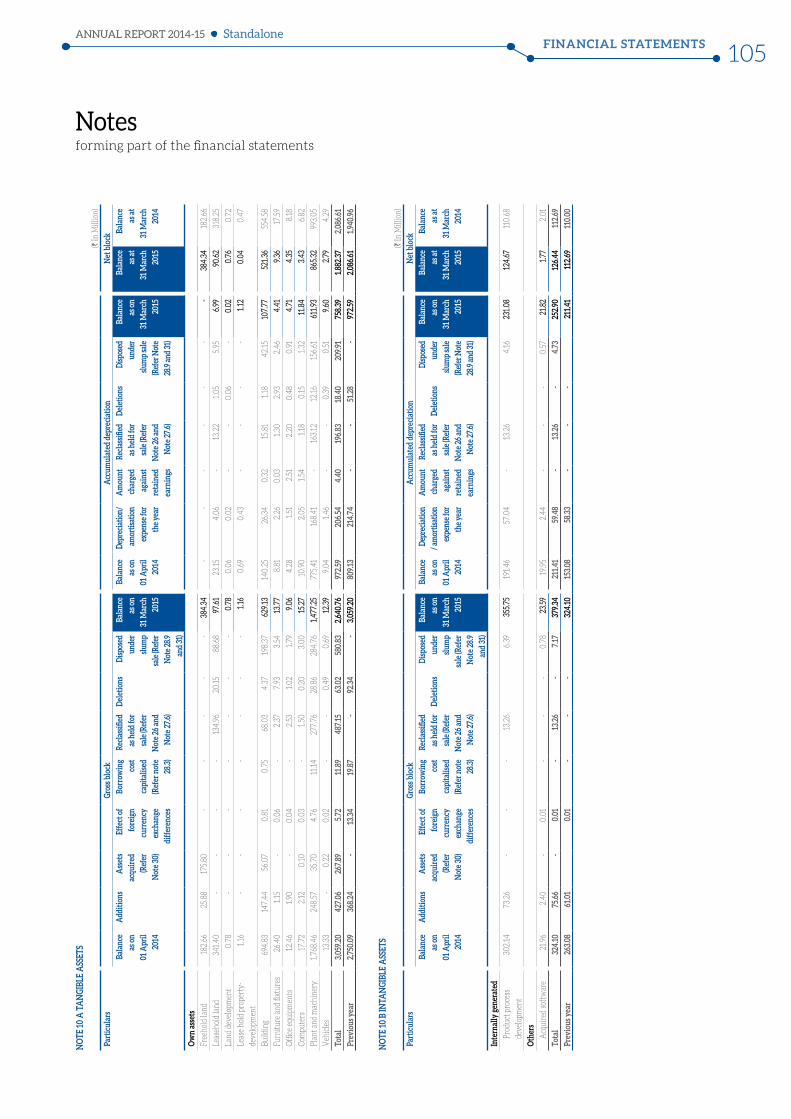
Notes forming part of the financial statements
FINANCIAL STATEMENTSANNUAL REPORT 2014-15
105Standalone
NO
TE 1
0 A
TA
NGI
BLE
ASS
ETS
(` In
Mill
ion)
Part
icul
ars
Gros
s blo
ckA
ccum
ulat
ed d
epre
ciat
ion
Net
blo
ck
Bala
nce
as o
n 01
Apr
il 20
14
Add
ition
s A
sset
s ac
quir
ed
(Ref
er
Not
e 30
)
Eff
ect o
f fo
reig
n cu
rren
cy
exch
ange
di
ffer
ence
s
Bor
row
ing
cost
ca
pita
lised
(R
efer
not
e 28
.3)
Recl
assifi
ed
as h
eld
for
sale
(Ref
er
Not
e 26
and
N
ote
27.6
)
Del
etio
ns
Disp
osed
un
der
slum
p sa
le (R
efer
N
ote 2
8.9
and
31)
Bala
nce
as o
n 31
Mar
ch
2015
Bala
nce
as o
n 01
Apr
il 20
14
Dep
reci
atio
n/
amor
tisat
ion
expe
nse f
or
the y
ear
Am
ount
ch
arge
d ag
ains
t re
tain
ed
earn
ings
Recl
assifi
ed
as h
eld
for
sale
(Ref
er
Not
e 26
and
N
ote
27.6
)
Del
etio
ns
Disp
osed
un
der
slum
p sa
le
(Ref
er N
ote
28.9
and
31)
Bala
nce
as o
n 31
Mar
ch
2015
Bala
nce
as a
t 31
Mar
ch
2015
Bala
nce
as a
t 31
Mar
ch
2014
Ow
n as
sets
Free
hold
land
1
82.6
6 2
5.88
1
75.8
0 -
- -
- -
384
.34
- -
- -
- -
- 3
84.3
4 1
82.6
6
Leas
ehol
d la
nd
341
.40
- -
- -
134
.96
20.
15
88.
68
97.
61
23.
15
4.0
6 -
13.
22
1.0
5 5
.95
6.9
9 9
0.62
3
18.2
5
Land
dev
elop
men
t 0
.78
- -
- -
- -
- 0
.78
0.0
6 0
.02
- -
0.0
6 -
0.0
2 0
.76
0.7
2
Leas
e ho
ld p
rope
rty-
deve
lopm
ent
1.1
6 -
- -
- -
- -
1.16
0
.69
0.4
3 -
- -
- 1.
12
0.0
4 0
.47
Build
ing
694
.83
147
.44
56.
07
0.8
1 0
.75
68.
03
4.3
7 1
98.3
7 6
29.13
1
40.2
5 2
6.34
0
.32
15.
81
1.1
8 4
2.15
10
7.77
5
21.3
6 5
54.5
8
Furn
iture
and
fixt
ures
26.
40
1.1
5 -
0.0
6 -
2.3
7 7
.93
3.5
4 13
.77
8.8
1 2
.26
0.0
3 1
.30
2.9
3 2
.46
4.4
1 9
.36
17.
59
Offi
ce e
quip
men
ts 1
2.46
1
.90
- 0
.04
- 2
.53
1.0
2 1
.79
9.0
6 4
.28
1.5
1 2
.51
2.2
0 0
.48
0.9
1 4
.71
4.3
5 8
.18
Com
pute
rs 1
7.72
2
.12
0.1
0 0
.03
- 1
.50
0.2
0 3
.00
15.2
7 1
0.90
2
.05
1.5
4 1
.18
0.1
5 1
.32
11.8
4 3
.43
6.8
2
Plan
t and
mac
hine
ry
1,7
68.4
6 2
48.5
7 3
5.70
4
.76
11.
14
277
.76
28.
86
284
.76
1,47
7.25
7
75.4
1 1
68.4
1 -
163
.12
12.
16
156
.61
611
.93
865
.32
993
.05
Veh
icle
s 1
3.33
-
0.2
2 0
.02
- -
0.4
9 0
.69
12.3
9 9
.04
1.4
6 -
- 0
.39
0.5
1 9
.60
2.7
9 4
.29
Tota
l 3
,059
.20
427
.06
267
.89
5.7
2 1
1.89
487
.15
63.
02
580
.83
2,6
40.7
6 9
72.5
9 2
06.5
4 4
.40
196
.83
18.
40
209
.91
758
.39
1,8
82.3
7 2
,086
.61
Prev
ious
yea
r 2
,750
.09
368
.24
- 1
3.34
1
9.87
-
92.
34
- 3
,059
.20
809
.13
214
.74
- -
51.2
8 -
972
.59
2,0
86.6
1 1
,940
.96
NO
TE 1
0 B
INTA
NGI
BLE
ASS
ETS
(` In
Mill
ion)
Part
icul
ars
Gros
s blo
ckA
ccum
ulat
ed d
epre
ciat
ion
Net
blo
ck
Bala
nce
as o
n 01
Apr
il 20
14
Add
ition
s A
sset
s ac
quir
ed
(Ref
er
Not
e 30
)
Eff
ect o
f fo
reig
n cu
rren
cy
exch
ange
di
ffer
ence
s
Bor
row
ing
cost
ca
pita
lised
(R
efer
not
e 28
.3)
Rec
lass
ified
as
hel
d fo
r sa
le (R
efer
N
ote
26 a
nd
Not
e 27
.6)
D
elet
ions
D
ispo
sed
unde
r sl
ump
sale
(Ref
er
Not
e 28
.9
and
31)
Bala
nce
as o
n 31
Mar
ch
2015
Bala
nce
as o
n 01
Apr
il 20
14
Dep
reci
atio
n / a
mor
tisat
ion
expe
nse f
or
the y
ear
Am
ount
ch
arge
d ag
ains
t re
tain
ed
earn
ings
Rec
lass
ified
as
hel
d fo
r sa
le (R
efer
N
ote
26 a
nd
Not
e 27
.6)
D
elet
ions
D
ispos
ed
unde
r slu
mp
sale
(R
efer
Not
e 28
.9 an
d 31
)
Bala
nce
as o
n 31
Mar
ch
2015
Bala
nce
as a
t 31
Mar
ch
2015
Bala
nce
as a
t 31
Mar
ch
2014
Inte
rnal
ly g
ener
ated
Prod
uct p
roce
ss
deve
lopm
ent
302
.14
73.
26
- -
- 1
3.26
6
.39
355
.75
191
.46
57.
04
- 1
3.26
4
.16
231
.08
124.
67
110
.68
Oth
ers
Acq
uire
d so
ftw
are
21.
96
2.4
0 -
0.0
1 -
- -
0.7
8 2
3.59
1
9.95
2
.44
- -
- 0
.57
21.8
2 1.
77
2.0
1
Tota
l 3
24.10
7
5.66
-
0.0
1 -
13.
26
- 7
.17
379
.34
211
.41
59.
48
- 1
3.26
-
4.7
3 2
52.9
0 1
26.4
4 1
12.6
9
Prev
ious
yea
r 2
63.0
8 6
1.01
0.0
1 -
- -
324
.10
153
.08
58.
33
- -
- 2
11.4
1 1
12.6
9 1
10.0
0
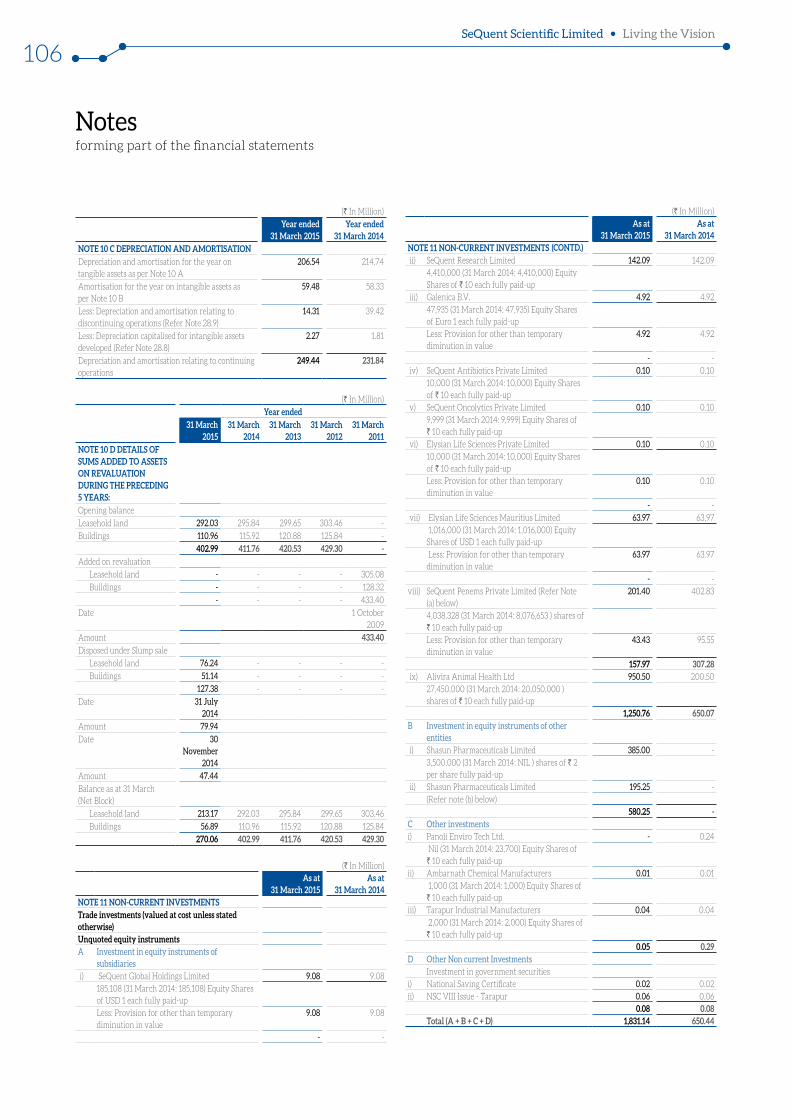
Notes forming part of the financial statements
SeQuent Scientific Limited Living the Vision
106
(` In Million)
Year ended 31 March 2015
Year ended 31 March 2014
NOTE 10 C DEPRECIATION AND AMORTISATION
Depreciation and amortisation for the year on tangible assets as per Note 10 A
206.54 214.74
Amortisation for the year on intangible assets as per Note 10 B
59.48 58.33
Less: Depreciation and amortisation relating to discontinuing operations (Refer Note 28.9)
14.31 39.42
Less: Depreciation capitalised for intangible assets developed (Refer Note 28.8)
2.27 1.81
Depreciation and amortisation relating to continuing operations
249.44 231.84
(` In Million)
Year ended31 March
201531 March
201431 March
201331 March
201231 March
2011NOTE 10 D DETAILS OF SUMS ADDED TO ASSETS ON REVALUATION DURING THE PRECEDING 5 YEARS:Opening balance
Leasehold land 292.03 295.84 299.65 303.46 -
Buildings 110.96 115.92 120.88 125.84 -
402.99 411.76 420.53 429.30 - Added on revaluation
Leasehold land - - - - 305.08
Buildings - - - - 128.32
- - - - 433.40
Date 1 October 2009
Amount 433.40 Disposed under Slump sale
Leasehold land 76.24 - - - -
Buildings 51.14 - - - -
127.38 - - - -
Date 31 July 2014
Amount 79.94 Date 30
November 2014
Amount 47.44 Balance as at 31 March (Net Block)
Leasehold land 213.17 292.03 295.84 299.65 303.46
Buildings 56.89 110.96 115.92 120.88 125.84
270.06 402.99 411.76 420.53 429.30
(` In Million)As at
31 March 2015As at
31 March 2014NOTE 11 NON-CURRENT INVESTMENTSTrade investments (valued at cost unless stated otherwise)Unquoted equity instrumentsA Investment in equity instruments of
subsidiaries i) SeQuent Global Holdings Limited 9.08 9.08
185,108 (31 March 2014: 185,108) Equity Shares of USD 1 each fully paid-up Less: Provision for other than temporary diminution in value
9.08 9.08
- -
(` In Million)As at
31 March 2015As at
31 March 2014NOTE 11 NON-CURRENT INVESTMENTS ii) SeQuent Research Limited 142.09 142.09
4,410,000 (31 March 2014: 4,410,000) Equity Shares of ` 10 each fully paid-up
iii) Galenica B.V. 4.92 4.92 47,935 (31 March 2014: 47,935) Equity Shares of Euro 1 each fully paid-up Less: Provision for other than temporary diminution in value
4.92 4.92
- - iv) SeQuent Antibiotics Private Limited 0.10 0.10
10,000 (31 March 2014: 10,000) Equity Shares of ` 10 each fully paid-up
v) SeQuent Oncolytics Private Limited 0.10 0.10 9,999 (31 March 2014: 9,999) Equity Shares of ` 10 each fully paid-up
vi) Elysian Life Sciences Private Limited 0.10 0.10 10,000 (31 March 2014: 10,000) Equity Shares of ` 10 each fully paid-up Less: Provision for other than temporary diminution in value
0.10 0.10
- - vii) Elysian Life Sciences Mauritius Limited 63.97 63.97
1,016,000 (31 March 2014: 1,016,000) Equity Shares of USD 1 each fully paid-up Less: Provision for other than temporary diminution in value
63.97 63.97
- -viii) SeQuent Penems Private Limited (Refer Note
(a) below) 201.40 402.83
4,038,328 (31 March 2014: 8,076,653 ) shares of ` 10 each fully paid-up Less: Provision for other than temporary diminution in value
43.43 95.55
157.97 307.28 ix) Alivira Animal Health Ltd 950.50 200.50
27,450,000 (31 March 2014: 20,050,000 ) shares of ` 10 each fully paid-up
1,250.76 650.07 B Investment in equity instruments of other
entities i) Shasun Pharmaceuticals Limited 385.00 -
3,500,000 (31 March 2014: NIL ) shares of ` 2 per share fully paid-up
ii) Shasun Pharmaceuticals Limited 195.25 - (Refer note (b) below)
580.25 - C Other investmentsi) Panoli Enviro Tech Ltd. - 0.24
Nil (31 March 2014: 23,700) Equity Shares of ` 10 each fully paid-up
ii) Ambarnath Chemical Manufacturers 0.01 0.01 1,000 (31 March 2014: 1,000) Equity Shares of ` 10 each fully paid-up
iii) Tarapur Industrial Manufacturers 0.04 0.04 2,000 (31 March 2014: 2,000) Equity Shares of ` 10 each fully paid-up
0.05 0.29 D Other Non current Investments
Investment in government securities i) National Saving Certificate 0.02 0.02 ii) NSC VIII Issue - Tarapur 0.06 0.06
0.08 0.08 Total (A + B + C + D) 1,831.14 650.44
(CONTD.)

Notes forming part of the financial statements
FINANCIAL STATEMENTSANNUAL REPORT 2014-15
107Standalone
(` In Million)As at
31 March 2015As at
31 March 2014NOTE 11 NON-CURRENT INVESTMENTS
Aggregate amount of unquoted investments 1,567.64 824.06 Aggregate amount of quoted investments 385.00 - Aggregate market value of listed and quoted investments
1,303.40 -
Aggregate provision for diminution in value of investments
121.50 173.62
Note: (a) Pursuant to Order of Honourable High Court of Karnataka, the Share Capital of
SeQuent Penems Private Limited reduced from 8,076,653 to 4,038,327 shares of ` 10 each. Consequently, proportionate investment value in SeQuent Penems Private Limited is reduced from ` 402.83 Millions to ` 201.40 Millions and amount written off is included under exceptional items (Refer note 26)
(b) Trade investment in equity instruments of other entities includes ` 195.25 Million (31 March 2014: Nil) investment made in Shasun Pharmaceuticals Limited towards 25% of amount paid for subscription of 7,100,000 of warrants at a price of ` 110 per warrant. Each warrant is convertible into one equity share of face value of ` 2 each on payment of balance subscription amount of ` 585.75 Million on or before 28 November 2015. (Refer note 27.2 (ii)(b))
(` In Million)
As at 31 March 2015
As at 31 March 2014
NOTE 12 LONG-TERM LOANS AND ADVANCES (Unsecured, considered good)
(a) Capital advances 2.80 121.75
(b) Security deposits 40.82 32.55
(c) Security deposits to related parties (Refer note 28.2)
2.27 2.27
(d) Advance income tax (net of provisions ` 111.70 million (As at 31 March, 2014 ` 112.95 million)
31.30 19.50
(e) MAT credit entitlement
Opening balance 72.96 72.96
Less: Reversal of MAT credit of prior years 27.21 -
Closing balance 45.75 72.96
(f) Prepaid expenses 21.90 7.12
Total 144.84 256.15
(` In Million)
As at 31 March 2015
As at 31 March 2014
NOTE 13 OTHER NON-CURRENT ASSETS (Unsecured, considered good)
Margin money deposits 5.41 9.50
Total 5.41 9.50
(` In Million)
As on 31 March 2015
As on 31 March 2014
NOTE 14 CURRENT INVESTMENTSCurrent investments (valued at lower of cost and estimated net realisable value)A Quoted equity instrumentsi) Agrodutch Industries Limited 0.34 0.34
36,250 (31 March 2014: 36,250) Equity Shares of ` 10 each fully paid-up
ii) Transchem Limited 0.43 0.43
32,500 (31 March 2014: 32,500) Equity Shares of ` 10 each fully paid-up
(` In Million)
As on 31 March 2015
As on 31 March 2014
NOTE 14 CURRENT INVESTMENTSiii) N B Footware Limited - -
100,000 (31 March 2014: 100,000) Equity Shares of ` 10 each fully paid-up
iv) Techindia Nirman Limited (Formerly known as Nath Seed Limited)
- -
18,270 (31 March 2014: 18,270) Equity Shares of ` 10 each fully paid-up
v) Nath Bio Genes (I) Limited - -
6,930 (31 March 2014: 6,930) Equity Shares of ` 10 each fully paid-up
vi) Agritech (India) Limited - -
6,300 (31 March 2014: 6,300) Equity Shares of ` 10 each fully paid-up
B Current investments (valued at lower of cost and fair value)Unquoted equity instruments
Aditya Investment & Communication Limited
- -
58,800 (31 March 2014: 58,800) shares of ` 10 each fully paid-up
Total 0.77 0.77 Aggregate amount of quoted investments: Market value: ` 1.72 million (31 March 2014: ` 1.35 million)
0.77 0.77
(` In Million)
As at 31 March 2015
As at 31 March 2014
NOTE 15 INVENTORIES(At lower of cost and net realisable value)(a) Raw materials and packing materials 180.98 265.90
Goods-in transit 47.02 84.55
228.00 350.45 (b) Work-in-progress and intermediates
(Refer note (i) below) 201.56 320.62
(c) Finished goods 232.77 262.79
Goods-in transit 0.98 74.32
233.75 337.11 (d) Fuel 5.53 4.33
Total 668.84 1,012.51 Note: (i) Details of inventory of work-in-progress and
intermediates:
Bulk drugs 201.56 304.84
Formulations - 0.87
Speciality chemicals - 14.91
Total 201.56 320.62
(` In Million)
As at 31 March 2015
As at 31 March 2014
NOTE 16 TRADE RECEIVABLES (a) Trade receivables outstanding for a period
exceeding six months from the date they are due for payment
Unsecured, considered good 28.31 11.59
Unsecured, considered doubtful 23.90 29.82
52.21 41.41 Less: Provision for doubtful debts 23.90 29.82
28.31 11.59
(CONTD.) (CONTD.)
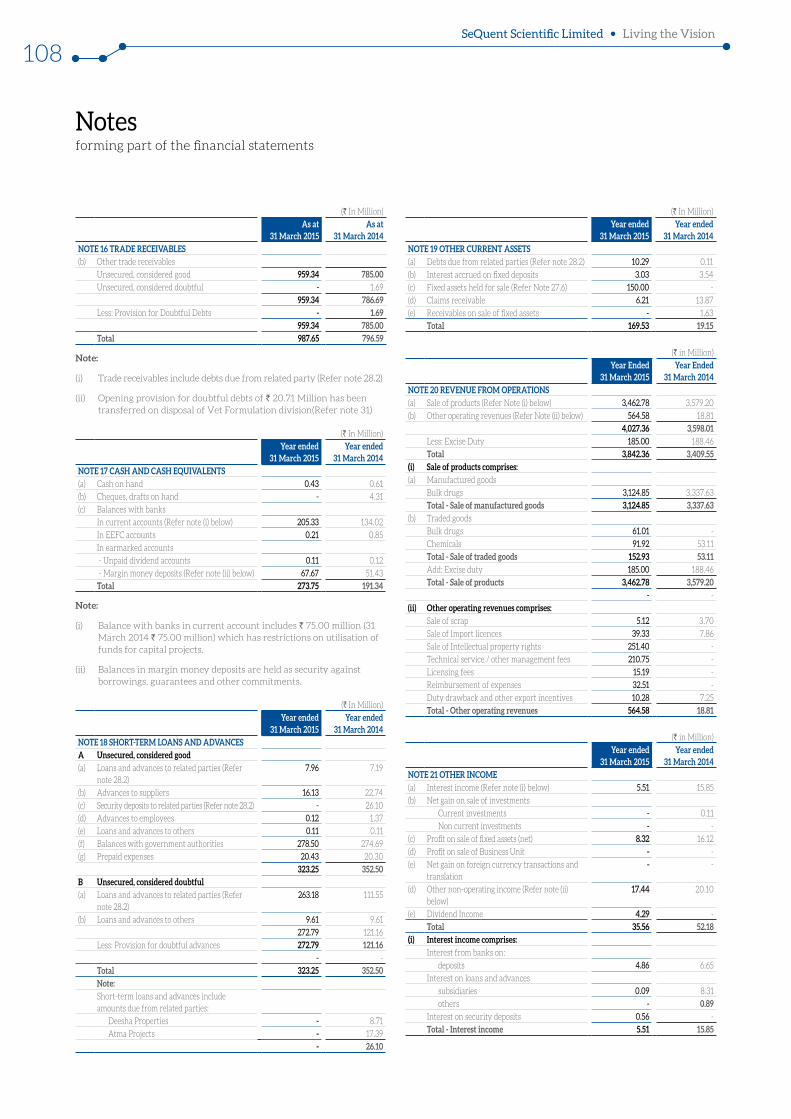
SeQuent Scientific Limited Living the Vision
108
Notes forming part of the financial statements
(` In Million)
As at 31 March 2015
As at 31 March 2014
NOTE 16 TRADE RECEIVABLES (b) Other trade receivables
Unsecured, considered good 959.34 785.00 Unsecured, considered doubtful - 1.69
959.34 786.69 Less: Provision for Doubtful Debts - 1.69
959.34 785.00 Total 987.65 796.59
Note:
(i) Trade receivables include debts due from related party (Refer note 28.2)
(ii) Opening provision for doubtful debts of ` 20.71 Million has been transferred on disposal of Vet Formulation division(Refer note 31)
(` In Million)
Year ended 31 March 2015
Year ended 31 March 2014
NOTE 17 CASH AND CASH EQUIVALENTS
(a) Cash on hand 0.43 0.61
(b) Cheques, drafts on hand - 4.31
(c) Balances with banks
In current accounts (Refer note (i) below) 205.33 134.02
In EEFC accounts 0.21 0.85
In earmarked accounts
- Unpaid dividend accounts 0.11 0.12
- Margin money deposits (Refer note (ii) below) 67.67 51.43
Total 273.75 191.34
Note:
(i) Balance with banks in current account includes ` 75.00 million (31 March 2014 ` 75.00 million) which has restrictions on utilisation of funds for capital projects.
(ii) Balances in margin money deposits are held as security against borrowings, guarantees and other commitments.
(` In Million)
Year ended 31 March 2015
Year ended 31 March 2014
NOTE 18 SHORT-TERM LOANS AND ADVANCES
A Unsecured, considered good(a) Loans and advances to related parties (Refer
note 28.2) 7.96 7.19
(b) Advances to suppliers 16.13 22.74
(c) Security deposits to related parties (Refer note 28.2) - 26.10
(d) Advances to employees 0.12 1.37
(e) Loans and advances to others 0.11 0.11
(f) Balances with government authorities 278.50 274.69
(g) Prepaid expenses 20.43 20.30
323.25 352.50 B Unsecured, considered doubtful(a) Loans and advances to related parties (Refer
note 28.2) 263.18 111.55
(b) Loans and advances to others 9.61 9.61
272.79 121.16
Less: Provision for doubtful advances 272.79 121.16 - -
Total 323.25 352.50 Note: Short-term loans and advances include amounts due from related parties:
Deesha Properties - 8.71
Atma Projects - 17.39
- 26.10
(` In Million)
Year ended 31 March 2015
Year ended 31 March 2014
NOTE 19 OTHER CURRENT ASSETS (a) Debts due from related parties (Refer note 28.2) 10.29 0.11
(b) Interest accrued on fixed deposits 3.03 3.54
(c) Fixed assets held for sale (Refer Note 27.6) 150.00 -
(d) Claims receivable 6.21 13.87
(e) Receivables on sale of fixed assets - 1.63
Total 169.53 19.15
(` in Million)
Year Ended 31 March 2015
Year Ended 31 March 2014
NOTE 20 REVENUE FROM OPERATIONS(a) Sale of products (Refer Note (i) below) 3,462.78 3,579.20
(b) Other operating revenues (Refer Note (ii) below) 564.58 18.81
4,027.36 3,598.01 Less: Excise Duty 185.00 188.46
Total 3,842.36 3,409.55 (i) Sale of products comprises:(a) Manufactured goods
Bulk drugs 3,124.85 3,337.63
Total - Sale of manufactured goods 3,124.85 3,337.63 (b) Traded goods
Bulk drugs 61.01 -
Chemicals 91.92 53.11
Total - Sale of traded goods 152.93 53.11 Add: Excise duty 185.00 188.46
Total - Sale of products 3,462.78 3,579.20 - -
(ii) Other operating revenues comprises:Sale of scrap 5.12 3.70
Sale of Import licences 39.33 7.86
Sale of Intellectual property rights 251.40 -
Technical service / other management fees 210.75 -
Licensing fees 15.19 -
Reimbursement of expenses 32.51 -
Duty drawback and other export incentives 10.28 7.25
Total - Other operating revenues 564.58 18.81
(` in Million)
Year ended 31 March 2015
Year ended 31 March 2014
NOTE 21 OTHER INCOME (a) Interest income (Refer note (i) below) 5.51 15.85
(b) Net gain on sale of investments
Current investments - 0.11
Non current investments - -
(c) Profit on sale of fixed assets (net) 8.32 16.12
(d) Profit on sale of Business Unit - -
(e) Net gain on foreign currency transactions and translation
- -
(d) Other non-operating income (Refer note (ii) below)
17.44 20.10
(e) Dividend Income 4.29 -
Total 35.56 52.18(i) Interest income comprises:
Interest from banks on:
deposits 4.86 6.65
Interest on loans and advances
subsidiaries 0.09 8.31
others - 0.89 Interest on security deposits 0.56 -
Total - Interest income 5.51 15.85

FINANCIAL STATEMENTSANNUAL REPORT 2014-15
109Standalone
Notes forming part of the financial statements
(` in Million)
Year ended 31 March 2015
Year ended 31 March 2014
NOTE 21 OTHER INCOME (ii) Other non-operating income comprises:
Insurance claim received 0.21 0.70
Liabilities / provisions no longer required written back
15.16 2.98
Reimbursement of expenses - 16.42
Rental income (Refer note 28.4 (b)) 1.30 -
Miscellaneous Income 0.77 -
17.44 20.10
(` In Million)
Year ended 31 March 2015
Year ended 31 March 2014
NOTE 22.A COST OF MATERIALS CONSUMED
Opening stock 299.37 252.07
Add: Purchases 1,633.34 1,962.74
Less: Closing stock 228.00 299.37
Cost of materials consumed 1,704.71 1,915.44 Materials consumed comprises:Solvents 391.35 500.79
Chemicals 1,313.36 1,414.65
Total 1,704.71 1,915.44
(` In Million)
Year ended 31 March 2015
Year ended 31 March 2014
NOTE 22.B PURCHASES OF STOCK-IN-TRADE
Purchases of stock-in-trade 136.86 53.75
Total 136.86 53.75 Purchases of stock-in-trade comprises:
Bulk drugs 40.16 Chemicals 96.70 53.75
Formulations - -
Total 136.86 53.75
(` In Million)
Year ended 31 March 2015
Year ended 31 March 2014
NOTE 22.C CHANGES IN INVENTORIES OF FINISHED GOODS AND WORK-IN-PROGRESS & INTERMEDIATES
Opening stockWork-in-progress and intermediates 304.84 214.27
Finished goods 220.79 228.94
525.63 443.21 Closing stock
Work-in-progress and intermediates 201.56 304.84
Finished goods 233.75 220.79
435.31 525.63 Net (increase) / decrease 90.32 (82.42)
Note: The inventory details are relating to only continuing operations.
(` In Million)
Year ended 31 March 2015
Year ended 31 March 2014
NOTE 23 EMPLOYEE BENEFITS EXPENSE
Salaries and wages 315.84 282.40
Contributions to provident fund and other funds 19.26 20.62
Expense on employee stock option scheme 44.57 17.08
Staff welfare expenses 18.79 15.38
Total 398.46 335.48
(` In Million)
Year ended 31 March 2015
Year ended 31 March 2014
NOTE 24 FINANCE COSTS Interest expense on borrowings 402.99 281.98
Other borrowing costs 30.71 23.11
Total 433.70 305.09
(` In Million)
Year ended 31 March 2015
Year ended 31 March 2014
NOTE 25 OTHER EXPENSES Power, water and fuel 206.81 217.71
Consumables 43.07 54.06
Conversion and processing charges 163.25 174.91
Contract labour charges 100.62 115.20
Freight and forwarding 40.12 52.30
Rent including lease rentals (Refer note 28.4a)
9.75 30.11
Rates and taxes 17.26 17.30
Communication expenses 10.97 8.37
Repairs and maintenance
Building 14.58 12.44
Machinery 55.65 46.56
Others 41.58 34.49
Insurance 8.61 8.51
Travelling and conveyance 23.14 25.39
Advertisement and selling expenses 3.43 9.53
Commission on sales 13.51 17.20
Legal and professional fees 55.62 61.23
Payments to auditors (Refer Note (i) below) 4.53 3.89
Analytical charges 66.62 58.65
Bad trade receivables written off 5.89 1.09
Bad loans and advances written off 6.11 22.02
Provision for doubtful trade receivables 11.48 0.25
Provision for doubtful loans and advances - 80.55
Provision for diminution in investment - 0.10
Provision for Intangible assets - 8.83
Fixed assets written off 16.36 14.40
Net loss on foreign currency transactions and translation
11.58 101.18
Increase/(Decrease) of excise duty on inventory
(6.87) (0.65)
Other expenses 48.11 55.31
Total 971.78 1,230.93 Notes:(i) Payments to the auditors comprises
(net of service tax input credit)
(a) As auditors - statutory audit (including fees for undertaking Limited reviews)
4.00 3.00
Fee for certification and other services
0.30 0.63
Reimbursement of expenses 0.10 0.12
(b) Payment to cost auditor 0.13 0.14
4.53 3.89
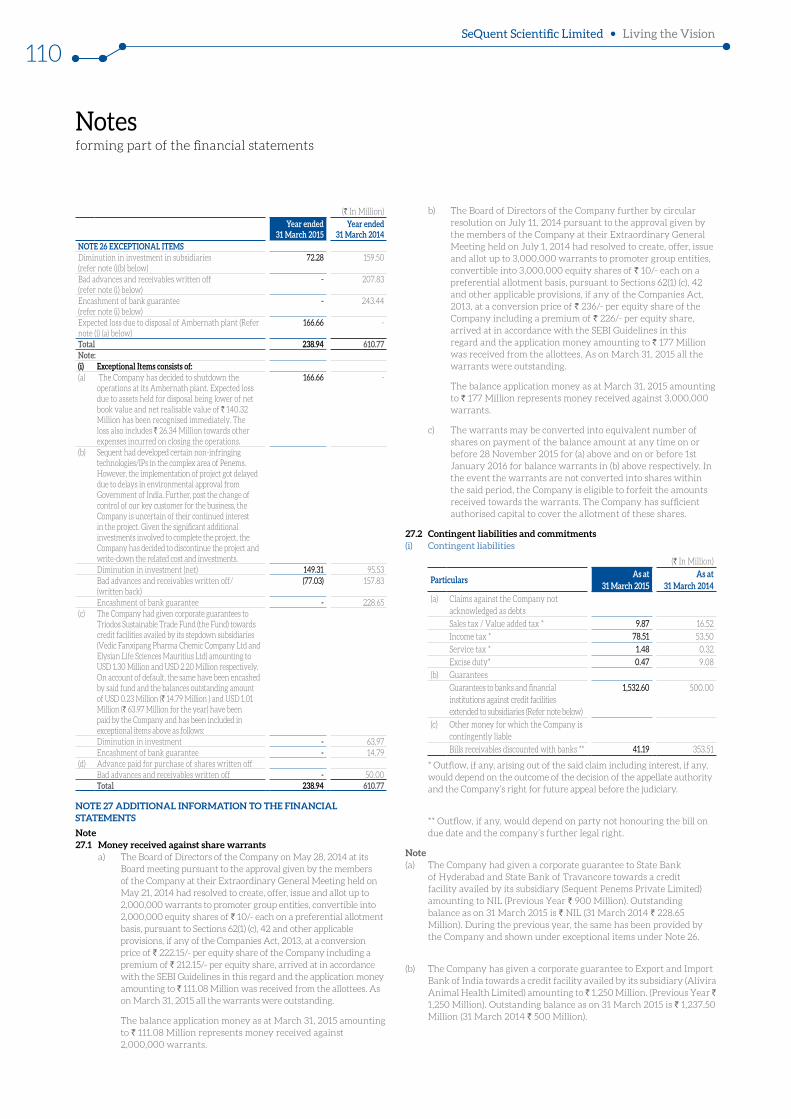
Notes forming part of the financial statements
SeQuent Scientific Limited Living the Vision
110
b) The Board of Directors of the Company further by circular resolution on July 11, 2014 pursuant to the approval given by the members of the Company at their Extraordinary General Meeting held on July 1, 2014 had resolved to create, offer, issue and allot up to 3,000,000 warrants to promoter group entities, convertible into 3,000,000 equity shares of ` 10/- each on a preferential allotment basis, pursuant to Sections 62(1) (c), 42 and other applicable provisions, if any of the Companies Act, 2013, at a conversion price of ` 236/- per equity share of the Company including a premium of ` 226/- per equity share, arrived at in accordance with the SEBI Guidelines in this regard and the application money amounting to ` 177 Million was received from the allottees. As on March 31, 2015 all the warrants were outstanding.
The balance application money as at March 31, 2015 amounting to ` 177 Million represents money received against 3,000,000 warrants.
c) The warrants may be converted into equivalent number of shares on payment of the balance amount at any time on or before 28 November 2015 for (a) above and on or before 1st January 2016 for balance warrants in (b) above respectively. In the event the warrants are not converted into shares within the said period, the Company is eligible to forfeit the amounts received towards the warrants. The Company has sufficient authorised capital to cover the allotment of these shares.
27.2 Contingent liabilities and commitments(i) Contingent liabilities
(` In Million)
ParticularsAs at
31 March 2015As at
31 March 2014(a) Claims against the Company not
acknowledged as debts
Sales tax / Value added tax * 9.87 16.52
Income tax * 78.51 53.50
Service tax * 1.48 0.32
Excise duty* 0.47 9.08
(b) Guarantees
Guarantees to banks and financial institutions against credit facilities extended to subsidiaries (Refer note below)
1,532.60 500.00
(c) Other money for which the Company is contingently liable
Bills receivables discounted with banks ** 41.19 353.51
* Outflow, if any, arising out of the said claim including interest, if any, would depend on the outcome of the decision of the appellate authority and the Company’s right for future appeal before the judiciary.
** Outflow, if any, would depend on party not honouring the bill on due date and the company’s further legal right.
Note (a) The Company had given a corporate guarantee to State Bank
of Hyderabad and State Bank of Travancore towards a credit facility availed by its subsidiary (Sequent Penems Private Limited) amounting to NIL (Previous Year ` 900 Million). Outstanding balance as on 31 March 2015 is ` NIL (31 March 2014 ` 228.65 Million). During the previous year, the same has been provided by the Company and shown under exceptional items under Note 26.
(b) The Company has given a corporate guarantee to Export and Import Bank of India towards a credit facility availed by its subsidiary (Alivira Animal Health Limited) amounting to ̀ 1,250 Million. (Previous Year ̀ 1,250 Million). Outstanding balance as on 31 March 2015 is ` 1,237.50 Million (31 March 2014 ` 500 Million).
(` In Million)Year ended
31 March 2015Year ended
31 March 2014NOTE 26 EXCEPTIONAL ITEMSDiminution in investment in subsidiaries (refer note (i(b) below)
72.28 159.50
Bad advances and receivables written off (refer note (i) below)
- 207.83
Encashment of bank guarantee (refer note (i) below)
- 243.44
Expected loss due to disposal of Ambernath plant (Refer note (i) (a) below)
166.66 -
Total 238.94 610.77 Note:(i) Exceptional Items consists of:(a) The Company has decided to shutdown the
operations at its Ambernath plant. Expected loss due to assets held for disposal being lower of net book value and net realisable value of ` 140.32 Million has been recognised immediately. The loss also includes ` 26.34 Million towards other expenses incurred on closing the operations.
166.66 -
(b) Sequent had developed certain non-infringing technologies/IPs in the complex area of Penems. However, the implementation of project got delayed due to delays in environmental approval from Government of India. Further, post the change of control of our key customer for the business, the Company is uncertain of their continued interest in the project. Given the significant additional investments involved to complete the project, the Company has decided to discontinue the project and write-down the related cost and investments.Diminution in investment (net) 149.31 95.53Bad advances and receivables written off/ (written back)
(77.03) 157.83
Encashment of bank guarantee - 228.65(c) The Company had given corporate guarantees to
Triodos Sustainable Trade Fund (the Fund) towards credit facilities availed by its stepdown subsidiaries (Vedic Fanxipang Pharma Chemic Company Ltd and Elysian Life Sciences Mauritius Ltd) amounting to USD 1.30 Million and USD 2.20 Million respectively. On account of default, the same have been encashed by said fund and the balances outstanding amount of USD 0.23 Million (` 14.79 Million ) and USD 1.01 Million (` 63.97 Million for the year) have been paid by the Company and has been included in exceptional items above as follows:Diminution in investment - 63.97Encashment of bank guarantee - 14.79
(d) Advance paid for purchase of shares written offBad advances and receivables written off - 50.00Total 238.94 610.77
NOTE 27 ADDITIONAL INFORMATION TO THE FINANCIAL STATEMENTS
Note 27.1 Money received against share warrants a) The Board of Directors of the Company on May 28, 2014 at its
Board meeting pursuant to the approval given by the members of the Company at their Extraordinary General Meeting held on May 21, 2014 had resolved to create, offer, issue and allot up to 2,000,000 warrants to promoter group entities, convertible into 2,000,000 equity shares of ` 10/- each on a preferential allotment basis, pursuant to Sections 62(1) (c), 42 and other applicable provisions, if any of the Companies Act, 2013, at a conversion price of ` 222.15/- per equity share of the Company including a premium of ` 212.15/- per equity share, arrived at in accordance with the SEBI Guidelines in this regard and the application money amounting to ` 111.08 Million was received from the allottees. As on March 31, 2015 all the warrants were outstanding.
The balance application money as at March 31, 2015 amounting to ` 111.08 Million represents money received against 2,000,000 warrants.
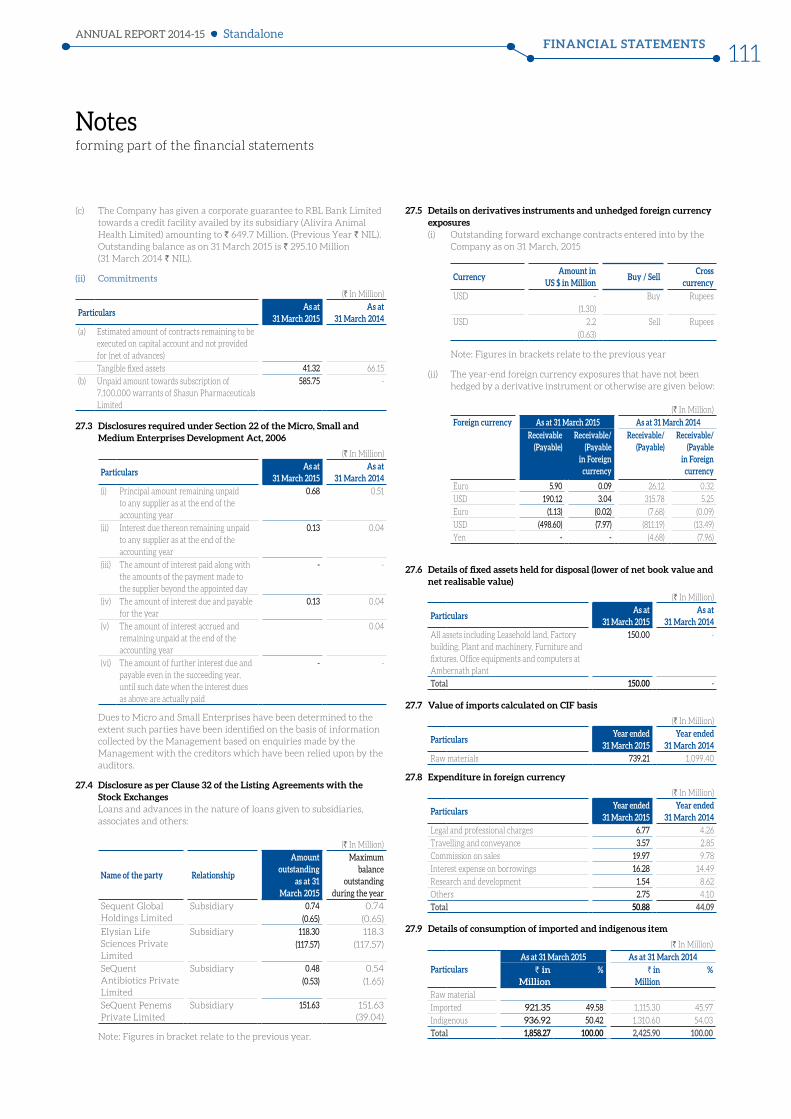
Notes forming part of the financial statements
FINANCIAL STATEMENTSANNUAL REPORT 2014-15
111Standalone
27.5 Details on derivatives instruments and unhedged foreign currency exposures (i) Outstanding forward exchange contracts entered into by the
Company as on 31 March, 2015
CurrencyAmount in
US $ in Million Buy / Sell
Cross currency
USD - Buy Rupees
(1.30)
USD 2.2 Sell Rupees
(0.63)
Note: Figures in brackets relate to the previous year
(ii) The year-end foreign currency exposures that have not been hedged by a derivative instrument or otherwise are given below:
(` In Million)
Foreign currency As at 31 March 2015 As at 31 March 2014Receivable
(Payable)Receivable/
(Payable in Foreign
currency
Receivable/(Payable)
Receivable/ (Payable
in Foreign currency
Euro 5.90 0.09 26.12 0.32
USD 190.12 3.04 315.78 5.25
Euro (1.13) (0.02) (7.68) (0.09)
USD (498.60) (7.97) (811.19) (13.49)
Yen - - (4.68) (7.96)
27.6 Details of fixed assets held for disposal (lower of net book value and net realisable value)
(` In Million)
ParticularsAs at
31 March 2015As at
31 March 2014All assets including Leasehold land, Factory building, Plant and machinery, Furniture and fixtures, Office equipments and computers at Ambernath plant
150.00 -
Total 150.00 -
27.7 Value of imports calculated on CIF basis
(` In Million)
ParticularsYear ended
31 March 2015Year ended
31 March 2014Raw materials 739.21 1,099.40
27.8 Expenditure in foreign currency
(` In Million)
ParticularsYear ended
31 March 2015Year ended
31 March 2014Legal and professional charges 6.77 4.26
Travelling and conveyance 3.57 2.85
Commission on sales 19.97 9.78
Interest expense on borrowings 16.28 14.49
Research and development 1.54 8.62
Others 2.75 4.10
Total 50.88 44.09
27.9 Details of consumption of imported and indigenous item
(` In Million)
ParticularsAs at 31 March 2015 As at 31 March 2014
` in Million
% ` in Million
%
Raw material
Imported 921.35 49.58 1,115.30 45.97
Indigenous 936.92 50.42 1,310.60 54.03
Total 1,858.27 100.00 2,425.90 100.00
(c) The Company has given a corporate guarantee to RBL Bank Limited towards a credit facility availed by its subsidiary (Alivira Animal Health Limited) amounting to ` 649.7 Million. (Previous Year ` NIL). Outstanding balance as on 31 March 2015 is ` 295.10 Million (31 March 2014 ` NIL).
(ii) Commitments
(` In Million)
ParticularsAs at
31 March 2015As at
31 March 2014(a) Estimated amount of contracts remaining to be
executed on capital account and not provided for (net of advances)
Tangible fixed assets 41.32 66.15
(b) Unpaid amount towards subscription of 7,100,000 warrants of Shasun Pharmaceuticals Limited
585.75 -
27.3 Disclosures required under Section 22 of the Micro, Small and Medium Enterprises Development Act, 2006
(` In Million)
ParticularsAs at
31 March 2015As at
31 March 2014(i) Principal amount remaining unpaid
to any supplier as at the end of the accounting year
0.68 0.51
(ii) Interest due thereon remaining unpaid to any supplier as at the end of the accounting year
0.13 0.04
(iii) The amount of interest paid along with the amounts of the payment made to the supplier beyond the appointed day
- -
(iv) The amount of interest due and payable for the year
0.13 0.04
(v) The amount of interest accrued and remaining unpaid at the end of the accounting year
0.04
(vi) The amount of further interest due and payable even in the succeeding year, until such date when the interest dues as above are actually paid
- -
Dues to Micro and Small Enterprises have been determined to the extent such parties have been identified on the basis of information collected by the Management based on enquiries made by the Management with the creditors which have been relied upon by the auditors.
27.4 Disclosure as per Clause 32 of the Listing Agreements with the Stock Exchanges
Loans and advances in the nature of loans given to subsidiaries, associates and others:
(` In Million)
Name of the party Relationship
Amount outstanding
as at 31 March 2015
Maximum balance
outstanding during the year
Sequent Global Holdings Limited
Subsidiary 0.74 0.74
(0.65) (0.65)
Elysian Life Sciences Private Limited
Subsidiary 118.30 118.3
(117.57) (117.57)
SeQuent Antibiotics Private Limited
Subsidiary 0.48 0.54
(0.53) (1.65)
SeQuent Penems Private Limited
Subsidiary 151.63 151.63 (39.04)
Note: Figures in bracket relate to the previous year.

Notes forming part of the financial statements
SeQuent Scientific Limited Living the Vision
112
27.10 Earnings in foreign exchange
(` In Million)
ParticularsYear ended
31 March 2015Year ended
31 March 2014Export of goods calculated on FOB basis 1,403.32 1,950.14
Interest income 0.10 0.06
27.11 Managerial Remuneration Based on the revised approval received from the Central Government
during the year, the Company has recovered excess salaries and allowances paid to its directors in the earlier years of ` NIL Million (Previous year ` 26.81 Million) and recognised it in the statement of profit and loss.
27.12 During the year, pursuant to the notification of Schedule II to the Companies Act, 2013 with effect from April 1, 2014, the Company has revised the estimated useful life of some of its assets to align the useful life with those specified in Schedule II. The details of previous and revised useful life are as follows:
(` In Million)
Asset Previous useful
life in yearsRevised useful
life in yearsComputers – End user devices like desktop, laptop
6 3
Office Equipment 20 5
Furniture and Fixtures 15 10
Vehicles 10 8
Pursuant to the transition provisions prescribed in Schedule II to the Companies Act, 2013, the Company has fully depreciated the carrying value of assets, net of residual value, where the remaining useful life of the asset was determined to be nil as on April 1, 2014, and has adjusted an amount of ` 4.40 Million against the Surplus/(Deficit) in statement of profit and loss under Reserves and Surplus. (Refer note 3)
The depreciation expense in the Statement of Profit and Loss for the year is higher by ` 3.45 Million consequent to the change in the useful life of the assets.
Note
28.1 Employee benefit plans 28.1.a Defined contribution plans
The Company makes Provident Fund and Employee State Insurance Scheme contributions which are defined contribution plans, for qualifying employees. Under the Schemes, the Company is required to contribute a specified percentage of the payroll costs to fund the benefits. The Company recognised ` 22.01 Million (Year ended 31 March 2014 ` 25.01 Million) for Provident Fund contributions and ` 1.45 Million (Year ended 31 March 2014 ` 1.54 Million) for Employee State Insurance Scheme contributions in the Statement of Profit and Loss. The contributions payable to these plans by the Company are at rates specified in the rules of the schemes.
28.1.b Defined benefit plans The Company has a defined Gratuity benefit plan. The following
table summarizes the components of net employee benefit expenses recognised in the statement of profit and loss and the funded status and amounts recognised in the balance sheet for the plan.
(` In Million)
ParticularsYear ended
31 March 2015Year ended
31 March 2014 Components of employer expenseCurrent service cost 8.83 8.50
Interest cost 5.34 4.64
Expected return on plan assets (0.75) (0.89)
Unrecognised past service cost - non vested benefits
- -
Recognised past service cost - non vested benefits
- -
Actuarial losses/(gains) (0.28) (0.84)
Total expense recognised in the Statement of Profit and Loss
13.14 11.41
Actual contribution and benefit payments for year Actual benefit payments (3.13) (4.76)
Actual contributions 0.50 -
Net asset / (liability) recognised in the Balance Sheet Present value of defined benefit obligation
56.46 59.48
Fair value of plan assets 7.93 9.83
Funded status [Surplus / (Deficit)] (48.53) (49.65)
Net asset / (liability) recognised in the Balance Sheet
(48.53) (49.65)
Change in defined benefit obligations (DBO) during the year Present value of DBO at beginning of the year
59.48 51.85
Current service cost 8.83 8.50
Interest cost 5.34 4.64
Acquistions/Business Combination (13.76) 0.00
Actuarial (gains) / losses (0.30) (0.75)
Past service cost - -
Benefits paid (3.13) (4.76)
Present value of DBO at the end of the year
56.46 59.48
Change in fair value of assets during the year Plan assets at beginning of the year 9.83 13.61
Expected return on plan assets 0.75 0.89
Actual company contributions 0.50 -
Actuarial gain / (loss) (0.02) 0.09
Benefits paid (3.13) (4.76)
Plan assets at the end of the year 7.93 9.83Actual return on plan assets 0.72 1.00
Composition of the plan assets is as follows: The details with respect to the investment made by Fund
managers (LIC and SBI Life) into major categories of plan assets have not been disclosed, as the same has not been provided by the Fund managers to the Company.
(` In Million)
ParticularsYear ended
31 March 2015Year ended
31 March 2014 Actuarial assumptionsDiscount rate 7.80% 9.20%
Expected return on plan assets 8.75% 8.75%
Salary escalation 12.00% 12.00%
Attrition 8.00% 8.00%
Mortality tables IALM (2006-08) IALM (2006-08)
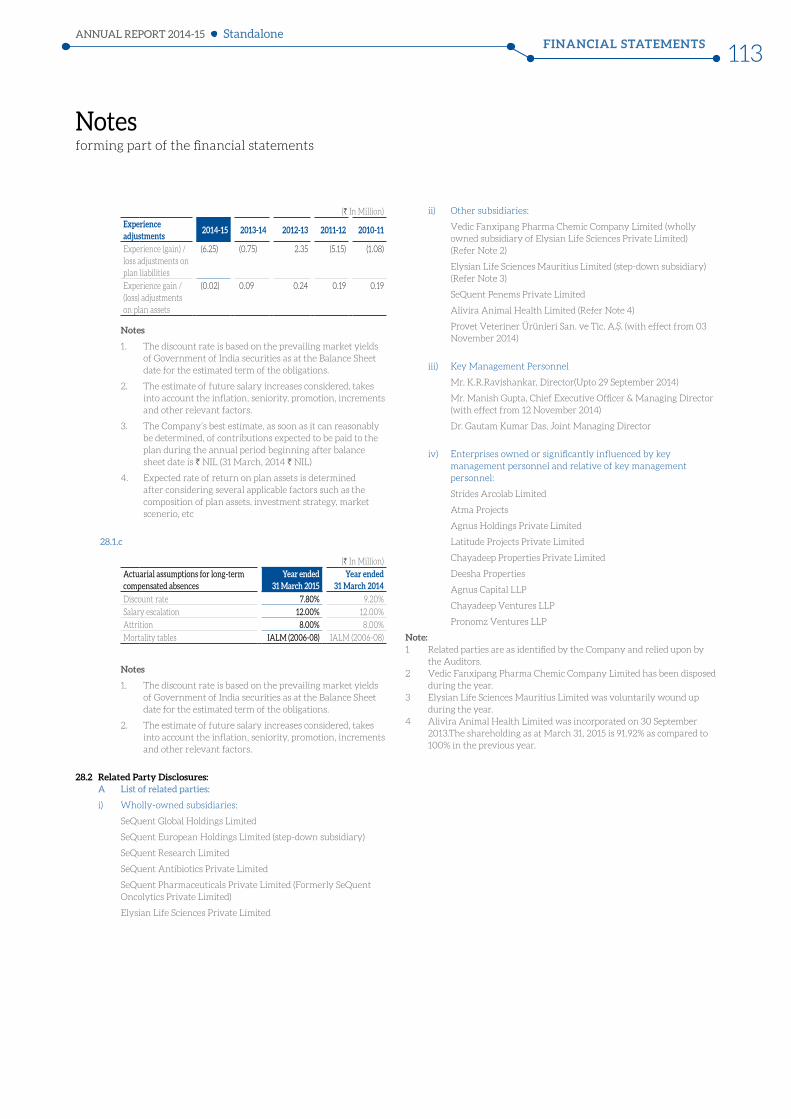
Notes forming part of the financial statements
FINANCIAL STATEMENTSANNUAL REPORT 2014-15
113Standalone
(` In Million)
Experience adjustments
2014-15 2013-14 2012-13 2011-12 2010-11
Experience (gain) / loss adjustments on plan liabilities
(6.25) (0.75) 2.35 (5.15) (1.08)
Experience gain / (loss) adjustments on plan assets
(0.02) 0.09 0.24 0.19 0.19
Notes
1. The discount rate is based on the prevailing market yields of Government of India securities as at the Balance Sheet date for the estimated term of the obligations.
2. The estimate of future salary increases considered, takes into account the inflation, seniority, promotion, increments and other relevant factors.
3. The Company’s best estimate, as soon as it can reasonably be determined, of contributions expected to be paid to the plan during the annual period beginning after balance sheet date is ` NIL (31 March, 2014 ` NIL)
4. Expected rate of return on plan assets is determined after considering several applicable factors such as the composition of plan assets, investment strategy, market scenerio, etc
28.1.c
(` In Million)
Actuarial assumptions for long-term compensated absences
Year ended 31 March 2015
Year ended 31 March 2014
Discount rate 7.80% 9.20%
Salary escalation 12.00% 12.00%
Attrition 8.00% 8.00%
Mortality tables IALM (2006-08) IALM (2006-08)
Notes
1. The discount rate is based on the prevailing market yields of Government of India securities as at the Balance Sheet date for the estimated term of the obligations.
2. The estimate of future salary increases considered, takes into account the inflation, seniority, promotion, increments and other relevant factors.
28.2 Related Party Disclosures: A List of related parties:
i) Wholly-owned subsidiaries:
SeQuent Global Holdings Limited
SeQuent European Holdings Limited (step-down subsidiary)
SeQuent Research Limited
SeQuent Antibiotics Private Limited
SeQuent Pharmaceuticals Private Limited (Formerly SeQuent Oncolytics Private Limited)
Elysian Life Sciences Private Limited
ii) Other subsidiaries:
Vedic Fanxipang Pharma Chemic Company Limited (wholly owned subsidiary of Elysian Life Sciences Private Limited) (Refer Note 2)
Elysian Life Sciences Mauritius Limited (step-down subsidiary) (Refer Note 3)
SeQuent Penems Private Limited
Alivira Animal Health Limited (Refer Note 4)
Provet Veteriner Ürünleri San. ve Tic. A. . (with effect from 03 November 2014)
iii) Key Management Personnel
Mr. K.R.Ravishankar, Director(Upto 29 September 2014)
Mr. Manish Gupta, Chief Executive Officer & Managing Director (with effect from 12 November 2014)
Dr. Gautam Kumar Das, Joint Managing Director
iv) Enterprises owned or significantly influenced by key management personnel and relative of key management personnel:
Strides Arcolab Limited
Atma Projects
Agnus Holdings Private Limited
Latitude Projects Private Limited
Chayadeep Properties Private Limited
Deesha Properties
Agnus Capital LLP
Chayadeep Ventures LLP
Pronomz Ventures LLP
Note: 1 Related parties are as identified by the Company and relied upon by
the Auditors. 2 Vedic Fanxipang Pharma Chemic Company Limited has been disposed
during the year. 3 Elysian Life Sciences Mauritius Limited was voluntarily wound up
during the year. 4 Alivira Animal Health Limited was incorporated on 30 September
2013.The shareholding as at March 31, 2015 is 91.92% as compared to 100% in the previous year.
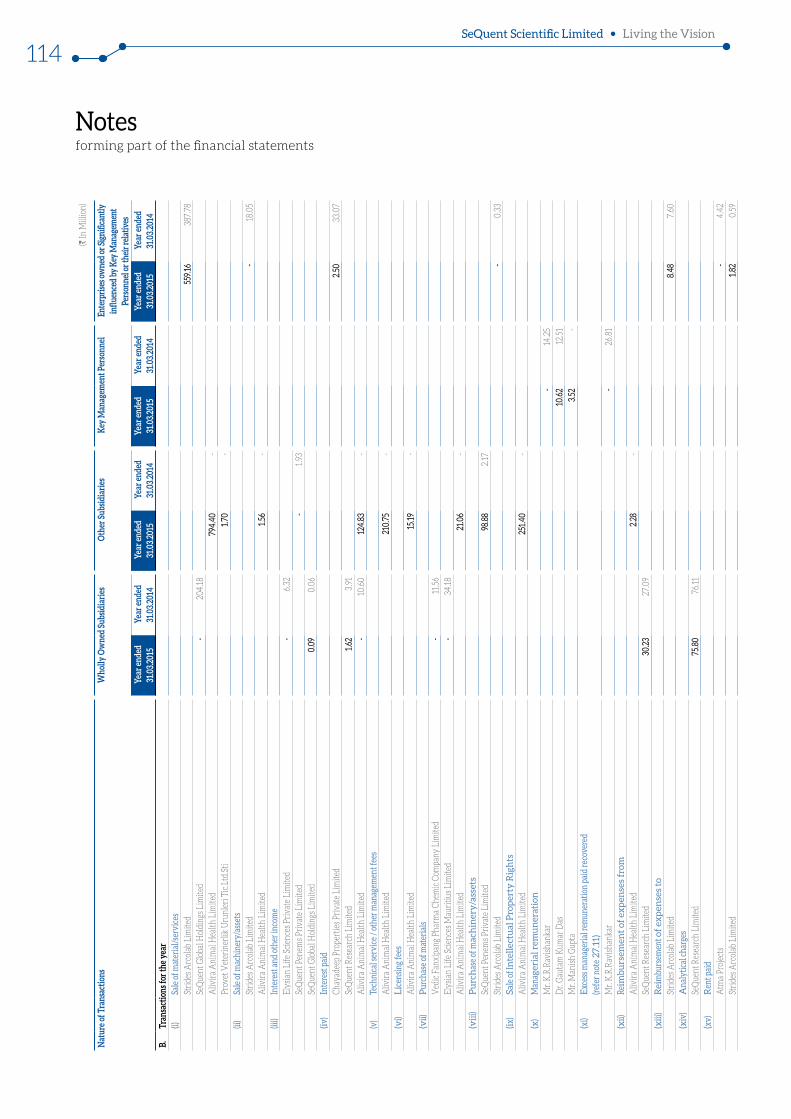
Notes forming part of the financial statements
SeQuent Scientific Limited Living the Vision
114(`
In M
illio
n)
Nat
ure
of T
rans
actio
nsW
holly
Ow
ned
Subs
idia
ries
Oth
er S
ubsi
diar
ies
Key
Man
agem
ent P
erso
nnel
E
nter
prise
s ow
ned
or Si
gnifi
cant
ly
influ
ence
d by
Key
Man
agem
ent
Pers
onne
l or t
heir
rela
tives
Y
ear e
nded
31
.03.
2015
Y
ear e
nded
31
.03.
2014
Y
ear e
nded
31
.03.
2015
Y
ear e
nded
31
.03.
2014
Ye
ar e
nded
31
.03.
2015
Y
ear e
nded
31
.03.
2014
Ye
ar e
nded
31
.03.
2015
Y
ear e
nded
31
.03.
2014
B.
Tran
sact
ions
for t
he y
ear
(i)Sa
le o
f mat
eria
l/ser
vice
sSt
ride
s Arc
olab
Lim
ited
559
.16
387
.78
SeQ
uent
Glo
bal H
oldi
ngs L
imite
d -
204
.18
Aliv
ira
Ani
mal
Hea
lth L
imite
d 7
94.4
0 -
Prov
et V
eter
iner
lik U
runl
eri T
ic.L
td.S
ti 1.
70
- (ii
)Sa
le o
f mac
hine
ry/a
sset
sSt
ride
s Arc
olab
Lim
ited
- 1
8.05
A
livir
a A
nim
al H
ealth
Lim
ited
1.56
-
(iii)
Inte
rest
and
oth
er in
com
eEl
ysia
n Li
fe S
cien
ces P
riva
te L
imite
d -
6.3
2 Se
Que
nt P
enem
s Pri
vate
Lim
ited
- 1
.93
SeQ
uent
Glo
bal H
oldi
ngs L
imite
d 0
.09
0.0
6 (iv
)In
tere
st p
aid
Chay
adee
p Pr
oper
ties P
riva
te L
imite
d 2
.50
33.
07
SeQ
uent
Res
earc
h Li
mite
d 1.
62
3.9
1 A
livir
a A
nim
al H
ealth
Lim
ited
- 1
0.60
12
4.83
-
(v)
Tech
nica
l ser
vice
/ ot
her m
anag
emen
t fee
sA
livir
a A
nim
al H
ealth
Lim
ited
210
.75
- (v
i)L
icen
sing
fees
Aliv
ira
Ani
mal
Hea
lth L
imite
d 15
.19
- (v
ii)P
urch
ase
of m
ater
ials
Ved
ic F
anxi
pang
Pha
rma
Chem
ic C
ompa
ny L
imite
d -
11.
56
Elys
ian
Life
Sci
ence
s Mau
ritiu
s Lim
ited
- 3
4.18
A
livir
a A
nim
al H
ealth
Lim
ited
21.0
6 -
(viii
)P
urc
has
e of
mac
hin
ery
/ass
ets
SeQ
uent
Pen
ems P
riva
te L
imite
d 9
8.88
2
.17
Stri
des A
rcol
ab L
imite
d -
0.3
3 (ix
)Sa
le o
f In
tell
ectu
al P
rop
erty
Rig
hts
Aliv
ira
Ani
mal
Hea
lth L
imite
d 2
51.4
0 -
(x)
Man
ager
ial r
emu
ner
atio
nM
r. K
.R.R
avis
hank
ar -
14.
25
Dr.
Gau
tam
Kum
ar D
as 10
.62
12.
51
Mr.
Man
ish
Gup
ta 3
.52
- (x
i)E
xces
s man
ager
ial r
emun
erat
ion
paid
reco
vere
d
(refe
r not
e 27
.11)
Mr.
K.R
.Rav
isha
nkar
- 2
6.81
(x
ii)Re
imb
urs
emen
t of
ex
pen
ses
from
Aliv
ira
Ani
mal
Hea
lth L
imite
d 2
.28
- Se
Que
nt R
esea
rch
Lim
ited
30.
23
27.
09
(xiii
)R
eim
burs
emen
t of
exp
ense
s to
Stri
des A
rcol
ab L
imite
d 8
.48
7.6
0 (x
iv)
Ana
lytic
al ch
arge
sSe
Que
nt R
esea
rch
Lim
ited
75.
80
76.
11
(xv)
Ren
t pai
dA
tma
Proj
ects
- 4
.42
Stri
des A
rcol
ab L
imite
d 1.
82
0.5
9
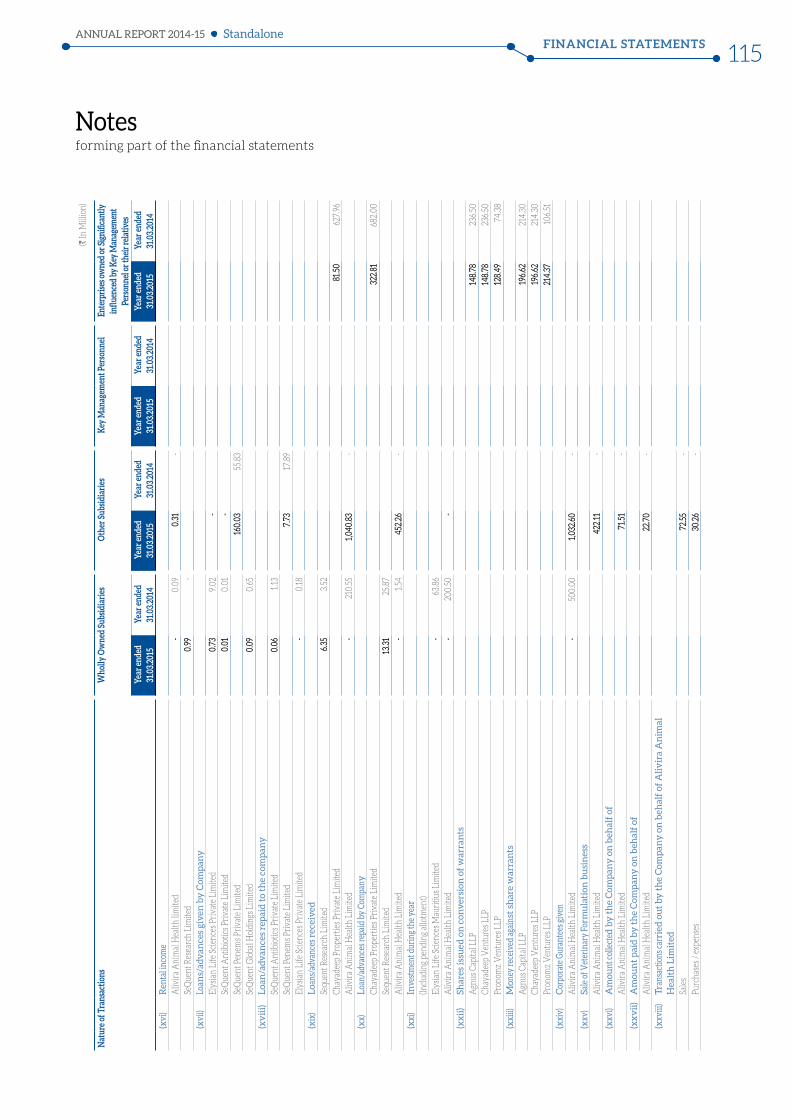
Notes forming part of the financial statements
FINANCIAL STATEMENTSANNUAL REPORT 2014-15
115Standalone
(` In
Mill
ion)
Nat
ure
of T
rans
actio
nsW
holly
Ow
ned
Subs
idia
ries
Oth
er S
ubsi
diar
ies
Key
Man
agem
ent P
erso
nnel
E
nter
prise
s ow
ned
or Si
gnifi
cant
ly
influ
ence
d by
Key
Man
agem
ent
Pers
onne
l or t
heir
rela
tives
Y
ear e
nded
31
.03.
2015
Y
ear e
nded
31
.03.
2014
Y
ear e
nded
31
.03.
2015
Y
ear e
nded
31
.03.
2014
Ye
ar e
nded
31
.03.
2015
Y
ear e
nded
31
.03.
2014
Ye
ar e
nded
31
.03.
2015
Y
ear e
nded
31
.03.
2014
(x
vi)
Ren
tal i
ncom
eA
livir
a A
nim
al H
ealth
lim
ited
- 0
.09
0.3
1 -
SeQ
uent
Res
earc
h Li
mite
d 0
.99
- (x
vii)
Loan
s/ad
van
ces
giv
en b
y C
omp
any
Elys
ian
Life
Sci
ence
s Pri
vate
Lim
ited
0.7
3 9
.02
- Se
Que
nt A
ntib
iotic
s Pri
vate
Lim
ited
0.0
1 0
.01
- Se
Que
nt P
enem
s Pri
vate
Lim
ited
160.
03
55.
83
SeQ
uent
Glo
bal H
oldi
ngs L
imite
d 0
.09
0.6
5 (x
vii
i)L
oan
/adv
ance
s re
pai
d t
o th
e co
mp
any
SeQ
uent
Ant
ibio
tics P
riva
te L
imite
d 0
.06
1.1
3 Se
Que
nt P
enem
s Pri
vate
Lim
ited
7.7
3 1
7.89
El
ysia
n Li
fe S
cien
ces P
riva
te L
imite
d -
0.1
8 (x
ix)
Loa
ns/a
dvan
ces r
ecei
ved
Sequ
ent R
esea
rch
Lim
ited
6.3
5 3
.52
Chay
adee
p Pr
oper
ties P
riva
te L
imite
d 8
1.50
627
.96
Aliv
ira
Ani
mal
Hea
lth L
imite
d -
210
.55
1,04
0.83
-
(xx)
Loa
n/ad
vanc
es re
paid
by
Com
pany
Chay
adee
p Pr
oper
ties P
riva
te L
imite
d 3
22.8
1 6
82.0
0 Se
quen
t Res
earc
h Li
mite
d 13
.31
25.
87
Aliv
ira
Ani
mal
Hea
lth L
imite
d -
1.5
4 4
52.2
6 -
(xxi
)In
vest
men
t dur
ing
the
year
(Incl
udin
g pe
ndin
g al
lotm
ent)
Elys
ian
Life
Sci
ence
s Mau
ritiu
s Lim
ited
- 6
3.86
A
livir
a A
nim
al H
ealth
Lim
ited
- 2
00.5
0 -
(xx
ii)
Shar
es is
sued
on
con
ver
sion
of
war
ran
tsA
gnus
Cap
ital L
LP 14
8.78
2
36.5
0 Ch
ayad
eep
Ven
ture
s LLP
148.
78
236
.50
Pron
omz
Ven
ture
s LLP
128.
49
74.
38
(xxi
ii)M
oney
rece
ived
aga
inst
sh
are
war
ran
tsA
gnus
Cap
ital L
LP 19
6.62
2
14.3
0 Ch
ayad
eep
Ven
ture
s LLP
196.
62
214
.30
Pron
omz
Ven
ture
s LLP
214
.37
106
.51
(xxi
v)C
orpo
rate
Gur
ante
es g
iven
Aliv
ira
Ani
mal
Hea
lth L
imite
d -
500
.00
1,03
2.60
-
(xxv
)Sa
le o
f Vet
erin
ary
Form
ula
tion
bu
sin
ess
Aliv
ira
Ani
mal
Hea
lth L
imite
d 4
22.11
-
(xxv
i)A
mou
nt c
olle
cted
by
th
e C
omp
any
on
beh
alf
ofA
livir
a A
nim
al H
ealth
Lim
ited
71.5
1 -
(xx
vii
)A
mou
nt
pai
d b
y t
he
Com
pan
y o
n b
ehal
f of
Aliv
ira
Ani
mal
Hea
lth L
imite
d 2
2.70
-
(xxv
iii)
Tran
sact
ions
carr
ied
ou
t b
y t
he
Com
pan
y o
n b
ehal
f of
Ali
vir
a A
nim
al
Hea
lth
Lim
ited
Sale
s 7
2.55
-
Purc
hase
s / e
xpen
ses
30.
26
-
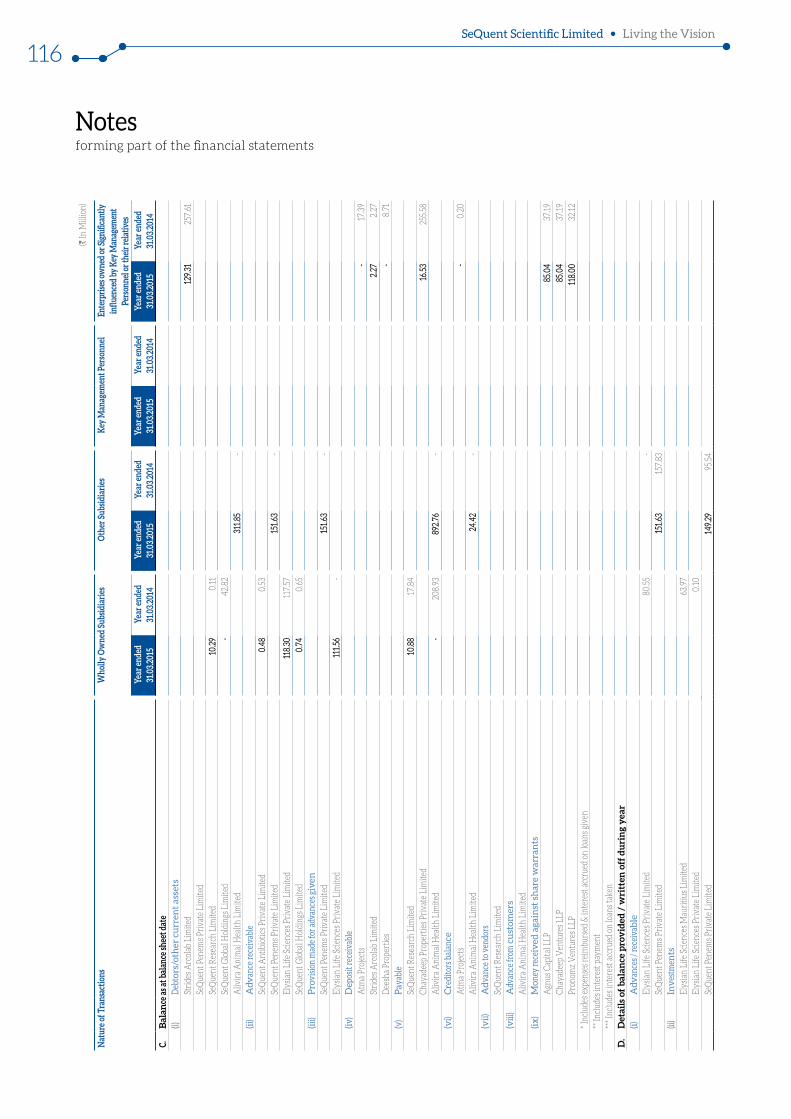
Notes forming part of the financial statements
SeQuent Scientific Limited Living the Vision
116(`
In M
illio
n)
Nat
ure
of T
rans
actio
nsW
holly
Ow
ned
Subs
idia
ries
Oth
er S
ubsi
diar
ies
Key
Man
agem
ent P
erso
nnel
E
nter
prise
s ow
ned
or Si
gnifi
cant
ly
influ
ence
d by
Key
Man
agem
ent
Pers
onne
l or t
heir
rela
tives
Y
ear e
nded
31
.03.
2015
Y
ear e
nded
31
.03.
2014
Y
ear e
nded
31
.03.
2015
Y
ear e
nded
31
.03.
2014
Ye
ar e
nded
31
.03.
2015
Y
ear e
nded
31
.03.
2014
Ye
ar e
nded
31
.03.
2015
Y
ear e
nded
31
.03.
2014
C.
Bal
ance
as a
t bal
ance
shee
t dat
e(i)
Deb
tors
/oth
er c
urr
ent
asse
tsSt
ride
s Arc
olab
Lim
ited
129.
31
257
.61
SeQ
uent
Pen
ems P
riva
te L
imite
dSe
Que
nt R
esea
rch
Lim
ited
10.2
9 0
.11
SeQ
uent
Glo
bal H
oldi
ngs L
imite
d -
42.
82
Aliv
ira
Ani
mal
Hea
lth L
imite
d 3
11.8
5 -
(ii)
Adv
ance
rece
ivab
leSe
Que
nt A
ntib
iotic
s Pri
vate
Lim
ited
0.4
8 0
.53
SeQ
uent
Pen
ems P
riva
te L
imite
d 15
1.63
- El
ysia
n Li
fe S
cien
ces P
riva
te L
imite
d 11
8.30
1
17.5
7 Se
Que
nt G
loba
l Hol
ding
s Lim
ited
0.7
4 0
.65
(iii)
Pro
visi
on m
ade
for a
dvan
ces g
iven
SeQ
uent
Pen
ems P
riva
te L
imite
d 15
1.63
- El
ysia
n Li
fe S
cien
ces P
riva
te L
imite
d11
1.56
- (iv
)D
epos
it re
ceiv
able
Atm
a Pr
ojec
ts
- 1
7.39
St
ride
s Arc
olab
Lim
ited
2.2
7 2
.27
Dee
sha
Prop
ertie
s -
8.7
1 (v
)P
ayab
leSe
Que
nt R
esea
rch
Lim
ited
10.8
8 1
7.84
Ch
ayad
eep
Prop
ertie
s Pri
vate
Lim
ited
16.5
3 2
55.5
8 A
livir
a A
nim
al H
ealth
Lim
ited
- 2
08.9
3 8
92.7
6 -
(vi)
Cre
dito
rs b
alan
ceA
tma
Proj
ects
- 0
.20
Aliv
ira
Ani
mal
Hea
lth L
imite
d 2
4.42
-
(vii)
Ad
vanc
e to
ven
dors
SeQ
uent
Res
earc
h Li
mite
d(v
iii)
Adv
ance
from
cu
stom
ers
Aliv
ira
Ani
mal
Hea
lth L
imite
d(ix
)M
oney
rece
ived
aga
inst
sh
are
war
ran
tsA
gnus
Cap
ital L
LP 8
5.04
3
7.19
Ch
ayad
eep
Ven
ture
s LLP
85.
04
37.
19
Pron
omz
Ven
ture
s LLP
118.
00
32.
12
* Inc
lude
s exp
ense
s rei
mbu
rsed
& in
tere
st a
ccru
ed o
n lo
ans g
iven
** In
clud
es in
tere
st p
aym
ent
*** I
nclu
des i
nter
est a
ccru
ed o
n lo
ans t
aken
D.
Det
ails
of
bal
ance
pro
vid
ed /
wri
tten
off
du
rin
g y
ear
(i )A
dvan
ces /
rece
ivab
leEl
ysia
n Li
fe S
cien
ces P
riva
te L
imite
d 8
0.55
-
SeQ
uent
Pen
ems P
riva
te L
imite
d 15
1.63
157
.83
(ii)
Inv
estm
ents
Elys
ian
Life
Sci
ence
s Mau
ritiu
s Lim
ited
63.
97
Elys
ian
Life
Sci
ence
s Pri
vate
Lim
ited
0.1
0 Se
Que
nt P
enem
s Pri
vate
Lim
ited
149.
29
95.
54
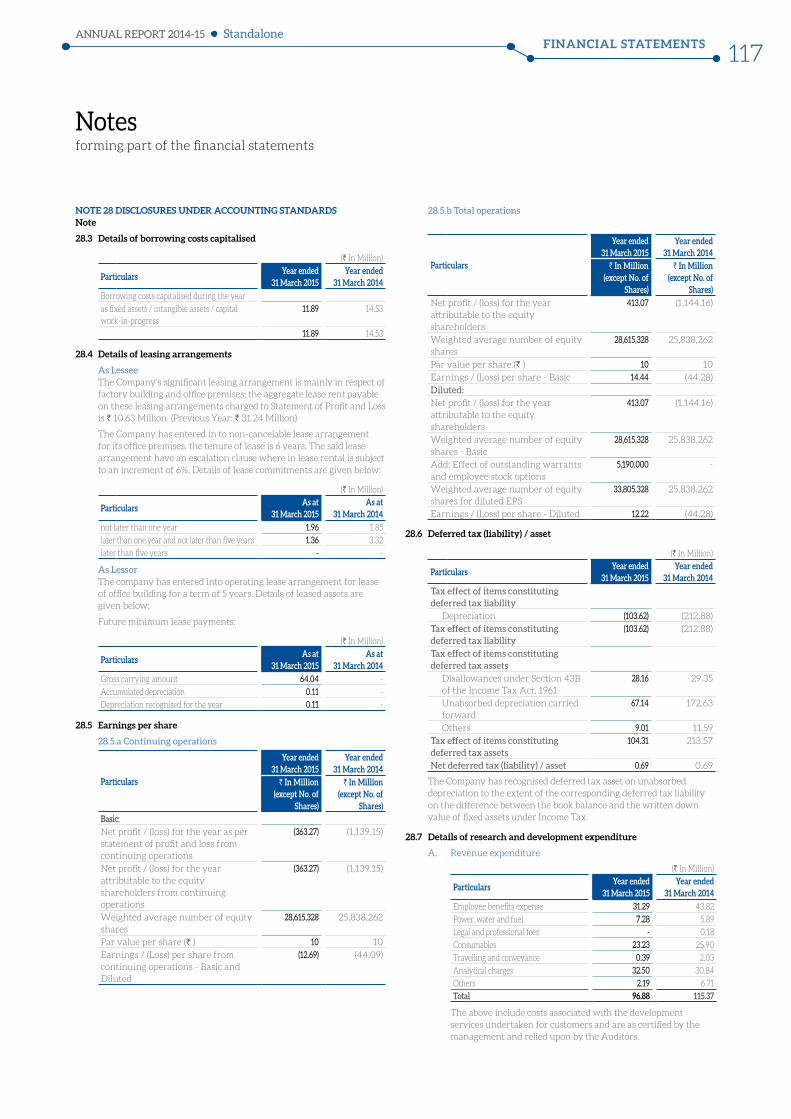
Notes forming part of the financial statements
FINANCIAL STATEMENTSANNUAL REPORT 2014-15
117Standalone
NOTE 28 DISCLOSURES UNDER ACCOUNTING STANDARDS Note
28.3 Details of borrowing costs capitalised
(` In Million)
ParticularsYear ended
31 March 2015Year ended
31 March 2014
Borrowing costs capitalised during the year
as fixed assets / intangible assets / capital work-in-progress
11.89 14.53
11.89 14.53
28.4 Details of leasing arrangements
As Lessee The Company’s significant leasing arrangement is mainly in respect of
factory building and office premises; the aggregate lease rent payable on these leasing arrangements charged to Statement of Profit and Loss is ` 10.63 Million. (Previous Year: ` 31.24 Million)
The Company has entered in to non-cancelable lease arrangement for its office premises, the tenure of lease is 6 years. The said lease arrangement have an escalation clause where in lease rental is subject to an increment of 6%. Details of lease commitments are given below:
(` In Million)
ParticularsAs at
31 March 2015As at
31 March 2014
not later than one year 1.96 1.85
later than one year and not later than five years 1.36 3.32
later than five years - -
As Lessor The company has entered into operating lease arrangement for lease
of office building for a term of 5 years. Details of leased assets are given below:
Future minimum lease payments:
(` In Million)
ParticularsAs at
31 March 2015As at
31 March 2014
Gross carrying amount 64.04 -
Accumulated depreciation 0.11 -
Depreciation recognised for the year 0.11 -
28.5 Earnings per share
28.5.a Continuing operations
Particulars
Year ended 31 March 2015
Year ended 31 March 2014
` In Million (except No. of
Shares)
` In Million (except No. of
Shares)Basic:Net profit / (loss) for the year as per statement of profit and loss from continuing operations
(363.27) (1,139.15)
Net profit / (loss) for the year attributable to the equity shareholders from continuing operations
(363.27) (1,139.15)
Weighted average number of equity shares
28,615,328 25,838,262
Par value per share (` ) 10 10
Earnings / (Loss) per share from continuing operations - Basic and Diluted
(12.69) (44.09)
28.5.b Total operations
Particulars
Year ended 31 March 2015
Year ended 31 March 2014
` In Million (except No. of
Shares)
` In Million (except No. of
Shares)
Net profit / (loss) for the year attributable to the equity shareholders
413.07 (1,144.16)
Weighted average number of equity shares
28,615,328 25,838,262
Par value per share (` ) 10 10
Earnings / (Loss) per share - Basic 14.44 (44.28)
Diluted:Net profit / (loss) for the year attributable to the equity shareholders
413.07 (1,144.16)
Weighted average number of equity shares - Basic
28,615,328 25,838,262
Add: Effect of outstanding warrants and employee stock options
5,190,000 -
Weighted average number of equity shares for diluted EPS
33,805,328 25,838,262
Earnings / (Loss) per share - Diluted 12.22 (44.28)
28.6 Deferred tax (liability) / asset
(` In Million)
ParticularsYear ended
31 March 2015Year ended
31 March 2014
Tax effect of items constituting deferred tax liability
Depreciation (103.62) (212.88)
Tax effect of items constituting deferred tax liability
(103.62) (212.88)
Tax effect of items constituting deferred tax assets
Disallowances under Section 43B of the Income Tax Act, 1961
28.16 29.35
Unabsorbed depreciation carried forward
67.14 172.63
Others 9.01 11.59
Tax effect of items constituting deferred tax assets
104.31 213.57
Net deferred tax (liability) / asset 0.69 0.69
The Company has recognised deferred tax asset on unabsorbed depreciation to the extent of the corresponding deferred tax liability on the difference between the book balance and the written down value of fixed assets under Income Tax.
28.7 Details of research and development expenditure
A. Revenue expenditure
(` In Million)
ParticularsYear ended
31 March 2015Year ended
31 March 2014
Employee benefits expense 31.29 43.82
Power, water and fuel 7.28 5.89
Legal and professional fees - 0.18
Consumables 23.23 25.90
Travelling and conveyance 0.39 2.03
Analytical charges 32.50 30.84
Others 2.19 6.71
Total 96.88 115.37
The above include costs associated with the development services undertaken for customers and are as certified by the management and relied upon by the Auditors.
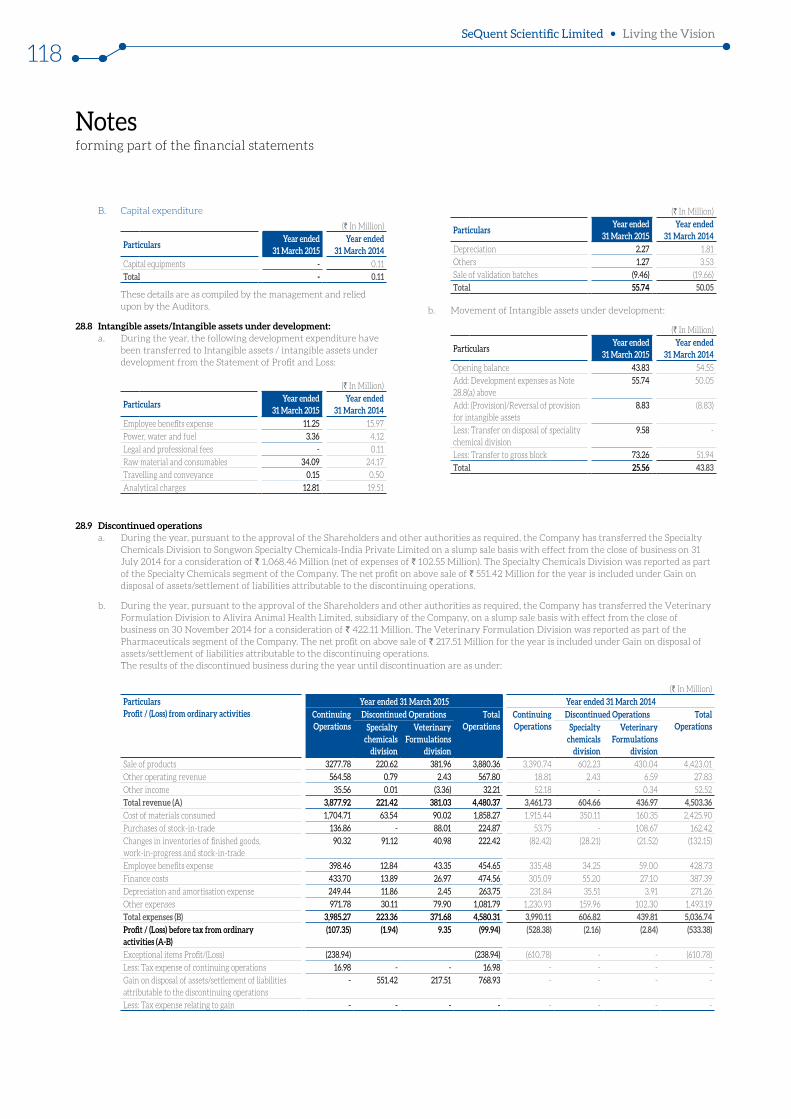
Notes forming part of the financial statements
SeQuent Scientific Limited Living the Vision
118
B. Capital expenditure
(` In Million)
ParticularsYear ended
31 March 2015Year ended
31 March 2014
Capital equipments - 0.11
Total - 0.11
These details are as compiled by the management and relied upon by the Auditors.
28.8 Intangible assets/Intangible assets under development: a. During the year, the following development expenditure have
been transferred to Intangible assets / intangible assets under development from the Statement of Profit and Loss:
(` In Million)
ParticularsYear ended
31 March 2015Year ended
31 March 2014
Employee benefits expense 11.25 15.97
Power, water and fuel 3.36 4.12
Legal and professional fees - 0.11
Raw material and consumables 34.09 24.17
Travelling and conveyance 0.15 0.50
Analytical charges 12.81 19.51
(` In Million)
ParticularsYear ended
31 March 2015Year ended
31 March 2014 Depreciation 2.27 1.81
Others 1.27 3.53
Sale of validation batches (9.46) (19.66)
Total 55.74 50.05
b. Movement of Intangible assets under development:
(` In Million)
ParticularsYear ended
31 March 2015Year ended
31 March 2014
Opening balance 43.83 54.55
Add: Development expenses as Note 28.8(a) above
55.74 50.05
Add: (Provision)/Reversal of provision for intangible assets
8.83 (8.83)
Less: Transfer on disposal of speciality chemical division
9.58 -
Less: Transfer to gross block 73.26 51.94
Total 25.56 43.83
28.9 Discontinued operations a. During the year, pursuant to the approval of the Shareholders and other authorities as required, the Company has transferred the Specialty
Chemicals Division to Songwon Specialty Chemicals-India Private Limited on a slump sale basis with effect from the close of business on 31 July 2014 for a consideration of ` 1,068.46 Million (net of expenses of ` 102.55 Million). The Specialty Chemicals Division was reported as part of the Specialty Chemicals segment of the Company. The net profit on above sale of ` 551.42 Million for the year is included under Gain on disposal of assets/settlement of liabilities attributable to the discontinuing operations.
b. During the year, pursuant to the approval of the Shareholders and other authorities as required, the Company has transferred the Veterinary Formulation Division to Alivira Animal Health Limited, subsidiary of the Company, on a slump sale basis with effect from the close of business on 30 November 2014 for a consideration of ` 422.11 Million. The Veterinary Formulation Division was reported as part of the Pharmaceuticals segment of the Company. The net profit on above sale of ` 217.51 Million for the year is included under Gain on disposal of assets/settlement of liabilities attributable to the discontinuing operations. The results of the discontinued business during the year until discontinuation are as under:
(` In Million)
Particulars Profit / (Loss) from ordinary activities
Year ended 31 March 2015 Year ended 31 March 2014Continuing Operations
Discontinued Operations Total Operations
Continuing Operations
Discontinued Operations Total OperationsSpecialty
chemicals division
Veterinary Formulations
division
Specialty chemicals
division
Veterinary Formulations
divisionSale of products 3277.78 220.62 381.96 3,880.36 3,390.74 602.23 430.04 4,423.01
Other operating revenue 564.58 0.79 2.43 567.80 18.81 2.43 6.59 27.83
Other income 35.56 0.01 (3.36) 32.21 52.18 - 0.34 52.52
Total revenue (A) 3,877.92 221.42 381.03 4,480.37 3,461.73 604.66 436.97 4,503.36 Cost of materials consumed 1,704.71 63.54 90.02 1,858.27 1,915.44 350.11 160.35 2,425.90
Purchases of stock-in-trade 136.86 - 88.01 224.87 53.75 - 108.67 162.42
Changes in inventories of finished goods, work-in-progress and stock-in-trade
90.32 91.12 40.98 222.42 (82.42) (28.21) (21.52) (132.15)
Employee benefits expense 398.46 12.84 43.35 454.65 335.48 34.25 59.00 428.73
Finance costs 433.70 13.89 26.97 474.56 305.09 55.20 27.10 387.39
Depreciation and amortisation expense 249.44 11.86 2.45 263.75 231.84 35.51 3.91 271.26
Other expenses 971.78 30.11 79.90 1,081.79 1,230.93 159.96 102.30 1,493.19
Total expenses (B) 3,985.27 223.36 371.68 4,580.31 3,990.11 606.82 439.81 5,036.74 Profit / (Loss) before tax from ordinary activities (A-B)
(107.35) (1.94) 9.35 (99.94) (528.38) (2.16) (2.84) (533.38)
Exceptional items Profit/(Loss) (238.94) (238.94) (610.78) - - (610.78)
Less: Tax expense of continuing operations 16.98 - - 16.98 - - - -
Gain on disposal of assets/settlement of liabilities attributable to the discontinuing operations
- 551.42 217.51 768.93 - - - -
Less: Tax expense relating to gain - - - - - - - -
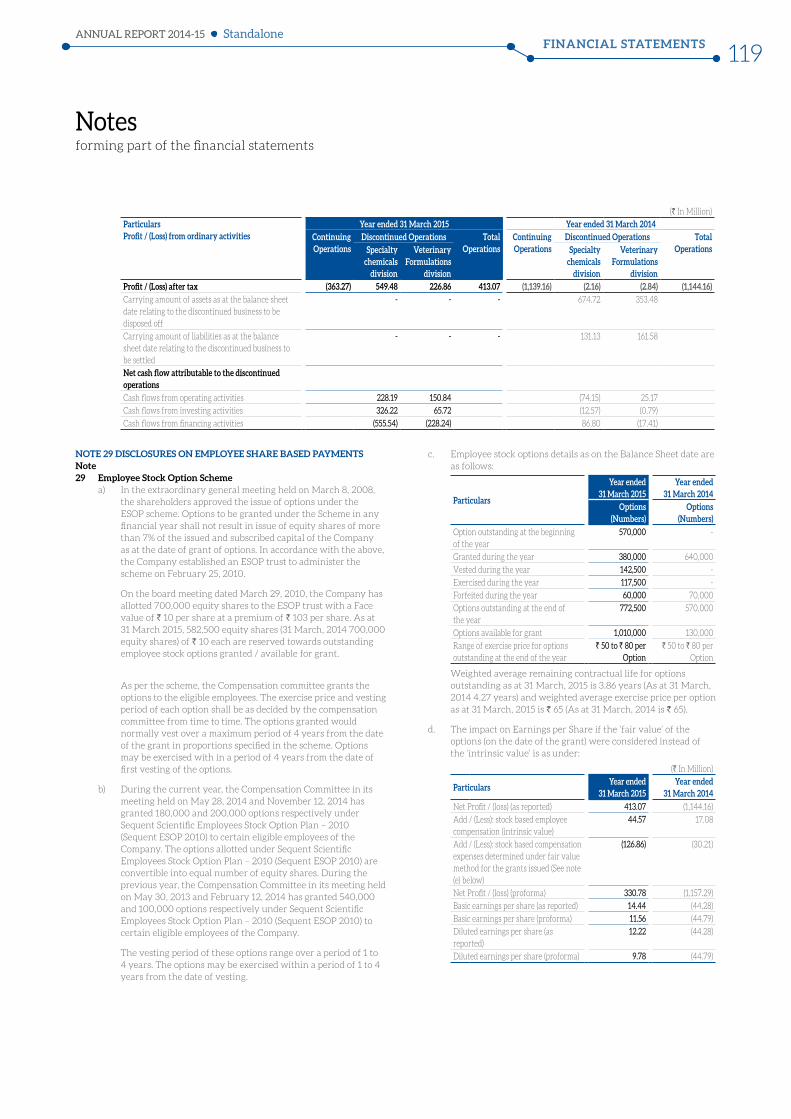
Notes forming part of the financial statements
FINANCIAL STATEMENTSANNUAL REPORT 2014-15
119Standalone
(` In Million)
Particulars Profit / (Loss) from ordinary activities
Year ended 31 March 2015 Year ended 31 March 2014Continuing Operations
Discontinued Operations Total Operations
Continuing Operations
Discontinued Operations Total OperationsSpecialty
chemicals division
Veterinary Formulations
division
Specialty chemicals
division
Veterinary Formulations
divisionProfit / (Loss) after tax (363.27) 549.48 226.86 413.07 (1,139.16) (2.16) (2.84) (1,144.16)Carrying amount of assets as at the balance sheet date relating to the discontinued business to be disposed off
- - - 674.72 353.48
Carrying amount of liabilities as at the balance sheet date relating to the discontinued business to be settled
- - - 131.13 161.58
Net cash flow attributable to the discontinued operationsCash flows from operating activities 228.19 150.84 (74.15) 25.17
Cash flows from investing activities 326.22 65.72 (12.57) (0.79)
Cash flows from financing activities (555.54) (228.24) 86.80 (17.41)
NOTE 29 DISCLOSURES ON EMPLOYEE SHARE BASED PAYMENTSNote 29 Employee Stock Option Scheme a) In the extraordinary general meeting held on March 8, 2008,
the shareholders approved the issue of options under the ESOP scheme. Options to be granted under the Scheme in any financial year shall not result in issue of equity shares of more than 7% of the issued and subscribed capital of the Company as at the date of grant of options. In accordance with the above, the Company established an ESOP trust to administer the scheme on February 25, 2010.
On the board meeting dated March 29, 2010, the Company has allotted 700,000 equity shares to the ESOP trust with a Face value of ` 10 per share at a premium of ` 103 per share. As at 31 March 2015, 582,500 equity shares (31 March, 2014 700,000 equity shares) of ` 10 each are reserved towards outstanding employee stock options granted / available for grant.
As per the scheme, the Compensation committee grants the options to the eligible employees. The exercise price and vesting period of each option shall be as decided by the compensation committee from time to time. The options granted would normally vest over a maximum period of 4 years from the date of the grant in proportions specified in the scheme. Options may be exercised with in a period of 4 years from the date of first vesting of the options.
b) During the current year, the Compensation Committee in its meeting held on May 28, 2014 and November 12, 2014 has granted 180,000 and 200,000 options respectively under Sequent Scientific Employees Stock Option Plan – 2010 (Sequent ESOP 2010) to certain eligible employees of the Company. The options allotted under Sequent Scientific Employees Stock Option Plan – 2010 (Sequent ESOP 2010) are convertible into equal number of equity shares. During the previous year, the Compensation Committee in its meeting held on May 30, 2013 and February 12, 2014 has granted 540,000 and 100,000 options respectively under Sequent Scientific Employees Stock Option Plan – 2010 (Sequent ESOP 2010) to certain eligible employees of the Company.
The vesting period of these options range over a period of 1 to 4 years. The options may be exercised within a period of 1 to 4 years from the date of vesting.
c. Employee stock options details as on the Balance Sheet date are as follows:
Particulars
Year ended 31 March 2015
Year ended 31 March 2014
Options (Numbers)
Options (Numbers)
Option outstanding at the beginning of the year
570,000 -
Granted during the year 380,000 640,000
Vested during the year 142,500 -
Exercised during the year 117,500 -
Forfeited during the year 60,000 70,000
Options outstanding at the end of the year
772,500 570,000
Options available for grant 1,010,000 130,000
Range of exercise price for options outstanding at the end of the year
` 50 to ` 80 per Option
` 50 to ` 80 per Option
Weighted average remaining contractual life for options outstanding as at 31 March, 2015 is 3.86 years (As at 31 March, 2014 4.27 years) and weighted average exercise price per option as at 31 March, 2015 is ` 65 (As at 31 March, 2014 is ` 65).
d. The impact on Earnings per Share if the ‘fair value’ of the options (on the date of the grant) were considered instead of the ‘intrinsic value’ is as under:
(` In Million)
ParticularsYear ended
31 March 2015Year ended
31 March 2014
Net Profit / (loss) (as reported) 413.07 (1,144.16)
Add / (Less): stock based employee compensation (intrinsic value)
44.57 17.08
Add / (Less): stock based compensation expenses determined under fair value method for the grants issued (See note (e) below)
(126.86) (30.21)
Net Profit / (loss) (proforma) 330.78 (1,157.29)
Basic earnings per share (as reported) 14.44 (44.28)
Basic earnings per share (proforma) 11.56 (44.79)
Diluted earnings per share (as reported)
12.22 (44.28)
Diluted earnings per share (proforma) 9.78 (44.79)
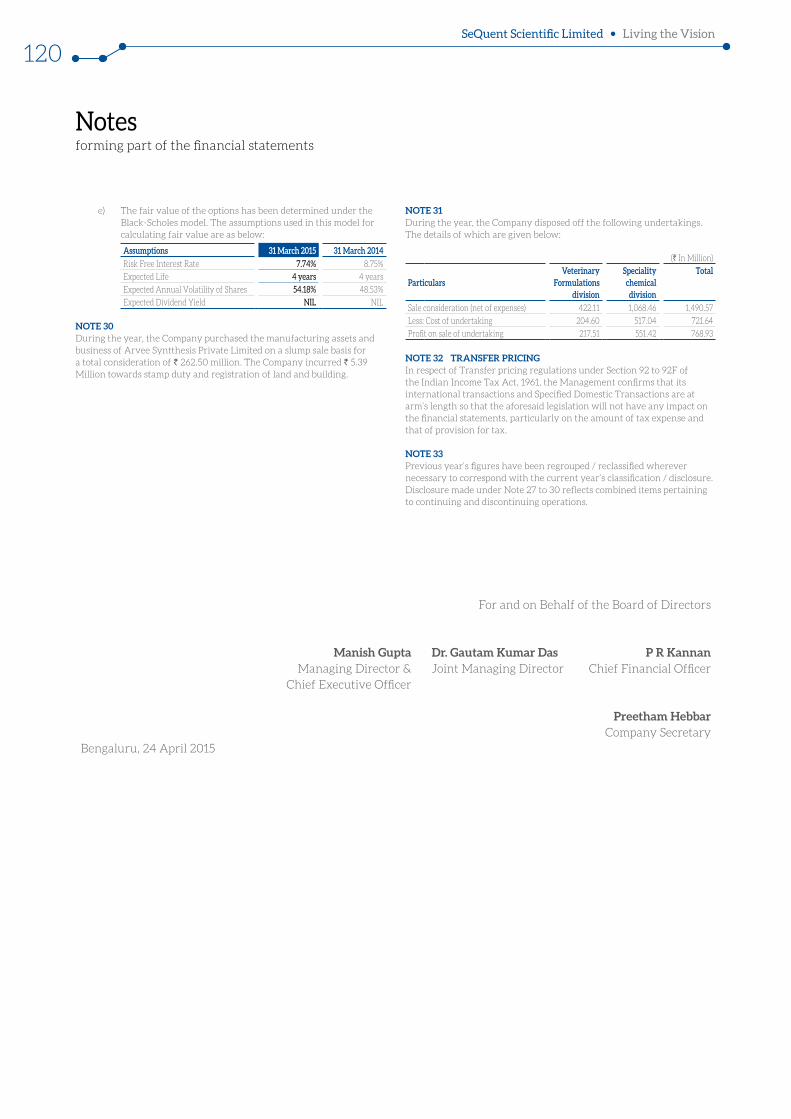
Notes forming part of the financial statements
SeQuent Scientific Limited Living the Vision
120
e) The fair value of the options has been determined under the Black-Scholes model. The assumptions used in this model for calculating fair value are as below:
Assumptions 31 March 2015 31 March 2014
Risk Free Interest Rate 7.74% 8.75%
Expected Life 4 years 4 years
Expected Annual Volatility of Shares 54.18% 48.53%
Expected Dividend Yield NIL NIL
NOTE 30 During the year, the Company purchased the manufacturing assets and business of Arvee Syntthesis Private Limited on a slump sale basis for a total consideration of ` 262.50 million. The Company incurred ` 5.39 Million towards stamp duty and registration of land and building.
NOTE 31 During the year, the Company disposed off the following undertakings. The details of which are given below:
(` In Million)
ParticularsVeterinary
Formulations division
Speciality chemical division
Total
Sale consideration (net of expenses) 422.11 1,068.46 1,490.57
Less: Cost of undertaking 204.60 517.04 721.64
Profit on sale of undertaking 217.51 551.42 768.93
NOTE 32 TRANSFER PRICING In respect of Transfer pricing regulations under Section 92 to 92F of the Indian Income Tax Act, 1961, the Management confirms that its international transactions and Specified Domestic Transactions are at arm’s length so that the aforesaid legislation will not have any impact on the financial statements, particularly on the amount of tax expense and that of provision for tax.
NOTE 33Previous year’s figures have been regrouped / reclassified wherever necessary to correspond with the current year’s classification / disclosure. Disclosure made under Note 27 to 30 reflects combined items pertaining to continuing and discontinuing operations.
For and on Behalf of the Board of Directors
Manish Gupta Dr. Gautam Kumar Das P R KannanManaging Director &
Chief Executive OfficerJoint Managing Director Chief Financial Officer
Preetham HebbarCompany Secretary
Bengaluru, 24 April 2015
FINANCIAL STATEMENTSANNUAL REPORT 2014-15
121Consolidated
Independent Auditors’ Report
To The Members of Sequent Scientific Limited
REPORT ON THE CONSOLIDATED FINANCIAL STATEMENTS
We have audited the accompanying consolidated financial
statements of SEQUENT SCIENTIFIC LIMITED (hereinafter
referred to as “the Holding Company”) and its subsidiaries (the
Holding Company and its subsidiaries together referred to as
“the Group”), comprising of the Consolidated Balance Sheet as
at March 31, 2015, the Consolidated Statement of Profit and
Loss, the Consolidated Cash Flow Statement for the year then
ended, and a summary of the significant accounting policies and
other explanatory information (hereinafter referred to as “the
consolidated financial statements”).
MANAGEMENT’S RESPONSIBILITY FOR THE CONSOLIDATED
FINANCIAL STATEMENTS
The Holding Company’s Board of Directors is responsible for
the preparation of these consolidated financial statements
in terms of the requirements of the Companies Act, 2013
(hereinafter referred to as “the Act”) that give a true and fair
view of the consolidated financial position, consolidated financial
performance and consolidated cash flows of the Group in
accordance with the accounting principles generally accepted
in India, including the Accounting Standards specified under
Section 133 of the Act, read with Rule 7 of the Companies
(Accounts) Rules, 2014. The respective Board of Directors
of the companies included in the Group are responsible for
maintenance of adequate accounting records in accordance with
the provisions of the Act for safeguarding the assets of the Group
and for preventing and detecting frauds and other irregularities;
the selection and application of appropriate accounting policies;
making judgments and estimates that are reasonable and
prudent; and the design, implementation and maintenance
of adequate internal financial controls, that were operating
effectively for ensuring the accuracy and completeness of the
accounting records, relevant to the preparation and presentation
of the financial statements that give a true and fair view and are
free from material misstatement, whether due to fraud or error,
which have been used for the purpose of preparation of the
consolidated financial statements by the Directors of the Holding
Company, as aforesaid.
AUDITOR’S RESPONSIBILITY
Our responsibility is to express an opinion on these consolidated
financial statements based on our audit. While conducting the
audit, we have taken into account the provisions of the Act,
the accounting and auditing standards and matters which are
required to be included in the audit report under the provisions
of the Act and the Rules made thereunder.
We conducted our audit in accordance with the Standards
on Auditing specified under Section 143(10) of the Act. Those
Standards require that we comply with ethical requirements and
plan and perform the audit to obtain reasonable assurance about
whether the consolidated financial statements are free from
material misstatement.
An audit involves performing procedures to obtain audit
evidence about the amounts and the disclosures in the
consolidated financial statements. The procedures selected
depend on the auditor’s judgment, including the assessment
of the risks of material misstatement of the consolidated
financial statements, whether due to fraud or error. In making
those risk assessments, the auditor considers internal financial
control relevant to the Holding Company’s preparation of the
consolidated financial statements that give a true and fair
view in order to design audit procedures that are appropriate
in the circumstances but not for the purpose of expressing an
opinion on whether the Holding Company has an adequate
internal financial controls system over financial reporting in
place and the operating effectiveness of such controls. An audit
also includes evaluating the appropriateness of the accounting
SeQuent Scientific Limited Living the Vision
122
Independent Auditors’ Report
policies used and the reasonableness of the accounting estimates
made by the Holding Company’s Board of Directors, as well as
evaluating the overall presentation of the consolidated financial
statements.
We believe that the audit evidence obtained by us and the audit
evidence obtained by the other auditors in terms of their reports
referred to in sub-paragraph (a) of the Other Matters paragraph
below, is sufficient and appropriate to provide a basis for our
audit opinion on the consolidated financial statements.
OPINION
In our opinion and to the best of our information and according
to the explanations given to us, the aforesaid consolidated
financial statements give the information required by the Act
in the manner so required and give a true and fair view in
conformity with the accounting principles generally accepted
in India, of the consolidated state of affairs of the Group as at
March 31, 2015 and its consolidated loss and its consolidated cash
flows for the year ended on that date.
OTHER MATTERS
(a) We did not audit the financial statements / financial
information of five subsidiaries, whose financial statements
/ financial information reflect total assets of ` 906.12 million
as at March 31, 2015, total revenues of ` 297.66 million
and net cash flows amounting to ` 50.59 million for the
year ended on that date, as considered in the consolidated
financial statements. These financial statements / financial
information have been audited by other auditors whose
reports have been furnished to us by the Management and
our opinion on the consolidated financial statements, in
so far as it relates to the amounts and disclosures included
in respect of these subsidiaries and our report in terms of
sub-sections (3) and (11) of Section 143 of the Act, insofar as
it relates to the aforesaid subsidiaries is based solely on the
reports of the other auditors.
(b) We did not audit the financial statements / financial
information of five subsidiaries, whose financial statements
/ financial information reflect total assets of ` 16.10 million
as at March 31, 2015 total revenues of ` 46.61 million and
net cash flows amounting to ` 9.70 million for the year
ended on that date, as considered in the consolidated
financial statements. These financial statements / financial
information are unaudited and have been furnished to us
by the Management and our opinion on the consolidated
financial statements, in so far as it relates to the amounts
and disclosures included in respect of these subsidiaries
and our report in terms of sub-sections (3) and (11) of
Section 143 of the Act in so far as it relates to the aforesaid
subsidiaries is based solely on such unaudited financial
statements / financial information. In our opinion and
according to the information and explanations given to us
by the Management, these financial statements / financial
information are not material to the Group.
Our opinion on the consolidated financial statements, and our
report on Other Legal and Regulatory Requirements below, is
not modified in respect of the above matters with respect to our
reliance on the work done and the reports of the other auditors
and the financial statements / financial information certified by
the Management.
REPORT ON OTHER LEGAL AND REGULATORY
REQUIREMENTS
1. As required by the Companies (Auditor’s Report) Order,
2015 (“the Order”), issued by the Central Government of
India in terms of sub-section (11) of Section 143 of the Act,
based on the comments in the auditors’ reports of the
Holding company and subsidiary companies incorporated in
India, we give in the Annexure a statement on the matters
specified in paragraphs 3 and 4 of the Order, to the extent
applicable:
2. As required by Section143 (3) of the Act, we report, to the
extent applicable, that:
(a) We have sought and obtained all the information and
explanations which to the best of our knowledge and
FINANCIAL STATEMENTSANNUAL REPORT 2014-15
123Consolidated
Independent Auditors’ Report
belief were necessary for the purposes of our audit of
the aforesaid consolidated financial statements.
(b) In our opinion, proper books of account as required
by law relating to preparation of the aforesaid
consolidated financial statements have been kept so far
as it appears from our examination of those books and
the reports of the other auditors.
(c) The Consolidated Balance Sheet, the Consolidated
Statement of Profit and Loss, and the Consolidated
Cash Flow Statement dealt with by this Report are
in agreement with the relevant books of account
maintained for the purpose of preparation of the
consolidated financial statements.
(d) In our opinion, the aforesaid consolidated financial
statements comply with the Accounting Standards
specified under Section 133 of the Act, read with Rule 7
of the Companies (Accounts) Rules, 2014.
(e) On the basis of the written representations received
from the directors of the Holding Company as on
March 31, 2015 taken on record by the Board of
Directors of the Holding Company and the reports
of the statutory auditors of its subsidiary companies
incorporated in India, none of the directors of the
Group companies incorporated in India is disqualified as
on March 31, 2015 from being appointed as a director
in terms of Section 164 (2) of the Act.
(f) With respect to the other matters to be included in
the Auditor’s Report in accordance with Rule 11 of
the Companies (Audit and Auditor’s) Rules, 2014, in
our opinion and to the best of our information and
according to the explanations given to us:
(i) The consolidated financial statements disclose the
impact of pending litigations on the consolidated
financial position of the Group – Refer Note 28.2(i)
to the consolidated financial statements;
(ii) The Group did not have any material foreseeable
losses on long-term contracts Including derivative
contracts; and
(iii) There has been no delay in transferring
amounts, required to be transferred, to the
Investor Education and Protection Fund by the
Holding Company and its subsidiary companies
incorporated in India.
For Deloitte Haskins & Sells
Chartered Accountants
(Firm’s Registration No. 008072S)
V. SrikumarPartner
(Membership No. 84494)
Bangalore, April 24, 2015
SeQuent Scientific Limited Living the Vision
124
Annexure to the Independent Auditor’s Report on the Consolidated Financial Statements(Referred to in paragraph 1under ‘Report on Other Legal and Regulatory Requirements’section of our report of even date)
Our reporting on the Order includes two subsidiary companies incorporated in India, to which the Order is applicable, which have been audited by other auditors and our report in respect of these entities is based solely on the reports of the other auditors, to the extent considered applicable for reporting under the Order in the case of the consolidated financial statements.
(i) In respect of the fixed assets of the Holding Company and subsidiary companies incorporated in India:
(a) The respective entities have maintained proper records showing full particulars, including quantitative details and situation of fixed assets.
(b) The fixed assets were physically verified during the year by the Management of the respective entities in accordance with a regular programme of verification which, in our opinion and the opinion of the other auditors, provides for physical verification of all the fixed assets at reasonable intervals. According to the information and explanation given to us and the other auditors, no material discrepancies were noticed on such verification.
(ii) In respect of the inventories of the Holding Company and subsidiary companies incorporated in India:
(a) As explained to us, the inventories were physically verified during the year by the Management of the respective entities at reasonable intervals.
(b) In our opinion and according to the information and explanations given to us and the other auditors, the procedures of physical verification of inventories followed by the Management of the respective entities were reasonable and adequate in relation to the size of the respective entities and the nature of their business.
(c) In our opinion and according to the information and explanations given to us, the respective entities have maintained proper records of their inventories and no material discrepancies were noticed on physical verification.
(iii) According to the information and explanations given to us, the Holding Company and the subsidiary companies have granted no loans, that are included in the consolidated financial statements, secured or unsecured, to companies, firms or other parties covered in the Register maintained under Section 189 of the Companies Act, 2013 by the respective entities.
(iv) In our opinion and according to the information and explanations given to us and other auditors, having regard to the explanations that some of the items purchased are of special nature and suitable alternative sources are not readily available for obtaining comparable quotations, there is an adequate internal control system commensurate with the size of the Holding Company and the nature of its business with regard to purchases of inventory and fixed assets and for the sale of goods and services. During the course of our audit, we have not observed any major weakness in such internal control system.
(v) According to the information and explanations given to us and other auditors, the Holding Company and subsidiary companies incorporated in India have not accepted any deposit during the year.
(vi) According to the information and explanations given to us and the other auditors, in our opinion and the opinion of the other auditors, the Holding Company and subsidiary companies incorporated in India have, prima facie, made and maintained the prescribed cost records pursuant to the Companies (Cost Records and Audit) Rules, 2014, as amended prescribed by the Central Government under subsection (1) of Section 148 of the Companies Act, 2013. Neither we nor the other auditors have, however, made a detailed examination of the cost records with a view to determine whether they are accurate or complete.
(vii) According to the information and explanations given to us, in respect of statutory dues of the Holding Company and subsidiary companies incorporated in India:
(a) The respective entities have been generally been regular in depositing undisputed statutory dues, including Provident Fund, Sales tax, Wealth Tax, Customs Duty, Excise Duty, Value Added Tax, Cess and other material statutory dues applicable to it with the appropriate authorities and there are delays in depositing Service Tax, Employee State Insurance and Income Tax.
(b) There were no undisputed amounts payable by the respective entities in respect of Provident Fund, Employees’ State Insurance, Income-tax, Sales Tax, Wealth Tax, Service Tax, Customs Duty, Excise Duty, Value Added Tax, Cess and other material statutory dues in arrears as at March 31, 2015 for a period of more than six months from the date they became payable.
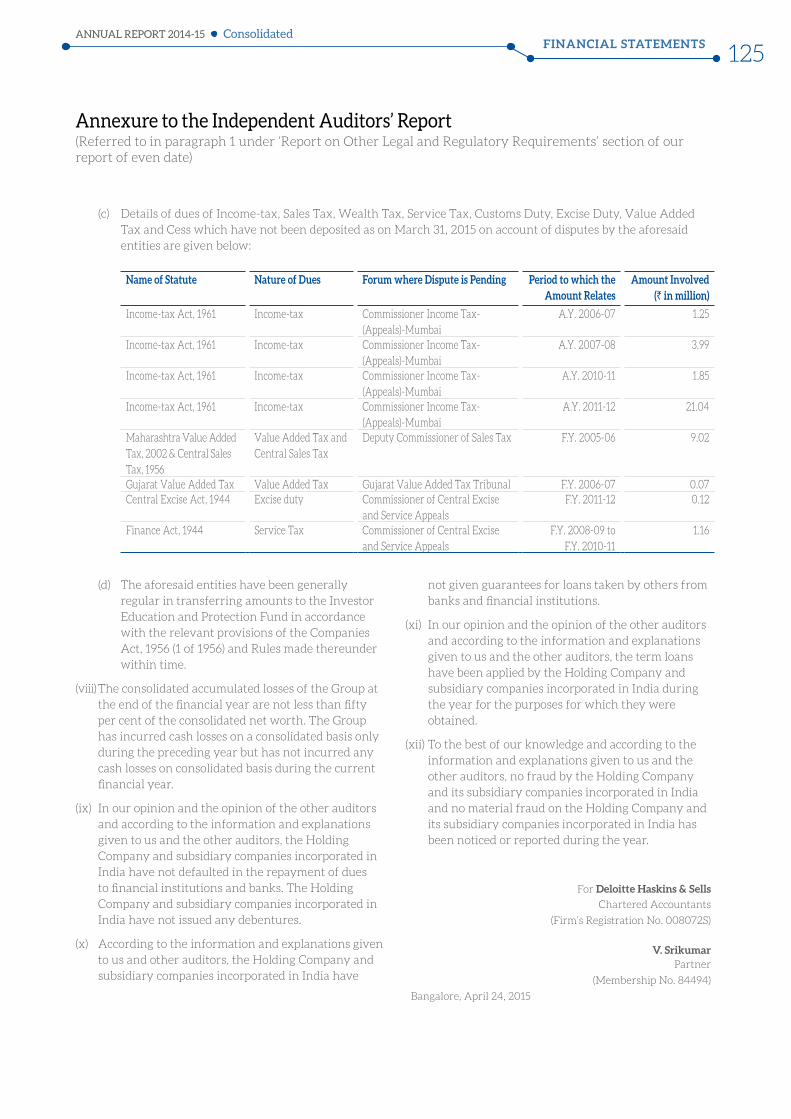
FINANCIAL STATEMENTSANNUAL REPORT 2014-15
125Consolidated
Annexure to the Independent Auditors’ Report(Referred to in paragraph 1 under ‘Report on Other Legal and Regulatory Requirements’ section of our report of even date)
(d) The aforesaid entities have been generally regular in transferring amounts to the Investor Education and Protection Fund in accordance with the relevant provisions of the Companies Act, 1956 (1 of 1956) and Rules made thereunder within time.
(viii) The consolidated accumulated losses of the Group at the end of the financial year are not less than fifty per cent of the consolidated net worth. The Group has incurred cash losses on a consolidated basis only during the preceding year but has not incurred any cash losses on consolidated basis during the current financial year.
(ix) In our opinion and the opinion of the other auditors and according to the information and explanations given to us and the other auditors, the Holding Company and subsidiary companies incorporated in India have not defaulted in the repayment of dues to financial institutions and banks. The Holding Company and subsidiary companies incorporated in India have not issued any debentures.
(x) According to the information and explanations given to us and other auditors, the Holding Company and subsidiary companies incorporated in India have
(c) Details of dues of Income-tax, Sales Tax, Wealth Tax, Service Tax, Customs Duty, Excise Duty, Value Added Tax and Cess which have not been deposited as on March 31, 2015 on account of disputes by the aforesaid entities are given below:
Name of Statute Nature of Dues Forum where Dispute is Pending Period to which the Amount Relates
Amount Involved (` in million)
Income-tax Act, 1961 Income-tax Commissioner Income Tax-(Appeals)-Mumbai
A.Y. 2006-07 1.25
Income-tax Act, 1961 Income-tax Commissioner Income Tax-(Appeals)-Mumbai
A.Y. 2007-08 3.99
Income-tax Act, 1961 Income-tax Commissioner Income Tax-(Appeals)-Mumbai
A.Y. 2010-11 1.85
Income-tax Act, 1961 Income-tax Commissioner Income Tax-(Appeals)-Mumbai
A.Y. 2011-12 21.04
Maharashtra Value Added Tax, 2002 & Central Sales Tax, 1956
Value Added Tax and Central Sales Tax
Deputy Commissioner of Sales Tax F.Y. 2005-06 9.02
Gujarat Value Added Tax Value Added Tax Gujarat Value Added Tax Tribunal F.Y. 2006-07 0.07Central Excise Act, 1944 Excise duty Commissioner of Central Excise
and Service AppealsF.Y. 2011-12 0.12
Finance Act, 1944 Service Tax Commissioner of Central Excise and Service Appeals
F.Y. 2008-09 to F.Y. 2010-11
1.16
not given guarantees for loans taken by others from banks and financial institutions.
(xi) In our opinion and the opinion of the other auditors and according to the information and explanations given to us and the other auditors, the term loans have been applied by the Holding Company and subsidiary companies incorporated in India during the year for the purposes for which they were obtained.
(xii) To the best of our knowledge and according to the information and explanations given to us and the other auditors, no fraud by the Holding Company and its subsidiary companies incorporated in India and no material fraud on the Holding Company and its subsidiary companies incorporated in India has been noticed or reported during the year.
For Deloitte Haskins & Sells
Chartered Accountants
(Firm’s Registration No. 008072S)
V. SrikumarPartner
(Membership No. 84494)
Bangalore, April 24, 2015

SeQuent Scientific Limited Living the Vision
126
(` In Million)
Note No.
As at 31 March 2015
As at 31 March 2014
A EQUITY AND LIABILITIES1 Shareholders’ funds
(a) Share capital 3 304.85 267.40 (b) Reserves and surplus 4 319.81 13.35 (c) Money received against share warrants 28.1 288.08 106.51
912.74 387.26 2 Share application money pending allotment - 180.00 3 Minority interest 1,469.29 45.80 4 Non-current liabilities
(a) Long-term borrowings 5 2,503.22 1,510.84 (b) Deferred tax liabilities (net) 29.7 15.25 1.22 (c) Long-term provisions 6 99.79 80.25
2,618.26 1,592.31 5 Current liabilities
(a) Short-term borrowings 7 2,043.06 2,266.00 (b) Trade payables 8 909.35 1,145.87 (c) Other current liabilities 9 1,074.34 568.03 (d) Short-term provisions 10 49.91 41.87
4,076.66 4,021.77 Total 9,076.95 6,227.14
B ASSETS1 Non-current assets
(a) Fixed assets(i) Tangible assets 11 A 3,901.90 2,168.73 (ii) Intangible assets 11 B 131.75 112.69 (iii) Capital work-in-progress 367.41 390.22 (iv) Intangible assets under development 29.9 23.16 40.15
(b) Goodwill on consolidation 710.65 94.53 (c) Non-current investments 12 580.37 0.36 (d) Long-term loans and advances 13 249.19 775.06 (e) Other non-current assets 14 15.55 17.00
5,979.98 3,598.74 2 Current assets
(a) Current investments 15 5.81 0.77 (b) Inventories 16 943.60 1,013.96 (c) Trade receivables 17 1,154.37 835.43 (d) Cash and cash equivalents 18 384.57 362.13 (e) Short-term loans and advances 19 445.86 381.09 (f) Other current assets 20 162.76 35.02
3,096.97 2,628.40 Total 9,076.95 6,227.14
See accompanying notes forming part of the consolidated financial statements
In terms of our report attached For DELOITTE HASKINS & SELLS For and on Behalf of the Board of Directors Chartered Accountants
V. Srikumar Manish Gupta Dr. Gautam Kumar Das P R KannanPartner Managing Director &
Chief Executive OfficerJoint Managing Director Chief Financial Officer
Preetham HebbarCompany Secretary
Bengaluru, April 24, 2015
Consolidated Balance sheetas at 31st March, 2015
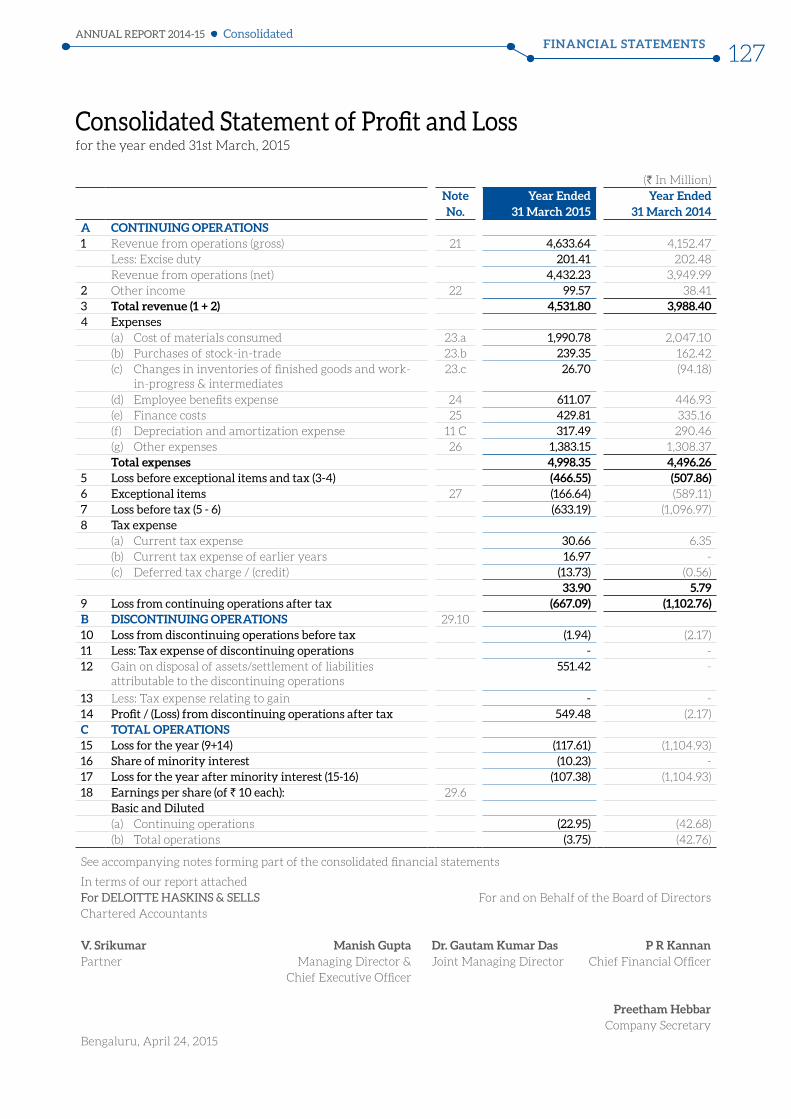
FINANCIAL STATEMENTSANNUAL REPORT 2014-15
127Consolidated
In terms of our report attached For DELOITTE HASKINS & SELLS For and on Behalf of the Board of Directors Chartered Accountants
V. Srikumar Manish Gupta Dr. Gautam Kumar Das P R KannanPartner Managing Director &
Chief Executive OfficerJoint Managing Director Chief Financial Officer
Preetham HebbarCompany Secretary
Bengaluru, April 24, 2015
Consolidated Statement of Profit and Lossfor the year ended 31st March, 2015
(` In Million)Note No.
Year Ended 31 March 2015
Year Ended 31 March 2014
A CONTINUING OPERATIONS1 Revenue from operations (gross) 21 4,633.64 4,152.47
Less: Excise duty 201.41 202.48 Revenue from operations (net) 4,432.23 3,949.99
2 Other income 22 99.57 38.41 3 Total revenue (1 + 2) 4,531.80 3,988.40 4 Expenses
(a) Cost of materials consumed 23.a 1,990.78 2,047.10 (b) Purchases of stock-in-trade 23.b 239.35 162.42 (c) Changes in inventories of finished goods and work-
in-progress & intermediates23.c 26.70 (94.18)
(d) Employee benefits expense 24 611.07 446.93 (e) Finance costs 25 429.81 335.16 (f) Depreciation and amortization expense 11 C 317.49 290.46 (g) Other expenses 26 1,383.15 1,308.37 Total expenses 4,998.35 4,496.26
5 Loss before exceptional items and tax (3-4) (466.55) (507.86)6 Exceptional items 27 (166.64) (589.11)7 Loss before tax (5 - 6) (633.19) (1,096.97)8 Tax expense
(a) Current tax expense 30.66 6.35(b) Current tax expense of earlier years 16.97 - (c) Deferred tax charge / (credit) (13.73) (0.56)
33.90 5.79 9 Loss from continuing operations after tax (667.09) (1,102.76)B DISCONTINUING OPERATIONS 29.1010 Loss from discontinuing operations before tax (1.94) (2.17)11 Less: Tax expense of discontinuing operations - - 12 Gain on disposal of assets/settlement of liabilities
attributable to the discontinuing operations 551.42 -
13 Less: Tax expense relating to gain - - 14 Profit / (Loss) from discontinuing operations after tax 549.48 (2.17)C TOTAL OPERATIONS15 Loss for the year (9+14) (117.61) (1,104.93)16 Share of minority interest (10.23) - 17 Loss for the year after minority interest (15-16) (107.38) (1,104.93)18 Earnings per share (of ` 10 each): 29.6
Basic and Diluted(a) Continuing operations (22.95) (42.68)(b) Total operations (3.75) (42.76)
See accompanying notes forming part of the consolidated financial statements
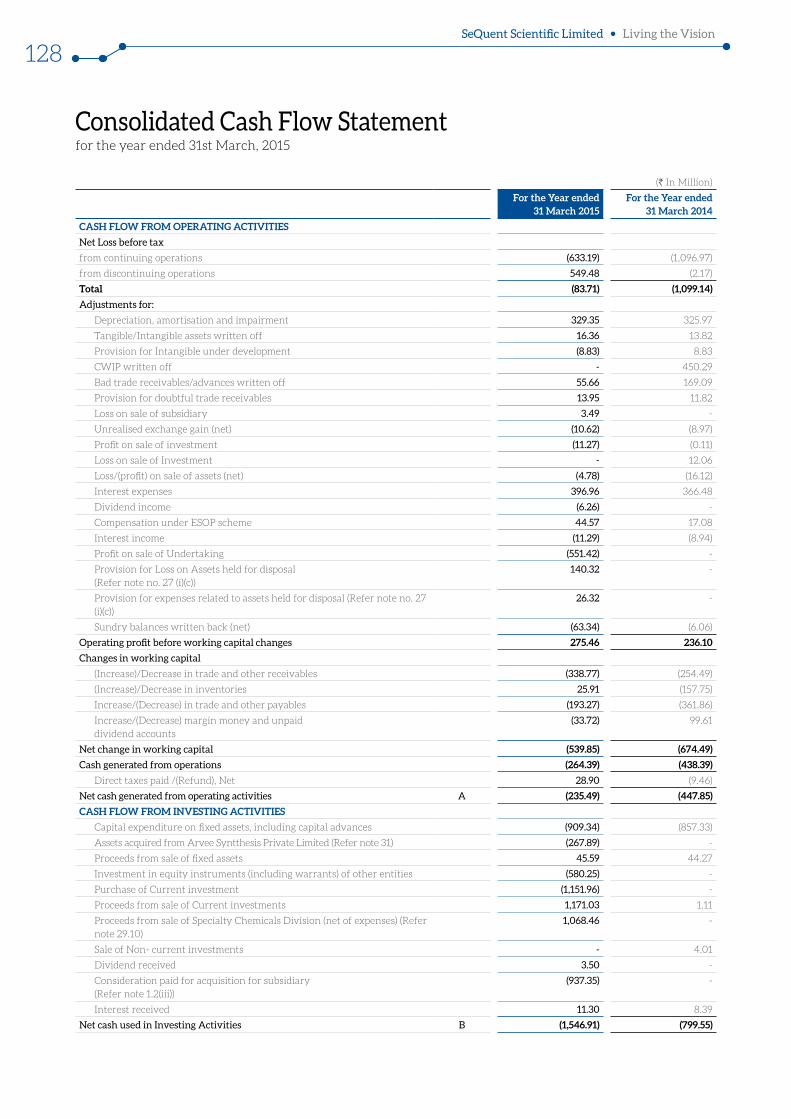
SeQuent Scientific Limited Living the Vision
128
Consolidated Cash Flow Statementfor the year ended 31st March, 2015
(` In Million)
For the Year ended 31 March 2015
For the Year ended 31 March 2014
CASH FLOW FROM OPERATING ACTIVITIES
Net Loss before tax
from continuing operations (633.19) (1,096.97)
from discontinuing operations 549.48 (2.17)
Total (83.71) (1,099.14)
Adjustments for:
Depreciation, amortisation and impairment 329.35 325.97
Tangible/Intangible assets written off 16.36 13.82
Provision for Intangible under development (8.83) 8.83
CWIP written off - 450.29
Bad trade receivables/advances written off 55.66 169.09
Provision for doubtful trade receivables 13.95 11.82
Loss on sale of subsidiary 3.49 -
Unrealised exchange gain (net) (10.62) (8.97)
Profit on sale of investment (11.27) (0.11)
Loss on sale of Investment - 12.06
Loss/(profit) on sale of assets (net) (4.78) (16.12)
Interest expenses 396.96 366.48
Dividend income (6.26) -
Compensation under ESOP scheme 44.57 17.08
Interest income (11.29) (8.94)
Profit on sale of Undertaking (551.42) -
Provision for Loss on Assets held for disposal (Refer note no. 27 (i)(c))
140.32 -
Provision for expenses related to assets held for disposal (Refer note no. 27 (i)(c))
26.32 -
Sundry balances written back (net) (63.34) (6.06)
Operating profit before working capital changes 275.46 236.10
Changes in working capital
(Increase)/Decrease in trade and other receivables (338.77) (254.49)
(Increase)/Decrease in inventories 25.91 (157.75)
Increase/(Decrease) in trade and other payables (193.27) (361.86)
Increase/(Decrease) margin money and unpaid dividend accounts
(33.72) 99.61
Net change in working capital (539.85) (674.49)
Cash generated from operations (264.39) (438.39)
Direct taxes paid /(Refund), Net 28.90 (9.46)
Net cash generated from operating activities A (235.49) (447.85)
CASH FLOW FROM INVESTING ACTIVITIES
Capital expenditure on fixed assets, including capital advances (909.34) (857.33)
Assets acquired from Arvee Syntthesis Private Limited (Refer note 31) (267.89) -
Proceeds from sale of fixed assets 45.59 44.27
Investment in equity instruments (including warrants) of other entities (580.25) -
Purchase of Current investment (1,151.96) -
Proceeds from sale of Current investments 1,171.03 1.11
Proceeds from sale of Specialty Chemicals Division (net of expenses) (Refer note 29.10)
1,068.46 -
Sale of Non- current investments - 4.01
Dividend received 3.50 -
Consideration paid for acquisition for subsidiary (Refer note 1.2(iii))
(937.35) -
Interest received 11.30 8.39
Net cash used in Investing Activities B (1,546.91) (799.55)
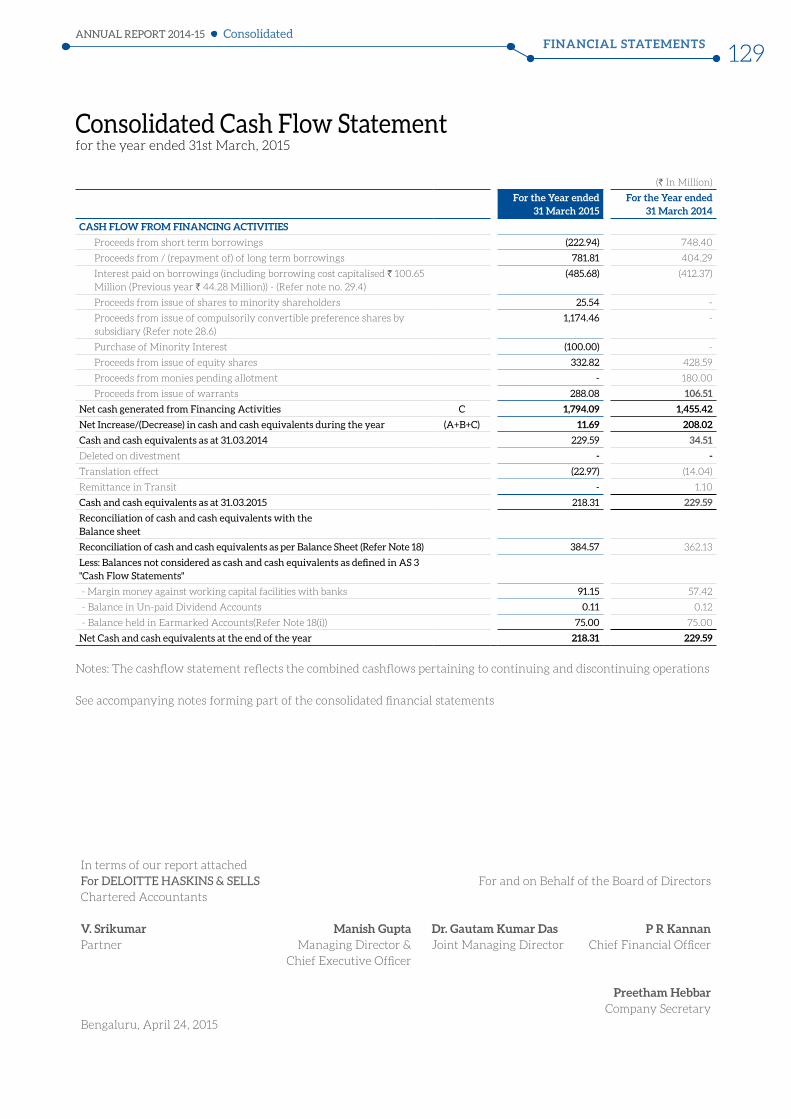
FINANCIAL STATEMENTSANNUAL REPORT 2014-15
129Consolidated
Consolidated Cash Flow Statementfor the year ended 31st March, 2015
(` In Million)
For the Year ended 31 March 2015
For the Year ended 31 March 2014
CASH FLOW FROM FINANCING ACTIVITIES
Proceeds from short term borrowings (222.94) 748.40
Proceeds from / (repayment of) of long term borrowings 781.81 404.29
Interest paid on borrowings (including borrowing cost capitalised ` 100.65 Million (Previous year ` 44.28 Million)) - (Refer note no. 29.4)
(485.68) (412.37)
Proceeds from issue of shares to minority shareholders 25.54 -
Proceeds from issue of compulsorily convertible preference shares by subsidiary (Refer note 28.6)
1,174.46 -
Purchase of Minority Interest (100.00) -
Proceeds from issue of equity shares 332.82 428.59
Proceeds from monies pending allotment - 180.00
Proceeds from issue of warrants 288.08 106.51
Net cash generated from Financing Activities C 1,794.09 1,455.42
Net Increase/(Decrease) in cash and cash equivalents during the year (A+B+C) 11.69 208.02
Cash and cash equivalents as at 31.03.2014 229.59 34.51
Deleted on divestment - -
Translation effect (22.97) (14.04)
Remittance in Transit - 1.10
Cash and cash equivalents as at 31.03.2015 218.31 229.59
Reconciliation of cash and cash equivalents with the Balance sheet
Reconciliation of cash and cash equivalents as per Balance Sheet (Refer Note 18) 384.57 362.13
Less: Balances not considered as cash and cash equivalents as defined in AS 3 "Cash Flow Statements"
- Margin money against working capital facilities with banks 91.15 57.42
- Balance in Un-paid Dividend Accounts 0.11 0.12
- Balance held in Earmarked Accounts(Refer Note 18(i)) 75.00 75.00
Net Cash and cash equivalents at the end of the year 218.31 229.59
Notes: The cashflow statement reflects the combined cashflows pertaining to continuing and discontinuing operations
See accompanying notes forming part of the consolidated financial statements
In terms of our report attached For DELOITTE HASKINS & SELLS For and on Behalf of the Board of Directors Chartered Accountants
V. Srikumar Manish Gupta Dr. Gautam Kumar Das P R KannanPartner Managing Director &
Chief Executive OfficerJoint Managing Director Chief Financial Officer
Preetham HebbarCompany Secretary
Bengaluru, April 24, 2015

Notes forming part of the consolidated financial statements
SeQuent Scientific Limited Living the Vision
130
Note
1 BASIS OF CONSOLIDATION The consolidated financial statements relate to SeQuent Scientific
Limited (the Company) and its subsidiaries companies together “the Group”. The financial statements of the entities in the Group used in the consolidation are drawn up to the same reporting date as of the Company, i.e. 31 March 2015.
1.1 Principles of consolidation The consolidated financial statements have been prepared on the
following basis:
(i) The financial statements of the Company and its subsidiary companies have been consolidated on a line–by-line basis by adding together like items of assets, liabilities, income and expenses. The intra group balances, intra group transactions and unrealised profits or losses have been eliminated fully.
(ii) The excess of cost to the Company of its investments in the subsidiary companies over its share of the equity of the subsidiary companies, at the dates on which the investments in the subsidiary companies were made, is recognised as ‘goodwill’, being an asset in consolidated financial statements. Where the share of the equity in the subsidiary companies as on the date of investment is in excess of cost of investments of the Company, it is recognised as ‘Capital Reserve’ and shown under the head ‘Reserves and Surplus’. Goodwill arising on consolidation is not amortised but tested for impairment. The ‘Goodwill’ / ‘Capital Reserve’ is determined separately for each subsidiary company and such amounts are not set off between different entities.
(iii ) Minority interest in the net assets of consolidated subsidiaries consists of the amount of equity attributable to the minority shareholders at the dates on which investments are made by the Company in the subsidiary companies and further movements in their share in the equity, subsequent to the dates of investments as stated above.
1.2 Information on subsidiary companies: (i) The following subsidiary companies are considered in the consolidated financial statements
Sl no
Name of the entity Country of Incorporation
Ownership at 31 March 2015 held by
Status % of effective ownership held either
directly or through subsidiary as at 31 March 2015
% of effective ownership held
either directly or through
subsidiary as at 31 March 2014
1 SeQuent Global Holdings Limited
Mauritius SeQuent Scientific Limited
Subsidiary 100.00% 100.00%
2 SeQuent European Holdings Limited
Cyprus SeQuent Global Holdings Limited
Subsidiary 100.00% 100.00%
3 SeQuent Research Limited
India SeQuent Scientific Limited
Subsidiary 100.00% 100.00%
4 Elysian Life Sciences Private Limited
India SeQuent Scientific Limited
Subsidiary 100.00% 100.00%
5 Vedic Fanxipang Pharma Chemic Company Limited
Vietnam Elysian Life Sciences Private Limited
Subsidiary [Refer note (b) below] 100.00%
6 SeQuent Anti Biotics Private Limited
India SeQuent Scientific Limited
Subsidiary 100.00% 100.00%
7 SeQuent Pharmaceuticals Private Limited [Formerly known as SeQuent Oncolytics Private Limited]
India SeQuent Scientific Limited
Subsidiary 99.99% 99.99%
8 SeQuent Penems Private Limited
India SeQuent Scientific Limited
Subsidiary 89.23% 89.23%
9 Elysian Life Science (Mauritius) Ltd
Mauritius SeQuent Scientific Limited and Vedic Fanxipang Pharma Chemic Company Limited
Subsidiary [Refer note (c) below] 100.00%
10 Alivira Animal Health Limited
India SeQuent Scientific Limited
Subsidiary 91.92% [Refer note (d) below]
100%
11 Alivira Animal Health Limited
Ireland Alivira Animal Health Limited, India
Subsidiary 91.92% [Refer note - (e) below]
-
12 Provet Veteriner Ürünleri San. ve Tic. A. .
Turkey Alivira Animal Health Limited, Ireland
Subsidiary 55.15% [Refer note - (f) below]
-
Note (a) In respect of entity in Sl. No.3 & Sl. No. 12, the Company’s cost of investment is in excess of its share of equity on the date of investment and the
difference has been recognised as Goodwill. In respect of Sl. No.10, the Company’s net worth is in excess of the cost of investment on the date of recognition and the difference has been recognised on Capital reserve amounting to ` 1.82 Million.
(b) Vedic Fanxipang Pharma Chemic Company Limited has been disposed off during the year. (c) Elysian Life Science (Mauritius) Limited has been voluntarily wound up during the year. (d) During the year, the Company purchased 7,400,000 equity shares of Alivira Animal Health Limited, India and the subsidiary issued 2,414,165
equity shares to other parties. (e) Alivira Animal Health Limited, Ireland was incorporated on 1 September 2014. (f) During the year, Alivira Animal Health Limited, Ireland acquired 60% shareholding in Provet Veteriner ‘Ürünleri San. ve Tic. A. .
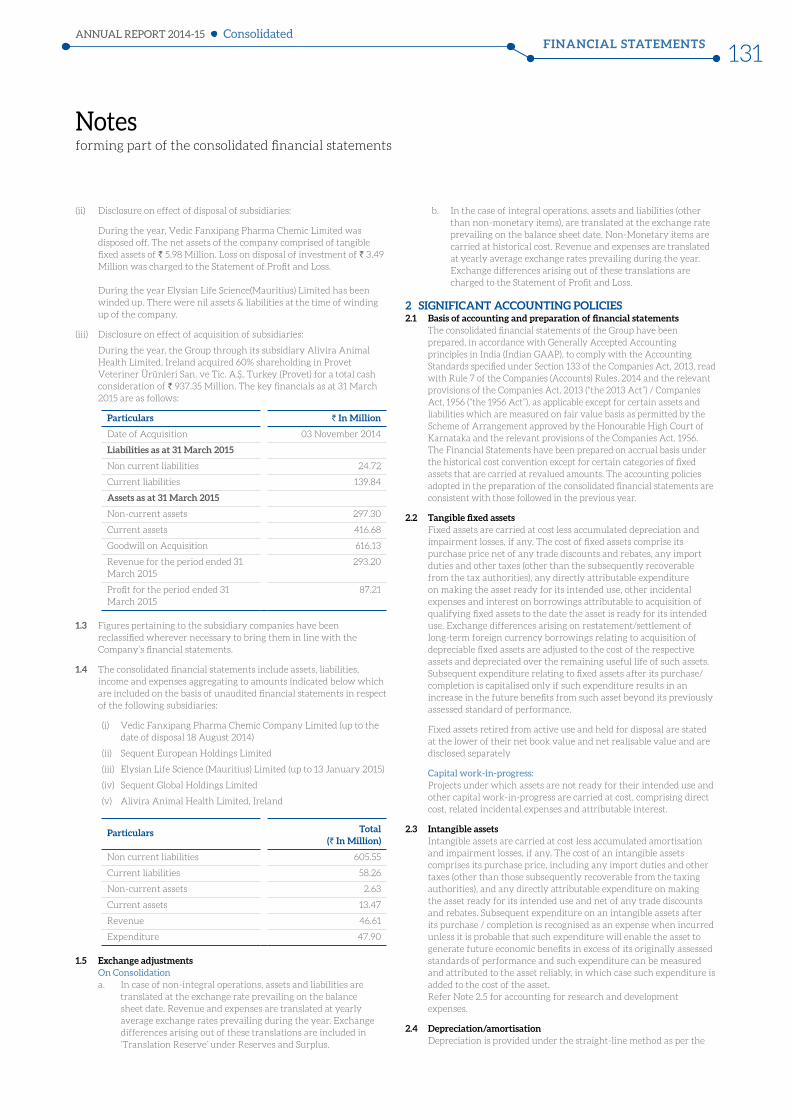
Notes forming part of the consolidated financial statements
FINANCIAL STATEMENTSANNUAL REPORT 2014-15
131Consolidated
(ii) Disclosure on effect of disposal of subsidiaries:
During the year, Vedic Fanxipang Pharma Chemic Limited was disposed off. The net assets of the company comprised of tangible fixed assets of ` 5.98 Million. Loss on disposal of investment of ` 3.49 Million was charged to the Statement of Profit and Loss. During the year Elysian Life Science(Mauritius) Limited has been winded up. There were nil assets & liabilities at the time of winding up of the company.
(iii) Disclosure on effect of acquisition of subsidiaries:
During the year, the Group through its subsidiary Alivira Animal Health Limited, Ireland acquired 60% shareholding in Provet Veteriner Ürünleri San. ve Tic. A. ., Turkey (Provet) for a total cash consideration of ` 937.35 Million. The key financials as at 31 March 2015 are as follows:
Particulars ` In Million
Date of Acquisition 03 November 2014
Liabilities as at 31 March 2015
Non current liabilities 24.72
Current liabilities 139.84
Assets as at 31 March 2015
Non-current assets 297.30
Current assets 416.68
Goodwill on Acquisition 616.13
Revenue for the period ended 31 March 2015
293.20
Profit for the period ended 31 March 2015
87.21
1.3 Figures pertaining to the subsidiary companies have been reclassified wherever necessary to bring them in line with the Company’s financial statements.
1.4 The consolidated financial statements include assets, liabilities, income and expenses aggregating to amounts indicated below which are included on the basis of unaudited financial statements in respect of the following subsidiaries:
(i) Vedic Fanxipang Pharma Chemic Company Limited (up to the date of disposal 18 August 2014)
(ii) Sequent European Holdings Limited
(iii) Elysian Life Science (Mauritius) Limited (up to 13 January 2015)
(iv) Sequent Global Holdings Limited
(v) Alivira Animal Health Limited, Ireland
Particulars Total (` In Million)
Non current liabilities 605.55
Current liabilities 58.26
Non-current assets 2.63
Current assets 13.47
Revenue 46.61
Expenditure 47.90
1.5 Exchange adjustments On Consolidation a. In case of non-integral operations, assets and liabilities are
translated at the exchange rate prevailing on the balance sheet date. Revenue and expenses are translated at yearly average exchange rates prevailing during the year. Exchange differences arising out of these translations are included in ‘Translation Reserve’ under Reserves and Surplus.
b. In the case of integral operations, assets and liabilities (other than non-monetary items), are translated at the exchange rate prevailing on the balance sheet date. Non-Monetary items are carried at historical cost. Revenue and expenses are translated at yearly average exchange rates prevailing during the year. Exchange differences arising out of these translations are charged to the Statement of Profit and Loss.
2 SIGNIFICANT ACCOUNTING POLICIES 2.1 Basis of accounting and preparation of financial statements The consolidated financial statements of the Group have been
prepared, in accordance with Generally Accepted Accounting principles in India (Indian GAAP), to comply with the Accounting Standards specified under Section 133 of the Companies Act, 2013, read with Rule 7 of the Companies (Accounts) Rules, 2014 and the relevant provisions of the Companies Act, 2013 (“the 2013 Act”) / Companies Act, 1956 (“the 1956 Act”), as applicable except for certain assets and liabilities which are measured on fair value basis as permitted by the Scheme of Arrangement approved by the Honourable High Court of Karnataka and the relevant provisions of the Companies Act, 1956. The Financial Statements have been prepared on accrual basis under the historical cost convention except for certain categories of fixed assets that are carried at revalued amounts. The accounting policies adopted in the preparation of the consolidated financial statements are consistent with those followed in the previous year.
2.2 Tangible fixed assets Fixed assets are carried at cost less accumulated depreciation and
impairment losses, if any. The cost of fixed assets comprise its purchase price net of any trade discounts and rebates, any import duties and other taxes (other than the subsequently recoverable from the tax authorities), any directly attributable expenditure on making the asset ready for its intended use, other incidental expenses and interest on borrowings attributable to acquisition of qualifying fixed assets to the date the asset is ready for its intended use. Exchange differences arising on restatement/settlement of long-term foreign currency borrowings relating to acquisition of depreciable fixed assets are adjusted to the cost of the respective assets and depreciated over the remaining useful life of such assets. Subsequent expenditure relating to fixed assets after its purchase/completion is capitalised only if such expenditure results in an increase in the future benefits from such asset beyond its previously assessed standard of performance.
Fixed assets retired from active use and held for disposal are stated at the lower of their net book value and net realisable value and are disclosed separately
Capital work-in-progress: Projects under which assets are not ready for their intended use and
other capital work-in-progress are carried at cost, comprising direct cost, related incidental expenses and attributable interest.
2.3 Intangible assets Intangible assets are carried at cost less accumulated amortisation
and impairment losses, if any. The cost of an intangible assets comprises its purchase price, including any import duties and other taxes (other than those subsequently recoverable from the taxing authorities), and any directly attributable expenditure on making the asset ready for its intended use and net of any trade discounts and rebates. Subsequent expenditure on an intangible assets after its purchase / completion is recognised as an expense when incurred unless it is probable that such expenditure will enable the asset to generate future economic benefits in excess of its originally assessed standards of performance and such expenditure can be measured and attributed to the asset reliably, in which case such expenditure is added to the cost of the asset. Refer Note 2.5 for accounting for research and development expenses.
2.4 Depreciation/amortisation Depreciation is provided under the straight-line method as per the
Notes forming part of the consolidated financial statements
SeQuent Scientific Limited Living the Vision
132
useful life prescribed in Schedule II to the Companies Act, 2013 except in respect of the following categories of assets, in whose case the life of the assets has been assessed as under based on technical advice, taking into account the nature of the asset, the estimated usage of the asset, the operating conditions of the asset, past history of replacement, anticipated technological changes, manufacturers warranties and maintenance support, etc.
Depreciation / amortisation is provided under the straight-line method based on the useful lives:
Nature of Asset Useful life in years
Buildings 10 - 60
Furniture and fixtures 5 - 10
Office equipment 5
Plant and Machinery 5 - 12
Computers 3 - 6
Motor vehicles 3 - 8
Leasehold land 85 -96
Leasehold property development Over lease period
Intangible assets are amortised under the straight line method over the useful life of assets as follows:
Product and process development : 5 Years Acquired Software : 3 Years
The estimated useful life of the intangible assets and its amortisation period are reviewed at the end of each financial year and the amortisation method is revised to reflect the changed pattern.
With respect to assets carried at revalued amounts as permitted under the Scheme of amalgamation, depreciation is recorded under the straight line method over the balance remaining useful life of the assets.
2.5 Research and development costs Revenue expenditure pertaining to research is charged to the
Statement of Profit and Loss. Development costs of products are also charged to the Statement of Profit and Loss unless a product’s technological feasibility has been established, in which case such expenditure is capitalised. The amount capitalised comprises expenditure that can be directly attributed or allocated on a reasonable and consistent basis to creating, producing and making the asset ready for its intended use. Fixed assets utilised for research and development are capitalised and depreciated in accordance with the policies stated for tangible fixed assets and intangible assets.
2.6 Impairment of assets As at each Balance Sheet date, the carrying amount of fixed assets is
tested for impairment if impairment conditions exist. An impairment loss is recognized when the carrying amount of an asset exceeds its recoverable amount. Recoverable amount is determined:
(a) in the case of an individual asset, at the higher of the net selling price and value in use.
(b) in the case of cash generating units, at the higher of the unit’s net selling price and the value in use.
Value in use is determined as the present value of estimated future cash flows from the continuing use of an asset and from its disposal at the end of its useful life.
2.7 Investments Current investments are carried at lower of cost and fair market
value. Provision is made to recognize decline, if any, in the carrying value. Long-term investments are carried individually at cost less provision for diminution, other than temporary in the value of the investment.
2.8 Inventory Inventories comprise raw materials, packing materials, consumables,
work in process, intermediates and finished goods. These are valued at the lower of cost and net realizable value. Cost is determined on First in First out basis as follows:
(i) Raw materials, packing materials and consumables
At purchase cost including other cost incurred in bringing materials/consumables to their present location and condition
(ii) Work in process and Intermediates
At material cost, conversion costs and appropriate share of production overheads
(iii) Finished goods
At material cost, conversion costs and an appropriate share of production overheads and excise duty, wherever applicable.
2.9 Revenue recognition Revenue from export sales is recognized when significant risks and
rewards of ownership is transferred on the basis of the shipping bills for exports. Revenue from domestic sales is recognized based on the transfer of significant risks and rewards of ownership which generally coincides with dispatch. Sales include excise duty and are stated net of discounts, other taxes, and sales returns.
Income from sale of technical know-how is recognized, when the risk and right to use is transferred to the buyer as per terms of contract.
Analytical services income is recognized when the services are completed as per the terms of the agreement and when no significant uncertainty as to its determination or realization exists. Revenue is net of discount and taxes.
In case of long term contracts involving multiple activities, revenue is recognized as and when the individual activities are completed. In the event of any expected losses on a contract, the entire amount is provided for in the accounting period in which such losses are first anticipated.
Dividend income is recognised when the right to receive the same is established. Interest income is recognised on an accrual basis.
Export incentives are accrued for based on fulfilment of eligibility criteria for availing the incentives and when there is no significant uncertainty in receiving the same.
2.10 Employee benefits Short term employee benefits like provident fund, medical, leave
travel, employee state insurance scheme etc. are accrued based on the terms of employment when services are rendered by the employees and charged as an expense to the statement of profit and loss.
Leave balances standing to the credit of the employees that are expected to be availed in the short term are provided for on full cost basis. Liability for unavailed leave considered to be long term is carried based on an actuarial valuation carried out at the end of financial year.
Liability for gratuity for the parent Group is funded with LIC and SBI Life Insurance group Limited. Gratuity and termination benefits expenses for the year are accounted based on actuarial valuation carried out using Projected Unit Credit Method as at the end of the fiscal year. The obligation recognised in the balance sheet represents the present value of the defined benefit obligation as adjusted for unrecognized past service cost, and as reduced by the fair value of scheme assets. Any asset resulting from this calculation is limited to past service cost, plus the present value of available refunds and reductions in future contributions to the scheme. “
Notes forming part of the consolidated financial statements
FINANCIAL STATEMENTSANNUAL REPORT 2014-15
133Consolidated
2.11 Foreign currency transactions Initial recognition Transactions in foreign currencies entered into by the Group
are accounted at the exchange rates prevailing on the date of the transaction or at rates that closely approximate the rate at the date of the transaction.
Measurement of foreign currency monetary items at the Balance Sheet date
Foreign currency monetary items of the Group and its net investment in non-integral foreign operations outstanding at the Balance Sheet date are restated at the year-end rates. Non monetary items of the Group are carried at historical cost. Revenue and expenses are translated at the average exchange rates prevailing during the year.
Treatment of exchange differences Exchange differences arising on settlement / restatement of foreign
currency monetary assets and liabilities of the Group are recognised as income or expense in the statement of profit and loss.
Accounting of forward contracts Premium / discount on forward exchange contracts, which are not
intended for trading or speculation purposes, are amortised over the period of the contracts if such contracts relate to monetary items as at the Balance Sheet date.
2.12 Taxes on income Income Tax comprises the current tax provision and the net change
in the deferred tax asset or liability during the year.
Deferred tax assets and liabilities are recognized for the future tax consequences arising out of temporary differences between the carrying values of the assets and liabilities and their respective tax bases. Deferred tax assets and liabilities are measured using enacted tax rates applicable on the Balance Sheet date. Deferred tax assets are recognised for timing differences of items other than unabsorbed depreciation and carry forward losses only to the extent that reasonable certainty exists that sufficient future taxable income will be available against which these can be realised. However, if there are unabsorbed depreciation and carry forward of losses, deferred tax assets are recognised only if there is virtual certainty that there will be sufficient future taxable income available to realise the assets. Deferred tax assets and liabilities are offset if such items relate to taxes on income levied by the same governing tax laws and the group has a legally enforceable right for such set off. Deferred tax assets are reviewed at each balance sheet date for their reliability.
Current tax is determined on the basis of taxable income and tax credits computed for each of the entities in the Group in accordance with the applicable tax rates and the provisions of applicable tax laws of the respective jurisdictions where the entities are located.
Minimum alternative tax (‘MAT’) paid in accordance to the tax laws, which gives rise to future economic benefits in the form of adjustment of future tax liability, is considered as an asset if there is convincing evidence that the group will pay normal income tax in future years. Accordingly, MAT is recognized as an assets in the balance sheet when it is probable that the future economic benefit associated with it will flow to the group and asset can be measured reliably.
2.13 Leases Lease arrangements, where the risks and rewards incident to
ownership of an asset substantially vest with the lessor, are classified as operating leases and the lease rentals thereon are recognised in the statement of profit and loss on straight line basis.
2.14 Employee stock option scheme Employee stock options are accounted in accordance with the
guidelines stipulated by SEBI and Guidance Note on Accounting for Employee Share-based Payments. The difference between the closing market price of the shares underlying the options granted on the date of grant of option and the option price is expensed under employee benefit expenses over the vesting period.
2.15 Earnings per share (EPS) In determining the Earnings per share, the Group considers the
net profit after tax. The number of shares used in computing Basic Earnings per share is the weighted average number of equity shares outstanding during the year. The number of shares used in computing Diluted Earnings per share comprises the weighted average number of equity shares considered for deriving Basic earnings per share and also the weighted average number of equity shares that could have been issued on the conversion of all dilutive potential equity shares. Dilutive potential equity shares are deemed converted as of the beginning of the year unless issued at a later date.
2.16 Provisions and contingencies A provision is recognized when the group has a present legal or
constructive obligation as a result of past event and it is probable that an outflow of resources will be required to settle the obligation, in respect of which reliable estimate can be made. Provisions (excluding retirement benefits) are not discounted to its present value and are determined based on best estimate required to settle the obligation at the balance sheet date. These are reviewed at each balance sheet date and adjusted to reflect the current best estimate. Contingent liabilities are not recognized but are disclosed in the notes to financial statements.
2.17 Use of estimates The preparation of the consolidated financial statements in
conformity with the Accounting Standards generally accepted in India requires that the Management makes estimates and assumptions that affect the reported amounts of assets and liabilities, disclosure of contingent liabilities as at the date of the financial statements and the reported amounts of revenue and expenses during the reported period. Management believes that the estimates used in preparation of consolidated financial statement are prudent and reasonable. Actual results could differ from those estimates and the estimates are recognised in the period in which the results are known/materialise.
2.18 Segment Segments have been identified taking into account the nature of
services, the differing risks and returns, the organizational structure and the internal reporting system.
2.19 Insurance claims Insurance claims are accounted for on the basis of claims admitted
/ expected to be admitted and to the extent that there is no uncertainty in receiving the claims.
2.20 Borrowing costs Borrowing costs include interest, amortisation of ancillary costs
incurred and exchange differences arising from foreign currency borrowings to the extent they are regarded as an adjustment to the interest cost. Costs in connection with the borrowing of funds to the extent not directly related to the acquisition of qualifying assets are charged to the Statement of Profit and Loss over the tenure of the loan. Borrowing costs, allocated to and utilised for qualifying assets, pertaining to the period from commencement of activities relating to construction / development of the qualifying asset upto the date of capitalisation of such asset is added to the cost of the assets. Capitalisation of borrowing costs is suspended and charged to the Statement of Profit and Loss during extended periods when active development activity on the qualifying assets is interrupted.
2.21 Cash flow statement Cash flows are reported using the indirect method, whereby profit / (loss)
before extraordinary items and tax is adjusted for the effects of transactions of non-cash nature and any deferrals or accruals of past or future cash receipts or payments. The cash flows from operating, investing and financing activities of the Group are segregated based on the available information.
2.22 Cash and cash equivalents (for purposes of cash flow statement) Cash comprises cash on hand and demand deposits with banks.
Cash equivalents are short-term balances (with an original maturity of three months or less from the date of acquisition), highly liquid investments that are readily convertible into known amounts of cash and which are subject to insignificant risk of changes in value.
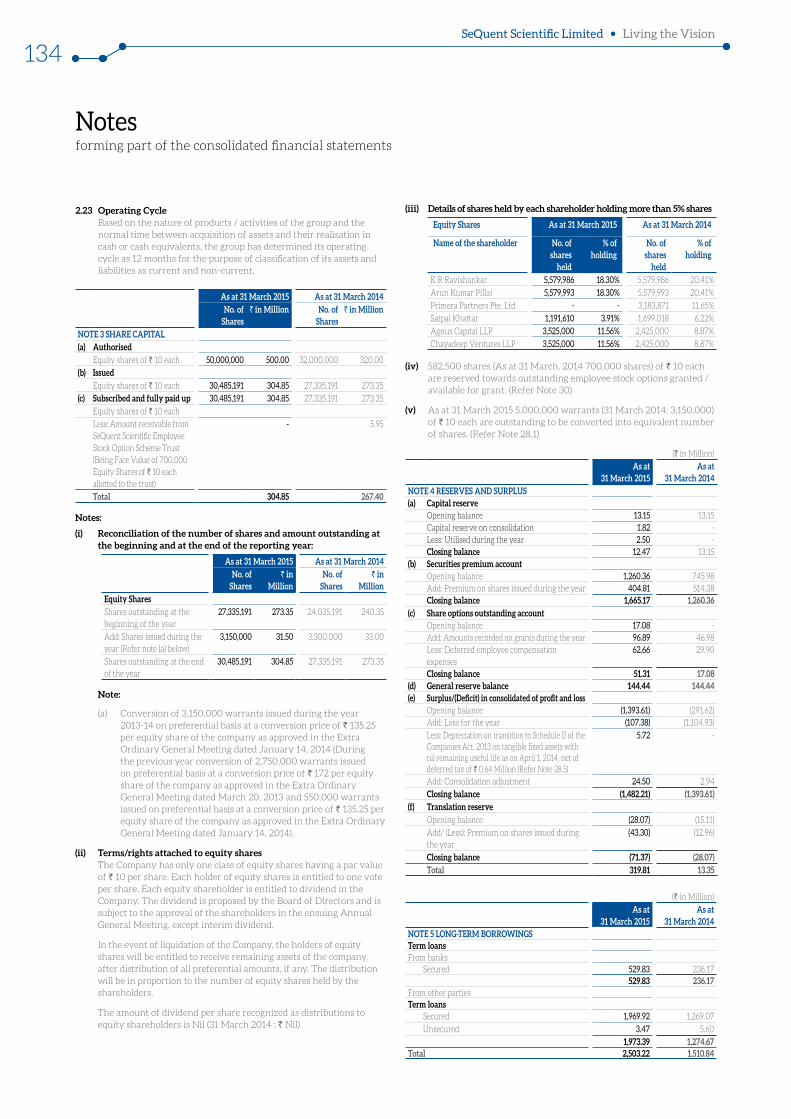
Notes forming part of the consolidated financial statements
SeQuent Scientific Limited Living the Vision
134
2.23 Operating Cycle Based on the nature of products / activities of the group and the
normal time between acquisition of assets and their realisation in cash or cash equivalents, the group has determined its operating cycle as 12 months for the purpose of classification of its assets and liabilities as current and non-current.
As at 31 March 2015 As at 31 March 2014 No. of
Shares` in Million No. of
Shares` in Million
NOTE 3 SHARE CAPITAL(a) Authorised
Equity shares of ` 10 each 50,000,000 500.00 32,000,000 320.00
(b) IssuedEquity shares of ` 10 each 30,485,191 304.85 27,335,191 273.35
(c) Subscribed and fully paid up 30,485,191 304.85 27,335,191 273.35
Equity shares of ` 10 each
Less: Amount receivable from SeQuent Scientific Employee Stock Option Scheme Trust (Being Face Value of 700,000 Equity Shares of ` 10 each allotted to the trust)
- 5.95
Total 304.85 267.40
Notes:
(i) Reconciliation of the number of shares and amount outstanding at the beginning and at the end of the reporting year:
As at 31 March 2015 As at 31 March 2014No. of
Shares` in
MillionNo. of
Shares` in
MillionEquity SharesShares outstanding at the beginning of the year
27,335,191 273.35 24,035,191 240.35
Add: Shares issued during the year (Refer note (a) below)
3,150,000 31.50 3,300,000 33.00
Shares outstanding at the end of the year
30,485,191 304.85 27,335,191 273.35
Note:
(a) Conversion of 3,150,000 warrants issued during the year 2013-14 on preferential basis at a conversion price of ` 135.25 per equity share of the company as approved in the Extra Ordinary General Meeting dated January 14, 2014 (During the previous year conversion of 2,750,000 warrants issued on preferential basis at a conversion price of ` 172 per equity share of the company as approved in the Extra Ordinary General Meeting dated March 20, 2013 and 550,000 warrants issued on preferential basis at a conversion price of ` 135.25 per equity share of the company as approved in the Extra Ordinary General Meeting dated January 14, 2014).
(ii) Terms/rights attached to equity shares The Company has only one class of equity shares having a par value
of ` 10 per share. Each holder of equity shares is entitled to one vote per share. Each equity shareholder is entitled to dividend in the Company. The dividend is proposed by the Board of Directors and is subject to the approval of the shareholders in the ensuing Annual General Meeting, except interim dividend.
In the event of liquidation of the Company, the holders of equity shares will be entitled to receive remaining assets of the company, after distribution of all preferential amounts, if any. The distribution will be in proportion to the number of equity shares held by the shareholders.
The amount of dividend per share recognized as distributions to equity shareholders is Nil (31 March 2014 : ` Nil)
(iii) Details of shares held by each shareholder holding more than 5% shares
Equity Shares As at 31 March 2015 As at 31 March 2014
Name of the shareholder No. of shares
held
% of holding
No. of shares
held
% of holding
K R Ravishankar 5,579,986 18.30% 5,579,986 20.41%
Arun Kumar Pillai 5,579,993 18.30% 5,579,993 20.41%
Primera Partners Pte. Ltd - - 3,183,871 11.65%
Satpal Khattar 1,191,610 3.91% 1,699,018 6.22%
Agnus Capital LLP 3,525,000 11.56% 2,425,000 8.87%
Chayadeep Ventures LLP 3,525,000 11.56% 2,425,000 8.87%
(iv) 582,500 shares (As at 31 March, 2014 700,000 shares) of ` 10 each are reserved towards outstanding employee stock options granted / available for grant. (Refer Note 30)
(v) As at 31 March 2015 5,000,000 warrants (31 March 2014: 3,150,000) of ` 10 each are outstanding to be converted into equivalent number of shares. (Refer Note 28.1)
(` in Million)
As at 31 March 2015
As at 31 March 2014
NOTE 4 RESERVES AND SURPLUS (a) Capital reserve
Opening balance 13.15 13.15 Capital reserve on consolidation 1.82 - Less: Utilised during the year 2.50 - Closing balance 12.47 13.15
(b) Securities premium accountOpening balance 1,260.36 745.98 Add: Premium on shares issued during the year 404.81 514.38 Closing balance 1,665.17 1,260.36
(c) Share options outstanding accountOpening balance 17.08 - Add: Amounts recorded on grants during the year 96.89 46.98 Less: Deferred employee compensation expenses
62.66 29.90
Closing balance 51.31 17.08 (d) General reserve balance 144.44 144.44 (e) Surplus/(Deficit) in consolidated of profit and loss
Opening balance (1,393.61) (291.62)Add: Loss for the year (107.38) (1,104.93)
Less: Depreciation on transition to Schedule II of the Companies Act, 2013 on tangible fixed assets with nil remaining useful life as on April 1, 2014, net of deferred tax of ` 0.64 Million (Refer Note 28.5)
5.72 -
Add: Consolidation adjustment 24.50 2.94
Closing balance (1,482.21) (1,393.61)(f) Translation reserve
Opening balance (28.07) (15.11)
Add/ (Less): Premium on shares issued during the year
(43.30) (12.96)
Closing balance (71.37) (28.07)Total 319.81 13.35
(` in Million)
As at 31 March 2015
As at 31 March 2014
NOTE 5 LONG-TERM BORROWINGS Term loans From banks
Secured 529.83 236.17 529.83 236.17
From other parties Term loans
Secured 1,969.92 1,269.07
Unsecured 3.47 5.60
1,973.39 1,274.67 Total 2,503.22 1,510.84
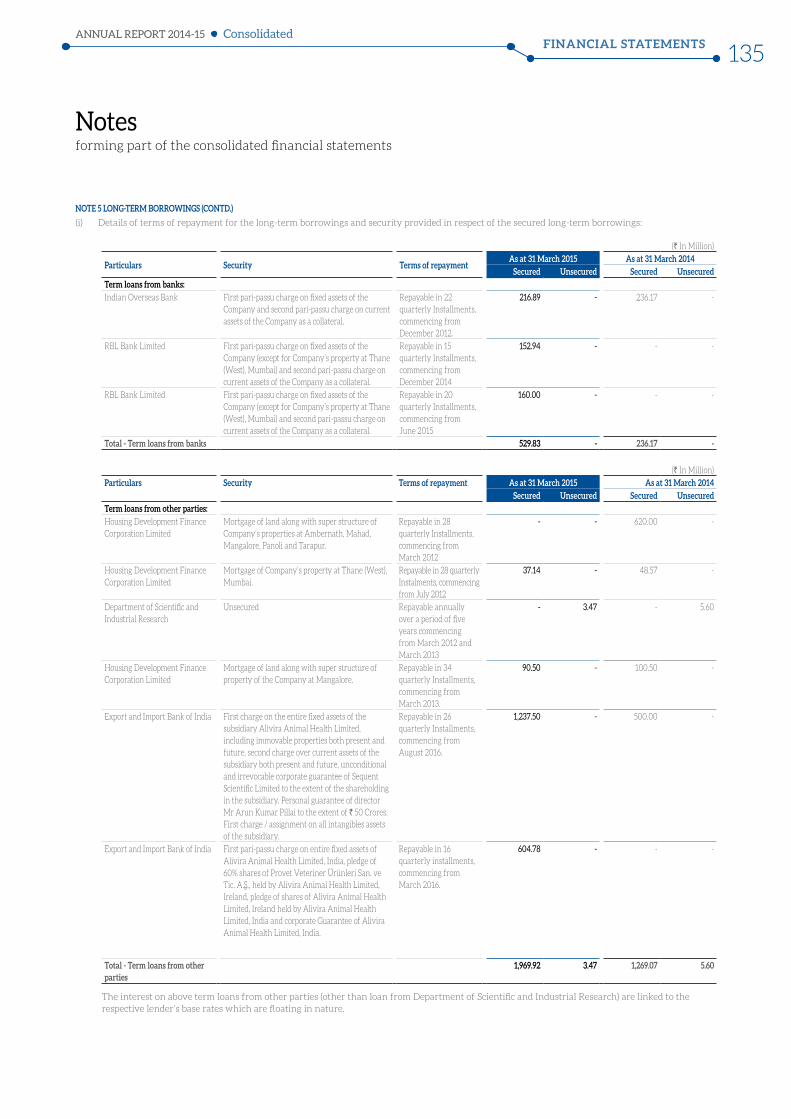
Notes forming part of the consolidated financial statements
FINANCIAL STATEMENTSANNUAL REPORT 2014-15
135Consolidated
NOTE 5 LONG-TERM BORROWINGS (CONTD.)
(i) Details of terms of repayment for the long-term borrowings and security provided in respect of the secured long-term borrowings:
(` In Million)
Particulars Security Terms of repaymentAs at 31 March 2015 As at 31 March 2014
Secured Unsecured Secured UnsecuredTerm loans from banks:Indian Overseas Bank First pari-passu charge on fixed assets of the
Company and second pari-passu charge on current assets of the Company as a collateral.
Repayable in 22 quarterly Installments, commencing from December 2012.
216.89 - 236.17 -
RBL Bank Limited First pari-passu charge on fixed assets of the Company (except for Company’s property at Thane (West), Mumbai) and second pari-passu charge on current assets of the Company as a collateral.
Repayable in 15 quarterly Installments, commencing from December 2014
152.94 - - -
RBL Bank Limited First pari-passu charge on fixed assets of the Company (except for Company’s property at Thane (West), Mumbai) and second pari-passu charge on current assets of the Company as a collateral.
Repayable in 20 quarterly Installments, commencing from June 2015
160.00 - - -
Total - Term loans from banks 529.83 - 236.17 -
(` In Million)
Particulars Security Terms of repayment As at 31 March 2015 As at 31 March 2014Secured Unsecured Secured Unsecured
Term loans from other parties:Housing Development Finance Corporation Limited
Mortgage of land along with super structure of Company’s properties at Ambernath, Mahad, Mangalore, Panoli and Tarapur.
Repayable in 28 quarterly Installments, commencing from March 2012
- - 620.00 -
Housing Development Finance Corporation Limited
Mortgage of Company’s property at Thane (West), Mumbai.
Repayable in 28 quarterly Instalments, commencing from July 2012
37.14 - 48.57 -
Department of Scientific and Industrial Research
Unsecured Repayable annually over a period of five years commencing from March 2012 and March 2013
- 3.47 - 5.60
Housing Development Finance Corporation Limited
Mortgage of land along with super structure of property of the Company at Mangalore.
Repayable in 34 quarterly Installments, commencing from March 2013.
90.50 - 100.50 -
Export and Import Bank of India First charge on the entire fixed assets of the subsidiary Alivira Animal Health Limited, including immovable properties both present and future, second charge over current assets of the subsidiary both present and future, unconditional and irrevocable corporate guarantee of Sequent Scientific Limited to the extent of the shareholding in the subsidiary. Personal guarantee of director Mr Arun Kumar Pillai to the extent of ` 50 Crores. First charge / assignment on all intangibles assets of the subsidiary.
Repayable in 26 quarterly Installments, commencing from August 2016.
1,237.50 - 500.00 -
Export and Import Bank of India First pari-passu charge on entire fixed assets of Alivira Animal Health Limited, India, pledge of 60% shares of Provet Veteriner Ürünleri San. ve Tic. A. ., held by Alivira Animal Health Limited, Ireland, pledge of shares of Alivira Animal Health Limited, Ireland held by Alivira Animal Health Limited, India and corporate Guarantee of Alivira Animal Health Limited, India.
Repayable in 16 quarterly installments, commencing from March 2016.
604.78 - - -
Total - Term loans from other parties
1,969.92 3.47 1,269.07 5.60
The interest on above term loans from other parties (other than loan from Department of Scientific and Industrial Research) are linked to the respective lender’s base rates which are floating in nature.
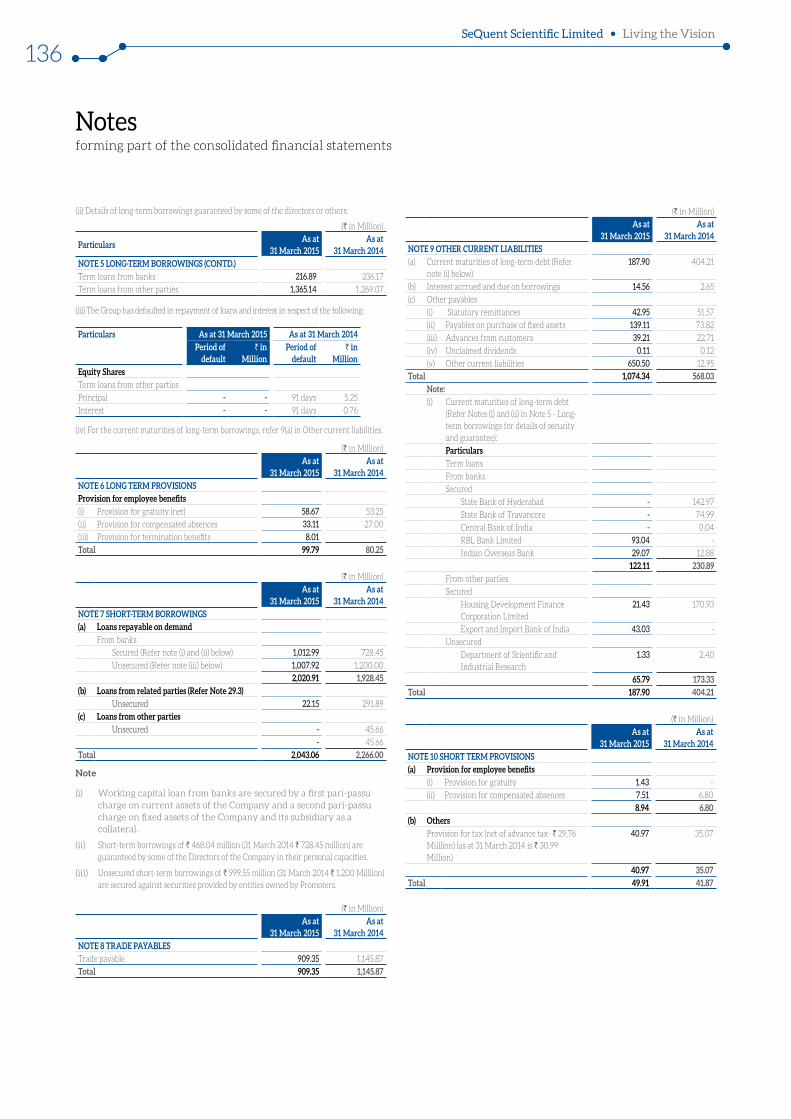
Notes forming part of the consolidated financial statements
SeQuent Scientific Limited Living the Vision
136
(` in Million)
As at 31 March 2015
As at 31 March 2014
NOTE 6 LONG TERM PROVISIONS Provision for employee benefits (i) Provision for gratuity (net) 58.67 53.25
(ii) Provision for compensated absences 33.11 27.00
(iii) Provision for termination benefits 8.01 -
Total 99.79 80.25
(` in Million)
As at 31 March 2015
As at 31 March 2014
NOTE 7 SHORT-TERM BORROWINGS (a) Loans repayable on demand
From banks
Secured (Refer note (i) and (ii) below) 1,012.99 728.45
Unsecured (Refer note (iii) below) 1,007.92 1,200.00
2,020.91 1,928.45 (b) Loans from related parties (Refer Note 29.3)
Unsecured 22.15 291.89
(c) Loans from other parties Unsecured - 45.66
- 45.66
Total 2,043.06 2,266.00
Note
(i) Working capital loan from banks are secured by a first pari-passu charge on current assets of the Company and a second pari-passu charge on fixed assets of the Company and its subsidiary as a collateral.
(ii) Short-term borrowings of ` 468.04 million (31 March 2014 ` 728.45 million) are guaranteed by some of the Directors of the Company in their personal capacities.
(iii) Unsecured short-term borrowings of ` 999.55 million (31 March 2014 ` 1,200 Milllion) are secured against securities provided by entities owned by Promoters.
(` in Million)
As at 31 March 2015
As at 31 March 2014
NOTE 8 TRADE PAYABLES Trade payable 909.35 1,145.87
Total 909.35 1,145.87
(` in Million)
As at 31 March 2015
As at 31 March 2014
NOTE 9 OTHER CURRENT LIABILITIES(a) Current maturities of long-term debt (Refer
note (i) below) 187.90 404.21
(b) Interest accrued and due on borrowings 14.56 2.65
(c) Other payables
(i) Statutory remittances 42.95 51.57
(ii) Payables on purchase of fixed assets 139.11 73.82
(iii) Advances from customers 39.21 22.71
(iv) Unclaimed dividends 0.11 0.12
(v) Other current liabilities 650.50 12.95
Total 1,074.34 568.03 Note:(i) Current maturities of long-term debt
(Refer Notes (i) and (ii) in Note 5 - Long-term borrowings for details of security and guarantee):
ParticularsTerm loans
From banks
Secured
State Bank of Hyderabad - 142.97
State Bank of Travancore - 74.99
Central Bank of India - 0.04
RBL Bank Limited 93.04 -
Indian Overseas Bank 29.07 12.88
122.11 230.89 From other parties
Secured
Housing Development Finance Corporation Limited
21.43 170.93
Export and Import Bank of India 43.03 -
Unsecured
Department of Scientific and Industrial Research
1.33 2.40
65.79 173.33 Total 187.90 404.21
(` in Million)
As at 31 March 2015
As at 31 March 2014
NOTE 10 SHORT TERM PROVISIONS (a) Provision for employee benefits
(i) Provision for gratuity 1.43 -
(ii) Provision for compensated absences 7.51 6.80
8.94 6.80 (b) Others
Provision for tax (net of advance tax- ` 29.76 Milllion) (as at 31 March 2014 is ` 30.99 Million)
40.97 35.07
40.97 35.07 Total 49.91 41.87
(ii) Details of long-term borrowings guaranteed by some of the directors or others:
(` in Million)
ParticularsAs at
31 March 2015 As at
31 March 2014 NOTE 5 LONG-TERM BORROWINGS (CONTD.)Term loans from banks 216.89 236.17
Term loans from other parties 1,365.14 1,269.07
(iii) The Group has defaulted in repayment of loans and interest in respect of the following:
Particulars As at 31 March 2015 As at 31 March 2014Period of
default` in
MillionPeriod of
default` in
MillionEquity SharesTerm loans from other parties
Principal - - 91 days 5.25
Interest - - 91 days 0.76
(iv) For the current maturities of long-term borrowings, refer 9(a) in Other current liabilities.
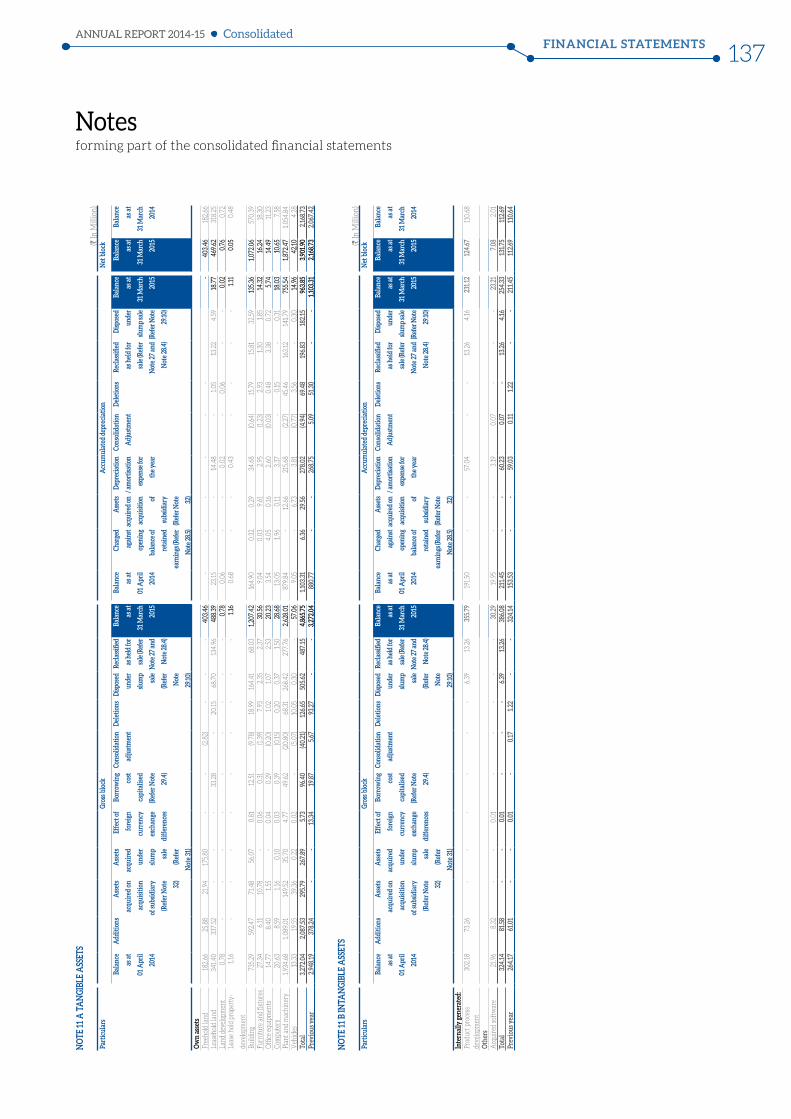
Notes forming part of the consolidated financial statements
FINANCIAL STATEMENTSANNUAL REPORT 2014-15
137Consolidated
NO
TE 1
1 A
TA
NGI
BLE
ASS
ETS
(` In
Mill
ion)
Part
icul
ars
Gros
s blo
ckA
ccum
ulat
ed d
epre
ciat
ion
Net
blo
ck
Bala
nce
as a
t
01 A
pril
2014
Add
ition
s A
sset
s
acqu
ired
on
acqu
isiti
on
of su
bsid
iary
(Ref
er N
ote
32)
Ass
ets
acqu
ired
unde
r
slum
p
sale
(Ref
er
Not
e 31
)
Eff
ect o
f
fore
ign
curr
ency
exch
ange
diff
eren
ces
Bor
row
ing
cost
capi
talis
ed
(Ref
er N
ote
29.4
)
Cons
olid
atio
n
adju
stm
ent
Del
etio
ns
Disp
osed
unde
r
slum
p
sale
(Ref
er
Not
e
29.10
)
Rec
lass
ified
as h
eld
for
sale
(Ref
er
Not
e 27
and
Not
e 28.4
)
Bala
nce
as a
t
31 M
arch
2015
Bala
nce
as a
t
01 A
pril
2014
Cha
rged
agai
nst
open
ing
bala
nce o
f
reta
ined
earn
ings
(Ref
er
Not
e 28.5
)
Ass
ets
acqu
ired
on
acqu
isitio
n of
subs
idia
ry
(Ref
er N
ote
32)
Dep
reci
atio
n
/ am
ortis
atio
n
expe
nse f
or
the y
ear
Con
solid
atio
n
Adj
ustm
ent
Del
etio
ns
Rec
lass
ified
as h
eld
for
sale
(Ref
er
Not
e 27
and
Not
e 28
.4)
Disp
osed
unde
r
slum
p sa
le
(Ref
er N
ote
29.10
)
Bala
nce
as a
t
31 M
arch
2015
Bala
nce
as a
t
31 M
arch
2015
Bala
nce
as a
t
31 M
arch
2014
Ow
n as
sets
Free
hold
land
1
82.6
6 2
5.88
2
1.94
1
75.8
0 -
- (2
.82)
- -
- 4
03.4
6 -
- -
- -
- -
403
.46
182
.66
Leas
ehol
d la
nd
341
.40
337
.52
- -
- 3
3.28
-
20.
15
68.
70
134
.96
488
.39
23.
15
- -
14.
48
- 1
.05
13.
22
4.5
9 18
.77
469
.62
318
.25
Land
dev
elop
men
t 0
.78
- -
- -
- -
- -
- 0
.78
0.0
6 -
- 0
.02
- 0
.06
- -
0.0
2 0
.76
0.7
2 Le
ase
hold
pro
pert
y-
deve
lopm
ent
1.1
6 -
- -
- -
- -
- -
1.16
0
.68
- -
0.4
3 -
- -
- 1.
11
0.0
5 0
.48
Build
ing
735
.29
592
.47
71.
48
56.
07
0.8
1 1
2.51
(9
.78)
18.
99
164
.41
68.
03
1,20
7.42
1
64.9
0 0
.32
0.2
9 3
4.68
(0
.64)
15.
79
15.
81
32.
59
135.
36
1,07
2.06
5
70.3
9 Fu
rnitu
re a
nd fi
xtur
es 2
7.34
6
.11
10.
78
- 0
.06
0.3
1 (1
.39)
7.9
3 2
.35
2.3
7 3
0.56
9
.04
0.0
3 9
.61
2.9
5 (1
.23)
2.9
3 1
.30
1.8
5 14
.32
16.2
4 1
8.30
O
ffice
equ
ipm
ents
14.
77
8.4
0 1
.55
- 0
.04
0.2
9 (0
.20)
1.0
2 1
.07
2.5
3 2
0.23
3
.54
4.0
5 0
.16
2.6
0 (0
.03)
0.4
8 3
.38
0.7
2 5
.74
14.4
9 1
1.23
Co
mpu
ters
20.
63
8.5
9 1
.16
0.1
0 0
.03
0.3
9 (0
.15)
0.2
0 0
.37
1.5
0 2
8.68
1
3.05
1
.96
0.1
1 3
.37
- 0
.15
- 0
.31
18.0
3 10
.65
7.5
8 Pl
ant a
nd m
achi
nery
1
,934
.68
1,0
89.0
1 1
49.5
2 3
5.70
4
.77
49.
62
(20.
80)
68.
31
268
.42
277
.76
2,6
28.0
1 8
79.8
4 -
12.
66
215
.68
(2.2
7) 4
5.46
1
63.1
2 1
41.7
9 7
55.5
4 1,
872.
47
1,0
54.8
4 V
ehic
les
13.
33
19.
55
39.
36
0.2
2 0
.02
- (5
.07)
10.
05
0.3
0 -
57.
06
9.0
5 -
6.7
3 3
.81
(0.7
7) 3
.56
- 0
.30
14.9
6 4
2.10
4
.28
Tota
l 3
,272
.04
2,0
87.5
3 2
95.7
9 2
67.8
9 5
.73
96.
40
(40.
21)
126
.65
505
.62
487
.15
4,8
65.7
5 1
,103.
31
6.3
6 2
9.56
2
78.0
2 (4
.94)
69.
48
196
.83
182
.15
963
.85
3,9
01.9
0 2
,168.
73
Prev
ious
yea
r 2
,948
.19
378
.24
- -
13.
34
19.
87
5.6
7 9
3.27
-
- 3
,272
.04
880
.77
- -
268
.75
5.0
9 5
1.30
- -
1,10
3.31
2
,168.
73
2,0
67.4
2
NO
TE 1
1 B
INTA
NGI
BLE
ASS
ETS
(` In
Mill
ion)
Part
icul
ars
Gros
s blo
ckA
ccum
ulat
ed d
epre
ciat
ion
Net
blo
ck
Bala
nce
as a
t
01 A
pril
2014
Add
ition
s A
sset
s
acqu
ired
on
acqu
isiti
on
of su
bsid
iary
(Ref
er N
ote
32)
Ass
ets
acqu
ired
unde
r
slum
p
sale
(Ref
er
Not
e 31
)
Eff
ect o
f
fore
ign
curr
ency
exch
ange
diff
eren
ces
Bor
row
ing
cost
capi
talis
ed
(Ref
er N
ote
29.4
)
Cons
olid
atio
n
adju
stm
ent
Del
etio
ns
Disp
osed
unde
r
slum
p
sale
(Ref
er
Not
e
29.10
)
Rec
lass
ified
as h
eld
for
sale
(Ref
er
Not
e 27
and
Not
e 28.4
)
Bala
nce
as a
t
31 M
arch
2015
Bala
nce
as a
t
01 A
pril
2014
Cha
rged
agai
nst
open
ing
bala
nce o
f
reta
ined
earn
ings
(Ref
er
Not
e 28.5
)
Ass
ets
acqu
ired
on
acqu
isitio
n of
subs
idia
ry
(Ref
er N
ote
32)
Dep
reci
atio
n
/ am
ortis
atio
n
expe
nse f
or
the y
ear
Con
solid
atio
n
Adj
ustm
ent
Del
etio
ns
Rec
lass
ified
as h
eld
for
sale
(Ref
er
Not
e 27
and
Not
e 28
.4)
Disp
osed
unde
r
slum
p sa
le
(Ref
er N
ote
29.10
)
Bala
nce
as a
t
31 M
arch
2015
Bala
nce
as a
t
31 M
arch
2015
Bala
nce
as a
t
31 M
arch
2014
Inte
rnal
ly g
ener
ated
:Pr
oduc
t pro
cess
de
velo
pmen
t 3
02.1
8 7
3.26
-
- -
- -
- 6
.39
13.
26
355
.79
191
.50
- -
57.
04
- -
13.
26
4.1
6 2
31.12
12
4.67
1
10.6
8
Oth
ers
Acq
uire
d so
ftw
are
21.
96
8.3
2 -
- 0
.01
- -
- -
- 3
0.29
1
9.95
-
- 3
.19
0.0
7 -
- -
23.
21
7.0
8 2
.01
Tota
l 3
24.14
8
1.58
- -
0.0
1 -
- -
6.3
9 1
3.26
3
86.0
8 2
11.4
5 -
- 6
0.23
0
.07
- 1
3.26
4
.16
254
.33
131
.75
112
.69
Prev
ious
yea
r 2
64.17
6
1.01
- -
0.0
1 -
0.17
1
.22
- -
324
.14
153.
53
- -
59.
03
0.11
1
.22
- -
211
.45
112
.69
110
.64
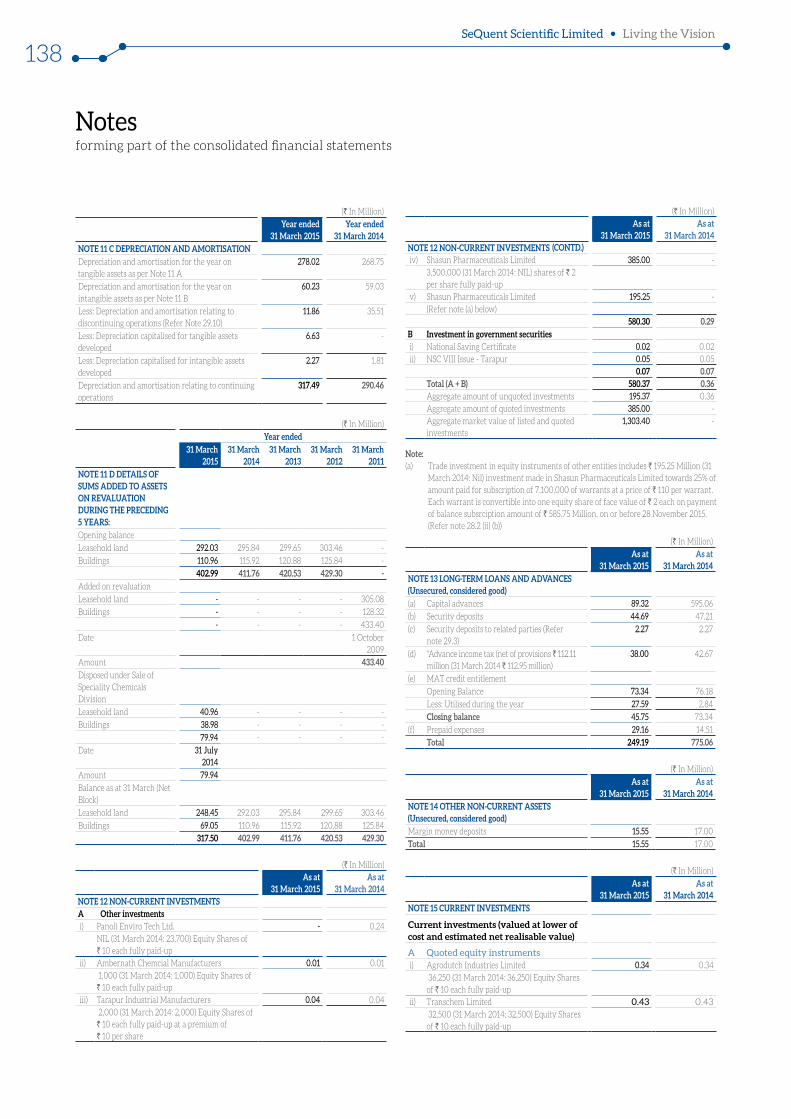
Notes forming part of the consolidated financial statements
SeQuent Scientific Limited Living the Vision
138
(` In Million)
Year ended 31 March 2015
Year ended 31 March 2014
NOTE 11 C DEPRECIATION AND AMORTISATION
Depreciation and amortisation for the year on tangible assets as per Note 11 A
278.02 268.75
Depreciation and amortisation for the year on intangible assets as per Note 11 B
60.23 59.03
Less: Depreciation and amortisation relating to discontinuing operations (Refer Note 29.10)
11.86 35.51
Less: Depreciation capitalised for tangible assets developed
6.63 -
Less: Depreciation capitalised for intangible assets developed
2.27 1.81
Depreciation and amortisation relating to continuing operations
317.49 290.46
(` In Million)
Year ended31 March
201531 March
201431 March
201331 March
201231 March
2011NOTE 11 D DETAILS OF SUMS ADDED TO ASSETS ON REVALUATION DURING THE PRECEDING 5 YEARS:Opening balance
Leasehold land 292.03 295.84 299.65 303.46 -
Buildings 110.96 115.92 120.88 125.84 -
402.99 411.76 420.53 429.30 - Added on revaluation
Leasehold land - - - - 305.08
Buildings - - - - 128.32
- - - - 433.40
Date 1 October 2009
Amount 433.40 Disposed under Sale of Speciality Chemicals Division
Leasehold land 40.96 - - - -
Buildings 38.98 - - - -
79.94 - - - -
Date 31 July 2014
Amount 79.94 Balance as at 31 March (Net Block)
Leasehold land 248.45 292.03 295.84 299.65 303.46
Buildings 69.05 110.96 115.92 120.88 125.84
317.50 402.99 411.76 420.53 429.30
(` In Million)As at
31 March 2015As at
31 March 2014NOTE 12 NON-CURRENT INVESTMENTSA Other investments i) Panoli Enviro Tech Ltd. - 0.24
NIL (31 March 2014: 23,700) Equity Shares of ` 10 each fully paid-up
ii) Ambernath Chemcial Manufacturers 0.01 0.01 1,000 (31 March 2014: 1,000) Equity Shares of ` 10 each fully paid-up
iii) Tarapur Industrial Manufacturers 0.04 0.04 2,000 (31 March 2014: 2,000) Equity Shares of ` 10 each fully paid-up at a premium of ` 10 per share
(` In Million)As at
31 March 2015As at
31 March 2014NOTE 12 NON-CURRENT INVESTMENTS iv) Shasun Pharmaceuticals Limited 385.00 -
3,500,000 (31 March 2014: NIL) shares of ` 2 per share fully paid-up
v) Shasun Pharmaceuticals Limited 195.25 -(Refer note (a) below)
580.30 0.29 B Investment in government securities i) National Saving Certificate 0.02 0.02 ii) NSC VIII Issue - Tarapur 0.05 0.05
0.07 0.07 Total (A + B) 580.37 0.36 Aggregate amount of unquoted investments 195.37 0.36 Aggregate amount of quoted investments 385.00 - Aggregate market value of listed and quoted investments
1,303.40 -
Note: (a) Trade investment in equity instruments of other entities includes ` 195.25 Million (31
March 2014: Nil) investment made in Shasun Pharmaceuticals Limited towards 25% of amount paid for subscription of 7,100,000 of warrants at a price of ` 110 per warrant.Each warrant is convertible into one equity share of face value of ` 2 each on payment of balance subsrciption amount of ` 585.75 Million. on or before 28 November 2015. (Refer note 28.2 (ii) (b))
(` In Million)
As at 31 March 2015
As at 31 March 2014
NOTE 13 LONG-TERM LOANS AND ADVANCES (Unsecured, considered good)
(a) Capital advances 89.32 595.06
(b) Security deposits 44.69 47.21
(c) Security deposits to related parties (Refer note 29.3)
2.27 2.27
(d) "Advance income tax (net of provisions ` 112.11 million (31 March 2014 ` 112.95 million)
38.00 42.67
(e) MAT credit entitlement
Opening Balance 73.34 76.18
Less: Utilised during the year 27.59 2.84
Closing balance 45.75 73.34
(f) Prepaid expenses 29.16 14.51
Total 249.19 775.06
(` In Million)
As at 31 March 2015
As at 31 March 2014
NOTE 14 OTHER NON-CURRENT ASSETS (Unsecured, considered good)
Margin money deposits 15.55 17.00
Total 15.55 17.00
(` In Million)
As at 31 March 2015
As at 31 March 2014
NOTE 15 CURRENT INVESTMENTS
Current investments (valued at lower of cost and estimated net realisable value)
A Quoted equity instruments i) Agrodutch Industries Limited 0.34 0.34
36,250 (31 March 2014: 36,250) Equity Shares of ` 10 each fully paid-up
ii) Transchem Limited 0.43 0.43 32,500 (31 March 2014: 32,500) Equity Shares of ` 10 each fully paid-up
(CONTD.)
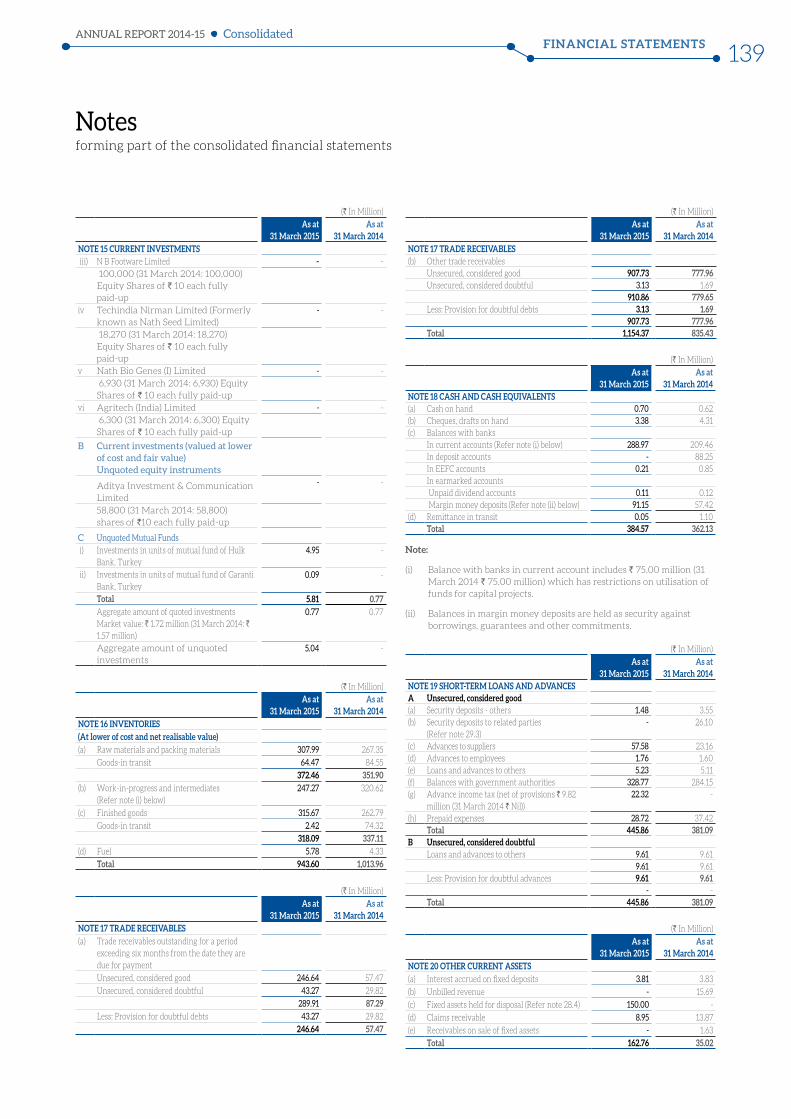
Notes forming part of the consolidated financial statements
FINANCIAL STATEMENTSANNUAL REPORT 2014-15
139Consolidated
(` In Million)
As at 31 March 2015
As at 31 March 2014
NOTE 15 CURRENT INVESTMENTS iii) N B Footware Limited - -
100,000 (31 March 2014: 100,000) Equity Shares of ` 10 each fully paid-up
iv Techindia Nirman Limited (Formerly known as Nath Seed Limited)
- -
18,270 (31 March 2014: 18,270) Equity Shares of ` 10 each fully paid-up
v Nath Bio Genes (I) Limited - - 6,930 (31 March 2014: 6,930) Equity Shares of ` 10 each fully paid-up
vi Agritech (India) Limited - - 6,300 (31 March 2014: 6,300) Equity Shares of ` 10 each fully paid-up
B Current investments (valued at lower of cost and fair value) Unquoted equity instruments
Aditya Investment & Communication Limited
- -
58,800 (31 March 2014: 58,800) shares of `10 each fully paid-up
C Unquoted Mutual Funds i) Investments in units of mutual fund of Hulk
Bank, Turkey 4.95 -
ii) Investments in units of mutual fund of Garanti Bank, Turkey
0.09 -
Total 5.81 0.77 Aggregate amount of quoted investments Market value: ` 1.72 million (31 March 2014: ` 1.57 million)
0.77 0.77
Aggregate amount of unquoted investments
5.04 -
(` In Million)
As at 31 March 2015
As at 31 March 2014
NOTE 16 INVENTORIES(At lower of cost and net realisable value)(a) Raw materials and packing materials 307.99 267.35
Goods-in transit 64.47 84.55
372.46 351.90 (b) Work-in-progress and intermediates
(Refer note (i) below) 247.27 320.62
(c) Finished goods 315.67 262.79
Goods-in transit 2.42 74.32
318.09 337.11 (d) Fuel 5.78 4.33
Total 943.60 1,013.96
(` In Million)
As at 31 March 2015
As at 31 March 2014
NOTE 17 TRADE RECEIVABLES (a) Trade receivables outstanding for a period
exceeding six months from the date they are due for payment
Unsecured, considered good 246.64 57.47
Unsecured, considered doubtful 43.27 29.82
289.91 87.29 Less: Provision for doubtful debts 43.27 29.82
246.64 57.47
(` In Million)
As at 31 March 2015
As at 31 March 2014
NOTE 17 TRADE RECEIVABLES (b) Other trade receivables
Unsecured, considered good 907.73 777.96 Unsecured, considered doubtful 3.13 1.69
910.86 779.65 Less: Provision for doubtful debts 3.13 1.69
907.73 777.96 Total 1,154.37 835.43
(` In Million)
As at 31 March 2015
As at 31 March 2014
NOTE 18 CASH AND CASH EQUIVALENTS (a) Cash on hand 0.70 0.62 (b) Cheques, drafts on hand 3.38 4.31 (c) Balances with banks
In current accounts (Refer note (i) below) 288.97 209.46 In deposit accounts - 88.25 In EEFC accounts 0.21 0.85 In earmarked accounts Unpaid dividend accounts 0.11 0.12 Margin money deposits (Refer note (ii) below) 91.15 57.42
(d) Remittance in transit 0.05 1.10 Total 384.57 362.13
Note:
(i) Balance with banks in current account includes ` 75.00 million (31 March 2014 ` 75.00 million) which has restrictions on utilisation of funds for capital projects.
(ii) Balances in margin money deposits are held as security against borrowings, guarantees and other commitments.
(` In Million)
As at 31 March 2015
As at 31 March 2014
NOTE 19 SHORT-TERM LOANS AND ADVANCES A Unsecured, considered good(a) Security deposits - others 1.48 3.55 (b) Security deposits to related parties
(Refer note 29.3) - 26.10
(c) Advances to suppliers 57.58 23.16 (d) Advances to employees 1.76 1.60 (e) Loans and advances to others 5.23 5.11 (f) Balances with government authorities 328.77 284.15 (g) Advance income tax (net of provisions ` 9.82
million (31 March 2014 ` Nil)) 22.32 -
(h) Prepaid expenses 28.72 37.42 Total 445.86 381.09
B Unsecured, considered doubtful Loans and advances to others 9.61 9.61
9.61 9.61 Less: Provision for doubtful advances 9.61 9.61
- - Total 445.86 381.09
(` In Million)
As at 31 March 2015
As at 31 March 2014
NOTE 20 OTHER CURRENT ASSETS (a) Interest accrued on fixed deposits 3.81 3.83
(b) Unbilled revenue - 15.69
(c) Fixed assets held for disposal (Refer note 28.4) 150.00 -
(d) Claims receivable 8.95 13.87
(e) Receivables on sale of fixed assets - 1.63
Total 162.76 35.02
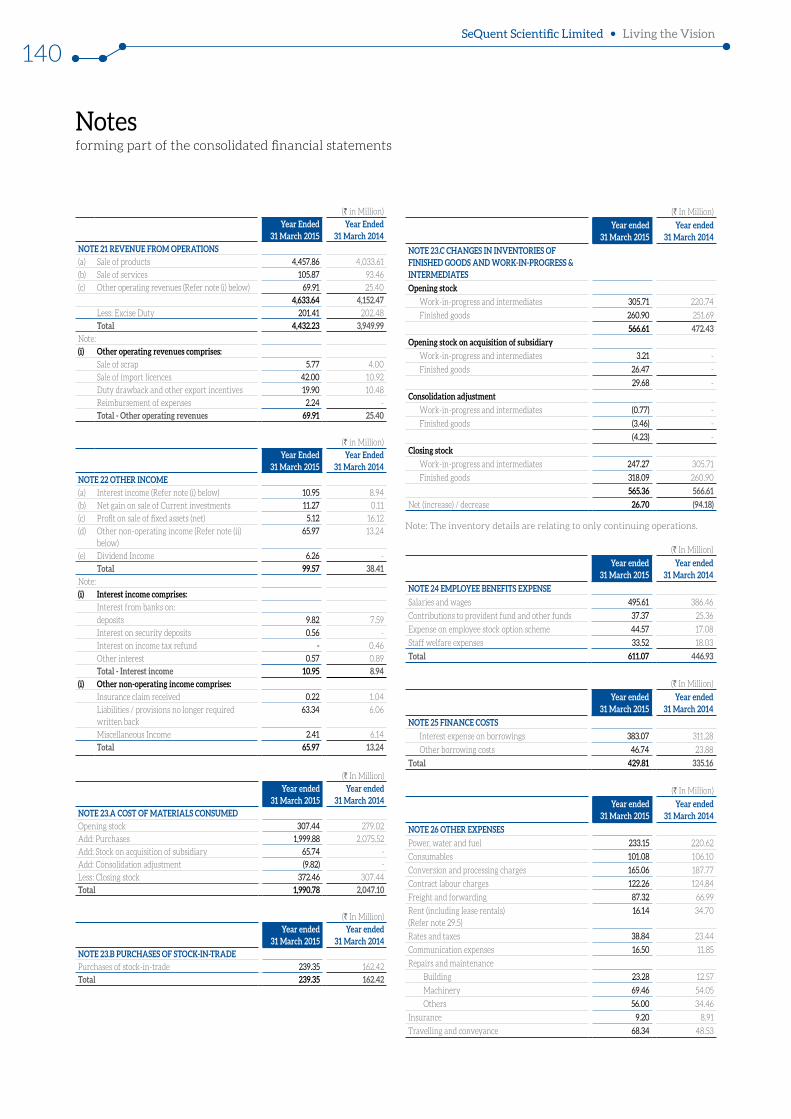
Notes forming part of the consolidated financial statements
SeQuent Scientific Limited Living the Vision
140
(` in Million)
Year Ended 31 March 2015
Year Ended 31 March 2014
NOTE 21 REVENUE FROM OPERATIONS(a) Sale of products 4,457.86 4,033.61
(b) Sale of services 105.87 93.46
(c) Other operating revenues (Refer note (i) below) 69.91 25.40
4,633.64 4,152.47 Less: Excise Duty 201.41 202.48
Total 4,432.23 3,949.99 Note:
(i) Other operating revenues comprises:Sale of scrap 5.77 4.00
Sale of import licences 42.00 10.92
Duty drawback and other export incentives 19.90 10.48
Reimbursement of expenses 2.24 -
Total - Other operating revenues 69.91 25.40
(` in Million)
Year Ended 31 March 2015
Year Ended 31 March 2014
NOTE 22 OTHER INCOME(a) Interest income (Refer note (i) below) 10.95 8.94
(b) Net gain on sale of Current investments 11.27 0.11
(c) Profit on sale of fixed assets (net) 5.12 16.12
(d) Other non-operating income (Refer note (ii) below)
65.97 13.24
(e) Dividend Income 6.26 -
Total 99.57 38.41 Note:
(i) Interest income comprises:Interest from banks on:
deposits 9.82 7.59
Interest on security deposits 0.56 -
Interest on income tax refund - 0.46
Other interest 0.57 0.89
Total - Interest income 10.95 8.94 (i) Other non-operating income comprises:
Insurance claim received 0.22 1.04
Liabilities / provisions no longer required written back
63.34 6.06
Miscellaneous Income 2.41 6.14
Total 65.97 13.24
(` In Million)
Year ended 31 March 2015
Year ended 31 March 2014
NOTE 23.A COST OF MATERIALS CONSUMED
Opening stock 307.44 279.02
Add: Purchases 1,999.88 2,075.52
Add: Stock on acquisition of subsidiary 65.74 -
Add: Consolidation adjustment (9.82) -
Less: Closing stock 372.46 307.44
Total 1,990.78 2,047.10
(` In Million)
Year ended 31 March 2015
Year ended 31 March 2014
NOTE 23.B PURCHASES OF STOCK-IN-TRADE
Purchases of stock-in-trade 239.35 162.42
Total 239.35 162.42
(` In Million)
Year ended 31 March 2015
Year ended 31 March 2014
NOTE 23.C CHANGES IN INVENTORIES OF FINISHED GOODS AND WORK-IN-PROGRESS & INTERMEDIATES
Opening stock
Work-in-progress and intermediates 305.71 220.74
Finished goods 260.90 251.69
566.61 472.43
Opening stock on acquisition of subsidiary
Work-in-progress and intermediates 3.21 -
Finished goods 26.47 -
29.68 -
Consolidation adjustment
Work-in-progress and intermediates (0.77) -
Finished goods (3.46) -
(4.23) -
Closing stock
Work-in-progress and intermediates 247.27 305.71
Finished goods 318.09 260.90
565.36 566.61
Net (increase) / decrease 26.70 (94.18)
Note: The inventory details are relating to only continuing operations.
(` In Million)
Year ended 31 March 2015
Year ended 31 March 2014
NOTE 24 EMPLOYEE BENEFITS EXPENSE
Salaries and wages 495.61 386.46
Contributions to provident fund and other funds 37.37 25.36
Expense on employee stock option scheme 44.57 17.08
Staff welfare expenses 33.52 18.03
Total 611.07 446.93
(` In Million)
Year ended 31 March 2015
Year ended 31 March 2014
NOTE 25 FINANCE COSTS
Interest expense on borrowings 383.07 311.28
Other borrowing costs 46.74 23.88
Total 429.81 335.16
(` In Million)
Year ended 31 March 2015
Year ended 31 March 2014
NOTE 26 OTHER EXPENSES
Power, water and fuel 233.15 220.62
Consumables 101.08 106.10
Conversion and processing charges 165.06 187.77
Contract labour charges 122.26 124.84
Freight and forwarding 87.32 66.99
Rent (including lease rentals) (Refer note 29.5)
16.14 34.70
Rates and taxes 38.84 23.44
Communication expenses 16.50 11.85
Repairs and maintenance
Building 23.28 12.57
Machinery 69.46 54.05
Others 56.00 34.46
Insurance 9.20 8.91
Travelling and conveyance 68.34 48.53
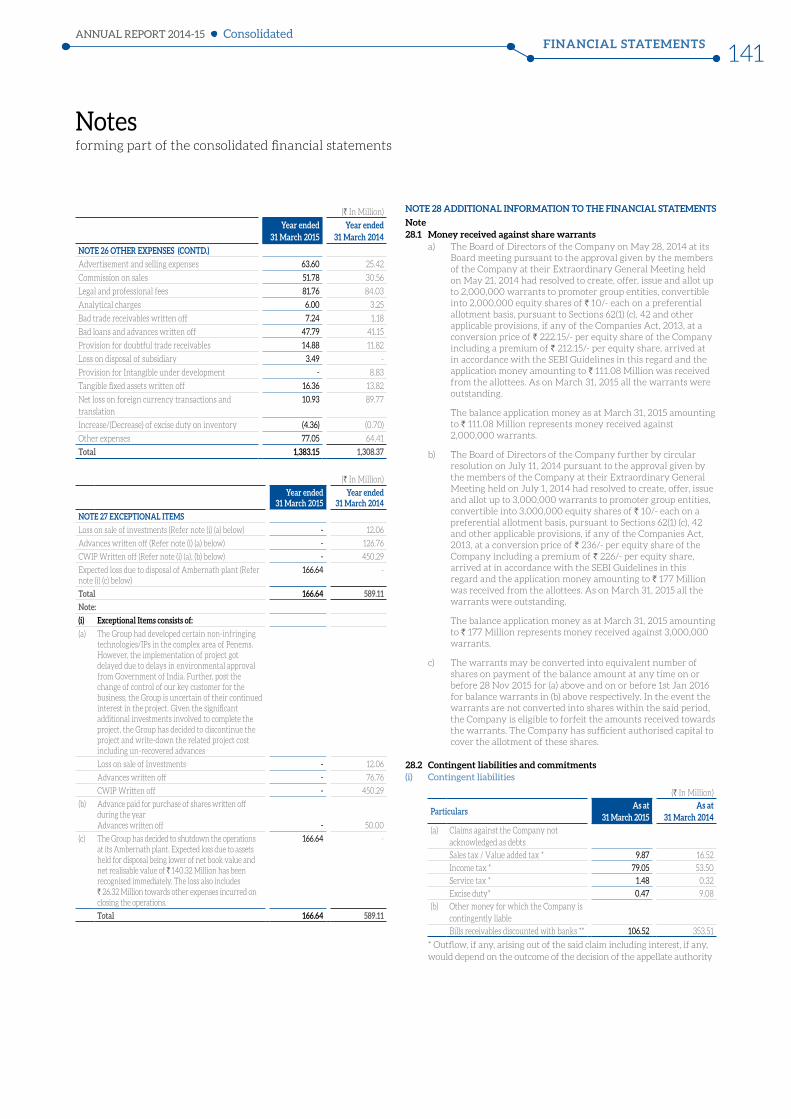
Notes forming part of the consolidated financial statements
FINANCIAL STATEMENTSANNUAL REPORT 2014-15
141Consolidated
(` In Million)
Year ended 31 March 2015
Year ended 31 March 2014
NOTE 26 OTHER EXPENSES
Advertisement and selling expenses 63.60 25.42
Commission on sales 51.78 30.56
Legal and professional fees 81.76 84.03
Analytical charges 6.00 3.25
Bad trade receivables written off 7.24 1.18
Bad loans and advances written off 47.79 41.15
Provision for doubtful trade receivables 14.88 11.82
Loss on disposal of subsidiary 3.49 -
Provision for Intangible under development - 8.83
Tangible fixed assets written off 16.36 13.82
Net loss on foreign currency transactions and translation
10.93 89.77
Increase/(Decrease) of excise duty on inventory (4.36) (0.70)
Other expenses 77.05 64.41
Total 1,383.15 1,308.37
(` In Million)
Year ended 31 March 2015
Year ended 31 March 2014
NOTE 27 EXCEPTIONAL ITEMS
Loss on sale of investments (Refer note (i) (a) below) - 12.06
Advances written off (Refer note (i) (a) below) - 126.76
CWIP Written off (Refer note (i) (a), (b) below) - 450.29
Expected loss due to disposal of Ambernath plant (Refer note (i) (c) below)
166.64 -
Total 166.64 589.11
Note:
(i) Exceptional Items consists of:
(a) The Group had developed certain non-infringing technologies/IPs in the complex area of Penems. However, the implementation of project got delayed due to delays in environmental approval from Government of India. Further, post the change of control of our key customer for the business, the Group is uncertain of their continued interest in the project. Given the significant additional investments involved to complete the project, the Group has decided to discontinue the project and write-down the related project cost including un-recovered advances
Loss on sale of Investments - 12.06
Advances written off - 76.76
CWIP Written off - 450.29
(b) Advance paid for purchase of shares written off during the yearAdvances written off - 50.00
(c) The Group has decided to shutdown the operations at its Ambernath plant. Expected loss due to assets held for disposal being lower of net book value and net realisable value of ` 140.32 Million has been recognised immediately. The loss also includes ` 26.32 Million towards other expenses incurred on closing the operations.
166.64 -
Total 166.64 589.11
(CONTD.)
NOTE 28 ADDITIONAL INFORMATION TO THE FINANCIAL STATEMENTS
Note 28.1 Money received against share warrants a) The Board of Directors of the Company on May 28, 2014 at its
Board meeting pursuant to the approval given by the members of the Company at their Extraordinary General Meeting held on May 21, 2014 had resolved to create, offer, issue and allot up to 2,000,000 warrants to promoter group entities, convertible into 2,000,000 equity shares of ` 10/- each on a preferential allotment basis, pursuant to Sections 62(1) (c), 42 and other applicable provisions, if any of the Companies Act, 2013, at a conversion price of ` 222.15/- per equity share of the Company including a premium of ` 212.15/- per equity share, arrived at in accordance with the SEBI Guidelines in this regard and the application money amounting to ` 111.08 Million was received from the allottees. As on March 31, 2015 all the warrants were outstanding.
The balance application money as at March 31, 2015 amounting to ` 111.08 Million represents money received against 2,000,000 warrants.
b) The Board of Directors of the Company further by circular resolution on July 11, 2014 pursuant to the approval given by the members of the Company at their Extraordinary General Meeting held on July 1, 2014 had resolved to create, offer, issue and allot up to 3,000,000 warrants to promoter group entities, convertible into 3,000,000 equity shares of ` 10/- each on a preferential allotment basis, pursuant to Sections 62(1) (c), 42 and other applicable provisions, if any of the Companies Act, 2013, at a conversion price of ` 236/- per equity share of the Company including a premium of ` 226/- per equity share, arrived at in accordance with the SEBI Guidelines in this regard and the application money amounting to ` 177 Million was received from the allottees. As on March 31, 2015 all the warrants were outstanding.
The balance application money as at March 31, 2015 amounting to ` 177 Million represents money received against 3,000,000 warrants.
c) The warrants may be converted into equivalent number of shares on payment of the balance amount at any time on or before 28 Nov 2015 for (a) above and on or before 1st Jan 2016 for balance warrants in (b) above respectively. In the event the warrants are not converted into shares within the said period, the Company is eligible to forfeit the amounts received towards the warrants. The Company has sufficient authorised capital to cover the allotment of these shares.
28.2 Contingent liabilities and commitments(i) Contingent liabilities
(` In Million)
ParticularsAs at
31 March 2015As at
31 March 2014(a) Claims against the Company not
acknowledged as debts
Sales tax / Value added tax * 9.87 16.52
Income tax * 79.05 53.50
Service tax * 1.48 0.32
Excise duty* 0.47 9.08
(b) Other money for which the Company is contingently liable
Bills receivables discounted with banks ** 106.52 353.51
* Outflow, if any, arising out of the said claim including interest, if any, would depend on the outcome of the decision of the appellate authority
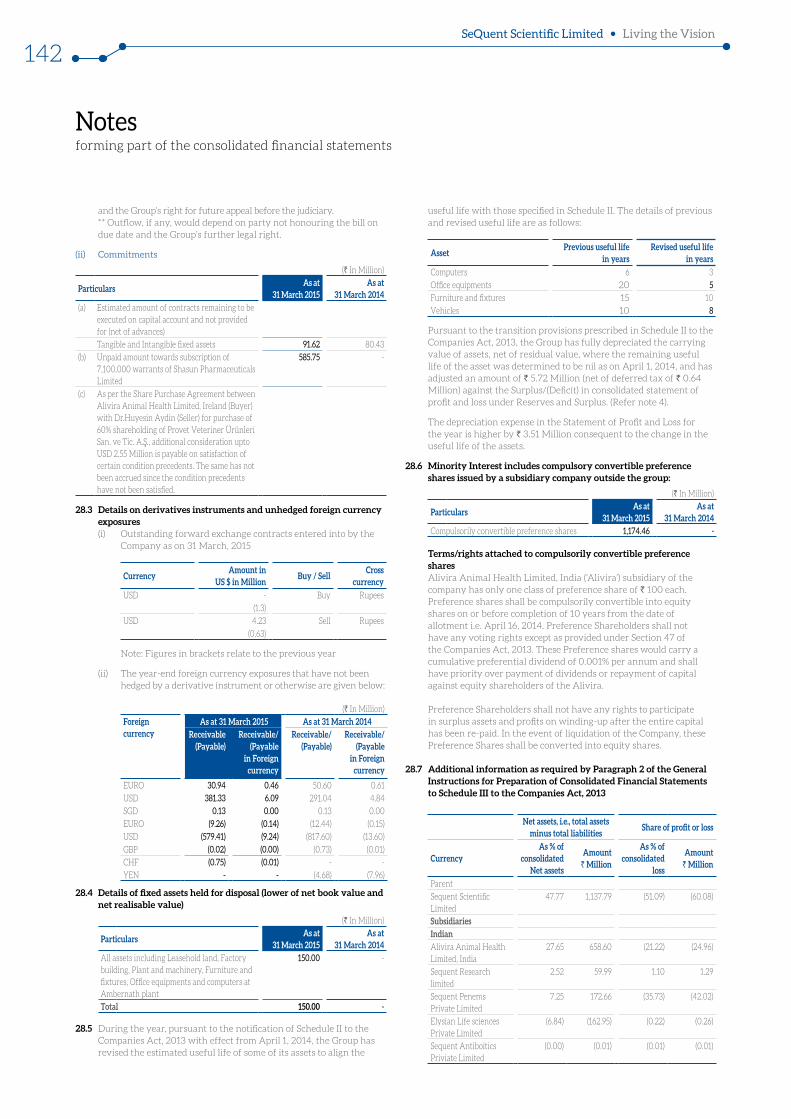
Notes forming part of the consolidated financial statements
SeQuent Scientific Limited Living the Vision
142
and the Group’s right for future appeal before the judiciary. ** Outflow, if any, would depend on party not honouring the bill on due date and the Group’s further legal right.
(ii) Commitments
(` In Million)
ParticularsAs at
31 March 2015As at
31 March 2014(a) Estimated amount of contracts remaining to be
executed on capital account and not provided for (net of advances)
Tangible and Intangible fixed assets 91.62 80.43
(b) Unpaid amount towards subscription of 7,100,000 warrants of Shasun Pharmaceuticals Limited
585.75 -
(c) As per the Share Purchase Agreement between Alivira Animal Health Limited, Ireland (Buyer) with Dr.Huyesin Aydin (Seller) for purchase of 60% shareholding of Provet Veteriner Ürünleri San. ve Tic. A. ., additional consideration upto USD 2.55 Million is payable on satisfaction of certain condition precedents. The same has not been accrued since the condition precedents have not been satisfied.
28.3 Details on derivatives instruments and unhedged foreign currency exposures (i) Outstanding forward exchange contracts entered into by the
Company as on 31 March, 2015
CurrencyAmount in
US $ in Million Buy / Sell
Cross currency
USD - Buy Rupees
(1.3)
USD 4.23 Sell Rupees
(0.63)
Note: Figures in brackets relate to the previous year
(ii) The year-end foreign currency exposures that have not been hedged by a derivative instrument or otherwise are given below:
(` In Million)
Foreign currency
As at 31 March 2015 As at 31 March 2014Receivable
(Payable)Receivable/
(Payable in Foreign
currency
Receivable/(Payable)
Receivable/ (Payable
in Foreign currency
EURO 30.94 0.46 50.60 0.61
USD 381.33 6.09 291.04 4.84
SGD 0.13 0.00 0.13 0.00
EURO (9.26) (0.14) (12.44) (0.15)
USD (579.41) (9.24) (817.60) (13.60)
GBP (0.02) (0.00) (0.73) (0.01)
CHF (0.75) (0.01) - -
YEN - - (4.68) (7.96)
28.4 Details of fixed assets held for disposal (lower of net book value and net realisable value)
(` In Million)
ParticularsAs at
31 March 2015As at
31 March 2014All assets including Leasehold land, Factory building, Plant and machinery, Furniture and fixtures, Office equipments and computers at Ambernath plant
150.00 -
Total 150.00 -
28.5 During the year, pursuant to the notification of Schedule II to the Companies Act, 2013 with effect from April 1, 2014, the Group has revised the estimated useful life of some of its assets to align the
useful life with those specified in Schedule II. The details of previous and revised useful life are as follows:
Asset Previous useful life
in years Revised useful life
in years
Computers 6 3
Office equipments 20 5Furniture and fixtures 15 10
Vehicles 10 8
Pursuant to the transition provisions prescribed in Schedule II to the Companies Act, 2013, the Group has fully depreciated the carrying value of assets, net of residual value, where the remaining useful life of the asset was determined to be nil as on April 1, 2014, and has adjusted an amount of ` 5.72 Million (net of deferred tax of ` 0.64 Million) against the Surplus/(Deficit) in consolidated statement of profit and loss under Reserves and Surplus. (Refer note 4).
The depreciation expense in the Statement of Profit and Loss for the year is higher by ` 3.51 Million consequent to the change in the useful life of the assets.
28.6 Minority Interest includes compulsory convertible preference shares issued by a subsidiary company outside the group:
(` In Million)
ParticularsAs at
31 March 2015As at
31 March 2014Compulsorily convertible preference shares 1,174.46 -
Terms/rights attached to compulsorily convertible preference sharesAlivira Animal Health Limited, India (‘Alivira’) subsidiary of the company has only one class of preference share of ` 100 each. Preference shares shall be compulsorily convertible into equity shares on or before completion of 10 years from the date of allotment i.e. April 16, 2014. Preference Shareholders shall not have any voting rights except as provided under Section 47 of the Companies Act, 2013. These Preference shares would carry a cumulative preferential dividend of 0.001% per annum and shall have priority over payment of dividends or repayment of capital against equity shareholders of the Alivira.
Preference Shareholders shall not have any rights to participate in surplus assets and profits on winding-up after the entire capital has been re-paid. In the event of liquidation of the Company, these Preference Shares shall be converted into equity shares.
28.7 Additional information as required by Paragraph 2 of the General Instructions for Preparation of Consolidated Financial Statements to Schedule III to the Companies Act, 2013
Net assets, i.e., total assets minus total liabilities
Share of profit or loss
CurrencyAs % of
consolidated Net assets
Amount ` Million
As % of consolidated
loss
Amount ` Million
Parent
Sequent Scientific Limited
47.77 1,137.79 (51.09) (60.08)
Subsidiaries IndianAlivira Animal Health Limited, India
27.65 658.60 (21.22) (24.96)
Sequent Research limited
2.52 59.99 1.10 1.29
Sequent Penems Private Limited
7.25 172.66 (35.73) (42.02)
Elysian Life sciences Private Limited
(6.84) (162.95) (0.22) (0.26)
Sequent Antiboitics Priviate Limited
(0.00) (0.01) (0.01) (0.01)
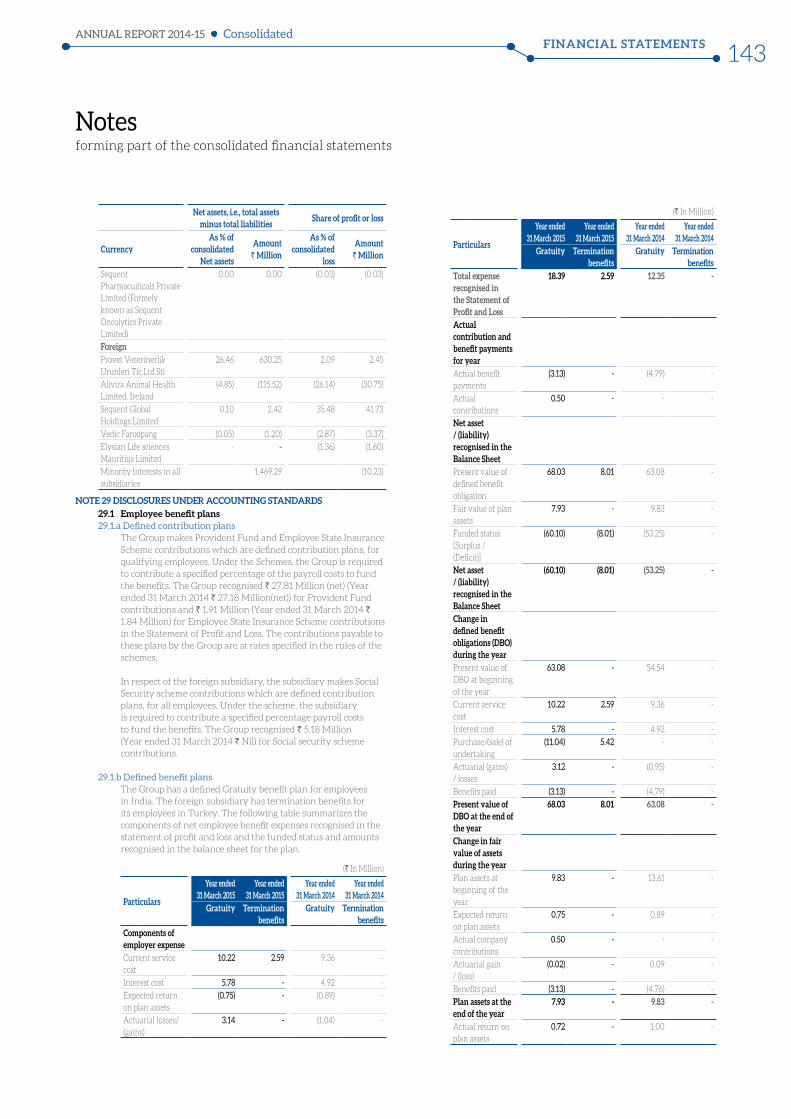
Notes forming part of the consolidated financial statements
FINANCIAL STATEMENTSANNUAL REPORT 2014-15
143Consolidated
NOTE 29 DISCLOSURES UNDER ACCOUNTING STANDARDS
29.1 Employee benefit plans 29.1.a Defined contribution plans
The Group makes Provident Fund and Employee State Insurance Scheme contributions which are defined contribution plans, for qualifying employees. Under the Schemes, the Group is required to contribute a specified percentage of the payroll costs to fund the benefits. The Group recognised ` 27.81 Million (net) (Year ended 31 March 2014 ` 27.18 Million(net)) for Provident Fund contributions and ` 1.91 Million (Year ended 31 March 2014 ` 1.84 Million) for Employee State Insurance Scheme contributions in the Statement of Profit and Loss. The contributions payable to these plans by the Group are at rates specified in the rules of the schemes.
In respect of the foreign subsidiary, the subsidiary makes Social Security scheme contributions which are defined contribution plans, for all employees. Under the scheme, the subsidiary is required to contribute a specified percentage payroll costs to fund the benefits. The Group recognised ` 5.18 Million (Year ended 31 March 2014 ` Nil) for Social security scheme contributions.
29.1.b Defined benefit plans The Group has a defined Gratuity benefit plan for employees
in India. The foreign subsidiary has termination benefits for its employees in Turkey. The following table summarizes the components of net employee benefit expenses recognised in the statement of profit and loss and the funded status and amounts recognised in the balance sheet for the plan.
(` In Million)
Particulars
Year ended 31 March 2015
Year ended 31 March 2015
Year ended 31 March 2014
Year ended 31 March 2014
Gratuity Termination benefits
Gratuity Termination benefits
Components of employer expenseCurrent service cost
10.22 2.59 9.36 -
Interest cost 5.78 - 4.92 -
Expected return on plan assets
(0.75) - (0.89) -
Actuarial losses/(gains)
3.14 - (1.04) -
(` In Million)
Particulars
Year ended 31 March 2015
Year ended 31 March 2015
Year ended 31 March 2014
Year ended 31 March 2014
Gratuity Termination benefits
Gratuity Termination benefits
Total expense recognised in the Statement of Profit and Loss
18.39 2.59 12.35 -
Actual contribution and benefit payments for year Actual benefit payments
(3.13) - (4.79) -
Actual contributions
0.50 - - -
Net asset / (liability) recognised in the Balance Sheet Present value of defined benefit obligation
68.03 8.01 63.08 -
Fair value of plan assets
7.93 - 9.83 -
Funded status [Surplus / (Deficit)]
(60.10) (8.01) (53.25) -
Net asset / (liability) recognised in the Balance Sheet
(60.10) (8.01) (53.25) -
Change in defined benefit obligations (DBO) during the year Present value of DBO at beginning of the year
63.08 - 54.54 -
Current service cost
10.22 2.59 9.36 -
Interest cost 5.78 - 4.92 -
Purchase/(sale) of undertaking
(11.04) 5.42 - -
Actuarial (gains) / losses
3.12 - (0.95) -
Benefits paid (3.13) - (4.79) -
Present value of DBO at the end of the year
68.03 8.01 63.08 -
Change in fair value of assets during the year Plan assets at beginning of the year
9.83 - 13.61 -
Expected return on plan assets
0.75 - 0.89 -
Actual company contributions
0.50 - - -
Actuarial gain / (loss)
(0.02) - 0.09 -
Benefits paid (3.13) - (4.76) -
Plan assets at the end of the year
7.93 - 9.83 -
Actual return on plan assets
0.72 - 1.00 -
Net assets, i.e., total assets minus total liabilities
Share of profit or loss
CurrencyAs % of
consolidated Net assets
Amount ` Million
As % of consolidated
loss
Amount ` Million
Sequent Pharmacuiticals Private Limited (Formely known as Sequent Oncolytics Private Limited)
0.00 0.00 (0.03) (0.03)
ForeignProvet Veterinerlik Urunleri Tic.Ltd.Sti
26.46 630.25 2.09 2.45
Alivira Animal Health Limited, Ireland
(4.85) (115.52) (26.14) (30.75)
Sequent Global Holdings Limited
0.10 2.42 35.48 41.73
Vedic Fanxipang (0.05) (1.20) (2.87) (3.37)
Elysian Life sciences Mauritius Limited
- - (1.36) (1.60)
Minority Interests in all subsidiaries
1,469.29 (10.23)
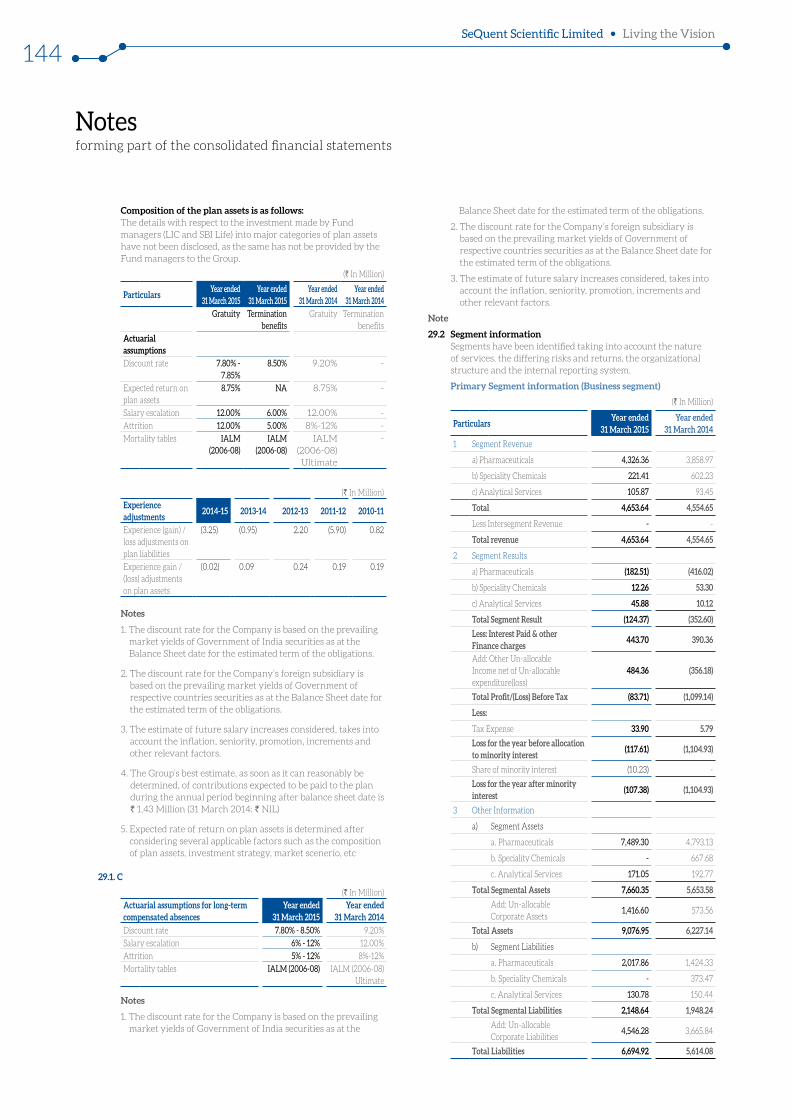
Notes forming part of the consolidated financial statements
SeQuent Scientific Limited Living the Vision
144
Composition of the plan assets is as follows: The details with respect to the investment made by Fund
managers (LIC and SBI Life) into major categories of plan assets have not been disclosed, as the same has not be provided by the Fund managers to the Group.
(` In Million)
ParticularsYear ended
31 March 2015Year ended
31 March 2015Year ended
31 March 2014Year ended
31 March 2014 Gratuity Termination
benefitsGratuity Termination
benefits
Actuarial assumptionsDiscount rate 7.80% -
7.85%8.50% 9.20% -
Expected return on plan assets
8.75% NA 8.75% -
Salary escalation 12.00% 6.00% 12.00% -
Attrition 12.00% 5.00% 8%-12% -
Mortality tables IALM (2006-08)
IALM (2006-08)
IALM (2006-08) Ultimate
-
(` In Million)
Experience adjustments
2014-15 2013-14 2012-13 2011-12 2010-11
Experience (gain) / loss adjustments on plan liabilities
(3.25) (0.95) 2.20 (5.90) 0.82
Experience gain / (loss) adjustments on plan assets
(0.02) 0.09 0.24 0.19 0.19
Notes
1. The discount rate for the Company is based on the prevailing market yields of Government of India securities as at the Balance Sheet date for the estimated term of the obligations.
2. The discount rate for the Company’s foreign subsidiary is based on the prevailing market yields of Government of respective countries securities as at the Balance Sheet date for the estimated term of the obligations.
3. The estimate of future salary increases considered, takes into account the inflation, seniority, promotion, increments and other relevant factors.
4. The Group’s best estimate, as soon as it can reasonably be determined, of contributions expected to be paid to the plan during the annual period beginning after balance sheet date is ` 1.43 Million (31 March 2014: ` NIL)
5. Expected rate of return on plan assets is determined after considering several applicable factors such as the composition of plan assets, investment strategy, market scenerio, etc
29.1. C
(` In Million)
Actuarial assumptions for long-term compensated absences
Year ended 31 March 2015
Year ended 31 March 2014
Discount rate 7.80% - 8.50% 9.20%
Salary escalation 6% - 12% 12.00%
Attrition 5% - 12% 8%-12%
Mortality tables IALM (2006-08) IALM (2006-08) Ultimate
Notes
1. The discount rate for the Company is based on the prevailing market yields of Government of India securities as at the
Balance Sheet date for the estimated term of the obligations.
2. The discount rate for the Company’s foreign subsidiary is based on the prevailing market yields of Government of respective countries securities as at the Balance Sheet date for the estimated term of the obligations.
3. The estimate of future salary increases considered, takes into account the inflation, seniority, promotion, increments and other relevant factors.
Note
29.2 Segment information Segments have been identified taking into account the nature
of services, the differing risks and returns, the organizational structure and the internal reporting system.
Primary Segment information (Business segment)
(` In Million)
ParticularsYear ended
31 March 2015Year ended
31 March 2014
1 Segment Revenue
a) Pharmaceuticals 4,326.36 3,858.97
b) Speciality Chemicals 221.41 602.23
c) Analytical Services 105.87 93.45
Total 4,653.64 4,554.65
Less Intersegment Revenue - -
Total revenue 4,653.64 4,554.65
2 Segment Results
a) Pharmaceuticals (182.51) (416.02)
b) Speciality Chemicals 12.26 53.30
c) Analytical Services 45.88 10.12
Total Segment Result (124.37) (352.60)
Less: Interest Paid & other Finance charges
443.70 390.36
Add: Other Un-allocable Income net of Un-allocable expenditure(loss)
484.36 (356.18)
Total Profit/(Loss) Before Tax (83.71) (1,099.14)
Less:
Tax Expense 33.90 5.79
Loss for the year before allocation to minority interest
(117.61) (1,104.93)
Share of minority interest (10.23) -
Loss for the year after minority interest
(107.38) (1,104.93)
3 Other Information
a) Segment Assets
a. Pharmaceuticals 7,489.30 4,793.13
b. Speciality Chemicals - 667.68
c. Analytical Services 171.05 192.77
Total Segmental Assets 7,660.35 5,653.58
Add: Un-allocable Corporate Assets
1,416.60 573.56
Total Assets 9,076.95 6,227.14
b) Segment Liabilities
a. Pharmaceuticals 2,017.86 1,424.33
b. Speciality Chemicals - 373.47
c. Analytical Services 130.78 150.44
Total Segmental Liabilities 2,148.64 1,948.24
Add: Un-allocable Corporate Liabilities
4,546.28 3,665.84
Total Liabilities 6,694.92 5,614.08
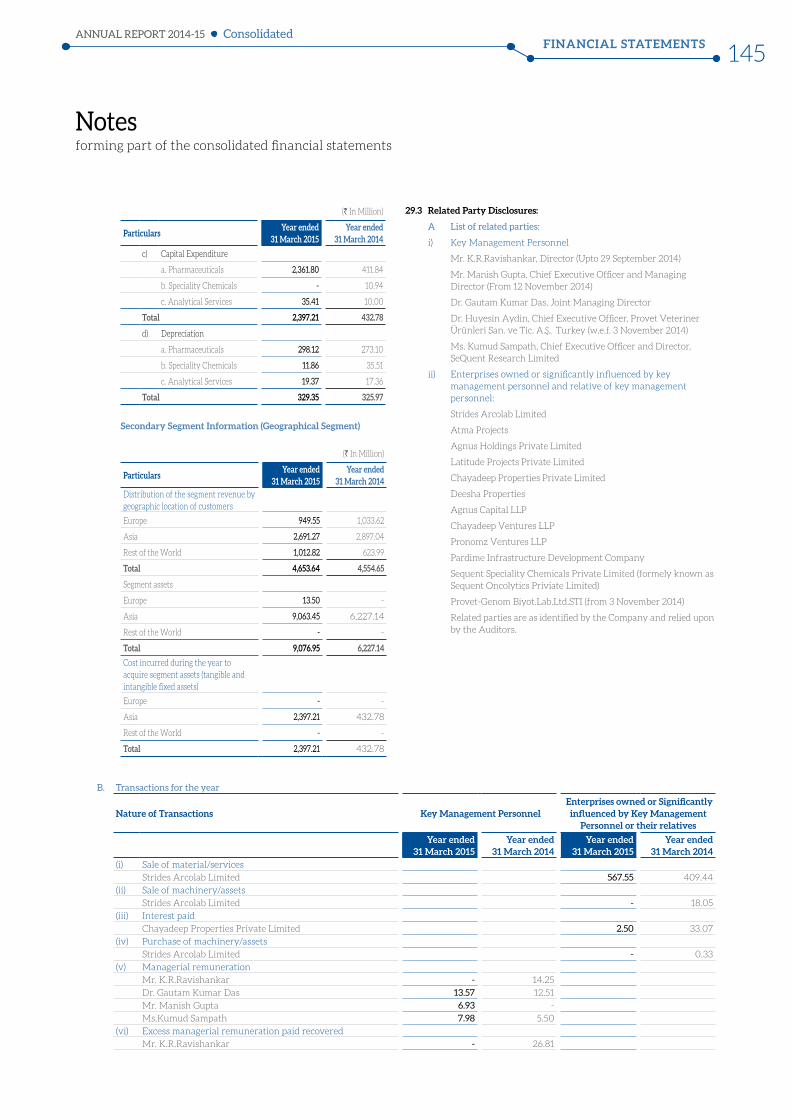
Notes forming part of the consolidated financial statements
FINANCIAL STATEMENTSANNUAL REPORT 2014-15
145Consolidated
(` In Million)
ParticularsYear ended
31 March 2015Year ended
31 March 2014
c) Capital Expenditure
a. Pharmaceuticals 2,361.80 411.84
b. Speciality Chemicals - 10.94
c. Analytical Services 35.41 10.00
Total 2,397.21 432.78
d) Depreciation
a. Pharmaceuticals 298.12 273.10
b. Speciality Chemicals 11.86 35.51
c. Analytical Services 19.37 17.36
Total 329.35 325.97
Secondary Segment Information (Geographical Segment)
(` In Million)
ParticularsYear ended
31 March 2015Year ended
31 March 2014Distribution of the segment revenue by geographic location of customers
Europe 949.55 1,033.62
Asia 2,691.27 2,897.04
Rest of the World 1,012.82 623.99
Total 4,653.64 4,554.65
Segment assets
Europe 13.50 -
Asia 9,063.45 6,227.14
Rest of the World - -
Total 9,076.95 6,227.14
Cost incurred during the year to acquire segment assets (tangible and intangible fixed assets)
Europe - -
Asia 2,397.21 432.78
Rest of the World - -
Total 2,397.21 432.78
29.3 Related Party Disclosures:
A List of related parties:
i) Key Management Personnel
Mr. K.R.Ravishankar, Director (Upto 29 September 2014)
Mr. Manish Gupta, Chief Executive Officer and Managing Director (From 12 November 2014)
Dr. Gautam Kumar Das, Joint Managing Director
Dr. Huyesin Aydin, Chief Executive Officer, Provet Veteriner Ürünleri San. ve Tic. A. ., Turkey (w.e.f. 3 November 2014)
Ms. Kumud Sampath, Chief Executive Officer and Director, SeQuent Research Limited
ii) Enterprises owned or significantly influenced by key management personnel and relative of key management personnel:
Strides Arcolab Limited
Atma Projects
Agnus Holdings Private Limited
Latitude Projects Private Limited
Chayadeep Properties Private Limited
Deesha Properties
Agnus Capital LLP
Chayadeep Ventures LLP
Pronomz Ventures LLP
Pardime Infrastructure Development Company
Sequent Speciality Chemicals Private Limited (formely known as Sequent Oncolytics Priviate Limited)
Provet-Genom Biyot.Lab.Ltd.STI (from 3 November 2014)
Related parties are as identified by the Company and relied upon by the Auditors.
B. Transactions for the year
Nature of Transactions Key Management Personnel Enterprises owned or Significantly
influenced by Key Management Personnel or their relatives
Year ended 31 March 2015
Year ended 31 March 2014
Year ended 31 March 2015
Year ended 31 March 2014
(i) Sale of material/services
Strides Arcolab Limited 567.55 409.44
(ii) Sale of machinery/assets
Strides Arcolab Limited - 18.05
(iii) Interest paid
Chayadeep Properties Private Limited 2.50 33.07
(iv) Purchase of machinery/assets
Strides Arcolab Limited - 0.33
(v) Managerial remuneration
Mr. K.R.Ravishankar - 14.25
Dr. Gautam Kumar Das 13.57 12.51
Mr. Manish Gupta 6.93 -
Ms.Kumud Sampath 7.98 5.50
(vi) Excess managerial remuneration paid recovered
Mr. K.R.Ravishankar - 26.81
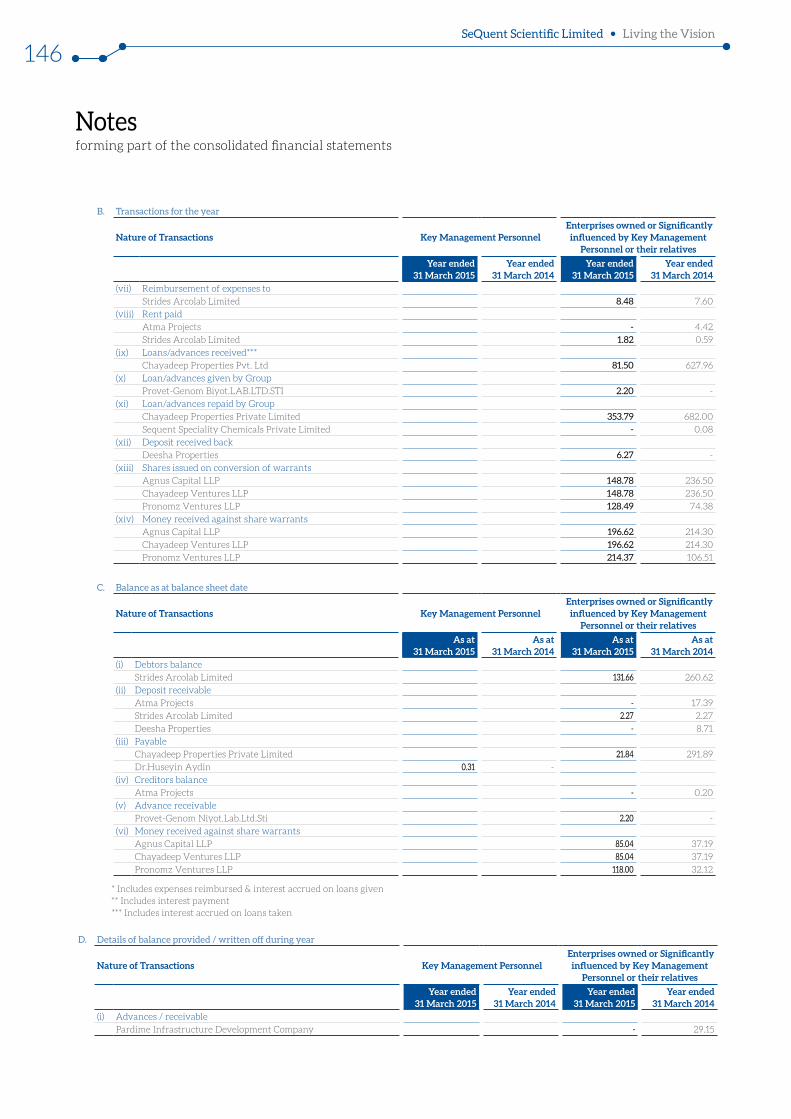
Notes forming part of the consolidated financial statements
SeQuent Scientific Limited Living the Vision
146
B. Transactions for the year
Nature of Transactions Key Management Personnel Enterprises owned or Significantly
influenced by Key Management Personnel or their relatives
Year ended 31 March 2015
Year ended 31 March 2014
Year ended 31 March 2015
Year ended 31 March 2014
(vii) Reimbursement of expenses to
Strides Arcolab Limited 8.48 7.60
(viii) Rent paid
Atma Projects - 4.42
Strides Arcolab Limited 1.82 0.59
(ix) Loans/advances received***
Chayadeep Properties Pvt. Ltd 81.50 627.96
(x) Loan/advances given by Group
Provet-Genom Biyot.LAB.LTD.STI 2.20 -
(xi) Loan/advances repaid by Group
Chayadeep Properties Private Limited 353.79 682.00
Sequent Speciality Chemicals Private Limited - 0.08
(xii) Deposit received back
Deesha Properties 6.27 -
(xiii) Shares issued on conversion of warrants
Agnus Capital LLP 148.78 236.50
Chayadeep Ventures LLP 148.78 236.50
Pronomz Ventures LLP 128.49 74.38
(xiv) Money received against share warrants
Agnus Capital LLP 196.62 214.30
Chayadeep Ventures LLP 196.62 214.30
Pronomz Ventures LLP 214.37 106.51
C. Balance as at balance sheet date
Nature of Transactions Key Management Personnel Enterprises owned or Significantly
influenced by Key Management Personnel or their relatives
As at 31 March 2015
As at 31 March 2014
As at 31 March 2015
As at 31 March 2014
(i) Debtors balance
Strides Arcolab Limited 131.66 260.62
(ii) Deposit receivable
Atma Projects - 17.39
Strides Arcolab Limited 2.27 2.27
Deesha Properties - 8.71
(iii) Payable
Chayadeep Properties Private Limited 21.84 291.89
Dr.Huseyin Aydin 0.31 -
(iv) Creditors balance
Atma Projects - 0.20
(v) Advance receivable
Provet-Genom Niyot.Lab.Ltd.Sti 2.20 -
(vi) Money received against share warrants
Agnus Capital LLP 85.04 37.19
Chayadeep Ventures LLP 85.04 37.19
Pronomz Ventures LLP 118.00 32.12
* Includes expenses reimbursed & interest accrued on loans given ** Includes interest payment *** Includes interest accrued on loans taken
D. Details of balance provided / written off during year
Nature of Transactions Key Management Personnel Enterprises owned or Significantly
influenced by Key Management Personnel or their relatives
Year ended 31 March 2015
Year ended 31 March 2014
Year ended 31 March 2015
Year ended 31 March 2014
(i) Advances / receivable
Pardime Infrastructure Development Company - 29.15
Notes forming part of the consolidated financial statements
FINANCIAL STATEMENTSANNUAL REPORT 2014-15
147Consolidated
29.4 Details of borrowing costs capitalised
(` In Million)
ParticularsYear ended
31 March 2015Year ended
31 March 2014
Borrowing costs capitalised during the year
- as fixed assets / intangible assets / capital work-in-progress
100.65 44.28
100.65 44.28
29.5 Details of leasing arrangements
The Group’s significant leasing arrangement is mainly in respect of factory building and office premises; the aggregate lease rent payable on these leasing arrangements charged to Statement of Profit and Loss is ` 16.14 Million. (Previous Year: ` 34.70 Million)
The Group has entered into non-cancelable lease arrangement for its facilities and office premises, the tenure of lease ranges from 5 years to 33 years. The said lease arrangements have an escalation clause where in lease rental is subject to an increment ranging from 6% to 10%. Details of lease commitments are given below:
(` In Million)
ParticularsAs at
31 March 2015As at
31 March 2014
not later than one year 6.51 1.85
later than one year and not later than five years 19.55 3.32
later than five years 122.77 -
29.6 Earnings per share
29.6.a Continuing operations
(` In Million)
Particulars
Year ended 31 March 2015
Year ended 31 March 2014
(except No. of Shares)
(except No. of Shares)
Net profit / (loss) for the year as per statement of profit and loss from continuing operations
(656.86) (1,102.76)
Less: Dividend on cummulative preference shares issued by subsidiary company outside the group
0.01 -
Net profit / (loss) for the year attributable to the equity shareholders from continuing operations
(656.87) (1,102.76)
Weighted average number of equity shares 28,615,328 25,838,262
Par value per share ` 10 10
Earnings / (Loss) per share from continuing operations - Basic and Diluted
(22.95) (42.68)
29.6. b Total operations
(` In Million)
Particulars
Year ended 31 March 2015
Year ended 31 March 2014
(except No. of Shares)
(except No. of Shares)
Net profit / (loss) for the year as per statement of profit and loss
(107.38) (1,104.93)
Less: Dividend on cummulative preference shares issued by subsidiary company outside the group
0.01 -
Net profit / (loss) for the year attributable to the equity shareholders
(107.39) (1,104.93)
Weighted average number of equity shares 28,615,328 25,838,262
Par value per share ` 10 10
Earnings / (Loss) per share - Basic and Diluted (3.75) (42.76)
29.7 a Deferred tax (liability) / asset
(` In Million)
ParticularsAs at
31 March 2015As at
31 March 2014
Tax effect of items constituting deferred tax liabilityDepreciation (189.89) (217.30)
Tax effect of items constituting deferred tax liability
(189.89) (217.30)
Tax effect of items constituting deferred tax assets
Disallowances under Section 43B of the Income Tax Act, 1961
47.45 31.86
Unabsorbed depreciation carried forward 110.58 172.63
Others 16.61 11.59
Tax effect of items constituting deferred tax assets
174.64 216.08
Net deferred tax (liability) / asset (15.25) (1.22)
The Group has recognised deferred tax asset on unabsorbed depreciation to the extent of the corresponding deferred tax liability on the difference between the book balance and the written down value of fixed assets under Income Tax.
b Movement of Deferred tax (liability) / asset
(` In Million)
ParticularsAs at
31 March 2015As at
31 March 2014
Opening balance (1.22) (1.78)
Less: Deferred tax adjusted against consolidated statement of Profit and Loss (Refer Note 28.5)
0.64 -
Add: Deferred tax liability included on acquisition of subsidiary
(31.42) -
Add: Credit for the year as per statement of profit and loss
13.73 0.56
Add: Consolidation adjustment 3.02 -
Closing balance (15.25) (1.22)
29.8 Details of research and development expenditure
A. Revenue expenditure
(` In Million)
ParticularsYear ended
31 March 2015Year ended
31 March 2014
Employee benefits expense 31.29 43.82
Power, water and fuel 7.28 5.89
Legal and professional fees - 0.18
Consumables 23.22 25.90
Travelling and conveyance 0.39 2.03
Analytical charges 32.50 30.84
Others 2.19 6.71
Total 96.87 115.37
The above include costs associated with the development services undertaken for customers and are as certified by the management and relied upon by the Auditors.
B. Capital expenditure
(` In Million)
ParticularsYear ended
31 March 2015Year ended
31 March 2014
Capital equipments - 0.11
Total - 0.11
These details are as complied by the management and have not been audited by the Statutory Auditors.
Notes forming part of the consolidated financial statements
SeQuent Scientific Limited Living the Vision
148
29.9 Intangible Assets/Intangible assets under development:
a. During the year, the following development expenditure have been transferred to Intangible assets / intangible assets under development from the Statement of Profit and Loss:
(` In Million)
ParticularsYear ended
31 March 2015Year ended
31 March 2014
Employee benefits expense 11.25 15.97
Power, water and fuel 3.36 4.12
Legal and professional fees - 0.11
Raw material and consumables 34.09 24.17
Travelling and conveyance expenses 0.15 0.50
Analytical charges 10.41 15.84
Depreciation 2.27 1.82
Others 1.27 3.53
Sale of validation batches (9.46) (19.68)
Total 53.34 46.38
b. Movement of Intangible assets under development:
(` In Million)
ParticularsYear ended
31 March 2015Year ended
31 March 2014
Opening balance 40.15 54.55
Add: Development expenses as Note 29.9(a) above
53.34 46.38
Add: Provision/(reversal) of provision for intangible assets
(8.83) 8.83
Less: Transfer on sale of Speciality Chemicals Division
5.90 -
Less: Transfer to gross block 73.26 51.95
Total 23.16 40.15
28.10 Discontinued operations a. During the year, pursuant to the approval of the Shareholders and other authorities as required, the Group has transferred the Specialty
Chemicals Division to Songwon Specialty Chemicals-India Private Limited on a slump sale basis with effect from the close of business on 31 July 2014 for a consideration of ` 1,068.46 Million (net of expenses). The Specialty Chemicals Division was reported as part of the Specialty Chemicals segment of the Group. The net profit on above sale of ` 551.42 Million for the year is included under gain on disposal of assets/settlement of liabilities attributable to the discontinuing operations. The results of the discontinued business during the year until discontinuation are as under:
(` In Million)
Profit / (Loss) from ordinary activitiesYear ended 31 March 2015 Year ended 31 March 2014
Continuing Operations
Discontinued Operations
Total Continuing Operations
Discontinued Operations
Total
Sale of products 4,256.45 220.62 4,477.07 3,831.13 602.23 4,433.36
Sale of Services 105.87 - 105.87 93.46 - 93.46
Other operating revenue 69.91 0.79 70.70 25.40 2.43 27.83
Other income 99.57 0.01 99.58 38.41 - 38.41
Total revenue (A) 4,531.80 221.42 4,753.22 3,988.40 604.66 4,593.06 Cost of materials consumed 1,990.78 63.54 2,054.32 2,047.10 350.11 2,397.21
Purchases of stock-in-trade 239.35 - 239.35 162.42 - 162.42
Changes in inventories of finished goods, work-in-progress and stock-in-trade 26.70 91.12 117.82 (94.18) (28.21) (122.39)
Employee benefits expense 611.07 12.84 623.91 446.93 34.25 481.18
Finance costs 429.81 13.89 443.70 335.16 55.20 390.36
Depreciation and amortisation expense 317.49 11.86 329.35 290.46 35.51 325.97
Other expenses 1,383.15 30.11 1,413.26 1,308.37 159.97 1,468.34
Total expenses (B) 4,998.35 223.36 5,221.71 4,496.26 606.83 5,103.09 Profit / (Loss) before tax from ordinary activities (A-B) (466.55) (1.94) (468.49) (507.86) (2.17) (510.03)Exceptional Items (166.64) - (166.64) 589.11 - 589.11
‘Gain on disposal of assets/settlement of liabilities attributable to the discontinuing operations
- 551.42 - - - -
Less: Tax expense relating to gain - - - - - -
Profit / (Loss) before tax after exceptional items (633.19) 549.48 (83.71) (1,096.97) (2.17) (1,099.14)Tax expense for continuing operations 33.90 - 33.90 5.79 - 5.79
Profit / (Loss) after tax before Minority interest (667.09) 549.48 (117.61) (1,102.76) (2.17) (1,104.93)Carrying amount of assets as at the balance sheet date relating to the discontinued business to be disposed off
- - - - 674.72 -
Carrying amount of liabilities as at the balance sheet date relating to the discontinued business to be settled
- - - - 131.13 -
Net cash flow attributable to the discontinued operationsCash flows from operating activities 228.19 (74.15)
Cash flows from investing activities 326.22 (12.57)
Cash flows from financing activities (555.54) 86.80
Notes forming part of the consolidated financial statements
FINANCIAL STATEMENTSANNUAL REPORT 2014-15
149Consolidated
NOTE 30 DISCLOSURES ON EMPLOYEE SHARE BASED PAYMENTS a) In the extraordinary general meeting held on March 8, 2008, the
shareholders approved the issue of options under the ESOP scheme. Options to be granted under the Scheme in any financial year shall not result in issue of equity shares of more than 7% of the issued and subscribed capital of the Company as at the date of grant of options. In accordance with the above, the Company established an ESOP trust to administer the scheme on February 25, 2010.
On the board meeting dated March 29, 2010, the Company has allotted 700,000 equity shares to the ESOP trust with a Face value of ` 10 per share at a premium of ` 103 per share. As at 31 March 2015, 582,500 equity shares (31 March, 2014 700,000 equity shares) of ` 10 each are reserved towards outstanding employee stock options granted / available for grant.
As per the scheme, the Compensation committee grants the options to the eligible employees. The exercise price and vesting period of each option shall be as decided by the compensation committee from time to time. The options granted would normally vest over a maximum period of 4 years from the date of the grant in proportions specified in the scheme. Options may be exercised with in a period of 4 years from the date of first vesting of the options.
b) During the current year, the Compensation Committee in its meeting held on May 28, 2014 and November 12, 2014 has granted 180,000 and 200,000 options respectively under Sequent Scientific Employees Stock Option Plan – 2010 (Sequent ESOP 2010) to certain eligible employees of the Company. The options allotted under Sequent Scientific Employees Stock Option Plan – 2010 (Sequent ESOP 2010) are convertible into equal number of equity shares. During the previous year, the Compensation Committee in its meeting held on May 30, 2013 and February 12, 2014 has granted 540,000 and 100,000 options respectively under Sequent Scientific Employees Stock Option Plan – 2010 (Sequent ESOP 2010) to certain eligible employees of the Company.
The vesting period of these options range over a period of 1 to 4 years. The options may be exercised within a period of 1 to 4 years from the date of vesting.
c) Employee stock options details as on the Balance Sheet date are as follows:
(` In Million)
Particulars
Year ended 31 March 2015
Year ended 31 March 2014
Options (Numbers)
Options (Numbers)
Option outstanding at the beginning of the year
570,000 -
Granted during the year 380,000 640,000
Vested during the year 142,500 -
Exercised during the year 117,500 -
Forfeited during the year 60,000 70,000
Options outstanding at the end of the year 772,500 570,000
Options available for grant 1,010,000 130,000
Range of exercise price for options outstanding at the end of the year
` 50 to ` 80 per Option
` 50 to ` 80 per Option
Weighted average remaining contractual life for options outstanding as at 31 March, 2015 in 3.86 years (As at 31 March 2014 - 4.27 years) and weighted average exercise price per option as at 31March 2015 is ` 65 ( As at 31 March 2014 is ` 65)
d) The impact on Earnings per Share if the ‘fair value’ of the options (on the date of the grant) were considered instead of the ‘intrinsic value’ is as under:
(` In Million)
ParticularsYear ended
31 March 2015Year ended
31 March 2014 Net Profit / (loss) (as reported) (107.38) (1,104.93)Add / (Less): stock based employee compensation (intrinsic value)
44.57 17.08
Add / (Less): stock based compensation expenses determined under fair value method for the grants issued (See note (e) below)
(126.86) (30.21)
Net Profit / (loss) (proforma) (189.67) (1,118.06)Basic earnings per share (as reported) (3.75) (42.76)Basic earnings per share (proforma) (6.63) (43.27)Diluted earnings per share (as reported) (3.75) (42.76)Diluted earnings per share (proforma) (6.63) (43.27)
e) The fair value of the options has been determined under the Black-Scholes model. The assumptions used in this model for calculating fair value are as below:
AssumptionsYear ended
31 March 2015Year ended
31 March 2014 Risk Free Interest Rate 7.74% 8.75%Expected Life 4 years 4 years Expected Annual Volatility of Shares 54.18% 48.53%Expected Dividend Yield NIL NIL
NOTE 31 During the year, the Group purchased the manufacturing fixed assets and business of Arvee Syntthesis Private Limited on a slump sale basis for a total consideration of ` 262.50 million. The Group incurred ` 5.39 Million towards stamp duty and registration of land and building.
NOTE 32 During the year following assets and liabilities were acquired due to acquisition of Provet Veteriner Ürünleri San. ve Tic. A. ., Turkey
(` In Million)ParticularsCurrent assets 375.14 Current liabilities (119.18)Fixed assets 270.95 Other non current assets 39.89 Other non current liability (31.42)
535.38
NOTE 33 TRANSFER PRICING In respect of Transfer pricing regulations under Section 92 to 92F of the Indian Income Tax Act, 1961, the Management confirms that its international transactions and Specified Domestic Transactions are at arm’s length so that the aforesaid legislation will not have any impact on the financial statements, particularly on the amount of tax expense and that of provision for tax.
NOTE 34 Previous year’s figures have been regrouped / reclassified wherever necessary to correspond with the current year’s classification / disclosure. Disclosure made under Note 29 to 32 reflects combined items pertaining to continuing and discontinuing operations.
For and on Behalf of the Board of Directors
Manish Gupta Dr. Gautam Kumar Das P R Kannan
Managing Director & Chief Executive Officer Joint Managing Director Chief Financial Officer
Preetham Hebbar
Company Secretary
Bengaluru, 24 April 2015

Notes

Notes

Notes
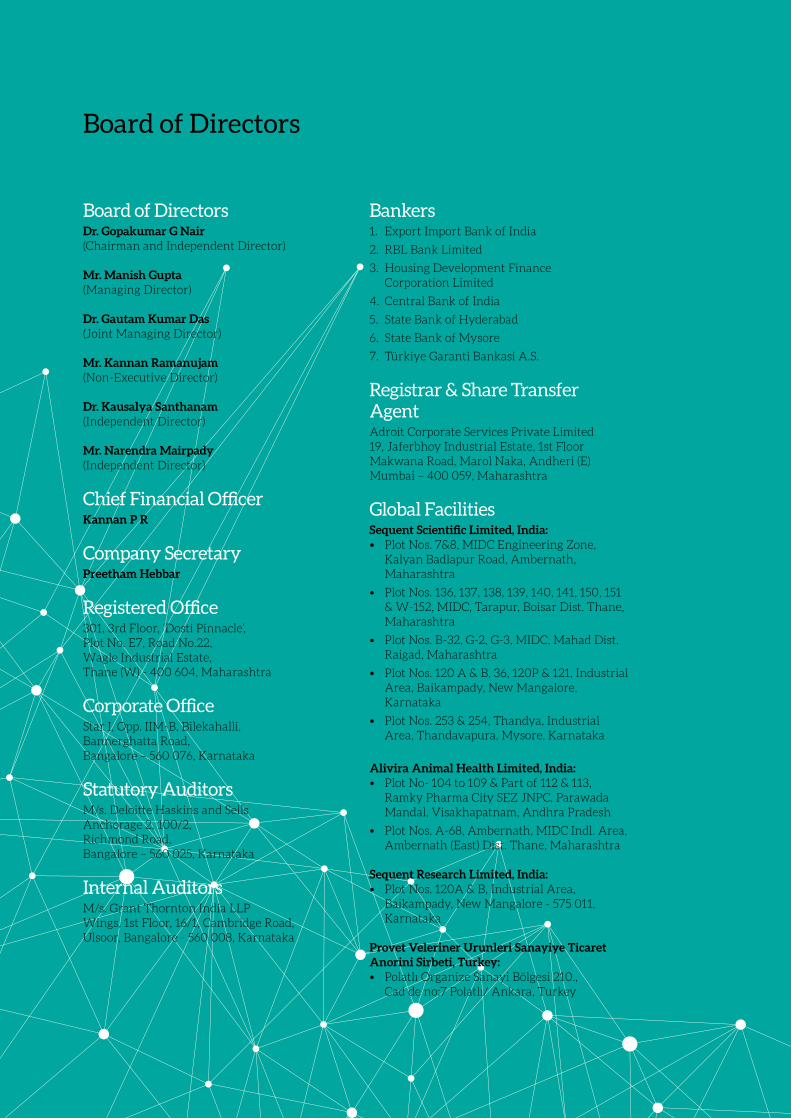
Board of DirectorsDr. Gopakumar G Nair (Chairman and Independent Director)
Mr. Manish Gupta (Managing Director)
Dr. Gautam Kumar Das (Joint Managing Director)
Mr. Kannan Ramanujam (Non-Executive Director)
Dr. Kausalya Santhanam (Independent Director)
Mr. Narendra Mairpady (Independent Director)
Chief Financial OfficerKannan P R
Company SecretaryPreetham Hebbar
Registered Office301, 3rd Floor, ‘Dosti Pinnacle’,Plot No. E7, Road No.22,Wagle Industrial Estate,Thane (W) - 400 604, Maharashtra
Corporate OfficeStar I, Opp. IIM-B, Bilekahalli,Bannerghatta Road,Bangalore – 560 076, Karnataka
Statutory AuditorsM/s. Deloitte Haskins and SellsAnchorage 2, 100/2, Richmond Road,Bangalore – 560 025, Karnataka
Internal AuditorsM/s. Grant Thornton India LLPWings, 1st Floor, 16/1, Cambridge Road,Ulsoor, Bangalore - 560 008, Karnataka
Bankers1. Export Import Bank of India
2. RBL Bank Limited
3. Housing Development Finance Corporation Limited
4. Central Bank of India
5. State Bank of Hyderabad
6. State Bank of Mysore
7. Türkiye Garanti Bankasi A.S.
Registrar & Share Transfer AgentAdroit Corporate Services Private Limited19, Jaferbhoy Industrial Estate, 1st FloorMakwana Road, Marol Naka, Andheri (E)Mumbai – 400 059, Maharashtra
Global FacilitiesSequent Scientific Limited, India:• Plot Nos. 7&8, MIDC Engineering Zone,
Kalyan Badlapur Road, Ambernath, Maharashtra
• Plot Nos. 136, 137, 138, 139, 140, 141, 150, 151 & W-152, MIDC, Tarapur, Boisar Dist. Thane, Maharashtra
• Plot Nos. B-32, G-2, G-3, MIDC, Mahad Dist. Raigad, Maharashtra
• Plot Nos. 120 A & B, 36, 120P & 121, Industrial Area, Baikampady, New Mangalore, Karnataka
• Plot Nos. 253 & 254, Thandya, Industrial Area, Thandavapura, Mysore, Karnataka
Alivira Animal Health Limited, India:• Plot No- 104 to 109 & Part of 112 & 113,
Ramky Pharma City SEZ JNPC, Parawada Mandal, Visakhapatnam, Andhra Pradesh
• Plot Nos. A-68, Ambernath, MIDC Indl. Area, Ambernath (East) Dist. Thane, Maharashtra
Sequent Research Limited, India:• Plot Nos. 120A & B, Industrial Area,
Baikampady, New Mangalore - 575 011, Karnataka
Provet Veleriner Urunleri Sanayiye Ticaret Anorini Sirbeti, Turkey:• Polatlı Organize Sanayi Bölgesi 210.,
Cad de no:7 Polatlı/ Ankara, Turkey
Board of Directors
conc
ept, c
onte
nt an
d de
sign a
t(in
fo@
aicl.in
)Registered Office301, 3rd Floor, ‘Dosti Pinnacle’, Plot No. E7Road No. 22, Wagle Industrial EstateThane (W), Mumbai – 400 604, Maharashtra. Ph: +91 22 41114777
Corporate OfficeStar I, Opp. IIM-B, BilekahalliBannerghatta RoadBangalore – 560 076, Karnataka.Ph: +91 80 67840340
Company InformationCIN: L99999MH1985PLC036685BSE Code: 512529 Email id: [email protected]: www.sequent.in
SeQuent Scientific Limited