Embed Size (px)
Citation preview

Humana Press
M E T H O D S I N M O L E C U L A R M E D I C I N ETM
VisionResearchProtocolsEdited by
P. Elizabeth Rakoczy
Humana Press
VisionResearchProtocolsEdited by
P. Elizabeth Rakoczy

Vision Research Protocols

60. Interleukin Protocols, edited by LukeA. J. O’Neill and Andrew Bowie, 2001
59. Molecular Pathology of the Prions,edited by Harry F. Baker, 2001
58. Metastasis Research Protocols:Volume 2, Cell Behavior In Vitroand In Vivo, edited by Susan A.Brooks and Udo Schumacher, 2001
57. Metastasis Research Protocols:Volume 1, Analysis of Cells andTissues, edited by Susan A. BrooksandUdo Schumacher, 2001
56. Human Airway Inflammation:Sampling Techniques and AnalyticalProtocols, edited by Duncan F. Rogersand Louise E. Donnelly, 2001
55. Hematologic Malignancies: Methodsand Protocols, edited by Guy B. Faguet,2001
54. Mycobacterium TuberculosisProtocols, edited by Tanya Parishand Neil G. Stoker, 2001
53. Renal Cancer: Methods and Protocols,edited by Jack H. Mydlo, 2001
52. Atherosclerosis Methods and Protocols,edited by Angela F. Drew, 2001
51. Angiotensin Protocols, edited byDonna H. Wang, 2001
50. Colorectal Cancer: Methods andProtocols, edited by Steven M.Powell, 2001
49. Molecular Pathology Protocols,edited by Anthony A. Killeen, 2001
48. Antibiotic Resistance Methods andProtocols, edited by Stephen H.Gillespie, 2001
47. Vision Research Protocols, edited byP. Elizabeth Rakoczy, 2001
46. Angiogenesis: Reviews andProtocols, edited by J. CliffordMurray, 2001
45. Hepatocellular Carcinoma: Methodsand Protocols, edited by Nagy A.Habib, 2000
44. Asthma: Mechanisms and Protocols,edited by K. Fan Chung and IanAdcock, 2000
43. Muscular Dystrophy: Methods andProtocols, edited by Katherine B.Bushby and Louise Anderson, 2000
42. Vaccine Adjuvants: PreparationMethods and Research Protocols,edited by Derek T. O’Hagan, 2000
41. Celiac Disease: Methods andProtocols, edited by Michael N.Marsh, 2000
40. Diagnostic and TherapeuticAntibodies, edited by Andrew J. T.George and Catherine E. Urch, 2000
39. Ovarian Cancer: Methods and Protocols,edited by John M. S. Bartlett, 2001
38. Aging Methods and Protocols,edited by Yvonne A. Barnett andChristopher R. Barnett, 2001
37. Electrochemotherapy,Electrogenetherapy, and TransdermalDrug Delivery: Electrically MediatedDelivery of Molecules to Cells, edited byMark J. Jaroszeski, Richard Heller, andRichard Gilbert, 2000
36. Septic Shock Methods and Protocols,edited by Thomas J. Evans, 2000
M E T H O D S I N M O L E C U L A R M E D I C I N ETM
John M. Walker, SERIES EDITOR

Humana Press Totowa, New Jersey
M E T H O D S I N M O L E C U L A R M E D I C I N E TM
Vision ResearchProtocols
Edited by
P. Elizabeth RakoczyCentre for Ophthalmology and Visual Science,
Lions Eye Institute,University of Western Australia,
Nedlands, Perth

© 2001 Humana Press Inc.999 Riverview Drive, Suite 208Totowa, New Jersey 07512
All rights reserved. No part of this book may be reproduced, stored in a retrieval system, or transmitted inany form or by any means, electronic, mechanical, photocopying, microfilming, recording, or otherwisewithout written permission from the Publisher. Methods in Molecular Medicine™ is a trademark of TheHumana Press Inc.
All authored papers, comments, opinions, conclusions, or recommendations are those of the author(s), anddo not necessarily reflect the views of the publisher.
Cover design by Patricia F. Cleary
This publication is printed on acid-free paper.ANSI Z39.48-1984 (American Standards Institute) Permanence of Paper for Printed Library Materials.
For additional copies, pricing for bulk purchases, and/or information about other Humana titles, contactHumana at the above address or at any of the following numbers: Tel.: 973-256-1699; Fax: 973-256-8341;E-mail: [email protected] or visit our Website: http://humanapress.com
Photocopy Authorization Policy:Authorization to photocopy items for internal or personal use, or the internal or personal use of specificclients, is granted by Humana Press Inc., provided that the base fee of US $10.00 per copy, plus US $00.25per page, is paid directly to the Copyright Clearance Center at 222 Rosewood Drive, Danvers, MA 01923.For those organizations that have been granted a photocopy license from the CCC, a separate system ofpayment has been arranged and is acceptable to Humana Press Inc. The fee code for users of the TransactionalReporting Service is: [0-89603-837-8/00 $10.00 + $00.25].
Printed in the United States of America. 10 9 8 7 6 5 4 3 2 1
Library of Congress Cataloging in Publication Data
Vision research protocols / edited by P. Elizabeth Rakoczy p.; cm.--(methods in molecular medicine; 47) Includes bibliographical references and index. ISBN 0-89603-837-8 (alk. paper) 1. Ophthalmology--Research--Methodology. 2. Molecular biology--Methodology. 3. Eye--Diseases--Molecular aspects. 4. Eye--Diseases--Gene therapy. I. Rakoczy, P. Elizabeth. II. Series. [DNLM: 1. Eye Diseases--genetics. 2. Eye Diseases--physiopathology. 3. Genetics, Biochemical. WW 140 O207 2000] RE58 .O25 200 00-033502 617.7--dc21 CIP

Preface
v
Genetic technology is the buzzword of the new millennium. Via the media,we are informed day by day about new genes, disease-causing mutations, clonedanimals, “Frankenstein” food, and further advances in the Human Genome Project.However, in spite of the constant media attention, most people remain con-fused about the importance and application of these new discoveries. It seemsthat only the high priests of this new technology, armed with PhDs in molecu-lar biology, understand the meaning, importance, and consequences of thesenew breakthroughs. But should it be like this? After all, molecular biology isonly a tool, though one that enables us to study the secrets of life, death, anddisease development.
Vision Research Protocols has been written for those scientists, optometrists,and ophthalmologists who are interested in eye research, but have not beentrained in molecular biology. It covers molecular biological techniques fromthe basics to the most sophisticated recent technologies. In each case, the tech-niques described have been adapted to the special requirements of eye re-search. The first four chapters discuss crucial molecular biologicalmethodologies that create a basis for the more complex methodologies pre-sented later. The last chapter discusses the impact of these new technologieson everyday clinical services.
The first four chapters follow the basic dogma of molecular biology.They describe the extraction of DNA and detection of mRNA and proteinexpression in vitro and in vivo. In addition, Chapter 2 gives a description ofthe basics of tissue culture technology, which has significantly advanced bio-logical research since the 1970s.
In a philosophical sense, diseases can be considered as disturbances inthe normal balance within a complex organism. In molecular terms, certaingenes become up or down regulated, or turned on and off out of sequence. Inthis respect, the new molecular biological techniques can have a significantimpact both in the development of animal models and on new treatments fordiseases. Chapters 5, 6, and 12 discuss technologies suitable for the downregulation of gene expression. Chapters 7–10 are devoted to the new genetherapy technologies. Following a very enthusiastic start in the early 1990s,

vi Preface
gene therapy proved to be a difficult technology to apply, and further improve-ments are required before it can be considered ready for clinical application.However, even in its present form, it is particularly suitable for the develop-ment of animal models and for testing new therapies in transgenic and knock-out animal models. Vision Research Protocols contains a detailed descriptionof the three most popular viral delivery vehicles: recombinant adeno, adeno-associated, and retroviruses. In addition, delivery methods for the most popu-lar animal models are also described.
In summary, I recommend Vision Research Protocols to all medical andnonmedical scientists who are thinking of using these new technologies intheir research, or those clinicians who would like to find out the current stateof progress in this important field of molecular medicine.
I would like to sincerely thank all the contributors, who are leading sci-entists in their fields with real hands-on experience in the different techniques.They were wonderful to work with, and I would specifically thank them forproviding their invaluable comments in the troubleshooting sections of eachchapter. I also would like to thank Ms. Louise Kemp, who has been superb inorganizing the contributions of experts from three continents.
P. Elizabeth Rakoczy

Contents
Preface .............................................................................................................v
Contributors ..................................................................................................... ix
1 Basic Molecular Biology TechniquesChooi-May Lai ........................................................................................ 1
2 Transient Transfection of Human Retinoblastoma Cells:Application to the Analysis of the Regulatory Regionsof Photoreceptor-Specific Genes
Debora B. Farber, Leonid E. Lerner, and Andrea S. Viczian. ......... 31
3 In Situ HybridizationXian-Jie Yang ....................................................................................... 45
4 Immunocytochemical Studies of the RetinaAnn H. Milam ........................................................................................ 71
5 Antisense DNA TechnologyPiroska Elizabeth Rakoczy ................................................................. 89
6 Inhibition of Gene Expression by RibozymesWilliam W. Hauswirth, Lynn C. Shaw, Patrick O. Whalen,
Jason J. Fritz, D. Alan White, and Alfred S. Lewin ................... 105
7 Intraocular Delivery of Recombinant VirusFong-Qi Liang, Vibha Anand, Albert M. Maguire,
and Jean Bennett ........................................................................... 125
8 Preparation of Recombinant AdenovirusesKarl G. Csaky...................................................................................... 141
9 Generation of Recombinant Adeno-Associated VirusFabienne Rolling ................................................................................ 157
10 Preparation of Recombinant RetrovirusesXian-Jie Yang ..................................................................................... 171
11 Generation of Transgenic Mice for Studies of Ocular Developmentand Disease
Abha R. Gupta, Nadine S. Dejneka, Albert M. Maguire,and Jean Bennett ........................................................................... 191
vii

12 Generation of Knockout Animal ModelsT. Michael Redmond .......................................................................... 215
13 Mutation Analysis of Ocular GenesMichael Danciger ............................................................................... 237
14 Ophthalmologists' PerspectiveSusan M. Downes, N. H. Victor Chong, and Alan C. Bird ............. 251
Index ............................................................................................................ 307
viii Contents

Contributors
VIBHA ANAND • Chance Labs, Department of Ophthalmology, Universityof Pennsylvania, Philadelphia, PA
JEAN BENNETT • Scheie Eye Institute, Department of Ophthalmology, Universityof Pennsylvania, Philadelphia, PA
ALAN C. BIRD • Medical Retina Department, Moorfields Eye Hospital, London, UKN. H. VICTOR CHONG • Medical Retina Department, Moorfields Eye Hospital,
London, UKKARL G. CSAKY • Laboratory of Immunology, NEI/NIH, Bethesda, MDMICHAEL DANCIGER • Department of Biology, Loyola Marymount University,
and Jules Stein Eye Institute, UCLA School of Medicine, Los Angeles, CANADINE S. DEJNEKA • Department of Ophthalmology, University of Pennsylvania,
Philadelphia, PASUSAN M. DOWNES • Medical Retina Department, Moorfields Eye Hospital,
London, UKDEBORA B. FARBER • Jules Stein Eye Institute, UCLA School of Medicine,
Los Angeles, CAJASON J. FRITZ • Department of Molecular Genetics and Microbiology, University
of Florida, Gainesville, FLABHA R. GUPTA • Department of Ophthalmology, University of Pennsylvania,
Philadelphia, PAWILLIAM W. HAUSWIRTH • Department of Molecular Genetics and Microbiology,
University of Florida, Gainesville, FLCHOOI-MAY LAI • Lions Eye Institute, University of Western Australia,
Nedlands, Perth, Western AustraliaLEONID E. LERNER • Jules Stein Eye Institute, UCLA School of Medicine,
Los Angeles, CAALFRED S. LEWIN • Department of Molecular Genetics and Microbiology,
University of Florida, Gainesville, FLFONG-QI LIANG • Chance Labs, Department of Ophthalmology, University
of Pennsylvania, Philadelphia, PAALBERT M. MAGUIRE • Department of Ophthalmology, University of Pennsylva-
nia, Philadelphia, PA
ix

x Contributors
ANN H. MILAM • Scheie Eye Institute, Department of Ophthalmology,University of Pennsylvania Health System, Philadelphia, PA
P. ELIZABETH RAKOCZY • Lions Eye Institute, University of Western Australia,Nedlands, Perth, Western Australia
T. MICHAEL REDMOND • NEI–LRCMB, NIH, Bethesda, MarylandFABIENNE ROLLING • Laboratoire de Therapie Genique, CHU Hotel-Dieu,
Nantes, FranceLYNN C. SHAW • Department of Molecular Genetics and Microbiology,
University of Florida, Gainesville, FLPATRICK O. WHALEN • Department of Molecular Genetics and Microbiology,
University of Florida, Gainesville, FLANDREA S. VICZIAN • Jules Stein Eye Institute, UCLA School of Medicine,
Los Angeles, CAD. ALAN WHITE • Department of Molecular Genetics and Microbiology,
University of Florida, Gainesville, FLXIAN-JIE YANG • Jules Stein Eye Institute, UCLA School of Medicine,
Los Angeles, CAXIAN-JIE YANG • Department of Ophthalmology and Neurobiology,
Jules Stein Eye Institute, UCLA School of Medicine, Los Angeles, CA
Molecular Biology Techniques 1
1
From: Methods in Molecular Medicine, vol. 47: Vision Research ProtocolsEdited by: P. E. Rakoczy © Humana Press Inc., Totowa, NJ
1
Basic Molecular Biology Techniques
Chooi-May Lai
1. Introduction
Molecular biology was first referred to as the study of the chemi-cal and physical structure of biological macromolecules such asnucleic acids and proteins. Nucleic acids, deoxyribonucleic acid(DNA), and ribonucleic acid (RNA) are polymers that consist ofnucleotides. Proteins are polymers that consist of several aminoacids. DNA and RNA encode the genetic information that specifiesthe primary structure of the proteins unique to the organism. Thus, astudy of the interrelation between nucleic acids and proteins mayprovide an understanding to the biological function of a gene.
The field of molecular biology has progressed rapidly in the pastthree decades. This progress has, in many ways, been because of thedevelopment of new laboratory techniques that have enabled theefficient isolation, cloning, expression, manipulation, and identifi-cation of genes of interest. In recent years, molecular biology tech-niques have been used in ocular research, revolutionizing diagnostictests for both inherited and acquired ocular diseases. Genes such asRPE65 and cellular retinaldehyde-binding protein (CRALBP),which are abundantly expressed in the retinal pigment epithelium(1–3), have been isolated and mutations in both of these genes havebeen linked to ocular diseases (4,5). A number of laboratories are

2 Lai
currently using molecular biology techniques to produce transgenicanimals (6) and gene knock-out animals (7–9) to study the impor-tance of certain genes in the eye. At the same time, molecular biol-ogy-based gene therapy techniques are being used on animal modelsfor ocular diseases to try to find a cure or to slow down the progres-sion of the disease (10–14). In this chapter, some basic molecularbiology techniques commonly used in ocular research are presented.
2. Materials
2.1. Solutions for Extractionof Genomic and Plasmid DNA
1. Digestion buffer: 100 mMNaCl, 10 mMTris-HCl (pH 8.0), 25 mM ethylene-diaminetetraacetic acid (EDTA) (pH 8.0), 0.5% sodium dodecyl sul-fate (SDS), 100 µg/mL proteinase K.
2. Phosphate-buffered saline (PBS): 140 mM NaCl, 2.7 mM KCl,6.5 mM Na2HPO4, 1.5 mM KH2PO4. Autoclave.
3. Tris-EDTA (TE) buffer: 10 mM Tris-HCl, 1 mM EDTA. Adjust pHto 8.0. Autoclave.
4. Luria Bertoni (LB) broth: 1% (w/v) bactotryptone, 0.5% (w/v) yeastextract, 1% (w/v) NaCl. Autoclave.
5. Sucrose/Triton X/EDTA/Tris (STET) solution: 8% (w/v) sucrose,5% (w/v) Triton X-100, 50 mM EDTA, 50 mM Tris-HCl (pH 8.0).Filter sterilize and store at 4°C.
6. Glucose/Tris/EDTA (GTE) solution: 50 mM glucose, 25 mM Tris-HCl (pH 8.0), 10 mM EDTA (pH 8.0). Autoclave and store at 4°C.
7. NaOH/SDS solution: 200 mM NaOH, 1% (w/v) SDS.8. 3 M potassium acetate solution: 3 M potassium acetate, 11.5% (v/v)
glacial acetate acid. Adjust pH to 4.8 with KOH pellet. Do not auto-clave. Store at room temperature.
9. Ethidium bromide stock solution: 10 mg/mL ethidium bromide indistilled water. Store in a dark bottle at 4°C.
10. 20X SSC: 3 M NaCl, 300 mM trisodium citrate.
2.2. Solutions for Extraction of RNA
1. Denaturing solution: 4 M guanidine thiocyanate, 25 mM sodium cit-rate, 0.5% (w/v) N-lauroylsarcosine, 100 mM -mercaptoethanol.

Molecular Biology Techniques 3
2. Diethyl pyrocarbonate (DEPC)-treated water: 0.2% DEPC in double-distilled water. Leave overnight and autoclave.
3. Column wash buffer: 100 mM NaOH, 5 mM EDTA solution.4. Equilibration buffer: 500 mM LiCl, 10 mM Tris-HCl (pH 7.5),
1 mM EDTA, 0.1% (w/v) SDS.5. Wash buffer: 150 mM LiCl, 10 mM Tris-HCl (pH 7.5), 1 mM EDTA,
0.1% (w/v) SDS.6. Elution buffer: 2 mM EDTA, 0.1% (w/v) SDS.
2.3. Solutions for Analysis of DNA
1. Tris/acetate (TAE) buffer: 40 mM Tris-HCl (pH 8.0), 1 mM EDTA.2. Tris/borate (TBE) buffer: 89 mM Tris-HCl (pH 8.3), 89 mM boric
acid, 2 mM EDTA.3. DNA loading buffer: 25% (w/v) Ficoll 400 or 50% (w/v) sucrose,
100 mM EDTA, 0.1% (w/v) bromophenol blue.4. Denaturation buffer: 1.5 M NaCl, 500 mM NaOH.5. Neutralization buffer: 1.5 M NaCl, 500 mM Tris-HCl (pH 7.0).6. Transfer buffer: 20X SSC: 3 M NaCl, 300 mM trisodium citrate or
0.4 M NaOH.
2.4. Solutions for Analysis of RNA
1. 10X MOPS buffer: 200 mM MOPS (pH 7.0), 50 mM sodium acetate,10 mM EDTA (pH 8.0).
2. RNA loading buffer: 1 mM EDTA (pH 8.0), 0.25% (w/v) xylenecyanol, 0.25% (w/v) bromophenol blue, 50% (v/v) glycerol.
3. 10X SSC: 1.5 M NaCl, 150 mM trisodium citrate.
2.5. Solutions for Analysis of Proteins
1. 4X gel buffer: 1.5 M Tris base (pH 8.8), 0.4% (w/v) SDS.2. 2X stacking gel buffer: 250 mM Tris base (pH 6.8), 0.2% (w/v) SDS.3. Electrode buffer: 25 mM Tris base (pH 8.3), 0.1% (w/v) SDS, 192 mM
glycine.4. Sample loading buffer: 125 mM Tris base (pH 6.8), 4% (w/v) SDS,
10% glycerol, 0.02% (w/v) bromophenol blue, 4% (v/v) -mercapto-ethanol.
5. Fixing solution: 50% (v/v) methanol, 10% (v/v) acetic acid.

4 Lai
6. Coomassie staining solution: 50% (v/v) methanol, 10% (v/v) aceticacid, 0.05% (v/v) Coomassie brilliant blue.
7. Destaining solution: 5% (v/v) methanol, 7% (v/v) acetic acid.8. Sliver nitrate solution: 3.5 mL concentrated NH4OH, 42 mL 0.36% NaOH,
154.5 mL water, swirl while adding 8 mL 20% (w/v) AgNO3 in water.9. Developer: 0.05% (v/v) citric acid in water. Add 5 µL 37% formal-
dehyde solution to each mL 0.05% citric acid.10. Transfer buffer: 25 mM Tris base, 192 mM glycine, 20% (v/v) methanol.11. TBS: 100 mM Tris base, 150 mM NaCl, adjust pH to 7.6.12. Blocking buffer: 10% (w/v) skim milk in TBS.
2.6. Solutions for Subcloning
1. Dephosphorylation buffer:• 10X alkaline phosphatase buffer 5 µL• Water 24 µL• Alkaline phosphatase 1 µL
2. Cloning buffer:• Cut insert (0.3 µg) 2 µL• Linearized and dephosphorylated vector (0.1 µg) 1 µL• T4 DNA ligase 1 U• 10X ligase buffer 2 µL• Water to final volume of 20 µL
3. LB broth: 1% (w/v) bactotryptone, 0.5% (w/v) yeast extract, 1% (w/v)NaCl. Autoclave.
4. Agar plates: 1.5% (w/v) bactoagar, 1% (w/v) bactotryptone, 0.5% (w/v)yeast extract, 1% (w/v) NaCl. Autoclave. Cool to 50°C. Add antibi-otics and pour into plastic Petri dishes (20–25 mL per 15-mm-diam-eter plate).
5. TE buffer: 10 mM Tris-HCl, 1 mM EDTA. Adjust pH to 8.0. Autoclave.6. DNA loading buffer: 25% (w/v) Ficoll 400 or 50% (w/v) sucrose,
100 mM EDTA, 0.1% (w/v) bromophenol blue.
3. Methods
3.1. Extraction of Nucleic Acid
Genomic DNA and RNA are used for preparation of genomic orcomplementary DNA (cDNA) libraries, respectively. Genomic DNA

Molecular Biology Techniques 5
is also frequently used for mapping of genes, and total or messengerRNA (mRNA) is normally used for gene expression studies.Genomic DNA fragments or cDNA from transcription of total RNAare often cloned into plasmid vectors for further analysis ormanipulation (Subheading 3.4.). Currently, kits are available froma number of companies for nucleic acid extraction, but the follow-ing sections outline some basic steps involved in their extraction.
3.1.1. Extraction of Genomic DNA
Different techniques for genomic DNA extraction are used, butthey all involve the lysis of cells (either from tissues removed or fromcell culture), deproteination, and recovery/purification of DNA.
3.1.1.1. MAMMALIAN TISSUE
When using mammalian tissue, including the retina layer gentlypeeled off the choroid layer, the following steps are performed:
1. Remove tissue rapidly, mince and freeze tissue in liquid nitrogen.2. Grind to a fine powder frozen tissue suspended in liquid nitrogen in
prechilled mortar and pestle.3. Resuspend 100 mg powdered tissue in 1.2 mL digestion buffer. Pro-
ceed to step 5 in Subheading 3.1.1.2.
3.1.1.2. CULTURED CELLS
When using cultured cells, the following steps are followed:
1. Remove adherent cells from flask by trypsin dispersion and pelletcells by centrifugation. Discard supernatant. For suspension culture,pellet cells by centrifugation and discard supernatant. Centrifuga-tion is normally carried out at between 500–1000g for 5 min at 4°C.
2. Wash cells by resuspending cells in ice-cold PBS. Pellet cells bycentrifugation and discard supernatant.
3. Repeat step 2.4. Resuspend washed cells in digestion buffer at a ratio of 108 cells
per mL digestion buffer. Digestion buffer can also be added directlyto adherent cells that have been washed with PBS. The resulting

6 Lai
cell lysate can then be transferred to a microfuge tube for subse-quent steps.
5. Incubate samples in digestion buffer at 50°C overnight with gentleshaking. (The sample is normally very viscous at this stage.)
6. Extract DNA by adding an equal volume of 25:24:1 phenol/chloro-form/isoamyl alcohol to the sample and shaking gently to thoroughlymix the two phases. Centrifuge at 1500–2000g, then transfer theaqueous (top) phase to a new tube.
7. Repeat extraction as in step 6.8. Add to the aqueous phase, 0.5 vol 7.5 M ammonium acetate and
2 vol 100% ethanol. Mix gently by rocking tube. The DNA willform a stringy precipitate, which can be recovered by either centrifu-gation at 2000g for 2 min or transferred using the tip of a drawn-outsilanized Pasteur pipet to a new tube.
9. Rinse the DNA with 70% ethanol to remove residual salt and phenol,decant ethanol, and air-dry the pellet.
10. Resuspend DNA in TE buffer with gentle shaking at 37°C until dis-solved. Adjust DNA concentration with TE buffer to 1 mg/mL andstore immediately at 4°C.
3.1.2. Boiling Miniprep for Plasmid DNA Extraction
This is a rapid method for preparing partially purified plasmidDNA for restriction digestion before large-scale growth. It involvesalkaline lysis to release the plasmid DNA from the cell, leavingbehind bacterial chromosomal DNA and cell wall debris, and pre-cipitation of the resulting plasmid DNA.
1. Select transformants (bacteria colonies seen on agar plate after over-night incubation) with sterile loop and place in 3-mL LB broth andthe appropriate selective agent such as antibiotics (see Note 1). Growat 37°C overnight with shaking.
2. Transfer 1.5 mL of culture to a microfuge tube. Centrifuge for 2 minat 2000g to pellet cells. Discard supernatant.
3. Resuspend pellet in 50 µL STET solution. Vortex to ensure that pel-let is completely resuspended.
4. Add 4 µL of freshly prepared lysozyme (10 mg/mL). Mix byvortexing for 3 s.
5. Immediately transfer tube to boiling water and leave for 40 s.
Molecular Biology Techniques 7
6. Transfer to microfuge and immediately centrifuge for 10 min at10,000g.
7. Remove the gelatinous pellet with a sterile toothpick.8. Precipitate DNA by adding 50 µL cold isopropanol to remaining
supernatant. Mix, then incubate in dry ice-ethanol bath for 5 min orat –70°C for 30 min.
9. Centrifuge for 15 min at 10,000g to pellet DNA. Remove superna-tant and dry DNA pellet briefly under vacuum.
10. Resuspend DNA in 30 µL TE buffer.
3.1.3. Large-Scale Preparationof Plasmid DNA: Alkaline-Lysis Method/CsCl-Ethidium Bromide Equilibrium Centrifugation Method
The alkaline lysis method is a fairly rapid and very reliablemethod for purifying plasmid DNA from Escherichia coli. Theresulting plasmid DNA is suitable for most molecular biologicalapplications and with the additional cesium chloride (CsCl)-ethidium bromide equilibrium centrifugation step, the high-qualityplasmid DNA obtained can be used to transfect cells or injectdirectly into animals. The alkaline-lysis method involves the lysisof plasmid-bearing E. coli with a solution containing SDS andNaOH, followed by precipitation with potassium acetate beforeseparation of plasmid DNA from proteins and chromosomal DNAby centrifugation. The plasmid DNA is then precipitated using iso-propanol and purified by CsCl-ethidium bromide centrifugation.
1. Prepare preinoculum by inoculating a single colony of E. coli con-taining the plasmid of interest into 5–10 mL LB broth with theappropriate selective agent (see Note 1). Shake vigorously overnightat 37°C.
2. Inoculate overnight culture from step 1 into 1 L LB broth containingthe appropriate selective agent in a 5-L flask. Shake culture vigor-ously overnight at 37°C.
3. Centrifuge culture at 5000g at 4°C to pellet cells.4. Resuspend cell pellet from 1-L culture in 40 mL GTE solution.5. Add 80 mL freshly prepared NaOH/SDS solution to resuspended
cells. Mix by gently stirring with a pipet or by gentle inversion until
8 Lai
solution becomes homogenous and clear. Incubate at room tempera-ture for 10 min.
6. Add 60 mL 3 M potassium acetate solution. Mix gently by inversion.Incubate for 5 min at room temperature
7. Centrifuge at 5000g for 20 min.8. Decant supernatant through four layers of sterile cheesecloth.9. Precipitate the plasmid DNA by adding isopropanol to a final vol-
ume of 400 mL.10. Pellet plasmid DNA by centrifuging at 10,000g for 15 min.11. Remove supernatant and wash pellet with 70% ethanol. Centrifuge
briefly at 10,000g for 5 min.12. Aspirate supernatant and vacuum dry pellet. This pellet can be stored
indefinitely.13. Resuspend pellet in 8 mL TE buffer.14. Add 0.8 mL ethidium bromide (10 mg/mL concentration) to resus-
pended plasmid DNA.15. Centrifuge to pellet any complex formed between ethidium bromide
and protein present. Transfer supernatant to a fresh tube.16. Add 1.1 g cesium chloride (CsCl) to each mL of supernatant recovered.17. Using a refractometer or a balance, check the density of the solution
and adjust density of solution to between 1.55 and 1.59 g/mL byadding TE buffer or CsCl, as appropriate.
18. Transfer solution to 5-mL or 12-mL quick-seal ultracentrifuge tubes.Top tubes, if necessary, with CsCl/TE buffer solution adjusted todensity of 1.55–1.59 g/mL and seal tubes.
19. For a 5-mL tube, centrifuge for 4 h at 20°C, 200,000g in a VTi80 rotorand for a 12-mL tube, centrifuge for 16–20 h at 20°C at 200,000g ina Ti70.1 rotor.
20. Remove tube from ultracentrifuge. Generally, two bands arepresent and they are visible under normal light. However, for smallamounts of DNA, visualization can be enhanced using a short-waveUV light.
21. Insert a 19-gage needle at the top of the sealed tube to prevent anyvacuum being formed when the DNA band is being removed. Inserta 19–21-gage needle fitted to a 3-mL syringe (bevel side up) justbelow the lower band containing the plasmid DNA. Remove thisband carefully and avoid extracting the upper band that contains thechromosomal DNA. (Caution: If using UV light, protect eyes bywearing UV-blocking face shield. Do not prolong exposure of bands

Molecular Biology Techniques 9
to UV light as prolonged exposure may cause damage to DNA. Do notuse a needle smaller than 21-gage as it may shear the DNA).
22. Transfer plasmid DNA removed to a fresh 15-mL tube.23. Extract ethidium bromide by adding an equal volume of 20X SSC-
saturated isobutanol to DNA/ethidium bromide solution. Shake well.Centrifuge briefly to separate the two phases. Remove the upperphase containing the ethidium bromide. Repeat extraction until thelower DNA-containing phase is colorless.
24. Transfer DNA solution to dialysis tubing or to commercially avail-able dialysis cassettes Dialysis tubing has to be pretreated by boilingin 2% sodium bicarbonate/1 mM EDTA solution and then thoroughlyrinsed in double-distilled water or by autoclaving before use.
25. Dialyze against 500 to 1000 vol TE buffer with three changes over-night at 4°C.
26. Transfer plasmid DNA to a new tube and determine concentrationand purity using a spectrophotometer at OD260 and OD280. Electro-phorese an aliquot on agarose gel (Subheading 3.2.1.1.) to checkintegrity of DNA.
3.1.4. Extraction of Total RNA
Any work involving the use of RNA must be carried out usingRNase-free reagents, solutions, and laboratory wares (see Note 2).Many protocols are available for RNA extraction and a single-stepisolation method for total RNA is outlined below. The total RNAisolated is comprised mainly of transfer RNA (tRNA), ribosomalRNA (rRNA), and a small amount of mRNA, and it can be used forgene-expression studies, reverse transcription-polymerase chainreaction (RT-PCR) work, and S1 nuclease or ribonuclease protec-tion assay.
1. When using tissue samples, homogenize 100 mg freshly removed tis-sue in 1 mL denaturing solution using a glass Teflon homogenizer or apowered homogenizer. For cultured adherent cells, remove growthmedium and add denaturing solution directly to the cell monolayer.For suspension cells, pellet the cells by centrifugation at 500–1000gfor 5 min, remove and discard supernatant and then add denaturingsolution to cell pellet. Normally, 1 mL denaturing solution is requiredfor 107 cells. Pass the cell lysate several times through a pipet.

10 Lai
2. Transfer the homogenate or cell lysate to a 5-mL polypropylene tube.When 1 mL of denaturing solution is used, add 0.1 mL 2 M sodiumacetate (pH 4.0) and mix thoroughly, followed by 1 mL water-satu-rated phenol. Mix thoroughly by repeated inversion and then add0.2 mL 49:1 chloroform/isoamyl alcohol. Mix thoroughly and incu-bate on ice for 15 min.
3. Centrifuge at 10,000g at 4°C for 20 min. Carefully remove and trans-fer the aqueous (top) phase, which contains the RNA, to a new tube.
4. Add 1 mL 100% isopropanol and incubate mixture at –20°C for30–60 min to precipitate the RNA.
5. Recover the RNA by centrifuging at 10,000g at 4°C for 10 min anddissolve RNA pellet in 0.3 mL denaturing solution.
6. Reprecipitate the RNA by adding 0.3 mL 100% isopropanol. Centri-fuge at 10,000g at 4°C for 10 min. Discard supernatant. RNA extractedfor Northern blot preparation can be dissolved in formamide immedi-ately after centrifugation without going through the following steps.
7. Wash resulting RNA pellet by resuspending and vortexing it in 75% etha-nol. Leave at room temperature for 15 min to dissolve any contami-nating guanidine.
8. Centrifuge at 10,000g at 4°C for 5 min. Discard supernatant andvacuum dry RNA pellet for 3–5 min. Avoid complete drying of RNAas this reduces its solubility.
9. Dissolve RNA pellet in DEPC-treated water. Pass the solution a fewtimes through a pipet tip and incubate at between 55 and 60°C. Storedissolved RNA at –70°C.
3.1.5. Isolation of mRNA
Polyadenylated or poly(A)+ RNA species (most eukaryoticmRNAs) represent only a small fraction of total RNA. Poly (A)+
RNA can be purified from nonpoly (A)+ RNA (rRNA and tRNA)using oligo(dT) cellulose. This method relies on the bindingbetween the poly(A)+ residues on the 3' end of the mRNA andoligo(dT) residues coupled to the cellulose column matrix. Theunbound RNA is then washed off the column and the poly (A)+
RNA is eluted by lowering the amount of salt in the columnbuffer. Poly (A)+ RNA is the starting material for cDNA libraryconstruction.

Molecular Biology Techniques 11
3.1.5.1. PREPARATION OF OLIGO(DT) COLUMN
1. Pour 0.5 mL oligo(dT) cellulose slurry into a sterile disposableplastic column or autoclaved silanized Pasteur pipet plugged withautoclaved silanized glass wool. The final packed volume isapprox 0.25–0.5 mL.
2. Wash with 3 mL column wash buffer.3. Rinse column with water until pH of effluent is approx 7.5 (mea-
sured with pH paper).4. Equilibrate with equilibration buffer.
3.1.5.2. PREPARATION OF SAMPLE, PURIFICATION, AND CONCENTRATION
1. Denature (1–10 mg) total RNA by heating in a 70°C water bath for10 min. This step is necessary for the disruption of any secondarystructure that might form.
2. Add LiCl to a final concentration of 0.5 M.3. Apply the RNA sample to oligo(dT) column. Wash column with
1 mL equilibration buffer.4. Collect eluate. Heat eluate to 70°C for 5 min. Cool to room temperature.5. Pass the eluate through the column two more times.6. Wash column with wash buffer. This eluate contains nonpoly(A)+ RNA.7. Elute RNA with 2 mL elution buffer. This RNA is poly(A)+ RNA-
enriched.8. Reduce the amount of contaminating nonpoly(A)+ RNA, by reequi-
librating the column with equilibration buffer and reapplying theeluted RNA (repeat steps 3–7).
9. Precipitate poly(A)+ RNA by adding 0.1 vol 3 M sodium acetate(pH 6.0) and 2.5 vol ethanol.
10. Incubate on dry ice for 30 min or at –20°C overnight.11. Collect precipitate by spinning in microfuge for 10 min at 4°C.
For recovery of small amounts of poly(A)+ RNA, centrifuge for30 min at 50,000 rpm in Beckman SW-55 rotor.
12. Wash RNA pellet with 0.5 mL 70% ethanol.13. Discard supernatant and dry RNA pellet under vacuum.14. Resuspend RNA pellet in DEPC-treated water at concentration of
1 µg/mL.15. Check quality of RNA by formaldehyde agarose gel electrophoresis
(Subheading 3.2.2.1.1.) and store at –70°C.

12 Lai
3.2. Analysis of Nucleic Acid
3.2.1. Analysis of DNA
3.2.1.1. AGAROSE GEL ELECTROPHORESIS
Agarose gel electrophoresis is useful for separating DNA frag-ments. Minigels are good for rapid separation of small amounts ofDNA for quick analysis of restriction digestion. The larger scalegels are used for longer electrophoresis for better resolution of DNAfragments and are well suited for Southern blotting.
1. Add appropriate amount of electrophoresis grade agarose to electro-phoresis buffer (see Note 3). The electrophoresis buffer generallyused is either TAE or TBE buffer. Melt agarose in microwave ovenand mix well by swirling.
2. Cool melted agarose to 50°C (see Note 4). Seal ends of casting traywith adhesive tape before pouring cooled agarose. The thickness ofthe gel varies from 5 to 10 mm and is dependent on the sample vol-ume to be loaded.
3. Insert comb and ensure comb is vertical and no bubble is trappedunder the comb.
4. Let gel set. Remove adhesive tapes and comb carefully so as not tobreak the sample wells.
5. Place casting tray and gel on platform of electrophoresis tank.Fill the electrophoresis tank with electrophoresis buffer until the gelis covered to a depth of 1 mm.
6. Add DNA loading buffer to DNA samples to be electrophoresed,mix well, and load into the wells with a micropipettor. Includemolecular weight markers.
7. Place the lid of the electrophoresis tank on and ensure that the leadsare properly attached so that the DNA will migrate into the gel fromthe negative to the positive pole (see Note 5).
8. Stain gel in solution containing ethidium bromide (0.5 µg/mL).View resolved DNA fragments on an UV transilluminator.
3.2.1.2. RESTRICTION ENDONUCLEASES AND RESOLUTION
OF DNA FRAGMENTS BY AGAROSE GEL ELECTROPHORESIS
Restriction endonucleases or restriction enzymes (REs) are bac-terial enzymes that cleave double-stranded DNA. Type II restric-

Molecular Biology Techniques 13
tion endonucleases cleave DNA at very specific sites and areextremely useful in molecular biology as they allow the DNA to becleaved for cloning. More than 500 different types of restrictionendonucleases are available commercially and they require differ-ent conditions such as temperature, salt concentration, and pH foroptimum activity. A typical reaction is set up as follows:
1. Add the following in a microfuge tube:a. 2 µL appropriate 10X buffer (normally supplied with the RE)b. 1 µL DNA sample (0.1–1 µg)c. 1 µL RE (containing 1 to 5 U)d. Water to make 20 µL
2. Mix and incubate at 37°C in a water bath or heating block.3. Add DNA loading buffer to DNA samples and load into the well of
an agarose gel.4. Electrophorese on an agarose gel with molecular weight markers and
an original uncut DNA sample as outlined in Subheading 3.2.1.1.5. If ethidium bromide has not been added to the gel prior to electro-
phoresis, the gel can be stained at the end of electrophoresis by placingit in a dilute solution of ethidium bromide (0.5 µg/mL in water). Gen-tly agitate the gel for 20 min. Visualize DNA by placing the stainedgel on a UV light source and photograph with a ruler placed along theside of the gel if the DNA is to be transferred on to a membrane.
3.2.1.3. SOUTHERN BLOT
Southern blot is a technique first developed by Southern in 1975(15) for transferring DNA from its position in an agarose gel to amembrane placed directly above or below the gel by capillary trans-fer (see Note 6). The DNA transferred onto the membrane is thenhybridized to labeled probes. In this subheading, the downward cap-illary transfer of DNA will be described. Prior to transfer, the DNAon the gel must undergo denaturation and neutralization beforebeing transferred in a high-salt or alkaline buffer by capillary action.The denatured single-stranded DNA is then permanently bonded tothe filter by UV crosslinking or by baking the filter. The DNA isthen hybridized to a labeled probe for detection of the DNA frag-ment of interest. The steps involved for this transfer are as follows.

14 Lai
1. After gel electrophoresis (Subheading 3.2.1.1.), remove gel andrinse in distilled water.
2. Depurinate gel by placing it in 0.25 M HCl for 8–10 min at roomtemperature with slow shaking on a platform shaker.
3. Remove HCl and rinse gel gently with distilled water.4. Denature DNA by adding denaturation buffer at room temperature
and gently shake gel for 30 min.5. Remove denaturation buffer and rinse gel in distilled water. Neutral-
ize by adding neutralization buffer at room temperature. Gentlyshake gel in platform shaker for 20 min, replace with fresh neutral-ization buffer, and shake for another 20 min.
6. Assemble the following:a. A stack of paper towels, about 3-cm high and slightly wider than
the gel.b. Place four pieces of Whatman 3MM filter paper on the stack of
paper towels and a fifth sheet that has been wet with transferbuffer on top.
c. Wet a piece of membrane, large enough to cover the exposed sur-face of the gel, by placing it on the surface of distilled water for5–10 min and lay it on the top piece of wet 3MM filter paper.
d. Remove any trapped air bubbles by rolling a 5-mL pipet over thesurface.
e. Place plastic wrap around the membrane to prevent the gel fromdirect contact with the 3MM filter paper.
f. Place the gel on top of membrane.g. Place three pieces of wet Whatman 3MM filter paper, the same
size as gel, with transfer buffer and place them on top of the gel.h. Soak two large pieces of Whatman 3MM filter paper and place
them together on top of the above set up and submerge the end ofthe filter paper in a container of transfer buffer. These filter papersact as a bridge between the gel and the reservoir of transfer buffer.For alkaline transfer, 0.4 M NaOH is used as the transfer buffer,whereas for high-salt transfer, 20X SSC is used.
i. Place a gel plate over the top of the final assembly and leave for1–2 h. The transfer is normally complete in this time.
j. Remove the membrane from the assembly and immobilize thetransferred DNA. For nylon membranes, dry the membrane com-pletely by baking it at 80°C for 30–60 min. Wrap membrane inUV-transparent plastic wrap and then place it DNA-side down on

Molecular Biology Techniques 15
an UV transilluminator and irradiate for the recommended time.For nitrocellulose membranes, place membrane between Whatman3MM filter paper and bake under vacuum at 80°C for 2 h.
k. Store membrane between Whatman 3MM filter paper at roomtemperature. For long-term storage, store in desiccator at roomtemperature or at 4°C.
3.2.1.4. PCR
This is a very sensitive technique for amplifying DNA sequences.It can be used to isolate specific sequences from genomic DNA forcloning into plasmid vectors. PCR is commonly used to reengineerthe gene by adding RE site to it for ease in cloning, or for introduc-ing mismatches or deletions in DNA sequences (mutations) forstructure/function analysis. A few factors have to be consideredbefore setting up any PCR work (see Note 7).
A typical PCR reaction is carried out in a final volume of 25 µLby addition of the following to the plasmid or genomic DNA sampleof interest or to 1–2 µL of reverse transcription products (Subhead-ing 3.2.2.2.1.):
1. dNTPs (0.2 mM final concentration of each).2. MgCl2 (to final optimized concentration).3. 1 U Taq polymerase.4. 1X reaction buffer (usually supplied with the Taq polymerase as 5X
or 10X reaction buffer).5. Distilled water to a final volume of 25 µL.
3.2.2. Analysis of RNA
Changes in gene transcriptional levels within a cell occur inresponse to a variety of factors such as cell differentiation, celldevelopment, and disease. Such changes may, in turn, alter thesteady-state levels of individual mRNA. Levels of individualmRNAs can be analyzed by procedures such as Northern blots,RNA-dot or slot-blot hybridization, nuclease protection, in situhybridization, and RT-PCR. Basic steps involved in carrying outsome of these procedures are given below.

16 Lai
3.2.2.1. NORTHERN BLOT HYBRIDIZATION
The blotting and hybridization of RNA fractionated in an agar-ose-formaldehyde gel is a quick and reliable method for analysis ofspecific sequences in RNA isolated from eukaryotic cells. This pro-tocol involves the electrophoresis of RNA under denaturing condi-tions in an agarose-formaldehyde gel, transfer of the RNA from thegel onto appropriate membrane (nylon or nitrocellulose), andhybridization of the RNA to labeled probes.
3.2.2.1.1. Agarose/Formaldehyde Gel Electrophoresis
1. Prepare a 1% gel by dissolving 1 g agarose in 72 mL DEPC-treatedwater (see Note 8).
2. Cool agarose to 60°C and in a fume hood add 10 mL 10X 3-[morpho-lino]propanesulfonic acid or MOPS running buffer and 18 mL 12.3 Mformaldehyde.
3. Pour gel and allow to set for 1 h. Remove comb and place gel in geltank. Add sufficient 1X MOPS running buffer to cover the gel to adepth of about 1 mm.
4. Use 10–20 µg of total RNA or 1–2 µg polyA+ RNA. Adjust volumeto 11 µL and then add to it 5 µL 10X MOPS running buffer, 9 µL12.3 M formaldehyde, and 25 µL deionized formamide. Mix byvortexing and microcentrifuge briefly.
5. Incubate for 15 min at 55°C.6. Add 10 µL RNA loading buffer. Add 1 µL 10 mg/mL ethidium bro-
mide solution. Mix by vortexing and microcentrifuge briefly to col-lect the liquid.
7. Load onto gel and electrophorese gel at 5 V/cm. Stop the electro-phoresis when the bromophenol blue dye has migrated two-thirdsthe length of the gel.
8. Remove gel and examine on an UV transilluminator to visualize theRNA. Photograph gel with a ruler placed alongside the gel to enablethe band positions to be identified on the membrane.
9. Wash gel three times, 10 min per wash, in 20 mM NaCl to reduceformaldehyde level and background.
10. Rinse gel in two changes of 500 mL 10X SSC for 20 min to removeformaldehyde from gel.
11. Wet a piece of Whatman 3MM filter paper in 10X SSC.

Molecular Biology Techniques 17
12. Place a glass plate over a tray containing 10X SSC. Drape the wetWhatman 3MM filter paper over the glass plate with both ends of thefilter hanging into the 10X SSC to act as a wick. Remove any airbubbles trapped by gently rolling the Whatman 3MM filter paperwith a 5-mL pipet.
13. Place gel, topside down, over wick.14. Cut a piece of nitrocellulose membrane to size of gel and wet mem-
brane. Place the wet membrane over gel. Remove any air bubblestrapped by rolling membrane gently with a 5-mL pipet.
15. Place two pieces of Whatman 3MM filter paper (same size as mem-brane) that have been wetted with water over the membrane andsmooth with 5-mL pipet to remove trapped air bubbles.
16. Place a stack of paper towels (3-cm thick) on top of Whatman 3MMfilter paper.
17. Cover with a glass plate. Place a small weight on top of glass plate.18. Allow transfer by capillary action to proceed overnight.19. Remove and discard paper towels and Whatman 3MM filter paper.20. View gel over UV transilluminator to ensure that transfer is complete.21. Rinse membrane in 10X SSC, then vacuum dry at 80°C between two
pieces of Whatman 3MM filter paper.
3.2.2.2. RT-PCR
3.2.2.2.1. Reverse Transcription (cDNA Synthesis). The RT-PCRmethod is a rapid and highly sensitive method for analysis of tran-scripts. It requires the isolation of high quality RNA to be used as atemplate for reverse transcription to cDNA, which, in turn, is usedas the template for PCR. The high-quality RNA can be extractedusing the method described earlier (Subheading 3.1.4. and Sub-heading 3.1.5.). cDNA is synthesized by a process known as reversetranscription (RT) (see Note 9). A RT reaction in a total volume of30 µL can be set up as follows.
1. Incubate RNA (1–2 µg) in DEPC-treated water at 70–80°C for3–5 min. Spin briefly and keep on ice.
2. Add the following componentsa. 3' specific primer or oligo(dT) primer or random hexamer primer.b. 1X RT buffer, normally supplied with the reverse transcriptase used.c. dNTP mix to final concentration of 0.5 mM.

18 Lai
d. RNase inhibitor (RNasin) to final concentration of 1 U/µL.e. Reverse transcriptase to final concentration recommended.
3. Incubate at recommended temperature and time.4. Incubate at 70–80°C for 15 min to terminate reaction. Centrifuge
briefly in microfuge tube at 4°C.5. Remove 1–2 µL for PCR (Subheading 3.2.1.4.). The remaining
reaction mix can be stored at –70°C for several months.
3.3. Analysis of Proteins
Separation of individual proteins from a heterologous mixturebased on their molecular weights in polyacrylamide gels is a quickand easy way of characterizing proteins. There are many ways forseparating native and denatured proteins, but the most widely usedtechnique is by SDS polyacrylamide denaturing gel electrophoresis(SDS-PAGE).
3.3.1. Separation of Proteins on SDS-PAGE
This involves heat denaturation of the proteins in the presence ofSDS and a reducing agent such as -mercaptoethanol or dithio-threitol (DTT) to reduce disulfide bonds. The SDS coats the pro-teins, giving them a negative charge proportional to their length.On application of an electric field, the proteins separate by chargeand by the sieving effect of the gel matrix. The separation of theproteins can be enhanced using a discontinuous gel system thathas stacking and separating gel layers differing either in salt oracrylamide concentration, pH or a combination of these (see Note 10).The method outlined below is based on a 12.5% gel.
1. Prepare resolving gel by mixing 6.25 mL deionized 30% acrylamide/bis-acrylamide (29:1) with 3.75 mL 4X gel buffer (use 16 mL and32 mL acrylamide/bis-acrylamide for 8% and 16% gels, respec-tively) and 5 mL water in a 25-mL side-arm flask. Degas undervacuum for 5–10 min.
2. Add 50 µL 10% freshly prepared ammonium persulfate. Swirl to mix.3. Clean glass plates for protein gel and assemble the plates with spacer
onto the gel system according to manufacturer’s instructions. Thethickness of the gel is dependent on the thickness of the spacer used.

Molecular Biology Techniques 19
4. Add 10 µL TEMED to acrylamide/bis-acrylamide/ammoniumpersulfate mixture. TEMED catalyzes polymerization and should beadded just before pouring into prepared plates. Mix well and pourinto the prepared plates to a height of 10–11 cm.
5. Gently overlay with 1 mL water-saturated isobutanol to keep surfaceof gel flat as it polymerizes. Leave for 1 h.
6. Prepare stacking gel by mixing 1 mL 30% acrylamide/bis-acrylamide(29:1) with 4 mL water and 5 mL 2X stacking gel buffer in a25-mL side-arm flask. Mix and degas under vacuum for 5 min.Add 10 µL ammonium persulfate and 5 µL TEMED.
7. Remove isobutanol from the top of polymerized gel by decanting itor with a piece of Whatman 3MM filter paper. Rinse with 1X gelbuffer. Remove buffer.
8. Pour stacking gel mixture on top of resolving gel until it is 1 cm fromthe top of the plates. Insert comb for samples. Allow stacking gel topolymerize. The stacking gel is added to give better resolution ofprotein bands.
9. Transfer gel assembly to electrophoresis unit. Pour the requiredvolume of electrode buffer to both top and bottom chambers. Checkfor leaks.
10. Clean sample wells by pipetting electrode buffer in and out of eachwell gently.
11. Add 10 µL sample buffer to 10 µL sample (1–50 µg protein ormolecular weight marker). Heat sample to 95°C for 2–5 min or to55°C for 15 min. Mix sample by vortexing before, during, and afterthe heating.
12. Load samples on gel with a micropipet.13. Electrophorese samples. The typical setting for electrophoresis is
10 mA constant current or between 80 and 100 V until the blue dyefront just runs out of the gel.
14. Remove gel and protein bands can be visualized after silver stainingor Coomassie brilliant blue staining. If the protein samples haveradioactive amino acids incorporated, the gel can be processed forautoradiography.
3.3.2. Visualization of Proteins Resolved on Gel3.3.2.1. COOMASSIE BRILLIANT BLUE STAINING
This method depends on the nonspecific binding of the dye to pro-teins and the limit of detection is between 0.3 and 1 µg protein per band.

20 Lai
1. Remove gel from plate and place in container. Cut corner of gel fororientation. Add five gel volumes of fixing solution. Gently rock gelfor 2 h in orbital shaker.
2. Remove fixing solution and replace with fresh fixing solution with0.05% (v/v) Coomassie brilliant blue added. Leave for 2–4 h.
3. Remove solution and rinse with 50 mL fixing solution. Remove fix-ing solution.
4. Destain gel by adding destaining solution for 2 h with gentle rocking.5. Discard destaining solution. Replace with fresh destaining solution
and gently rock. Continue destaining until a clear background andblue protein bands are visible.
6. Gel can be stored in 7% acetic acid or in water. For a permanentrecord, gel can be dried between Whatman 3MM filter paperwrapped in plastic in conventional gel dryer at 80°C for 1–2 h.
3.3.2.2. SILVER STAINING
This is a very sensitive method for detection of protein and the limitof detection is 1–5 ng protein per band. Silver staining is dependent onthe binding of silver to various chemical groups in the proteins.
1. Place gel in container. Add five gel volumes of fixing solution. Rockgently for 30 min.
2. Replace fixing solution with an equal volume of destaining solution.Rock gently for 30–60 min.
3. Discard destaining solution and add five gel vol 10% glutaraldehyde.Rock gently in a fume hood for 30 min.
4. Discard glutaraldehyde. Wash gel with gentle rocking in water fourtimes, 30 min each. Leave gel in last wash overnight. Discard water.
5. Stain gel by adding five gel volume of silver nitrate solution.6. Shake vigorously for 15 min. Watch carefully. If gel starts to turn
brown before the end of 15 min, go immediately to next step.7. Transfer gel to another container. Rinse five times, exactly 1 min per
time, with water. Shake gently with each wash.8. Add developer to cover the gel during rocking.9. Shake vigorously until bands appear. Change developer if it turns
brown.10. Stop development immediately when gel background starts to appear
or when desired band intensity is achieved by washing gel in two

Molecular Biology Techniques 21
changes of water over 2 h or transfer gel to Kodak Rapid Fix solutionA for 5 min, followed by washing in water 4–5 times.
11. Photograph gel and store gel in sealed plastic bag, if desired.
3.3.2.3. AUTORADIOGRAPHY
1. Remove gel from plate and place in container. Cut corner of gel fororientation. Add five gel volumes of fixing solution. Gently rock gelfor 1 h in orbital shaker.
2. Discard fixing solution and replace with fresh fixing solution. Gen-tly rock for 1 h.
3. Discard fixing solution. Add 10% glycerol solution to gel and letstand for 1–2 h. Discard glycerol solution.
4. Dry gel at 80°C under vacuum for 2 h.5. Expose gel to X-ray film for required time.6. Process film.
3.3.3. Immunoblotting and Immunodetectionof Specific Proteins
This method is used for identifying specific proteins that havebeen resolved by SDS-PAGE. The resolved proteins are first trans-ferred to a nitrocellulose, nylon, or PVDF membrane and then incu-bated with specific antisera. The primary antibody specifically bindsto its epitope and the antigen-antibody complex is then detecteddirectly with secondary antibodies conjugated with differentenzymes. The activities of the enzymes are then visualized usingchromogenic or luminescent substrates.
3.3.3.1. WET TRANSFER/BLOTTING OF PROTEINS
In this method, the protein resolved in the polyacrylamide gel iselectrophoretically transferred to the membrane with the gel in avertical position. The method outlined below is based on the trans-fer of proteins without prior staining.
1. Switch power supply off. Remove gel from tank at the end of elec-trophoresis.

22 Lai
2. Equilibrate gel and membrane that has been cut to size (not largerthan gel) in transfer buffer.
3. Soak the two filter pads in transfer buffer and place one of them ontop of the back plate of gel cassette.
4. Wet two pieces of Whatman 3MM filter paper. Place one pieceon top of filter pad. Remove any air bubbles by rolling with a5-mL pipet.
5. Place gel on top of the filter paper. Then, place the wet mem-brane over the top of the gel. Smooth filter paper by rolling witha 5-mL pipet to remove any trapped air bubbles.
6. Place the second piece of filter paper on top of membrane and thesecond filter pad on top of this filter paper. Gently remove anytrapped air bubbles.
7. Close the cassette and insert cassette into the buffer tank of thewet transfer unit according to manufacturer’s instructions for theunit used.
8. Fill tank with transfer buffer to cover gel.9. Connect to power supply and use settings suggested by manufac-
turer. Transfer is normally carried out overnight or at least for 4 h.10. On completion of transfer, switch off power supply, remove mem-
brane and gel from tank. Cut a corner off membrane for orientationand then briefly rinse membrane in water.
11. If prestained molecular weight standards are used, the efficiency oftransfer can be gaged from the transfer of the prestained markers.Alternatively, stain the gel in Coomassie blue to check efficiency oftransfer.
12. Membrane is now ready for immunoprobing and detection of spe-cific proteins.
3.3.3.2. SEMIDRY TRANSFER/BLOTTING OF PROTEINS
This system of transfer has the gel placed in a horizontal positionbetween buffer-saturated filter paper that is in contact with the elec-trode. This transfer is rapid and uses minimal buffer.
1. Switch power supply off. Remove gel after electrophoresis andequilibrate gel in transfer buffer.
2. Prewet three pieces of Whatman 3MM filter paper with transferbuffer and stack them on top of anode of semidry transfer unit.

Molecular Biology Techniques 23
3. Cut membrane to size and prewet in transfer buffer. Place membraneon top of the stack of Whatman 3MM filter paper. Smooth mem-brane with a 5-mL pipet to remove any air bubbles.
4. Place gel on top of membrane. Gently roll gel with a 5-mL pipet toremove air bubbles and to ensure contact between gel and membrane.
5. Prewet three more pieces of Whatman 3MM filter paper and stackthem on top of gel. Remove any air bubbles by rolling gently with a5-mL pipet.
6. Carefully place cathode on top of stack, put safety cover on and plugleads to power pack. Use power settings recommended by manufac-turer. The time of transfer is normally between 15 and 45 min. Thissystem of transfer is not recommended for prolonged transfers.
7. Switch off supply. Remove gel and membrane and check for transferefficiency as described for wet transfer in Subheading 3.3.3.1.Membrane is now ready for use.
3.3.3.3. IMMUNOPROBING
There are three steps to follow in immunoprobing. The firstinvolves the binding of primary antibodies to the epitope of interest.The second involves the application of a secondary antibody (usu-ally an enzyme–antibody conjugate) directed against the primaryantibody used. The final step is the identification of the epitope bychromogenic or luminescent visualization.
3.3.3.3.1. Primary and Secondary Antibody Reaction. Themethod described here is for proteins immobilized on neutral andpositively charged nylon membranes (see Note 11).
1. Block membrane by incubating membrane in blocking buffer at roomtemperature for 1 h or overnight at 4°C with rocking on an orbitalshaker.
2. Discard blocking buffer. Place membrane in plastic bag.3. Dilute primary antibody in blocking buffer and add to membrane in
the bag. The dilution of primary antibody used varies with the anti-body used. Seal bag. Incubate at room temperature for 1 h, withgentle rocking.
4. Remove membrane from bag and transfer to shallow tray. Washmembrane with four changes of TBS over 60 min. Then place washedmembrane in plastic bag.

24 Lai
5. Dilute secondary antibody in blocking buffer and add to membranein plastic bag. Seal bag and incubate at room temperature with con-stant rocking for 30–60 min.
3.3.3.3.2. Visualization. The visualization of the antigen of inter-est is carried out using chromogenic or luminescent substrates andis dependent on the enzyme that is conjugated to the secondaryantibodies. Enzymes that are commonly conjugated to the second-ary antibodies include horseradish peroxidase and alkaline phos-phatase. The protocol used for each system is normally according tothe manufacturer’s suggestion.
3.4. Subcloning and Ligation of Insert from Library
Genomic DNA fragments or cDNA inserts from clones of inter-est in genomic or cDNA libraries are normally subcloned into plas-mids. Plasmids are very useful subcloning vectors as they can beeasily transformed into cells, amplified, and purified to yieldlarge quantities of DNA. The choice of the vector is dependent onthe kind of study to be carried out later. In general, the vector willhave to be linearized by restricting with one or more RE to generatetermini that are compatible with the cohesive and/or blunt terminiof the DNA fragment to be subcloned. The restricted vector shouldcontain an intact drug resistance gene that allows selection forE. coli transformation with the recombinant plasmid, and an originof DNA replication that allows for autonomous replication of plas-mid DNA circle in the E. coli host. The termini are then ligated andthe ligation mix is then transformed into E. coli. The transformantsare selected using the drug-resistance gene present on the plasmid.If the fragment to be subcloned has identical ends, that is, cleavedwith one RE, then the linearized vector used has to be dephosphory-lated (removal of 5' phosphate) to inhibit the religation of the compat-ible ends, thus, enhancing the frequency of ligation to insert termini.
3.4.1. Dephosphorylation
The dephosphorylation of the vector is performed as follows.
1. Restrict vector DNA with RE (Subheading 3.2.1.2.) in a total reac-tion volume of 20 µL (see Note 12).

Molecular Biology Techniques 25
2. At the end of the reaction, add to it the dephosphorylation buffer(see Subheading 2.6.1.)
3. Centrifuge briefly to collect liquid at bottom of tube. Incubate for30 min at 37°C.
4. Phenol/chloroform extract DNA, precipitate DNA by adding to it0.1 vol 3 M sodium acetate (pH 5.2) and at least 2.5 vol ethanol.Place on dry ice for at least 10 min or store for several hours at –20°C.
5. Recover DNA by centrifuging at 4°C for 10 min and resuspend DNAin 50 µL TE.
3.4.2. Symmetric Cloning/Nondirectional Cloning
1. Put together 0.3 µg cut insert (2 µL) and cloning buffer (see Note 13).2. Incubate at between 4 and 16°C for 4 h to overnight.3. Transform ligated insert into bacteria as described in Subhead-
ing 3.4.4.
3.4.3. Asymmetrical Cloning/Directional Cloning
When the insert is cleaved with different REs, asymmetrical endsresult and the following has to be carried out.
1. Cleave fragment and vector DNA with the REs required.2. Electrophorese cleaved DNA on agarose gel (Subheading 3.2.1.1.).
Isolate insert and vector fragment required.3. Follow the same protocol from steps 1–3 of Subheading 3.4.2.
3.4.4. Transformation of Bacteria
The bacteria cells used can either be prepared by the user or pur-chased as competent cells. Different grades of competent cells withdifferent transformation efficiencies are available commercially.
1. Aliquot 10–20 ng plasmid DNA or DNA from ligation mix in atotal volume of 20 µL in a sterile 15-mL round-bottom tube. Leaveon ice.
2. Thaw competent cells on ice and add 200 µL immediately to the DNAin the tube. Gently mix and leave on ice for 30 to 60 min.
3. Heat shock cells by transferring tube into a 42°C water bath for2.5 min or 37°C water bath for 5 min.

26 Lai
4. Add 3 mL LB broth into tube and incubate mixture for 1 h at 37°Cwith shaking.
5. Plate aliquots (a few different dilutions) of transformation cultureonto agar plates containing the appropriate antibiotics. Dry platesand incubate overnight at 37°C.
Following transformation of ligation reaction, mix into E. colicells (Subheading 3.4.4.), successful subclones are screened. Gen-erally, colonies are picked from agar plates and “miniprep” plasmidDNA are prepared. Many methods are available and one quickmethod is described in Subheading 3.1.2. and the desired recombi-nant plasmid is then identified by RE digestion and analysis. How-ever, in instances where large numbers of putative subclones arepresent, this “miniprep” plasmid DNA preparation is tedious andtime consuming. For such cases, PCR-based screening methodshave the advantage and these methods normally involve the follow-ing steps.
1. Determine the number of colonies to be tested and prepare a mastermix for PCR where 10 µL are used for each colony. Each 10 µLcontains 0.5 µM reverse and 0.5 µM forward oligonucleotide prim-ers, 1X PCR buffer, 0.02 µM of each dNTP, 0.2–0.5 U Taq poly-merase and distilled water.
2. Number the wells of a microtiter plate suitable for use in thethermocyler used. Add to each well 10 µL of master mix for PCR.
3. Label a second microtiter plate in the same way as the first. Add tothe well 100 µL LB broth with the appropriate antibiotics. A 96-welltissue-culture plate could be used for this purpose.
4. Pick each colony with a sterile toothpick.5. Dip toothpick with colony first into the well containing master mix
for PCR. Swirl toothpick.6. Dip same toothpick into well with corresponding number on second
plate containing LB broth. Swirl toothpick.7. When all the colonies have been picked, incubate the plate with LB
broth at 37°C for 6 h to overnight.8. If the thermocycler used does not have a heated lid, overlay each
well containing master mix for PCR with 50 µL mineral oil. Sealmicrotiter plate and place it on the appropriate block in thermocycler.Set program for 30–35 cycles with denaturation at 95°C for 30 s,

Molecular Biology Techniques 27
annealing at between 50 and 55°C (depending on primers used) for30 s, extension at 72–74°C for 5 min for the first cycle. Use the samesettings for denaturation and annealing, but for extension, set thetime to 30 s for the remaining cycles.
9. At the end of the reaction, add 1 µL DNA loading buffer to eachsample and electrophorese on agarose gel as described in Subhead-ing 3.2.1.1. Select samples with amplified bands of the correct size.Inoculate sample from corresponding well in second plate into freshLB broth with antibiotics for “miniprep” DNA preparation. AnalyzeDNA by RE digestion to check for correct orientation of DNA frag-ment or for sequencing.
4. Notes
1. Genes encoding resistance to antibiotics, the most common bacterialselectable markers for plasmid vectors, are carried on plasmid andphage vectors and cells that contain the vector are identified by theirability to grow and form colonies in the presence of the antibiotic.The choice of antibiotics used in the LB broth or on agar platesdepends on the selectable marker present on the plasmid. Commonlyused antibiotic are ampicillin (50–100 µg/mL), kanamycin (25 µg/mL),tetracylin (12.5–15 µg/mL), and chloramphenicol (10 µg/mL).
2. Reagents and solutions can be treated by addition of DEPC to inacti-vate the RNases present. Glassware can be baked at 300°C for 4 h or200°C overnight and some plastic wares can be treated by rinsingwith chloroform to inactivate the RNases. Gloves should be worn atall times, as the hands are a major source of contaminating RNases.
3. The percentage of agarose gel used is dependent on the size of theexpected DNA fragments. In general, 0.5% agarose gel is used forDNA ranging from 1–30 kb, 1% agarose gel for 0.5–10 kb, and1.5% agarose gel for 0.2–3 kb.
4. Ethidium bromide can be added to the cooled agarose and the DNAcould be viewed at anytime during the electrophoresis.
5. For minigels, set the voltage to 80 V for approx 1 h or until bro-mophenol blue dye is 75% across the gel. For larger gels to be usedfor Southern blotting, electrophorese gel at 40 V for 4 h to overnightwith ethidium bromide added to gel during gel preparation.
6. One disadvantage of upward capillary transfer is the weight of thefilter paper and paper towels placed on top of the gel which couldcrush the gel and reduce capillary action.

28 Lai
7. One of these factors is the design of the primers used. The locationof the primer template within the target DNA defines the length ofthe product. Typically, products ranging from 500–2000 bp are idealas they do not necessitate the use of special gels for good resolutionin the case of small products or the use of special polymerases in thecase of large products. When cDNA from a RT reaction is the targetsequence, the region on the cDNA to be amplified has to be takeninto consideration based on the primers used in cDNA synthesis. Forexample, in cDNA synthesis using oligo(dT) primers, the primingand extension are from the 3' end of the mRNA and long templatesare difficult to transcribe. Hence, the 5' primer used in amplificationof the resulting cDNA should be no further than 2–3 kb from the3' end of the mRNA. Typically, PCR primers should be between 20and 30 bp long and the optimal annealing temp of the two primersshould be similar. Another factor to consider is the MgCl2 concen-tration. The MgCl2 concentration has to be titrated to optimize thePCR. The annealing temperature, though worked out empiricallyfrom the primers designed, has to be tested. Also, if the sample is froma RT reaction, it is important to establish that there is no contaminat-ing genomic DNA that will result in false-positive results. In this case,it is advisable to design primers that span across an intron so as toensure that the contaminating genomic DNA is not amplified. In somecases where no intron is present in the gene, e.g., Type 1 interferons,the presence of contaminating genomic DNA has to be addressed byDNase treating the total RNA sample used in the RT reaction.
8. A 1% agarose/formadehyde gel is good for detection of RNA mol-ecules from 500 bp to 10 kb.
9. There are three ways to prime the mRNA for cDNA synthesis.The first is specific priming and it involves the use of a 3' (antisense)gene-specific primer to anneal to the mRNA and extended withreverse transcriptase. The second and third involve the use ofoligo(dT) and random hexamers as primers in which the entiremRNA population is first converted to cDNA by priming witholigo(dT) and random hexamers, respectively.
10. The percentage of polyacrylamide gel used is dependent on the sizeof the proteins to be separated. For example, an 8% gel is effectivefor proteins in the 80,000-Da range, whereas 12.5% and 16% gelsare effective for proteins in the 50,000-Da and 10,000–30,000-Darange, respectively.

Molecular Biology Techniques 29
11. For other types of membrane used such as nitrocellulose orPVDF, follow the above, but use TBS containing 0.1% Tween-20 (TTBS) as the blocking buffer and wash membrane in TTBSinstead of TBS.
12. Ensure vector DNA is completely digested by electrophoresing asmall aliquot on miniagarose gel. Incomplete digestion of vectorresults in high background of colonies without inserts.
13. Different amounts of vector and insert can be used and very often theamounts used are based on molar ratios of vector to insert of 1:1, 1:3,and so on.
Acknowledgments
The author would like to thank Yvonne Lai for her valuable com-ments on the manuscript and Natalie Daw for her advice on the tech-nology used for the protein work presented.
References
1. Crabb, J. W., Goldflam S., Harris, S. E., and Saari, J. C. (1988) Clon-ing of the cDNAs encoding the cellular retinaldehyde binding proteinfrom human retina and comparison of the protein structures. J. Biol.Chem. 263, 18,688–18,692.
2. Gu, S.-M., Thompson, C. R., Srikumari, S., et al. (1997) Mutation inRPE65 cause autosomal recessive childhood-onset retinal dystrophy.Nat. Genet. 17, 194–197.
3. Intres, R., Goldflam, S., Cook, J. R., and Crabb, J. W. (1994) Molecu-lar cloning and structure analysis of the human gene encoding cellularretinaldehyde-binding protein. J. Biol. Chem. 269, 25,411–25,418.
4. Maw, M. A., Knight, K. B., Bridges, R., et al. (1997) Mutation of thegene encoding cellular retinaldehyde-binding protein in autosomalrecessive retinitis pigmentosa. Nat. Genet. 17, 198–200.
5. Nicoletti, A., Wong, D. J., Kawasa, K., et al. (1995) Molecular char-acterization of the human gene encoding an abundant 61 kDa pro-tein specific to the retinal pigment epithelium. Hum. Mol. Genet. 4,641–649.
6. Porciatti, V., Pizzarusso, T., and Maffei, L. (1999) Vision in micewith neuronal redundancy due to inhibition of developmental celldeath. Visual Neurosci. 16, 721–726.
30 Lai
7. Lem, J., Krasnoperova, N. V., Calvert, P. D., et al. (1999) Morpho-logical, physiological, and biochemical change in rhodopsin knock-out mice. Proc. Natl. Acad. Sci. USA 96, 736–741.
8. Redmond, T. M., Yu, S., Lee, E., et al. (1998) RPE65 is necessary forproduction of 11-cis-vitamin in the retinal visual cycle. Nat. Genet.20, 344–351.
9. Liou, G. I., Fei, Y., Peachy, N. S., et al. (1998) Early onset photo-receptor abnormalities induced by targeted disruption of the interphoto-receptor retinoid-binding protein gene. J. Neorosci. 18, 4511–4520.
10. Li, T. and Davidson, B. L. (1995) Phenotype correction in retinal pig-ment epithelium in murine mucopolysaccharidosis VII by adenovirus-mediated gene transfer. Proc. Natl. Acad. Sci. USA 92, 7700–7704.
11. Sakamoto, T., Kimura, H., Scuric, Z., et al. (1995) Inhibition ofexperimental proliferative vitreoretinopathy by retroviral vector-mediated transfer of suicide gene. Can proliferative vitreoretinopathybe a target of gene therapy? Ophthalmology 102, 1417–1424.
12. Bennett, J., Tanabe, T., Sun, D., et al. (1996) Photoreceptor cellrescue in retinal degeneration (rd) mice by in vivo gene therapy.Nat. Med. 2, 649–654.
13. Kumar-Singh, R. and Farber, D. B. (1998) Encapsidated adenovirusmini-chromosome-mediated delivery of genes to the retina: applica-tion to the rescue of photoreceptor degeneration. Hum. Mol. Genet. 7,1893–1900.
14. Bennett, J., Zeng, Y., Bajwa, R., et al. (1988) Adenovirus-mediateddelivery of rhodopsin-promoted bcl-2 results in a delay in photo-receptor cell death in the rd/rd mouse. Gene Ther. 5, 1156–1164.
15. Southern, E. M. (1975). Detection of specific sequences among DNAfragments separated by gel electrophoresis. J. Mol. Biol. 98, 503–517.

Transfection of Rb Cells 31
31
From: Methods in Molecular Medicine, vol. 47: Vision Research ProtocolsEdited by: P. E. Rakoczy © Humana Press Inc., Totowa, NJ
2
Transient Transfectionof Human Retinoblastoma Cells
Application to the Analysis of the Regulatory Regionsof Photoreceptor-Specific Genes
Debora B. Farber, Leonid E. Lerner,and Andrea S. Viczian
1. Introduction
Retinoblastoma (Rb) is an intraocular tumor usually diagnosed inchildren under four years of age (1). The tumor rises when both alle-les of the Rb tumor suppressor gene become inactivated in a retinalprecursor cell during development (2,3). The first retinoblastoma cellline to be established in culture, Y-79 (4), has been shown to originatefrom neuroectodermal cells that express both neuronal and glial cellmarkers (3). Both Y-79 cells and Rb tumor cells produce mRNAsencoding several proteins unique to the photoreceptors (5), includingdifferent subunits of cone- and rod-specific cGMP-phosphodi-esterases (6). Therefore, cultured Y-79 cells, which have a humanretinal origin, could be particularly useful for studying the regulatorymechanisms of photoreceptor-specific gene expression (7).
In order to introduce DNA into eukaryotic cells several methodshave been developed. The most commonly used techniques arecalcium phosphate-mediated transfection, electroporation, and

32 Farber, Lerner, and Viczian
lipofection. Briefly, calcium phosphate-mediated transfection takesadvantage of the formation of DNA-calcium phosphate precipitateswhich enhance the introduction of foreign DNA into the cells (8). Itis a convenient and inexpensive technique, although the efficiencyof DNA uptake may vary significantly between different cell types.During electroporation, a high-voltage electric pulse of a brief dura-tion is applied to the cells to generate transient and reversible“electropores” in the plasma membrane. The optimal conditions forefficient electroporation which is not harmful to the cells must bedetermined empirically for each cell type (9). Lipofection (10) isoften useful for cell types that transfect inefficiently by other meth-ods. However, the selection of an efficient, convenient, and cost-effective transfection technique depends, to a large extent, on theparticular cell line to be transfected.
Various reporter genes may be used in transient transfectionassays for transcriptional regulation studies. These include chloram-phenicol acetyl transferase (CAT) (11), -galactosidase (12),luciferase (13), and -globin (14). In particular, we have used theGeneLight™ reporter vectors pGL2-Basic and pGL2-Control(Promega Corp., Madison, WI) that contain the coding region of thefirefly Photinus pyralis luciferase gene. Luciferase activity can beeasily quantified with low background (there is no endogenousluciferase activity in eukaryotic cells) using a rapid and sensitiveassay that allows the analysis of a large number of samples.
Transient transfections have been employed for the study of theregulatory cis-elements and their interactions with trans-actingnuclear factors that control the level of transcriptional activation ofvarious photoreceptor-specific genes including the -subunit ofcGMP-phosphodiesterase ( -PDE) gene (7). In order to prepareconstructs suitable for transient transfections, various lengths of the5'-flanking region of the human -PDE gene were generated bypolymerase chain reaction (PCR) using sequence-specific primers;the 3' primers contained a BglII linker and the 5' primers containedan NheI linker. PCR products were digested with BglII and NheI,and directionally subcloned into the pGL2-Basic vector upstreamof the luciferase reporter gene. Inserts were sequenced in both

Transfection of Rb Cells 33
directions to assure 100% identity with the 5'-flanking region of thehuman -PDE gene.
This chapter describes the detailed protocols for the propagationof Y-79 retinoblastoma cells in culture, for calcium phosphate-mediated transient transfections of Y-79 cells using luciferasereporter constructs, for the preparation of Y-79 cell extracts and forthe determination of the levels of the luciferase gene expression.
2. Materials
2.1. Equipment
1. Luminometer (Monolight 2010; Analytical Luminescence, MD).2. Standard cell culture equipment (e.g., a cell-culture incubator preset
at 37°C with 5% CO2 in air atmosphere, laminar flow hood, centri-fuge, microscope, Coulter counter or hemocytometer).
2.2. Reagents
2.2.1. Cell Culture
1. Y-79 Human retinoblastoma cells obtained from American TypeCulture Collection (Rockville, MD, Cat. No. HTB18).
2. Complete growth medium: RPMI-1640 with L-glutamine and with-out sodium phosphate (Gibco BRL, Grand Island, NY) supplementedwith 15% fetal bovine serum (FBS; Gibco BRL).
3. Transfection medium: Dulbecco’s modified Eagle’s medium (DMEM)/F12 (50/50 mix, Cellgro™, Mediatech, Inc., Herndon, VA) supple-mented with 15% FBS.
2.2.2. Transient Transfections of Human Rb CellsUsing Calcium Phosphate Precipitation
1. 2×HEPES-buffered saline/Na2HPO4, pH 7.0 (HBS/P): 45 mM HEPES(tissue-culture grade), 280 mM NaCl, and 2.8 mM Na2HPO4. AdjustpH accurately to 7.0 with NaOH, filter sterilize. This buffer may bestored at 4°C for several months; recheck pH after prolonged storage.
2. Phosphate-buffered saline (PBS), pH 7.4: 140 mM NaCl, 2.7 mM KCl,4.5 mM Na2HPO4, and 1.5 mM KH2PO4. Adjust pH to 7.4 with HCl,filter sterilize.
34 Farber, Lerner, and Viczian
3. 2.5 M CaCl2 (tissue-culture grade), filter sterilize.4. 10× TE buffer, pH 7.0: 10 mM Tris-HCl and 1 mM ethylene-
diaminetetraacetic acid (EDTA), filter sterilize. This buffer may bestored at 4°C for several months.
5. 0.2 mg/mL poly-D-lysine in PBS, filter sterilize, store at 4°C.6. 5 µg/mL fibronectin (Sigma Chemical Company, St. Louis, MO) in
PBS, filter sterilize, store at 4°C.
2.2.3. Preparation of Cell Lysateand Measurement of Luciferase Activity
1. Luciferase assay mixture (LAM): 20 mM Tricine, 1 mM MgCO3,2.7 mM MgSO4, 0.1 mM EDTA, 30 mM dithiothreitol (DTT),0.3 mM coenzyme A, 0.5 mM luciferin, and 0.5 mM ATP; adjust pHto 7.8 with 1 M HCl. Store 1 mL aliquots at –20°C in complete dark-ness (may be wrapped in aluminum foil).
2. Prepare the cell lysis buffer by adding 1 vol of 5× Reporter LysisBuffer (Promega) to 4 vol of ddH2O. Vortex.
2.2.4. Determination of Galactosidase Activityand Quantification of Transcription Levels
1. -galactosidase assay buffer, pH to 7.0 (buffer Z): 60 mM Na2HPO4,40 mM NaH2PO4, 10 mM KCl, 1 mM MgSO4, and 50 mM -mer-captoethanol (15). Do not autoclave. This buffer is stable at 4°C.
2. 4 mg/mL o-nitrophenyl- -D-galactopyranoside (ONPG) in buffer Z,store in 1-mL aliquots at –20°C.
3. 1 M Na2CO3 in ddH2O.
3. Methods
In the identification of specific nucleotides involved in protein-DNA interactions, it is important to ensure that mutational analysisdoes not disrupt the spatial relations between potential regulatoryelements. In this regard, site-specific nucleotide substitutions arepreferred to sequence deletions or additions as they preserve theoverall length and the internal structure of the tested DNA region.
There are thee main criteria for selecting Y-79 human Rb cells asthe cell line in which to study the transcriptional regulation mecha-

Transfection of Rb Cells 35
nisms of photoreceptor-specific genes in general and the -PDEgene in particular:
1. Y-79 Rb cells express a number of photoreceptor-specific genes (5,6)that indicates that they possess the regulatory factors necessary fortheir transcription. For example, the fact that Y-79 Rb cells producereadily detectable levels of the -subunit of cGMP-phosphodi-esterase ( -PDE) indicates that these cells have the appropriate tran-scription machinery for the expression of the gene encoding thisprotein.
2. A convenient method for the introduction of DNA into Y-79 Rb cellsby transient transfections has been established (see Subheading 3.3.)that allows for sufficiently high transfection efficiency.
3. Promoters of many photoreceptor-specific genes, e.g., the -PDEgene, as well as the SV40 early promoter are capable of directinghigh levels of expression of the luciferase reporter gene in Y-79 ret-inoblastoma cells (7).
3.1. Propagation of Y-79 Human Rb Cells in Culture
1. Rapidly thaw in a water bath preheated to 37°C the frozen stock ofY-79 human Rb cells. Rinse the exterior of the cryovial with 70% etha-nol and dry it.
2. Transfer the cells to a 175-cm2 flask containing 25 mL of the com-plete growth medium.
3. Incubate the cells at 37°C in 5% CO2 and 95% air for 24 h (see Note 1).4. Replace the growth medium as follows:
a. Gently pellet the cells by centrifugation at 125g for 2 min at roomtemperature.
b. Carefully aspirate the culture medium.c. Resuspend the cells in 35 mL of fresh complete growth medium.
5. Allow the cells to grow undisturbed in the humidified incubator at37°C in 5% CO2 and 95% air for 7–10 d or until the medium becomesslightly yellow. When this occurs, change the medium again.
6. Allow the cells to grow in 35 mL of the complete growth medium foranother 10–14 d or until the medium turns light yellow. Clusters ofY-79 cells in suspension can now be seen with the naked eye. As thepopulation of cells increases, they may be transferred into two ormore flasks, and the growth medium needs to be changed more fre-quently. Thus, daily observation of the cells is recommended.

36 Farber, Lerner, and Viczian
3.2. Isolation of Plasmid DNA Suitablefor High-Efficiency Transient Transfections
For efficient and consistent transfection results in Y-79 Rbcells, it is very important to prepare highly purified plasmid DNA(see Note 2) (Fig. 1).
1. Late in the afternoon, transform DH5 ™ competent cells (Gibco-BRL) with a desired plasmid, e.g., a pGL2-based construct or thepSV- -Galactosidase control plasmid (Promega). Select the trans-formed colonies by growing the cells overnight in an appropriatemedium supplemented with antibiotic, e.g., LB medium supple-mented with ampicillin.
2. The following morning inoculate 2 mL of LB/ampicillin media withone small colony selected from the plate (large overgrown coloniesmay not grow well). Grow the bacterial culture in a 14-mL Falcon®
tube in a shaker incubator at 250 rpm at 37°C until the OD595 is about0.5 (in the late afternoon).
3. Inoculate the entire volume (2 mL) into a 2-L flask containing250 mL of LB/ampicillin and incubate in a shaker incubator at 250 rpmat 37°C until the OD595 is about 1.0 (usually by the next morning).
4. Harvest the cells by centrifuging at 6000g for 15 min at 4°C. Decantthe supernatant. At this stage, the cells can either be frozen or pro-cessed further for plasmid isolation using the Endofree Maxi kit(Qiagen, Valencia, CA).
The concentration of the purified DNA is calculated based on theOD260 measurements, the plasmid is digested with a restriction endo-nuclease and both digested and undigested samples are resolved ona 1% agarose gel to ensure the quality of the plasmid preparation.
3.3. Transient Transfections of Human Rb CellsUsing Calcium Phosphate Precipitation
1. Initiate Y-79 Rb cell cultures at least 2 wk before transfection. Cellsmaintained in culture for a long period of time may not produceoptimal results, therefore, we prefer to use cell cultures less than1.5 mo old. Propagate the cells in suspension as described above.The day before plating the cells for transfection, change the com-plete growth medium.

Transfection of Rb Cells 37
Fig. 1. Relative luciferase activity in transient transfections of Y-79human Rb cells using pGL2-based constructs containing unidirectionalnested deletions of the –197 to +4 bp of the 5'-flanking region of thehuman PDE6B gene. Plasmid nomenclature (p-197 to p+4) refers to the5'-most nucleotide in the subcloned fragment. Constructs p-93M andp-72M contain site-specific nucleotide substitutions (7). Plasmids werecotransfected with pSV- -Galactosidase control vector. Luciferase activ-ity was normalized to the corresponding -galactosidase activity for eachsample and expressed as percent activity of the construct p-197. Valuesrepresent the average of at least three transfections and standard devia-tion bars are shown.
2. The following day, under sterile conditions coat 60-mm diametertissue-culture plates with 0.4 mL of poly-D-lysine (spread over thesurface with brisk rotational movements), replace the lid and waitfor 10 min. Add 0.2 mL of fibronectin solution and spread over thesurface, replace the lid, and wait for 30–60 min. Meanwhile, count

38 Farber, Lerner, and Viczian
the cells and dilute them with complete growth medium to 1.5 × 10⁶
cells/mL. Aspirate the remaining fibronectin/poly-D-lysine solutionand wash the dishes briefly with 3 mL of serum-free RPMI-1640followed by aspiration. Plate 3 mL of cell suspension per plate(approx 4.5 × 10⁶ cells/plate) and incubate them overnight at 37°Cin 5% CO2 and 95% air. If larger dishes are used, the number of cellsplated and the volumes given should be adjusted accordingly.
3. The next morning, gently aspirate the complete growth medium(including any dead cells) and add 4 mL of the transfection medium(see Note 3). Place the cells back into the humidified incubator for 3 h.
4. In a 14-mL Falcon tube prepare the following transfection mixturethat will be used for three plates (transfection of each construct iscarried out in triplicate to ensure the reproducibility of the results):1.35 mL of 10× TE buffer, pH 7.0; 15 µg of pSV- -Galactosidasevector (5 µg per plate) and 30 µg of the appropriate pGL2 construct(10 µg per plate) in a total volume of 45 µL of TE buffer; 0.15 mL of2.5 M CaCl2. Add 1.5 mL of 2× HBS/P, pH 7.0 and mix thoroughlyby pipeting up and down.
5. Add 1.0 mL of transfection mixture to each plate and spread over thecells by grid movements (forward-backward and left-right). Rota-tional movements are undesirable because the precipitate tends tospread around the periphery of the plate.
6. Place the plates into the humidified incubator overnight (see Note 4).The following morning, a fine-grained precipitate is readily visual-ized under the microscope around the cells and attached to the sur-face of the cells (see Note 5).
7. Carefully aspirate the medium from the plates to avoid cell loss. Cellsmay be gently washed with 5 mL of serum-free medium for up tothree times. Feed the cells with 5 mL of the complete growthmedium, incubate for 24 h, and harvest (see Notes 6 and 7).
3.4. Preparation of Cell Lysateand Measurement of Luciferase Activity
It is accepted that the level of luciferase activity measured fol-lowing transient transfection correlates well with the level of theluciferase reporter gene expression.
In order to prepare cell lysates suitable for luciferase activity mea-surements, the luciferase assay system (Promega) is used accordingto the manufacturer’s instructions with minor modifications:

Transfection of Rb Cells 39
1. Aspirate the medium from the plates and wash the cells twice with4 mL of PBS at room temperature (see Note 8).
2. Add 0.1 mL of cell lysis buffer directly onto the cell monolayer andspread it over the surface by tilting the plate in all directions. Leavethe plate horizontal for 15 min at room temperature. The cells willbe lysed (if viewed under the microscope, only intact nuclei arevisible).
3. Scrape the plate thoroughly with a cell scraper and transfer the celllysate into a precooled microfuge tube. Keep on ice. Centrifuge for2 min at 4°C at 16,000g to pellet the cell debris, and transfer thesupernatant into a clean 1.5-mL tube. Store on ice.
4. Pipet 20 µL of the extract obtained from different plates into appro-priately labeled polystyrene luminometer cuvettes. Bring the cuvetsand LAM alongside a luminometer and turn it on.
5. Add 0.1 mL of LAM to each cuvet and measure the luciferase activ-ity (see Note 9).
3.5. Determination of -Galactosidase Activityand Quantification of Transcription Levels
The luciferase activity measured following transient transfectionsmust be normalized for transfection efficiency and for generaleffects on transcription using an internal control vector (see Note 10).Therefore, all cells are routinely cotransfected with a control plas-mid containing the bacterial lacZ gene driven by the SV40 earlypromoter, the pSV- -galactosidase control vector (Promega).
The method of Sambrook et al. is used (15) with minor modifications.
1. Pipet 40 µL of 4 mg/mL ONPG stock solution into appropriatelylabeled glass tubes.
2. Add 40 µL of cell extract followed by 120 µL of buffer Z. Mix.3. Incubate at 37°C until yellow color develops (approx 1.5–3 h).4. Add 100 µL of 1 M Na2CO3 to each tube and determine the OD at
420 nm.
The following formula is used to calculate Relative LuciferaseActivity (RLA; see Note 10):
RLA = luciferase activity (light units)/-galactosidase activity (OD420 U) × 1000

40 Farber, Lerner, and Viczian
A typical example of relative luciferase activity obtained follow-ing transient transfections of Y-79 Rb cells with pGL2-based con-structs containing different lengths of the 5'-flanking region of thehuman B-PDE gene and the luciferase reporter gene is shown inFig. 1 (see Note 11).
3.6. Summary
In order to achieve high-efficiency transfection of plasmid DNAinto Y-79 Rb cells, sufficiently high levels of expression of theluciferase reporter gene and a good reproducibility of the results,several factors have to be taken into consideration: (1) cell densityused for transfections, (2) quality of the plasmid DNA preparation,(3) the length of the incubation of cells with transfection mixture,and (4) the duration of post-transfection incubation.
Briefly, the highest luciferase activity is observed when cells aretransfected with plasmid DNA isolated using the Endofree MaxiPrep kit (Qiagen), and when the cells are plated at a density of3–4.5 million per 60-mm diameter plate. The optimal results areobtained when Y-79 cells are incubated for 16–24 h with calciumphosphate/DNA transfection mixture and harvested 24 h followingthe removal of the mixture.
4. Notes
1. The medium used for the storage of Y-79 cells in a frozen state con-tains 95% complete growth medium and 5% dimethyl sulfoxide(DMSO). DMSO is toxic for the growing cells and should beremoved within 24 h following thawing of the Y-79 cells by chang-ing the growth medium.
2. We have compared three different plasmid isolation techniques. TheEndofree Maxi kit (Qiagen, Valencia, CA), designed to remove bac-terial endotoxin, provided the highest levels of luciferase activity,followed by the Maxi Prep kit (Qiagen); the lowest levels wereobserved using the alkaline lysis/lysozyme isolation technique (16).
3. The transfection medium differs from the complete growth mediumin that it contains DMEM/F12 instead of RPMI-1640 (see Subhead-

Transfection of Rb Cells 41
ing 2.). The latter medium has a high Ca2+ content which may inter-fere with calcium phosphate-mediated transfection.
4. We have compared the levels of luciferase activity after Y-79 cellswere incubated with the DNA/calcium phosphate transfectionmixture for various periods of time (3, 6, 12, 16, and 24 h). Thetransfection mixture was then replaced with complete growthmedium and the cells were harvested the next day. The highestluciferase activity was observed following the 24-h incubation.
5. It is important to examine all the plates for the amount of precipitateformed, which should be comparable, as well as to make sure thatthe cells remain attached to the plate. If there are plates with signifi-cantly less precipitate or with many cells detached, those platesshould be disregarded.
6. We have compared the effect of various posttransfection incubationperiods on the level of luciferase reporter gene expression. Uponremoval of the calcium phosphate mixture, the cells were allowed togrow in fresh complete growth medium for 24 or 56 h. Luciferaseactivity was measured for both incubation times and found to be thesame, but at 56 h many cells were detached from the plate. There-fore, we routinely use the 24-h incubation.
7. Essentially, the same protocol can be used for transient transfectionsof WERI-Rb-1 human Rb cells.
8. Thoroughly remove all PBS after the final wash by tilting the plate(residual PBS may interfere with the cell lysis buffer and preventcomplete lysis of the cells).
9. LAM is thawed at room temperature in the dark. Add LAM to onecuvet at a time, briefly mix by hand-vortex, using one finger tap onthe lower portion of the cuvet, insert the cuvet into the luminometerand measure the luciferase activity. It is important to performthese step in a timely fashion consistent for all the cuvets becauseonce LAM is added to the extract, the light-emitting reaction begins.One can perform this sequence to a count of one to four. Alterna-tively, if the luminometer is equipped with a dispenser, LAM can beinjected automatically.
10. Although the luciferase activity measured directly in cell lysatesmay vary between different transfections or batches of Y-79cells, the activity of the promoter of interest may still be evaluatedprovided it is normalized relative to an internal control plasmid,e.g., pSV- -Galactosidase vector (Promega).

42 Farber, Lerner, and Viczian
11. For negative controls, the measurements of luciferase activity inLAM alone or in the extracts from mock-transfected cells can beused (between 90 and 150 light units). Luciferase activity measuredin Y-79 cells transfected with the pGL2-Control vector can be usedas a positive control and the values obtained usually range between70,000 and 110,000 light units.
Acknowledgments
The development of the protocols described in this chapter wassupported by NIH Grants EY02651 (DBF) and EY00367 (LEL).DBF is the recipient of a Senior Scientific Investigators Award fromResearch to Prevent Blindness.
References
1. Keith, C. G. (1993) Molecular biology in ocular disorders. Med. J.Australia 158, 615–618.
2. Lee, W. H., Bookstein, R., Hong, F., et al. (1987) Human retinoblas-toma susceptibility gene: cloning, identification, and sequence. Science235, 1394–1399.
3. Kyritsis, A. P., Tsokos, M., Triche, T. J., and Chader, G. J. (1984)Retinoblastoma-origin from a primitive neuroectodermal cell? Nature307, 471–473.
4. Reid, T. W., Albert, D. M., Rabson, A. S., et al. (1974) Characteris-tics of an established cell line of retinoblastoma. J. Natl. Cancer Inst.53, 347–360.
5. Di Polo, A. and Farber, D. B. (1995) Rod photoreceptor-specific geneexpression in human retinoblastoma cells. Proc. Natl. Acad. Sci. USA92, 4016–4020.
6. Hurwitz, R. L., Bogenmann, E., Font, R. L., et al. (1990) Expressionof the functional cone phototransduction cascade in retinoblastoma.J. Clin. Invest. 85, 1872–1878.
7. Di Polo, A., Lerner, L. E., and Farber, D. B. (1997) Transcriptionalactivation of the human rod cGMP-phosphodiesterase beta-subunitgene is mediated by an upstream AP-1 element. Nucleic Acids Res.25, 3863–3867.
8. Wigler, M., Silverstein, S., Lee, L. S., et al. (1977) Transfer ofpurified herpes virus thymidine kinase gene to cultured mouse cells.Cell. 11, 223–232.
Transfection of Rb Cells 43
9. Chu, G., Hayakawa, H., and Berg, P. (1987) Electroporation for theefficient transfection of mammalian cells with DNA. Nucleic AcidsRes. 15, 1311–1326.
10. Felgner, P. L., Gadek, T. R., Holm, M., et al. (1987) Lipofection:a highly efficient, lipid-mediated DNA-transfection procedure.Proc. Natl. Acad. Sci. USA 84, 7413–7417.
11. Gorman, C. M., Moffat, L. F., and Howard, B. H. (1982) Recombi-nant genomes which express chloramphenicol acetyltransferase inmammalian cells. Mol. Cell Biol. 2, 1044–1051.
12. Hall, C. V., Jacob, P. E., Ringold, G. M., and Lee, F. (1983) Expres-sion and regulation of Escherichia coli lacZ gene fusions in mamma-lian cells. J. Mol. Appl. Genet. 2, 101–109.
13. De Wet, J. R., Wood, K. V., DeLuca, M., et al. (1987) Fireflyluciferase gene: structure and expression in mammalian cells. Mol. CellBiol. 7, 725–737.
14. Knoll, B. J., Zarucki, S. T., Dean, D. C., and O’Malley, B. W. (1983)Definition of the ovalbumin gene promoter by transfer of an ovalglobinfusion gene into cultured cells. Nucleic Acids Res. 11, 6733–6754.
15. Sambrook, J., Fritsch, E., and Maniatis, T. (1989) Molecular Clon-ing: A Laboratory Manual. vol. 3, Cold Spring Harbor Laboratory,New York, pp. 16.66–16.67.
16. Lee, S. Y. and Rasheed, S. (1990) A simple procedure for maximumyield of high-quality plasmid DNA. Biotechniques 9, 676–679.


In Situ Hybridization 45
45
From: Methods in Molecular Medicine, vol. 47: Vision Research ProtocolsEdited by: P. E. Rakoczy © Humana Press Inc., Totowa, NJ
3
In Situ Hybridization
Xian-Jie Yang
1. Introduction
In situ hybridization techniques involve specific annealing oflabeled nucleic acid probes with complimentary cellular RNAs, andthe subsequent detection of these labeled probes within fixed cells(1,2). In situ hybridization can be applied to monolayer cells, tissuesections, or whole mount tissues. It is a powerful technique for thecellular or subcellular localization of transcribed RNA, and is espe-cially useful when antibodies recognizing a particular protein arenot available for immunocytochemical staining.
1.1. Preparation of Probes
Probes commonly used for in situ hybridization are single-stranded DNAs, single-stranded RNAs, or oligonucleotides. Hybridsformed between RNA–RNA molecules are more stable than RNA–DNA, or DNA–DNA hybrids. Large quantities of single-strandedRNA probes consisting of either the sense or the antisense tran-scripts can be easily synthesized by in vitro transcription reactionsemploying recombinant bacteriophage RNA polymerases. Thelengths of probes can vary from less than 100 bases to a fewkilobases. Longer probes allow more extensive annealing and thusmore labeled moiety per target RNA.

46 Yang
Two types of labels, radioactive and nonradioactive, can beincorporated into probes for visualization. Radioactive probes typi-cally contain 35S- or 3H-labeled nucleotides, and can be stored forup to one month. Hybridization signals of radioactive probes maybe detected by exposure to photographic emulsion. Nonradioactiveprobes contain nucleotides covalently linked to haptens such asbiotin, digoxigenin, or fluorescein. These probes are generally stablewhen frozen and thus can be stored for prolonged periods of time.The nonradioactive probes are detected with the use of reagents thatbind to the incorporated haptens with high affinity and are conju-gated to enzymes that catalyze histochemical reactions facilitatingvisualization.
1.2. Preparation of Specimen
Tissues or cells used for in situ hybridizations are typically fixedwith 4% paraformaldehyde, 4% formaldehyde, or 1% glutaralde-hyde. Glutaraldehyde is the strongest of these three fixatives andcan result in better preservation of morphology, but can also reducesignal strength because of decreased probe penetration. Fresh tis-sues are essential because RNAs are labile and can be easilydegraded by ribonucleases released from dying cells. Most in situhybridization protocols use either paraffin sections or cryosectionsof tissues. However, fixed whole mount embryos or dissected tis-sues, as well as dissociated cells that have been attached to slidesand fixed for processing, are also commonly used.
1.3. Pretreatment of Tissues
Tissue specimens can be treated in a variety of ways before probehybridization to improve the signal-to-noise ratio. Dewaxing is nec-essary when using paraffin sections in order to ensure the aqueousenvironment required for efficient in situ hybridization. Acetyla-tion is commonly used in combination with paraffin sections to pre-vent nonspecific binding of negatively charged probes to positivelycharged amino groups. A bleaching step is frequently included toreduce background caused by blood cells or pigmented cells,

In Situ Hybridization 47
although this step is not essential for many samples. Perhaps themost critical pretreatment of a specimen is a controlled proteasedigestion to allow better probe penetration. Proper digestion withprotease can significantly enhance hybridization signals. However,excess digestion will result in poor tissue morphology and even lossof signal.
1.4. Hybridization of Probes and Washing
The hybridization of nucleic acid molecules in fixed tissues is acomplex process, and at present is not fully understood. Therefore,hybridization conditions are largely tested empirically. The meltingtemperature (Tm) of a given nucleic acid hybrid depends on theextent of homology between the probe and the target, the length ofthe probe, the base composition of the probe, and the type of hybridformed (RNA–RNA, RNA–DNA, or DNA–DNA). In addition, theTm of a nucleic acid hybrid in tissue is generally lower than its Tm insolution. Most hybridization buffers contain high salts, excessprobes, and other components that favor the formation of hybrids.Under these conditions, RNA–RNA hybridization is completedwithin 6 h at 25°C below the Tm.
Washing after hybridization is performed to eliminate probes par-tially hybridized or nonspecifically bound to tissues. Washing tem-peratures should be 5°C lower than the hybrid’s Tm. Increasinglylower monovalent salt concentrations are typically used to destabi-lize hybrids that form because of partial homologies. Furthermore,formamide is often included in the washing buffer to decrease theTm, and, therefore, effectively increase the stringency of washing.
1.5. Detection and Visualization of Bound Probes
Radioactive in situ hybridization signals are detected by overlay-ing tissue sections with a light-sensitive photographic emulsion.The radioactive signals are captured as reduced silver grains in theemulsion layer and visualized using light microscopy. 35S-labeledprobes are commonly used because the hybridization signals areeasily detected and relatively defined (Table 1). Exposure times

48Y
ang
Table 1Summary of Labeling and Detection Methods Used for In Situ Hybridization
Type of labels Detection reagents Visualization
Radioactive Photographic emulsion Bright field light microscopy,S35 or H3 nucleotides or epilumination
and dark field.Nonradioactive
Fluorescein a. Direct detection of fluorescence Fluorescence microscopy.b. Antifluorescein antibodies conjugated with fluorochromes Fluorescence microscopy.c. Antifluorescein antibodies conjugated with AP:
Enzymatic reaction with: Color Bright fieldNBT/BCIP (X-Phos) Purple or Nomaski microscopy.Naphthol-AS-GR-phosphate/Fast Blue BN GreenNaphthol-AS-phosphate/Fast Red TR RedNaphthol-AS-phosphate/Fast Blue BN Blue
Digoxigenin a. Antidigoxigenin antibodies conjugated with fluorochromes Fluorescence microscopy.b. Antidigoxigenin antibodies conjugated with AP (see above) Bright field
or Nomaski microscopy.Biotin Straptavidin coupled antibodies conjugated with HRP: Bright field
Enzymatic reaction with: Color or Nomaski microscopy.DAB Brown

In Situ Hybridization 49
vary greatly depending on expression levels of target RNAs, andtypically range from 3 to 7 d.
Nonradioactively labeled probes can be detected either directlywithout using any secondary reagents (as in the case with fluores-cent haptens), or indirectly with the use of secondary reagentsincluding hapten-specific antibodies (in cases of digoxigenin andfluorescein) or other high-affinity reagents like streptavidin (in thecase of biotin). These secondary reagents are conjugated withenzymes including alkaline phosphatase (AP) and horse radish per-oxidase (HRP), which catalyze histochemical reactions within cellswhen appropriate substrates are provided. Digoxigenin is a plantderived steroid that is not present in animal cells (3). Therefore,detection of digoxigenin using specific antibodies results in lowendogenous background in animal tissues.
1.6. Artifacts and Controls
When using in situ hybridization to study the expression patternsof new genes, it is crucial to include proper controls. A commonlychosen control probe is the sense strand transcript. In most cases,the sense strand is complimentary to a nonsense sequence thatshould not exist as a transcript in target cells. Hence, it is expectedthat hybridization of sense probe will not result in any specific sig-nal. Another type of control experiment involves competing thelabeled probe with nonlabeled antisense probe. Authentic signalsshould decrease with increasing concentrations of nonlabeled probe.
It is important to realize that in situ hybridization is generally nota quantitative assay. Signal levels between two probes are notdirectly comparable; signal levels detected by the same probe canonly be qualitatively compared when a number of criteria are met.
Radioactive probes may be more sensitive under some circum-stances compared to other labeling methods. However, nonradio-active in situ hybridization procedures offer several advantages overradioactive procedures: (1), it does not involve handling and dis-posing of radioactive materials; (2), the probes have an indefinitetheoretical half-life; (3), the procedure can be accomplished in a
50 Yang
shorter period of time; (4), a higher cellular and subcellular resolu-tion similar to antibody staining can be achieved; (5), it can be usedto detect global expression patterns in embryos or other wholemount tissues; (6), it can simultaneously detect different RNA tran-scripts in the same specimen; and (7), it can be combined withimmunocytochemical staining of proteins. These advantages havemade nonradioactive in situ hybridization the method of choice todetect temporal and spatial distribution of RNAs.
In this chapter, nonradioactive in situ hybridization protocolsusing single-strand RNA probes for monolayer cells, paraffin andcryosections, and whole-mount tissues are described. In addition,variations of these protocols that allow detection of multiple tran-scripts, and combinations of in situ hybridization and immuno-cytochemistry are discussed.
2. Materials
2.1. Supplies and Equipment
1. Pretreated glass slides (Superfrost Plus, Fisher Scientific).2. Glass scintillation vials.3. Glass staining dishes or Coplin jars.4. Plastic (polypropylene) slide mailers for section hybridization.5. Shaking water bath.6. Orbitron rotator.7. Filter units (0.2–0.45-µm pore size, Nalgene, Rochester, NY).8. OCT Tissue-Tek embedding compound (Fisher Scientific).9. Cryostat used to section OCT embedded tissues.
10. Slide storage box with desiccant.
2.2. Reagents, Solutions, and Recipes
1. 10X phosphate-buffered saline (10X PBS), pH 7.3: Dissolve 80 g NaCl,2 g KCl, 11.5 g Na2HPO4·7H2O, and 2 g KH2PO4 in double-distilled(dd) H2O to a final volume of 1 L. Titrate to pH 7.3 with 1 N NaOH.
2. 30% Sucrose/PBS: Dissolve 30 g of sucrose in 1X PBS to a finalvolume of 100 mL. Filter and store at 4°C.

In Situ Hybridization 51
3. 10 mg/mL poly-D-lysine solution: Dissolve 1 g of poly-D-lysine(high molecular weight, Sigma) in 100 mL of dd H2O. Filter, andstore in aliquots at –20°C. Dilute to 10 µg/mL with H2O before coat-ing glass slides.
4. 10% Tween solution: Add 90 mL of dd H2O to 10 mL of Tween-20(Sigma), mix until homogenous. Store at room temperature.
5. PBT: Add 10 mL of 10% Tween solution to 1 L of 1X PBS, mix, andfilter before use.
6. 4% Paraformaldehyde (PFA): Add 40 g of paraformaldehyde to800 mL of dd H2O preheated to 65°C. Stir while adding 10 N NaOHdrop by drop until the solution becomes clear. Continue to stir whileadding 100 mL of 10X PBS. Measure pH with pH paper, and titrateto pH 7.5 with 1 N HCl. Adjust volume to 1.0 L with dd H2O.Let solution cool to room temperature, filter through Whatman No. 4filter paper. Either use fresh, or divide into aliquots, store at –20°C.Thaw and use the same day. Preparation of this solution shouldbe carried out in a fume hood, and it is necessary to wear glovesand a mask.
7. 25% Glutaraldehyde: This stock can be purchased from Sigma. Storeat –20°C. Can be repeatedly frozen and thawed. Wear gloves whenhandle the solution.
8. Diethylpyrocarbonate (DEPC) H2O: Water used to prepare in situhybridization solutions should first be treated with DEPC. Add1 mL DEPC to 1 L of dd H2O, shake vigorously to disperse DEPC,and autoclave. Wear gloves when handle DEPC, because it is a sus-pected carcinogen.
9. 5X Transcription buffers: For T7 and T3 RNA polymerases,200 mM Tris HCl, pH 8.0, 40 mM MgCl2, 10 mM spermidine,250 mM NaCl; for SP6 RNA polymerase, 200 mM Tris-HCl, pH 7.5,30 mM MgCl2, 10 mM spermidine.
10. Nucleotide mixtures for transcription (10X): 10 mM each of GTP,ATP, CTP, 6.5 mM UTP, and 3.5 mM digoxygenin-11-UTP or fluo-rescein-12-UTP. Store frozen at –20°C. Thaw on ice before use.
11. RNase inhibitor: Purchase from Boehringer Mannheim.12. RIPA: 50 mM Tris HCl, pH 8.0, 150 mM NaCl, 1 mM ethylene-
diaminetetraacetic acid (EDTA), 1% Nonidet P-40, 0.5% sodiumdeoxycholate, 0.1% sodium dodecyl sulfate (SDS). Make with DEPCH2O. Filter before use.
13. Proteinase K stock: Dissolve proteinase K (Boehringer Mannheim)in the original bottle to 10 mg/mL with DEPC-treated H2O. Immedi-

52 Yang
ately distribute as 0.5-mL aliquots into Eppendorf tubes and store at–20°C. When thawing a frozen tube, make sure that it is fully resus-pended before pipeting and diluting. Each batch of proteinase K mayhave different specific activities and may require titration to deter-mine the optimal concentration for different applications.
14. 20X SSC, pH 4.5: 3 M NaCl, 0.3 M trisodium citrate. Use citric acid(anhydrous) to adjust pH. Autoclave before use.
15. Hybridization solution: 5X SSC, pH 4.5, 50% formamide (BoehringerMannheim, no need to deionize), 50 µg/mL yeast RNA (Sigma),1% SDS, 50 µg/mL Heparin (Low molecular weight, sodium salt,Sigma). All components should be made up with DEPC-treated H2Oat room temperature and filtered. Aliquots of the solution can bestored in 50-mL sterile polypropylene tubes at –20°C for up to 1 yr.Before each use, heat the solution to 70°C. For hybridization,directly add single strand RNA probe to a final concentration ofapprox 1 µg/mL. Hybridization solutions containing probes can alsobe stored at –20°C, and reused several times. Before each use, heatto 70°C to denature probes.
16. Washing solution I: 5X SSC, pH 4.5, 50% formamide, 1% SDS.Make up fresh the day of use and filter.
17. Washing solution II: 2X SSC, pH 4.5, 50% formamide. Make upfresh the day of use and filter.
18. Sheep serum: Inactivate normal sheep serum by heating to 55°C for60 min, swirling every few minutes. Store aliquots at –20°C.
19. Antidigoxigenin and antifluorescein antibodies: Antidigoxigeninantibody conjugated to alkaline phosphatase (from sheep, Fab frag-ment, Boehringer Mannheim) and antifluorescein antibody conju-gated to alkaline phosphatase (from sheep, Fab fragment, BoehringerMannheim) are used at 1:2000 dilutions.
20. TBST: 25 mM Tris-HCl, pH 7.0, 140 mM NaCl, 2.7 mM KCl,0.1% Tween-20, 2 mM Levimasole. Make from stock solutions.Add Tween-20 and Levimasole (to inhibit endogenous alkalinephosphatase activities) the day of use, then filter. Does not requireDEPC water.
21. NTMT: 100 mM Tris-HCl, pH 9.5, 100 mM NaCl, 50 mM MgCl2,0.1% Tween-20, 2 mM Levimasole. Make up fresh from stock solu-tions, add Levimasole, and filter before use.
22. NBT: Dissolve 75 mg nitroblue tetrazolium (NBT) in 1.0 mL 70% (v/v)N, N-dimethylformamide. Make fresh daily.

In Situ Hybridization 53
23. BCIP (X-Phos): Dissolve 50 mg 5-bromo-4-chloro-3-indolyl phos-phate (BCIP) sodium salt in 1.0 mL of H2O; or 50 mg BCIP toluidinesalt in 1.0 mL of N, N-dimethylformamide. Make fresh daily.
24. Multicolor alkaline phosphatase (AP) detection set: Can be pur-chased from Boehringer Mannheim. It contains AP substrates to give“green” (naphthol-AS-GR-phosphate and Fast Blue BN), “red”(naphthol-AS-phosphate and Fast Red TR), and “blue” (naphthol-AS-phosphate and Fast Blue BN) reaction precipitates. Use asdirected.
25. Alkaline phosphatase (AP) reaction mix with NBT/BCIP: 250 µg/mLNBT, 130 µg/mL BCIP diluted in NTMT. To make 2.0 mL of thereaction mix, add 6.75 µL of NBT solution and 5.25 µL of BCIPsolution to 2.0 mL of NTMT. Make these solutions immediatelybefore use and keep in the dark.
26. PBS, pH 5.0: Titrate 1X PBS with 1 N HCl until pH 5.0.27. Embryo powder: Embryo powders are used to preabsorb antibod-
ies in order to reduce backgrounds in whole mount in situ hybrid-izations. Embryo powders should be derived from the same species,e.g., mouse, rat, or chicken, that will be used in in situ hybridiza-tion assays. For mice, embryos at gestation day 12–13 are used;for chicks, embryos at approx stage 32 (embryonic day 6) can beused. Dissect embryos free of embryonic membranes in cold PBS,and remove hearts. Homogenize dissected embryos in a minimumvolume of ice-cold PBS. Add 4X volumes of ice-cold acetone,vortex, and put on ice for 30 min. Spin in oak ridge tubes at10,000g for 10 min at 4°C. Decant and rinse pellet in ice-coldacetone. Allow tissue pellet to air-dry completely on wax filterpaper, and grind to powder in mortar and pestle. Store at –20°C ina sealed container.
28. ABC Elite kit for HRP staining: Purchase from Vector Lab (Burlin-game, CA). Appropriate secondary antibodies (e.g., biotinylatedantirabbit antibody) can also be obtained from Vector Lab. Use thesesecondary antibodies at 1:200 dilution.
29. DAB substrate solution: Make 10 mg/mL 3,3-diaminobenzidinetetrahydrochloride (DAB), store as aliquots at –20°C. Add 250 µL of1 M Tris-HCl, pH 7.5, 250 µL of 10 mg/mL DAB, and 5 µL of30% H2O2 to 5 mL of ddH2O right before use. DAB is a carcinogen,therefore, wear gloves and dispose wastes according to institutionalguidelines.

54 Yang
3. Methods
3.1. Preparation of RNA Probes
Single-stranded sense and antisense RNA probes are synthesizedby in vitro transcription reactions using bacteriophage RNA poly-merases (T7, T3, or SP6). To obtain appropriate DNA templatessuitable for transcription reactions, DNA sequences encoding theprobes should be subcloned into restriction sites of a plasmidflanked by two distinct bacteriophage promoters (e.g., Bluescript,Strategene). The size of the probe can range from 200 basepairs upto a few kilobases (see Notes 1 and 2).
Linear DNA templates for sense and antisense RNAs are gener-ated by restriction cutting circular template plasmid DNA at eitherend of the probe. In general, 5' protruding or blunt-end restrictionenzymes are preferred to generate linear templates. To prepare tran-scription reactions, use autoclaved Eppendorf tubes and pipet tips,and wear gloves to reduce RNase contamination. A 20-µL reactioncontaining 1 µg of template DNA can synthesize up to 10 µg ofRNA transcripts (see Note 3).
1. Mix the following reagents together at room temperature in the fol-lowing order:
DEPC H2O 10 µLTranscription buffer (5X) 4 µL0.2 M DTT 1 µLNucleotide mix (10X) 2 µLLinearized DNA (0.5 µg/µL) 2 µLRNase inhibitor 0.5 µLRNA polymerase (T7, T3, or SP6) 1 µL (10 U)
2. Incubate at 37°C for 2 h.3. Check transcription by running a 1-µL aliquot of the reaction on a
1% agarose gel. A single predominant band of greater intensity thanthe DNA template band indicates that transcription has been suc-cessful (see Note 4).
4. Add 1 µL DNase (RNase-free) and incubate at 37°C for 15 min.5. Add 100 µL DEPC-treated H2O, 10 µL 4 M LiCl, 300 µL of 100% etha-
nol, and incubate at –20°C for 60 min to overnight.

In Situ Hybridization 55
6. Spin for 10 min in a microfuge, and wash with 70% ethanol. Air-dry.7. If using fluorescein-labeled probes, repeat steps 5 and 6.8. Redissolve in 10 µL DEPC-treated H2O. Add 10 µL hybridization
buffer. Probe can be stored in 50% hybridization buffer for at leastseveral months at –20°C.
3.2. Preparation of Paraffin Sections
3.2.1. Fixation of Samples
1. Place dissected organs or embryos in clean scintillation vials con-taining fresh (or freshly thawed) 4% PFA fixative. Allow fixation toproceed at 4°C for desired time (see Notes 5–7).
3.2.2. Dehydration of Samples
1. Melt sufficient amount of paraffin wax in a 60°C oven.2. Replace fixatives with 50% ethanol, immediately change the
50% ethanol to fresh 50% ethanol and incubate at room tempera-ture for 20 min. Repeat the 20-min incubation with fresh ethanoltwo more times.
3. Perform the same dehydration procedure three times each using 70%,95%, and 100% ethanol, allowing 20 min for each change. (Samplescan be stored in 70% ethanol for a few days. Complete dehydrationis critical for paraffin embedding.)
4. Replace 100% ethanol with xylenes in a fume hood. Immediatelychange to fresh xylenes and incubate at room temperature for 10 min.Repeat incubation with xylenes two more times. (Longer xyleneincubations may be necessary for larger samples).
3.2.3. Embedding in Wax
1. Pour off xylenes. Add 5 mL fresh xylenes, and an equal volumeof molten wax. Mix and leave at room temperature overnight.(The wax/xylenes will harden, but impregnation of tissue will occur.)
2. Place the vial in a 60°C oven until the wax/xylenes mix melts.Replace the wax/xylenes mix with fresh wax, and leave at 60°Cfor 1 h. Repeat this step two more times for a total of 3 h incubationin wax.
3. Move the vial to a 60°C heat block. Fill embedding mold with freshmolten wax using a hot Pasteur pipet. Immediately place and orient

56 Yang
the sample in the mold using hot forceps. Place an embedding ringon the mold and fill with more wax. Label the embedding ring toallow the identification of samples (see Note 8).
4. Leave the wax blocks to harden completely at room temperature.The blocks can be stored in dry conditions for several years.
3.2.4. Sectioning Paraffin-Embedded Samples
1. Mount paraffin blocks onto the microtome, and trim away excessparaffin. The final shape of the block face is typically trapezoidal tofacilitate ribbon formation.
2. Collect 5–8 µM sections on glass slides coated with H2O. Allow sec-tions to stretch on a 45°C slide warmer for 30 min, and then drainexcess water. Incubate the slide in a dry 37°C incubator overnight.If desired, paraffin sections can now be stored in a desiccated slidebox at room temperature.
3.2.5. Dewaxing and Rehydrating Paraffin Sections
1. Incubate slides with paraffin sections twice in fresh xylenes for 5 mineach to dissolve the wax.
2. Transfer slides to 100% ethanol twice for 5 min each, similarlyincubate slides with 95%, 70%, and 50% ethanol for 5 min each, andthen transfer to PBS. The paraffin sections are now ready for in situhybridization.
3.3. Preparation of Cryosections
1. Dissect tissues in cold PBS, then transfer to fresh 4% PFA at 4°C,overnight.
2. To cryoprotect samples, wash the tissues once with 30% sucrose/PBS,then leave them in 30% sucrose/PBS until they sink to the bottom ofthe vial. Change to fresh 30% sucrose/PBS for another hour and makesure samples remain sunk. (For large pieces of tissues, longer incuba-tion periods and multiple changes of sucrose solution are necessary.)
3. Transfer tissues to a 1:1 mixture of 30% sucrose/PBS and OCT, gen-tly rock for 1 h. Use enough of the sucrose/PBS/OCT mixture tocompletely cover all tissues.
4. Transfer tissues to chilled OCT in embedding molds using plasticPasteur pipetors, and orient tissues with a pair of forceps. Freeze on

In Situ Hybridization 57
dry ice. Wrap OCT blocks with aluminum foil, label the blocks, andstore at –80°C.
5. Equilibrate OCT tissue blocks to –20°C before sectioning. Carefullycollect 10–20 µM cryosections on pretreated glass slides (SuperfrostPlus, Fisher).
6. Dry sections overnight at room temperature, and use the next day.Alternatively, place slides in slide storage boxes with desiccants, sealthe box with tape, and store at –80°C for up to 6 mo. Avoid repeatedfreezing and thawing. Before opening, let slide boxes warm up toroom temperature to prevent condensation.
3.4. Preparation of Monolayer Cells
1. Coat glass slides with 10 µg/mL poly-D-lysine at room temperaturefor 30 min. Rinse the slides once with PBS, and set horizontally in amoist chamber.
2. Pipet suspensions of cells (2 × 10⁷ – 1 × 10⁸ cells/mL) onto a slide as10 to 100 µL drops. Place slides in a 37°C, 5% CO2 tissue-cultureincubator for 1 h to allow cell attachment. Alternatively, one candirectly culture cells on the slides for prolonged periods.
3. Fix cells by submerging slides in fresh 4% PFA at room temperaturefor 10 min.
4. Wash slides twice with PBS for 5 min each. Slides can then be usefor in situ hybridization. Alternatively, slides can be submerged andstored in 100% methanol at –20°C.
3.5. Preparation of Whole-Mount Embryos and Tissues
1. Dissect embryos or tissues in cold PBS. Transfer samples to scintil-lation vials containing 15–30 mL of fresh 4% PFA, and fix at 4°Covernight with gentle rocking (see Note 9).
2. Remove the fixative and wash samples in 5–10 mL PBT twice for5 min each at 4°C with gentle rocking.
3. Dehydrate samples by washing in 25%, 50%, 75% methanol/PBTsequentially, 5 min each at room temperature with gentle rocking.Then wash two times with 100% methanol for 5 min each with gentlerocking.
4. Dehydrated samples are ready to be used for in situ hybridization, orcan be stored in 100% methanol at –20°C for several months.

58 Yang
3.6. Whole-Mount In Situ Hybridization (Figs. 1 and 2)
The protocol described below is derived from the method used byRiddle et al. (4–7). All washes are performed in vials with 5–10 mLof solution at room temperature for 5 min with gentle rocking on anOrbitron rotator, unless otherwise noted.
Fig. 1. Whole-mount in situ hybridization of chick embryos with Pax6RNA probes. Images of early chick embryos processed for whole-mount insitu hybridization as described in this chapter are shown. Chick embryosranged from 30 h (HH stage 8.5) to 4.5 d (HH stage 24) of incubation werehybridized to antisense chick Pax6 RNA probes labeled with digoxigenin,which was detected by an antidigoxigenin antibody conjugated to alkalinephosphotase. Hybridization signals appear as magenta-colored precipitates.Images of whole-mount embryos were photographed with dark-field stageillumination. A and B are dorsal views of embryos. C is a frontal view. Dand E are lateral and ventral views of the head region of E 4.5 embryos,respectively. Pax6 mRNA are detected in the developing eye primordiumin addition to other regions of the developing central nervous system.Abbreviations: fb, forebrain; ov, optic vesicle; so, somites; sc, spinal cord;di, diencephalon; te, telencephalon; oc, optic cup; le, lens vesicle; mb, mid-brain; hb, hindbrain; os, optic stalk; np, nasal placode.

In Situ Hybridization 59
3.6.1. Pretreatment and Hybridization (Day 1)
1. Rehydrate samples stored in 100% methanol by sequential 5-min washesin 75%, 50%, 25% methanol/PBT, followed by two washes with PBT.
2. Bleach samples with 2% H2O2 in PBT for 1 h at room temperature,followed by three washes with PBT.
3. Treat samples with 10 µg/mL proteinase K in PBT for 15 min atroom temperature while rocking.a. The concentration and duration of proteinase K treatment are
critical, and must be empirically determined. For youngerembryos or ectodermal detection, less proteinase K is necessary;
Fig. 2. Section in situ hybridization of chick retina with Pax6 RNAprobes. Micrographs of chick eyes processed for section in situhybridization as described in this chapter are shown. Cryosection of15-µm thickness were hybridized to antisense chick Pax6 RNA probeslabeled with digoxigenin, which was detected by an antidigoxigeninantibody conjugated to alkaline phosphotase. Hybridization signalsappear as magenta-colored precipitates on sections. Images were photo-graphed using Normaski optics. (A) Pax6 mRNA is detected in the devel-oping eye including the pigmented epithelium, the retina, and the lens.During retinal neurogenesis (B–D), Pax6 is expressed in retinal progeni-tor cells as well as differentiated cells. After the completion of neuro-genesis (E16), Pax6 expression is maintained in amacrine cells andganglion cells (E). Abbreviations: ret, retina; le, lens; pe, pigmented epi-thelium; os, optic stalk; gc, ganglion cell layer; vz, ventricular zone; onl,outer nuclear layer; inl, inner nuclear layer.

60 Yang
e.g., 1/5 (approx 2 µg/mL) proteinase K for ectodermal layer and1/200 (approx 50 ng/mL) for mouse gestation day 9 embryos.
b. For younger embryos, the following method without H2O2 or pro-teinase K has been used successfully. Wash embryos with threechanges of RIPA buffer, each for 30 min at room temperature,followed with three washes of PBT. Proceed to step 5 (see Note 10).
4. Wash with freshly made and filtered 2 mg/mL glycine in PBT for10 min at room temperature. Then wash twice with PBT.
5. Postfix with 4% PFA and 0.2% glutaraldehyde in PBT for 20 min,then wash two times with PBT.
6. Add 1 mL hybridization solution to the vial, mix gently by inversion.Remove and add sufficient amount of hybridization solution to coverthe samples.
7. Incubate samples at 70°C for 1 h to initiate prehybridization.(Samples can be stored in hybridization solution at –20°C before orafter this heating step.)
8. Add labeled RNA probes to fresh hybridization solution to a finalconcentration of approx 1 µg/mL probe, and keep warm at 37°C.Replace the prehybridization buffer with the hybridization solutioncontaining probe. Use enough solution to cover the samples. Mix gen-tly by inversion. Hybridize overnight at 70°C (see Note 11).
3.6.2. Posthybridization Washes and Antibody Binding (Day 2)
1. Carefully remove the hybridization solution from scintillation vialsusing a Pasteur pipet. Wash samples with prewarmed washing solu-tion I for 30 min at 70°C with gentle rocking in a shaking water bath.Decant and repeat the same wash two times.
2. Similarly, wash samples three times with washing solution II for30 min each at 65°C.
3. Wash with fresh TBST three times for 5 min each at room tempera-ture while rocking.
4. Incubate embryos with 10% sheep serum in TBST for 2.5 h at roomtemperature to block nonspecific binding sites.
5. Absorb the antidigoxigenin antibody with embryo powders. Beginthis step during the first posthybridization wash (see Subheading3.6.2., step 1):a. Put approx 3 mg of embryo powder into Eppendorf tubes (can be
scaled up into larger tubes as necessary).

In Situ Hybridization 61
b. Add 0.5 mL TBST, incubate at 70°C for 30 min.c. Vortex for 10 min.d. Cool on ice, add 5 µL sheep serum and 1 µL antidigoxigenin
antibody.e. Shake gently at 4°C for 1 h.f. Spin in a microfuge at full speed for 10 min at 4°C.g. Collect the supernatant and dilute it with 1% sheep serum/TBST
to a volume of 2 mL. The effective dilution of the digoxigeninantibody is 1:2000.
6. Remove blocking serum from embryos. Add 1 mL of dilutedantibody (or approx five times the volume of tissue sample), mixgently, and then remove antibody solution. Add another 1 mL ofthe antibody solution to samples, mix, and rock gently overnightat 4°C.
3.6.3. Postantibody Washes (Day 3)
1. Remove antibody and rinse samples briefly with fresh TBST. Washthree times for 5 min each with TBST at room temperature.
2. Wash samples five times in TBST for 1–1.5 h each, rocking at roomtemperature.
3. Wash overnight in TBST, rocking at 4°C.
3.6.4. Detection and Visualization of Hybridized Probes (Day 4)
1. Wash three times in NTMT, each for 10 min at room temperature.2. Incubate with freshly made X-Phos reaction mix. Cover tubes with
foil, place on rocker at room temperature. Check on reactionprogress after 20 min, and then monitor about once an hour, asnecessary (see Note 12).
3. When reaction is judged complete, wash two times in NTMT for10 min each, rocking in dark.
4. Wash two times in PBT (pH 5.5), for 10 min each at room temperature.5. Postfix with 4% Paraformaldehyde and 0.1% Glutaraldehyde in PBS
for 1 h at room temperature.6. Wash two times with PBT for 10 min each at room temperature.7. Visualize the AP reaction signals using dissecting microscope and
appropriate lighting. Samples can be stored at 4°C in the darkness(see Notes 13–15).

62 Yang
3.7. In Situ HybridizationUsing Tissue Sections or Monolayer Cells
The following protocol is a modification of the whole-mountin situ hybridization described in Subheading 3.6. (8). Proceduresare performed at room temperature using staining trays with slidesresting in racks, unless otherwise noted.
3.7.1. Pretreatment and Hybridization (Day 1)
1. Rehydrate and equilibrate cryosections, or dewaxed paraffin sectionsin PBS for 5 min.
2. Fix in fresh 4% PFA for 15 min.3. Wash two times with PBT for 5 min each.4. Bleach with 0.5–1% H2O2 in PBT for 5 min.5. Wash three times in PBT for 5 min each.6. Treat with 1 µg/mL proteinase K /PBT, for 1 to 15 min (see Note 16).7. Wash with freshly made 2 mg/mL glycine/PBT for 10 min.8. Wash two times with PBT for 5 min each.9. Fix with 4% PFA/0.2 % Glutaraldehyde/PBT for 15 min. (Omit the
glutaraldehyde if using a fluorescence detection method.)10. Wash three times with PBT for 5 min each. (Steps 1–9 can be elimi-
nated completely with no loss of signal or increase in background inmany tissues. Monolayer cells stored in 100% methanol can bedirectly used at step 11).
11. Incubate slides in hybridization solution for 30 min at 70°C. Thiscan be easily accomplished by arranging slides back-to-back (tissuesections facing outward) within commercially available slide mail-ers that have been filled with hybridization solution, and then plac-ing these slide mailers at 70°C (see Note 17).
12. Add RNA probe to tissue sections or cells attached to slides: This isusually done by dropping approx 100 µL of hybridization solutioncontaining 1 µg/mL RNA probe onto sections, overlaying sectionswith a glass cover slip, and then placing slides horizontally in ahumidified slide chamber at 70°C. Alternatively, if enough RNAprobe solution is available, slides can be directly transferred to slidemailers containing 1 µg/mL RNA probe in hybridization solution.The mailer is then sealed with plastic wrap, and incubated at 70°Covernight in a vertical position (see Notes 18 and 19).

In Situ Hybridization 63
3.7.2. Posthybridization Washes and Antibody Binding (Day 2)
1. Carefully lift cover slips from slides or remove slides from slide mail-ers, and place individual slides directly into prewarmed washingsolution I in a slide tray or a Coplin jar.
2. Wash three times for 15 min each in washing solution I at 70°C.3. Wash three times for 15 min each in washing solution II at 65°C.4. Wash three times for 10 min each in TBST at room temperature.5. Block in 5% sheep serum/TBST, for 1 h at room temperature, or
overnight at 4°C.6. Dilute the antidigoxigenin antibody conjugated with AP 1:2000 in
1% sheep serum/TBST. Place slides in a horizontal position in ahumidified chamber and incubate sections with the diluted antibodysolution for 2 h at room temperature, or overnight at 4°C.
3.7.3. Postantibody Washes and Detection (Day 3)
1. Place individual slide in a slide tray or a Coplin jar filled with TBST.Wash slides four times for 15 min each in TBST.
2. Wash three times for 10 min each in NTMT.3. Incubate with fresh X-Phos reaction mix in the dark at room tem-
perature until the desired staining intensity is achieved (see Note 20).4. Wash two times with NTMT for 5 min each.5. Wash with PBT pH 5.5, for 10 min.6. Wash two times with PBT. Mount slides with a glycerol based
mounting medium, and seal the edges of the cover slip with nail pol-ish. Keep slides in a dry and dark place (see Note 15).
7. The AP reaction signals are best visualized using bright field orNomaski microscopy.
3.8. Detection of Two RNA Probes
Double detection of two RNA probes labeled with distinct hap-tens can be applied to both whole mount and section in situ hybrid-izations. The basic protocol for detecting two RNA probes is similarto single probe detection, except for the following modifications:
1. Add the digoxigenin-labeled and fluorescein-labeled probes togetherin hybridization solution, to 1 µg/mL each. Perform hybridizationwith two probes simultaneously (for whole-mount in situ hybridiza-

64 Yang
tion, see Subheading 3.6.1., step 8; for section in situ hybridization,see Subheading 3.7.1., step 12).
2. Follow the protocol as described in Subheading 3.6. or Subheading3.7. Proceed with the detection of the antidigoxigenin antibody usingNBT and BCIP (X-Phos) as substrates until the desired AP signalintensity is achieved (for whole-mount in situ hybridization, this isSubheading 3.6.4., step 2 for section in situ hybridization, this isSubheading 3.7.3., step 3).
3. Do not postfix following X-Phos detection, instead, wash the samplestwice for 10 min each with TBST. Heat at 70°C for 30 min. Washagain with TBST at room temperature for 10 min.
4. Incubate tissue samples with 1% sheep serum/TBST containingantifluorescein antibody conjugated to AP (1:2000 dilution) (seeNote 21).
5. Continue with postantibody washes using TBST as described in Sub-heading 3.6. or Subheading 3.7., and proceed to predetectionNTMT washes.
6. Incubate with AP reaction mix containing substrates (e.g., BoehringerMannheim) that will give color precipitates other than the purpleX-Phos reaction precipitates, e.g., red, until signals reach desiredintensity. Continue to the end of protocols (see Note 21).
3.9. Combinations of In Situ Hybridizationand Immunocytochemistry
The simultaneous detection of RNA and protein expression canbe accomplished by combining in situ hybridization techniques withimmunocytochemistry methods.
1. Follow the in situ hybridization protocol through to the antibody block-ing step (see Subheading 3.6.2., step 4 or Subheading 3.7.2., step 5).
The in situ antibody blocking solution (10% sheep serum/TBST)can be supplemented with 2% normal serum from the species of sec-ondary antibody that will be used to detect the primary antibody.
For the detection of protein antigens, the proteinase K treatmentprior to hybridization can be detrimental, and thus should be reducedor eliminated.
2. Incubate samples for 2 h at room temperature or at 4°C overnightwith 1% sheep serum/TBST containing both the antidigoxigenin inantibody (1:2000) and a suitable dilution of the primary antibody.

In Situ Hybridization 65
3. Wash four times with PBT for 15 min each if using sections, or washfive times with PBT for 1 to 2 h each if using whole-mount samples.
4. Incubate with appropriate secondary antibody diluted in 2% sheepserum/TBST for 60 min at room temperature for sections, or over-night at 4°C for whole-mount samples.
5. Prepare the “ABC complex” using the Elite ABC kit by adding2 drops of solution A and 2 drops of solution B to 5 mL of PBS, mix,and incubate at room temperature for 60 min. This step should becarried out on the same day of the HRP detection.
6. Wash sections four times with PBT for 10–20 min each, or washwhole-mount samples five times for 1 h each in PBT to get rid ofnonspecifically bound secondary antibodies.
7. Incubate slides with the “ABC complex” that contains horse radishperoxidase (HRP) at room temperature for 30 to 60 min. Wash sec-tions four times with PBS for 10–20 min each, or wash whole-mountsamples five times for 1 h each in PBS.
8. Carry out HRP reaction by incubating with the DAB substrate solu-tion at room temperature (brown precipitates). Wash samples withPBS when HRP reaction is completed. If fluorochrome conjugatedsecondary antibodies are used, omit all glutaraldehyde fixation steps.
9. Proceed with NTMT washes of samples, followed by incubation withthe X-Phos reaction mix (purple precipitates) following in situhybridization protocols (for whole mount, follow Subheading 3.6.4.;for sections, follow Subheading 3.7.3., steps 2–7).
Double staining with fluorescent and cytochemical methods is notrecommended if signals are expected to colocalize because the darkAP and HRP reaction products may partially or completely quenchoverlapping fluorescence.
4. Notes
1. The nonradioactive protocols described in this chapter have beentested and used successfully by a large number of researchers (3–7).The hybridization and washing conditions employed in these proto-cols are highly stringent. They allow specific hybridization signalsto be observed for probes with very high homologies (90% orhigher), e.g., different homeo-domain containing RNAs, BMPs, andtyrosine kinases. Cross-species probes with lower amounts ofhomology may not generate sufficient signal under these conditions,and whenever possible, species-specific probes should be used.

66 Yang
2. The probes synthesized can be of various length, from 200 basepairsto 4 kilobases. Probes shorter than 200 bases may yield less signalsunder these conditions. Long probes (>2 kb) seem to work well underthese conditions and no further hydrolysis of probes is necessary.
3. The quality of the RNA probe is crucial for the success of the tech-nique. Incompletely linearized templates will produced long “run-on” transcripts instead of homogeneous “run-off” products, and thusincrease background signals. Incomplete removal of nonincorporatedlabel can also result in a high background.
4. Because these agarose gels are not denaturing, the apparent size ofthe RNA may appear different than predicted for double-strandedDNAs. Higher molecular-weight bands may also be seen; these arelikely products of transcribing the circular plasmid caused by incom-plete digestion of template DNA.
5. Equally important is the fixation and preservation of RNAs in thetissue samples. Therefore, dissection and fixation of tissues shouldbe carried out swiftly, and only fresh fixatives should be used.
6. Optimal fixation results in well-preserved morphology and goodsignal-to-noise ratio, and needs to be determined for each tissue.In general, 4°C overnight is sufficient for most embryonic tissues.For homogenous and rapid fixation of animal organs, e.g., adultmouse brain, perfusion is necessary.
7. In general, paraffin tissue blocks used to generate sections for insitu hybridization can be the same as prepared by standard patho-logical embedding protocols. However, there are two criticalparameters that need to be observed for in situ hybridization in or-der to achieve good results. First, tissues should be fresh. Smalltissues (e.g., mouse eyes) should be fixed immediately followingdissection. Larger tissues, such as humans or monkey eyes, andchick eyes at late embryonic or posthatching stages will be betterfixed by perfusion procedures. If perfusion is not possible and onlythe retina and pigmented epithelium are of interest, denucleationshould be followed by the quick removal of the cornea and lens,and submersion of the entire eye in fixatives. This protocol allowsthe rapid access of posterior segment tissue to the fixatives. Sec-ond, the preferred fixative is 4% paraformaldehyde in PBS. Thefixative solution should be freshly prepared. Alternatively, largequantities can be prepared ahead of time and stored frozen at–20°C in 40-mL aliquots in standard cornical tubes. Frozen fixa-tive can be thawed on the same day of tissue collection.
In Situ Hybridization 67
8. The embedding ring is used to attach the paraffin block to the micro-tome during sectioning.
9. Embryos may have cavities that can trap probes and detectingreagents during in situ hybridization. Use a fine needle or forceps tomake a hole to allow solutions to flow in and out of these cavities.
10. Proteinase K treatments can greatly influence the outcome of in situhybridization. The optimal concentration and duration of this treat-ment depends on the age and type of tissue sections, and even thespecies of origin. For examples, paraffin sections in general are moreresistant to proteinase K treatment than cryosections; and embryonictissues are more sensitive to proteinase K digestion. Thus, it is crucialto empirically determine optimal proteinase K treatment parameters.
11. If hybridization signals on tissue sections appear weak, hybridiza-tion can be carried out at 65°C overnight, followed by two 30-minwashes at 65°C with 1X SSC, 0.1% Tween-20, 50% formamide.Then the sections can be washed with TBST and processed for block-ing and antibody incubation as described.
12. Incubation at 37°C can accelerate the AP reaction. Most probesrequire from 20 min to a few hours to develop at room temperature.Prolonged developing times maybe necessary for transcripts expressedat low levels. When developing for long periods (e.g., overnight),change to freshly made X-Phos reaction mix.
13. To clear embryos, wash in increasing concentrations of glycerol(30%, 50%, 70%, 80%) for 15 min to 1 h each, depending on the sizeof the embryo. Samples should be photographed as soon as possibleafter the completion of the procedure. Prolonged storage can resultin increased background signals. Samples can also be embedded andsectioned. However, the tissue morphology and resolution of signalsmay not be as good as in situ hybridization performed directly withtissue sections.
14. High background can also result from incomplete removal andreplacement of the various solutions. For whole-mount in situhybridization, a gyration type of shaking device (e.g., an Orbitronrotator) is highly recommended. “Trapping” caused by incompleteelimination of probe or antibodies during wash steps can be avoidedby making small holes at appropriate positions in the sample.For example, when using mouse gestation day 10 embryos, smallholes can be punctured at positions of the forebrain and in the roof ofthe hindbrain to prevent “trapping” in the developing neural tube.In general, whole-mount in situ hybridization does not work well

68 Yang
with large pieces of solid tissue because probe penetration will besuperficial. In situ hybridization using sections, however, can reli-ably reveal expression patterns of most tissues and cell types at highresolution. When performing section in situ hybridization, it isimportant to keep sections moist throughout the procedure and pre-vent antibodies from drying on sections.
15. The time required for nonradioactive in situ hybridization is rela-tively short (3–4 d) compared with the traditional radioactivedetection method, and is comparable to immunocytochemistry.Furthermore, it allows detection of two or more RNA targets whenusing two probes labeled with distinct haptens, and can be combinedwith antibody staining. Both double-probe in situ hybridization andin situ hybridization in combination with immunocytochemistry canbe applied to whole-mount samples, as well as sections. It is recom-mended to first work out conditions required for each individualprobe and/or antibodies before performing the combination experi-ments. In general, whole-mount samples require more extensiveincubation and washes throughout the procedure.
16. The optimal duration of proteinase K treatment may vary dependingupon type, age, and thickness of tissues, as well as the specific activ-ity of the proteinase, and thus must be empirically determined.
17. Each slide mailer takes about 12 mL of solution with four slidespositioned back-to-back. If using less than four slides, use blankslides to take up the space. When transferring slides into mailers,care should be taken to prevent smearing or scratching the samples.
18. When using AP or HRP conjugated antibodies to visualize hybrid-ization signals, it is important to inactivate endogenous AP andperoxidase activities. The bleaching step with H2O2 during the pre-treatment before hybridization effectively eliminates endogenousperoxidase activities. The hybridization step carried out at 70°Cserves to inhibit endogenous alkaline phosphatase activities withinmost tissues.
19. Hybridization solutions containing probes can be reused several timesif stored at –20°C in slide mailers. When reusing hybridization solu-tions, make sure to first heat to 80°C to melt secondary structures.
20. The time required for the AP reaction differs for individual probes. Fornew probes, it is recommended to check the reaction every 20–30 min.For overnight incubations, fresh X-Phos reaction mix should be used.
21. For whole-mount in situ hybridization, the antifluorescein antibodycan be similarly preabsorbed with embryo powders as described.

In Situ Hybridization 69
References
1. Wilkinson, D. G. (1992) In Situ Hybridization: A Practical Approach.(Wilkinson, D. G., ed.), Oxford University Press, New York.
2. Harris, N. and Wilkinson, D. G. (1990) In Situ Hybridisation: Appli-cation to Developmental Biology and Medicine. Cambridge Univer-sity Press, New York.
3. Kessler, C. (1991) The digoxigenin system: anti-digoxigenin tech-nology—a survey on the concept and realization of a novel bio-analytic indicator system. Mol. Cell. Probes 5, 161–205.
4. Riddle, R. D., Johnson, R. L., Laufer, E., and Tabin, C. (1993) Sonichedgehog mediates the polarizing activity of the ZPA. Cell 75, 1401–1416.
5. Parr, B. A., Shea, M. J., Vassileva, G., and McMahon, A. P. (1993)Mouse Wnt genes exhibits discrete domains of expression in the earlyembryonic CNS and limb buds. Development 119, 247–261.
6. Sasaki, H. and Hogan, B. L. M. (1993) Differential expression of mul-tiple folk head-related genes during gastrulation and axial pattern for-mation in the mouse embryo. Development 118, 47–59.
7. Rosen, B. and Beddington, R. S. P. (1993) Whole mount in situhybridization in the mouse embryo: gene expression in three dimen-sions. Trends Genet. 9, 162–167.
8. Yang, X.-J. and Cepko, C. L. (1996) Flk-1, a receptor for vascularendothelial growth factor (VEGF), is expressed by retinal progenitorcells. J. Neurosci. 16, 6089–6099.


Immunocytochemical Studies 71
71
From: Methods in Molecular Medicine, vol. 47: Vision Research ProtocolsEdited by: P. E. Rakoczy © Humana Press Inc., Totowa, NJ
4
Immunocytochemical Studies of the Retina
Ann H. Milam
1. Introduction
It is often desirable to localize a specific protein within a layer,cell, or subcellular organelle in the retina. A variety of immuno-cytochemical techniques are available to achieve this goal. Thesetechniques all utilize an antibody that binds to the protein of interestand is detected by a label (a fluorescent dye, enzyme, or electrondense marker) to localize the specific antigen in the tissue.
1.1. Immunofluorescence Methods
Fluorescence immunocytochemistry involves initial treatment ofretina sections with a primary antibody in serum, ascites fluid, orculture medium. The primary antibody is then localized by applica-tion of a fluorochrome-labeled secondary antibody made against theIgG of the species of the first antibody. This technique can also beused for simultaneous localization of more than one antigen. Withthis approach, the section is incubated with a mixture of primaryantibodies made in different animal species. Each species-specificsecondary antibody is labeled with a different fluorochrome. Thesection is examined sequentially with fluorescence filter sets spe-cific for the different fluorochromes and photographed as multipleexposures.

72 Milam
The most widely used fluorochromes are fluorescein isothio-cyanate (FITC, yellow green), tetramethyl rhodamine (TRITC, red),and 7-amino-4-methylcoumarin-3-acetic acid (AMCA, blue), avail-able from DAKO, Molecular Probes, ICN, and Chemicon. Alter-nate fluorochromes are BODIPY FL (FITC substitute), Texas Red(rhodamine substitute), BODIPY TMR (rhodamine substitute),BODIPY TR (Texas Red substitute) Cascade blue, and Oregongreen (FITC substitute) from Molecular Probes. Recently devel-oped, nonbleaching fluorochromes include indocarbocyanine CY-2(FITC substitute) and indocarbocyanine Cy-3 (rhodamine substi-tute), from Jackson ImmunoResearch and Chemicon; and Alexa 488(FITC substitute) and Alexa 568 (rhodamine substitute) fromMolecular Probes. A new indodicarbocyanine dye, Cy5, (JacksonImmunoResearch) cannot be used with a conventional epifluores-cence microscope, but can be visualized with a confocal microscopeequipped with a krypton/argon or helium/neon laser for excitationand a far-red detector (e.g., a CCD).
Cell nuclei in sections can be stained with DNA-specific fluores-cent dyes, 4',6'-diamidino-2-phenylindole (DAPI, blue) or propidiumiodide (PI, red) added to the secondary antibody mixture, both fromMolecular Probes.
Retinas can be prepared for immunofluorescence as flat mounts,or sectioned with a cryostat (8–14 µm sections) or vibratome(approx 100 µm sections). In general, cryostat sections are exam-ined and photographed with an epifluorescence microscope, andretinal flat mounts and thick vibratome sections are suitable for con-focal microscopy (1,2).
As an example, Fig. 1 demonstrates cryosections of normalhuman retina that have been processed for immunofluorescence.The left panel shows a normal human retina after application ofserum from a normal human subject, followed by treatment withantihuman IgG labeled with FITC. The bright dots in the retina areautofluorescent lipofuscin granules in the retinal pigment epithe-lium and photoreceptors. The right panel shows a human retinasection after treatment with serum from a patient with MAR (mela-noma-associated retinopathy). In addition to autofluorescent lipo-

Immunocytochemical Studies 73
fuscin granules as seen in the left panel, a population of bipolarcells is specifically labeled with the MAR serum. The clinical fea-tures of MAR and labeling of bipolar cells by autoantibodies fromMAR have been reported (3).
1.2. Avidin-Biotin Methods
A second useful technique is based on the same principle, butinstead of using a fluorochrome, employs a secondary antibodylabeled with biotin, followed by application of avidin, then of biotinlabeled with horseradish peroxidase (HRP). This technique, includ-
Fig. 1. Illustration of immunofluorescence technique. Human retinacryosections processed for immunofluorescence using serum from nor-mal human subject on left, and serum from patient with melanoma-asso-ciated retinopathy (MAR) on right. Note specific labeling of bipolar cells(arrows) in the inner nuclear layer (INL) with MAR serum. White bandsat top of panels correspond to autofluorescent lipofuscin granules in theretinal pigment epithelium (R). G, autofluorescent ganglion cells; P, pho-toreceptor layer. Original magnification, X68. Reprinted from (3) withpermission of the Association for Research in Vision and Ophthalmology.

74 Milam
ing a number of variations, is usually referred to as the ABC method(avidin-biotin complex) and complete kits for processing tissues bythis method are available from Vector, DAKO, ICN, and Zymed.The peroxidase is localized by enzyme cytochemistry using hydro-gen peroxide substrate and the chromogen, diaminobenzidine(DAB). This technique can be used on cryosections or retinal wholemounts, and the DAB reaction produces a permanent, dark brownreaction product. The reaction product is also electron dense, mak-ing it suitable for electron microscopic (EM) immunocytochemis-try. Alternate peroxidase substrates can be employed to producereaction products of different colors, including red, blue, violet, andbluish/gray (Vector, Zymed). Other enzyme markers available inkits are alkaline phosphatase and glucose oxidase.
In addition to manufacturer’s instructions in ABC kits, more com-plete discussion of this technique is available in ref. 4.
Fig. 2. Illustration of ABC technique. The outer layers of rabbit retinaswere incubated over wells containing PBS with or without a biotinylatedprotein tracer, followed by avidin-HRP to demonstration diffusion of thetracer. Left panel shows retina incubated over PBS. Middle panel showsretina incubated over biotinylated glyceraldehyde-P dehydrogenase,which is retained in the subretinal space by the external limiting mem-brane (*). Right panel shows retina incubated over biotinylated-HRP,which freely penetrates the external limiting membrane and diffusesaround the photoreceptors (P). O, outer segments. Original magnifica-tion, X480. Reprinted from (5) with permission of the Association forResearch in Vision and Ophthalmology.

Immunocytochemical Studies 75
An example of application of the ABC technique to retina is givenin Fig. 2, taken from a previous publication (5). The two panelsshow rabbit retina after incubation with various proteins labeledwith biotin. The biotin was detected by application of avidin-per-oxidase, which was then reacted with hydrogen peroxide and DABto produce a dark brown reaction product. The left panel showsretina incubated over phosphate-buffered saline (PBS), which pro-duced no reaction product. The middle panel shows retina incu-bated over biotinylated glyceraldehyde-P dehydrogenase, whichdiffused through the interphotoreceptor space, but stopped abruptlyat the external limiting membrane. The right panel shows retinaexposed to HRP, which penetrated the external limiting membraneand diffused throughout the extracellular spaces of the neurosen-sory retina.
1.3. Electron Microscopic Methods
Two general methods are available for EM immunocytochemis-try, preembedment and postembedment labeling. For preembedmentlabeling, tissues are processed by the ABC technique using the elec-tron dense chromogen, DAB. The tissues are then postfixed inosmium tetroxide or gold chloride (3), embedded in epoxy resin,and conventional ultrathin sections are prepared for EM.
Postembedment labeling involves embedding tissues in a resinsuch as LR White or LR Gold (Ted Pella), with subsequent process-ing of ultrathin sections by the immunogold method. These resinsare blends of hydrophilic and acrylic monomers that rapidly pen-etrate the tissue and once polymerized, are permeated by most anti-bodies. More complete discussions of the immunogold techniqueare available, see refs. 6 and 7.
Secondary antibodies adsorbed with gold particles are availablecommercially (Jackson ImmunoResearch, ICN, Ted Pella, Vector).Double labeling can be performed on ultrathin sections using pri-mary antibodies made in two species, followed by two species-spe-cific secondary antibodies labeled with two sizes of gold particles.In general, more intense labeling is observed with smaller gold

76 Milam
Fig. 3. Illustration of immunogold technique viewed by darkfieldmicroscopy. Normal human retina (top panel) and human retina withretinitis pigmentosa (RP) (middle and bottom panels) were labeled with
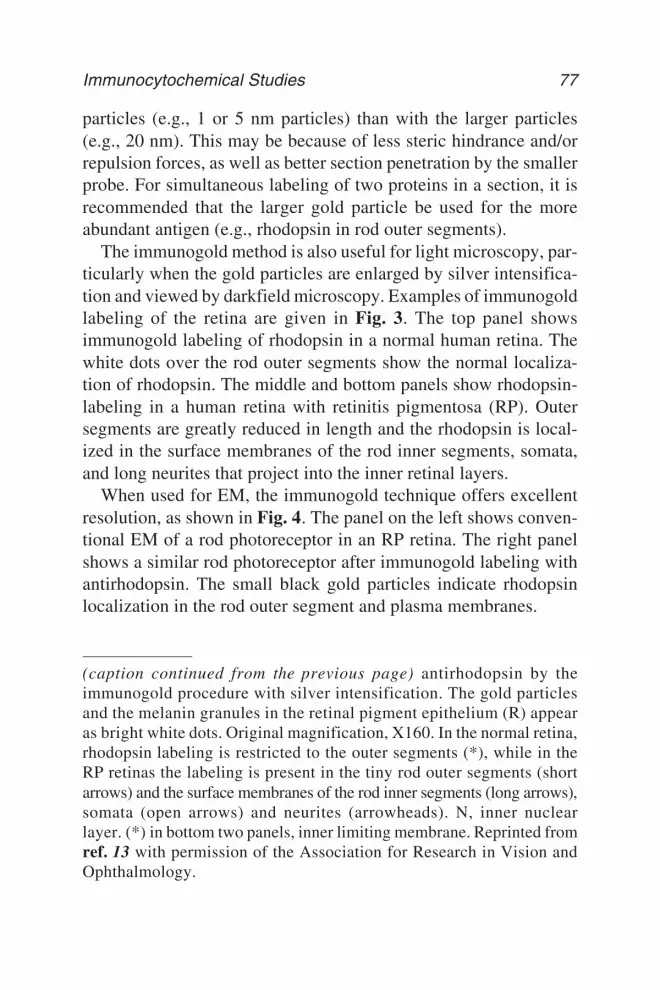
Immunocytochemical Studies 77
particles (e.g., 1 or 5 nm particles) than with the larger particles(e.g., 20 nm). This may be because of less steric hindrance and/orrepulsion forces, as well as better section penetration by the smallerprobe. For simultaneous labeling of two proteins in a section, it isrecommended that the larger gold particle be used for the moreabundant antigen (e.g., rhodopsin in rod outer segments).
The immunogold method is also useful for light microscopy, par-ticularly when the gold particles are enlarged by silver intensifica-tion and viewed by darkfield microscopy. Examples of immunogoldlabeling of the retina are given in Fig. 3. The top panel showsimmunogold labeling of rhodopsin in a normal human retina. Thewhite dots over the rod outer segments show the normal localiza-tion of rhodopsin. The middle and bottom panels show rhodopsin-labeling in a human retina with retinitis pigmentosa (RP). Outersegments are greatly reduced in length and the rhodopsin is local-ized in the surface membranes of the rod inner segments, somata,and long neurites that project into the inner retinal layers.
When used for EM, the immunogold technique offers excellentresolution, as shown in Fig. 4. The panel on the left shows conven-tional EM of a rod photoreceptor in an RP retina. The right panelshows a similar rod photoreceptor after immunogold labeling withantirhodopsin. The small black gold particles indicate rhodopsinlocalization in the rod outer segment and plasma membranes.
(caption continued from the previous page) antirhodopsin by theimmunogold procedure with silver intensification. The gold particlesand the melanin granules in the retinal pigment epithelium (R) appearas bright white dots. Original magnification, X160. In the normal retina,rhodopsin labeling is restricted to the outer segments (*), while in theRP retinas the labeling is present in the tiny rod outer segments (shortarrows) and the surface membranes of the rod inner segments (long arrows),somata (open arrows) and neurites (arrowheads). N, inner nuclearlayer. (*) in bottom two panels, inner limiting membrane. Reprinted fromref. 13 with permission of the Association for Research in Vision andOphthalmology.

78 Milam
2. Materials
2.1. Solutions for Immunofluorescence
1. Phosphate buffer (0.13 M): 3000 mL of distilled H2O (dH2O), 18 gmof NaOH, 75 gm of NaH2PO4·H2O, add H2O to 4000 mL, adjust pHto 7.3–7.4, store at 4°C.
2. Paraformaldehyde fixative (also available from Polysciences): dis-solve 4.5 gm of NaOH pellets in 600 mL of dH2O, dissolve 40 gm ofparaformaldehyde with heating, add 18.75 gm of NaH2PO4·H2O, adddH2O to 1000 mL, adjust pH to 7.3–7.4 and filter.
Fig. 4. Illustration of immunogold technique viewed by transmissionelectron microscopy. Both panels illustrate rod photoreceptors in a hu-man RP retina. Left panel illustrates rod (curved arrow) in retinaembedded in epoxy retina and stained with uranyl acetate and lead cit-rate. C, cone inner segment. Right panel illustrates similar rod processedin LR White and labeled with anti-rhodopsin, followed by secondaryantibody complexed to gold particles. Note black dots indicating local-ization of rhodopsin in the outer segment (straight arrow) and surfacemembrane of adjacent rods (open arrows).

Immunocytochemical Studies 79
3. Holding buffer for storing paraformaldehyde-fixed tissue: 80 gmof D-glucose (dextrose), 0.5 gm of sodium azide, 1000 mL of phos-phate buffer, 4 mL of 5% CaCl2 in dH2O, adjust pH to 7.4 andfilter.
4. PBS: 87.6 gm of NaCl, 4.3 gm of NaH2PO4·H2O, 9.7 gm of Na2HPO4,add dH2O to 1000 mL.
5. Sodium borohydride (NaBH4) treatment of glutaraldehyde-fixed tis-sue (adapted from refs. 8 and 9)a. Rinse buffer: 100 mL of 0.13 M phosphate buffer (pH 7.3), 4 gm
of sucrose.b. Sodium borohydride solution: 100 mL of rinse buffer, 1 gm of
sodium borohydride, prepare immediately before use.6. Subbed slides for cryostat sections: dissolve 6 gm of gelatin in
500 mL of dH2O with heat, add 0.5 gm of chromium potassium sul-fate, filter, dip glass slides while solution is still warm, cover, andair-dry overnight.
7. Blocking buffer for cryostat sections: 1 mL of normal horse serum,1 gm of bovine serum albumin (BSA), 0.5 to 3 mL of 10% TritonX-100, PBS to volume of 100 mL, aliquot, and store frozen.
8. Buffer for vibratome sections: 100 mL of PBS, 0.5 gm of BSA, 2 mLof 10% Triton X-100, 0.05 gm of sodium azide.
9. Blocking buffer for vibratome sections: 100 mL of buffer forvibratome sections, 2 mL of normal goat serum.
10. Coverslip mounting media: Compounds (1,4 diazabicyclo [2,2,2]-octane [DABCO] or N-propyl-gallate) are added to the mountingmedium to minimize photobleaching of fluorescent probes.a. Glycerol with DABCO: 90 mL of glycerol, 10 mL of PBS, 2 gm
of DABCO.b. Glycerol with n-propyl gallate: 6 gm of n-propyl gallate, 100 mL
of absolute glycerol.c. Kits containing DABCO in 50% glycerol and buffered wash solu-
tion (Molecular Probes): i. SlowFade—reduces FITC fading but decreases FITC
intensity and quenches the fluorescence of AMCA andCascade blue.
ii. SlowFade-Light—slows FITC fading without quenchingFITC; minimally quenches fluorescence of AMCA and Cas-cade Blue.

80 Milam
2.2. Solutions for ABC Procedure
1. Citrate buffer (pH 3.5) for antigen retrieval in paraffin sections: 0.18 Mcitric acid, 0.129 M Na2HPO4.
2.3. Solutions for Immunogold Procedure
1. Blocking buffer for light microscopy: 100 mL of PBS, 0.3 mL of10% Triton X-100, 1 mL of horse serum, 1 gm of BSA.
2. Tris-buffered saline (TBS, 20 mM): 900 mL of dH2O, 9 gm of NaCl,2.42 gm of Tris base (tris hydroxymethylaminomethane), adjust pHto 8.2 with concentrated HCl.
3. BSA-TBS: 90 mL of TBS, 0.1 gm of BSA, 0.5 mL of 10% TritonX-100, add dH2O to 100 mL, filter through 0.2 µm membrane filterimmediately before use to remove microorganisms and particulates.
4. BSA-TBS-NaCl: 50 mL of BSA-TBS, 1.46 gm of NaCl.5. Blocking buffer: 90 mL of TBS, 1 gm of BSA, 1 mL of normal horse
serum (or serum from animal used to produce the colloidal gold-linked antibody), dilute to 100 mL with dH2O.
3. Methods
3.1. Immunofluorescence Processingof Cryo- and Vibratome Sections3.1.1. Preparation of Cryosections
1. Fix retinal samples for 6 h or longer in 4% paraformaldehyde in0.13 M phosphate buffer, pH 7.3.
2. For glutaraldehyde-fixed tissue, use sodium borohydride treatment.3. Soak tissue overnight in 30% sucrose in phosphate buffer at 4°C.4. Freeze tissue in OCT (Polysciences) on a cryostat chuck.5. Section at 8–14-µm thickness.6. Mount sections on subbed glass slides.7. Air-dry overnight at RT. Slides can be stored at –80°C.
3.1.2. Sodium Borohydride (NaBH4) Treatmentto Restore Antigenicity to Glutaraldehyde-Fixed Tissues (seerefs. 8 and 9)
1. Wash small tissue samples for 1 h in rinse buffer.2. Incubate 30 min–1 h in freshly prepared 1% NaBH4 in rinse buffer.
Incubate on shaker table in uncapped vials.

Immunocytochemical Studies 81
3. Wash 2–5 h on shaker table in 4–5 changes of rinse buffer, untilbubbling ceases.
4. Process further for immunocytochemistry.
3.1.3. Immunofluorescence Processing of Cryosections
1. Unfixed tissue sections can be stabilized in chilled acetone for 5 min.2. Mount plastic rings (Polysciences) around the sections with finger-
nail polish to form incubation chambers. The rings are easilyremoved with a single-edge razor blade before cover slips areapplied. Alternatively, an incubation well can be made using a PAPpen (Polysciences). Perform all incubations in a moisture chamber.
3. Fill well with blocking buffer for 30 min at RT.4. Do not rinse after this step.5. Fill well with primary antibody diluted in PBS with 0.3% Triton X-100,
overnight at 4°C.6. Rinse three times for 1 1/2 h with PBS.7. Fill well with secondary antibody diluted 1:50 in PBS with 0.3% Tri-
ton X-100, 30–60 min at RT. This and subsequent steps are per-formed under dim red illumination.
8. Rinse three times for 1 1/2 h with PBS.9. Mount coverslips in glycerol containing antibleaching compound
(see Subheading 2.1.10.).
3.1.4. Controls for Immunocytochemistry
Process sections in the same manner with:
1. Omission of primary antibody, or2. Adsorption of the primary antibody with an excess (generally
25–50 µg/mL) of the immunizing antigen, or3. Substitution of non-immune serum from the same species as the
primary antibody.
3.1.5. Preparation of Vibratome Sections (see refs. 1 and 2)
1. Rinse paraformaldehyde fixed retinal samples in PBS.2. Embed in warm (just below 40°C) 5% agarose (type XI, Sigma).3. Harden agarose at 4°C and cut into blocks.

82 Milam
4. Mount onto microtome supports with cyanoacrylate glue (Krazy Glue).5. Section at 100 µm with a vibrating microtome (Leica, Allendale, NJ).6. Collect sections in chilled PBS.
3.1.6. Processing Vibratome Sectionsfor Immunofluorescence
1. Treat sections free floating in the various solutions and transfer witha fine brush.
2. To reduce nonspecific labeling, incubate sections for 4 h at RT inblocking buffer with 2% normal goat serum.
3. Incubate sections with gentle agitation in primary antibody in block-ing buffer solution for 14 h at 4°C.
4. Rinse sections in buffer, 3 × 15 min.5. Incubate sections with gentle agitation in fluorochrome-labeled sec-
ondary antibody in blocking buffer solution for 14 h at 4°C.6. A nuclear stain can be added to the secondary antibody; use DAPI at
1 µg/mL or PI at 2 µg/mL (both from Molecular Probes).7. Rinse sections three times for 3 h in buffer.8. Mount cover slips with glycerol containing DABCO or n-propyl gallate.9. Rim cover slips with nail polish.
3.2. ABC Technique
The ABC technique, which employs avidin-biotin-coupled horse-radish peroxidase, can be used for labeling of retinal flat-mountsand sections. The ABC method is best performed using a commer-cial kit (see above). The manufacturer’s instructions are quite com-plete. It is recommended that the DAB solution be treated with dilutebleach before disposal.
3.2.1. Retinal Flat-Mounts (see ref. 10)
1. Fix retina for 6 h or longer in 4% paraformaldehyde.2. Treat free-floating samples with a mixture of methanol, dimethyl-
sulfoxide, and 30% hydrogen peroxide (4:1:1, v/v) for 4 h at RT.3. Rehydrate samples through a methanol series.4. Block samples for 1 h at RT with 2% instant skim milk powder in
PBS with 0.3% Triton X-100.

Immunocytochemical Studies 83
5. Incubate samples overnight at 4°C in primary antibody in PBS with0.3% Triton X-100.
6. Control samples are incubated with nonimmune serum from the samespecies.
7. Process samples with an ABC kit (Vector) according to the manu-facturer’s instructions.
3.2.2. Antigen Retrieval
There are a number of techniques in the literature for antigenretrieval, many of which involve microwave treatment in buffer atlow pH (11). One version of this technique has been used success-fully on paraffin sections of human retina (12,13). Cryosections aregenerally too delicate for this procedure, and will fragment anddetach from the glass slides.
1. Embed paraformaldehyde-fixed retina samples in paraffin and section.2. Mount sections on Fisher “Probe-On Plus Slides” and dry thoroughly.3. Deparaffinize sections and rehydrate them through an ethanol series.4. Heat sections in citrate buffer on a hot plate at 90°C for 10–30 min.
Microwave treatment of the sections in citrate buffer is also effectivein antigen retrieval. Replenish buffer if boiling is very vigorous.
5. Process with ABC kit according to manufacturer’s instructions (seeSubheading 1.2.).
3.3. Electron Microscopic Immunocytochemistry
For electron microscopic (EM) localization of antigens, the retinacan be labeled before or after the tissue is embedded in EM resin.
3.3.1. Preembedment Labeling
1. Process free-floating pieces of tissue, cryo- or vibratome sections asabove by the ABC technique using DAB as the chromogen.
2. Postfix tissue in osmium tetroxide or gold chloride (7), embed in anepoxy resin, and cut ultrathin sections for EM.
3. Examine and photograph sections unstained or lightly contrastedwith lead citrate. Advantages of this technique are the good sensitiv-ity of the ABC technique and use of conventional EM resin. In addi-

84 Milam
tion, semithin (1 µm) sections can be used for light microscopy. Thedisadvantage is that the tissue preservation is sometimes suboptimal,and EM contrast can be a problem with nonstained sections.
3.3.2. Postembedment Labeling
1. Fix tissue with paraformaldehyde.2. Treat tissue with sodium borohydride if the fixative contained glut-
araldehyde.3. Embed tissue without postosmication in LR White or LR Gold resin
according to instructions of manufacturer (Polysciences).4. Cure LR White cold or with heat, and cure LR Gold with UV light in
the cold.5. Cut semithin and ultrathin sections and process them by the immuno-
gold technique according to the manufacturer’s recommendations(Ted Pella).
3.3.2.1. IMMUNOGOLD/SILVER INTENSIFICATION METHOD
FOR LIGHT MICROSCOPY
1. Mount semithin (1 µm) sections of LR White-embedded retina indrops of syringe-filtered dH2O on clean glass slides and dry for sev-eral hours at 80–100°C.
2. Mount plastic rings around the sections with nail polish.3. Treat sections with blocking buffer for 1 h at RT. Perform all incuba-
tions in a moisture chamber.4 Dilute primary antibody in PBS with 0.3% Triton X-100.5. Incubate sections for 2–3 h at RT, or overnight at 4°C.6. Rinse sections three times for 30 min in PBS.7. Dilute secondary antibody 1:100 in BSA-TBS with NaCl. The rec-
ommended secondary antibody is a 1- or 5-nm gold conjugate forlight microscopy (Ted Pella)
8. Incubate in secondary 1 h at RT.9. Rinse sections three times for 30 min in BSA-TBS.
10. Wash sections five times for 25 min in dH2O. At this point the slidescan be stored dry at 4°C for several weeks.
11. Follow directions in “Silver Enhancing Kit—Light Microscopy”(Ted Pella) Use a 1-mL syringe with a 4-mm 0.22-µm syringe filterto apply the solution to the sections.

Immunocytochemical Studies 85
12. Monitoring: At 20°C a typical development time is 10–15 min. Viewsections with a microscope to monitor the development. Stop thereaction when the staining is complete and the background is stillminimal.
13. Stop the reaction by washing the sections in several changes of tapH2O for 1–2 min.
14. Air-dry sections and mount coverslips with Permount (Fisher).15. View sections by brightfield or darkfield microscopy (Fig. 3).
If counterstaining is desired, apply Richardson’s mixture of methyl-ene blue/azure II to the sections for several minutes at RT.
3.2.2.2. LR-WHITE IMMUNOGOLD LABELING FOR ELECTRON MICROSCOPY
1. Embed paraformaldehyde-fixed tissue in LR-White according to themanufacturer’s recommendations. If the tissue has been fixed in glu-taraldehyde, treat the tissue with sodium borohydride. Do not postfixtissue in osmium tetroxide.
2. Place the tissue and fresh LR-White in Beem (Ted Pella) or gelatincapsules and cap them tightly.
3. Polymerize blocks in vacuum oven flushed with pure N2 gas to removeall oxygen. Polymerize at 50°C for 24–48 h. Do not add paper labelsto blocks, as trapped oxygen will interfere with polymerization.
4. Cut ultrathin sections and mount on parlodion/carbon coated nickelor gold grids. Perform all incubations on drops of reagent placed onclean sheets of dental wax.
5. Incubate grids on drops of blocking buffer for 1 h at RT. Do not filterthe blocking buffer or rinse after this step.
6. Place grids on drops of primary antibody in BSA-TBS without NaClovernight at 4°C in a moisture chamber.
7. Rinse two times for 10 min in BSA-TBS.8. Rinse two times for 20 min in BSA-TBS-NaCl.9. Place grids on drops of secondary antibody conjugated to 10–40-nm
gold particles (Janssen AuroProbe, available from Ted Pella). Thesecondary antibody is diluted 1:100 (range of 1:10 to 1:200) in BSA-TBS-NaCl. The grids are incubated for 1–2 h at RT (see Note 3).
10. Rinse three times for 30 min in BSA-TBS-NaCl.11. Rinse three times for 15 min in dH2O.12. After drying, grids may be stained with uranyl acetate (10 min) and
lead citrate (6–8 min) for additional contrast.

86 Milam
4. Notes
1. False Positives: Areas in the retina that are rich in proteins (e.g., Müllercell end feet) often show nonspecific labeling with even nonimmuneprimary antibody. This emphasizes the importance of the control ofincubating the section in the same concentration of nonimmune pri-mary antibody to rule out this artifact.
To minimize nonspecific labeling, perform a dilution series withthe primary antibody. Use the most dilute concentration of primaryantibody that produces unequivocal labeling of the structure of interest.
2. False Negatives: It cannot be emphasized too strongly that immuno-cytochemistry is a method to detect a certain antigenic epitope in thetissue by means of an antibody that specifically recognizes thisepitope. Even though a negative result is obtained by immuno-labeling, this result per se does not demonstrate absence of the pro-tein. There are a number of reasons why negative results can beobtained:a. Fixation: The most common reason for a negative result is the
fixation step, which crosslinks proteins and may alter the epitoperecognized by the antibody. This problem may be solved by usinga weaker strength fixative for a shorter time, by omitting glut-araldehyde from the fixative, or by using the sodium borohydridemethod given above. Some proteins are extremely sensitive tofixation and can be demonstrated only in unfixed retina sections;an example is the MAR antigen, shown in Fig. 1 (3).
b. Detergent-sensitivity: Other antibodies are nonreactive with pro-teins exposed to detergents, such as the Triton X-100 commonlyused in immunocytochemistry protocols. In this case, the incuba-tions must be performed with no added detergent and incubationtimes increased because of loss of detergent-enhanced antibodypenetration.
c. Autofluorescence: The retina contains abundant lipid that mayproduce severe autofluorescence, particularly if the tissue hasbeen fixed with glutaraldehyde. The photoreceptor outer seg-ments are usually weakly autofluorescent, but this can usually bequenched in glutaraldehyde fixed tissue by the borohydride treat-ment given above.
Lipofuscin granules in the RPE are highly autofluorescent,making immunofluorescent labeling of RPE cytoplasmic proteinsvery difficult. This is a particular problem in retinas from older
Immunocytochemical Studies 87
humans and monkeys, where lipofuscin, an aging pigment, isabundant in the RPE.
d. Nonspecific labeling of outer segments: In addition to auto-fluorescence discussed above, outer segments are often “sticky”for proteins, including primary and secondary antibodies. It isessential that the proper controls be performed to rule out non-specific outer segment labeling, particularly if the antigen understudy is present in the outer segments. This problem is some-times encountered with the ABC and immunogold techniques forEM, again emphasizing the necessity of proper controls.
3. Resolution: Retinas processed for EM by the immunogold techniqueoffer very high resolution. However, the resolution is not that of thegold particle, but rather that of the diameter of the secondary anti-body, which is on the order of 10 nm (6). One way to improve theresolution is to use Fab fragments of the primary antibodies andcouple them directly to colloidal gold (6).
Acknowledgments
The author is grateful to the following colleagues for advice onimmunocytochemistry: J. C. Chang, R. N. Fariss, C. J. Guerin, J. Huang,I. Klock, Z.-Y. Li, D. E. Possin, and J. E. Smith. This work wassupported by the Foundation Fighting Blindness, Inc., Hunt Valley,MD; the Paul and Evanina Bell Mackall Foundation Trust, New York,NY; and by Research to Prevent Blindness, Inc., New York, NY.
References
1. Matsumoto, B. and Hale, I. L. (1993) Resolution of subcellular detailin thick tissue sections: immunohistochemical preparation and fluo-rescence confocal microscopy, in Cell Biological Applications ofConfocal Microscopy (Matsumoto, B., ed.), Academic, San Diego,CA, pp. 289–324.
2. Matsumoto, B. and Hale, I. L. (1993) Preparation of retinas for studyingphotoreceptors with confocal microscopy, in Methods in Neurosciences,vol. 15 (Hargrave, P. A., ed.), Academic, San Diego, CA, pp. 54–71.
3. Milam, A. H., Saari, J. C., Jacobson, S. G., et al. (1993) Autoantibod-ies against retinal bipolar cells in cutaneous melanoma-associatedretinopathy. Invest. Ophthalmol. Vis. Sci. 149, 574–576.

88 Milam
4. Bullock, G. R. and Petrusz, P. (1989) Techniques in Immuno-cytochemistry. Academic, San Diego, CA.
5. Bunt-Milam, A. H., Saari, J. C., Klock, I. B., and Garwin, G. G.(1985) Zonulae adherentes pore size in the external limiting mem-brane of the rabbit retina. Invest. Ophthalmol. Vis. Sci. 26, 1377–1380.
6. Verkleij, A. J. and Leunissen, J. L. M. (1989) Immuno-Gold Labelingin Cell Biology. CRC, Boca Raton, FL.
7. Polak, J. M. and Priestley, J. V. (1992) Electron Microscopic Immuno-cytochemistry, Oxford University Press, New York, NY.
8. Eldred, W. D., Zucker, C., Karten, H. J., and Yazulla, S. (1983) Com-parison of fixation and penetration enhancement techniques for usein ultrastructural immunocytochemistry. J. Histochem. Cytochem. 31,285–292.
9. Milam, A. H. and Jacobson, S. G. (1990) Photoreceptor rosettes withblue cone opsin immunoreactivity in retinitis pigmentosa. Ophthal-mology 97, 1620–1631.
10. Milam, A. H., Possin, D. E., Huang, J., et al. (1997) Characterizationof aldehyde dehydrogenase-positive amacrine cells restricted in dis-tribution to the dorsal retina. Vis. Neurosci. 14, 601–608.
11. Shi, S.-R., Imam, A., Young, L., et al. (1995) Antigen retrievalimmunohistochemistry under the influence of pH using monoclonalantibodies. J. Histochem. Cytochem. 43, 193–201.
12. Fariss, R. N., Apte, S. S., Luthert, P. J., et al. (1998) Abnormal accu-mulation of tissue inhibitor of metalloproteinases-3 in human eyeswith Sorsby’s fundus dystrophy and retinitis pigmentosa. Brit. J.Ophthalmol. 82, 1329–1334.
13. Milam, A. H., Li, Z.-Y., Cideciyan, A. V., and Jacobson, S. G. (1996)Clinicopathologic effects of the Q64ter rhodopsin mutation in retini-tis pigmentosa. Invest. Ophthalmol. Vis. Sci. 37, 753–765.

Antisense DNA Technology 89
89
From: Methods in Molecular Medicine, vol. 47: Vision Research ProtocolsEdited by: P. E. Rakoczy © Humana Press Inc., Totowa, NJ
5
Antisense DNA Technology
Piroska Elizabeth Rakoczy
1. Introduction
Antisense DNA technology is a method to inhibit or down-regulate the production of a target protein by using antisense DNAor RNA molecules. An antisense sequence is a DNA or RNA that isperfectly complementary to the target nucleotide sequence presentin the cell. There are two possible mechanisms for an antisenseeffect. The method that relies on targeting of the mRNA is calledthe antisense strategy. When the double-stranded DNA or genessituated in the nucleus are targeted, the approach is called theantigene strategy. Whereas the antisense strategy is well establishedwith several examples of in vitro and in vivo applications (1), theantigene approach is still in its infancy and our understanding ofthe mechanism involved is limited. The antisense strategy utilizesthe ability of a 100% complementary DNA or RNA sequence tointerlock or hybridize with the target mRNA thus inhibiting thetranslation of the target protein. This inhibition can be achievedeither by blocking the binding sites for the 40S ribosomal subunitand for other translation initiation signals. Alternatively, the forma-tion of a double-stranded DNA/RNA complex can render the RNAsusceptible to RNase H digestion (2). The antigene approach is basedon the binding of an antisense or sense DNA to the complimentary

90 Rakoczy
DNA sequence in the nucleus thus forming a triplex structure.This triplex prevents the transcription of the DNA coding sequenceinto mRNA (2).
The essence of antisense DNA technology is the uniqueness ofthe gene or targeted DNA sequence. The recognition that evenshort parts of the genetic code are unique resulted in the introduc-tion of short DNA molecules called oligodeoxynucleotides (ODN),for gene expression regulation. It has been proposed that even a15–17 basepair (bp) long fraction of the target DNA sequence couldspecifically inhibit the expression of the target gene (3).
There are several prerequisites that ODNs have to satisfy tobecome potentially suitable for the downregulation of transgeneexpression. ODNs have to be able to reach the target cells, whichmight be a problem, particularly in vivo. ODNs have to cross thecell membrane or, in the case of the antigene strategy, the mem-brane of the nucleus, and they have to be present in a biologicallyactive concentration within the cells for an extended period of time.In addition, ODNs have to resist the DNase activity or quick decom-position within the cells and have to be specific for the target gene.
Although ODNs are nontoxic, in diseases where systematicdelivery of large doses of ODNs is required, they may be the sourceof potential complications. These difficulties have limited the rangeof successful in vivo applications of ODN technology. In contrast,the eye is an excellent target for ODN delivery as it provides a con-fined space (4,5) separated by the retina-brain barrier from the restof the body. Depending on the target tissue within the eye, there areseveral delivery methods available. Superficial viral infection andcorneal cells can be targeted with high efficiency when using oint-ments covering the surface of the cornea. Following injection intothe anterior chamber, cells of the cornea, iris, and perhaps the lens,can be targeted. Intravitreal, subretinal injections can successfullytarget cells of the retina (4,5). In addition, choroidal injections canbe used to target cells residing in the choroid cells.
With the development of synthetic DNA technologies ODNs cannow be synthesized easily in bulk using DNA synthesizers. This chap-

Antisense DNA Technology 91
ter will focus on the utilization of the antisense approach for thedownregulation of gene expression in the eye.
2. Materials
2.1. Equipment
1. Computer with Internet access.2. Any tissue-culture incubator.3. Centrifuge suitable to sediment cells.4. Microtone (LKB 2088 Ultratone, LKB-Produkter, Sweden).5. Fluorescence Activated Cell Sorter (FACS), any type that can gener-
ate 488-nm absorption and 530-nm emission wavelength.6. Light microscope with X40 lens.7. Confocal microscope (MRC-1000, Bio-Rad, Hercules, CA).
2.2. Reagents
1. PBS: phosphate-buffered saline.2. DMEM: Dulbecco’s modified Eagle’s medium.3. FBS-Fetal bovine serum.4. Saline: 10% sodium chloride.5. FCS: Fetal calf serum.6. BSA/PBS: 0.1% bovine serum albumin (BSA) dissolved in PBS.7. Phosphate buffer: 0.1 M Na2HPO4/KH2PO4, pH 6.8.8. F12 medium.
3. Methods
3.1. Selection of Antisense ODN Sequence
3.1.1. Analysis of Target DNA Sequence
For the selection of antisense ODNs, it is necessary to downloadeither the genomic or cDNA sequence of the target DNA. Both thegenomic and cDNA sequences preferably should contain some ofthe 5' untranslated region. The genomic DNA sequence is usuallylong 10–20,000 bp. The cDNA sequence is derived from the mRNA,

92 Rakoczy
thus it only contains the exons. Exons are the parts of the genomicDNA that are translated into protein. Generally, the cDNA sequenceusually is not longer than 2000 bp. For antisense DNA selection,it is preferred to use the short cDNA sequence or the part of thegenomic DNA sequence that contains the first exon (Exon 1).
1. Access GenBank either through an Internet search engine by typingGenbank or through Email under the address [email protected].
2. Using GenBank Keyword Search, identify all files containing yourtarget gene.
3. If there are several sequences available, narrow the selection for thespecies, and then further to the organ from which your target cellsare derived.
4. If your target species’ genomic or cDNA sequence has not beenfound, perform sequence comparison between the published DNAsequences.
5. If the comparison demonstrates that the sequence in the 5' untranslatedregion and in Exon 1 is highly conserved (99% homology), then thepublished related sequences can be used for the selection of yourantisense ODNs. However, if there are significant differences, it isdesirable to identify the target sequence region from the target cells bysequencing the cDNA PCR product (see Chapter 1).
6. Print the selected or obtained genomic or cDNA sequence and iden-tify 19–25 bp long fragments.
7. Select fragments including the ATG initiation codon.8. Prefer fragments which have approx 50 % GC content.9. Make sure, that the ends are not complimentary (to avoid loop formation).
10. Try to select fragments where the distribution of A, G, C, and T unitsis even.
11. Having selected the fragments, perform Blast analysis on GenBankto see if there is any other gene, other than your target, with highhomology to the selected fragment (see Note 1).
3.1.2. Generation of Antisense DNA Sequencefrom Target DNA Sequence
Most DNA analysis programs are capable, or automatically, pro-duce the antisense DNA sequence. However, for those who areinterested in performing this easy procedure, the relevant steps aredescribed below.

Antisense DNA Technology 93
Each DNA sequence has a complimentary sequence that followsthe laws of the Watson and Crick model. It is based on the ability ofthe base components Thymidine (T) and Adenosine (A) to formhydroxyl bonds with Cytidine (C) and Guanosine (G), respectively.The two ends of the double-stranded DNA are called 5 prime (5')and 3 prime (3') ends. These two positions are differentiated fromthe rest of the DNA chain by the presence of unsubstituted hydroxilgroups.
1. Write down the selected DNA sequence clearly marking the 5' posi-tion 5'-AGCTGCATGGAACTTCACGCT.
2. Create the complementary sequence by deriving the complementarysequence one by one (T-A, A-T, G-C, C-G)
5'-AGCTGCATGGAACTTACGCT 3'3'-T….……………………………... 5'5'-AGCTGCATGGAACTTACGCT 3'3'-TCGACGTAG………….………. 5'5'-AGCTGCATGGAACTTACGCT 3'3'-TCGACGTACCTTGAATGCGA 5'
3. The antisense ODNs sequence is: 5'-AGCGTAAGTTCCATGCAGCT. It is this sequence that has to be given to the company orperson synthesizing the ODNs. DNA synthesis service providers usu-ally do not take responsibility for deriving the antisense sequence.
4. As the identification of an effective antisense ODN is an empiricalprocess in addition to the 10–20 antisense ODNs controls, usuallysense ODNs of the same regions, or containing scrambled sequencesand ODNs targeting genes other than the target gene have to be used.Generally, to make a successful selection 10–15 ODNs (antisenseand controls) have to be synthesized.
3.2. ODN Synthesis and Storage
3.2.1. Ordering ODNs
1. Always provide the sequence that you want to be synthesized. TheDNA sequence has to be written clearly (beware of clearly distin-guishing between G and C) with the 5' end marked. For example:5'-CAAACCAGCCGTTTCATCT.
2. The scale of the synthesis will depend on the intended use. If a goodsensitive screening method, such as enzyme-linked immunosorbent

94 Rakoczy
assay (ELISA), is available to test the efficacy of the oligonucleotidethan the smallest scale of 40 nmol might be sufficient for an initialselection process. If the efficacy test is a functional analysis or otherprotein analysis, the 1 µmolar scale is recommended (see Note 2).
3. For inhibition experiments, always use protected ODNs. Suppliersgenerally provide a list of protective groups of which phospho-thioates are the most frequently used. On the order form, clearly markif protected or unprotected ODN is requested.
4. There is usually a list of purification techniques that are offered onthe order form such as crude, desalted, or high-performance liquidchromatography (HPLC) purified. For initial antisense studies, nospecial purification are required. Crude products are suitable bothfor in vitro and in vivo experiments.
5. Usually, the cleavage of the ODN from the column and deprotectionof the cleaved ODN does not have to be requested, but if so, alwaysrequest cleaved and deprotected ODN.
6. Some suppliers provide ODNs with a variety of labeling. The use ofFITC labeling to track the uptake of ODNs has been widely testedand it is recommended to request at least one of the ODNs with FITClabeling for easy in vitro and in vivo uptake studies.
3.2.2. Storage of ODNs
1. ODNs are usually supplied in the form of a powder in which fromthey are stable and can be stored for up to 1 yr at –20°C.
2. The average molecular weight (MW) of a phosphothioate protectedODN is 349. Thus the MW of a 20 mer ODN is: 20 × 349 = 6980.The amount of the ODN in µg is provided by the supplier.
3. Dissolve ODN in water or PBS in the glass flask the ODN was deliv-ered to a final concentration of 5–10 mM using the average MWprovided above. It is desirable to make 10–20-µL aliquots and storedissolved ODNs at –70°C.
3.3. Delivery and Uptake of ODNs In Vitro and In Vivo
As the effect of ODNs will largely depend on their ability to enterinto the cells, it is essential to establish if the target cells are able totake up and retain ODNs at a concentration suitable to induce a bio-logical effect. In this section, an uptake study will be described byquantification of the uptake of an FITC-labeled ODN by retinal pig-ment epithelial (RPE) cells (see Note 3).

Antisense DNA Technology 95
3.3.1. In Vitro Uptake Studies
1. Subculture frozen RPE cells (American Tissue Culture Collection,Rockville, NY) in 40% Ham’s F12, 40% DMEM including 20% FBS,0.4% glucose, and 50 µg/mL gentamicin at 37°C in 5% CO2.
2. From confluent cultures seed cells at a concentration of at 105 cells/wellinto a 24-well plate and incubate them in the medium describedabove with 10 µM FITC labeled ODN added.
3. After 3 d of incubation, discard the medium and harvest the cellsusing trypsin at 0.025%. Sediment the cells with centrifugation(1000g). Resuspend pellets in 5 mL incomplete PBS and filter themthrough a nylon sieve mesh (44 µm). Centrifuged the filtrate andresuspended pellet in 300 µL balanced salt solution (saline).
4. Use a FACS to analyze the fluorescent signal at 488 nm absorption and530 nm emission wavelength by counting 105 cells from each of the wells.
5. Following FACS analysis calculate the average intensity of the fluo-rescent signal by averaging the mean fluorescence intensity (Table 1).It is important to note the significant (100X increase) in fluorescentsignal intensity between RPE cells with or without FITC-ODN.
3.3.2. In Vivo Uptake Studies
This example is given to demonstrate the uptake of ODNs in dif-ferent retinal cells following intravitreal injection of FITC-labeledODN into rat eyes. All procedures involving animals conformed tothe Declaration of Helsinki.
1. Anesthetize minimum 8-wk-old nonpigmented rats (by this age,the eyes have reached their adult size and the animals are lesssusceptible to complications following anesthesia) by intra-peritonial injection of sodium pentobarbital (50 mg/kg bodyweight) and inject into the vitreous of one eye with 2 µL ofsaline and the other with 2 µL of ODN solution containing 66 µg
Table 1Cellular Uptake of ODNs In Vitro
RPE cells ODNs FACS readingsa
RPE no 4.20 ± 0.38RPE FITC-ODN 453.50 ± 27.1
aAverage of three measurements.

96 Rakoczy
(10 nmol) FITC-ODN. Allow animals to recover from anesthesia.Following their recovery, the animals were housed in normal con-ditions until euthanasia.
2. Enucleated eyes at 2 h 3, 7, and 14 d postinjection. Enucleated eyes weresnap frozen in OCT and sectioned by a cryostat into 10-µm thick sections.
3. The sections were either stored frozen at –70°C or analyzed by aconfocal microscope using a blue light at a 488 nm wavelength.For the detection of fluorescence, a 522 nm wavelength filter wasused. This technique enables the easy visualization of the location ofthe fluorescent signal derived from the FITC-labeled ODN. The sig-nal derived from the FITC-labeled ODN has to be significantly stron-ger than any background, thus it is easily distinguishable (Fig. 1).
3.4. Efficacy Studies3.4.1. Monitoring of Oligonucleotide-Mediated Downregulationof a Target Protein Expression by Immunocytochemistry
Example: Inhibition of Cathepsin S (CatS) expression in retinalpigment epithelial cells by an antisense oligonucleotide.
Fig. 1. Monitoring cellular uptake of ODNs in vivo following intra-vitreal injection of FITC labeled ODN at (A) 2 h, (B) 3 d, (C) 7 d, and (D)28 d postinjection using a confocal microscope.

Antisense DNA Technology 97
1. Seed 105 RPE cells onto cover slips.2. Prepare tissue-culture medium (as described earlier) containing
either the antisense oligonucleotide (AS), scrambled oligonucleotide(C) at concentrations ranging from 1 nM to 1 µM. For example, 1 nM,10 nM, 100 nM, and 1 µM.
3. Incubate cells at 36°C for 3 d, replenishing the oligonucleotides daily.4. Remove medium, gently rinse cells.5. Fix samples in methanol for 20 s.6. Pretreat cells with 10% normal goat serum, 0.1% BSA/PBS for
30 min at room temperature.7. Add CatS antibody (6) diluted 1:500 with 0.1% BSA/PBS and incubate
sections overnight at 4°C.8. Wash sections three times for 5 min with 0.1% PBS.9. Add secondary antibody (biotinylated goat antirabbit) diluted in
1:200 in 0.1% BSA/PBS and incubate sections for 1 h.10. Repeat washing, as above.11. Add chromophore of your choice and visualize signal according to
the manufacturer’s protocol.12. Score the signal by two independent observers from 1–3 or quantify
it by any other means. A significant decrease in signal intensity isexpected at least at one antisense ODN concentration as demon-strated in Fig. 2 (see Note 4).
3.4.2. Monitoring Functional Changes In Vitro
Example: Accumulation of autofluorescent debris in rod outersegment challenged retinal pigment cells with or without the pres-ence of a CatS-specific antisense oligonucleotide.
CatS is a lysosomal enzyme present in the RPE cells. It hasbeen demonstrated previously, that inhibition of CatS activityby leupeptin leads to the accumulation of an autofluorescentdebris in the RPE cells in vivo (7). In this assay, autofluorescentdebris accumulation in ROS challenged cultured RPE cells wasused to monitor the efficacy of antisense ODN-mediated inhi-bition of CatS, by monitoring a relevant biological function(Fig. 3).
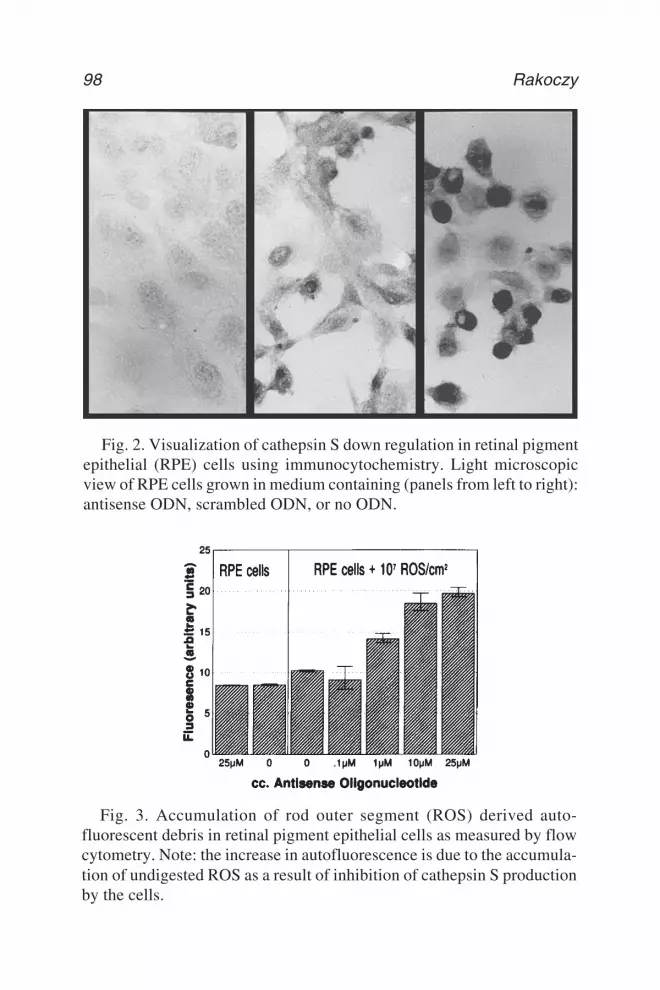
98 Rakoczy
Fig. 3. Accumulation of rod outer segment (ROS) derived auto-fluorescent debris in retinal pigment epithelial cells as measured by flowcytometry. Note: the increase in autofluorescence is due to the accumula-tion of undigested ROS as a result of inhibition of cathepsin S productionby the cells.
Fig. 2. Visualization of cathepsin S down regulation in retinal pigmentepithelial (RPE) cells using immunocytochemistry. Light microscopicview of RPE cells grown in medium containing (panels from left to right):antisense ODN, scrambled ODN, or no ODN.

Antisense DNA Technology 99
3.4.2.1. CONCENTRATION DEPENDENCE
1. Sterilize bovine eyes in Betadine.2. Dissect eyes, remove anterior segment and vitreous, and discard.3. Sever optic nerve head.4. Remove neural retina (neural retina can be stored at –70°C, store
25 retina/tube).5. Add 15 mL of a 0.73 M sucrose solution in 0.1 M phosphate buffer
into tube containing 25 retina and gently agitate tube.6. Filter mixture through a 100-µm nylon mesh.7. Prepare discontinuous sucrose gradient with successive layers of
1.2 M, 1.0 M, and 0.8 M sucrose in 0.1 M phosphate buffer.8. Layer retinal suspension on top of the gradient.9. Centrifuge for 1 h at 60,000g.
10. Harvest orange band and pellet ROS centrifuging mixture at 27,000g.11. Measure ROS concentration on an electronic particle counter.12. Store ROS in liquid nitrogen.13. Seed 2 × 10⁵ RPE cells into a 24-well plate and incubated at 37°C
until they became 80% confluent.14. Challenge RPE cultures (triplicates) 107 ROS/mL medium contain-
ing 0, 0.1, 1, 10, or 25 nM antisense ODN.15. Following 2 d of incubation remove the medium and harvest the cells
in 5 mL (DMEM, F12 +10% FCS).16. Centrifuge suspensions at 1000g for 3 min.17. Resuspended pellets in 5 mL PBS.18. Filter suspensions through a nylon mesh (44 µm).19. Centrifuge filtrates at 1000g for 3 min.20. Resuspend pellet in 300 µL of isoton.21. Measure autofluorescent debris with a fluorophotometric flow
cytometer (FACS) at 488-nm absorption and 530-nm emissioncounting 105 cells. Always compare data from the same batch of cellsmeasured by FACS on the same day.
22. Plot data.
3.4.2.2. SPECIFICITY (FIG. 4)
1. Set up specificity experiments as described above using control andantisense ODNs at a concentration that was sufficient to achieve themaximum biological activity (10 nM).

100 Rakoczy
2. Incubate cell cultures for 2 to 7 d, change the medium and replenishthe ODNs every second day.
3. Harvest cells and measure autofluorescent debris as described above.4. Plot data.
3.4.3. Monitoring Functional Changes In Vivo
3.4.3.1. CONCENTRATION DEPENDENCE
All procedures involving animals conformed to the Declarationof Helsinki.
1. Female 60 d old Long Evans, RCS-rdy+ nonpigmented (normal) orany type of nonpigmented rats can be used.
2. Anesthetize animals by intraperitoneal injection of sodium pento-barbital (50 mg/kg body weight).
3. Perform intravitreal injection using 2–3 µL saline containing 6.6, 66,or 132 µg of antisense oligonucleotide.
4. Sacrifice animals at 1 wk postinjection by an overdose of sodiumpentobarbital.
5. Following enucleation, immerse whole eyes in 2.5% glutaraldehydeand 1% paraformaldehyde in 0.125 M cacodylate buffer pH 7.35.
6. Remove the cornea and the lens and trim the eye cup for orientationpurposes.
7. Fix tissue xed overnight at 4°C in 1% osmium tetroxid.
Fig. 4. Specificity of antisense ODN as measured by the accumulation ofROS derived autofluorescent debris accumulation in retinal pigment epi-thelial cells. Empty columns: scrambled ODN. Full columns: antisense ODN.

Antisense DNA Technology 101
Fig. 5. Accumulation of undigested phagosomes in the retinal pigmentepithelial cell layer of a rat retina following intravitreal injection of ananitsense ODM, at 7 d postinjection.
8. Following ethanol dehydration, embed the tissue in epoxy resin.9. Cut sections of 1 µm using and LKB 2088 ultratome (LKB-Produkter,
Sweden).10. The accumulation of undigested phagosomes can be counted at ×40
magnification by light microscopy.11. From each eye, five sets of counts were in 250 µm in length of the
RPE layer and standard deviations were calculated (Figs. 5 and 6).
3.4.3.2. SPECIFICITY
1. Rats were anesthetized injected with saline, S1 and S2, andantisense oligonucleotide and analyzed as described above and theaccumulation of undigested phagosomes were counted and com-pared to uninjected control animals (Fig. 7).
4. Notes
1. Although there are several theories on how to select antisense ODNsthe selection process remains very much an empirical process.

102 Rakoczy
Fig. 7. Specificity of an antisense ODN following intravitreal injection ofidentical amounts of ODNs as measured by the accumulation of undigestedphagosomes. S1 and S2 are scrambled ODNs; antisense is an antisense ODN.
Fig. 6. Concentration dependence of phagosome accumulation in the rat reti-nal pigment epithelial layer following intravitreal injection of antisense ODN.

Antisense DNA Technology 103
Analysis of antisense ODNs, which were biologically effective indownregulating a target sequence, suggests that the most success wasachieved when the antisense ODNs sequence was derived from theExon 1. In addition, the majority of successful antisense ODNs gen-erally contain the ATG initiation codon, which is responsible for thestart of protein synthesis.
Generally, ODNs are highly specific and can detect even 1 or 2 bp dif-ferences. However, specificity depends on the conditions (8). Thus,for antisense purposes, more than 85% homology to any other knowngene renders the fragment unsuitable. Although the Blast analysis isan important step in the selection of the ODNs, one has to be awarethat to date only a small fraction of all 120,000 human genes havebeen submitted to databases. Thus, whereas Blast analysis might helpto exclude certain ODNs it cannot ensure their specificity to the tar-get sequence.
2. Although for bigger departments, it might be worthwhile to purchasea DNA Synthesizer. Most researchers order antisense ODNs fromcommercial suppliers. Generally, it is recommended to order theODNs because the price has been falling rapidly and reliable com-mercial suppliers are widely available.
3. It is essential to establish the efficiency of ODN uptake by the targetcells. If convincing in vitro or in vivo data cannot be produced tosupport the uptake of the ODNs by the target cells, the antisenseODN-based approach has to be abandoned.
4. As there will be a large number of experiments involved in establish-ing the efficacy of ODNs, it is essential to have a well-establishedreliable screening method before the start of ODN screening. The screen-ing method should be suitable to monitor the expression of the targetprotein, thus, it can be Western blot analysis (Chapter 1) immuno-precipitation (Chapter 1), ELISA, immunocytochemistry, immuno-histochemistry or analysis of a function related to the target protein.It has to be noted that whereas immunoprecipitation is one of themost reliable methods for in vitro analysis, it is unsuitable for in vivostudies. Efficacy studies always have to demonstrate the concentra-tion dependence of the ODN and have to include the use of appropri-ate sense and scrambled ODN controls.
Acknowledgments
This work was supported by the National Health and MedicalCouncil of Australia. The author would like to thank Dr. Kerryn Garrett
104 Rakoczy
for the critical reading of the manuscript and Louise Kemp for helpwith the preparation of the manuscript.
References
1. Wagner, R. W. (1994) Gene inhibition using antisense oligodeoxy-nucleotides. Nature 372, 333–335.
2. Helene, C. (1991) Rational design of sequence-specific oncogeneinhibitors based on antisense and antigene oligonucleotides. Eur. J.Cancer 27, 1466–1471.
3. Stein, C. A. and Cheng, Y.-C. (1993) Antisense oligonucleotides astherapeutic agents—is the bullet really magical? Science 261, 1004–1012.
4. Rakoczy, P. E., Lai, M. C., Watson, M., et al. (1996) Targeted deliv-ery of an antisense oligonucleotide in the retina. Uptake, distribution,stability and effect. Antisense Nucleic Acid Drug Dev. 6, 207–213.
5. Rakoczy, P. E., Lai, M. C., Vijayasekaran, S., et al. (1996) Initiationof impaired outer segment degradation in vivo using an antisense oli-gonucleotide. Curr. Eye Res. 15, 119–123.
6. Wiederanders, B. and Kirschke, H. (1986) Antibodies to rat livercathepsins: characterization and use for the identification of enzymeprecursors. Biomed. Biochim. Acta. 45, 1421–1431.
7. Katz, M. L. and Shanker, M. J. (1989) Development of lipofuscin-like fluorescence in the retinal pigment epithelium in response to pro-tease inhibitor treatment. Mech. Ageing Dev. 49, 23–40.
8. Rakoczy, P., Demeter, T., Hutchinson, L., et al. (1989) Detection ofhuman papillomavirus type 16 DNA in cervical swabs and formalin-fixed, paraffin-embedded squamous cell carcinomas of non-genitaltissues using a synthetic oligodeoxynucleotide probe. J. Virolog.Meth. 25, 325–336.

Inhibition of Gene Expression 105
105
From: Methods in Molecular Medicine, vol. 47: Vision Research ProtocolsEdited by: P. E. Rakoczy © Humana Press Inc., Totowa, NJ
6
Inhibition of Gene Expression by Ribozymes
William W. Hauswirth, Lynn C. Shaw,Patrick O. Whalen, Jason J. Fritz,D. Alan White, and Alfred S. Lewin
1. Introduction
1.1. Ribozyme Biology
RNA enzymes, or ribozymes, can be defined as RNA moleculesthat promote a variety of reactions involving RNA and DNA mol-ecules. These include site-specific cleavage, ligation, polymeriza-tion, and phosphoryl exchange (1). The use of ribozymes formedical therapy was recognized soon after RNA catalysis was dis-covered in the early 1980s (2). Three broad classes, naturally occur-ring ribozymes have been recognized: (1) RNase P, required fortRNA processing; (2) self-splicing introns, including group I and IIintrons of bacteria, mitochondria, and chloroplasts; and (3) self-cleaving viral agents, including hepatitis delta virus and componentsof plant viroids that cleave the RNA genome during replication.Because of their small size and great specificity, the self-cleavingribozymes have the greatest potential for medical applications.The ability of these ribozymes to cleave other RNA molecules atspecific sites makes them useful as inhibitors of viral replication orof cell proliferation (3–8).

106 Hauswirth et al.
The underlying hypothesis for therapy is that ribozymes canreduce levels of mutated proteins that eventually lead to apoptosisof rod photoreceptors by lowering mutant mRNA levels. The issuesinvolved in developing ribozyme therapy specifically for dominantretinal disease include (1) the existence of a target sequence createdby the disease-causing mutation or located near the relevant muta-tion; (2) ribozyme accessibility of that target sequence with respect toRNA secondary structure; and (3) delivery of ribozymes in a cell-type specific manner. Our strategy has been to express ribozymesusing the promoter from the rod opsin gene that confers rod cell-specific expression (9). The viral vector we employ, recombinantAdeno-Associated Virus (AAV), is discussed in a separate articleby Rolling, in this volume.
Two kinds of ribozyme have been widely employed, hairpinsand hammerheads (Fig. 1). Both catalyze the sequence-specificcleavage of target RNA yielding products containing a 5' hy-droxyl and a 2',3'-cyclic phosphate. Hammerhead ribozymeshave been used more commonly, because the target site has fewlimitations (10). For designing a ribozyme, first select a regionin the target RNA containing NUX is selected, where N standsfor any nucleotide and X is any nucleotide except guanosine.Two stretches of 6-to-8-nucleotides-long antisense nucleotidesthat flank the 21-nucleotide sequence that forms the catalytichammerhead between them are then designed based on the targetsequence surrounding the target triplet. Hairpin ribozyme designemploys the same ideas, except that the catalytic core is larger(34 nucleotides) and the ribozyme targeting domains requiremore specificity (11). Hairpins recognize the sequence NNNYNGUCNNNNNN, where N is any nucleotide and Y is a pyrimi-dine. Using in vitro selection and site-specific mutagenesis,nucleotides essential for activity and expanding the target rangehave been identified (12–17). Being inherently more stable, hair-pin ribozymes function better than hammerheads under physi-ologic temperature and magnesium concentrations. The hairpinribozyme stability can be enhanced by replacing a naturallyoccurring three-base loop in the catalytic core with a tetraloop

Inhibition of Gene Expression 107
(18,19) and by changing a U to C at position 39 of the catalyticcore. This increases hairpin activity twofold compared to theoriginal sequence.
The catalytic properties and greater specificity of ribozymes givethem potential advantage over antisense RNA. In a head-to-headstudy, comparing antisense RNA and ribozymes with identical tar-get sequences, ribozymes inhibited viral replication 2- to 10-foldbetter than the comparable antisense molecules (20). For the degra-dation of mRNA molecules whose protein products lead to retinaldegeneration, the ability of ribozymes to selectively cleave themutant mRNA is their chief advantage over antisense oligonucleo-tides. A single-base mismatch is sufficient to block the cleavage of
Fig. 1. Schematic secondary structures of the hammerhead (A) and thehairpin (B) ribozymes. Arrows indicate the cleavage sites in target RNAs.N can be any nucleotide, X is any nucleotide but guanosine, and Y indi-cates a pyrimidine nucleotide. The helices in the hammerhead ribozymeare numbered with Roman numerals, and the helices in the hairpin aredesignated with Arabic numerals. The large loops in the hairpin are des-ignated A and B.

108 Hauswirth et al.
wild-type mRNA by a ribozyme, whereas a similar mismatch in anantisense molecule will have little impact: both wild-type and mutantmessages will be bound and their translation into protein inhibited.
1.2. Ribozyme Target Site Selection
Key to the successful therapeutic application of a ribozyme isidentification of a suitable RNA target site. Not all target triplets(NUX) for hammerhead ribozymes are equally susceptible to cleav-age (21). The most favored cleavage site GUC is five times moreefficiently cleaved than the next best sequence (CUC), which ismore than twice as efficiently cleaved as the triplet UUC. One ofthe least favored sites, AUU, is a more than 100-fold less efficienttarget than of GUC. Fortunately, the most easily cleaved triplets arerelatively common in mRNA. For example, the human rod opsinmRNA contains 17 GUC triplets, 14 CUC triplets, and 22 UUCtriplets its coding region. Target site selection therefore involvesidentifying one of these triplet targets near the site of the sequencechange, giving rise to a dominant genetic mutation. Because theaim is to design a ribozyme that discriminates between mutant andwild-type sequences, it should have relatively short right- and left-hybridizing arms (helicies I and III, respectively). Analysis ofhammerhead ribozyme specificity in bimolecular reactions demon-strated that a recognition sequences of up to 12 nucleotides (thesum of arms) could be used to discriminate a one-nucleotide mis-match in one of the hybridizing arms (22). However, ribozymes withsomewhat longer arms can distinguish between mismatched andfully complementary targets if the mismatch is within the triplettarget or is immediately adjacent to it. Based on these principles,for example, we have designed a hammerhead ribozyme to cleavethe mutant rod opsin mRNA present in the VPP mouse model ofADRP (Fig. 2A).
Hairpin ribozymes differ from hammerheads in two aspects: theyrequire a GUC target in a less flexible sequence context (see earlier)and the length of one hybridizing arm (helix 2) is limited to four

Inhibition of Gene Expression 109
basepairs and is separated from helix 1 by an 8 nucleotide loop(loop A) (23). Mismatches can be tolerated in hairpin ribozymes ifthe mismatches are not next to the cleavage site, although reducedcleavage efficiency is observed (24). Therefore, it is desirable tokeep hairpin helix 1 short to promote selective cleavage (Fig. 2B).Although it has been found that use of the optimal target will resultin the best ribozyme activity on oligonucleotide RNA targets invitro, a combinatorial library of ribozymes demonstrated that targetaccessibility determines which ribozymes are most active in cells(25). Target RNA secondary structure is therefore a final importantconsideration. Whether a possible target site is exposed or concealedby RNA folding should be determined experimentally, becauseRNA secondary structure algorithms are unreliable for long sequences(26,27) (see Notes 1 and 2).
Fig. 2. Diagrams of the hammerhead (A) and the hairpin (B) ribozymesused to target the P23H opsin mRNA in the VPP mouse model of ARDP(45). The positions of cytosine nucleotides present in wild-type rhodop-sin are indicated.

110 Hauswirth et al.
2. Materials
2.1. Ribozyme Cloning and Labeling
1. DNA oligonucleotides encoding the ribozyme sequences withappropriate flanking restriction sites can be ordered from a variety ofcommercial sources.
2. Large fragment of DNA pol I (Klenow) and DNA ligase are pur-chased from New England Biolabs (NEB).
3. Unlabeled nucleoside triphosphates should be obtained from ahigh-quality vendor and purchased as a buffered stock solution (typi-cally, 200 mM).
4. Transcription vectors include pT7T3-19 (Gibco-BRL) and pBluescriptIIKS+ (Stratagene).
5. RNA polymerase, DNA polymerase, restriction endonucleases, andpolynucleotide kinase are available from several manufacturersincluding Gibco-BRL and NEB.
6. DNA Polymerase buffer; 10 mM Tris-HCl, pH 7.5, 5 mM MgCl2, 7.5 mMdithiothreitol (DTT).
7. Transcription buffer:• 48 µL autoclaved distilled water;• 20 µL 100 mM sodium phosphate buffer, pH 7.7;• 1 µL template DNA (0.4–0.8 µg) in 10 mM Tris-HCl, 0.1 mM
ethylene-diaminetetraacetic acid (EDTA), pH 7.5;• 4 µL 1 M DTT.• 20 µL 40 mM Mg2Cl, 20 mM spermidine-hydrochloride;• 4 µL 40 mM NTP mix (40 mM each of ATP, CTP, GTP, and UTP,
freshly mixed from 200 mM stocks);• 1 µL RNasin (Promega);• 1 µL T7 RNA polymerase (5 U);• 1 µL -32P-UTP or -32P-CTP (3000 Ci/mmol; 10 µCi/µL).
2.2. In Vitro Transcription
1. Labeled nucleotides for ribozyme assays are from Amersham, ICN,or DuPont/NEN.
2. T7 RNA polymerase is available from NEB.3. Placental RNase inhibitor is available as RNAsin is from Promega
or as RNase Inhibit-Ace from 3 Prime–5 Prime, Boulder, CO.

Inhibition of Gene Expression 111
2.3. Labeling of RNA Oligonucleotides
1. -32P ATP is purchased from Amersham.2. RNA oligonucleotides to serve as targets for ribozyme cleavage
assays can be ordered from several companies. We use Dharmacon,(Boulder, CO). RNA oligonucleotides are provided protected on their2' residues, and must be deblocked according to the manufacturer’srecommendations prior to use.
3. Kinase buffer is from Promega.4. Polynucleotide kinase is from Gibco-BRL.5. Sephadex G-25 fine resin is purchased directly from Pharmacia, Inc.6. Labeling buffer:
• 10 µL (2.5 nmol) RNA oligonucleotide;• 1 µL -32P-ATP;• 2 µL kinase buffer: 0.7 M Tris-HCl, pH 7.6, 0.1 M MgCl2, 50 mM DTT;• 1 µL RNAsin (diluted 1:10 from stock in 10 mM DTT);• 1 µL polynucleotide kinase (10 U);• 5 µL sterile water.
2.4. Purification of Ribozymes and Target RNA
1. Reagents for denaturing electrophoresis (acrylamide, methylene(bis)-acrylamide, urea) should be highly purified and are available from avariety of companies.
2. Recombinant placental ribonuclease inhibitor can be obtained asRNAsin, from Promega.
3. Silica-gel thin-layer chromatography (TLC) plates for ultraviolet(UV)-shadowing should contain fluorescent (F254) indicator. Theseplates are available from Fisher Scientific (Catalog no. M5715-7)and other vendors.
4. TBE buffer; 89 mM Tris borate, pH 8.3, 20 mM EDTA.5. Elution buffer; 1 M NH4OAc, 50 mM Tris-HCl, pH 7.5, 20 mM EDTA,
0.5% sodium dodecyl sulfate (SDS) at 37°C.
2.5. Total Retinal RNA Extraction
1. Triazol reagent is purchased from Gibco-BRL.2. Pure water is critical for RNA experiments. Deionized water should
be purified by a filtration and ion exchange chromatography system

112 Hauswirth et al.
such as Barnstead NanoPure II. We steam-sterilize such water anduse it directly without diethylpyrocarbonate (DEPC) treatment.Should RNase contamination prove a problem, water can be treatedfor 1–15 h with DEPC at 0.02% final concentration prior to autoclaving.
2.6. Reverse Transcriptase Polymerase Chain Reaction(RT-PCR) Analysis of Ribozyme Cleavage Productsfrom Full-Length Retinal RNA
1. Superscript first-strand buffer is purchased from Gibco-BRL.2. Superscript reverse transcriptase (RT) is from Gibco-BRL.3. Placental RNase inhibitor is from 3 prime-5 prime, or Promega.4. -32P-labeled dCTP is from NEN/DuPont.
3. Methods
3.1 Cloning of Ribozymes and Targets(General Cloning Methods Are Described in [28])
1. Coding sequences for ribozymes are generated by extension of twooverlapping synthetic DNA oligonucleotides coding for the ribozymesequence and flanked by restriction sites. The large fragment of DNApol I is used to fill out the DNA duplexes. Overlapping oligonucle-otides are heated to 65°C for 2 min and then annealed by slow cool-ing to room temperature over 30 min. The annealed oligonucleotidesprime each other and are mutually extended by DNA polymerase inthe presence of 5 mM deoxynucleoside triphosphates and polymerasebuffer (see Subheading 2.1., step 6) for 1 h at 37°C.
2. The fully duplex fragments are then digested and ligated into the T7RNA polymerase expression plasmid of choice, typically pT7T3-19or pBluescriptII KS+. Ligated plasmids are used to transformEscherichia coli cells; clones are screened by colony hybridizationand verified by DNA sequencing.
3. In addition to producing clones for active ribozymes this way, clonesfor inactive ribozymes may be prepared by mutating one or more ofthe nucleotides essential for catalysis by hammerhead or hairpinribozymes (12,29). Inactive ribozymes are useful in distinguishingphysiological effects that depend on catalytic activity.
4. Clones for the production of target RNA can be prepared in a similarfashion by mutually primed synthesis, or they can consist of partial

Inhibition of Gene Expression 113
or full-length cDNA clones. The latter are particularly useful indetermining whether a ribozyme target site is accessible in the full-length mRNA.
3.2. Production of Ribozymesand Longer Target RNA’s by In Vitro Transcription
1. Plasmid DNAs containing target sequences or ribozyme genes arelinearized with a restriction enzyme that cuts downstream of thesequence to be transcribed.
2. Endonucleases and contaminating ribonucleases are inactivated byextraction with phenol-chloroform-isoamyl alcohol (50:50:1) fol-lowed by ethanol precipitation.
3. Transcripts are generated with T7 (or other) RNA polymerase andlabeled by incorporation of -[32P]-UTP using the protocol of Grodbergand Dunn (30). A 100-µL reaction (see Subheading 2.1., step 7).
4. For labeling of target molecules, a high-specific activity is desirable,and the level of unlabeled UTP or CTP is reduced fourfold. (Reduc-ing unlabeled nucleoside triphosphates further severely reduces theyield of full-length transcripts.) For labeling of ribozymes, thelabeled nucleotide is diluted 10-fold, and the unlabeled nucleotide isused at 40 mM in the stock, since the radioactivity serves only as atracer to allow quantitation of ribozyme. Reactions are routinely per-formed at 37°C for 2 h, though labeling will continue under theseconditions for at least 6 h.
5. Following synthesis, transcription reactions should be brought to0.5% SDS, extracted with phenol-chloroform-isoamyl alcohol(50:50:1), and passed through a 1-mL Sephadex G50 spin column (31).
6. Hammerhead ribozymes or target transcripts are then ethanolprecipitated, washed twice with 70% ethanol, and resuspended in10 mM Tris-HCl, 0.1 mM EDTA, pH 7.4. Ethanol precipitation maydenature or lead to irreversible aggregation of hairpin ribozymes.If the concentration is kept low (< 1 nM), heating and slow coolingshould restore activity of denatured hairpins.
3.3. Labeling of RNA Oligonucleotides
1. Protecting groups are removed from the 2' positions of RNA oligo-nucleotides according to the manufacturer’s instructions.
2. RNA oligonucleotides (typically, 14mers) are assembled with thelabeling reagents (see Subheading 2.3., step 6).

114 Hauswirth et al.
3. The mixture is incubated at 37°C for 30 min and then is diluted to100 µL with sterile water and extracted with phenol chloroformisoamyl alcohol (50:50:1) to inactivate the enzyme.
4. Unincorporated nucleotides are removed by passing the aqueousphase over a Sephadex G-25 spin column. The sample can be used asis or can be ethanol precipitated keeping the salt (ammonium acetate)concentration 200 mM or less. Addition of Dextran Blue (Sigma) orRNase-free glycogen (Ambion) as a carrier enhances recovery ofsmall RNA molecules, without affecting their cleavage.
3.4. Purification of Ribozymes and Target RNA
1. Ribozymes and target RNA molecules produced by in vitro transcrip-tion may require purification by gel electrophoresis to assure homo-geneity. Ribozymes or larger targets (>30 nucleotides) can bepurified on 8% acrylamide, 8 M urea sequencing gels run in TBEbuffer (see Subheading 2.4. [4,32]).
2. Labeled molecules are visualized by autoradiography, excised witha sterile scalpel, and eluted from the gel in elution buffer (see Sub-heading 2.4., step 5) for 1–4 h.
3. If gel purification is omitted, the transcript should be treated withRNase-free DNase I to remove DNA sequences that may anneal tothe target or to the ribozyme.
4. RNA oligonucleotides require purification if the synthesis reactionor the deblocking step are incomplete. Purification should precedelabeling so that the recovery of the purified nucleotide can be deter-mined before labeling. One hundred nmoles of deprotected oligo-nucleotide are suspended in sterile water, mixed with equal volumeof formamide loading dye (90% formamide, TBE buffer, 0.4% xylenecyanol, and 0.4% bromphenol blue), and separated on a 20% acrylamide,8 M urea gel run in TBE.
5. After the bromphenol blue tracking dye has run two-thirds of the gel,electrophoresis is stopped and the gel is transferred to a 20 cm ×20 cm silica gel TLC plate containing F254 fluorescent indicator.The TLC plate should be covered with plastic wrap to prevent trans-fer of the powder to the gel. In a dark room, using a short-wave-length UV hand lamp, the RNA band can be detected as a dark bandagainst the fluorescent background. A 14- or 15-nucleotide moleculewill run just above the bromphenol blue dye. This band is excisedand eluted as described above except that carrier is omitted.

Inhibition of Gene Expression 115
6. The ethanol precipitate of the oligonucleotide is dissolved in sterilewater (100 µL), and the concentration is determined by absorbanceat 260 nm.
3.5. Total Retinal RNA Extraction
1. Total RNA from the retina is conveniently recovered by extractionwith Trizol according to the manufacturer's recommendations. Reti-nas can be snap frozen in liquid nitrogen prior to RNA extractionand stored at –70°C. A single mouse or rat retina is resuspended in1 mL Trizol reagent and homogenized by repeated passage thoughan 18-gage syringe needle.
2. Following a 5- to 15-min incubation at room temperature, the sus-pension is extracted with 0.2 mL of chloroform.
3. After centrifugation to separate phases, RNA is precipitated fromthe aqueous phase. A typical preparation from a single rat retinaresults in 100 µg of total RNA.
3.6. Specific Activity Determination
1. To determine the specific radioactivity of transcripts and oligonucle-otides, small samples (1–5 µL) are spotted on glass fiber filters, dried,and analyzed in a liquid scintillation counter using scintillation fluid.Counting efficiency is presumed to be 90%.
2. For end-labeled oligonucleotides, the specific activity is determinedby dividing the dpm by the concentration of oligonucleotide deter-mined by UV absorbance. This may be converted to µCi per mole bydividing by 2.22 × 10⁶ dpm/µCi.
3. For transcribed molecules, the moles of cold UTP used in the tran-scription reaction (40 nmol or 10 nmol) is divided by the radioactiv-ity in µCi of the -32P-UTP added (10 µCi or 1 µCi). (Radioactivityis determined by the concentration of radioactivity on the vial timesthe decay factor.) This number is divided by the number of uridineresidues in the transcript, and the result divided by 2.22 × 10⁶ dpmper µCi. The dividend is multiplied by the dpm in the sample todetermine moles of transcript in the sample.
3.7. In Vitro Ribozyme Cleavage Reactions
1. Specific radioactivity of each molecule is used to calculate the con-centration of target and ribozyme molecules.

116 Hauswirth et al.
2. Initial cleavage conditions consist of 50 nM substrate RNA and10 nM ribozyme, 20 mM MgCl2, 40 mM Tris-HCl, pH 7.5. Incuba-tion is at 37°C.
3. Prior to incubation with substrate, hammerhead ribozymes are rena-tured by incubation in 40 mM Tris-HCl, pH 7.4, 10 mM MgCl2 at37°C for 15 min to several hours. (Short periods of renaturation areusually adequate, but some ribozymes need to incubate in magne-sium buffer for hours to achieve full potency).
4. Hairpin ribozymes are denatured at 85°C for 2–3 min in 0.1 mM EDTAand renatured at room temperature for 5–15 min.
5. The ribozyme and target are then mixed in digestion buffer, preincu-bated for several minutes, and cleavage is initiated by the addition ofMgCl2 to 20 mM.
6. Reactions are stopped by adding 1/10 reaction volume of 0.5 M EDTAfollowed by an equal volume of formamide loading dye (see earlier).
7. Experimental conditions such as time of incubation, magnesium con-centration, and ribozyme concentration should be varied indepen-dently. The magnesium dependence of ribozymes can be lowered byaddition of spermine (0.5 mM). Ribozymes requiring high magne-sium concentrations or high ribozyme concentration for cleavage areunlikely to work well in vivo and should be eliminated from furtheranalysis at this stage.
8. Cleavage products for target RNAs produced by in vitro transcriptionare analyzed by electrophoresis on 8 M urea, 8, or 10% acrylamidesequencing gels run in TBE.
9. Digests of oligonucleotides are analyzed on 20% gels. Gels should befixed in 10% (v:v) acetic acid, 10% methanol (for 10% gels) or in40% methanol, 10% acetic acid, 3% glycerol for high percentage gels.
10. Gels are imaged by autoradiography using X-ray film, but quantitationis performed using a radioanalytic phosphorescent screen scanner.We use a PhosphorImager from Molecular Dynamics, and similarinstruments are available from Fuji Medical Electronics or Bio-Rad.If such an instrument is not available, cleavage can be quantitated bycounting the radioactivity in gel slices.
11. Conversion of the PhosphorImager output to dpm can be made byexposing a slot-blot of serial dilutions of a sample of known radio-activity (usually the target molecule) to the same screen as the gel.
12. The fraction cleaved is determined from ratio of radioactivity in the prod-uct to the sum of the radioactivity in the product and the original target:

Inhibition of Gene Expression 117
Fraction cleaved (FC) = P/(P + T).
The reaction velocity is the fraction cleaved per minute.
3.8. Multiple Turnover Kinetic Analysis (see Note 3)
1. Analyses to determine multiple turnover kinetic constants are typi-cally carried out in 20 mM MgCl2, 40 mM Tris-HCl, pH 7.5, at 37°Cfor short intervals. The appropriate interval is determined by a time-course experiment under multiple turnover conditions (i.e., substrateexcess). Initial rates should be measured when the amount of cleav-age is linear with time and when no more than 10% of substrate hasbeen converted to product. Rates are measured at several intervals(e.g., 5, 10, and 20 min) to ensure linearity.
2. Samples are preincubated at 37°C prior to initiation of cleavage andcontain 1–10 nM ribozyme and increasing concentrations of substrateRNA, holding ribozyme concentration constant.
3. Substrate concentrations should greatly exceed ribozyme concentra-tion, the lowest being in fivefold excess.
4. Values for Vmax and KM are obtained by double reciprocal plots ofvelocity versus substrate concentration (Lineweaver–Burke plots) orby plots of reaction velocity versus the ratio of velocity to substrateconcentration (Eadie–Hofstee plots).
5. The turnover number kcat is determined by dividing Vmax by theribozyme concentration: kcat = Vmax/[Rz].
6. The values for kcat and KM cannot be determined accurately unlessthe saturating substrate level (which yields Vmax) is approached. Thislevel can be difficult to achieve with cloned targets if the KM of theribozyme is high. In such a case, synthetic oligonucleotides arerecommended (33).
3.9. Single Turnover Kinetic Analysis
1. The rate of the cleavage step of a ribozyme (kobs), as distinct from theoverall rate depending on association and dissociation steps, can bedetermined in ribozyme excess experiments. This is often a usefulstatistic in comparing a new ribozyme with others that have beenused successfully in the past.
2. The relative amounts of ribozyme and substrate must be experimentallydetermined, but 20:1 is a reasonable starting condition. (Rates should

118 Hauswirth et al.
not vary with ribozyme concentration if an adequate excess has beenachieved.)
3. Ribozymes are renatured and mixed with substrate as aforemen-tioned, except that a single large reaction (e.g., 50 µL) is set up andsamples (e.g., 4 µL) are withdrawn at various intervals. At least onesample should be taken after a long incubation to serve as an esti-mate of the fraction cleaved at t = .
4. Reactions are stopped with EDTA and loading buffer as describedand analyzed on denaturing acrylamide gels.
5. The fraction cleaved at each time point is determined using aPhosphorImager (or similar instrument).
6. If the substrate is fully complexed with the ribozyme at the outset ofthe experiment, cleavage should follow an exponential curve. The datafit an equation of the type:
Fct = Fc – (exp[–kobst]Fc )
where Fct is the fraction cleaved at time t, Fc is the fraction cleavedafter a long interval (t ), kobs is the first order rate constant for thereaction, and Fc is difference in fraction cleaved between t0 and t .
3.10. RT-PCR Analysis of Ribozyme Cleavage Productsfrom Full-Length Retinal RNA
1. To distinguish wild-type opsin mRNA from mutant transgenemRNA, we use a three-primer system for PCR amplification. Thedownstream primer anneals to both the mutant and wild-type cDNAand two separate upstream primers anneal to either the mutant orwild-type cDNA (34). This reaction results in PCR products of dif-ferent lengths from wild-type and mutant mRNA.
2. RT-PCR reactions initially contain 1 µg of total retinal RNA, 1 pmoleof primer, Superscript first-strand buffer (Gibco-BRL), and 200 µmdNTPs in a 30-µL volume.
3. The reaction mix is denatured at 80°C for 2 min and then annealed at56°C for 20 min.
4. 200 U of Superscript II RT (Gibco-BRL) and 1 U of RNase Inhibit-Ace are added and incubated at 37°C for 1 h.
5. To control for amplification from DNA templates, a similar reactionis run with no RT added after the annealing step.

Inhibition of Gene Expression 119
6. 2 µL is removed from the RT reaction and transferred to a solutioncontaining 20 mM Tris-HCl (pH 8.4), 10 pM of each primer, 2 mM,MgCl2, 200 µM dNTPs, and 5 µCi of -32P dCTP (3000 Ci/mmol).
7. The PCR reaction is incubated at 94°C for 5 min and then run for30 cycles of 94°C for 1 min, 55°C for 1 min, and 72°C for 1 min.
8. The fragments are analyzed by electrophoresis on 4% or 5% non-denaturing polyacrylamide gels.
9. Radioactivity of PCR fragments is quantitated by radioanalytic scan-ning with a PhosphorImager.
10. An additional primer set to amplify an invariant mRNA should beadded to control for differences in sample preparation. We use -actinas an internal standard.
11. As an alternative to distinguishing mutant from wild-type retinal genesusing distinctive primers, restriction site differences between the mutantand wild-type cDNA can be employed if they exist. We have used thismethod to distinguish between RT-PCR products resulting from het-erozygous rd mice (35). To obtain a quantitative estimate of productbased on restriction enzyme digestion, one must correct for the fractionof heteroduplex molecules formed during the last stages of PCR.Apostolakos et al. (36) describe a method for making this correction andit is described in the context of retinal RNA in Yan et al. (35).
12. To test ribozyme cleavage of full-length opsin mRNA in the contextof total retinal RNA, one simply precedes the RT-PCR reaction witha ribozyme cleavage incubation or with a mock incubation. Cleav-age assays with the total retinal RNAs typically contain 10 µg totalRNA extract and 20–50 nM ribozyme (see Note 4).
4. Notes
1. A successful ribozyme gene therapy for dominant mutations torequires that the expression from one allele (presumably the wild-type allele) must maintain the normal phenotype. Many loss-of-function mutations are dominant because of haplo-insufficiency,i.e., too little protein is produced from the remaining wild-typeallele to preserve function. For rhodopsin and other visual cycleproteins, one normal allele is normally sufficient to preserve vision(37). It usually remains possible, therefore, to limit the expressionof the dominant mutant allele, permitting the wild-type gene todirect the synthesis of functional opsin.

120 Hauswirth et al.
2. One major problem that limits the use of ribozyme technology for allforms of autosomal dominant retinitis pigmentosa is the requirementfor small distances between the mutated site and the cleavage site.If the cleavage site is more than three or four residues away fromthe mutated base, selective degradation of the mutant mRNA maynot be possible. However, it is important to recognize that the base-change leading to ribozyme selectivity need not be the same one lead-ing to RP; a linked, silent mutation is equally suitable as long as itsatisfies the above criteria. Indeed, the ribozymes we have employedin the rat P23H model of ADRP cleave following a silent mutation(C to U) in codon 22 that is linked to the C to A transversion incodon 23 (34,38). Alternatively, the target-site problem has led otherinvestigators (39,40) to propose a novel ribozyme strategy that usesribozymes capable of destroying both mutant and wild-type mRNA,whereas at the same time, delivering an intact wild-type allele lack-ing the ribozyme target site.
3. It is not absolutely necessary to carry out a detailed kinetic analysisto develop therapeutic ribozymes. However, accurate prediction ofRNA structure is often uncertain and ribozymes that might appearfunctional in theory may fold improperly in solution (41,42).We therefore recommend testing ribozyme kinetics in vitro understandard conditions, before any in vivo animal evaluation is attempted.We have found the kcat determined in 10 or 20 mM MgCl2 to be agood predictor of the relative activity of ribozymes in vivo in theretina. It is also vital to test ribozymes on long RNA substrates, pref-erably full-length mRNA extracted from tissue or transcripts ofcDNA clones, to confirm that the target site on the mRNA is exposedin solution and not buried in a stable helical structure.
4. It needs to be remembered that the kinetics of even the best ribozymespale in comparison to those of protein ribonucleases. Consequently,as intracellular therapeutic agents, ribozymes must be expressed athigh levels. A proximal rod opsin promoter works well to drive thesynthesis of ribozymes in rod photoreceptor cells (9,38). RNA polIII promoters have been used in other tissue because they are respon-sible for the high level synthesis of small nuclear RNA and transferRNA (43). However, pol II promoters such as the rod opsin pro-moter more likely to ensure correct transcript trafficking to the cyto-plasm where its intended mRNA target resides (44). For retinalmRNA targets, therefore, we recommend high-efficiency, cell-typespecific promoters to drive ribozyme expression in vivo.

Inhibition of Gene Expression 121
Acknowledgment
This work has been supported by grants from the National EyeInstitute, the National Institute of Neurologic Disease and Stroke,The March of Dimes Foundation, the Foundation Fighting Blind-ness, and Research to Prevent Blindness, Inc.
References
1. Cech, T. R. and Bass, B. L. (1986) Biological catalysis by RNA.Annu. Rev. Biochem. 55, 599–629.
2. Cech, T. R. (1988) Ribozymes and their medical implications.JAMA 260, 3030–3034.
3. Czubayko, F., Schulte, A. M., Berchem, G. J., and Wellstein, A.(1996) Melanoma angiogenesis and metastasis modulated by ribozymetargeting of the secreted growth factor pleiotrophin. Proc. Natl. Acad.Sci. USA 93, 14,753–14,758.
4. Gervaix, A., Schwarz, L., Law, P., et al. (1997) Gene therapy target-ing peripheral blood CD34(+) hematopoietic stem cells of HIV-infected individuals. Hum. Gene Ther. 8, 2229–2238.
5. Kashani Sabet, M., Funato, T., Florenes, V. A., et al. (1994) Suppres-sion of the neoplastic phenotype in vivo by an anti-ras ribozyme.Cancer. Res. 54, 900–902.
6. Koizumi, M., Kamiya, H., and Ohtsuka, E. (1993) Inhibition of c-Ha-rasgene expression by hammerhead ribozymes containing a stableC(UUCG)G hairpin loop. Biol. Pharm. Bull. 16, 879–883.
7. Sarver, N., Cantin, E. M., Chang, P. S., et al. (1990) Ribozymes aspotential anti-HIV-1 therapeutic agents. Science 247, 1222–1225.
8. Wong-Staal, F., Poeschla, E. M., and Looney, D. J. (1998) A con-trolled, Phase 1 clinical trial to evaluate the safety and effects inHIV-1 infected humans of autologous lymphocytes transducedwith a ribozyme that cleaves HIV-1 RNA. Hum. Gene Ther. 9,2407–2425.
9. Flannery, J. G., Zolotukhin, S., Vaquero, M. I., et al. (1997) Efficientphotoreceptor-targeted gene expression in vivo by recombinantadeno-associated virus. Proc. Natl. Acad. Sci. USA 94, 6916–6921.
10. Birikh, K. R., Heaton, P. A., and Eckstein, F. (1997) The structure,function and application of the hammerhead ribozyme. Eur. J.Biochem. 245, 1–16.

122 Hauswirth et al.
11. Earnshaw, D. J. and Gait, M. J. (1997) Progress toward the structureand therapeutic use of the hairpin ribozyme. Antisense Nucleic AcidDrug Dev. 7, 403–411.
12. Berzal-Herranz, A., Joseph, S., and Burke, J. M. (1992) In vitroselection of active hairpin ribozymes by sequential RNA-catalyzedcleavage and ligation reactions. Genes. Dev. 6, 129–134.
13. Berzal-Herranz, A., Joseph, S., Chowrira, B. M., et al. (1993) Essen-tial nucleotide sequences and secondary structure elements of thehairpin ribozyme. EMBO. J. 12, 2567–2574.
14. Burke, J. M. and Berzal-Herranz, A. (1993) In vitro selection andevolution of RNA—applications for catalytic RNA, molecular rec-ognition, and drug discovery. FASEB. J. 7, 106–112.
15. Anderson, P., Monforte, J., Tritz, R., et al. (1994) Mutagenesis of thehairpin ribozyme. Nucleic Acids Res. 22, 1096–1100.
16. Siwkowski, A., Shippy, R., and Hampel, A. (1997) Analysis of hair-pin ribozyme base mutations in loops 2 and 4 and their effects on cis-cleavage in vitro. Biochemistry 36, 3930–3940.
17. Vaish, N. K., Heaton, P. A., Fedorova, O., and Eckstein, F. (1998)In vitro selection of a purine nucleotide-specific hammerhead-likeribozyme. Proc. Natl. Acad. Sci. USA 95, 2158–2162.
18. Yu, M., Poeschla, E., Yamada, O., et al. (1995) In vitro and in vivocharacterization of a second functional hairpin ribozyme againstHIV-1. Virology 206, 381–386.
19. Sargueil, B., Pecchia, D. B., and Burke, J. M. (1995) An improvedversion of the hairpin ribozyme functions as a ribonucleoprotein com-plex. Biochemistry 34, 7739–7748.
20. Hormes, R., Homann, M., Oelze, I., et al. (1997) The subcellularlocalization and length of hammerhead ribozymes determine efficacyin human cells. Nucleic Acids Res. 25, 769–775.
21. Shimayama, T., Nishikawa, S., and Taira, K. (1995) Generality of theNUX rule: kinetic analysis of the results of systematic mutations inthe trinucleotide at the cleavage site of hammerhead ribozymes.Biochemistry 34, 3649–3654.
22. Hertel, K. J., Herschlag, D., and Uhlenbeck, O. C. (1996) Specificityof hammerhead ribozyme cleavage. EMBO J. 15, 3751–3757.
23. Hampel, A., Tritz, R., Hicks, M., and Cruz, P. (1990) “Hairpin” cata-lytic RNA model: evidence for helices and sequence requirement forsubstrate RNA. Nucleic Acids Res. 18, 299–304.

Inhibition of Gene Expression 123
24. Joseph, S., Berzalherranz, A., Chowrira, B. M., et al. (1993) Sub-strate selection rules for the hairpin ribozyme determined by in vitroselection, mutation, and analysis of mismatched substrates. Gene Dev.7, 130–138.
25. Yu, Q., Pecchia, D. B., Kingsley, S. L., et al. (1998) Cleavage ofhighly structured viral RNA molecules by combinatorial libraries ofhairpin ribozymes. The most effective ribozymes are not predictedby substrate selection rules. J. Biol. Chem. 273, 23,524–23,533.
26. Campbell, T. B., McDonald, C. K., and Hagen, M. (1997) The effectof structure in a long target RNA on ribozyme cleavage efficiency.Nucleic Acids Res. 25, 4985–4993.
27. Birikh, K. R., Berlin, Y. A., Soreq, H., and Eckstein, F. (1997) Prob-ing accessible sites for ribozymes on human acetylcholinesteraseRNA. RNA 3, 429–437.
28. Ausabel, F. M., Brent, R., Kingston, R. E., Moore, D. D., et al. (1997)Current Protocols in Molecular Biology, Wiley, New York, pp. 1.01–3.17.
29. Ruffner, D. E., Stormo, G. D., and Uhlenbeck, O. C. (1990) Sequencerequirements of the hammerhead RNA self-cleavage reaction. Biochem-istry 29, 10,695–10,702.
30. Grodberg, J. and Dunn, J. J. (1988) ompT encodes the Escherichiacoli outer membrane protease that cleaves T7 RNA polymerase dur-ing purification. J. Bacteriol. 170, 1245–1253.
31. Penefsky, H. S. (1977) Reversible binding of Pi by beef heart mito-chondrial adenosine triphosphatase. J. Biol. Chem. 252, 2891–2899.
32. Maxam, A. M. and Gilbert, W. (1977) A new method for sequencingDNA. Proc. Natl. Acad. Sci. USA 74, 560–564.
33. DeYoung, M. B., Siwkowski, A., and Hampel, A. (1997) Determina-tion of catalytic parameters of hairpin ribozymes, in Ribozyme Proto-cols (Turner, P. C., ed.), Humana, Totowa, NJ, pp. 209–220.
34. Drenser, K. A., Timmers, A. M., Hauswirth, W. W., and Lewin, A. S.(1998) Ribozyme-targeted destruction of RNAs associated withADRP. Inv. Ophth. Vis. Sci. 39, 681–689.
35. Yan, W., Lewin, A., and Hauswirth, W. (1998) Selective degradationof nonsense beta-phosphodiesterase mRNA in the heterozygous rdmouse. Invest. Ophthalmol. Vis. Sci. 39, 2529–2536.
36. Apostolakos, M. J., Schuermann, W. H., Frampton, M. W., et al.(1993) Measurement of gene expression by multiplex competitivepolymerase chain reaction. Anal. Biochem. 213, 277–284.
124 Hauswirth et al.
37. Humphries, M. M., Rancourt, D., Farrar, G. J., et al. (1997) Retin-opathy induced in mice by targeted disruption of the rhodopsin gene.Nat. Genet. 15, 216–219.
38. Lewin, A. S., Drenser, K. A., Hauswirth, W. W., et al. (1998) Ribozymerescue of photoreceptor cells in a transgenic rat model of autosomaldominant retinitis pigmentosa. Nat. Med. 4, 967–971.
39. Millington-Ward, S., O’Neill, B., Tuohy, G., et al. (1997) Strategemsin vitro for gene therapies directed to dominant mutations. Hum. Mol.Genet. 6, 1415–1426.
40. Sullivan, J. and Pietras, K. (1998) Design and testing of hammerheadribozymes to cleave full length opsin mRNA. Inv. Ophth. Vis. Sci. 39,S722(Abstract).
41. Heus, H. A., Uhlenbeck, O. C., and Pardi, A. (1990) Sequence-dependent structural variations of hammerhead RNA enzymes.Nucleic Acids Res. 18, 1103–1108.
42. Fedor, M. J. and Uhlenbeck, O. C. (1990) Substrate sequence effectson “hammerhead” RNA catalytic efficiency. Proc. Natl. Acad. Sci.USA 87, 1668–1672.
43. Lieber, A. and Strauss, M. (1995) Selection of efficient cleavage sitesin target RNAs by using a ribozyme expression library. Mol. Cell.Biol. 15, 540–551.
44. Bertrand, E., Castanotto, D., Zhou, C., et al. (1997) The expressioncassette determines the functional activity of ribozymes in mamma-lian cells by controlling their intracellular localization. RNA 3, 75–88.
45. Naash, M. I., Hollyfield, J. G., Al-Ubaidi, M. R., and Baehr, W.(1993) Simulation of human autosomal dominant retinitis pigmentosain transgenic mice expressing a mutated murine opsin gene. Proc. Natl.Acad. Sci. USA 90, 5499–5503.

Intraocular Delivery of Recombinant Virus 125
125
From: Methods in Molecular Medicine, vol. 47: Vision Research ProtocolsEdited by: P. E. Rakoczy © Humana Press Inc., Totowa, NJ
7
Intraocular Delivery of Recombinant Virus
Fong-Qi Liang, Vibha Anand,Albert M. Maguire, and Jean Bennett
1. Introduction
In the past 5 yr, advances in technology have been made thatallow efficient somatic transfer of functional genes to target cells inthe eye in vivo. The ability to deliver functional genes to these cellsis due primarily to the development of viral vectors—viruses inwhich various replicative functions have been replaced withtransgene cassettes. Because progress continues in developing newvectors and refining those that are already available, the field hasmoved past the step of actually proving that gene transfer is pos-sible to one where vectors are used (experimentally) for therapeuticpurposes. In fact, proofs of principle of virus-based retinal genetherapy have been achieved in relevant animal models for retinitispigmentosa (1–3).
The promising results to date assure that the ocular gene therapyfield will continue to grow. The methods described here aim to pro-vide the reader with information relevant to performing intraocularvirus-mediated gene transfer in eyes of different species of mam-mals. Although our experience is primarily with recombinant aden-ovirus and adeno-associated virus (rAAV), the techniques describedhere should be applicable to experiments involving any type of virus

126 Liang et al.
or physicochemical reagent serving as the vector. This chapterincludes details relevant to preparation of recombinant virus formicroinjection, surgical procedures for intraocular injection inrodents (mice and rats) and larger animals, and methods to evaluatethe success/effects of the treatment ophthalmoscopically. We feelthat these procedures will be useful for experiments including thoseevaluating not only efficacy of gene therapy, but also those evaluat-ing the effects of wild-type and mutant ocular proteins on a varietyof biochemical, cell biological, developmental, immunological, andphysiological processes.
2. Materials
2.1. Preparation of Recombinant Virusfor Microinjection
1. Purified virus stored at –80°C.2. HBS: HEPES-buffered saline: 20 mM HEPES, 150 mM NaCl,
pH 7.8: filter with 0.22 mM filter.3. Glycerol.4. Phosphate-buffered saline (PBS)-20%S: 20% sucrose in PBS. PBS
is prepared by dilution of a 10X stock. Composition per liter of10X stock: 80 g NaCl, 2 g KCl, 21.4 g Na2HPO4·7H2O, 3.5 gKH2PO4, pH 7.4.
5. Disinfectant: 10% bleach (i.e., 0.525 g sodium hypochlorite/100 mL).
2.2. Surgical Procedures in Mice
1. Anesthetic. Avertin: Stock solution: dissolve 10 g 2,2,2-tribromoetha-nol (Avertin, Aldrich Chemical, Milwaukee, WI) in 10 mL 2-methyl,2-butanol. Working solution: To 1.25 mL of avertin stock solution,add PBS to a final volume of 50 mL. Store both stock and workingsolution wrapped in foil at 4°C.
2. Povidone-iodine 5% (Betadine 5%, Escalon Ophthalmics, Skillman, NJ).3. 1.0% tropicamide (e.g., Mydriacyl 1%, Alcon, Fort Worth, TX)
PredG (Allergan Pharmaceuticals, Irvine, CA).4. Injection Apparatus. Hamilton syringe ( 10 mL) with removable
33 gage blunt needle (e.g., Hamilton #801RN and Hamilton #79633,Baxter Scientific Products, Edison, NJ).

Intraocular Delivery of Recombinant Virus 127
5. Vannas iridectomy scissors (e.g., catalog #RS-5610, Roboz Surgi-cal, Rockville, MD).
6. Jeweler’s forceps (Dumont #5, Roboz Surgical).7. Dissecting microscope (e.g., Nikon SMZU microscope, Optical
Apparatus, Ardmore, PA).8. Fiber optics light source.9. Heat lamp.
2.3. Surgical Procedures in Larger Animals
1. Anesthetic. Anesthesia appropriate for the species (e.g., for dogs:preanesthesia with preacepromazine, 0.1–0.3 mg/kg IM then atro-pine 0.04 mg/kg IM. Induction with thiopental, 1 cc/6 lbs IV of a2% solution, intubation and ventilation with 2.5% isofluorane).
Fig. 1. Injection apparatus recommended for use on large eyes. 1: ante-rior chamber infusion cannula; 2: rubber plunger tip; 3: “sawed-off” plastictuberculin syringe; 4: T-connector; 5: tubing filled with sterile saline; 6:1-cc glass Hamilton syringe; 7: location of virus to be injected into the eye.

128 Liang et al.
2. Reagents. Same reagents as for mice (Subheading 2.2.) plusphenylephrine hydrochloride, 2.5% (Mydfin, Alcon); hydroxy-propyl methylcellulose 2.5% (Goniosol; CIBAVision Ophthalmics,Atlanta, GA).
3. Injection Apparatus. Sterile 30 gage needle; sterile lid speculum.The injection apparatus is not available commercially, and must beassembled by the investigator. Assembly is by a modification of aprocedure described by Wallace and Vander 17 (4). A 30-gage ante-rior chamber cannula (Storz) is connected to a syringe containing thematerial to be injected. This syringe is in turn connected throughflexible extension tubing and a T" connector (#4612, Abbott Hospi-tals, Chicago, IL) with a second syringe containing saline (Fig. 1).
4. Surgical tools. Plano convex fundus contact lens. In addition, see Sub-heading 2.2. (steps 5 and 6).
5. Equipment. Operating microscope with coaxial illumination (e.g., ZeissOPMI 6-S, Germany); warming blanket.
2.4. In Vivo Assessment by Ophthalmoscopy
1. Dilating drops (see Subheading 2.2., step 3 and Subheading 2.3., step 2).2. Ophthalmoscope: Heine Omega 180 binocular indirect, Krebs,
Englewood, NJ). For rodents: 78 or 90 diopter lens (Krebs). For largeranimals: 20 or 28 diopter lens (Krebs).
3. Fundus photography: Kowa Camera (Krebs, Englewood, NJ) and 78 or90 diopter lens for rodents and 20 or 28 diopter lens for larger animals.
3. Methods
3.1. Preparation of Recombinant Virus for Microinjection
Thaw an aliquot of purified virus on wet ice and dilute as neces-sary (see Note 1). Recombinant adenovirus can be diluted in HBSor PBS-20%S. Recombinant AAV can be diluted in HBS. Bothviruses can be injected undiluted, however, it should be noted thatsolutions of frozen adenovirus usually contain 10% glycerol.
3.2. Surgical Procedures in Mice (see Note 2)3.2.1. Subretinal Injection
1. Anesthetize the adult mouse by intraperitoneal (i.p.) injection ofavertin (0.5–0.6 mg/kg intraperitoneally prn).

Intraocular Delivery of Recombinant Virus 129
2. Dilate the pupils with topical application of one drop of Mydriacyl.3. Position the anesthetized mouse on the base of the dissecting
microscope with the eye to be injected under view (approx ×15magnification).
4. Grasp the temporal conjunctiva with jeweler’s forceps and carefullycut down to the sclera with the tip of Vannas iridotomy scissors(Roboz Surgical) (Fig. 2B).
5. Perform a conjunctival peritomy by introducing the lower lip of thescissors through the incision extending circumferentially both
Fig. 2. Surgical procedure for subretinal injection in mice. (A) It canbe a challenge to perform subretinal injection in the newborn mouse asthe eye is small (shown for comparison, is the tip of a ballpoint pen adja-cent to a 4-d-old mouse). Details of subretinal injection in the adult mouseare as follows. (B) The temporal conjunctiva is grasped with jeweler’sforceps and the fold of tissue is carefully cut down to the sclera with thetip of Vannas scissors; (C) A conjunctival peritomy is made by introduc-ing the lower lip of the scissors through the incision extending the open-ing circumferentially both superiorly and inferiorly for 180°; (D) Theeye is grasped by the conjunctiva near the cornea and is rotated nasallythereby exposing the sclera at the temporal equator. A 30-gage needle ispassed obliquely through the sclera, choroid, and retina into the vitreousspace, avoiding the lens; (E) The 32-gage blunt injection needle is intro-duced into the 30-gage incision in an orientation tangential to the surfaceof the globe. The injection is then delivered (not shown).

130 Liang et al.
superiorly and inferiorly for 180° (Fig. 2C). Carefully, clean off thesurface of the sclera.
6. Grasp the conjunctiva adjacent to the cornea with forceps providingtraction to rotate the globe and allowing optimal surgical exposure.
7. Pass the tip of a sterile 30-gage needle obliquely through the sclera,choroid, and retina into the vitreous space, avoiding the lens (Fig. 2D).A bead of clear vitreous will prolapse through this scleral incisionand occasionally the translucent edge of the retina can be seeninternally.
8. Switch hand position and retract the globe gently to expose the scle-rotomy incision.
9. Introduce the tip of a 33-gage blunt needle mounted on a 10-µL Hamiltonsyringe into the incision tangentially to the surface of the globe (Fig. 2E).The needle is passed along the inner surface of the sclera with the tipentering approx 1 mm. Use the jeweler’s forceps in the opposite handto provide guidance. The 33-gage needle passes through the scleraand the choroid (an external transscleral transchoroidal approach)and then terminates in the subretinal space. The surgeon steadies thehand holding the injection syringe on a fixed surface (e.g., roll oftowels) as the assistant delivers the injection.
10. After injection, carefully withdraw the needle and reposition the con-junctiva. Apply ointment (preferably PredG, Allergan Pharmaceuti-cals) to the corneas to minimize drying of this tissue while the animalrecovers from anesthesia. For further reference, a cartoon depictionof this procedure is presented in Bennett et al. (5).
3.2.1.1. NEONATAL MOUSE
The surgical procedure in the neonatal mouse proceeds similarlyto that in the adult mouse with the following differences. Anesthe-sia by hypothermia is recommended for neonatal mice (throughapprox 5 d after birth).
1. The eyelids of the mouse must be opened artificially as they do notopen spontaneously until approx 10–11 d after birth. The eyelids areopened by carefully incising the skin between the upper and lowerlid with the beveled edge of a 30-gage needle. The line of skin can beidentified by its lack of hair follicles and its smooth surface.
2. Once a small opening is made, the tips of a jeweler’s forcep areplaced in the space between the lids and are carefully spread open toexpose the eye.

Intraocular Delivery of Recombinant Virus 131
3. While exerting gentle fingertip pressure, the lids should be slippedbehind the eye, allowing the entire globe to prolapse forward.
3.2.2. Intravitreal Injection
Perform intravitreal injections similarly as subretinal injections(Subheading 2.2.) except guide the 33-gage needle through the holein the neural retina created by the lateral canthotomy in a directionparallel with the lens capsule (i.e., avoiding damage to the lens).
3.2.3. Intracameral Injection
In contrast to subretinal and intravitreal injection, do not dilatepupils prior to anterior chamber injection.
1. Immobilize the eye by grasping the conjunctiva with forceps.2. Puncture the limbus with a 33-gage needle attached to a Hamilton
syringe while immobilizing.3. Insert the needle into anterior chamber parallel to the iris plane. Care
must be taken not to damage the iris as this tissue is rich in bloodvessels and heavy bleeding may occur.
4. Slowly inject the virus solution (<1 µL). Rapid injection and toomuch volume may lead to increased intraocular pressure (glaucoma),particularly in smaller eyes.
5. Leave the needle in place approx 30 s and then carefully withdraw it.To minimize leakage of injection solution, immediately press theinjection site (gently) with a sterile swab.
6. Finally, apply ointment to the cornea as in Subheading 3.2.1.
3.3. Surgical Procedures in Larger Animals (see Note 3)
3.3.1. Subretinal Injection
After anesthesia has been achieved, and pupils have been dilated(topical application of Mydriacyl and Mydfin), apply betadine tothe ocular area.
1. Use a lid speculum to keep the eye open.2. Perform a fornix-based conjunctival peritomy in one quadrant to
expose the underlying sclera.
132 Liang et al.
3. Treat the external sclera lightly with cautery at the incision site.4. Perform an anterior chamber paracentesis with a 30-gage needle to
soften the eye prior to injection (and to obtain fluid, if desired, forexperimental purposes).
5. Use a 30-gage needle to incise the sclera approx 2 to 3 mm posteriorto the corneoscleral limbus (pars plana).
6. Insert the 30-gage anterior chamber cannula (connected to thesyringe components as shown in Fig. 1) through the sclerotomyincision. As shown in Fig. 1, the syringe/tubing assembly allowsthe surgeon flexibility in directing the needle to the target region.An assistant holds the saline-filled syringe.
7. A 30-gage blunt-tipped anterior chamber infusion cannula is intro-duced through the scleral incision into the vitreous.
8. Apply a drop of Goniosol to the corneal surface and visualize (usingcoaxial illumination from the operating microscope) the retinathrough a plano convex fundus contact lens held to the cornealsurface.
9. Press the tip of the 30-gage cannula gently against the retina in atangential orientation.
10. When the needle is tightly apposed to the retina, the assistant shouldbriskly inject a defined amount of fluid from the saline-containingsyringe. This, in turn, results in a controlled injection of purified virusinto the subretinal space.
11. The localized retinal detachment should be visible through the oper-ating microscope. A cartoon depiction of the large animal injectionprocedure is presented in Bennett et al. (5).
12. Retinal vessels should be assessed to assure that they remain wellperfused during and following the procedure.
13. Ointment (preferably PredG; Allergan Pharmaceuticals, Irvine, CA)should be applied to the corneas to minimize drying of this tissue asthe animal recovers from anesthesia.
3.3.2. Intravitreal Injection
Perform intravitreal injection similarly as described for the mouse(Subheading 3.2.2.) except that up to 100 µL of solution can beinjected. Retinal vessels should be assessed to assure that theyremain well perfused during and following the procedure.

Intraocular Delivery of Recombinant Virus 133
3.3.3. Intracameral Injection
Perform intravitreal injection similarly as described for the mouse(Subheading 3.2.3.). Up to 50 µL of solution can be injected.
3.4. In Vivo Assessment by Ophthalmoscopy (see Note 4)
Ophthalmoscopy can be used to verify that the retina has beendetached immediately after subretinal injection and that it has reat-tached during the recovery period. Ophthalmoscopy can also beused to assess the health of the retina and to identify fluorescentlytagged transgenes through illumination with the exciting wave-length of light (1,6).
1. Dilate the pupils as described in Subheading 3.2.1. or 3.3.1.The rodent fundus can be observed under illumination from thelight of the indirect ophthalmoscope through a 78 or 90 diopterlens. The fundus of a larger animal can be observed through a20 or 28 diopter lens.
2. Advance the lens slowly and carefully towards the eye keeping thered reflex of the fundus centered. As the lens approaches the eye, theimage from the fundus will enlarge and fill the lens. The image willbe inverted.
4. Notes
1. If the virus has been purified appropriately, it should be “sterile,”i.e., lack other contaminants (7). Quality control of virus prepara-tions is important. Recombinant adenovirus should be free of wild-type adenovirus. Adenovirus stocks can be screened for presence ofwild-type virus through polymerase chain reaction (PCR) of regionsthat should be deleted in the recombinant (1). Recombinant AAVpreparations should be screened for presence of replication-compe-tent AAV (and adenovirus, if that was used to generate the rAAV).Replication-competent AAV can be detected through Western blotor immunohistochemical analyses of rep and cap proteins (8). Alter-natively 293 cells can be infected with the rAAV in the presence ofadenovirus. The DNA harvested from the resulting lysate can be ana-lyzed by Southern blot analysis using a rep probe. Rep, reflecting thepresence of wild-type AAV, should not be detected. Recombinant

134 Liang et al.
adenovirus that contaminates rAAV preparations can be inactivatedand removed through heat denaturation and sedimentation throughcesium. It is currently difficult to remove contaminating replicationcompetent AAV. Presence of 10% glycerol in virus stocks causesminimal toxicity after intraocular injection. Dose of the virus can bea critical variable for analysis of experimental results. For example,no transduced cells are observed after subretinal injection of 1 × 10⁵
IU of rAAV but up to 100% of photoreceptors are transduced afterinjection of 1 × 10⁸ IU of the same virus (2). Dilution of virus withPBS-20%S may be preferable to dilution with HBS as use of thedenser solution facilitates monitoring of the accuracy of injection.
Once an aliquot of virus has been thawed for an experiment, itshould be refrozen with a label noting that it has been thawed. Trans-duction efficiency diminishes markedly upon repeat freeze-thawingof viruses. A fresh aliquot of virus should be used for each new ani-mal experiment. However, aliquots of previously thawed virus canbe used in many situations—for example, in in vitro studies.
2. Surgical Procedures in Mice: Any evaluation of the effect of virus onanimals should be performed in accordance with the ARVO State-ment for the Use of Animals in Ophthalmic and Vision Research andwith federal, state, and local regulations. Prior to initiating experi-ments in animals, approval must be obtained from the local animalcare and use committee and from the Environmental Health andSafety Committee. Animals that are exposed to recombinant virusshould be maintained in a colony separate from other animals in thefacility. There should be mechanisms in place to autoclave wastematerial that has been in contact with the treated animals (bedding,food, cages, cage tops, etc.). Biohazard safety level 2 proceduresshould be in place at all times. These include use of gloves and pro-tective apparel and no mouth pipeting. All materials coming incontact with recombinant virus should be decontaminated with10% bleach and disposable materials should be autoclaved and dis-posed of appropriately. The minimal number of animals should beused to obtain statistically significant results. The colony of animalsshould be screened periodically to assure that there are no otherpathogens present that may affect the health of the animals/the effectsof the virus treatment. Aseptic technique should be used and allreagents and instruments that come in contact with the eye should besterile. Animals should be appropriately anesthetized. Avertin pro-vides fast onset, short term (approx 1 h) anesthesia for mice. How-
Intraocular Delivery of Recombinant Virus 135
ever, use of old solutions can result in toxicity. Avertin should bestored at 4°C. It should be warmed to 37°C immediately before use.Younger mice are more sensitive to avertin, so the lowest dose pos-sible should be used. To avoid hypothermia, maintain animals undera heat lamp until they have recovered their ability to roll over orblink. This takes approx 1 h for avertin-induced anesthesia (or longer,if higher doses are used). Complete recovery takes 2–4 h. Otheranesthetics besides avertin are better suited for other animal species.Pentobarbital (25–40 mg/kg intraperitoneally) is effective with rats,for instance. Pupils can be dilated while waiting for anesthetic totake effect. Rodents that have been injected should be numberedsequentially by either ear punches or toe clipping. Toe clippings arepreferable in newborn mice as the ears are too small to punch reli-ably. Animals should receive regular postoperative care to assurethat there are no untoward complications. The surgical field and allreagents and surgical tools that come in contact with the eye shouldbe sterile. Surgical instruments should be autoclaved; fresh (sterile)needles should be used for injections; Hamilton syringes can crack ifautoclaved. These should be sterilized by washing 6–7 times withsterile water, incubating in 70% ethanol for 2 d, washing again insterile water 6–7 times, and air-drying on a sterile surface. It is criti-cal to have surgical tools that are in good condition. The Dumontforceps are particularly fragile and care should be taken in storage ofthese instruments as they are very expensive. If they become dam-aged/misaligned, they can be repaired by following the instructionsin the tweezer repair kit (Ernest F. Fullam, Latham, NY). In order toassess the depth of the needle during the subretinal injection proce-dure, it is helpful to mark a point approx 1 mm from the tip of theneedle with an indelible marker prior to performing the procedure.The volume of solution to be injected into the subretinal space ofmice should not exceed 1 µL. It is difficult to measure the exactamount that remains in this space as there is usually some leak-age from the needle entry site. This can be minimized by holding theneedle in this space for a short time (20 s) after injection. It may beeasier to learn how to perform and assess accuracy of subretinalinjections in albino mice (such as CD-1 mice) rather than pigmentedmice (such as C57Bl/6 mice). This is because the injection needlecan be visualized through the lightly pigmented sclera in the albinomouse. Care must be taken in all surgical procedures in the rodenteye to avoid damage to the lens. The rodent lens occupies most of

136 Liang et al.
the space in the vitreous cavity and is easy to injure. Damage to thelens can cause cataracts as well as a significant inflammatoryresponse. Data from animals in which the lens has been damagedshould be evaluated as a separate category. For situations in whichvirus-mediated transduction of anterior segment structures is desired,intravitreal injections are recommended over intracameral injections.Because the flow of ocular fluid is from posterior to anterior,intravitreal injection results in exposure of anterior segment struc-tures such as corneal endothelium, trabecular meshwork, iris pig-ment epithelium, and lens epithelium (9,10), as well as retinalganglion cells and Muller cells (2,8).
3. Surgical Procedures in Larger Animals: The same animal welfareand environmental safety concerns apply to surgical proceduresadministered to larger animals as with rodents (Subheading 4.2.). It isimportant to perform surgical procedures in larger animals in con-sultation with a technician experienced with veterinary anesthesia.For intraocular injections, the corneoscleral limbus (pars plana) isselected as the needle entry site. Because of the reduced blood sup-ply at this site, the likelihood of hemorrhage here is less than afterinsertion into other portions of the eye. Small amounts of bleedingcan be stopped rapidly with cautery. In large animals, it is possible toperform a subretinal injection under direct visualization. Because thelens occupies only a small portion of the vitreous cavity, the injec-tion needle can be introduced via an anterior approach (see Bennettet al. ref. 5 for a comparison of injection procedures in rodents ver-sus large animals).
Doses should be scaled up proportionately in the eye of larger ani-mals compared to a mouse. For example, similar levels of photore-ceptor transduction are observed after injection of 1 × 10⁸ IU ofrAAV in the mouse as 1.2 × 10¹⁰ IU in the dog (8). There is a riskof increased intraocular pressure, however, if more than 100 µL ofsolution are injected into the subretinal space. Pilot experimentsevaluating the effect of dose should be performed for each vec-tor/species to be tested. Obviously, scale-up procedures for virusproduction are important when considering selecting a larger animalfor study than a rodent. Scale-up is not an issue for injections ofrecombinant adenovirus, where large amounts of virus are producedin each lot. It is an issue for studies involving recombinant AAV,where it is more difficult to purify large amounts of high titer virus.Studies evaluating effects of treatment on components of ocular fluid

Intraocular Delivery of Recombinant Virus 137
should be done in large animals (not in rodents). Fluid can beobtained readily through anterior chamber paracentesis. In eyes ofrabbits, dogs, and monkeys, it is possible to obtain 50–100 µL offluid without injuring the eye (1,8). Anterior chamber paracentesisshould be performed at least 2 wk prior to fundus photography orelectroretinography, however, as the low-level inflammation result-ing from this treatment can reduce the quality of data derived fromthose procedures.
4. In Vivo Assessment by Ophthalmoscopy: As described in Chapter 11of this volume (11), ophthalmoscopy requires patience and practice.Gross features of the fundus that can be identified ophthalmoscopi-cally include: color and contour of the optic disk, the caliber of theretinal blood vessels, the homogeneity of the pigment epithelial layerunderlying the retina and the presence of any opacities in the vitre-ous or lens. There is a wide variation in the fundus features of differ-ent pigmented strains and species of animals. It would be worthwhilefor anyone considering to use ophthalmoscopy regularly, to view theretinas of as many untreated animals of different strains as possible toget an idea of what is normal (see Chapter 11 for discussions on diffi-culties the novice will face with ophthalmoscopy and ophthalmo-scopic abnormalities encountered in different strains of mice (11).Ophthalmoscopes with teaching lenses are available. It would behelpful for the novice, to view retinas with someone familiar withthis technique. The inexperienced ophthalmoscopist should concen-trate on viewing retinas of pigmented animals as fundus features ofalbino animals are difficult to appreciate. Subretinal injection resultsin a localized detachment of the retina which is visible ophthalmo-scopically (3,12,13). The detachment generally resolves within 24 hof injection. It is usually possible, however, to identify the affectedarea long after the injection. Clues are presence of the hole madeupon needle entry and often a birefringent appearance of the bordersof the detached region of retina. Identification of the injection sitecan be helpful in evaluations of retinas that have been injectedsubretinally with a vector encoding a fluorescently labeled protein,such as green fluorescent protein (GFP). The location of the express-ing cells can often be confirmed by identifying the injection site firstwith the white light of an ophthalmoscope and then identifying theexpressing cells after viewing through a cobalt blue filter (6,8). Oph-thalmoscopic evaluation of fluorescent markers is difficult if notimpossible in eyes of albino mice (8). The background pigmentation

138 Liang et al.
in pigmented eyes seems to provide enough contrast to allow detec-tion of fluorescent compounds. It will be difficult to evaluate theretina ophthalmoscopically if there is a high amount of inflammationfollowing an intraocular injection. For example, intravitreal orintracameral injection of recombinant adenovirus can result in sig-nificant vitritis that obscures the retina (3,14). Accidental damage ofthe lens during the surgical procedure can also result in significantinflammation. Mouse fundus photography is difficult and shouldonly be attempted by a skilled ophthalmoscopist. Methods aredescribed by Bennett et al. (5). In order to photograph fluorescentcompounds observed through the ophthalmoscope, it is possible toilluminate the eye with the exciting wavelength of light by coveringthe light source with the appropriate gelatin filter. For example, bytaping a Wratten #47B gelatin excitation filter (Kodak, Rochester,NY) to a Kowa camera, it is possible to photograph retinal cellsexpressing GFP (6,8).
Acknowledgments
This work was supported by a Research to Prevent BlindnessDepartmental Award, NEI RO1s EY10820 and EY 12156 (JB),AHA F98223E (VA); a Center Grant from Foundation FightingBlindness, Inc; the Pennsylvania Lions Sight Conservation and EyeResearch Foundation (JB); NIH P30 DK47757-05; Layton Bio-science, Inc.; the Paul and Vebanina Mackall Foundation Trust andthe F. M. Kirby Foundation.
References
1. Bennett, J., Zeng, Y., Bajwa, R., et al. (1998) Adenovirus-mediateddelivery of rhodopsin-promoted bcl-2 results in a delay in photo-receptor cell death in the rd/rd mouse. Gene Ther. 5, 1156–1164.
2. Bennett, J. and Anand, V. (1999) Recombinant adenovirus and genetherapy. Int. Retinitis Pigmentosa Assoc., http://www. irpa. org/sci-news/topbenne. htm.
3. Bennett, J. and Maguire, A. M. (1998) Gene therapy and potentialapplications to age-related macular degeneration, in Age-RelatedMacular Degeneration (Fine, S. L., Berger, J. W., and Maguire, M.,eds.), Mosby, St. Louis, MO, pp. 395–412.

Intraocular Delivery of Recombinant Virus 139
4. Wallace, R. T. and Vander, J. F. (1993) A simple technique for con-trolled subretinal injections. Retina 13, 260,261.
5. Bennett, J., Anand, V., Acland, G. M., and Maguire, A. M. (2000)Cross-species comparison of in vivo reporter gene expression afterrAAV-mediated retinal transduction. Methods Enzymol. 316, 777–789.
6. Bennett, J., Duan, D., Engelhardt, J., and Maguire, A. M. (1997) Real-time non-invasive in vivo assessment of adeno-associated virus-mediated retinal transduction. Invest. Ophthalmol. Vis. Sci. 38,2857–2863.
7. Bennett, J., Zeng, Y., Gupta, A. R., and Maguire, A. M. (2000)Application of adenoviral vectors: analysis of eye development, inDevelopmental Biology Protocols, vol 1 (Tuan, R. S. and Lo, C. W.,eds.), Humana, Totowa, NJ, pp. 525–535.
8. Dudus, L., Anand, V., Chen, S.-J., et al. Persistent transgene productin retina, optic nerve and brain after intraocular injection of rAAV.Vision Res. 39, 2545–2554.
9. Budenz, D., Bennett, J., Alonso, L., and Maguire, A. (1995) In vivogene transfer into murine trabecular meshwork and corneal endothe-lial cells. Invest. Ophthalmol. Vis. Sci. 36, 2211–2215.
10. Hoffman, L. M., Maguire, A. M., and Bennett, J. (1997) Cell-medi-ated immune response and stability of intraocular transgene expres-sion after adenovirus-mediated delivery. Invest. Ophthalmol. Vis. Sci.38, 2224–2233.
11. Gupta, A. R., Dejneka, N., Maguire, A. M., and Bennett, J. (2000)Generation of transgenic mice for studies of ocular development anddisease, in Methods in Molecular Medicine, vol 47: Vision ResearchProtocols (Rakoczy, P. E., ed.), Humana, Totowa, NJ.
12. Bennett, J., Wilson, J., Sun, D., et al. (1994) Adenovirus vector-mediated in vivo gene transfer into adult murine retina. Invest.Ophthalmol. Vis. Sci. 35, 2535–2542.
13. Li, T., Adamian, M., Roof, D. J., et al. (1994) In vivo transfer of areporter gene to the retina mediated by an adenoviral vector. Invest.Ophthalmol. Vis. Sci. 35, 2543–2549.
14. Maguire, A. M., Bennett, J., Nickle, A., et al. (1995) Adenovirus-mediated gene transfer to canine retinal photoreceptors: effects ofinflammation. Invest. Ophthalmol. Vis. Sci. 36, S777.

Preparation of Recombinant Adenoviruses 141
141
From: Methods in Molecular Medicine, vol. 47: Vision Research ProtocolsEdited by: P. E. Rakoczy © Humana Press Inc., Totowa, NJ
8
Preparation of Recombinant Adenoviruses
Karl G. Csaky
1. Introduction
Adenoviruses are viruses with genomes of double-stranded DNAapprox 36 kb in size. There are more than 100 different serotypesthat have been identified, 47 of them of human origin. Human sero-types have been grouped into six subgenera (A–F) and whereassequence similarity between genera is low, other molecular biologicaspects of the viruses are almost identical. Of all the humanadenoviruses, serotypes 2 and 5 (subgenus C) have been the mostextensively studied (1).
Recently, more interest in the molecular biology of adenoviruseshas arisen because of their potential as mammalian expression vec-tors. The virus has the advantage of being stable, maintaining for-eign genes through viral vector production and exhibiting relativeease in generation of high titer stocks. Additionally, expression ishigh level and the virus has the ability to infect a large variety ofboth dividing and nondividing cells (2,3). Adenoviral vectors havebeen shown to be effective for delivery of genes into various partsof the eye in both neonatal (4) and adult animals. These vectorshave been able to transduce cornea (5,6), iris, trabecular meshwork,lens epithelium (7), and the retina (8). Interestingly, the retinal pig-ment epithelium appears to be more susceptible to adenoviral gene

142 Csaky
transfer than other cells of the retina (8). Although most of thesestudies have shown efficient and high-level gene expressionfollowing adenoviral gene transfer, the duration of this expressionwas relatively short amounting generally to weeks of activity (4,8).A major drawback to the use of adenoviral vectors is the well-estab-lished cytopathic and immunologic responses that this class of viralvector can produce (2,3).
To understand how adenoviral vectors are generated, one mustunderstand the genomic structure (see Fig. 1) and lifecycle of theparent virus. The viral DNA is double-stranded, but transcriptionoccurs from both strands and various other RNA species areformed from alternate splicing. Therefore, the DNA is highlyefficient is producing a large variety of proteins. There are threeregions in the DNA that can accept substitutions with promoter/transgene sequences; E1, E3 regions, and an area distal to E4 (9).Vectors with mutations in E2 (10) or E4 (11) regions have beengenerated in an attempt to further improve the safety of thesevectors. Recently, vectors have been produced in which the entireviral genome, except for extreme terminal regions, have beenreplaced by exogenous gene sequences, so-called “gutless” aden-oviral vectors, where the helper cells produce, in trans, all viralproteins required for viral replication (12). However, this chapterwill only focus on production of conventional E1 or E1/E3 deleted
Fig. 1. Genomic structure of human adenovirus type 5.

Preparation of Recombinant Adenoviruses 143
vectors. Because of the size of these regions, the limit to insertionof DNA in E1/E3 deleted vectors is approx 8 kb.
The replication cycle of the virus can be seen to occur in twophases, one occurring prior to and during viral DNA replicationand the second involving generation of the viral structural pro-teins. In phase 1, virus absorbs and penetrates the host cell followedby expression of the early genes (E1a, E1b, E2, E3, and E4), a pro-cess that lasts 5–6 h (13,14). Viral DNA replication occurs withconcomitant entrance into phase 2 and expression of the structuralproteins of the virus core and capsid, a phase that lasts approx 20–24 hdepending on the number of viruses that infect (MOI = multiplicityof infection = number of infectious virus particles per cell) (15).Low MOI may result in longer times to completion of the replica-tion cycle. The E1 region encodes two major proteins, E1a and E1b.E1a, the first adenoviral gene expressed, increases transcription ofall subsequent viral genes and along with E1b ensures that the hostcells enter S phase where viral replication is most efficient (16).The E2 genes are directly involved in viral DNA replication (17)and the E3 genes, although not essential for virus replication, areimportant in reducing the immune response to an adenoviral infec-tion (18). The E4 region involves a complex set of proteins criticalfor viral replication, including those affecting viral DNA replica-tion, transcription of late viral coat proteins, and viral assembly (19).
Replicated viral DNA and associated viral core proteins areformed in the nucleus. Final assembly of the virus also occurs in thenucleus, but only after empty, immature capsids have been assembled.This process is inefficient with only about 10% of the total viralDNA packaged into virions (20). Infected cells can remain intactwithout lysing and accumulate viral particles in their nuclei. How-ever, disruption of the cytoskeleton of the cell does occur, whichresults in rounding up and a shape change in infected cells. Thisappearance of the adenovirus cytopathic effect (CPE) results in agrapelike clustering of the cells (1,21). Eventually, host cells rup-ture when release of infectious virions occurs.
The process of generating E1 or E1/E3 deleted adenoviral vec-tors involves the cloning of the foreign gene and promoter into a

144 Csaky
shuttle plasmid in a replacement region for E1 along with the leftend of the adenoviral genome. This plasmid is cotransfected alongwith virion DNA into the appropriate helper 293 cells. In vitrohomologous recombination results in switching of the left end ofthe virion DNA with the shuttle plasmid and generation of an aden-ovirus deleted in E1. To prevent wild-type nonrecombined virusfrom being produced, the virion DNA is engineered with a filler inthe E1 region resulting in adenovirus DNA of 40 kb, a size thatexceeds the packaging capabilities of infectious particles (22). As longas the inserted sequences for the E1 region in the shuttle plasmidproduce recombinant adenovirus DNA that does not exceed the36–37 kb packing limit, infectious recombined particles are pro-duced. Alternatively, virion adenoviral DNA is constructed lackingpackaging signals, which are then supplied by the recombinedshuttle plasmid. For more extensive transgenes, virion DNA con-taining additional E3 substitutions can be used (23).
Both types of virion adenoviral DNA contain an ampicillin resis-tance gene and a bacterial origin of replication allowing for bacte-rial production of the virion DNA. 293 cells, a human embryonickidney cell line engineered to express E1 sequences, provide E1proteins in trans, during propagation of an E1-deleted vector (24).Subsequent steps in the generation of the vector involves isolationof single virus clones utilizing a standard overlay technique. Onceindividual viral clones are identified, verification of the clone is pre-formed by either polymerase chain reaction (PCR) or dot-blot analy-sis of the viral DNA. Enlargement of the viral vector pool on 293 cellsis then performed in 10-cm2 dishes. Vector protein production isverified by enzyme-linked immunosorbent assays (ELISA) or West-ern blot analysis. This step is following by viral amplification withresultant generation of a large-scale 293 cell infection. Purificationof virus via double-cesium gradient ultracentrifugation results inadenoviral vector stocks. The quantity of virus is then determinedby plaque titration. Final viral vector is then reverified for appropri-ate transgene expression and screened for wild-type adenoviruscontamination.

Preparation of Recombinant Adenoviruses 145
2. Materials
2.1. Plasmids
1. E1 shuttle plasmids with various multiple cloning sites containingeither human (p E1spA, B, or pCA vectors) or murine (pMH vec-tors) CMV promoter regions are available from Microbix Biosystems(Toronto, Ontario, Canada).
2. Virion adenovirus DNA: Adenoviral virion DNA containing unpackage-able sequences with deletions only in E1 (pBHG or JM17) or lackingpackaging signal with substitutions in both E1 and E3 (pBHG 10,11) are available from Microbix Biosystems (22,23).
2.2. Cells
1. 293 cells: All E-1 deleted mutant viruses need to be grown in293 monolayers cells. These are available from Microbix Biosystemsas 293 low passage cells.
Media requirements: Iscove’s minimal essential media (IMEM)containing 10% fetal bovine serum (FBS).
2. A549 cells: available from American Type Culture Collection(Rockville, MD).
Media requirements: Complete media: Dulbecco’s modified Eagles’smedium (DMEM) containing 10% heat-inactivated fetal calf serum(HIFCS). Maintenance media: DMEM containing 5% HIFCS.
2.3. Large-Scale Adenoviral Vector Production
1. Nunclon vented triple flasks can be obtained from Nunc (Denmark)(see Note 5) with a flask area of 525 cm2.
2. Buffered cesium chloride (1.25 g/mL and 1.4 g/mL) can be obtainedfrom Biowhittaker (Walkersville, MD).
3. Beckman ultracentrifugation tubes can be purchased through (Beckman#331372) (Fullerton, CA).
4. 10 K dialysis cassettes, volumes of 0.5–3.0 mL (Pierce, Rockford, IL),should be used.
2.4. Dot Blot DNA Analysis
1. Denaturing solution: 0.5 N NaOH.2. Neutralizing solution: Solution containing 1.5 M NaCl and 1.0 M
Tris-HCl pH 7.4.

146 Csaky
3. 10 X SSC: Solution of 1.5 M NaCl and 0.15 M sodium citrate, finalpH 7.5.
3. Methods
3.1. Cloning and Generationof Homologous Recombinant Vectors
1. Clone desired gene into appropriate shuttle vector (see Note 1) usingstandard cloning techniques.
2. Establish 293 cells at 70–80% confluency in 6-well dishes (see Note 2).3. Standard transfection technique (see Note 1): Cotransfect 5–10 µg of
shuttle plasmid DNA along with 5–10 µg of virion adenoviral DNAin serum-free media or appropriate transfection media. Allow to sitfor instructed time and wash cells with serum-free DMEM. Proceedwith overlay (see Subheading 3.2.).
3.2. Isolation of Single Viral Clones (Overlay)
1. Prepare overlay as follows (see Note 3).a. Add 100 U/mL penicillin 100 µg/mL streptomycin and fetal calf
serum to 2% to 2X IMEM and warm to 32°C.b. Melt 0.4% bacto-agar/1.6% yeast extract in sterile water and cool
to 44°C in a water bath (see Note 3).c. Mix equal volumes of the above solutions in a 50-mL sterile coni-
cal tube and shake gently by hand (overlay solution).d. Aspirate media off 293 cells.e. Gently apply approx 3 mL overlay solution/well of 6-well dish.f. Allow overly to “harden” at room temperature for 20–30 min.g. Place in cell incubator with lid.h. “Feed” overlays by repeating steps 1–6 every 6 d and place over
existing agar.i. Plaques should appear between 7–14 d.j. Allow plaques to develop for 2–14 d (see Notes 4 and 5).k. Allow plaques to expand for 2–3 d.
2. Cut a 1000-µL sterile pipet tip and use appropriate cut end to aspirateplaque/overlay plug ensuring that individual plaques are isolatedwithout neighbor plaque contamination.
3. Place plug in 2 mL IMEM with 2% FBS in 5-mL sterile snap-on tube.4. Freeze/thaw (see Note 6) × 4 and spin at 20,000g for 5–10 min at 4°C.

Preparation of Recombinant Adenoviruses 147
5. Aspirate supernatant with a 3-mL syringe and push through a 0.22-µmsyringe filter. (May freeze sample at –80°C or proceed to Verification.)
3.3. Verification
3.3.1. Generation of Cellular Viral Lysate (CVL) Supernatant(see Note 7)
1. Establish 293 cells at 70–80% confluency in 6-well dishes and growin IMEM containing 10% FBS.
2. Take supernatant from Subheading 3.2.5. and mix 200 µL with 1.8 mLserum-free IMEM and place into one well.
3. Incubate for 90 min, then add 2.0 mL of IMEM containing 10% FBS.4. Change media (2 mL IMEM containing 10% FBS) at 24 h and every
3 d thereafter.5. Remove cells from well once CPE is evident (either with aspiration
or scraping) (see Note 9).6. Pellet cells by centrifugation 5 min at 2000g.7. Freeze/thaw (see Note 6) cell pellet with supernatant × 4 and spin at
20,000g for 5–10 min at 4°C.8. Aspirate supernatant with a 3-mL syringe and push through a 0.22-µm
syringe filter. (May freeze sample at –80°C or proceed to other steps.)
3.3.2. Viral DNA Extraction from CVL
1. Add CVL supernatant to proteinase K (final concentration 1 mg/mL)and sodium dodecyl sulfate (SDS) (final concentration 0.025%) at a1:1 v/v supernatant/(proteinase K + SDS).
2. Incubate overnight at 37°C.3. Extract with 1 vol of buffered phenol/chloroform.4. Precipitate DNA with 0.1 vol 3 M NaAcetate/2 vol of 100% ethyl
alcohol and wash DNA with 80% ethyl alcohol.5. Resuspend DNA in 10–100 µL Tris-ethylenediamine tetraacetic acid
(EDTA) (pH 8.0).
3.3.3. DNA Verification
1. Dot/Blota. Mix DNA (minimum 10 µL sample) with 10 vol of denaturing
solution and incubate for 5 min at room temperature.

148 Csaky
b. Add an equivalent volume of neutralization solution.c. Place two pieces of prewet Whatmann 3MM paper and one piece
of a Nytran membrane on an assembled filtration/vacuum unit.d. Place DNA into wells and aspirate sample.e. Wash wells × 3 with 10X SSC.f. Disassemble apparatus and crosslink DNA.
2. Hybridize under standard conditions with probe specific for trans-gene using uninfected 293 cellular DNA as control.
3. PCR—use primers specific for transgene utilizing established PCRparameters.
3.3.4. Transgene Protein Verification
1. Grow target cells to 70–80% confluency.2. Mix CVL supernatant to a final concentration of 10% in appropriate
serum free media for infection of target cells at an MOI of 10–100.3. Place on cells for 90 min at 37°C.4. Add 2X media to cells to generate 1X final media.5. After 24 h, replace media with appropriate 1X media.6. After 3–5 d, analyze either cell lysates or conditioned media for vec-
tor transgene production using an appropriate protein detection sys-tem (ELISA or Western blotting).
3.4. Amplification/Purification(Large-Scale Adenoviral Preparation)
1. Split rapidly growing 293 cells 1:4 or 1:5 and place finally in 24–30-vented triple flasks at approx 70% confluency (see Note 8).
2. Transduce with either purified virus or CVL at an MOI of 0.05–0.1.3. Transduce the 293 cells in 20 mL of IMEM containing 2% FBS.
Place in incubator and wait 90 min. Add 20 mL of IMEM containing20% FBS.
4. Carefully watch cells and look for beginning of CPE, which typi-cally occurs within 24–48 h (see Note 9). Cells are typically ready toharvest after approx 48–72 h.
5. Harvest cells from triple flasks by bumping the flasks and transferringthe cell containing medium to autoclaved 500-mL centrifuge bottles.
6. Wash the flasks with 500 mL of serum free IMEM and pass the mediaflask to flask and combine wash medium with the rest of media inthe centrifuge tubes.

Preparation of Recombinant Adenoviruses 149
7. Pellet cells at 2000g and remove all but approx 10 mL of supernatant.8. Resuspend cell pellet by vortexing.9. Transfer cells to 50-mL conical tube and freeze/thaw ×4 (see Note 6).
10. Pellet debris by spinning for 5 min at 8000g.11. Place supernatant onto cesium chloride step gradient. Create cesium
chloride step gradient by placing 2.0–2.5 mL of 1.4 g/mL bufferedcesium chloride into a Beckman ultracentrifuge tube. Gently, over-lay (do not mix) with 1.5–2.0 mL of 1.25 g/mL buffered cesium chlo-ride. (Important: each tube should contain at least 10.5 mL of totalvolume. If volume of supernatant needs to be split, then top off tubeswith appropriate volume of serum-free IMEM to final volume of10.5 mL).
12. Centrifuge for 1 h at 210,000g at 4°C in an SW-41 swinging bucketBeckman ultracentrifuge rotor.
13. Following spin, identify virus band at interface of the two cesiumdensities (see Note 10).
14. Harvest band by inserting a 20-gage needle on a 3-cc syringe, bevelup, just below the live virus band and pull as much of the band with-out aspirating other bands (see Note 10).
15. Transfer the virus band to a fresh Beckmann centrifuge tube and fillthe tube with a 1:1 mixture of 1.2 g/mL:1.4 g/mL cesium chloridesolution to a final volume of 10.5 mL. The balance tube can be pre-pared with 1.32 g/mL cesium chloride solution.
16. Place tube along with balance tube in ultracentrifuge and spin for16–18 h at 210,000g at 4°C in an SW-41 swinging bucket Beckmanultracentrifuge rotor. Pull the live virus band (see Note 10) asdescribed above.
17. Place live virus band into dialysis cassette.18. Dialyze as follows:
a. generate dialysis solution (per 4 L):• 400 mL glycerol (final concentration 10%);• 40 mL 1 M Tris-HCl, pH 7.4;• 2 mL 2 M MgCl2;
b. Autoclave solution and store at 4°C until use.c. Dialyze in 1 L vol for 1 h with gentle agitation.d. Change dialysis fluid every 1 h × 4 changes.
19. Remove live virus from cassette and aliquot (see Note 9).20. Store at –80°C (see Note 11).

150 Csaky
3.5. Plaque Titration (see Note 12)
1. Seed 293 cells in a 6-well dish and allow to grow until 90% confluent.2. Make 10-fold dilutions in 2% IMEM of CVL supernatant from 10–4
to 10–9 or purified vector from 1:10–7 – 1:10–12 with the final volumebeing approx 2 mL/well.
3. Remove growth media from cells and replace with virus containingmedia.
4. Incubate at 37°C for 60–90 min.5. Add 2.0 mL of IMEM containing 10% FBS.6. At 24 h, remove virus containing media and replace with overlay
(see Subheading 3.2.1.).7. Titer of virus = number of plaques/well/dilution.
3.6. Detection of Wild-Type Recombinant Virus(see Note 13)
1. Plate A549 cells in a 150-mm dish in A549 complete media.2. When cells are at 80–100% confluency, place vector stock in 5 mL
of serum-free DMEM at an MOI = 10–20 (approx total of 5 × 10⁸ pfuof viral vector).
3. Place on cells for 90 min then add 5 mL of A549 complete media.4. Replace media at 24 h and every 3 d with A549 complete media.5. By 5–6 d, cell changes should be evident, which are a result of direct
viral penton toxicity.6. Scrape cells and pellet by centrifugation at 2000g at 4°C for 5 min.7. Remove supernatant and freeze/thaw pellet × 3 times (see Note 6).8. Resuspend in 2 mL of A549 maintenance media.9. Dilute in 3 mL of serum-free DMEM and place onto a 150-mm dish
of A549 cells grown to 80–100% confluency. Wait 90 min, then add5 mL of A549 complete media.
10. Replace at 24 h and maintain the cells with A549 maintenance media.11. Observe cells for development of cytopathic effect. Recombinant
wild-type virus contamination will show signs of CPE after approx10–16 d.
4. Notes
1. It is important that the shuttle plasmid and the virion DNA “match”(see Subheading 1.). If extension transgenes are to be used then

Preparation of Recombinant Adenoviruses 151
virion DNA lacking E3 sequences should be utilized. Make sure thatthe packaging limits of the recombined DNA do not exceed 37 kb.Purity of both the shuttle plasmid and virion DNA should be highenough (either anion column or cesium chloride purity) to ensurehigh efficiency of transfection. Numerous techniques for transfec-tion are now available (many commercially available) so details willnot be outlined here. However, most investigators utilize calciumchloride transfection. Electroporation should not be used.
2. The quality and condition of the 293 cells are critical for efficienttransfection and recombination. Ensure that the plated cells areexhibiting a doubling rate of approx 1–2 d and that 90–100% of thecells are viable. Also, when plating, ensure that complete trypsiniza-tion has occurred avoiding clumps or nonuniform plating of the cells.One to four wells of a standard 6-well dish can be used.
3. The bacto-agar/yeast extract can be made beforehand, autoclaved,and stored at 4°C.
4. If multiple attempts at cotransfection do not result in generation ofCPE, then verification of the transfection efficiency should be per-formed with standard marker plasmids (green fluorescent protein[GFP] or lacZ). Alternatively, more elaborate schemes for cotrans-fection of shuttle and virion DNA involving the use of adenoviralDNA–protein complexes can be used (see details in ref. 25). Thetransgene may also be potentially toxic to or growth arresting the293 cells in which case inducible promoter strategies may need tobe employed.
5. Depending on several factors, plaques can take up to 2 wk to form.If, however, no plaques form after this time, see Note 4. It is impor-tant that the investigator learn how to recognize CPE or plaque for-mation. Wild-type adenoviral DNA can also be obtained fromMicrobix Biosystems, transfected into 293 cells and overlaid so thatthe generation of virus can be observed.
6. Freeze/thawing must be complete for optimal virus isolation. Tubesshould be placed in a dry-ice/ethyl alcohol bath until complete freez-ing has occurred. This should be followed by immersion at 37°Cuntil complete thawing is seen followed by vigorous vortexing.
7. CVL supernatant can be used for various applications including fur-ther expansion of total amount of CVL supernatant prior to large-scale vector production. This can be accomplished by repeatingSubheading 3.3.1. except using a 10 cm2 dish of 293 cells and2.5 mL of total volume for infection and final volume of 5 mL.
152 Csaky
Infections with CVL supernatant should only be used at a maximumof 10% of final volume because cellular debris can be toxic to cells.CVL supernatants usually exhibit a titer of 1 × 10⁷ pfu/mL, but canbe titered if necessary.
8. High titer virus is dependent on the number of 293 cells used. Inthis protocol, approx 1.8 × 10¹⁰ cells are used and typically resultsin 1 mL of vector at titer of 1 × 10¹⁰ – 1 × 10¹² pfu/mL. Investigatorsmay scale down and generate large-scale production in other sizeflasks or dishes recognizing that the amount and titer of the finalproduct will vary.
9. Timing of harvest of the large scale is a critical factor in the amountof final product obtained. Careful observation will determine whencells are exhibiting CPE, but not lysing. This typically happens when80% of the cells are still adherent, but exhibiting “grape-clustering.”
10. Identification and removal of the correct band is critical. To aid inthis step, a dark paper is held behind the tube to assist the investiga-tor in this step. The first centrifugation typically results in a fairlylarge band in the middle of the tube. Complete removal of this bandshould be attempted. In the step centrifugation, the viral band is alsolocated in the middle of the tube, but may not be the largest bandseen. Empty capsid rests towards the top of the tube. If the viral bandis small and the capsid band is large, incomplete viral assemblyoccurred during the infection. Removal of the thickest, lower portionof the viral band may result in a lower amount, but higher titer vector.
11. Storage of the virus can be done with or without sterile glycerol,although it should be remembered that glycerol may affect subse-quent transductions and result in an enhanced inflammatory effect.Thus, it may be required to remove the glycerol by dialysis for futureuse of the vector. Alternatively, the virus is stored in 10–20 µL aliquots,depending on the future need, so that repeat freezing and thawing,which can reduce viral DNA, does not occur.
12. There are various ways to report the amount of virus present in asample. Plaque forming units (pfu)/mL indicates number of293 infectious units of adenovirus. Direct quantitation of viral DNAor amount of protein/mL of sample can be reported. This last num-ber reports the amount of capsid protein in the sample and can pre-sented as a ratio with pfu to indicate the amount of capsid protein perinfectious particle.
13. Although the described procedure is the most sensitive assay fordetection of wild-type combination, PCR using primers for the E1

Preparation of Recombinant Adenoviruses 153
region can also be performed on isolated viral DNA. Becauserecombinant vector should be free of most sequences, contaminatingDNA from the 293 cells may lead to false positives. Additionally,the level of detection of the PCR reaction may not be adequate(see ref. 26).
Acknowledgments
The author would like to thank Drs. Frank Graham, ChristinaAddison, Jay Ramsey, Dan Sullivan, and Michael Blaese for help inrefinements in adenoviral vector production.
References
1. Shenk, T. (1996) Adenoviridae: the viruses and their replication,in Fields Virology (Fields, B. N., Knipe, D. M., Howley, P. M., et al.,eds.), Lippincott-Raven, Philadelphia, PA, pp. 2111–2148.
2. Kovesdi, I., Brough, D. E., Bruder, J. T., and Wickham, T. J. (1997) Aden-oviral vectors for gene transfer. Curr. Opin. Biotechnol. 8, 583–589.
3. Yeh, P. and Perricaudet, M. (1997) Advances in adenoviral vectors:from genetic engineering to their biology. FASEB J. 11, 615–623.
4. Bennett, J., Wilson, J., Sun, D., et al. (1994) Adenovirus vector-mediated in vivo gene transfer into adult murine retina. Invest.Ophthalmol. Vis. Sci. 35, 2535–2542.
5. Mashhour, B., Couton, D., Perricaudet, M., and Briand, P. (1994)In vivo adenovirus-mediated gene transfer into ocular tissues. GeneTher. 1, 122–126.
6. Tsubota, K., Inoue, H., Ando, K., et al. (1998) Adenovirus-mediatedgene transfer to the ocular surface epithelium. Exp. Eye. Res. 67, 531–538.
7. Borras, T., Matsumoto, Y., Epstein, D. L., and Johnson, D. H. (1998)Gene transfer to the human trabecular meshwork by anterior segmentperfusion. Invest. Ophthalmol. Vis. Sci. 39, 1503–1507.
8. Anglade, E. and Csaky, K. G. (1998) Recombinant adenovirus-medi-ated gene transfer into the adult rat retina. Curr. Eye Res. 17, 316–321.
9. Graham, F. L. and Prevec, L. (1992) Adenovirus-based expressionvectors and recombinant vaccines. Biotechnology 20, 363–390.
10. Amalfitano, A., Hauser, M. A., Hu, H., et al. (1998) Production andcharacterization of improved adenovirus vectors with the E1, E2b,and E3 genes deleted. J. Virol. 72, 926–933.

154 Csaky
11. Brough, D. E., Lizonova, A., Hsu, C., et al. (1996) A gene transfervector-cell line system for complete functional complementation ofadenovirus early regions E1 and E4. J. Virol. 70, 6497–6501.
12. Parks, R. J., Chen, L., Anton, M., et al. (1996) A helper-dependentadenovirus vector system: removal of helper virus by Cre-mediatedexcision of the viral packaging signal. Proc. Natl. Acad. Sci. USA 93,13,565–13,570.
13. Chardonnet, Y. and Dales, S. (1970) Early events in the interaction ofadenoviruses with HeLa cells. I. Penetration of type 5 and intracellu-lar release of the DNA genome. Virology 40, 462–477.
14. Greber, U. F., Willetts, M., Webster, P., and Helenius, A. (1993)Stepwise dismantling of adenovirus 2 during entry into cells. Cell 75,477–486.
15. Horwitz, M. S., Scharff, M. D., and Maizel, J. V., Jr. (1969) Synthe-sis and assembly of adenovirus 2. I. Polypeptide synthesis, assemblyof capsomeres, and morphogenesis of the virion. Virology 39, 682–694.
16. Shenk, T. and Flint, J. (1991) Transcriptional and transformingactivities of the adenovirus E1A proteins. Adv. Cancer. Res. 57, 47–85.
17. Pronk, R., Stuiver, M. H., and van der Vliet, P. C. (1992) AdenovirusDNA replication: the function of the covalently bound terminal pro-tein. Chromosoma 102, S39–45.
18. Wold, W. S. and Gooding, L. R. (1989) Adenovirus region E3 pro-teins that prevent cytolysis by cytotoxic T cells and tumor necrosisfactor. Mol. Biol. Med. 6, 433–452.
19. Halbert, D. N., Cutt, J. R., and Shenk, T. (1985) Adenovirus earlyregion 4 encodes functions required for efficient DNA replication,late gene expression, and host cell shutoff. J. Virol. 56, 250–257.
20. Philipson, L. (1984) Adenovirus assembly, in The Adenoviruses(Ginsberg, H. S., ed.), Plenum, New York, pp. 309–337.
21. Horwitz, M. S. (1996) Adenoviruses, in Fields Virology (Fields, B. N.,Knipe, D. M., Howley, P. M., et al., eds.), Lippincott-Raven, Phila-delphia, PA, pp. 2149–2171.
22. Bett, A. J., Prevec, L., and Graham, F. L. (1993) Packaging capacityand stability of human adenovirus type 5 vectors. J. Virol. 67, 5911–5921.
23. Bett, A. J., Haddara, W., Prevec, L., and Graham, F. L. (1994)An efficient and flexible system for construction of adenovirus vec-tors with insertions or deletions in early regions 1 and 3. Proc. Natl.Acad. Sci. USA 91, 8802–8806.

Preparation of Recombinant Adenoviruses 155
24. Graham, F. L., Smiley, J., Russell, W. C., and Nairn, R. (1977) Char-acteristics of a human cell line transformed by DNA from humanadenovirus type 5. J. Gen. Virol. 36, 59–74.
25. Okada, T., Ramsey, W. J., Munir, J., et al. (1998) Efficient direc-tional cloning of recombinant adenovirus vectors using DNA-proteincomplex. Nucleic Acids Res. 26, 1947–1950.
26. Zhang, W. W., Koch, P. E., and Roth, J. A. (1995) Detection of wild-type contamination in a recombinant adenoviral preparation by PCR.Biotechniques 18, 444–447.


Generation of rAAV 157
157
From: Methods in Molecular Medicine, vol. 47: Vision Research ProtocolsEdited by: P. E. Rakoczy © Humana Press Inc., Totowa, NJ
9
Generation of RecombinantAdeno-Associated Virus
Fabienne Rolling
1. Introduction
Adeno-associated virus (AAV) was discovered about 30 yr agoas a contaminant of adenovirus preparations. Since its discovery,researchers have described many unique characteristics of AAVbiology that have made it attractive as a potential vector for genetherapy. For example, AAV is not pathogenic, approx 80% of adultsin the United States are seropositive, but in no case has the virusbeen implicated as the etiological agent for a human disease. AAVis a defective parvovirus with a single-stranded DNA genome of4.6 kb comprising two open reading frames coding for nonstructural(Rep) and structural (Cap) proteins. The entire genome is flankedby two identical 145-basepair (bp) inverted terminal repeats (ITR),as shown in Fig. 1. Possibly, the most striking property of the virusis its inability to productively infect healthy cells in the absence of acoinfection by a helper virus (either adenovirus or herpesvirus).Thus, AAV vectors are inherently replication defective. Infection inthe absence of helper virus leads to integration of the AAV genomeat a specific site on the q arm of chromosome 19 to establish latentinfection (1–3). This is the only known example of site-specificintegration by a mammalian virus and suggests the possibility of a

158 Rolling
vector that can be inserted at a known site in the human genome.Additional features of the virus, which enhance its desirability as avector, include its wide host range and the stability of the virion.
AAV-based vectors contain only the two AAV terminal repeatsnecessary for replication, packaging, and integration. They do notcontain any viral coding sequences that limits any induce immuneresponses to viral translation products. It has been reported thatAAV vectors efficiently transduce many cell types in vitro andin vivo without requiring active cell proliferation (4). Additionally,long-term expression of reporter and therapeutic genes in the brain,muscle, and lung suggest that AAV-based vectors can stably persistin vivo and appear to be safe transducing agents (5–8).
A number of laboratories have started to explore AAV-based vec-tors for gene transfer to the retina. It was found that in mice,subretinal injections consistently transduced RPE cells and photo-receptors, whereas intravitreal injections always transduced cells inthe ganglion cell layer (9,10). Interestingly, by replacing thecytomegalovirus (CMV) promoter with a rod opsin promoter, spe-cific expression of the green fluorescent protein (GFP) was observedin the photoreceptor layer (11). Because GFP has similar absorp-tion-emission characteristics as sodium fluorescein, efficiency, and
Fig. 1. Structure of AAV2 genome. Black boxes represent the invertedterminal repeats, arrows designate the three viral promoters at map posi-tions 5, 19, 40, and open boxes denote coding regions. The left open read-ing frame (ORF) encodes four Rep proteins, Rep78, Rep68, Rep52, andRep40. The right ORF encodes three Cap proteins, VP1, VP2, and VP3.

Generation of rAAV 159
duration of gfp gene expression in the retina can be examined in situwith a camera normally used for fluorescein angiography in a clini-cal setting (10,12). The combination of a recombinant AAV (rAAV)vector expressing GFP and retinal fluorescent photography, consti-tute a very powerful tool for therapeutic studies in the retina.
Here, we describe a simple and efficient method for the produc-tion of a rAAV carrying the gfp and neomycin resistance (neor)genes. Generation of rAAV involves cotransfection of cells with aDNA vector carrying the transgene flanked by the AAV-ITR’s, anda packaging plasmid expressing the AAV rep and cap gene (with-out ITRs) followed by overinfection with adenovirus at a low mul-tiplicity of infection (MOI). Our efficient transfection method andthe use of a modified adenovirus as a helper have improved the yieldof rAAV produced and allowed us to generate a rAAV-gfp titer of109 transducing units (tU)/mL.
2. Materials
1. 293 cells were originally derived from human embryonic kidneycells transformed with the adenovirus type 5 (Ad5) E1A and E1Bgenes (American Type Culture Collection, Rockville, MD, ATCC No.CRL 1573).
2. psub201 plasmid: AAV plasmid (13). This plasmid contains theAAV genome cloned in pEMBL8(+). Digestion of this plasmid byXbaI allows excision of the internal AAV sequence between the twoinverted terminal repeats and replacement with any promoter andgene of interest, generating the recombinant plasmid.
3. pAAV/Ad: helper plasmid (14). This plasmid was generated by sub-stitution of the AAV ITRs with adenoviral terminal sequences inpsub201. This plasmid contains the AAV rep and cap genes, andshares no viral sequence homology with the AAV recombinant plas-mid (see Note 1).
4. pFG140: This plasmid contains an ampicillin-resistance gene andbacterial origin of replication inserted in the E1 region of the Ad5genome. pFG140 was derived from Ad5dl309 and, therefore, con-tains a deletion/substitution in the E3 region (Microbix, Canada).
5. Growth media: 293 cells are maintained in Dulbecco’s modifiedEagle’s medium (DMEM, Gibco, 4500 mg/mL D-glucose with
160 Rolling
L-glutamine). DMEM is supplemented with 10% fetal calf serum(FCS), 100 U/mL penicillin, and 100 µg/mL streptomycin (Gibco).
6. Transfection reagent: FuGENE (Roche Diagnostic, Australia).7. Phosphate-buffered saline (PBS), pH 7.3, sterile.8. Saturated solution of (NH4)2SO4.9. Cesium chloride solutions: 1.37 g/mL and 1.5 g/mL CsCl. The CsCl
is dissolved in PBS. Weigh 1 mL of the solution to check the densitybefore every gradient.
10. Dialysis cassette with a molecular weight cutoff 10 K: Slide-A-lyzer.
3. Method
3.1. Cotransfection/Ad Infection of 293 Cells
Generation of rAAV-gfp virus involves cotransfection of 293 cellswith the recombinant plasmid SSVgfp (Subheading 3.1.2.) andthe helper plasmid pAAV/Ad, followed by adenovirus infection(see Note 2). A schematic representation of the protocol is providedin Fig. 2. The 293-cell line, which constitutively expresses E1 pro-teins, is used to make AAV recombinant virus because they allow agood efficiency of transfection and the use of E1-deficient adeno-virus (replication defective) as helper virus (see Note 3).
3.1.1. Production of Adenovirus Helper
This protocol describes how to make, purify, and titer adenovirushelper stocks for use in AAV production. In order to avoid contami-nation of adenovirus stock with wild-type (wt) AAV, the helperadenovirus was generated by transfection of 293 cells with theadenovirus plasmid pFG140 (Microbix, Canada) (see Note 4).Adenovirus production is very efficient and CsCl purification resultsin a large white band of adenovirus that is easily recovered from thegradient.
1. Transfect 20 15-cm tissue-culture dishes of 70–80% confluent293 cells by adding 25 µg pFG140 DNA and 50 µL of FuGENEaccording to manufacturer’s instruction. Incubate until full cyto-pathic effect (CPE) occurs (48–56 h) (see Note 5).
2. Harvest the cells, pellet at 500g (tabletop centrifuge), for 5 min.3. Discard supernatant and resuspend the pellet in 20 mL PBS.

Generation of rAAV 161
4. Sonicate cells in three 20-s bursts on ice (output control 5, dutycycle 50%).
5. Vortex the lysate at top speed for 30 s and then centrifuge at topspeed in a tabletop centrifuge for 10 min. Transfer the supernatant toa new tube.
6. Adenovirus is purified on two consecutive CsCl gradients, a one-step gradient and a continuous gradient as previously described (14).
Fig. 2. Schematic representation of the constructs and protocol usedfor production of rAAV-gfp.

162 Rolling
3.1.2. Construction of the SSVgfp Plasmid
This plasmid was constructed by excision and insertion of theAseI-EcoO109 gfp–neo gene fragment from pEGFP-N1 (Clontech,Palo Alto, CA) into the XbaI site of the AAV plasmid psub201.SSVgfp consists of two genes, the gfp-reporter gene and the neo-mycin resistance (neor) gene, which are flanked by two AAV ITRs.
3.1.3. Large-Scale Preparation of Plasmid DNA
SSVgfp and pAAV/Ad plasmid DNA are extracted by alkalinelysis and purified by CsCl/ethidium bromide equilibrium centrifu-gation as described in ref. 14. This purification procedure yieldshigh-quality plasmid DNA, which is required to achieve high-effi-ciency transfection.
3.1.4. Transfection of 293 Cells
The cotransfection is performed in 15-cm tissue-culture disheswhen the 293 cells are 70–80% confluent. Typically, for one prepa-ration of rAAV, 20 plates are transfected.
1. In tube 1, mix 28 mL of serum-free DMEM with 1 mL of FuGENE.Incubate at room temperature for 5 min.
2. In tube 2, mix 500 µg of SSVgfp with 500 µg of pAAV/Ad (approx 1 mL).3. Add contents dropwise from tube 1 to tube 2 and incubate at room
temperature for 15 min.4. Add 1.5 mL of FuGENE/DNA mix to each 15-cm plate, mix by
swirling, and incubate for 18 to 24 h at 37°C, 5% CO2.
3.1.5. Adenovirus Infection
In order to check the transfection efficiency, plates are visual-ized under a fluorescent microscope. Strong fluorescence from thegfp gene should be observed in 60–70% of the cells at 18 hposttransfection.
1. Replace the cotransfection media with 25 mL DMEM-2% fetalbovine saline (FBS) containing adenovirus at an MOI of 3–10 infec-tious units (IU/cells).

Generation of rAAV 163
2. Incubate the plates at 37°C, 5% CO2 for 48–72 h. Adenovirusgenerates a CPE, and the cells gradually become clumped androunded. The amount of adenovirus used for the infection is cal-culated to ensure that the cells remain viable for at least 72 h post-infection. Rescue, replication, and encapsidation of the recombinantAAV genome occurs during this period. Therefore, the durationof adenovirus infection is critical to achieve high titers of rAAV.If too much adenovirus is added, the cells die before AAV can bepackaged.
3.2. Assaying Excision and Replication of Viral DNA
Many different types of promoters and gene cassettes are beingcloned in AAV vectors and tested in eukaryotic cells. Although stilllimited, some sequences have been found to be incompatible withAAV vectors. The ability of the recombinant genome to be rescuedand replicated during the complementation process is easily testedby analyzing low-molecular-weight DNA isolated from transfected,adenovirus coinfected cells. This protocol is a modification of theHirt procedure (15).
1. Collect transfected Ad-infected cells from a 15-cm plate, centrifugeat 500g for 5 min and resuspend the cell pellet in 1.6 mL 10 mM Tris-HCl (pH 7.4), 100 mM ethylenediamine tetraacetic acid (EDTA) andput 0.8 mL of the suspension in a second tube.
2. Add 85 µL 10% SDS in each tube to a final concentration of 1%, mixby inversion, and incubate for 10 min at room temperature.
3. Add 0.25 mL 5 M NaCl to precipitate out high-molecular-weightDNA, mix, and incubate overnight at 4°C.
4. Transfer the precipitate/lysate to an ultracentrifuge tube, and centri-fuge at 300,000g (fixed angle rotor) for 5 min.
5. Discard the pellet.6. Extract the supernatant with phenol and then chloroform. Precipitate
the DNA with an equal volume of isopropanol.7. Wash the DNA pellet with 70% ethanol, dry briefly, and resuspend
in 100 µL TE+RNase A (20 mg/mL).8. Digest 10 µL of Hirt DNA with DpnI for 2 h at 37°C.9. Load a 0.8% agarose gel with the same amount of nondigested and
DpnI-digested Hirt DNA and electrophorese.

164 Rolling
10. The monomer and dimer replicative intermediates of the recombi-nant AAV sequence should be visible at the appropriates sizes afterethidium bromide staining or Southern blot analysis using a specificprobe for the recombinant sequence. Because DpnI is a methylation-dependent enzyme, monomer and dimer replicative intermediatesshould be completely resistant to digestion, whereas the methylatedinput plasmids will be degraded. If replicative intermediates are notdetected by ethidium bromide staining or Southern blot analysis, thisimplies that the rAAV sequence has not replicated, and virus will notbe produced. Figure 3 shows the monomer and dimer replicativeintermediates from rAAV-gfp.
3.3. Harvesting the Cotransfected Ad-Infected Cells
1. Transfer the cotransfected Ad-infected 293 cells and media (Sub-heading 3.1.5.) to centrifuge tubes, and pellet at 500g, for 5 min.
Fig. 3. Southern blot analysis of low-molecular-weight DNA isolatedfrom SSVgfp, pAAV/Ad cotransfected, adenovirus coinfected cells. rAAV-gfp monomer (M) and dimer (D) replicative intermediates were detected.

Generation of rAAV 165
2. Resuspend the pellet in PBS at 1 mL/plate.3. Sonicate cells in three 20-s bursts on ice (output control 5, duty cycle
50%). Because AAV accumulates in the nucleus of infected cells,this step is important to disrupt the cells nucleus completely.
4. Vortex the lysate at top speed for 30 s and spin at top speed in atabletop centrifuge for 10 min.
3.4. Precipitation of rAAV and Ad
Before banding on a CsCl gradient, the virus needs to be concen-trated and most of the cellular proteins removed. For this purpose,two successive precipitations with (NH4)2SO4 are performed. Thefirst one will precipitate the undesired proteins and the second willprecipitate the rAAV virions and adenovirus.
1. Pool the supernatant and add 1/3 vol of cold saturated (NH4)2SO4.Mix well and put on ice for 10 min. Typically, this would be 20 mLof supernatant + 7 mL of (NH4)2SO4. The saturated (NH4)2SO4should be adjusted to pH 7.0 with NaOH and kept at 4°C.
2. Centrifuge the sample 10 min at 5000g (8000 rpm for SS34 rotor).A precipitate at the bottom of the tube will be formed, containing pro-teins. Save the supernatant and transfer it to two clean 50-mL tubes.
3. Add 2/3 vol (14 mL) of saturated (NH4)2SO4 of the initial lysate tomake the saturation to 50% and keep the sample on ice for 10–20 min.
4. Centrifuge the sample on the same rotor at 8000g for 15 min. Aprecipitate containing AAV and Ad will form.
3.5. Purification on CsCl Gradient
1. Resuspend the precipitate with 10 mL of CsCl (density 1.37 g/mL PBSpH 7.5).
2. Overlay the CsCl sample onto CsCl cushion (density 1.5 g/mL PBSpH 7.5) in a 12-mL ultraclear ultracentrifugation tube (BeckmanCat. no. 344059).
3. Centrifuge the sample at 285,000g in a Beckman SW41 rotor at 15°Cfor 36–48 h. AAV should form a diffuse band at the middle of thetube, about 1 cm below the sharp Ad band. Proteins will form a vis-cous band above the viral bands.
4. Insert a 21-gage needle just below the diffuse rAAV band and col-lect the rAAV band from the tube.

166 Rolling
5. Combine the fractions and adjust the volume to 12 mL by adding1.37 g/mL CsCl solution.
6. Transfer to an ultraclear tube, underlay with 0.5 mL of 1.5 g/mL CsClsolution and centrifuge as previously described. Rebanding the frac-tions increases the purity and concentration of the rAAV, but someloss can occur because of added manipulations.
7. Transfer pooled rAAV fractions to a sterile 10 K dialysis cassetteand dialyze against sterile PBS for at least 6 h.
8. Aliquot the virus in small volumes to avoid repeated freezing andthawing. Store at –80°C (see Note 6).
3.6. Titration of rAAV-gfp
Titration of rAAV by detecting transgene expression is themost stringent method to determine rAAV titers because thevirion must infect, unpackage, and express the transgene to highenough levels to allow detection. This can result in underesti-mates of the actual number of infectious particles. This techniqueis very useful with rAAV-gfp because in contrast to the galgene, no staining is required, but just the visualization of the cellsunder fluorescent microscopy. However, the lack of standard-ization between the different expression assays used for eachgene makes the yields of rAAV with various transgenes or pro-moters difficult to compare.
Another assay, the replication center assay (RCA), provides thebest method to compare infectious viral titers. This assay allows usto titer rAAV that do not carry any reporter genes (for example,viruses that contain therapeutic genes only). However, this methoddoes not give any information as to the integrity of the expressioncassette. By using RCA, comparison between different preparationsof different transgene vector is possible as long as the same celltype is used in the assay, usually, 293 cells.
3.6.1. Transgene Expression Assay
1. Seed 293 cells into 10-cm tissue-culture plates2. Prepare fivefold serial dilutions of rAAV stock in DMEM.

Generation of rAAV 167
3. At 80% confluency, infect the cells in 2% serum DMEM by adding10 µL of each serial dilution to the different plates and adenovirus atan MOI of three to all plates. Incubate at 37°C for 24 h to allowtransgene expression. In order to visualize GFP expression in all thetransduced cells as soon as 24 h postinfection, it is necessary tocoinfect with adenovirus. The presence of adenovirus enhancesrAAV transgene expression by increasing second-strand DNAsynthesis (16,17).
4. Count the fluorescent cells present in ten fields of each plate and findthe titer by calculating the number of transducing units (tU)/mL ofvirus stock.
3.6.2. Replication Center Assay
In this assay, 293 cells are coinfected with rAAV, wtAAV, andadenovirus. Wild-type AAV and adenovirus supply all the compo-nents necessary for replication of rAAV. After 24 h of incubation,cells are vacuum-filtered onto nylon membranes. The membrane isthen hybridized with a rAAV-specific radioactive probe and thenumber of positive signals are counted to calculate titer of rAAV.This method is described in detail in current protocols in humangenetics (14). The titer is expressed as infectious units per milliliter.
4. Notes
1. The AAV capsid has a narrow packaging range and, therefore, thesize of the rAAV genome should be similar or smaller than thewtAAV genome size of 4.6 kb. Although AAV can package a vectorlarger than its genome size, up to 5.2 kb, the packaging efficienciesin this large size range are sharply reduced (18).
2. Before starting rAAV production, it is essential to be sure that the293 cells or the helper adenovirus stock is not contaminated withwtAAV. Wild-type AAV is ubiquitous and can be present in its latentform in many cell lines. In order to do so, 293 cells are infected withadenovirus and low molecular-weight DNA is analyzed by Southernblot hybridization (Subheading 3.2.) using a wtAAV-specific probe.No wtAAV band should be detected.
3. Production of rAAV depends on transient transfection and, there-fore, it is important to achieve a good transfection efficiency.
168 Rolling
For this purpose, it is crucial to use high-quality DNA. The FuGENEtransfection reagent is very efficient and gives consistent results.In our hand, this technique is much more efficient and less cumber-some than the calcium phosphate method.
4. In standard protocols, Ad5 or Addl309 are used as helper virus andnew batches of Ad helper stock are generated by successive infec-tion of 293 cells. Using this technique, the adenovirus stock can eas-ily be contaminated with wtAAV or other recombinant adenovirus.In the case of a wtAAV infection, the yield of rAAV produced willdrop and be highly contaminated with wtAAV. In order to preventsuch a contamination, our adenovirus helper stock was generatedfrom plasmid transfections of 293 cells. Additionally, the adenovi-rus produced from pFG140 contains a deletion in the E1 region mak-ing it replication defective except in 293 cells. Although most Adhelper should be eliminated from the new rAAV stock by purifica-tion on 2 CsCl gradients, Ad particles could still be present making adefective helper Ad safer to use.
5. The highest rAAV titers are obtained when the adenovirus infectiontakes 56 h to reach full CPE. If the adenovirus infection proceeds toorapidly, the cells will detach sooner and less rAAV will be produced.
6. Following purification of rAAV on two successive CsCl gradients,the fraction might still contain traces of adenovirus. The residualadenovirus contamination can be heat inactivated 15 min at 56°C.However, the rAAV titer may decrease during this heating step.
References
1. Kotin, R. M., Siniscalco, M., Samulski, R. J., et al. (1990) Site-specificintegration by adeno-associated virus. Proc. Natl. Acad. Sci. USA87, 2211–2215.
2. Kotin, R. M., Linden, R. M., and Berns, K. I. (1992) Characterizationof a preferred site on human chromosome 19q for integration ofadeno-associated virus DNA by non-homologous recombination.EMBO. J. 11, 5071–5078.
3. Samulski, R. J., Zhu, X., Xiao, X., et al. (1991) Targeted integrationof adeno-associated virus (AAV) into human chromosome 19.EMBO. J. 10, 3941–3950.
4. Podsakoff, G., Wong, K. K., and Chatterjee, S. (1994) Efficient genetransfer into nondividing cells by adeno-associated virus-based vec-tors. J. Virol. 68, 5656–5666.
Generation of rAAV 169
5. Xiao, X. and Samulski, R. J. (1996) Long-term and efficient in vivogene transfer into muscle tissue of immunocompetent mice withrAAV vector. J. Virol. 70, 8098–8108.
6. Okada, H., Miyamura, K., Itoh, T., et al. (1996) Gene therapy againstan experimental glioma using adeno-associated virus vectors. Gene Ther.3, 957–964.
7. Conrad, C. K., Allen, S. S., Afione, S. A., et al. (1996) Safety ofsingle-dose administration of an adeno-associated virus (AAV)-cftrvector in the primate lung. Gene Ther. 3, 658–668.
8. Afione, S. A., Conrad, C. K., Kearns, W. G., et al. (1996) In vivomodel of adeno-associated virus vector persistence and rescue. J. Virol.70, 3235–3241.
9. Grant, C. A., Ponnazhagan, S., Shan-Wang, X., et al. (1997) Evalua-tion of recombinant adeno-associated virus as a gene transfer vectorfor the retina. Curr. Eye. Res. 16, 949–956.
10. Bennett, J., Duan, D., Engelhardt, J. F., and Maguire, A. (1997)Real-time noninvasive in vivo assessment of adeno-associatedvirus-mediated retinal transduction. Invest. Ophthalmol. Vis. Sci.38, 2857–2863.
11. Flannery, J. G., Zolotukhin, S., Vaquero, M. I., and LaVail, M. M.(1997) Efficient photoreceptor-targeted gene expression in vivo byrecombinant adeno-associated virus. Proc. Natl. Acad. Sci. USA 94,6916–6921.
12. Rolling, F., Shen, W., Tabarias, H., et al. (1999) Evaluation of AAVmediated gene transfer into the rat retina by clinical fluorescent pho-tography. Hum. Gene Ther. 10, 641–648.
13. Samulski, R. J., Chang, L. S., and Shenk, T. (1989) Helper-free stocksof recombinant adeno-associated viruses: normal integration does notrequire viral gene expression. J. Virol. 63, 3822–3828.
14. Snyder, R. O., Xiao, X., and Samulski, R. J. (1996) Production ofrecombinant adeno-associated viral vectors, in Current Protocols inHuman Genetics (Dracopoli, N., Haines, J., Korf, B., et al., eds.),Wiley, New York, pp. 12.1.1–12.1.23.
15. Hirt, B. (1967) Selective extraction of polyoma DNA from infectedmouse cell cultures. J. Mol. Biol. 2, 365–369.
16. Ferrari, F. K., Samulski, T., Shenk, T., and Samulski, R. J. (1996)Second-strand synthesis is a rate-limiting step for efficient transduc-tion by recombinant adeno-associated virus vectors. J. Virol. 70,3227–3234.

170 Rolling
17. Fisher, K. J., Jooss, K., Alston, J., et al. (1997) Recombinant adeno-associated virus for muscle directed gene therapy. Nat. Med. 3, 306–312.
18. Dong, J. Y., Fan, P. D., and Frizzeli, R. A. (1996) Quantitativeanalysis of the packaging capacity of recombinant adeno-associatedvirus. Hum. Gene Ther. 7, 2101–2112.

Recombinant Retroviruses 171
171
From: Methods in Molecular Medicine, vol. 47: Vision Research ProtocolsEdited by: P. E. Rakoczy © Humana Press Inc., Totowa, NJ
10
Preparation of Recombinant Retroviruses
Xian-Jie Yang
1. Introduction
Retroviruses are naturally occurring viruses with an RNA genome.A retroviral vector is a modified infectious virus derived frommurine or avian species that can be used to introduce nonviral DNAsinto a target cell. There are two prominent features of retroviral-mediated DNA transduction. First, retroviral vectors can stablyintegrate into the host genome as a provirus. Second, retroviral-mediated DNA integration requires host cell proliferation. Becauseretroviral vectors allow stable and efficient DNA transduction invitro and in vivo, they have been widely used in developmental stud-ies (1–3) and certain types of gene therapy approaches (4).
1.1. The Life Cycle of a Retrovirus
Naturally occurring retroviruses are replication competent. Uponinfection of a target cell, the viral genome is replicated and pack-aged into viral particles that can infect new host cells. Retroviralinfection occurs through an interaction between viral particles andspecific receptor proteins on the surface of the target cell. Uponentry into the target cell, the retroviral RNA genome is reverse tran-scribed into DNA by a viral encoded reverse transcriptase (RT)enzyme (Fig. 1A). The duplex viral DNA genome can randomly

172 Yang
Fig. 1. Retroviral expression systems. (A) Genomic structure and tran-scripts of a wild-type retrovirus. The long terminal repeats (LTR), thesplice donor site (SD), the splice acceptor site (SA), the packaging sequence
+, and the polyadenylation sequence (PA) of the Moloney murine leu-kemia virus (MoMuLV) are indicated. Transcription of MoMuLV ini-tiates within the 5' LTR, and yields a full-length transcript that serves asthe mRNA for the viral gag and pol proteins, as well as the viral genomefor packaging. In addition, an alternatively spliced transcript encodes theenv protein. The + packaging sequence extends into the gag gene (25),therefore, all retroviral vectors contain a portion of the gag gene. (B) Struc-ture of a splicing retroviral vector. The splicing retroviral vector MFG(26) utilizes the LTR promoter and encodes wild-type SD and SA sites.

Recombinant Retroviruses 173
integrate into the host’s genome as a provirus during S phase of thehost cell. This integration is catalyzed by the viral int protein andoccurs at the two long terminal repeat (LTR) regions of the genome.
The proviral genome encodes essential viral proteins, including astructural protein (gag), a RT enzyme (pol), and the envelope pro-tein found on the outer surface of the viral particle (env). The pro-duction of viral particles relies on transcription that initiates fromthe 5' LTR and results in a full-length copy of the proviral genome.These unspliced full-length transcripts serve to produce the gag, pol,and int proteins. A spliced form of the viral RNA is translated toproduce the env protein. The full-length RNA transcripts alsoencode the packaging sequence , which is recognized by packag-ing proteins. Thus, some full-length transcripts are packaged intoviral particles as the viral RNA genome. Mature viral particles con-tain two copies of this full-length viral RNA, and are formed bybudding off the host cell membrane.
(caption continued from the previous page) The cDNA of interest iscloned by precise fusion to the start codon of the env protein and isexpressed by a spliced RNA similar to the viral env RNA. (C) Structures ofnonsplicing retroviral vectors. Nonsplicing vectors express genes ofinterest by unspliced transcripts. The BAG (11) virus contains an internalpromoter (pSV40) expressing the neomycin-resistant gene (neo), that canbe used to select for stable producer cells in the presence of G418. ThelacZ gene in BAG is transcribed from the LTR promoter and is fused withthe start codon of the MoMuLV gag gene. The LIG (7) and LIA (8) vec-tors have similar structures and both contain the IRES site that allows theexpression of marker genes. The LIG vector expresses a fusion protein ofthe -galactosidase (LacZ) and the neomycin-resistant gene (geo) (27),which permits selection of stable viral producer cells and easy identifica-tion of LIG virus-infected cells. The LIA vector expresses the humanplacental alkaline phosphatase gene as a histochemical marker. ThecDNA of interest is transcribed from the LTR promoter in LIG and LIA.The start codon of the viral gag gene is mutated in LIG and LIA so thattranslation of the gene of interest relies on its own start codon.

174 Yang
1.2. Design of Retroviral Vectors
Retroviral vectors have been modified to accommodate nonviralgenes, and usually some or all of the essential viral genes have beendeleted. Therefore, the resulting retroviral vectors are often renderedreplication incompetent. However, to capitalize on retroviral tran-scription, integration, and packaging functions, retroviral vectorsusually retain the packaging sequence, the reverse transcriptionand integration signals, and the viral promoter, enhancer, andpolyadenylation sequences (Fig. 1B and C). The Moloney murineleukemia virus (MMLV) 5'-LTR is commonly used in mammalianretroviral vectors because it is active in most cell types. The sizelimit of foreign DNA that can be transduced by mammalianretroviral vectors is usually below 8 Kb. In contrast, avian replica-tion competent retroviruses (5) can transduce foreign DNAs of lessthan 2.5 Kb.
When cloning cDNAs into retroviral vectors, the 5' and 3' untranslatedregions should be trimmed as much as possible to prevent interfer-ence with viral transcription. No additional polyadenylation site orsplice acceptor sites should be retained because they may affect theintegrity of the full-length viral RNA and the viral titer. The gene ofinterest can be expressed by the 5' LTR promoter or by an exog-enous promoter placed internally in the viral genome. In addition,polycistronic retroviral vectors have been developed that encode aninternal ribosomal entry site (IRES) (6). The IRES sequence allowsthe translational initiation of a second gene from the same full lengthviral RNA, and thus reduces the possible competition between the5' LTR promoter and the internal promoter (7,8). Recently retroviralvectors containing the regulated tetracycline-inducible promoterhave also been designed to overcome toxicity of genes constitu-tively expressed by retroviruses (9,10).
Several marker genes have been engineered into retroviral vec-tors to aid in the identification or selection of infected cells. Vectorsexpressing histological markers (e.g., the lacZ gene) are advanta-geous for determining viral titer and for identifying viral-infectedcells (11,12). However, they do not facilitate the selection of stable

Recombinant Retroviruses 175
producer cells. Conversely, viral vectors carrying drug resistantmarkers permit the selection of stable producer cells, but are moredifficult to titer and to identify infected cells, unless the gene ofinterest is independently tagged with epitope markers.
1.3. Production of Retroviruses
The production of replication-incompetent infectious retroviralparticles relies on the supply of essential viral proteins from anexogenous source. Towards this end, various packaging cell linesstably transduced to express of essential viral proteins are estab-lished. The most commonly used packaging cell lines are derivedfrom human 293 cells, primate COS cells, mouse NIH 3T3 cells,and quail QT6 cells. During viral production, recombination eventsmay lead to wild-type (helper) viruses. Contamination of helperviruses can be largely avoided by using packaging cell lines in whichdifferent viral proteins are expressed from separate nonviral pro-moters, and therefore are unlikely to recombine to generate wild-type viral genome.
Two approaches have been developed to produce replicationincompetent retroviruses. The first approach relies on making stableproducer cells. Packaging cell lines can be stably transfected withrecombinant retroviral vector DNA, and selected for their ability toproduce high-titer infectious viruses. In the second approach, pro-ducer cells are transiently cotransfected with the retroviral DNA andhelper virus DNA encoding essential viral proteins, but not the pack-aging sequence, or packaging cells are transiently transfected withretroviral vector DNA alone to produce viruses. This transient methodrequires high-efficiency transfection for high-titer viral production.
1.4. Host Ranges of Retroviral Vectors
The host range of a retrovirus particle is determined by the viralglycoprotein env and host cell surface receptors. Murine and avianretroviral vectors have several types of env proteins that interactwith different host receptors. Murine ecotropic retroviruses bind tothe ecotropic receptor found on rat and mouse cells, and do not infect

176 Yang
human cells. The amphotropic env proteins, however, endorse amurine retrovirus with a broader host range including rodents,human, chicken, dog, and cat. Packaging cell lines expressing eitherecotropic or amphotropic env proteins can be used to producemurine retroviruses with a desired host range. The avian retrovirusesuse six different env protein subtypes: A, B, C, D, E, and F (13).
Retroviruses can also become polytropic by pseudotyping tofurther expand their host range. An effective approach involvespseudotyping the retrovirus with the vesicular stomatitus virus (VSV)G protein (14,15). The VSV G protein allows viral particles tointeract with phosphatidyl serine and other components of the lipidbilayer that are widely expressed in mammalian and nonmammaliancells. This method of VSV G pseudotyping has facilitated retroviralinfection of cells from a variety of species including fish, frog,insects, and human (15,16).
1.5. Safety Issues Regarding Usage of Retroviral Vectors
Biological safety issues should be carefully considered whenworking with retroviral vectors. Retroviruses have a half-life of 3–6 hat 37°C (17), and viral particles are sensitive to detergents. Whenworking with ecotropic viruses, it is recommended that all tissueculture wastes be collected and autoclaved before disposal, and allsurfaces that come in contact with the virus be decontaminated.Extreme precaution and containment should be implemented whenworking with amphotropic and polytropic viruses because of thedanger of infecting humans. Detailed protocols of containment anddecontamination should be discussed with the appropriate biologi-cal safety committee of the institution where the experiments are tobe performed.
Although it is still necessary to select stable producer cell lines inorder to produce large quantities of retrovirus, the generation ofhigh-titer retrovirus by transient transfection is less labor-intensiveand less time-consuming (18). Moreover, transient transfectionallows the production of high-titer viral stocks that cannot be pro-duced by stable producer cells due to toxicity. Transient transfec-

Recombinant Retroviruses 177
tion also facilitates the rapid testing of different viral constructs,pseudotyping, and even the construction and application ofretroviral cDNA libraries (4). This chapter describes protocols forproducing retroviruses by stable producer cells and by transienttransfections of packaging cells or producer cells, as well aspseudotyping viruses, titering viral supernatants, and concentratingviral stocks.
2. Materials
2.1. Supplies and Equipment
1. Tissue-culture incubator (37°C, 5% CO2).2. Laminar flow hood.3. Tissue-culture dishes.4. Packaging cell lines, e.g., 2 cells or NX cells.5. Target cells, e.g., NIH 3T3 cells.6. Producer cells, e.g., 293 cells.7. Cloning cylinders.8. Filter unit, 0.45-µm pore size.9. Cryogenic vials, 2 mL.
10. Beckman L3-50 centrifuge and SW-28 rotor (or equivalent).
2.2. Reagents and Solutions
1. Retrovirus plasmid DNA.2. Helper virus plasmid DNAs: Ecotropic helper DNA (19,20), or ampho-
tropic helper DNA (19,20).3. VSV G protein expression plasmid, e.g., pHCMV-VSV-G (16).4. Culture media: For 293 cell and its derivatives, use Dulbecco’s modi-
fied Eagle’s medium (DMEM, high glucose, 2 mM L-glutamine)containing 10% fetal calf serum (FCS); for NIH 3T3 cell and itsderivatives, use DMEM containing 10% calf serum (CS).
5. HEPES-buffered saline (HBS): 137 mM NaCl, 5 mM KCl, 0.7 mMNa2HPO4, 6 mM dextrose, 21 mM HEPES. Carefully adjust pH to7.05 and store at room temperature for 6 mo.
6. 2 M CaCl2: Autoclave and store at room temperature.7. HBS/Glycerol: 15% (v/v) glycerol in HBS.

178 Yang
8. Lipofectamine: This transfection reagent is purchased from Gibco-BRL Life Technologies. Other lipid transfection products can alsobe used.
9. Optimum: A serum-free medium from Gibco-BRL Life Technolo-gies used in the Lipofectamine transfection procedure. Optimum canbe replaced by other serum-free media.
10. 100X Polybrene: 800 µg/mL in d H2O, filter sterilize and store asaliquots at –20°C.
11. Glutaraldehyde fixative: Dilute 25% glutaraldehyde stock (Sigma)into phosphate-buffered saline (PBS) to 0.05% right before use.
12. Paraformaldehyde fixative: Fresh 4% PFA in PBS (see Chapter 3).13. X-gal reaction buffer: 10 mM K3Fe(CN)6 (potassium ferricyanide),
10 mM K4Fe(CN)6·3H2O (potassium ferrocyanide), 2 mM MgCl2 orMgSO4. Cover the bottle with foil, and store at room temperature forup to 1 yr. Avoid contacting and inhaling cyanide. Wear gloves whenhandling solutions.
14. 40X X-gal: Dissolve 40 mg/mL 5-bromo-4-chloro-3-indolyl -D-galacto-pyranoside (X-gal) in N,N-dimethylformamide. Store in a glassvial covered with foil at –20°C. Dilute in X-gal reaction buffer to1 mg/mL just before use.
15. G418: Use at 1 mg/mL for selection of NIH3T3 cells transfectedwith DNA encoding the neomycin resistance gene.
3. Methods
3.1. Production of Retrovirus by Stable Producer Cell Lines
Large quantities of high-titer retroviral stocks can be producedby stable producer cell lines (see Note 1). Only retroviral vectorsencoding selectable drug-resistant markers can be used to generateproducer cell lines. Retroviral vector DNA is initially used to trans-fect a packaging cell line expressing all necessary viral proteins.At this point, drug selection can be applied directly to select stablytransfected cells. However, because transfection can result in alteredor damaged viral genomes, a better strategy is to use infectious viralparticles produced by the initial transfection to “cross-infect” a sec-ond packaging cell line expressing a different class of env glyco-proteins. (Note: viral particles are not able to infect a packaging cell

Recombinant Retroviruses 179
line that expresses the same class of env protein due to blockage ofcell surface receptors by the env protein.) The “cross-infected” cellline is then selected for drug resistance in order to establish indi-vidual stable producers. The producer cell lines can be screened forhigh-titer clones, and these clones can then be expanded and used toproduce large quantities of virus.
3.1.1. Transfection of Packaging CellsUsing Ca3 (PO4)2 (Table 1)
1. Plate packaging cells, e.g., -CRIP, at 10% (1:10 split) to 20%(1:5 split) confluency in a 10-cm dish the day before transfection(see Note 2).
2. Add 10 µg of retroviral plasmid DNA to 0.5 mL of HBS. (Use poly-styrene tubes for good visibility.)
3. Add 32 µL of 2 M CaCl2 while gently tapping the tube. Incubate themixture at room temperature for 45 min. (Fine hazy precipitatesshould be observed.)
4. Remove the medium from packaging cells and pipet the DNA mix-ture into the dish. Incubate at room temperature in the hood for10 min, gently redistribute solution throughout the entire dish, andincubate an additional 10 min.
5. Add 10 mL medium (in this case, DMEM containing 10% CS) to thedish, and return cells to 37°C incubator for 4 h.
6. Remove the medium completely, and add 2.5 mL HBS/glycerol.Return the dish to 37°C for 3.5 min (see Note 3).
7. Quickly remove the HBS/glycerol and rinse cells with 10 mL medium.Repeat the rinse. Then add 5 mL of medium to the cells and incubatefor 18–24 h at 37°C.
8. Remove the supernatant and filter through a 0.45-µm filter attachedto a syringe. Store this transient supernatant at –80°C (see Note 4).
3.1.2. Infection of Packaging Cells
1. Plate a packaging cell line at approx 10–20% confluency the daybefore infection. Use a packaging cell with a different class of envprotein (e.g., 2) than the one used in Subheading 3.1.1. (1). ( 2 isan ecotropic packaging cell line derived from NIH3T3 cells.)

180Y
ang
180
Table 1Retroviral Packaging Cell Lines
Drug HelperCell line Cell type resistancea virus Usageb Sourcec Reference
Ecotropic2 NIH3T3 gpt Yes For stable producers — 23
BOSC 293 neo, hph, gpt No For transient transfection ATCC CRL 11270 21NX-Eco 293 neo No For transient transfection — 4 & P. Achacoso
and G. Nolan(unpublished)
Amphotropic-CRIP NIH3T3 hph, gpt No For stable producers — 24
BING 293 hph, gpt No For transient transfection ATCC CRL 11554 18NX-Am 293 neo No For transient transfection — 4 & P. Achacoso
and G. Nolan(unpublished)
aAbbreviations for drug resistant markers: gpt, xanthine-guanine phosphoribosyltransferase; neo, neomycin phosphotransferase;hph, hygromycin phosphotransferase.
bThe most common usage of each packaging cell line is indicated.cPackaging cell lines can be obtained from American Type Culture Collection (ATCC), or by contacting the authors.

Recombinant Retroviruses 181
2. Remove medium from the cells to be infected. To a 10-cm dish, add5 mL of medium containing 8 µg/mL polybrene and 0.1–1 mL of thetransient viral stock from Subheading 3.1.1. (8). Incubate for 1 h at37°C (see Note 5).
3. Add 5 mL of medium to the dish, and continue to incubate for 2–3 d.
3.1.3. Selection of Producers
1. Split infected cells at 1:10 or 1:20 ratios, and plate for 3 d in selectivemedium (e.g., for 2 cells infected with the neomycin expressing BAGvirus (11), use DMEM containing 10% CS and 1 mg/mL G418).
2. Replace medium every 3 d with fresh selective medium and continueto incubate for another 4–7 d until colonies are visible.
3. Isolate individual colonies with the use of a cloning ring and gentlytrypsinize isolated cells. Plate cells from each clone into two wells ofa six- or 12-well dish, and grow until 50–90% confluent. (Clones canbe pooled to yield high-titer producer cells when this infection pro-cedure is used.)
3.1.4. Expanding Producer Cells and Harvest Viral Stocks
1. Replace medium, using one-half of the normal volume (e.g., 1 mLfor a well of a six-well dish). Harvest supernatants every 24 h andreplace with fresh medium.
2. Viral stocks can be titered immediately (see later), or can be filteredand stored at –80°C (see Note 6).
3. Once a good producer cell line is identified, expand the line. Growproducer cells to 70% confluency, trypsinize the cells, and spin themdown. Resuspend Cells from each 10-cm dish in 3 mL of mediumcontaining 10–15% DMSO, and freeze 20–30 vials in liquid nitro-gen in 1-mL aliquots.
3.2. Production of Retrovirus by Transient Transfections
Transient transfection methods for retroviral production are basedon the high-transfection efficiency of packaging or producer sys-tems derived from the 293 cell line, an adenovirus-transformedhuman embryonic kidney cell line. Transient transfection of NIH3T3-based packaging cells produces relatively low titer viral stocks
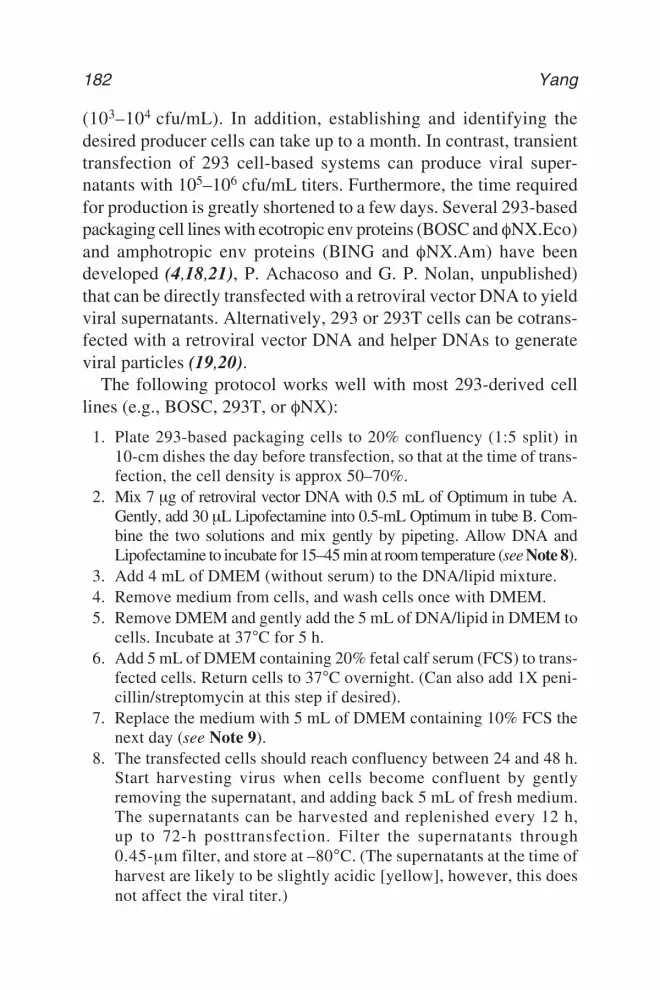
182 Yang
(103–104 cfu/mL). In addition, establishing and identifying thedesired producer cells can take up to a month. In contrast, transienttransfection of 293 cell-based systems can produce viral super-natants with 105–106 cfu/mL titers. Furthermore, the time requiredfor production is greatly shortened to a few days. Several 293-basedpackaging cell lines with ecotropic env proteins (BOSC and NX.Eco)and amphotropic env proteins (BING and NX.Am) have beendeveloped (4,18,21), P. Achacoso and G. P. Nolan, unpublished)that can be directly transfected with a retroviral vector DNA to yieldviral supernatants. Alternatively, 293 or 293T cells can be cotrans-fected with a retroviral vector DNA and helper DNAs to generateviral particles (19,20).
The following protocol works well with most 293-derived celllines (e.g., BOSC, 293T, or NX):
1. Plate 293-based packaging cells to 20% confluency (1:5 split) in10-cm dishes the day before transfection, so that at the time of trans-fection, the cell density is approx 50–70%.
2. Mix 7 µg of retroviral vector DNA with 0.5 mL of Optimum in tube A.Gently, add 30 µL Lipofectamine into 0.5-mL Optimum in tube B. Com-bine the two solutions and mix gently by pipeting. Allow DNA andLipofectamine to incubate for 15–45 min at room temperature (see Note 8).
3. Add 4 mL of DMEM (without serum) to the DNA/lipid mixture.4. Remove medium from cells, and wash cells once with DMEM.5. Remove DMEM and gently add the 5 mL of DNA/lipid in DMEM to
cells. Incubate at 37°C for 5 h.6. Add 5 mL of DMEM containing 20% fetal calf serum (FCS) to trans-
fected cells. Return cells to 37°C overnight. (Can also add 1X peni-cillin/streptomycin at this step if desired).
7. Replace the medium with 5 mL of DMEM containing 10% FCS thenext day (see Note 9).
8. The transfected cells should reach confluency between 24 and 48 h.Start harvesting virus when cells become confluent by gentlyremoving the supernatant, and adding back 5 mL of fresh medium.The supernatants can be harvested and replenished every 12 h,up to 72-h posttransfection. Filter the supernatants through0.45-µm filter, and store at –80°C. (The supernatants at the time ofharvest are likely to be slightly acidic [yellow], however, this doesnot affect the viral titer.)

Recombinant Retroviruses 183
3.3. Determination of Retroviral Titers (see Note 10)
Titers of retroviral stocks can be determined by using viralencoded selectable drug-resistant markers or histochemicalmarkers (12). The murine BAG virus expresses both the neomy-cin resistance gene and the lacZ gene, and thus can be titeredwith either method (11). Titers of avian viruses can also bedetermined by immunocytochemistry using an antibody that rec-ognizes the viral gag protein (22).
1. Split NIH3T3 target cells 1:10 or 1:20 into the wells of a 12-well dishthe day before infection (see Note 11).
2. Dilute 0.01–0.1 mL of viral stocks to a final volume of 0.5 mL withmedium containing 8 µg/mL polybrene. Remove medium from cells,add diluted virus, and incubate cells 1–3 h at 37°C. (It is necessary touse dilutions over several orders of magnitude in order to obtainaccurate titers of viral stocks. Viral absorption to target cells occurswithin 1 h.)
3. Add 1.5 mL of medium to dilute polybrene to 2 µg/mL. Incubateinfected cells for 36–48 h at 37°C.
4. If the viral vector encodes a histochemical marker such as -galac-tosidase (LacZ) or alkaline phosphatase (AP), stain cells usingX-gal or X-phos substrates using appropriate methods (seeNote 12).a. If the viral vector encodes a drug resistance marker, split
infected cells into 10-cm dishes in selective medium. Culture for3 d, change to fresh selective medium every 3 d, and continueto culture for an additional 7–10 d till colonies become visible(see Note 13).
5. Count the positive stained cell clusters per well when using a histo-chemical marker, or count the drug resistant colonies per dish whenusing drug resistant selection. Calculate the titer as colony formingunits per milliliters of viral stock (cfu/mL), as follows:
the number of clusters or coloniescfu/mL = –––––––––––––––––––––––––––––––––––––––––––––––––
(volume of virus) (dilution factor) (fraction of infected cells used)
Positively staining clones often appear as clusters of 1–8 cells,depending on how confluent the target cells were at the time of theinfection (see Note 14).

184 Yang
3.4. Pseudotyping Retroviruses with VSV G Protein
Retroviruses can be pseudotyped with VSV G protein to broadenthe host range. VSV G is fusogenic and thus toxic to cells whenstably expressed. However, transient transfection of cells with aVSV G expressing plasmid allows incorporation of the VSV G pro-tein into viral particles before the onset of massive cell death. Stableviral producer lines can be transiently transfected with a VSV Gexpressing plasmid, or packaging cell lines can be cotransfectedwith VSV G plasmid and a retroviral vector to produce pseudotypedretroviruses. These VSV G pseudotyped viruses can then be con-centrated to 108–109 cfu/mL (15).
1. The day before transfection, plate amphotropic packaging cells atapprox 10–20% (1:5–1:10) of their confluent cell density.
2. Transfect cells the next day with the retroviral plasmid using thelipid-mediated or Ca3(PO4)2 precipitation method.
3. Harvest the transient viral supernatant. Use 1 mL of the supernatantto infect a cell line expressing the gag and pol proteins. Select stableproducer cells, and freeze them as described in Subheading 3.1.
4. Plate these producer cells at 1:5–1:10 the day before transfection.5. Transfect the producer cells with the VSV G protein expressing plas-
mid using the lipid-mediated or Ca3(PO4)2 precipitation method.(If no producer cells are available, cotransfect 293 cells with the VSVG plasmid, the retroviral DNA, and a plasmid expressing gag andpol at a 1:1:1 molar ratio.)
6. Replace medium 24 h after transfection, and continue incubationat 37°C.
7. Harvest the supernatant between 36 and 72 h posttransfection. Filterand store the pseudotyped virus at –80°C (see Note 15).
3.5. Concentration of Retrovirus Stocks
High-titer viral stocks are necessary for various applicationsincluding in vivo infections. In order to obtain high-titer retroviralstocks, large volumes of tissue culture supernatants containingretroviruses can be concentrated by centrifugation, polyethyleneglycol (PEG) precipitation, and chromatography. The centrifuga-tion method is described below.

Recombinant Retroviruses 185
1. If viral supernatants are frozen, thaw them by incubating at 37°C.Gently mix the viral supernatant every few minutes until completelythawed. (Retroviral particles are fragile. Prolonged incubation at37°C can reduce titer. Avoid creating bubbles when mixing.)
2. Filter supernatants through 0.45-µm units if they were not previ-ously filtered. (Use the paper prefilter that comes with the filterunit, as cell debris in the supernatant will clot the filter units. Alter-natively, first spin the supernatant for 10 min at 50,000g in a SW-28[or equivalent] rotor to get rid of cell debris.)
3. Rinse SW-28 ultraclear centrifugation tubes and the swing bucketswith 70% ethanol, and dry the tubes and buckets in the tissue culturehood with the UV light on. Transfer approx 35 mL of the super-natants into each SW-28 centrifuge tube. (For many applications,it is necessary to keep the viral stock sterile by operating in a laminarhood, and using sterile tubes and pipets.)
4. Centrifuge for 2 h at 50,000g at 4°C in a SW-28 rotor or an equiva-lent swing-bucket rotor. For large volumes, centrifuge for 5–16 h at50,000g in a JA-14 rotor. (Swing-bucket rotors are preferred becausethey allow viral pellets to form at the bottom of the tube. If usingfixed-angle rotors, mark the position of the viral pellet immediatelyafter the centrifugation stops.)
5. Immediately transfer centrifugation tubes into the hood, decantthe supernatant quickly, allowing only 100–200 µL of liquid toremain in each tube that originally contained 35 mL of viral super-natant (a 200-fold to 400-fold reduction in volume).
6. Place the tube with the virus pellet and residual liquid back into theswing bucket and tighten the cap. Rock the tube in the bucket onice for 60 min. (Make sure the bucket is in a vertical position sur-rounded by ice, so that the residual liquid covers the viral pelletsduring rocking.)
7. Return the tube back to the hood, and gently resuspend the virus byrepetitively pipeting the liquid. (Keep the pipet tip submerged at alltimes, and avoid making bubbles.)
8. Dispense 10–20 µL of the concentrated viral stock into cryogenicscrew-cap tubes. Store at –80°C (see Note 14).
4. Notes
1. Unless large quantities (> 10 mL) of concentrated retroviral stockare needed, the transient transfection viral production is advantageous.

186 Yang
It allows the preparation of high-titer viral stock (106 to 107 cfu/mL)in a few days once the retroviral vector DNA is available. Transienttransfection of ten 10-cm dishes can yield 200 mL of unconcentratedsupernatant, which can yield 0.5 to 1 mL of concentrated viral stock.Transient transfection also permits the preparation of recombinantretroviruses expressing proteins (wild type or mutant) that are detri-mental to the producer cells, and therefore cannot be produced bystable producer cell lines. Because transient transfection significantlyreduces the time required for viral production, it is feasible to testvarious constructs. Transient transfection also permits pseudotypingwith the VSV G protein. Retroviruses that have incorporated theVSV G protein can better withstand centrifugation and thus can beconcentrated up to 1000-fold. After concentration, titers of VSV Gprotein pseudotyped virus can reach 109 cfu/mL. In addition to yield-ing high-titer viruses, the polytropic VSV G pseudotyped virus canmediate stable gene transfer to multiple species.
2. -CRIP is an amphotropic producer cell line derived from NIH3T3.The virus produced in the supernatant can infect humans. All pre-cautions should be taken as required by regulations. If scaling downto 6-cm dishes, reduce all reagents proportionally.
3. The optimal time for glycerol shocking varies depending on the cellline. 3.5 min works well for 3T3 derived cells including 2 or -CRIP.Avian Q2bn cells require only 90 s of incubation with glycerol.
4. This transient viral stock can be used to infect other packaging celllines bearing a different class of env proteins (e.g., 2) to establishstable producer cells lines, or it can be used directly to infect targettissues. A good transfection can yield a transient viral supernatantwith a titer of 104 cfu/mL.
5. It is difficult to predict the titer of the transient viral stock for a newviral vector. Therefore, several dilutions of the viral stock should betested to insure that an adequate number of clones are generated.Polybrene is included to facilitate an interaction between viral par-ticles and cells.
6. The supernatants now contain ecotropic viruses if 2 cells have beeninfected, see Subheading 3.1.2. (1). Keep retroviruses on ice if theyare to be used within 2 h. Avoid repeated freeze-thaw cycles of viralstocks, because viral titers decrease significantly after the secondfreeze-thaw cycle.
7. Choosing an appropriate packaging cell line is critical when design-ing a retroviral experiment. In general, it is preferable to use a cell

Recombinant Retroviruses 187
line that does not produce helper virus. The 293-based NX cell lineis a good choice because the viral proteins produced in these cellsare expressed from nonviral promoters to further reduce the chanceof recombination. In addition, the production of essential viral pro-teins can be monitored in these cells. The 293 derived cells are veryeasily transfected by different methods. The cell density at the timeof transfection must be less than confluent (approx 50–70%) in orderto allow a period of continued cell growth, which is necessary for theproduction of high-titer viruses.
8. When cotransfecting 293 producer cells with retroviral vector DNAand helper viral DNA, use a total of 10 µg of DNA with the two plas-mids at equal molar ratio. For other size dishes, the amount of reagentscan be scaled up or down in proportion to culture surface area.
9. This protocol typically achieves 293 cell transfection efficiencies of> 50%. Other lipid transfection protocols can also be used.
10. A variety of retroviral vectors have been developed. Vectors express-ing a drug-resistance marker are useful for selecting stable producercells and determining titer. Because the preparation of viruses bytransient transfection does not require the drug-resistance marker, aretroviral vector encoding a histochemical marker can be very usefulfor monitoring infection and for titering. In general, the expressionfrom the 5'LTR promoter is thought to be more reliable than fromexogenous promoters placed internally within the viral genome.Several vectors, including the MMLV-based LIG (7) and LIA (8),allow expression of a gene of interest from the 5'LTR, and expres-sion of a marker gene from a polycistronic RNA encoding an IRES.Cells infected by these viruses can be conveniently detected byhistochemical staining. Although positive staining of the markerprotein indicates that the full-length viral RNA is expressed inthe cell, the expression of the gene of interest should be indepen-dently verified.
11. NIH3T3 cells are frequently used as target cells for titering murineviruses. To determine titers of avian viruses, use the quail QT6cell line (13).
12. Staining protocols for AP using X-phos have been described else-where (see Chapter 3) (12). It is necessary to heat cells at 65°C for30 min before staining. To stain for X-gal, fix cells with 0.05%glutaraldehyde for 10 min, wash three times with PBS for 10 mineach, add X-gal reaction buffer containing 1 mg/mL X-gal at 37°C ina humidified chamber (do not use tissue-culture incubators). Stop

188 Yang
reaction by washing with PBS containing 20 mM ethylenediaminetetraacetic acid (EDTA).
13. If the transient viral supernatant used for infection has an anticipatedtiter of approx 104 cfu/mL, use 1/5 or 1/10 of the infected cells forselection. If the titer is likely to be low, use all of the cells for selec-tion, but plate in several dishes containing 5- to 10-fold differentamounts of infected cells.
14. Titers of concentrated viral stocks can be determined by serial dilu-tions and methods described in Subheading 3.3.
15. Syncytiums containing multiple nuclei caused by VSV G expressionare visible at 36 h posttransfection.
References
1. Cepko, C. L. (1989) Lineage analysis and immortalization of neuralcells via retrovirus vectors, in Neuromethods, vol. 16, MolecularNeurobiological Techniques (Boulton, A. A., Baker, G. B., andCampagnoni, A. T., eds.), Humana, Totowa, NJ, pp. 367–392.
2. Cepko, C. L., Ryder, E., Austin, C., Golden, J., Fields-Berry, S., and Lin, J.(1998) Lineage analysis using retroviral vectors. Methods 14, 393–406.
3. Cepko, C. L. and Pear, W. (1997) Transduction of genes usingretrovirus vectors, in Current Protocols in Molecular Biology(Ausubel, F. M., et al., eds.), Wiley, New York, pp. 9.9.1–9.12.6.
4. Nolan, G. P. and Shatzman, A. R. (1998) Expression vectors anddelivery systems. Curr. Opin. Biotechnol. 9, 447–450.
5. Hughes, S. H., Greenhouse, J. J., Petropoulos, C. J., and Sutrave, P.(1987) Adaptor plasmids simplify the insertion of foreign DNA intohelper-independent retroviral vectors. J. Virol. 61, 3004–3012.
6. Jang, S. K., Davies, M. V., Kaufman, R. J., and Wimmer, E. (1989)Initiation of protein synthesis by internal entry of ribosomes into the5' nontranslated region of encephalomyocarditis virus RNA in vivo.J. Virol. 63, 1651–1660.
7. Lillien, L. (1995) Changes in retinal cell fate induced by over-expression of EGF receptor. Nature 377, 158–162.
8. Bao, Z.-Z. and Cepko, C. L. (1997) The expression and function of Notchpathway genes in the developing rat eye. J. Neurosci. 17, 1425–1434.
9. Paulus, W., Baur, I., Boyce, F. M., Breakefield, X. O., and Reeves, S. A.(1996) Self-contained, tetracycline-regulated retroviral vector systemfor gene delivery to mammalian cells. J. Virol. 70, 62–67.

Recombinant Retroviruses 189
10. Shockett, P. E. and Schatz, D. G. (1996) Diverse strategies for tetra-cycline-regulated inducible gene expression. Proc. Natl. Acad. Sci. USA93, 5173–5176.
11. Price, J., Turner, D., and Cepko, C. (1987) Lineage analysis inthe vertebrate nervous system by retrovirus-mediated gene transfer.Proc. Natl. Acad. Sci. USA 84, 156–160.
12. Fields-Berry, S. C., Halliday, A. L., and Cepko, C. L. (1992) A recom-binant retrovirus encoding alkaline phosphatase confirms clonalboundary assignment in lineage analysis of murine retina. Proc. Natl.Acad. Sci. USA 89, 693–697.
13. Morgan, B. A. and Fekete, D. M. (1996) Manipulating gene expres-sion with replication competent retroviruses. Methods Cell Biol. 51,185–218.
14. Burns, J. C., Friedmann, T., Driever, W., Burrascano, M., and Yee, J. K.(1993) Vesicular stomatitis virus G glycoprotein-pseudotypedretroviral vectors: concentration to a very high-titer and efficient genetransfer into mammalian and nonmammalian cells. Proc. Natl. Acad.Sci. USA 90, 8033–8037.
15. Yee, J. K., Friedmann, T., and Burns, J. C. (1994) Generation ofhigh-titer pseudotyped retroviral vectors with very broad host range.Methods Cell Biol. 43, 99–112.
16. Matsubara, T., Beeman, R. W., Shike, H., Besansky, N. J., Muka-bayire, O., Higgs, S., et al. (1996) Pantropic retroviral vectorsintegrate and express in cells of the malaria mosquito, Anophelexgambiae. Proc. Natl. Acad. Sci. USA 93, 6181–6185.
17. Sanes, J. R., Rubenstein, J. L. R., and Nicolas, J. F. (1986) Use ofrecombinant retrovirus to study post-implantation cell lineage inmouse embryos. EMBO J. 5, 3133–3142.
18. Pear, W. S., Scott, M. L., and Nolan, G. P. (1996) Generation of high-titer, helper free retroviruses by transient transfection, in Methods inMolecular Biology, Methods in Gene Therapy (Robbins, P., ed.),Humana, Totowa, NJ.
19. Naviaux, R. E., Costanzi, E., Haas, M., and Verma, I. M. (1996) ThepCL vector system: rapid production of helper-free, high-titer recom-binant retroviruses. J. Viol. 70, 5701–5705.
20. Soneoka, Y., Cannon, P. M., Ramsdale, E. E., Griffiths, J. C.,Romano, G., Kingsman, S. M., and Kinsman, A. L. (1995) A tran-sient three-plasmid expression system for the production of high-titerretroviral vectors. Nucleic Acids Res. 23, 628–633.

190 Yang
21. Pear, W., Nolan, G., Scott, M., and Baltimore, D. (1993) Productionof high-titer helper-free retroviruses by transient transfection. Proc. Natl.Acad. Sci. USA 90, 8392–8396.
22. Stoker, A. W. and Bissell, M. J. (1987) Quantitative immuno-cytochemical assay for infectious avian retroviruses. J. Gen. Virol.68, 2481–2485.
23. Mann, R., Mulligan, R. C., and Baltimore, D. (1983) Construction ofa retrovirus packaging mutant and its use to produce helper-freedefective retrovirus. Cell 33, 153–159.
24. Danos, O. and Mulligan, R. C. (1988) Safe and efficient generationof recombinant retroviruses with amphotropic and ecotropic hostranges. Proc. Natl. Acad. Sci. USA 85, 6460–6464.
25. Bender, M. A., Palmer, T. D., Gelinas, R. E., and Miller, A. D. (1987)Evidence that the packaging signal of Moloney murine leukemia virusextends into the gag region. J. Viol. 61, 1639–1646.
26. Dranoff, G., Jaffee, E., Lazenby, A., Golumbek, P., Levitsky, H.,Brose, K., et al. (1993) Vaccination with irradiated tumor cells engi-neered to secrete murine granulocyte-macrophage colony-stimulat-ing factor stimulates potent, specific, and long-lasting anti-tumorimmunity. Proc. Natl. Acad. Sci. USA 90, 3539–3543.
27. Friedrich, G. and Soriano, P. (1991) Promoter traps in embryonicstem cells: a genetic screen to identify and mutate developmentalgenes in mice. Genes Dev. 5, 1513–1523.

Transgenic Mice 191
191
From: Methods in Molecular Medicine, vol. 47: Vision Research ProtocolsEdited by: P. E. Rakoczy © Humana Press Inc., Totowa, NJ
11
Generation of Transgenic Micefor Studies of Ocular Developmentand Disease
Abha R. Gupta, Nadine S. Dejneka,Albert M. Maguire, and Jean Bennett
1. Introduction
Over the past decade, there has been spectacular growth in ourunderstanding of the molecular genetics of eye development andocular disease. Although this is primarily caused by developmentsin recombinant DNA technology, it is also caused in large part byadvances in, and the spread of, transgenic mouse technology.Whereas 10 years ago few laboratories had the equipment and skillto generate transgenic mice, now most investigators have access toa transgenic core facility. Transgenic mouse studies have fueled ourunderstanding of ocular development, have delineated regulatoryelements involved in gene expression in cells of the eye, and haveunraveled pathogenic mechanisms involved in eye disease.
There are many marvelous resources available for those who wishto apply transgenic technology to studies of the eye. There are notas many resources that detail considerations unique to studiesinvolving this organ. In addition, there are few resources thatdescribe methods for evaluating the (transgenic) mouse eye in vivo.Therefore, in this chapter we have tried to emphasize particular

192 Gupta et al.
details that may be useful in planning and conducting eye-relatedstudies. Although it is beyond the scope of this chapter to providespecific molecular biologic techniques for generating constructs andanalyzing integration and expression, details to be considered priorto embarking on the experiment are described. Information regard-ing ocular cell lines in which constructs can be evaluated prior totheir incorporation into transgenic mice is provided. We have alsodescribed ocular cell-specific regulatory elements that have beenidentified (and which may be useful in driving expression in spe-cific cells in the eye), criteria for selecting background strains, meth-ods for propagating transgenic mouse lines, and techniques that maybe valuable for evaluating the effects of transgene expression onocular phenotype. Whereas it is beyond the scope of this chapter todescribe methodology for generating either knockout mice ortransgenic animals in species other than the mouse, methods thatare used to evaluate ocular anatomy in the pronuclear injection-derived transgenic mouse can be adapted for use in those othersituations.
2. Materials
2.1. Creation and Preparationof DNA Constructs for Microinjection
1. 3 M sodium acetate, pH 5.2.2. 100% ethanol.3. 70% ethanol.4. TE pH 7.5, low ethylenediaminetetraacetic acid (EDTA) concentra-
tion: 10 mM Tris-HCl, 0.1 mM (EDTA).5. Agarose.6. TAE: 0.04 M Tris.acetate, 1 mM EDTA.7. TBE: 0.09 M Tris.borate, 1 mM EDTA; phenol.8. Chloroform/isoamyl alcohol (24:1).
2.2. In Vitro Transfection Experiments
1. Plasmid containing transgene cassette.2. Ocular cell line for expression.

Transgenic Mice 193
3. Cell culture media, with and without serum.4. Lipofectamine Reagent (Gibco-BRL, Gaithersburg, MD).
2.3. Selection of Embryo Donor Strains
Consult the Jackson Laboratory, Bar Harbor, ME, for a completelisting of available animals (1). It should be noted that The JacksonLaboratory maintains an “Eye Models Resource.” Charles RiverLaboratories (Wilmington, MA) also carries a large number of dif-ferent strains.
2.4. Molecular Biology Reagentsto Screen Transgenic Mice
2.4.1. Reagents to Purify and Digest Genomic DNA
1. Tail buffer: 50 mM Tris, pH 8.0, 100 mM EDTA, 0.5% sodiumdodecyl sulfate (SDS).
2. Proteinase K.3. Phenol.4. Chloroform/isoamyl alcohol: 24:1.5. 5 M sodium chloride.6. 100% ethanol.7. 70% ethanol.8. TE pH 8: 10 mM Tris-HCl, 1 mM EDTA.9. Restriction endonucleases.
10. RNase; spermidine.11. 3 M sodium acetate, pH 4.8.
2.4.2. Reagents for Southern Blot Analysis
1. Agarose.2. TAE.3. Denaturation solution: 0.6 M sodium chloride, 0.2 M sodium
hydroxide.4. Neutralization solution: 1 M Tris, 1.5 M sodium chloride, pH 7.4.5. Formamide.6. 20X SSC: 3 M sodium chloride, 0.3 M sodium citrate, pH 7.0.7. 10% SDS.

194 Gupta et al.
8. Dextran sulfate.9. DNA probe for labeling; 32[P]dCTP.
2.4.3. Reagents for PCR
1. DNA template.2. Specific primers (0.5 µM).3. MgCl2 (optimal concentration depends on primers).4. Sterile H2O.5. 25 mM dNTP mix (combine equal volumes of 100 mM each dNTP).6. 10X polymerase chain reaction (PCR) amplification buffer: 500 mM
KCl, 100 mM Tris-HCl, pH 9.0, 0.1% Triton X-100.7. Taq polymerase.8. Mineral oil.
2.5. Genotype-Phenotype Correlations
2.5.1. Slit Lamp Examination
1. To dilate mouse eye: 1% tropicamide (e.g., Mydriacyl 1%, Alcon,Humacao, Puerto Rico).
2. Slit Lamp (Carl Zeiss, Germany; sold through Krebs, Englewood, NJ).
2.5.2. Ophthalmoscopy
1. Dilating drops (see Subheading 2.5.1.); Ophthalmoscope: HeineOmega 180 binocular indirect, Krebs, Englewood, NJ) and 78 or90 diopter lens (Krebs).
2. Fundus photography: Kowa Camera (Krebs, Englewood, NJ) and78 or 90 diopter lens.
2.5.3. Histological Studies
1. Cryosections: Selection of fixative is dependent on what additionalstudies are desired. The fixative least likely to interfere with immuno-histochemistry/immunofluorescence is 4% paraformaldehyde in1X phosphate-buffered saline (PBS). PBS composition per liter:8.0 g NaCl, 0.2 g KCl, 2.14 g Na2HPO4·7H2O, 0.35 g KH2PO4,pH 7.4. Use 4% paraformaldehyde within 24 h with storage at 4°C.Use within 1 wk with storage at –20°C; Cryoprotectant: 30% sucrosein 1X PBS; Embedding: Optimal Tissue Compound (OCT; VWR

Transgenic Mice 195
Scientific, Bridgeport, NJ). There are a wide variety of stains; selec-tion depends on what aspect of the tissue is of interest (2). The celllayers of the retina can be delineated using neutral red (0.5% aque-ous) or hematoxylin and eosin.
2. Paraffin sections: Fixative selection and staining of sections similaras in Subheading 2.5.3., step 1, except for deparaffinization steps.
3. Plastic sections Fixative: 4% paraformaldehyde/0.25% glutaralde-hyde in 1X PBS. Always make fresh; JB-4 Plus Embedding Kit(Polysciences, Warrington, PA); Richardson’s Stain: Mix equal vol-umes of 1% methylene blue and 1% Azure II/1% sodium borate (3).Alternatively, use 1% toluidine blue/1% sodium borate or 1% AzureII/1% sodium borate. All staining solutions are made with H2O, fil-ter before use.
2.5.4. RNA Preparation
TRIzol reagent (Gibco-BRL); Diethyl pyrocarbonate (DEPC;Sigma, St. Louis, MO)-treated ddH2O: Add 1 mL DEPC to 1 L ddH2Oin a glass bottle. Cap and shake vigorously, sit overnight. The nextday, invert bottle and sit again overnight. Autoclave at 121°C for90 min; DNase I, Amplification grade (Gibco-BRL).
There are a number of ways to detect the transgene transcript:Northern analysis, reverse transcription-polymerase chain reaction(RT-PCR), in situ hybridization, in situ RT-PCR. Materials will dependon selection of technique. For example, RT-PCR will require the RNAtemplate (1–5 µg), primers (0.5 µM), dNTPs (0.25 mM), RNase inhibi-tor (1 U/µL), reverse transcriptase (10 U/µL), and Taq polymerase.When using a cDNA transgene containing an exogenously addedintron, it is advantageous to design a primer pair that encompasses theintronic sequences. In this way, the RT-PCR product will reflect thetransgene-derived spliced transcript rather than possible contaminatingDNA sequences. In situ hybridization and in situ RT-PCR will requiretissue sections (Subheadings 2.5.3., steps 1 and 2).
2.5.5. Protein Analysis
Materials for extraction will depend on the specific protocol cho-sen to extract the transgenic protein. Different methods can be used

196 Gupta et al.
to detect the protein: Western analysis, immunohistochemistry,functional assays. Besides the protein sample, Western analysis andimmunohistochemistry will require a primary antibody. If thesequences for an epitope tag were not incorporated into the transgeneconstruct, a primary antibody should distinguish (if possible) betweenthe transgenic protein product and any homologous endogenousmurine protein. The ECL Western blotting detection kit (AmershamLife Sciences, Arlington Heights, IL) can be used to develop thesignal. This kit also requires a peroxidase-conjugated secondaryantibody and Hybond ECL nitrocellulose membrane. For immuno-histochemistry, the choice of fixative for tissue sections will bedetermined by how it affects the integrity of the antigen.
2.6. Storage of Transgenic Mouse Embryos
1. Reagents: Hormones (pregnant mare serum [PMS] and human chori-onic gonadotrophin [hCG]) for superovulation—see Hogan et al. (4);PBS; 2 M dimethyl sulfoxide (DMSO).
2. Supplies, Equipment: 5-cc syringe equipped with 30-gage needle;dissecting microscope; 2 mL plastic cryotubes; Pasteur pipets; con-trolled rate freezer (such as CryoMed 1010 programmable freezingcontroller; Forma Scientific, Inc., Marietta, OH); liquid nitrogen stor-age; sterile culture dishes; surgical tools.
3. Methods
3.1. Preparation of Transgene DNA
A transgene cassette is constructed using standard molecularcloning techniques (5) (see Note 1).
1. The transgene is linearized, isolated from vector sequences and puri-fied for microinjection.
2. Purified DNA is resuspended at 200–400 copies/µL in TE pH 7.5,low EDTA buffer prior to microinjection. Many transgenic facilitieshave specific purification requirements, so it is wise to consult withthem prior to initiating the experiments.
3.2. Confirmation of Transgene Function
Whenever possible, it is desirable to verify that the transgenecassette can drive appropriate expression prior to microinjection

Transgenic Mice 197
(see Note 2). This can be done by transfecting plasmid DNA intoan appropriate cell line and evaluating expression. DNA doesnot enter most cells efficiently. However, a variety of transfec-tion reagents are available. The Lipofectamine Reagent has beenused successfully in our hands following the manufacturer’sdirections. Depending on the transgene, expression may be detectedusing direct fluorescence microscopy (i.e., green fluorescentprotein) or indirectly, using immunohistochemistry or Westernblot analysis.
3.3. Embryo Selection
Select embryo donor strains such that the genetic backgrounddoes not have a negative effect on transgene expression or function(see Note 3). Other selection criteria are similar to those used inother transgenic mouse studies (for example, transgenic mouse pro-duction is generally more efficient when F2 zygotes are used formicroinjection instead of zygotes from inbred mice [6]).
3.4. Identification of Transgenic Mice
1. Obtain a biopsy from the tips of mouse tails using a sterile razorblade.
2. Digest the tails overnight at 55°C in tail buffer with proteinase K at0.5 µg/µL.
3. Isolate genomic DNA using a series of phenol and chloroformextractions.
4. Precipitate and rehydrate DNA in TE pH 8.0.5. Digest genomic DNA (20 µg) with selected restriction enzymes and
subject to electrophoresis.6. Transfer DNA to a nylon or nitrocellulose membrane and perform
Southern blot analysis.7. Use a 32[P]-radiolabeled probe, complementary to the transgene, to
identify positive animals. Label probe via random priming asdescribed (7).
8. PCR may also be used to analyze DNA once true positives have beenidentified through Southern analysis (see Note 4).

198 Gupta et al.
3.5. Genotype-Phenotype Correlations
3.5.1. Slit-Lamp Examination
Slit-lamp examinations can be performed to evaluate the corneasand lenses of transgenic mice. The technique of slit-lamp examina-tion of the mouse is essentially identical to that used in the human.
1. The key manoeuver is properly positioning the mouse with respectto the working distance of the slit lamp in order to perform theexamination. It is useful to take a strip of paper from the foreheadmount and determine where the slit lamp will be properly operatedand focused using the strip of paper as a reference.
2. The animal is then positioned at this point in space with pupils dilated.3. Dilation is achieved within 5 min (after applying 1 drop of Mydriacyl
per eye) and lasts for up to 2 h. The eye should be evaluated within15 min after application of the dilating drops. Under high magnifica-tion, a slit beam is passed across the anterior segment. Oblique illu-mination by the slit beam, will provide an optical cross-section ofthe lens and cornea. If opacification of the lens is detected, directillumination along the visual access will allow the cataract to bevisualized against the fundus reflex (red reflex). This is often usefulin determining its density and position.
3.5.2. Ophthalmoscopy
The neural retina can be visualized in a noninvasive fashion usingophthalmoscopy. Changes in ocular phenotype can be followed forthe life of the animal. Ophthalmoscopy can also be used to identifyfluorescently tagged transgenes through illumination with theexciting wavelength of light. This has been successfully reportedfor the jellyfish-derived transgene, GFP, which encodes the biolu-minescent green fluorescent protein (8).
Ophthalmoscopy requires patience and practice.
1. Prior to ophthalmoscopy, dilate the pupil as described above. Theeasiest way to achieve a view of the fundus is to observe it underillumination from the light of the indirect ophthalmoscope through a78 or 90 diopter lens.
2. Advance the lens slowly and carefully towards the eye keeping thered reflex of the fundus centered. As the lens approaches the eye, the

Transgenic Mice 199
image from the fundus will enlarge and fill the lens. The image willbe inverted. Inexperienced observers may be disoriented due to themotion of the object opposite to that of the motion of the lens(“against movement”). Image inversion and “against movement” willbe easily compensated for by the observer with time.
3. In order to observe a specific aspect of the retina, orient the line ofsight to match up with the area of the fundus to be observed. For example,if the observer wishes to visualize the nasal fundus, the eye can beexamined while “looking” in the direction of the nose or, more com-monly in the case of the mouse, the observer will move behind theear and aim the lens towards the nasal aspect of the eye.
3.5.3. Histological Studies
1. Perfusion with fixative results in excellent fixation of retinal tissue.This can be performed by deeply anesthetizing the mouse andsequentially injecting the left ventricle of the heart with saline andthen fixative. This procedure obviously also kills the mouse.
2. Alternatively, the eye can be surgically enucleated and then fixed.Enucleation should be done as carefully as possible so as not to rup-ture the globe or detach the retina. To this end, grasp the conjunctivagently with forceps while using curved iridectomy scissors to freethe globe from surrounding muscle, optic nerve, and other tissue.Rough removal of the eye can lead to retinal detachment.a. Cryosections: Fix in 4% paraformaldehyde at room temperature
for 2 h. Cryoprotect in 30% sucrose/PBS at 4°C overnight. Thisstep improves the histology of frozen sections. Immerse the tis-sue in OCT and freeze in a 2-methylbutane/dry-ice bath. Sectionat –20°C.
b. Paraffin sections: Fix in 4% paraformaldehyde overnight. Pro-cess for paraffin sectioning and embed in paraffin wax. Prior tostaining, clear paraffin from the slides by immersing themsequentially in xylene, 1:1 xylene/100% EtOH and 100% and50% EtOH solutions.
c. Plastic sections: Fix in 4% paraformaldehyde/0.25% glutaralde-hyde overnight. Using the JB-4 Plus Embedding Kit, infiltratethe tissue at 4°C at least one night and embed in plastic. Placestain directly on slides for 20–30 s and rinse off excess withtap water.

200 Gupta et al.
3.5.4. RNA Analysis
RNA preparation: Because eye tissue degrades rapidly afterremoval from the animal, freeze the tissue on dry ice or liquid nitro-gen immediately. Alternatively, the tissue can be placed directlyinto TRIzol reagent. Depending on the size of the eye, 1 globe(minus the lens) can yield 1 to 10 µg RNA. Be careful to use RNase-free instruments, reagents, and barrier pipet tips.
Detection of transgene transcript: The expected level of transgeneexpression can guide the choice of technique to detect transcript.Northern analysis can be performed if the estimated abundance isrelatively high. RT-PCR can detect relatively rare transcripts. In situhybridization and in situ RT-PCR can give location information forthe transcripts (7).
3.5.5. Protein Analysis
Protein extraction: The choice of protocol will depend on the cel-lular fraction in which the protein product of the transgene is found:extracellular, membrane, cytosolic, nuclear, and so on. Proteinexpression can be assessed by Western analysis, immunohistochem-istry, and functional assays (7).
3.6. Storage of Transgenic Mouse Embryos (see Note 6)
It may be desirable to store transgenic mouse embryos after theline has been characterized. To cryopreserve transgenic embryos, atransgenic male mouse should be mated to superovulated femalemice of the same inbred strain. To facilitate future steps, the malemouse should be homozygous for the transgene.
1. Three days after pairing (with day of pairing considered day 0), thefemale mice are sacrificed and embryos are flushed from their ovi-ducts with saline in a 5-cc syringe equipped with a 30-gage needleand introduced into the uterine end of the oviduct. This is performedunder a dissecting scope.
2. The normal-appearing 8-cell embryos are transferred into 2-mL plas-tic cryotubes containing 0.1 mL PBS and placed on ice. No morethan 40 embryos should be stored in a single tube.

Transgenic Mice 201
3. The tubes containing embryos are held on ice until all oviducts havebeen flushed (generally requiring about 2 h).
4. Mouse embryos can be frozen and thawed by various methods. Thefreezing must be performed gradually (–0.5°C/min) for optimalresults, as described by Whittingham et al. and Leibo (9,10).
5. An additional 0.1 mL of PBS at 4°C with 2 M DMSO is gentlyadded to each cryotube to bring the final concentration of DMSOto 1 M. After at least 30 min equilibration on ice, the cryotubes aretransferred to a salt and ice bath made up to maintain a temperatureof –6°C.
6. Two minutes after immersion in the ice bath, the contents of thecryotubes are seeded with an ice crystal from the tip of a Pasteurpipet. To prepare the pipettes a small amount of PBS is drawn intothe tip of a Pasteur pipet by capillary action. The pipet (or pipets, ifmore than one seeding is to be done) is then put inside a glass testtube that is partially immersed in a –10°C salt and ice bath. Whenthe embryo culture is ready to be seeded, a pipet with the frozenPBS in the tip is just touched to the surface of the medium contain-ing the embryos. This will bring about the ice nucleation of themedium with minimal damage to the embryos caused by the for-mation of ice crystals.
7. The cryotubes are then capped and transferred to a controlled-ratefreezer that has been precooled to –6°C. The temperature in thecontrolled rate freezer is lowered at the rate of 0.5°C per minute.When the temperature of the freezing chamber has been lowered to–80°C, the cryotubes are removed from the freezing chamber andimmediately put into a liquid nitrogen storage container.
8. To reconstitute the thawed embryos, embryo transfer is performedusing pseudopregnant female mice. Pseudopregnant mice areproduced by selecting females in proestrus and mating them(day 0) to vasectomized males that have been proven sterile.Perform the embryo transfer by aseptically injecting thawed 8-cellembryos into the infundibulum of the oviduct (4). To thaw theembryos, remove cryotubes from liquid nitrogen storage andplace them on the bench at ambient temperature until thawed,which usually requires from 12 to 15 min. When completelythawed, slowly add 0.8 mL of PBS in a dropwise fashion to dilutethe DMSO. Wash the embryos once in M16 culture medium (4)before implanting.

202 Gupta et al.
4. Notes
1. The essential construct components include the gene or cDNA ofinterest, a promoter to drive cell-specific expression and a poly Atail. Attempts should be made to include intronic sequences incDNA-containing constructs. Tags (i.e., polyhistidine, c-Myc,hemagglutinin) may also be included in order to facilitate identifica-tion of the protein product of the transgene.
Transgene expression depends on the site of integration, as well asthe presence of regulatory elements. In order to direct tissue- or cell-specific expression it is necessary to include an appropriate pro-moter in the DNA construct. With respect to the eye, a number ofcell-specific promoters have been identified. Many have been usedto successfully drive transgene expression in transgenic models(see Table 1). Ubiquitous promoters (i.e., CMV promoter) shouldbe avoided unless nonspecific expression is desired.
Intron sequences, although optional, are also key to successfultransgene expression. In many cases, upstream elements are neces-sary for tissue-specific expression. Expression levels also tend toincrease, when introns are present (11). This may be the result ofenhancers present within the intron. It is recommended that genomicsequences, containing both introns and exons, be used in thetransgene cassette. If a cDNA is used, it is advisable to introduce anexogenous intron.
Tags are another optional component that may be beneficial.In some instances the transgenic animal may be designed such thatit overexpresses a gene found endogenously. Thus, it is difficult todistinguish between endogenous expression and transgene-specificexpression. One may also lack appropriate antibodies to detect theprotein of interest. It is useful to incorporate an epitope tag in theconstruct design when such detection problems are anticipated.
Purified DNA should be clean, devoid of vector backbone sequenceand chemical contaminants. Vector sequence will reduce the effi-ciency of gene transfer. Contaminants, such as traces of phenol, etha-nol or enzymes can be toxic to the embryo. Particulate matter such asagarose or dust, will clog the microinjection needle. Thus, all solu-tions added to the DNA sample should be filtered.
2. Prior to microinjection, it is highly recommended that the DNA con-struct be tested for expression using transient transfection techniques.This is an effective and easy way to determine if the transgene is
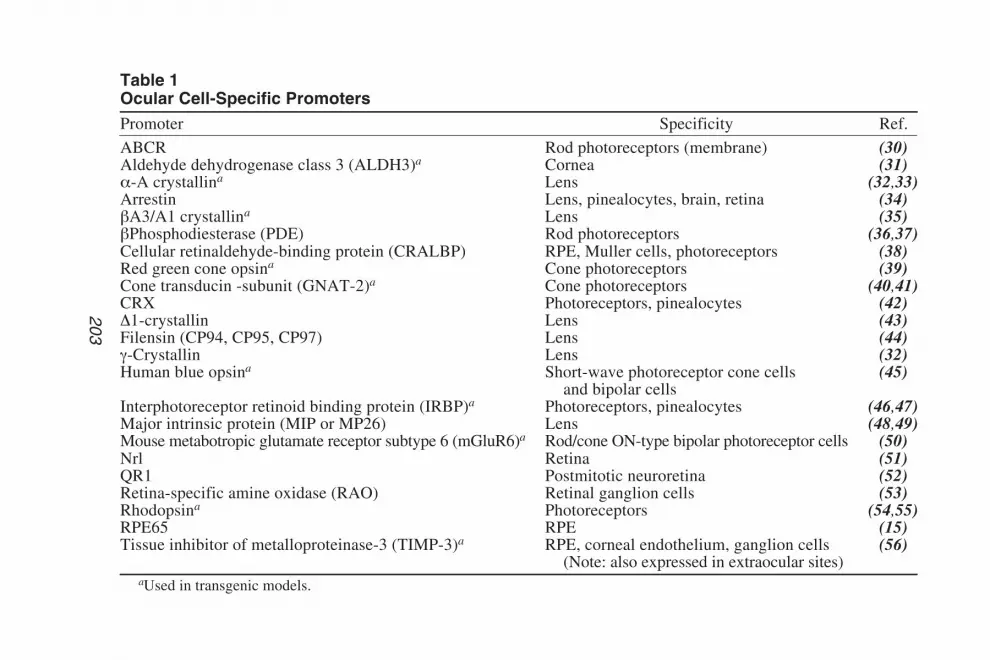
Transgenic M
ice203
203
Table 1Ocular Cell-Specific PromotersPromoter Specificity Ref.
ABCR Rod photoreceptors (membrane) (30)Aldehyde dehydrogenase class 3 (ALDH3)a Cornea (31)
-A crystallina Lens (32,33)Arrestin Lens, pinealocytes, brain, retina (34)
A3/A1 crystallina Lens (35)Phosphodiesterase (PDE) Rod photoreceptors (36,37)
Cellular retinaldehyde-binding protein (CRALBP) RPE, Muller cells, photoreceptors (38)Red green cone opsina Cone photoreceptors (39)Cone transducin -subunit (GNAT-2)a Cone photoreceptors (40,41)CRX Photoreceptors, pinealocytes (42)
1-crystallin Lens (43)Filensin (CP94, CP95, CP97) Lens (44)-Crystallin Lens (32)
Human blue opsina Short-wave photoreceptor cone cells (45)and bipolar cells
Interphotoreceptor retinoid binding protein (IRBP)a Photoreceptors, pinealocytes (46,47)Major intrinsic protein (MIP or MP26) Lens (48,49)Mouse metabotropic glutamate receptor subtype 6 (mGluR6)a Rod/cone ON-type bipolar photoreceptor cells (50)Nrl Retina (51)QR1 Postmitotic neuroretina (52)Retina-specific amine oxidase (RAO) Retinal ganglion cells (53)Rhodopsina Photoreceptors (54,55)RPE65 RPE (15)Tissue inhibitor of metalloproteinase-3 (TIMP-3)a RPE, corneal endothelium, ganglion cells (56)
(Note: also expressed in extraocular sites)aUsed in transgenic models.

204 Gupta et al.
functioning. A limitation for evaluating constructs containing tissue-specific promoters is availability of ocular tissue-specific cell lines.There are several permanent cells lines available for retinal pigmentepithelium (RPE) cells, but only one permanent line, which isthought to be photoreceptor in origin (see Table 2; This line hasbeen used successfully to evaluate cell-specific expression of therhodopsin promoter and retinal cell-specific protein-DNA inter-actions in the phosphodiesterase [PDE] promoter, for example[12,13]). For some cell types it is possible to generate primary cul-tures which can be used to evaluate promoter activity. Primary cul-tures can be generated from RPE, corneal endothelium, embryonicchick photoreceptors, neonatal mouse photoreceptors, and Mullercells (14–18).
3. Many inbred strains of mice exhibit congenital ophthalmic abnor-malities or spontaneous mutations, which can make data interpreta-tion difficult. An effort should be made to avoid such strains. Table 3lists several common strains of mice with known ocular defects. Ifsuch a strain was used accidentally to generate the initial founder mice,it is possible in some situations to breed the mice selectively to elimi-nate the mutant allele. For example, if the injected embryos containthe rd allele, the transgenic founders can be bred to C57Bl/6 mice toproduce offspring, which possess the transgene, but lack the rd allele(detectable through restriction fragment polymorphism analysis [19]).
It may be helpful to consult The Jackson Laboratory (http://www.jax.org/) when choosing a strain. This is a marvelous resourcefor information about specific strains of mice. The Jackson Labora-tory also maintains lines of mice with known defects, which may beuseful as models for ocular disease.
4. Southern blot analysis is recommended for screening mice and iden-tifying transgenics. This analysis will confirm the size of the inte-grated transgene and can be used to obtain copy number. Once aSouthern has been used to identify transgenic mice, lines can bemaintained using slot blot analysis or PCR. If PCR is used, controlsshould be run in order to avoid false positive (or false negative) results.
In order to run a Southern or perform PCR, it is first necessary toobtain genomic DNA from animals to be tested. Genomic DNA isextracted from tail (or ear) tissue using a series of phenol/chloroformextractions. When obtaining tissue to analyze, it is necessary to usesterile scissors or razor blades. Dirty scissors can contaminate a tis-sue sample.

Transgenic Mice 205
In preparing Southern blots, one can obtain copy number infor-mation by loading equal concentrations of the mouse DNA onto agel side-by-side with known numbers of copies of the transgene(standards). Copy number can be determined through comparisonof signals of experimental samples with the standards in the devel-oped autoradiogram (4). Although the blot can be probed using a
Table 2Permanent Cell Lines that Can Be Usedto Evaluate Ocular-Cell-Specific Transgene Expression
Ocular cell type Reference or source (cat. no.)
RPE cellsD407 (human) (57)ARPE19 (human) ATCC (#CRL-2302); (58)RPE-J (rat) ATCC (#CRL-2240)
Photoreceptor cellsY-79, retinoblastoma (human) ATCC (#HTB-18)
Table 3Ocular Abnormalities Found in Specific Strains of Mice
Strain Defect
C57BL strains Microphthalmia/anophthalmia(incidence 4–12%); corneal abnormalities (22)
DBA/2J Pigmentary dispersion glaucoma (28)CBA/J rd mutation causing retinal degeneration (1,19)a
ST/bJWB/ReJ-WPL/JSWR/JSJL/JBDP/JFVB/NBub/JRBJ/DnC3H/Hej
aThe following strains of mice have been tested for the rd mutation and do notcarry the defect: SM/J, AKR/J, DBA/2J, 129/Rr, I/LnJ, LP/J, and NZB/BlnJ (19).

206 Gupta et al.
nonradioactive methods, in our hands, sensitivity is enhanced using32[P]-labeled probe.
Once a positive transgenic mouse has been identified, it should bemated to establish a transgenic line. The founder can be mated tomice of the same strain to conserve the genetic background or todifferent strains to study potential effects of genetic background ontransgene expression and function. The investigator should be awarethat it takes more than 20 generations of brother–sister matings todevelop an inbred transgenic line, however (20). To facilitate mat-ing, feed the mating pair breeder chow (which has higher fat contentthan regular chow) and do not change the bedding immediately afterpairing the mice to be crossed. A male mouse is more likely to matewhen it is maintained in an environment that it has marked as itsterritory. Ovulation and mating is generally coincident with the mid-point of the dark cycle (if mice are maintained on a 14-h light/10-hdark cycle). Mating has occurred if the female shows a vaginal plugthe next morning. However, a plug is not a guarantee of a successfulpregnancy.
By Mendelian inheritance, the founder is expected to transmit thetransgene to 50% of its offspring. A less than 50% rate can indicatethat the founder is a mosaic. Mice homozygous for the transgene canbe produced by mating heterozygotes. Methods to distinguishbetween homozygotes and heterozygotes are available: quantitationof transgene dosage, product, or phenotype; in situ hybridization tointerphase nuclei, test breeding, Southern blot analysis using a flank-ing probe, and PCR analysis with a flanking primer (4).
The offspring should be numbered sequentially by either earpunches or toe clipping. Toe clippings are preferable in young miceas the ears are too small to punch reliably.
5. There can be age-related ocular changes in mice, with some strainsbeing more susceptible than others. It is important to be aware of thisif the phenotype is to be followed over time.a. Cornea: Although focal and diffuse corneal opacities and kerati-
tis are infrequent in mice, the incidence of corneal dystrophyincreases with age in some strains. A large proportion of Japa-nese KK mice develop this degenerative disorder (21).
b. Uveal tract: Inflammation of the iris and ciliary body may occa-sionally be seen with age (21). By 22–30 mo of age in DBA/2Jmice, there is complete loss of the iris pigmentary epithelium andextensive atrophy of the iris stroma (22).

Transgenic Mice 207
c. Lens: There is an increasing incidence of cataracts in Swiss micewith age: by 25–30 mo of age, up to 40% of these mice had cata-racts (23). Taradach and Greaves found a 25% incidence of cata-racts in CD1 mice by 18 mo of age (21). Cataracts are rare inBalb/c and C57Bl/6 mice up to approx 2 yr of age (24).
d. Retina: Retinal atrophy is rare in C57Bl/6 mice up to 2 yr of age(24). Frequency of retinal atrophy is less than 2% in Balb/c mice(25), 4–6% in CD1 mice (26), and 100% in C3H mice (25). (Reti-nal atrophy in the rd mouse is caused by presence of the mutantrd allele—see Table 3). By 22–30 mo of age in DBA/2J mice,there is loss of nerve fibers with cupping of the optic nerve sec-ondary to glaucoma (27,28). Some thinning of the retina appearsto be a side effect of transynaptic degeneration (John R. Hecken-lively, personal communication).
e. The frequency of blepharoconjunctivitis increases with age in anumber of strains: A/HeJ, Balb/cJ, Balb/cByJ, CBA/J, and 129/J(22). As far as details concerning retinal anatomy, gross featuresof the fundus that can be identified ophthalmoscopically include:color and contour of the optic disk, the caliber of the retinal bloodvessels, the homogeneity of the pigment epithelial layer underly-ing the retina and the presence of any opacities in the vitreous orlens. When observing animals with retinal degeneration, the mostsensitive marker is the presence of pigment changes such as pig-ment mottling (“salt and pepper pigmentation”), large areas ofpigment atrophy, or the presence of pigment migration into theretina (“bone spicules”). Of note, there is a wide variation in thefundus features of different pigmented strains of mice. Determi-nation of fundus features in albino mice is particularly difficultdue to the lack of ability to observe pigmentary changes. It isimportant to appreciate the variability of normal fundi. In addi-tion, there can be normal age-related/degenerative changes, suchas RPE drusen-like deposits that are occasionally seen. Examplesof normal and abnormal mouse fundus views are demonstrated inFig. 1. Mouse fundus photography is difficult and should only beattempted by a skilled ophthalmoscopist. Methods are describedby Bennett et al. (29).
Variations in ophthalmoscopic appearance of wild-type reti-nas in different lines of mice: it is important to be aware that coatcolor, and therefore degree of pigmentation in the eye, can changethe ophthalmoscopic appearance of the fundus. For example, reti-

208 Gupta et al.
nal or choroidal atrophy is much more striking in pigmentedmice, such as C57Bl/6, than in albino mice, such as CD1 orAKR. Also, the underlying choroidal vessels are much moreprominent in albino mice. Therefore, if transgenic animals areto be produced of varying coat colors, one must become famil-iar with the ophthalmoscopic appearance of the wild-type fun-dus for each color.
With respect to histological procedures, fixatives are toxicand often carcinogenic. (Gloves should be worn and solutionsshould be prepared in a chemical fume hood.) Likewise, DEPC,used in RNA studies, is also toxic and should be handled withcaution.
6. Cryostorage of transgenic mouse embryos can save animal costs andcan provide an important back-up should a disaster strike the animalroom. In addition, many centers require long quarantine periodsbefore allowing a new line of mice into the facility. The availabilityof frozen embryos can expedite collaborations with other laborato-ries by allowing rapid rederivation of the line in the new animalfacility (and avoiding the need for quarantine). The Jackson Labora-tory offers a course on embryo cryopreservation (for information,see http://www.jax.org/courses/documents/courses1999.html).
Fig. 1. Fundus features that can be appreciated in adult transgenic mice.(A) Phenotypically normal fundus of a C57Bl/6 mouse. Pink optic nerve,normal caliber retinal vessels, homogeneous pigmentation; (B) Retinaldegeneration (rd) mouse. Optic disk pallor, attenuated retinal vessels and,most prominent, pigment mottling and migration throughout the fundus;(C) Isolated degenerative change in a transgenic mouse; Drusen arepresent at the level of the RPE. Arrow delineates one drusen underlying aretinal vessel.

Transgenic Mice 209
Acknowledgments
The authors would like to thank Alicia Valenzuela and Dr. LarryMobraaten of The Jackson Laboratory for detailed technologicaladvice regarding embryo cryopreservation. This work was sup-ported by a Research to Prevent Blindness Departmental Award,NEI RO1s EY10820 and EY 12156 (JB), T32 EY07131 (ARG);The Fight for Sight Research Division of Prevent BlindnessAmerica (NSD); a Center Grant from Foundation Fighting Blind-ness, Inc; the Pennsylvania Lions Sight Conservation and EyeResearch Foundation (JB); NIH P30 DK47757-05; the Paul andEvanina Mackall Foundation Trust and the F. M. Kirby Foundation.
References
1. The Jackson Laboratory. http://www. jax. org/.2. Kiernan, J. (1990) Histological and Histochemical Methods: Theory
and Practice. Pergamon, Elmsford, New York.3. Richardson, K. C., Jarret, L., and Finke, E. H. (1960) Embedding
in epoxy resins for ultrathin sectioning in electron microscopy.Stain Technol. 35, 313.
4. Hogan, B., Constantini, F., and Lacy, E. (1994) Manipulating theMouse Genome: A Laboratory Manual. Cold Spring Harbor Labora-tory, Cold Spring Harbor, New York.
5. Sambrook, J., Fritsch, E. F., and Maniatis, T. (1989) Molecular Cloning:A Laboratory Manual. Cold Spring Harbor Laboratory, Cold SpringHarbor, New York.
6. Brinster, R. L., Chen, N. Y., Trumbauer, M. E., Yagle, M. K., andPalmiter, R. D. (1985) Factors affecting the efficiency of introducingforeign DNA into mice by microinjecting eggs. Proc. Natl. Acad. Sci.USA 82, 4438–4442.
7. Ausubel, F. M., Brent, R., Kingston, R. E., Moore, D. D., Seidman, J. G.,Smith, J. A., and Struhl, K. (1996) Current Protocols in MolecularBiology. Vol. 2. Wiley, New York.
8. Bennett, J., Duan, D., Engelhardt, J., and Maguire, A. M. (1997) Real-time non-invasive in vivo assessment of adeno-associated virus-mediated retinal transduction. Invest. Ophthalmol. Vis. Sci. 38,2857–2863.

210 Gupta et al.
9. Whittingham, D., Leibo, S., and Mazur, P. (1972) Survival of mouseembryos frozen to –196°C and –269°C. Science 178, 411–414.
10. Leibo, S. P. (1986) Cryobiology: preservation of mammalian embryos,in Genetic Engineering of Animals (Evans, J. W. and Hollaender, A.,eds.), Plenum, New York, pp. 251–272.
11. Palmiter, R. D., Sandgren, E. P., Avarbock, M. R., Allen, D. D., andBrinster, R. L. (1991) Heterologous introns can enhance expressionof transgenes in mice. Proc. Natl. Acad. Sci. USA 88, 478–482.
12. Bennett, J., Zeng, Y., Bajwa, R., Klatt, L., Li, Y., and Maguire, A. M.(1998) Adenovirus-mediated delivery of rhodopsin-promoted bcl-2results in a delay in photoreceptor cell death in the rd/rd mouse. GeneTherapy 5, 1156–1164.
13. Di Polo, A., Rickman, C., and Farber, D. (1996) Isolation and initialcharacterization of the 5'-flanking region of the human and murinecyclic guanosine monophosphate-phosphodiesterase beta-subunitgenes. Invest. Ophthalmol. Vis. Sci. 37, 551–560.
14. Werner, M., Madreperla, S., Lieberman, P., and Adler, R. (1990)Expression of transfected genes by differentiated, postmitotic neu-rons and photoreceptors in primary cell cultures. J. Neurosci. Res.25, 50–57.
15. Nicoletti, A., Kawase, K., and Thompson, D. A. (1998) Promoteranalysis of RPE65, the gene encoding a 61-kDa retinal pigment epi-thelium-specific protein. Invest. Ophthalmol. Vis. Sci. 39, 637–644.
16. Politi, L. E., Lehar, M., and Adler, R. (1988) Development of neona-tal mouse retinal neurons and photoreceptors in low density cell cul-ture. Invest. Ophthalmol. Vis. Sci. 29, 534–543.
17. Bednarz, J., Rodokanaki-von Schrenck, A., and Englemann, K.(1998) Different characteristics of endothelial cells from central andperipheral human cornea in primary culture and after subculture. InVitro Cell. Dev. Biol. 34, 149–153.
18. McGillem, G. S., Guidry, C., and Dacheux, R. F. (1998) Antigenicchanges of rabbit retinal Muller cells in culture. Invest. Ophthalmol.Vis. Sci. 39, 1453–1461.
19. Pittler, S. J. and Baehr, W. (1991) Identification of a nonsense muta-tion in the rod photoreceptor cGMP-phosphodiesterase beta subunitgene of the rd mouse. Proc. Natl. Acad. Sci. USA 88, 8322–8326.
20. Altman, P. L. and Katz, D. D. (1979) Inbred and genetically definedstrains of laboratory animals. Part I: Mouse and rat. Federation ofAmerican Societies for Experimental Biology, Bethesda, MD.

Transgenic Mice 211
21. Taradach, C. and Greaves, P. (1984) Spontaneous eye lesions in labo-ratory animals: incidence in relation to age. Crit. Rev. Toxicol. 12,121–147.
22. Smith, R. S. and Sundberg, J. P. (1996) Ophthalmic abnormalities ininbred mice, in Pathobiology of the Aging Mouse (Mohr, U., Dung-worth, D. L., Capen, C. C., Carlton, J. P., Sundberg, W. W., and Ward,J. M. W., eds.), ILSI Press, Washington, DC, pp. 117–123.
23. Tucker, M. J., De, C., and Baker, S. B. (1967) Diseases of specific patho-gen free mice, in Pathology of Laboratory Rats and Mice (Cotchin, E.and Roe, F. J. C., eds.), Blackwell Scientific, Oxford, England.
24. Frith, C. H., Highman, B., Burger, G., and Sheldon, W. D. (1983)Spontaneous lesions in virgin and retired breeder Balb/c and C57BL/6 mice. Lab. Animal Sci. 33, 273–286.
25. Frith, C. H. and Ward, J. M. (1988) Color Atlas of Neoplastic andNon-neoplastic Lesions in Aging Mice. Elsevier, New York.
26. Frame, S. R. and Slone, T. W. (1996) Nonneoplastic and neoplasticchanges in the eye, in Pathobiology of the Aging Mouse (Mohr, U.,Dungworth, D. L., Capen, C. C., Carlton, W. W., Sundberg, J. P., andWard, J. M., eds.), ILSI Press, Washington, DC, pp. 97–103.
27. Smith, R. S., Chang, B., Hawes, N., Heckenlively, J. R., Roderick, T. H.,and Sundberg, J. P. (1996) Glaucoma in aging inbred mice, inPathobiology of the Aging Mouse (Mohr, U., Dungworth, D. L.,Capen, C. C., Carlton, W. W., Sundberg, J. P., and Ward, J. M., eds.),ILSI Press, Washington, DC, pp. 125–129.
28. John, S. W., Smith, R. S., Savinova, O. V., Hawes, N. L., Chang, B.,Turnbull, D., et al. (1998) Essential iris atrophy, pigment dispersion,and glaucoma in DBA/2J mice (published erratum appears in Invest.Ophthalmol. Vis. Sci. [1998] Aug. 39(9), 1641). Invest. Ophthalmol.Vis. Sci. 39, 951–962.
29. Bennett, J., Anand, V., Acland, G. M., and Maguire, A. M. (2000)Cross-species comparison of in vivo reporter gene expression afterrAAV-mediated retinal transduction. Meth. Enzymol. 316, 777–789.
30. Allikmets, R., Wasserman, W. W., Hutchinson, A., Smallwood, P.,Nathans, J., Rogan, P. K., et al. (1998) Organization of the ABCRgene: analysis of promoter and splice junction sequences. Gene 215,111–122.
31. Kays, W. T. and Piatigorsky, J. (1997) Aldehyde dehydrogenase class3 expression: identification of a cornea-preferred gene promoter intransgenic mice. Proc. Natl. Acad. Sci. USA 94, 13,594–13,599.
212 Gupta et al.
32. Graw, J. (1997) The crystallins: genes, proteins and disease. Biologi-cal Chem. 378, 1331–1348.
33. Srinivasan, Y., Lovicu, F., and Overbeek, P. A. (1998) Lens-specificexpression of transforming growth factor beta1 in transgenic micecauses anterior subcapsular cataracts. J. Clin. Invest. 101, 625–634.
34. Kikuchi, T., Raju, K., Breitman, M. L., and Shinohara, T. (1993) Theproximal promoter of the mouse arrestin gene directs gene expres-sion in photoreceptor cells and contains an evolutionarily conservedretinal factor-binding site. Mol. Cell Biol. 13, 4400–4408.
35. McDermott, J. B., Cvekl, A., and Piatigorsky, J. (1996) Lens-specificexpression of a chicken beta A3/A1-crystallin promoter fragment intransgenic mice. Biochem. Biophys. Res. Comm. 221, 559–564.
36. Di Polo, A., Lerner, L. E., and Farber, D. B. (1997) Transcriptionalactivation of the human rod cGMP-phosphodiesterase beta-subunitgene is mediated by an upstream AP-1 element. Nucleic Acid. Res.25, 3863–3867.
37. Kumar-Singh, R. and Farber, D. B. (1998) Encapsidated adenovirusminichromosome (EAM)-mediated rescue of retinal degeneration inthe rd mouse and construction of second generation EAMs and helpervirions. Invest. Ophthalmol. Vis. Sci. 39, S1118.
38. Kennedy, B. N., Goldflam, S., Chang, M. A., Campochiaro, P., Davis,A. A., Zack, D. J., et al. (1998) Transcriptional regulation of cellularretinaldehyde-binding protein in the retinal pigment epithelium.A role for the photoreceptor consensus element. J. Biol. Chem. 273,5591–5598.
39. Wang, Y., Macke, J. P., Merbes, S. L., Zack, D., Klaunberg, B.,Bennett, J., et al. (1992) A locus control region adjacent to the humanred and green visual pigment genes. Neuron 9, 429–440.
40. Ying, S., Fong, S. L., Fong, W. B., Kao, C. W., Converse, R. L., andKao, W. W. (1998) A CAT reporter construct containing 277bpGNAT2 promoter and 214bp IRBP enhancer is specifically expressedby cone photoreceptor cells in transgenic mice. Curr. Eye Res. 17,777–782.
41. Morris, T. A., Fong, W. B., Ward, M. J., Hu, H., and Fong, S. L.(1997) Localization of upstream silencer elements involved in theexpression of cone transducin alpha-subunit (GNAT2). Invest.Ophthal. Vis. Sci. 38, 196–206.
42. Chen, S., Wang, Q. L., Nie, Z., Sun, H., Lennon, G., Copeland, N. G.,et al. (1997) Crx, a novel Otx-like paired-homeodomain protein, binds

Transgenic Mice 213
to and transactivates photoreceptor cell-specific genes. Neuron 19,1017–1030.
43. Cvekl, A., Sax, C. M., Li, X., McDermott, J. B., and Piatigorsky, J.(1995) Pax-6 and lens-specific transcription of the chicken delta 1-crys-tallin gene. Proc. Natl. Acad. Sci. USA 92, 4681–4685.
44. Masaki, S., Kamachi, Y., Quinlan, R. A., Yonezawa, S., and Kondoh,H. (1998) Identification and functional analysis of the mouse lensfilensin gene promoter. Gene 214, 77–86.
45. Chen, J., Tucker, C. L., Woodford, B., Szel, A., Lem, J., Gianella-Borradori, A., et al. (1994) The human blue opsin promoter directstransgene expression in cone and cone bipolar cells in the mouseretina. Proc. Natl. Acad. Sci. USA 91, 2611–2615.
46. Boatright, J. H., Borst, D. E., Peoples, J. W., et al. (1997) The majorcis activator of the IRBP gene contains CRX-binding and Ret-1/PCE-Ielements. Mol. Vis. 3, 15.
47. Bobola, N., Hirsch, E., Albini, A., Altruda, F., Noonan, D., and Ravazzolo,R. (1995) A single cis-acting element in a short promoter segment of thegene encoding the interphotoreceptor retinoid-binding protein confers tis-sue-specific expression. J. Biol. Chem. 270, 1289–1294.
48. Wang, X. Y., Ohtaka-Maruyama, C., Pisano, M. M., Jaworski, C. J.,and Chepelinsky, A. B. (1995) Isolation and characterization of the5'-flanking sequence of the human ocular lens MIP gene. Gene 167,321–325.
49. Chepelinsky, A. B., Piatigorsky, J., Pisano, M. M., Dubin, R. A.,Wistow, G., Limjoco, T. I., et al. (1991) Lens protein gene expres-sion: alpha-crystallins and MIP. Lens Eye Tox. Res. 8, 319–344.
50. Ueda, Y., Iwakabe, H., Masu, M., Suzuki, M., and Nakanishi, S.(1997) The mGluR6 5' upstream transgene sequence directs a cell-specific and developmentally regulated expression in retinal rod andON-type cone bipolar cells. J. Neurosci. 17, 3014–3023.
51. Farjo, Q., Jackson, A. U., Xu, J., Gryzenia, M., Skolnick, C., Agarwal,N., and Swaroop, A. (1993) Molecular characterization of the murineneural retina leucine zipper gene, Nrl. Genomics 18, 216–222.
52. Pierani, A., Pouponnot, C., and Calothy, G. (1995) Developmentalcontrol of transcription of a retina-specific gene, QR1, during differ-entiation: involvement of factors from the POU family. Mol. Cell.Biol. 15, 642–652.
53. Imamura, Y., Noda, S., Mashima, Y., Kudoh, J., Oguchi, Y., andShimizu, N. (1998) Human retina-specific amine oxidase: genomic

214 Gupta et al.
structure of the gene (AOC2), alternatively spliced variant, andmRNA expression in retina. Genomics 51, 293–298.
54. Zack, D. J., Bennett, J., Wang, Y., Davenport, C., Klaunberg, G.,Gearhart, J., and Nathans, J. (1991) Unusual topography of bovinerhodopsin promoter-lacZ fusion gene expression in transgenic mouseretinas. Neuron 6, 187–199.
55. Lem, J., Applebury, M. L., Falk, J. D., Flannery, J. G., and Simon, M.(1991) Tissue-specific and developmental regulation of rod opsinchimeric genes in transgenic mice. Neuron 6, 201–210.
56. Zeng, Y., Rosborough, R. C., Li, Y., Gupta, A. R., and Bennett, J.(1998) Temporal and spatial regulation of gene expression mediatedby the promoter for the human tissue inhibitor of metalloproteinases-3 (TIMP-3)-encoding gene. Dev. Dyn. 211, 228–237.
57. Davis, A. A., Bernstein, P. S., Bok, D., Turner, J., Nachtigal, M., andHunt, R. C. (1995) A human retinal pigment epithelial cell that retainsepithelial characteristics after prolonged culture. Invest. Ophthalmol.Vis. Sci. 36, 955–964.
58. Dunn, K. C., Aotaki-Keen, A. E., Putkey, F. R., and Hjelmeland, L. M.(1996) ARPE-19, a human retinal pigment epithelial cell line withdifferentiated properties. Exp. Eye Res. 62, 155–169.

Knockout Animal Models 215
215
From: Methods in Molecular Medicine, vol. 47: Vision Research ProtocolsEdited by: P. E. Rakoczy © Humana Press Inc., Totowa, NJ
12
Generation of Knockout Animal Models
T. Michael Redmond
1. Introduction
The ability to culture pluripotent cell lines, introduce into themtargeted gene mutations, and then use these mutant cell lines togenerate chimeric animals (1–4), has had a major impact on manyfields; not least on ophthalmology and vision research (5–8).By generating animals lacking in the product of a single gene, wecan examine the biochemical, physiological, and structural effectsof its loss in vivo. Often this can yield insights, sometimes surpris-ing, into human diseases caused by mutations in the same gene.
Studies involving the eye are often less subject to a commoneffect of targeted disruption, that of embryonic lethality. This isbecause many of the genes of special interest to the vision com-munity are also highly specific to the eye and are not required inembryonic development. Despite this, surprises do occur and it isthe surprises that give us deeper insight into the roles that thesegenes fulfill.
As gene targeting has become more established over the lastdecade, the number of gene knockouts has been growing exponen-tially. In the same way, the variety of options to the laboratory inter-ested in generating a knockout or two has become wider. In theearly days, collaboration with a lab routinely making knockouts was

216 Redmond
the only option. Procedures were still being developed andreagents were not consistent. Of course, this is still a possibleoption, as long as the expert laboratory is interested. At the otherextreme, one could set up one’s own knockout facility. In view ofthe variety of techniques involved, the expense of obtaining andmaintaining the specialized equipment required and the trainedtechnical expertise necessary, this is not a viable option for theinvestigator interested in one or a few targeted disruptions. Fortu-nately, there is now a wide middle ground. Many larger centershave set up institutional or core transgenic facilities offering amenu of services. The investigator can obtain advice on setting upa strategy and can do much of the work in his/her own laboratorywhile relying on the core facility for such techniques as blastocystinjection, where the required investment would be prohibitive.Alternatively, a number of commercial contractors will performthese services.
The methods described in this chapter were used to successfullyderive a targeted knockout for the Rpe65 gene (7) and are standardmethods employed by us and in the Laboratory of MammalianGenes and Development, National Institute of Child Health andHuman Development, National Institutes of Health. They arebased on methods in general use by the knockout community. Inaddition, there are a number of useful web sites (9) providingsupplemental or alternative procedures.
2. Materials
2.1. Cloning and Sequence Analysisand Vector Construction
1. A genomic clone for the gene of interest, sequenced as necessary.2. Suitable targeting vector (e.g., pPNT).3. Restriction enzymes, DNA modifying enzymes and their buffers.4. Subcloning grade competent bacterial cells, bacteriological media,
and antibiotics.5. Plasmid purification kits.

Knockout Animal Models 217
2.2. ES Cell Culture
First, a frozen aliquot of a suitable ES cell line (for example, J1;see ref. 4) should be obtained. This should be stored in liquid nitro-gen until required.
For the cell culture techniques described here, an adequatelyequipped tissue culture laboratory is necessary. Essential equipmentincludes 37°C tissue culture incubators set to 86% humidity and5% CO2, a laminar flow biological safety hood, a table-top clinicalcentrifuge, an inverted microscope, and a liquid nitrogen repository.The following media should be made as required and stored at 4°C.
1. Embryonic Stem Cell Media (ESM) (600 mL):a. Dulbecco’s modified Eagle’s medium (DMEM) (Gibco) 500 mLb. Fetal calf serum (FCS) (Hyclone) 90 mLc. Nonessential amino acid (Gibco) 6 mLd. Pen/Strep (Gibco) 3 mLe. 2- -Mercaptoethanol (Gibco) 1 mLf. Leukemia-inhibitory factor (LIF) (ES-GRO, Gibco) 60 µLg. pH 7.2–7.3; Osmolarity 290–300 mOsm
2. Embryonic Feeder Cell Media. (EFM): DMEM+ 10% FCS + 1% Pen/Strep.3. Blastocyst Injection Media (BIM)—1 L:
a. DMEM (w/o Na pyruvate, w/o NaHCO3; Gibco) 873 mLb. 1 M HEPES (Gibco) 25 mLc. 1 M NaOH 2 mLd. FCS (Hyclone) add to 10% 100 mLe. pH 7.2–7.3
4. Hanks–HEPES (H/H) (500 mL):a. 10X Hanks (Gibco) 50 mLb. 1 M HEPES Buffer (Gibco) 10 mLc. 1 M NaOH 1.25 mLd. Double-distilled water (DDW) 438.75 mLe. pH 7.2–7.3; Osmolarity 290–300 mOsm
5. 0.25% HEPES-trypsin-ethylene diamine tetraacetic acid (EDTA)a. 0.25% trypsin, 1 mM EDTA (Gibco) 100 mLb. 1 M HEPES 2 mL
6. 0.025% HEPES-trypsin-EDTA (used for colony picking)Make a 1:10 dilution of 0.25% HEPES-trypsin-EDTA in H/H:

218 Redmond
7. 0.05% Trypsin-EDTA (Gibco; used for EF cells).8. 2X ES Freezing Buffer (ESF) (10 mL):
a. Dimethyl sulfoxide (DMSO) (Sigma) 2 mLb. FCS (Hyclone) 2 mLc. ES Media (ESM) 6 mL
9. Electroporation Buffer (EB) (50 mL):a. 10X Hanks 5 mLb. 1 M HEPES 1 mLc. 2- -Mercaptoethanol 0.1 mLd. 1 M NaOH 50 µLe. DDW 44 mL
Make in tissue-culture flask to avoid contamination.10. 0.2% Gelatin/Gelatinized Plates:
a. Add 20 mL of autoclaved 10% gelatin (Sigma) in DDW to 980 mLof prewarmed PBS.
b. Dispense 3–4 mL per 6-cm plate and allow to sit for 1 h at roomtemperature.
c. Aspirate liquid from plates.11. 1% Mitomycin C (200 mL): Dissolve 1 vial of Mitomycin C (2 mg,
Sigma) in 1 mL of 0.22-µm filtered phosphate-buffered saline (PBS)and transfer all to 199 mL of EFM. Use 20 mL of mitomycin C/EFMmedia per 150-cm2 flask for mitotic inactivation of EF cells. (Mito-mycin C should be discarded as a hazardous biological waste).
12. 2 µM Ganciclovir (600 mL): To make the stock solution, dissolve12.8 mg of ganciclovir powder (Syntex) in 10 mL of DDW andfilter it. Add 0.24 mL of the stock solution to 600 mL of ESM for2 µM ganciclovir.
13. G418 350 µg/mL (600 mL): To make stock solution, dissolve 1 g ofG418 (Geneticin, Gibco) in 10 mL of D.W. and filter it. Add 2.1 mL ofthe stock solution to 600 mL of ESM for 350 µg/mL of G418.
2.3. Restriction Enzyme Digestion Buffer
a. 30 µL DNAb. 5 µL 10X bufferc. 9 µL H2Od. 1 µL RNasee. 5 µL Restriction enzyme

Knockout Animal Models 219
2.4. Neo Gene-Specific Polymerase Chain Reaction (PCR)
The presence or absence of the neo gene can be assayed for byneo-specific PCR using primers recommended by the Jackson Labo-ratory Induced Mutant Resource (8). These are
1. oIMR013 (5'-CTT GGG TGG AGA GGC TAT TC-3'; Tm = 58.7°C);2. oIMR014 (5'-AGG TGA GAT GAC AGG AGA TC-3'; Tm = 53.9°C).
Use these in a reaction consisting of
1. 100 ng genomic DNA.2. 1X reaction buffer.3. 1.5 mM MgCl2 (final).4. 0.5 µM each primer (final).5. 0.25–0.5 U Taq DNA polymerase.
3. Methods
An overview of the steps required and the approximate durationof each is presented in Fig. 1.
3.1. Constructing the Targeting Vector
3.1.1. Cloning and Sequencing of the Gene to be Targeted
Prior to embarking on a gene-targeting project, it is to be expectedthat the investigator has already acquired significant informationabout the gene of interest. This could include information about tis-sue expression, developmental expression, and protein localization(secreted, membrane, or cytoplasmic). Information about the pos-sible function of the protein expressed by the gene will also assist inthe ultimate analysis of phenotype (is it an enzyme, a transport pro-tein, a structural protein, a DNA-binding protein, or is it involved insignal transduction, and so on). All this information will help nar-row down possible outcomes. Of course, when the gene of interestis specifically or preferentially localized to ocular tissues, many pos-sible negative outcomes may be less likely. For example, embry-onic lethality is unlikely to occur with disruption of an eye-specific

220 Redmond
Fig. 1. Schematic flowchart of the steps required for generation of aknockout mouse. To the left side of the figure are the approximate peri-ods of time required for the four major parts of the process. (A) Genecloning and targeting vector construction; (B) Preparation of EF cell lines;(C) Electroporation and selection of ES cells; and (D) Blastocyst injec-tion and derivation of homozygous knockout mice.

Knockout Animal Models 221
gene. This may not be the case for genes of major relevance to theeye, but expressed elsewhere. Species-specific effects may also berelevant. A case in point is ornithine aminotransferase, mutations inthe human gene for which cause gyrate atrophy of the retina (10),but no apparent systemic effects. Because of differences betweenhuman and mouse amino acid metabolism, mice with targeted dis-ruption of the OAT gene die shortly after birth unless supplementedwith L-arginine (8). Transcription factors important to eye develop-ment, but also acting elsewhere may also fall in this group. Asidefrom such information on function or possible function, the avail-ability of gene and/or protein specific reagents is also highly useful.For example, access to cDNA sequence and specific antibodies. Theformer to derive the genomic sequence of the gene and the latter toassay for disruption of expression.
A variety of mouse genomic DNA libraries (including lambdaphage, BAC, and P1) are available from a number of vendors (in theU.S.: Clontech, Stratagene, Genomic Systems, among others). Be sureto select a library generated from mouse DNA of the 129Sv strain(see Note 1). This is the strain most widely used for targeted disrup-tion studies. The use of isogenic DNA for construction of targetingvectors maximizes the frequency of homologous recombination(11). Once the gene of interest has been cloned, the level of analysisrequired to generate a targeting vector becomes an issue. Givenadequate information from Southern blot restriction site mapping,it is theoretically possible to embark on generating a targeting con-struct without sequencing the genomic clone. In practice, however,sequencing of the gene to customary accuracy offers the most flex-ibility in possible subcloning options. This is because all possiblerestriction sites can be predicted by sequence analysis softwareallowing for precise tailoring of homologous DNA segments. Inaddition, it allows for the generation of suitable flanking probes byPCR for determination of germline establishment and of genotype,as well as PCR primers for gene-specific PCR analysis. To achievethis, it is not necessary to determine the entire gene structure. It isnecessary to sequence the entire region that is to be targeted plus0.5 to 1 kb of flanking sequences 5' and 3' to the targeted region.

222 Redmond
What region should be targeted? In most cases, the most effectivedisruption strategies target the beginning of the gene, including pro-moter regions.
3.1.2. Assembling the Targeting Vector
Because the assembly of the targeting vector is a straightforwardexercise in subcloning and is highly dependent for its specifics onthe particular gene being targeted, it is beyond the scope of thischapter. That being said, the investigator should be skilled insubcloning strategies and in DNA analysis.
The investigator has a number of choices with regard to targetingvector. The most widely used selection strategy employs the neoresistance gene (12). Other resistance genes may be used but theneo resistance cassette has been the most popular. Though the neocassette provides a positive selection for insertion of the neo genealong with the targeted mutation, it does not discriminate betweenclones positive for homologous recombination and clones harbor-ing a random or nonhomologous insertion of the targeting construct.To account for this, a second, negative, selection strategy isemployed. This is the positive–negative selection strategy ofMansour et al. (13). The most commonly employed negative selec-tion strategy uses the herpes simplex virus thymidine kinase (HSV-tk)gene cassette, expressing the HSV-tk gene, included to one side ofthe targeting vector. In a homologous recombination event, theHSV-tk gene is excised. However, in a random insertion event,HSV-tk is not excised and is expressed in the transfected cells.When such cells are grown in medium containing ganciclovir, a syn-thetic guanine analog, HSV-tk generates toxic metabolites of thissubstrate that kill these cells. Cells with homologous recombinationevents are not sensitive to ganciclovir and survive.
In one kind of strategy, the neo cassette from pMCI neo poly A(12) (available from Stratagene), may be excised and inserted into aplasmid containing the genomic sequence of interest in such a wayas to disrupt an exon, and followed by insertion of the PGK/HSV-tkcassette. In another strategy, the pPNT vector (14), and its deriva-tive X-pPNT, containing both the PGK/neo and PGK/HSV-tk cas-

Knockout Animal Models 223
settes may be engineered to accept upstream and downstreamhomologous segments. Again, the precise strategy to be useddepends entirely on the specific sequence being targeted.
Knockouts of ocular interest that employ the pPNT vector, or itsderivatives, include those of A-crystallin (6) and of Rpe65 (7).Other knockouts, for example rhodopsin (5) have employed alter-native strategies (12).
Whatever vector is used, a number of rules are to be observed.Fragments to be used for homologous regions are excised fromgenomic clones by restriction enzyme digestion. Where requiredthese fragments can be blunt ended by treatment with Klenow DNApolymerase, subcloned into transitional vectors (such as pGEM fam-ily of vectors [Promega] or others [see Note 2]) and cut out againwith different restriction enzymes as required. Detailed knowledgeof the restriction sites is invaluable for the design of such a strategy.Use of such restriction fragments is mandatory. It is not a good prac-tice to use PCR amplification to generate fragments with desiredrestriction site ends. This is because of the well-known propensityof all thermostable DNA polymerases (some more than others) torandomly insert mutations during amplification. Such mutations canadversely affect the frequency of homologous recombination. In addi-tion, all junctions should be sequenced to assure the expected outcome.
3.2. Preparation of EF Cells for ES-Cell Culturing
The methods described below are based on those of Robertson(15). While ES cells have been successfully grown on plastic (16)in the presence of leukemia-inhibitory factor (LIF), they grow bet-ter on a feeder layer of embryonic fibroblast (EF) cells. LIF is adifferentiation-inhibiting cytokine necessary to prevent differentia-tion of ES cells (17). Primary EF cells produce some of this factor,but it has to be supplemented with recombinant LIF (ES-gro, Gibco,Gaithersburg, MD).
3.2.1. Preparation of EF Cells
EF feeder cells are isolated from day 14 neo-resistant mouse embryos.

224 Redmond
1. Male and female PGK-neo homozygous mice are mated.2. 13–14 d after the plug is noted, the female is euthanized and the
embryos are removed.3. Decapitate each embryo and remove the liver. Rinse each in PBS to
remove as much blood as possible (see Note 3).4. Place the embryos in a dish containing 15 mL of 0.25% Trypsin/EDTA
and mechanically dissociate by mincing with fine iris scissors. Drawup and down six times with a 10-mL pipet and place the mincedembryo suspension in a 37°C incubator for 10 min. Pipet up anddown six times with a 5-mL pipet and return the dish to the incubatorfor a further 10 min.
5. Draw up the contents of the dish and place in a 50-mL conical tube.Allow the heavier fragments to settle out for 3–5 min. Draw up thesupernatant and place in another 50-mL tube. Add EFM up to 50 mLand centrifuge for 3 min at setting 3 in an IEC clinical centrifuge.
6. Discard the supernatant and resuspend the pellet in 10-mL EFM.Place the cell suspension in a T-150 flask. Grow for 24 h in the 37°Cincubator. Change the medium and grow for another 24 h.
7. To freeze these cells at passage 2, split the cells in the originalT-150 flask into 3 T-150 flasks. Incubate for 24 h, refeed andincubate for another 24 h. Dissociate the cells in these flasks with0.05% trypsin/EDTA and pool. Pellet the cells and bring up the pel-let in 10-mL EFM.
8. Put 0.5 mL of this EF cell suspension in each of 20 cryotubes. Add0.5-mL 2X ES freezing buffer to each tube. Mix gently. Place eachcryotube in an expanded polystyrene foam box (to allow for slowfreezing) and freeze at –70°C (see Note 4). After 24 h store the tubesin liquid nitrogen.
These cells may be expanded for up to five passages in EF media(EFM).
3.2.2. Mitomycin C Treatment of EF Cells
Prior to use with ES cells, EF cells must be mitotically inacti-vated with mitomycin C.
1. EF cells should ideally have a cobblestone-like appearance for mito-mycin C treatment. Overgrown cells are spindly.
2. Replace EF media with 20 mL of mitomycin C media for each150-cm2 flask.
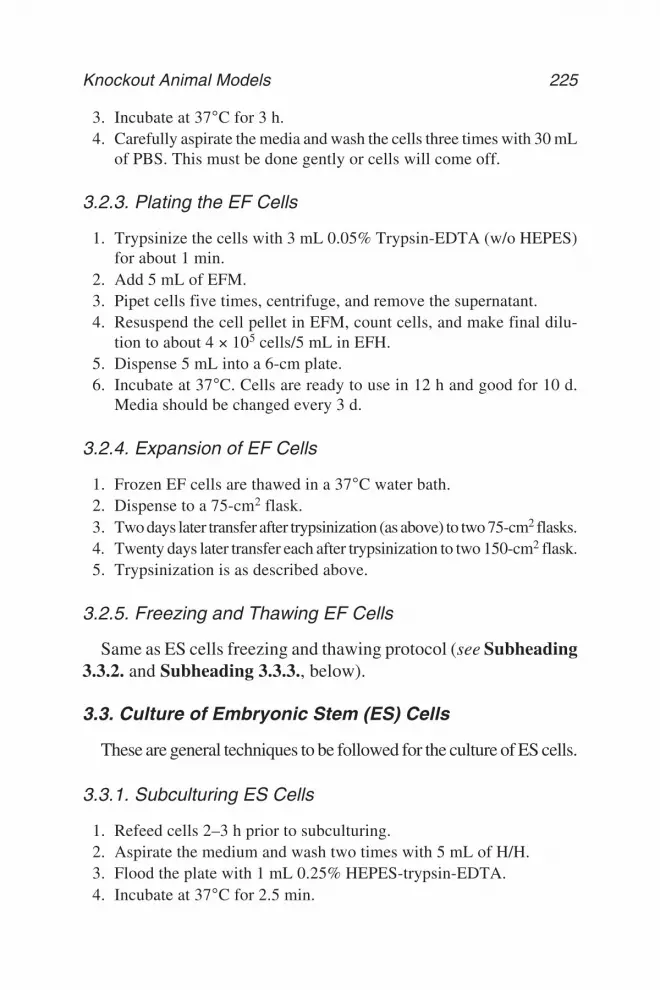
Knockout Animal Models 225
3. Incubate at 37°C for 3 h.4. Carefully aspirate the media and wash the cells three times with 30 mL
of PBS. This must be done gently or cells will come off.
3.2.3. Plating the EF Cells
1. Trypsinize the cells with 3 mL 0.05% Trypsin-EDTA (w/o HEPES)for about 1 min.
2. Add 5 mL of EFM.3. Pipet cells five times, centrifuge, and remove the supernatant.4. Resuspend the cell pellet in EFM, count cells, and make final dilu-
tion to about 4 × 10⁵ cells/5 mL in EFH.5. Dispense 5 mL into a 6-cm plate.6. Incubate at 37°C. Cells are ready to use in 12 h and good for 10 d.
Media should be changed every 3 d.
3.2.4. Expansion of EF Cells
1. Frozen EF cells are thawed in a 37°C water bath.2. Dispense to a 75-cm2 flask.3. Two days later transfer after trypsinization (as above) to two 75-cm2 flasks.4. Twenty days later transfer each after trypsinization to two 150-cm2 flask.5. Trypsinization is as described above.
3.2.5. Freezing and Thawing EF Cells
Same as ES cells freezing and thawing protocol (see Subheading3.3.2. and Subheading 3.3.3., below).
3.3. Culture of Embryonic Stem (ES) Cells
These are general techniques to be followed for the culture of ES cells.
3.3.1. Subculturing ES Cells
1. Refeed cells 2–3 h prior to subculturing.2. Aspirate the medium and wash two times with 5 mL of H/H.3. Flood the plate with 1 mL 0.25% HEPES-trypsin-EDTA.4. Incubate at 37°C for 2.5 min.

226 Redmond
5. Shake.6. Incubate at 37°C for 2.5 min.7. Agitate with 1-mL pipet 10× and check under microscope.8. Add 4 mL ESM.9. Agitate 15 times with a 5-mL pipet.
10. Transfer to 15-mL tube and add 5 mL ESM.11. Spin 3.5 min on setting 3 using a tabletop clinical centrifuge.12. Aspirate the supernatant and resuspend the cell pellet in 1 mL of ESM.13. Determine cell concentration with a hemocytometer (see Note 5).14. Add 0.5 × 10⁶ cells in 4–5 mL of ESM to one 6-cm plate previously
seeded with EF cells (for confluency in 2–3 d).15. Let the plate sit 10 min on the bench top before transfer to the incubator.
3.3.2. Freezing ES Cells
1. Prepare 10 mL of 2X ES freezing media (ESF).2. Harvest the cells by trypsinization as described above.3. Count cells and resuspend to a density of 2 × 10⁶ cells/mL.4. Dispense 0.5-mL cell suspension into cryotubes with 0.5-mL ESF.5. Place the cryotubes inside a polystyrene box (see Note 4), seal the
box with tape, and place overnight in a –70°C freezer.6. Transfer the cryotubes to liquid nitrogen storage after 24 h.
3.3.3. Thawing ES Cells
1. Place the frozen cryotube into a 37°C water bath.2. Remove the cryotube from the water bath as soon as it thaws.3. Wipe the cap with alcohol.4. Transfer all the cells into a 15-mL tube with 6 mL prewarmed ESM.5. Rinse the tube with 1 mL of ESM.6. Centrifuge for 3 min to isolate the cell pellet.7. Resuspend in 1 mL of ESM.8. Dispense in 6-cm plates with EF cells and 4 mL of ESM.
3.4. Electroporation of ES Cells
Once the cell lines and targeting construct are ready, electro-poration and the subsequent selection procedure takes about 14 d tocomplete. The targeting vector is transfected into ES cells byelectroporation. Generally, 25–50 µg of linearized targeting plas-
Knockout Animal Models 227
mid is used to transfect 2 – 4 × 10⁷ cells. Start growing up the EF-neocells for postpicking amplification at the time of electroporation.
1. Preparation of ES cells: Thaw (see Subheading 3.3.3.) 1 cryotube offrozen ES cells (e.g., J1) 6 d prior to the expected electroporationdate and expand to four 6-cm plates (see Subheading 3.3.1.). Thisshould give 1.6 × 10⁷ cells for electroporation.
2. Preparation of embryonic fibroblasts: One week before the electro-poration date, 2 cryotubes of EF-neo should be thawed (see Subhead-ing 3.3.3.) and expanded to eight 150-cm2 flasks (see Subheading3.2.5.). EF cells are then plated in 6-cm pregelatinized plates at adensity of 4 × 10⁵ cells/plate. Sixty plates are needed for eachelectroporation experiment.
3. Preparation of DNA.a. Precipitate 25 µg of linearized DNA (see Note 6).b. Wash two times with 70% ethanol.c. Air dry the DNA and redissolve in EB at 1 µg/µL.d. Centrifuge at top speed in a microcentrifuge for 30 min at 4°C
and transfer supernatant to an ethanol-cleaned tube.e. Place DNA at 42°C for 1 min then place on ice.
4. Electroporation.a. Trypsinize ES with 0.25% HEPES-trypsin-EDTA to a single-cell
suspension. It is important to trypsinize ES cells to a single-cellsuspension before electroporation.
b. Centrifuge the ES cells and resuspend the pellet in 10-mL EB.Determine cell density (The number of plates depends on thenumber of cells. 1.5 × 10⁷ cells are needed for 60 6-cm plates.)
c. Centrifuge the ES cell again and resuspend the pellet in 0.8 mL of EB.d. Add DNA into a clean Bio-Rad 0.4-cm electrode cuvet and then
add 0.8 mL of ES cells in EB.e. Electroporate ES cells with Bio-Rad Gene Pulser with setting of
0.4 kV, 25 µFD (time constant should fall on 0.4 to 0.5 s).f. Allow the electroporated cells to recover for 10 min at room
temperature.
3.5. Positive–Negative Selection
1. Label the 60 6-cm EF-neo plates: one plate with ES and ESM, oneplate with ES and G418, two plates with Elec. ES and G418 and allthe others with Elec. ES with G418+Gan.

228 Redmond
2. Resuspend the electroporated cells with ESM to a density of 2.5 ×10⁵ cells/4 mL and add 4 mL of ESM and cells to all of the 6-cm platesmarked with Elec. ES.
3. Add nonelectroporated ES cells (from the aliquot removed for count-ing) to the other control plates marked with ES.
4. 24 h later, start the single (G418) and double (G418+Gan) selection:replace ESM with G418 ESM for the plates marked with G418 andG418+Gan ESM for the plates marked with G418+Gan. Wait at least24 h after electroporation before changing the media.
5. Change media every day (see Note 7).6. Stop double selection in about 5 d, because all ganciclovir-sensitive
cells will be dead by then.7. Pick colonies 6–12 d after selection, usually at day 7. With pPNT as
the vector, there should be 30–40 colonies on each single-selectionplate and 1–10 colonies on double selection or about 3–30-folddegree of enrichment. This phenomenon should be evident by aboutthe fifth to eighth day of selection.
3.6. Picking, Harvesting, and Freezing Colonies
Picking of putative targeted ES cell colonies may begin on d 6 or7 of selection. Colonies are picked from plates using an invertedmicroscope set up in the laminar flow hood. Clones suitable forpicking are big and elevated. Colonies with a clean edge usually arethe best colonies. Avoid colonies with pigmented cells (these aredifferentiated colonies) and pinhead colonies (these are background,non-neo resistant colonies).
3.6.1. Preparation Prior to Picking
1. Set up the inverted microscope in the hood.2. Change the media for the EF-neo cells growing in 24-well plates
with 0.5 mL ESM+G418.
3.6.2. Picking Colonies
1. Change media with ESM+G418 for the plates with colonies severalhours before picking.
2. Aspirate the media from the plates and wash one time with H/H.

Knockout Animal Models 229
3. Aspirate one colony by automatic pipet (see Note 8) and transfer itto one of the wells of a 96-well U-bottom plate containing 30 µL of0.25% HEPES-trypsin EDTA.
4. Collect 16 colonies (i.e., two vertical rows)5. Incubate for 5 min at 37°C.6. Agitate with yellow tips 2–3 times using multichannel multidispenser
(load with yellow tips every second slot). Do not try to makesingle-cell suspension, check that colony has dispersed by naked eye(see Note 9).
7. Transfer 50 µL of ESM+G418 medium from 24-well plate into 96 welland agitate aggressively ten times.
8. Dispense the cells onto 24-well plate with EF-neo and 0.5-mL ESM+ G418.
9. Leave to settle on bench. It is important to let the cells to settle 10 minprior to placing back to incubator.
10. Change media with ESM + G418 every day.
3.6.3. Harvesting and Freezing
It is recommended that the picked colonies be harvested at50% confluence and stored in the freezer until they are genotyped,rather than be passaged and continued in culture. This is because ofthe potential for ES cells to diverge from euploidy at higher passagenumbers.
1. Harvest the colonies at about 50% confluence (approx 2–3 d).2. Add 400 µL of 2X freezing media (ESF) to each of the freezing ampule.3. Aspirate the entire 24-well plate and wash one time with H/H.4. Add 200 µL of 0.25% HEPES-trypsin-EDTA.5. Incubate for 5 min at 37°C.6. Add 400 µL ESM to each well and agitate ten times with blue tip.7. Mark cryotubes and pregelled 24-well plate with same series of
numbers.8. Dispense 400 µL cell suspension into a cryotube and agitate two times.9. Dispense the rest of the cell suspension into a new pregelatinized
24-well plate with 0.5-mL ESM for DNA preparation in 4–5 d.10. After collecting 15 cryotubes, put them into a polystyrene foam box
(see Note 4), seal with tape, place in –70°C freezer overnight, andtransfer to liquid nitrogen the next day.

230 Redmond
3.7. Screening of Putative Targeted ES Cell Clones
3.7.1. Preparation of Genomic DNA from ES Cells (18)
1. Make up lysis buffer: 100 mM Tris-HCl, pH 8.5, 5 mM EDTA,0.2% sodium dodecyl sulfate (SDS), 200 mM NaCl, 100 µg pro-teinase K/mL.
2. After ES cell clones in the 24-well dish reach confluency (see Sub-heading 3.6.4.), remove media and replace with 0.5 mL of lysisbuffer. Return the plate to a 37°C incubator overnight.
3. In the morning, add 0.5 mL of isopropanol and agitate on a rockingplatform or orbital shaker until it is well mixed and the DNAprecipitated.
4. Lift out each DNA plug with a flame-sealed Pasteur pipet and trans-fer to a 1.5-mL microfuge tube containing 70% ethanol. Spin this topellet and allow to air-dry briefly.
5. Add 200 µL of TE and incubate overnight in a 50°C water bath toredissolve.
3.7.2. Southern Blotting
1. Digest 30 µL of ES-cell DNA with a suitable restriction enzyme (seeSubheading 2.3.). Digest overnight at 37°C.
2. These digests can be run on 1% agarose gels in 1X TAE, and South-ern blotted to nylon membranes. Such blots can be hybridized to asuitable flanking probe to determine the presence of a targeted dis-ruption (see Note 10).
3.8. Blastocyst Injection
Because of the high investment required in sophisticated micro-manipulation apparatus and the expertise to use it, it is highly rec-ommended that the investigator contract this out to a suitableinstitutional core facility or commercial provider. Many academiccenters provide this service. Commercial providers include GenomeSystems Inc (St. Louis, MO).
1. Preparation of targeted ES cell line for blastocyst injection2. Set up EF-neo cell cultures in 6-cm dishes and grow to confluency in
2–3 d (see Subheading 3.2.4., 3.2.2., and 3.2.3.)

Knockout Animal Models 231
3. Thaw the ES clones of interest (see Subheading 3.3.3.) and dispenseon EF cells. Grow for 2 d.
4. Split the ES cell culture (see Subheading 3.3.1.). Grow for 2 d.
Harvest the cells by trypsinization (see Subheading 3.3.1.). Resus-pend the cell pellet in 1 mL of BIM (see Subheading 2.2., step 3).
3.9. Derivation of Homozygous Knockout Animals
If the blastocyst injection is successful, then about 18 d afterinjection day chimeric progeny will be born to the foster mother.Because the blastocysts used are generally C57bl/6 embryos, wild-type progeny will have black coat color, whereas chimeric progenywill have a variable contribution of agouti coat color from the 129SvES cell line injected into the blastocyst. Chimeric mice with near-total or total agouti coloration are chosen for further breeding. Countup to 6 mo before homozygous knockout progeny are born.
3.9.1. Generation of Heterozygous F1 Progeny
1. Chimeric progeny (F0 generation) are ear-tagged.2. Chimeras are mated to C57bl/6 mice (see Note 11).3. F1 progeny are ear-tagged and tail biopsies taken at weaning (see
Note 12).4. Genomic DNA is isolated (Subheading 3.10.1.) and analyzed by
Southern blot (Subheading 3.7.2.) or by PCR (Subheading 3.10.2.)to identify heterozygotes.
3.9.2. Production of Knockout Progeny
1. F1 heterozygous progeny are crossed.2. F2 progeny are genotyped as above (see Note 13).
When there is no effect of the targeted disruption on embryonicviability or postnatal survival, a normal wild-type: heterozygous:knockout Mendelian ratio of 1:2:1 is expected. Deviations from thisratio may be informative to the phenotype and must be furtherinvestigated. The investigator should count on about 6 mo of breed-ing events before knockout progeny are born.
232 Redmond
3.10. Other Useful Methods
3.10.1. Isolation of Genomic DNA from Tail Biopsies
Genomic DNA is prepared from tail biopsies by a simple salting-out procedure:
1. Place each 1-cm tail biopsy in 500 µL lysis buffer (200 mM NaCl,20 mM EDTA, 40 mM Tris, pH 8.0, 0.5% SDS, 0.5% 2- -mercapto-ethanol, 400 µg/mL proteinase K) and lyse overnight at 55°C.
2. Vortex each tube for 10 s. Add 250 µL of saturated NaCl (about 6 M)and vortex another 10 s. Place on ice for 15 min.
3. Spin the tubes at maximum speed in a microfuge.4. Transfer the supernatant to a clean tube and precipitate the DNA
with 750 µL of ethanol. Pellet the DNA by spinning gently at roomtemperature at setting 10 on an Eppendorf microfuge for 3 min.
5. Wash the DNA pellet with 70% ethanol and air-dry. Dissolve in100 µL of TE buffer with incubation at 55°C.
3.10.2. Neo Gene-Specific PCR
Although targeted gene-specific PCR (see Note 13) is the pre-ferred method for rapid and precise genotyping of progeny ofcrosses, the neo gene can provide partial information.
Perform an amplification program consisting of 94°C hot start,94°C denaturation for 5 min, 40 cycles of 94°C denaturation for1 min, 50°C annealing for 30 s, 72°C extension for 30 s, followedby 72°C terminal extension for 5 min on a Perkin-Elmer GeneAmpPCR System 2400, 9700, or 9600 cycler. The oIMR013 andoIMR14 primers amplify a 280 bp product from the neo insert.
4. Notes
1. It should be noted that there is, in fact, a high degree of genetic vari-ability within the various substrains of mice designated “129” andthe ES lines derived therefrom. Whether this is relevant to mostapplications of this technique is not clear. The interested reader isreferred to a recent review (19) on the subject.
2. For use with the pPNT vector and its derivatives, a useful transi-tional vector is the pLPG9 vector. This has a polylinker with manyunique restriction sites contained in the cloning sites of pPNT.

Knockout Animal Models 233
3. Note that the heads and livers are discarded and not used for the EFcell preparation.
4. Use the expanded polystyrene foam racks that many sterile 50-mL coni-cal-bottom tubes are supplied in. Place the cryotubes in the holes inone such rack and cover with another. Tape up and label. After a dayor so at –70°C, remove the cryotubes from the foam rack box andplace in liquid nitrogen.
5. Using a 1:10 dilution is helpful at this step. For 1:10 dilution, thetotal count from one corner [16 grids] × 105 = number of cells/mL.Calculate the cell concentration.
6. The targeting vector plasmid must be linearized prior to electro-poration. The pPNT/X-pPNT vectors contain a unique Not I site thatis utilized for this purpose. Following digestion with Not I, the DNAmust be cleaned up. If phenol-chloroform extraction is used for this,it is essential that the DNA be washed with 70% ethanol, dried,redissolved in TE, and reprecipitated. This is because traces of phe-nol and chloroform are toxic to blastocysts.
7. About 50% of the cells will die from the trauma of electroporation.In addition, there will be ongoing death of ganciclovir-sensitive cells.Thus, when changing the media, try to remove as many dead cells aspossible. These are the cells that are unattached and/or floating.
8. Use a 200-µL automatic pipet (cleaned with 70% ethanol) withsterile 160-µL barrier tips. Set the pipet to draw 30–50 µL. Insertthe pipet tip, with the plunger pressed, to the level of the EF celllayer. Scoop off the ES colony of interest, trying not to gougeinto the EF cell layer, while slowly releasing the plunger to aspi-rate the colony. It may require some practice to perfect thismaneuver, so try it first on less desirable colonies (for example,differentiating colonies).
9. Alternatively, this may be done with a single-channel pipetor. This maybe easier to monitor.
10. Because this is highly specific to the particular locus being tar-geted, only general remarks can be made here. It is useful to deter-mine if the neo gene insertion causes the loss (or gain) of somerestriction site. Use this restriction site to cut the genomic DNA todifferentiate between the targeted and untargeted allele. Generate aprobe (e.g., by random-primed labeling of a suitable PCR fragment)that is outside the disrupted region but contained within a restrictionfragment also containing the disrupted region.

234 Redmond
11. It is more convenient to use male chimeras to establish germlinetransmission. Females can be used, but the process is necessarilyslower because they can only be mated once every 6–8 wk.
12. It is to be expected that the investigator has prepared the requiredanimal study protocol and filed it with his institution’s animal careand use committee (or the equivalent) prior to any work with ani-mals. It is also expected that the investigator will follow all approvedprotocols for obtaining biopsies from the animals generated.
13. A gene-specific PCR protocol that accurately and efficiently desig-nates the genotype of progeny should be devised where possible.The raw data for such a strategy are to be derived from the initialsequence analysis of the gene. Three primers are used. The firstprimer is for the neo gene (we use oIMR210 (ref. 9): 5'-GGG AACTTC CTG ACT AGG GGA GG-3'), the second primer is to theregion of the targeted gene that has been replaced by the neo genecassette. The third primer is a reverse primer to a region of the tar-geted gene flanking the disruption (Primers 1 and 2 are forward prim-ers, primer 3 is a reverse primer). The sizes of the fragmentsgenerated by each of these pairs (1+3 and 2+3) must be close enoughin size to generate equivalent signals in heterozygous animals yetdistinct enough to be discriminated by gel electrophoresis.
Acknowledgments
The author would like to thank his colleagues and collaborators,especially Dr. Karl Pfeiffer who introduced us to knockout tech-niques and helped us generate the Rpe65 knockout. The author alsowishes to thank Julia Redmond for typing the manuscript.
References
1. Evans, M. J. and Kaufman, M. H. (1981) Establishment in culture ofpluripotential cells from mouse embryos. Nature 292, 154–156.
2. Doetschman, T., Gregg, R. G., Maeda, N., Hooper, M. L., Melton, D. W.,Thompson, S., and Smithies, O. (1987) Targeted correction of a mutantHPRT gene in mouse embryonic stem cells. Nature 330, 576–578.
3. Bradley, A., Evans, M., Kaufman, M. H., and Robertson, E. J. (1984)Formation of germ-line chimeras from embryo-derived teratocarci-noma cell lines. Nature 309, 255, 256.

Knockout Animal Models 235
4. Nagy, A., Rossant, J., Nagy, R., Abramow-Newerly, W., and Roder,J. C. (1993) Derivation of completely cell culture-derived mice fromearly-passage embryonic stem cells. Proc. Natl. Acad. Sci. USA 90,8424–8428.
5. Humphries, M. M., Rancourt, D., Farrar, G. J., Kenna, P., Hazel, M.,Bush, R. A., et al. (1997) Retinopathy induced in mice by targeteddisruption of the rhodopsin gene. Nat. Genet. 15, 216–219.
6. Brady, J. P., Garland, D., Duglas-Tabor, Y., Robison, W. G., Groome,A., and Wawrousek, E. F. (1997) Targeted disruption of the mouse
A-crystallin gene induces cataract and cytoplasmic inclusion bod-ies containing the small heat shock protein B-crystallin. Proc. Natl.Acad. Sci. USA 94, 884–889.
7. Redmond, T. M., Yu, S., Lee, E., Bok, D., Hamasaki, D., Chen, N., et al.(1998) Rpe65 is necessary for production of 11-cis-Vitamin A in theretinal visual cycle. Nat. Genet. 20, 344–350.
8. Wang, T., Lawler, A. M., Steel, G., Sipila, I., Milam, A. H., and Valle,D. (1995) Mice lacking ornithine-delta-aminotransferase haveparadoxical neonatal hypoornithinaemia and retinal degeneration.Nat. Genet. 11, 185–190.
9. IMR (Induced Mutant Resources of the Jackson Laboratory) http://lena.jax.org/resources/documents/imr/.
10. Inana, G., Totsuka, S., Redmond, T. M., Dougherty, T., Nagle, J.,Shiono, T., et al. (1986) Molecular cloning of human ornithine ami-notransferase mRNA. Proc. Natl. Acad. Sci. USA 83, 1203–1207.
11. Deng, C. and Capecchi, M. R. (1992) Re-examination of gene target-ing frequency as a function of the extent of homology between thetargeting vector and the target locus. Mol. Cell. Biol. 12, 3365–3371.
12. Thomas, K. R. and Capecchi, M. R. (1987) Site-directed mutagenesis bygene targeting in mouse embryo-derived stem cells. Cell 51, 503–512.
13. Mansour, S. L., Thomas, K. R., and Capecchi, M. R. (1988) Disrup-tion of the proto-oncogene int-2 in mouse embryo-derived stem cells:a general strategy for targeting mutations to non-selectable genes.Nature 336, 348–352.
14. Tybulewicz, V. L., Crawford, C. E., Jackson, P. K., Bronson, R. T.,and Mulligan, R. C. (1991) Neonatal lethality and lymphopenia inmice with a homozygous disruption of the c-abl proto-oncogene.Cell 65, 1153–1163.
15. Robertson, E. J. (ed.) (1987), Teratocarcinomas and Embryonic StemCells: A Practical Approach. IRL Press, Oxford, England.

236 Redmond
16. Pease, S. and Williams, R. I. (1990) Formation of germ-line chimerasfrom embryonic stem cells maintained with recombinant leukemiainhibitory factor. Exp. Cell. Res. 190, 209–211.
17. Smith, A. G., Heath, J. K., Donaldson, D. D., Wong, G. G., Moreau,J., Stahl, M., and Rogers, D. (1988) Inhibition of pluripotentialembryonic stem cell differentiation by purified polypeptides. Nature336, 688–690.
18. Laird, P. W., Zijderveld, A., Linders, K., Rudnicki, M. A., Jaenisch,R., and Berns, A. (1991) Simplified mammalian DNA isolation pro-cedure. Nucleic Acid Res. 19, 4293.
19. Simpson, E. M., Linder, C. C., Sargent, E. E., Davisson, M. T.,Mobraaten, L. E., and Sharp, J. J. (1997) Genetic variation among129 substrains and its importance for targeted mutagenesis in mice.Nat. Genet. 16, 19–27.

Mutation Analysis of Ocular Genes 237
237
From: Methods in Molecular Medicine, vol. 47: Vision Research ProtocolsEdited by: P. E. Rakoczy © Humana Press Inc., Totowa, NJ
13
Mutation Analysis of Ocular Genes
Michael Danciger
1. Introduction
The RHO gene, which encodes rhodopsin, was the first gene inwhich mutations were found that were associated with an inheritedretinal disease (1). RHO was examined by exon screening in a largepopulation of patients with autosomal dominant retinitis pigmentosa(adRP), because a linkage study in an Irish family showed one locusof adRP to be on human chromosome 3q (2)—where RHO had beenpreviously mapped (3). Since that time, over 100 different disease-causing mutations have been found in RHO, and many other muta-tions in at least 55 additional genes. Also, there are at least 120other retinal disease loci for which the defective genes have not yetbeen identified (for reviews, see refs. 4–6; RetNet <http://www.sph.uth.tmc.edu/retnet/>). In short, there is much mutation hunting yetto be done.
Four basic approaches have been used to discover mutant genesresponsible for inherited retinal degenerations. These are as follows.
1. Positional cloning for a yet undiscovered gene in a disease locusdetermined by linkage analysis.
2. Mutation screening of a candidate gene that maps to a locus estab-lished by linkage analysis to be the site of the mutation responsible

238 Danciger
for disease. The mutation screening is done in affected family mem-bers of the pedigree.
3. Screening of a gene that is a candidate for a particular disease or groupof diseases in a large number of unrelated patients with the disease(s).
4. A combination of genotyping and screening in which small familiesare genotyped for markers that are in or near the chromosomal lociof candidate genes. If the markers clearly do not segregate with dis-ease in the small family, the corresponding gene may be ruled out;if the markers cannot be excluded from segregating with disease,the corresponding candidate gene is screened for mutations.
Number 1. above is beyond the scope of this chapter. A goodexample of approach number 2. above started with the discovery ofan autosomal recessive retinitis pigmentosa (arRP) locus named“RP14” in a large Dominican pedigree (7). This was followed bythe cloning of the TULP1 retinal gene and its localization to theRP14 locus (8). Shortly after, a homozygous splice site mutationwas found in all affected members of the consanguineous Domini-can pedigree (9). Based on the coincidence of RP14 and TULP1loci and the retinal expression of TULP1, another study utilizingapproach number 3. above was carried out at about the same time.In this case, 2 of 536 arRP and simplex RP patients screened carriedcompound heterozygous mutations in their TULP1 genes that seg-regated with disease in their small families (10). The selection ofthe candidate TULP1 gene for mutation screening in a large numberof unrelated individuals with retinal disease was based on its chro-mosomal location and on its presence in retina as was the selectionof the RHO gene mentioned at the beginning of the chapter. Thereare many other examples of the number 3. approach where retinalcandidate genes were not selected for chromosomal location, butrather for some other reason. The gene encoding the beta-subunit ofcGMP-phosphodiesterase was first shown to be the site of mutationresponsible for the autosomal recessive retinal degeneration in therd mouse (11,12) and the Irish Setter dog (13,14). It was, therefore,selected for screening among a large number of unrelated patientswith arRP and a number of mutations were found (15–17). Thissame gene was studied with approach number 4. above. In this case,
Mutation Analysis of Ocular Genes 239
a dinucleotide repeat marker that is in the gene was used as a markerin a number of small arRP families. Many of the families couldbe ruled out from further study because the marker did not segre-gate with disease in those families. Proband DNAs from theremaining families were then screened for mutations and severalwere found (18–20).
Inherent in all of the approaches is the selection of candidategenes to study for particular diseases. For example, the gene encod-ing the rod-specific -subunit of cGMP-phosphodiesterase wasselected for study in patients with retinitis pigmentosa, a rod-domi-nant disease. Likewise, the gene encoding retinal guanylate cyclase(largely expressed in cones) was selected for study in a family withcone-rod dystrophy linked to the chromosomal location of this gene.The result was the discovery of a set of three mutations responsiblefor disease (21).
The methods used to conduct these studies and others involvedexon screening for point mutations and small insertions and dele-tions and haplotype analysis. The following outline describes themethods used in approaches 2., 3., and 4. mentioned earlier in thisintroduction.
2. Materials
2.1. Isolation of DNA from Blood Leukocytes
1. Lysis buffer: 111.25 gm sucrose, 5 mL 1 M MgCl, 10 mL Triton X-100,10 mL 1 M Tris-HCl pH 7.8, make to 500 mL with water. Store at 4°C.
2. Saline ethylenediamine tetraacetic acid (EDTA): 2.19 gm NaCl,4.56 gm EDTA, make to 500 mL with water and autoclave.
3. Protease K solution: Use Sigma P-0390 protease K and make to20 mg/mL in water.
4. 20% sodium dodecyl sulfate (SDS): Dissolve 400 gm sodium laurylsulfate in water and bring to 2 L. Mix with a mag stirrer overnight.Filter sterilize.
5. Phenol: Equilibrate to pH 8.0.6. P/C: 1 to 1 of equilibrated phenol and chloroform:isoamyl alco-
hol 24:1.

240 Danciger
7. 3 M NaAcetate: 123 gm of NaAC dissolved in 500 mL water.Autoclave.
2.2. Single-Strand Conformation PolymorphismElectrophoresis (SSCP) (22)
1. Primers may be purchased from a large number of suppliers. Typingpolymerase chain reaction “(PCR) primers” or “DNA primers” intoa web browser will produce many choices. The ingredients of thePCR mixture are as follows for a 15-µL reaction: 20 ng of leukocyteDNA in 15 µL of a buffer containing 20 mM Tris·HCl (pH 8.4 or8.6), 1.5 mM MgCl2, 50 mM KCl, 0.02 mM dATP, 0.02 mM dTTP,0.02 mM dGTP, 0.002 mM dCTP, 0.6 µCi [-32P]dCTP (3000 Ci/mmol),5 pM of each primer, 0.1 mg/mL BSA, and 0.25 U of Taq polymerase.
2. Stop solution/running solution: 19 mL formamide, 152 mg EDTA,10 mg bromphenol blue, 10 mg xylene cyanol FF, 1 mL nanopurewater. Add 500 µL 0.6 N NaOH to each mL of the above.
3. 7% nondenaturing acrylamide gel.a. 30% acrylamide stock: Dissolve 1 g bis-acrylamide and 29 g acryl-
amide in 100 mL nanopure water. Filter solution through Whatmanpaper and degas for 1/2–1 h. Store at 4°C.
b. 25 mL 30% acrylamide stock, 0 or 10 mL glycerol, 10 mL 10X TBEbuffer, make to 100 mL with nanopure water.
c. 10X TBE buffer: 216 g Tris-base, 110 g boric acid, 80 mL0.5 M EDTA (pH 8.0).
d. Just before casting the gel, add 500 µL 10% ammonium per-sulfate to 100 mL 7% acrylamide, mix thoroughly and then add90 µL TEMED.
2.3. Denaturing Gradient Gel Electrophoresis (DGGE) (23)
1. The ingredients of the PCR mix are as follows for a 100-µL reaction:1 µg of leukocyte DNA in 50 µL of a buffer containing 20 mM Tris-HCl (pH 8.4 or 8.6), 1.5 mM MgCl2, 50 mM KCl, 0.02 mM dATP,0.02 mM dTTP, 0.02 mM dGTP, 0.002 mM dCTP, 0.6 µCi [-32P]dCTP(3000 Ci/mmol), 20 pM of each primer, 0.1 mg/mL BSA, and 2.5 U Taqpolymerase.
2. 14% acrylamide denaturing gels.a. Acrylamide stock solution: 100 gm acrylamide, 2.7 gm bis-
acrylamide, water to 250 mL. Do not autoclave.

Mutation Analysis of Ocular Genes 241
b. 20X gel running buffer: 190 gm Tris base, 110 gm NaAC·3H2O,15 gm Na2EDTA, water to 2 L, adjust pH to 7.4 with acetic acid.
c. 10% denaturant stock solution/14% acrylamide: 88 mL ofacrylamide stock solution, 10 mL of deionized formamide,10.625 gm urea (ultrapure), 12.5 mL 20X gel running buffer,water to 250 mL.
d. 40% denaturant stock solution/14% acrylamide: 88 mL ofacrylamide stock solution, 40 mL of deionized formamide,42.5 gm urea (ultrapure), 12.5 mL 20X gel running buffer,water to 250 mL.
e. 50% denaturant stock solution/14% acrylamide: 88 mL ofacrylamide stock solution, 50 mL of deionized formamide,53.125 gm urea (ultrapure), 12.5 mL 20X gel running buffer,water to 250 mL.
f. 80% denaturant stock solution/14% acrylamide: 88 mL of acryl-amide stock solution, 80 mL of deionized formamide, 85 gm urea(ultrapure), 12.5 mL 20X gel running buffer, water to 250 mL.
g. Store all denaturant stock solutions at 4°C.h. Polymerization catalysts: TEMED and 10% ammonium per-
sulfate (store at 4°C).3. Running dye: 2 gm sucrose, 100 mL Tris-HCl, pH 7.8, 20 mL 0.5 M EDTA,
pH 8.0, 10 mg dye (bromphenol blue), make to 10 mL with water.
2.4. Haplotype Analysis for Candidate Gene
1. Primers for simple sequence repeat markers may be purchasedas in Subheading 2.2. or from Research Genetics, Huntsville,AL. The ingredients of the PCR mix are as in Subheading 2.2.as well.
2. Stop solution/running solution: 19 mL formamide, 152 mg EDTA,10 mg bromphenol blue, 10 mg xylene cyanol FF, 1 mL nanopurewater.
3. 7% denaturing acrylamide gel: 2.6 gm bis-acrylamide, 67.5 gmacrylamide, 100 mL 10X TBE, 480 gm urea. Dissolve in 1 L of water(takes several hours), sterilize by filtration and degas for 1 h. Store inthe cold.
4. To catalyze gel formation from the liquid add 500 µL of 10% ammo-nium persulfate and 90 µL of TEMED to 100 mL of gel solution justbefore casting.

242 Danciger
5. See Subheading 2.2., step 3c for ingredients of 10X TBE.
3. Methods
3.1. Isolation of DNA from Blood Leukocytes (see Note 1)
1. To lyse red cells mix 5–10 mL blood with an equal volume of coldlysis buffer. Leave on ice for 5' and agitate frequently.
2. Centrifuge to pellet the white blood cells at approx 800g (no morethan 1000g or the white cell membranes will be disrupted) for 10' attop speed.
3. Pour off supernatant and freeze pellet at –20°C or continue.4. Suspend freshly prepared or previously frozen white cell pellet in
2 mL saline/EDTA and add 40 µL of the protease K solution alongwith 100 µL of the SDS solution. Incubate overnight at 37°C.
5. Add 50 µL more of the protease K solution the next morning andcontinue to incubate at 37°C until the afternoon.
6. Add 4 mL of equilibrated phenol to each tube and shake until homo-geneous. Centrifuge at approx 800g for 5 min and pipet off the upperphase into a Phase-Lock tube (5'–3' prime).
7. Add 4 mL of P/C solution and shake until homogeneous.8. Centrifuge at approx 800g for 5 min and pipet off the aqueous layer
above the gel plug of the Phase-Lock tube.9. Add 100 mL of the NaAC solution and 2.5 vol of cold isopropyla
alcohol.10. Gently invert the tube until the DNA forms at the interface of the
phases. It should appear as a white “thready” mass.11. Wind out the DNA on a Pasteur pipet, rinse with 70% ethanol,
unwind the DNA into sterile water, and dissolve overnight in thecold with gentle shaking. Store in the cold.
3.2. Single-Strand Conformation PolymorphismElectrophoresis (SSCP) (see Note 2)
1. Design PCR primers from the sequences flanking each exon accord-ing to the following criteria.a. Select primers that amplify from at least 20 bp in front of the
exon to 60 bp after the exon. This is to include the entire 14 bp accep-tor splice sequence upstream of the exon, and the 14 bp donor

Mutation Analysis of Ocular Genes 243
splice site downstream of the exon plus possible branch pointsites at 30–50 bp downstream of the exon.
b. Select front and rear primers that have approximately the samepercentage of G/C bases. This is to ensure that both primers willanneal equally well to the template at the annealing temperatureselected.
c. Primer lengths are generally 18–24 bp. Generally, the longer theprimer, the more specific.
d. Exclude from sequences selected for primers those that containmore than three consecutive identical bases or any repeat sequencesin order to avoid nonspecific binding of the primers. For example,(CA)6 within a 24 bp primer is dangerous because there are thou-sands of CA repeat sites in the human genome. On the other hand,(CA)2 within a 24 bp primer would not be a problem because ofthe specificity of the other 20 bp.
e. Select primers to amplify a fragment of approx 250 bp. Muchmore than this decreases the sensitivity of the SSCP method fordetecting variants.
2. PCR amplification may be performed with many different protocols andmany different brands of taq polymerase. The following procedure maybe followed for any 15-µL PCR protocol or commercial taq enzyme.a. Mix PCR reactants on ice using control DNA as template.b. Overlay the PCR reaction mixture with oil.c. Place PCR reaction tubes in the temperature cycler set to 94°C
and allow to remain at this temperature for 3–5 min.d. Set temperature cycler for 30 cycles of (94°C for 30 s; annealing
temp for 30 s; 72° for 30 s) followed by 5 min at 72°C.e. Set the annealing temperature according to the percent GC/total
bases in the primer. For approx 50% GC, use 55°C. For <50% GC,lower the annealing temperature; for > 50% GC, raise it.
f. Electrophorese PCR product in a 3–4% agarose gel against a sizestandard such as X174 digested with HaeIII (Promega) and stainwith ethidium bromide.
g. If the PCR product gives extraneous bands use a higher anneal-ing temperature; if there are no bands or a weak band lower theannealing temperature.
h. The concentration of MgCl2 in the PCR reaction mixture mayalso influence the reaction.

244 Danciger
i. Once a clean strong band of the correct size results from PCR, usethat protocol and MgCl2 concentration for that exon for all subjectDNAs tested (used as template) and use an a-dNT32P as label.
3. Once the PCR reaction has been completed, add 3 µL of PCR prod-uct to 9 µL of stop solution, boil for 1 min and put on ice until readyto load gel.
4. Cast 7% acrylamide nondenaturing gels in 14" × 17" glass plateswith 0.3-mm spacers and place upright in the acrylamide gel appara-tus (Stratagene, LaJolla, CA). Run two gels (at room temperature)for each exon—one with 10% glycerol and the other with no glyc-erol. Run the 0% glycerol gel for approx 3 h at 40 W; the 10% glyc-erol gel for approx 16 h (overnight) at 18 W.
5. After electrophoresis: gently remove one glass plate from gel. Placewhatman filter paper on the exposed gel and remove from secondglass plate. Cover gel and dry in gel dryer (Bio-Rad). After dryingplace gel still on Whatman paper into 14" × 17" light-tight metalcassettes (Daigger Lab Supplies) and in the dark expose to X-rayfilm (Kodak). Develop film after 1–10 d exposure depending onstrength of signal (see Note 3).
3.3. Denaturing Gradient Gel Electrophoresis (DGGE)(see Note 4)
1. Design PCR Primers as in Subheading 3.2., step 1a–e with the fol-lowing exceptions:a. Include a large “GC clamp” (24) on the 5' end of the primer with
the most G’s and C’s. One example is GCC GCC CGC CCG CCCGCC GCG CCG CCC GCC GCC CGC (18). This primer willthen be 18–24 bp plus the 36 bp GC clamp; the other primerremains at 18–24 bp.
b. Select primers to amplify a fragment of approx 300 bp (the GCclamp adds 36–40 bp). Much more than this decreases the sensi-tivity of the DGGE method for detecting variants.
2. Perform PCR amplification in 100-µL aliquots. See Subheading 3.2.,step 2a–i.
3. Once the PCR reaction has been completed, add 50 µL of PCRproduct to 5–10 µL of loading solution and put on ice until ready toload gel.
4. Electrophorese two different gradient gels for each amplicon. Cast1.5-mm thick, 14% acrylamide gels in 17.7 × 22 cm upright glass

Mutation Analysis of Ocular Genes 245
plates. One gel is made with a 10–50% denaturing gradient, theother with a 40–80% gradient. The complete DGGE setup isavailable from CBS Scientific, Solana Beacch, CA (DGGE-2000).Make the gradients with a gradient maker (CBS Scientific) with50-mL gels cast between the glass plates. Just after adding 22.5 µLof TEMED and 125 µL of 10% ammonium persulfate to each25-mL acrylamide aliquot make the gradient gels. For the 10–50% gradient put 25 mL of acrylamide with 10% denaturant in onewell of the gradient maker and 25 mL of acrylamide with 50% dena-turant in the other. Make the 40–80% gradient gel the same way,only place 25 mL of acrylamide with 40% denaturant in one wellof the gradient maker and 25 mL of acrylamide with 80% denatur-ant in the other.
5. To run, immerse gel in a 60°C water bath and load with PCR product.a. Run the 10–50% gel at 200 V for 4–5 h; the 40–80% gel at 90 V
overnight (approx 16 h).b. After electrophoresis gently remove gel from the glass plates,
stain with ethidium bromide and photograph over a UV light box(Daigger Lab Supplies).
3.4. Haplotype Analysis for Candidate Gene (see Note 5)
1. Primers that will amplify simple sequence repeat markers may bepurchased from Research Genetics, Huntsville, AL. The ideal char-acteristics of these primers are as follows:a. They should be as close as possible (if not in) the candidate gene
to be studied;b. They should be as highly polymorphic as possible, i.e., as high a
heterogeneity index as possible.2. Information on primers can be found in a number of data bases,
including the Whitehead Institute database <http://www-genome.wi.mit.edu/>; Genethon <http://www.genethon.fr/genethon_en. html>;the Genome Database <http://www.hgmp.mrc.ac.uk/gdb/gdbtop.html>; and GeneMap <http://www.ncbi.nlm.nih.gov/genemap/>.
3. Once the PCR reaction has been completed, add stop solution at halfthe volume of the PCR reaction. Use SeqaMark (USB) as a size indi-cator when running the gels.
4. Cast 7% acrylamide denaturing gels in 14" × 17" glass plates with0.3-mm spacers and place upright in the acrylamide gel apparatus

246 Danciger
(Stratagene). Run gels at 90 W for several hours. The temperature ofthe glass plates should be 50–55°C. If plates get much hotter thanthat, they may crack; the temperature can be kept down with a fan.
5. After electrophoresis: gently remove one glass plate from gel. Placewhatman filter paper on the exposed gel and remove from secondglass plate. Cover gel and dry in gel dryer (Bio-Rad). After drying,place gel, still on Whatman paper, into 14" × 17" light-tight metalcassettes (Daigger Lab Supplies) and in the dark, expose to X-rayfilm (Kodak). Develop film after 1–10 d exposure depending onstrength of signal (see Notes 6 and 7).
4. Notes
1. Isolation of DNA from blood leukocytes: The quality and amount ofDNA isolated from blood leukocytes depends on how the blood ishandled before it is extracted. Extraction should be performed asclose to the time the blood is drawn as possible. Until that time theleukocytes do well at room temperature. If the blood is heated(e.g., during shipping in hot weather) or not extracted within 1 wkof draw the quality and amount of DNA extracted goes down.
2. SSCP (22): In this procedure, double-stranded fragments of DNAare first separated, and then the single strands are electrophoresed ina nondenaturing acrylamide gel. If the fragments are small enough(approx 250 bp), a single base change will cause one or both strandsto run differently in the gel compared to wild type. If the two allelesare different (heterozygosity), the normal bands and variantbands will both appear in the gel (if detected). If the two alleles arethe same (homozygosity), only the variant band(s) will appear (seeFig. 1). SSCP detects 80–90% of all variants (25).
3. With a homozygous exon fragment, usually one strong band appearson the film. However, there can be secondary, tertiary, or even morebands that do not give as intense a signal as the primary band.The important observation is that the pattern should be the same asthat of control DNAs. A heterozygous exon fragment will give anadditional band (if detected); a homozygous variant band should giveat least one unique band, and one of the normal bands should disap-pear. Secondary or tertiary bands are important because they mayreveal differences that are not seen in the primary bands.
4. DGGE (23): With a homozygous exon fragment one sharp bandappears in the gel. A homozygous single base variant should

Mutation Analysis of Ocular Genes 247
give a band at a higher or lower position in the gel than the normals.A heterozygous variant should give four bands: the normal, the vari-ant, and the heterodimers. Often, the variant band will be seen in oneor the other of the denaturing gradient gels because it melts at a par-ticular concentration of denaturant. Only when the melting point isnear to or in the 40–50% range where the gels overlap, will it be seenin both gels. The important observation is to discern any pattern thatis different from the normal DNAs.
5. Haplotype analysis for Candidate Gene: This procedure is appropri-ate when one has a large number of small families with at leasttwo affected and the candidate gene to be screened has a largenumber of exons.
6. Any family where the gene markers near or in the candidate genelocus do not segregate with disease can be ruled out. Exon screening
Fig. 1. SSCP gel showing segregation of variant band with disease.In this consanguineous family, the affected sibling who has autosomalrecessive disease has inherited the same variant allele from each carrierparent. The variant is detected in the fainter upper band. This figure wasoriginally published in Molecular Vision 2(10), 1996. <http://www.emory.edu/molvis/v2/danciger>

248 Danciger
is done on the DNAs of the probands of those families that cannot beruled out by haplotype analysis. With a large number of exons in agene, one can cut down on the number of gels and PCR reactionssubstantially by ruling out families. For genes with only three or fourexons it may not be worth the trouble to do haplotype analysis.Of course, when only proband DNAs are available this procedurecannot be used.
7. The most commonly used of the procedures described is SSCP. WithDGGE it takes three or four times as long to run the same number ofsamples as it does with SSCP, and DGGE is more costly. On theother hand, DGGE results are readable immediately after stainingthe gel with ethidium bromide, whereas radioactivity-based SSCPrequires at least overnight exposure to X-ray film, if not more time.No matter which procedure is used, some sequence variants will bemissed; perhaps 10–20% (25). For affected members of a family thatis linked to the locus of a candidate gene, the surest way to detect avariant is by sequencing. However, sequencing is prohibitive whenscreening a large number of unrelated individuals. In our lab, wehave compared DGGE with SSCP and found that approximately thesame number of variants are detected by one and missed by the other.
References
1. Dryja, T. P., McGee, T. L., Reichel, E., Hahn, L. B., Cowley, G. S.,Yandell, D. W., et al. (1990) A point mutation of the rhodopsin genein one form of retinitis pigmentosa. Nature 343, 364–366.
2. McWilliam, P., Farrar, G. J., Kenna, P., Bradley, D. G., Humphries,M. M., Sharp, E. M., et al. (1989) Autosomal dominant retinitispigmentosa (ADRP): localization of an ADRP gene to the long armof chromosome 3. Genomics 5, 619–622.
3. Sparkes, R. S., Klisak, I., Kaufman, D., Mohandas, T., Tobin, A. J.,and McGinnis, J. F. (1986) Assignment of the rhodopsin gene tohuman chromosome three, region 3q21-3q24 by in situ hybridizationstudies. Curr. Eye Res. 5, 797, 798.
4. van Soest, S., Westerveld, A., de Jong, P. T., Bleeker-Wagemakers,E. M., and Bergen, A. A. (1999) Retinitis pigmentosa defined from amolecular point of view. Surv. Ophthalmol. 43, 321–334.
5. Inglehearn, C. F. (1998) Molecular genetics of human retinal dystro-phies. Eye 12, 571–579.

Mutation Analysis of Ocular Genes 249
6. Farber, D. B. and Danciger, M. (1997) Identification of genes caus-ing photoreceptor degenerations leading to blindness. Curr. Opin.Neurobiol. 7, 666–673.
7. Knowles, J. A., Shugart, Y., Banerjee, P., Gilliam, T. C., Lewis, C. A.,Jacobson, S. G., and Ott, J. (1994) Identification of a locus, distinctfrom RDS-peripherin, for autosomal recessive retinitis pigmentosaon chromosome 6p. Hum. Mol. Genet. 3, 1401–1403.
8. North, M. A., Naggert, J. K., Yan, Y., Noben-Trauth, K., and Nishina,P. M. (1997) Molecular characterization of TUB, TULP1, andTULP2, members of the novel tubby gene family and their possiblerelation to ocular diseases. Proc. Natl. Acad. Sci. USA 94, 3128–3133.
9. Banerjee, P., Kleyn, P. W., Knowles, J. A., Lewis, C. A., Ross, B. M.,Parano, E., et al. (1998) TULP1 mutation in two extended Dominicankindreds with autosomal recessive retinitis pigmentosa. Nat. Genet.18, 177–179.
10. Hagstrom, S. A., North, M. A., Nishina, P. L., Berson, E. L., andDryja, T. P. (1998) Recessive mutations in the gene encoding thetubby-like protein TULP1 in patients with retinitis pigmentosa.Nat. Genet. 18, 174–176.
11. Bowes, C., Li, T., Danciger, M., Baxter, L. C., Applebury, M. L., andFarber, D. B. (1990) Retinal degeneration in the rd mouse is causedby a defect in the beta subunit of rod cGMP-phosphodiesterase.Nature 347, 677–680.
12. Pittler, S. J. and Baehr, W. (1991) Identification of a nonsense muta-tion in the rod photoreceptor cGMP phosphodiesterase beta-subunitgene of the rd mouse. Proc. Natl. Acad. Sci. USA 88, 8322–8326.
13. Farber, D. B., Danciger, J. S., and Aguirre, G. (1992) The beta sub-unit of cyclic GMP phosphodiesterase mRNA is deficient in caninerod-cone dysplasia 1. Neuron 9, 349–356.
14. Suber, M. L., Pittler, S. J., Qin, N., Wright, G. C., Holcombe, V., Lee,R. H., et al. (1993) Irish setter dogs affected with rod/cone dysplasiacontain a nonsense mutation in the rod cGMP phosphodiesterase beta-subunit gene. Proc. Natl. Acad. Sci. USA 90, 3968–3972.
15. McLaughlin, M. E., Sandberg, M. A., Berson, E. L., and Dryja, T. P.(1993) Recessive mutations in the gene encoding the beta-subunit ofrod phosphodiesterase in patients with retinitis pigmentosa. Nat. Genet.4, 130–134.
16. McLaughlin, M. E., Ehrhart, T. L., Berson, E. L., and Dryja, T. P.(1995) Mutation spectrum of the gene encoding the beta subunit of

250 Danciger
rod phosphodiesterase among patients with autosomal recessiveretinitis pigmentosa. Proc. Natl. Acad. Sci. USA 92, 3249–3253.
17. Saga, M., Mashima, Y., Akeo, K., Kudoh, J., Oguchi, Y., andShimizu, N. (1998) A novel homozygous Ile535Asn mutation in therod cGMP-phosphodiesterase beta-subunit gene in two brothers ofa Japanese family with autosomal recessive retinitis pigmentosa.Curr. Eye Res. 17, 332–335.
18. Danciger, M., Blaney, J., Gao, Y. Q., Zhao, D. Y., Heckenlively, J. R.,Jacobson, S. G., and Farber, D. B. (1995) Mutations in the PDE6Bgene in autosomal recessive retinitis pigmentosa. Genomics 30, 1–7.
19. Danciger, M., Heilbron, V., Gao, Y. Q., Zhao, D. Y., Jacobson, S. G.,and Farber, D. B. (1996) A homozygous PDE6B mutation in a familywith autosomal recessive retinitis pigmentosa. Mol. Vis. 2, 10.
20. Bayes, M., Martinez-Mir, A., Valverde, D., del Rio, E., Vilageliu, L.,Grinberg, D., et al. (1996) Autosomal recessive retinitis pigmentosain Spain: evaluation of four genes and two loci involved in the dis-ease. Clin. Genet. 50, 380–387.
21. Perrault, I., Rozet, J. M., Gerber, S., Kelsell, R. E., Souied, E., Cabot,A., et al. (1998) A retGC-1 mutation in autosomal dominant cone-roddystrophy. Am. J. Hum. Genet. 63, 651–654.
22. Orita, M., Iwahana, H., Kanazawa, H., Hayashi, K., and Sekiya, T.(1989) Detection of polymorphisms of human DNA by gel electro-phoresis as single-strand conformation polymorphisms. Proc. Natl.Acad. Sci. USA 86, 2766–2770.
23. Myers, R. M., Sheffield, V. C., and Cox, D. R. (1988) Detection ofsingle base changes in DNA: ribonuclease cleavage and denaturinggradient gel electrophoresis, in Genome Analysis: A PracticalApproach (Davies, K. E., ed.), IRL Press: Washington, DC, pp. 95–139.
24. Sheffield, V. C., Cox, D. R., Lerman, L. S., and Myers, R. M. (1989)Attachment of a 40-base-pair G + C-rich sequence (GC-clamp) togenomic DNA fragments by the polymerase chain reaction results inimproved detection of single-base changes. Proc. Natl. Acad. Sci.USA 86, 232–236.
25. Sheffield, V. C., Beck, J. S., Kwitek, A. E., Sandstrom, D. W., andStone, E. M. (1993) The sensitivity of single-strand conformationpolymorphism analysis for the detection of single base substitutions.Genomics 16, 325–332.
Ophthalmologists’ Perspective 251
251
From: Methods in Molecular Medicine, vol. 47: Vision Research ProtocolsEdited by: P. E. Rakoczy © Humana Press Inc., Totowa, NJ
14
Ophthalmologists’ Perspective
Susan M. Downes, N. H. Victor Chong, and Alan C. Bird
1. Introduction
Molecular biology has significantly contributed to our understand-ing of inherited retinal disease, in particular to that of monogenicdisorders. The discovery of the responsible gene, the elucidation ofits function, and the increasing understanding of the pathogenesisof inherited retinal disorders is both exciting and important. Fromthe clinician’s point of view, this new information is helpful indiagnosis and prognosis, and may ultimately yield benefits in theform of therapy. This chapter deals with the advances made in thefield of molecular biology as it pertains to inherited retinal disor-ders from the perspective of the clinician. Identification of specificloci, genes, and causative mutations have led to reclassification andreordering of the preexisting nosological classification. Progressionin the understanding of the function of the relevant protein, andputative metabolic disturbance caused by the mutation at the cellu-lar level, is continuing and therapies developed to address theseabnormalities are currently undergoing evaluation.
Molecular genetics has also had an impact on clinical manage-ment. The most common questions asked regarding inherited reti-nal dystrophies in a clinical setting are the diagnosis, visualprognosis, whether there is a possibility that the disorder may be

252 Downes, Chong, and Bird
transmitted to the next generation, and whether there is or will be a“cure.” Molecular genetics contributes to answering these questions.In families in which a mutation in a gene has been identified, thediagnosis is secure, and by documenting the distribution of themutant gene within a family, genetic counselling can be given withconfidence; although identification of a mutation in gene in an indi-vidual can be associated with variable expression of the disease evenwithin the same family. The developments in tumor biology and thetherapeutics involved are not within the scope of this chapter, norare the developments in immunogenetics as applied to uveitis. It isalso beyond the scope of this chapter to review adequately complexmultifactorial disorders such as age-related macular degeneration.
1.1. Phenotype and Genotype Correlation
The outer retinal dystrophies comprise a large number of disor-ders characterized by progressive retinal degeneration. In the past,careful description of the clinical phenotype supplemented byfunctional evaluation by electrophysiology and psychophysics ledto clinical categorization of retinal dystrophies into retinitispigmentosa, macular, and rod/cone dystrophies. Further subdivisionwas achieved on the basis of inheritance as autosomal dominant,autosomal recessive, or X-linked. However, each of these catego-ries contained many individual diseases.
Retinal degenerations have also been classified on the basis ofnonsyndromic and syndromic type. The syndromic type includesdisorders such as Usher syndrome in which congenital hearingloss and retinitis pigmentosa are associated. Syndromic RP is usu-ally associated with either autosomal recessive or mitochondrialinheritance, but there are exceptions such as macular dystrophy andspinocerebellar ataxia (1). Examples of digenic inheritance, otherthan that described in peripherin/RDS and ROM1 (2), or proof thatthe second allele is exerting either a protective or deleterious effect,are yet to be described.
The first firm evidence of different pathogenetic mechanismsbecame evident in the early 1980s. Autosomal dominant disease was

Ophthalmologists’ Perspective 253
divided into the “diffuse type” in which diffuse loss of scotopicfunction occurred before photopic loss, and the “regional type” inwhich patchy loss of both these systems occurred simultaneously(3,4). Furthermore, it was concluded that in the latter, visual losswas because of cell death or loss of the outer segment, whereas inthe former, this could not be the case.
Clinical classification has been revolutionized by the advent ofmolecular genetics. In the last few years in particular, chromosomallocalization and identification of causative genes have led to theconclusion that retinal dystrophies exhibit marked clinical andgenetic heterogeneity. Not unexpectedly, mutations in differentgenes may give rise to distinct phenotypes, but different mutationsin the same gene also give rise to different disorders (5). Further-more, within a family, the same mutation can give rise to a pheno-type that may vary both quantitatively and qualitatively. By contrast,mutations in different genes may give rise to phenotypes that cur-rently appear to be indistinguishable one from another, so thatpatients with a common phenotype cannot be assumed to behomogeneous. These observations have an impact for clinicians andpatients, as an important part of clinical practice is to establish adiagnosis.
A system that relates a genotype to the phenotype is clearlyimportant. It is hoped that with more sophisticated analysis of reti-nal structure and function that clinical features can be shown toreflect the metabolic derangement consequent upon the mutation.In recent years, careful genotype–phenotype correlations have beenundertaken, which, in some cases, have demonstrated that inter- andintrafamilial variation exists. An example of this is the peripherin/RDSmutation in codon 153 or 154 of the peripherin/RDS gene givingrise to marked phenotypic variation with retinitis pigmentosa,pattern dystrophy, and fundus flavimaculatus in one family (5). In con-trast to this, the phenotype recorded in the codon 172-peripherin/RDSmacular dystrophy is fairly consistent (6,7).
Explanations include epigenetic phenomenon, the possibility of a“protective” allele, digenic disease, or stochastic or environmentalinfluences. Mutations in the rhodopsin gene that give rise to auto-

254 Downes, Chong, and Bird
somal dominant RP appear to have a more consistent phenotype,even though familial variability in phenotype has been described;the P23H mutation is a good example of this kind of phenotype (8).
Information from genotype–phenotype correlation studies isbecoming increasingly available as loci and genes are identified.In some cases, distinctive phenotypes associated with specificmutations, are emerging. Genes described in association with cone(COD) and cone–rod (CORD) dystrophies are good examples ofthis, and are discussed below. Although these genotype–phenotypestudies have shown us that there is variability as aforementioned,further studies are warranted as identification of the secondaryfactors that are modulating this clinical expression can then beattempted.
1.2. Laboratory-Based Techniquesand In Vivo Studies of the Retina
The identification of new genes has led to an increase in knowl-edge regarding these genes. The site of expression, and resultantabnormalities in structures affected by mutant genes are beinginvestigated using techniques including in situ hybridization andimmunohistochemistry. These different techniques all contribute tothe understanding of retinal disease and help identify the intendedsite of action for proposed therapeutic measures as well as directresearch towards appropriate therapies; this will also allow evalua-tion of the results of these therapies.
Various investigative approaches allow documentation of thefunction of the normal and the mutated gene, either by usingmutagenesis in cell systems, or by creating transgenic or knockoutanimal models. These techniques have been widely used in theexamination of retinal degeneration. As mutations in genes are iden-tified their effect can be examined both in vitro and in vivo.Transgenic models of rhodopsin and peripherin/RDS mutations haveenabled functional evaluation with sequential histopathology. Spe-cific effects on cells and their connections can be addressed.Transgenic or knockout animal models provide the advantage that
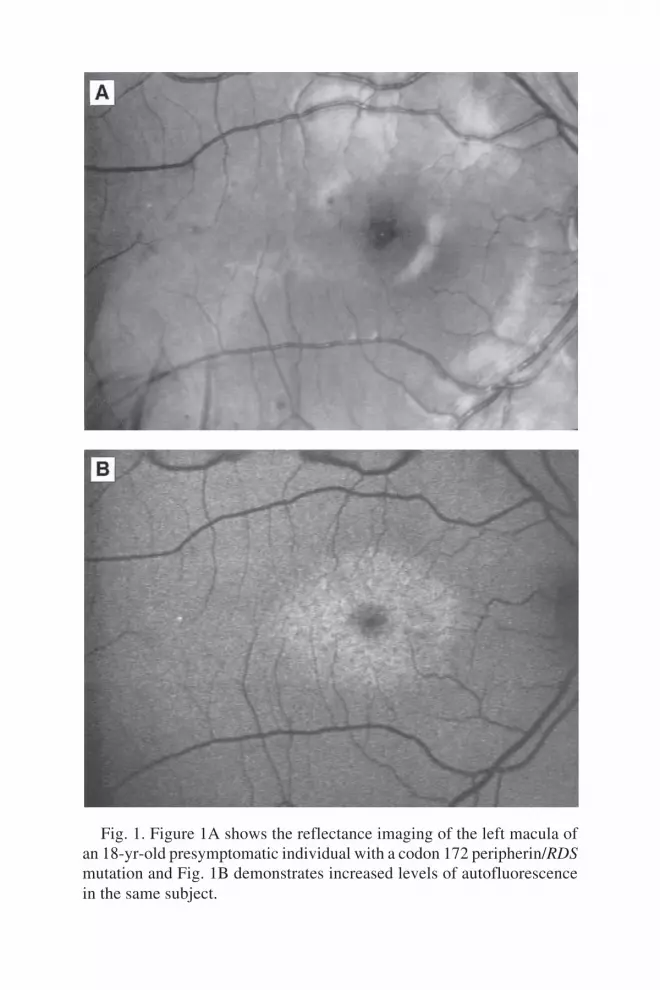
Ophthalmologists’ Perspective 255
Fig. 1. Figure 1A shows the reflectance imaging of the left macula ofan 18-yr-old presymptomatic individual with a codon 172 peripherin/RDSmutation and Fig. 1B demonstrates increased levels of autofluorescencein the same subject.

256 Downes, Chong, and Bird
the effects of the mutated gene are observed in vivo, which may besignificantly different from that observed in vitro (9,10). In addi-tion, effects of therapies under evaluation can also be examined inthese models. In parallel with these techniques, information isgleaned from clinical examination of the retina and associated struc-tures with electrophysiology, psychophysics, and scanning laserophthalmoscopic imaging, so that in vivo effects of the mutation inhumans can be assessed (see Fig. 1).
1.3. Prospect of Treatment
The first apparently successful gene therapy was initiated in 1990for the rare recessively inherited disorder adenosine deaminase(ADA) deficiency (a severe combined immunodeficiency) (11). TheADA gene is small and the target cells are T cells that are easy toaccess and culture such that ex vivo gene therapy was possible. Theeffect of the gene transfer was demonstrated to persist for severalweeks. The difficulty in treating retinal disease is that the retina is abrain derivative, is delicate, and fairly inaccessible. In addition, forany tissue the introduction of a foreign product may be accompa-nied by toxic reaction, may evoke an immunogenic response, ormay even introduce a new problem associated with the vector itself.In particular, the use of virus vectors is being evaluated carefully (12).
Each viral vector has its advantages and disadvantages and somemay be better suited to the retina than others. Other vectors that arecurrently undergoing evaluation include liposomes. These are cur-rently associated with rather a low efficiency of transfer, but may besuitable for use as part of an in vivo strategy and their nonviral ori-gin may prove an advantage.
The various methods described in the previous chapters includedelivery of different recombinant viruses to the eye, antisense DNAtechnology, and inhibition of gene expression by ribozymes.
At first glance the difficulties to be overcome seem daunting.Successful in vivo gene transfer to ocular tissue was first reportedin 1994 (13). The theory is that a piece of DNA coding for thedesired protein is transferred into the target cell. The cell then tran-

Ophthalmologists’ Perspective 257
scribes the gene, and translates the resulting mRNA into the desiredprotein. In order to function normally, the gene must have itsupstream region including its promotor region, where transcriptionfactors can bind to in order to initiate and regulate transcription.Other more subtle factors, which as yet may be unknown regardingtemporal regulation of gene expression, and cis and trans actingfactors concerning the regulation of the gene, may influence the suc-cessful outcome. Research into the use of these therapies using ani-mal models has been in progress throughout the 1990s. Successfulgene therapy applicable to human retinal disease will be dependenton a reliable method to deliver a gene to the target, adequate expres-sion of the gene, and subsequent regulation of its expression. Inaddition, it will be necessary to demonstrate low toxicity and long-term efficacy, safety, stability, and target specificity. The vector thatis used to transfer the gene to the target site must not cause disease,inflammatory reactions, immunogenic reactions, or spread to otherpeople. Retinal tissues are not easily accessible thus renderingin vivo therapy more appropriate than ex vivo gene therapy. It isclear that one particular technique may not be appropriate for alldisorders, and that the nature of the disorder may well dictate thespecific therapeutic agent. For example, in a recessive disorder suchas gyrate atrophy there is a lack of ornithine transferase so a geneaugmentation approach is desirable; similarly in choroideremiawhere the protein is missing, corrective gene addition seems a logi-cal approach. Generally, the type of inheritance pattern will influ-ence the strategy in gene therapy. Some generalizations are helpfulin considering the suitability of various disorders for gene therapy.
In recessive disorders there is usually little or no gene product asboth alleles are affected so that it would be expected that if any levelof expression can be achieved, that this should confer some benefit.This concept is not the same for dominant disorders as most areheterozygous and therefore 50% of the normal product is producedas well as the abnormal gene product (unless there is a null muta-tion). Therefore, although gene augmentation would be predicted tobe helpful in recessive disorders, but the reverse is likely in domi-nant conditions. Therefore, in disorders where there is a gain of

258 Downes, Chong, and Bird
function, or a toxic product, adding a normal gene would be inap-propriate. Either specific blocking of the mutant gene or repair orremoval of the offending gene would be necessary.
The opposite of the gene augmentation approach is correctivetreatment; for example, the introduction of antisense oligonucleo-tides to prevent overexpression. Specific genes that are overexpress-ing and producing deleterious products are targeted for inhibition.Antisense oligonucleotides can be introduced into the cell to bindthe mRNA and prevent translation of the protein. The particularpotential of this technique is to target conditions where excessivecell proliferation is occurring. Retinal disorders that involve angio-genesis such as retinal vein occlusions, sickle-cell disease, and dia-betes may be very suited to this form of therapy. Ribozyme therapy,whereby specific gene expression can be blocked, may be more suit-able for the treatment of autosomal dominant retinal disorders.Ribozymes have been shown to discriminate and catalyze in vitrothe destruction of P23H mutant mRNAs from a transgenic rat modelof ADRP (14). This approach has also been achieved in vivo usinga recombinant adeno-associated virus (rAAV) incorporating a rodopsin promoter. Ribozyme-directed cleavage of mutant mRNAsmay be an effective therapy for ADRP and may be applicable toother inherited diseases (15). An alternative to a viral vector islipsomal delivery that is undergoing evaluation.
Current drawbacks with all of the therapies are the difficulties inobtaining adequate transfer, problems with toxicity, and to establishcontinued expression. The issue regarding viral vectors and theirpotential for harm is also a consideration. In addition, it has beenshown that the immune privilege observed in the eye is not indefi-nite and absolute (16).
The response to foreign antigens delivered to some tissues is dis-tinctly different depending on the mode of delivery and to whichtissue. Experiments involving transplantation of allogenic neonatalretina tissue into the subretinal space demonstrated prolonged sur-vival, but the tissue was eventually rejected. However, the rejectionwas atypical and no significant cell infiltrate and little or no injuryto uninvolved ocular structures was observed (16).

Ophthalmologists’ Perspective 259
1.4. Alternative Approaches
In some disorders, in both man and animals, there is increasingevidence that the metabolic defect consequent upon the mutationcauses cell death through apoptosis. This would account for coneloss in patients with RP because of rhodopsin mutations (17).
Apoptosis, or programmed cell death, is a genetically encodedpotential of all cells, and is an essential part of embryonic development,cell turnover and of removal of cells infected by virus or harbouringmutations (18). Morphologically, it is characterized by disintegrationof the nucleolus and generalized condensation of the chromatin.In contrast to necrosis, the process affects isolated cells with healthyneighboring cells and in the absence of acute inflammation.
The observation that apoptosis may be manipulated by growthfactors suggested an alternative therapeutic approach. The firstindication that this may be viable was the demonstration that injec-tion of basic fibroblast growth factor (bFGF) into the eye resulted inlong-term survival of photoreceptors in the RCS rat (19). A poten-tial disadvantage of bFGF is its lack of specificity since it influ-ences many cell types. For instance in the rabbit, it can causecataract and proliferative vitreoretinopathy (20). Neurotrophins,including brain-derived neurotrophic factor (BDNF), nerve growthfactor (NGF) and neurotrophin 4/5 (NT4/5) appear to be moreattractive since they have a relatively specific influence on neuraltissue (21). They are present in the CNS, and play important roles inneural development, differentiation and survival (21). Anotherimportant neurotrophic factor is the ciliary neurotrophic factor(CNTF) that is closely related to the interleukin 6 (IL-6) (22). Thereis an increasing body of experimental work that illustrates thepotential value of this approach. Intravitreal injections of eitherBDNF, CNTF, or bFGF transiently protect the retina from pressure-induced ischaemic injury (23). Both BDNF and CNTF protect theretina from light damage in albino rats and mice (24,25). CNTFdelays photoreceptor degeneration in rd (retinal degeneration) mice(25), transgenic rhodopsin Q344ter mutant mice (25), and Rdy (reti-nal dystrophy) cats (26).

260 Downes, Chong, and Bird
This form of treatment of retinal degeneration has the advantagethat it may be effective in disease without having to know the caus-ative mutation. Currently, the effect of the neurotrophic factors isrelatively short lived, lasting only about a month in animals (24–26);although the effect may be much longer in humans. Repeatedmonthly intravitreal injections would present ergonomic difficul-ties, and would be associated with risks such as retinal detachmentand endophthalmitis. Biological and biochemical slow-delivery sys-tems are being developed that may overcome these problems (27,28).
The possible role of cell transplantation has also been investi-gated. Early work did not appear to show promise, but recently ithas been shown that the cells may survive and there appears to beintegration with the host retina (29). If successful, it is the only cur-rent approach that would potentially restore vision.
2. Methods—Disorders
The tissue in which the gene is expressed is not necessarily the cellsystem in which clinically evident dysfunction occurs. For the pur-poses of this chapter, the disorders are considered according to themain structure affected by the disorder. In those cases in which morethan one structure is involved, it is the site of proposed primary dam-age that will be used. The retinal degenerations will be consideredunder the following groups: those primarily affecting photoreceptors;the retinal pigment epithelium, Bruch’s membrane, and the chorio-capillaris. Some disorders have been better characterized than othersand are used as illustrative examples. Not all inherited retinal degen-erations are reviewed, but appended to the end of the chapter is a listof all the inherited disorders with known loci and genes to date.Further information and references regarding these genes and locican be obtained from the Retinal Information Network (30).
2.1. Photoreceptor Dystrophies
2.1.1. Retinitis Pigmentosa
Donders described the fundus findings of this condition and firstused the term retinitis pigmentosa (RP) in 1855 (31). Through the

Ophthalmologists’ Perspective 261
years, many terms have been used to describe RP including tape-toretinal degeneration, primary pigmentary retinal degeneration,pigmentary retinopathy, and rod–cone dystrophy. RP is a essentiallya group of heterogeneous progressive retinal degenerations with acommon set of clinical characteristics comprising night blindness,constricted visual fields, pigment deposition in the outer retina, anda diminished or absent electroretinogram (ERG) (see Fig. 2).
RP affects approx 1 in 4000 of the general population and occursas autosomal dominant, recessive, X-linked or simplex forms(32,33). In addition, digenic inheritance has been reported (2).Mitochondrial disorders have also been described with progressiveretinal degeneration; for example, Kearns–Sayre syndrome.
3. Autosomal-Dominant RP (adRP)
The reported relative incidence of adRP ranges from 10 to 25%.The adRP group is reported on average to be milder and have a later
Fig. 2. The figure shows the typical features of intraretinal bone spi-cule pigmentation.

262D
ownes, C
hong, and Bird
Table 1Appendix of All Known Loci of Retinal Disorders to Date (May 1999) (30)
Location Disease Protein
1p31 Recessive Leber congenital amaurosis; recessive RP Retinal pigment epithelium-specific65 kD protein (RPE65)
1p21–p13 Recessive Stargardt disease, juvenile and late onset; ATP-binding cassette transporter—recessive MD; recessive RP; recessive fundus retina (ABC-R)flavimaculatus; recessive combined RPand cone–rod dystrophy
1q13–q23 Dominant RP1q25–q31 Dominant MD, age-related1q31–q32 Recessive ataxia, posterior column with RP1q31–q32.1 Recessive RP with paraarteriolar preservation
of the RPE (PPRPE)1q41 Recessive Usher syndrome, type 2a Novel protein with similarity to laminins
and cell adhesion molecules2p16 Dominant radial, macular drusen; Gene reported at ARVO 1999
dominant Doyne honeycomb retinal degeneration(Malattia leventinese)
2p14–p13 Recessive Alström syndrome2p11–p16 Recessive RP2q11 Recessive achromatopsia; Cone photoreceptor cGMP-gated cation
channel, alpha subunit2q31–q33 Recessive RP
262
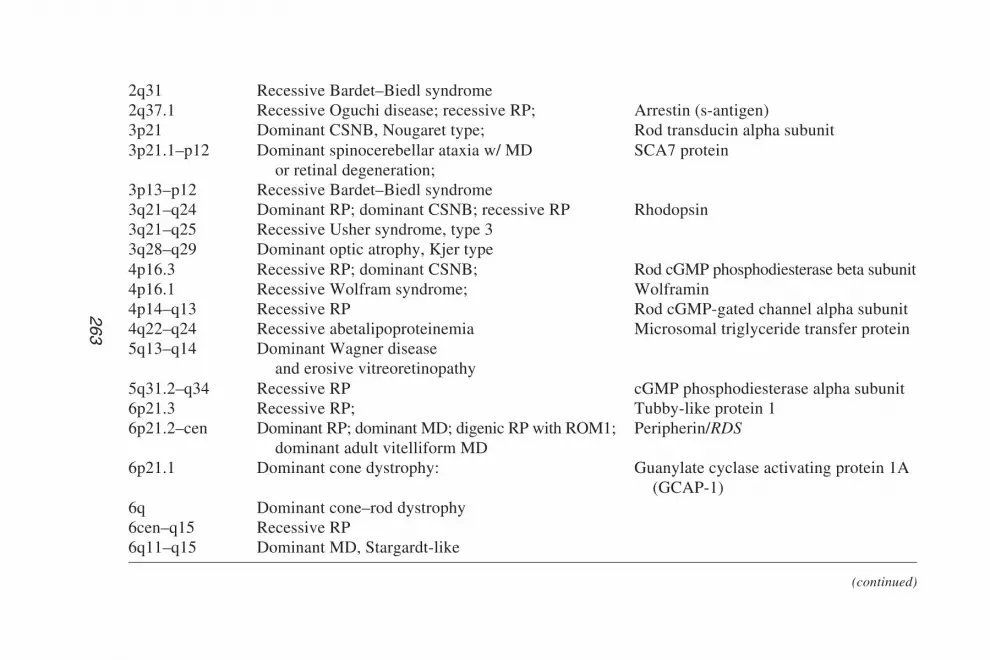
Ophthalm
ologists’ Perspective
2632q31 Recessive Bardet–Biedl syndrome2q37.1 Recessive Oguchi disease; recessive RP; Arrestin (s-antigen)3p21 Dominant CSNB, Nougaret type; Rod transducin alpha subunit3p21.1–p12 Dominant spinocerebellar ataxia w/ MD SCA7 protein
or retinal degeneration;3p13–p12 Recessive Bardet–Biedl syndrome3q21–q24 Dominant RP; dominant CSNB; recessive RP Rhodopsin3q21–q25 Recessive Usher syndrome, type 33q28–q29 Dominant optic atrophy, Kjer type4p16.3 Recessive RP; dominant CSNB; Rod cGMP phosphodiesterase beta subunit4p16.1 Recessive Wolfram syndrome; Wolframin4p14–q13 Recessive RP Rod cGMP-gated channel alpha subunit4q22–q24 Recessive abetalipoproteinemia Microsomal triglyceride transfer protein5q13–q14 Dominant Wagner disease
and erosive vitreoretinopathy5q31.2–q34 Recessive RP cGMP phosphodiesterase alpha subunit6p21.3 Recessive RP; Tubby-like protein 16p21.2–cen Dominant RP; dominant MD; digenic RP with ROM1; Peripherin/RDS
dominant adult vitelliform MD6p21.1 Dominant cone dystrophy: Guanylate cyclase activating protein 1A
(GCAP-1)6q Dominant cone–rod dystrophy6cen–q15 Recessive RP6q11–q15 Dominant MD, Stargardt-like
(continued)
263

264D
ownes, C
hong, and Bird
Table 1(continued)
Location Disease Protein
6q14–q16.2 Dominant MD, North Carolina type;dominant progressive bifocal chorioretinal atrophy
6q25–q26 Dominant retinal–cone dystrophy 17p21–p15 Dominant MD, cystoid7p13–p15 Dominant RP7q21–q22 Recessive Refsum disease, infantile Peroxisome biogenesis factor 17q31.3 Dominant RP7q31.3–32 Dominant tritanopia Blue cone opsin8q11–q13 Dominant RP8q13.1–q13.3 Recessive RP and/or recessive or dominant ataxianot 8q24 Dominant MD, atypical vitelliform9q34–qter Dominant RP with sensorineural deafness10 Recessive Usher syndrome, type 1f10p Recessive Refsum disease Phytanoyl-CoA hydroxylase10q Recessive Usher syndrome, type 1d10q21 Recessive nonsyndromal congenital retinal
nonattachment10q24 Recessive RPE degeneration Retinol-binding protein 410q24.3–q25.1 Dominant renal–coloboma syndrome Paired homeotic gene 210q26 Recessive gyrate atrophy Ornithine aminotransferase
264

Ophthalm
ologists’ Perspective
26511p15 Dominant atrophia areata; dominant chorioretinal
degeneration. helicoid11p15.1 Recessive Usher syndrome, Acadian11p12–q13 Dominant MD, Best type Bestrophin11q13 Recessive Bardet–Biedl syndrome11q13 Dominant RP; digenic RP with RDS Retinal outer segment membrane protein 1
(ROM-1)11q13–q23 Dominant familial exudative vitreoretinopathy11q13 Dominant neovascular inflammatory vitreoretinopathy11q13.5 Recessive Usher syndrome, Myosin VIIA
type 1; recessive congenital deafness without RP;recessive atypical Usher syndrome (USH3-like)
13q14.1–q14.2 Dominant germline or somatic retinoblastoma; Retinoblastoma protein 1benign retinoma; pinealoma; osteogenic sarcoma
13q34 Dominant MD, Stargardt type13q34 Recessive CSNB, Oguchi type Rhodopsin kinase14 Recessive RP (possibly)14 Recessive rod monochromacy or achromatopsia14q11.2 Dominant RP Neural retina lucine zipper14q24 Recessive Leber congenital amaurosis14q32 Recessive Usher syndrome, French15q22.3–q23 Recessive Bardet–Biedl syndrome15q24 Recessive retardation, spasticity
and retinal degeneration
(continued)
265

266D
ownes, C
hong, and Bird
Table 1(continued)
Location Disease Protein
15q26 Recessive RP; recessive Bothnia dystrophy; Cellular retinaldehyde-binding proteinrecessive retinitis punctata albescens
16p12.1 Recessive Batten disease Batten disease protein(ceroid-lipofuscinosis, neuronal 3), juvenile
16p12.1–p12.3 Recessive RP16q21 Recessive Bardet–Biedl syndrome, type 217p Dominant central areolar choroidal dystrophy17p13 Recessive Leber congenital amaurosis; Retinal-specific guanylate cyclase (Ret-GC)
dominant cone–rod dystrophy17p13–p12 Dominant cone dystrophy, progressive17p13.3 Dominant RP17q Cone–rod dystrophy17q22 Dominant RP17q25 Mouse recessive retinal degeneration;
protein: cGMP phosphodiesterase gamma subunit18q21.1–q21.3 Cone–rod dystrophy; de Grouchy syndrome19q13.2–q13.3 Recessive optic atrophy with ataxia
and 3-methylglutaconic aciduria19q13.3 Dominant cone–rod dystrophy; recessive, dominant Cone–rod otx-like photoreceptor homeobox
and “de novo” Leber congenital amaurosis;dominant RPtranscription factor (CRX)
266

Ophthalm
ologists’ Perspective
26719q13.4 Dominant RP20p12–p11.23 Dominant Alagille syndrome; Phospholipase-C-beta-421q21 Recessive Usher syndrome, type 122q12.1–q13.2 Dominant Sorsby's fundus dystrophy Tissue inhibitor of metalloproteinases-3
(TIMP-3)Xp22.3–p22.1 Retinoschisis X-linked retinoschisis 1 proteinXp22.13–p22.11 X-linked RP, dominantXp21–q21 RP with mental retardationXp21.3–p21.2 X-linked RPXp21.2 Oregon eye disease (probable cause); DystrophinXp21.1 X-linked RP; X-linked CSNB (possibly); Retinitis pigmentosa GTPase regulator
(RPGR)Xp11.4 X-linked cone dystrophy, 1Xp11.4–p11.3 X-linked CSNBXp11.4–p11.3 Norrie Disease; familial exudative vitreoretinopathy Norrie disease proteinXp11.4–p11.3 X-linked CSNBXp11.4–p11.2 X-linked optic atrophyXp11.4–q21 Åland island eye diseaseXp11.3 X-linked RP Novel protein with similarity
to human cofactor CXp11.3–p11.23 Retinal dysplasia, primaryXp11.23 X-linked CSNB, incomplete L-type voltage-gated calcium channel,
alpha-1 subunitXq13.3 RP with myopathy Phosphoglycerate kinase
(continued)
267

268D
ownes, C
hong, and Bird
268
Table 1(continued)
Location Disease Protein
Xq21.1–q21.3 Choroideremia Geranylgeranyl transferase Rab escortprotein 1 (REP-1)
Xq26–q27 X-linked RPXq27 X-linked progressive cone dystrophy, 2Xq28 Protanopia and rare dystrophy Red cone opsin
in blue cone monochromacyXq28 Deuteranopia and rare retinal dystrophy in blue cone Green cone opsin
monochromacy

Ophthalmologists’ Perspective 269
onset than other inherited groups. However, it is becoming clearerthat the severity of disease depends on the gene, and the positionand character of the mutation in the gene.
Because the first description of a P23H rhodopsin mutation byDryja et al. in 1991 (34), over 70 different mutations in rhodopsinhave been linked to autosomal dominant and recessive RP and con-genital stationary night blindness. Mutations in rhodopsin accountfor over 25% of adRP in large families (17,35,36). If smaller fami-lies are analyzed, the figure falls to 10%. To date, nine mapped lociand three genes have been associated with adRP. The three genesare rhodopsin (34), peripherin/RDS (37), and the neural retina leu-cine (NRL) gene (38).
The great majority of mutations in rhodopsin are short-lengthmutations affecting less than 20 basepairs. Of these, 90% are basesubstitutions and there are a few nonsense mutations; otherwise, allare missense mutations. The remaining 10% are deletions or inser-tions. Two families have been described with autosomal recessiveinheritance. Polymorphisms have been found in the noncodingregion of the gene and several sequence variants have been found inthe rhodopsin gene in the homozygous state not giving rise todisease (17).
In vitro functional assays of rhodopsin mutations performed bySung et al. showed that rhodopsin mutations tended to fall into twotypes as set out here. Class I mutations resemble wild-type opsinin their site of expression and ability to bind in vitro to 11-cis-reti-nal; these mutations are usually clustered at the carboxyl end. Incontrast, class II are associated with opsin accumulation in the roughendoplasmic reticulum and there is no evidence of a photolabilepigment (39,40). As 80% of rod outer segment protein is rhodopsin(41), it has been suggested that large quantities of structurally alteredmutant protein may lead to photoreceptor degeneration (42). Thishypothesis is supported by examining recessive RP with a nullmutation in rhodopsin (43). In this case, the photoreceptor remainsrelatively healthy with only 50% of normal rhodopsin present in theheterozygous carriers of the null mutation. It would appear thatabsence of the mutant product in the presence of 50% of the normal

270 Downes, Chong, and Bird
protein appears to be well tolerated. It can be postulated that for theheterozygous state, it may be the presence of the mutant protein thatis causing disease.
It is clear from studies of the rhodopsin molecule that certaindomains are more critical than others. Lys296Glu is an example ofthis, as it is located at the 11-cis-retinal binding site, and gives riseto severe disease (44). With more information regarding the bio-chemistry and structure of the gene product, it should be possible topredict whether a certain mutation will exert a specific effectbecause of its character or position. However, this is not always thecase, the investigation of the effect of the codon 296 mutation is agood example. The effect of mutant protein in vivo appears to bedifferent from that of in vitro studies. In vitro findings suggested aconstitutive activation of transducin by these alleles (45), but noevidence for such a mechanism was found by in vivo studies andLys296Glu opsin was phosphorylated and bound to arrestin nor-mally in transgenic animals (46).
Li et al. examined the retina in adRP associated with a threonine-17-methionine rhodopsin mutation using histopathology and immuno-cytochemistry. This is a mutation that gives rise to inferior retinalinvolvement. By using immunocytochemistry with rod-specificmarkers, they found that rods were qualitatively normal in the supe-rior mid- to far-peripheral retina. Electron microscopic immunogoldlabeling with antirhodopsin revealed similar densities of gold par-ticles over rod outer segments of the RP and a normal donor retina.Degenerate photoreceptors in the superior equatorial region of theRP retina had short outer segments, and some rods had surfacelabeling with antirhodopsin of the inner segments, somata, and syn-apses. The results indicate regional retinal differences of diseaseseverity in this genotype, and show that rods in the superior periph-eral retina have normal morphology despite the presence of themutant allele (47).
Generation of transgenic animals with rhodopsin mutations hashelped in elucidating the basis of the retinal degeneration seen inthese mutations (48,49). Li et al. investigated the rhodopsintransgenic pig retina with the P347S mutation and found that this

Ophthalmologists’ Perspective 271
model shared many cytologic features with human retinas withretinitis pigmentosa (48). Altered cAMP levels in retinas were foundin these transgenic mice expressing P347S mutant rhodopsin sug-gesting that mutants of rhodopsin are mistargeted to the rod innersegment, raising the possibility that rhodopsin triggers apoptosisthrough activation of signaling pathways not normally under its con-trol (48). Such models provide an opportunity to examine the earli-est stages in photoreceptor degeneration, about which little is knownin humans.
Models of retinitis pigmentosa using rhodopsin transgenic ani-mals to assess the effect of gene therapy are now being used andhave the advantage that they reproduce the degenerative disease,but the course is over several weeks to months, making it easier toobserve beneficial effects, if produced.
Mutations in peripherin/RDS have been associated with a widerange of phenotypes including adRP, pattern dystrophy (a disordercharacteristically affecting the retinal pigment epithelium), CORD,COD, and fundus flavimaculatus (37,50–55). To date, more than30 different mutations have been described (55). Several genotype–phenotype correlation studies have been carried out showing thatthis gene can be associated with a high degree of phenotypic vari-ability even within the same family (5). In contrast, the codon172 mutation appears to have a more consistent phenotype (6,7).
Peripherin/RDS is a structural protein in the disc rim of the outersegment disks. It was first identified in bovine disk membranesusing monoclonal antibodies (56), and was subsequently cloned(57). Its importance in outer segment morphology was confirmedby cellular and molecular analysis of the retinal degeneration slowmouse (rds). Jansen and Sanyal showed that mice homozygous forthe rds mutation failed to develop outer segments and the photo-receptors underwent slow degeneration. In the heterozygous state,the outer segments are short and highly disorganized (58). Travis et al.used subtractive hybridization techniques to identify a mutation in aphotoreceptor specific gene (59).
The mechanism by which mutations in peripherin/RDS cause spe-cific phenotypes has been examined by using a heterologous cell

272 Downes, Chong, and Bird
expression system (55). Molday et al. findings suggest that the largeintradiscal loop is important in subunit to subunit interactions. Theyinvestigated the R172W peripherin/RDS mutation that, in general,does not exhibit rod involvement. They found that the mutant pro-tein folds normally and assembles with ROM-1. By contrast, mutantproteins causing retinitis pigmentosa do not form dimers with ROM-1.Digenic ROM-1/peripherin/rds disease was also analyzed. Using aROM-1 knockout mouse and rds mouse they undertook compara-tive analysis and concluded that peripherin/RDS is the dominantsubunit required for disk morphogenesis and that ROM-1 had a moreminor role (55).
Recently, mutations in NRL zipper protein have been identifiedas causing RP. NRL is a retinal transcription factor that interactswith CRX and promotes transcription of rhodopsin and other retinalgenes. It is a gene that codes for a basic motif leucine zipper, bZIP,that is highly and specifically expressed in adult retina. Cell-culturestudies were performed to compare levels of transcription ofrhodopsin in the mutant and wild state, and it was shown thatrhodopsin is overexpressed with low levels of NRL in cell systems (38).
Although there are now three known genes associated with adRP,there are a number of genes yet to be identified. In adRP, associatedwith chromosomes 19q and 7p, the genes are not yet known. In thesetwo conditions, there is markedly variable expressivity with incom-plete expression in some generations. Molecular genetics can behelpful here with haplotype analysis that can be performed to assistthe clinician in genetic counselling (60,61). These two types of adRPare of interest because of the significant variation in expressivity.Further investigation may lead to an explanation for this phenomenon.
4. Autosomal Recessive (arRP)
This is the most common mode of inheritance. The incidence isparticularly high in isolated communities and where consanguinityis common. The majority of “simplex” and “multiplex” cases areassumed to be autosomal recessive RP. There is large variation ofseverity and age of onset, although in autosomal recessive RP vision

Ophthalmologists’ Perspective 273
tends to cause early onset disease progressing to severe visual handi-cap by the fourth decade. However, mild autosomal recessive dis-ease exists. A number of genes have been found associated witharRP. They include RPE65 (62) rod cGMP phosphodiesterase betasubunit (63), rod cGMP-gated channel alpha subunit (64), cGMPphosphodiesterase alpha subunit (65), and tubby-like protein 1 (66).No good phenotypic characterization is available as yet.
5. Leber Congenital Amaurosis (LCA)
Early onset severe retinal degenerations are known as LCA and areclassically inherited as autosomal recessive disorders. Nonallelic het-erogeneity has been proved in LCA with mutations in the RETGC (67),RPE 65 (68), and CRX genes (69). Most of the LCA patients withRETGC and RPE 65 mutations are homozygotes or compound het-erozygotes. De novo mutations have been reported in RPE 65 and CRXthat may indicate dominant disease (70,71). Little is known of thedisease mechanisms, except for RPE 65, which appears to importantin generating 11-cis retinal to make it available within the RPE (72).
6. X-Linked Recessive (xlRP)
The reported relative incidence of X-linked RP of all types ofRP ranges from 8 to 20%. As a group, it is consistently severe, ofearly onset, and associated with myopia. The retinitis pigmentosaGTPase regulator (RPGR) (RP3) (73) and human cofactor C (RP2)(74) are mutated in xlRP. The functions of these genes are notfully understood.
7. Digenic RP
A combination of mutations at the peripherin/RDS and ROM-1loci has been shown to produce an RP phenotype (2).
7.1. Cone and Cone–Rod Dystrophies
Cone dystrophies are characterized by progressive dysfunctionof the photopic system with preservation of scotopic function; most
274 Downes, Chong, and Bird
cone dystrophies present themselves in childhood or early adult-hood. In late disease, rod photoreceptor involvement can be demon-strated in a proportion of cases (75). For this reason, cone andcone–rod dystrophies are often considered together.
Common symptoms in cone dystrophy include photophobia, lossof visual acuity, color vision, and central visual fields. Electro-diagnostic tests are used to distinguish cone, cone–rod, and maculardystrophies. Simplex cases are most commonly reported followedby autosomal dominant inheritance, and autosomal recessive;X-linked forms are also described. Genetic studies, to date, haveshown that autosomal dominant cone and cone–rod dystrophies aregenetically heterogeneous with 13 different genomic regions so farreported. Four genes have been described in cone and cone–rod dys-trophies and include peripherin/RDS (52,53) GUCA1A associatedwith autosomal dominant cone dystrophy (76), GUCY2D associ-ated with cone–rod dystrophy (77), and CRX associated with auto-somal dominant cone-rod dystrophy (69).
Recent cell-culture mutagenesis systems have demonstrated in thecase of the mutation in GUCA1A gene that the mutant Y99Cguanylate cyclase activating protein 1 (GCAP-1) becomes unrespon-sive to increasing levels of calcium that would normally inhibit it.Dizhoor et al. produced recombinant Y99C GCAP-1 mutant andtested its ability to activate retGC in vitro at various concentrations ofcalcium (78). The mutant did not decrease the ability of GCAP-1 toactivate retGC; in fact, the RetGC stimulated by the mutant remainedactive even when calcium levels dropped to a level which would nor-mally render the GCAP-1 inactive. Thus, retGC becomes constitu-tively active. This would presumably result in inappropriately highlevels of cyclic GMP. Evidence exists that continuously high levelsof cGMP can cause photoreceptor cell death (79). In addition, immu-nohistochemical staining for GCAP-1 in cones in human retinas dem-onstrated intense staining of both the outer and inner segment throughcell body, axon to pedicle. Weaker immunoreactivity was observedin the rod inner segments, and the rod outer segments were very mini-mally immunostained (80). Therefore, it is predictable that the disor-der would affect cone more than rod photoreceptors.

Ophthalmologists’ Perspective 275
Mutations in RETGC-1 (GUCY2D) are associated with autosomaldominant cone–rod dystrophy in the heterozygous state (77). Workis currently under way to examine the function of the mutant proteinin the heterozygous state. This will be interesting particularly inview of the intimate relationship between GCAP and RETGC in thephototransduction cascade.
CRX is a photoreceptor specific transcription factor that is asso-ciated with regulatory control of rhodopsin and the expression ofother photoreceptor-specific genes during embryonic developmentand during adult life. Mutations in the gene CRX cone-rod homeo-box gene located on chromosome 19q13.3 are associated with auto-somal dominant cone–rod dystrophy, recessive, dominant and de novoLeber congenital amaurosis (71). Expression studies have identi-fied that CRX is highly expressed in developing and adult mice reti-nas and binds to sites in the rhodopsin, interphotoreceptor retinoidbinding protein, -phosphodiesterase, and arrestin promotors (69).That this gene is important in both early and adult gene regulation issupported by the early onset Leber congenital amaurosis (LCA) andCORD seen in patients with mutations in this gene. Further bio-chemical in vitro and genetically engineered animal studies will helpelucidate the mechanism of disease.
7.2. Congenital Stationary Night Blindness (CSNB)
CSNB is a heterogeneous group of disorders characterized bypoor night vision that is life-long and described as nonprogressive.Dark adaptation may be absent or markedly prolonged. X-linkedinheritance is the most common pattern in CSNB. Autosomal reces-sive and dominant forms are also seen. Oguchi disease and fundusalbipunctatus are distinct forms of CSNB.
CSNB is usually classified into two distinct groups according tothe electrophysiological findings. In type I, there is no rod a-wavesuggesting a defect inherent in the rods themselves. A missensemutation in the gene of alpha-subunit of rod transducin is one ofthe genes responsible for the autosomal dominant form of type ICSNB (81). Rod cGMP phosphodiesterase beta is also a disease

276 Downes, Chong, and Bird
causing gene in the heterozygous or homozygous state. It is associ-ated with recessive RP and dominant CSNB (82,83). The gene hasbeen cloned and the same gene is responsible for the rd-mouse andthe Irish red setter dog retinal degeneration (84). Rhodopsin muta-tions give rise to dominant CSNB, as well as dominant and reces-sive RP (45,85). There is evidence that these mutations causerhodopsin to be constitutively active such that the retina wouldbehave as if it is in constant light.
In type II, the ERG is negative (a relative preservation of a-waveas compared with b-wave—Schubert-Bornschein type). The defectis presumed to indicate a posttransductional abnormality. Type IIhas been subdivided into complete and incomplete types. The com-plete type shows no rod function. In the incomplete variety, rodfunction is reduced but present. A mutation in the gene encoding avoltage-gated calcium channel that may decrease neurotransmitterrelease from photoreceptor presynaptic terminals has been identi-fied in X-linked type II incomplete CSNB (86).
Oguchi disease is a rare autosomal recessive form of CSNB char-acterized by a golden/gray-white discoloration of the retina givingrise to a metallic sheen to the back of the eye. This disappears whenthe fundus is viewed after some time in the dark and has becomeknown as the Mizuo phenomenon. Visual acuity, color vision, andvisual fields are usually normal in Oguchi disease. Dark adaptationof the rods is extremely delayed, but cone photoreceptors appear toreact normally. As in type II CSNB, the ERG is negative. Two genesinvolved in Oguchi disease have been identified and include:arrestin (87) and rhodopsin kinase (88). The arrestin mutations aremore common in Japanese Oguchi disease, and rhodopsin kinase inEuropean Oguchi disease. There is no good explanation why thesemutations should give rise to a negative ERG or a yellow sheen.
7.3. Stargardt Disease/Fundus Flavimaculatus
Stargardt disease (juvenile macular degeneration) was firstdescribed by Stargardt in 1909 (89). His classification stipulatedthat the central area of the macula was affected by typical fleck-likedeposits at the level of the retinal pigment epithelium (RPE) in a

Ophthalmologists’ Perspective 277
ring-shaped pattern associated with depigmentation and atrophy ofthe RPE. Childhood onset, autosomal recessive inheritance, and pro-gressive bilateral central visual loss are also key features that hedescribed (see Fig. 3).
The term fundus flavimaculatus was introduced by Franceschettiand François, in 1965 to describe a fundus appearance character-ized by ill-defined yellowish spots in the deeper retinal layers of theposterior pole of the eye (90). As similar flecks had been previouslydescribed in Stargardt disease, it is impractical to separate these twoconditions.
Linkage in families and individuals with fundus flavimaculatusand Stargardt disease was demonstrated to chromosome 1p13 (91)suggesting that these two disorders were the same, but exhibitingphenotypic variation. Since the discovery of the ABCR transportergene, mutations in this gene segregating with fundus flavimaculatusand Stargardt disease (92) show that consideration of these two dis-orders as a spectrum of the same disease was justified.
Fig. 3. The figure shows the typical flecks with increased levels ofautofluorescence in the location of the flecks. Picture courtesy of NoemiLois, MD.

278 Downes, Chong, and Bird
Some cases of autosomal dominant Stargardt disease have beendescribed in the literature, but these are not common. The pheno-type has been seen both with peripherin/RDS mutations and in fami-lies with linkage to loci 6q (93) and 13q34 (94). These sharephenotypic similarities.
Color vision may be affected in this condition. In particular, theremay be abnormalities in the red–green axis. On autofluorescenceimaging, the pale flecks have increased autofluorescence and the areasof atrophy are dark. Dysfunction is usually restricted to the macula,but general photopic and scotopic losses may occur. Dark adapta-tion has been described as slow in the intact peripheral retina. Fluo-rescein angiography, usually demonstrates a lack of choroidalfluorescence known as a “dark or silent choroid.” This has beenexplained by the even deposition of abnormal material at the levelof the pigment epithelium that absorbs blue–green light. Flecks ofrecent origin do not show hyperfluorescence, but areas of RPE atro-phy exhibit it.
These changes start to develop in childhood. At the site of previouswhite lesions, atrophy of the pigment epithelium occurs. Fluoresceinangiography shows multifocal hyperfluorescence corresponding tothe areas of pigment epithelial atrophy (95) (see Fig. 3).
A histopathological study showed accumulation of a substance inthe inner half of the cells of the RPE (96). This substance wasidentified as an acid mucopolysaccharide, with lipofuscin andmelanolipofuscin.
The gene has been shown to express in rods and the protein islimited to the margins of the outer-segment disks. The ABCRprotein is thought to transport 11-cis and all-trans retinal in and outof the disk membrane and is considered important in rhodopsinregeneration (97).
7.4. X-Linked Juvenile Retinoschisis
X-linked juvenile retinoschisis is a relatively rare disorder, withsymptoms and signs usually occurring in preteens. Inheritance isX-linked recessive. The phenotype of this condition varies in sever-ity from family to family and also within each family.

Ophthalmologists’ Perspective 279
Patients usually experience difficulty in seeing in detail andreport a decrease in central vision. Visual loss tends to become lessprogressive by the late teens. The pattern of the central abnormalityhas been likened to the appearance of bicycle-spokes. These radialstriations are particularly apparent early in disease. In older patients,the bicycle-spoke pattern may become replaced by atrophic changes.In approximately half of these cases, the central abnormalities arethe only feature.
Linkage studies have localized the retinoschisis gene XLRS1 tothe distal short arm of Xp22.1-p22.3 (98). Using positional cloning,the gene has been identified (99). DNA analysis can help detect thecarrier state. Appropriate DNA probes can be used to identify car-rier status if DNA is available from the possible carrier and severalfamily members, including an affected male.
An inherent structural defect in the Müller cells is suggested byultrastructural studies of the Müller cells (100). However, the geneis expressed in photoreceptor cells and it is thought that the proteinis exported into the extracellular space. How this gives rise to thephenotype is unknown as yet.
8. Diseases of the Retinal Pigment Epithelium,Bruch’s Membrane and Choroid
8.1. Best Disease
Best disease, otherwise known as vitelliform dystrophy, is anautosomal dominant condition characterized by early-onset macu-lar degeneration in the form of yellow deposits that are usuallybilateral and symmetrical (see Fig. 4). Phenotypic variation is wellrecognized and about half of those with the abnormal gene havegood vision throughout life and normal or near-normal fundi (101).Visual acuity tends to remain quite good and in some individualsmay become fairly static. Choroidal neovascularization, and occa-sionally macular holes, have been reported in association with Bestlesions. If these occur, or atrophic changes of the retinal pigmentepithelium secondary to the vitelliform lesion, central visual acuity

280 Downes, Chong, and Bird
Fig. 4. Figure 4A shows a cLSO image of the typical egg yolk-typelesions seen in a 10-yr-old child demonstrating high levels of auto-fluorescence. Figure 4B shows another Best lesion in a 70-yr-old adult,again showing increased levels of autofluorescence within the lesion.

Ophthalmologists’ Perspective 281
may be affected. An absent or severely diminished light rise of theelectrooculogram is the hallmark of the disease.
The gene is located on chromosome 11p12-q13 and is calledbestrophin and has been cloned. It is known to be retinal-specific,and expressed exclusively in the RPE (102,103). It may be involvedin the metabolism and/or transport of polyunsaturated fatty acids.O’Gorman et al. examined an eye affected by Best with histopathol-ogy (104). RPE cells across the entire fundus were seen with anexcessive amount of lipofuscin as defined by ultrastructural appear-ance, autofluorescence studies, and staining properties. Lipofuscinaccumulation was particularly notable in some pigment epithelialcells in the fovea. Their findings were consistent with Best’svitelliform macular dystrophy representing a generalized disorderof the pigment epithelium that secondarily affects focal areas ofthe retina.
8.2. Gyrate Atrophy of the Choroid and Retina
Gyrate atrophy (GA) is a rare autosomal recessive disorder char-acterized by elevated levels of serum ornithine (105) caused byreduced activity of ornithine aminotransferase (OAT), a mitochon-drial matrix enzyme (106). It is supposed that high levels of circu-lating ornithine levels damage tissues, including the eye. Patientswith GA usually have myopia and night blindness during the firstdecade of life, although phenotypic variation exists. Progressivevisual field constriction with central visual loss leads to blindnessby the fifth or sixth decade of life. The fundal appearance showssharply demarcated circular regions of chorioretinal dystrophy inthe midperiphery that become confluent and extend anteriorly andposteriorly (107) (see Fig. 5).
The chromosomal localization of the human OAT gene was linkedto 10q26 (108). Over 50 different mutations in the OAT gene,including missense mutations, nonsense mutations, deletion, andsplice acceptor mutation, were identified leading to GA (109,110).The combination of PCR amplification of the gene sequences,denaturing gradient gel electrophoresis (DGGE) analysis, and direct

282 Downes, Chong, and Bird
sequencing can be used to detect mutations in GA cases (111). Theserum ornithine levels can be lowered in some patients with GA bypyridoxine (vitamin B6), and the progress of the disease slowed bydietary restriction. The genotypes are known in some of thesepatients (112). This is a potential role for molecular analysis allow-ing clinicians to target therapy.
A clinicopathologic study of GA showed the retina in the posteriorpole had focal areas of photoreceptor atrophy with adjacent retinal pig-ment epithelial hyperplasia (113). An abrupt transition from the near-normal retina to a zone of near-total atrophy of the retina, RPE, andchoroid was present in the midperiphery. Although every cell carriesthe genetic defect, for some reason, only the RPE is primarily affected.
Knockout mice lacking OAT were shown to have retinal degen-eration (114,115). The primary disease was found to be in the reti-nal pigment epithelium, which is followed by photoreceptordegeneration (115). Retrovirus (116) and adenovirus (117) havebeen used as vectors for gene transfer of OAT into human cells.
Fig. 5. The figure shows typical atrophy with scalloped edges.
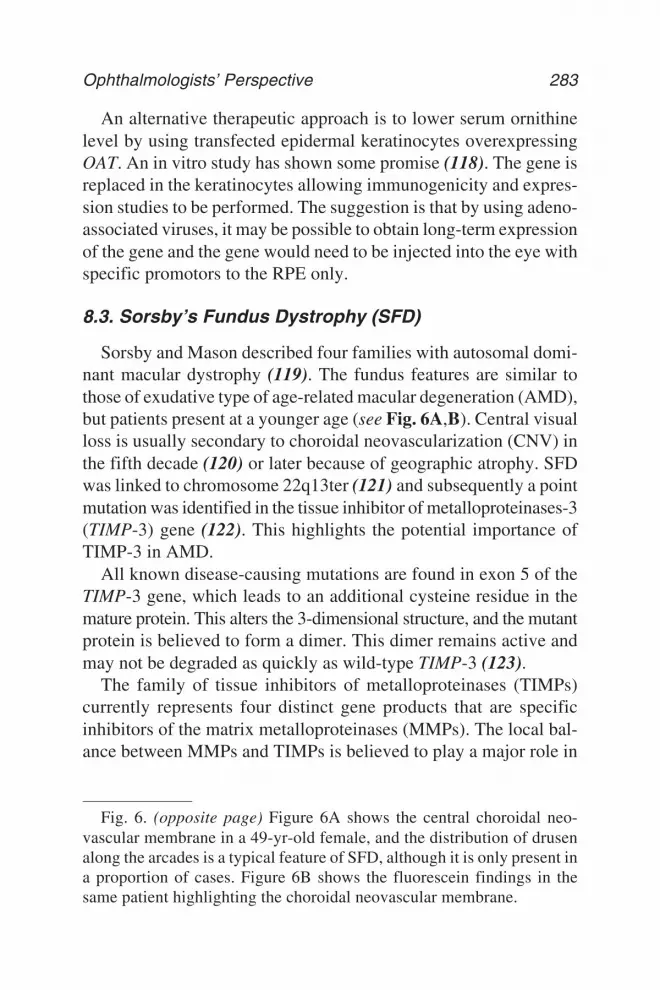
Ophthalmologists’ Perspective 283
An alternative therapeutic approach is to lower serum ornithinelevel by using transfected epidermal keratinocytes overexpressingOAT. An in vitro study has shown some promise (118). The gene isreplaced in the keratinocytes allowing immunogenicity and expres-sion studies to be performed. The suggestion is that by using adeno-associated viruses, it may be possible to obtain long-term expressionof the gene and the gene would need to be injected into the eye withspecific promotors to the RPE only.
8.3. Sorsby’s Fundus Dystrophy (SFD)
Sorsby and Mason described four families with autosomal domi-nant macular dystrophy (119). The fundus features are similar tothose of exudative type of age-related macular degeneration (AMD),but patients present at a younger age (see Fig. 6A,B). Central visualloss is usually secondary to choroidal neovascularization (CNV) inthe fifth decade (120) or later because of geographic atrophy. SFDwas linked to chromosome 22q13ter (121) and subsequently a pointmutation was identified in the tissue inhibitor of metalloproteinases-3(TIMP-3) gene (122). This highlights the potential importance ofTIMP-3 in AMD.
All known disease-causing mutations are found in exon 5 of theTIMP-3 gene, which leads to an additional cysteine residue in themature protein. This alters the 3-dimensional structure, and the mutantprotein is believed to form a dimer. This dimer remains active andmay not be degraded as quickly as wild-type TIMP-3 (123).
The family of tissue inhibitors of metalloproteinases (TIMPs)currently represents four distinct gene products that are specificinhibitors of the matrix metalloproteinases (MMPs). The local bal-ance between MMPs and TIMPs is believed to play a major role in
Fig. 6. (opposite page) Figure 6A shows the central choroidal neo-vascular membrane in a 49-yr-old female, and the distribution of drusenalong the arcades is a typical feature of SFD, although it is only present ina proportion of cases. Figure 6B shows the fluorescein findings in thesame patient highlighting the choroidal neovascular membrane.

284 Downes, Chong, and Bird
Fig. 6.

Ophthalmologists’ Perspective 285
extracellular matrix remodeling during development and in disease.Unlike the other TIMPs, which are soluble, TIMP-3 is unique inbeing a component of the extracellular matrix.
TIMP-3 transcripts have been demonstrated in cultured humanRPE, choroidal microcapillary endothelium, and pericytes (124).RPE cells also express and secrete TIMP-3 protein, which waslocalized to the extracellular matrix and was not found in the cul-ture medium; TIMP-1 and TIMP-2 were found almost exclusivelyin the medium. TIMP-3 is present in Bruch's membrane, the elasticlayer of some choroidal vessels and the basement membrane of thenonpigmented ciliary epithelium. Fariss et al. have also foundTIMP-3 in Bruch’s membrane. Using the same techniques, TIMP-1was noted to be absent and TIMP-2 was barely detectable in Bruch’smembrane. It therefore appears that TIMP-3 is the main TIMP in
Fig. 6. (continued) Figure 6C shows TIMP-3 immunohistochemistryin Sorsby fundus dystrophy (×400). Histopathology shows gross thicken-ing of Bruch membrane and retinal degeneration. The entire Bruch mem-brane is immunopositive for TIMP-3.

286 Downes, Chong, and Bird
Bruch’s membrane (125). Light microscopy showed a layer of lipid-positive floccular deposit, which was up to 30 µm in thickness, onthe inner aspect of Bruch’s membrane. This could represent anextreme example of Bruch’s membrane thickening, which is com-mon in AMD patients (126). The distribution of TIMP-3, elastin,and collagen in eyes from an SFD donor has been recently reported(127). TIMP-3 immunoreactivity was present in the subretinal epi-thelial deposit. There were also multiple breaks in Bruch’s mem-brane with CNV formation (see Fig. 6C). Electron microscopyrevealed a morphologically altered elastic layer of Bruch’s mem-brane. Furthermore, the distribution of TIMP-3 and elastin wereremarkably similar. It was suggested that TIMP-3 might play a rolein the metabolism of elastin. The altered elastic layer of Bruch’smembrane might have weakened the Bruch’s membrane leading tomultiple break formation.
8.4. Choroideraemia
Choroideraemia (tapetochoroidal dystrophy, TCD), a commonform of X-linked blindness, is characterized by progressive and pro-found atrophy of the choroid, RPE, and inner retina (see Fig. 7).Heterozygotes show pigmentary change and may lose vision inmiddle to late life. The TCD gene was found to be linked to theXq21 region (128). By making use of reverse genetics strategies,Cremers et al. isolated eight overlapping complementary DNAclones from the same chromosomal region (129). The correspond-ing gene is expressed in retina, choroid, and RPE. The cDNAencompass an open reading frame of 948 basepairs that is structur-ally altered in eight TCD patients with deletions, and in a femalepatient with a balanced translocation involving Xq21.
The Rab geranylgeranyl transferase (GG transferase) from ratbrain contains two components, A and B. The holoenzyme attaches3H-geranylgeranyl to cysteines in two GTP-binding proteins,Rab3A and Rab1A. Six peptides from rat component A show strik-ing similarity to the product of the defective gene in choroideremia(130). The choroideremia protein resembles Rab3A guanine nucle-

Ophthalmologists’ Perspective 287
otide dissociation inhibitor (GDI), which binds Rab3A (130). Thiswas confirmed by cDNA cloning (131).
In biochemical assays, component A binds unprenylated Rab1A,presents it to the catalytic component B, and remains bound to it afterthe geranylgeranyl transfer reaction (131). In the absence of deter-gents, the reaction terminates when all of component A is occupiedwith prenylated Rab. Detergents allow multiple rounds of catalysis,apparently by dissociating the component A-Rab complex and thusallowing recycling of component A. Within the cell, component Amay be regenerated by transferring its prenylated Rab to a proteinacceptor, such as Rab3A GDI. In view of its function in escortingRab proteins during and presumably after the prenyl transfer reac-tion, component A was renamed as Rab escort protein (REP) (131).
A related gene, which was designated as choroideremia-like,encodes a protein that closely resembles REP-1. This protein was
Fig. 7. The figure shows a fluorescein angiogram in a 39-yr-old indi-vidual highlighting the typical loss of RPE and choriocapillaris withretention of islands of tissue.

288 Downes, Chong, and Bird
named REP-2 (132). The two proteins were approximately equal infacilitating the attachment of GG groups to several Rab proteins,including Rab1A, Rab5A, and Rab6. However, REP-2 was only25% as active as REP-1 in supporting GG attachment to Rab3A andRab3D. The low activity toward Rab3A was increased to that ofRab1A when the COOH-terminal 12 amino acids of Rab3A werereplaced with the corresponding residues of Rab1A. REP-2 mightsubstitute for the absent function of REP-1 in nonretinal cells ofpatients with choroideremia, thus preventing cellular dysfunctionthroughout the body. In the retina, REP-2 may be only partiallyeffective, leading eventually to retinal degeneration and blindness (132).
As nearly all known mutations in the CHM gene create stopcodons that truncate the protein product and result in absence ofREP-1 (133), this has led to a simple test for CHM. The clinicaldiagnosis of CHM can be confirmed simply by immunoblot analy-sis with anti-REP-1 antibody, showing the absence of REP-1 pro-tein in peripheral blood samples (134) or the use of the proteintruncation test (PTT) applied to lymphocyte RNA derived fromaffected males (135).
A gene-targeting approach was used to disrupt the mouse chm/rep-1gene. Chimaeric males transmitted the mutated gene to their carrierdaughters but, surprisingly, these heterozygous females had neitheraffected male nor carrier female offspring because of lethality inmale embryos; in female embryos, it is also lethal if the mutation isof maternal origin (136).
9. Syndromal
Most of these syndromes are of autosomal recessive inheritancepattern for which gene augmentation approaches would seem logi-cal. However, in the syndromal RP group, the target cells are notjust those of the retina. A more wide-ranging therapeutic approachwould need to be employed. There is a whole group of rare andvarious syndromes of which we have selected some examples.Mitochondrial disorders have been described in association withpigmentary retinopathy and maculopathy, but are not dealt with here.

Ophthalmologists’ Perspective 289
9.1. Usher Syndrome
Usher syndrome represents the association of a hearing impair-ment with retinitis pigmentosa, and is the most frequent cause ofdeafness associate with blindness in humans. It is inherited as anautosomal recessive trait that is clinically and genetically hetero-geneous. Some patients show abnormal organization of micro-tubules in the axoneme of their photoreceptors cells (connectingcilium), nasal cilial cells, and sperm cells, as well as widespreaddegeneration of the organ of Corti.
Usher syndrome type 1 (USH1) is characterized by a profoundcongenital sensorineural hearing loss, constant vestibular dysfunc-tion and prepubertal onset of retinitis pigmentosa. Of three differentgenes responsible for USH1, USH1B maps to 11q13.5 (137) andaccounts for about 75% of USH1 patients. The mouse deafnessshaker-1 (sh1) mutation has been localized to the homologousmurine region. Weil et al. considered the human homolog as a goodcandidate for the gene that is defective in USH1B, following theidentification of a gene encoding an unconventional myosin as acandidate for shaker-1 (138). The gene-encoding myosin VIIA wasfound to be responsible for USH1B (139). Two different pre-mature stop codons, a six-basepair deletion and two different mis-sense mutations were detected in five unrelated families. In one ofthese families, the mutations were identified in both alleles. Thesemutations, which are located at the amino-terminal end of the motordomain of the protein, are likely to result in the absence of a func-tional protein. Thus USH1B appears as a primary cytoskeletalprotein defect.
Using antibodies specific to the tail portion of this unconventionalmyosin, myosin VIIa was expressed in cochlea, retina, testis, lung,and kidney. In cochlea, myosin VIIa expression was restricted tothe inner and outer hair cells, where it was found in the apical ste-reocilia, as well as the cytoplasm. In the eye, myosin VIIa isexpressed by the RPE cells, where it was enriched within the apicalactin-rich domain of this cell type. The cell-specific localization ofmyosin VIIa suggests that the blindness and deafness associated

290 Downes, Chong, and Bird
with Usher syndrome is caused by lack of proper myosin VIIa func-tion within the cochlear hair cells and the RPE cells.
In Usher type II, USH2A localized to 1q41 (140), the responsiblegene is a protein within the extracellular matrix and similar tolaminins and cell-adhesion molecules in sequence (141). The func-tion of this protein remains unknown.
Usher III is confined to a distinct genetic group and is character-ized by progressive hearing and visual loss and the gene has beenlocalized to chromosome 3 (142).
9.2. Refsum Syndrome
Refsum disease is an autosomal recessive disorder characterizedby retinitis pigmentosa, peripheral polyneuropathy, cerebellarataxia, and increased cerebrospinal fluid protein. Biochemically, thedisorder is defined by two related properties: pronounced accumu-lation of phytanic acid and selective loss of the peroxisomaldioxygenase required for alpha-hydroxylation of phytanoyl-CoA2.Decreased phytanic acid oxidation is also observed in human cellslacking PEX7, the receptor for the type-2 peroxisomal targeting sig-nal (PTS2), suggesting that the enzyme defective in Refsum diseaseis targeted to peroxisomes by a PTS2.
Human phytanoyl-CoA alpha-hydroxylase (PAHX) is targetedto peroxisomes, requires the PTS2 receptor for peroxisomal local-ization, interacts with the PTS2 receptor in the yeast two-hybridassay, and has intrinsic PAHX activity that requires the dioxy-genase cofactor iron and cosubstrate 2-oxoglutarate. The use ofradiation hybridization places the PAHX on chromosome 10(143) in a region implicated in Refsum disease by homozygositymapping (144).
Sequence analysis of PAHX fibroblast cDNA from five patientswith Refsum disease revealed distinct mutations, including a one-nucleotide deletion, a 111-nucleotide deletion, and a point mutation(145). Moreover, transfection of skin fibroblasts from two RDpatients with wild-type PAHX gene restored the activity for alpha-oxidation of phytanic acid (146).

Ophthalmologists’ Perspective 291
9.3. Infantile Refsum Disease
Human peroxisome biogenesis disorders (PBDs) are a group ofgenetically heterogeneous autosomal-recessive disease caused bymutations in PEX genes that encode peroxins, proteins required forperoxisome biogenesis. These lethal diseases include Zellwegersyndrome (ZS), neonatal adrenoleukodystrophy (NALD), andinfantile Refsum disease (IRD), three phenotypes now thought torepresent a continuum of clinical features that are most severe inZS, milder in NALD, and least severe in IRD2. At least 11 PBDcomplementation groups have been identified by somatic-cellhybridization analysis compared to the 18 PEX complementationgroups that have been found in yeast (147). Human PEX1 gene hasbeen identified by computer-based “homology probing” using theScPex1p sequence to screen databases of expressed sequence tags(dbEST) for human cDNA clones. In vitro studies demonstrated thatexpression of PEX1 rescued the cells from the biogenesis defect inhuman fibroblasts of complementation group 1 (CG1), the largestPBD complementation group (146).
9.4. Batten Disease
Batten disease is also known as juvenile ceroid-lipofuscinosis andCLN3 is an autosomal recessive disorder that results in blindnesscaused by retinal degeneration. There are several clinically andgenetically distinct forms of ceroid-lipofuscinosis, the most com-mon of which is Batten disease (148). Visual deterioration usuallybegins at age 5–7 yr, with onset of seizures and progressive psycho-motor and cognitive deterioration. This culminates in a vegetativestate and death usually by the midteens to early-20’s.
The CLN3 gene was mapped to chromosome 16p12.1 andhas been identified by positional cloning (149). Katz and colleaguesusing immunochemical techniques found that the protein wasalmost exclusively located in the mitochondria, but only in certaincell types (148).
The mnd/mnd mouse strain has been proposed as an animal modelfor this condition, although linkage analysis has ruled out a muta-tion in the CNL3 gene as causative in these mice (150).

292 Downes, Chong, and Bird
10. Summary
Although new genes have been identified in retinal degenerationsand advances in molecular genetics have facilitated the search, manydisease-causing genes are still unidentified. The contributions ofother disciplines, again part of molecular medicine, have allowedmore insight into the function of both normal and mutated genes.We now know more about their expression, interaction and func-tion. The clinical potential of the new techniques described in theprevious chapters is yet to be realized, and there may be significantdifficulties in implementing these gene-based therapies.
10.1. What of the Future?
Again, from the clinician’s perspective, it is clear that all theinformation derived from the laboratory has shed light on manyaspects of these inherited disorders, and the benefits of knowing thedisease gene and its effect are obvious. The results of mutationalscreening should become more easily accessible to the clinician asthis form of screening becomes more routinely available with auto-mation of investigative procedures such as mutational analysis andlinkage studies, leading to quicker and more reliable results. Identi-fication of further genes will add more DNA/RNA-based diagnosesand therefore should lead to increase diagnostic accuracy. Geno-type–phenotype correlation studies will help in more precise defini-tion of genetic abnormalities.
Genetic screening services with appropriate funding and resourceswill become part of the norm. Ethical issues, such as prenatal diag-nosis and counseling will also need to be addressed. Regardingtherapy, several options in addition to gene therapy are currentlyundergoing evaluation in inherited retinal disease. None of these isas yet either ready or proved to be beneficial. They include RPE andretinal transplantation, survival factors, product substitutes, and con-struction of artificial or electronic devices. In the light of expandingknowledge of the gene function, it may be possible to design drugsto correct molecular abnormalities. It is an exciting time and it is tobe hoped that at least one of these therapies will be successful in thenot-too-distant future.

Ophthalmologists’ Perspective 293
References
1. Abe, T., Abe, K., Aoki, M., Itoyama, Y., and Tamai, M. (1997)Ocular changes in patients with spinocerebellar degeneration andrepeated trinucleotide expansion of spinocerebellar ataxia type 1gene. Arch. Ophthalmol. 115, 231–236.
2. Kajiwara, K., Berson, E. L., and Dryja, T. P. (1994) Digenic retini-tis pigmentosa due to mutations at the unlinked peripherin/RDS andROM1 loci. Science 264, 1604–1608.
3. Massof, R. W. and Finkelstein, D. (1981) Two forms of autosomaldominant primary retinitis pigmentosa. Doc. Ophthalmol. 51, 289–346.
4. Lyness, A. L., Ernst, W., Quinlan, M. P., Glover, G. M., Arden, G. B.,Carter, R. M., et al. (1984). A clinical, psychophysical and elec-troretinographic survey of patients with autosomal dominant retini-tis pigmentosa. Br. J. Ophthalmol. 69, 326–339.
5. Weleber, R. G., Carr, R. E., Murphey, W. H., Sheffield, V. C., andStone, E. M. (1993) Phenotypic variation including retinitis pig-mentosa, pattern dystrophy, and fundus flavimaculatus in a singlefamily with a deletion of codon 153 or 154 of the peripherin/RDSgene. Arch. Ophthalmol. 111, 1531–1542.
6. Downes, S. M., Fitzke, F. W., Holder, et al. (1999) 172-RDS macu-lar dystrophy—a similar phenotype in 12 families: clinical features’.Ophthalmology, in press.
7. Piguet, B., Heon, E., Grounauer, P. A., et al. (1996) Full char-acterisation of the maculopathy associated with an Arg-172- Trpmutation in the RDS/peripherin gene. Ophthal. Genet. 17, 175–186.
8. Berson, E. L., Rosner, B., Sandberg, M. A., and Dryja, T. P. (1991)Ocular findings in patients with autosomal dominant retinitispigmentosa and a rhodopsin gene defect. (Pro-23-His). Arch.Ophthalmol. 109, 92–101.
9. Sung, C. H., Makino, C., Baylor, D., and Nathans, J. (1994)A rhodopsin gene responsible for autosomal dominant retinitispigmentosa results in a protein that is defective in localization to thephotoreceptor outer segment. J. Neurosci. 14, 5818–5833.
10. Li, T., Franson, W., Gordon, J. W., Berson, E. L., and Dryja, T. P.(1995) Constitutive activation of phototransduction is not a cause ofphotoreceptor degeneration. Proc Natl. Acad. Sci. USA 92, 3551–3555.
11. Marshall, E. (1995) Gene therapy’s growing pains. Science 269,1052–1055.

294 Downes, Chong, and Bird
12. Hoffman, L. M., Maguire, A. M., and Bennet, J. (1997) Cell medi-ated immune response and stability of intraocular transgene expres-sion after adenovirus-mediated delivery. Invest. Ophthalmol. Vis.Sci. 38, 2224–2233.
13. Mashour, B., Couton, D., Perricaudet, M., and Briand, P. (1994). In vivoadenovirus-mediated gene transfer into ocular tissues. Gene Ther.1, 122–126.
14. Drenser, K. A., Timmers, A. M., Hauswirth, W. W., and Lewin, A. S.(1998) Ribozyme-targeted destruction of RNA associated withautosomal-dominant retinitis pigmentosa. Invest. Ophthalmol. Vis.Sci. 39, 681–689.
15. Lewin, A. S., Drenser, K. A., Hauswirth, W. W., Nishikawa, S.,Yasumura, D., et al. (1998) Ribozyme rescue of photoreceptor cellsin a transgenic rat model of autosomal dominant retinitis pigmentosa.Nat. Med. 4, 967–971.
16. Jiang, L. Q., Jorquera, M., and Streilein, J. W. (1993) Subretinalspace and vitreous cavity as immunologically privileged sites forretinal allografts. Invest. Ophthalmol. Vis. Sci. 34, 3347–3354.
17. Gal, A., Apfelstedt-Sylla, E., Janecke, A. R., and Zrenner, E. (1997).Rhodopsin mutations in inherited retinal disorders. Prog. RetinalEye Res. 16, 51–79.
18. Wyllie, A. H., Kerr, J. F. R., and Currie, A. R. (1980) Cell death: thesignificance of apoptosis. Int. Rev. Cytol. 68, 251–306.
19. Faktorovich, E. G., Steinberg, R. H., Yasumura, D., Matthes, M. T.,and LaVail, M. M. (1990) Photoreceptor degeneration in inher-ited retinal dystrophy delayed by basic fibroblast growth factor.Nature 347, 83–86.
20. Borhani, H., Peyman, G. A., Rahimy, M. H., and Beuerman, R. W.(1993) Vitreoretinal toxicity of basic fibroblast growth factor.Int. Ophthal. 17, 195–199.
21. Thoenen, H. (1991) The changing scene of neurotrophic factors.Trends Neurosci. 14, 165–170.
22. Richardson, P. M. (1994) Ciliary neurotrophic factor: a review.Pharmacol. Ther. 63, 187–198.
23. Unoki, K. and LaVail, M. M. (1994) Protection of the rat retina fromischemic injury by brain-derived neurotrophic factor, ciliary neu-rotrophic factor, and basic fibroblast growth factor. Invest. Ophthalmol.Vis. Sci. 35, 907–915.

Ophthalmologists’ Perspective 295
24. LaVail, M. M., Unoki, K., Yasumura, D., Matthes, M. T., Yanco-poulos, G. D., and Steinberg, R. H. (1992) Multiple growth factors,cytokines, and neurotrophins rescue photoreceptors from the dam-aging effects of constant light. Proc. Natl. Acad. Sci. USA 89,11,249–11,253.
25. LaVail, M. M., Yasumura, D., Matthes, M. T., Lau-Villacorta, C.,Unoki, K., Sung, C. H., and Steinberg, R. H. (1998) Protection ofmouse photoreceptors by survival factors in retinal degenerations.Invest. Ophthalmol. Vis. Sci. 39, 592–602.
26. Chong, N. H. V., Alexander, R. A., Waters, L., Barnett, K. C., Bird,A. C., and Luthert, P. J. (1999) Repeated injections of a ciliary neu-rotrophic factor analogue leading to long-term photoreceptor sur-vival in hereditary retinal degeneration. Invest. Ophthalmol. Vis. Sci.40, 1298–1305.
27. Akimoto, M., Miyatake, S. I., Kogishi, J. I., et al. (1999) Adeno-virally expressed basic fibroblastic growth factor rescues photo-receptor cells in RCS rats. Invest. Ophthalmol. Vis. Sci. 40, 273–279.
28. Maysinger, D., Krieglstein, K., Filipovic Grcic, J., Sendtner, M.,Unsicker, K., and Richardson, P. (1996) Microencapsulated ciliaryneurotrophic factor: Physical properties and biological activities.Exp. Neuro. 138, 177–188.
29. Ghosh, F., Johansson, K., and Ehinger, B. (1999) Long-term full-thickness embryonic rabbit retinal transplants. Invest. Ophthalmol.Vis. Sci. 40, 133–142.
30. Daiger, S. P., Sullivan, L. S., and Rossiter, B. J. F. The RetNet.University of Texas Houston Health Science Center.
31. Donders, F. C. (1855) Torpeur de la rétine congénital e héréditarie.Ann. Ocul. (Paris) 34, 270–273.
32. Bundey, S. and Crews, S. J. (1984) A study of retinitis pigmentosain the city of Birmingham-I. Prevalence. J. Med. Genet. 21, 417–420.
33. Bunker, C. H., Berson, E. L., and Bromley, W. C. (1984) Preva-lence of retinitis pigmentosa in Maine. Am. J. Ophthalmol. 97, 357–365.
34. Dryja, T. P., McGee, T. L., Reichel, E., et al. (1990) A point muta-tion of the rhodopsin gene in one form of retinitis pigmentosa. Nature343, 364–366.
35. Dryja, T. P. (1992) Rhodopsin and autosomal dominant retinitispigmentosa. (Doyne Lecture) Eye 6, 1–10.
36. Dryja, T. P. and Li, T. (1995) Molecular genetics of retinitispigmentosa. Hum. Mol. Genet. 4, 1739–1743.

296 Downes, Chong, and Bird
37. Kajiwara, K., Hahn, L. B., Mukai, S., et al. (1991) Mutations in thehuman retinal degeneration slow gene in autosomal dominantretinitis pigmentosa. Nature 354, 480–483.
38. Bessant, D. A. R., Payne, A. M., Mitton, K. P., et al. (1999) A muta-tion in NRL is associated with autosomal dominant retinitis pigmentosa.Nat. Genet. 21, 355, 356.
39. Sung, C. H., Davenport, C. M., Hennessy, J. C., et al. (1991)Rhodopsin mutations in autosomal dominant retinitis pigmentosa.Proc. Natl. Acad. Sci. USA 88, 6481–6485.
40. Sung, C. H., Schneider, B. G., Agarwal, N., Papermaser, D. S., andNathans, J. (1991) Functional heterogeneity of mutant rhodopsinsresponsible for autosomal dominant retinitis pigmentosa. Proc. Natl.Acad. Sci. USA 88, 8840–8844.
41. Basinger, S., Bok, D., and Hall, H. (1976) Rhodopsin in the outersegment plasma membrane. J. Cell. Biol. 69, 29–42.
42. Al-Maghtheh, M., Gregory, C., Inglehearn, C., Hardcastle, A., andBhattacharya, S. S. (1993) Rhodopsin mutations in autosomal domi-nant retinitis pigmentosa. Hum. Mutat. 2, 249–255.
43. Rosenfeld, P. J., Cowley, G. S., McGee, T. L., Sandberg, M. A.,Berson, E. L., and Dryja, T. P. (1992) A null mutation in the rhodop-sin gene causes rod photoreceptor dysfunction and autosomalrecessive retinitis pigmentosa. Nature Genet. 1, 209–213.
44. Owens, S. L., Fitzke, F. W., Inglehearn, C. F., et al. (1994) Ocularmanifestations in autosomal dominant retinitis pigmentosa with aLys-296-Glu rhodopsin mutation at the retinal binding site. Br. J.Ophthalmol. 78, 353–358.
45. Rao, V. R., Cohen, G. B., and Oprian, D. D. (1994) Rhodopsinmutation G90D and a molecular mechanism for congenital nightblindness. Nature 367, 639–642.
46. Li, T., Ranson, W., Gordon, J. W., Berson, E. L., and Dryja, T. P.Constitutive activation of phototransduction is not a cause of photo-receptor degeneration. Proc. Natl. Acad. Sci. USA 92, 3551–3555.
47. Li, Z. Y., Jacobson, S. G., and Milam, A. H. (1994) Autosomaldominant retinitis pigmentosa caused by the threonine-17-methion-ine rhodopsin mutation: retinal histopathology and immuno-cytochemistry. Exp. Eye Res. 58, 397–408.
48. Li, T., Snyder, W. K., Olsson, J. E., and Dryja, T. P. (1996)Transgenic mice carrying the dominant mutation P347S: evidencefor the defective vectorial transport of rhodopsin to the outer seg-ments. Proc. Natl. Acad. Sci. USA 93, 14,176–14,181.

Ophthalmologists’ Perspective 297
49. Olsson, J. E., Gordon, J. W., Pawlyk, B. S., et al. (1992) Transgenicmice with a rhodopsin mutation (Pro23His) a mouse model of auto-somal dominant retinitis pigmentosa. Neuron 9, 815–830.
50. Felbor, U., Schilling, H., and Weber, B. H. F. (1997) Adultvitelliform macular dystrophy is frequently associated with muta-tions in the peripherin/RDS gene. Hum. Mutat. 10, 301–309.
51. Kohl, S. M., Christ Adler, E., Apfelstedt-Sylla, U., et al. (1997)RDS/Peripherin gene mutations are frequent causes of central reti-nal dystrophies. J. Med. Genet. 34, 620–626.
52. Fishman, G. A., Stone, E. M., Alexander, K. R., et al. (1997) Serine-27-Phenylalanine mutation within the Peripherin/RDS gene in afamily with cone dystrophy. Ophthalmology 104, 299–306.
53. Nakazawa, M., Kikawa, E., Chida, Y., Wada, Y., Shiono, T., andTamai, M. (1996) Autosomal dominant cone-rod dystrophy associ-ated with mutations in codon 244 (Asn 211 His) and codon 184(Tyr 184 Ser) of the peripherin/RDS gene. Arch. Ophthalmol.114, 72–78.
54. Kohl, S., Giddings, I., Besch, D., Apfelstedt-Sylla, U., Zrenner, E.,and Wissinger, B. (1998) The role of the peripherin /RDS gene inretinal dystrophies. Acta. Anat. (Basel) 162, 75–84.
55. Molday, R. S. (1999) Photoreceptor membrane proteins, photo-transduction, and retinal degenerative diseases. Friedenwald Lec-ture. Invest. Ophthalmol. Vis. Sci. 39, 2493–2513.
56. Molday, R. S., Hicks, D., and Molday, L. L. (1987) Peripherin:a rim-specific membrane protein of rod outer segment disks.Invest. Ophthalmol. Vis. Sci. 28, 50–61.
57. Conell, G. and Molday, R. S. (1990) Molecular cloning, primarystructure, and orientation of the vertebrate photoreceptor cell pro-tein peripherin in the rod outer segment disk membrane. Biochemis-try 29, 1171–1184.
58. Jansen, H. G. and Sanyal, S. (1984) Development and degenerationof retina in rds mutant mice. Electron microscopy. J. Comp. Neurol.224, 71–84.
59. Travis, G. H., Brennan, M. B., Danielson, P. E., Koxak, C. A., andSutcliffe, J. G. (1989) Identification of a photoreceptor specificmRNA encoded by the gene responsible for retinal degenerationslow (rds). Nature 338, 70–73.
60. Kim, R. Y., Fitzke, F. W., Moore, A. W., et al. (1995) Autosomaldominant retinitis pigmentosa mapping to chromosome 7p exhibitsvariable expression. Br. J. Ophthalmol. 79, 23–27.

298 Downes, Chong, and Bird
61. Evans, K., Al-Maghtheh, M., Fitzke, F. W., et al. (1995) Bimodalexpressivity in dominant retinitis pigmentosa genetically linked tochromosome 19q. Br. J. Ophthalmol. 79, 841–846.
62. Gu, S. M., Thompson, D. A., Srikumari, C. R. S., et al. (1997).Mutations in RPE65 cause autosomal recessive childhood-onsetsevere retinal dystrophy. Nat. Genet. 17, 194–197.
63. McLaughlin, M. E., Sandberg, M. A., Berson, E. L., and Dryja, T. P.(1993) Recessive mutations in the gene encoding the beta-subunitof rod phosphodiesterase in patients with retinitis pigmentosa.Nat. Genet. 4, 130–134.
64. Dryja, T. P., Finn, J. T., Peng, Y.-W., McGee, T. L., Berson, E. L.,and Yau, K.-W. (1995) Mutations in the gene encoding the alphasubunit of the rod cGMP-gated channel in autosomal recessiveretinitis pigmentosa. Proc. Natl. Acad. Sci. USA 92, 10,177–10,181.
65. Huang, S. H., Pittler, S. J., Huang, X., Oliveria, L., Berson, E. L.,and Dryja, T. P. (1995) Autosomal recessive retinitis pigmentosacaused by mutations in the alpha subunit of rod cGMP phospho-diesterase. Nat. Genet. 11, 468–4712.
66. Banerjee, P., Kleyn, P. W., Knowles, J. A., et al. (1998) ‘TULIP1’mutation in two recessive extended Dominican kindreds with auto-somal recessive retinitis pigmentosa. Nat. Genet. 18, 177–179.
67. Perrault, I., Rozet, J. M., Calvas, P., et al. (1996) Retinal specificguanylate cyclase gene mutations in Leber’s congenital amaurosis.Nat. Genet. 14, 461–464.
68. Marlhens, F., Bareil, C., Griffoin, J. M., et al. (1997) Mutations inRPE65 cause Leber’s congenital amaurosis. Nat. Genet. 17, 139–141.
69. Freund, C., Gregory-Evans, C. Y., Furukawa, T., et al. (1997) Cone-rod dystrophy due to mutations in a novel photoreceptor-specifichomeobox gene (CRX) essential for the maintenance of the photo-receptor. Cell 91, 543–553.
70. Freund, C. L., Wang, Q. L., Chen, S., et al. (1998) De novo muta-tions in the CRX homeobox gene associated with Leber congenitalamaurosis. Nat. Genet. 18, 311, 312.
71. Sohocki, M. M., Sullivan, L. S., and Mintz-Hittner, H. A. (1998) A rangeof clinical phenotypes associated with mutations in CRX, a photo-receptor transcription-factor gene. Am. J. Hum. Genet. 63, 1307–1315.
72. Redmond, T. M., Yu, S., Lee, E., et al. (1998) Rpe65 is necessaryfor production of 11-cis-vitamin A in the retinal visual cycle.Nat. Genet. 20, 344–351.

Ophthalmologists’ Perspective 299
73. Meindl, A., Dry, K., Herrmann, K., et al. (1996) A gene (RPGR)with homology to the RCC1 guanine nucleotide exchange factor ismutated in X-linked retinitis pigmentosa (RP3). Nat. Genet. 13, 35–42.
74. Schwahn, U., Lenzner, S., Dong, J., et al. (1998) Positional cloningof the gene for X-linked retinitis pigmentosa 2. Nat. Genet. 19,327–332.
75. Simunovic, M. P. and Moore, A. T. (1998) The Cone dystrophies.Eye 12, 553–565.
76. Payne, A. M., Downes, S. M., Bessant, D. A. R., et al. (1998) A muta-tion in guanylate cyclase activator 1A (GUCA1A) in an autosomaldominant cone dystrophy pedigree mapping to a new locus on chro-mosome 6p21.1. Hum. Mol. Genet. 7, 273–277.
77. Kelsall, R. E., Gregory-Evans, K., Payne, A. M., et al. (1998) Muta-tions in the retinal guanylate cyclase (RETGC-1) gene in dominantcone-rod dystrophy. Hum. Mol. Genet. 7, 1179–1184.
78. Dizhoor, A. M., Boikov, S. G., and Olshevskaya, E. V. (1998) Con-stitutive activation of photoreceptor guanylate cyclase by Y99Cmutant of GCAP-1. Possible role in causing human autosomal domi-nant cone degeneration. J. Biol. Chem. 273, 17,311–17,314.
79. Williams, D. S., Colley, N. J., and Farber, D. B. (1987) Photorecep-tor degeneration in a pure cone retina. Invest. Ophthalmol. Vis. Sci.28, 1059–1069.
80. Cuenca, N., Lopez, S., Howes, K., and Kolb, H. (1998) The local-ization of guanylyl cyclase-activating proteins in the mammalianretina. Invest. Ophthalmol. Vis. Sci. 39, 1243–1250.
81. Dryja, T. P., Hahn, L. B., Reboul, T., and Arnaud, B. (1996) Mis-sense mutation in the gene encoding the alpha subunit of rodtransducin in the Nougaret form of congenital stationary night blind-ness. Nat. Genet. 13, 358–360.
82. Gal, A., Orth, U., Baehr, W., Schwinger, E., and Rosenberg, T.(1994) Heterozygous missense mutation in the rod cGMP phos-phodiesterase beta-subunit gene in autosomal dominant stationarynight blindness. Nat. Genet. 7, 64–68.
83. McLaughlin, M. E., Sandberg, M. A., Berson, E. L., and Dryja, T. P.(1993) Recessive mutations in the gene encoding the beta-subunitof rod phosphodiesterase in patients with retinitis pigmentosa.Nat. Genet. 4, 130–134.
84. Suber, M. L., Pittler, S. J., Qin, N., et al. (1993) Irish setter dogsaffected with rod/cone dysplasia contain a nonsense mutation in the

300 Downes, Chong, and Bird
rod cGMP phosphodiesterase beta-subunit gene. Proc. Natl. Acad.Sci. USA 90, 3968–3972.
85. Dryja, T. P., Berson, E. L., Rao, V. R., and Oprian, D. D. (1993)Heterozygous missense mutation in the rhodopsin gene as a causeof congenital stationary night blindness. Nat. Genet. 4, 280–283.
86. Bech-Hansen, N. T., Naylor, M. J., Maybaum, T. A., et al. (1998)Loss-of-function mutations in a calcium-channel alpha 1-subunitgene in Xp11.23 cause incomplete X-linked congenital stationarynight blindness. Nat. Genet. 19, 264–267.
87. Fuchs, S., Nakazawa, M., Maw, M., Tamai, M., Oguchi, Y., andGal, A. (1995) A homozygous 1-base pair deletion in the arrestingene is a frequent cause of Oguchi disease in Japanese. Nat. Genet.10, 360–362.
88. Yamamoto, S., Sippel, K. C., Berson, E. L., and Dryja, T. P. (1997)Defects in the rhodopsin kinase gene in the Oguchi form of station-ary night blindness. Nat. Genet. 15, 175–178.
89. Stargardt, K. (1909) Ueber familiäre, progressive Degeneration inder Maculagegend des Auges. Albrecht von Graefes Arch. Klin.Ophthalmol. 71, 534.
90. Franceschetti, A. and François, J. (1965) Fundus flavimaculatus.Arch. Ophthalmol. (Paris, France) 25, 505.
91. Kaplan, J., Gerber, S., Roset, J. M., Souied, E., Bonneau, D.,Dufier, J. L., and Munnich, A. (1994). Late-onset Stargardt-likemacular dystrophy maps to chromosome 1p13. Am. J. Hum. Genet.55, 190.
92. Allikmets, R., Singh, N., Sun, H., et al. (1997) A photoreceptor cell-specific ATP-binding transporter gene (ABCR) is mutated in reces-sive Stargardt macular dystrophy. Nat. Genet. 15, 236–246.
93. Stone, E. M., Nichols, B. E., Kimura, A. E., Weingeist, T. A., Drack,A., and Sheffield, V. C. (1994) Clinical features of a Stargardt-likedominant progressive macular dystrophy with genetic linkage tochromosome 6q. Arch. Ophthalmol. 112, 765–772.
94. Zhang, K., Bither, P. P., Park, R., Donoso, L. A., Seidman, J. G.,and Seidman, C. E. (1994) A dominant Stargardt’s macular dystro-phy locus maps to chromosome 13q34. Arch. Ophthalmol. 112,759–764.
95. Armstrong, J. D., Meyer, D., Xu, S., and Elfervig, J. L. (1998) Long-term follow-up of Stargardt’s disease and fundus flavimaculatus.Ophthalmology 105, 448–457.
Ophthalmologists’ Perspective 301
96. Eagle, R. C., Lucier, A. C., Bernardino, V. B., and Yanoff, M.(1980) Retinal pigment epithelial abnormalities in fundus flavi-maculatus: a light and electron microscopic study. Ophthalmology87, 1189.
97. Sun, H., Molday, R. S., and Nathans, J. (1999) Retinal stimulatesATP hydrolysis by purified and reconstituted ABCR, the photo-receptor-specific ATP-binding cassette transporter responsible forStargardt disease. J. Biol. Chem. 274, 8269–8281.
98. Sieving, P. A., Bingham, E. L., Roth, M. S., et al. (1990) Linkagerelationship of X-linked juvenile retinoschisis with Xp22.1-p22.3probes. Am. J. Hum. Genet. 47, 616–621.
99. Sauer, C. G., Gehrig, A., Warneke-Wittstock, R., et al. (1997) Posi-tional cloning of the gene associated with X-linked juvenileretinoschisis. Nat. Genet. 17, 164–170.
100. Condon, G. P., Brownstein, S., Wang, N. S., Kearns, A. F., andEwing, G. C. (1986) Congenital hereditary (juvenile X-linked)retinoschisis. Histopathologic and ultrastructural findings in threeeyes. Arch. Ophthalmol. 104, 576–583.
101. Blodi, C. F. and Stone, E. M. (1990) Best’s vitelliform dystrophy.Ophthal. Paediatr. Genet. 11, 49–59.
102. Petrukhin, K., Koisti, M. J., Bakall, B., et al. (1998) Identificationof the gene responsible for Best macular dystrophy. Nat. Genet. 19,241–247.
103. Marquardt, A., Stohr, H., Passmore, L. A., Kramer, F., Rivera, A.,and Weber, B. H. F. (1998) Mutations in a novel gene VMD2encoding a gene of unknown properties cause juvenile-onsetvitelliform macular dystrophy (Best’s disease). Hum. Mol. Genet.7, 1517–1525.
104. O’Gorman, S., Flaherty, W. A., Fishman, G. A., and Berson, E. L.(1990) Histopathologic findings in Best’s vitelliform macular dys-trophy. Ophthal. Paediatr. Genet. 11, 49–59.
105. Simell, O. and Takki, K. (1973) Raised plasma-ornithine and gyrateatrophy of the choroid and retina. Lancet 1, 1031.
106. Valle, D., Kaiser-Kupfer, M., and Del Valle, L. (1977) Gyrateatrophy of the choroid and retina: Deficiency of ornithine ami-notransferase in transformed lymphocytes. Proc. Natl. Acad. Sci.USA 74, 5159.
107. Valle, D. and Simell, O. (1995) The hyperornithineamias, in The Meta-bolic and Molecular Bases of Inherited Diseases. (Scriver, C.,
302 Downes, Chong, and Bird
Beaudet, A., Sky, W., and Valle, D., eds.), McGraw Hill, New York,pp. 1147–1185.
108. Barrett, D. J., Bateman, J. B., Sparkes, R. S., Mohandas, R., Klisak,I., and Inana, G. (1987) Chromosomal localization of humanornithine aminotransferase gene sequences to 10q26 and Xp11.2.Invest. Ophthalmol. Vis. Sci. 28, 1035.
109. Brody, L. C., Mitchell, G. A., Obie, C., Michaud, J., Steel, G.,Fontaine, G., et al. (1992) Ornithine delta-aminotransferase muta-tions in gyrate atrophy. Allelic heterogeneity and functional conse-quences. J. Biol. Chem. 267, 3302–3307.
110. Mashima, Y., Shiono, T., Tamai, M., and Inana, G. (1996) Het-erogeneity and uniqueness of ornithine aminotransferase muta-tions found in Japanese gyrate atrophy patients. Curr. Eye Res.15, 792–796.
111. Mashima, Y., Shiono, T., and Inana, G. (1994) Rapid and efficientmolecular analysis of gyrate atrophy using denaturing gradient gelelectrophoresis. Invest. Ophthalmol. Vis. Sci. 35, 1065–1070.
112. Michaud, J., Thompson, G. N., Brody, L. C., Steel, G., Obie, C.,Fontaine, G., et al. (1995) Pyridoxine-responsive gyrate atrophy ofthe choroid and retina: clinical and biochemical correlates of themutation A226V. Am. J. Hum. Genet. 56, 616–622.
113. Wilson, D. J., Weleber, R. G., and Green, W. R. (1991) Ocular clinico-pathologic study of gyrate atrophy. Am. J. Ophthalmol. 111, 24–33.
114. Wang, T., Lawler, A. M., Steel, G., Sipila, I., Milam, A. H., andValle, D. (1995) Mice lacking ornithine-delta-aminotransferasehave paradoxical neonatal hypoornithinaemia and retinal degenera-tion. Nat. Genet. 11, 185–190.
115. Wang, T., Milam, A. H., Steel, G., and Valle, D. (1996) A mousemodel of gyrate atrophy of the choroid and retina. Early retinalpigment epithelium damage and progressive retinal degeneration.J. Clin. Invest. 97, 2753–2762.
116. Rivero, J. L., Lacorazza, H. D., Kozhich, A., Nussenblatt, R. B.,and Jendoubi, M. (1994) Retrovirus-mediated gene transfer andexpression of human ornithine delta-aminotransferase into embry-onic fibroblasts. Hum. Gene Ther. 5, 701–707.
117. Sullivan, D. M., Chung, D. C., Anglade, E., Nussenblatt, R. B., andCsaky, K. G. (1996) Adenovirus-mediated gene transfer of orni-thine aminotransferase in cultured human retinal pigment epithe-lium. Invest. Ophthalmol. Vis. Sci. 37, 766–774.

Ophthalmologists’ Perspective 303
118. Sullivan, D. M., Jensen, T. G., Taichman, L. B., and Csaky, K. G.(1997) Ornithine-delta-aminotransferase expression and ornithinemetabolism in cultured epidermal keratinocytes: toward metabolicsink therapy for gyrate atrophy. Gene Ther. 4, 1036–1044.
119. Sorsby, A., Mason, M. E. J., and Gardener, N. (1949) A fundusdystrophy with unusual features. Br. J. Ophthalmol. 33, 67–97.
120. Polkinghorne, P. J., Capon, M. R., Berninger, T., Lyness, A. L.,Sehmi, K., and Bird, A. C. (1989) Sorsby’s fundus dystrophy. A clini-cal study. Ophthalmology 96, 1763–1768.
121. Weber, B. H., Vogt, G., Wolz, W., Ives, E. J., and Ewing, C. C.(1994) Sorsby’s fundus dystrophy is genetically linked to chromo-some 22q13-qter. Nat. Genet. 7, 158–161.
122. Weber, B. H., Vogt, G., Pruett, R. C., Stohr, H., and Felbor, U.(1994) Mutations in the tissue inhibitor of metalloproteinases-3(TIMP3) in patients with Sorsby’s fundus dystrophy. Nat. Genet. 8,352–356.
123. Langton, K. P., Barker, M. D., and McKie, N. (1998) Localizationof the functional domains of human tissue inhibitor of metallo-proteinases-3 and the effects of a Sorsby’s fundus dystrophy muta-tion. J. Biol. Chem. 273, 16,778–16,781.
124. Della, N. G., Campochiaro, P. A., and Zack, D. J. (1996) Localiza-tion of TIMP-3 mRNA expression to the retinal pigment epithe-lium. Invest. Ophthalmol. Vis. Sci. 37, 1921–1924.
125. Fariss, R. N., Apte, S. S., Olsen, B. R., Iwata, K., and Milam, A. H.(1997) Tissue inhibitor of metalloproteinases-3 is a component ofBruch membrane of the eye. Am. J. Pathol. 150, 323–328.
126. Capon, M. R., Marshall, J., Krafft, J. I., Alexander, R. A., Hiscott,P. S., and Bird, A. C. (1989) Sorsby’s fundus dystrophy. A light andelectron microscopic study. Ophthalmology 96, 1769–1777.
127. Luthert, P. J., Chong, N. H. V., Alexander, R. A., Gin, T., and Bird,A. C. (1998) TIMP-3, collagen and elastin immunohistochemistry andhistopathology in the ciliary body and Bruch membrane of Sorsby’sfundus dystrophy. Invest. Ophthalmol. Vis. Sci. (Suppl.) 39, 4459.
128. Wright, A. F., Nussbaum, R. L., Bhattacharya, S. S., Jay, M., Lesko,J. G., Evans, H. J., and Jay, B. (1990) Linkage studies and deletionscreening in choroideremia. J. Med. Genet. 27, 496–498.
129. Cremers, F. P., van-de, P. D., van, K. L., Wieringa, B., and Ropers,H. H. (1990) Cloning of a gene that is rearranged in patients withchoroideraemia. Nature 347, 674–677.

304 Downes, Chong, and Bird
130. Seabra, M. C., Brown, M. S., Slaughter, C. A., Sudhof, T. C., andGoldstein, J. L. (1992) Purification of component A of Rabgeranylgeranyl transferase: possible identity with the choroideremiagene product. Cell 70, 1049–1057.
131. Andres, D. A., Seabra, M. C., Brown, M. S., Armstrong, S. A.,Smeland, T. E., Cremers, F. P., and Goldstein, J. L. (1993) cDNAcloning of component A of Rab geranylgeranyl transferase and dem-onstration of its role as a Rab escort protein. Cell 73, 1091–1099.
132. Cremers, F. P., Armstrong, S. A., Seabra, M. C., Brown, M. S., andGoldstein, J. L. (1994) REP-2, a Rab escort protein encoded by thechoroideremia-like gene. J. Biol. Chem. 269, 2111–2117.
133. van-den Hurk, J. A., Schwartz, M., van Bokhoven, H., van-de, PolT. J., Bogerd, L., et al. (1997) Molecular basis of choroideremia(CHM): mutations involving the Rab escort protein-1 (REP-1) gene.Hum. Mutat. 9, 110–117.
134. MacDonald, I. M., Mah, D. Y., Ho, Y. K., Lewis, R. A., and Seabra,M. C. (1998) A practical diagnostic test for choroideremia. Ophthal-mology 105, 1637–1640.
135. Beaufrere, L., Tuffery, S., Hamel, C., Bareil, C., Arnaud, B.,Demaille, J., and Claustres, M. (1997) The protein truncation test(PTT) as a method of detection for choroideremia mutations.Exp. Eye Res. 65, 849–854.
136. van-den Hurk, J. A., Hendriks, W., van-de Pol, T. J., Oerlemans, F.,Jaissle, G., Ruther, K., et al. (1997) Mouse choroideremia genemutation causes photoreceptor cell degeneration and is not trans-mitted through the female germline. Hum. Mol. Genet. 6, 851–858.
137. Kimberling, W. J., Möller, C. G., Davenport, S., et al. (1992) Link-age of Usher syndrome type I gene (USH1B) to the long arm ofchromosome 11. Genomics 14, 988–994.
138. Gibson, F., Walsh, J., Mburu, P., et al. (1995) A type VII myosinencoded by the mouse deafness gene shaker-1. Nature 374, 62–64.
139. Weil, D., Blanchard, S., Kaplan, J., et al. (1995) Defective mysin VIIAgene responsible for Usher syndrome type 1B. Nature 374, 60, 61.
140. Kimberling, W. J., Weston, M. D., Möller, C., et al. (1995) Gene map-ping of Usher syndrome type IIa: localization of the gene to a 2.1-cMsegment of chromosome 1q41. Am. J. Hum. Genet. 56, 216–2223.
141. Eudy, J. D., Weston, M. D., Yao, S., et al. (1998) Mutation of agene encoding a protein with extracellular matrix motifs in Ushersyndrome type IIa. Science 280, 1753–1757.

Ophthalmologists’ Perspective 305
142. Sankila, E. M., Pakarinen, L., Kaariainen, H., Aittomaki, K.,Karjalainen, S., Sistonen, P., and de la Chapelle, A. (1995) Assign-ment of an Usher syndrome type III (USH3) gene to chromosome3q. Hum. Mol. Genet. 4, 93–98.
143. Nadal, N., Rolland, M. O., Tranchant, C., et al. (1995) Localizationof Refsum disease with increased pipecolic acidaemia to chromo-some 10p by homozygosity mapping and carrier testing in a singlenuclear family. Hum. Mol. Genet. 4, 1963–1966.
144. Mihalik, S. J., Morrell, J. C., Kim, D., Sacksteder, K. A., Watkins,P. A., and Gould, S. J. (1997) Identification of PAHX, a Refsumdisease gene. Nat. Genet. 17, 185–189.
145. Jansen, G. A., Ofman, R., Ferdinandusse, S., et al. (1997) Refsumdisease is caused by mutations in the phytanoyl-CoA hydroxylasegene. Nat. Genet. 17, 190–193.
146. Chahal, A., Khan, M., Pai, S. G., Barbosa, E., and Singh, I. (1998)Restoration of phytanic acid oxidation in Refsum disease fibroblastsfrom patients with mutations in the phytanoyl-CoA hydroxylasegene. FEBS Lett. 429, 119–122.
147. Reuber, B. E., Germain-Lee, E., Collins, C. S., et al. (1997) Muta-tions in PEX1 are the most common cause of peroxisome biogen-esis disorders. Nat. Genet. 17, 445–448.
148. Katz, M. L., Gao, C. L., Prabhakaram, M., Shibuya, H., Liu, P. C.,and Johnson, G. S. (1997) immunochemical localisation of theBatten disease protein in retina. Invest. Ophthalmol. Vis. Sci. 38,2375–2386.
149. International Batten Disease Consortium (1995) Isolation of a novelgene underlying Batten disease. CLN3. Cell 82, 949–957.
150. Lee, R. L., Johnson, K. R., and Lerner, T. J. (1996) Isolation andchromosomal mapping of a mouse homolog of the Batten diseasegene. Genomics 35, 617–619.


M E T H O D S I N M O L E C U L A R M E D I C I N ETM
Series Editor: John M. Walker
Contents
Features
9 780896 038370
9 0 0 0 0>
Vision Research ProtocolsEdited by
P. Elizabeth RakoczyCentre for Ophthalmology and Visual Science,
Lions Eye Institute,University of Western Australia,
Nedlands, Perth
Methods in Molecular Medicine™Vision Research ProtocolsISBN: 0-89603-837-8http://humanapress.com
Much fascinating and valuable research has been devoted to the molecular biology of the eye, its variousstructures, and its innervation this past decade. In Vision Research Protocols, Elizabeth Rakoczy and ateam of leading clinical and experimental scientists describe in step-by-step detail the key techniquesessential to effective molecular biological research in ophthalmology and optometry. These readilyreproducible methods are adapted to the special requirements of vision research, with coverage thatranges from the most basic to the most sophisticated technologies. Included are methods for thedownregulation of gene expression, new gene therapy techniques, and the development of transgenicand knockout animal models for testing novel therapies. This book details the three most popular viraldelivery vehicles—recombinant adeno, adeno-associated, and retroviruses—as well as the major deliverymethods for the most widely used animal models.
Eminently accessible and clinically relevant, Vision Research Protocols provides experimental and bio-medical investigators in ophthalmology and optometry with a rich panoply of the most powerful toolswith which to ask—and answer—all the important questions emerging from the dramatically advancingwork on vision research today.
• Readily reproducible moleculartechniques adapted to eye research
• Coverage of the three most popular viraldelivery vehicles
• Introduction to methods for the extractionof DNA and the detection of mRNA
• Discussion of the impact of moleculartechniques on everyday clinical services
Basic Molecular Biology Techniques. Transient Trans-fection of Human Retinoblastoma Cells: Applicationto the Analysis of the Regulatory Regions of Photore-ceptor-Specific Genes. In Situ Hybridization. Immu-nocytochemical Studies of the Retina. Antisense DNATechnology. Inhibition of Gene Expression by Ri-bozymes. Intraocular Delivery of Recombinant Virus.
Preparation of Recombinant Adenoviruses. Genera-tion of Recombinant Adeno-Associated Virus. Prepa-ration of Recombinant Retroviruses. Generation ofTransgenic Mice for Studies of Ocular Developmentand Disease. Generation of Knockout Animal Models.Mutation Analysis of Ocular Genes. Ophthalmolo-gists’ Perspective. Index.


