Embed Size (px)
Citation preview

Learning Parameters in Canonical Models usingWeighted Least Squares
Krzysztof Nowak1,3 & Marek J. Druzdzel1,2
1 Bia lystok University of Technology, Bia lystok, Poland2 School of Information Sciences, Pittsburgh, USA
3 European Space Agency, Noordwijk, The [email protected],[email protected]
Abstract. We propose a novel approach to learning parameters of canon-ical models from small data sets using a concept employed in regressionanalysis: weighted least squares method. We assess the performance ofour method experimentally and show that it typically outperforms sim-ple methods used in the literature in terms of accuracy of the learnedconditional probability distributions.
Keywords: Bayesian networks, canonical models, noisy–MAX gates,parameter learning, weighted least squares
1 Introduction
Methodologies for extracting information from data have been one of the keyfactors for the success of modern artificial intelligence. Bayesian networks — oneof the prime examples among probabilistic modeling techniques — are widelyacclaimed and used by the scientific communities as well as the industry. Nowa-days, data for many problem domains are freely accessible and in many casesgrowing at an exponential rate. Nonetheless, in some fields the amount of datais small, usually due to the cost of acquisition or high complexity of the prob-lem. The latter increases the number of parameters required for the accuratemodeling of the problem, which in turn calls for learning samples of large size. Aclass of interactions within Bayesian networks, the so called ICI (Independenceof Causal Influence) models, find their applications in problems where obtainingan adequately sampled dataset is infeasible. In this paper we focus on learningparameters for the ICI models by framing the problem in terms of linear al-gebra and then calculating the values of parameters by means of the weightedleast squares. We follow this up by an empirical test for learning accuracy ofthe proposed method and highlight the cases in which it outperforms the twocommon approaches to this problem: Expectation-maximization approach andthe method proposed by Onisko and Druzdzel [1].
2 ICI Models
ICI models [2–5] are based on the assumption of independence of causal influ-ences. An effect variable, along with its causes, may fit an ICI model if the mech-

anisms through which the causes impact the effect do not interact among eachother. This simple restriction greatly simplifies elicitation of parameters fromdata and experts. Because some conditional probabilities can now be expressedas a function of a far smaller set of parameters, the number of independent pa-rameters required to define the CPT (Conditional Probability Table) of the childnode is reduced from exponential to linear in the number of parents. Figure 1shows an example of such model.
X1 X2 · · · Xn
I1 I2 · · · In
Y
Fig. 1: Structure of an ICI model: additional auxiliary nodes I1 - In are calledinhibitors. The independence of mechanisms is represented by a lack of edgesamong the inhibitor nodes I1 to In.
2.1 Noisy–OR/MAX
Deterministic models usually rely on a function that takes a set of input signalswhich determine the state of the child node Y . The deterministic OR functionmakes it impossible for the child to be activated if none of the parent nodes ispresent. Noisy–OR [2, 3] and Noisy–MAX [6] models are cases of deterministicOR and deterministic MAX functions applied to the ICI framework [5]. Everyvariable has a special state indicating that the phenomenon that it represents is“absent,” we call such state the “distinguished state.” The term “activated state”will then refer to any of the non-distinguished states. Uncertainty is introducedto the model by adding a separate layer of inhibitor nodes (I1 through In inFigure 1), which are activated based on their corresponding states of parents(nodes X1 through Xn) with a certain probability. Once that is done, the statesof inhibitor nodes are used as input signals for the deterministic function. Asit turns out, all we need to provide to the model are the probabilities of everyparent variable activating the child independently, that is when every variableother than the one in question is in its distinguished state. Thus, a Noisy–OR

parameter pi describes the probability of i-th parent activating the child:4
pi = P (+y|¬x1,¬x2, . . . ,+xi, . . . ,¬xn) . (1)
Obtaining conditional probabilities for the combination of states of nodes Xi
other than the ones already described by the Noisy–MAX parameters can bederived using the following equation:
P (+y|x) = 1−∏
i∈I(x)
(1− pi) , (2)
where I(x) is a set of indices of parents in combination x which are in theiractivated states. In our case, OR is the deterministic function — the child isactive when any of the inhibitors is active. Deterministic MAX function is ageneralization of the deterministic OR as proposed independently by Dıez [6]and Srinivas [7]. For that reason, we can treat Noisy–OR as a binary case of theNoisy–MAX model. In further sections, we will occasionally use Noisy–OR/MAXinterchangeably, knowing that general ideas apply equally well to binary andnon-binary variables.
2.2 Leaky Noisy–OR/MAX
Deterministic OR function activates the child node only when at least one ofthe parents is in its non-distinguished state. This is not always the case in thereal world — absence of any signal from the parental causes may still activatethe child variable. Sometimes a problem does not allow for explicit modeling ofeach possible cause, either because it is not well understood, or because it wouldrequire a large number of additional variables that would have minimal impacton the child. In that case the unmodelled causes can be aggregated into a singlenode called leak [2] (see Figure 2). Since leak is modeling mechanisms that we
X1 X2 · · · Xn
I1 I2 · · · In L
Y
Fig. 2: Structure of a Leaky ICI model: L is the implicit leak node.
4 We will use lowercase to denote the states of variables. Distinguished states arepreceded with a negation sign, while activated states with a plus sign, e.g., +x1 and¬x1 are activated and distinguished states of variable X1 respectively.
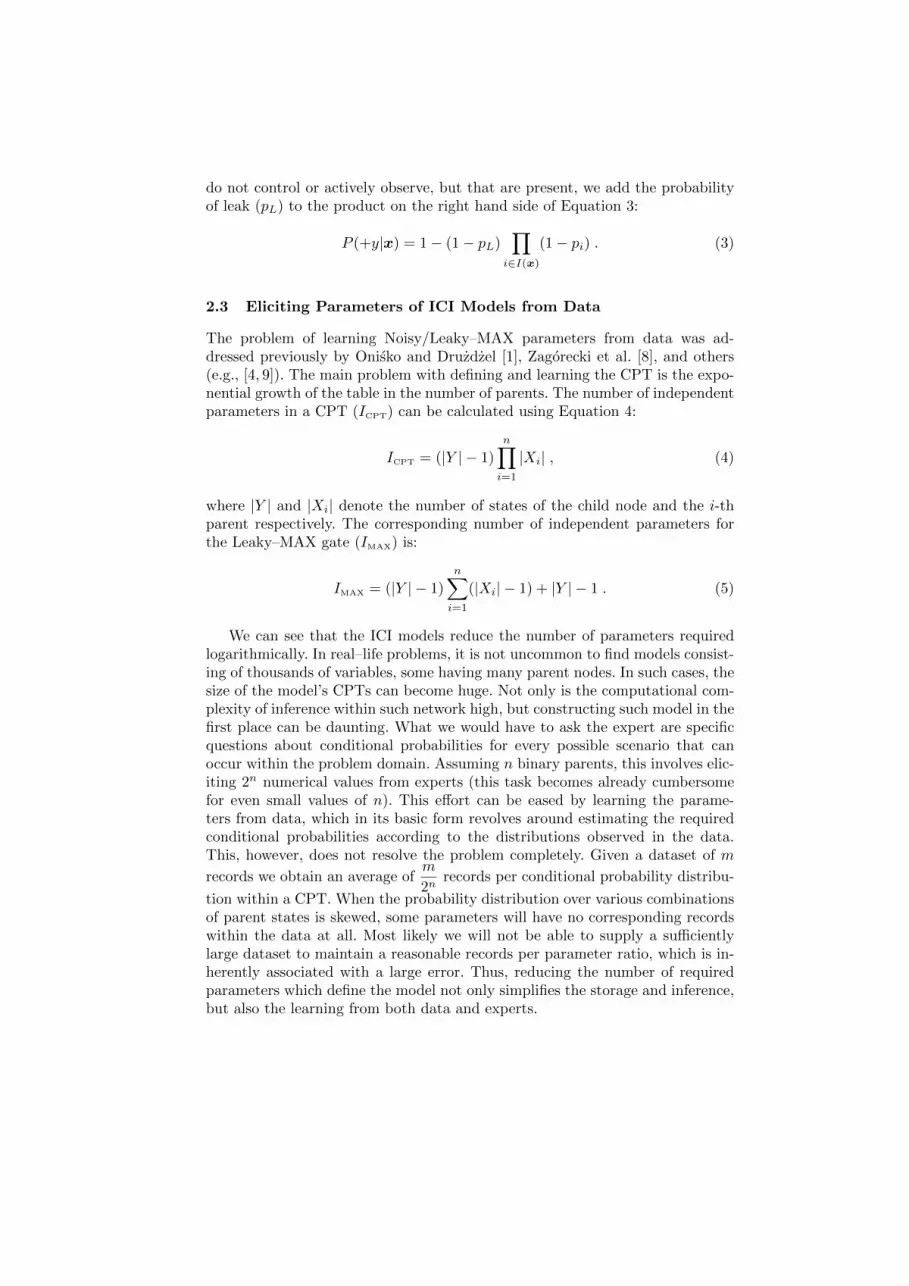
do not control or actively observe, but that are present, we add the probabilityof leak (pL) to the product on the right hand side of Equation 3:
P (+y|x) = 1− (1− pL)∏
i∈I(x)
(1− pi) . (3)
2.3 Eliciting Parameters of ICI Models from Data
The problem of learning Noisy/Leaky–MAX parameters from data was ad-dressed previously by Onisko and Druzdzel [1], Zagorecki et al. [8], and others(e.g., [4, 9]). The main problem with defining and learning the CPT is the expo-nential growth of the table in the number of parents. The number of independentparameters in a CPT (ICPT) can be calculated using Equation 4:
ICPT = (|Y | − 1)
n∏i=1
|Xi| , (4)
where |Y | and |Xi| denote the number of states of the child node and the i-thparent respectively. The corresponding number of independent parameters forthe Leaky–MAX gate (IMAX) is:
IMAX = (|Y | − 1)
n∑i=1
(|Xi| − 1) + |Y | − 1 . (5)
We can see that the ICI models reduce the number of parameters requiredlogarithmically. In real–life problems, it is not uncommon to find models consist-ing of thousands of variables, some having many parent nodes. In such cases, thesize of the model’s CPTs can become huge. Not only is the computational com-plexity of inference within such network high, but constructing such model in thefirst place can be daunting. What we would have to ask the expert are specificquestions about conditional probabilities for every possible scenario that canoccur within the problem domain. Assuming n binary parents, this involves elic-iting 2n numerical values from experts (this task becomes already cumbersomefor even small values of n). This effort can be eased by learning the parame-ters from data, which in its basic form revolves around estimating the requiredconditional probabilities according to the distributions observed in the data.This, however, does not resolve the problem completely. Given a dataset of m
records we obtain an average ofm
2nrecords per conditional probability distribu-
tion within a CPT. When the probability distribution over various combinationsof parent states is skewed, some parameters will have no corresponding recordswithin the data at all. Most likely we will not be able to supply a sufficientlylarge dataset to maintain a reasonable records per parameter ratio, which is in-herently associated with a large error. Thus, reducing the number of requiredparameters which define the model not only simplifies the storage and inference,but also the learning from both data and experts.

Onisko and Druzdzel [1] propose a simple method of learning Noisy–MAXparameters from data by limiting learning to only those records that describethe parameters directly, namely the cases where only one of the parent nodes isin its activated state. Another approach by Zagorecki and Druzdzel [10] aims atlearning the full CPT first and then fitting the Noisy/Leaky–MAX parameterswhich are the closest (in Euclidian distance) to the original CPT distribution.In this research, we propose yet another approach which somewhat resemblesthe previous two: Learning Leaky–MAX parameters directly from the data (yetusing the information from the full dataset), while also minimizing the sum ofdistances towards each of the probabilistic scenarios in data using the weightedleast squares method.
3 Least Squares Approximation
Least Squares (also known as “Ordinary” or “Linear” Least Squares) is a pa-rameter estimation method, commonly used in regression analysis [11]. As wewill show in this section, this approach resonates well with the constraints of ourproblem and can be employed for the purpose of learning parameters of canoni-cal models from data. In this research we focus on the Leaky–OR/MAX gates,yet the same approach can be employed to the Leaky–AND/MIN models andother canonical gates, as long as it is possible to frame the problem in terms ofa system of linear equations.
3.1 Expressing Probabilistic Information as a System of LinearEquations
Following Equation 3 we can express any conditional probability within theCPT using the Leaky–MAX parameters. Thus, given an arbitrary observationof parent states x and child state y we have the following:
1− P (+y|x) = (1− pL)∏
i∈I(x)
(1− pi) , (6)
where P (+y|x), pL and pi are the estimations of P (+y|x), pL and pi from data.Taking the logarithm of both sides gives us:
log(1− P (+y|x)) = log(1− pL) +∑i∈I(x)
log(1− pi) . (7)
By introducing substitutions q = log(1 − P (+y|x)), qL = log(1 − pL) and qi =log(1− pi) we obtain a linear equation:
q = qL +∑i∈I(x)
qi , (8)
with q as a constant, and qL, q1, . . . , qn as the unknowns. Repeating the stepsabove for each combination x observed within the data gives us a system of linear

equations. Solving for qi and qL gives us the corresponding values of log(1− pi)and log(1− pL), from which we can obtain the original Leaky–MAX parameterspi and pL:
pk = 1− exp(qk) for k ∈ {1, . . . , n, L} . (9)
Example 1. Let the binary nodes X1, X2 and Y form a Leaky–OR model, givingus 8 possible observations in the sample (Figure 3a). Let us assume a sample of100 records reflecting the structure (Table 3b). Expressing the observations from
X1 X2 L
Y
(a) Structure of the problem
x = x1,x2 and y # records P (+y|x)
+x1,+x2,+y 40 40
52+x1,+x2,¬y 12
¬x1,+x2,+y 1 1
3¬x1,+x2,¬y 2
+x1,¬x2,+y 16 16
25+x1,¬x2,¬y 9
¬x1,¬x2,+y 1 1
20¬x1,¬x2,¬y 19
(b) Sampled dataset
Fig. 3: Leaky–OR structure (left) along with a sample of 100 records (right).
the sample using the Equation 6, gives us the following system of equations:(1− p1) · (1− p2) · (1− pL)
(1− p2) · (1− pL)(1− p1) · (1− pL)
(1− pL)
=
1− P (+y|+ x1,+x2)
1− P (+y| ¬ x1,+x2)
1− P (+y|+ x1,¬x2)
1− P (+y| ¬ x1,¬x2)
. (10)
We take logarithm of both sides of each of the equations:log(1− p1) + log(1− p2) + log(1− pL)
log(1− p2) + log(1− pL)log(1− p1) + log(1− pL)
log(1− pL)
=
log(1− 40/52)log(1− 1/3)log(1− 16/25)log(1− 1/20)
, (11)
and apply the substitutions qL = log(1 − pL) and qi = log(1 − pi), which givesus the following system of linear equations:
1 1 10 1 11 0 10 0 1
·q1q2qL
=
log(12/52)log(2/3)log(9/25)log(19/20)
=
−1.466 . . .−0.405 . . .−1.021 . . .−0.051 . . .
. (12)
�

3.2 Weighted Least Squares Method
In the previous section, we have shown a transition from discrete data, obeyingthe assumptions of the Leaky-MAX model, to a system of linear equations. Theinput in our case is an overdetermined system of linear equations, which can bethought of as a set of hyperplanes. Least squares method allows for finding asolution that minimizes the sum of vertical distances to each of the planes.
Given an overdetermined system:
Ax = b , (13)
where A is an m×n matrix of real–valued coefficients, and x ∈ Rn and b ∈ Rm,we can obtain an approximate solution x′ solving the following:
ATAx′ = AT b . (14)
Thus obtained solution x′ minimizes the sum of the squares of the errors foreach of the m equations. Since in our case the equations are obtained from data,least squares method has no means of distinguishing between these equationsthat were represented by a larger fraction of the dataset (potential lower error)and those equations that were represented by only a handful of records (highererror). For that reason we employ the weighted variant of the method [11], thusallowing to promote the more significant equations.
Given the system of equations (13) and a diagonal matrix W with weightson its main diagonal,5 we solve for the weight–induced approximate solution x′′
using the following:ATWAx′′ = ATWb . (15)
Example 2. Let us continue the previous example and assume an overdeterminedsystem in Equation 12. By assuming
A =
1 1 10 1 11 0 10 0 1
, b =
−1.466 . . .−0.405 . . .−1.021 . . .−0.051 . . .
,ATA =
2 1 21 2 22 2 4
,AT b =
−1.871 . . .−2.487 . . .−2.944 . . .
,x =
q1q2qL
,(16)
we can solve for an ordinary least squares solution x′
ATAx′ = AT b⇒
2 1 21 2 22 2 4
x′ =
−1.821 . . .−2.555 . . .−2.894 . . .
⇒ x′ =
−0.399 . . .−1.015 . . .−0.028 . . .
. (17)
Since x′ is a vector of approximate parameters q′1, q′2 and q′L, we apply Equation 9to obtain the corresponding parameters p′1, p′2 and p′L:p′1p′2
p′L
=
1− exp(q′1)1− exp(q′2)1− exp(q′L)
=
0.329 . . .0.638 . . .0.028 . . .
. (18)
5 wii ∈W describes the weight of the i-th equation. Normalization of the weights isnot necessary.

Alternatively, we can apply weights:6
W =
52 0 0 00 3 0 00 0 25 00 0 0 20
,ATWA =
55 52 5552 77 7755 77 100
,ATWb =
−77.465 . . .−101.790 . . .−104.033 . . .
, (19)
and solve for a weighted least squares solution x′′:
ATWAx′′ = ATWb⇒
55 52 5552 77 7755 77 100
x′′ =
−77.465 . . .−101.790 . . .−104.033 . . .
⇒ x′′ =
−0.432 . . .−0.988 . . .−0.041 . . .
.(20)
As previously highlighted, in order to obtain the final parameters p′′1 , p′′2 and p′′L,we employ the Equation 9:p′′1p′′2
p′′L
=
1− exp(q′′1 )1− exp(q′′2 )1− exp(q′′L)
=
0.351 . . .0.628 . . .0.040 . . .
. (21)
�
4 Empirical Performance
This section describes experiments performed to test our approach in practice.We perform two types of experiments: learning parameters using datasets gen-erated from an ideal Leaky–MAX definition and a definition “distorted” by avarying noise parameter κ. The latter models the situation in which we are fittinga Leaky–MAX gate to a distribution that is not exactly a Leaky–MAX.
4.1 Data Generation
Data for the experiment were prepared and generated using the GeNIe and
SMILE,software packages.7 We focus on learning networks composed of onlyone child and the number of binary parents varying between 2 and 6 plusleak.After testing the accuracy of our method on non-binary parents, we havefound its performance to be correlated with the number of possible equations forgiven test case. For that reason we model the “hardness” of the problem simplyby a varying number of binary parents. In order to provide statistical results, wegenerate a thousand randomized networks for each number of parents. The priorprobabilities of parents, as well as the Leaky–MAX definition of the child arerandomized uniformly each time. For each of the 5000 networks, we generate 20random datasets consisting of 100, 200, . . ., 1900 and 2000 records, which givesus 100,000 datasets total.
6 For simplicity we assume wii ∈ W to be the number of records describing i-thequation (see Table 3b).
7 Available at http://genie.sis.pitt.edu/.

Noise–Induced Leaky–MAX: In order to test the accuracy of both meth-ods in cases when the original distribution differs from the ideal Leaky–MAX,we introduce the “distortion” to the definition. We expand the Leaky–MAXparameters to a full CPT and introduce the noise to each of the probabilitydistributions pk (columns in CPT), by sampling a variate x from the Dirichletdistribution, as defined by the following probability density function:
Dir(x1, . . . , xn−1;α1, . . . , αn) =1
B(α)
n∏i=1
xαi−1i , (22)
where α = κ · pk and B(α) is the multinomial Beta function.Figure 4 shows a visualization of the distortion of the distribution q =
[0.2, 0.3, 0.5] for decreasing values of κ. For the noise–induced data, we generatesimilar groups of 100,000 learning datasets for κ = 100, 25 and 10.
Fig. 4: Distortion of original distribution q = [0.2, 0.3, 0.5] with a varying param-eter κ visualized by sampling a 100 new variates from the Dirichlet distribution.
4.2 Tested Learning Algorithms.
We compare three approaches to learning the Leaky–MAX parameters: (1) Sim-ple learning method by Onisko and Druzdzel [1], (2) Leaky–MAX fitting to CPTby Zagorecki and Druzdzel [10], and (3) Weighted Least Squares method pro-posed in this paper. Small datasets may miss some of the information necessaryfor the estimation of the parameters: if m records describe a given combinationof parent states, and the effect variable is activated in k of those records, we cansafely assume that the approximate conditional probability that the variable will
be activated is then equal tok
m. However, when none or all of the m records
contain the child in an activated state, we end up with probabilities 0 and 1respectively, which are best avoided when defining a probabilistic model [12].Our method of handling such extreme cases (for both methods) is as follows:
– If none of the observed m records contains the child in an activated state,
assume probability1
m+ 1.

– If all of the observed m records contain the child in an activated state, assume
probabilitym
m+ 1.
– If a given scenario is nonexistent in the data, i.e., the joint probability ofa given combination of parents states was very small, assume the uniformdistribution for the child variable (Simple learning only).
In the remainder of this section, we will describe the three methods in detail:
Simple Learning
1. Perform a sweep through the dataset in search of records with only oneparent being in its activated state and compute the conditional probabilitiesfor the child node.
2. Since leak (denoted as L) is always taken into account, we are also interestedin the conditional probability of the child being present, when all of theparents are in their corresponding distinguished states.
3. So far, the obtained values are the so–called compound parameters pc [2],as they reflect the fact that implicit causes (leak node) might have actedupon the effect variable. In order to obtain each of the corresponding netparameters pn [6], we compute the following:
pn = 1− 1− pc1− pL
. (23)
In case of a small dataset, it might occur that pc < pL, leading to pn beinga negative value, in which case we assume a uniform distribution.
Weighted Least Squares Method
1. Express the data as system of linear equations (Equations 6 through 8).2. To reduce the potential error in the estimations, remove the equations which
were represented by fewer than 10 records. While more relaxed and flexiblerules can be considered here, they impact the general performance of thealgorithm minimally, and only for the smallest datasets.
3. Assume the following weight for each of the equations:
w = (m · 0.5δ)2 , (24)
where m is the total number of records describing a given equation, and δ isthe number of parents that were in their activated state in a given probabilis-tic relationship. We want to promote the equations which were representedby a larger share of the sample, but at the same time we want to penalizecomplex equations with many activated parents. Higher prevalence of thelatter results in more complex linear combination for the final parameter,increasing the error propagation. We have experimented with the degreeof penalty that could be applied to each equation, and found that weight

decreasing exponentially with the number of activated parents led to high-est accuracy 8. Proposed constants achieved the best results in preliminaryexperiments.
4. Apply the Weighted Least Squares method as described in the previous sec-tion. If any errors occur during learning (i.e., computed probability is neg-ative or larger than 1), compute given parameter using the Simple learningmethod described above.
Leaky–MAX Fitting to CPT
1. Initialize the CPT and the prior probabilities with uniform distributions.2. Perform the Expectation-maximization learning of the full CPT.3. Perform fitting of the Leaky–MAX parameters to thus obtained CPT using
the algorithm of Zagorecki and Druzdzel [10].9
4.3 Performance Assessment
This section describes our methodology for the performance evaluation of thetested algorithms (see Figure 5):
1. The first step differs for each of the experiments:(a) Leaky–MAX experiment: Parameters of the network (parents’ prior prob-
abilities and CPT) are randomized uniformly.(b) Noise–induced experiment: Parameters of the network are randomized
uniformly and then subjected to a Dirichlet noising with parameter κ.2. Thus obtained reference network is used for sampling of the datasets.3. Tested algorithms learn the Leaky–MAX parameters from the data and ex-
pand them to full CPT.4. Learned CPTs are compared against the original CPT using the Hellinger
distance [13].
We use two metrics based on the Hellinger distance to measure the average andmaximal errors within the learned CPT:
HMAX(P,Q) = max{H(P,Q, j) | j ∈ J} , (25)
HAVG(P,Q) = avg{H(P,Q, j) | j ∈ J} , (26)
where H(P,Q, j) is the Hellinger distance between the j-th columns (out of Jtotal) of the CPTs P and Q:
H(P,Q, j) =1√2
√√√√ I∑i=1
(√Pij −
√Qij)2
, (27)
and I is the number of states of the child node.8 Linear and polynomial penalty functions were also considered.9 Implementation of the Leaky–MAX fitting algorithm is available in
GeNIe/SMILE,software packages at http://genie.sis.pitt.edu/.

Initial MAX ReferenceHellinger
Learning
randomizeuniformly
randomizeDirichlet
generatedataset
CPT
CPT
distance
Fig. 5: Experiment flowchart. Dashed line is an noise–induced variant to theuniform randomization of the reference Leaky–MAX parameters.
4.4 Results
Figure 6 presents the results of the first experiment. We can observe almost unan-imous tendency for the Least Squares–based learning to achieve better accuracythan the Simple learning method. However, for 2 and 3 parents Leaky–MAX fit-ting seems to achieve the best performance in both average and maximal error.The situation changes as we increase the number of parents to 5 and 6, in whichcase the accuracy of the Leaky–MAX fitting deteriorates drastically.
Figure 7 presents the results in more detail for 100, 1000 and 2000 records.Each of the boxplots represents 1000 experiment repetitions, with the centerbox describing the 50% of cases between the two quartiles (also known as the in-terquartile range – IQR). The whiskers extend further by a distances of 1.5 ·IQR,with the outliers marked in red. Above each of the boxplots we gather four sta-tistical measures (rounded to 4 decimal points): mean (µ), median (x), standarddeviation (σ) and a win ratio (ω), last of which was also shown on a separate ploton the right. Win ratio is simply the fraction of the 1000 experiments in whichgiven method achieved the minimal distance among other algorithms (includingties). The best value for each of the statistics among the tested algorithms issignified with the boldface font.
Leaky–MAX fitting achieves the best overall performance for 2 parents byalmost all statistical measures across the experiment. Similar scenario (althoughnot as apparent) occurs for 3 parents, with Least Squares method performingakin to Leaky–MAX fitting in mean, median and win ratio. However, when welook at the case of 4 parents, the Least Squares method starts to outperformthe remaining methods and loses only to Simple learning in standard deviationfor 100 records. The effect continues to persist for 5 and 6 parents — for thelatter, Least Squares obtains the best statistical indicators for all three datasetsizes. Analyzing the corresponding plots of the win ratio suggests that the LeastSquares method is almost consistently better than the Simple learning approach,while for 4 and 6 parents it clearly outperforms both methods.
We show the results of the second experiment for 3, 4, and 5 parents inFigure 8. Since all methods assume certain unmet properties about the data, itis expected that the learning quality will deteriorate with lower values of κ. Forrelatively small deviation from the ideal Leaky–MAX (κ = 100), we observe that

the Least Squares method achieves the accuracy as good as the Simple learningmethod, and not clearly different from the previous experiment. As we divertaway from the perfect scenario (κ = 25 and 10) a degeneration in accuracy startsto occur, especially for the Least Squares method when assessed by the HMAX
metric. The Leaky–MAX fitting method seems to be more resistant to distortion,especially when one considers maximal error – the degeneration is not as severeas it is for the remaining methods.
Fig. 6: Simple learning, Least Squares method and Leaky–MAX fitting approach. Average over 1000repetitions.
4.5 Discussion
The degrading performance of the Leaky–MAX fitting for 4 and more parentsis not surprising, as the main drawback of the method is the lack of informationon the accuracy of the estimated parameters in the CPT after the Expectation-maximization algorithm. When the number of parents is small (i.e., 2 or 3 nodes,giving 4 and 8 parameters respectively), individual parameters in the CPT areestimated based on a larger share of the sample. However, exponential increase inthe number of CPT parameters, without a corresponding exponential increasein the number of records, must lead to higher frequency of poorly estimatedor missing entries in a CPT. Missing information on the individual parameters“quality” leads to higher error propagation during the Leaky–MAX fitting phase.
If we analyze the cases of 100–300 records and 5 parents, Least Squares andSimple learning methods perform similarly in terms of win ratio. This is due tothe fact that the Least Squares method falls back to Simple learning when theinformation within data is poorly estimated. However, as we increase the numberof records to 400 and more, we can notice an increasing difference between thetwo methods, suggesting a higher frequency of “exclusive wins” for the LeastSquares approach (similarly for 6 parents with a threshold of 500 records).
Noise–induced experiment revealed a poor performance of Least Squares ap-proach for the non-Leaky–MAX data. It is expected, as the assumptions about

Fig. 7: Statistical performance of Least Squares (L.Squares), Simple learning (Simple) and Leaky–MAX fitting (L-M fitting) methods. Mean (µ), median (x), standard deviation (σ) and win ratio(ω) over 1000 experiment repetitions (HAVG metric).
the Leaky–MAX distributions are not met – most of the presumed relationshipsbetween the equations and computations done, are simply incorrect. This leadsto a larger degree of error propagation in the final parameters. Simple learningfocuses only on the subset of data, without considering any relationships be-tween observations. Intuitively, minor utilization of the false assumptions aboutthe data in the simple method leads to fewer points of failure.

Fig. 8: Average accuracy of the Least Squres, Simple learning and Leaky–MAX fitting methodsfor various degrees of noise introduced to the learning data.
5 Conclusions
Learning Leaky–MAX parameters from data can be improved in terms of accu-racy by employing a method able to extract more information from the sample.The method proposed in this research achieves better results in terms of learn-ing precision than the simple approach and the Leaky–MAX fitting approach,assuming that the data fits the Leaky–MAX definition. By employing the as-sumptions of canonical models, we show that it is possible to render a connectionbetween the probabilistic relationships and linear algebra. This opens up roomfor future research, as we believe that the approach thus presented resonatesequally well with other canonical models. Besides a possible wider applicationof our solution, the core method itself can be improved as the problem of quasilinear regression presented in this research was given much attention in the fieldof regression analysis.

Acknowledgments
We acknowledge the support the National Institute of Health under grant num-
ber U01HL101066-01. Implementation of this work is based on SMILE,, aBayesian inference engine developed at the Decision Systems Laboratory andavailable at http://genie.sis.pitt.edu/.
References
1. Onisko, A., Druzdzel, M.J., Wasyluk, H.: Learning Bayesian network parametersfrom small data sets: Application of Noisy-OR gates. In: Working notes on theEuropean Conference on Artificial Intelligence (ECAI) Workshop Bayesian andCausal Networks: From Inference to Data Mining. (August 22 2000)
2. Henrion, M.: Some practical issues in constructing belief networks. In: Uncer-tainty in Artificial Intelligence 3 Annual Conference on Uncertainty in ArtificialIntelligence (UAI-87), Amsterdam, NL, Elsevier Science (1987) 161–173
3. Pearl, J.: Probabilistic Reasoning in Intelligent Systems: Networks of PlausibleInference. Morgan Kaufmann Publishers Inc., San Francisco, CA, USA (1988)
4. Heckerman, D.: A tutorial on learning with Bayesian networks. In Jordan, M.I.,ed.: Learning in Graphical Models. The MIT Press, Cambridge, Massachusetts(1998) Available on web at ftp://ftp.research.microsoft.com/pub/tr/TR-95-06.ps.
5. Dıez, F.J., Druzdzel, M.J.: Canonical probabilistic models for knowledge engineer-ing. Technical report, UNED, Madrid, Spain (2006)
6. Diez, F.: Parameter adjustment in Bayes networks. the generalized noisy OR-gate. In: Proceedings of the Ninth Conference Annual Conference on Uncertaintyin Artificial Intelligence (UAI-93), San Francisco, CA, Morgan Kaufmann (1993)99–105
7. Srinivas, S.: A generalization of the noisy-OR model. In: Proceedings of the NinthConference Annual Conference on Uncertainty in Artificial Intelligence (UAI-93),San Francisco, CA, Morgan Kaufmann (1993) 208–215
8. Zagorecki, A., Voortman, M., Druzdzel, M.J.: Decomposing local probability dis-tributions in Bayesian networks for improved inference and parameter learning. InSutcliffe, G., Goebel, R., eds.: Recent Advances in Artificial Intelligence: Proceed-ings of the Nineteenth International Florida Artificial Intelligence Research SocietyConference (FLAIRS–2006), Menlo Park, CA, AAAI Press (2006) 860–865
9. Friedman, N., Goldszmidt, M.: Learning Bayesian networks with local structure.In Jordan, M.I., ed.: Learning and Inference in Graphical Models. The MIT Press,Cambridge, MA (1999) 421–459
10. Zagorecki, A., Druzdzel, M.J.: Knowledge engineering for Bayesian networks: Howcommon are noisy-MAX distributions in practice? IEEE Transactions on Systems,Man, and Cybernetics: Systems 43(1) (January 2013) 186–195
11. Wasserman, L.: All of nonparametric statistics. Springer (2006)12. Onisko, A., Druzdzel, M.J.: Impact of precision of Bayesian network parameters on
accuracy of medical diagnostic systems. Artificial Intelligence in Medicine 57(3)(March 2013) 197–206
13. Gibbs, A.L., Su, F.E.: On choosing and bounding probability metrics. Internationalstatistical review 70(3) (2002) 419–435