Embed Size (px)
Citation preview
Purdue University Purdue University
Purdue e-Pubs Purdue e-Pubs
Open Access Dissertations Theses and Dissertations
12-2017
Learning Electron Transport Chain Process in Photosynthesis Learning Electron Transport Chain Process in Photosynthesis
Using Video and Serious Game Using Video and Serious Game
Cecilia Espinoza Morales Purdue University
Follow this and additional works at: https://docs.lib.purdue.edu/open_access_dissertations
Recommended Citation Recommended Citation Espinoza Morales, Cecilia, "Learning Electron Transport Chain Process in Photosynthesis Using Video and Serious Game" (2017). Open Access Dissertations. 1544. https://docs.lib.purdue.edu/open_access_dissertations/1544
This document has been made available through Purdue e-Pubs, a service of the Purdue University Libraries. Please contact [email protected] for additional information.
LEARNING ELECTRON TRANSPORT CHAIN PROCESS IN
PHOTOSYNTHESIS USING VIDEO AND SERIOUS GAME
by
Cecilia Espinoza Morales
A Dissertation
Submitted to the Faculty of Purdue University
In Partial Fulfillment of the Requirements for the degree of
Doctor of Philosophy
Department of Youth Development and Agricultural Education
West Lafayette, Indiana
December 2017
ii
THE PURDUE UNIVERSITY GRADUATE SCHOOL
STATEMENT OF DISSERTATION APPROVAL
Dr. Kathryn S. Orvis, Chair
Departments of Youth Development & Agricultural Education and
Horticulture & Landscape Architecture
Dr. Sean P. Brophy, Co-Chair
School of Engineering Education
Dr. Pamala V. Morris
Department of Youth Development & Agricultural Education
Dr. Todd R. Kelley
Purdue Polytechnic Institute
Approved by:
Dr. Mark Russell
Head of the Departmental Graduate Program

iii
Dedicada a mi familia, y a aquella visionaria y generosa profesora de ciencias que junto
a sus estudiantes ayudaron a que este proyecto se concretara.
iv
ACKNOWLEDGMENTS
This thesis would not have been possible without the guidance and contribution of
several people who participated in this study.
First, my gratitude to Dr. Kathryn S. Orvis, associate professor in Youth
Development & Ag. Education and Horticulture & L. Architecture Departments, who
was my major professor, for her valuable guidance and support to conduct this study.
Dr. Sean P. Brophy, associate professor of Engineering Education, who was my
co-advisor, for closely working with me in the design and development of this project.
Drs. Pamala V. Morris and Todd R. Kelley, members of my committee, for their
support and constructive feedback to successfully complete this research.
Ms. Jayne S. Price, Ms. Taylor K. Mears and Ms. Deirdre R. Carmicheal, for their
administrative support to help me fulfill the academic requirements during my doctoral
program.
Mr. Cody R. Bouse, from the Purdue Statistical Consulting Services, for
providing advice on the statistical analysis in this dissertation. Lafayette School
Corporation for their collaboration and in interest in being part of my research.
Last, my deep gratitude to the anonymous teacher and her students as well as the
Lafayette School Corporation for their collaboration and in interest in being part of my
research.
My graduate program at Purdue University would not have been possible without
the generous support of the Chilean National Commission for Science and Technology
(CONICYT) and the Fulbright Commission.
v
TABLE OF CONTENTS
LIST OF TABLES ............................................................................................................. xi
LIST OF FIGURES ......................................................................................................... xiv
ABBREVIATIONS ......................................................................................................... xvi
ABSTRACT .................................................................................................................... xvii
CHAPTER 1: INTRODUCTION ....................................................................................... 1
1.1 Background of the Problem ...................................................................................... 1
1.2 Statement of the Problem .......................................................................................... 7
1.3 Significance of the Study .......................................................................................... 8
1.4 Purpose of the Study ................................................................................................. 9
1.5 Research Question .................................................................................................. 10
1.6 Assumptions ............................................................................................................ 11
1.7 Limitations of the Study ......................................................................................... 11
1.7.1 Absence of a Pilot Study .................................................................................. 11
1.7.2 Treatments Constituted by Intact Classes ........................................................ 12
1.8 Definition of Terms ................................................................................................ 13
1.9 Summary ................................................................................................................. 15
CHAPTER 2: LITERATURE REVIEW .......................................................................... 16
2.1 Philosophy of Biology ............................................................................................ 18
2.2 Learning through Visual Representations ............................................................... 21
2.2.1 Design of the ETC video .................................................................................. 22
2.2.2 The Electron Transport Chain Process in Photosynthesis ............................... 27
2.2.2.1. Definition of photosynthesis .................................................................... 27
2.2.2.2. Definition of the electron transport chain (ETC) process in photosynthesis
............................................................................................................................... 28
2.2.3 Design of the Electron Chute Game ................................................................ 33
2.2.3.1 Constructivist theory of knowing.............................................................. 33
2.2.3.2 The epistemic game framework ................................................................ 34
2.2.3.3 Learning through meaningful repetition ................................................... 35
2.2.3.4 Additional Educational Explanations about Electron Chute .................... 35
vi
2.3 Design of the Instructional Intervention ................................................................. 39
2.3.1 Learning Outcomes .......................................................................................... 39
2.3.1.1 Learning Outcomes of the Lesson Activities about Photosynthesis ......... 40
2.3.1.2 Learning outcomes of the ETC video and the Electron Chute game
learning experiences.............................................................................................. 41
2.4 Assessment .............................................................................................................. 44
2.5 Summary ................................................................................................................. 47
CHAPTER 3: METHODS ................................................................................................ 48
3.1 Purpose of the Study ............................................................................................... 50
3.2 Research Question .................................................................................................. 51
3.3 Participants .............................................................................................................. 53
3.4 Instructional Intervention ....................................................................................... 54
3.4.1 Classroom Procedure ....................................................................................... 58
3.4.1.1 Pre-test Day ............................................................................................... 58
3.4.1.2 Treatment Day .......................................................................................... 60
3.5 Data Collection Methods ........................................................................................ 61
3.5.1 Instrument (Knowledge test) ........................................................................... 61
3.5.1.1 Instrument Validity ................................................................................... 62
3.5.1.2 Analysis of the Items of the Instrument-Difficult and Discrimination
Indices ................................................................................................................... 62
3.5.2 Exit Survey ...................................................................................................... 64
3.6 Data Analysis .......................................................................................................... 67
3.6.1 Multiple-Choice Section Analysis .................................................................. 67
3.6.1.1 Differences in Achievement of Learning Outcomes between Treatments
for the Multiple-Choice-Two Independent Variables ........................................... 67
3.6.1.2 Effect of Treatments on Overall Average Score Gain for the Multiple-
Choice ................................................................................................................... 71
3.6.1.3 Effect of Academic Readiness-Challenge versus Regular-on Overall
Average Score Gain for the Multiple-Choice ....................................................... 72
3.6.1.4 Effect of Treatment between Academic Readiness on Overall Average
Score Gain for the Multiple-Choice ...................................................................... 72
vii
3.6.2 Essay Section Analysis ................................................................................... 74
3.6.2.1 Differences in the Average Overall Score between Treatments for the
Essay-Two Independent Variables ....................................................................... 74
3.6.2.2 Effect of Treatments on Overall Average Score Gain for the Essay ........ 80
3.6.2.3 Effect of Academic Readiness-Challenge versus Regular-on Overall
Average Score Gain for the Essay ........................................................................ 81
3.6.2.4 Effect of Treatment between Academic Readiness on Overall Average
Score Gain for the Essay ....................................................................................... 82
3.6.3 Quantitative Analysis of the Survey ................................................................ 83
3.6.3.1 Students' Reactions to the ETC Video and the Electron Chute Game
Learning Experiences............................................................................................ 84
3.6.3.2 Effect of Treatments on Students' Reactions to the Video and Game and
Interest in Science ................................................................................................. 86
3.6.3.3 Effect of Academic Readiness-Challenge versus Regular Classes-on
Students' Reactions to the Video and Game and Interest in Science .................... 88
3.6.3.4 Effect of Treatment between Academic Readiness on Students' Reactions
to the Video and Game and Interest in Science .................................................... 91
3.6.4 Qualitative Analysis for the Open-Ended Questions of the Survey................. 92
3.6.5 Class Recording Analysis ................................................................................ 93
3.6.5.1 Reliability of the Classification Procedure ............................................... 97
3.7 The Electron Chute Game ...................................................................................... 99
3.7.1 Layout and Rules of Electron Chute ................................................................ 99
3.7.1.1 Features of Electron Chute ....................................................................... 99
3.7.1.2 Organization of Electron Chute ................................................................ 99
3.7.1.3 Set up ...................................................................................................... 100
3.7.1.4 Turn Taking ............................................................................................ 101
3.7.2 Rules Summary .............................................................................................. 103
3.8 Summary ............................................................................................................... 104
CHAPTER 4: RESULTS ................................................................................................ 105
4.1 Purpose of the Study ............................................................................................. 106
4.2 Research Question ................................................................................................ 106
viii
4.3 Knowledge Test Results ....................................................................................... 107
4.3.1 Multiple-Choice Section ................................................................................ 109
4.3.1.1 Analysis of the Items of the Instrument-Difficult and Discrimination
Indexes ................................................................................................................ 109
4.3.1.2 Differences in Achievement of Learning Outcomes between Treatments
for the Multiple-Choice....................................................................................... 121
4.3.2 Essay Section ................................................................................................. 126
4.3.2.1 Differences in the Scores Gain between the Treatments for the Essay .. 126
4.3.2.2 Differences in Students' Interpretation of the ETC Representation between
the Treatments for the Essay ............................................................................... 129
4.3.3 Analysis of the Items and Essay -Learning Outcomes .................................. 133
4.3.4 Effect of Treatments and Academic Readiness on Score Gain ..................... 159
4.3.4.1 Effect of Treatments on Score Gain for the Multiple-Choice................. 159
4.3.4.2 Effect of Treatments on Score Gain for the Essay .................................. 165
4.3.4.3 Effect of Academic Readiness on Score Gain for the Multiple-Choice . 171
4.3.4.4 Effect of Academic Readiness on Score Gain for the Essay .................. 176
4.3.4.5 Effect of Treatment between Academic Readiness on Score Gain for the
Multiple-Choice .................................................................................................. 181
4.3.4.6 Effect of Treatment between Academic Readiness on Score Gain for the
Essay ................................................................................................................... 186
4.3.5 Correlation Between Variables ...................................................................... 193
4.4 Class Recording Results ...................................................................................... 195
4.4.1 Game Actions that do not Follow the Rules .................................................. 202
4.4.1.1 In Each Turn, the Player does not Lay Down all Possible Cards ........... 202
4.4.1.2 In Each Turn, the Player does not Start his or her Turn with Five Cards
............................................................................................................................. 205
4.4.1.3 In Each Turn, the Player Forgets that the First Action is to Pick Up the
Cards .................................................................................................................. 206
4.4.1.4 In Each Turn, the Player Forgets that the Second Action is to Move the
Electrons ............................................................................................................. 206
ix
4.4.1.5 In Each Turn, the Player does not Discard a Card at the End of the Turn
............................................................................................................................. 208
4.4.1.6 The Player does not Follow the Rules of the Electrons Movement from
Position 1 to Position 5 on the Board ................................................................. 208
4.4.1.7 After Laying Light, Chlorophyll and Water Cards on Position 1-and
Generating Electrons- the Player Forgets to Pick Up an Oxygen (O2) Card L.O.10
............................................................................................................................. 211
4.4.1.8 The Player Moves the Protons to Lumen when the Electrons Pass from
Position 2 to 3 but Forgets to Move Back the Four-Protons Card from ATP
Synthase to its Position in the Stroma................................................................. 211
4.4.1.9 The Player Forgets to Roll the die when Electrons Move from Position 2
to 3 to Win ATP. L.O.8....................................................................................... 212
4.4.1.10 The Player Forgets to Roll the die when Electrons Move from Position 4
to 5 to win NADPH. L.O.11 ............................................................................... 212
4.4.1.11 The Player does not Seem to Know when to Start Rolling the die to Win
CO2 ...................................................................................................................... 213
4.4.1.12 The Player Stacks the Cards on the Same Positions on the Board ....... 214
4.4.1.13 The Player is not Aware that Light is a Limiting Factor and then There
are fewer Light Cards.......................................................................................... 215
4.4.1.14 The Player does not Seem to Know how to Simultaneously Play with
PSII and PSI ........................................................................................................ 216
4.5 Exit Survey Results .............................................................................................. 219
4.5.1 Quantitative Analysis of the Survey .............................................................. 220
4.5.1.1 Students' Reactions to the Video and Game Learning Experiences ....... 220
4.5.1.2 Effect of Treatments on Students' Reactions to the Video and Game and
Interest in Science ............................................................................................... 221
4.5.1.3 Effect of Academic Readiness on Students' Reactions to the Video and
Game and Interest in Science .............................................................................. 222
4.5.1.4 Effect of Treatment between Academic Readiness on Students' Reactions
to the Video and Game and Interest in Science .................................................. 224
4.5.2 Qualitative Analysis for the Open-Ended Questions of the Survey............... 227
x
4.6 Summary ............................................................................................................... 231
CHAPTER 5: DISCUSSION .......................................................................................... 232
CHAPTER 6: CONCLUSIONS ..................................................................................... 247
6.1 Conclusions of the Study ...................................................................................... 247
6.2 Limitations ............................................................................................................ 251
6.3 Recommendations ................................................................................................ 254
6.3.1 Recommendations for Teachers ..................................................................... 254
6.3.2 Recommendations for Designers ................................................................... 254
6.4 Summary .............................................................................................................. 256
REFERENCES ............................................................................................................... 257
APPENDICES ................................................................................................................ 268
APPENDIX A: ETC Video Story Board and Scripts ..................................................... 269
APPENDIX B: Instrument .............................................................................................. 271
APPENDIX C: Exit Survey ............................................................................................ 280
APPENDIX D: Lesson-Introduction to Photosynthesis ................................................. 281
APPENDIX E: Determination of Starch in the Leaves .................................................. 288
APPENDIX F: IRB Form ............................................................................................... 293
APPENDIX G: Improved Set of Rules for Electron Chute ............................................ 294
APPENDIX H: ANOVA for Class Recording Classification Procedures ..................... 304
APPENDIX I: Presentation of Rules Given to all Students Before Playing the Game 310
VITA ............................................................................................................................... 315
xi
LIST OF TABLES
Table 1: Learning Outcomes, Misconceptions, Instrument Items, Instructional
Intervention and Treatments ....................................................................................... 45
Table 2: Participants of the Study ..................................................................................... 54
Table 3: Sequence of Instruction Leading up to the Intervention and Sequence of Steps in
the Treatments ............................................................................................................. 56
Table 4: A Number of Participants Taking the Survey per each Treatment ..................... 64
Table 5: Survey Statements Listed in Order of Presentation on Survey ........................... 65
Table 6: ANOVA -Calculation of the p-Value for Inter-Rater Reliability for the Scoring
Rubric for the Essay .................................................................................................... 79
Table 7: Categories and Codes for the Classroom Recording Data.................................. 94
Table 8: Effect of the Treatments on Students’ Achievement of Learning Outcomes and
Misconceptions ......................................................................................................... 122
Table 9: Students' Correct Answers about Photosynthesis and ETC in the Pretest and
Posttest - A Comparison between Treatments for the Multiple-Choice Section ..... 124
Table 10: Students' Average Overall Scores in the Essay Section of the Pretest and
Posttest in Relation to their Interpretation of ETC. A Comparison between the
Treatments................................................................................................................. 128
Table 11: Students' Interpretation of the ETC Representation in the Pretest and Posttest -
A Comparison between Treatments for the Essay .................................................... 130
Table 12: Effect of Treatments on Students’ Ability to Interpret the ETC Representation
in the Essay ............................................................................................................... 132
Table 13: Analysis of the Keyed Response and Distractors for Items 1 to 3 and Learning
Outcomes 1 to 3 ........................................................................................................ 136
Table 14: Analysis of the Keyed Response and Distractors for Item 4 and Learning
Outcome 4 ................................................................................................................. 137
Table 15: Analysis of the Keyed Response and Distractors for Item 5 and Learning
Outcome 5 ................................................................................................................. 139
xii
Table 16: Analysis of the Keyed Response and Distractors for Item 6 and Learning
Outcome 6 ................................................................................................................. 142
Table 17: Analysis of the Keyed Response and Distractors for Item 7 and Learning
Outcome 7 ................................................................................................................. 144
Table 18: Analysis of the Keyed Response and Distractors for Item 8 and Learning
Outcome 8 ................................................................................................................. 147
Table 19: Analysis of the Keyed Response and Distractors for Item 9 and Learning
Outcome 9 ................................................................................................................. 150
Table 20: Analysis of the Keyed Response and Distractors for Item 10 and Learning
Outcome 10 ............................................................................................................... 151
Table 21: Analysis of the Keyed Response and Distractors for Item 11 and Learning
Outcome 11 ............................................................................................................... 154
Table 22: Analysis of the Keyed Response and Distractors for Item 12 and Learning
Outcome 12 ............................................................................................................... 157
Table 23: Evaluating Differences for Score Gain between Treatment divided into Regular
and Challenge Classes (α value = 0.05) for the Multiple-Choice Section ................ 164
Table 24: Evaluating Differences for Score Gain between Treatment divided into Regular
and Challenge Classes (α value = 0.05) for the Essay .............................................. 170
Table 25: The Most Frequent Actions Performed by Students while Playing the Game|
................................................................................................................................... 196
Table 26: Comparison between the Game Actions Performed by Female and Male
Students ..................................................................................................................... 200
Table 27: Students' Affirmative Responses about the Video and Game -Effect of
Treatments................................................................................................................. 222
Table 28: Students' Affirmative Responses about the Video and Game -Effect of
Academic Readiness ................................................................................................. 223
Table 29: Students' Affirmative Responses about the Video and Game -Effect of
Treatments between Academic Readiness ................................................................ 225
Table 30: Students' Open-Ended Responses from Exit Survey about the Video and Game
................................................................................................................................... 229

xiii
Table 31: Students' Open-Ended Responses about the Video and Game - A Comparison
between Challenge and Regular Classes................................................................... 230
xiv
LIST OF FIGURES
Figure 1: Conceptual Map of the Research Frameworks .................................................. 17
Figure 2: A representation of the inputs and outputs of the ETC process in photosynthesis
to design the ETC video and game ............................................................................. 22
Figure 3: A representation of (a) the process of photosynthesis at a macro level and (b) at
the micro level, a leaf anatomy showing cells with chloroplasts, a chloroplast with
thylakoids and a thylakoid with its membrane and lumen, the liquid area inside the
thylakoid sac. .............................................................................................................. 23
Figure 4: The ETC process in photosynthesis from the leading book .............................. 24
Figure 5: Electron Chute board game showing a representation of (a) the location of the
thylakoid membrane within a leaf chloroplast; (b) the steps involved in the ETC
process......................................................................................................................... 26
Figure 6: Amplification of a piece of thylakoid membrane (right) showing a
representation of the proteins involved in the ETC process in photosynthesis. ......... 30
Figure 7: Representation of the transformation of sunlight energy into ATP. The
synthesis of ATP is the consequence of an active transport of H+ from stroma a
lumen against their concentration gradient which is activated by the flow of electrons
from PSII to the proton pump. .................................................................................... 31
Figure 8: Representation of the photolysis of water molecules by sunlight energy and the
transference of electrons from water to PSII in the ETC process in photosynthesis.
Oxygen is produced .................................................................................................... 32
Figure 9: Representation of the production of NADPH in the ETC process in
photosynthesis ............................................................................................................. 32
Figure 10: Score distribution for the instrument pretest (a) and posttest (b), and for the
multiple-choice section (c) pretest and (d) posttest. ................................................. 110
Figure 11: Score distribution for the instrument pretest (a) and posttest (b), and for the
essay section (c) pretest and (d) posttest. .................................................................. 127
Figure 12: Score distribution for the multiple-choice section for the (a) pretest and (b)
posttest in the treatments ........................................................................................... 160

xv
Figure 13: Score distribution for the score gain between pretest and posttest (a) for the
whole class (N=115) and for the treatments (b) video only (N= 57) and (c)
video+game (N =58) -Multiple-Choice section. ....................................................... 162
Figure 14: Score distribution for the essay section for the (a) pretest and (b) posttest in the
treatments .................................................................................................................. 166
Figure 15: Score distribution for the score gain between pretest and posttest (a) for the
whole class and for the treatments (b) video only (N= 57) and (c) video+game (N
=58) -Essay section. .................................................................................................. 168
Figure 16: Score distribution for the multiple-choice section for the (a) pretest and (b)
posttest in the challenge (N=49) and the regular (N=66) classes. ............................ 172
Figure 17: Score distribution of score gain between pretest and posttest (a) for the whole
class (N=115) and for the classes (b) challenge (N= 49) and (c) regular (N =66)-
Multiple-Choice section ............................................................................................ 173
Figure 18: Score distribution for the essay for the (a) pretest and (b) posttest in the
challenge (N=49) and the regular (N=66) classes. ................................................... 177
Figure 19: Score distribution of score gain between pretest and posttest (a) for the whole
class (N=115) and for the classes (b) challenge (N= 49) and (c) regular (N =66)-
Essay section.. ........................................................................................................... 178
Figure 20: Score distribution of score gain between (a) pretest and (b) posttest for the
treatments between classes-Multiple-Choice section ............................................... 182
Figure 21: Score distribution of score gain between pretest and posttest for the (a) video
only-regular (N=29); (b) video only-challenge (N=28); (c) video+game-regular
(N=37) and (d) video+game-challenge (N=21)-Multiple-Choice section ................ 184
Figure 22: Score distribution of score gain in the (a) pretest and (b) posttest for the
treatments between classes -Essay section... ............................................................ 188
Figure 23: Score distribution of score gain in the pretest and posttest (a) for the (a) video
only-regular (N=29); (b) video only-challenge (N=28); (c) video+game-regular
(N=37) and (d) video+game-challenge (N=21) -Essay section.... ............................ 190
Figure 24: Percentage of actions performed by the players within a community of their
peers... ....................................................................................................................... 197

xvi
ABBREVIATIONS
ANOVA Analysis of Variance
xvii
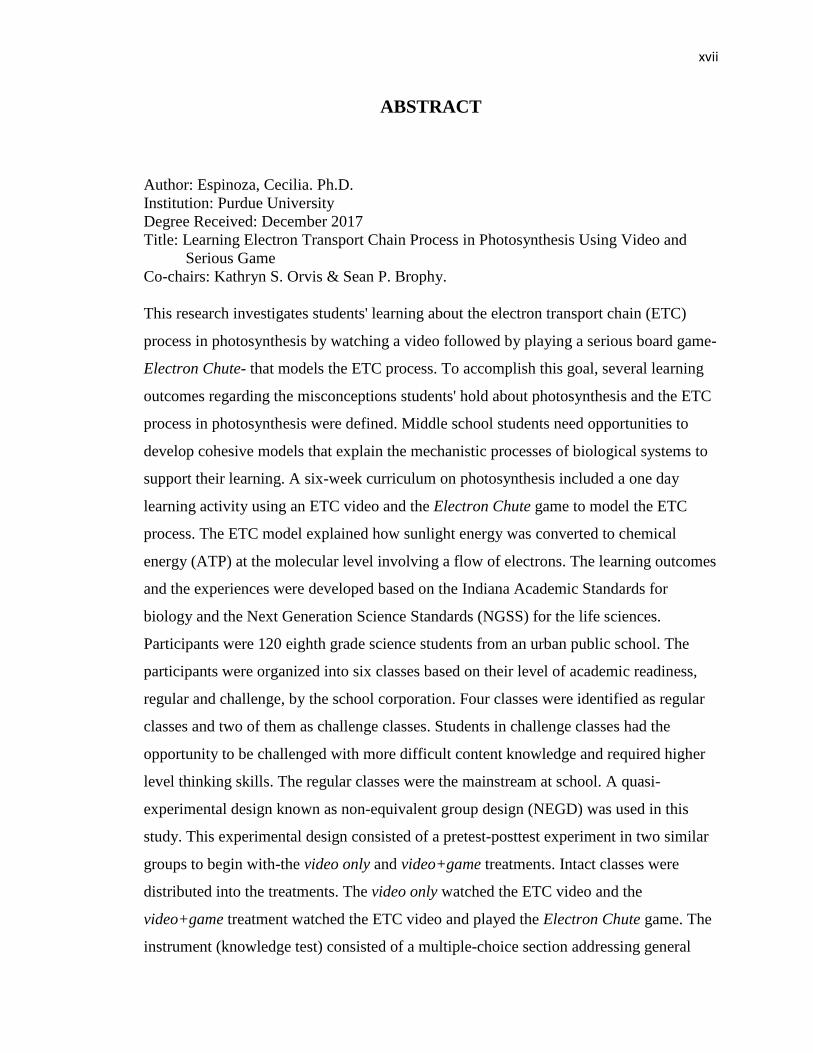
ABSTRACT
Author: Espinoza, Cecilia. Ph.D.
Institution: Purdue University
Degree Received: December 2017
Title: Learning Electron Transport Chain Process in Photosynthesis Using Video and
Serious Game
Co-chairs: Kathryn S. Orvis & Sean P. Brophy.
This research investigates students' learning about the electron transport chain (ETC)
process in photosynthesis by watching a video followed by playing a serious board game-
Electron Chute- that models the ETC process. To accomplish this goal, several learning
outcomes regarding the misconceptions students' hold about photosynthesis and the ETC
process in photosynthesis were defined. Middle school students need opportunities to
develop cohesive models that explain the mechanistic processes of biological systems to
support their learning. A six-week curriculum on photosynthesis included a one day
learning activity using an ETC video and the Electron Chute game to model the ETC
process. The ETC model explained how sunlight energy was converted to chemical
energy (ATP) at the molecular level involving a flow of electrons. The learning outcomes
and the experiences were developed based on the Indiana Academic Standards for
biology and the Next Generation Science Standards (NGSS) for the life sciences.
Participants were 120 eighth grade science students from an urban public school. The
participants were organized into six classes based on their level of academic readiness,
regular and challenge, by the school corporation. Four classes were identified as regular
classes and two of them as challenge classes. Students in challenge classes had the
opportunity to be challenged with more difficult content knowledge and required higher
level thinking skills. The regular classes were the mainstream at school. A quasi-
experimental design known as non-equivalent group design (NEGD) was used in this
study. This experimental design consisted of a pretest-posttest experiment in two similar
groups to begin with-the video only and video+game treatments. Intact classes were
distributed into the treatments. The video only watched the ETC video and the
video+game treatment watched the ETC video and played the Electron Chute game. The
instrument (knowledge test) consisted of a multiple-choice section addressing general
xviii
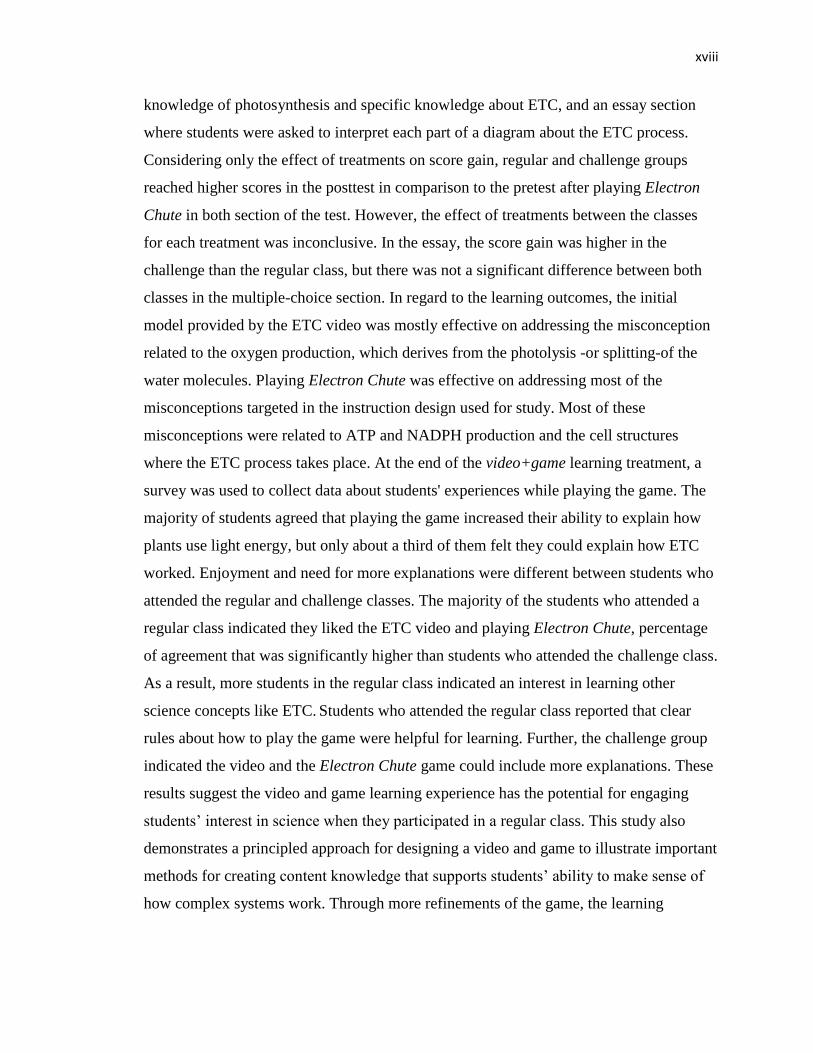
knowledge of photosynthesis and specific knowledge about ETC, and an essay section
where students were asked to interpret each part of a diagram about the ETC process.
Considering only the effect of treatments on score gain, regular and challenge groups
reached higher scores in the posttest in comparison to the pretest after playing Electron
Chute in both section of the test. However, the effect of treatments between the classes
for each treatment was inconclusive. In the essay, the score gain was higher in the
challenge than the regular class, but there was not a significant difference between both
classes in the multiple-choice section. In regard to the learning outcomes, the initial
model provided by the ETC video was mostly effective on addressing the misconception
related to the oxygen production, which derives from the photolysis -or splitting-of the
water molecules. Playing Electron Chute was effective on addressing most of the
misconceptions targeted in the instruction design used for study. Most of these
misconceptions were related to ATP and NADPH production and the cell structures
where the ETC process takes place. At the end of the video+game learning treatment, a
survey was used to collect data about students' experiences while playing the game. The
majority of students agreed that playing the game increased their ability to explain how
plants use light energy, but only about a third of them felt they could explain how ETC
worked. Enjoyment and need for more explanations were different between students who
attended the regular and challenge classes. The majority of the students who attended a
regular class indicated they liked the ETC video and playing Electron Chute, percentage
of agreement that was significantly higher than students who attended the challenge class.
As a result, more students in the regular class indicated an interest in learning other
science concepts like ETC. Students who attended the regular class reported that clear
rules about how to play the game were helpful for learning. Further, the challenge group
indicated the video and the Electron Chute game could include more explanations. These
results suggest the video and game learning experience has the potential for engaging
students’ interest in science when they participated in a regular class. This study also
demonstrates a principled approach for designing a video and game to illustrate important
methods for creating content knowledge that supports students’ ability to make sense of
how complex systems work. Through more refinements of the game, the learning

xix
experiences could be a viable learning experience that accommodates the needs of a
diverse population of students who might prefer different learning methods.
1
CHAPTER 1. INTRODUCTION
Chapter 1 introduces the research problem and the purpose of the study. It
presents the research question, the limitations and the assumptions of this dissertation.
The final section defines the key terms of this work.
1.1 Background of the Problem
The present work develops and explores an instructional approach for promoting
middle school students’ learning of an energy transformation process in a biological
system in photosynthesis. The energy transformation process is known as electron
transport chain (ETC) and refers to a chain of reactions involving a flow of electrons that
in plants is activated by sunlight energy. One of the learning outcomes for eighth grades
in life sciences is photosynthesis (National Research Council, 2012). The learning
experiences in middle school science lessons about photosynthesis teach basic facts of
plant structure and the role of plants in taking in carbon dioxide (CO2) from the
environment and releasing oxygen (O2) to it for human consumption -Indiana Academic
Standards-Biology Standard 2 (Indiana Department of Education, 2016). The Next
Generation Science Standards (NGSS) for the life sciences-LS1.C: organization for
matter and energy flow of organisms- indicates as a discipline core idea the learning of
how organisms obtain and use the matter and energy they need to live and grow (NGSS,
2013). Specifically, for middle school students, the LS1.C states that plants use the
energy from sunlight, water and CO2 to synthesize carbohydrates, and releases O2
through photosynthesis (NGSS, n.d.). However, few lessons provide a more

2
comprehensive model of how plant organisms transform sunlight (electromagnetic)
energy into chemical energy for their own survival. The ETC process in photosynthesis is
important for plants because it is the mechanism used by plants to transform the
electromagnetic energy from the sun into the chemical energy plants needs to form plant
matter, build cell structures, and it maintains plants’ activities to survive (Lawlor &
Cornic, 2002).
Middle school students need to develop a more comprehensive model of how the
energy transformation process in plant photosynthesis works and clarify their
misconceptions about photosynthesis. The challenge is identifying learning experiences
that make abstract processes that occur at the cellular level like ETC in photosynthesis
accessible to young learners. The premise is that by making it more accessible, more
students will engage in the activity and increase their ability to explain the phenomenon
and their interest in pursuing other scientific endeavors (Honey & Hilton, 2011). Many
middle school students are finalizing their decision to pursue a STEM (science,
technology, engineering and mathematics) career before they enter high school (Honey,
Pearson, Schweingruber, 2014). Therefore, often middle school is the last chance to
influence students to consider tracking themselves into STEM pathways. For that reason,
instructional methods that can increase students’ abilities and interest in science must
occur at the middle school level if there is any chance of increasing the number of
students pursuing it (Honey, Pearson, Schweingruber, 2014).
One conjecture for using serious games in formal educational is that the informal
activity of game play is engaging to more learners because it is fun (Elias, Garfield,
Gutschera & Whitley, 2012) and less school-like (Gee, 2003). Therefore, this kind of
3
informal learning experience can be a satisfying inroad to complex ideas for students who
may need a different approach for learning.
The present research uses visual representations to foster learning (Gordin & Pea,
1995; Mayer & Moreno, 2002) because they provide a knowledge structure (Collins &
Ferguson, 1993), help learners assimilate considerable amount of information in a short
period of time and support students to create their own model or schema (Kraidy, 2002).
The visual representations were part of a video and a serious game about the ETC process
created by the researcher.
The ETC video was used to familiarize students with the transition from macro
(environment, plant, leaves) to micro (cells, chloroplast, thylakoid membrane, electrons)
levels in photosynthesis. The ETC video started with the absorption of sunlight by a
plant's leaf, continue with the absorption of sunlight by the chloroplast structures known
as thylakoids, and ended with the production of two molecules -Adenosine Triphosphate
(ATP) and Nicotinamide Adenine Phosphate (NADPH)- because of the flow of electrons
activated by sunlight. The ETC video showed step by step the process of the flow of
electrons through the thylakoid membrane and it was the basic representation for the
development of the game. More information about the design of the ETC video is
provided in Chapter 2.
Serious games are educational games designed to engage students in learning
(Aldrich, 2009). Serious games provide one method for achieving formal learning
outcomes through more informal learning experiences (Gee, 2003). They provide a
constructivist learning environment (Hainey, Connolly, Stansfield & Boyle, 2011) and
engage students in the learning process (Annetta, 2010). Serious games support science
4
understanding by allowing learners to visualize a phenomenon in the classroom and
mentally create a link between the representation and the unseen process (Honey &
Hilton, 2011). The serious game developed for this study was a board game consisting of
a visual representation at the molecular level of the ETC process with particular features
that helped students acquire vocabulary about the energy transformation process. The
game actions were analogous to the movement and reactions associated with the flow of
electrons in the ETC process that transforms sunlight energy into chemical energy (ATP).
The game actions were developed to support students' ability to interpret and explain the
ETC process. The board game was called Electron Chute.
The premise for using a video and serious game as learning experiences comes
from knowing how students learn to support their future inquiry (Bransford, Brown,
Cocking, Donovan, & Pellegrino, 2000). The learning activities of the ETC video and the
Electron Chute game use a constructivist theory of knowing and the how people learn
framework for supporting their design (Schwartz, Brophy, Lin & Bransford, 1999;
Bransford et al., 2000).
Under the constructivist theory of knowing, people learn by assimilating new
information into their current knowledge structure (Savery & Duffy, 1995). The structure
of knowledge in people's mind is defined as schema (pl. schemata), it represents generic
knowledge and it is the basis of schema theory (Anderson, 1978). According to Anderson
(1978), "a schema is conceived to contain a slot or placeholder for each component" (p.
4) of a representation. Schema theory as a theoretical perspective of how people process
information explains that individuals learn by constructing mental models or
5
representations of their surrounding world in their minds (Johnson-Laird, 1983; Wilson &
Rutherford, 1989). These models can become devices a learner can use to organize
information in ways that increase their chance for retrieval, or they can be used to build
new schema and generate new knowledge (Cowley, Charles, Black & Hickey, 2008).
In the present work, the initial mental model, or schema of ETC, to explain how a
complex phenomenon like ETC works was provided by the ETC video (Mayer &
Moreno, 2002). The ETC video narrative and visuals provided participants with a model
for describing the transformation of sunlight energy to chemical energy by starting with
what students know, a plant in nature. Then during the play of Electron Chute the
learners revisit this model with each players’ turn reenacting the ETC process. The
conversation between players to review the possible moves leverages social construction
of knowledge by multiple players to learn the vocabulary and subtleties of the processes.
The design of Electron Chute aimed to support learning with a game and
leveraged constructivist theories of knowing with specific reference to (1) the visual
representation of the ETC (Gordin & Pea, 1995) to provide a schema (Anderson, 1978;
Derry, 1996); (2) the refinement of vocabulary through labels on game board (Baker,
1995); (3) and causal relationships reinforced by the repetitive movement of the two-
electron cards the players master when playing the game. The blending of learning
mechanisms into a game experience using the epistemic game framework (Collins &
Ferguson, 1993) to organize the visual layout of the game into usual model of the
biological system and the rules of the game as illustrations of dynamic actions in the
system. The representation of the ETC video and the Electron Chute game was critical to
6
making it accessible to the target learners and scientifically accurate (Treagust,
Chittleborough & Mamiala, 2002). Therefore, the design of the ETC video and Electron
Chute depended on defining the ETC model and the processes that governed its behavior
on formal models used by scientists to explain the phenomenon (Lehninger, Nelson &
Cox, 2005).
Under the how people learn framework, the combination of viewing the ETC
video and iterative reenactment of the process through the play of Electron Chute created
a well-balanced learning environment that posited four attributes: (1) knowledge about
the phenomenon relative to the standard; (2) center on learners’ need to engage in
activity; (3) continual assessment of what the learners know which is obtained through
game play within a community of their peers; (4) build a sense of community that helps
one another solve problems by building on each other's knowledge (Bransford et al.,
2000, p. 23-25).
The researcher' claim is that the general model about photosynthesis presented to
students is incomplete. This is because it does not explain photosynthesis as a biological
process that involves the machinery to transform electromagnetic energy from the
universe (sunlight energy) to chemical energy (ATP) connected to a flow of electrons.
This energy is used and stored by plants inside each one of their cells for their survival
(Lawlor & Cornic, 2002). In the academic standards, photosynthesis is a simple
description of a plant as a system that takes in sunlight, water and CO2, and converts
them in carbohydrates and O2 (Indiana Department of Education, 2016; NGSS, 2013).
Therefore, it is expectable that students hold misconceptions about the energy
transformation process of photosynthesis. The ETC video and Electron Chute are models
7
of how the ETC process works and were developed to support students' learning by
teaching new vocabulary of ETC, engaging learners in peer discussion using a game
format and addressing common misconceptions. These might help learners to be
conscious of their own misconceptions and clarify misconceptions about the energy
transformation of photosynthesis.
It was not part of this research to do a qualitative study to find the misconceptions
participants' hold about the ETC process of photosynthesis. Rather, the present study
used information in regard to misconceptions of the phenomenon found in the literature
to design a ETC video and game that could address them and support students' learning
of ETC process from a biological point of view.
1.2 Statement of the Problem
Limited research has been done in how to enhance students' knowledge of energy
transformation in biological settings connected to the flow of electrons. The knowledge
associated with this biological phenomenon is filled with difficult vocabulary for middle
school to pronounce and remember. In addition, students have difficulties visualizing and
understanding how the transformation of sunlight energy into ATP and carbohydrates
occurs. This study involves an abstract representation of an invisible process used to
illustrate the excitation and movement of electrons involved in chemical reactions. These
kinds of representational models may be new to many students and difficult for them to
interpret. Therefore, it is posited that young learners need a model of the ETC process
that provides an explanatory level of the phenomenon in terms they can comprehend and
provides a useful representation for more sophisticated models they will use in the future.
8
1.3 Significance of the Study
Photosynthesis is a key plant process taught in life sciences that is introduced to
elementary students and is revisited across the curriculum at the middle and high school
levels (Quinn, 2011; NGSS n.d.). Middle school science instruction of photosynthesis
typically concludes with students' ability to repeat the definition of photosynthesis that
explains why leaves are green and how plants provide oxygen. In middle school, students
are expected to learn about photosynthesis as an energy transformation process; however,
the standards do not mention the ETC process-Indiana Academic Standards-Biology
(Indiana Department of Education, 2016) and the NGSS standards (NGSS, 2013).
Students may often have an incomplete model of how photosynthesis works and
insufficient knowledge that leads to misconceptions (Deshmukh, 2015). Considering that
ETC is the energy transformation process of photosynthesis, learners need coherent
models that supports their comprehension of ETC. Specifically, where the ETC process
takes place in the plant, the causal chain of events initiated by sunlight energy and the
connection between the transformation of the energy from the sun to chemical energy
(ATP) with a flow of electrons inside the plant cells.
In the present study the researcher developed a video and a game about ETC.
They were designed to help students relate the transformation of sunlight
(electromagnetic) energy into chemical energy (ATP) to a flow of electrons and address
the misconceptions students hold regarding the ETC process in photosynthesis. The
novelty of Electron Chute is in that it explicitly shows that the energy transformation
process requires a flow of electrons to occur, sequence that is mimicked by engaging
students in physical moves of electrons cards. In Electron Chute, the outputs of the ETC
9
process (ATP and NADPH) react with carbon dioxide (CO2) to synthesize carbohydrates,
the final product of photosynthesis plants use for their own survival (Lawlor & Cornic,
2002). Broadly, Electron Chute addressed students' need to visualize the transformation
of sunlight energy into ATP, and finally in carbohydrates, that occurs in photosynthesis.
The ETC video and the Electron Chute game were developed to help students
understand the energy transformation process and clarify the misconceptions they hold
about photosynthesis: (1) Plants exist to give resources to humans (Schwartz & Brown,
2013); (2) The main product of photosynthesis is oxygen (Svandova, 2014); (3)
Photosynthesis is a gas exchange process which uses oxygen (Marmaroti &
Galanopoulou , 2006); (4) Photosynthesis takes place in chlorophyll (Deshmukh, 2015);
(5) Chlorophyll is produced and consumed during photosynthesis (Marmaroti &
Galanopoulou, 2006); (6) Photosynthesis is when plants take the light from the sun and
create oxygen to support plants' growth (Schwartz & Brown, 2013); (7) The ATP
production is the end point of photosynthesis (Parker et al, 2012); (8) Plants transform
carbon dioxide into oxygen (Flores, Tovar & Gallegos, 2003). Detailed information about
misconceptions is presented in Chapter 2 in association with the learning outcomes of the
video and game learning experiences.
1.4 Purpose of the Study
The purpose of this study is to support students' learning of the energy
transformation process in photosynthesis and help them to clarify misconceptions about
this process. Specifically, the instructional approach developed in this work aims to
10
contribute to students' understanding of the transformation of sunlight -electromagnetic-
energy into high energy compounds -ATP and NADPH- inside a plant cell structure.
In this study, the researcher argues that a video and a game’s visual representation
of the ETC process would help students gain knowledge to explain the transformation of
sunlight energy into ATP and NADPH. This transformation involves the activation of a
flow of electrons through a biological membrane-the thylakoid membrane- subunit of the
chloroplast. Students could use that knowledge to explain how the ETC process works,
look for similarities with other processes inside the cell and infer how energy
transformation occurs in other organisms.
Laterally, this study explores evidences that the video and game learning
experiences have a positive impact on students from different academic readiness. A
questionnaire survey instrument was used to collect students' feedback about learning
ETC using a video and game with the intention of improving these learning experiences
for future learners.
1.5 Research Question
To investigate this conjecture, a research question was defined to frame the
inquiry of the study:
What are the specific learning outcomes achieved by middle school students after
learning about the energy transformation process in photosynthesis, process
known as electron transport chain (ETC), through video and serious game
learning experiences?
11
1.6 Assumptions
The researcher assumed that students had limited knowledge regarding the
electron transport chain (ETC) process in photosynthesis before starting the learning
experiences-watching the ETC video and playing the Electron Chute game. Because the
understanding of ETC required that students were familiar with the vocabulary related to
photosynthesis, students participated in a series of classroom activities about
photosynthesis during previous weeks. Detailed information about these classroom
activities were included in Chapter 2.
1.7 Limitations of the Study
The researcher identified the following limitations that might have impacted the
findings research question: (1) Absence of a pilot study to anticipate design errors and
implementation issues (Blessing & Chakrabarti, 2009); (2) Treatments were constituted
by intact classes which reduced random sampling (Trochim & Donnelly, 2001).
1.7.1 Absence of a Pilot Study
A pilot study is a procedure that allow researchers to follow preliminary analyses
of the research and identify problems that could affect the validity of the results before
undertaking a fully developed experiment (Blessing & Chakrabarti, 2009). In the present
study, a pilot would have allowed the researcher to evaluate the instrument (knowledge
test) and gain information about the game procedures such as, time students spent playing
Electron Chute, clarity of the instructions/rules and the optimal number of players that
would have allowed every student the sufficient time to complete the game play.
12
The choice to not include a pilot study with participants of the target age group
was made by the researcher during the process of planning the research because of the
limited time participants were available to participate in this study. The absence of pilot
was not necessarily detrimental to the quality of this study because the design of the
research and the data analysis were done as planned by the researcher. The content
validity of the knowledge test was checked by an expert in the field. The reliability of the
rubric was calculated by a statistical program following the recommendations of a
statistical consultant.
Additionally, participants' feedback was requested at the end of the study to gain
insights about their experiences with the video and the game as well as use this
information to improve learners' experiences for future studies. For a future research,
before undertaking the planned research, a pilot study to try out methods and procedures
could be performed in a second school from the same school corporation. The school
should have a similar population of students in regard to gender, ethnicity, and abilities to
obtain results that are valid to use for modifications of the research study. All researchers
in the study should be part of the pilot study (Blessing & Chakrabarti, 2009).
1.7.2 Treatments Constituted by Intact Classes
As in many studies in education, the randomization of participants in each
classroom cannot be assured, because the classes are formed by the schools for their own
purposes. The way to face this limitation was to approach the study using a quasi-
experimental design (Robson, 2002). In the present work, the quasi-experimental design
used was the non-equivalent group design (NEGD) which consisted of a pretest-posttest
13
experiment in two comparable classes at school. These comparable classes constituted
both treatments (Trochim & Donnelly, 2001). The comparison was done between two
different treatments consisted of a similar population of students including gender,
ethnicity, and abilities according to the school corporation. For a future study, the
research design could have an additional treatment and measure the level of knowledge
of the experimental treatment after watching the ETC video to measure the gain of
knowledge attributed to the video.
1.8 Definition of Terms
In the context of this thesis, the following definition of terms will be used:
ATP: Adenosine Triphosphate. It is a small metabolic molecule and one of the outputs of
the electron transport chain process. ATP serves as "the major carrier of chemical energy
in all cells." ATP is also one of the inputs of the second phase of photosynthesis, known
as the Calvin Cycle, to produce carbohydrates (Lehninger, Nelson & Cox, 2005, p. 122).
CO2: Carbon dioxide. It is a gaseous input of photosynthesis. During the second stage of
photosynthesis, known as Calvin Cycle, carbon dioxide reacts with ATP and NADPH to
produce carbohydrates, the final product of photosynthesis the plant uses for storage,
maintenance and growth (Lawlor & Cornic, 2002).
ETC: Electron transport chain. The electron transport chain process is a biological
process that occur inside cellular structures known as chloroplasts in plants and
mitochondria in both plants and animals. ETC consists of a series of reactions involving a
flow of electrons through protein complexes inserted in a biological membrane and a
movement of protons (H+) across the membrane to synthesize energy (ATP) useful for
14
survival. In bacteria, the ETC process occurs in their cell membrane. In plants' and
animals' mitochondria, ETC is part of cellular respiration. In plants' chloroplasts, ETC is
the first stage of photosynthesis and occurs in a chloroplast inner membrane known as the
thylakoid membrane. ETC in photosynthesis is the focus of the present study and is
defined as the process of transformation of sunlight (electromagnetic) energy into
chemical energy (ATP) involving a flow of electrons (Lehninger et al., 2005).
Foil: Distractor or alternative choice.
H+: Protons or hydrogen ions. During the ETC process, protons move from stroma to
lumen and then back to stroma through a protein complex known as ATP synthase.
Because of this proton motive force, ATP is produced in the stroma of chloroplast
(Lehninger et al., 2005).
H2O: Water. It is a liquid input of photosynthesis. During ETC, the photolysis (splitting
by light energy) of water produces a pair of electrons to continue the chain of reaction
through the thylakoid membrane. As a byproduct of photolysis of water, oxygen is
produced (Joliot, Barbieri, & Chabaud, 1969).
NADPH: Nicotinamide Adenine Phosphate (reduced form). NADPH is the final acceptor
of electrons during the ETC process. It is one of the outputs of the ETC process in
photosynthesis and one of the inputs in the second phase of photosynthesis, known as the
Calvin Cycle, to produce carbohydrates (Lehninger et al., 2005).
O2: Oxygen. It is a byproduct of photosynthesis. Once oxygen is produced by the
photolysis of water, part of it is used in cellular respiration. Most of the amount produced
is released to the air as gas which is needed to sustain animal life on Earth (Lawlor &
Cornic, 2002).
15
1.9 Summary
Chapter 1 provided general information of the present study. The purpose of the
study, the research question and the reasons why this research is relevant were presented.
Limitations and assumptions acknowledged by the researcher were informed in this
chapter. A section including the definitions of the most common terms used in this work
were also identified. Chapter 2 provided a literature review of previous research to
support the framework of this work.
16
CHAPTER 2. LITERATURE REVIEW
This chapter provides an overview of the theoretical foundations of this study
focused on why students hold misconceptions. Specifically, the scope of this research
was to clarify the misconceptions students hold regarding the energy transformation
process in photosynthesis and promote students' learning of it. The researcher frames this
study under the philosophy of biology to give clarifying explanations why students hold
misconceptions from a biological point of view regarding the electron transport chain
process in photosynthesis (Kampourakis, 2013). The researcher argues that learners may
have an incomplete model of how the ETC process works and limited knowledge of ETC
that might conduce them to misconceptions. Then, the researcher presents the theoretical
foundation of this study focused on what to do to help students in their learning process
of ETC. This was based on the premise supported by the schema theory (Anderson, 1978)
that students learn by constructing mental models or representations of their surrounding
world in their minds (Johnson-Laird, 1983; Wilson & Rutherford, 1989) and the concept
that people learned in a well-balanced learning environment. Therefore, the researcher
framed the design of the learning experiences, the ETC video and the Electron Chute
game, under a constructivist theory of knowing called schema theory (Anderson, 1978)
and the how people learn framework (Bransford et al., 2000) to guide the instructional
design. Specifically, the design of the ETC video and the Electron Chute game was
founded in the concepts of learning through visual representations (Gordin & Pea, 1995;
Mayer & Moreno, 2002); the cognitive theory of multimedia learning (Mayer, 1997) and
epistemic game framework (Collins & Ferguson, 1993). Later in the chapter, a
17
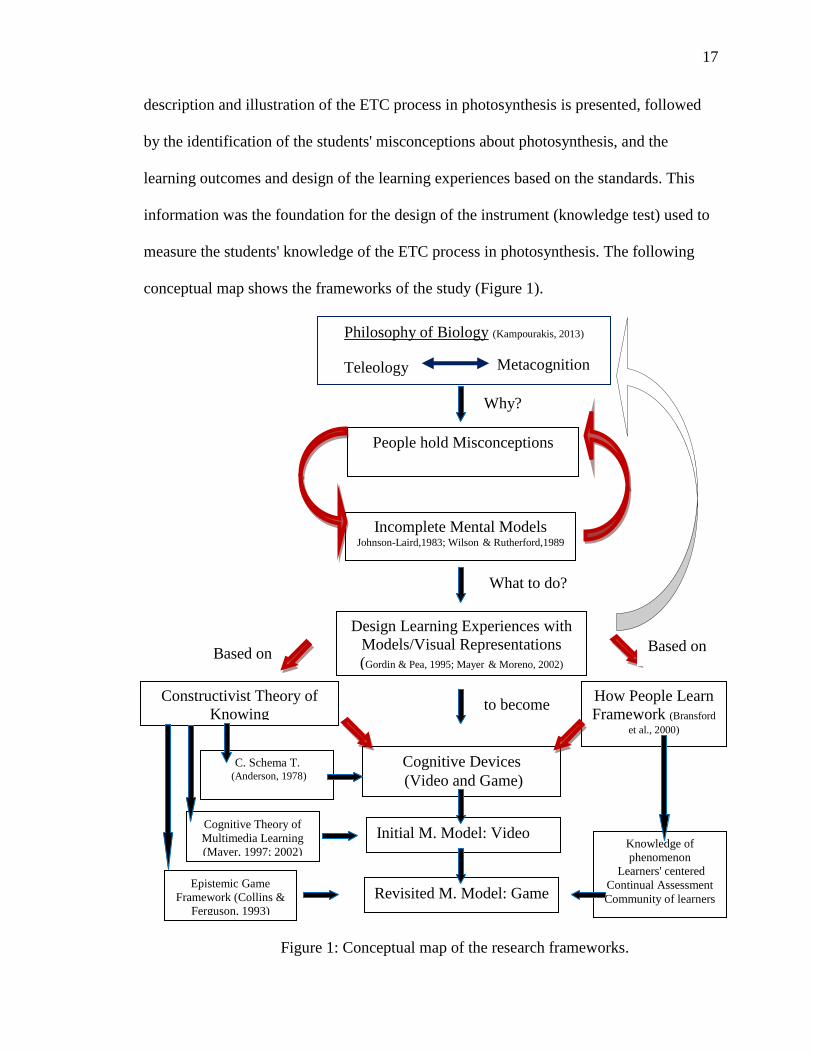
description and illustration of the ETC process in photosynthesis is presented, followed
by the identification of the students' misconceptions about photosynthesis, and the
learning outcomes and design of the learning experiences based on the standards. This
information was the foundation for the design of the instrument (knowledge test) used to
measure the students' knowledge of the ETC process in photosynthesis. The following
conceptual map shows the frameworks of the study (Figure 1).
Figure 1: Conceptual map of the research frameworks.
People hold Misconceptions
Why?
Philosophy of Biology (Kampourakis, 2013)
Teleology Metacognition
Incomplete Mental Models Johnson-Laird,1983; Wilson & Rutherford,1989
What to do?
Design Learning Experiences with
Models/Visual Representations
(Gordin & Pea, 1995; Mayer & Moreno, 2002)
Constructivist Theory of
Knowing
Based on
How People Learn
Framework (Bransford
et al., 2000)
Based on
to become
Cognitive Devices
(Video and Game)
Initial M. Model: Video
Revisited M. Model: Game Epistemic Game
Framework (Collins &
Ferguson, 1993)
Cognitive Theory of
Multimedia Learning
(Mayer, 1997; 2002)
C. Schema T. (Anderson, 1978)
Knowledge of
phenomenon
Learners' centered
Continual Assessment
Community of learners
18
2.1 Philosophy of Biology
The researcher framed this study under the philosophy of biology to give
explanations why students hold misconceptions from a biological point of view regarding
the electron transport chain process in photosynthesis (Kampourakis, 2013). The
philosophy of biology as an independent field emerged during the 1960s and 1970s and
since that time has had relevant implications for all disciplines related to biology
including biology education (Kampourakis, 2013).
There are two concepts embraced by the philosophy of biology that are relevant to
this study. These are teleology and metacognition. The researcher argues that both
concepts are in dispute in people's mind, which could be an explanation why students
hold misconceptions about energy processes. Teleology is related to important conceptual
obstacles because it indicates that a characteristic exists for a purpose, and that way of
thinking could foster misconceptions, which could interfere with the students' ability to
learn (Lennox & Kampourakis, 2013). For example, "plants exist to give resources to
humans" (Schwartz & Brown, 2013) is a misconception students’ hold that could be
related to the idea that plants have a purpose, which is to provide human with resources.
This way of thinking could lead to a plausible explanation for other misconceptions such
as "the main product of photosynthesis is oxygen" (Svandova, 2014). The sentence
suggests that the purpose of photosynthesis is producing oxygen which is not accurate
from a biological point of view which investigations have discovered that oxygen is a
byproduct of photosynthesis (Lawlor & Cornic, 2002) and comes from the photolysis of
water molecules (Joliot et al., 1969).
19
Misconceptions are connected to flaw or incomplete mental models (Chi, 2008)
and, therefore, interfere with the way students think and their ability to make sense of
how complex phenomena work (Vosniadou, 2009). Metacognition is the ability of
learners to control their learning processes (Tulving & Madigan, 1970). Metacognition
accounts for the decisions learners make contingent on their own knowledge (Fleming,
Dolan & Frith, 2012).
Metacognition is the knowledge of each one's own mental process and control one's own
behavior (Davidson, Deuser & Sternberg, 1994). Learners need to recognize they hold a
misconception before they can address it, therefore, learning experiences that help them
to be aware of their own misconceptions could guide students to make their own
conceptual change needed for learning (Galli, 2016).
In the present study, the researcher argues that the ETC video and Electron Chute
are instructional treatments that support students in their metacognitive processes. This
research suggests that the video and the game learning experience in a well-balanced
classroom environment (Bransford et al., 2000) engages learners in peer discussions that
could lead to explanations of the ETC phenomenon, help them make sense of how a
complex biochemical process works and realize their own misconceptions about it.
Students hold misconceptions regarding energy transformation mostly because of the
differences between the vocabulary they learn in their daily lives to explain this
phenomenon and the scientific knowledge students' learn at school (Neumann, Boone &
Fischer, 2013; Solomon, 1983). The knowledge associated with the energy
transformation process in photosynthesis requires difficult vocabulary for middle school
to learn. The design of Electron Chute took into account the refinement of vocabulary
20
through labels on game board (Baker, 1995) to help students learn about ETC by
enhancing their knowledge of the ETC process in a less school-like context (Gee, 2003).
Most of the biological phenomena including energy transformation processes are
neither visible nor connected to the students' daily lives. Therefore, the processes
involved in energy transformation are more difficult for student to comprehend (Barak,
Gorodetsky, & Chipman, 1997). Students are familiar with the energy conservation
principle which states that energy is neither created nor destroyed but transformed;
however, they have difficulties in applying this principle to biological systems
(Chabalengula, Sanders, & Mumba, 2012). This is also related to the difficulties students
have about how the non-living world and the living world are related (Lin & Hu, 2003).
This is associated with the students' conceptions that the energy principles in living
matter are different from the principles in non-living matter (Barak, Gorodetsky, &
Chipman, 1997). The ETC video and the Electron Chute game contextualize the learning
of the energy transformation process in the biological membrane of a living organism-a
plant. Visual representations were part of them and, therefore, the process of learning
through representations is presented in the following section.
21
2.2 Learning through Visual Representations
Visual representations foster learning (Gordin & Pea, 1995; Mayer & Moreno,
2002) by providing important relationships between components that define a complex
process like ETC. This structure can provide a useful model, or schema of ETC, learners
can use to process information or generate new knowledge. Images embedded with texts
help students to focus on new conceptual elements (Mayer, 1989), such as a process, by
capturing cause effect relationships of each step of the process. Images best support
students' learning when learners' previous knowledge is limited (Mayer & Gallini, 1990).
How a representation is designed can play a significant role in students' learning because
it provides a knowledge structure or schema that is a relationship among its components
(Collins & Ferguson, 1993). This knowledge structure and the methods used to process it
are important to how students can retrieve that knowledge in future activities. The design
of the ETC video and Electron Chute were informed by principles for designing effective
instructional media to manage content, cognitive load and game board layout design
(Collins & Ferguson, 1993; Mayer, 2005; Sweller, 1994). The schema or mental model of
photosynthesis used by the researcher to represent the ETC process in photosynthesis
presented in Figure 2. The photosynthesis process is presented as a system with inputs-
light, water (H2O) and carbon dioxide (CO2) -and outputs- carbohydrates and oxygen
(O2). Two subsystem of photosynthesis are illustrated in the representation. These are the
ETC process and the Calvin Cycle. The inputs of the ETC process are light and H2O and
its outputs are NADPH, ATP and O2. The ETC process is central to transforming light
energy into the chemical energy of NADPH and ATP used by the plant to sustain its life.
These energy molecules, NADPH and ATP, and CO2 are inputs to the Calvin Cycle

22
which outputs are carbohydrates. Notice in the model that O2 comes from H2O and the
carbon skeleton of the carbohydrates comes from the carbon fixation of CO2. The model
in Figure 2 was not shown to the participants of this study.
Figure 2: A representation of the inputs and outputs of photosynthesis and the ETC
process used by the researchers to design the ETC video and game.
2.2.1. Design of the ETC video
The video was designed to illustrate where ETC occurs in a plant and the
mechanism of how sunlight activates a chain of reactions that transforms sunlight energy
into the energy the plant needs to survive. Therefore, the narrative of the video (Appendix
A) begins at the macroscopic level of the leaf on a plant, the roots in the soil with water
(H2O), carbon dioxide (CO2) in the atmosphere and sun as a light energy source. The
narrative then transitions focus to the microscopic level of the cell zooming in on the
chloroplast and its inner structures, the thylakoid sacs. It is in the thylakoid membrane
where ETC occurs. Figure 3 illustrates the model of the cell chloroplast and the thylakoid
membrane were the ETC process occurs.
ETC
Pro
cess
ETC process
Chlorophyll
ATP
+N
DP
H
ATP +
NADPH
Cal
vin
Cyc
le
Calvin
Cycle
Water
(H2O)
Oxygen
(O2)
Sunlight
energy
Carbon
dioxide
(CO2)
Carbohydrates
(CH2O)n Inputs
Input
Inputs
Output
Outputs
Output
Photosynthesis
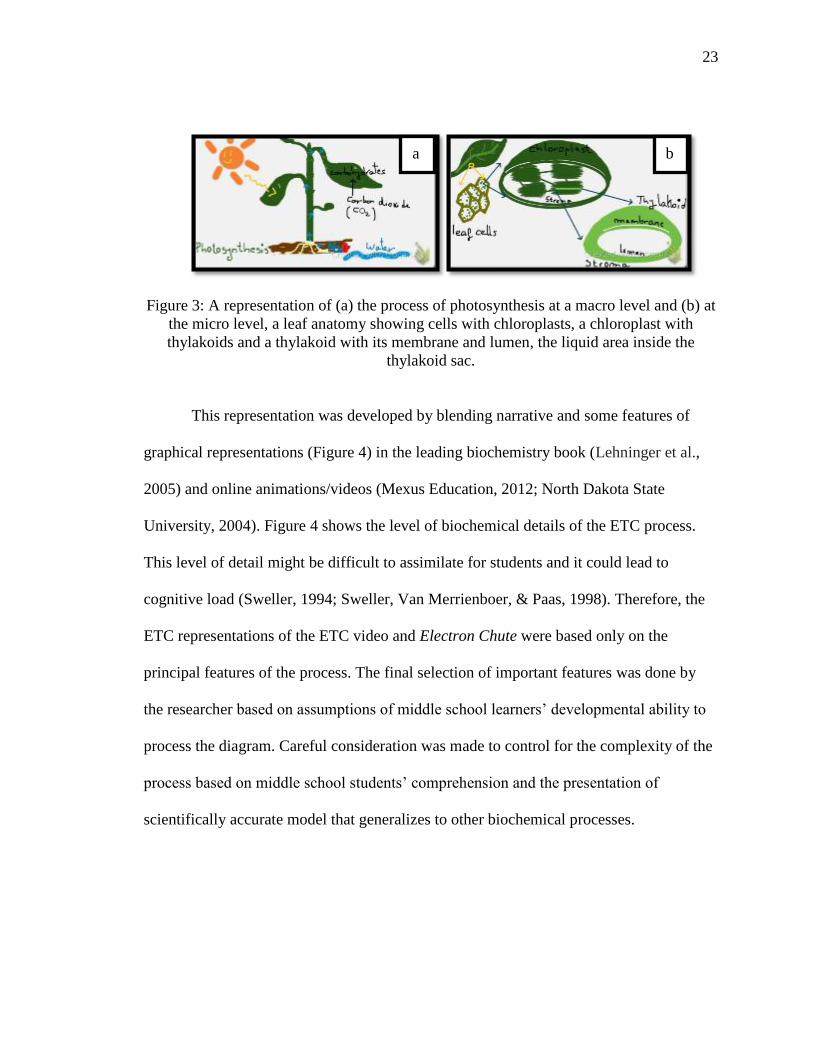
23
Figure 3: A representation of (a) the process of photosynthesis at a macro level and (b) at
the micro level, a leaf anatomy showing cells with chloroplasts, a chloroplast with
thylakoids and a thylakoid with its membrane and lumen, the liquid area inside the
thylakoid sac.
This representation was developed by blending narrative and some features of
graphical representations (Figure 4) in the leading biochemistry book (Lehninger et al.,
2005) and online animations/videos (Mexus Education, 2012; North Dakota State
University, 2004). Figure 4 shows the level of biochemical details of the ETC process.
This level of detail might be difficult to assimilate for students and it could lead to
cognitive load (Sweller, 1994; Sweller, Van Merrienboer, & Paas, 1998). Therefore, the
ETC representations of the ETC video and Electron Chute were based only on the
principal features of the process. The final selection of important features was done by
the researcher based on assumptions of middle school learners’ developmental ability to
process the diagram. Careful consideration was made to control for the complexity of the
process based on middle school students’ comprehension and the presentation of
scientifically accurate model that generalizes to other biochemical processes.
a b
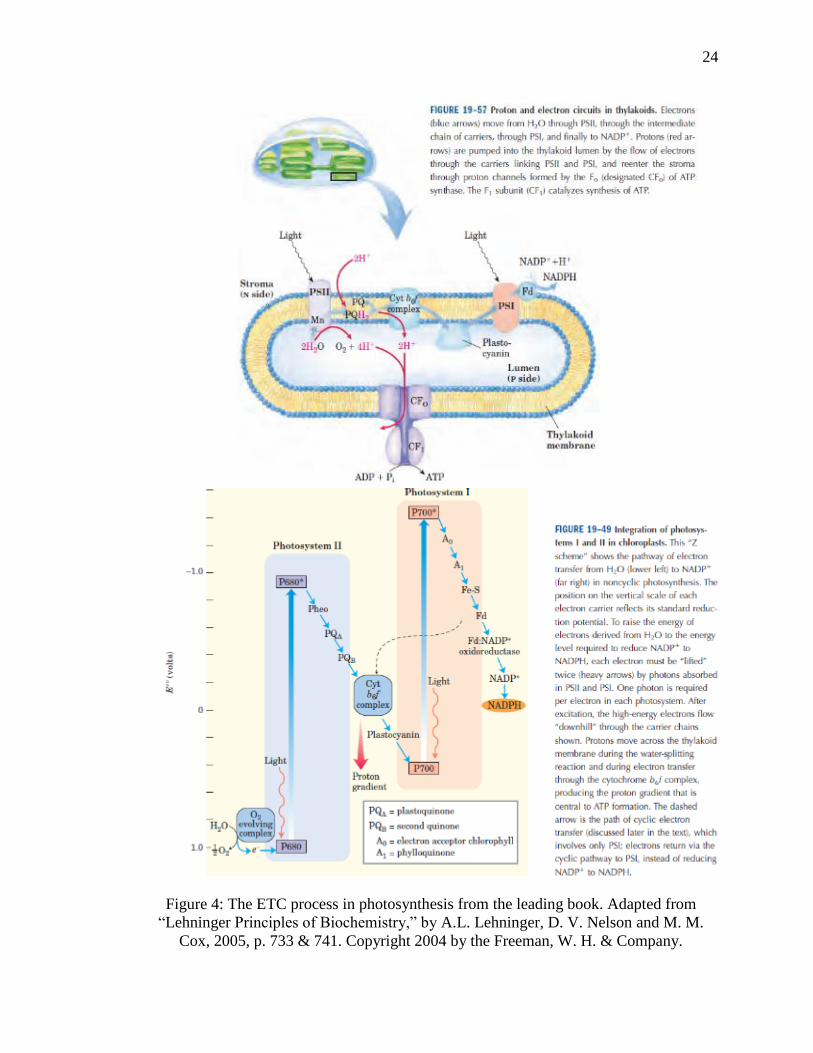
24
Figure 4: The ETC process in photosynthesis from the leading book. Adapted from
“Lehninger Principles of Biochemistry,” by A.L. Lehninger, D. V. Nelson and M. M.
Cox, 2005, p. 733 & 741. Copyright 2004 by the Freeman, W. H. & Company.
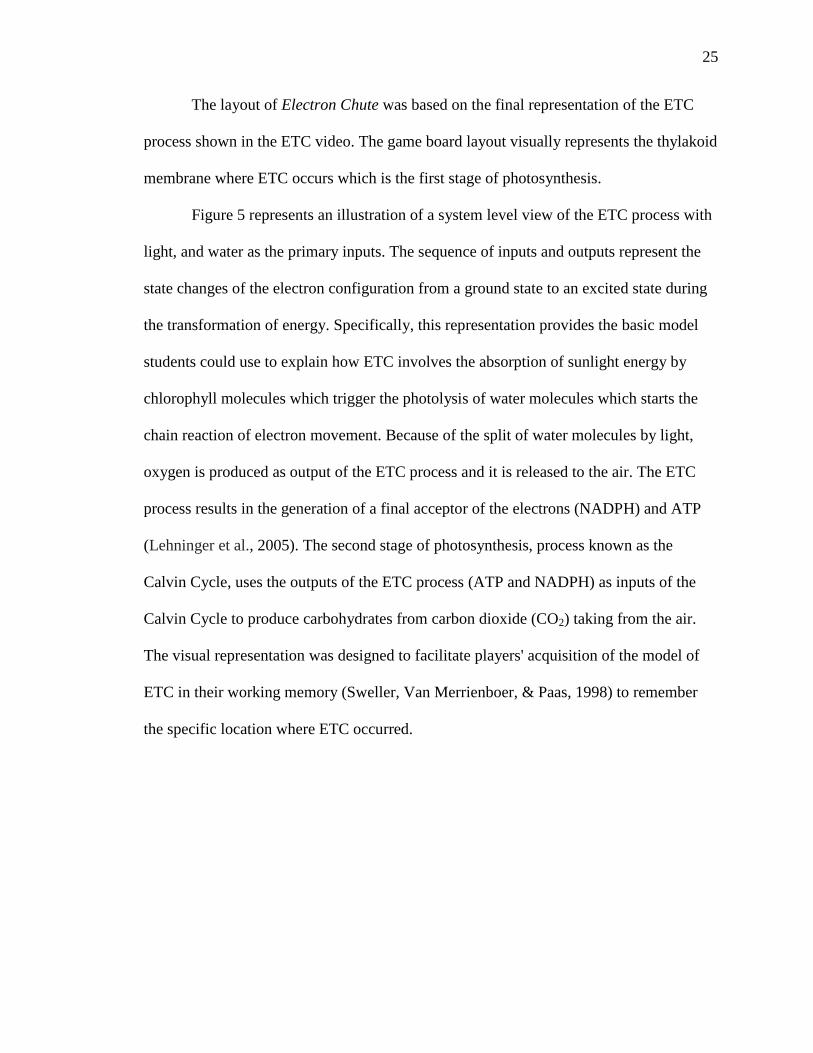
25
The layout of Electron Chute was based on the final representation of the ETC
process shown in the ETC video. The game board layout visually represents the thylakoid
membrane where ETC occurs which is the first stage of photosynthesis.
Figure 5 represents an illustration of a system level view of the ETC process with
light, and water as the primary inputs. The sequence of inputs and outputs represent the
state changes of the electron configuration from a ground state to an excited state during
the transformation of energy. Specifically, this representation provides the basic model
students could use to explain how ETC involves the absorption of sunlight energy by
chlorophyll molecules which trigger the photolysis of water molecules which starts the
chain reaction of electron movement. Because of the split of water molecules by light,
oxygen is produced as output of the ETC process and it is released to the air. The ETC
process results in the generation of a final acceptor of the electrons (NADPH) and ATP
(Lehninger et al., 2005). The second stage of photosynthesis, process known as the
Calvin Cycle, uses the outputs of the ETC process (ATP and NADPH) as inputs of the
Calvin Cycle to produce carbohydrates from carbon dioxide (CO2) taking from the air.
The visual representation was designed to facilitate players' acquisition of the model of
ETC in their working memory (Sweller, Van Merrienboer, & Paas, 1998) to remember
the specific location where ETC occurred.
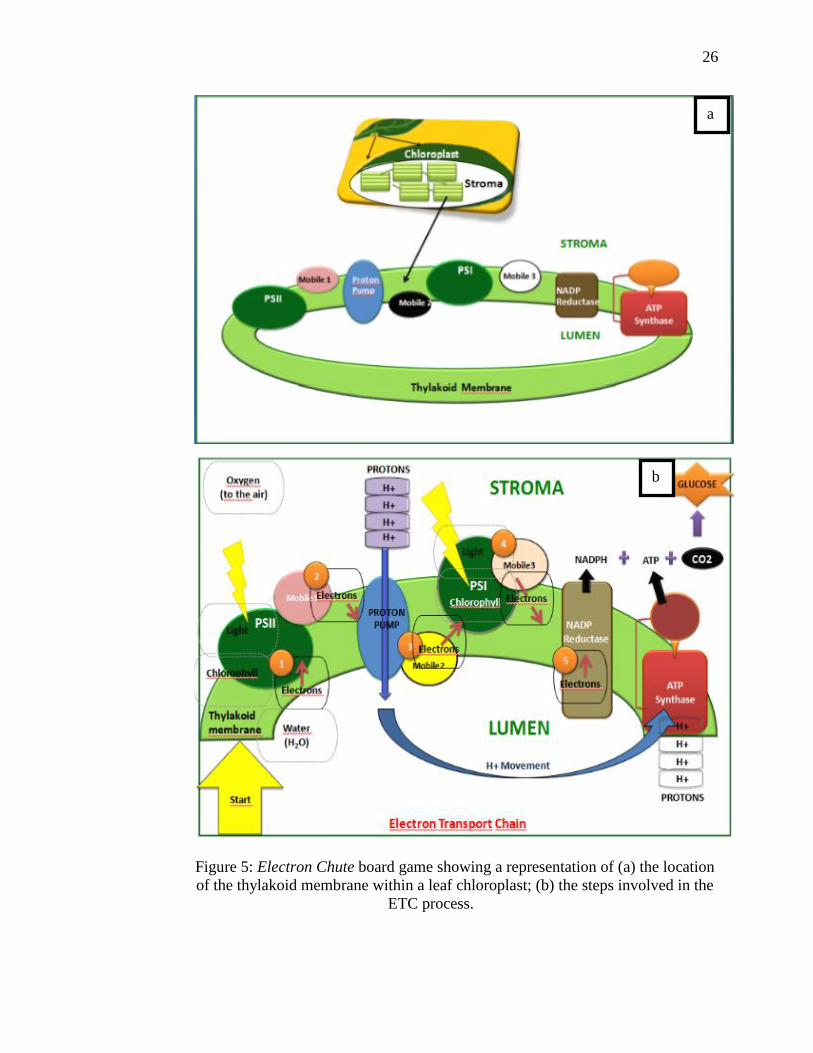
26
Figure 5: Electron Chute board game showing a representation of (a) the location
of the thylakoid membrane within a leaf chloroplast; (b) the steps involved in the
ETC process.
a
b
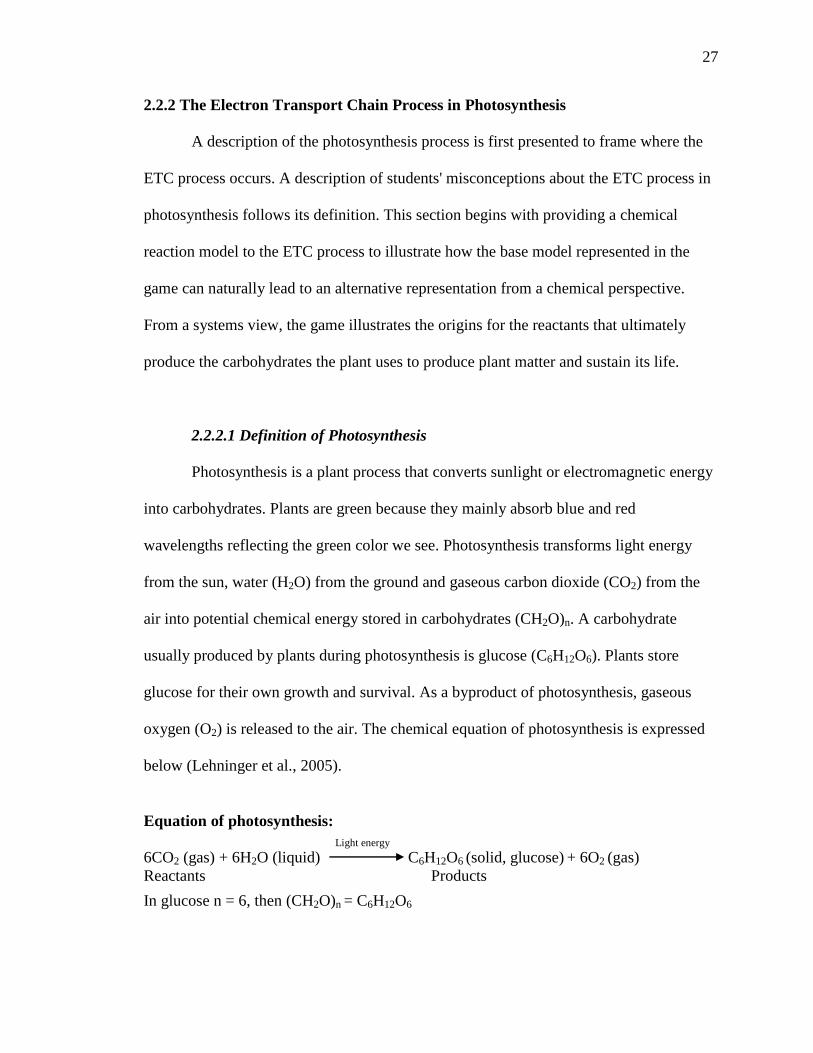
27
2.2.2 The Electron Transport Chain Process in Photosynthesis
A description of the photosynthesis process is first presented to frame where the
ETC process occurs. A description of students' misconceptions about the ETC process in
photosynthesis follows its definition. This section begins with providing a chemical
reaction model to the ETC process to illustrate how the base model represented in the
game can naturally lead to an alternative representation from a chemical perspective.
From a systems view, the game illustrates the origins for the reactants that ultimately
produce the carbohydrates the plant uses to produce plant matter and sustain its life.
2.2.2.1 Definition of Photosynthesis
Photosynthesis is a plant process that converts sunlight or electromagnetic energy
into carbohydrates. Plants are green because they mainly absorb blue and red
wavelengths reflecting the green color we see. Photosynthesis transforms light energy
from the sun, water (H2O) from the ground and gaseous carbon dioxide (CO2) from the
air into potential chemical energy stored in carbohydrates (CH2O)n. A carbohydrate
usually produced by plants during photosynthesis is glucose (C6H12O6). Plants store
glucose for their own growth and survival. As a byproduct of photosynthesis, gaseous
oxygen (O2) is released to the air. The chemical equation of photosynthesis is expressed
below (Lehninger et al., 2005).
Equation of photosynthesis:
Light energy
6CO2 (gas) + 6H2O (liquid) C6H12O6 (solid, glucose) + 6O2 (gas)
Reactants Products
In glucose n = 6, then (CH2O)n = C6H12O6
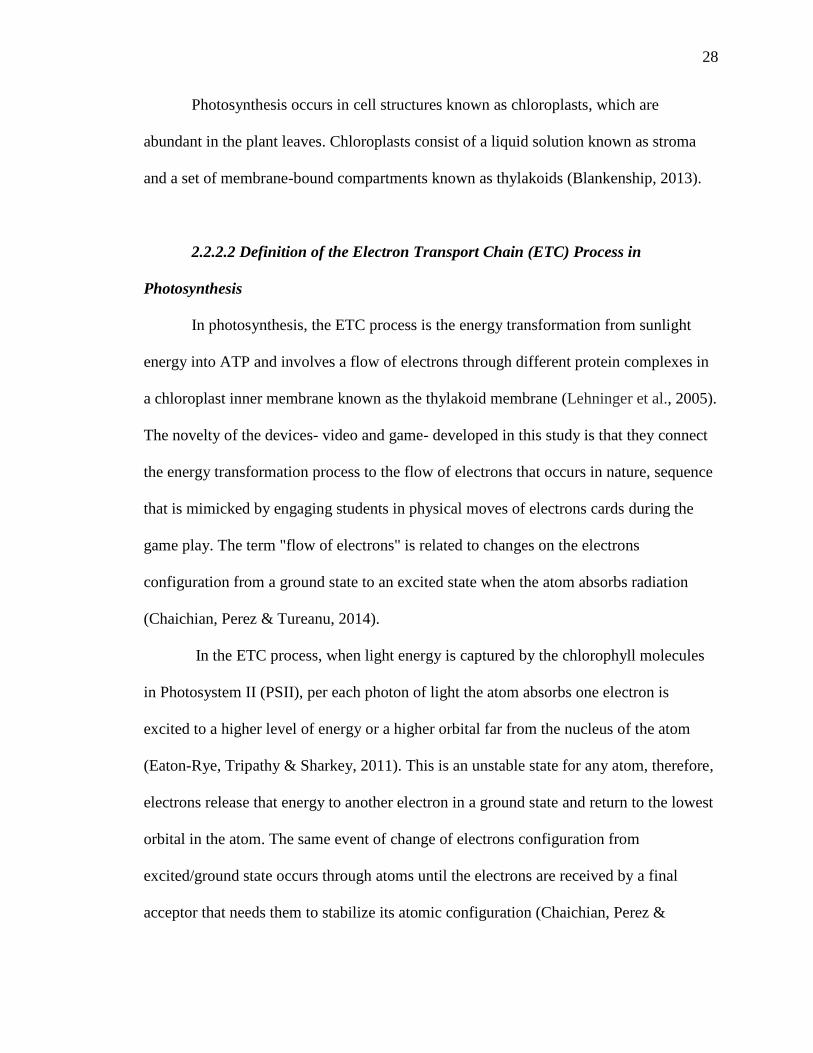
28
Photosynthesis occurs in cell structures known as chloroplasts, which are
abundant in the plant leaves. Chloroplasts consist of a liquid solution known as stroma
and a set of membrane-bound compartments known as thylakoids (Blankenship, 2013).
2.2.2.2 Definition of the Electron Transport Chain (ETC) Process in
Photosynthesis
In photosynthesis, the ETC process is the energy transformation from sunlight
energy into ATP and involves a flow of electrons through different protein complexes in
a chloroplast inner membrane known as the thylakoid membrane (Lehninger et al., 2005).
The novelty of the devices- video and game- developed in this study is that they connect
the energy transformation process to the flow of electrons that occurs in nature, sequence
that is mimicked by engaging students in physical moves of electrons cards during the
game play. The term "flow of electrons" is related to changes on the electrons
configuration from a ground state to an excited state when the atom absorbs radiation
(Chaichian, Perez & Tureanu, 2014).
In the ETC process, when light energy is captured by the chlorophyll molecules
in Photosystem II (PSII), per each photon of light the atom absorbs one electron is
excited to a higher level of energy or a higher orbital far from the nucleus of the atom
(Eaton-Rye, Tripathy & Sharkey, 2011). This is an unstable state for any atom, therefore,
electrons release that energy to another electron in a ground state and return to the lowest
orbital in the atom. The same event of change of electrons configuration from
excited/ground state occurs through atoms until the electrons are received by a final
acceptor that needs them to stabilize its atomic configuration (Chaichian, Perez &
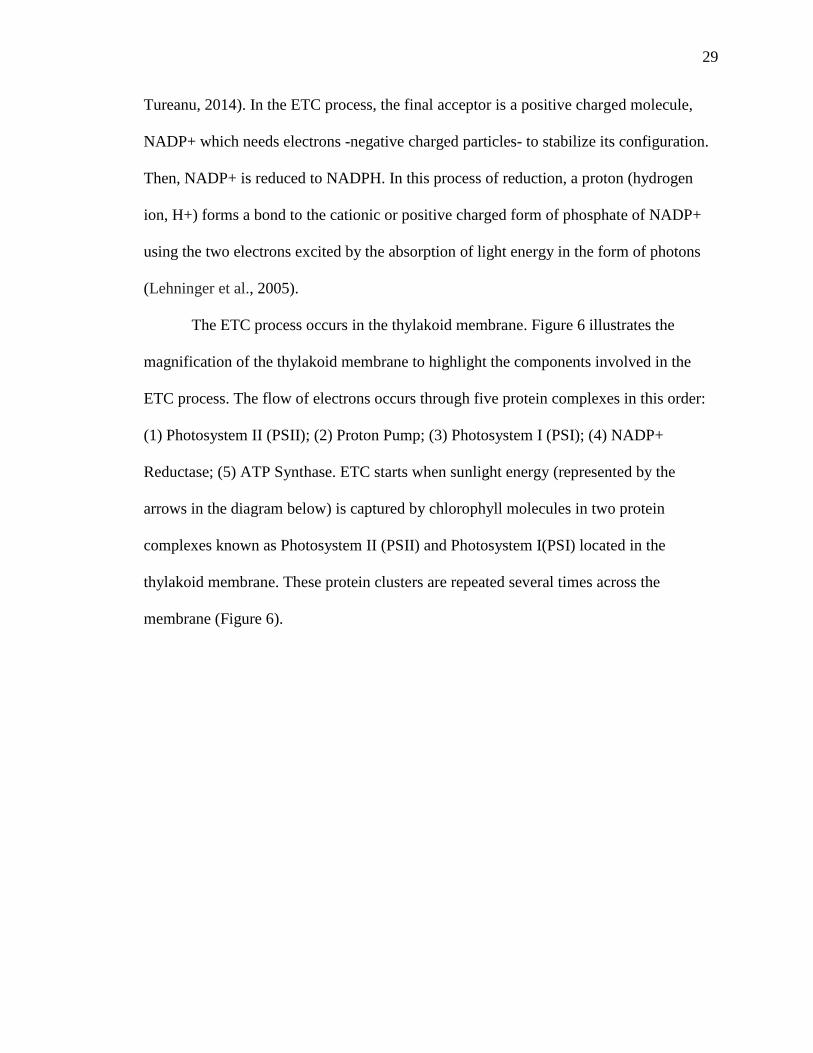
29
Tureanu, 2014). In the ETC process, the final acceptor is a positive charged molecule,
NADP+ which needs electrons -negative charged particles- to stabilize its configuration.
Then, NADP+ is reduced to NADPH. In this process of reduction, a proton (hydrogen
ion, H+) forms a bond to the cationic or positive charged form of phosphate of NADP+
using the two electrons excited by the absorption of light energy in the form of photons
(Lehninger et al., 2005).
The ETC process occurs in the thylakoid membrane. Figure 6 illustrates the
magnification of the thylakoid membrane to highlight the components involved in the
ETC process. The flow of electrons occurs through five protein complexes in this order:
(1) Photosystem II (PSII); (2) Proton Pump; (3) Photosystem I (PSI); (4) NADP+
Reductase; (5) ATP Synthase. ETC starts when sunlight energy (represented by the
arrows in the diagram below) is captured by chlorophyll molecules in two protein
complexes known as Photosystem II (PSII) and Photosystem I(PSI) located in the
thylakoid membrane. These protein clusters are repeated several times across the
membrane (Figure 6).
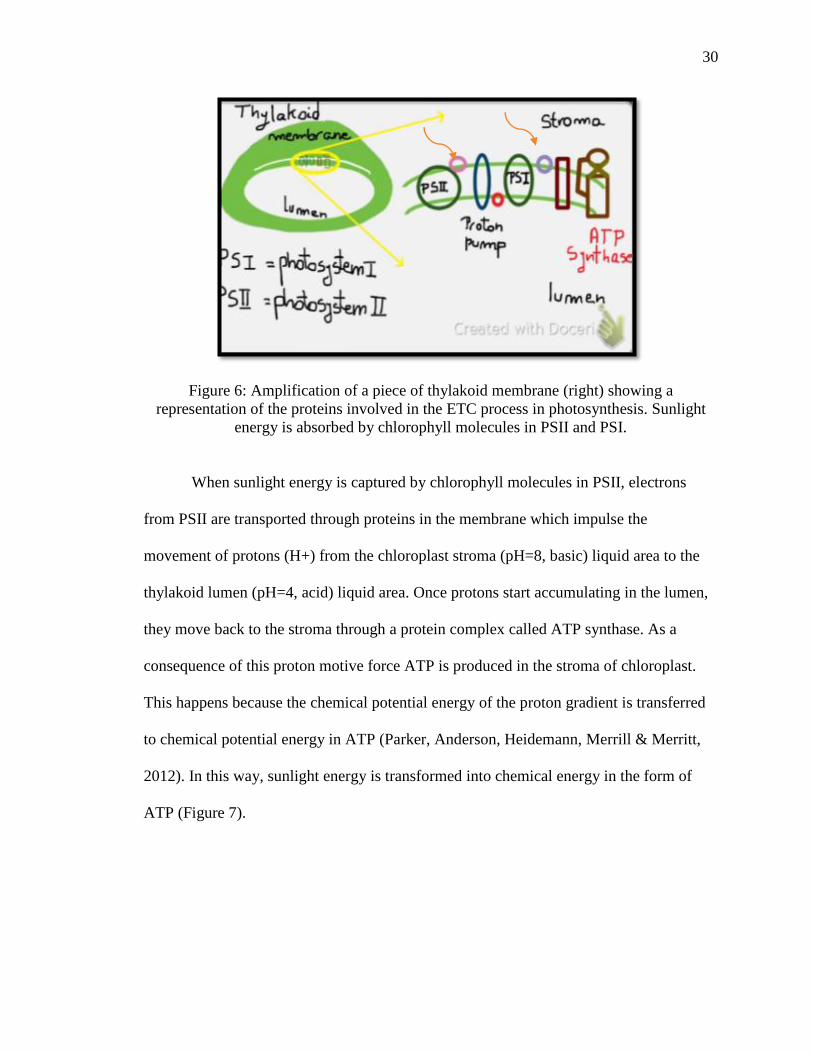
30
Figure 6: Amplification of a piece of thylakoid membrane (right) showing a
representation of the proteins involved in the ETC process in photosynthesis. Sunlight
energy is absorbed by chlorophyll molecules in PSII and PSI.
When sunlight energy is captured by chlorophyll molecules in PSII, electrons
from PSII are transported through proteins in the membrane which impulse the
movement of protons (H+) from the chloroplast stroma (pH=8, basic) liquid area to the
thylakoid lumen (pH=4, acid) liquid area. Once protons start accumulating in the lumen,
they move back to the stroma through a protein complex called ATP synthase. As a
consequence of this proton motive force ATP is produced in the stroma of chloroplast.
This happens because the chemical potential energy of the proton gradient is transferred
to chemical potential energy in ATP (Parker, Anderson, Heidemann, Merrill & Merritt,
2012). In this way, sunlight energy is transformed into chemical energy in the form of
ATP (Figure 7).
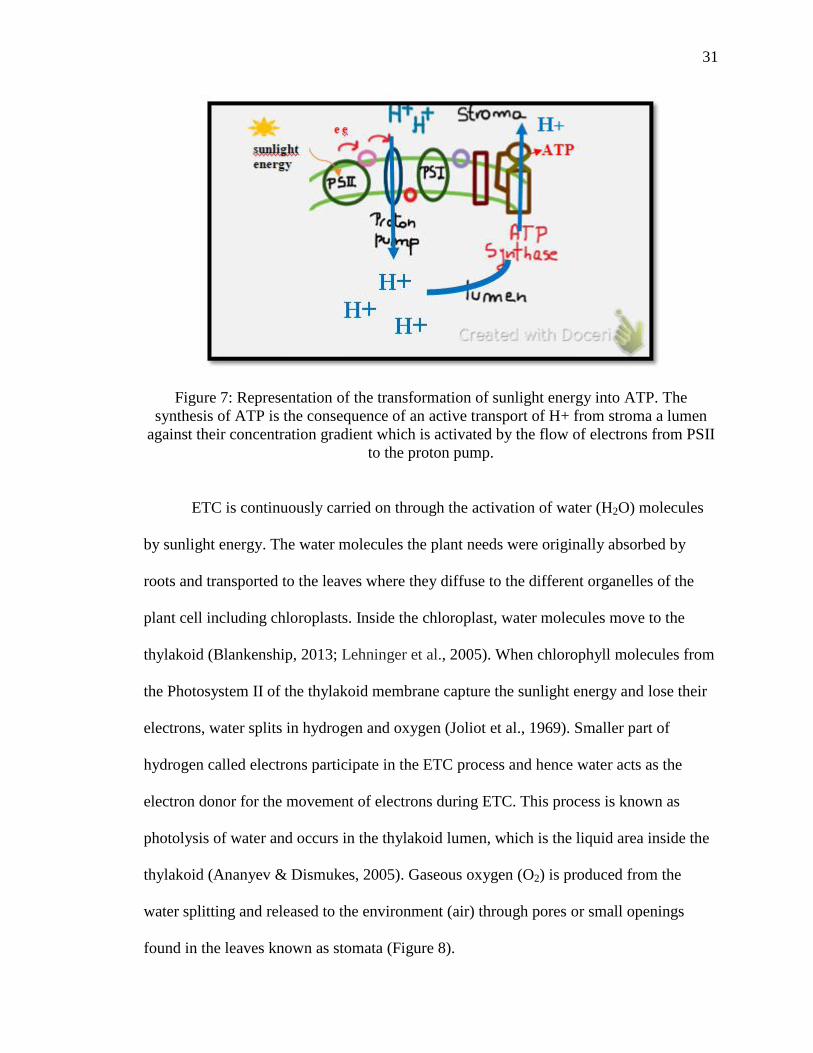
31
Figure 7: Representation of the transformation of sunlight energy into ATP. The
synthesis of ATP is the consequence of an active transport of H+ from stroma a lumen
against their concentration gradient which is activated by the flow of electrons from PSII
to the proton pump.
ETC is continuously carried on through the activation of water (H2O) molecules
by sunlight energy. The water molecules the plant needs were originally absorbed by
roots and transported to the leaves where they diffuse to the different organelles of the
plant cell including chloroplasts. Inside the chloroplast, water molecules move to the
thylakoid (Blankenship, 2013; Lehninger et al., 2005). When chlorophyll molecules from
the Photosystem II of the thylakoid membrane capture the sunlight energy and lose their
electrons, water splits in hydrogen and oxygen (Joliot et al., 1969). Smaller part of
hydrogen called electrons participate in the ETC process and hence water acts as the
electron donor for the movement of electrons during ETC. This process is known as
photolysis of water and occurs in the thylakoid lumen, which is the liquid area inside the
thylakoid (Ananyev & Dismukes, 2005). Gaseous oxygen (O2) is produced from the
water splitting and released to the environment (air) through pores or small openings
found in the leaves known as stomata (Figure 8).
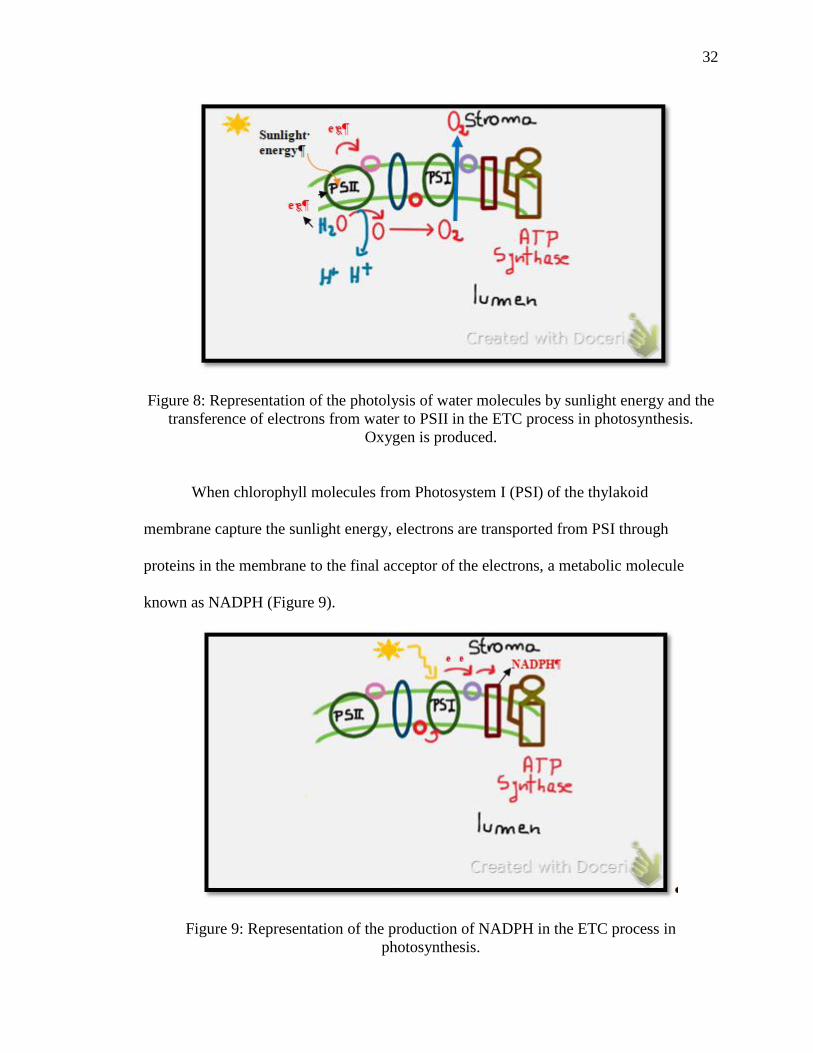
32
Figure 8: Representation of the photolysis of water molecules by sunlight energy and the
transference of electrons from water to PSII in the ETC process in photosynthesis.
Oxygen is produced.
When chlorophyll molecules from Photosystem I (PSI) of the thylakoid
membrane capture the sunlight energy, electrons are transported from PSI through
proteins in the membrane to the final acceptor of the electrons, a metabolic molecule
known as NADPH (Figure 9).
Figure 9: Representation of the production of NADPH in the ETC process in
photosynthesis.
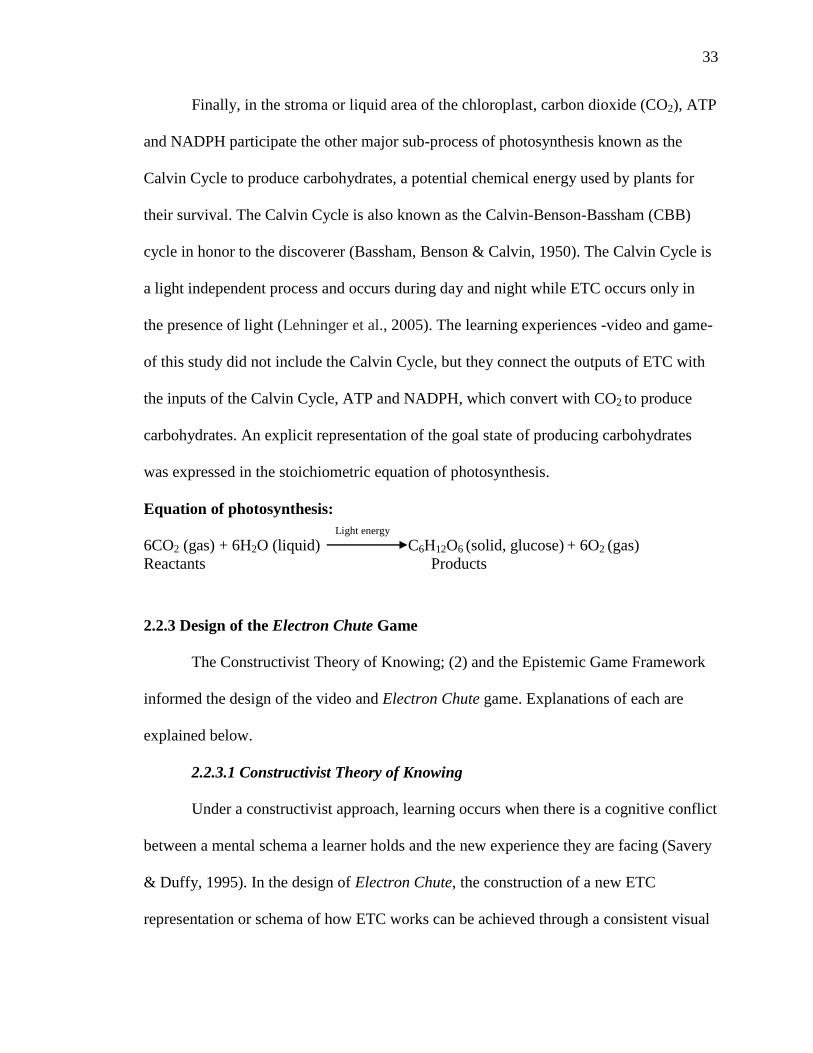
33
Finally, in the stroma or liquid area of the chloroplast, carbon dioxide (CO2), ATP
and NADPH participate the other major sub-process of photosynthesis known as the
Calvin Cycle to produce carbohydrates, a potential chemical energy used by plants for
their survival. The Calvin Cycle is also known as the Calvin-Benson-Bassham (CBB)
cycle in honor to the discoverer (Bassham, Benson & Calvin, 1950). The Calvin Cycle is
a light independent process and occurs during day and night while ETC occurs only in
the presence of light (Lehninger et al., 2005). The learning experiences -video and game-
of this study did not include the Calvin Cycle, but they connect the outputs of ETC with
the inputs of the Calvin Cycle, ATP and NADPH, which convert with CO2 to produce
carbohydrates. An explicit representation of the goal state of producing carbohydrates
was expressed in the stoichiometric equation of photosynthesis.
Equation of photosynthesis:
Light energy
6CO2 (gas) + 6H2O (liquid) C6H12O6 (solid, glucose) + 6O2 (gas)
Reactants Products
2.2.3 Design of the Electron Chute Game
The Constructivist Theory of Knowing; (2) and the Epistemic Game Framework
informed the design of the video and Electron Chute game. Explanations of each are
explained below.
2.2.3.1 Constructivist Theory of Knowing
Under a constructivist approach, learning occurs when there is a cognitive conflict
between a mental schema a learner holds and the new experience they are facing (Savery
& Duffy, 1995). In the design of Electron Chute, the construction of a new ETC
representation or schema of how ETC works can be achieved through a consistent visual
34
representation of the ETC process (Gordin & Pea, 1995) to provide a schema (Anderson,
1978) to build on; (2) the refinement of vocabulary through labels on game board (Baker,
1995); (3) and repetition at viewing and interpreting that representation (Collins &
Ferguson, 1993) to reinforce memory of these linguistic associations. The causal
relationships of the electrons flow and proton (H+) mobility are reinforced by the
repetitive game play by the player to move the two-electron cards and the protons (H+)
pumped through the system. This simulation of the ETC process should help students
remember the process and be a catalyst for discussion with their other teammates as they
make sense of the rules of the game. These rules of the game are directly analogous to the
movement of electrons in the actual process.
2.2.3.2 The Epistemic Game Framework
In the epistemic game framework, a visual representation constitutes an epistemic
form and the rules that govern the actions or moves in that form define the epistemic
game. A game representation guides learning when the representation constitutes an
epistemic form or target structure that communicate knowledge and fosters learning
(Collins & Ferguson, 1993). These representations are used by different disciplines (e.g.
biological, physical and social sciences) and includes models, visual representations, lists,
tree structures and tables among others (Bielaczyc & Kapur, 2010). Under the epistemic
game framework, the design features of Electron Chute that support students' learning are
(1) the visual representation of the ETC which constitutes the epistemic form of the game
(Gordin & Pea, 1995) and (2) the repetitive movement of electrons the players master
35
when playing the game which constitutes the epistemic game (Collins & Ferguson,
1993).
2.2.3.3 Learning through Meaningful Repetition
An epistemic game involves strategic play with disciplinary knowledge that
"consists of rules, strategies, and different moves that players master over a period of
time" (Collins & Ferguson, 1993, p. 25). The goal is to complete the visual representation
(epistemic form) that communicates knowledge and promotes learning. In this study,
playing the game offers learners repetitive engagement in a process to reinforce the
formation of a consistent model of a complex process and its representation that results in
remembering new vocabulary and factual knowledge. This involves the production of
metabolic molecules (ATP and NADPH) caused by sunlight energy activating the flow of
electrons, which is a basic concept of energy transformation (Lehninger et al., 2005).
2.2.3.4 Additional Educational Explanations about Electron Chute
The following adaptations (Lehninger et al., 2005) have been done to facilitate the
dynamism of the game and avoid cognitive load (Sweller, 1994), which could affect the
educational aim of Electron Chute.
1. The process of photosynthesis in plants consists of two major sub-processes (1)
transformation of sunlight energy into chemical energy (ATP) first, process
known as the electron transport chain (ETC); and (2) then transformation of
carbon dioxide (CO2) into potential chemical energy (carbohydrates), process
known as Calvin Cycle. The actions or moves of Electron Chute replicates ETC

36
which also produces NADPH. To complete the process of photosynthesis, in the
Calvin Cycle ATP and NADPH convert CO2 into glucose, a type of
carbohydrates. Electron Chute does not show the Calvin Cycle.
2. One molecule of water splitting releases two protons (H+) to the lumen, which are
not shown in Electron Chute.
3. Chlorophyll molecules in PSII and PSI are considered the same type of molecule.
However, there are two types of different chlorophyll molecules in plants, a and
b.
4. Mobile 1, Mobile 2, and Mobile 3 are invented names to identify three molecules
in the membrane known Plastoquinone Qb, Plastocyanin and Ferrodoxin,
respectively.
5. Plastoquinone Qb takes two protons (H+) from the stroma while transporting two
electrons from PSII to the Proton Pump protein. When Plastoquinone Qb releases
the two electrons to the Proton Pump, those two protons (H+) are released into the
lumen. In addition, the two electrons move two more protons (H+) to the lumen.
Therefore, Electron Chute moves a one 4-H+ card any time than a two-electron
card is moved from position 2 (Mobile 1) to position 3 (Mobile 2).
6. The Proton Pump protein complex is known as Cytochrome b6f, and NADP
Reductase protein is known as Ferrodixin-NADP+ Reductase.
7. The substrate for ATP synthase and NADP reductase are not shown in Electron
Chute. These are ADP and Pi, and NADP, respectively. ADP stands for
Adenosine Diphosphate, Pi stands for Inorganic Phosphate and NADP+ stands for
Nicotinamide Adenine Dinucleotide Phosphate. These three molecules are found
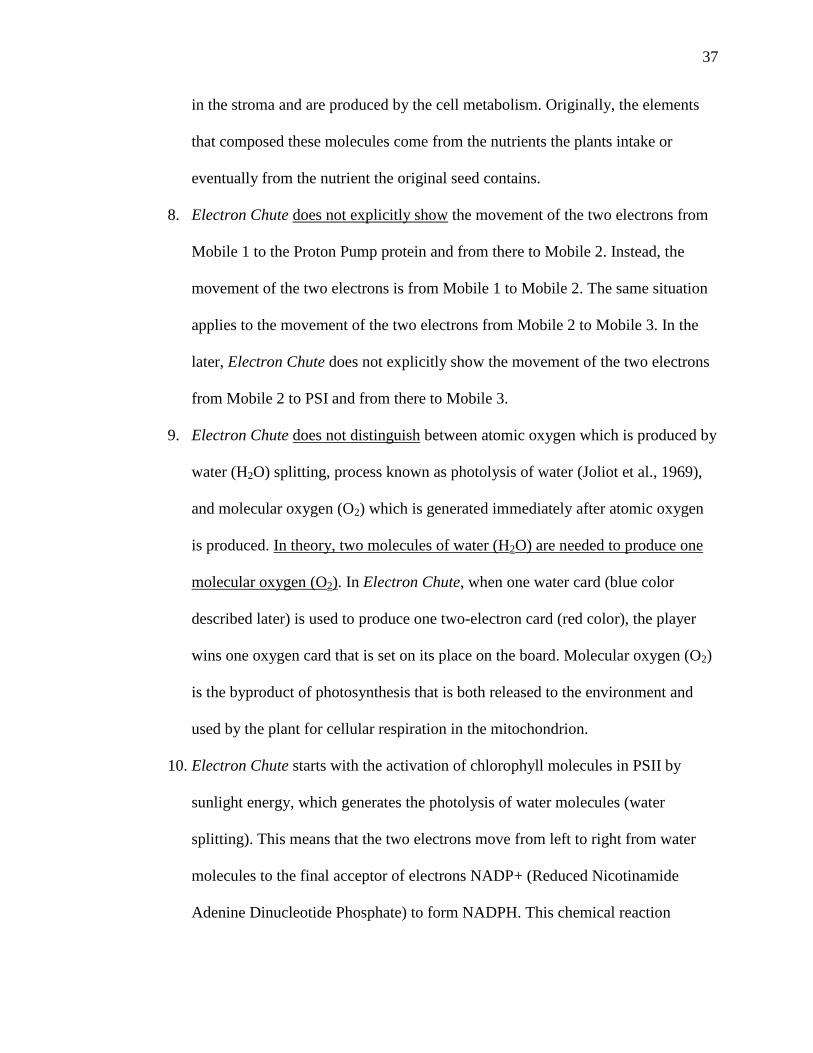
37
in the stroma and are produced by the cell metabolism. Originally, the elements
that composed these molecules come from the nutrients the plants intake or
eventually from the nutrient the original seed contains.
8. Electron Chute does not explicitly show the movement of the two electrons from
Mobile 1 to the Proton Pump protein and from there to Mobile 2. Instead, the
movement of the two electrons is from Mobile 1 to Mobile 2. The same situation
applies to the movement of the two electrons from Mobile 2 to Mobile 3. In the
later, Electron Chute does not explicitly show the movement of the two electrons
from Mobile 2 to PSI and from there to Mobile 3.
9. Electron Chute does not distinguish between atomic oxygen which is produced by
water (H2O) splitting, process known as photolysis of water (Joliot et al., 1969),
and molecular oxygen (O2) which is generated immediately after atomic oxygen
is produced. In theory, two molecules of water (H2O) are needed to produce one
molecular oxygen (O2). In Electron Chute, when one water card (blue color
described later) is used to produce one two-electron card (red color), the player
wins one oxygen card that is set on its place on the board. Molecular oxygen (O2)
is the byproduct of photosynthesis that is both released to the environment and
used by the plant for cellular respiration in the mitochondrion.
10. Electron Chute starts with the activation of chlorophyll molecules in PSII by
sunlight energy, which generates the photolysis of water molecules (water
splitting). This means that the two electrons move from left to right from water
molecules to the final acceptor of electrons NADP+ (Reduced Nicotinamide
Adenine Dinucleotide Phosphate) to form NADPH. This chemical reaction
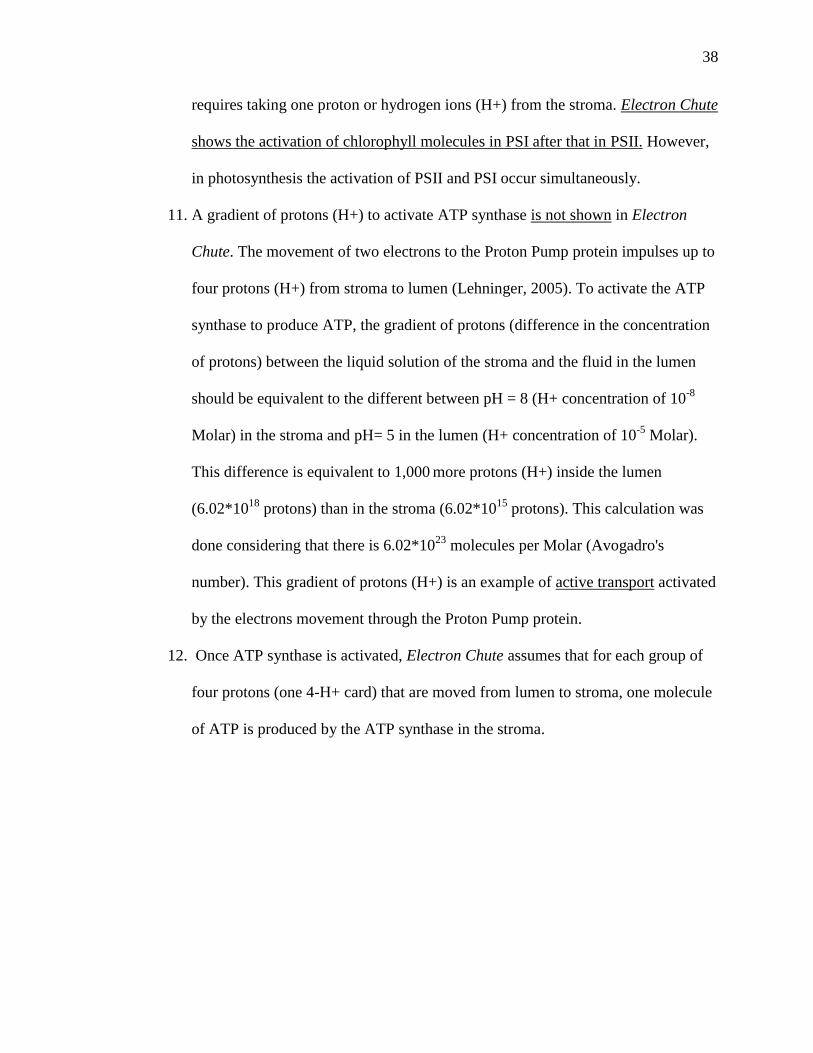
38
requires taking one proton or hydrogen ions (H+) from the stroma. Electron Chute
shows the activation of chlorophyll molecules in PSI after that in PSII. However,
in photosynthesis the activation of PSII and PSI occur simultaneously.
11. A gradient of protons (H+) to activate ATP synthase is not shown in Electron
Chute. The movement of two electrons to the Proton Pump protein impulses up to
four protons (H+) from stroma to lumen (Lehninger, 2005). To activate the ATP
synthase to produce ATP, the gradient of protons (difference in the concentration
of protons) between the liquid solution of the stroma and the fluid in the lumen
should be equivalent to the different between pH = 8 (H+ concentration of 10-8
Molar) in the stroma and pH= 5 in the lumen (H+ concentration of 10-5
Molar).
This difference is equivalent to 1,000 more protons (H+) inside the lumen
(6.02*1018
protons) than in the stroma (6.02*1015
protons). This calculation was
done considering that there is 6.02*1023
molecules per Molar (Avogadro's
number). This gradient of protons (H+) is an example of active transport activated
by the electrons movement through the Proton Pump protein.
12. Once ATP synthase is activated, Electron Chute assumes that for each group of
four protons (one 4-H+ card) that are moved from lumen to stroma, one molecule
of ATP is produced by the ATP synthase in the stroma.
39
2.3 Design of the Instructional Intervention
Students face challenges to understand processes they cannot see, therefore, they
need additional instruction to understand processes at a micro level (Collier, 2010).
Transitions between macro to micro levels help learners to understand processes in the
cell (Treagust & Tsui, 2013) such as the ETC process. An instructional intervention was
designed to connect the ETC process with the macro component of photosynthesis. The
macro components surround students' daily lives such as water, air, sunlight, plant,
leaves, roots, and soil. The micro components are those which students do not see or feel
with their senses.
In the instructional intervention, The ETC video was used to help students be
familiar with the transition from macro (environment, plant, leaves) to micro (cells,
chloroplast, thylakoid membrane) levels in photosynthesis. Electron Chute helps students
to visualize and understand how the transformation of sunlight energy into ATP and the
final product of photosynthesis, a carbohydrate known as glucose that plants storage for
their own growth and survival (Lawlor & Cornic, 2002).
The instructional intervention was designed based on the learning outcomes of the
learning experiences. The learning outcomes were developed based on the
misconceptions students hold regarding photosynthesis and ETC process.
2.3.1 Learning Outcomes
The learning outcomes of the lesson activities about photosynthesis, the ETC
video and the Electron Chute game were developed based on the Indiana Academic
Standards and the NGSS for middle school for Life Sciences and students'
40
misconceptions about photosynthesis described in the literature. The Standard 2 of the
Indiana Academic Standards for energy transformation states: Students in eighth grade
study atoms, elements, compounds and molecules; and the relationship between atomic
structure and chemical properties. Students study the water cycle and the role of the sun’s
energy in driving this process. Students develop understanding of matter cycle and
energy transfer-Indiana Academic Standards-Biology (Indiana Department of Education,
2016). The framework for K-12 science education discusses photosynthesis as one of the
outcomes for eighth graders (National Research Council, 2012). Similarly, the NGSS
standards for middle school for Life Sciences LS1.C target students’ abilities to explain
how organisms obtain and use the matter and energy they need to live and grow (NGSS,
2013). The relationship between the energy transformation concepts in the standards and
the ETC process in photosynthesis was based on the biochemical foundations of this
process described by Lehninger et al. (2005). A description of the learning outcomes and
misconceptions are presented in the following section.
2.3.1.1 Learning Outcomes of the Lesson Activities about Photosynthesis
The learning outcomes of the lesson activities about photosynthesis includes
students' ability to:
1. Identify the basic vocabulary of the photosynthesis process: reactants (light,
carbon dioxide and water), plant part (leaves) and molecule (chlorophyll) involve
in photosynthesis, and products (carbohydrates and oxygen). Figure 3. Appendix
D.
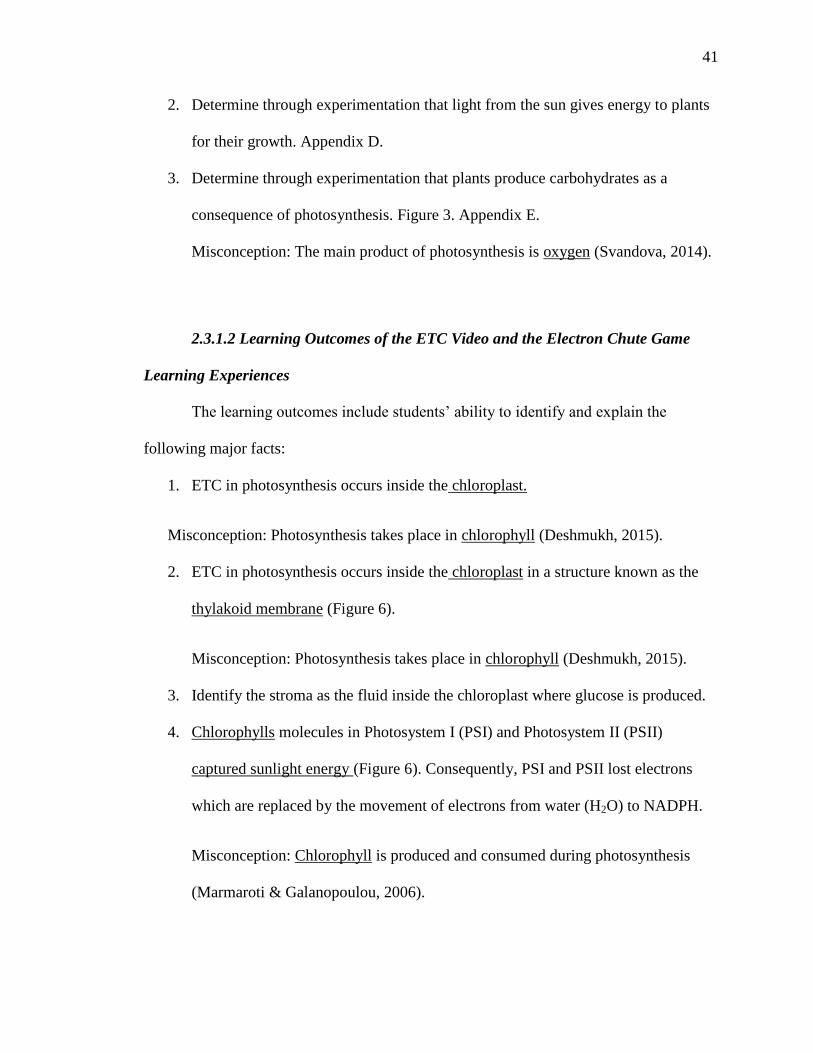
41
2. Determine through experimentation that light from the sun gives energy to plants
for their growth. Appendix D.
3. Determine through experimentation that plants produce carbohydrates as a
consequence of photosynthesis. Figure 3. Appendix E.
Misconception: The main product of photosynthesis is oxygen (Svandova, 2014).
2.3.1.2 Learning Outcomes of the ETC Video and the Electron Chute Game
Learning Experiences
The learning outcomes include students’ ability to identify and explain the
following major facts:
1. ETC in photosynthesis occurs inside the chloroplast.
Misconception: Photosynthesis takes place in chlorophyll (Deshmukh, 2015).
2. ETC in photosynthesis occurs inside the chloroplast in a structure known as the
thylakoid membrane (Figure 6).
Misconception: Photosynthesis takes place in chlorophyll (Deshmukh, 2015).
3. Identify the stroma as the fluid inside the chloroplast where glucose is produced.
4. Chlorophylls molecules in Photosystem I (PSI) and Photosystem II (PSII)
captured sunlight energy (Figure 6). Consequently, PSI and PSII lost electrons
which are replaced by the movement of electrons from water (H2O) to NADPH.
Misconception: Chlorophyll is produced and consumed during photosynthesis
(Marmaroti & Galanopoulou, 2006).
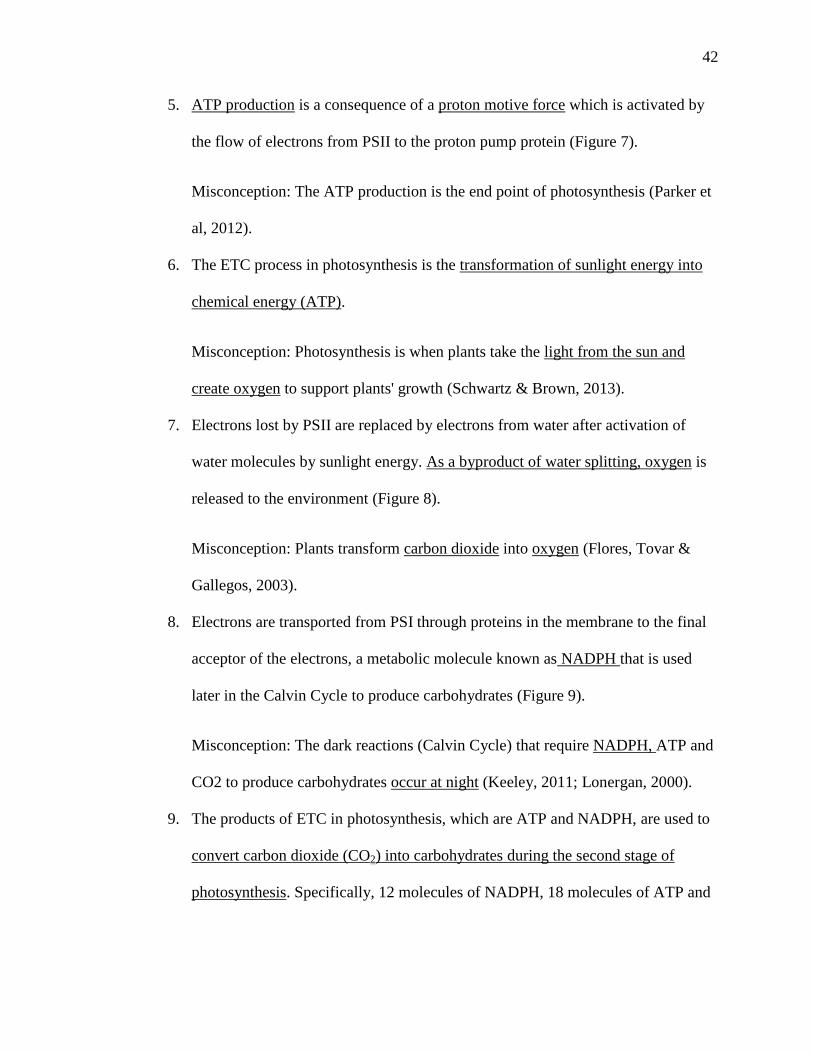
42
5. ATP production is a consequence of a proton motive force which is activated by
the flow of electrons from PSII to the proton pump protein (Figure 7).
Misconception: The ATP production is the end point of photosynthesis (Parker et
al, 2012).
6. The ETC process in photosynthesis is the transformation of sunlight energy into
chemical energy (ATP).
Misconception: Photosynthesis is when plants take the light from the sun and
create oxygen to support plants' growth (Schwartz & Brown, 2013).
7. Electrons lost by PSII are replaced by electrons from water after activation of
water molecules by sunlight energy. As a byproduct of water splitting, oxygen is
released to the environment (Figure 8).
Misconception: Plants transform carbon dioxide into oxygen (Flores, Tovar &
Gallegos, 2003).
8. Electrons are transported from PSI through proteins in the membrane to the final
acceptor of the electrons, a metabolic molecule known as NADPH that is used
later in the Calvin Cycle to produce carbohydrates (Figure 9).
Misconception: The dark reactions (Calvin Cycle) that require NADPH, ATP and
CO2 to produce carbohydrates occur at night (Keeley, 2011; Lonergan, 2000).
9. The products of ETC in photosynthesis, which are ATP and NADPH, are used to
convert carbon dioxide (CO2) into carbohydrates during the second stage of
photosynthesis. Specifically, 12 molecules of NADPH, 18 molecules of ATP and
43
6 molecules of CO2 produce one molecule of a type of carbohydrate known as
glucose that plants store for their own growth and survival.
Misconception: Photosynthesis is a gas exchange process which uses oxygen
(Marmaroti & Galanopoulou, 2006).
Therefore, each of these big ideas were carefully considered when deciding what
to include in the representation of the ETC video and the Electron Chute game as well as
in the action and rules that illustrated the ETC process.
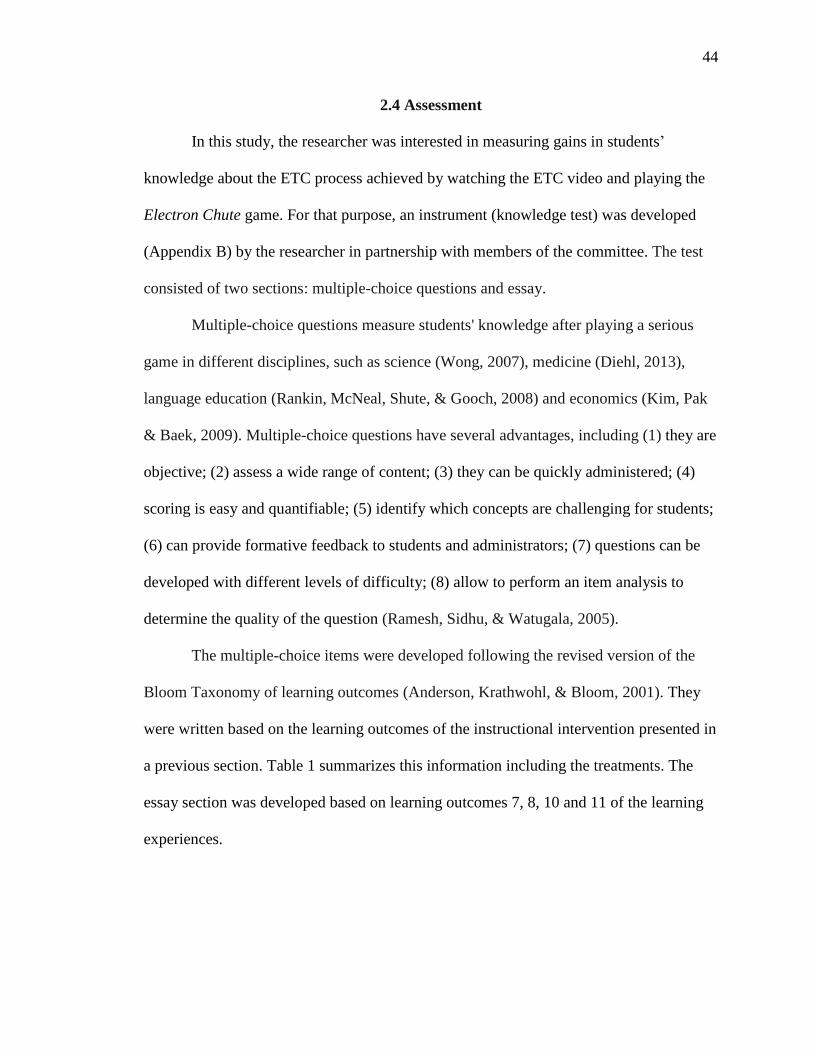
44
2.4 Assessment
In this study, the researcher was interested in measuring gains in students’
knowledge about the ETC process achieved by watching the ETC video and playing the
Electron Chute game. For that purpose, an instrument (knowledge test) was developed
(Appendix B) by the researcher in partnership with members of the committee. The test
consisted of two sections: multiple-choice questions and essay.
Multiple-choice questions measure students' knowledge after playing a serious
game in different disciplines, such as science (Wong, 2007), medicine (Diehl, 2013),
language education (Rankin, McNeal, Shute, & Gooch, 2008) and economics (Kim, Pak
& Baek, 2009). Multiple-choice questions have several advantages, including (1) they are
objective; (2) assess a wide range of content; (3) they can be quickly administered; (4)
scoring is easy and quantifiable; (5) identify which concepts are challenging for students;
(6) can provide formative feedback to students and administrators; (7) questions can be
developed with different levels of difficulty; (8) allow to perform an item analysis to
determine the quality of the question (Ramesh, Sidhu, & Watugala, 2005).
The multiple-choice items were developed following the revised version of the
Bloom Taxonomy of learning outcomes (Anderson, Krathwohl, & Bloom, 2001). They
were written based on the learning outcomes of the instructional intervention presented in
a previous section. Table 1 summarizes this information including the treatments. The
essay section was developed based on learning outcomes 7, 8, 10 and 11 of the learning
experiences.
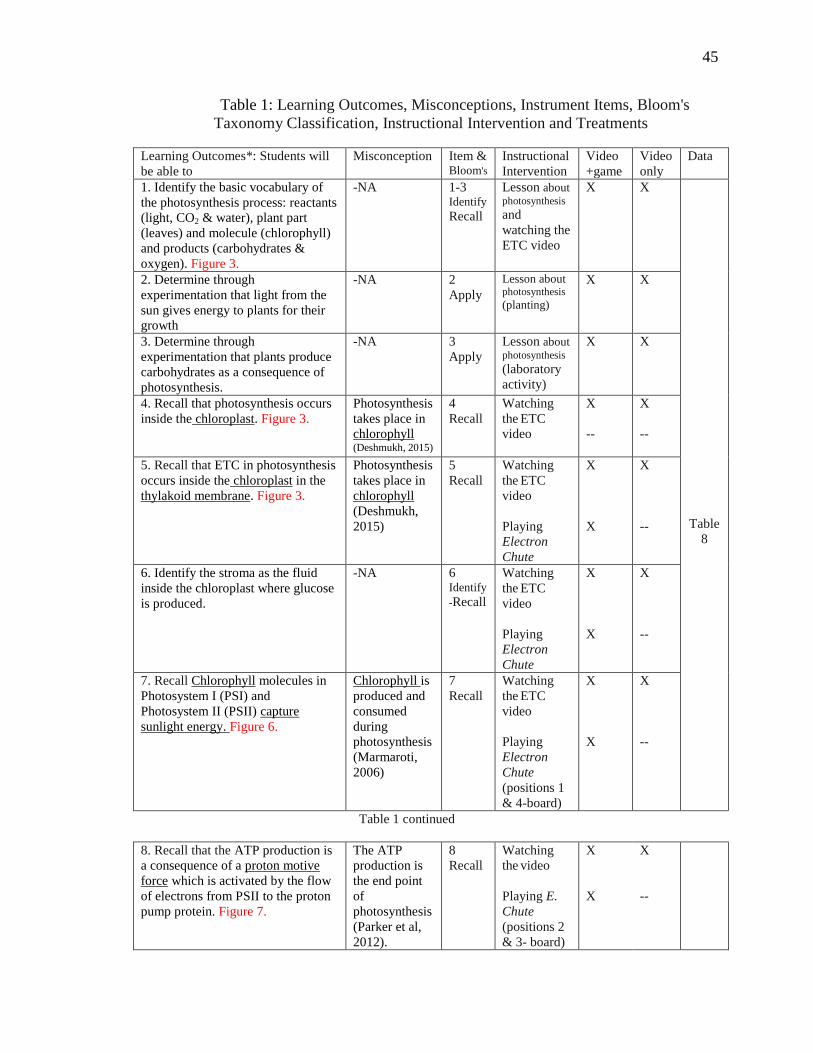
45
Table 1: Learning Outcomes, Misconceptions, Instrument Items, Bloom's
Taxonomy Classification, Instructional Intervention and Treatments
Learning Outcomes*: Students will
be able to
Misconception Item & Bloom's
Instructional
Intervention
Video
+game
Video
only
Data
1. Identify the basic vocabulary of
the photosynthesis process: reactants
(light, CO2 & water), plant part
(leaves) and molecule (chlorophyll)
and products (carbohydrates &
oxygen). Figure 3.
-NA 1-3 Identify
Recall
Lesson about photosynthesis and
watching the
ETC video
X X
Table
8
2. Determine through
experimentation that light from the
sun gives energy to plants for their
growth
-NA 2
Apply
Lesson about photosynthesis (planting)
X X
3. Determine through
experimentation that plants produce
carbohydrates as a consequence of
photosynthesis.
-NA 3
Apply
Lesson about photosynthesis
(laboratory
activity)
X X
4. Recall that photosynthesis occurs
inside the chloroplast. Figure 3.
Photosynthesis
takes place in
chlorophyll (Deshmukh, 2015)
4
Recall
Watching
the ETC
video
X
--
X
--
5. Recall that ETC in photosynthesis
occurs inside the chloroplast in the
thylakoid membrane. Figure 3.
Photosynthesis
takes place in
chlorophyll
(Deshmukh,
2015)
5
Recall
Watching
the ETC
video
Playing
Electron
Chute
X
X
X
--
6. Identify the stroma as the fluid
inside the chloroplast where glucose
is produced.
-NA 6 Identify
-Recall
Watching
the ETC
video
Playing
Electron
Chute
X
X
X
--
7. Recall Chlorophyll molecules in
Photosystem I (PSI) and
Photosystem II (PSII) capture
sunlight energy. Figure 6.
Chlorophyll is
produced and
consumed
during
photosynthesis
(Marmaroti,
2006)
7
Recall
Watching
the ETC
video
Playing
Electron
Chute
(positions 1
& 4-board)
X
X
X
--
Table 1 continued
8. Recall that the ATP production is
a consequence of a proton motive
force which is activated by the flow
of electrons from PSII to the proton
pump protein. Figure 7.
The ATP
production is
the end point
of
photosynthesis
(Parker et al,
2012).
8
Recall
Watching
the video
Playing E.
Chute
(positions 2
& 3- board)
X
X
X
--

46
9. Understand that the ETC process in
photosynthesis is the transformation
of sunlight energy into chemical
energy (ATP). Figure 7.
Photosynthesis
is when plants
take the light
from the sun
and create
oxygen to
support plants'
growth
(Schwartz,
2013)
9
Unders
tand
Watching
the ETC
video
Playing
Electron
Chute
X
X
X
--
Table
8
10. Recall that electrons lost by PSII
are replaced by electrons from water
after activation of water molecules
by sunlight energy. As a byproduct
of water splitting, oxygen is
released. Figure 8.
Photosynthesis
is a gas
exchange
process which
uses oxygen
(Marmaroti &
Galanopoulou,
2006)
10
Recall
Watching
the ETC
video
Playing
Electron
Chute
(position 1 -
board)
X
X
X
--
11. Recall that electrons are
transported from PSI through
proteins in the membrane to the final
acceptor of the electrons, a
metabolic molecule known as
NADPH. Figure 9.
Dark reactions
(Calvin Cycle)
requires
NADPH, ATP
& CO2 to
produce
carbohydrates
at night
(Lonergan,
2000)
11
Recall
Watching
the ETC
video
Playing
Electron
Chute
(position 5-
board)
X
X
X
--
12. Recall that the products of ETC
in photosynthesis, ATP and
NADPH, are used to convert CO2
into carbohydrates during the second
stage of photosynthesis.
Photosynthesis
is a gas
exchange
process which
uses oxygen
(Marmaroti &
Galanopoulou,
2006)
12
Recall
Watching
the ETC
video
Playing
Electron
Chute
X
X
X
--
*Based on the concept of energy transformation-Indiana Academic Standards for science (Indiana Department of Education, 2016),
the Next Generation Science Standards (NGSS) for the life sciences-LS1.C (NGSS, 2013), and the biochemical foundations of
photosynthesis (Lehninger, 2005). NA means no applicable.
47
2.5 Summary
Chapter 2 presented a literature review of previous research to provide a
background of common misconceptions of photosynthesis held by middle schoolers, and
guiding theories of learning and instructional design that informed the design of the
learning experiences. framework of this work. First, the researcher introduced a
description of the philosophy of biology to explain why students hold misconceptions
from a biological point of view. The misconceptions about the energy transformation
process in photosynthesis that students’ hold suggested they have limited knowledge of
ETC and may have an incomplete model of how the ETC process works. Second, the
author described schema theory for knowledge representation and the how people learn
framework to frame the design of the learning experiences; that is, the ETC video and the
Electron Chute game to support students’ acquisition of the ETC model. Finally, a
description of the learning outcomes of both learning experiences are presented. These
outcomes were defined based on the Indiana Academic Standards and the NGSS for
middle school for Life Sciences and the students' misconceptions about photosynthesis
described in the literature. Chapter 3 provided the methods used to conduct this research
and analyze the data collected in this work.
48
CHAPTER 3. METHODS
In the present research, the author claims the photosynthesis model presented to
students in the standards is incomplete. In the standards, photosynthesis is defined as an
energy transformation process, but it is presented as a descriptive process of inputs and
outputs -Indiana Academic Standards (Indiana Department of Education, 2016) and
NGSS standards (NGSS, 2013)- without reference to the electron transport chain (ETC)
process. The author' conjecture is that students may have an incomplete model of the
energy transformation process in photosynthesis and limited knowledge that could be the
reasons of the misconceptions described in the literature. The researcher argues that
learners need models that support their comprehension of ETC. The ETC process in
photosynthesis consists of a series of reactions involving a flow of electrons excited by
sunlight energy that transforms the electromagnetic energy from the sun into ATP inside
the plant cells (Lehninger et al., 2005; Blankenship, 2013).
In this study, the researcher examines to what extent a video and a serious game
targeting the ETC can help students achieve the desired learning outcomes of the ETC
process. The ETC video and the Electron Chute game were developed by the researcher
and they are representations of how the ETC process works. Both devices aim to support
students’ learning by enhancing their knowledge of ETC, promoting peer discussion and
helping learners to clarify misconceptions about the energy transformation of
photosynthesis. The ETC video and the Electron Chute game represent the process of
transformation of the energy from the sun to the synthesis of ATP through a flow of
49
electrons in a biological membrane. In Electron Chute, the chain reaction of electron
movement is mimicked by engaging students in physical moves of electrons cards.
In the present research, the learning outcomes of the learning experiences were
developed based on the Indiana Academic Standards and the Next Generation Science
Standards (NGSS) for middle school for Life Sciences and the students' misconceptions
about photosynthesis described in the literature. The knowledge students gained about
ETC after they watched the ETC video only or followed by playing the Electron Chute
game after watching the video was measured by using a knowledge test as an instrument.
This instrument was designed to measure the learning outcomes of the instructional
intervention presented in Chapter 2. Students' feedback from these learning experiences
were collected using a survey. Students in both treatments watched the ETC video.
Students in the experimental treatment watched the ETC video and played the Electron
Chute on the same day. The video only experienced a one-day delay between watching
the ETC video and playing Electron Chute. The delay provided the video only group the
opportunity to complete the posttest that measured their learning gains from just the ETC
video experience. The purpose of the study and the research question are presented in the
following sections. The measures and comparative analysis are also provided.
The Institutional Review Board (IRB) was approved on May 1, 2016, prior to the
start of the data collection for this research, under the approval number #11603017358
(Appendix F).
50
3.1 Purpose of the Study
The purpose of this study is to support students' learning of the energy
transformation process in photosynthesis and help them to clarify misconceptions about
this process. Specifically, the instructional approach developed in this work aims to
contribute to students' understanding of the transformation of sunlight, electromagnetic
energy, into high energy compounds -ATP and NADPH- inside a plant cell structure.
In this study, the researcher argues that a video and a game’s visual representation
of the ETC process would help students gain knowledge of the transformation of sunlight
energy into ATP and NADPH. This transformation involves the activation of a flow of
electrons through a biological membrane, the thylakoid membrane, subunit of the
chloroplast. Students could use that knowledge to explain how the ETC process works,
look for similarities with other processes inside the cell and infer how energy
transformation occurs in other organisms.
Laterally, this study explores evidences that the video and game learning
experiences have a positive impact on students from different academic readiness.
through a questionnaire survey, this research collects students' feedback about learning
ETC using a video and game with the intention of improving these learning experiences
for future learners.
51
3.2 Research Question
To investigate this conjecture, a research question was defined to frame the
inquiry of the study:
What are the specific learning outcomes achieved by middle school students after
learning about the energy transformation process in photosynthesis, process
known as electron transport chain (ETC), through video and serious game
learning experiences?
To answer the research question that guided this study, the researcher used a non-
equivalent quasi-experimental group design (NEGD) (Robson, 2002) because
randomization of participants cannot be assured in a school setting. The methods
consisted of a pretest-posttest evaluation of two similar groups at school based on the
score of the standardized assessments used by the school district (Table 2). These similar
groups constituted the treatments (Trochim & Donnelly, 2001).
The instrument (Appendix B) consisted of multiple-choice and essay sections in a
pretest-posttest design. The multiple-choice section (12 items) was a set of questions to
determine students' ability to (1) recall and recognize vocabulary of the main concepts of
photosynthesis and the ETC process; (2) recall how the process of ETC occurs in a way
that makes sense to the representation they were exposed to during the ETC video and the
Electron Chute game. The essay score gain provided general information about students'
ability to interpret a representation of ETC. A scoring rubric was developed to evaluate
students' responses (Appendix B).
52
An exit survey (Appendix C) was developed and used to collect students'
feedback of learning about ETC by watching the video followed by playing Electron
Chute. The survey collected data about (1) students' experiences while playing the game;
(2) specific characteristics of the video and the game students found helpful and difficult
for learning about ETC.
The quantitative analysis was performed to calculate the significance from pretest
to posttest (Devore, 2015) in both sections of the instrument-multiple-choice and essay
separately. The analysis consisted of (1) a comparison between the percentage of correct
answers achieved by the treatments as well as the challenge and regular classes-or
academic readiness- using a Z-Test (2) a comparison between score gain achieved by the
video only and video+game treatments as well as the challenge and regular classes using
an univariate analysis of variance (ANOVA); (3) a quantitative analysis of a survey about
students' feedback after the learning experiences using Z-Test and Chi-Square Test; (4) a
qualitative analysis of a survey using coding and organizing the information in a
frequency table. SPSS software was used to perform the analysis and to create the
histogram of the scores distribution and score gain for the treatments and the challenge
and regular classes.
A quantitative and qualitative analysis of the survey was performed to identify
any unforeseen issues the students had about the learning experiences or opportunities for
refinements of the game. The quantitative analysis was performed to compare the effect
of treatments and academic readiness-challenge and regular classes- on students'
agreement. The analysis provided information about how well students' experiences
watching the video and playing Electron Chute met the learning outcomes of the video
53
and game. The qualitative analysis included the coding of the open-ended section of the
survey. Categories were presented in frequency tables. The survey was developed by the
researcher and administrated at the end of the video and game learning experiences to all
students during the same day.
3.3 Participants
A middle school science teacher in an urban public school with whom the
researcher had an established relationship agreed to participate in the proposed research
and learning activities as part of her standard curriculum. Participants included 120
eighth grade students, 62 girls and 58 boys, distributed across six classes. Seventy percent
of the students at the school received either free or reduced lunch (Graphiq, n.d.).
Overall, 115 students completed all the activities of this study. At the end of the class
activities, all 120 students took the survey. The school divided their students in regular
and challenge classes. A regular class (N=66) included students who attend a mainstream
class according to the school corporation. A challenge class (N=49) included students
who were more prepared than students who attended a regular class according to the
school administration. These students have the opportunity to be challenged with content
knowledge that possesses a higher level of difficulty and requires higher level of thinking
skills according to the school corporation where this study was conducted. Table 2
summarizes the basic break down of the students by class period through the day. This
information was provided by the class teacher.
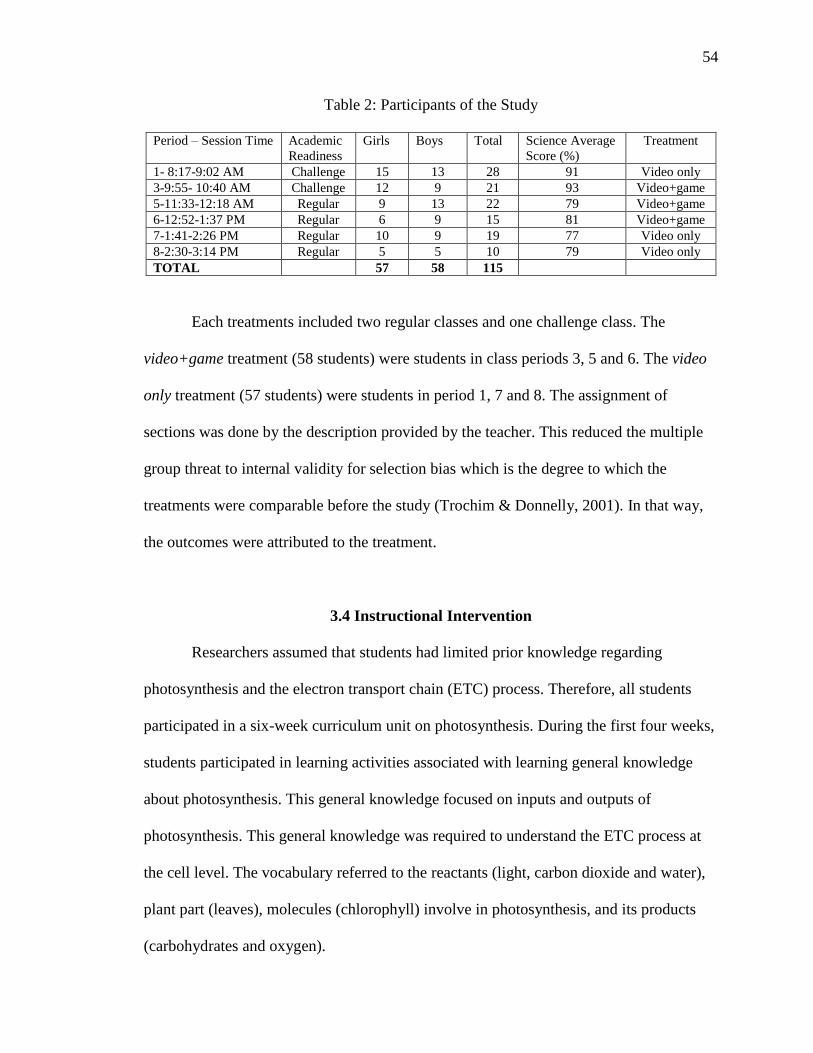
54
Table 2: Participants of the Study
Period – Session Time Academic
Readiness
Girls Boys Total Science Average
Score (%)
Treatment
1- 8:17-9:02 AM Challenge 15 13 28 91 Video only
3-9:55- 10:40 AM Challenge 12 9 21 93 Video+game
5-11:33-12:18 AM Regular 9 13 22 79 Video+game
6-12:52-1:37 PM Regular 6 9 15 81 Video+game
7-1:41-2:26 PM Regular 10 9 19 77 Video only
8-2:30-3:14 PM Regular 5 5 10 79 Video only
TOTAL 57 58 115
Each treatments included two regular classes and one challenge class. The
video+game treatment (58 students) were students in class periods 3, 5 and 6. The video
only treatment (57 students) were students in period 1, 7 and 8. The assignment of
sections was done by the description provided by the teacher. This reduced the multiple
group threat to internal validity for selection bias which is the degree to which the
treatments were comparable before the study (Trochim & Donnelly, 2001). In that way,
the outcomes were attributed to the treatment.
3.4 Instructional Intervention
Researchers assumed that students had limited prior knowledge regarding
photosynthesis and the electron transport chain (ETC) process. Therefore, all students
participated in a six-week curriculum unit on photosynthesis. During the first four weeks,
students participated in learning activities associated with learning general knowledge
about photosynthesis. This general knowledge focused on inputs and outputs of
photosynthesis. This general knowledge was required to understand the ETC process at
the cell level. The vocabulary referred to the reactants (light, carbon dioxide and water),
plant part (leaves), molecules (chlorophyll) involve in photosynthesis, and its products
(carbohydrates and oxygen).
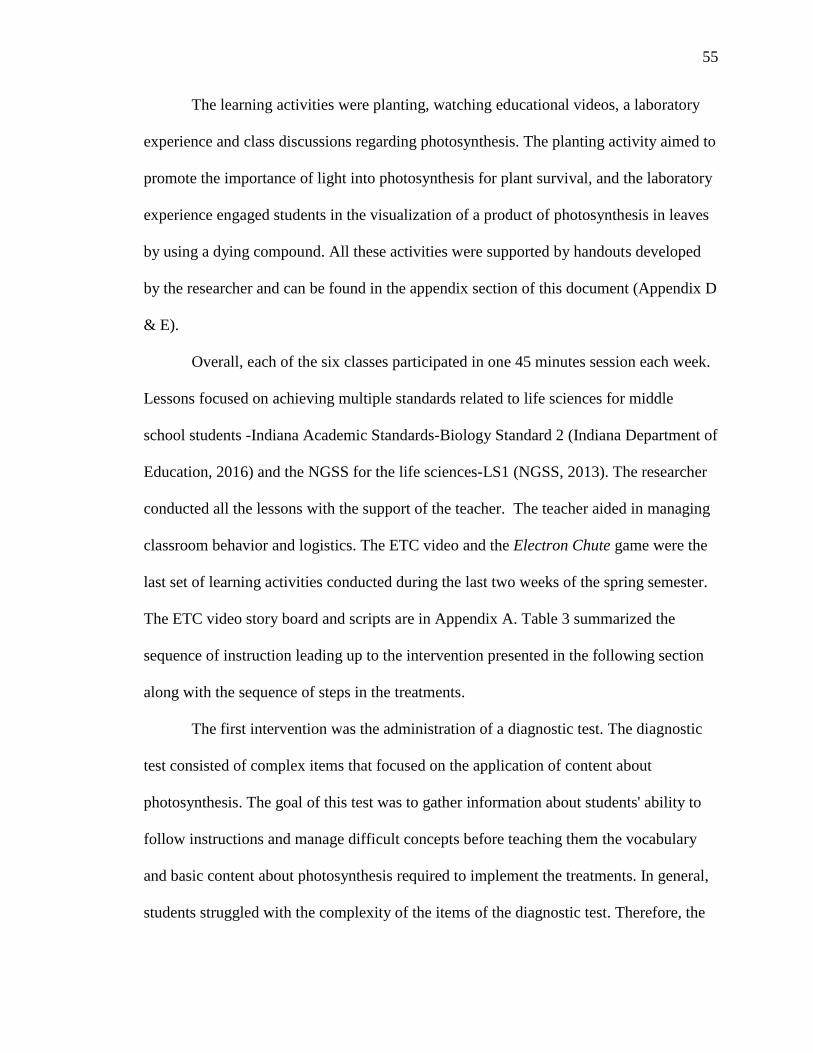
55
The learning activities were planting, watching educational videos, a laboratory
experience and class discussions regarding photosynthesis. The planting activity aimed to
promote the importance of light into photosynthesis for plant survival, and the laboratory
experience engaged students in the visualization of a product of photosynthesis in leaves
by using a dying compound. All these activities were supported by handouts developed
by the researcher and can be found in the appendix section of this document (Appendix D
& E).
Overall, each of the six classes participated in one 45 minutes session each week.
Lessons focused on achieving multiple standards related to life sciences for middle
school students -Indiana Academic Standards-Biology Standard 2 (Indiana Department of
Education, 2016) and the NGSS for the life sciences-LS1 (NGSS, 2013). The researcher
conducted all the lessons with the support of the teacher. The teacher aided in managing
classroom behavior and logistics. The ETC video and the Electron Chute game were the
last set of learning activities conducted during the last two weeks of the spring semester.
The ETC video story board and scripts are in Appendix A. Table 3 summarized the
sequence of instruction leading up to the intervention presented in the following section
along with the sequence of steps in the treatments.
The first intervention was the administration of a diagnostic test. The diagnostic
test consisted of complex items that focused on the application of content about
photosynthesis. The goal of this test was to gather information about students' ability to
follow instructions and manage difficult concepts before teaching them the vocabulary
and basic content about photosynthesis required to implement the treatments. In general,
students struggled with the complexity of the items of the diagnostic test. Therefore, the
56
teacher recommended simplifying the items for the final instrument used in this study.
The information provided by the diagnostic test was used by the researcher to develop the
lessons of photosynthesis (Appendix D and E) prior the video and game learning
experiences.
Table 3: Sequence of Instruction Leading up to the Intervention and Sequence of
Steps in the Treatments
Week Description of Activity Video+game
Video
only
1 Diagnostic test: General knowledge test about photosynthesis and
ETC administrated to create the lessons about photosynthesis
x x
2 Lesson about photosynthesis: Part 1 (Appendix D)
Watch a YouTube video about general knowledge of photosynthesis
https://www.youtube.com/watch?v=ttFoPiRBwrY
x x
3 Lesson about photosynthesis: Part 2 (Appendix D)
x x
4 Laboratory activity: (Appendix E) x x
5 Pretest (Appendix B)
x x
6 Watch the ETC video: https://drive.google.com/file/d/0BxHDv-
4_A8eyUklBV08xWHpIS2M/view?usp=sharing
x x
6 Teach instructions and play Electron Chute
x
6 Play a different game not related to photosynthesis: Fruit and
Vegetable Bingo game by Lucy Hammett
x
6 Posttest (Appendix B) which end the pretest-posttest design
experiment
x x
7 Teach instructions and play Electron Chute
x
7 Exit survey to collect students' feedback x X
Two treatment conditions were used to evaluate the learning outcomes using
video only versus video plus the ETC serious game. The video+game treatment began
their learning experience with a short introduction outlining the plan for the day. The
students watched the video as a class and the researcher asked the students if they had
any questions about the video. Next, the researcher explained the rules of the Electron
Chute game, answered questions and then divided the class into groups of three or four
57
students. Students met at one of seven stations around the classroom that were
prearranged with the game materials and a copy of the rules. In each one of the three
class periods of the experimental treatment (3, 5 & 6), there were three to five trained
adults including the teacher and the researcher. They answered questions students had
while playing the game. These adults were previously trained by the researcher about
how to play the game. The playing time was 20-25 minutes. Three randomly selected
station per class were recorded using a camera to study students' conversations and
interaction while playing the game.
The video only group began their experience similarly with a description of the
plan for the day and then watched the ETC video and were given the chance to ask
questions. The difference was that they played the Fruit and Vegetable Bingo game by
Lucy Hammett Games which is not related to the photosynthesis game.
The following day each group completed a posttest measuring their ability to
recall facts about ETC in photosynthesis by answer multiple-choice questions and explain
the process of ETC through essay questions targeting the interpretation of the
representation in the ETC video and the Electron Chute game. After the posttest the video
only group had the opportunity to play the ETC game, but did not view the video a
second time. On the last day students in both treatments completed the exit survey used in
this study which is described later. The following sections provide a more detailed
account of the two treatment conditions.

58
3.4.1 Classroom Procedure
3.4.1.1 Pre-test Day (Appendix B)
Before starting the class (3 minutes). The teacher explained to the students the
organization of the classroom procedures involved in electron transport chain (ETC) unit
as part of her curriculum: a three-days project which consisted of (1) the administration
of a pretest to know how familiar students were with concepts related to photosynthesis
and the ETC process; (2) the learning experiences-ETC video and Electron Chute game-
for the video+game treatment versus the ETC video and the Fruit and Vegetable Bingo
game for the video only treatment; (3) the administration of a posttest to know how much
familiar students were with concepts related to photosynthesis and the ETC processes
after the treatment.
Before the test (3 minutes). The researcher asked students to review the pretest
and after that, students received information about the organization of the test: (1) The
first four questions of the multiple-choice section were related to concepts they learned
during the previous lessons of photosynthesis. See Table 1, weeks 2 to 4. The following
eight questions of the multiple-choice and the essay section were related to the ETC
content material the researcher designed into the ETC video and the Electron Chute
game. The reason of this 3-minutes intervention was to reduce the level of students'
anxiety of not knowing some of the concepts contained in the test. Students were
encouraged by the teacher to give their best guess even if they were not sure about the
answer.
59
Pre-test (15-20 minutes). Students were informed they could ask the researcher
any questions related to format during the test. For example, format questions in the essay
section, such as, if the numbers 1 to 11 in the sheet were related to the numbers 1 to 11 in
the representation. Also, if they should read the ETC representation from left to right or
right to left.
After the test (5 minutes). Students were informed about what the research
design of a ETC project was and why the different classes were not playing Electron
Chute at the same time. Students were informed that the pretest- posttest design could be
applied to any field they were planning to pursue in their future, such as technology,
education, medicine, literature, science, arts and communication. After that, there was a
short discussion (3 minutes) about electrons to identify if they were familiar with what
electrons were. Some students were familiar with electrons, others seemed to remember
little from their previous classes. Students had studied molecules, atoms and electrons
earlier as part of the teacher’s curriculum. Then, the researcher showed them a short
video (https://youtu.be/IOXxFaHbIXg) about electrons in an atom. After that, there was a
class discussion about what electrons were to help them remember about electrons. The
researcher selected this video to show students the concept of electrons move/flow,
because that idea was fundamental to understand the ETC video and the dynamic of the
Electron Chute game.
60
3.4.1.2 Treatment Day
ETC video (5:30 minutes). As discussed in Chapter 2, the design of the ETC
video emphasized the context of the ETC process in the plant, because students needed
the complexity of the process informed by a well-structured transition from macro to
micro representations of photosynthesis and the ETC process.
After the ETC video (3 minutes). The researcher and students discussed how the
content of the ETC video was related to the representation on the test. Most of them
could make some conclusions about the ETC process.
Before Electron Chute (2 minutes). The researcher reviewed the main concepts
of the board game and the rules of the game (Appendix I). The discussion of the rules
was expressed in terms of the explanation of ETC: (1) flow of electrons => production of
NADPH; (2) movement of H+ activated by the flow of electrons equals the production of
ATP; (3) ATP + NADPH + CO2 = Glucose production (winning the game). This last
formula was kept on the screen during the game play to remind students how to win the
game.
Electron Chute game (20-25 minutes). As discussed in Chapter 2, the game
actions were analogous to the movement and reactions associated with the flow of
electrons in the ETC process that transforms sunlight energy into chemical energy (ATP).

61
3.5 Data Collection Methods
The researcher provided the teacher with copies of the pretest and posttest with an
assigned number printed on them, and the teacher assigned those numbers to specific
students. The researcher did not have access to the key containing matched student names
and numbers.
3.5.1 Instrument (Knowledge test)
The instrument (Appendix B) consisted of a two major sections, a multiple choice
section and an essay section. The 12 multiple-choice questions measured (1) students'
ability to recall and recognize vocabulary of the main concepts of photosynthesis and the
electron transport chain (ETC) process; (2) and their ability to recall how the process of
ETC occurs in a way that makes sense to the representation they were exposed to during
the video and the game (12 points total). The items were developed based on the learning
outcomes of the learning experiences which were supported by the standards -Indiana
Academic Standards (Indiana Department of Education, 2016) and the NGSS standards
(NGSS, 2013). The revised version of Bloom's Taxonomy was used to create the items
(Anderson, Krathwohl, & Bloom, 2001). Most of the items in the multiple-choice section
measured students' ability to recall or remember vocabulary and major parts of the ETC
process. Exceptions are (1) item 9 that measured students' ability to understand the ETC
process (understanding level); (2) items 2 and 3 that determined students' ability to
demonstrate facts through experimentation (applying level).
The knowledge test also included an essay section to determine students' ability to
interpret a representation of ETC and generate a narrative with the representation using
62
the correct language and organized the sequence of events involved in the ETC process
(11 points total).
3.5.1.1 Instrument Validity
The content validity of the instrument was confirmed by an expert in biosciences
as recommended by Robson (2002). The content validity was also confirmed by the
research team and the science teacher. The rubric of the essay section is included in
Appendix B and its inter-rater reliability was calculated and explained later in this
chapter.
3.5.1.2 Analysis of the items of the instrument-difficult and discrimination
indices
The item evaluation was done after students had the learning experiences-
watching the video or watching the video and playing the game. This was the evaluation
of the items in the posttest. The frequency distribution of the scores for the test takers
(N=115) was organized in a histogram. To measure the level of difficulty of each item,
the scores of the whole class (N=115) were considered to calculate the difficult index (p).
The difficult index (p) is the proportion of learners who answered an item correctly. The
p value should be between 0.21-0.60 which indicates that the item is neither too difficult
nor too easy. The interpretation of value per range is: (1) below or equal 0.20, very
difficult; (2) 0.21-0.40, moderately difficult; (3) 0.41-0.60, average; (4) 0.61-0.80,
moderately easy; (5) above or equal 0.81, very easy (Popham, 2013). This parameter is
calculated using the expression below:
Difficult Index (p) = Number of students answering an item correctly
Total number of students attempting item
63
To measure the discrimination (D) of each item, the tests of all students (N=115)
were divided into two groups consisting of the highest scores group (N=58) and the
lowest scores group (N=57) tests each. The division of the tests for the high score and
low score groups considers the total number of students who take the test and the
distribution of the scores in the histogram. The discrimination index (D) indicates the
extent to which an item differentiates between learners who score well on the test and
those students who perform poorly. The value of D for the keyed response, correct
option, of each item should be positive. The D value for each one of the distractors
should be negative. Distractors that have a positive D should be rewritten. Distractors that
have a D value equal to zero might be rewritten (Popham, 2013). This discrimination
index (D) is calculated using the expression below:
D =N° of students answering an item correctly in the high group-N° answering correctly in the low group
Number of students in either the high or the low group
Example of calculations. As an example of calculation, consider the following
statement (item 12): "What molecules transform carbon dioxide into carbohydrates?
(Answer: ATP, NADPH)" In the posttest, 41 out of 115 students answered it correctly.
Therefore, the level of difficulty of item 12 was 0.36. This means that item 12 was
moderately difficult with only 41 out of 115 students selecting the correct choice. See
expression below:
Difficult Index (p) = 41/115 = 0.36
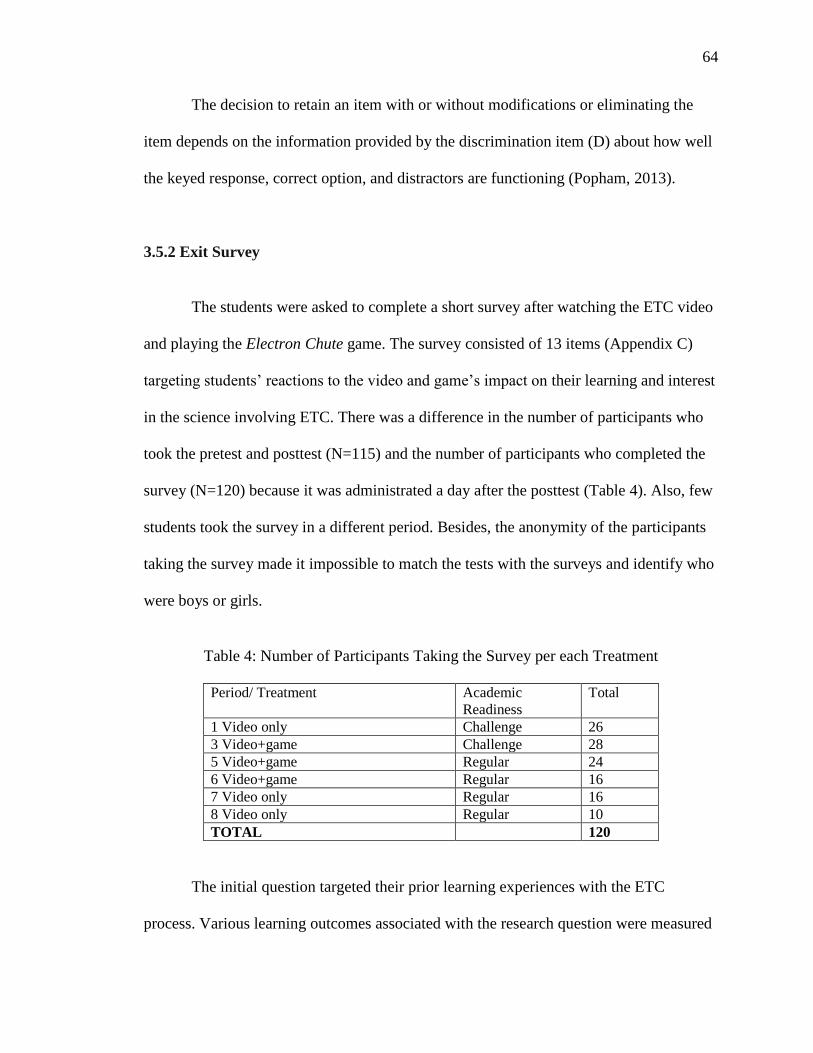
64
The decision to retain an item with or without modifications or eliminating the
item depends on the information provided by the discrimination item (D) about how well
the keyed response, correct option, and distractors are functioning (Popham, 2013).
3.5.2 Exit Survey
The students were asked to complete a short survey after watching the ETC video
and playing the Electron Chute game. The survey consisted of 13 items (Appendix C)
targeting students’ reactions to the video and game’s impact on their learning and interest
in the science involving ETC. There was a difference in the number of participants who
took the pretest and posttest (N=115) and the number of participants who completed the
survey (N=120) because it was administrated a day after the posttest (Table 4). Also, few
students took the survey in a different period. Besides, the anonymity of the participants
taking the survey made it impossible to match the tests with the surveys and identify who
were boys or girls.
Table 4: Number of Participants Taking the Survey per each Treatment
Period/ Treatment Academic
Readiness
Total
1 Video only Challenge 26
3 Video+game Challenge 28
5 Video+game Regular 24
6 Video+game Regular 16
7 Video only Regular 16
8 Video only Regular 10
TOTAL 120
The initial question targeted their prior learning experiences with the ETC
process. Various learning outcomes associated with the research question were measured
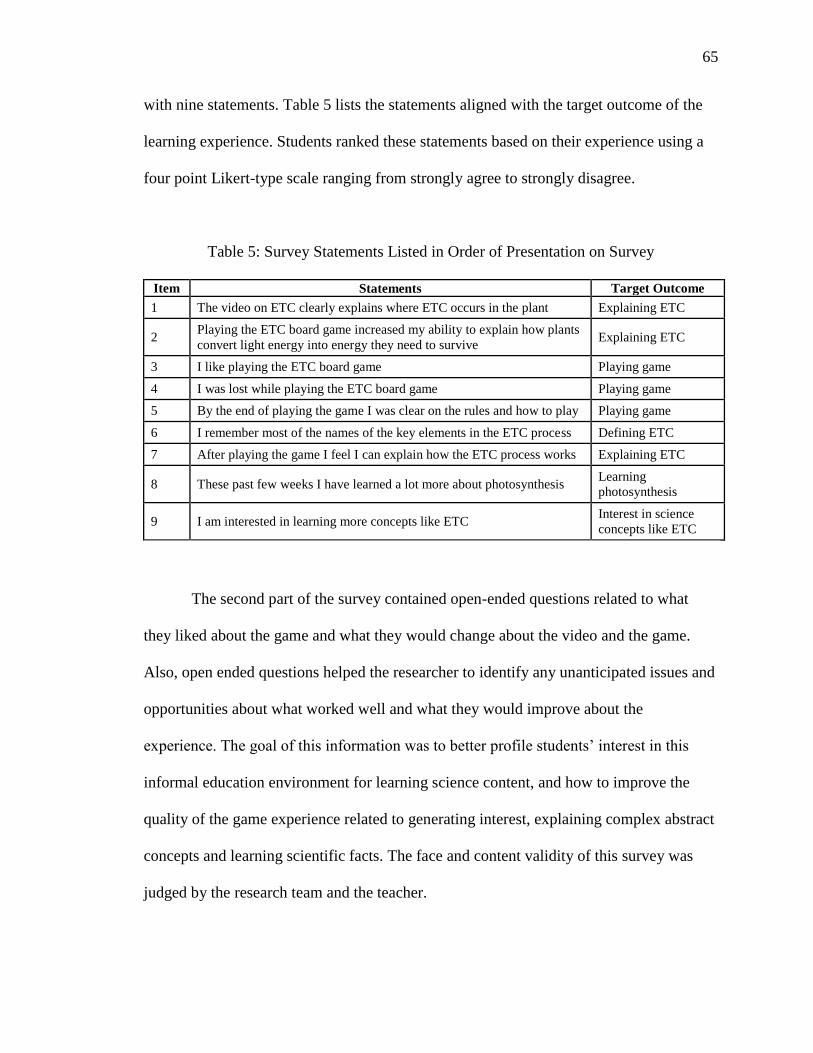
65
with nine statements. Table 5 lists the statements aligned with the target outcome of the
learning experience. Students ranked these statements based on their experience using a
four point Likert-type scale ranging from strongly agree to strongly disagree.
Table 5: Survey Statements Listed in Order of Presentation on Survey
Item Statements Target Outcome
1 The video on ETC clearly explains where ETC occurs in the plant Explaining ETC
2 Playing the ETC board game increased my ability to explain how plants
convert light energy into energy they need to survive Explaining ETC
3 I like playing the ETC board game Playing game
4 I was lost while playing the ETC board game Playing game
5 By the end of playing the game I was clear on the rules and how to play Playing game
6 I remember most of the names of the key elements in the ETC process Defining ETC
7 After playing the game I feel I can explain how the ETC process works Explaining ETC
8 These past few weeks I have learned a lot more about photosynthesis Learning
photosynthesis
9 I am interested in learning more concepts like ETC Interest in science
concepts like ETC
The second part of the survey contained open-ended questions related to what
they liked about the game and what they would change about the video and the game.
Also, open ended questions helped the researcher to identify any unanticipated issues and
opportunities about what worked well and what they would improve about the
experience. The goal of this information was to better profile students’ interest in this
informal education environment for learning science content, and how to improve the
quality of the game experience related to generating interest, explaining complex abstract
concepts and learning scientific facts. The face and content validity of this survey was
judged by the research team and the teacher.
66
The survey analysis was performed for both treatments to see if this delay would
significantly impact their overall learning experience with the video plus game. The
video+game group experienced the ETC video and played Electron Chute on the same
day. However, the video only group experienced a one-day delay between watching the
ETC video and playing the Electron Chute game. The delay provided the video only
group the opportunity to complete the posttest that measured their learning gains from
just the ETC video experience.
67
3.6 Data Analysis
The data analysis in this study was done following the recommendations of the
Purdue University Statistical Consulting Service. SPSS was used to analyze the pre/post
results and survey results. SPSS was also used to generate histograms of the score
distribution for the multiple-choice and the essay sections of the pretest and posttest and
the inter-rater reliability of the rubric developed to evaluate the essay section of the
instrument.
3.6.1 Multiple-Choice Section Analysis
3.6.1.1 Differences in Achievement of Learning Outcomes between Treatments
for the Multiple-Choice -Two Independent Variables
An analysis known as inference concerning a difference between population
proportions was conducted for each treatment to identify potential difference between
them. These two treatments were the two independent variables of the analysis and were
referred to as x (video only) and y (video+game). The follow provides details of the
analysis methods used to make these comparisons.
Using statistical analysis researchers studied if the differences between the
changes in percentage of correct answers per question on the pretest and posttest for the
treatments were likely due to chance or had statistical significance. A comparison of two
population proportions was conducted to determine if there was a statistically significant
difference between the change in percentage of correct answers in the pretest and the
posttest for the video only (x) and the video+game (y) treatments. The analysis was done
per each question. The hypothesis test is indicated below:

68
Null hypothesis: Ho: p2-p1= 0 (where p1 is the proportion from a video only
population and p2 from the video+game population)
Alternative hypothesis: Ha: p2-p1 > 0 (z ≥ zα one-tailed distribution)
If there is no difference between the proportion of the video only and video+game
populations, then the difference of p2-p1 is expected to be zero.
Assuming a random sample was selected independently from population 1 (n1)
and independently from population 2 (n2), then the variables x -difference between the
percentage of correct answers in the pretest and the posttest for the video only treatment
per question- and y -difference between the percentage of correct answers in the pretest
and the posttest for the video+game treatment per question- are also independent. Then
(x/n1-y/n2) is the natural estimator for (p2-p1). Defining x/n1 p 1 and y/n2 as p 2, the
estimator for (p2-p1 can be expressed as p 2- p 1) (Devore, 2015). In this study, n1 is the
sample size of the video only group and n2 is the sample size of the video+game group.
A Z-test was used to test the difference between population proportions who
possesses a characteristic of interest. The Z-test assumes normal distribution for p 2-p 1
and random sample from the population. The estimator p 2-p 1) is approximately normally
distributed when the sample size n1 and n2 are considered large. Sample size n1 and n2 are
considered large when n1p 1 ≥10; n1 1- p 1) ≥ 10; n2p 2 ≥10; n2 1- p 2) ≥ 10 which is required
to use the formula for the test statistic value Z (below).
The hypothesis test was carried out using a significance level α of 0.05.
Statistical significance of 0.05 means that the probability of something being true is 95%.
The z critical value is zα:0.05 =1.645. Ho is rejected if z ≥ 1.645 (Devore, 2015).
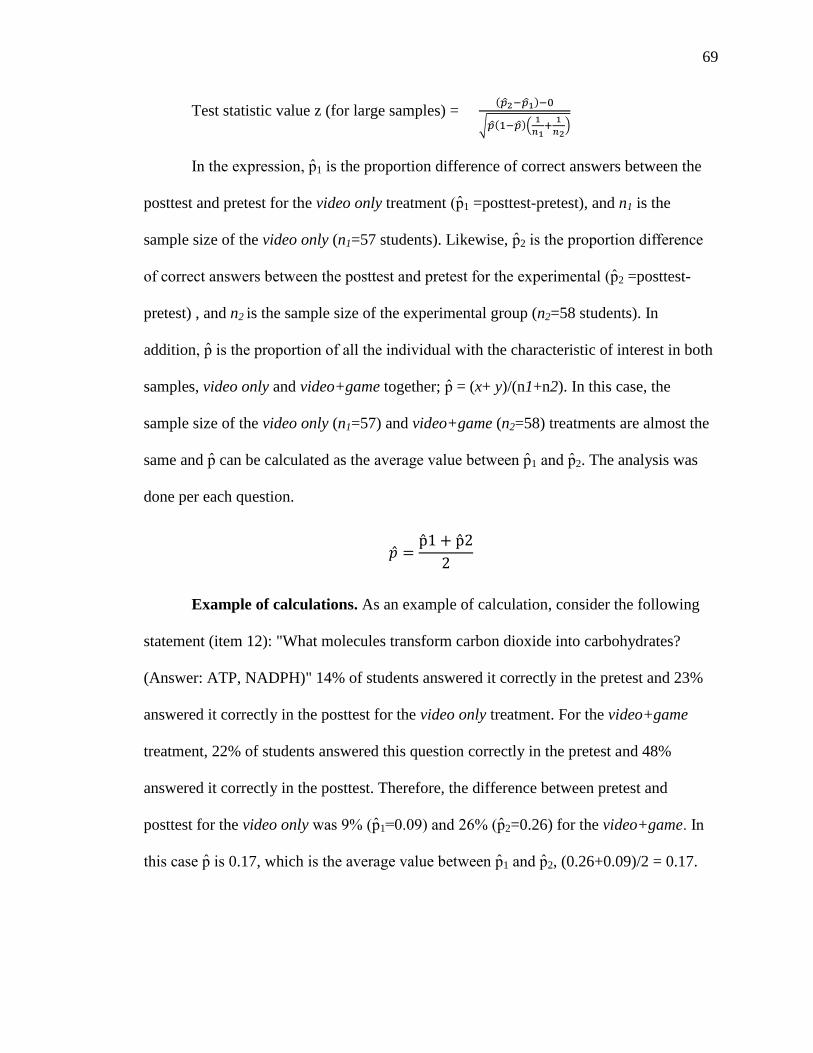
69
Test statistic value z (for large samples) =
n the expression, p 1 is the proportion difference of correct answers between the
posttest and pretest for the video only treatment p 1 =posttest-pretest), and n1 is the
sample size of the video only (n1=57 students). Likewise, p 2 is the proportion difference
of correct answers between the posttest and pretest for the experimental p 2 =posttest-
pretest) , and n2 is the sample size of the experimental group (n2=58 students). In
addition, p is the proportion of all the individual with the characteristic of interest in both
samples, video only and video+game together; p = (x+ y)/(n1+n2). In this case, the
sample size of the video only (n1=57) and video+game (n2=58) treatments are almost the
same and p can be calculated as the average value between p 1 and p 2. The analysis was
done per each question.
Example of calculations. As an example of calculation, consider the following
statement (item 12): "What molecules transform carbon dioxide into carbohydrates?
(Answer: ATP, NADPH)" 14% of students answered it correctly in the pretest and 23%
answered it correctly in the posttest for the video only treatment. For the video+game
treatment, 22% of students answered this question correctly in the pretest and 48%
answered it correctly in the posttest. Therefore, the difference between pretest and
posttest for the video only was p 1 0.0 and p 2=0.26) for the video+game. n
this case p is 0.17, which is the average value between p 1 and p 2, (0.26+0.09)/2 = 0.17.
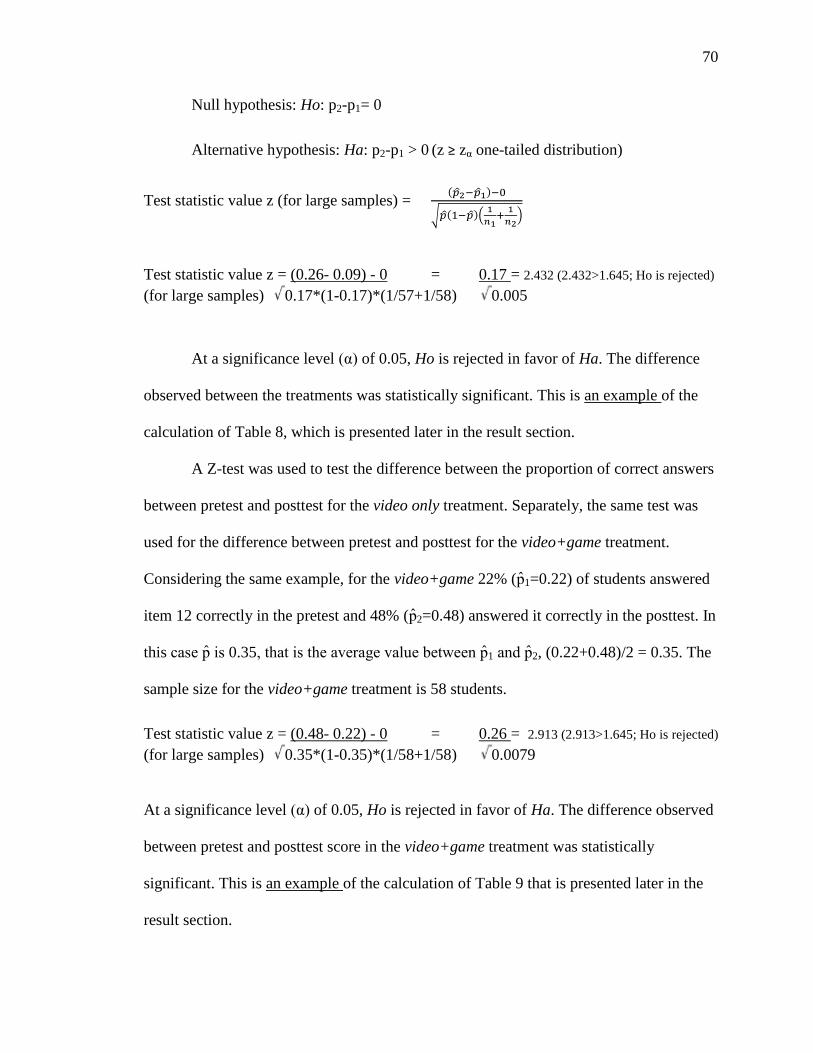
70
Null hypothesis: Ho: p2-p1= 0
Alternative hypothesis: Ha: p2-p1 > 0 (z ≥ zα one-tailed distribution)
Test statistic value z (for large samples) =
Test statistic value z = (0.26- 0.09) - 0 = 0.17 = 2.432 (2.432>1.645; Ho is rejected)
(for large samples) 0.17*(1-0.17)*(1/57+1/58) 0.005
At a significance level α of 0.05, Ho is rejected in favor of Ha. The difference
observed between the treatments was statistically significant. This is an example of the
calculation of Table 8, which is presented later in the result section.
A Z-test was used to test the difference between the proportion of correct answers
between pretest and posttest for the video only treatment. Separately, the same test was
used for the difference between pretest and posttest for the video+game treatment.
Considering the same example, for the video+game 22% (p 1=0.22) of students answered
item 12 correctly in the pretest and 48% (p 2=0.48) answered it correctly in the posttest. In
this case p is 0.35, that is the average value between p 1 and p 2, (0.22+0.48)/2 = 0.35. The
sample size for the video+game treatment is 58 students.
Test statistic value z = (0.48- 0.22) - 0 = 0.26 = 2.913 (2.913>1.645; Ho is rejected)
(for large samples) 0.35*(1-0.35)*(1/58+1/58) 0.0079
At a significance level α of 0.05, Ho is rejected in favor of Ha. The difference observed
between pretest and posttest score in the video+game treatment was statistically
significant. This is an example of the calculation of Table 9 that is presented later in the
result section.

71
3.6.1.2 Effect of Treatments on Overall Average Score Gain for the Multiple-
Choice
A univariate analysis of variance (ANOVA) was performed to calculate the
significance of the score gain from pretest to posttest (Devore, 2015). The dependent
variable was gain. The statistical method compares the overall average score gain versus
treatments.
ANOVA calculates a p-value which is the probability of the null (Ho) hypothesis
being not correct. The p value is known as significance (sig.) and is presented in Chapter
4 (Table 10). Ho is rejected when p value < α value. In this study, α was defined as 0.05.
A p-value lower than 0.05 means that there is a significant evidence to reject Ho in favor
of Ha. This is what the researcher expected in an hypothesis test. The hypothesis for the
treatment effect on overall average score gain for the multiple-choice section (hypothesis
1) is presented below where μ is the mean of the population.
Hypothesis 1: Considering only the treatment effect on score gain (Multiple-Choice)
Null hypothesis: Ho: μ score gain in video only = μ score gain in video+game
(Playing Electron Chute is not significant for score gain)
Alternative hypothesis: Ha: μ score gain in video only ≠ μ score gain in
video+game (Playing Electron Chute is significant for score gain)
Both treatments include students from both regular and challenge classes.
72
3.6.1.3 Effect of Academic Readiness-Challenge versus Regular Classes-on
Overall Average Score Gain for the Multiple-Choice
A univariate analysis of variance (ANOVA) was performed to calculate the
significance of the score gain from pretest to posttest (Devore, 2015). The dependent
variable was gain. The statistical method compares the overall average score gain versus
academic readiness-regular and challenge classes. The hypothesis for the academic
readiness effect on overall average score gain for the multiple-choice section (hypothesis
2) is presented below where μ is the mean of the population.
Hypothesis 2: Considering only the academic readiness effect- challenge and
regular- on score gain (Multiple-Choice)
Null hypothesis: Ho: μ score gain in challenge class = μ score gain in regular
class (class is not significant for score gain)
Alternative hypothesis: Ha: μ score gain in challenge class ≠ μ score gain in
regular class (class is significant for score gain)
The regular and challenge classes include students from both treatments.
3.6.1.4 Effect of Treatment between Academic Readiness on Overall Average
Score Gain for the Multiple-Choice
A univariate analysis of variance (ANOVA) was performed to calculate the
significance of the score gain from pretest to posttest (Devore, 2015). The dependent
variable was gain. The statistical method compares the overall average score gain versus
73
the interaction between treatments and classes. The hypothesis for the effect of treatment
between academic readiness on overall average score gain for the multiple-choice section
(hypothesis 3) is presented below where μ is the mean of the population.
Hypothesis 3: Considering the effect of treatment between the academic
readiness on score gain (Multiple-Choice)
Null hypothesis: Ho: μ score gain with interaction =μ score gain without
interaction (the interaction between class and treatment is not significant for score gain)
Alternative hypothesis: Ha: μ score gain with interaction ≠ μ score gain without
interaction (the interaction between class and treatment is significant for score
improvement gain)
The analysis of the interaction between classes and treatments is performed to
evaluate how the game, Electron Chute, impacts both classes -challenge and regular.
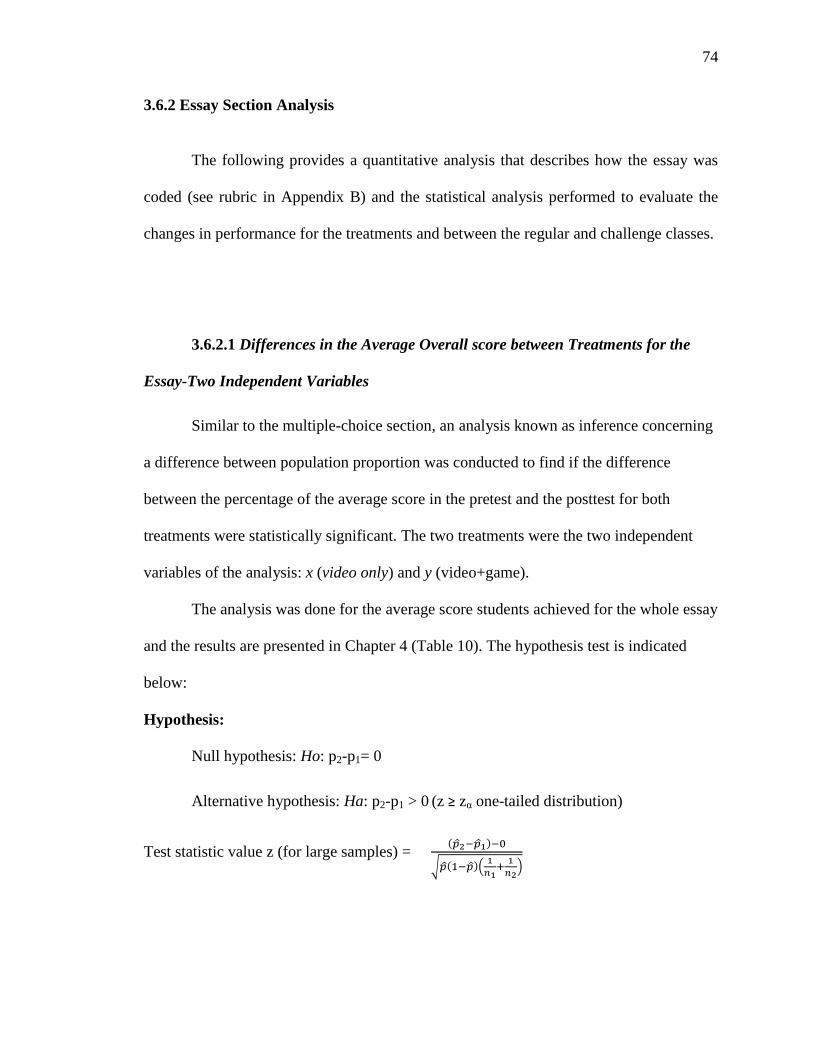
74
3.6.2 Essay Section Analysis
The following provides a quantitative analysis that describes how the essay was
coded (see rubric in Appendix B) and the statistical analysis performed to evaluate the
changes in performance for the treatments and between the regular and challenge classes.
3.6.2.1 Differences in the Average Overall score between Treatments for the
Essay-Two Independent Variables
Similar to the multiple-choice section, an analysis known as inference concerning
a difference between population proportion was conducted to find if the difference
between the percentage of the average score in the pretest and the posttest for both
treatments were statistically significant. The two treatments were the two independent
variables of the analysis: x (video only) and y (video+game).
The analysis was done for the average score students achieved for the whole essay
and the results are presented in Chapter 4 (Table 10). The hypothesis test is indicated
below:
Hypothesis:
Null hypothesis: Ho: p2-p1= 0
Alternative hypothesis: Ha: p2-p1 > 0 (z ≥ zα one-tailed distribution)
Test statistic value z (for large samples) =
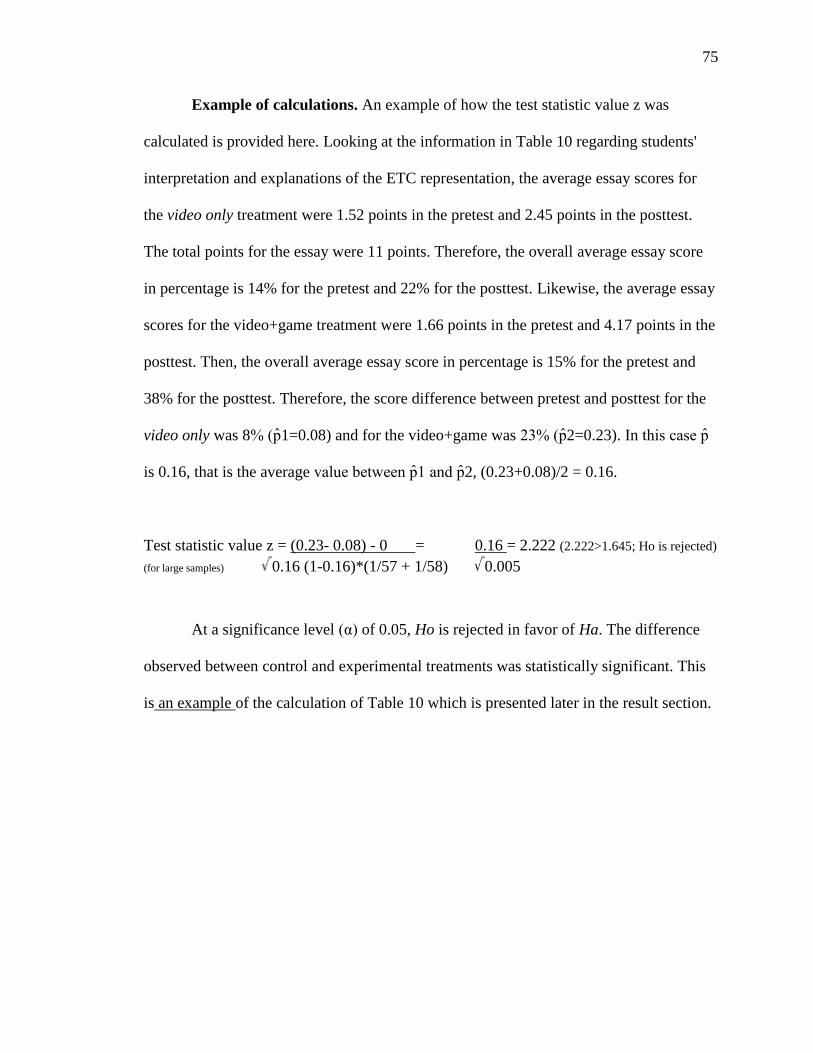
75
Example of calculations. An example of how the test statistic value z was
calculated is provided here. Looking at the information in Table 10 regarding students'
interpretation and explanations of the ETC representation, the average essay scores for
the video only treatment were 1.52 points in the pretest and 2.45 points in the posttest.
The total points for the essay were 11 points. Therefore, the overall average essay score
in percentage is 14% for the pretest and 22% for the posttest. Likewise, the average essay
scores for the video+game treatment were 1.66 points in the pretest and 4.17 points in the
posttest. Then, the overall average essay score in percentage is 15% for the pretest and
38% for the posttest. Therefore, the score difference between pretest and posttest for the
video only was 8 p 1=0.08) and for the video+game was p 2=0.23). In this case p
is 0.16, that is the average value between p 1 and p 2, (0.23+0.08)/2 = 0.16.
Test statistic value z = (0.23- 0.08) - 0 = 0.16 = 2.222 (2.222>1.645; Ho is rejected)
(for large samples) 0.16 (1-0.16)*(1/57 + 1/58) 0.005
At a significance level α of 0.05, Ho is rejected in favor of Ha. The difference
observed between control and experimental treatments was statistically significant. This
is an example of the calculation of Table 10 which is presented later in the result section.
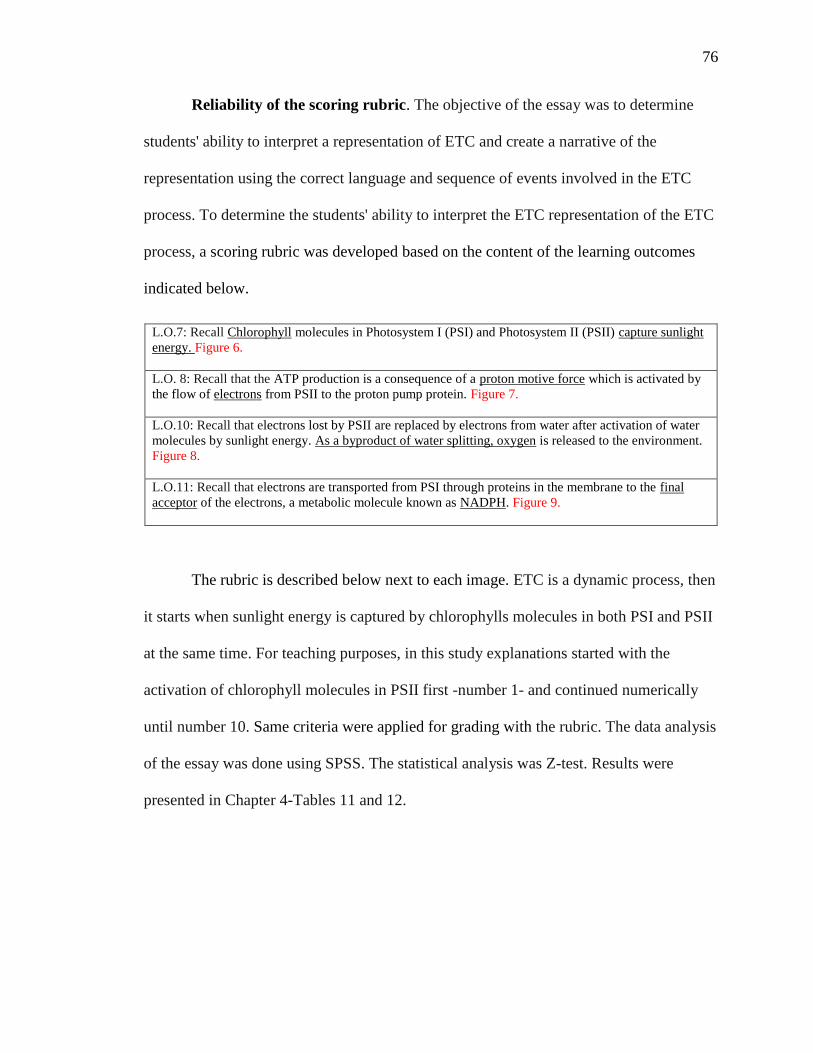
76
Reliability of the scoring rubric. The objective of the essay was to determine
students' ability to interpret a representation of ETC and create a narrative of the
representation using the correct language and sequence of events involved in the ETC
process. To determine the students' ability to interpret the ETC representation of the ETC
process, a scoring rubric was developed based on the content of the learning outcomes
indicated below.
L.O.7: Recall Chlorophyll molecules in Photosystem I (PSI) and Photosystem II (PSII) capture sunlight
energy. Figure 6.
L.O. 8: Recall that the ATP production is a consequence of a proton motive force which is activated by
the flow of electrons from PSII to the proton pump protein. Figure 7.
L.O.10: Recall that electrons lost by PSII are replaced by electrons from water after activation of water
molecules by sunlight energy. As a byproduct of water splitting, oxygen is released to the environment.
Figure 8.
L.O.11: Recall that electrons are transported from PSI through proteins in the membrane to the final
acceptor of the electrons, a metabolic molecule known as NADPH. Figure 9.
The rubric is described below next to each image. ETC is a dynamic process, then
it starts when sunlight energy is captured by chlorophylls molecules in both PSI and PSII
at the same time. For teaching purposes, in this study explanations started with the
activation of chlorophyll molecules in PSII first -number 1- and continued numerically
until number 10. Same criteria were applied for grading with the rubric. The data analysis
of the essay was done using SPSS. The statistical analysis was Z-test. Results were
presented in Chapter 4-Tables 11 and 12.
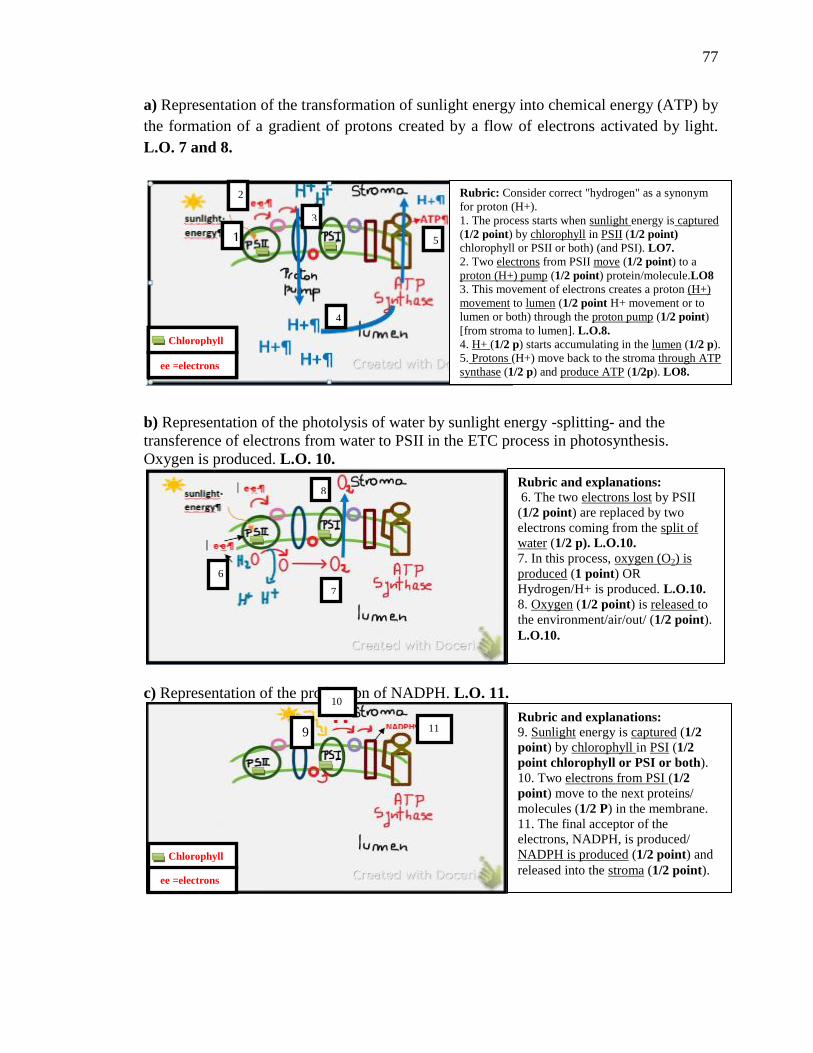
77
a) Representation of the transformation of sunlight energy into chemical energy (ATP) by
the formation of a gradient of protons created by a flow of electrons activated by light.
L.O. 7 and 8.
b) Representation of the photolysis of water by sunlight energy -splitting- and the
transference of electrons from water to PSII in the ETC process in photosynthesis.
Oxygen is produced. L.O. 10.
c) Representation of the production of NADPH. L.O. 11.
ee =electrons
Chlorophyll
Chlorophyll
ee =electrons
1
2
3
4
5
ee =electrons
Chlorophyll
Rubric: Consider correct "hydrogen" as a synonym
for proton (H+).
1. The process starts when sunlight energy is captured
(1/2 point) by chlorophyll in PSII (1/2 point)
chlorophyll or PSII or both) (and PSI). LO7.
2. Two electrons from PSII move (1/2 point) to a
proton (H+) pump (1/2 point) protein/molecule.LO8
3. This movement of electrons creates a proton (H+)
movement to lumen (1/2 point H+ movement or to
lumen or both) through the proton pump (1/2 point)
[from stroma to lumen]. L.O.8.
4. H+ (1/2 p) starts accumulating in the lumen (1/2 p).
5. Protons (H+) move back to the stroma through ATP
synthase (1/2 p) and produce ATP (1/2p). LO8.
________________________________
________________________________
________________________________
________________________________
________________________________
________________________________
________________________________
________________________________
___________
1
1
2
2 3
3
4
4
5
ee =electrons
Chlorophyll
Rubric and explanations:
6. The two electrons lost by PSII
(1/2 point) are replaced by two
electrons coming from the split of
water (1/2 p). L.O.10.
7. In this process, oxygen (O2) is
produced (1 point) OR
Hydrogen/H+ is produced. L.O.10.
8. Oxygen (1/2 point) is released to
the environment/air/out/ (1/2 point).
L.O.10.
6
7
87
Rubric and explanations:
9. Sunlight energy is captured (1/2
point) by chlorophyll in PSI (1/2
point chlorophyll or PSI or both).
10. Two electrons from PSI (1/2
point) move to the next proteins/
molecules (1/2 P) in the membrane.
11. The final acceptor of the
electrons, NADPH, is produced/
NADPH is produced (1/2 point) and
released into the stroma (1/2 point).
9
10
11
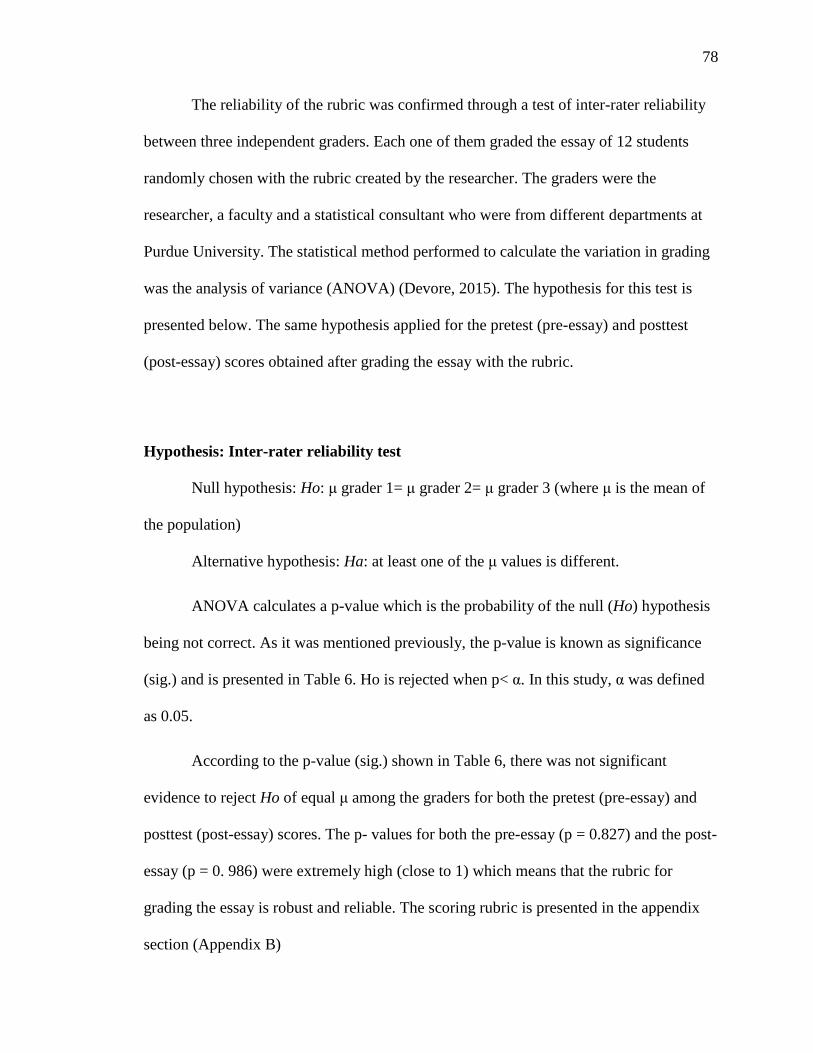
78
The reliability of the rubric was confirmed through a test of inter-rater reliability
between three independent graders. Each one of them graded the essay of 12 students
randomly chosen with the rubric created by the researcher. The graders were the
researcher, a faculty and a statistical consultant who were from different departments at
Purdue University. The statistical method performed to calculate the variation in grading
was the analysis of variance (ANOVA) (Devore, 2015). The hypothesis for this test is
presented below. The same hypothesis applied for the pretest (pre-essay) and posttest
(post-essay) scores obtained after grading the essay with the rubric.
Hypothesis: Inter-rater reliability test
Null hypothesis: Ho: μ grader 1= μ grader 2= μ grader 3 (where μ is the mean of
the population)
Alternative hypothesis: Ha: at least one of the μ values is different.
ANOVA calculates a p-value which is the probability of the null (Ho) hypothesis
being not correct. As it was mentioned previously, the p-value is known as significance
(sig.) and is presented in Table 6. Ho is rejected when p< α. In this study, α was defined
as 0.05.
According to the p-value (sig.) shown in Table 6, there was not significant
evidence to reject Ho of equal μ among the graders for both the pretest (pre-essay) and
posttest (post-essay) scores. The p- values for both the pre-essay (p = 0.827) and the post-
essay (p = 0. 986) were extremely high (close to 1) which means that the rubric for
grading the essay is robust and reliable. The scoring rubric is presented in the appendix
section (Appendix B)
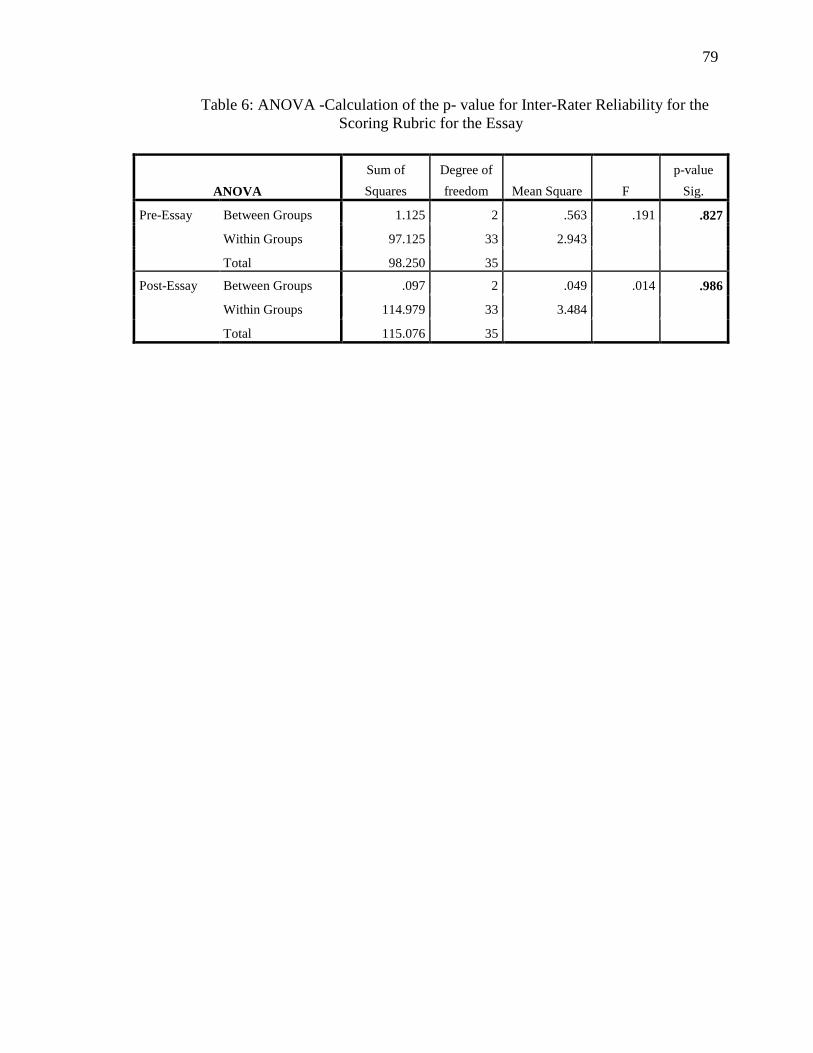
79
Table 6: ANOVA -Calculation of the p- value for Inter-Rater Reliability for the
Scoring Rubric for the Essay
ANOVA
Sum of
Squares
Degree of
freedom Mean Square F
p-value
Sig.
Pre-Essay Between Groups 1.125 2 .563 .191 .827
Within Groups 97.125 33 2.943
Total 98.250 35
Post-Essay Between Groups .097 2 .049 .014 .986
Within Groups 114.979 33 3.484
Total 115.076 35
80
3.6.2.2 Effect of Treatments on Overall Average Score Gain for the Essay
Similar to the multiple-choice section of this test, a univariate analysis of variance
(ANOVA) was performed to calculate the significance of the overall average score gain
from pretest to posttest (Devore, 2015). The dependent variable was gain. The statistical
method compared the overall average score gain versus treatments.
ANOVA calculates a p-value which is the probability of the null (Ho) hypothesis
being no correct. The p value is known as significance (sig.) and is presented in Chapter 4
(Table 10). Ho is rejected when p value < α value. In this study, α was defined as 0.05. A
p-value lower than 0.05 means that there is a significant evidence to reject Ho in favor of
Ha.
The hypothesis for the treatment effect on overall average score gain for the essay
section (hypothesis 1) is presented below and is the same than the one presented
previously for the multiple-choice section of the test. In the following expression, μ is the
mean of the population.
Hypothesis 1: Considering only the treatment effect on score gain (Essay)
Null hypothesis: Ho: μ score gain in video only = μ score gain in video+game
(Playing Electron Chute is not significant for score gain)
Alternative hypothesis: Ha: μ score gain in video only ≠ μ score gain in
video+game (Playing Electron Chute is significant for score gain)
The treatments include students from both regular and challenge classes. The
analysis of the video only performance gives some indication of the benefits of the ETC
81
video while the performance of the video+game treatment provides some indication of
the learning potential of the ETC video and Electron Chute together.
3.6.2.3 Effect of Academic Readiness-Challenge versus Regular Classes-on Overall
Average Score Gain for the Essay
A univariate analysis of variance (ANOVA) was performed to calculate the
significance of the overall average score gain from pretest to posttest (Devore, 2015). The
dependent variable was gain. The statistical method compared the overall average score
gain versus academic readiness-regular and challenge classes. The hypothesis for the
academic readiness effect on overall average score gain for essay section (hypothesis 2)
is presented below where μ is the mean of the population.
Hypothesis 2: Considering only the academic readiness effect on score gain (Essay)
Null hypothesis: Ho: μ score gain in regular class = μ score gain in challenge
class (class is not significant for score gain)
Alternative hypothesis: Ha: μ score gain in academic class ≠ μ score gain in
challenge class (class is significant for score gain)
The regular and challenge classes include students from both treatments.
82
3.6.2.4 Effect of Treatment between Academic Readiness on Overall Average Score
Gain for the Essay
A univariate analysis of variance (ANOVA) was performed to calculate the
significance of the score gain from pretest to posttest (Devore, 2015). The dependent
variable was gain. The statistical method compared the overall average score gain versus
the interaction between treatments and classes. The hypothesis for the effect of treatment
between academic readiness on overall average score gain for the essay section
(hypothesis 3) is presented below where μ is the mean of the population.
Hypothesis 3: Considering the effect of treatment between the academic readiness
on score gain (Essay)
Null hypothesis: Ho: μ score gain with interaction =μ score gain without
interaction (the interaction between class and treatment is not significant for score gain)
Alternative hypothesis: Ha: μ score gain with interaction ≠ μ score gain without
interaction (the interaction between class and treatment is significant for score gain).
The analysis of the interaction between classes and treatments gives some
indications of how students from different academic backgrounds react to informal
teaching methods.

83
3.6.3 Quantitative Analysis of the Survey
A statistical analysis of the four point Likert-type scale items was used to
determine the strength of the whole class’ N 1 0 agreement with a particular statement.
A single-group statistical analysis with a binary dependent (agree/disagree) variable was
used to determine the variable "level of agreement" of the entire population of students
identified for each statement.
A second analysis known as inference concerning a difference between
population proportion was conducted for each treatment and for each class-challenge and
regular- to identify potential difference between them. Both treatments are the two
independent variables of the analysis and are referred as x (video only) and y
(video+game). The analysis was used to see if there was a significant difference in the
level of agreement between the treatments. Similarly, challenge (x) and regular (y)
classes are the two independent variables of the analysis. The analysis was also used to
see if there was a significant difference in the level of agreement between the regular and
challenge classes. The follow provides details of the analysis methods used to make these
comparisons.
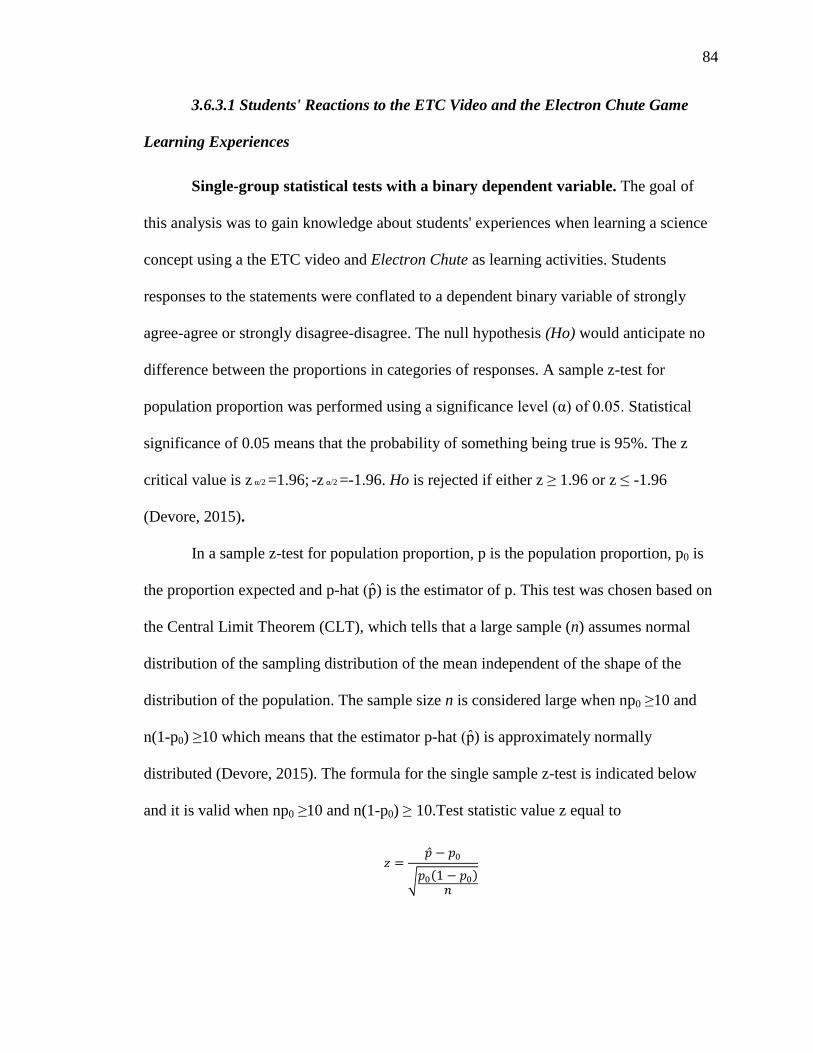
84
3.6.3.1 Students' Reactions to the ETC Video and the Electron Chute Game
Learning Experiences
Single-group statistical tests with a binary dependent variable. The goal of
this analysis was to gain knowledge about students' experiences when learning a science
concept using a the ETC video and Electron Chute as learning activities. Students
responses to the statements were conflated to a dependent binary variable of strongly
agree-agree or strongly disagree-disagree. The null hypothesis (Ho) would anticipate no
difference between the proportions in categories of responses. A sample z-test for
population proportion was performed using a significance level α of 0.05. Statistical
significance of 0.05 means that the probability of something being true is 95%. The z
critical value is z α/2 =1.96; -z α/2 =-1.96. Ho is rejected if either z ≥ 1.96 or z ≤ -1.96
(Devore, 2015).
In a sample z-test for population proportion, p is the population proportion, p0 is
the proportion expected and p-hat p ) is the estimator of p. This test was chosen based on
the Central Limit Theorem (CLT), which tells that a large sample (n) assumes normal
distribution of the sampling distribution of the mean independent of the shape of the
distribution of the population. The sample size n is considered large when np0 ≥10 and
n(1-p0) ≥10 which means that the estimator p-hat p ) is approximately normally
distributed (Devore, 2015). The formula for the single sample z-test is indicated below
and it is valid when np0 ≥10 and n(1-p0) ≥ 10.Test statistic value z equal to
85
In the expression, p is the proportion of the sample choosing strongly agree-agree,
n is the sample size and p0(1-p0)/n is the standard error, sp0. The margin error of the
survey items was calculated multiplying the standard error and the z critical value. The
margin error is 8.9 % (margin error = sp0*1.96*100% = 0.0456*1.96*100 = 8.9%). As it
was indicated above, p0 is the proportion expected (0.5) if there is no difference between
the proportion of strongly agree-agree and strongly disagree-disagree responses. The
hypothesis test was:
Hypothesis
Null hypothesis: Ho: p = p0 Ho: p = 0.5
Alternative hypothesis: Ha: p ≠ p0 Ha: p ≠ 0.5 either z ≥ z α/2 or z ≤ -z α/2 two-tailed
distribution)
Example of calculations. As an example, in this study, 68 p = 0.68) of
participants in the class strongly agreed-agreed that playing Electron Chute increased
their ability to explain how plants convert light energy into energy they need to survive.
The sample size was n=120, therefore, 120*0.5 ≥10 and 120(1-0.5) ≥ 10 which means
that the estimator p-hat p ) is approximately normally distributed, hence the following
test procedure is valid.
The statistic value z = (0.68-0.5)/( 0.5(1-0.5)/120) = 0.18/ 0.0021= 3.83 (3.83>
1.96).
At a significance level α of 0.05, Ho is rejected. The difference between the
strongly agree-agree and strongly disagree-disagree proportions cannot be explained by
86
sampling variability. The difference between strongly agree-agree and strongly disagree-
disagree was statistically significant.
3.6.3.2 Effect of Treatments on Students' Reactions to the Video and Game and
Interest in Science
The goal of this analysis was to identify how the treatments influence on their
opinions about learning science using a video and a game as learning activities.
Inferences concerning a difference between population proportions. A
between two independent variables (x and y) analysis was used to compare the
differences between the strongly agree-agree responses indicated by the video only (x)
and video+game (y) treatments. A two-tailed test with α alpha level of 0.05 was used to
test for significance. For each one of the statements of the exit survey, the following
hypothesis was tested:
Hypothesis:
Null hypothesis: Ho: p1-p2= 0 (where p1 and p2 are the strongly agree-agree
proportions from a first population (video only) and from a second population
(video+game) respectively
Alternative hypothesis: Ha: p1-p2 ≠ 0 (either z ≥ z α/2 or z ≤ -z α/2 two-tailed
distribution)
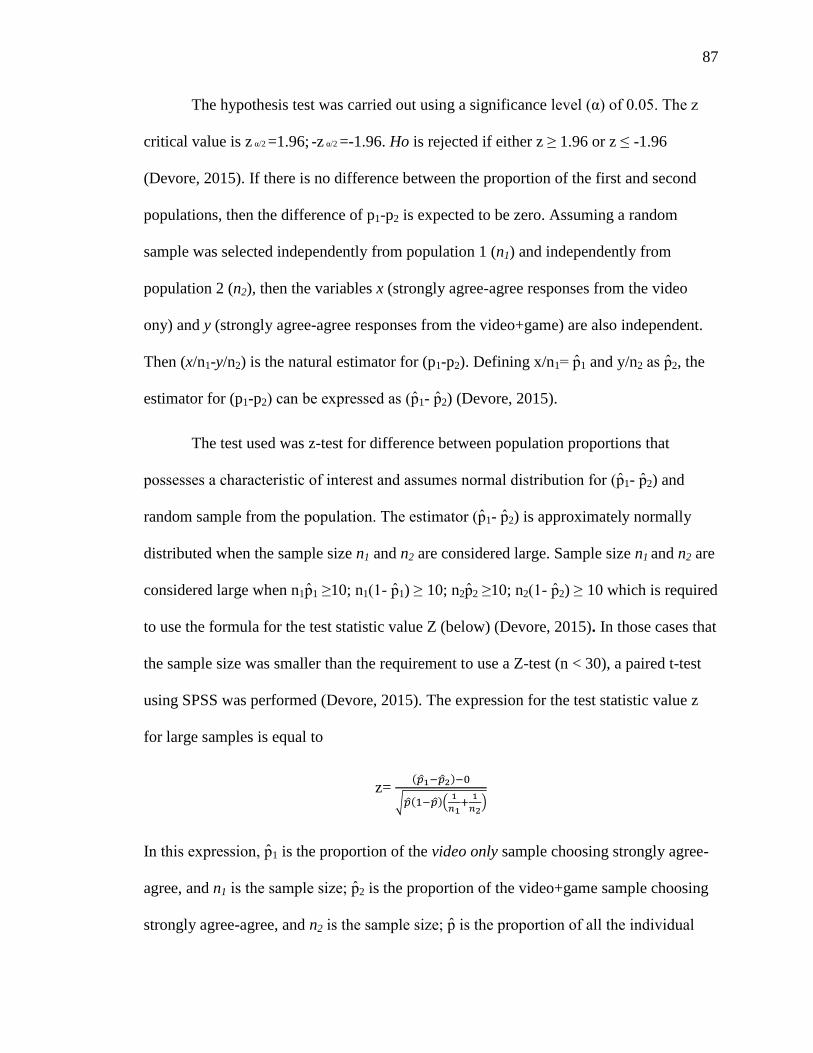
87
The hypothesis test was carried out using a significance level α of 0.05. The z
critical value is z α/2 =1.96; -z α/2 =-1.96. Ho is rejected if either z ≥ 1.96 or z ≤ -1.96
(Devore, 2015). If there is no difference between the proportion of the first and second
populations, then the difference of p1-p2 is expected to be zero. Assuming a random
sample was selected independently from population 1 (n1) and independently from
population 2 (n2), then the variables x (strongly agree-agree responses from the video
ony) and y (strongly agree-agree responses from the video+game) are also independent.
Then (x/n1-y/n2) is the natural estimator for (p1-p2). Defining x/n1 p 1 and y/n2 as p 2, the
estimator for (p1-p2 can be expressed as p 1- p 2) (Devore, 2015).
The test used was z-test for difference between population proportions that
possesses a characteristic of interest and assumes normal distribution for p 1- p 2) and
random sample from the population. The estimator p 1- p 2) is approximately normally
distributed when the sample size n1 and n2 are considered large. Sample size n1 and n2 are
considered large when n1p 1 ≥10; n1 1- p 1) ≥ 10; n2p 2 ≥10; n2 1- p 2) ≥ 10 which is required
to use the formula for the test statistic value Z (below) (Devore, 2015). In those cases that
the sample size was smaller than the requirement to use a Z-test (n < 30), a paired t-test
using SPSS was performed (Devore, 2015). The expression for the test statistic value z
for large samples is equal to
z=
n this expression, p 1 is the proportion of the video only sample choosing strongly agree-
agree, and n1 is the sample size p 2 is the proportion of the video+game sample choosing
strongly agree-agree, and n2 is the sample size p is the proportion of all the individual
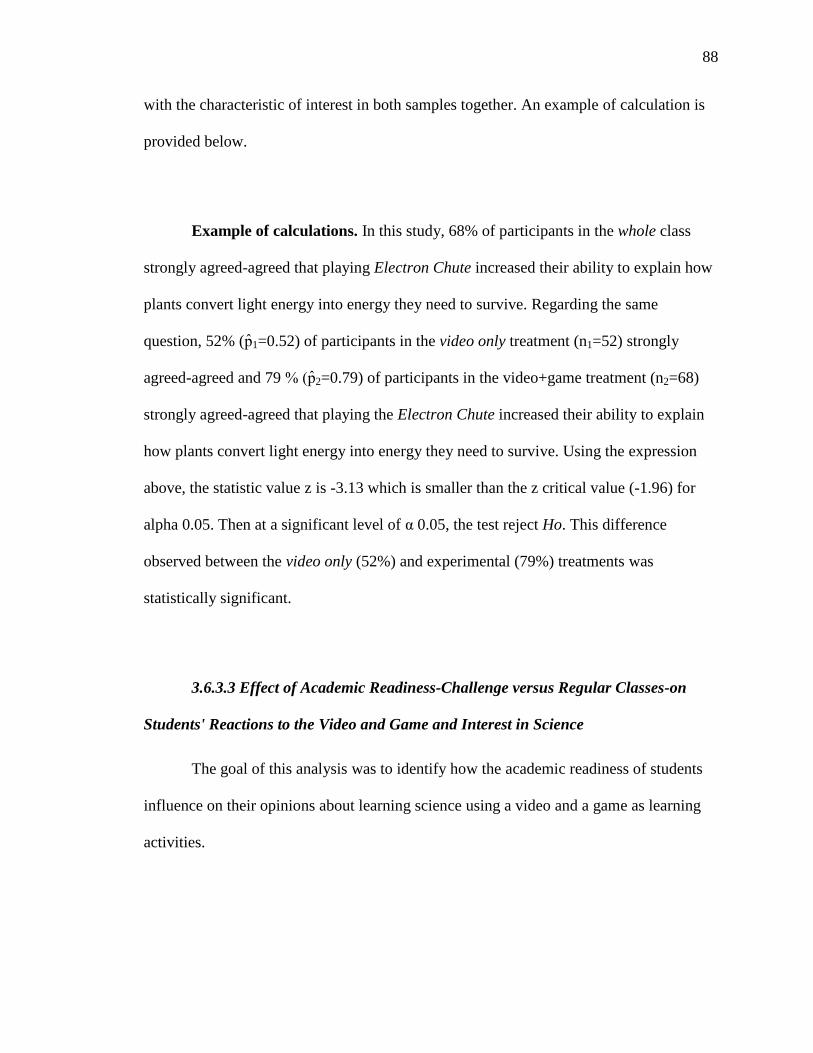
88
with the characteristic of interest in both samples together. An example of calculation is
provided below.
Example of calculations. In this study, 68% of participants in the whole class
strongly agreed-agreed that playing Electron Chute increased their ability to explain how
plants convert light energy into energy they need to survive. Regarding the same
question, 52% (p 1=0.52) of participants in the video only treatment (n1=52) strongly
agreed-agreed and 79 p 2=0.79) of participants in the video+game treatment (n2=68)
strongly agreed-agreed that playing the Electron Chute increased their ability to explain
how plants convert light energy into energy they need to survive. Using the expression
above, the statistic value z is -3.13 which is smaller than the z critical value (-1.96) for
alpha 0.05. Then at a significant level of α 0.05, the test reject Ho. This difference
observed between the video only (52%) and experimental (79%) treatments was
statistically significant.
3.6.3.3 Effect of Academic Readiness-Challenge versus Regular Classes-on
Students' Reactions to the Video and Game and Interest in Science
The goal of this analysis was to identify how the academic readiness of students
influence on their opinions about learning science using a video and a game as learning
activities.
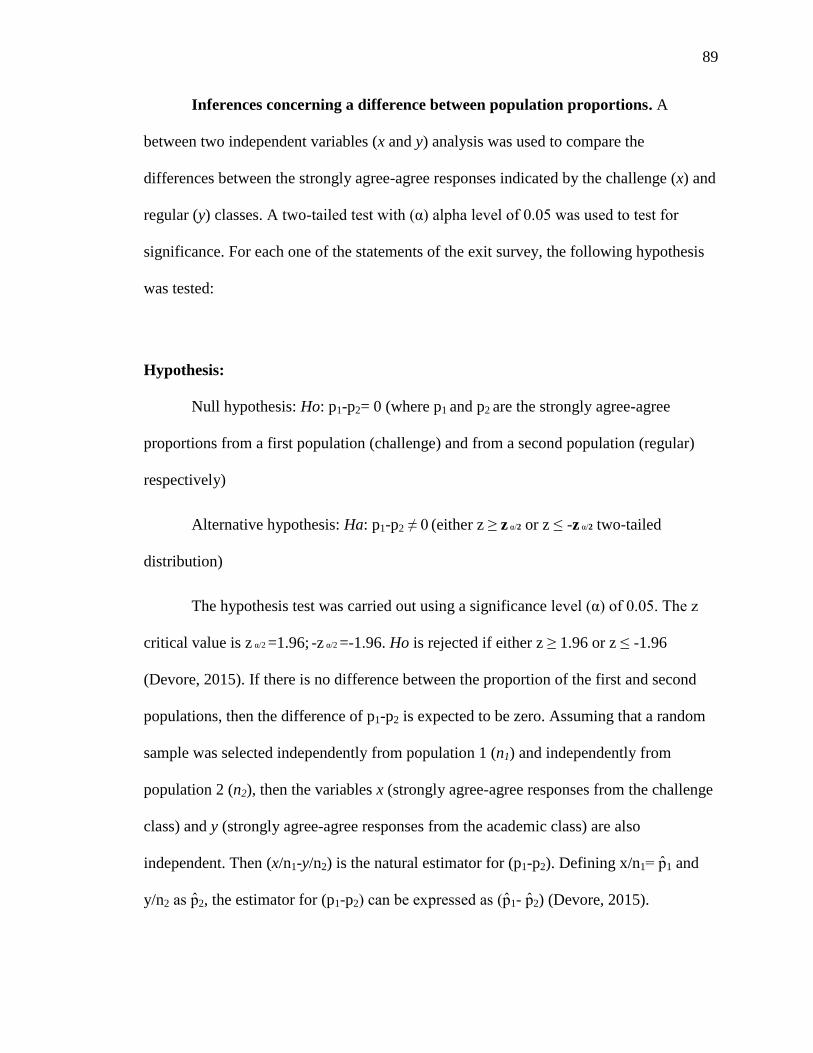
89
Inferences concerning a difference between population proportions. A
between two independent variables (x and y) analysis was used to compare the
differences between the strongly agree-agree responses indicated by the challenge (x) and
regular (y) classes. A two-tailed test with α alpha level of 0.05 was used to test for
significance. For each one of the statements of the exit survey, the following hypothesis
was tested:
Hypothesis:
Null hypothesis: Ho: p1-p2= 0 (where p1 and p2 are the strongly agree-agree
proportions from a first population (challenge) and from a second population (regular)
respectively)
Alternative hypothesis: Ha: p1-p2 ≠ 0 (either z ≥ z α/2 or z ≤ -z α/2 two-tailed
distribution)
The hypothesis test was carried out using a significance level α of 0.05. The z
critical value is z α/2 =1.96; -z α/2 =-1.96. Ho is rejected if either z ≥ 1.96 or z ≤ -1.96
(Devore, 2015). If there is no difference between the proportion of the first and second
populations, then the difference of p1-p2 is expected to be zero. Assuming that a random
sample was selected independently from population 1 (n1) and independently from
population 2 (n2), then the variables x (strongly agree-agree responses from the challenge
class) and y (strongly agree-agree responses from the academic class) are also
independent. Then (x/n1-y/n2) is the natural estimator for (p1-p2). Defining x/n1 p 1 and
y/n2 as p 2, the estimator for (p1-p2 can be expressed as p 1- p 2) (Devore, 2015).
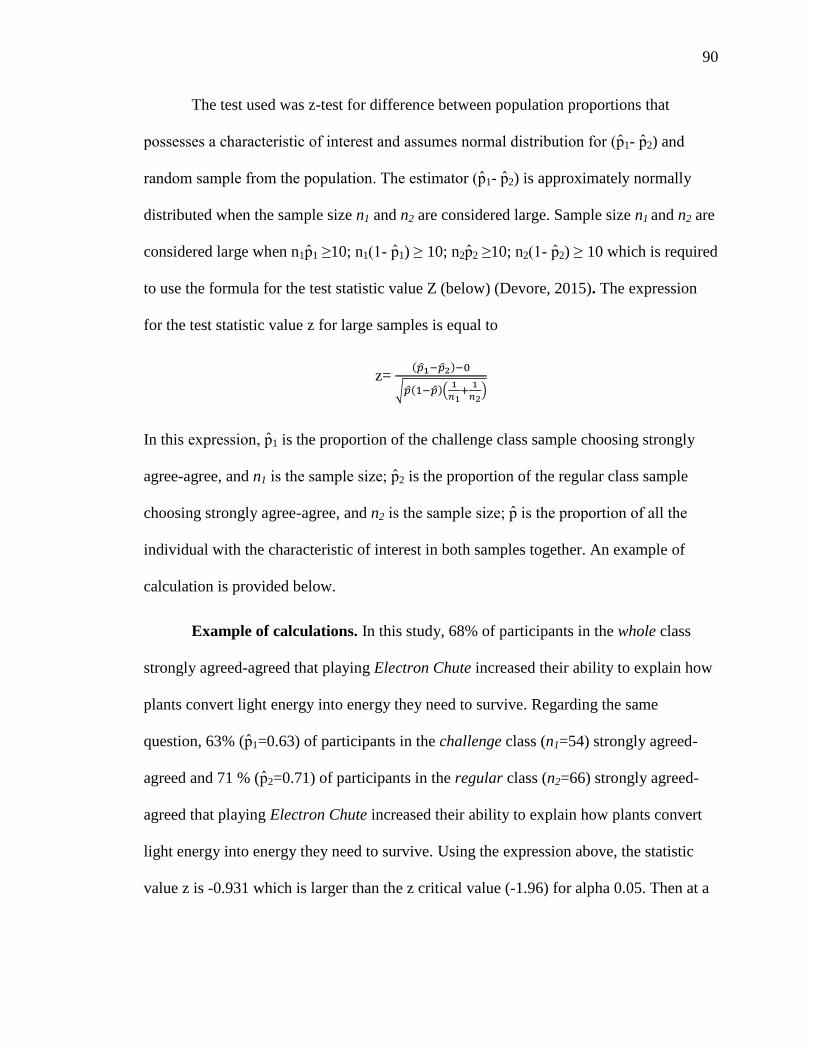
90
The test used was z-test for difference between population proportions that
possesses a characteristic of interest and assumes normal distribution for p 1- p 2) and
random sample from the population. The estimator p 1- p 2) is approximately normally
distributed when the sample size n1 and n2 are considered large. Sample size n1 and n2 are
considered large when n1p 1 ≥10; n1 1- p 1) ≥ 10; n2p 2 ≥10; n2 1- p 2) ≥ 10 which is required
to use the formula for the test statistic value Z (below) (Devore, 2015). The expression
for the test statistic value z for large samples is equal to
z=
In this expression, p 1 is the proportion of the challenge class sample choosing strongly
agree-agree, and n1 is the sample size p 2 is the proportion of the regular class sample
choosing strongly agree-agree, and n2 is the sample size p is the proportion of all the
individual with the characteristic of interest in both samples together. An example of
calculation is provided below.
Example of calculations. In this study, 68% of participants in the whole class
strongly agreed-agreed that playing Electron Chute increased their ability to explain how
plants convert light energy into energy they need to survive. Regarding the same
question, 63% (p 1=0.63) of participants in the challenge class (n1=54) strongly agreed-
agreed and 71 % (p 2=0.71) of participants in the regular class (n2=66) strongly agreed-
agreed that playing Electron Chute increased their ability to explain how plants convert
light energy into energy they need to survive. Using the expression above, the statistic
value z is -0.931 which is larger than the z critical value (-1.96) for alpha 0.05. Then at a
91
significant level of α 0.05, the test fails to reject Ho. This difference observed between
the challenge (63%) and regular (71%) classes was not statistically significant.
3.6.3.4 Effect of Treatment between Academic Readiness on Students'
Reactions to the Video and Game and Interest in Science
The goal of this analysis was to identify how the treatments between the academic
readiness influence students' opinions about learning science using the ETC video and the
Electron Chute game as learning activities. A Chi-Square Test was performed to
determine the effect of treatments between challenge and regular classes on students'
reactions. The Chi-Square Test evaluates if the proportion of one variable (treatment) is
independent of the other variable (class). The hypothesis test was carried out using a
significance level α of 0.05. The Chi-Square Test is statistically significant when p
value is smaller than 0.05 (p < 0.05). Therefore, Ho is rejected if p < 0.05 (Devore,
2015). For each one of the statements of the exit survey, the following hypothesis was
tested:
Null hypothesis: Ho: μ students' affirmative responses with interaction =μ
students' affirmative responses without interaction (the interaction between treatment and
class is not significant for students' affirmative responses to the statements)
Alternative hypothesis: Ha: μ students' affirmative responses with interaction ≠ μ
students' affirmative responses without interaction (the interaction between treatment and
class is significant for students' affirmative responses to the statements).
92
3.6.4 Qualitative Analysis for the Open-Ended Questions of the Survey
The coding process of the open-ended survey responses was done using the First
Cycle coding recommended by Saldaña (2009). From the First Cycle coding method
(Saldaña, 2009), structural coding was used to organize the data collection of the exit
survey. Structural coding was selected because it “acts as a labeling and indexing device,
allowing researchers to quickly access data likely to be relevant to a particular analysis
from a larger data set" (Saldaña, 2009, p. 67). The structural codes for the three open-
ended questions target the specific components and objectives of the intervention
including: (a) changes about the video; (b) changes about the ETC game; (c) what they
liked about the ETC game. The coding was done by a single coder who read through the
responses multiple times looking for common responses, then responses were coded with
a common descriptive label. Then frequency of responses was marked for each class of
students. Chapter 4 (Table 30 and Table 31) summarized the common responses and
frequency of occurrence in the whole class and between challenge and regular classes.
93
3.6.5 Class Recording Analysis
Participants of the experimental (video+game) treatment were recorded while
playing Electron Chute. Students in each class period were distributed into six to seven
stations of three to four students. Three randomly selected station per class were recorded
using an audio camera to describe the students' conversations while playing the game and
their individual interactions with the game. A total of nine videos of 20 minutes long
were recorded. The method used to analyze the class recording was Content Analysis.
Content Analysis is a method to identify meaningful patterns using codes that help
researchers calculate the patterns proportion in the data (Krippendorf, 2014). The
researcher defined three categories based on the learning outcomes and the how people
learn (Bransford et al., 2000) and the epistemic game (Collins & Ferguson, 1993)
frameworks used to answer the research question. The categories were: (1) game play
within a community of their peers, (2) individual game actions; (3) individual strategies.
The author used structural coding to organize data into the categories (Saldaña, 2009).
The coding was done by the researcher who watched each one of the nine videos three
times looking for common responses. Each code represented an action. The categories
and codes identified by the researcher are presented in Table 7.
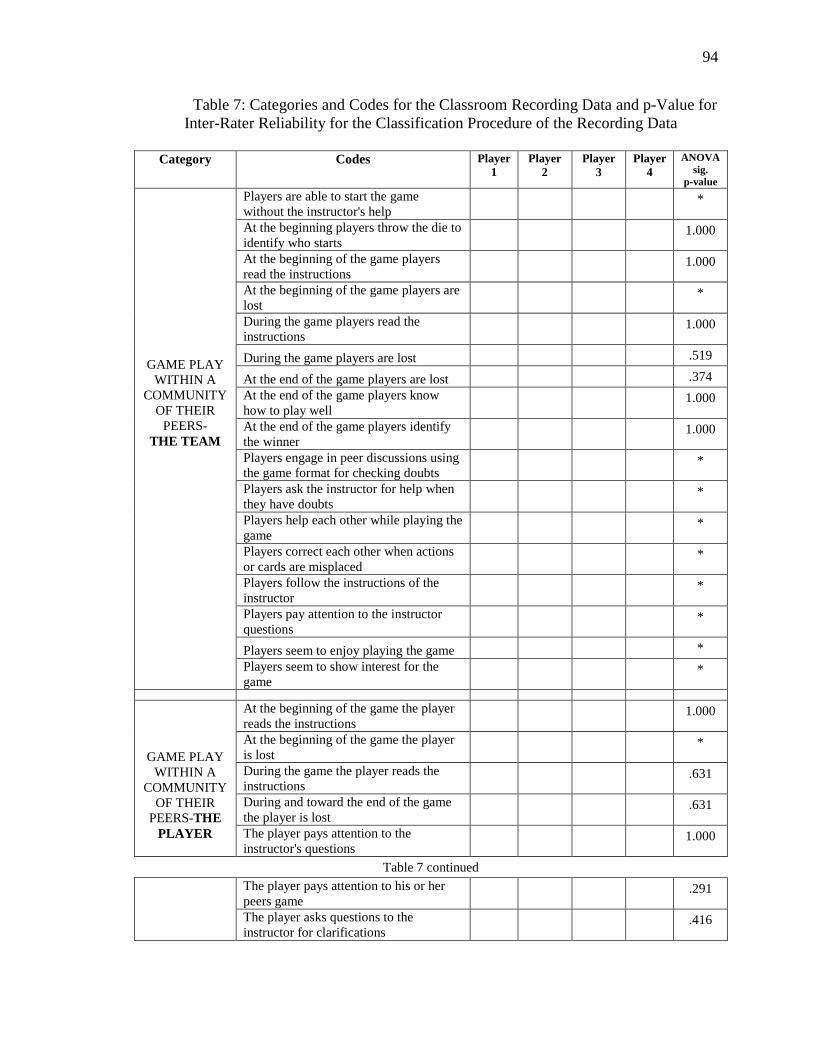
94
Table 7: Categories and Codes for the Classroom Recording Data and p-Value for
Inter-Rater Reliability for the Classification Procedure of the Recording Data
Category Codes Player
1
Player
2
Player
3
Player
4
ANOVA
sig.
p-value
GAME PLAY
WITHIN A
COMMUNITY
OF THEIR
PEERS-
THE TEAM
Players are able to start the game
without the instructor's help *
At the beginning players throw the die to
identify who starts 1.000
At the beginning of the game players
read the instructions 1.000
At the beginning of the game players are
lost *
During the game players read the
instructions 1.000
During the game players are lost .519
At the end of the game players are lost .374
At the end of the game players know
how to play well 1.000
At the end of the game players identify
the winner 1.000
Players engage in peer discussions using
the game format for checking doubts *
Players ask the instructor for help when
they have doubts *
Players help each other while playing the
game *
Players correct each other when actions
or cards are misplaced *
Players follow the instructions of the
instructor *
Players pay attention to the instructor
questions *
Players seem to enjoy playing the game *
Players seem to show interest for the
game *
GAME PLAY
WITHIN A
COMMUNITY
OF THEIR
PEERS-THE
PLAYER
At the beginning of the game the player
reads the instructions 1.000
At the beginning of the game the player
is lost *
During the game the player reads the
instructions .631
During and toward the end of the game
the player is lost .631
The player pays attention to the
instructor's questions 1.000
Table 7 continued
The player pays attention to his or her
peers game .291
The player asks questions to the
instructor for clarifications .416
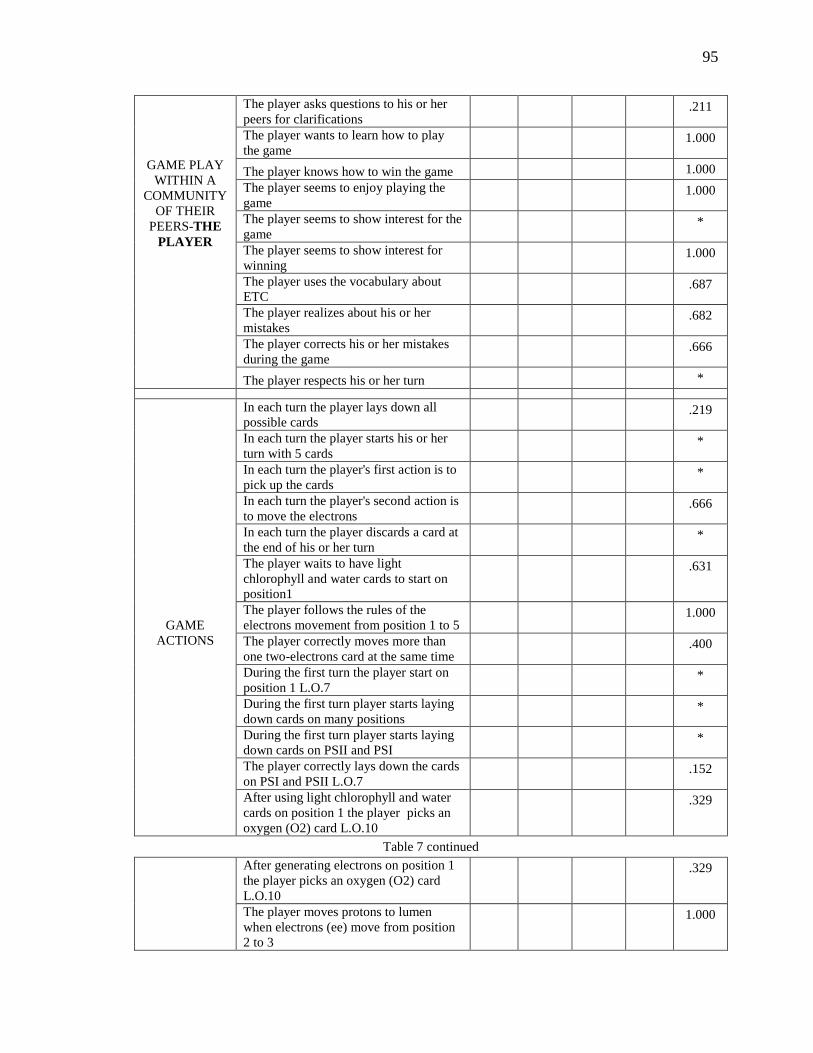
95
GAME PLAY
WITHIN A
COMMUNITY
OF THEIR
PEERS-THE
PLAYER
The player asks questions to his or her
peers for clarifications .211
The player wants to learn how to play
the game 1.000
The player knows how to win the game 1.000
The player seems to enjoy playing the
game 1.000
The player seems to show interest for the
game *
The player seems to show interest for
winning 1.000
The player uses the vocabulary about
ETC .687
The player realizes about his or her
mistakes .682
The player corrects his or her mistakes
during the game .666
The player respects his or her turn *
GAME
ACTIONS
In each turn the player lays down all
possible cards .219
In each turn the player starts his or her
turn with 5 cards *
In each turn the player's first action is to
pick up the cards *
In each turn the player's second action is
to move the electrons .666
In each turn the player discards a card at
the end of his or her turn *
The player waits to have light
chlorophyll and water cards to start on
position1
.631
The player follows the rules of the
electrons movement from position 1 to 5 1.000
The player correctly moves more than
one two-electrons card at the same time .400
During the first turn the player start on
position 1 L.O.7 *
During the first turn player starts laying
down cards on many positions *
During the first turn player starts laying
down cards on PSII and PSI *
The player correctly lays down the cards
on PSI and PSII L.O.7 .152
After using light chlorophyll and water
cards on position 1 the player picks an
oxygen (O2) card L.O.10
.329
Table 7 continued
After generating electrons on position 1
the player picks an oxygen (O2) card
L.O.10
.329
The player moves protons to lumen
when electrons (ee) move from position
2 to 3
1.000
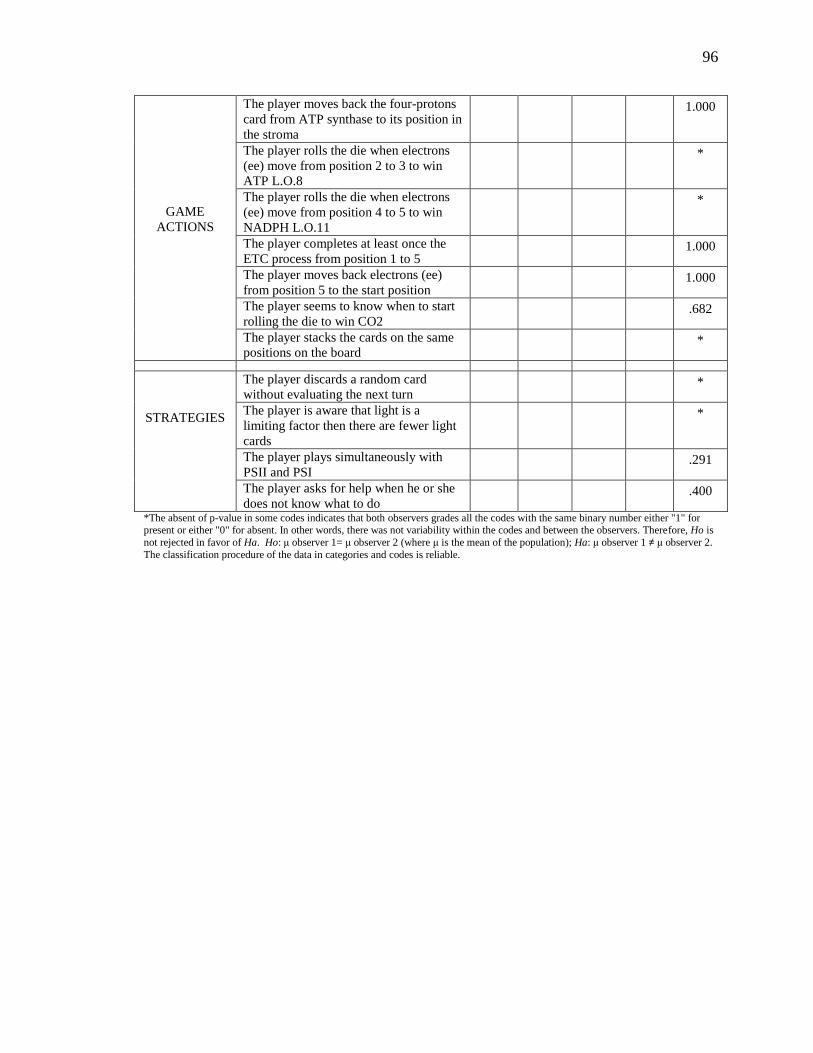
96
GAME
ACTIONS
The player moves back the four-protons
card from ATP synthase to its position in
the stroma
1.000
The player rolls the die when electrons
(ee) move from position 2 to 3 to win
ATP L.O.8
*
The player rolls the die when electrons
(ee) move from position 4 to 5 to win
NADPH L.O.11
*
The player completes at least once the
ETC process from position 1 to 5 1.000
The player moves back electrons (ee)
from position 5 to the start position 1.000
The player seems to know when to start
rolling the die to win CO2 .682
The player stacks the cards on the same
positions on the board *
STRATEGIES
The player discards a random card
without evaluating the next turn *
The player is aware that light is a
limiting factor then there are fewer light
cards
*
The player plays simultaneously with
PSII and PSI .291
The player asks for help when he or she
does not know what to do .400
*The absent of p-value in some codes indicates that both observers grades all the codes with the same binary number either "1" for present or either "0" for absent. In other words, there was not variability within the codes and between the observers. Therefore, Ho is
not rejected in favor of Ha. Ho: μ observer 1= μ observer 2 (where μ is the mean of the population); Ha: μ observer 1 ≠ μ observer 2.
The classification procedure of the data in categories and codes is reliable.
97
3.6.5.1 Reliability of the Classification Procedure
The reliability of the classification procedure of the data was measured through a
test of inter-rater reliability between two independent coders or observers (Krippendorf,
2014, p. 220). Inter-rater reliability measures the level of agreement between the two
observers. Per each one of the three period class of the video+game treatment-periods 3,
5 and 6- one video recording was randomly chosen. Each one of the observers rated the
same video per each one of the categories created by the researcher.
The observations were done first for the team of players as a group and then for
each one of the three to four players who were playing in each team. The observer
marked "1" when the code was present and "0" for absent. The observers were the
researcher and a scientist who earned a degree in biological sciences and was ranked in
the World Chess Federation. Both watched the same video three times. The scientist was
trained by the researcher in how to play the Electron Chute game. Both played the game
several times before scoring the recording. Similar to the essay rubric, the statistical
method performed to calculate the variation in rating was the analysis of variance
(ANOVA) (Devore, 2015). The hypothesis is presented below.
Hypothesis: Inter-rater reliability test
Null hypothesis: Ho: μ observer 1= μ observer 2 (where μ is the mean of the
population)
Alternative hypothesis: Ha: μ observer 1 ≠ μ observer 2.
98
ANOVA calculates a p-value which is the probability of the null (Ho) hypothesis
being not correct. As it was mentioned previously, the p-value is known as significance
(sig.) and is presented in Table 7. Ho is rejected when p< α. In this study, α was defined
as 0.05.
According to the p-value (sig.) shown in Table 7 there was not significant
evidence to reject Ho. The p- value was much higher than 0.05 which means that the
classification procedure of the data is robust and reliable. Calculations are presented in
Appendix H.
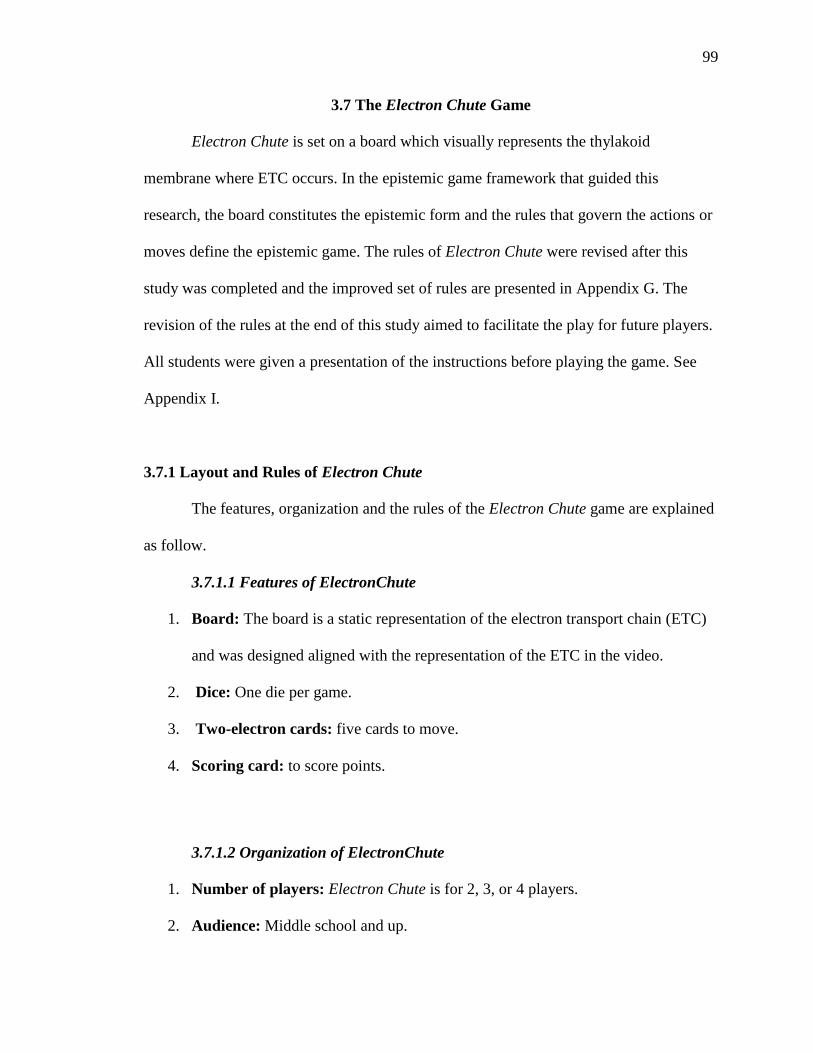
99
3.7 The Electron Chute Game
Electron Chute is set on a board which visually represents the thylakoid
membrane where ETC occurs. In the epistemic game framework that guided this
research, the board constitutes the epistemic form and the rules that govern the actions or
moves define the epistemic game. The rules of Electron Chute were revised after this
study was completed and the improved set of rules are presented in Appendix G. The
revision of the rules at the end of this study aimed to facilitate the play for future players.
All students were given a presentation of the instructions before playing the game. See
Appendix I.
3.7.1 Layout and Rules of Electron Chute
The features, organization and the rules of the Electron Chute game are explained
as follow.
3.7.1.1 Features of ElectronChute
1. Board: The board is a static representation of the electron transport chain (ETC)
and was designed aligned with the representation of the ETC in the video.
2. Dice: One die per game.
3. Two-electron cards: five cards to move.
4. Scoring card: to score points.
3.7.1.2 Organization of ElectronChute
1. Number of players: Electron Chute is for 2, 3, or 4 players.
2. Audience: Middle school and up.
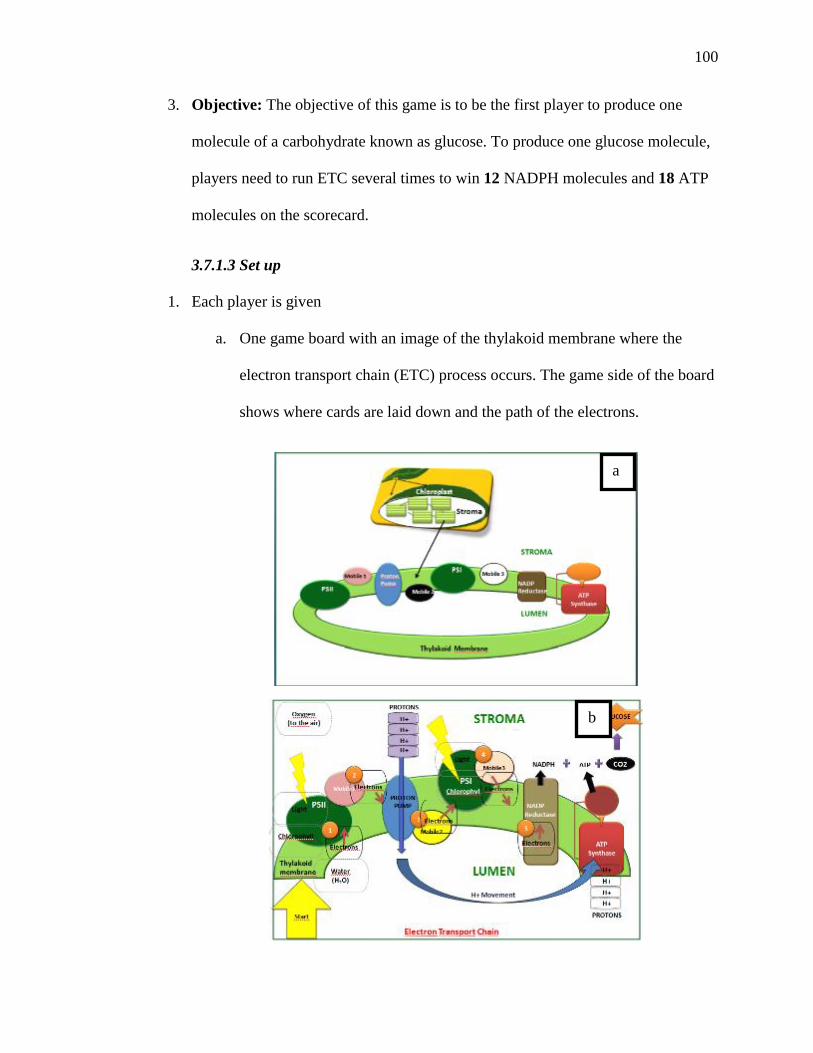
100
3. Objective: The objective of this game is to be the first player to produce one
molecule of a carbohydrate known as glucose. To produce one glucose molecule,
players need to run ETC several times to win 12 NADPH molecules and 18 ATP
molecules on the scorecard.
3.7.1.3 Set up
1. Each player is given
a. One game board with an image of the thylakoid membrane where the
electron transport chain (ETC) process occurs. The game side of the board
shows where cards are laid down and the path of the electrons.
a
b
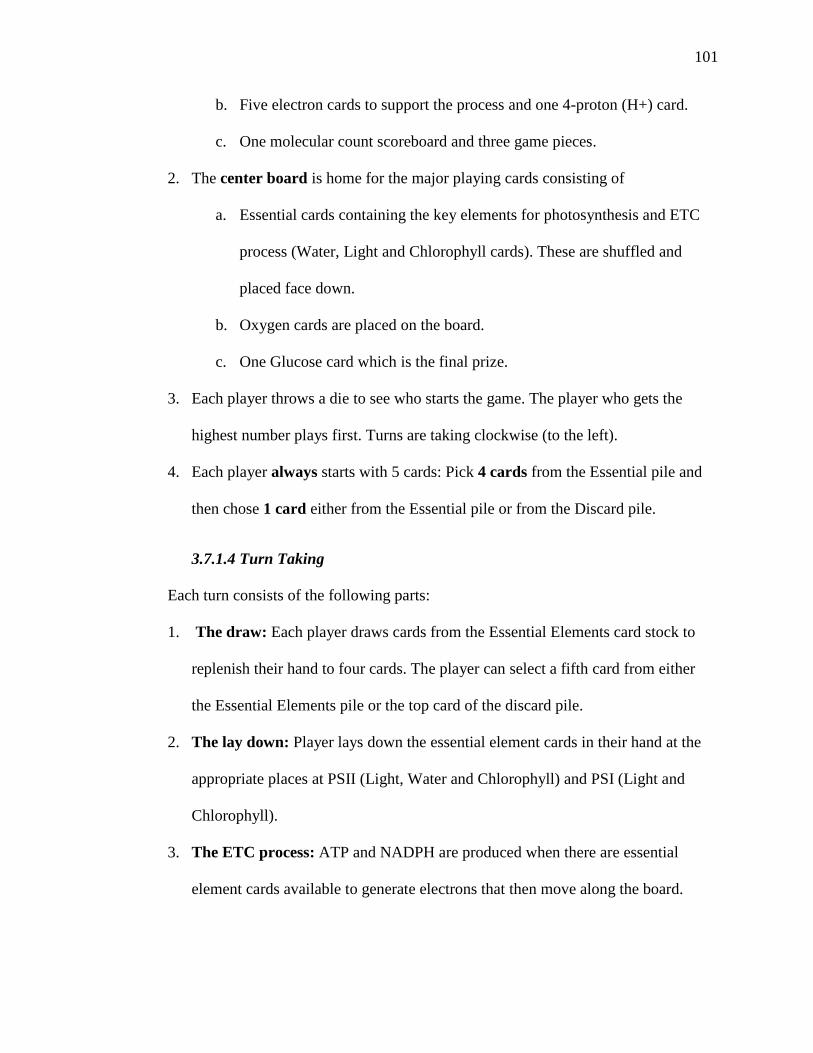
101
b. Five electron cards to support the process and one 4-proton (H+) card.
c. One molecular count scoreboard and three game pieces.
2. The center board is home for the major playing cards consisting of
a. Essential cards containing the key elements for photosynthesis and ETC
process (Water, Light and Chlorophyll cards). These are shuffled and
placed face down.
b. Oxygen cards are placed on the board.
c. One Glucose card which is the final prize.
3. Each player throws a die to see who starts the game. The player who gets the
highest number plays first. Turns are taking clockwise (to the left).
4. Each player always starts with 5 cards: Pick 4 cards from the Essential pile and
then chose 1 card either from the Essential pile or from the Discard pile.
3.7.1.4 Turn Taking
Each turn consists of the following parts:
1. The draw: Each player draws cards from the Essential Elements card stock to
replenish their hand to four cards. The player can select a fifth card from either
the Essential Elements pile or the top card of the discard pile.
2. The lay down: Player lays down the essential element cards in their hand at the
appropriate places at PSII (Light, Water and Chlorophyll) and PSI (Light and
Chlorophyll).
3. The ETC process: ATP and NADPH are produced when there are essential
element cards available to generate electrons that then move along the board.
102
a. When Light, Water and Chlorophyll cards are present, then the player
wins two electrons and one oxygen. Place an two-electron card at the
position 1 in PSII and the Light, Water and Chlorophyll cards are removed
and put to the side to be recycled to the Essential Element card stack.
b. Set the oxygen card in its place on the board.
c. At the start of every turn a player can move the two-electron card they
have on the board following these simple rules
a) 2-electrons card moves from PSII to Mobile 1.
b) 2-electrons card moves from Mobile 1 to Mobile 2. This
movement pumps the 4-proton (H+) card to move to the ATP
synthesis state– the player rolls the die and adds that many ATP
molecules on their scorecard.
c) If the player has Light and Chlorophyll cards on PSI, then moves
the 2-electrons card at Mobile 2 to Mobile 3.
d) 2-electrons card moves from Mobile 3 to NADP Reductase. The
player rolls the die and adds that many NADPH molecules to their
score card.
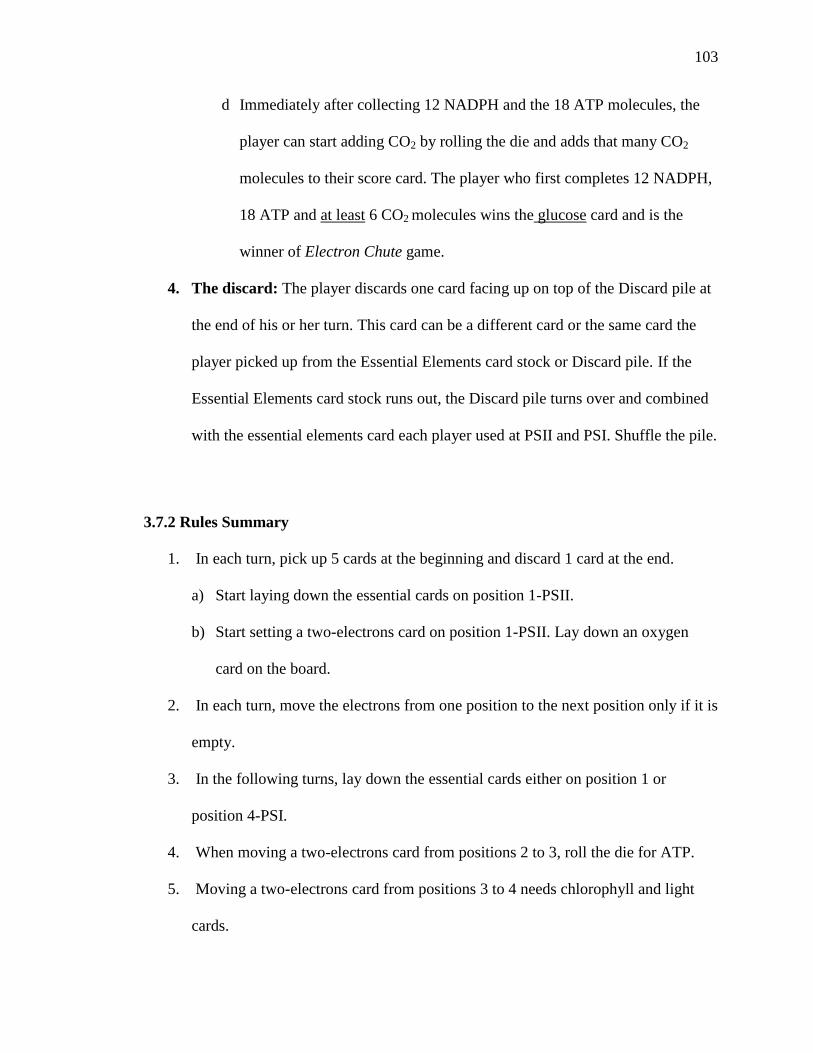
103
d Immediately after collecting 12 NADPH and the 18 ATP molecules, the
player can start adding CO2 by rolling the die and adds that many CO2
molecules to their score card. The player who first completes 12 NADPH,
18 ATP and at least 6 CO2 molecules wins the glucose card and is the
winner of Electron Chute game.
4. The discard: The player discards one card facing up on top of the Discard pile at
the end of his or her turn. This card can be a different card or the same card the
player picked up from the Essential Elements card stock or Discard pile. If the
Essential Elements card stock runs out, the Discard pile turns over and combined
with the essential elements card each player used at PSII and PSI. Shuffle the pile.
3.7.2 Rules Summary
1. In each turn, pick up 5 cards at the beginning and discard 1 card at the end.
a) Start laying down the essential cards on position 1-PSII.
b) Start setting a two-electrons card on position 1-PSII. Lay down an oxygen
card on the board.
2. In each turn, move the electrons from one position to the next position only if it is
empty.
3. In the following turns, lay down the essential cards either on position 1 or
position 4-PSI.
4. When moving a two-electrons card from positions 2 to 3, roll the die for ATP.
5. Moving a two-electrons card from positions 3 to 4 needs chlorophyll and light
cards.
104
6. When moving a two-electrons card from positions 4 to 5, roll the die for
NADPH.
7. In the turn after scoring 18 ATP and 12 NADPH, roll the die for CO2 once per
turn.
8. The player who scores at least 6CO2 gets the Glucose and win the game.
3.8 Summary
Chapter 3 presented the mixed-methods used by the researcher to collect and
analyze the data for this work. In this research, the author examined to what extent the
ETC video and Electron Chute helped students to achieve the learning outcomes of the
electron transport chain (ETC) process. The quantitative method consisted of the
development and analysis of a knowledge test instrument. This instrument was developed
by the researcher based on the learning outcomes stated by the Standards and
misconceptions students hold regarding the energy transformation process in
photosynthesis known as ETC. The data was collected using a pretest-posttest design.
The qualitative method consisted of a quantitative and qualitative analysis of a survey.
The analysis of the survey provided information about how well students' experiences
watching the ETC video and the playing the Electron Chute game related to the intended
learning outcomes of the video and the game. Results of this study are presented in
Chapter 4.
105
CHAPTER 4. RESULTS
Chapter 4 results of the analysis described in chapter 3 to provides evidence to
answer the research question of this study. Results were organized in three sections (1)
Knowledge Test; (2) Class Recording; (3) Exit Survey.
Sections 4.3 showed the results of the analysis of the Knowledge Test. Subsection
4.3.1 described the results from the multiple-choice section of the test and subsection
4.3.2 presented the results from the essay. Both sections gave the researcher different
information about students' learning experiences of the video only treatment and the
video+game treatment. The multiple-choice section measured students' ability to recall
vocabulary and identify the various steps of the ETC process. The essay section provided
insightful information regarding students' ability to interpret an ETC representation.
Section 4.4 presented the results from the classroom video and audio recording of
students playing the Electron Chute game. Students were divided into teams of three or
four players. The recording captured the behavior of the teams and of each player while
playing. Also, the recording collected valuable information about the students' game
actions, moves, and investigated the strategies done by them in the game. The analysis of
the recording allowed the researcher to identify the challenge students had in following
the instructions, rules, and the model of the ETC process presented to them. The analysis
of the students' moves helped the researcher to understand what the player was thinking
when the action was done and to use that insights for improvement of the learning
experiences.
106
Section 4.5 described the results of a questionnaire survey administrated to the
students after their learning experiences, watching the video and playing the game. The
survey gathered information about students' experiences with the video and game, their
comprehension of the rules, and their interest in learning about photosynthesis and
content related area. The feedback obtained by the survey was collected and analyzed by
the researcher for making changes for the better learning experiences of future learners.
4.1 Purpose of the Study
The purpose of this study is to support students' learning of the energy
transformation process in photosynthesis and help them to clarify misconceptions about
this process. Specifically, the instructional approach developed in this work aims to
contribute to students' understanding of the transformation of sunlight, electromagnetic
energy, into high energy compounds, ATP and NADPH, inside a plant cell structure.
n this study, the researcher argues that a video and a game’s visual representation
of the ETC process would help students to gain knowledge of the transformation of
sunlight energy into ATP and NADPH. This transformation involves the activation of a
flow of electrons through a biological membrane, the thylakoid membrane, subunit of the
chloroplast. Students could use that knowledge to explain how the ETC process works,
look for similarities with other processes inside the cell and infer how energy
transformation occurs in other organisms.
Laterally, this study explores evidences that the video and game learning
experiences have a positive impact on students from different academic readiness.
through a questionnaire survey, this research collects students' feedback about learning
107
ETC using a video and game with the intention of improving these learning experiences
for future learners.
4.2 Research Question
To investigate this conjecture, a research question was defined to frame this
study:
What are the specific learning outcomes achieved by middle school students after
learning about the energy transformation process in photosynthesis, process
known as electron transport chain (ETC), through video and serious game
learning experiences?
4.3 Knowledge Test Results
The instrument was designed to measure the learning outcomes of the
instructional intervention presented in Chapter 2. The knowledge test was divided in two
section (1) multiple-choice; (2) essay. In both sections of the test, the information was
organized in a way that facilitated the interpretation of the data to answer the research
question. The same organization was followed in the method section. This organization
allows the reader to check the procedures associated with the results. The presentation of
results from the instrument-multiple-choice and essay was divided in four parts (1)
differences in learning outcome achievement between the treatments; (2) effect of
treatments score gain; (3) effect of academic readiness on score gain; (4) effect of
treatment between academic readiness on score gain.
108
The items of the knowledge test were revised by calculating the difficulty (p) and
discrimination (D) items. The difficulty index indicates the difficulty of an item by
providing the proportion of students who responded the item correctly. The
discrimination index measures the extent to what an item distinguishes between students
who obtained the highest score in each test from those who obtained the lowest score.
The logic behind calculating D is that students who answered the item correctly also
responded well on the test and vice versa. Therefore, a positive discrimination index
indicates that an item is measuring what the rest of the test is measuring (Popham, 2013).
A value of D below 0.0 suggests that the key is not functioning well because the high
performing students are not selecting that foil. In that case, the item needs to be revised.
The discrimination and difficult indexes of an item are correlated. If the p-value is of an
item is very low (p ≤ 0.20; very difficult item) or very high (p > 0.80; very easy item), the
value of D will probably be low. The rationale is if the item is too difficult, it might be
difficult even for those students who performed well on the test. Likewise, if the item is
too easy, it might be easy also for those students who performed poorly on the test.
Therefore, an average p-value (p= 0.41-0.60) is desired to provide discrimination
between students who score higher from those who performed lower (Popham, 2013).
The calculation of the difficult and discrimination indexes is presented in the next
section. The multiple-choice results are presented below.
109
4.3.1 Multiple-Choice Section
The questions in the multiple-choice section aimed to determine if students could
achieve the learning outcomes described in Table 1 by either watching the ETC video
only or by playing Electron Chute after watching the video. These learning outcomes
were developed based on the students' misconceptions of photosynthesis presented in the
literature review. The learning outcomes addressed the misconceptions students hold
about the energy transformation process in photosynthesis known as ETC. The difference
in percentage of correct answers after the treatments was determined through a
comparison of two population proportions. A Z-test was used to evaluate if the difference
between the percentage of correct answers in the pretest and the posttest for both
treatments was statistically significant. Also, a comparison of score gain between the
treatments was performed. The effect of treatments between the regular and challenge
class was reported. Calculations were done executing a univariate analysis of variance
(ANOVA) (Devore, 2015).
4.3.1.1 Analysis of the Items of the Instrument-Difficult and Discrimination
Indexes
Whole Class. The scores distribution for both the instrument and the multiple-
choice section in the pretest and posttest are shown in Figure 10. Overall, the scores
distribution for the multiple-choice section showed that students in the whole class
reached higher scores in the posttest (Figure 10d; mean= 5.41; std=2.21; N=115) in
comparison to the pretest (Figure 10c; mean=4.83; std=1.84; N=115). Also, in the
posttest more students reached higher scores.
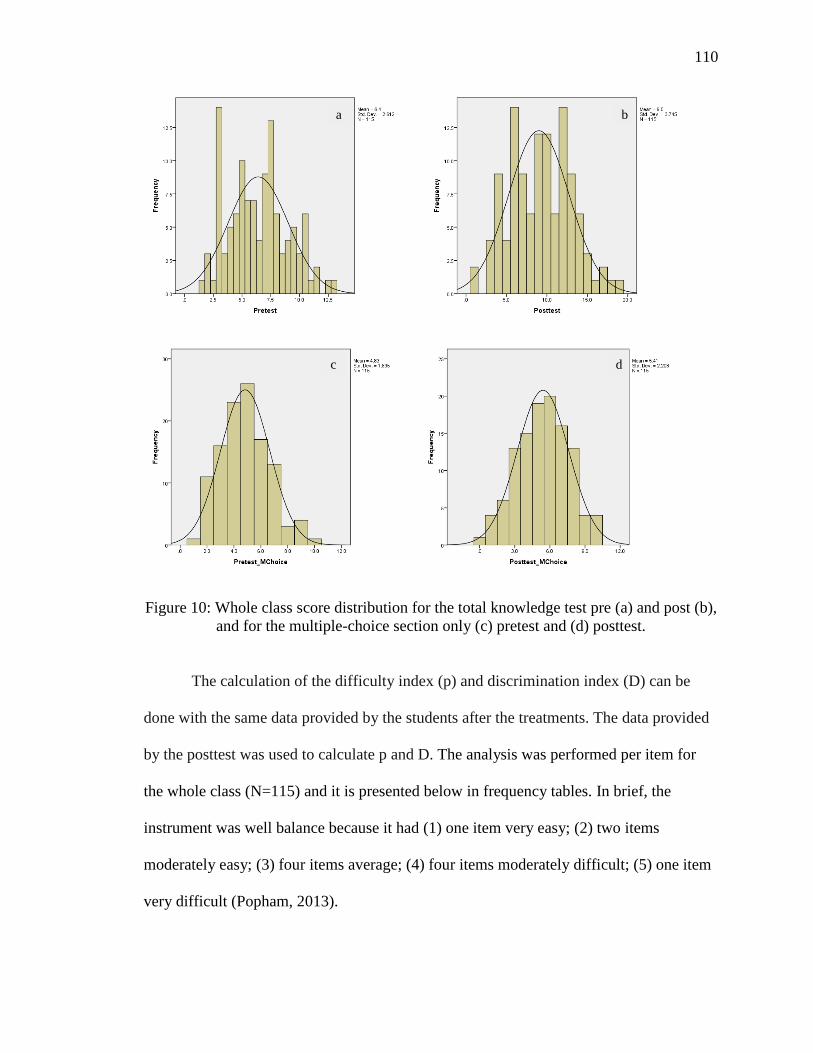
110
Figure 10: Whole class score distribution for the total knowledge test pre (a) and post (b),
and for the multiple-choice section only (c) pretest and (d) posttest.
The calculation of the difficulty index (p) and discrimination index (D) can be
done with the same data provided by the students after the treatments. The data provided
by the posttest was used to calculate p and D. The analysis was performed per item for
the whole class (N=115) and it is presented below in frequency tables. In brief, the
instrument was well balance because it had (1) one item very easy; (2) two items
moderately easy; (3) four items average; (4) four items moderately difficult; (5) one item
very difficult (Popham, 2013).
a b
c d
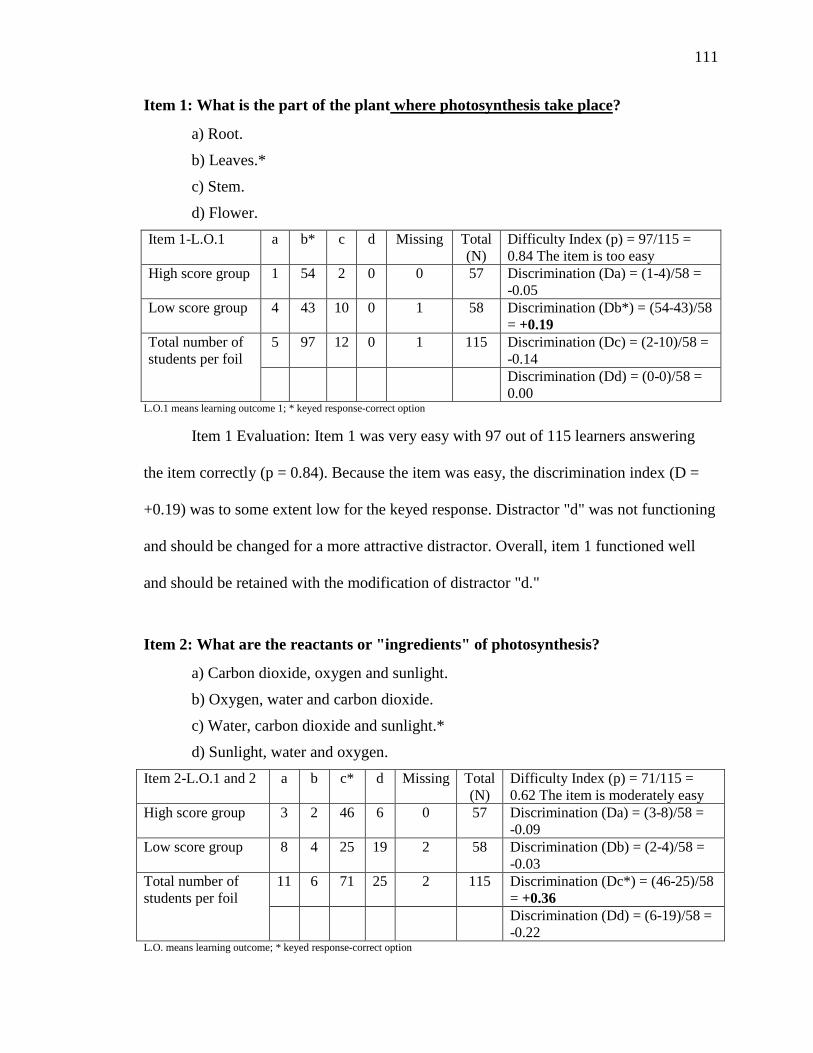
111
Item 1: What is the part of the plant where photosynthesis take place?
a) Root.
b) Leaves.*
c) Stem.
d) Flower.
Item 1-L.O.1 a b* c d Missing Total
(N)
Difficulty Index (p) = 97/115 =
0.84 The item is too easy
High score group 1 54 2 0 0 57 Discrimination (Da) = (1-4)/58 =
-0.05
Low score group 4 43 10 0 1 58 Discrimination (Db*) = (54-43)/58
= +0.19
Total number of
students per foil
5 97 12 0 1 115 Discrimination (Dc) = (2-10)/58 =
-0.14
Discrimination (Dd) = (0-0)/58 =
0.00 L.O.1 means learning outcome 1; * keyed response-correct option
Item 1 Evaluation: Item 1 was very easy with 97 out of 115 learners answering
the item correctly (p = 0.84). Because the item was easy, the discrimination index (D =
+0.19) was to some extent low for the keyed response. Distractor "d" was not functioning
and should be changed for a more attractive distractor. Overall, item 1 functioned well
and should be retained with the modification of distractor "d."
Item 2: What are the reactants or "ingredients" of photosynthesis?
a) Carbon dioxide, oxygen and sunlight.
b) Oxygen, water and carbon dioxide.
c) Water, carbon dioxide and sunlight.*
d) Sunlight, water and oxygen.
Item 2-L.O.1 and 2 a b c* d Missing Total
(N)
Difficulty Index (p) = 71/115 =
0.62 The item is moderately easy
High score group 3 2 46 6 0 57 Discrimination (Da) = (3-8)/58 =
-0.09
Low score group 8 4 25 19 2 58 Discrimination (Db) = (2-4)/58 =
-0.03
Total number of
students per foil
11 6 71 25 2 115 Discrimination (Dc*) = (46-25)/58
= +0.36
Discrimination (Dd) = (6-19)/58 =
-0.22 L.O. means learning outcome; * keyed response-correct option
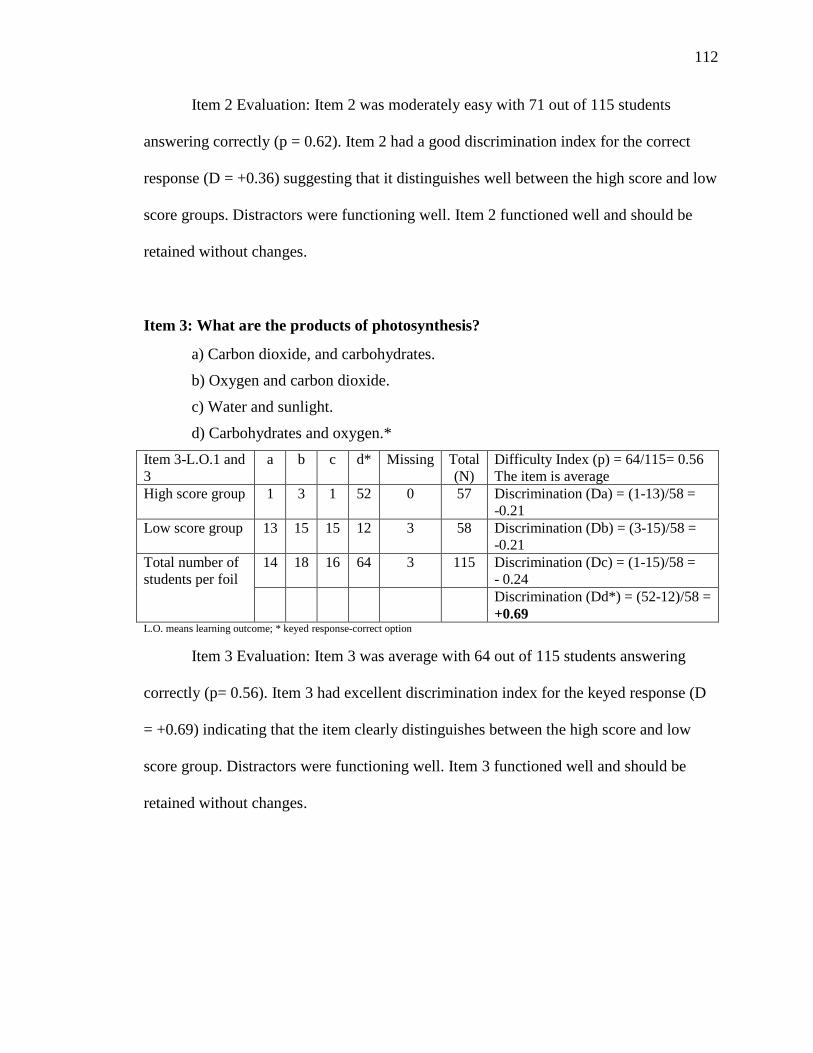
112
Item 2 Evaluation: Item 2 was moderately easy with 71 out of 115 students
answering correctly (p = 0.62). Item 2 had a good discrimination index for the correct
response (D = +0.36) suggesting that it distinguishes well between the high score and low
score groups. Distractors were functioning well. Item 2 functioned well and should be
retained without changes.
Item 3: What are the products of photosynthesis?
a) Carbon dioxide, and carbohydrates.
b) Oxygen and carbon dioxide.
c) Water and sunlight.
d) Carbohydrates and oxygen.*
Item 3-L.O.1 and
3
a b c d* Missing
Total
(N)
Difficulty Index (p) = 64/115= 0.56
The item is average
High score group 1 3 1 52 0 57 Discrimination (Da) = (1-13)/58 =
-0.21
Low score group 13 15 15 12 3 58 Discrimination (Db) = (3-15)/58 =
-0.21
Total number of
students per foil
14 18 16 64 3 115 Discrimination (Dc) = (1-15)/58 =
- 0.24
Discrimination (Dd*) = (52-12)/58 =
+0.69 L.O. means learning outcome; * keyed response-correct option
Item 3 Evaluation: Item 3 was average with 64 out of 115 students answering
correctly (p= 0.56). Item 3 had excellent discrimination index for the keyed response (D
= +0.69) indicating that the item clearly distinguishes between the high score and low
score group. Distractors were functioning well. Item 3 functioned well and should be
retained without changes.
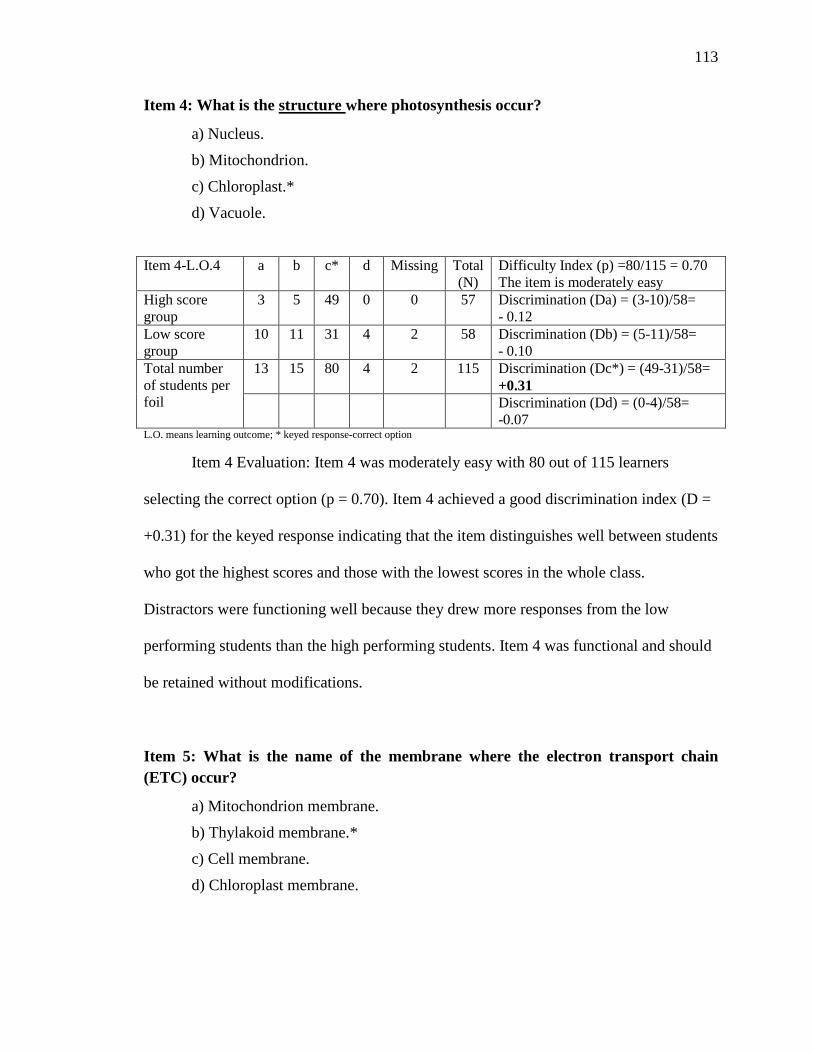
113
Item 4: What is the structure where photosynthesis occur?
a) Nucleus.
b) Mitochondrion.
c) Chloroplast.*
d) Vacuole.
Item 4-L.O.4 a b c* d Missing Total
(N)
Difficulty Index (p) =80/115 = 0.70
The item is moderately easy
High score
group
3 5 49 0 0 57 Discrimination (Da) = (3-10)/58=
- 0.12
Low score
group
10 11 31 4 2 58 Discrimination (Db) = (5-11)/58=
- 0.10
Total number
of students per
foil
13 15 80 4 2 115 Discrimination (Dc*) = (49-31)/58=
+0.31
Discrimination (Dd) = (0-4)/58=
-0.07 L.O. means learning outcome; * keyed response-correct option
Item 4 Evaluation: Item 4 was moderately easy with 80 out of 115 learners
selecting the correct option (p = 0.70). Item 4 achieved a good discrimination index (D =
+0.31) for the keyed response indicating that the item distinguishes well between students
who got the highest scores and those with the lowest scores in the whole class.
Distractors were functioning well because they drew more responses from the low
performing students than the high performing students. Item 4 was functional and should
be retained without modifications.
Item 5: What is the name of the membrane where the electron transport chain
(ETC) occur?
a) Mitochondrion membrane.
b) Thylakoid membrane.*
c) Cell membrane.
d) Chloroplast membrane.
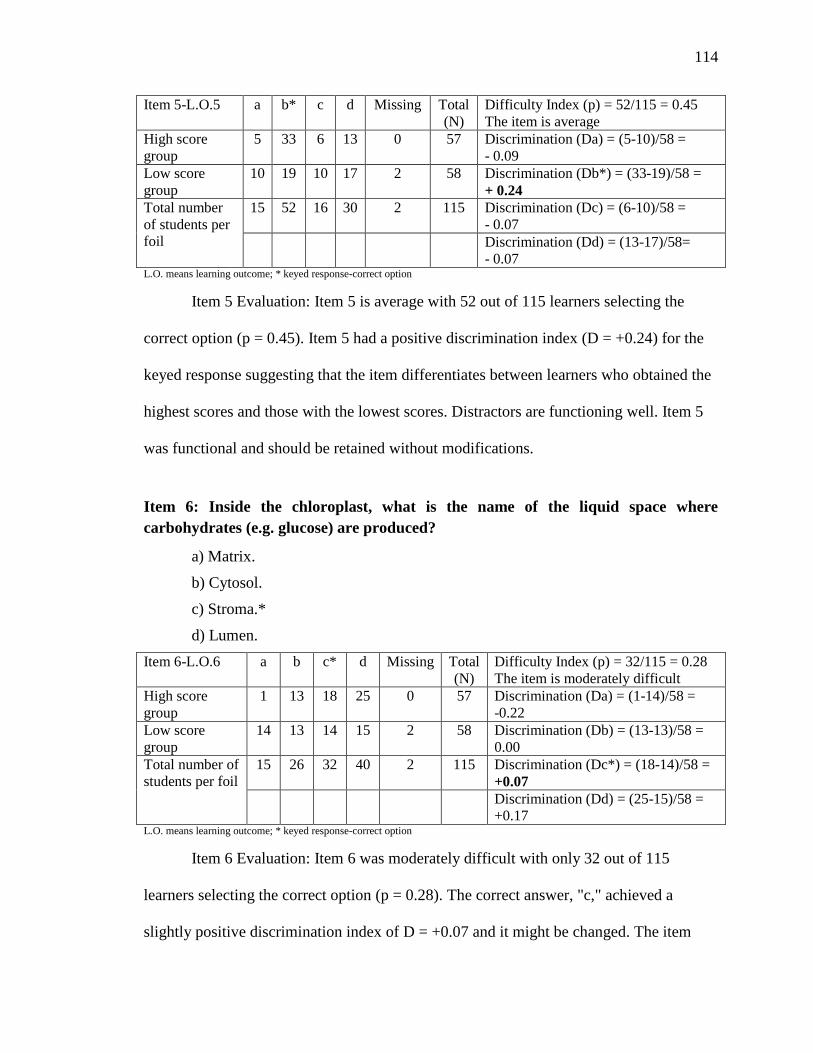
114
Item 5-L.O.5 a b* c d Missing Total
(N)
Difficulty Index (p) = 52/115 = 0.45
The item is average
High score
group
5 33 6 13 0 57 Discrimination (Da) = (5-10)/58 =
- 0.09
Low score
group
10 19 10 17 2 58 Discrimination (Db*) = (33-19)/58 =
+ 0.24
Total number
of students per
foil
15 52 16 30 2 115 Discrimination (Dc) = (6-10)/58 =
- 0.07
Discrimination (Dd) = (13-17)/58=
- 0.07 L.O. means learning outcome; * keyed response-correct option
Item 5 Evaluation: Item 5 is average with 52 out of 115 learners selecting the
correct option (p = 0.45). Item 5 had a positive discrimination index (D = +0.24) for the
keyed response suggesting that the item differentiates between learners who obtained the
highest scores and those with the lowest scores. Distractors are functioning well. Item 5
was functional and should be retained without modifications.
Item 6: Inside the chloroplast, what is the name of the liquid space where
carbohydrates (e.g. glucose) are produced?
a) Matrix.
b) Cytosol.
c) Stroma.*
d) Lumen.
Item 6-L.O.6 a b c* d Missing Total
(N)
Difficulty Index (p) = 32/115 = 0.28
The item is moderately difficult
High score
group
1 13 18 25 0 57 Discrimination (Da) = (1-14)/58 =
-0.22
Low score
group
14 13 14 15 2 58 Discrimination (Db) = (13-13)/58 =
0.00
Total number of
students per foil
15 26 32 40 2 115 Discrimination (Dc*) = (18-14)/58 =
+0.07
Discrimination (Dd) = (25-15)/58 =
+0.17 L.O. means learning outcome; * keyed response-correct option
Item 6 Evaluation: Item 6 was moderately difficult with only 32 out of 115
learners selecting the correct option (p = 0.28). The correct answer, "c," achieved a
slightly positive discrimination index of D = +0.07 and it might be changed. The item
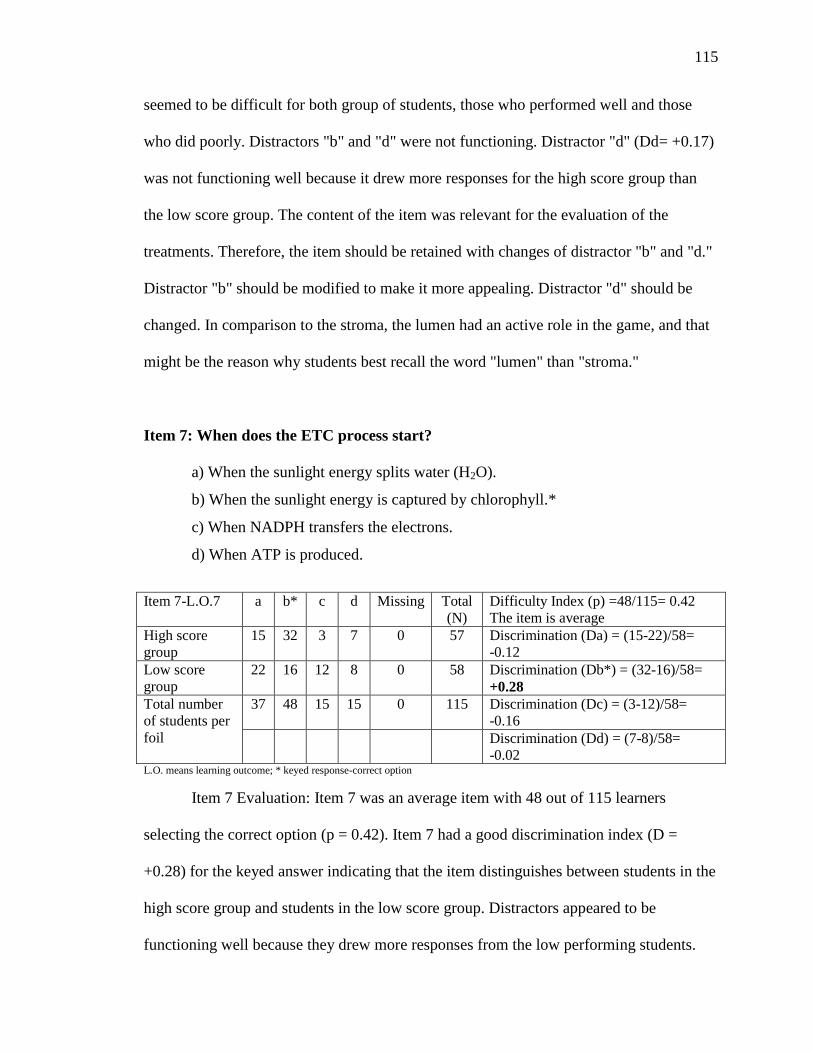
115
seemed to be difficult for both group of students, those who performed well and those
who did poorly. Distractors "b" and "d" were not functioning. Distractor "d" (Dd= +0.17)
was not functioning well because it drew more responses for the high score group than
the low score group. The content of the item was relevant for the evaluation of the
treatments. Therefore, the item should be retained with changes of distractor "b" and "d."
Distractor "b" should be modified to make it more appealing. Distractor "d" should be
changed. In comparison to the stroma, the lumen had an active role in the game, and that
might be the reason why students best recall the word "lumen" than "stroma."
Item 7: When does the ETC process start?
a) When the sunlight energy splits water (H2O).
b) When the sunlight energy is captured by chlorophyll.*
c) When NADPH transfers the electrons.
d) When ATP is produced.
Item 7-L.O.7 a b* c d Missing Total
(N)
Difficulty Index (p) =48/115= 0.42
The item is average
High score
group
15 32 3 7 0 57 Discrimination (Da) = (15-22)/58=
-0.12
Low score
group
22 16 12 8 0 58 Discrimination (Db*) = (32-16)/58=
+0.28
Total number
of students per
foil
37 48 15 15 0 115 Discrimination (Dc) = (3-12)/58=
-0.16
Discrimination (Dd) = (7-8)/58=
-0.02 L.O. means learning outcome; * keyed response-correct option
Item 7 Evaluation: Item 7 was an average item with 48 out of 115 learners
selecting the correct option (p = 0.42). Item 7 had a good discrimination index (D =
+0.28) for the keyed answer indicating that the item distinguishes between students in the
high score group and students in the low score group. Distractors appeared to be
functioning well because they drew more responses from the low performing students.
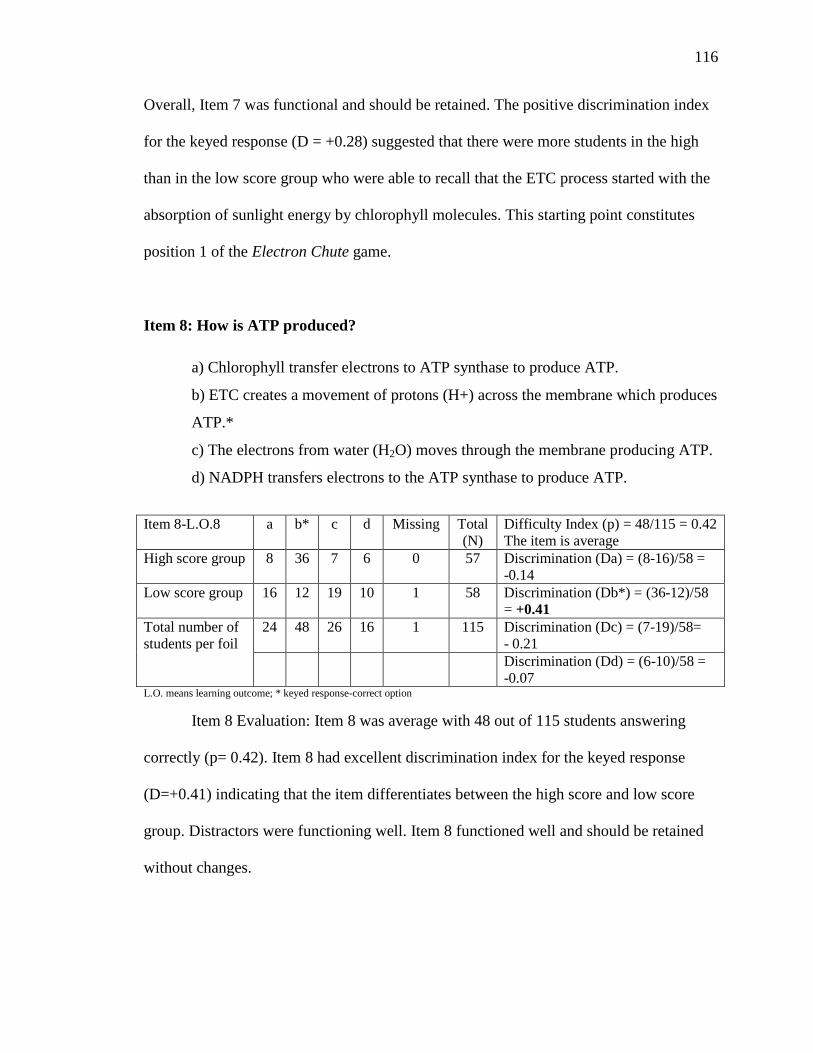
116
Overall, Item 7 was functional and should be retained. The positive discrimination index
for the keyed response (D = +0.28) suggested that there were more students in the high
than in the low score group who were able to recall that the ETC process started with the
absorption of sunlight energy by chlorophyll molecules. This starting point constitutes
position 1 of the Electron Chute game.
Item 8: How is ATP produced?
a) Chlorophyll transfer electrons to ATP synthase to produce ATP.
b) ETC creates a movement of protons (H+) across the membrane which produces
ATP.*
c) The electrons from water (H2O) moves through the membrane producing ATP.
d) NADPH transfers electrons to the ATP synthase to produce ATP.
Item 8-L.O.8 a b* c d Missing Total
(N)
Difficulty Index (p) = 48/115 = 0.42
The item is average
High score group 8 36 7 6 0 57 Discrimination (Da) = (8-16)/58 =
-0.14
Low score group 16 12 19 10 1 58 Discrimination (Db*) = (36-12)/58
= +0.41
Total number of
students per foil
24 48 26 16 1 115 Discrimination (Dc) = (7-19)/58=
- 0.21
Discrimination (Dd) = (6-10)/58 =
-0.07 L.O. means learning outcome; * keyed response-correct option
Item 8 Evaluation: Item 8 was average with 48 out of 115 students answering
correctly (p= 0.42). Item 8 had excellent discrimination index for the keyed response
(D=+0.41) indicating that the item differentiates between the high score and low score
group. Distractors were functioning well. Item 8 functioned well and should be retained
without changes.
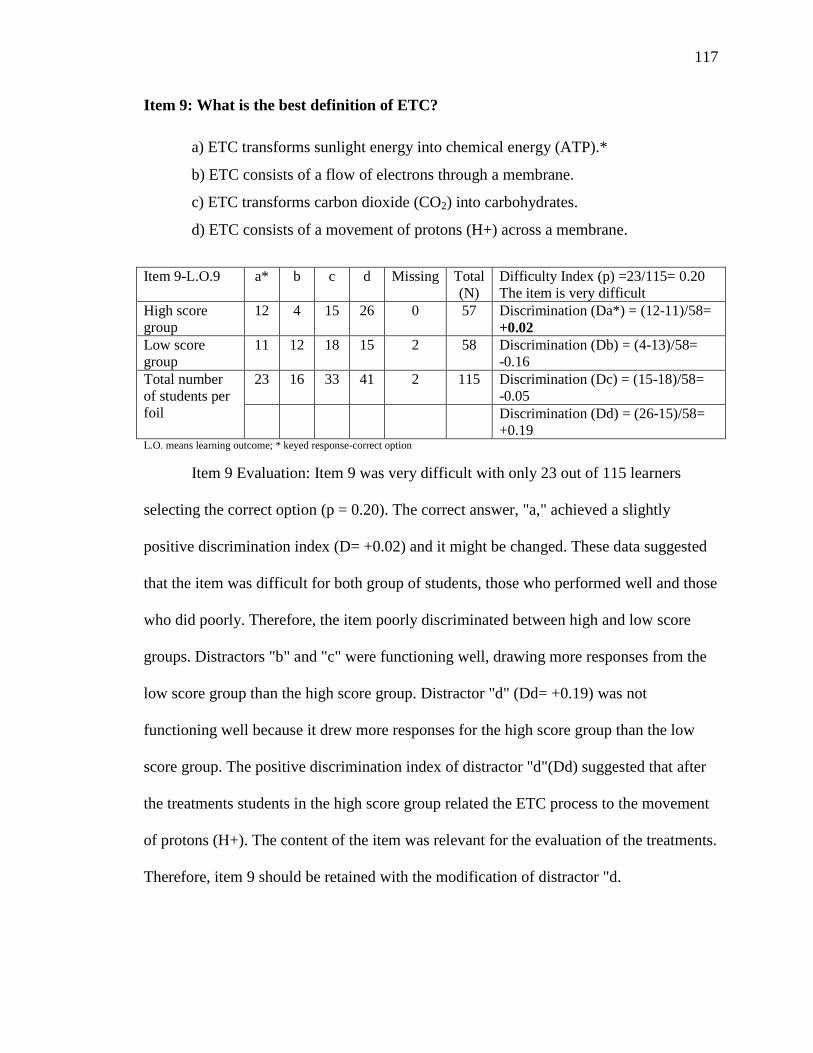
117
Item 9: What is the best definition of ETC?
a) ETC transforms sunlight energy into chemical energy (ATP).*
b) ETC consists of a flow of electrons through a membrane.
c) ETC transforms carbon dioxide (CO2) into carbohydrates.
d) ETC consists of a movement of protons (H+) across a membrane.
Item 9-L.O.9 a* b c d Missing Total
(N)
Difficulty Index (p) =23/115= 0.20
The item is very difficult
High score
group
12 4 15 26 0 57 Discrimination (Da*) = (12-11)/58=
+0.02
Low score
group
11 12 18 15 2 58 Discrimination (Db) = (4-13)/58=
-0.16
Total number
of students per
foil
23 16 33 41 2 115 Discrimination (Dc) = (15-18)/58=
-0.05
Discrimination (Dd) = (26-15)/58=
+0.19 L.O. means learning outcome; * keyed response-correct option
Item 9 Evaluation: Item 9 was very difficult with only 23 out of 115 learners
selecting the correct option (p = 0.20). The correct answer, "a," achieved a slightly
positive discrimination index (D= +0.02) and it might be changed. These data suggested
that the item was difficult for both group of students, those who performed well and those
who did poorly. Therefore, the item poorly discriminated between high and low score
groups. Distractors "b" and "c" were functioning well, drawing more responses from the
low score group than the high score group. Distractor "d" (Dd= +0.19) was not
functioning well because it drew more responses for the high score group than the low
score group. The positive discrimination index of distractor "d"(Dd) suggested that after
the treatments students in the high score group related the ETC process to the movement
of protons (H+). The content of the item was relevant for the evaluation of the treatments.
Therefore, item 9 should be retained with the modification of distractor "d.
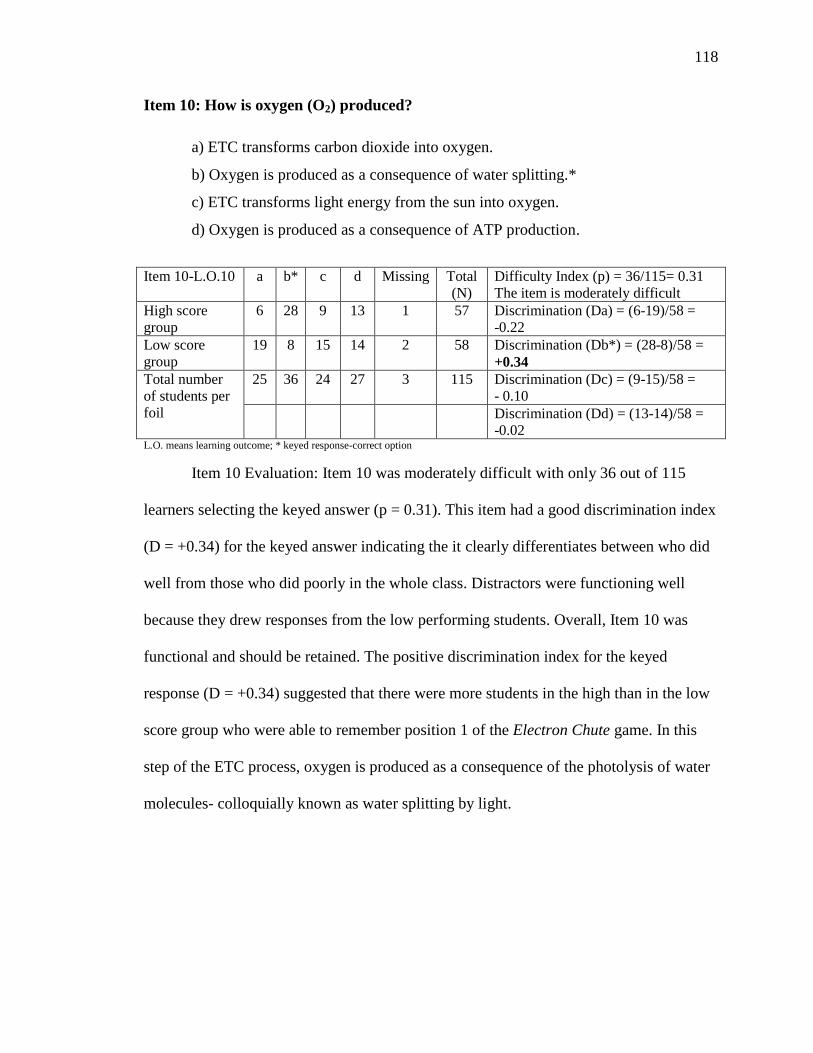
118
Item 10: How is oxygen (O2) produced?
a) ETC transforms carbon dioxide into oxygen.
b) Oxygen is produced as a consequence of water splitting.*
c) ETC transforms light energy from the sun into oxygen.
d) Oxygen is produced as a consequence of ATP production.
Item 10-L.O.10 a b* c d Missing Total
(N)
Difficulty Index (p) = 36/115= 0.31
The item is moderately difficult
High score
group
6 28 9 13 1 57 Discrimination (Da) = (6-19)/58 =
-0.22
Low score
group
19 8 15 14 2 58 Discrimination (Db*) = (28-8)/58 =
+0.34
Total number
of students per
foil
25 36 24 27 3 115 Discrimination (Dc) = (9-15)/58 =
- 0.10
Discrimination (Dd) = (13-14)/58 =
-0.02 L.O. means learning outcome; * keyed response-correct option
Item 10 Evaluation: Item 10 was moderately difficult with only 36 out of 115
learners selecting the keyed answer (p = 0.31). This item had a good discrimination index
(D = +0.34) for the keyed answer indicating the it clearly differentiates between who did
well from those who did poorly in the whole class. Distractors were functioning well
because they drew responses from the low performing students. Overall, Item 10 was
functional and should be retained. The positive discrimination index for the keyed
response (D = +0.34) suggested that there were more students in the high than in the low
score group who were able to remember position 1 of the Electron Chute game. In this
step of the ETC process, oxygen is produced as a consequence of the photolysis of water
molecules- colloquially known as water splitting by light.
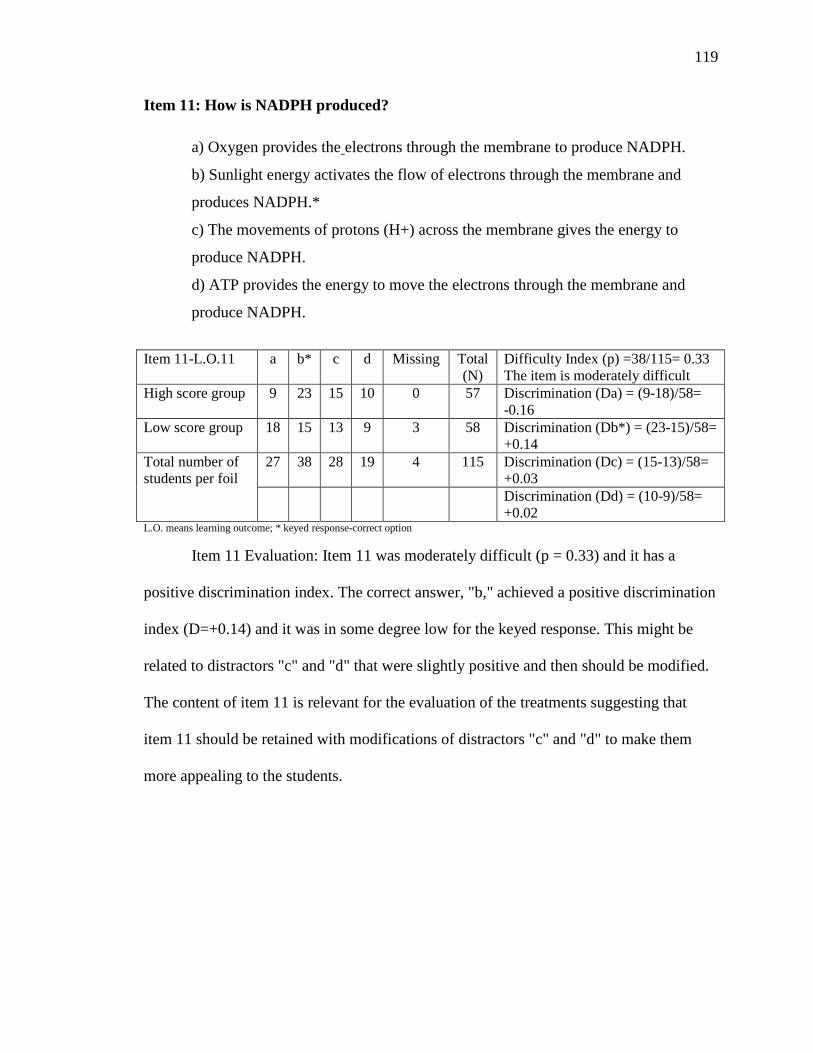
119
Item 11: How is NADPH produced?
a) Oxygen provides the electrons through the membrane to produce NADPH.
b) Sunlight energy activates the flow of electrons through the membrane and
produces NADPH.*
c) The movements of protons (H+) across the membrane gives the energy to
produce NADPH.
d) ATP provides the energy to move the electrons through the membrane and
produce NADPH.
Item 11-L.O.11 a b* c d Missing Total
(N)
Difficulty Index (p) =38/115= 0.33
The item is moderately difficult
High score group 9 23 15 10 0 57 Discrimination (Da) = (9-18)/58=
-0.16
Low score group 18 15 13 9 3 58 Discrimination (Db*) = (23-15)/58=
+0.14
Total number of
students per foil
27 38 28 19 4 115 Discrimination (Dc) = (15-13)/58=
+0.03
Discrimination (Dd) = (10-9)/58=
+0.02 L.O. means learning outcome; * keyed response-correct option
Item 11 Evaluation: Item 11 was moderately difficult (p = 0.33) and it has a
positive discrimination index. The correct answer, "b," achieved a positive discrimination
index (D=+0.14) and it was in some degree low for the keyed response. This might be
related to distractors "c" and "d" that were slightly positive and then should be modified.
The content of item 11 is relevant for the evaluation of the treatments suggesting that
item 11 should be retained with modifications of distractors "c" and "d" to make them
more appealing to the students.
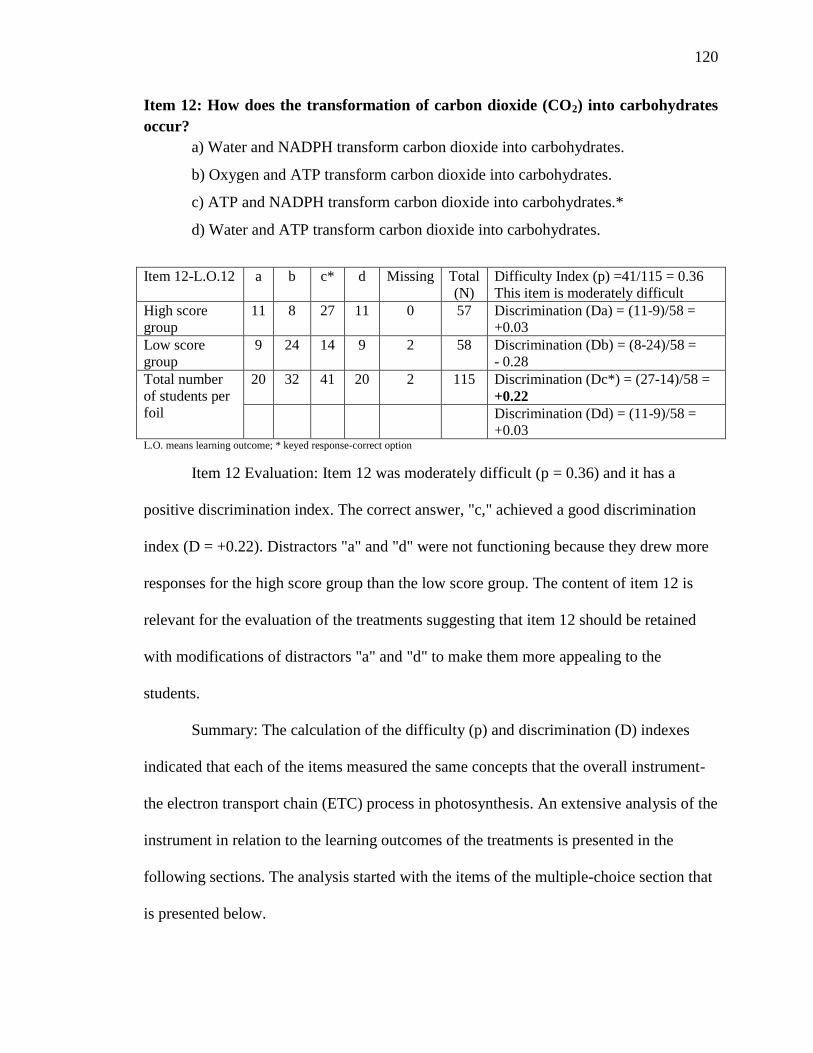
120
Item 12: How does the transformation of carbon dioxide (CO2) into carbohydrates
occur?
a) Water and NADPH transform carbon dioxide into carbohydrates.
b) Oxygen and ATP transform carbon dioxide into carbohydrates.
c) ATP and NADPH transform carbon dioxide into carbohydrates.*
d) Water and ATP transform carbon dioxide into carbohydrates.
Item 12-L.O.12 a b c* d Missing Total
(N)
Difficulty Index (p) =41/115 = 0.36
This item is moderately difficult
High score
group
11 8 27 11 0 57 Discrimination (Da) = (11-9)/58 =
+0.03
Low score
group
9 24 14 9 2 58 Discrimination (Db) = (8-24)/58 =
- 0.28
Total number
of students per
foil
20 32 41 20 2 115 Discrimination (Dc*) = (27-14)/58 =
+0.22
Discrimination (Dd) = (11-9)/58 =
+0.03 L.O. means learning outcome; * keyed response-correct option
Item 12 Evaluation: Item 12 was moderately difficult (p = 0.36) and it has a
positive discrimination index. The correct answer, "c," achieved a good discrimination
index (D = +0.22). Distractors "a" and "d" were not functioning because they drew more
responses for the high score group than the low score group. The content of item 12 is
relevant for the evaluation of the treatments suggesting that item 12 should be retained
with modifications of distractors "a" and "d" to make them more appealing to the
students.
Summary: The calculation of the difficulty (p) and discrimination (D) indexes
indicated that each of the items measured the same concepts that the overall instrument-
the electron transport chain (ETC) process in photosynthesis. An extensive analysis of the
instrument in relation to the learning outcomes of the treatments is presented in the
following sections. The analysis started with the items of the multiple-choice section that
is presented below.
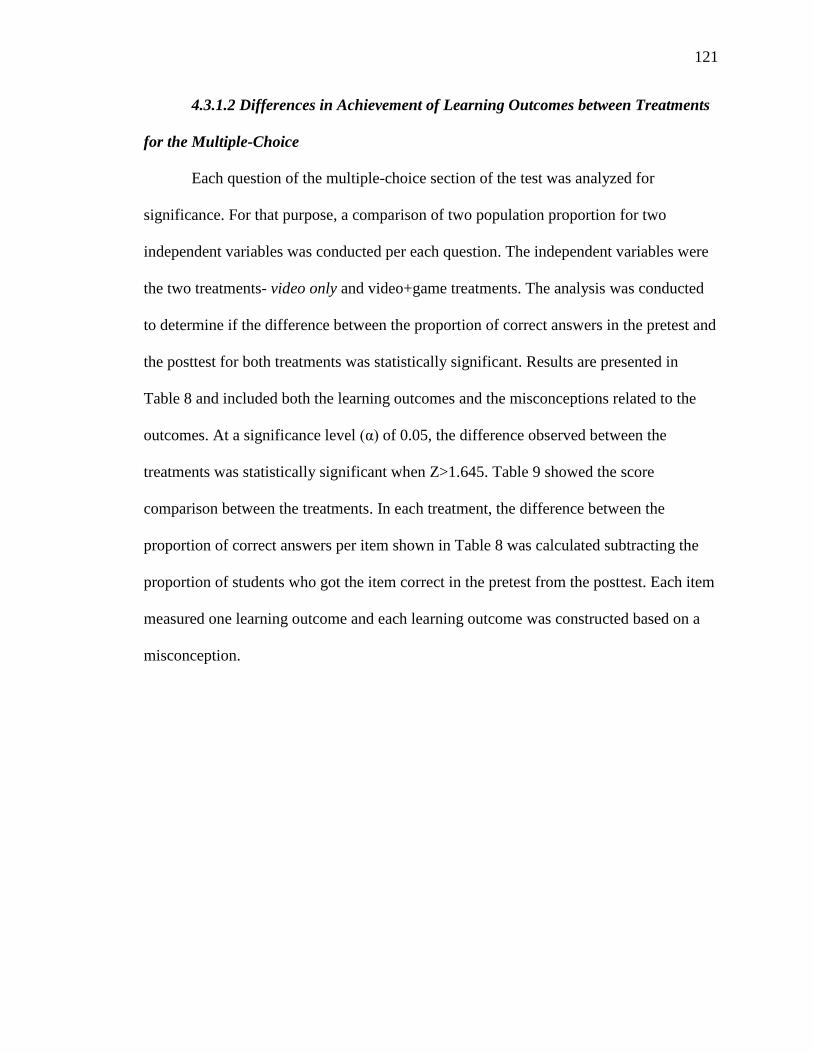
121
4.3.1.2 Differences in Achievement of Learning Outcomes between Treatments
for the Multiple-Choice
Each question of the multiple-choice section of the test was analyzed for
significance. For that purpose, a comparison of two population proportion for two
independent variables was conducted per each question. The independent variables were
the two treatments- video only and video+game treatments. The analysis was conducted
to determine if the difference between the proportion of correct answers in the pretest and
the posttest for both treatments was statistically significant. Results are presented in
Table 8 and included both the learning outcomes and the misconceptions related to the
outcomes. At a significance level α of 0.05, the difference observed between the
treatments was statistically significant when Z>1.645. Table 9 showed the score
comparison between the treatments. In each treatment, the difference between the
proportion of correct answers per item shown in Table 8 was calculated subtracting the
proportion of students who got the item correct in the pretest from the posttest. Each item
measured one learning outcome and each learning outcome was constructed based on a
misconception.
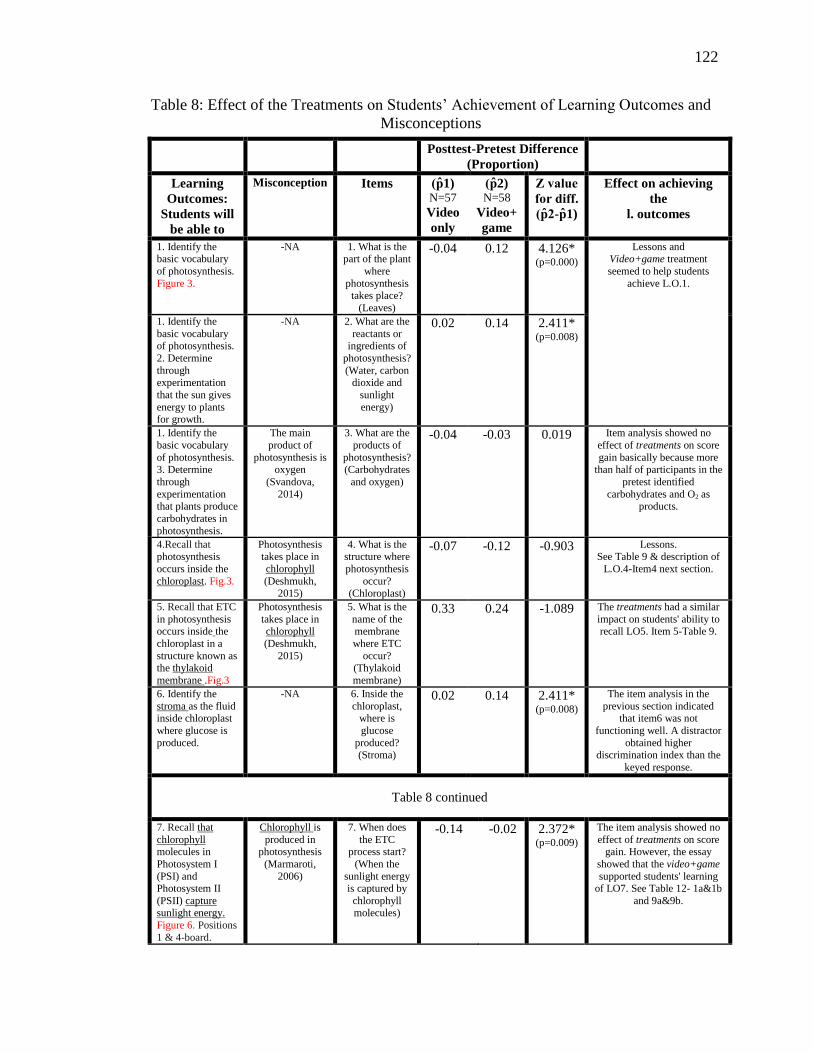
122
Table 8: Effect of the Treatments on Students’ Achievement of Learning Outcomes and
Misconceptions
Posttest-Pretest Difference
(Proportion)
Learning
Outcomes:
Students will
be able to
Misconception Items
1) N=57
Video
only
2) N=58
Video+
game
- 1)
Effect on achieving
the
l. outcomes
1. Identify the basic vocabulary
of photosynthesis.
Figure 3.
-NA 1. What is the part of the plant
where
photosynthesis takes place?
(Leaves)
-0.04 0.12 4.126* (p=0.000)
Lessons and Video+game treatment
seemed to help students
achieve L.O.1.
1. Identify the
basic vocabulary of photosynthesis.
2. Determine
through experimentation
that the sun gives
energy to plants for growth.
-NA 2. What are the
reactants or ingredients of
photosynthesis?
(Water, carbon dioxide and
sunlight
energy)
0.02 0.14 2.411* (p=0.008)
1. Identify the
basic vocabulary
of photosynthesis. 3. Determine
through
experimentation that plants produce
carbohydrates in
photosynthesis.
The main
product of
photosynthesis is oxygen
(Svandova,
2014)
3. What are the
products of
photosynthesis? (Carbohydrates
and oxygen)
-0.04 -0.03 0.019 Item analysis showed no
effect of treatments on score
gain basically because more than half of participants in the
pretest identified
carbohydrates and O2 as products.
4.Recall that
photosynthesis
occurs inside the
chloroplast. Fig.3.
Photosynthesis
takes place in
chlorophyll
(Deshmukh, 2015)
4. What is the
structure where
photosynthesis
occur? (Chloroplast)
-0.07 -0.12 -0.903 Lessons.
See Table 9 & description of
L.O.4-Item4 next section.
5. Recall that ETC
in photosynthesis occurs inside the
chloroplast in a
structure known as the thylakoid
membrane .Fig.3
Photosynthesis
takes place in chlorophyll
(Deshmukh,
2015)
5. What is the
name of the membrane
where ETC
occur? (Thylakoid
membrane)
0.33 0.24 -1.089 The treatments had a similar
impact on students' ability to recall LO5. Item 5-Table 9.
6. Identify the
stroma as the fluid inside chloroplast
where glucose is
produced.
-NA 6. Inside the
chloroplast, where is
glucose
produced? (Stroma)
0.02 0.14 2.411* (p=0.008)
The item analysis in the
previous section indicated that item6 was not
functioning well. A distractor
obtained higher discrimination index than the
keyed response.
Table 8 continued
7. Recall that
chlorophyll molecules in
Photosystem I
(PSI) and Photosystem II
(PSII) capture sunlight energy.
Figure 6. Positions
1 & 4-board.
Chlorophyll is
produced in photosynthesis
(Marmaroti,
2006)
7. When does
the ETC process start?
(When the
sunlight energy is captured by
chlorophyll molecules)
-0.14
-0.02
2.372* (p=0.009)
The item analysis showed no
effect of treatments on score gain. However, the essay
showed that the video+game
supported students' learning of LO7. See Table 12- 1a&1b
and 9a&9b.
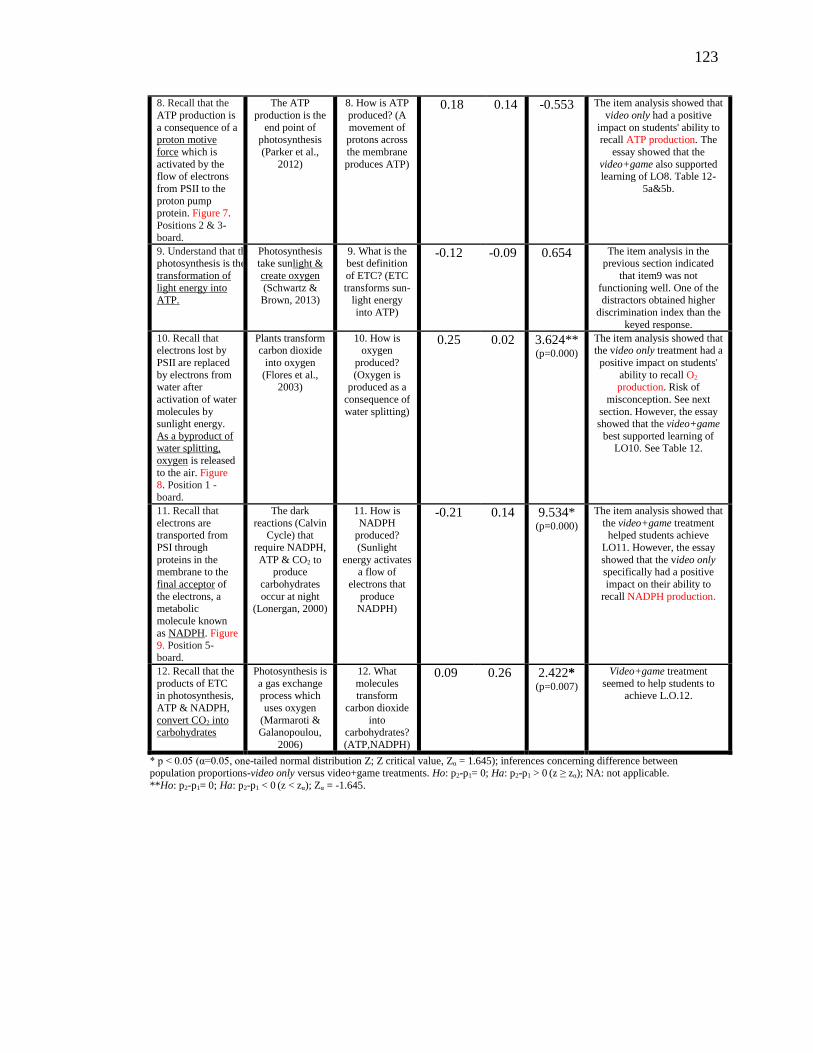
123
8. Recall that the
ATP production is
a consequence of a proton motive
force which is
activated by the flow of electrons
from PSII to the
proton pump protein. Figure 7.
Positions 2 & 3-
board.
The ATP
production is the
end point of photosynthesis
(Parker et al.,
2012)
8. How is ATP
produced? (A
movement of protons across
the membrane
produces ATP)
0.18
0.14
-0.553
The item analysis showed that
video only had a positive
impact on students' ability to recall ATP production. The
essay showed that the
video+game also supported learning of LO8. Table 12-
5a&5b.
9. Understand that the ETC in photosynthesis is the
transformation of
light energy into ATP.
Photosynthesis take sunlight &
create oxygen
(Schwartz & Brown, 2013)
9. What is the best definition
of ETC? (ETC
transforms sun- light energy
into ATP)
-0.12
-0.09
0.654
The item analysis in the previous section indicated
that item9 was not
functioning well. One of the distractors obtained higher
discrimination index than the
keyed response.
10. Recall that electrons lost by
PSII are replaced
by electrons from water after
activation of water
molecules by sunlight energy.
As a byproduct of water splitting,
oxygen is released
to the air. Figure 8. Position 1 -
board.
Plants transform carbon dioxide
into oxygen
(Flores et al., 2003)
10. How is oxygen
produced?
(Oxygen is produced as a
consequence of
water splitting)
0.25
0.02
3.624** (p=0.000)
The item analysis showed that the video only treatment had a
positive impact on students'
ability to recall O2 production. Risk of
misconception. See next
section. However, the essay showed that the video+game
best supported learning of LO10. See Table 12.
11. Recall that
electrons are transported from
PSI through
proteins in the membrane to the
final acceptor of
the electrons, a metabolic
molecule known
as NADPH. Figure 9. Position 5-
board.
The dark
reactions (Calvin Cycle) that
require NADPH,
ATP & CO2 to produce
carbohydrates
occur at night (Lonergan, 2000)
11. How is
NADPH produced?
(Sunlight
energy activates a flow of
electrons that
produce NADPH)
-0.21
0.14
9.534* (p=0.000)
The item analysis showed that
the video+game treatment helped students achieve
LO11. However, the essay
showed that the video only specifically had a positive
impact on their ability to
recall NADPH production.
12. Recall that the
products of ETC in photosynthesis,
ATP & NADPH,
convert CO2 into carbohydrates
Photosynthesis is
a gas exchange process which
uses oxygen
(Marmaroti & Galanopoulou,
2006)
12. What
molecules transform
carbon dioxide
into carbohydrates?
(ATP,NADPH)
0.09
0.26
2.422* (p=0.007)
Video+game treatment
seemed to help students to achieve L.O.12.
* p < 0.05 α 0.05, one-tailed normal distribution Z; Z critical value, Zα = 1.645); inferences concerning difference between population proportions-video only versus video+game treatments. Ho: p2-p1= 0; Ha: p2-p1 > 0 (z ≥ zα); NA: not applicable.
**Ho: p2-p1= 0; Ha: p2-p1 < 0 (z < zα); Zα = -1.645.

124
Table 9: Students' Correct Answers about Photosynthesis and ETC in the Pretest and
Posttest -A Comparison between Treatments for the Multiple-Choice Section
Correct Answers (Proportion)
Items
Whole Class
(N= 115)
Test
statistic
Video only
(N=57)
Video+game
(N=58)
Pre Post Z value pretest
1
2
Z value
Pre-Post
2
1
Z value
Pre-Post
1. What is the part of
the plant where photosynthesis takes
place? (Leaves)
0.81
0.84
0.88
0.84
0.81
-0.492
0.78*
0.90*
1.756* (p=0.039)
2. What are the
reactants or ingredients of
photosynthesis?
(Water, carbon dioxide and sunlight
energy)
0.56
0.62
1.21
0.65
0.67
0.197
0.45
0.59
1.486
3. What are the
products of photosynthesis?
0.57 0.56 -0.53 0.63
0.60
-0.385
0.53
0.50
-0.372
4. What is the
structure where photosynthesis
occur? (Chloroplast)
0.77 0.70 -1.34 0.75
0.68
-0.834
0.83
0.71
-1.538
5. What is the name
of the membrane where the electron
transport chain
(ETC) occur?
(Thylakoid
membrane)
0.16
*
0.45
*
4.75* (p=0.000)
0.11*
0.44*
3.999* (p=0.000)
0.21*
0.45*
2.770* (p=0.028)
6. Inside the
chloroplast, where is glucose produced?
(Stroma)
0.23 0.28 1.37 0.16
0.18
0.251
0.26
0.40
1.583
7. When does the ETC process start?
(When the sunlight
energy is captured by chlorophyll
molecules)
0.50 0.42 -1.19 0.56
0.42
-1.495
0.44
0.42
-0.218
8. How is ATP
produced? (A movement of protons
across the membrane
produces ATP)
0.26
*
0.42
*
2.51* (p=0.006)
0.26*
0.44*
1.962* (p=0.024)
0.26
0.40
1.583
9. What is the best
definition of ETC?
(ETC transforms sunlight energy into
ATP)
0.30
*
0.20
*
-1.82** (p=0.034)
0.37
0.25
-1.421
0.24
0.16
-1.164
Table 9 continued
10. How is oxygen
produced? (Oxygen
is produced as a consequence of water
splitting)
0.18
*
0.31
*
2.32* (p=0.010)
0.12*
0.37*
3.046* (p=0.000)
0.22
0.24
0.220
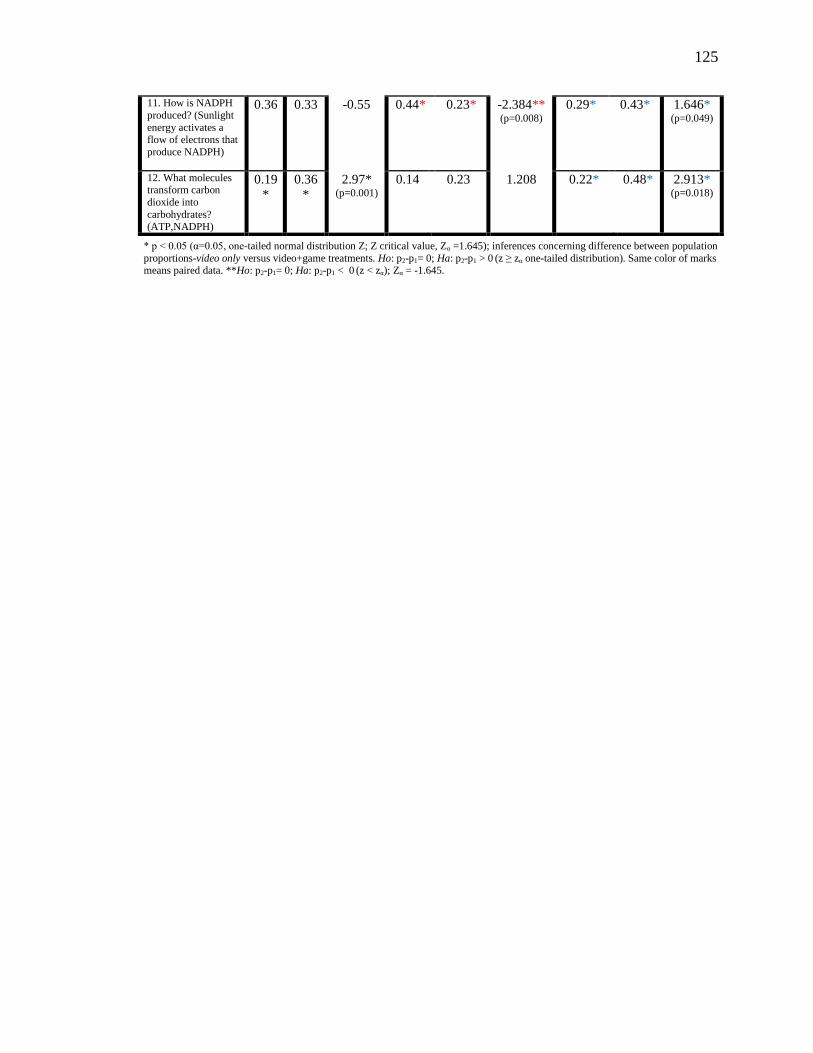
125
* p < 0.05 α 0.05, one-tailed normal distribution Z; Z critical value, Zα =1.645); inferences concerning difference between population
proportions-video only versus video+game treatments. Ho: p2-p1= 0; Ha: p2-p1 > 0 (z ≥ zα one-tailed distribution). Same color of marks means paired data. **Ho: p2-p1= 0; Ha: p2-p1 < 0 (z < zα); Zα = -1.645.
11. How is NADPH
produced? (Sunlight
energy activates a flow of electrons that
produce NADPH)
0.36 0.33 -0.55 0.44*
0.23*
-2.384** (p=0.008)
0.29*
0.43*
1.646* (p=0.049)
12. What molecules transform carbon
dioxide into
carbohydrates? (ATP,NADPH)
0.19
*
0.36
*
2.97* (p=0.001)
0.14
0.23
1.208
0.22*
0.48*
2.913* (p=0.018)
126
4.3.2 Essay Section
The essay section provided general information regarding the ability students had
to interpret the ETC representation after the learning experiences given by the treatments.
The significant difference between the overall essay score in the pretest and the
posttest for the treatments was determined through a comparison of two population
proportions using a Z-test. The effect of treatments, the effect of academic readiness and
the effect of the treatments between academic readiness on score gain from pretest to
posttest was determined performing an univariate analysis of variance (ANOVA)
(Devore, 2015).
4.3.2.1 Differences in the Score Gain between the Treatments for the Essay
The scores distribution for the essay section of the pretest and posttest are shown
in Figure 11. The means are indicated in the graphs. The total points were 11 points.
Likewise the multiple-choice section (Figure 10a and Figure 10b), the scores distribution
showed that students reached higher scores in the posttest (Figure 11b; mean=3.60;
std=2.35) in comparison to the pretest (Figure 11a; mean=1.57; std=1.60). More students
reached higher scores in the posttest in comparison to the pretest. A third (30%) of the
students scored 0 points in the pretest in comparison to the 15% in the posttest. This is a
positive result because it indicates that after the treatments half of the participants could
explain some of the ideas related to the ETC process in the essay. Later in the chapter,
data indicates that those students who scored 0 point were part of the video only
treatment. No student in the video+game treatment scored 0 points.
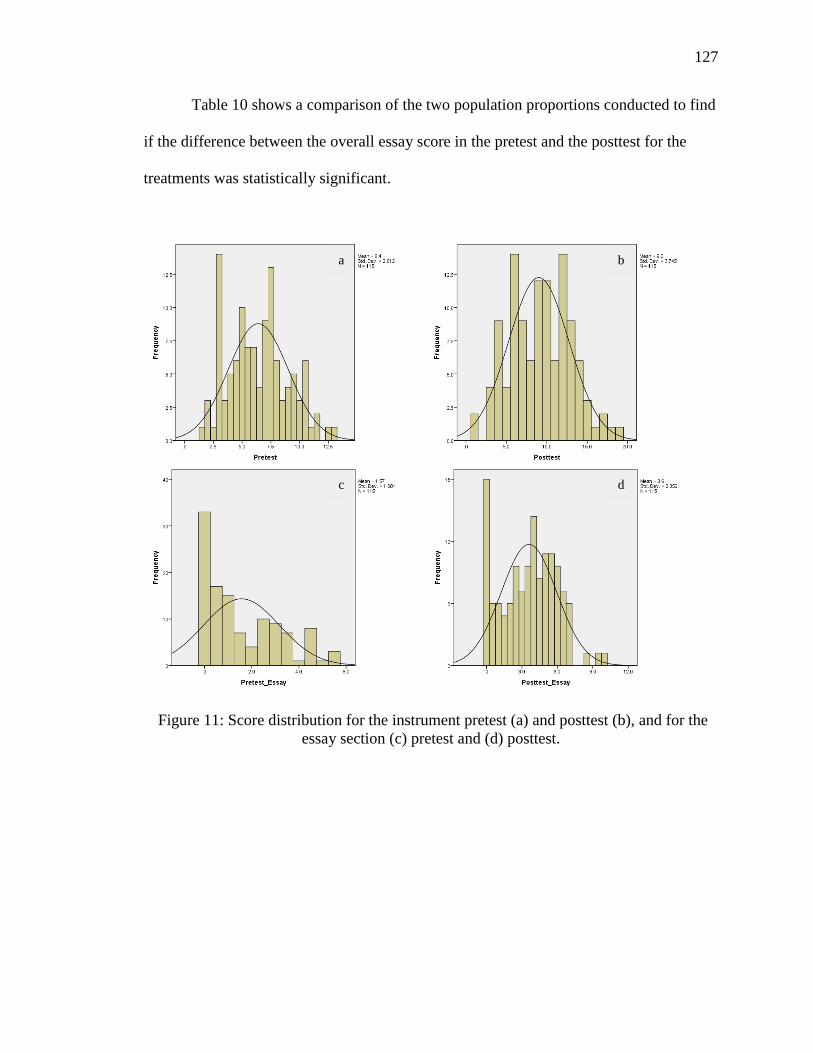
127
Table 10 shows a comparison of the two population proportions conducted to find
if the difference between the overall essay score in the pretest and the posttest for the
treatments was statistically significant.
Figure 11: Score distribution for the instrument pretest (a) and posttest (b), and for the
essay section (c) pretest and (d) posttest.
a b
c d
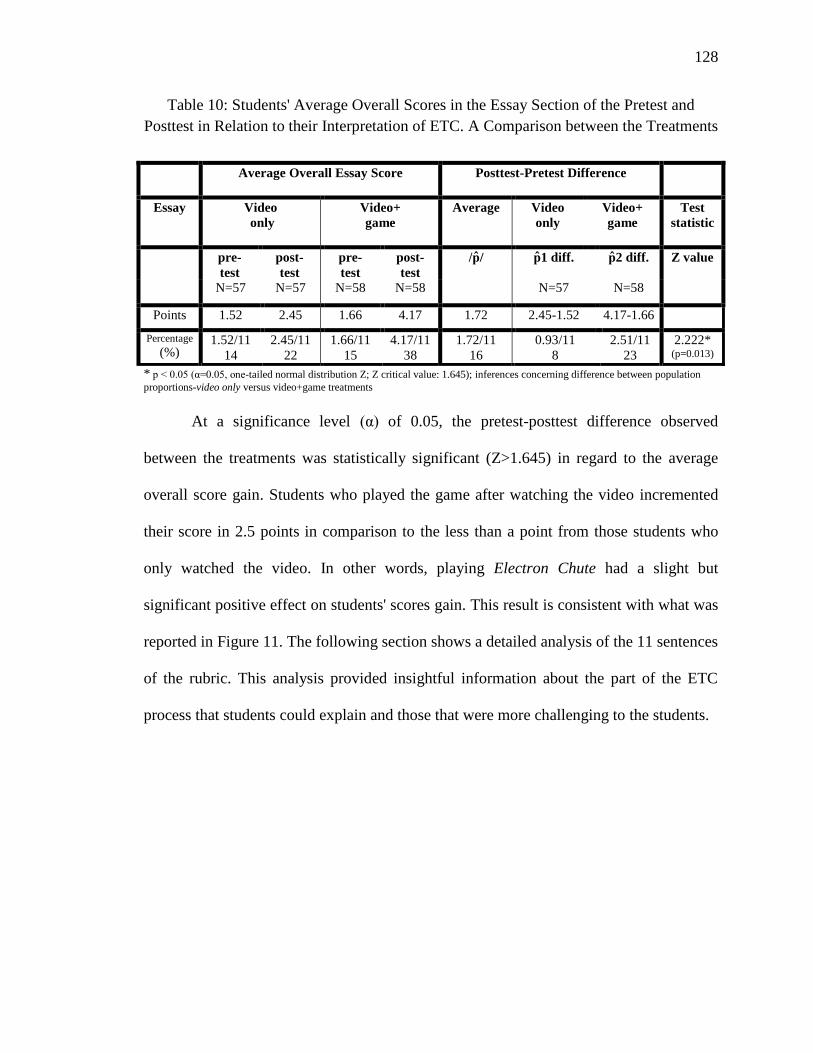
128
Table 10: Students' Average Overall Scores in the Essay Section of the Pretest and
Posttest in Relation to their Interpretation of ETC. A Comparison between the Treatments
Average Overall Essay Score
Posttest-Pretest Difference
Essay
Video
only
Video+
game
Average
Video
only
Video+
game
Test
statistic
pre-
test
post-
test
pre-
test
post-
test
/ 1 diff. 2 diff. Z value
N=57 N=57 N=58 N=58 N=57 N=58
Points 1.52 2.45 1.66 4.17 1.72 2.45-1.52 4.17-1.66
Percentage (%)
1.52/11
14
2.45/11
22
1.66/11
15
4.17/11
38
1.72/11
16
0.93/11
8
2.51/11
23
2.222* (p=0.013)
* p < 0.05 α 0.05, one-tailed normal distribution Z; Z critical value: 1.645); inferences concerning difference between population
proportions-video only versus video+game treatments
At a significance level α of 0.05, the pretest-posttest difference observed
between the treatments was statistically significant (Z>1.645) in regard to the average
overall score gain. Students who played the game after watching the video incremented
their score in 2.5 points in comparison to the less than a point from those students who
only watched the video. In other words, playing Electron Chute had a slight but
significant positive effect on students' scores gain. This result is consistent with what was
reported in Figure 11. The following section shows a detailed analysis of the 11 sentences
of the rubric. This analysis provided insightful information about the part of the ETC
process that students could explain and those that were more challenging to the students.
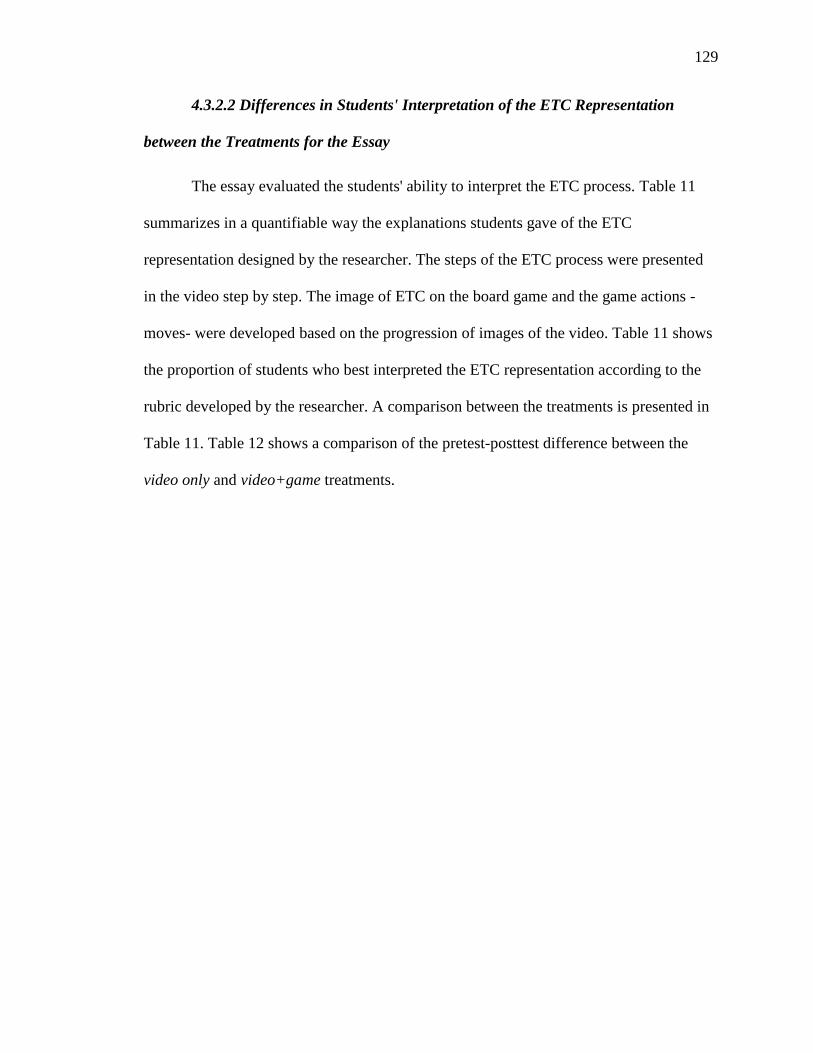
129
4.3.2.2 Differences in Students' Interpretation of the ETC Representation
between the Treatments for the Essay
The essay evaluated the students' ability to interpret the ETC process. Table 11
summarizes in a quantifiable way the explanations students gave of the ETC
representation designed by the researcher. The steps of the ETC process were presented
in the video step by step. The image of ETC on the board game and the game actions -
moves- were developed based on the progression of images of the video. Table 11 shows
the proportion of students who best interpreted the ETC representation according to the
rubric developed by the researcher. A comparison between the treatments is presented in
Table 11. Table 12 shows a comparison of the pretest-posttest difference between the
video only and video+game treatments.

130
Table 11: Students' Interpretation of the ETC Representation in the Pretest and Posttest -
A Comparison between Treatments for the Essay
Proportion of Students who best Interpreted the ETC Representation
Rubric
Sentences
Whole Class
(N= 115)
Test
statistic
Video only
(N=57)
Video+game
(N=58)
Pre Post Z value
1
2
Z value
Pre-
Post
1
2
Z value
Pre-
Post
Representation of the transformation of sunlight energy into chemical energy (ATP) by the formation of a
gradient of protons created by a flow of electrons activated by light. L.O. 7 and L.O. 8.
1a. The process
starts when
sunlight energy
is captured
L.O.7.
0.56* 0.67* 1.714* (p=0.043)
0.56 0.60 0.433 0.57* 0.74* 1.926* (p=0.027)
1b. by
chlorophyll in
PSII
(chlorophyll or
PSII or
both)L.O.7.
0.22* 0.37* 2.494* (p=0.006)
0.23 0.32 1.076 0.21* 0.43* 2.540* (p=0.005)
2a. Two
electrons from
PSII move
L.O.8.
0.24* 0.55* 4.809* (p=0.000)
0.19* 0.40* 2.458* (p=0.007)
0.28* 0.69* 4.418* (p=0.000)
2b. to a proton
(H+) pump
protein/
molecule.
L.O.8.
0.10* 0.22* 2.482* (p=0.006)
0.04* 0.16* 2.135* (p=0.016)
0.17 0.28 1.419
3a. This
movement of
electrons
creates a H+
movement to
lumen L.8.
0.17* 0.41* 4.011* (p=0.000)
0.18 0.26 1.031 0.16* 0.55* 4.389* (p=0.000)
3b. through the
proton pump
[from stroma to
lumen] L.O.8.
0.10* 0.28* 3.479* (p=0.000)
0.07 0.14 1.219 0.12* 0.41* 3.539* (p=0.000)
4a. Protons
(H+) 0.17* 0.33* 2.486*
(p=0.006) 0.19 0.21 0.267 0.14* 0.45* 3.661*
(p=0.000) 4b. starts
accumulating in
the lumen
0.08* 0.17* 2.064* (p=0.019)
0.12 0.19 1.033 0.03* 0.14* 2.124* (p=0.016)
5a. Protons
(H+) move
back to stroma
through ATP
synthase L.O.8.
0.08* 0.24* 3.309* (p=0.000)
0.05 0.14 1.639 0.10* 0.33* 3.015* (p=0.001)
Table 11 continued
5b. and produce
ATP. L.O.8. 0.18* 0.58* 6.249*
(p=0.000) 0.23* 0.42* 2.166*
(p=0.015) 0.14* 0.74* 6.509*
(p=0.000)
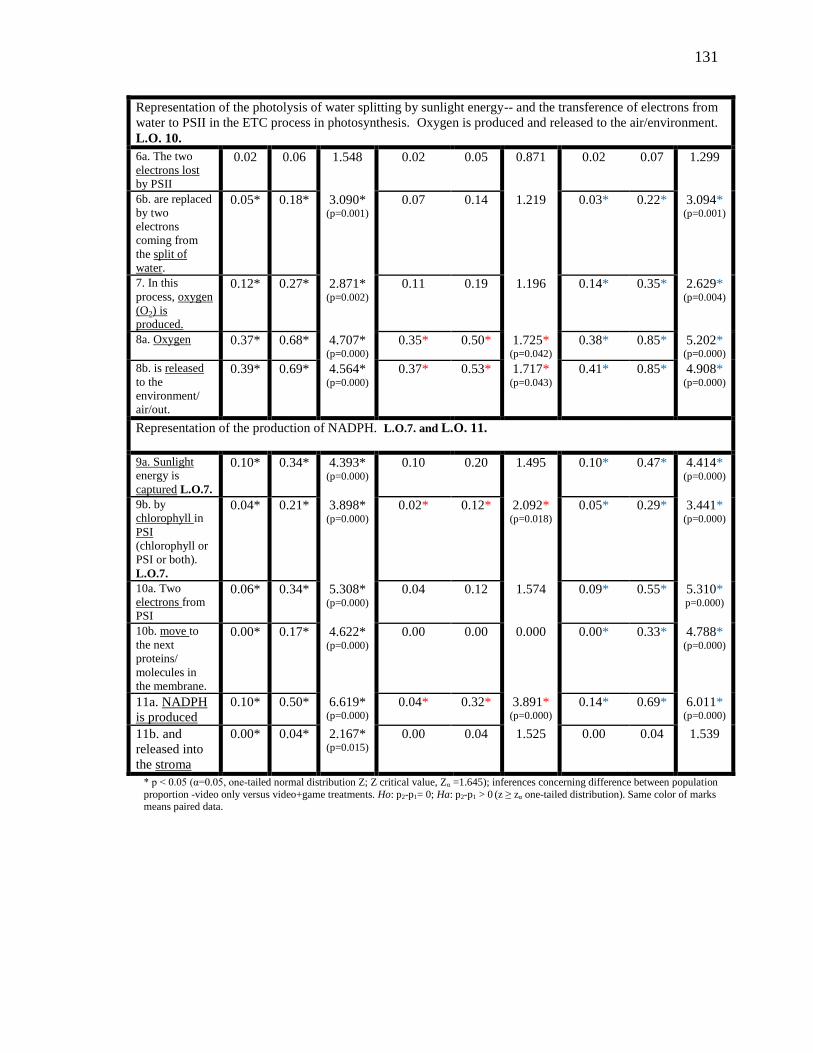
131
* p < 0.05 α 0.05, one-tailed normal distribution Z; Z critical value, Zα =1.645); inferences concerning difference between population
proportion -video only versus video+game treatments. Ho: p2-p1= 0; Ha: p2-p1 > 0 (z ≥ zα one-tailed distribution). Same color of marks means paired data.
Representation of the photolysis of water splitting by sunlight energy-- and the transference of electrons from
water to PSII in the ETC process in photosynthesis. Oxygen is produced and released to the air/environment.
L.O. 10.
6a. The two
electrons lost
by PSII
0.02 0.06 1.548 0.02 0.05 0.871 0.02 0.07 1.299
6b. are replaced
by two
electrons
coming from
the split of
water.
0.05* 0.18* 3.090* (p=0.001)
0.07 0.14 1.219 0.03* 0.22* 3.094* (p=0.001)
7. In this
process, oxygen
(O2) is
produced.
0.12* 0.27* 2.871* (p=0.002)
0.11 0.19 1.196 0.14* 0.35* 2.629* (p=0.004)
8a. Oxygen 0.37* 0.68* 4.707* (p=0.000)
0.35* 0.50* 1.725* (p=0.042)
0.38* 0.85* 5.202* (p=0.000)
8b. is released
to the
environment/
air/out.
0.39* 0.69* 4.564* (p=0.000)
0.37* 0.53* 1.717* (p=0.043)
0.41* 0.85* 4.908* (p=0.000)
Representation of the production of NADPH. L.O.7. and L.O. 11.
9a. Sunlight
energy is
captured L.O.7.
0.10* 0.34* 4.393* (p=0.000)
0.10 0.20 1.495 0.10* 0.47* 4.414* (p=0.000)
9b. by
chlorophyll in
PSI
(chlorophyll or
PSI or both).
L.O.7.
0.04* 0.21* 3.898* (p=0.000)
0.02* 0.12* 2.092* (p=0.018)
0.05* 0.29* 3.441* (p=0.000)
10a. Two
electrons from
PSI
0.06* 0.34* 5.308* (p=0.000)
0.04 0.12 1.574 0.09* 0.55* 5.310*
p=0.000)
10b. move to
the next
proteins/
molecules in
the membrane.
0.00* 0.17* 4.622* (p=0.000)
0.00 0.00 0.000 0.00* 0.33* 4.788* (p=0.000)
11a. NADPH
is produced
0.10* 0.50* 6.619* (p=0.000)
0.04* 0.32* 3.891* (p=0.000)
0.14* 0.69* 6.011* (p=0.000)
11b. and
released into
the stroma
0.00* 0.04* 2.167* (p=0.015)
0.00 0.04 1.525 0.00 0.04 1.539
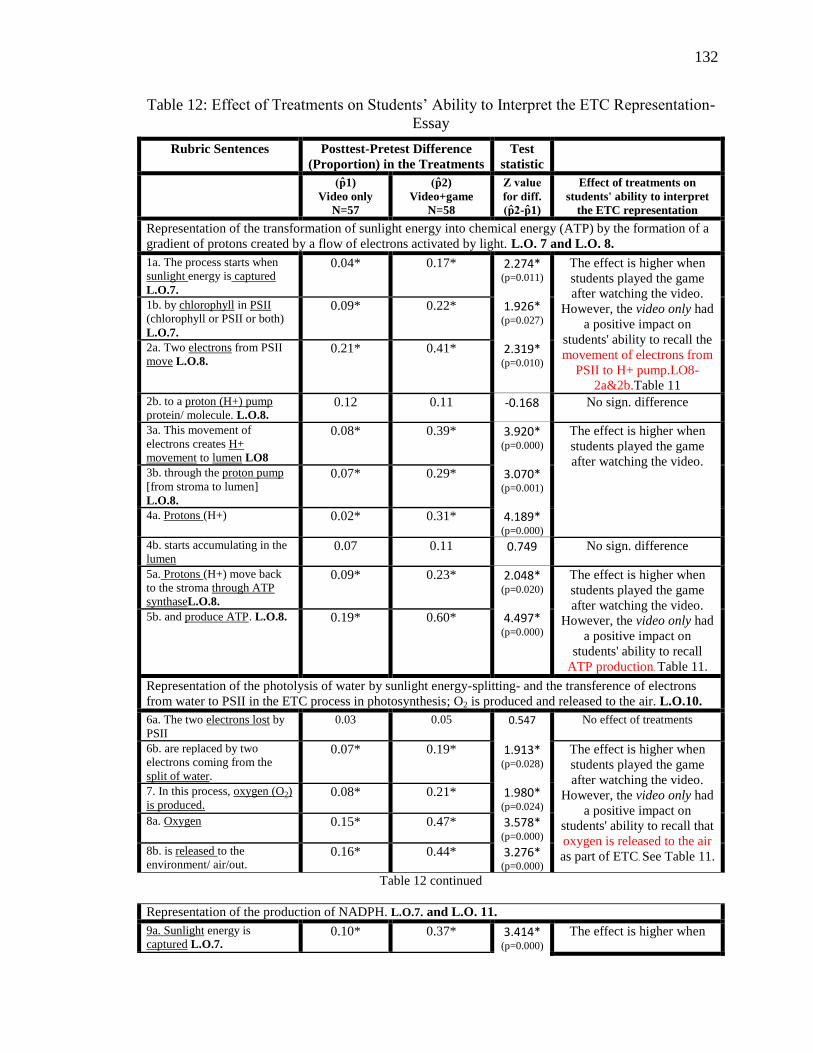
132
Table 12: Effect of Treatments on Students’ Ability to nterpret the ETC Representation-
Essay
Rubric Sentences
Posttest-Pretest Difference
(Proportion) in the Treatments
Test
statistic
1)
Video only
N=57
2)
Video+game
N=58
- 1)
Effect of treatments on
students' ability to interpret
the ETC representation
Representation of the transformation of sunlight energy into chemical energy (ATP) by the formation of a
gradient of protons created by a flow of electrons activated by light. L.O. 7 and L.O. 8.
1a. The process starts when
sunlight energy is captured
L.O.7.
0.04* 0.17* 2.274* (p=0.011)
The effect is higher when
students played the game
after watching the video.
However, the video only had
a positive impact on
students' ability to recall the
movement of electrons from
PSII to H+ pump.LO8-
2a&2b.Table 11
1b. by chlorophyll in PSII
(chlorophyll or PSII or both)
L.O.7.
0.09* 0.22* 1.926* (p=0.027)
2a. Two electrons from PSII
move L.O.8. 0.21* 0.41* 2.319*
(p=0.010)
2b. to a proton (H+) pump
protein/ molecule. L.O.8. 0.12 0.11 -0.168 No sign. difference
3a. This movement of
electrons creates H+
movement to lumen LO8
0.08* 0.39* 3.920* (p=0.000)
The effect is higher when
students played the game
after watching the video. 3b. through the proton pump
[from stroma to lumen]
L.O.8.
0.07* 0.29* 3.070* (p=0.001)
4a. Protons (H+) 0.02* 0.31* 4.189* (p=0.000)
4b. starts accumulating in the
lumen 0.07 0.11 0.749 No sign. difference
5a. Protons (H+) move back
to the stroma through ATP
synthaseL.O.8.
0.09* 0.23* 2.048* (p=0.020)
The effect is higher when
students played the game
after watching the video.
However, the video only had
a positive impact on
students' ability to recall
ATP production. Table 11.
5b. and produce ATP. L.O.8. 0.19* 0.60* 4.497* (p=0.000)
Representation of the photolysis of water by sunlight energy-splitting- and the transference of electrons
from water to PSII in the ETC process in photosynthesis; O2 is produced and released to the air. L.O.10.
6a. The two electrons lost by
PSII
0.03 0.05 0.547 No effect of treatments
6b. are replaced by two
electrons coming from the
split of water.
0.07* 0.19* 1.913* (p=0.028)
The effect is higher when
students played the game
after watching the video.
However, the video only had
a positive impact on
students' ability to recall that
oxygen is released to the air
as part of ETC. See Table 11.
7. In this process, oxygen (O2)
is produced. 0.08* 0.21* 1.980*
(p=0.024) 8a. Oxygen 0.15* 0.47* 3.578*
(p=0.000) 8b. is released to the
environment/ air/out. 0.16* 0.44* 3.276*
(p=0.000) Table 12 continued
Representation of the production of NADPH. L.O.7. and L.O. 11.
9a. Sunlight energy is
captured L.O.7. 0.10* 0.37* 3.414*
(p=0.000) The effect is higher when
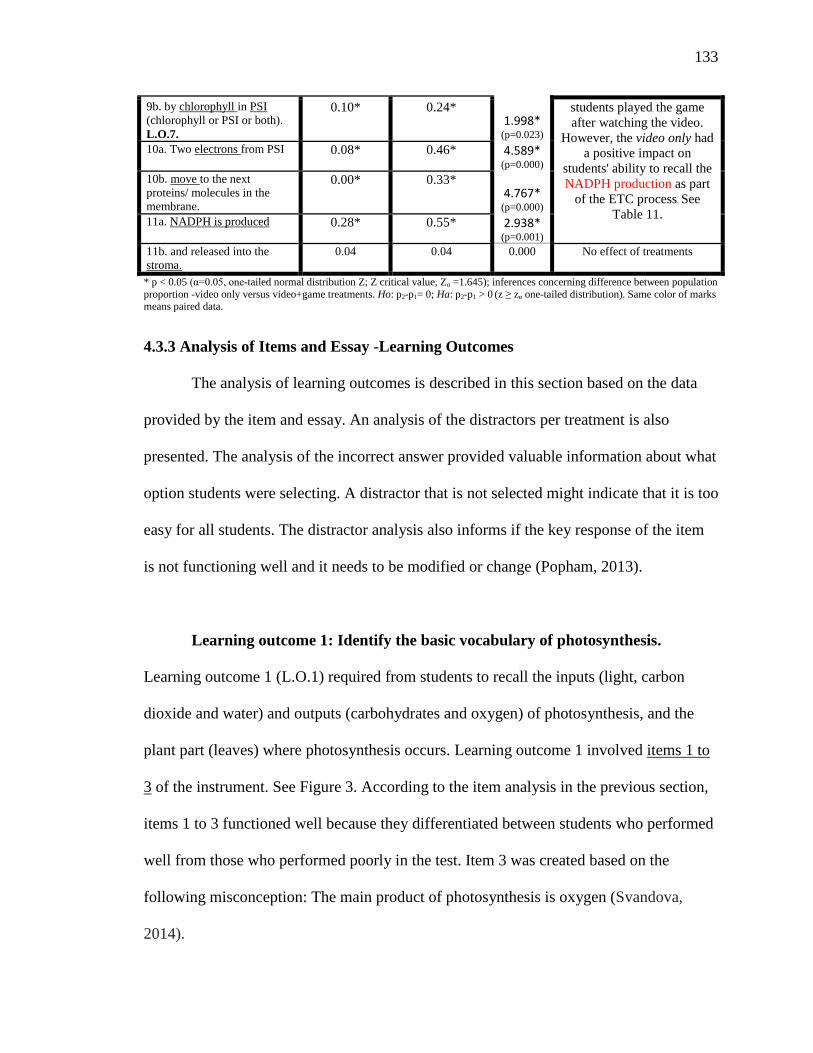
133
9b. by chlorophyll in PSI
(chlorophyll or PSI or both).
L.O.7.
0.10* 0.24* 1.998*
(p=0.023)
students played the game
after watching the video.
However, the video only had
a positive impact on
students' ability to recall the
NADPH production as part
of the ETC process. See
Table 11.
10a. Two electrons from PSI 0.08* 0.46* 4.589* (p=0.000)
10b. move to the next
proteins/ molecules in the
membrane.
0.00* 0.33* 4.767*
(p=0.000) 11a. NADPH is produced 0.28* 0.55* 2.938*
(p=0.001) 11b. and released into the
stroma.
0.04 0.04 0.000 No effect of treatments
* p < 0.05 α 0.05, one-tailed normal distribution Z; Z critical value, Zα =1.645); inferences concerning difference between population
proportion -video only versus video+game treatments. Ho: p2-p1= 0; Ha: p2-p1 > 0 (z ≥ zα one-tailed distribution). Same color of marks means paired data.
4.3.3 Analysis of Items and Essay -Learning Outcomes
The analysis of learning outcomes is described in this section based on the data
provided by the item and essay. An analysis of the distractors per treatment is also
presented. The analysis of the incorrect answer provided valuable information about what
option students were selecting. A distractor that is not selected might indicate that it is too
easy for all students. The distractor analysis also informs if the key response of the item
is not functioning well and it needs to be modified or change (Popham, 2013).
Learning outcome 1: Identify the basic vocabulary of photosynthesis.
Learning outcome 1 (L.O.1) required from students to recall the inputs (light, carbon
dioxide and water) and outputs (carbohydrates and oxygen) of photosynthesis, and the
plant part (leaves) where photosynthesis occurs. Learning outcome 1 involved items 1 to
3 of the instrument. See Figure 3. According to the item analysis in the previous section,
items 1 to 3 functioned well because they differentiated between students who performed
well from those who performed poorly in the test. Item 3 was created based on the
following misconception: The main product of photosynthesis is oxygen (Svandova,
2014).
134
Item 1, in the pretest, 81% of students in the whole class answered it correctly.
This indicated that the lessons (Appendix D & E) of photosynthesis before the treatments
helped students remember that leaves were the part of the plant where photosynthesis
takes place. See Table 9. That idea seemed to be reinforced by playing Electron Chute
after watching the ETC video (video+game treatment). See Table 8.
Item 2, in the pretest, 56% of students in the whole class answered this item
correctly. See Table 9. This result suggested that the lessons taught before the treatments
helped half of the class remember that water, carbon dioxide and sunlight were the
reactants or inputs of photosynthesis. Data from the posttest suggested that the video only
treatment did not have an additional effect on reinforcing the reactants of photosynthesis
in the whole class. Playing Electron Chute after watching the video -video+game
treatment- seemed to reinforce the idea that water, carbon dioxide and sunlight were the
reactants of photosynthesis. See Table 8.
Item 3, in the pretest, 57% of students in the whole class answered this item
correctly. See Table 9. This result suggested that the lessons taught before the treatments
helped half of the class remember that carbohydrates and oxygen (O2) were the products
or outputs of photosynthesis. Data from the posttest suggested that the treatments did not
have any additional effect on score gain and, therefore, on reinforcing the products of
photosynthesis in the whole class. The ETC video and the Electron Chute game
reinforced the concept of oxygen (O2) production during the ETC process in
photosynthesis (time lapse in the video between 0:42-0:57 seconds). The data suggested
that for some reason students were not able to relate the production of O2 from the
135
photolysis- or splitting- of water (H2O) molecules in ETC to the O2 production of the
whole photosynthesis process.
The present work did not include a pretest for the lessons about photosynthesis
that were taught to the students before the treatments. Therefore, for items 1 to 3, the
overall score students got in posttest in the whole class might not only be associated to
the lessons (Appendix D & E) before the treatments, but also to their previous
knowledge.
The evidence the researcher had to suggest a positive effect of the lessons on
students’ achievement is that most of the students in the whole class and in both
treatments reported they learned a lot more about photosynthesis (Table 29) during the
lessons previous the treatments. The objective of the lessons was to provide students the
vocabulary and general content knowledge of photosynthesis, inputs and outputs, to be
able to explain the ETC process. ETC is the first phase of photosynthesis and it was the
focus of this research. See Table 13 for the key and distractors analysis per treatment.
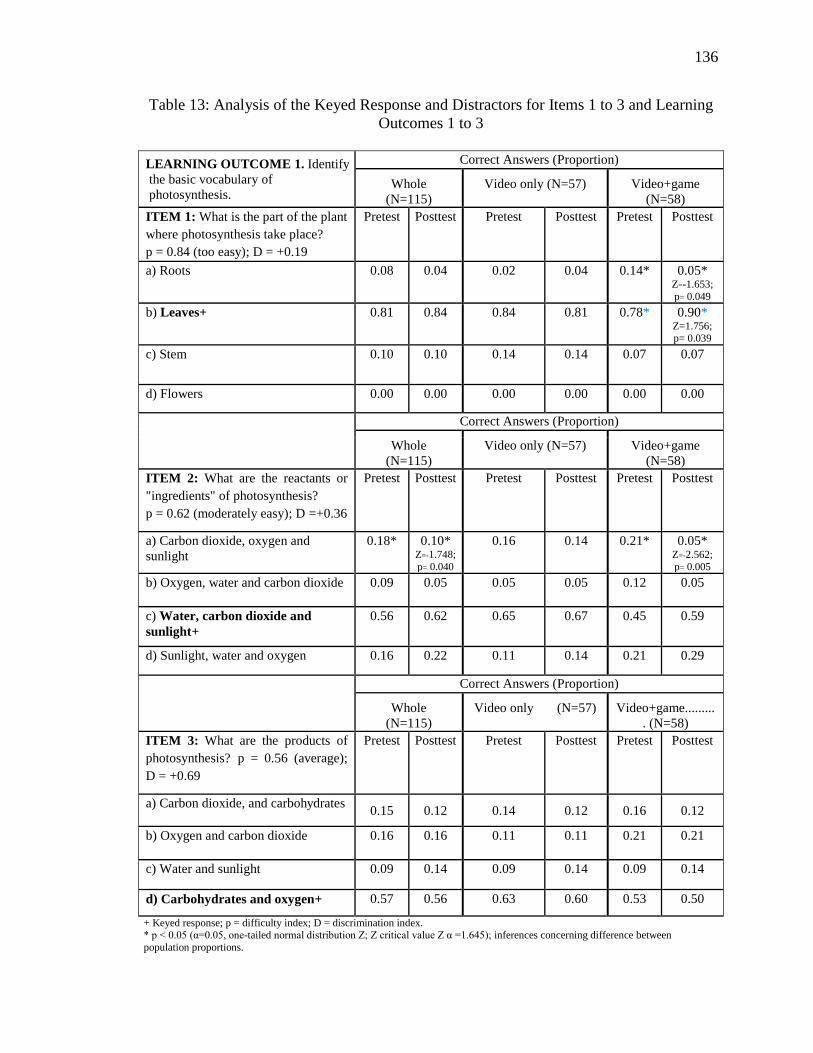
136
Table 13: Analysis of the Keyed Response and Distractors for Items 1 to 3 and Learning
Outcomes 1 to 3
LEARNING OUTCOME 1. Identify
the basic vocabulary of
photosynthesis.
Correct Answers (Proportion)
Whole
(N=115)
Video only (N=57) Video+game
(N=58)
ITEM 1: What is the part of the plant
where photosynthesis take place? p = 0.84 (too easy); D = +0.19
Pretest Posttest Pretest Posttest Pretest Posttest
a) Roots 0.08 0.04 0.02 0.04 0.14* 0.05* Z=-1.653;
p= 0.049
b) Leaves+ 0.81 0.84 0.84 0.81 0.78* 0.90* Z=1.756;
p= 0.039
c) Stem 0.10 0.10 0.14 0.14 0.07 0.07
d) Flowers 0.00 0.00 0.00 0.00 0.00 0.00
Correct Answers (Proportion)
Whole
(N=115)
Video only (N=57) Video+game
(N=58)
ITEM 2: What are the reactants or
"ingredients" of photosynthesis?
p = 0.62 (moderately easy); D =+0.36
Pretest Posttest Pretest Posttest Pretest Posttest
a) Carbon dioxide, oxygen and
sunlight
0.18* 0.10* Z=-1.748;
p= 0.040
0.16 0.14 0.21* 0.05* Z=-2.562;
p= 0.005
b) Oxygen, water and carbon dioxide 0.09 0.05 0.05 0.05 0.12 0.05
c) Water, carbon dioxide and
sunlight+
0.56 0.62 0.65 0.67 0.45 0.59
d) Sunlight, water and oxygen 0.16 0.22 0.11 0.14 0.21 0.29
Correct Answers (Proportion)
Whole
(N=115)
Video only (N=57) Video+game.........
. (N=58)
ITEM 3: What are the products of
photosynthesis? p = 0.56 (average);
D = +0.69
Pretest Posttest Pretest Posttest Pretest Posttest
a) Carbon dioxide, and carbohydrates 0.15 0.12 0.14 0.12 0.16 0.12
b) Oxygen and carbon dioxide 0.16 0.16 0.11 0.11 0.21 0.21
c) Water and sunlight 0.09 0.14 0.09 0.14 0.09 0.14
d) Carbohydrates and oxygen+ 0.57 0.56 0.63 0.60 0.53 0.50
+ Keyed response; p = difficulty index; D = discrimination index. * p < 0.05 α 0.05, one-tailed normal distribution Z Z critical value Z α 1. 45 inferences concerning difference between
population proportions.
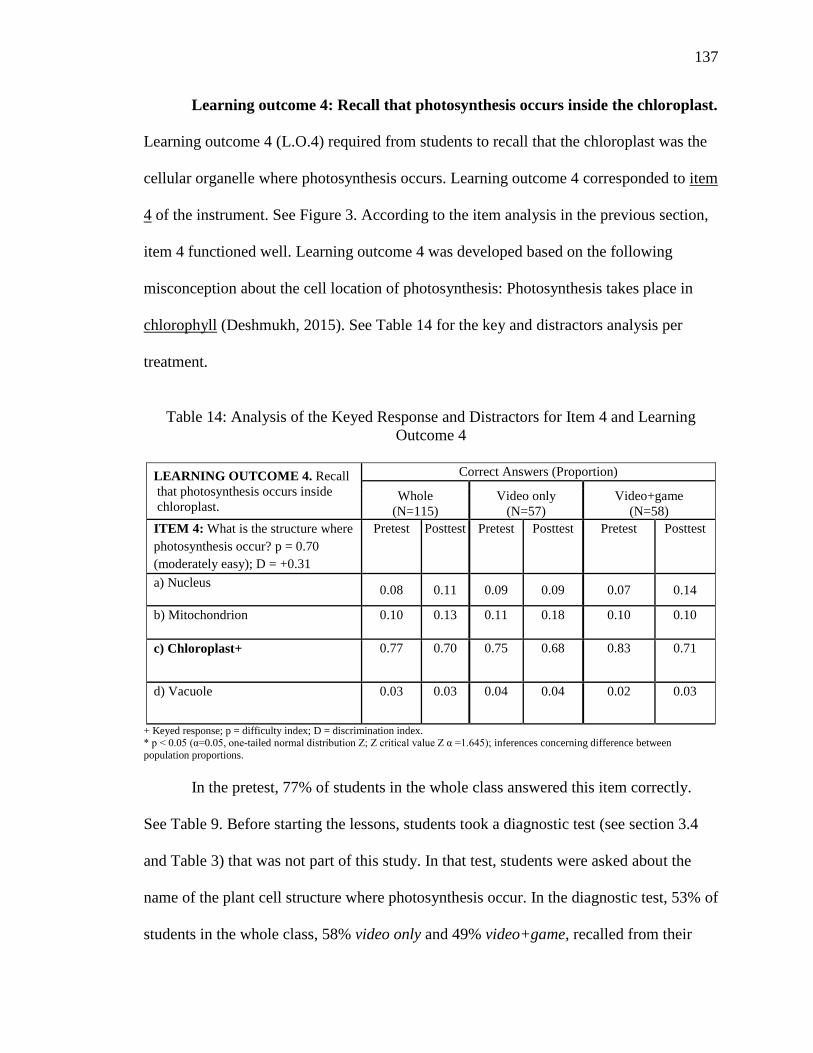
137
Learning outcome 4: Recall that photosynthesis occurs inside the chloroplast.
Learning outcome 4 (L.O.4) required from students to recall that the chloroplast was the
cellular organelle where photosynthesis occurs. Learning outcome 4 corresponded to item
4 of the instrument. See Figure 3. According to the item analysis in the previous section,
item 4 functioned well. Learning outcome 4 was developed based on the following
misconception about the cell location of photosynthesis: Photosynthesis takes place in
chlorophyll (Deshmukh, 2015). See Table 14 for the key and distractors analysis per
treatment.
Table 14: Analysis of the Keyed Response and Distractors for Item 4 and Learning
Outcome 4
LEARNING OUTCOME 4. Recall
that photosynthesis occurs inside
chloroplast.
Correct Answers (Proportion)
Whole
(N=115)
Video only
(N=57)
Video+game
(N=58)
ITEM 4: What is the structure where
photosynthesis occur? p = 0.70
(moderately easy); D = +0.31
Pretest Posttest Pretest Posttest Pretest Posttest
a) Nucleus 0.08 0.11 0.09 0.09 0.07 0.14
b) Mitochondrion 0.10 0.13 0.11 0.18 0.10 0.10
c) Chloroplast+ 0.77 0.70 0.75 0.68 0.83 0.71
d) Vacuole 0.03 0.03 0.04 0.04 0.02 0.03
+ Keyed response; p = difficulty index; D = discrimination index. * p < 0.05 α 0.05, one-tailed normal distribution Z Z critical value Z α 1. 45 inferences concerning difference between
population proportions.
In the pretest, 77% of students in the whole class answered this item correctly.
See Table 9. Before starting the lessons, students took a diagnostic test (see section 3.4
and Table 3) that was not part of this study. In that test, students were asked about the
name of the plant cell structure where photosynthesis occur. In the diagnostic test, 53% of
students in the whole class, 58% video only and 49% video+game, recalled from their
138
previous classes that the chloroplast was the organelle of photosynthesis. The question
was slightly different from the final question in the instrument: What are the plant cell
structures (organelles) where photosynthesis occur?
This additional information suggested that the lessons taught before the treatments
helped an additional number of students in both treatments to reinforce the idea that
chloroplast was the cell structure where photosynthesis occurs. In the posttest, 70% of
students in the whole class recalled that the chloroplast was the organelle of
photosynthesis. Additional score gain was not provided by the treatments. A possible
reason could be that the video and the game strongly reinforced a subunit of the
chloroplast, known as thylakoid. Specifically, the video and the game reinforced the
thylakoid membrane as the physical structure inside the chloroplast where the ETC
process in photosynthesis takes place. See L.O.5 and item 5 below.
Learning outcome 5: Recall that ETC in photosynthesis occurs inside the
chloroplast in a structure known as the thylakoid membrane. Learning outcome 5
(L.O.5) required from students to recall that the ETC process occurs in the thylakoid,
specifically in the membrane that surrounds the structure. Learning outcome 5
corresponded to item 5 of the instrument. See Figure 3. According to the item analysis in
the previous section, item 5 functioned well. See Table 15 for the key and distractors
analysis per treatment.
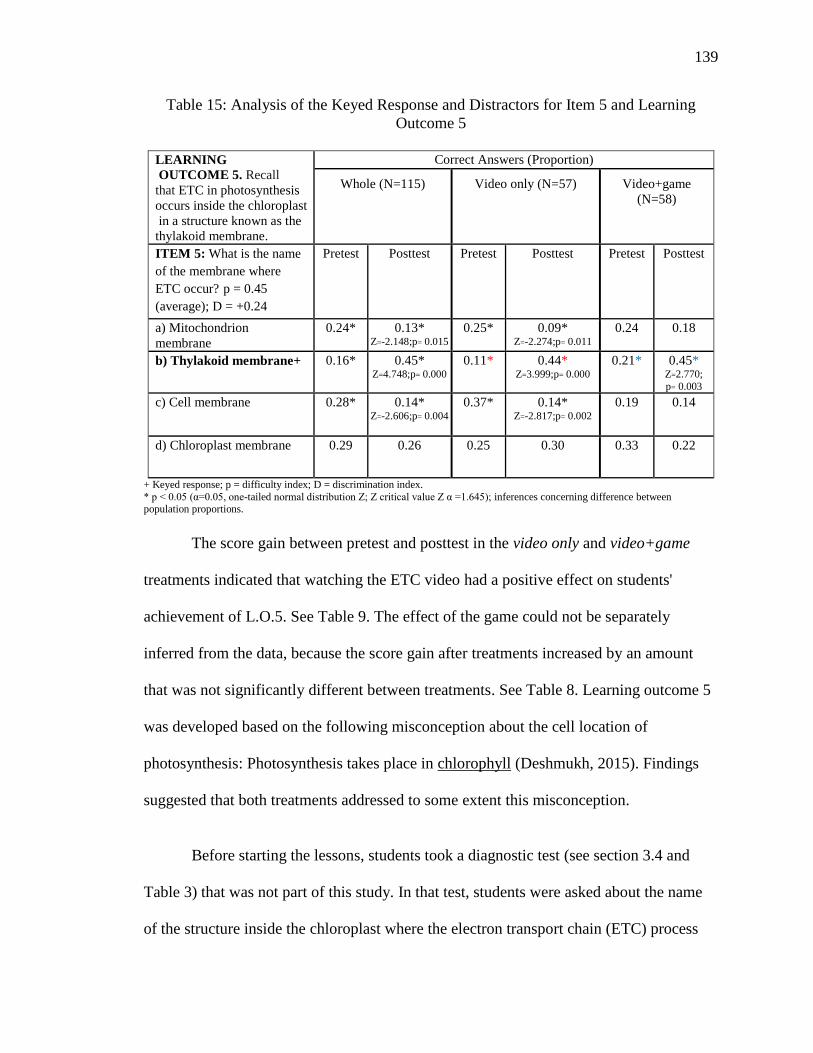
139
Table 15: Analysis of the Keyed Response and Distractors for Item 5 and Learning
Outcome 5
LEARNING
OUTCOME 5. Recall
that ETC in photosynthesis
occurs inside the chloroplast
in a structure known as the
thylakoid membrane.
Correct Answers (Proportion)
Whole (N=115) Video only (N=57) Video+game
(N=58)
ITEM 5: What is the name
of the membrane where
ETC occur? p = 0.45
(average); D = +0.24
Pretest Posttest Pretest Posttest Pretest Posttest
a) Mitochondrion
membrane
0.24* 0.13*
Z=-2.148;p= 0.015 0.25* 0.09*
Z=-2.274;p= 0.011 0.24 0.18
b) Thylakoid membrane+ 0.16* 0.45*
Z=4.748;p= 0.000 0.11* 0.44*
Z=3.999;p= 0.000 0.21* 0.45*
Z=2.770;
p= 0.003
c) Cell membrane 0.28* 0.14* Z=-2.606;p= 0.004
0.37* 0.14*
Z=-2.817;p= 0.002 0.19 0.14
d) Chloroplast membrane 0.29 0.26 0.25 0.30 0.33 0.22
+ Keyed response; p = difficulty index; D = discrimination index.
* p < 0.05 α 0.05, one-tailed normal distribution Z Z critical value Z α 1. 45 inferences concerning difference between population proportions.
The score gain between pretest and posttest in the video only and video+game
treatments indicated that watching the ETC video had a positive effect on students'
achievement of L.O.5. See Table 9. The effect of the game could not be separately
inferred from the data, because the score gain after treatments increased by an amount
that was not significantly different between treatments. See Table 8. Learning outcome 5
was developed based on the following misconception about the cell location of
photosynthesis: Photosynthesis takes place in chlorophyll (Deshmukh, 2015). Findings
suggested that both treatments addressed to some extent this misconception.
Before starting the lessons, students took a diagnostic test (see section 3.4 and
Table 3) that was not part of this study. In that test, students were asked about the name
of the structure inside the chloroplast where the electron transport chain (ETC) process
140
occurred. In the diagnostic test, 10% of students in the whole class,11% video only and
9% video+game, were familiar with the thylakoid. This percentage (10%) was not
significantly different from the pretest (16%), but it was significantly different from the
posttest (45%) suggesting a positive effect on students' achievement of L.O.5 after
treatments. See Table 9. The concept of thylakoid membrane was not introduced to the
students before the treatments. This additional information supported the results obtained
after the treatments. Data suggested that both treatments helped students learn a new
structure -the thylakoid membrane- and remember that the ETC process in photosynthesis
takes place there.
The focus of the content for the question in the diagnostic test and in the pretest
was the same. The diagnostic question was: What is the name of the membrane-bound
compartment where the light-dependant reaction of photosynthesis occur? The light-
dependent reaction refers to the electron transport chain process which requires light
energy to occur. The question in the diagnostic test provided more information to help
students relate the curricular concept of "light-dependent reaction" to the new concept of
"electron transport chain (ETC)." The assumption was that the students had learned about
the curricular concept of "light-dependent reaction" previously but not under the name of
ETC. The question aimed to determine if students were familiar with the inner
chloroplast structure known as thylakoid membrane. Also, to determine if they related the
thylakoid membrane as the place where ETC or "light-dependent reaction" occurred in
photosynthesis.
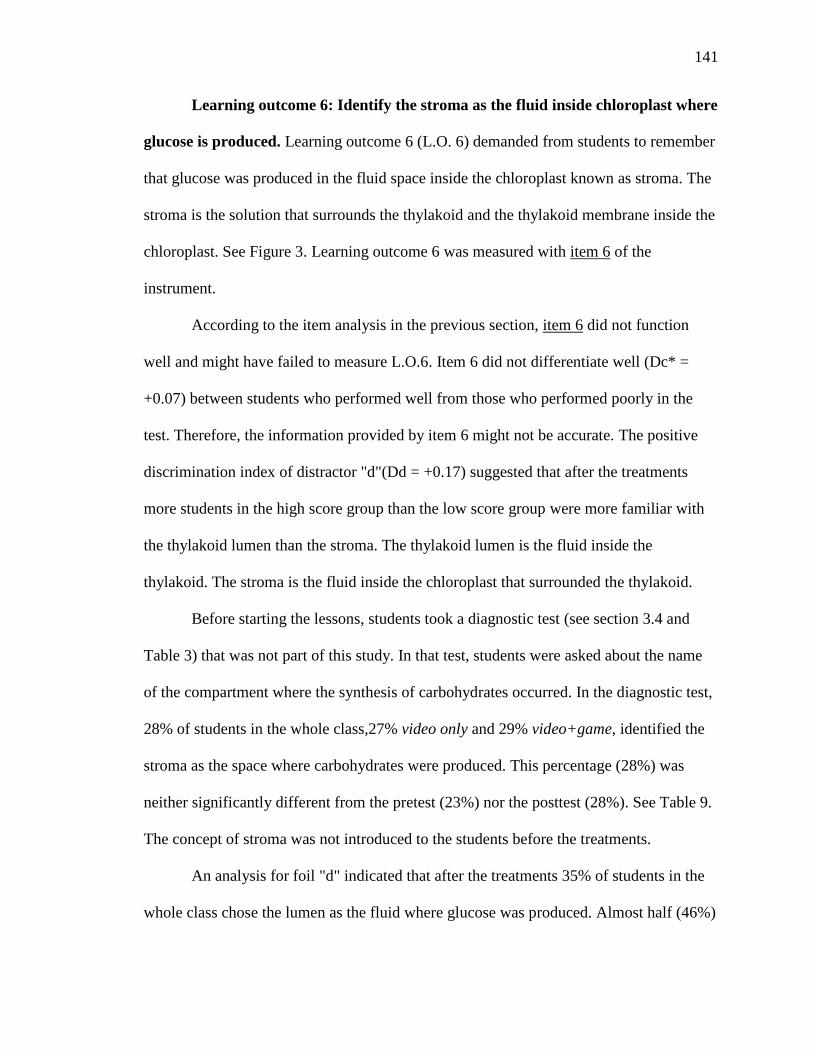
141
Learning outcome 6: Identify the stroma as the fluid inside chloroplast where
glucose is produced. Learning outcome 6 (L.O. 6) demanded from students to remember
that glucose was produced in the fluid space inside the chloroplast known as stroma. The
stroma is the solution that surrounds the thylakoid and the thylakoid membrane inside the
chloroplast. See Figure 3. Learning outcome 6 was measured with item 6 of the
instrument.
According to the item analysis in the previous section, item 6 did not function
well and might have failed to measure L.O.6. Item 6 did not differentiate well (Dc* =
+0.07) between students who performed well from those who performed poorly in the
test. Therefore, the information provided by item 6 might not be accurate. The positive
discrimination index of distractor "d"(Dd = +0.17) suggested that after the treatments
more students in the high score group than the low score group were more familiar with
the thylakoid lumen than the stroma. The thylakoid lumen is the fluid inside the
thylakoid. The stroma is the fluid inside the chloroplast that surrounded the thylakoid.
Before starting the lessons, students took a diagnostic test (see section 3.4 and
Table 3) that was not part of this study. In that test, students were asked about the name
of the compartment where the synthesis of carbohydrates occurred. In the diagnostic test,
28% of students in the whole class,27% video only and 29% video+game, identified the
stroma as the space where carbohydrates were produced. This percentage (28%) was
neither significantly different from the pretest (23%) nor the posttest (28%). See Table 9.
The concept of stroma was not introduced to the students before the treatments.
An analysis for foil "d" indicated that after the treatments 35% of students in the
whole class chose the lumen as the fluid where glucose was produced. Almost half (46%)
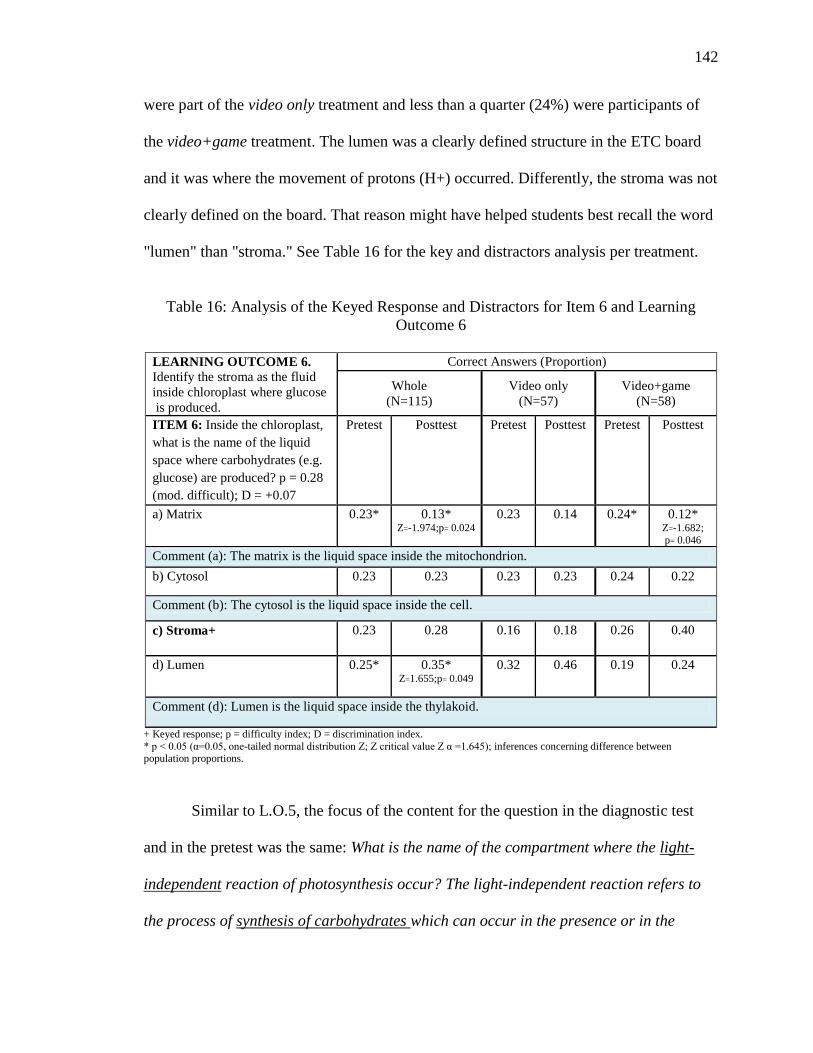
142
were part of the video only treatment and less than a quarter (24%) were participants of
the video+game treatment. The lumen was a clearly defined structure in the ETC board
and it was where the movement of protons (H+) occurred. Differently, the stroma was not
clearly defined on the board. That reason might have helped students best recall the word
"lumen" than "stroma." See Table 16 for the key and distractors analysis per treatment.
Table 16: Analysis of the Keyed Response and Distractors for Item 6 and Learning
Outcome 6
LEARNING OUTCOME 6. Identify the stroma as the fluid
inside chloroplast where glucose
is produced.
Correct Answers (Proportion)
Whole
(N=115)
Video only
(N=57)
Video+game
(N=58)
ITEM 6: Inside the chloroplast,
what is the name of the liquid
space where carbohydrates (e.g.
glucose) are produced? p = 0.28
(mod. difficult); D = +0.07
Pretest Posttest Pretest Posttest Pretest Posttest
a) Matrix 0.23* 0.13*
Z=-1.974;p= 0.024 0.23 0.14 0.24* 0.12*
Z=-1.682;
p= 0.046
Comment (a): The matrix is the liquid space inside the mitochondrion.
b) Cytosol 0.23 0.23 0.23 0.23 0.24 0.22
Comment (b): The cytosol is the liquid space inside the cell.
c) Stroma+ 0.23 0.28 0.16 0.18 0.26 0.40
d) Lumen 0.25* 0.35*
Z=1.655;p= 0.049 0.32 0.46 0.19 0.24
Comment (d): Lumen is the liquid space inside the thylakoid.
+ Keyed response; p = difficulty index; D = discrimination index.
* p < 0.05 α 0.05, one-tailed normal distribution Z Z critical value Z α 1. 45 inferences concerning difference between population proportions.
Similar to L.O.5, the focus of the content for the question in the diagnostic test
and in the pretest was the same: What is the name of the compartment where the light-
independent reaction of photosynthesis occur? The light-independent reaction refers to
the process of synthesis of carbohydrates which can occur in the presence or in the
143
absence of light. The question in the diagnostic test provided more information to help
students relate the curricular concept of "light-independent reactions" to the concept of
"synthesis of carbohydrates." The question searched if students recalled that the stroma
was the place inside the chloroplast where one of the products of photosynthesis -the
carbohydrates- were produced.
Learning outcome 7: Recall that chlorophyll molecules in Photosystem I
(PSI) and Photosystem II (PSII) capture sunlight energy. Learning outcome 7 (L.O.7)
required from students to remember that the ETC process started when the sunlight
energy was captured by chlorophyll molecules. Once activated, ETC behaves as a
cyclical phenomena between PSII and PSI, however, ETC requires sunlight energy to be
activated. Therefore, in this research, the activation of ETC by sunlight energy is defined
as the starting point of ETC. See Figure 6. Also, see positions 1 and 4 on the board of the
Electron Chute game -Figure 5- for reference. Learning outcome 7 corresponded to item
7 of the instrument. According the item analysis in the previous section, item 7
functioned well. See Table 17 for the key and distractors analysis per treatment.
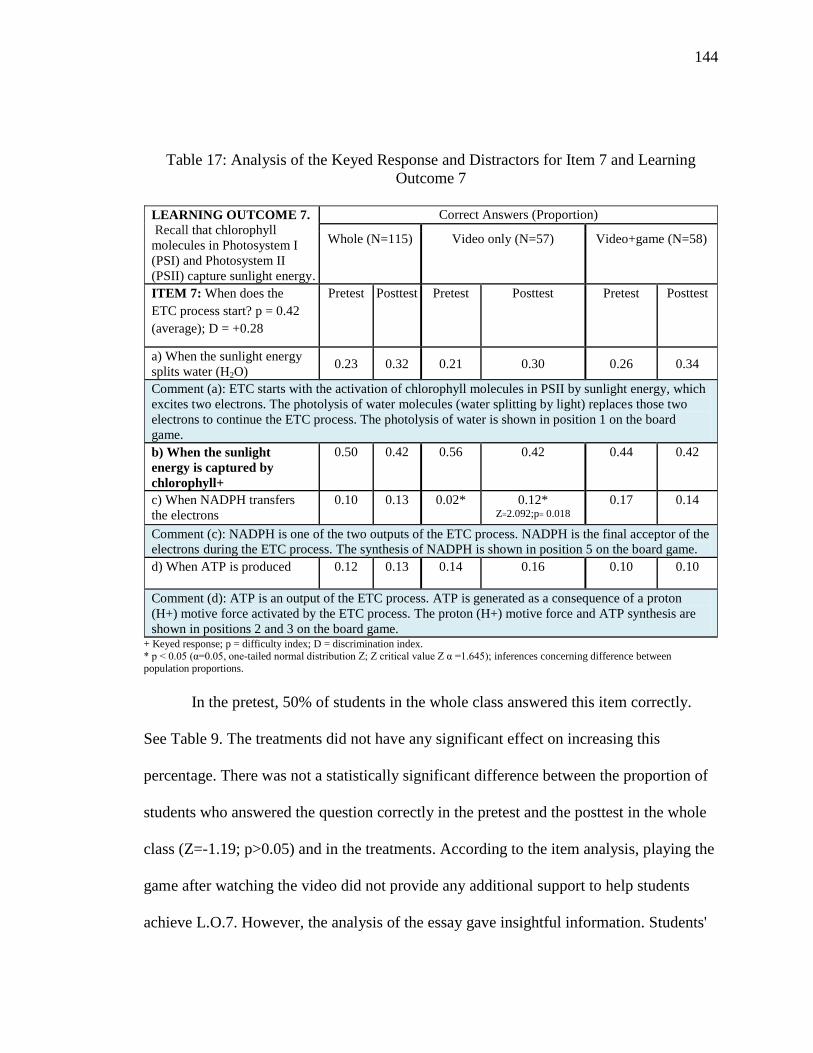
144
Table 17: Analysis of the Keyed Response and Distractors for Item 7 and Learning
Outcome 7
LEARNING OUTCOME 7.
Recall that chlorophyll
molecules in Photosystem I
(PSI) and Photosystem II
(PSII) capture sunlight energy.
Correct Answers (Proportion)
Whole (N=115) Video only (N=57) Video+game (N=58)
ITEM 7: When does the
ETC process start? p = 0.42
(average); D = +0.28
Pretest Posttest Pretest Posttest Pretest Posttest
a) When the sunlight energy
splits water (H2O) 0.23 0.32 0.21 0.30 0.26 0.34
Comment (a): ETC starts with the activation of chlorophyll molecules in PSII by sunlight energy, which
excites two electrons. The photolysis of water molecules (water splitting by light) replaces those two
electrons to continue the ETC process. The photolysis of water is shown in position 1 on the board
game.
b) When the sunlight
energy is captured by
chlorophyll+
0.50 0.42 0.56 0.42 0.44 0.42
c) When NADPH transfers
the electrons
0.10 0.13 0.02* 0.12*
Z=2.092;p= 0.018 0.17 0.14
Comment (c): NADPH is one of the two outputs of the ETC process. NADPH is the final acceptor of the
electrons during the ETC process. The synthesis of NADPH is shown in position 5 on the board game.
d) When ATP is produced 0.12 0.13 0.14 0.16 0.10 0.10
Comment (d): ATP is an output of the ETC process. ATP is generated as a consequence of a proton
(H+) motive force activated by the ETC process. The proton (H+) motive force and ATP synthesis are
shown in positions 2 and 3 on the board game. + Keyed response; p = difficulty index; D = discrimination index.
* p < 0.05 α 0.05, one-tailed normal distribution Z Z critical value Z α 1. 45 inferences concerning difference between
population proportions.
In the pretest, 50% of students in the whole class answered this item correctly.
See Table 9. The treatments did not have any significant effect on increasing this
percentage. There was not a statistically significant difference between the proportion of
students who answered the question correctly in the pretest and the posttest in the whole
class (Z=-1.19; p>0.05) and in the treatments. According to the item analysis, playing the
game after watching the video did not provide any additional support to help students
achieve L.O.7. However, the analysis of the essay gave insightful information. Students'
145
interpretation of the essay for Learning outcome 7 (See L.O.7-Table 11) showed that
after treatments almost three quarters (67%) of students in the whole class could explain
that ETC started when sunlight energy was captured. However, only a third (37%) of the
whole class identified chlorophyll as the molecule that captures the light energy from the
sun. For both statements, playing Electron Chute after watching the video -video+game
treatment- had a statistically significant effect on students' ability to explain the events
that trigger ETC. See Table 12 -1a & 1b. Positive results were also observed in regard to
the light absorption by chlorophyll molecules in PSI. See Table 12 -9a & 9b.
Three quarters (74%) of the group of students who played the game were able to
correctly interpret the ETC model provided in the test. See Table 11. They were able to
identify the absorption of sunlight energy as the phenomenon that started ETC. However,
only 43% of these students were able to name chlorophyll as the molecules responsible of
absorbing the energy to activate ETC. Most of the remaining students left the space in
blank.
In the item analysis, one reason why more than 30 % of students selected foil "a"
instead of foil "b" could be related to the narrative of the video associated to the image
that shows the starting point of ETC. The narrative said "Let’s see how the electron
transport chain works" instead of "Let’s see how the electron transport chain starts." See
the video narrative and link to the video in Appendix A (time lapse in the video between
2:55-2:59 minutes).
Another reason could be associated to the Electron Chute game. The game started
when players have the three essential elements in position 1 on the board: light,
chlorophyll and water. Once they have these elements, they earn a two-electrons card that
146
they lay down on position 1 (PSII). In other words, on the board game it might be unclear
which event occurred first: (1) The activation of chlorophyll molecules by sunlight
energy -the light excites two electrons from chlorophyll to start ETC; or (2) The
photolysis -water splitting by light- of water molecules that produces two electrons.
These two electrons replace the two electrons lost by PSII to continue the ETC process.
Having these two events together on position 1 (PSII) on the board game might have
been ineffective as an aid to help students comprehend that the photolysis of water is a
consequence of the activation of chlorophyll molecules in PSII by sunlight energy.
Learning outcome 7 (L.O.7) was developed based on the following misconception
focused on the role of chlorophyll molecules in photosynthesis: Chlorophyll is produced
in photosynthesis (Marmaroti & Galanopoulou,2006) instead of being the molecules that
capture the sunlight energy in ETC. Findings suggested that asking students to write a
narrative about ETC after playing the game was more effective on addressing this
misconception than selecting a foil from an item. Playing the game helped students
remember the role of chlorophyll in photosynthesis and, therefore, the game can be
helpful to address a common misconception described in the literature.
Learning outcome 8: Recall that the ATP production is a consequence of a
proton motive force which is activated by the flow of electrons from PSII to the
proton pump protein. Learning outcome 8 (L.O.8) required from students to remember
that the ATP production involved a gradient of proton (H+) through the thylakoid
membrane. See Figure 7. Also, see positions 2 and 3 on the board of the Electron Chute
game-Figure 5- for reference. Learning outcome 8 corresponded to item 8 of the
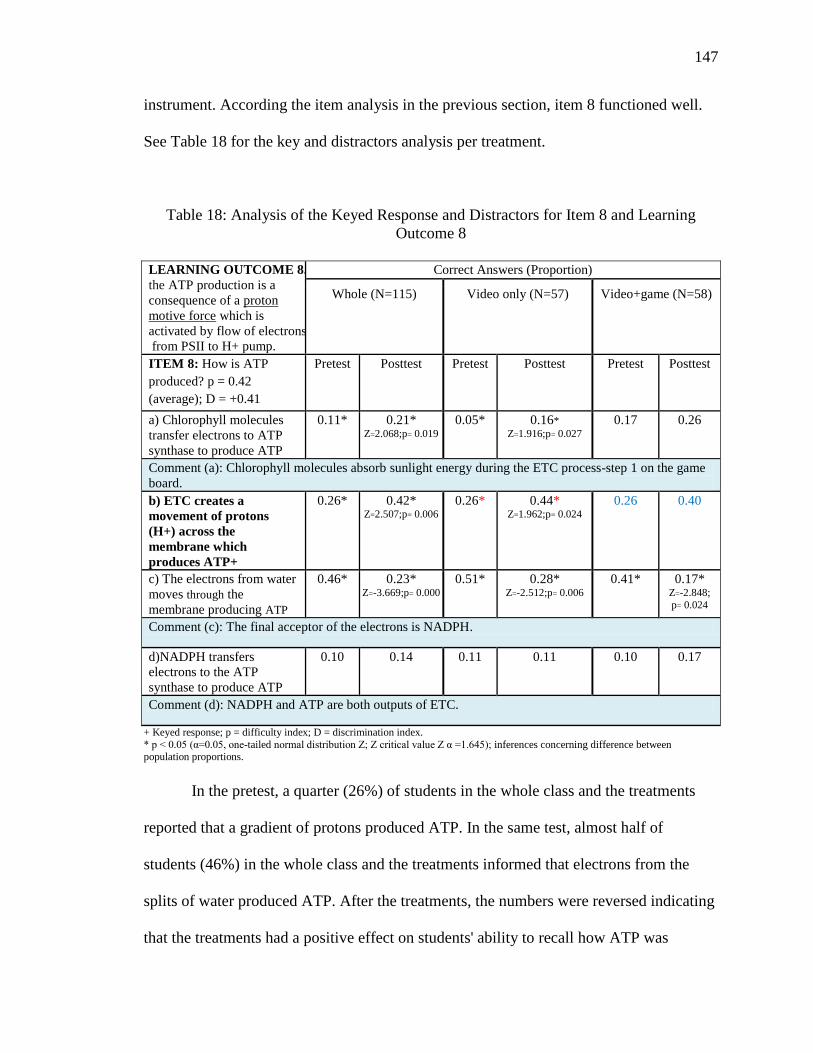
147
instrument. According the item analysis in the previous section, item 8 functioned well.
See Table 18 for the key and distractors analysis per treatment.
Table 18: Analysis of the Keyed Response and Distractors for Item 8 and Learning
Outcome 8
LEARNING OUTCOME 8. Recall that
the ATP production is a
consequence of a proton
motive force which is
activated by flow of electrons
from PSII to H+ pump.
Correct Answers (Proportion)
Whole (N=115) Video only (N=57) Video+game (N=58)
ITEM 8: How is ATP
produced? p = 0.42
(average); D = +0.41
Pretest Posttest Pretest Posttest Pretest Posttest
a) Chlorophyll molecules
transfer electrons to ATP
synthase to produce ATP
0.11* 0.21* Z=2.068;p= 0.019
0.05* 0.16*
Z=1.916;p= 0.027 0.17 0.26
Comment (a): Chlorophyll molecules absorb sunlight energy during the ETC process-step 1 on the game
board.
b) ETC creates a
movement of protons
(H+) across the
membrane which
produces ATP+
0.26* 0.42* Z=2.507;p= 0.006
0.26* 0.44*
Z=1.962;p= 0.024 0.26 0.40
c) The electrons from water
moves through the
membrane producing ATP
0.46* 0.23* Z=-3.669;p= 0.000
0.51* 0.28*
Z=-2.512;p= 0.006 0.41* 0.17*
Z=-2.848;
p= 0.024
Comment (c): The final acceptor of the electrons is NADPH.
d)NADPH transfers
electrons to the ATP
synthase to produce ATP
0.10 0.14 0.11 0.11 0.10 0.17
Comment (d): NADPH and ATP are both outputs of ETC.
+ Keyed response; p = difficulty index; D = discrimination index.
* p < 0.05 α 0.05, one-tailed normal distribution Z Z critical value Z α 1. 45 inferences concerning difference between population proportions.
In the pretest, a quarter (26%) of students in the whole class and the treatments
reported that a gradient of protons produced ATP. In the same test, almost half of
students (46%) in the whole class and the treatments informed that electrons from the
splits of water produced ATP. After the treatments, the numbers were reversed indicating
that the treatments had a positive effect on students' ability to recall how ATP was
148
produced. Learning outcome 8 was developed based on the following misconception
about the ATP production: The ATP production is the end point of photosynthesis
(Parker et al., 2012) instead of being an output of ETC. ATP is produced by a movement
of protons and it is used for the synthesis of carbohydrates.
The essay gave students the chance to explain the sequential events involved in
the ATP production. Students' interpretation of the ETC representation indicated that the
treatments had a positive impact on their ability to explain how ATP was produced. First,
more than half (55%) of students in the whole class were able to state the step following
to the absorption of sunlight. This step was that "two electrons move" from position 1
(PSII) to the next molecule. See Table 11-2a. The difference between treatments was
large. Almost three quarters (69%) of the students who played Electron Chute after
watching the video were able to identify the movement of two electrons from one step to
the following step in ETC. Differently, less than half (40%) of the students who watched
the video only were able to identify the same idea. After the treatments, few students
were able to identify the "proton pump" as the protein activated by the movement of the
two electrons lost by PSII. However, more than half (55%) of the students who played
the game indicated that there was a "movement of protons to the lumen." See Table 11-
3a. Also, 41% of students who played the game noticed that the movement of protons
(H+) to the lumen was done through a proton pump. See Table 11-3b. Then, a third
(33%) of the students who played the game stated that the protons (H+) move back to the
stroma through the ATP synthase. Three quarters (74%) of the students in the
video+game and almost a half (42%) of the students in the video only narrated that ATP
was produced ATP at that point. See Table 11-5b.
149
Learning outcome 9: Understand that the ETC process in photosynthesis is
the transformation of sunlight energy into chemical energy (ATP). Learning outcome
9 (L.O.9) summarized the ETC process and evaluated the students' ability to interpret the
process beyond only remembering the vocabulary of the process. According to the item
analysis in the previous section, the content of item 9 was relevant for the evaluation of
the treatments but there was a problem with distractor "d." Distractor "d" referred to a
step in the ETC process, but it was not the best definition of the whole process.
The data in Table 8 suggested a negative impact of treatments on students' ability
to achieve learning outcome 9. However, the data also suggested that item 9 failed to
measure this learning outcome. Considering that distractor "d" should have been
modified to infer conclusions regarding L.O.9, the data suggested that the treatments
helped students to relate ETC to a movement of protons (H+) through a membrane. Data
from distractor "d" showed a positive result in regard to this point. A third (36%) of the
whole class related the ETC process to the concept of proton movement (H+). The flow
of proton (H+) through the thylakoid membrane is a step of ETC involved in the ATP
production. See Table 19 for the key and distractors analysis per treatment.
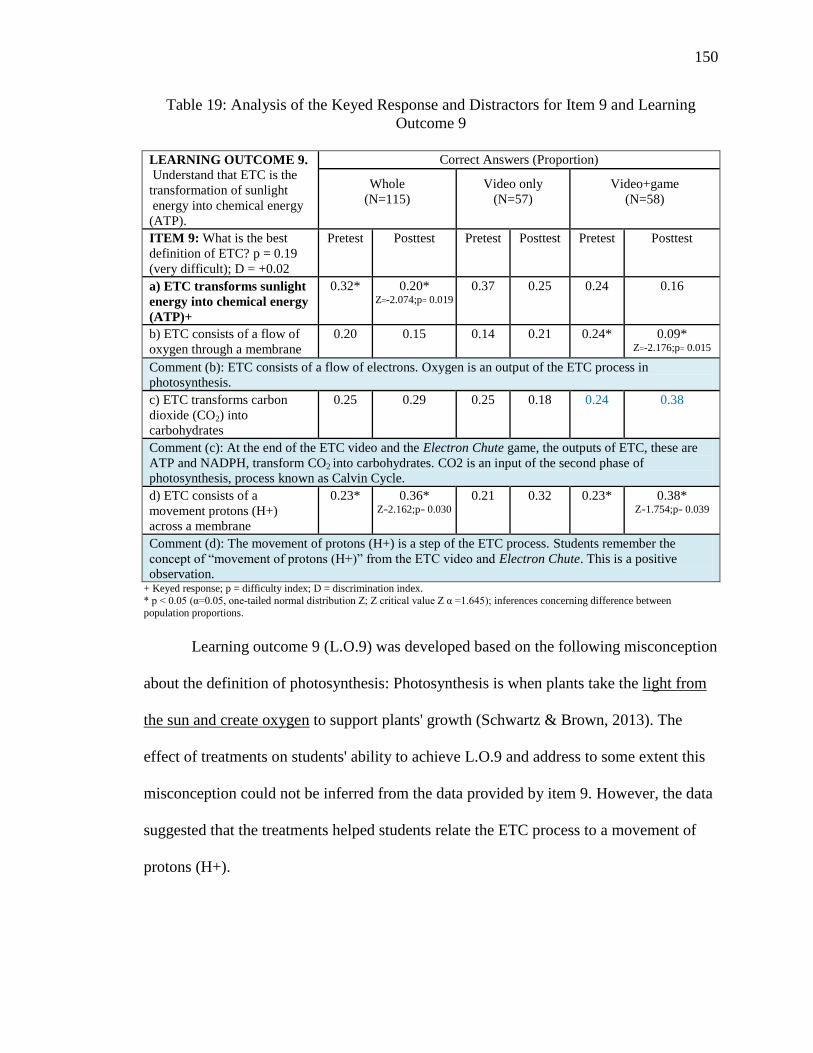
150
Table 19: Analysis of the Keyed Response and Distractors for Item 9 and Learning
Outcome 9
LEARNING OUTCOME 9.
Understand that ETC is the
transformation of sunlight
energy into chemical energy
(ATP).
Correct Answers (Proportion)
Whole
(N=115)
Video only
(N=57)
Video+game
(N=58)
ITEM 9: What is the best
definition of ETC? p = 0.19
(very difficult); D = +0.02
Pretest Posttest Pretest Posttest Pretest Posttest
a) ETC transforms sunlight
energy into chemical energy
(ATP)+
0.32* 0.20* Z=-2.074;p= 0.019
0.37 0.25 0.24 0.16
b) ETC consists of a flow of
oxygen through a membrane
0.20 0.15 0.14 0.21 0.24* 0.09*
Z=-2.176;p= 0.015
Comment (b): ETC consists of a flow of electrons. Oxygen is an output of the ETC process in
photosynthesis.
c) ETC transforms carbon
dioxide (CO2) into
carbohydrates
0.25 0.29 0.25 0.18 0.24 0.38
Comment (c): At the end of the ETC video and the Electron Chute game, the outputs of ETC, these are
ATP and NADPH, transform CO2 into carbohydrates. CO2 is an input of the second phase of
photosynthesis, process known as Calvin Cycle.
d) ETC consists of a
movement protons (H+)
across a membrane
0.23* 0.36* Z=2.162;p= 0.030
0.21 0.32 0.23* 0.38* Z=1.754;p= 0.039
Comment (d): The movement of protons (H+) is a step of the ETC process. Students remember the
concept of “movement of protons H+ ” from the ETC video and Electron Chute. This is a positive
observation. + Keyed response; p = difficulty index; D = discrimination index.
* p < 0.05 α 0.05, one-tailed normal distribution Z Z critical value Z α 1. 45 inferences concerning difference between
population proportions.
Learning outcome 9 (L.O.9) was developed based on the following misconception
about the definition of photosynthesis: Photosynthesis is when plants take the light from
the sun and create oxygen to support plants' growth (Schwartz & Brown, 2013). The
effect of treatments on students' ability to achieve L.O.9 and address to some extent this
misconception could not be inferred from the data provided by item 9. However, the data
suggested that the treatments helped students relate the ETC process to a movement of
protons (H+).
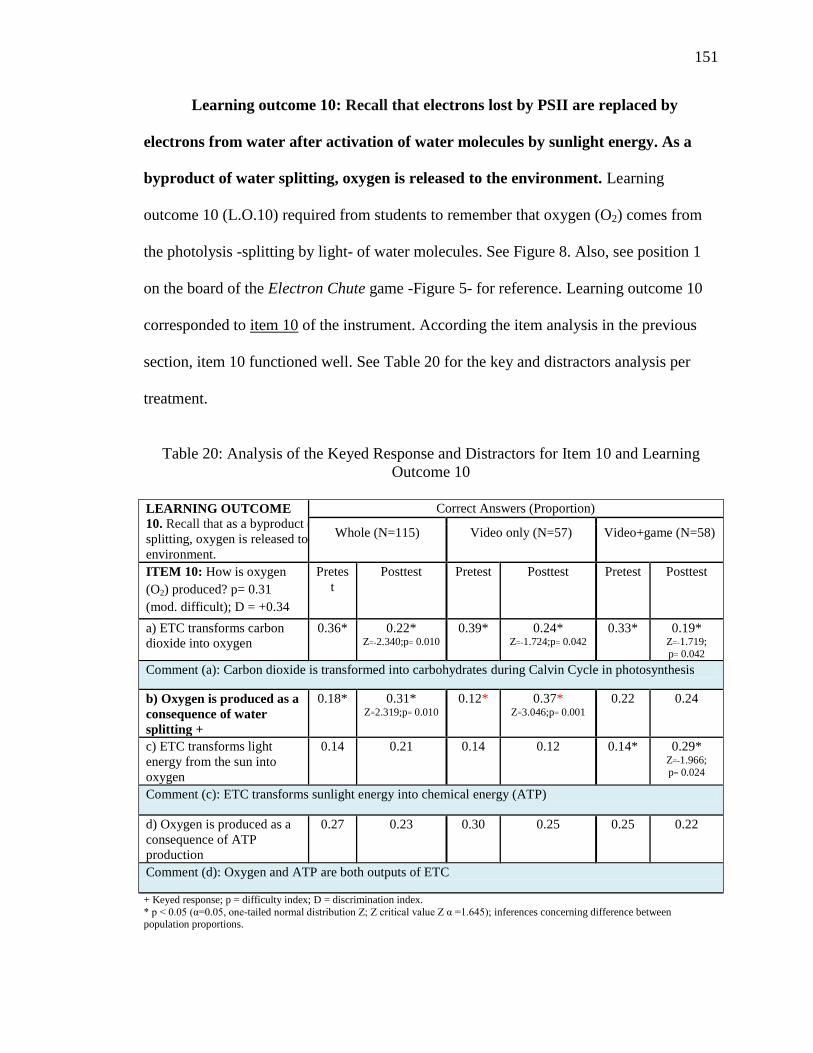
151
Learning outcome 10: Recall that electrons lost by PSII are replaced by
electrons from water after activation of water molecules by sunlight energy. As a
byproduct of water splitting, oxygen is released to the environment. Learning
outcome 10 (L.O.10) required from students to remember that oxygen (O2) comes from
the photolysis -splitting by light- of water molecules. See Figure 8. Also, see position 1
on the board of the Electron Chute game -Figure 5- for reference. Learning outcome 10
corresponded to item 10 of the instrument. According the item analysis in the previous
section, item 10 functioned well. See Table 20 for the key and distractors analysis per
treatment.
Table 20: Analysis of the Keyed Response and Distractors for Item 10 and Learning
Outcome 10
LEARNING OUTCOME
10. Recall that as a byproduct of water
splitting, oxygen is released to the
environment.
Correct Answers (Proportion)
Whole (N=115) Video only (N=57) Video+game (N=58)
ITEM 10: How is oxygen
(O2) produced? p= 0.31
(mod. difficult); D = +0.34
Pretes
t
Posttest Pretest Posttest Pretest Posttest
a) ETC transforms carbon
dioxide into oxygen
0.36* 0.22*
Z=-2.340;p= 0.010 0.39* 0.24*
Z=-1.724;p= 0.042 0.33* 0.19*
Z=-1.719;
p= 0.042
Comment (a): Carbon dioxide is transformed into carbohydrates during Calvin Cycle in photosynthesis
b) Oxygen is produced as a
consequence of water
splitting +
0.18* 0.31*
Z=2.319;p= 0.010 0.12* 0.37*
Z=3.046;p= 0.001 0.22 0.24
c) ETC transforms light
energy from the sun into
oxygen
0.14 0.21 0.14 0.12 0.14* 0.29*
Z=-1.966;
p= 0.024
Comment (c): ETC transforms sunlight energy into chemical energy (ATP)
d) Oxygen is produced as a
consequence of ATP
production
0.27 0.23 0.30 0.25 0.25 0.22
Comment (d): Oxygen and ATP are both outputs of ETC
+ Keyed response; p = difficulty index; D = discrimination index.
* p < 0.05 α 0.05, one-tailed normal distribution Z Z critical value Z α 1. 45 inferences concerning difference between population proportions.
152
In the pretest, only 18% of students in the whole class answered this item
correctly. See Table 9. However, after the treatments almost a third (31%) of the whole
class recalled that oxygen (O2) comes from the split of water molecules. There was a
statistically significant difference between the proportion of students who answered the
question correctly in the pretest and the posttest in the whole class (Z=2.32; p<0.05) and
in the video only treatment (Z=3.046; p<0.05).
Data suggested that the video helped a third (37%) of the class to remember that
the splits of water produces oxygen. Differently, playing the Electron Chute game after
watching the video seemed to have no evident effect in helping students achieve L.O.10.
See Table 8. However, the analysis of the essay clearly showed that both treatments had a
positive effect on students' ability to remember that oxygen was produced in ETC and
released to the environment. Half (50%) of the students who watched the video and the
majority (85%) of the students who played the game after watching the video wrote down
that oxygen was produced and released to the air. See Table 11-8a & 8b. Also, the essay
analysis indicated that around a third of the students who played the game wrote down
"water splitting" and "oxygen is produced" at that point. This result suggests students
connected the idea of oxygen coming from water splitting. See Table 11-6b &7.
In the item analysis, almost a third (29%) of the students who played the Electron
Chute game after watching the video selected foil "c" as correct answer: "ETC transforms
light energy from the sun into oxygen." An explanation could be similar to what happened
for L.O.7. The game started when players had the three essential elements on position 1
on the board: light, chlorophyll and water. Once they have these elements, players earn
an oxygen card in addition to the two-electrons they lay down on position 1 on the board.
153
Having the light and the oxygen cards simultaneously on the same position -position 1-
might make students think that ETC transformed sunlight into oxygen.
In the pretest, 36% of students in the whole class, 39% video only and 33%
video+game- selected foil "a" as correct answer: "ETC transforms carbon dioxide into
oxygen." After the treatments, there was a statistically significant difference between the
proportion of students who selected foil "a" in the pretest and the posttest in the whole
class and in the treatments. Therefore, the treatments helped students to correct a
misconception some of them seemed to hold: "ETC transforms CO2 into O2."
Learning outcome 10 (L.O.10) was developed based on the following
misconceptions about oxygen production in photosynthesis: Plants transform carbon
dioxide into oxygen (Flores, Tovar & Gallegos, 2003). Data suggested that the treatments
helped students to some extent remediate the common misconception that plants
transform carbon dioxide into oxygen. However, the data suggested a potential risk of the
design of position 1 on the board in introducing a misconception, oxygen comes from
sunlight energy. For those students who selected this option after playing the game was
unclear what chemical reactions were occurring in PSII (position 1). To avoid a
misconception, position 1 on the board game should be divided in two sequential parts:
(1) light absorption by chlorophyll; (2) photolysis of water. It is during the second part
that oxygen is produced during ETC.
Learning outcome 11: Recall that electrons are transported from PSI
through proteins in the membrane to the final acceptor of the electrons, a metabolic
molecule known as NADPH. Learning outcome 11 (L.O.11) referred to one step of ETC
-position 5 on the board of the Electron Chute game. See Figure 5. It was also illustrated
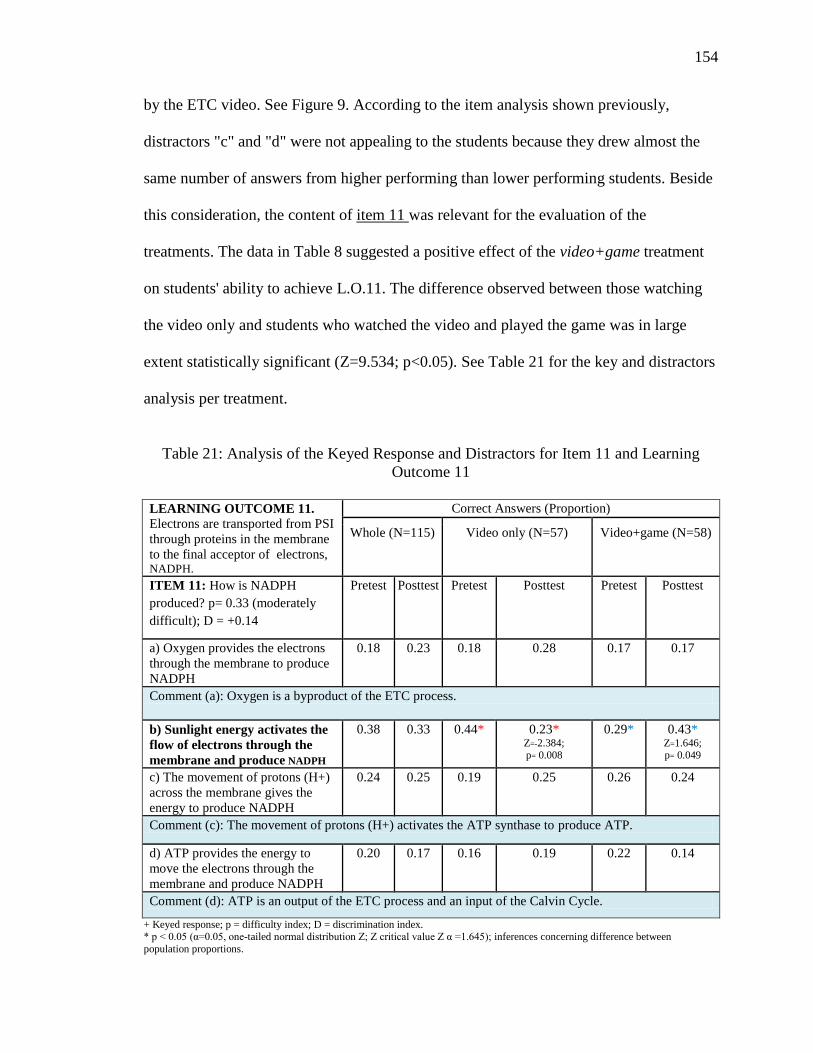
154
by the ETC video. See Figure 9. According to the item analysis shown previously,
distractors "c" and "d" were not appealing to the students because they drew almost the
same number of answers from higher performing than lower performing students. Beside
this consideration, the content of item 11 was relevant for the evaluation of the
treatments. The data in Table 8 suggested a positive effect of the video+game treatment
on students' ability to achieve L.O.11. The difference observed between those watching
the video only and students who watched the video and played the game was in large
extent statistically significant (Z=9.534; p<0.05). See Table 21 for the key and distractors
analysis per treatment.
Table 21: Analysis of the Keyed Response and Distractors for Item 11 and Learning
Outcome 11
LEARNING OUTCOME 11. Electrons are transported from PSI
through proteins in the membrane
to the final acceptor of electrons, NADPH.
Correct Answers (Proportion)
Whole (N=115) Video only (N=57) Video+game (N=58)
ITEM 11: How is NADPH
produced? p= 0.33 (moderately
difficult); D = +0.14
Pretest Posttest Pretest Posttest Pretest Posttest
a) Oxygen provides the electrons
through the membrane to produce
NADPH
0.18 0.23 0.18 0.28 0.17 0.17
Comment (a): Oxygen is a byproduct of the ETC process.
b) Sunlight energy activates the
flow of electrons through the
membrane and produce NADPH
0.38 0.33 0.44* 0.23* Z=-2.384; p= 0.008
0.29* 0.43* Z=1.646; p= 0.049
c) The movement of protons (H+)
across the membrane gives the
energy to produce NADPH
0.24 0.25 0.19 0.25 0.26 0.24
Comment (c): The movement of protons (H+) activates the ATP synthase to produce ATP.
d) ATP provides the energy to
move the electrons through the
membrane and produce NADPH
0.20 0.17 0.16 0.19 0.22 0.14
Comment (d): ATP is an output of the ETC process and an input of the Calvin Cycle.
+ Keyed response; p = difficulty index; D = discrimination index. * p < 0.05 α 0.05, one-tailed normal distribution Z Z critical value Z α 1. 45 inferences concerning difference between
population proportions.
155
Likewise, the analysis of the essay showed that the video+game treatment had a
positive effect on students' ability to achieve L.O.11. See Table 11. Almost half (47%) of
the students who played the game after watching the video were able to identify that
sunlight was captured. Almost a third (29%) of those who played the game identified
chlorophyll as the molecule that captured the light. See Table 11-9a & 9b. After the
video+game treatment, more than half (55%) of the students were able to identify from
the ETC representation a key concept from ETC: "two electrons from PSI." In addition, a
third (33%) of the students who played the game were able to articulate that those two
electrons from PSI moved to the next part in the membrane. See Table 11-10a & 10b.
After the video+game treatment, the majority (69%) of the students wrote down
that NADPH was produced at that point. Also, a third (32%) of the students who watched
the video only were able to identify NADPH as a product. Table 11-11a. The treatments
were not effective in helping students to identify the stroma as the solution where
NADPH was produced. See Table 11-11b. This might be related to the results observed
for L.O.6 that indicated that students were more familiar with the role of the lumen than
the stroma while playing the game.
Learning outcome 11 (L.O.11) was developed based on the following
misconception about NADPH: The dark reactions (Calvin Cycle) that require NADPH,
ATP & CO2 to produce carbohydrates occur at night (Lonergan,2000). Playing the game
in addition to watching the video helped students to achieve L.O.11 and to some extent
address this misconception.
156
Learning outcome 12: Recall that the products of ETC in photosynthesis,
ATP and NADPH, convert CO2 into carbohydrates. Learning outcome 12 (L.O.12)
referred to the outputs of ETC -ATP and NADPH- and the fixation of carbon dioxide by
ATP and NADPH into carbohydrates. In the ETC video and the Electron Chute game, the
carbohydrate is glucose. According to the item analysis in the previous section,
distractors "a" and "d" were not appealing to the students because they drew almost the
same number of answers from higher performing than lower performing students. Like
item 11, the content of item 12 was relevant for the evaluation of the treatments.
The data in Table 8 suggested a positive effect of the video+game treatment on
students' ability to achieve L.O.12. The difference observed between those watching only
the video and students who watched the video and played the game was statistically
significant (Z=2.913; p<0.05). See Table 22 for the key and distractors analysis per
treatment.
In the pretest, 36% of students in the whole class -39% video only and 33%
video+game- selected foil "a" as correct answer: "Water and NADPH transform carbon
dioxide into carbohydrates." After the treatments, there was a statistically significant
difference between the proportion of students who selected foil "a" in the pretest and the
posttest in the whole class and in the treatments. Therefore, the treatments helped
students to clarify that ATP and no water -and NADPH- fixed CO2 into carbohydrates.
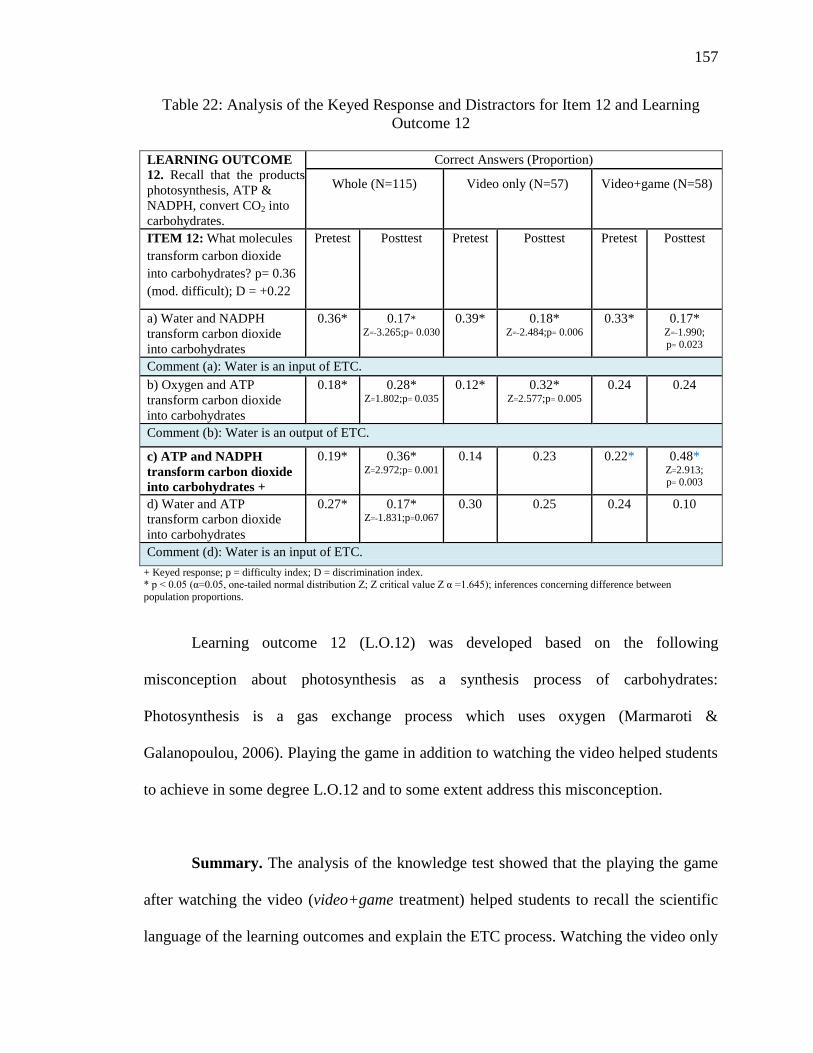
157
Table 22: Analysis of the Keyed Response and Distractors for Item 12 and Learning
Outcome 12
LEARNING OUTCOME
12. Recall that the products of ETC in
photosynthesis, ATP &
NADPH, convert CO2 into
carbohydrates.
Correct Answers (Proportion)
Whole (N=115) Video only (N=57) Video+game (N=58)
ITEM 12: What molecules
transform carbon dioxide
into carbohydrates? p= 0.36
(mod. difficult); D = +0.22
Pretest Posttest Pretest Posttest Pretest Posttest
a) Water and NADPH
transform carbon dioxide
into carbohydrates
0.36* 0.17*
Z=-3.265;p= 0.030 0.39* 0.18*
Z=-2.484;p= 0.006 0.33* 0.17*
Z=-1.990;
p= 0.023
Comment (a): Water is an input of ETC.
b) Oxygen and ATP
transform carbon dioxide
into carbohydrates
0.18* 0.28*
Z=1.802;p= 0.035 0.12* 0.32*
Z=2.577;p= 0.005 0.24 0.24
Comment (b): Water is an output of ETC.
c) ATP and NADPH
transform carbon dioxide
into carbohydrates +
0.19* 0.36*
Z=2.972;p= 0.001 0.14 0.23 0.22* 0.48*
Z=2.913; p= 0.003
d) Water and ATP
transform carbon dioxide
into carbohydrates
0.27* 0.17*
Z=-1.831;p=0.067 0.30 0.25 0.24 0.10
Comment (d): Water is an input of ETC.
+ Keyed response; p = difficulty index; D = discrimination index. * p < 0.05 α 0.05, one-tailed normal distribution Z Z critical value Z α 1. 45 inferences concerning difference between
population proportions.
Learning outcome 12 (L.O.12) was developed based on the following
misconception about photosynthesis as a synthesis process of carbohydrates:
Photosynthesis is a gas exchange process which uses oxygen (Marmaroti &
Galanopoulou, 2006). Playing the game in addition to watching the video helped students
to achieve in some degree L.O.12 and to some extent address this misconception.
Summary. The analysis of the knowledge test showed that the playing the game
after watching the video (video+game treatment) helped students to recall the scientific
language of the learning outcomes and explain the ETC process. Watching the video only
158
supported students' ability to recall how ATP, NADPH and O2 were produced. Also, the
video only treatment had a positive impact on students' ability to recall the movement of
electrons from PSII to H+ pump.
Conclusions. The findings of the analysis and description of the instrument
suggested that the initial model provided by the ETC video helped students learn about
ETC (Mayer & Moreno, 2002). The ETC representation was effective on addressing
some of the misconceptions students' hold regarding photosynthesis and the ETC process
in photosynthesis. In this study, the researcher used a visual representation of the ETC to
support students' learning (Gordin & Pea, 1995; Mayer & Moreno, 2002). This result
supports the idea that students learn by assimilating information and creating their own
model (Kraidy, 2002). Using a visual representation to learn about ETC, students could
be aware of their own misconceptions about energy transformation in photosynthesis.
This way of learning could have helped students to remove their cognitive obstacle (Galli
& Meinard, 2011) and make their own conceptual change needed for addressing
misconceptions (Galli, 2016). A cognitive obstacle could be the teleological thinking of
ETC having a purpose, for example, the production of oxygen for human consumption.
Findings also indicated that the visual representation of the ETC video was not
enough to help students remember several concepts. The mix of a visual representation in
Electron Chute in addition to the epistemic form and the rules that govern actions
Collins & Ferguson, 1 helped students revisit this ETC model with each players’
turn reenacting the ETC process. Playing the game more than once could have provided
the time students needed to achieve the level of thinking related to the understanding of
this particular learning outcome.
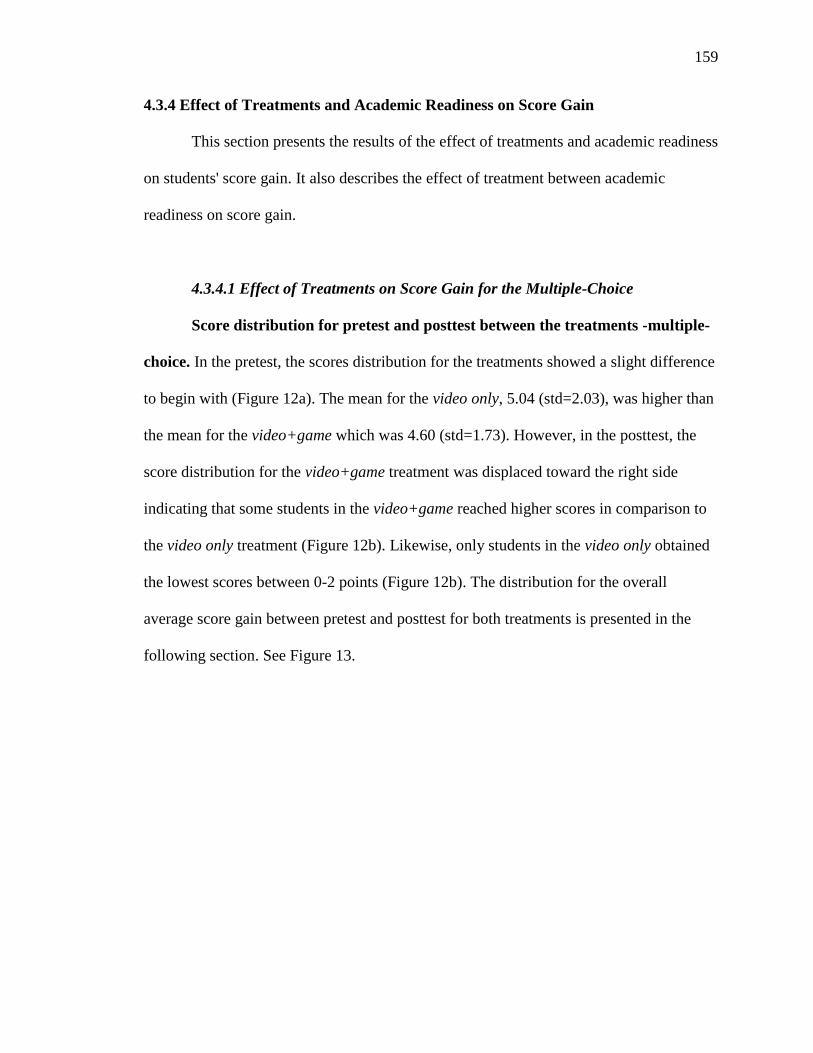
159
4.3.4 Effect of Treatments and Academic Readiness on Score Gain
This section presents the results of the effect of treatments and academic readiness
on students' score gain. It also describes the effect of treatment between academic
readiness on score gain.
4.3.4.1 Effect of Treatments on Score Gain for the Multiple-Choice
Score distribution for pretest and posttest between the treatments -multiple-
choice. In the pretest, the scores distribution for the treatments showed a slight difference
to begin with (Figure 12a). The mean for the video only, 5.04 (std=2.03), was higher than
the mean for the video+game which was 4.60 (std=1.73). However, in the posttest, the
score distribution for the video+game treatment was displaced toward the right side
indicating that some students in the video+game reached higher scores in comparison to
the video only treatment (Figure 12b). Likewise, only students in the video only obtained
the lowest scores between 0-2 points (Figure 12b). The distribution for the overall
average score gain between pretest and posttest for both treatments is presented in the
following section. See Figure 13.

160
Figure 12: Score distribution for the multiple-choice section for the (a) pretest and (b)
posttest in the treatments.
a 5.04
Video
only
Video
only
Video+
game
Video+
game
4.60
b 5.12
5.64
161
Overall average score gain for pretest and posttest between the treatments -
multiple-choice. The score distribution for the score gain between pretest and posttest for
the treatments is illustrated in Figure 13b and Figure 13c. The graph shows that the score
gain was slightly higher in the video+game (Figure 13c) than the video only (Figure 13b).
The video+game group increased its score in an average of one points out of 12 points
(mean= 1.03; std= 2.21) which is an approximately 8% of score gain. The video only
practically did not increase its score (mean= 0.14 points; std=2.08) which is only a 1% of
score gain. The difference of overall average score gain between the treatments was
significant (p=0.023) (Table 23). The hypothesis for significance is tested in the next
section.
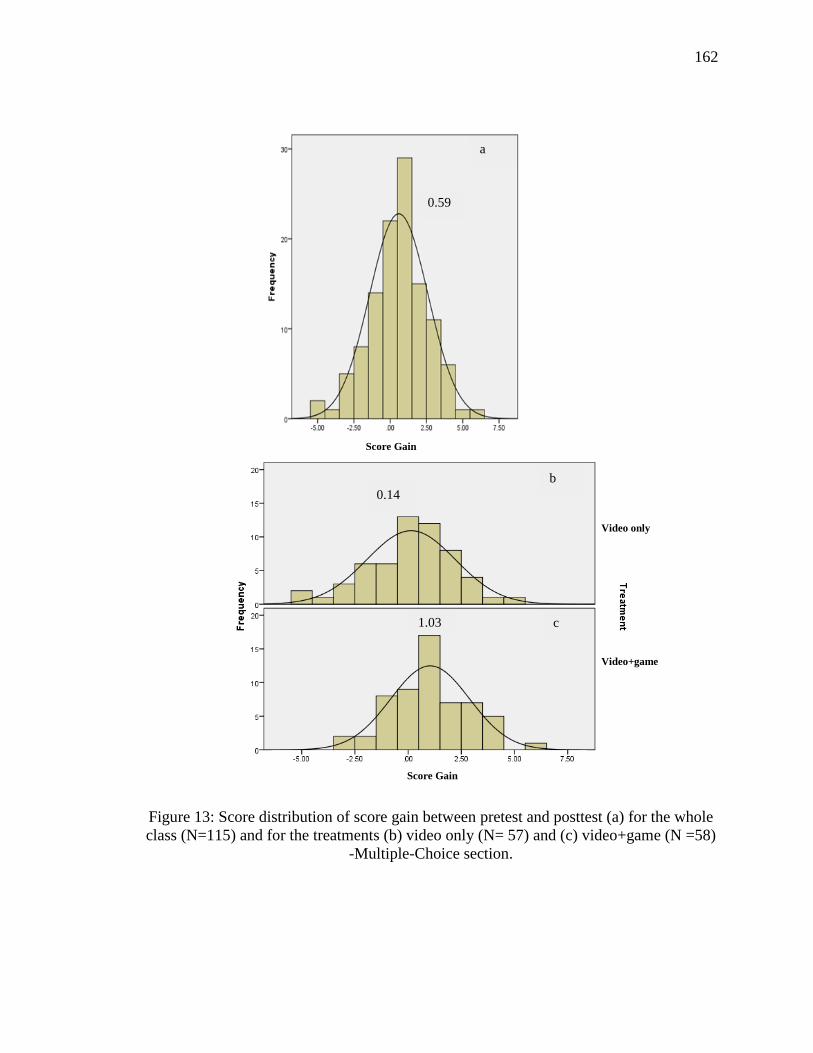
162
Figure 13: Score distribution of score gain between pretest and posttest (a) for the whole
class (N=115) and for the treatments (b) video only (N= 57) and (c) video+game (N =58)
-Multiple-Choice section.
0.59
a
Score Gain
Video only
Video+game
0.14
b
c 1.03
Score Gain
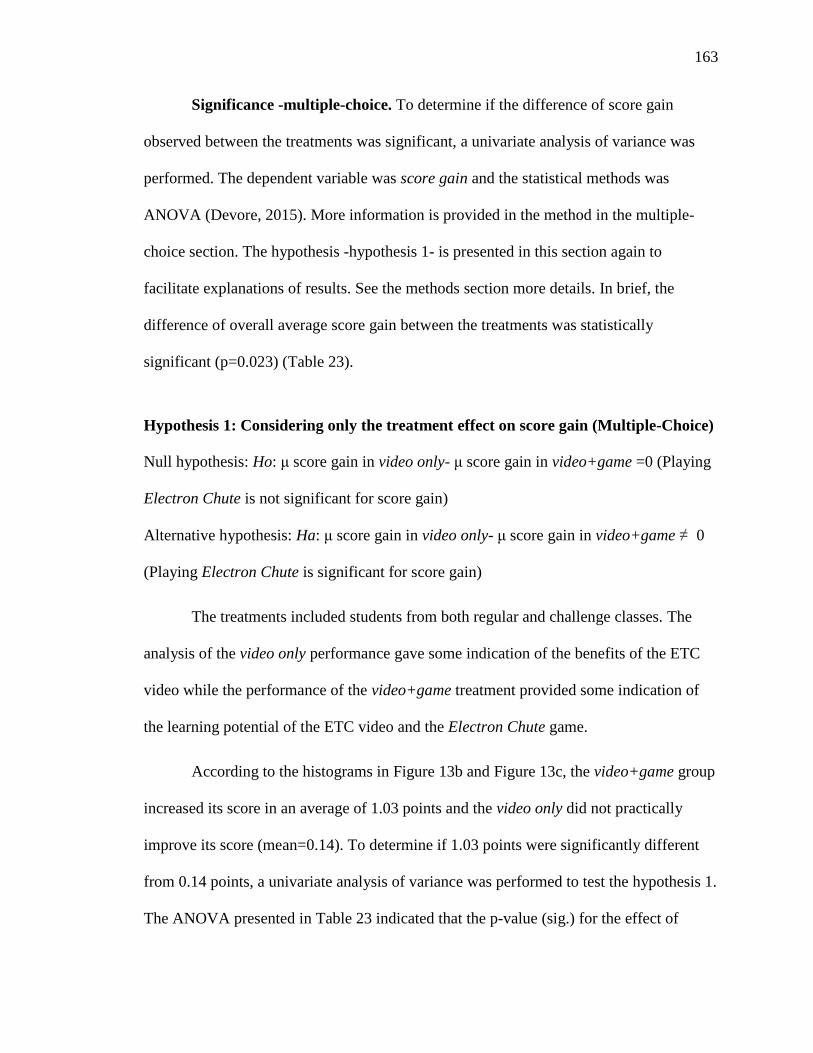
163
Significance -multiple-choice. To determine if the difference of score gain
observed between the treatments was significant, a univariate analysis of variance was
performed. The dependent variable was score gain and the statistical methods was
ANOVA (Devore, 2015). More information is provided in the method in the multiple-
choice section. The hypothesis -hypothesis 1- is presented in this section again to
facilitate explanations of results. See the methods section more details. In brief, the
difference of overall average score gain between the treatments was statistically
significant (p=0.023) (Table 23).
Hypothesis 1: Considering only the treatment effect on score gain (Multiple-Choice)
Null hypothesis: Ho: μ score gain in video only- μ score gain in video+game =0 (Playing
Electron Chute is not significant for score gain)
Alternative hypothesis: Ha: μ score gain in video only- μ score gain in video+game ≠ 0
(Playing Electron Chute is significant for score gain)
The treatments included students from both regular and challenge classes. The
analysis of the video only performance gave some indication of the benefits of the ETC
video while the performance of the video+game treatment provided some indication of
the learning potential of the ETC video and the Electron Chute game.
According to the histograms in Figure 13b and Figure 13c, the video+game group
increased its score in an average of 1.03 points and the video only did not practically
improve its score (mean=0.14). To determine if 1.03 points were significantly different
from 0.14 points, a univariate analysis of variance was performed to test the hypothesis 1.
The ANOVA presented in Table 23 indicated that the p-value (sig.) for the effect of
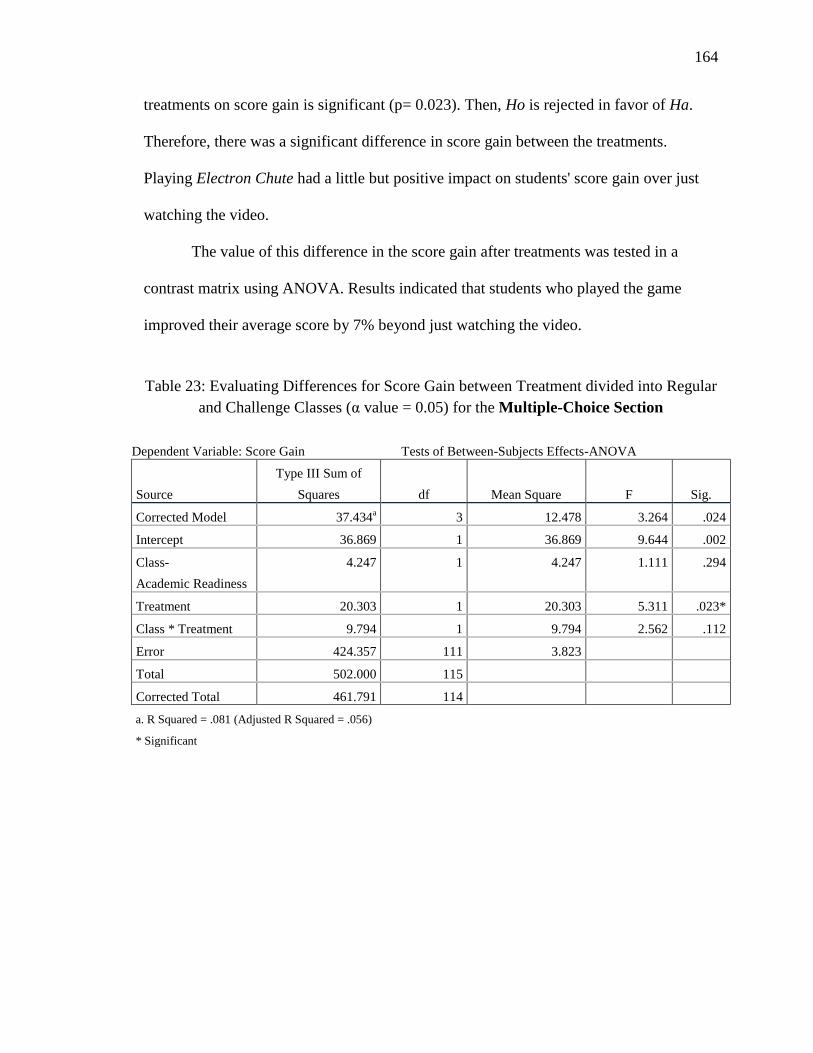
164
treatments on score gain is significant (p= 0.023). Then, Ho is rejected in favor of Ha.
Therefore, there was a significant difference in score gain between the treatments.
Playing Electron Chute had a little but positive impact on students' score gain over just
watching the video.
The value of this difference in the score gain after treatments was tested in a
contrast matrix using ANOVA. Results indicated that students who played the game
improved their average score by 7% beyond just watching the video.
Table 23: Evaluating Differences for Score Gain between Treatment divided into Regular
and Challenge Classes (α value = 0.05) for the Multiple-Choice Section
Dependent Variable: Score Gain Tests of Between-Subjects Effects-ANOVA
Source
Type III Sum of
Squares df Mean Square F Sig.
Corrected Model 37.434a 3 12.478 3.264 .024
Intercept 36.869 1 36.869 9.644 .002
Class-
Academic Readiness
4.247 1 4.247 1.111 .294
Treatment 20.303 1 20.303 5.311 .023*
Class * Treatment 9.794 1 9.794 2.562 .112
Error 424.357 111 3.823
Total 502.000 115
Corrected Total 461.791 114
a. R Squared = .081 (Adjusted R Squared = .056)
* Significant
165
4.3.4.2 Effect of Treatments on Score Gain for the Essay
Score distribution for pretest and posttest essay between the treatments -
essay. In the pretest, the scores distribution for the treatments were similar to begin with
(Figure 14a). The mean was very low for the video only group, 1.52 (std=1.42), and for
the video+game group, 1.66 (std=1.77). Also, approximately 15% of students in both
treatments scored zero points.
In the posttest, video+game treatment, the entire score distribution was displaced
to the right side in comparison to the pretest. However, in the video only treatment many
students obtained the lowest scores (Figure 14b). This result suggests that playing the
game provided students with the vocabulary and ideas to write a narrative about the ETC
process. This result supported the objectives of the video+game learning experience, that
was developed to foster students' ability to remember vocabulary and explain a
representation.
The scores of the video only increased in almost one point out of 11 points, from
1.52 to 2.45 points, and the scores from the video+game increased in around 2.5 points.
In average, students got one point (10% of improvement) more in the essay section than
in the item section of the instrument. This result suggested that giving students the chance
to explain the ETC representation helped them to learn a bit more about the process. The
distribution for the overall average score gain between pretest and posttest for both
treatments for the essay is presented in the next section. See Figure 15. The same
distribution for the items was presented in Figure 13.
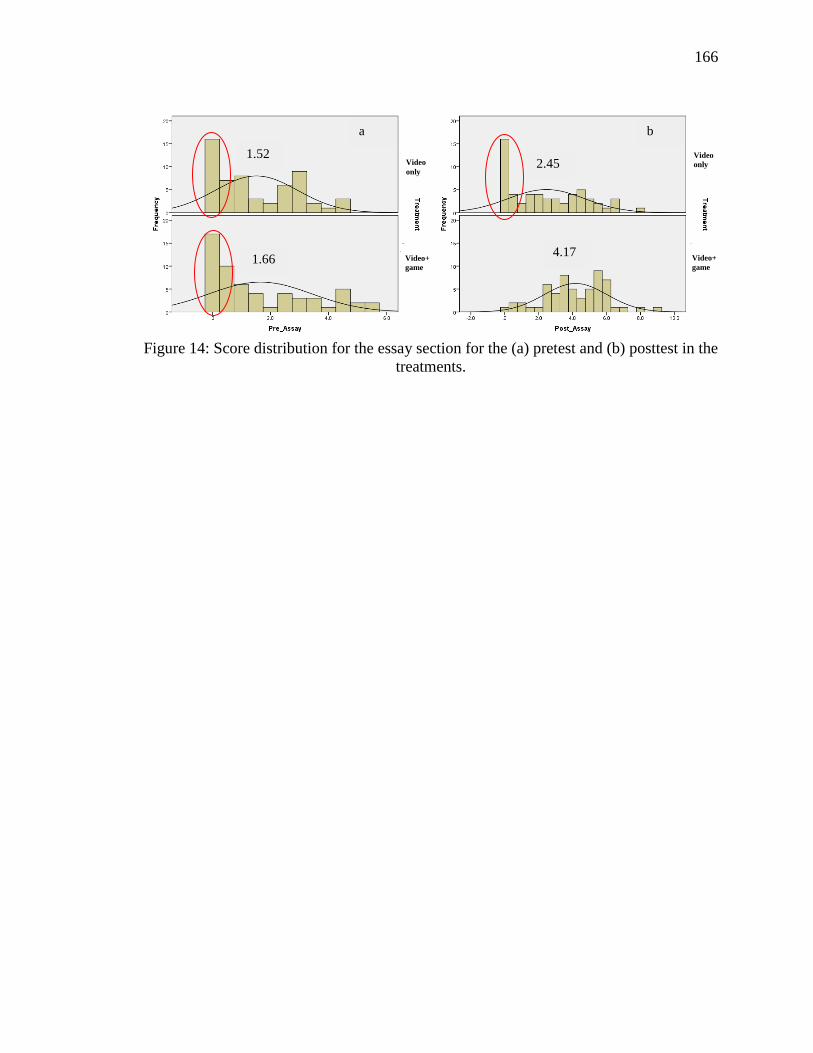
166
Figure 14: Score distribution for the essay section for the (a) pretest and (b) posttest in the
treatments.
a
1.52 Video
only
Video
only
Video+
game
Video+
game 1.66
2.45
4.17
b
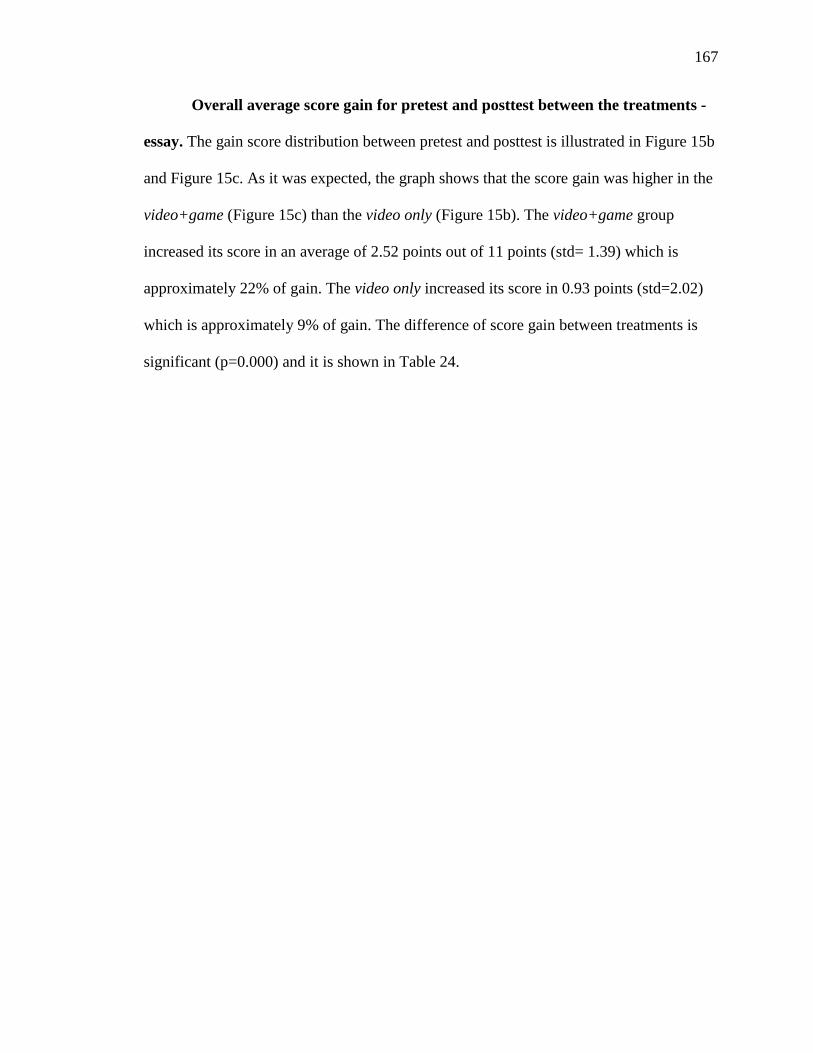
167
Overall average score gain for pretest and posttest between the treatments -
essay. The gain score distribution between pretest and posttest is illustrated in Figure 15b
and Figure 15c. As it was expected, the graph shows that the score gain was higher in the
video+game (Figure 15c) than the video only (Figure 15b). The video+game group
increased its score in an average of 2.52 points out of 11 points (std= 1.39) which is
approximately 22% of gain. The video only increased its score in 0.93 points (std=2.02)
which is approximately 9% of gain. The difference of score gain between treatments is
significant (p=0.000) and it is shown in Table 24.
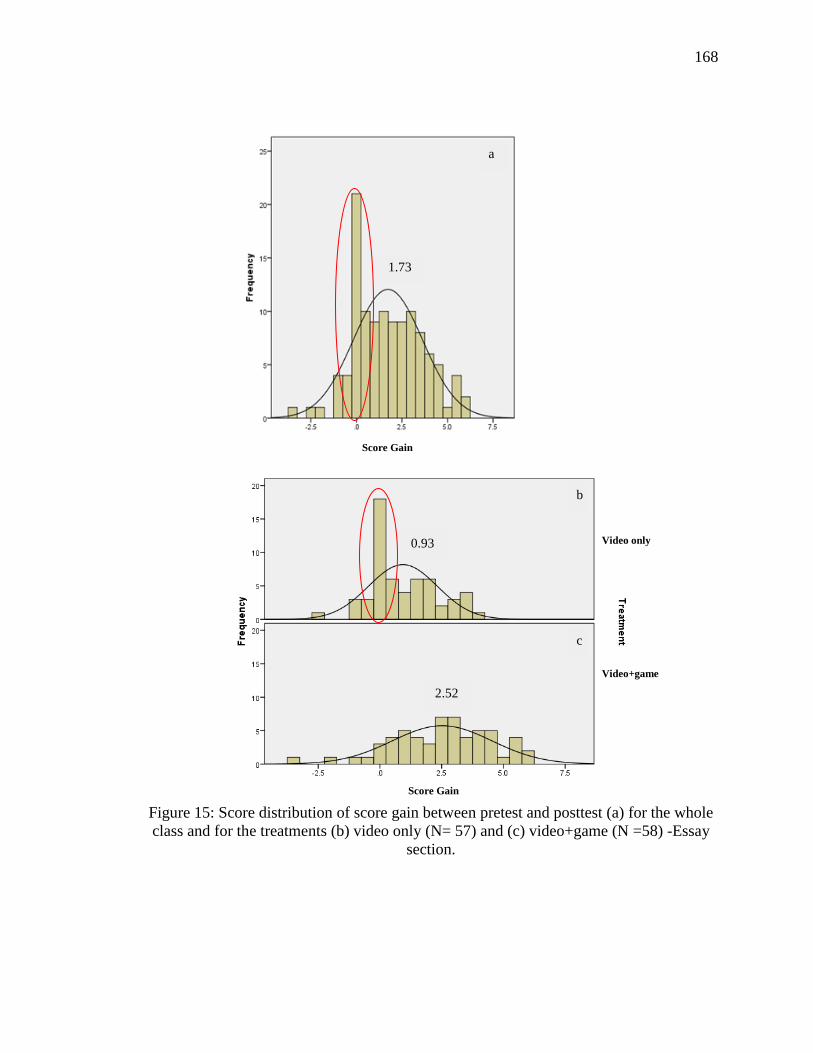
168
Figure 15: Score distribution of score gain between pretest and posttest (a) for the whole
class and for the treatments (b) video only (N= 57) and (c) video+game (N =58) -Essay
section.
1.73
a
Score Gain
Score Gain
Video only
Video+game
0.93
b
2.52
c
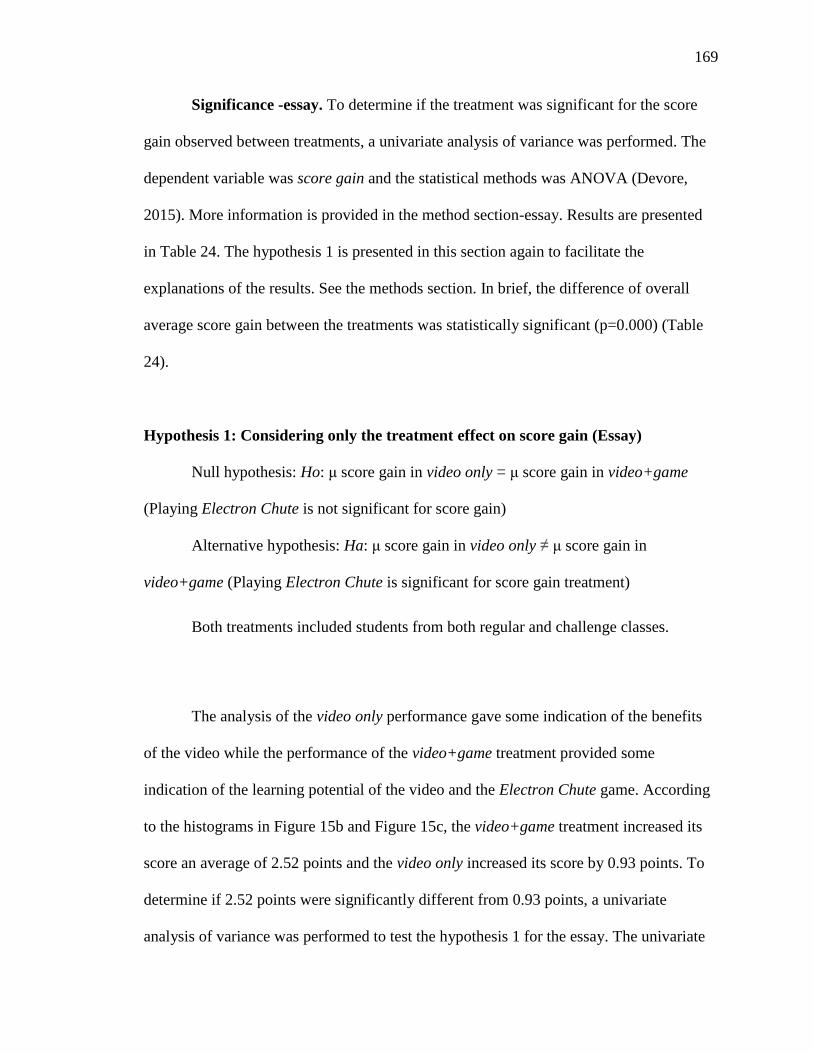
169
Significance -essay. To determine if the treatment was significant for the score
gain observed between treatments, a univariate analysis of variance was performed. The
dependent variable was score gain and the statistical methods was ANOVA (Devore,
2015). More information is provided in the method section-essay. Results are presented
in Table 24. The hypothesis 1 is presented in this section again to facilitate the
explanations of the results. See the methods section. In brief, the difference of overall
average score gain between the treatments was statistically significant (p=0.000) (Table
24).
Hypothesis 1: Considering only the treatment effect on score gain (Essay)
Null hypothesis: Ho: μ score gain in video only = μ score gain in video+game
(Playing Electron Chute is not significant for score gain)
Alternative hypothesis: Ha: μ score gain in video only ≠ μ score gain in
video+game (Playing Electron Chute is significant for score gain treatment)
Both treatments included students from both regular and challenge classes.
The analysis of the video only performance gave some indication of the benefits
of the video while the performance of the video+game treatment provided some
indication of the learning potential of the video and the Electron Chute game. According
to the histograms in Figure 15b and Figure 15c, the video+game treatment increased its
score an average of 2.52 points and the video only increased its score by 0.93 points. To
determine if 2.52 points were significantly different from 0.93 points, a univariate
analysis of variance was performed to test the hypothesis 1 for the essay. The univariate
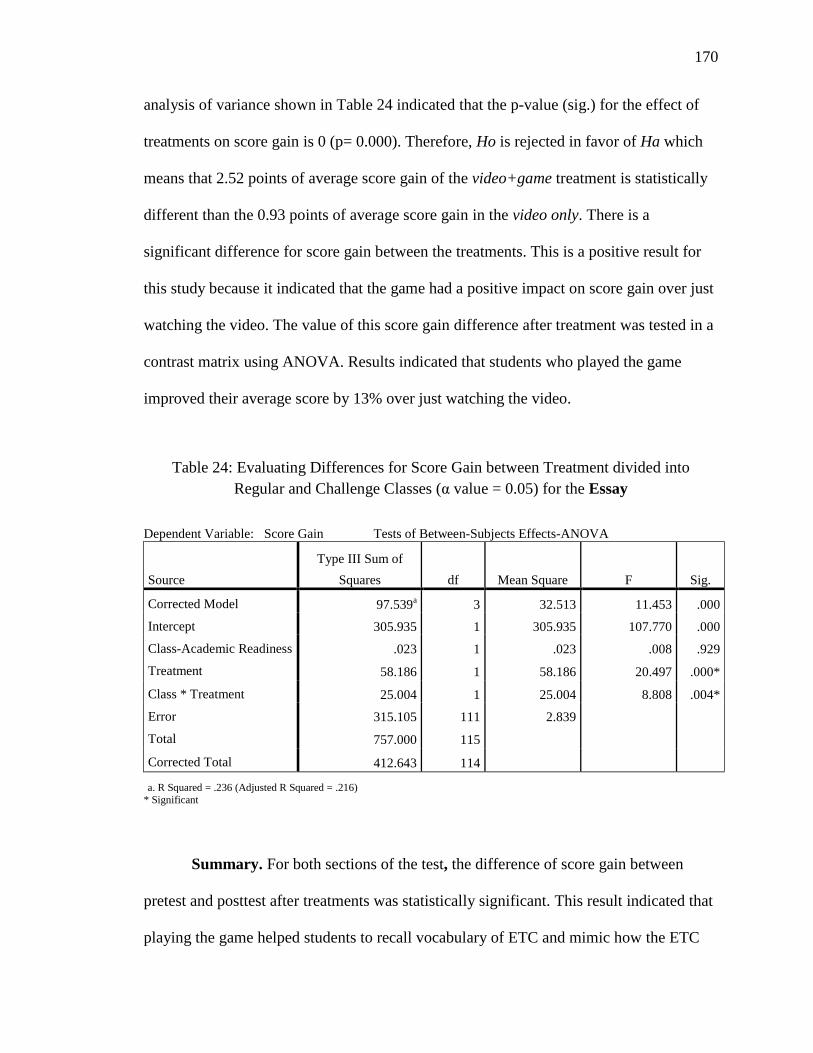
170
analysis of variance shown in Table 24 indicated that the p-value (sig.) for the effect of
treatments on score gain is 0 (p= 0.000). Therefore, Ho is rejected in favor of Ha which
means that 2.52 points of average score gain of the video+game treatment is statistically
different than the 0.93 points of average score gain in the video only. There is a
significant difference for score gain between the treatments. This is a positive result for
this study because it indicated that the game had a positive impact on score gain over just
watching the video. The value of this score gain difference after treatment was tested in a
contrast matrix using ANOVA. Results indicated that students who played the game
improved their average score by 13% over just watching the video.
Table 24: Evaluating Differences for Score Gain between Treatment divided into
Regular and Challenge Classes (α value = 0.05) for the Essay
Dependent Variable: Score Gain Tests of Between-Subjects Effects-ANOVA
Source
Type III Sum of
Squares df Mean Square F Sig.
Corrected Model 97.539a 3 32.513 11.453 .000
Intercept 305.935 1 305.935 107.770 .000
Class-Academic Readiness .023 1 .023 .008 .929
Treatment 58.186 1 58.186 20.497 .000*
Class * Treatment 25.004 1 25.004 8.808 .004*
Error 315.105 111 2.839
Total 757.000 115
Corrected Total 412.643 114
a. R Squared = .236 (Adjusted R Squared = .216)
* Significant
Summary. For both sections of the test, the difference of score gain between
pretest and posttest after treatments was statistically significant. This result indicated that
playing the game helped students to recall vocabulary of ETC and mimic how the ETC
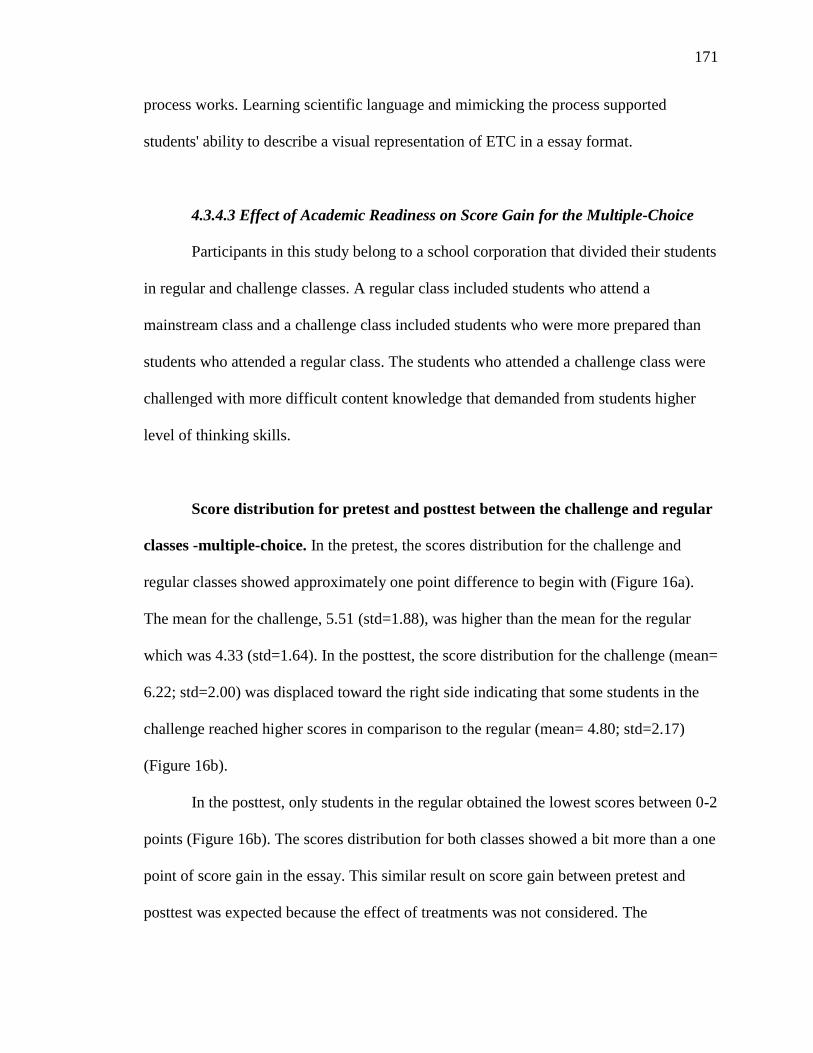
171
process works. Learning scientific language and mimicking the process supported
students' ability to describe a visual representation of ETC in a essay format.
4.3.4.3 Effect of Academic Readiness on Score Gain for the Multiple-Choice
Participants in this study belong to a school corporation that divided their students
in regular and challenge classes. A regular class included students who attend a
mainstream class and a challenge class included students who were more prepared than
students who attended a regular class. The students who attended a challenge class were
challenged with more difficult content knowledge that demanded from students higher
level of thinking skills.
Score distribution for pretest and posttest between the challenge and regular
classes -multiple-choice. In the pretest, the scores distribution for the challenge and
regular classes showed approximately one point difference to begin with (Figure 16a).
The mean for the challenge, 5.51 (std=1.88), was higher than the mean for the regular
which was 4.33 (std=1.64). In the posttest, the score distribution for the challenge (mean=
6.22; std=2.00) was displaced toward the right side indicating that some students in the
challenge reached higher scores in comparison to the regular (mean= 4.80; std=2.17)
(Figure 16b).
In the posttest, only students in the regular obtained the lowest scores between 0-2
points (Figure 16b). The scores distribution for both classes showed a bit more than a one
point of score gain in the essay. This similar result on score gain between pretest and
posttest was expected because the effect of treatments was not considered. The
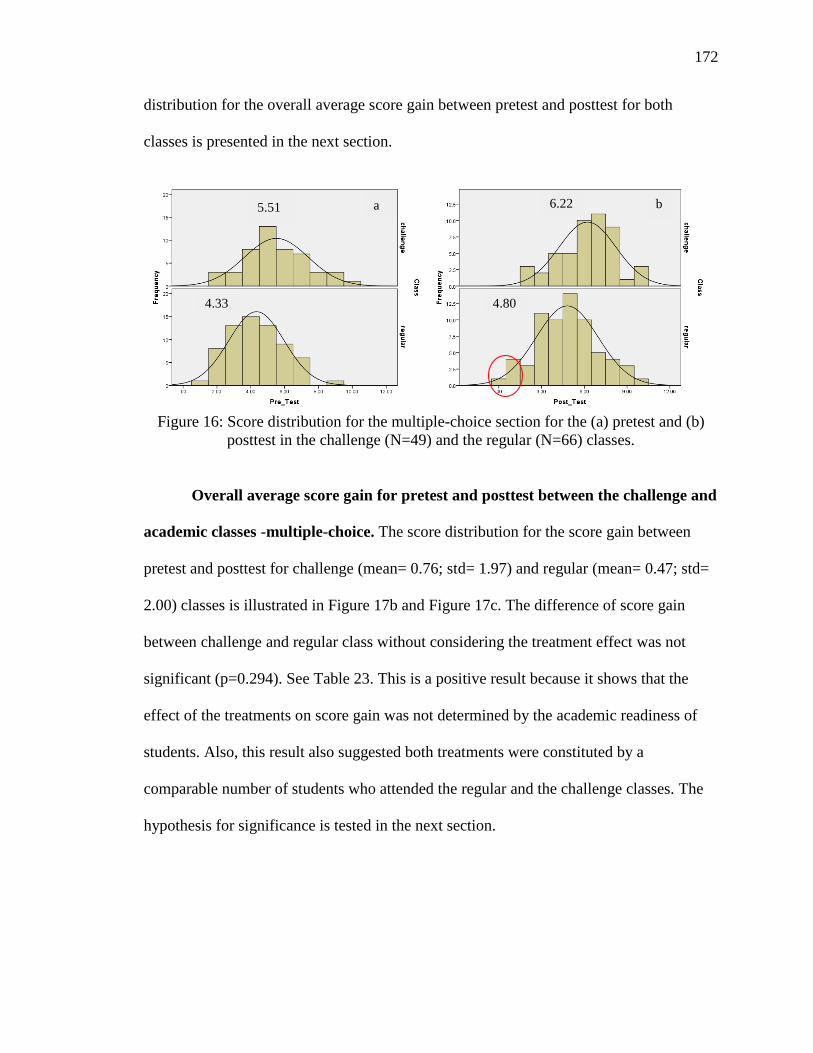
172
distribution for the overall average score gain between pretest and posttest for both
classes is presented in the next section.
Figure 16: Score distribution for the multiple-choice section for the (a) pretest and (b)
posttest in the challenge (N=49) and the regular (N=66) classes.
Overall average score gain for pretest and posttest between the challenge and
academic classes -multiple-choice. The score distribution for the score gain between
pretest and posttest for challenge (mean= 0.76; std= 1.97) and regular (mean= 0.47; std=
2.00) classes is illustrated in Figure 17b and Figure 17c. The difference of score gain
between challenge and regular class without considering the treatment effect was not
significant (p=0.294). See Table 23. This is a positive result because it shows that the
effect of the treatments on score gain was not determined by the academic readiness of
students. Also, this result also suggested both treatments were constituted by a
comparable number of students who attended the regular and the challenge classes. The
hypothesis for significance is tested in the next section.
5.51 a
4.33
6.22
4.80
b
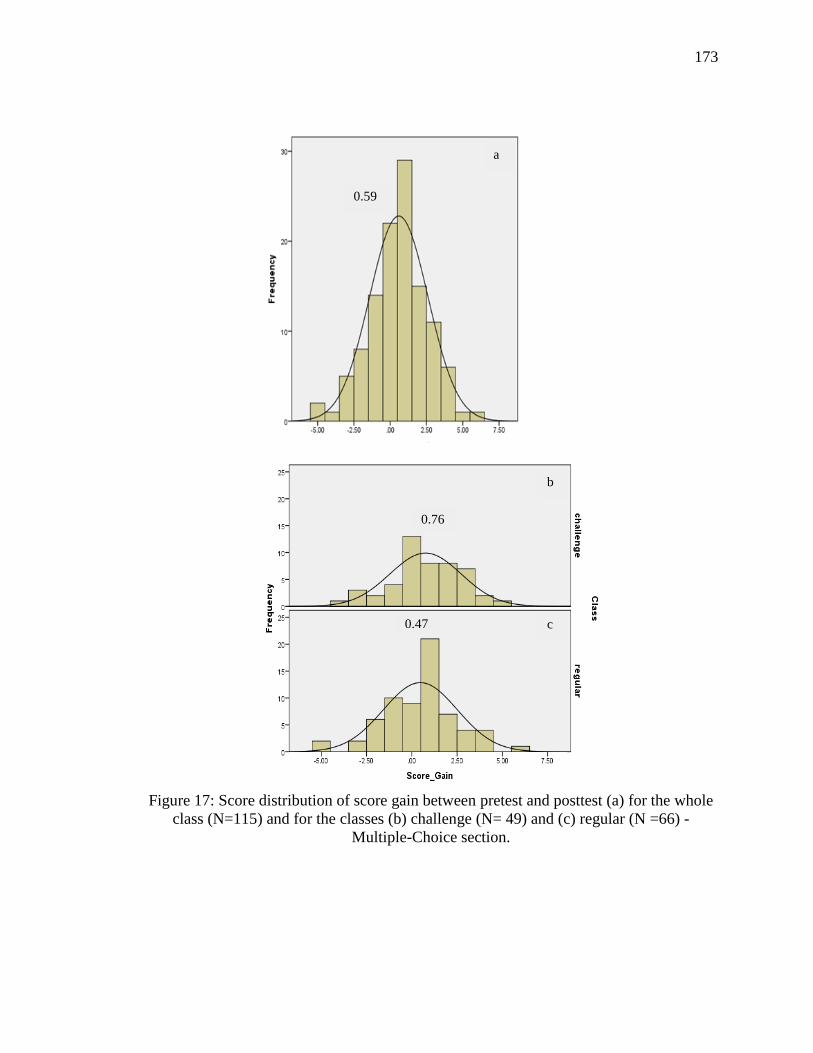
173
Figure 17: Score distribution of score gain between pretest and posttest (a) for the whole
class (N=115) and for the classes (b) challenge (N= 49) and (c) regular (N =66) -
Multiple-Choice section.
0.59
a
0.76
b
0.47 c
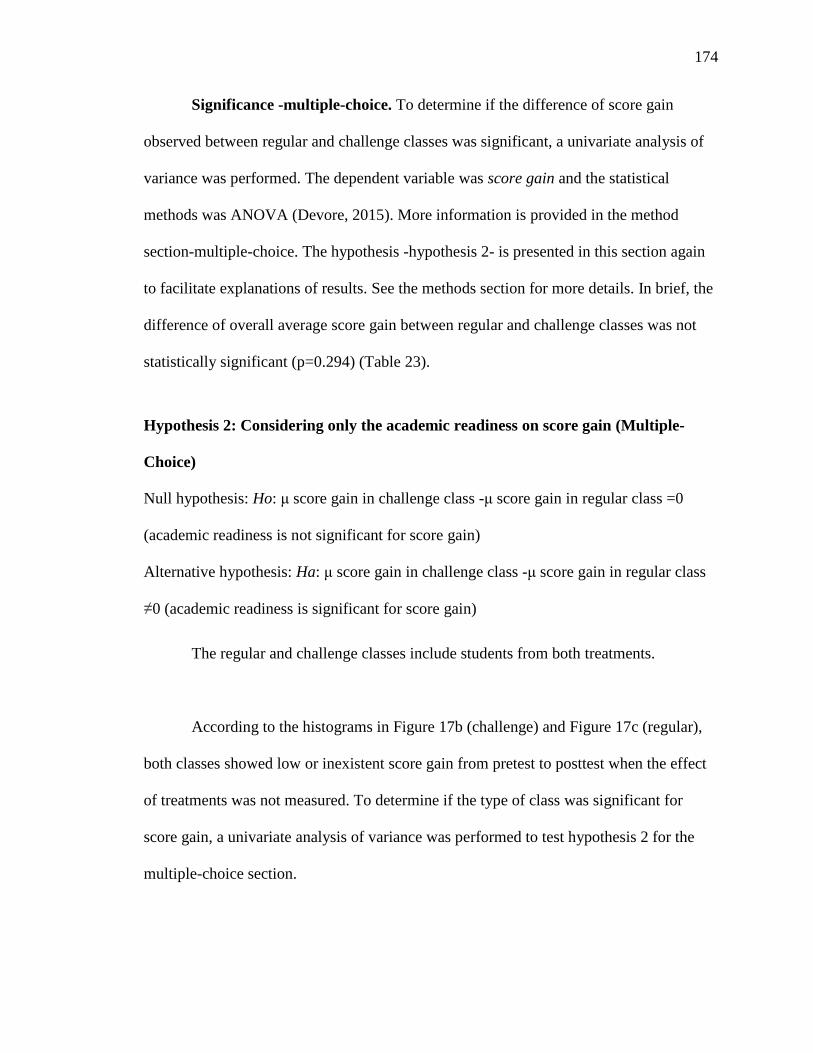
174
Significance -multiple-choice. To determine if the difference of score gain
observed between regular and challenge classes was significant, a univariate analysis of
variance was performed. The dependent variable was score gain and the statistical
methods was ANOVA (Devore, 2015). More information is provided in the method
section-multiple-choice. The hypothesis -hypothesis 2- is presented in this section again
to facilitate explanations of results. See the methods section for more details. In brief, the
difference of overall average score gain between regular and challenge classes was not
statistically significant (p=0.294) (Table 23).
Hypothesis 2: Considering only the academic readiness on score gain (Multiple-
Choice)
Null hypothesis: Ho: μ score gain in challenge class -μ score gain in regular class =0
(academic readiness is not significant for score gain)
Alternative hypothesis: Ha: μ score gain in challenge class -μ score gain in regular class
≠0 (academic readiness is significant for score gain)
The regular and challenge classes include students from both treatments.
According to the histograms in Figure 17b (challenge) and Figure 17c (regular),
both classes showed low or inexistent score gain from pretest to posttest when the effect
of treatments was not measured. To determine if the type of class was significant for
score gain, a univariate analysis of variance was performed to test hypothesis 2 for the
multiple-choice section.
175
The univariate analysis of variance shown in Table 23 indicated that the p-value
(sig.) for the effect of academic readiness on score gain was not significant (p=0.294).
Then, there was not a significant evidence to reject Ho in favor of Ha.
This result indicated that the difference of score gain between regular and
challenge classes was not statistically significant when a separation for treatments was
not applied. As it was mentioned earlier, this result is positive because it indicated that
the type of class students attended -regular versus challenge- had no effect on score gain.
A separation of both treatments between the classes is tested later in the chapter. See
hypothesis 3 for the multiple-choice in section 4.3.4.5.
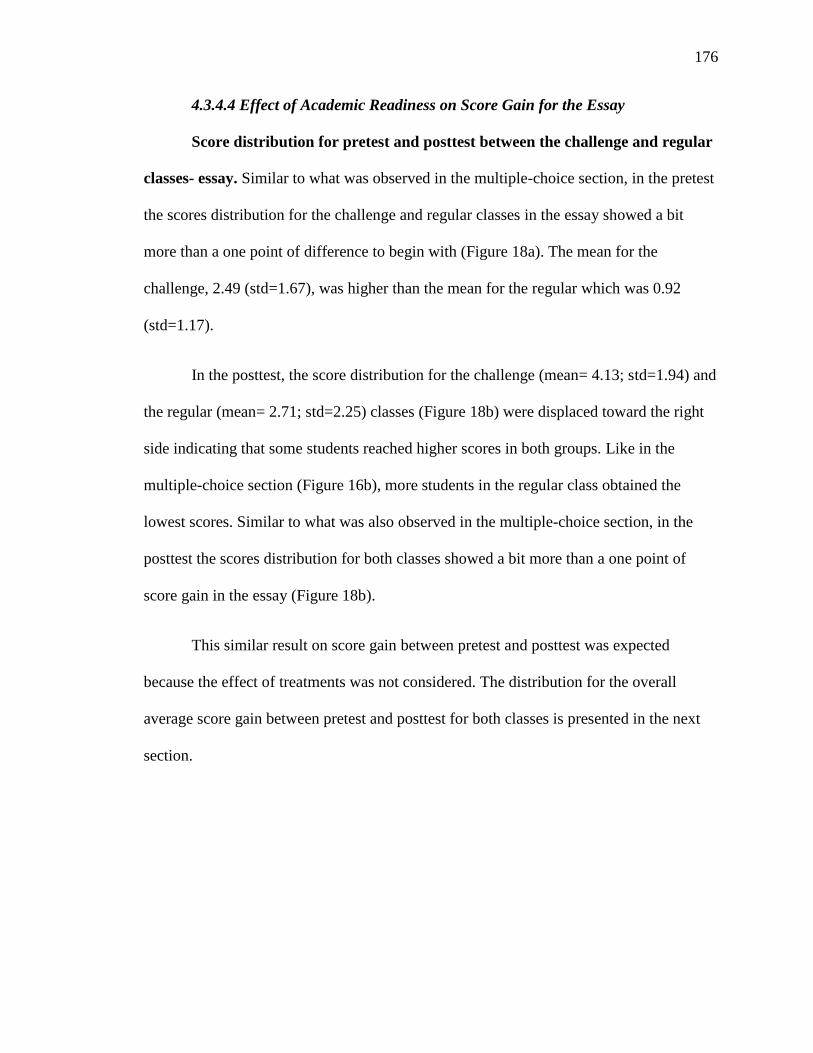
176
4.3.4.4 Effect of Academic Readiness on Score Gain for the Essay
Score distribution for pretest and posttest between the challenge and regular
classes- essay. Similar to what was observed in the multiple-choice section, in the pretest
the scores distribution for the challenge and regular classes in the essay showed a bit
more than a one point of difference to begin with (Figure 18a). The mean for the
challenge, 2.49 (std=1.67), was higher than the mean for the regular which was 0.92
(std=1.17).
In the posttest, the score distribution for the challenge (mean= 4.13; std=1.94) and
the regular (mean= 2.71; std=2.25) classes (Figure 18b) were displaced toward the right
side indicating that some students reached higher scores in both groups. Like in the
multiple-choice section (Figure 16b), more students in the regular class obtained the
lowest scores. Similar to what was also observed in the multiple-choice section, in the
posttest the scores distribution for both classes showed a bit more than a one point of
score gain in the essay (Figure 18b).
This similar result on score gain between pretest and posttest was expected
because the effect of treatments was not considered. The distribution for the overall
average score gain between pretest and posttest for both classes is presented in the next
section.
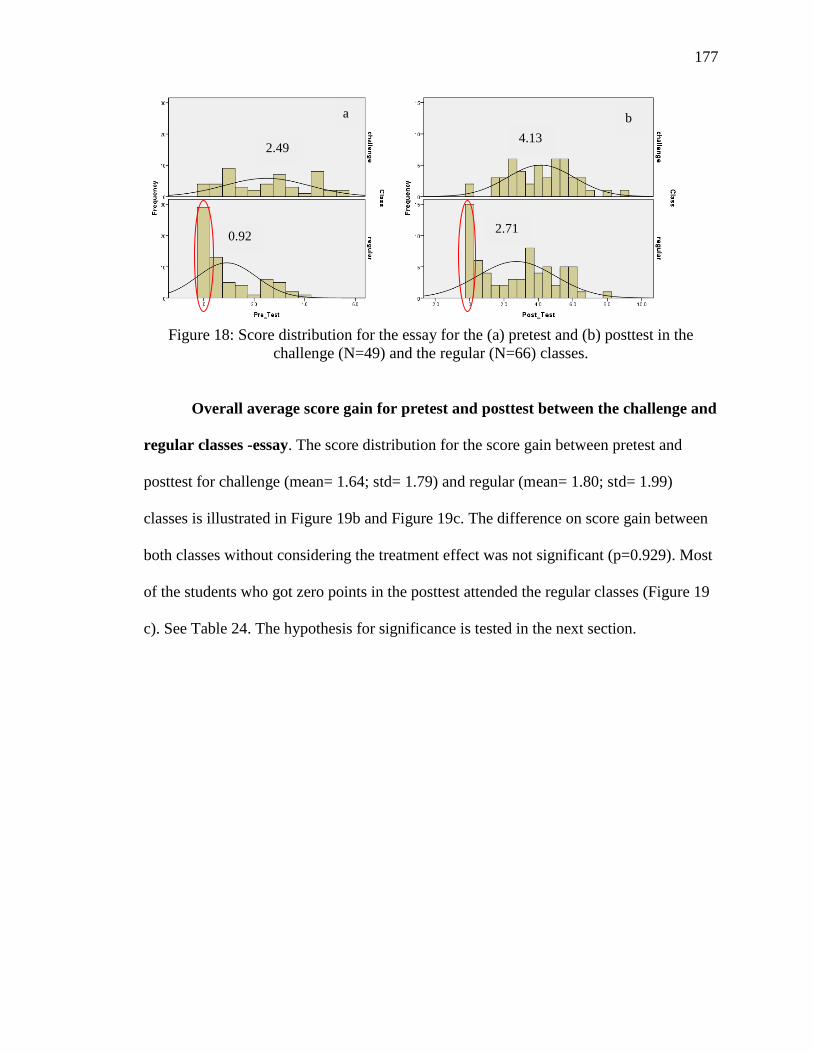
177
Figure 18: Score distribution for the essay for the (a) pretest and (b) posttest in the
challenge (N=49) and the regular (N=66) classes.
Overall average score gain for pretest and posttest between the challenge and
regular classes -essay. The score distribution for the score gain between pretest and
posttest for challenge (mean= 1.64; std= 1.79) and regular (mean= 1.80; std= 1.99)
classes is illustrated in Figure 19b and Figure 19c. The difference on score gain between
both classes without considering the treatment effect was not significant (p=0.929). Most
of the students who got zero points in the posttest attended the regular classes (Figure 19
c). See Table 24. The hypothesis for significance is tested in the next section.
2.49
a
0.92
4.13
2.71
b
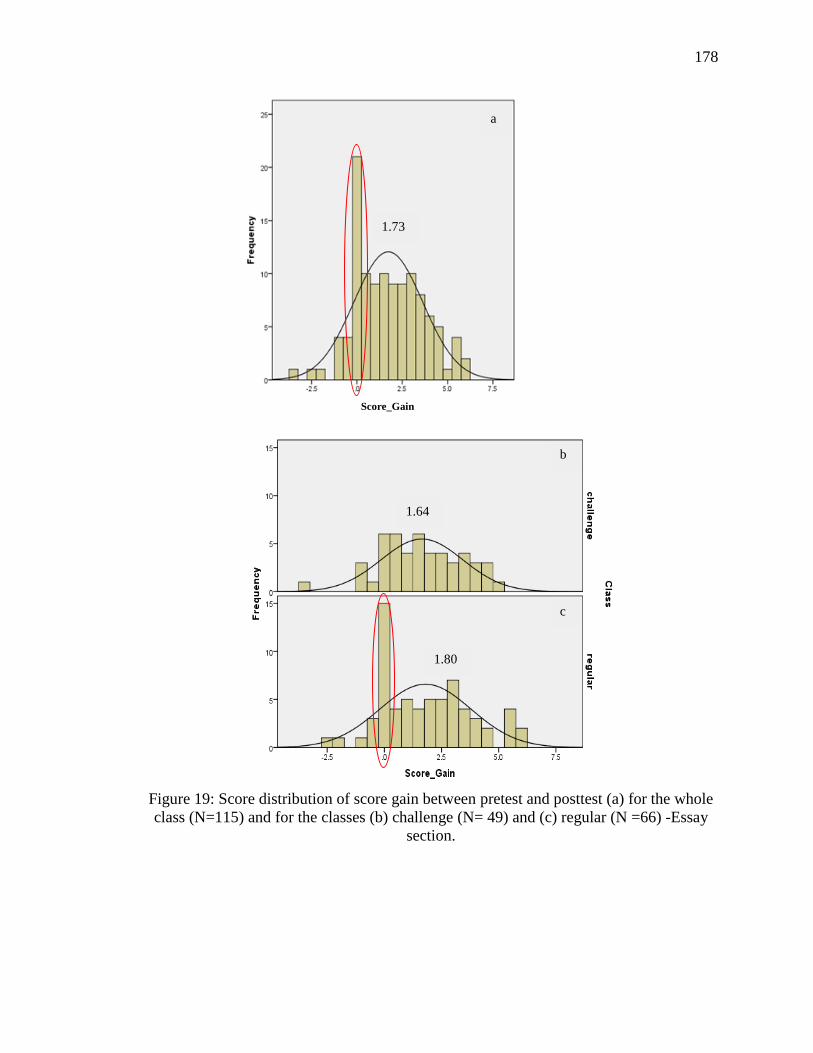
178
Figure 19: Score distribution of score gain between pretest and posttest (a) for the whole
class (N=115) and for the classes (b) challenge (N= 49) and (c) regular (N =66) -Essay
section.
1.73
a
Score_Gain
1.64
1.80
b
c
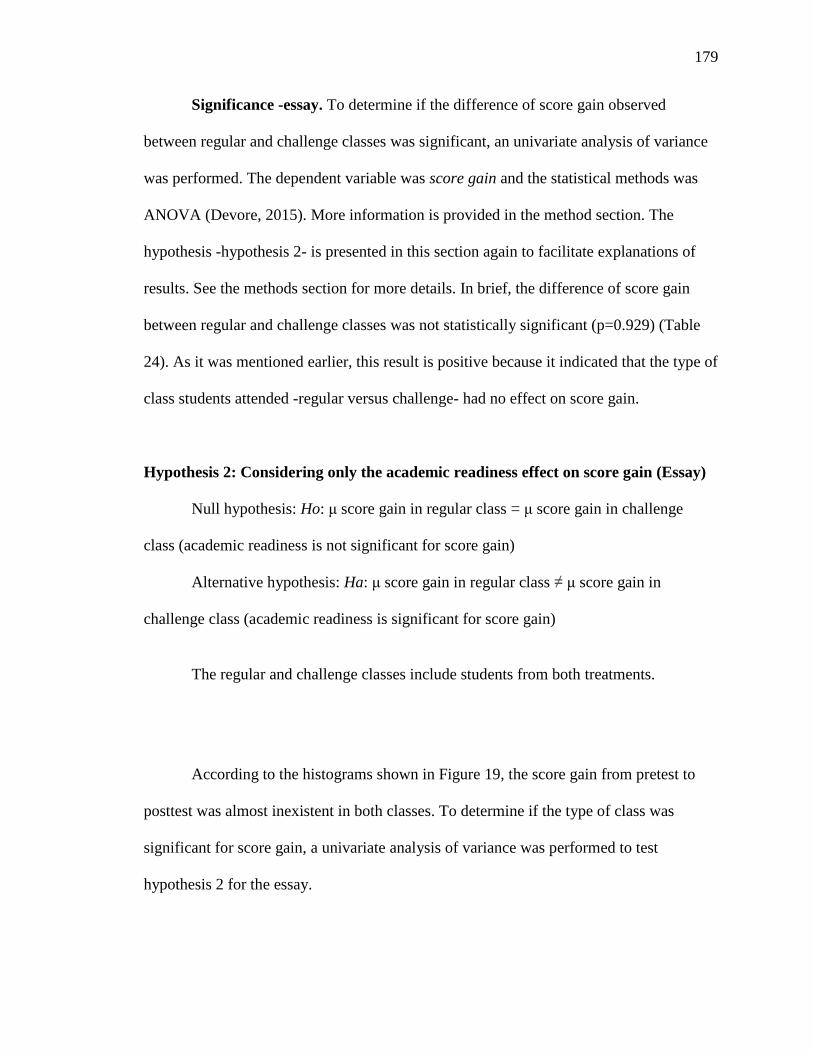
179
Significance -essay. To determine if the difference of score gain observed
between regular and challenge classes was significant, an univariate analysis of variance
was performed. The dependent variable was score gain and the statistical methods was
ANOVA (Devore, 2015). More information is provided in the method section. The
hypothesis -hypothesis 2- is presented in this section again to facilitate explanations of
results. See the methods section for more details. In brief, the difference of score gain
between regular and challenge classes was not statistically significant (p=0.929) (Table
24). As it was mentioned earlier, this result is positive because it indicated that the type of
class students attended -regular versus challenge- had no effect on score gain.
Hypothesis 2: Considering only the academic readiness effect on score gain (Essay)
Null hypothesis: Ho: μ score gain in regular class = μ score gain in challenge
class (academic readiness is not significant for score gain)
Alternative hypothesis: Ha: μ score gain in regular class ≠ μ score gain in
challenge class (academic readiness is significant for score gain)
The regular and challenge classes include students from both treatments.
According to the histograms shown in Figure 19, the score gain from pretest to
posttest was almost inexistent in both classes. To determine if the type of class was
significant for score gain, a univariate analysis of variance was performed to test
hypothesis 2 for the essay.
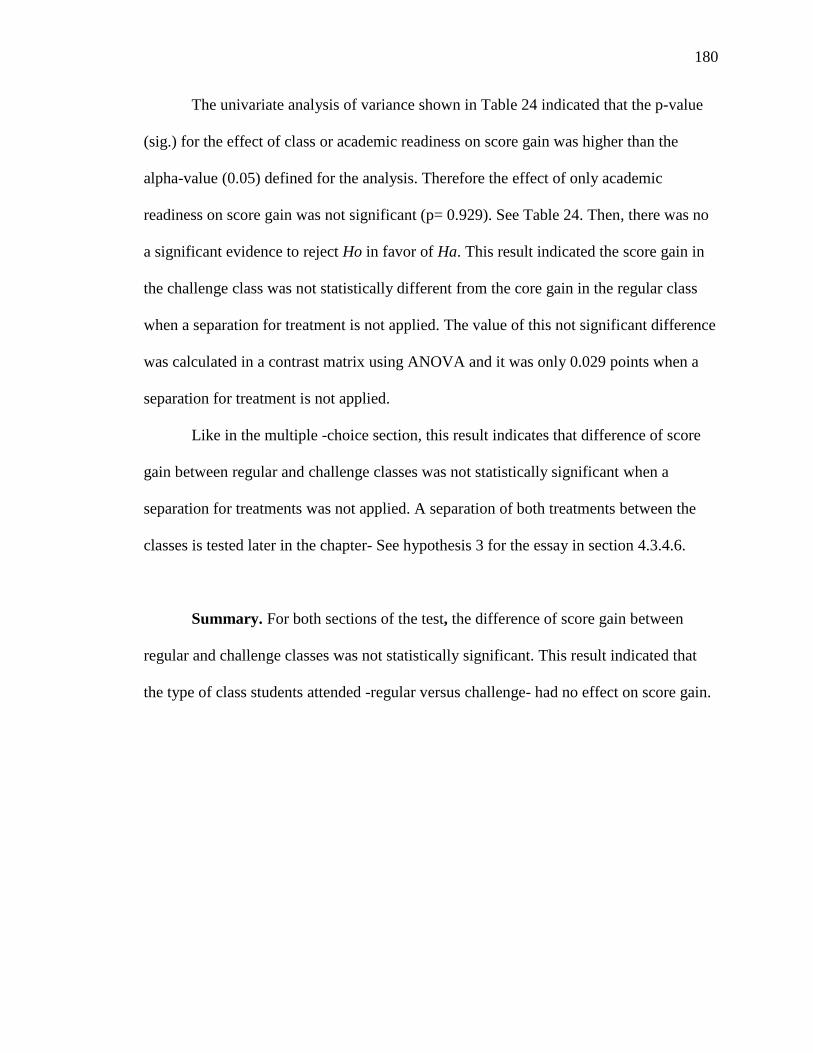
180
The univariate analysis of variance shown in Table 24 indicated that the p-value
(sig.) for the effect of class or academic readiness on score gain was higher than the
alpha-value (0.05) defined for the analysis. Therefore the effect of only academic
readiness on score gain was not significant (p= 0.929). See Table 24. Then, there was no
a significant evidence to reject Ho in favor of Ha. This result indicated the score gain in
the challenge class was not statistically different from the core gain in the regular class
when a separation for treatment is not applied. The value of this not significant difference
was calculated in a contrast matrix using ANOVA and it was only 0.029 points when a
separation for treatment is not applied.
Like in the multiple -choice section, this result indicates that difference of score
gain between regular and challenge classes was not statistically significant when a
separation for treatments was not applied. A separation of both treatments between the
classes is tested later in the chapter- See hypothesis 3 for the essay in section 4.3.4.6.
Summary. For both sections of the test, the difference of score gain between
regular and challenge classes was not statistically significant. This result indicated that
the type of class students attended -regular versus challenge- had no effect on score gain.
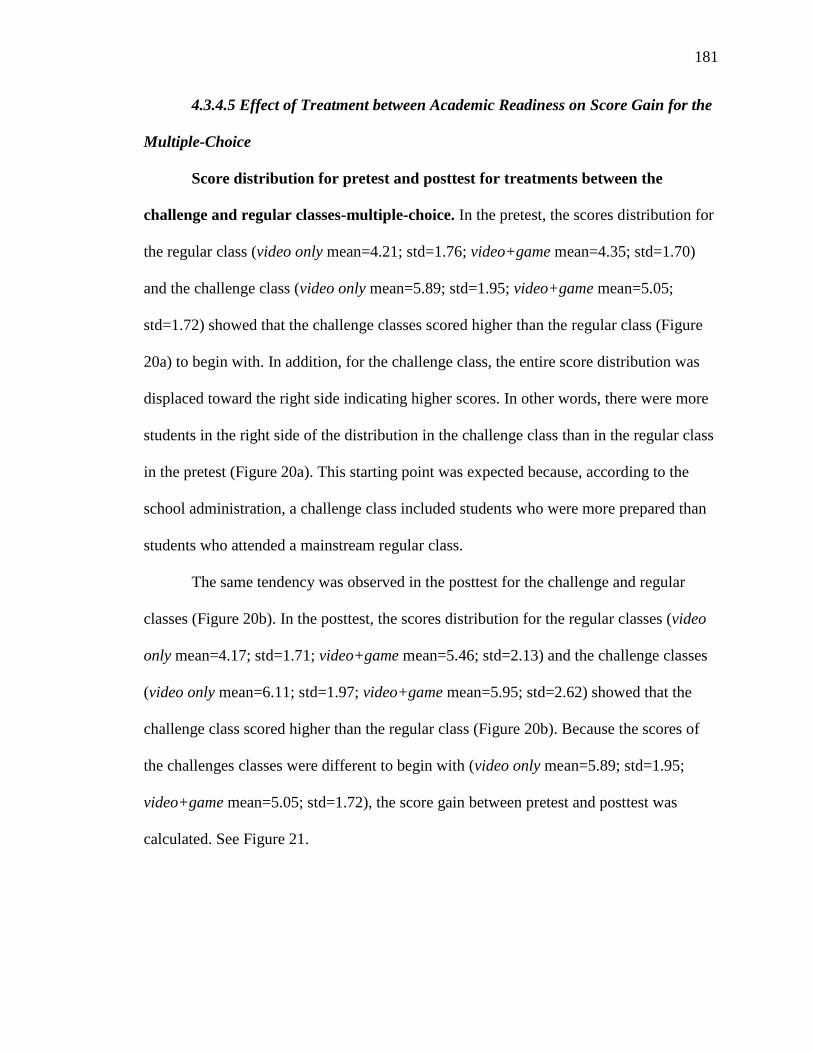
181
4.3.4.5 Effect of Treatment between Academic Readiness on Score Gain for the
Multiple-Choice
Score distribution for pretest and posttest for treatments between the
challenge and regular classes-multiple-choice. In the pretest, the scores distribution for
the regular class (video only mean=4.21; std=1.76; video+game mean=4.35; std=1.70)
and the challenge class (video only mean=5.89; std=1.95; video+game mean=5.05;
std=1.72) showed that the challenge classes scored higher than the regular class (Figure
20a) to begin with. In addition, for the challenge class, the entire score distribution was
displaced toward the right side indicating higher scores. In other words, there were more
students in the right side of the distribution in the challenge class than in the regular class
in the pretest (Figure 20a). This starting point was expected because, according to the
school administration, a challenge class included students who were more prepared than
students who attended a mainstream regular class.
The same tendency was observed in the posttest for the challenge and regular
classes (Figure 20b). In the posttest, the scores distribution for the regular classes (video
only mean=4.17; std=1.71; video+game mean=5.46; std=2.13) and the challenge classes
(video only mean=6.11; std=1.97; video+game mean=5.95; std=2.62) showed that the
challenge class scored higher than the regular class (Figure 20b). Because the scores of
the challenges classes were different to begin with (video only mean=5.89; std=1.95;
video+game mean=5.05; std=1.72), the score gain between pretest and posttest was
calculated. See Figure 21.
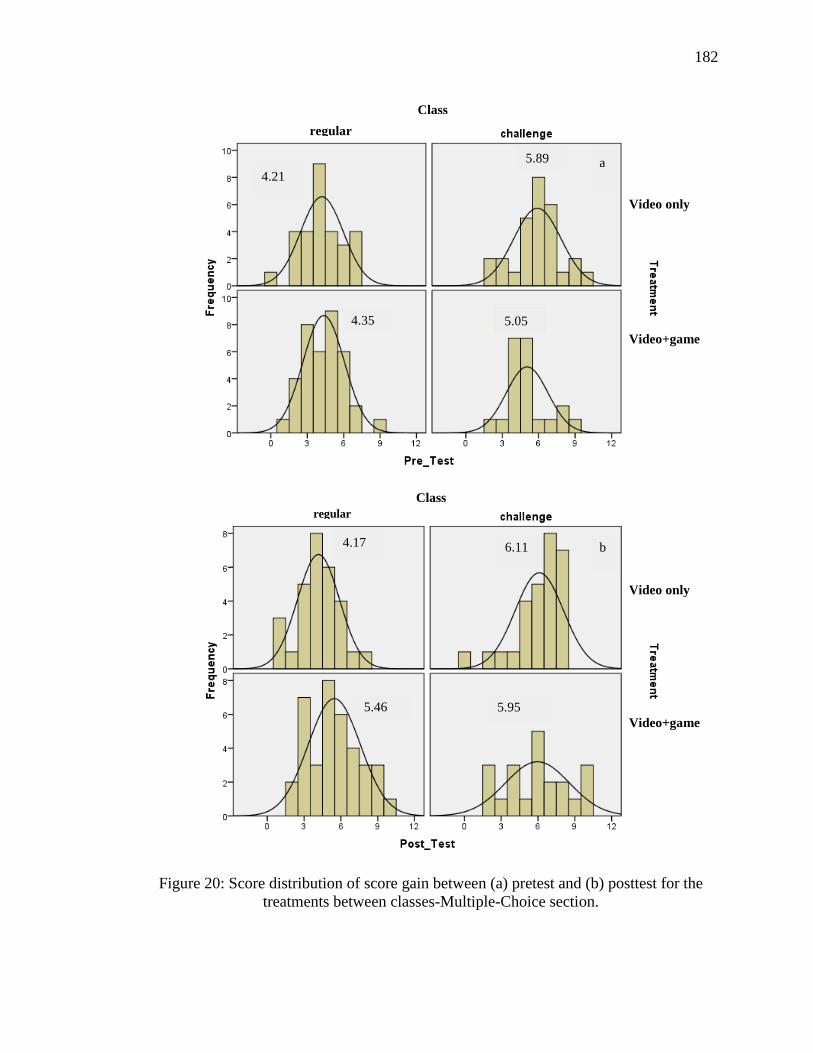
182
Figure 20: Score distribution of score gain between (a) pretest and (b) posttest for the
treatments between classes-Multiple-Choice section.
4.21
4.35
5.89
5.05
a
4.17
5.46
6.11
5.95
b
regular
regular
Class
ss
regular
Class
ss
regular
Video only
Video+game
Video only
Video+game
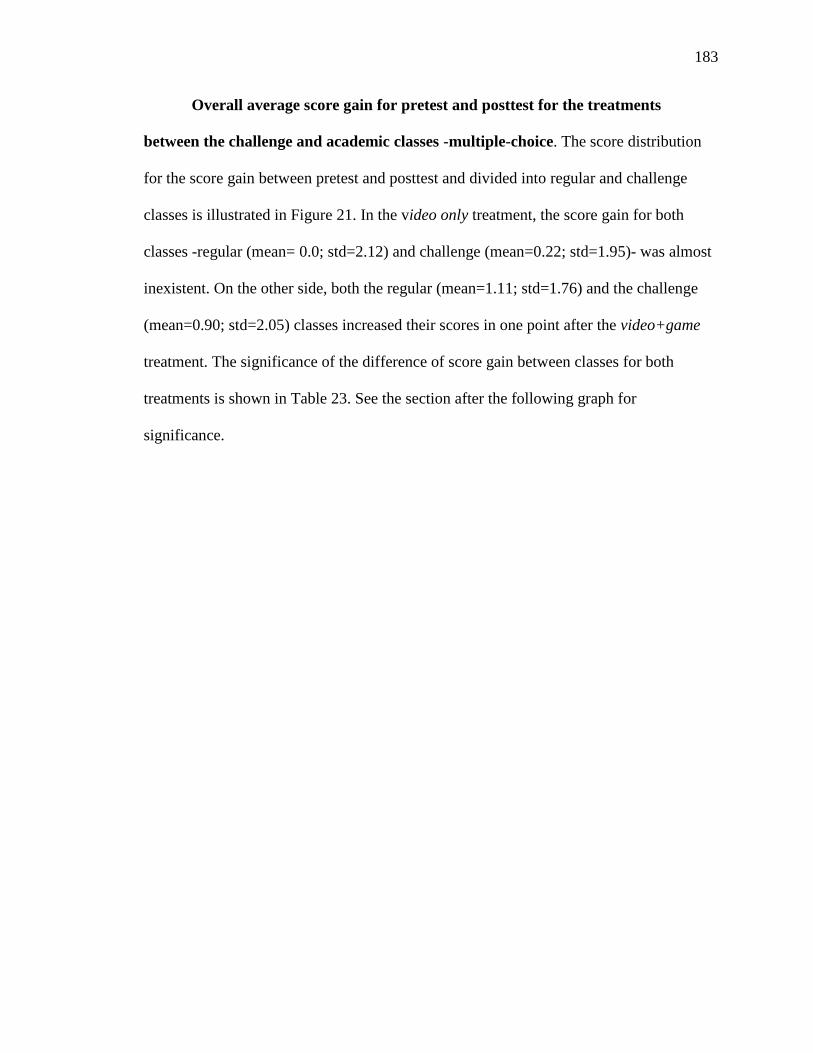
183
Overall average score gain for pretest and posttest for the treatments
between the challenge and academic classes -multiple-choice. The score distribution
for the score gain between pretest and posttest and divided into regular and challenge
classes is illustrated in Figure 21. In the video only treatment, the score gain for both
classes -regular (mean= 0.0; std=2.12) and challenge (mean=0.22; std=1.95)- was almost
inexistent. On the other side, both the regular (mean=1.11; std=1.76) and the challenge
(mean=0.90; std=2.05) classes increased their scores in one point after the video+game
treatment. The significance of the difference of score gain between classes for both
treatments is shown in Table 23. See the section after the following graph for
significance.
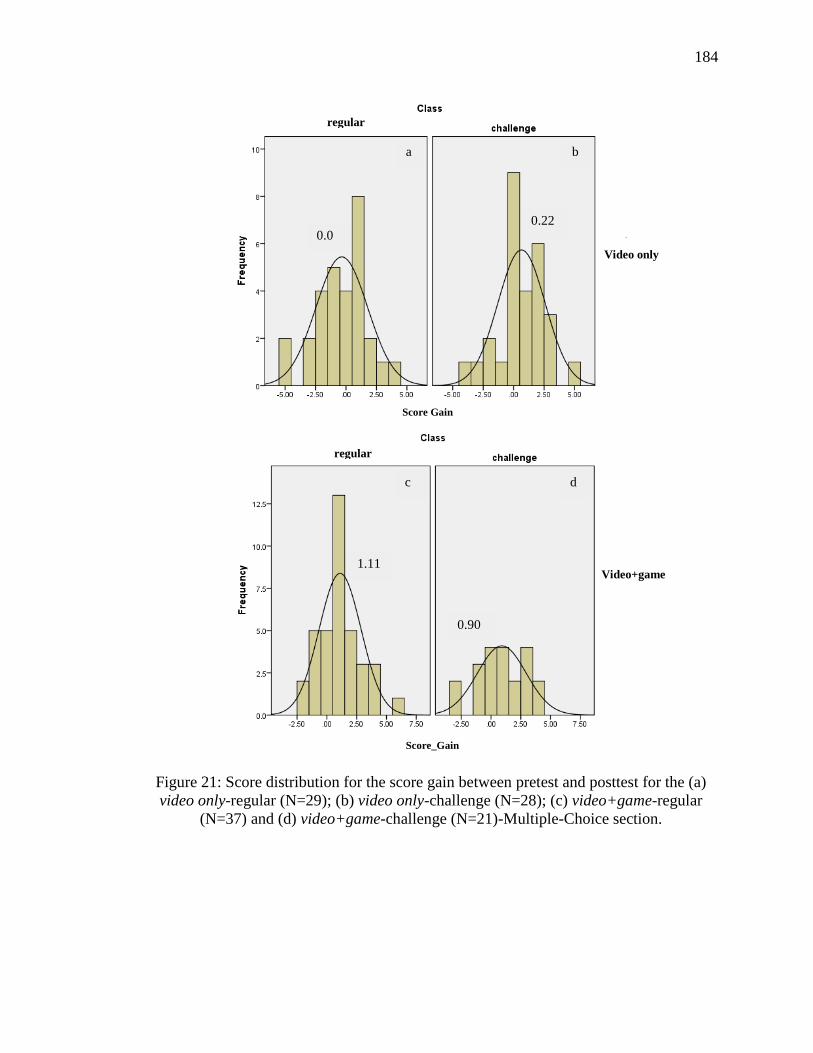
184
Figure 21: Score distribution for the score gain between pretest and posttest for the (a)
video only-regular (N=29); (b) video only-challenge (N=28); (c) video+game-regular
(N=37) and (d) video+game-challenge (N=21)-Multiple-Choice section.
0.22
a
d
0.0
regular
regular
Score Gain
Score_Gain
Video only
Video+game
b
1.11
0.90
c
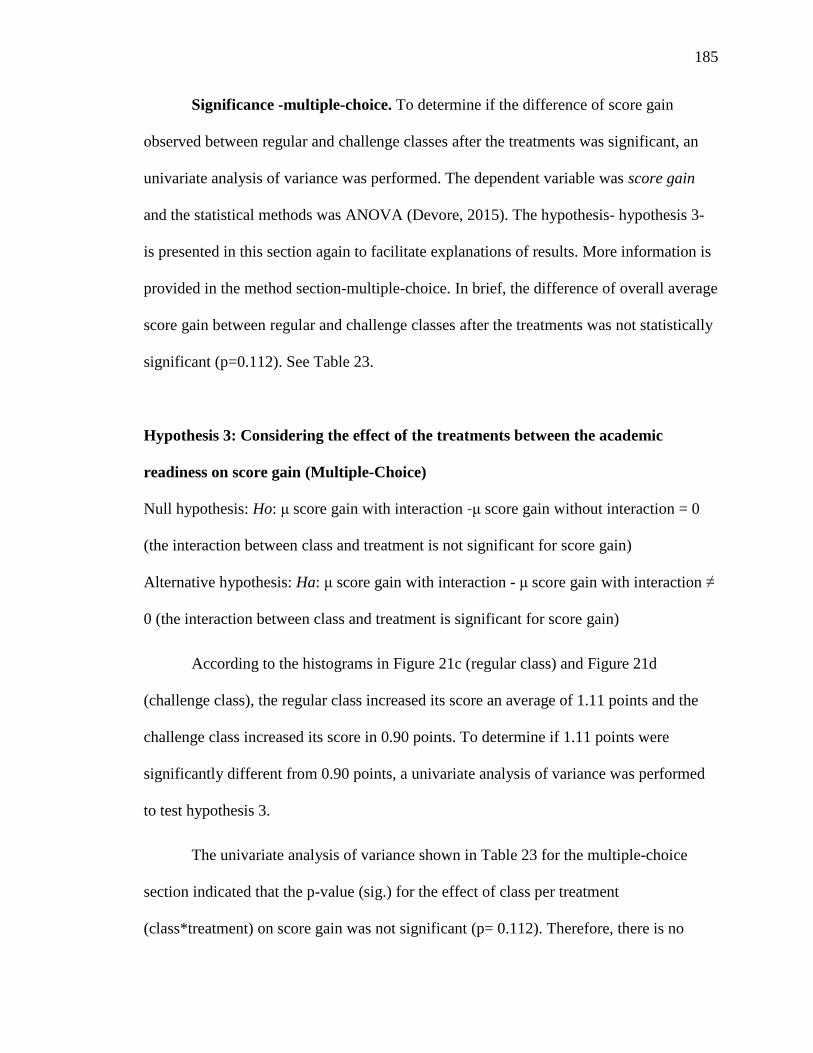
185
Significance -multiple-choice. To determine if the difference of score gain
observed between regular and challenge classes after the treatments was significant, an
univariate analysis of variance was performed. The dependent variable was score gain
and the statistical methods was ANOVA (Devore, 2015). The hypothesis- hypothesis 3-
is presented in this section again to facilitate explanations of results. More information is
provided in the method section-multiple-choice. In brief, the difference of overall average
score gain between regular and challenge classes after the treatments was not statistically
significant (p=0.112). See Table 23.
Hypothesis 3: Considering the effect of the treatments between the academic
readiness on score gain (Multiple-Choice)
Null hypothesis: Ho: μ score gain with interaction -μ score gain without interaction = 0
(the interaction between class and treatment is not significant for score gain)
Alternative hypothesis: Ha: μ score gain with interaction - μ score gain with interaction ≠
0 (the interaction between class and treatment is significant for score gain)
According to the histograms in Figure 21c (regular class) and Figure 21d
(challenge class), the regular class increased its score an average of 1.11 points and the
challenge class increased its score in 0.90 points. To determine if 1.11 points were
significantly different from 0.90 points, a univariate analysis of variance was performed
to test hypothesis 3.
The univariate analysis of variance shown in Table 23 for the multiple-choice
section indicated that the p-value (sig.) for the effect of class per treatment
(class*treatment) on score gain was not significant (p= 0.112). Therefore, there is no
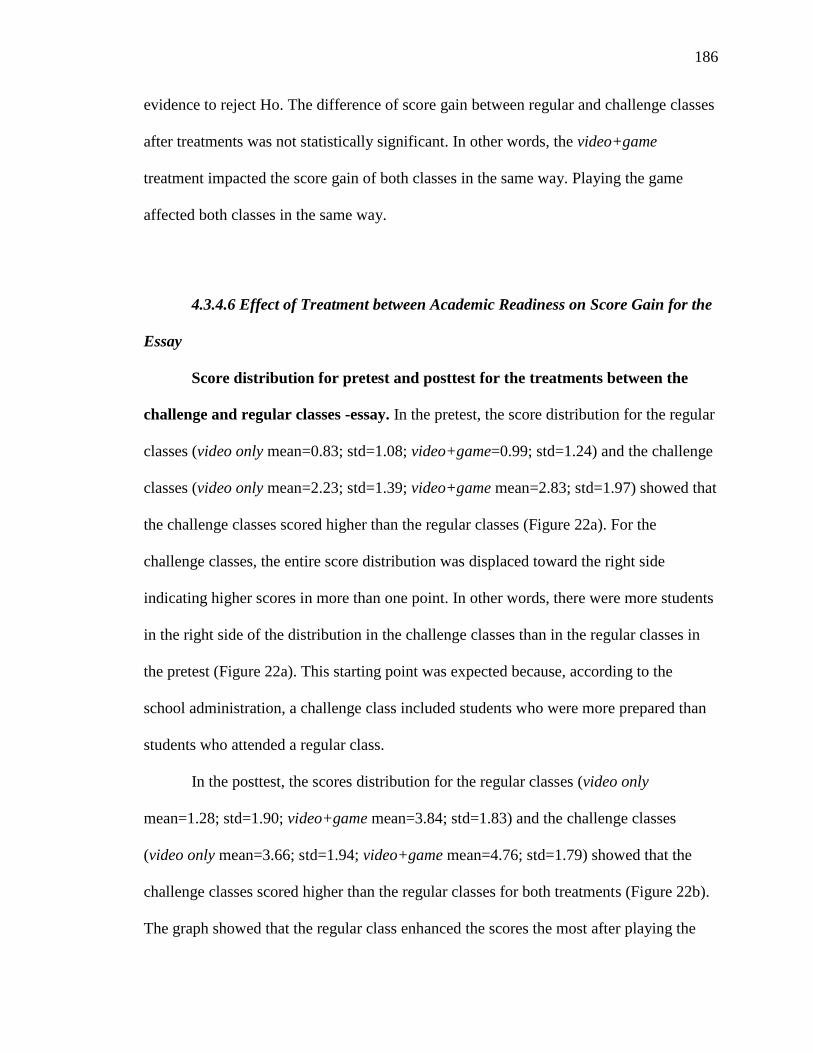
186
evidence to reject Ho. The difference of score gain between regular and challenge classes
after treatments was not statistically significant. In other words, the video+game
treatment impacted the score gain of both classes in the same way. Playing the game
affected both classes in the same way.
4.3.4.6 Effect of Treatment between Academic Readiness on Score Gain for the
Essay
Score distribution for pretest and posttest for the treatments between the
challenge and regular classes -essay. In the pretest, the score distribution for the regular
classes (video only mean=0.83; std=1.08; video+game=0.99; std=1.24) and the challenge
classes (video only mean=2.23; std=1.39; video+game mean=2.83; std=1.97) showed that
the challenge classes scored higher than the regular classes (Figure 22a). For the
challenge classes, the entire score distribution was displaced toward the right side
indicating higher scores in more than one point. In other words, there were more students
in the right side of the distribution in the challenge classes than in the regular classes in
the pretest (Figure 22a). This starting point was expected because, according to the
school administration, a challenge class included students who were more prepared than
students who attended a regular class.
In the posttest, the scores distribution for the regular classes (video only
mean=1.28; std=1.90; video+game mean=3.84; std=1.83) and the challenge classes
(video only mean=3.66; std=1.94; video+game mean=4.76; std=1.79) showed that the
challenge classes scored higher than the regular classes for both treatments (Figure 22b).
The graph showed that the regular class enhanced the scores the most after playing the
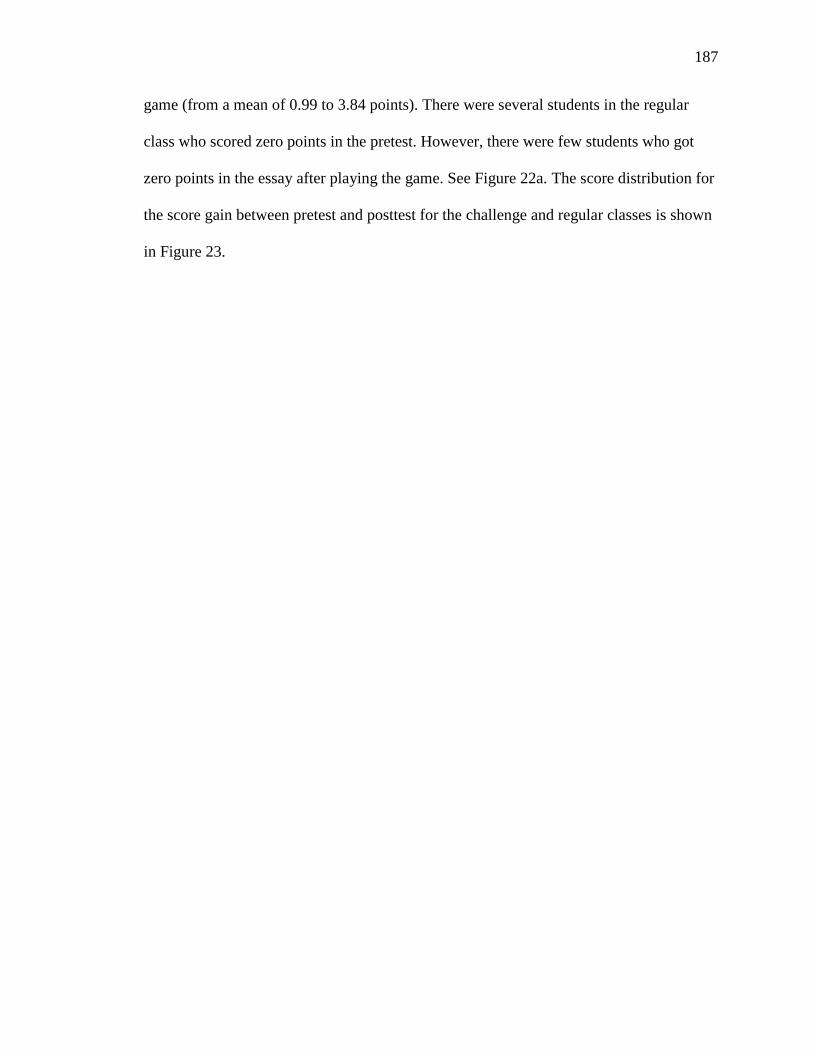
187
game (from a mean of 0.99 to 3.84 points). There were several students in the regular
class who scored zero points in the pretest. However, there were few students who got
zero points in the essay after playing the game. See Figure 22a. The score distribution for
the score gain between pretest and posttest for the challenge and regular classes is shown
in Figure 23.
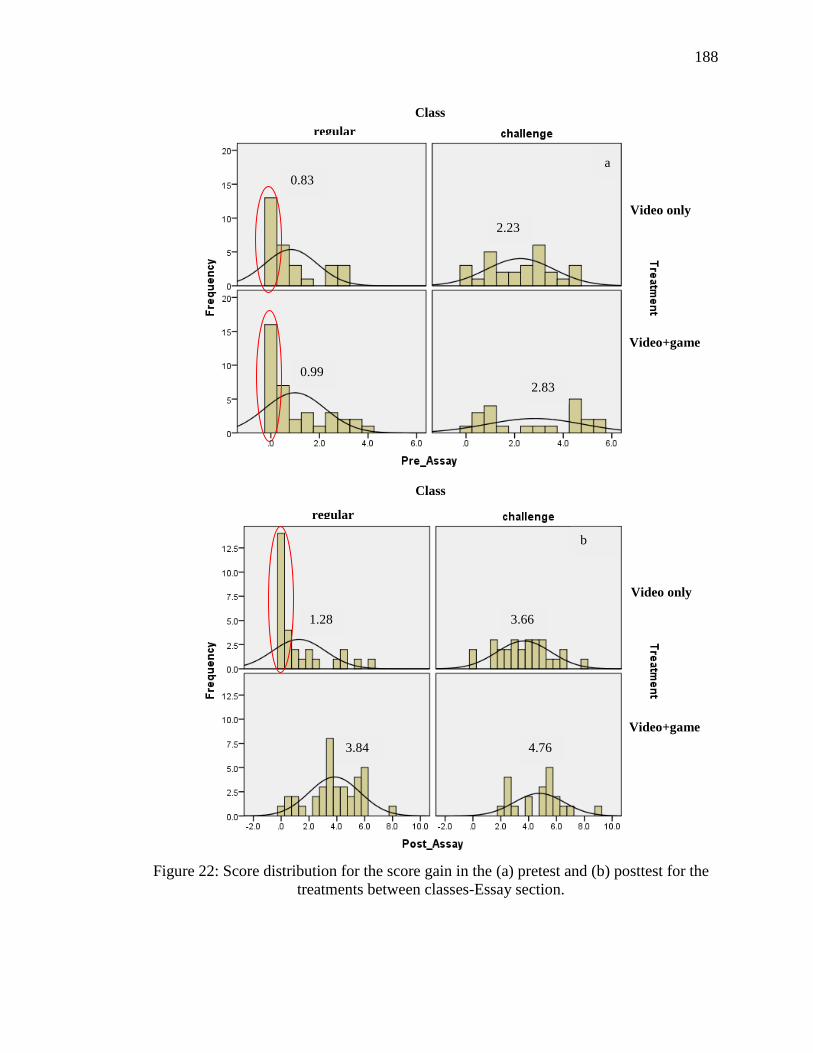
188
Figure 22: Score distribution for the score gain in the (a) pretest and (b) posttest for the
treatments between classes-Essay section.
a
b
0.83
2.23
0.99
2.83
regular
Class
Class
Video only
Video+game
Video only
Video+game
regular
1.28 3.66
3.84 4.76
regular
regular
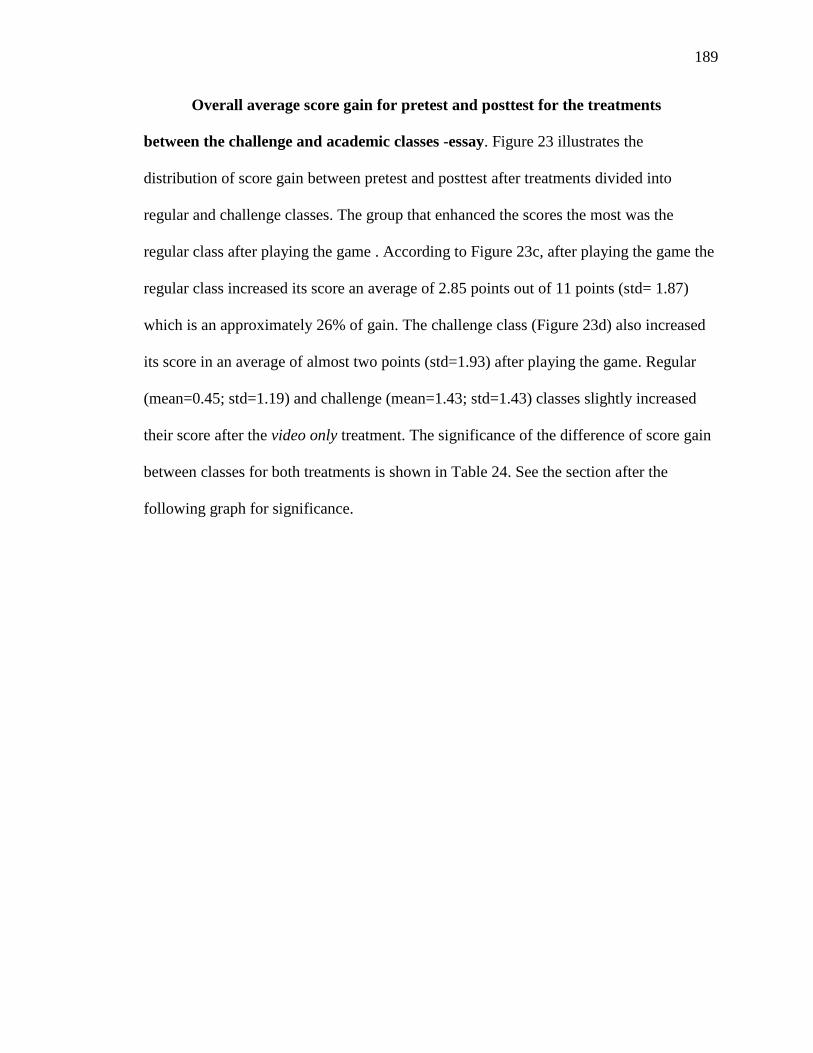
189
Overall average score gain for pretest and posttest for the treatments
between the challenge and academic classes -essay. Figure 23 illustrates the
distribution of score gain between pretest and posttest after treatments divided into
regular and challenge classes. The group that enhanced the scores the most was the
regular class after playing the game . According to Figure 23c, after playing the game the
regular class increased its score an average of 2.85 points out of 11 points (std= 1.87)
which is an approximately 26% of gain. The challenge class (Figure 23d) also increased
its score in an average of almost two points (std=1.93) after playing the game. Regular
(mean=0.45; std=1.19) and challenge (mean=1.43; std=1.43) classes slightly increased
their score after the video only treatment. The significance of the difference of score gain
between classes for both treatments is shown in Table 24. See the section after the
following graph for significance.
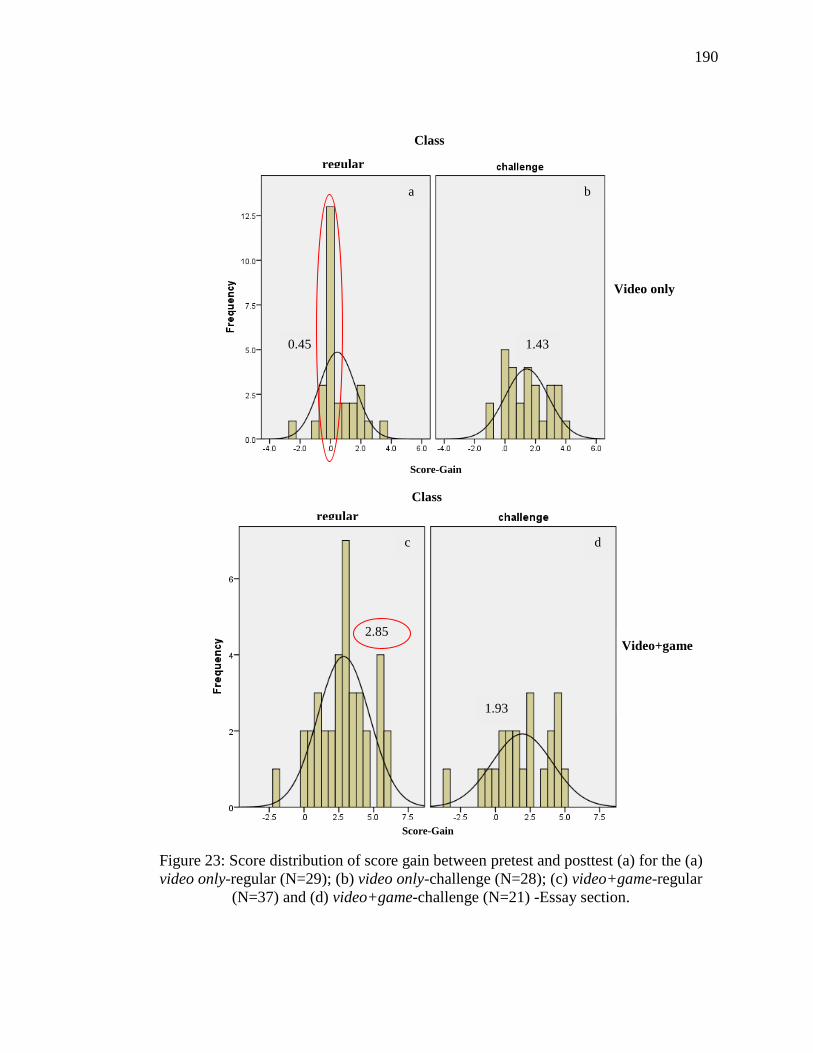
190
Figure 23: Score distribution of score gain between pretest and posttest (a) for the (a)
video only-regular (N=29); (b) video only-challenge (N=28); (c) video+game-regular
(N=37) and (d) video+game-challenge (N=21) -Essay section.
2.85
a
0.45
1.93
Class
Class
regular
regular
Score-Gain
Score-Gain
Video only
Video+game
b
c d
1.43

191
Significance -essay. To determine if the difference of score gain observed
between regular and challenge classes after treatments was significant, a univariate
analysis of variance was performed. The dependent variable was score gain and the
statistical methods was ANOVA (Devore, 2015). The hypothesis -hypothesis 3- is
presented in this section again to facilitate explanations of results. More information is
provided in the method section-essay. In brief, the difference of overall average score
gain between regular and challenge classes for both treatments was statistically
significant (p=0.004). See Table 24.
Hypothesis 3: Considering the effect of treatments between the academic readiness
on score gain (Essay)
Null hypothesis: Ho: μ score gain with interaction =μ score gain without
interaction (the interaction between class and treatment is not significant for score gain)
Alternative hypothesis: Ha: μ score gain with interaction ≠ μ score gain without
interaction (the interaction between class and treatment is significant for score gain)
According to the histograms in Figure 23c (regular class) and Figure 23d
(challenge class), the regular class increased its score an average of 2.85 points and the
challenge class increased its score in 1.93 points. To determine if 2.85 points were
significantly different from 1.93 points, a univariate analysis of variance was performed
to test hypothesis 3.
The univariate analysis of variance shown in Table 24 indicated that the p-value
(sig.) for the effect of class on score gain after playing the game is significant (p= 0.004).
Therefore, Ho is rejected in favor of Ha. This means that 2.85 points of score gain in the
192
regular class was statistically different than the 1.93 points of score gain in the challenge
class. Playing the game had a higher impact on increasing the scores in the essay of
students who attended the regular class.
Summary. Students in the whole class achieved higher scores in the posttest after
both treatments. Playing the game after watching the video had a positive impact on score
gain over just watching the video. Students who played the game achieved higher score
than those students who only watched the ETC video. The impact of playing the Electron
Chute game on score gain in the challenge and regular classes was positive. Electron
Chute impacted both classes in the same way when considering the information provided
by the multiple-choice section. However, the score gain was higher in the regular class
after playing the game when considering the information provided by the essay. Overall,
students in both classes achieved higher scores after playing the game. Students who
attended the challenge class achieved the highest score in the multiple-choice and essay
sections of the test, in both pretest and posttest, and for both treatments. Therefore, the
impact of the game was measured by comparing the score gain between pretest and
posttest after treatments.
193
4.3.5 Correlation between Variables
Pearson correlation. The correlation (r) between scores in the pretest and
posttest were calculated using SPSS. There was a significant and moderate positive
correlation between students' scores in the pretest (Fig. 10; mean= 6.40; std= 2.61) and
posttest (mean= 9.0; std= 3.74), r(113)=0.576, p=0.000. The relationship was also
significant and moderate between pretest (Fig. 10; mean=4.83; std=1.84) and posttest
(mean= 5.41; std=2.21) in the multiple-choice, r(113)=0.515, p=0.000. Likewise,
relationship was significant and moderate between pretest (Fig. 11; mean=1.57; std=1.60)
and posttest (mean=3.60; std=2.35) in the essay, r(113)=0.550, p=0.000.
However, there was no predictable relationship between the multiple-choice and
essay scores. In the pretest, there was not a significant relationship between the scores in
the multiple-choice and essay, r(113)=0.151, p=0.106. In the posttest after treatments,
there was a significant but weak relationship between both variables, r(113)=0.349,
p=0.000. In other words, students who scored well on the multiple-choice section did not
necessarily scored well on the essay section of the same test - either pretest or posttest.
That results might indicate that some students might perform better in a multiple-choice
format than in an essay, and vice versa.
Another explanation for the no significant relationship between the scores in the
multiple-choice and essay in the pretest could be related to the ETC content in both
sections of the instrument. The content of the essay -11 points- was exclusively about the
ETC process students learned after the treatments. The multiple-choice section included
194
four items -four out of 12 points- about photosynthesis they learned during the lessons
previous to the treatments. The rest eight items were about ETC.
Considering only the ETC content knowledge, students might have had similar
points to begin (data not available). In this study, this situation was addressed evaluating
and analyzing students' score gain between pretest and posttest after the treatments.
In the video only treatment, there was a significant and strong positive correlation
between students' scores in the pretest (mean=6.53; std=2.53) and posttest (mean=7.77;
std=3.68), r(55)=0.690, p=0.000. The correlation was significant and moderate between
the multiple-choice section of the pretest (mean=5.04; std=2.03) and posttest
(mean=5.12; std=2.05), r(55)=0.466, p=0.000. The correlation was significant and very
strong between the essay section of the pretest (mean=1.52; std=1.41) and posttest
(mean=2.45; std=2.38), r(55)=0.827, p=0.000. This strong correlation in the essay could
be explained by the low score mean in both the pretest and posttest and, therefore, to the
large number of students who obtained low scores in the essay.
In the video+game treatment, the relationship between the scores in the pretest
(mean=6.28; std=2.71) and posttest (mean=10.22; std=3.43) was significant and
moderate, r(56)=0.569, p=0.000. The correlation was significant and strong between the
multiple-choice section of the pretest (mean=4.60; std=1.73) and posttest (mean=5.64;
std=2.31), r(56)=0.611, p=0.000. The correlation was significant and very weak between
the essay section of the pretest (mean=1.66; std=1.78) and posttest (mean=4.17;
std=1.88), r(55)=0.362, p=0.000 in the video+game treatment. This weak correlation
means that those students who got low scores in the pretest did not necessarily get low
195
scores in the posttest after playing the game, and vice versa. This is a positive result
because it suggested that students in the video+game group who performed poorly in the
essay section might have performed better after playing the game.
4.4 Class Recording Results
Participants of the video+game treatment were recorded while playing Electron
Chute. Three randomly selected station per class were recorded using an audio camera to
describe the students' conversations while playing the game and their individual
interactions with the game. A total of nine videos of 20 minutes long were recorded by
the researcher team and analyzed by the researcher. Each video recorded 3-4 students
playing the game.
The total number of students recorded was 34 students (N=34), 15 girls and 19
boys. The researcher marked "1" when the action was present and "0" for absent
(Krippendorf, 2014). Students' names were modified respecting their ethnic background.
Results are presented in Table 25. Table 26 shows a comparison between boys and girls
in regard to the game actions they performed while playing the game. Figure 24 shows
the percentage of actions performed by the players within their community of peers.
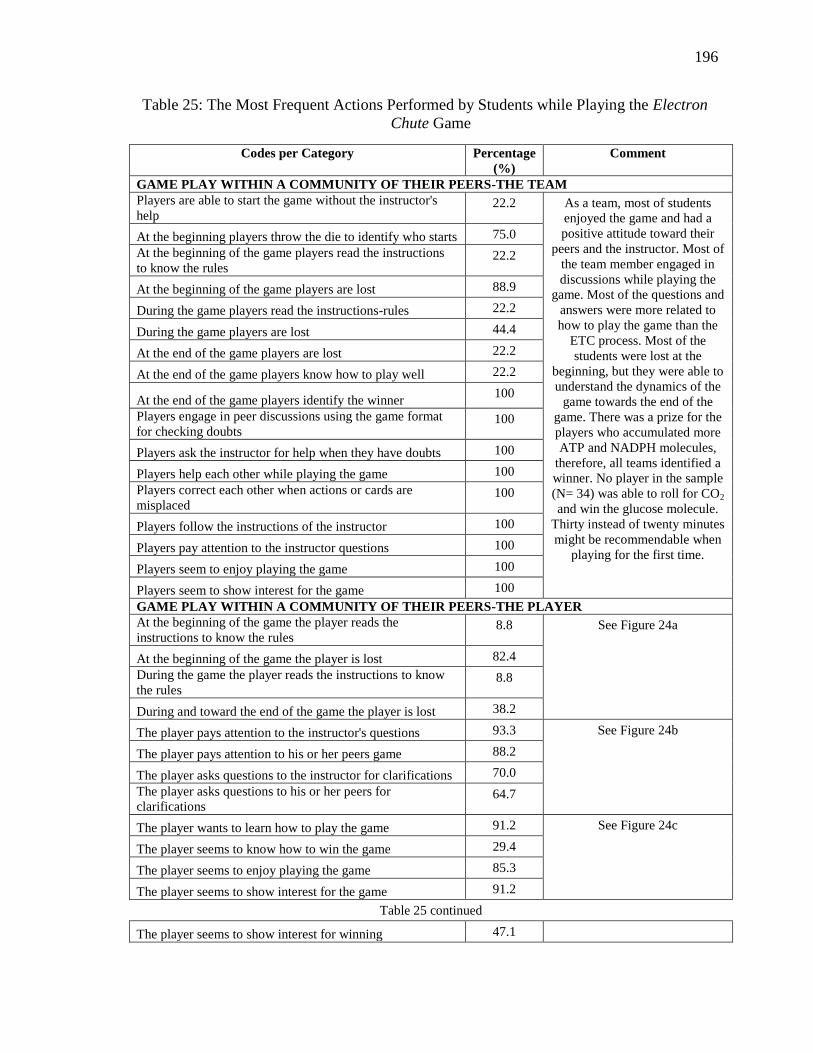
196
Table 25: The Most Frequent Actions Performed by Students while Playing the Electron
Chute Game
Codes per Category Percentage
(%)
Comment
GAME PLAY WITHIN A COMMUNITY OF THEIR PEERS-THE TEAM
Players are able to start the game without the instructor's
help 22.2 As a team, most of students
enjoyed the game and had a
positive attitude toward their
peers and the instructor. Most of
the team member engaged in
discussions while playing the
game. Most of the questions and
answers were more related to
how to play the game than the
ETC process. Most of the
students were lost at the
beginning, but they were able to
understand the dynamics of the
game towards the end of the
game. There was a prize for the
players who accumulated more
ATP and NADPH molecules,
therefore, all teams identified a
winner. No player in the sample
(N= 34) was able to roll for CO2
and win the glucose molecule.
Thirty instead of twenty minutes
might be recommendable when
playing for the first time.
At the beginning players throw the die to identify who starts 75.0
At the beginning of the game players read the instructions
to know the rules 22.2
At the beginning of the game players are lost 88.9
During the game players read the instructions-rules 22.2
During the game players are lost 44.4
At the end of the game players are lost 22.2
At the end of the game players know how to play well 22.2
At the end of the game players identify the winner 100
Players engage in peer discussions using the game format
for checking doubts 100
Players ask the instructor for help when they have doubts 100
Players help each other while playing the game 100
Players correct each other when actions or cards are
misplaced 100
Players follow the instructions of the instructor 100
Players pay attention to the instructor questions 100
Players seem to enjoy playing the game 100
Players seem to show interest for the game 100
GAME PLAY WITHIN A COMMUNITY OF THEIR PEERS-THE PLAYER
At the beginning of the game the player reads the
instructions to know the rules 8.8 See Figure 24a
At the beginning of the game the player is lost 82.4
During the game the player reads the instructions to know
the rules 8.8
During and toward the end of the game the player is lost 38.2
The player pays attention to the instructor's questions 93.3 See Figure 24b
The player pays attention to his or her peers game 88.2
The player asks questions to the instructor for clarifications 70.0
The player asks questions to his or her peers for
clarifications 64.7
The player wants to learn how to play the game 91.2 See Figure 24c
The player seems to know how to win the game 29.4
The player seems to enjoy playing the game 85.3
The player seems to show interest for the game 91.2
Table 25 continued
The player seems to show interest for winning 47.1
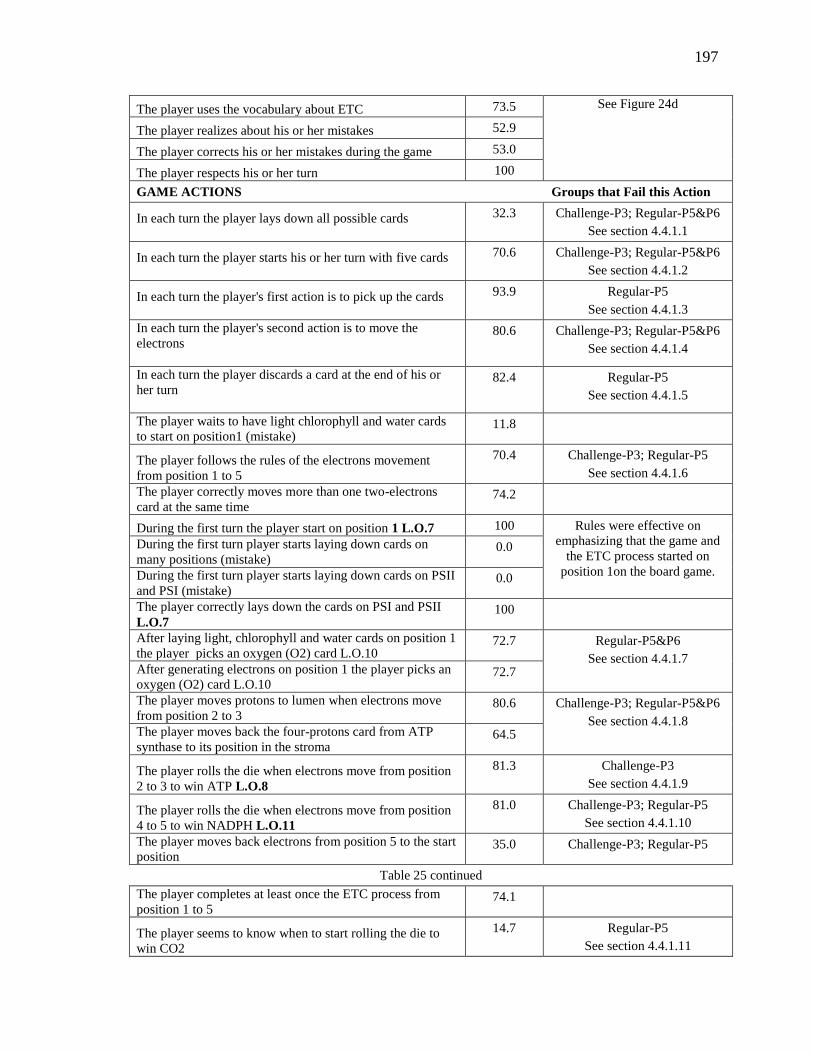
197
The player uses the vocabulary about ETC 73.5 See Figure 24d
The player realizes about his or her mistakes 52.9
The player corrects his or her mistakes during the game 53.0
The player respects his or her turn 100
GAME ACTIONS Groups that Fail this Action
In each turn the player lays down all possible cards
32.3 Challenge-P3; Regular-P5&P6
See section 4.4.1.1
In each turn the player starts his or her turn with five cards
70.6 Challenge-P3; Regular-P5&P6
See section 4.4.1.2
In each turn the player's first action is to pick up the cards
93.9 Regular-P5
See section 4.4.1.3
In each turn the player's second action is to move the
electrons
80.6 Challenge-P3; Regular-P5&P6
See section 4.4.1.4
In each turn the player discards a card at the end of his or
her turn
82.4 Regular-P5
See section 4.4.1.5
The player waits to have light chlorophyll and water cards
to start on position1 (mistake) 11.8
The player follows the rules of the electrons movement
from position 1 to 5
70.4 Challenge-P3; Regular-P5
See section 4.4.1.6
The player correctly moves more than one two-electrons
card at the same time 74.2
During the first turn the player start on position 1 L.O.7 100 Rules were effective on
emphasizing that the game and
the ETC process started on
position 1on the board game.
During the first turn player starts laying down cards on
many positions (mistake) 0.0
During the first turn player starts laying down cards on PSII
and PSI (mistake) 0.0
The player correctly lays down the cards on PSI and PSII
L.O.7 100
After laying light, chlorophyll and water cards on position 1
the player picks an oxygen (O2) card L.O.10 72.7 Regular-P5&P6
See section 4.4.1.7 After generating electrons on position 1 the player picks an
oxygen (O2) card L.O.10 72.7
The player moves protons to lumen when electrons move
from position 2 to 3 80.6 Challenge-P3; Regular-P5&P6
See section 4.4.1.8 The player moves back the four-protons card from ATP
synthase to its position in the stroma 64.5
The player rolls the die when electrons move from position
2 to 3 to win ATP L.O.8
81.3 Challenge-P3
See section 4.4.1.9
The player rolls the die when electrons move from position
4 to 5 to win NADPH L.O.11
81.0 Challenge-P3; Regular-P5
See section 4.4.1.10
The player moves back electrons from position 5 to the start
position 35.0 Challenge-P3; Regular-P5
Table 25 continued
The player completes at least once the ETC process from
position 1 to 5 74.1
The player seems to know when to start rolling the die to
win CO2
14.7 Regular-P5
See section 4.4.1.11
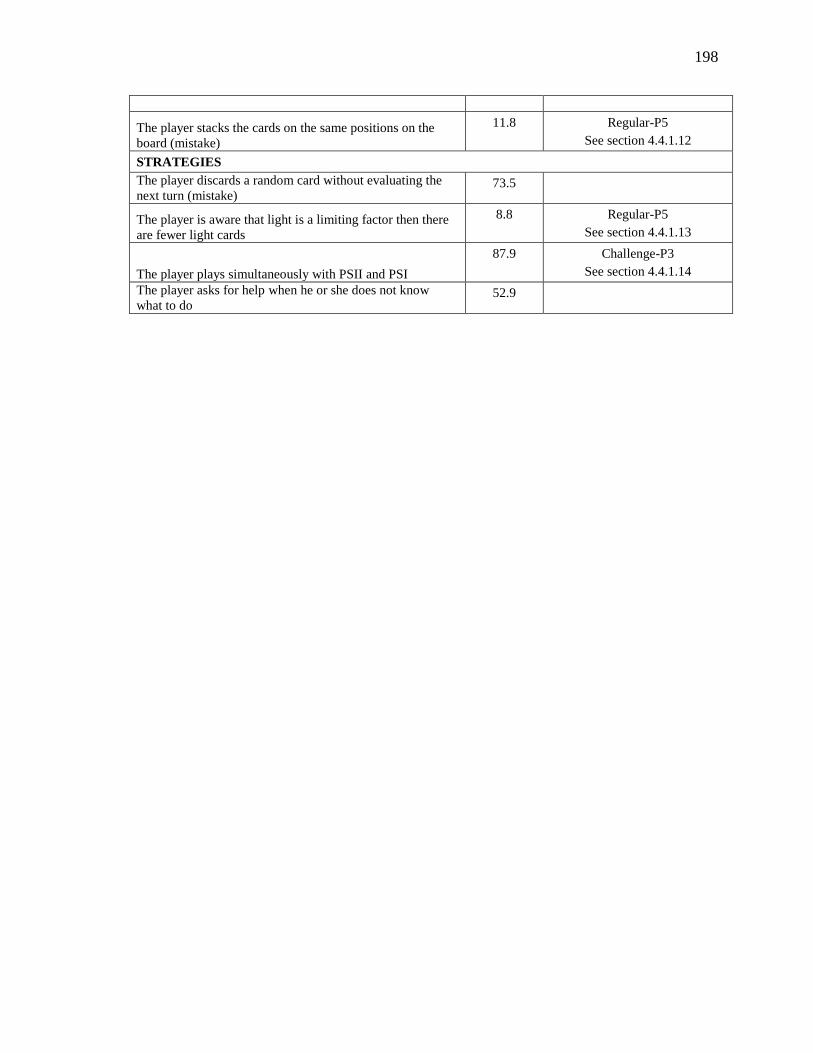
198
The player stacks the cards on the same positions on the
board (mistake)
11.8 Regular-P5
See section 4.4.1.12
STRATEGIES
The player discards a random card without evaluating the
next turn (mistake) 73.5
The player is aware that light is a limiting factor then there
are fewer light cards
8.8 Regular-P5
See section 4.4.1.13
The player plays simultaneously with PSII and PSI
87.9 Challenge-P3
See section 4.4.1.14
The player asks for help when he or she does not know
what to do 52.9
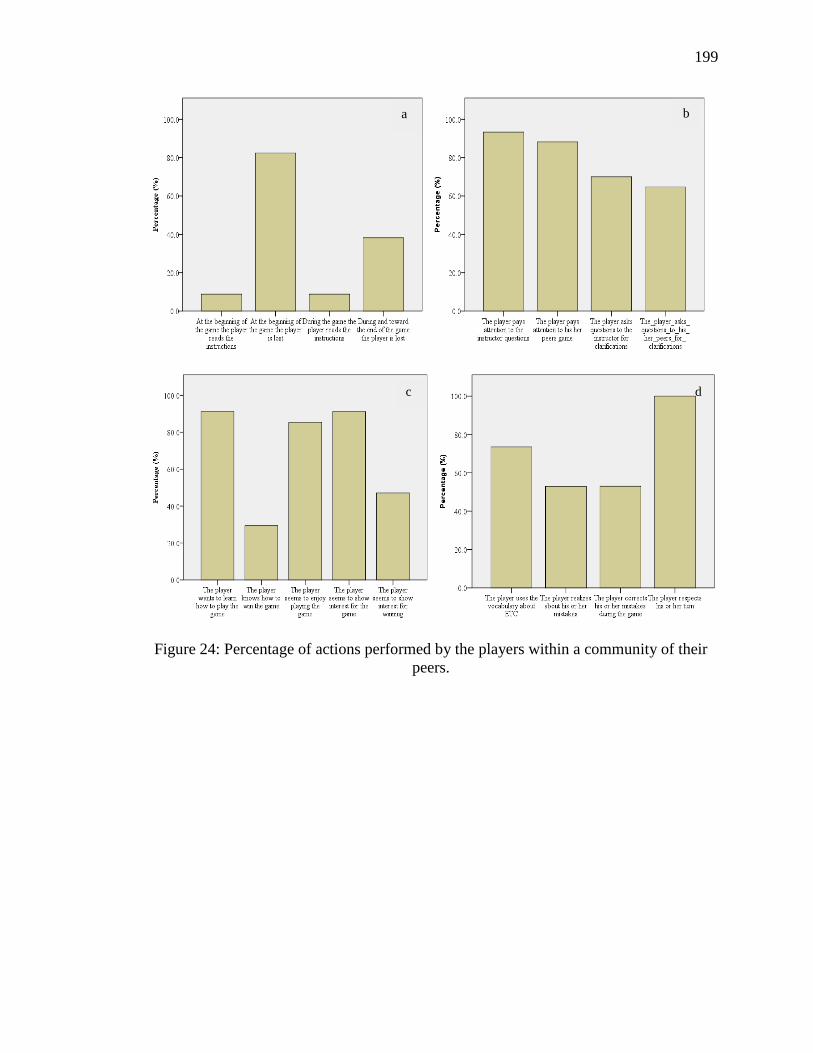
199
Figure 24: Percentage of actions performed by the players within a community of their
peers.
a b
c d
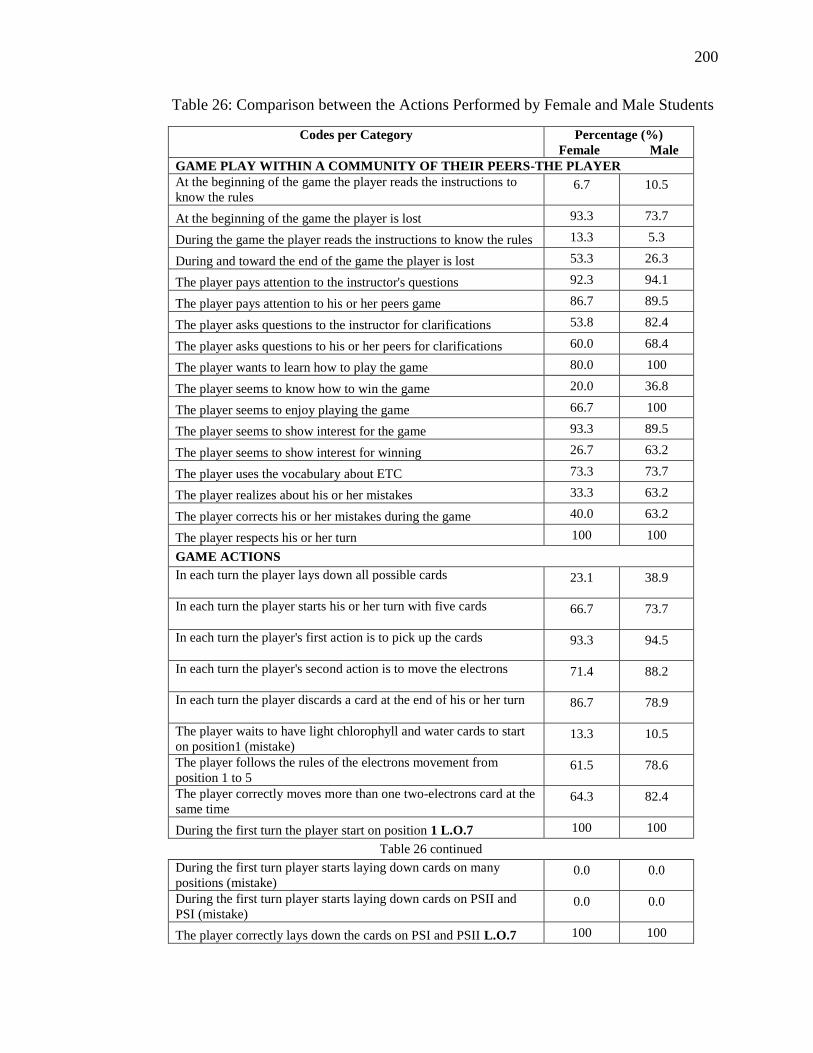
200
Table 26: Comparison between the Actions Performed by Female and Male Students
Codes per Category Percentage (%)
Female Male
GAME PLAY WITHIN A COMMUNITY OF THEIR PEERS-THE PLAYER
At the beginning of the game the player reads the instructions to
know the rules 6.7 10.5
At the beginning of the game the player is lost 93.3 73.7
During the game the player reads the instructions to know the rules 13.3 5.3
During and toward the end of the game the player is lost 53.3 26.3
The player pays attention to the instructor's questions 92.3 94.1
The player pays attention to his or her peers game 86.7 89.5
The player asks questions to the instructor for clarifications 53.8 82.4
The player asks questions to his or her peers for clarifications 60.0 68.4
The player wants to learn how to play the game 80.0 100
The player seems to know how to win the game 20.0 36.8
The player seems to enjoy playing the game 66.7 100
The player seems to show interest for the game 93.3 89.5
The player seems to show interest for winning 26.7 63.2
The player uses the vocabulary about ETC 73.3 73.7
The player realizes about his or her mistakes 33.3 63.2
The player corrects his or her mistakes during the game 40.0 63.2
The player respects his or her turn 100 100
GAME ACTIONS
In each turn the player lays down all possible cards
23.1 38.9
In each turn the player starts his or her turn with five cards
66.7 73.7
In each turn the player's first action is to pick up the cards
93.3 94.5
In each turn the player's second action is to move the electrons
71.4 88.2
In each turn the player discards a card at the end of his or her turn
86.7 78.9
The player waits to have light chlorophyll and water cards to start
on position1 (mistake) 13.3 10.5
The player follows the rules of the electrons movement from
position 1 to 5 61.5 78.6
The player correctly moves more than one two-electrons card at the
same time 64.3 82.4
During the first turn the player start on position 1 L.O.7 100 100
Table 26 continued
During the first turn player starts laying down cards on many
positions (mistake) 0.0 0.0
During the first turn player starts laying down cards on PSII and
PSI (mistake) 0.0 0.0
The player correctly lays down the cards on PSI and PSII L.O.7 100 100
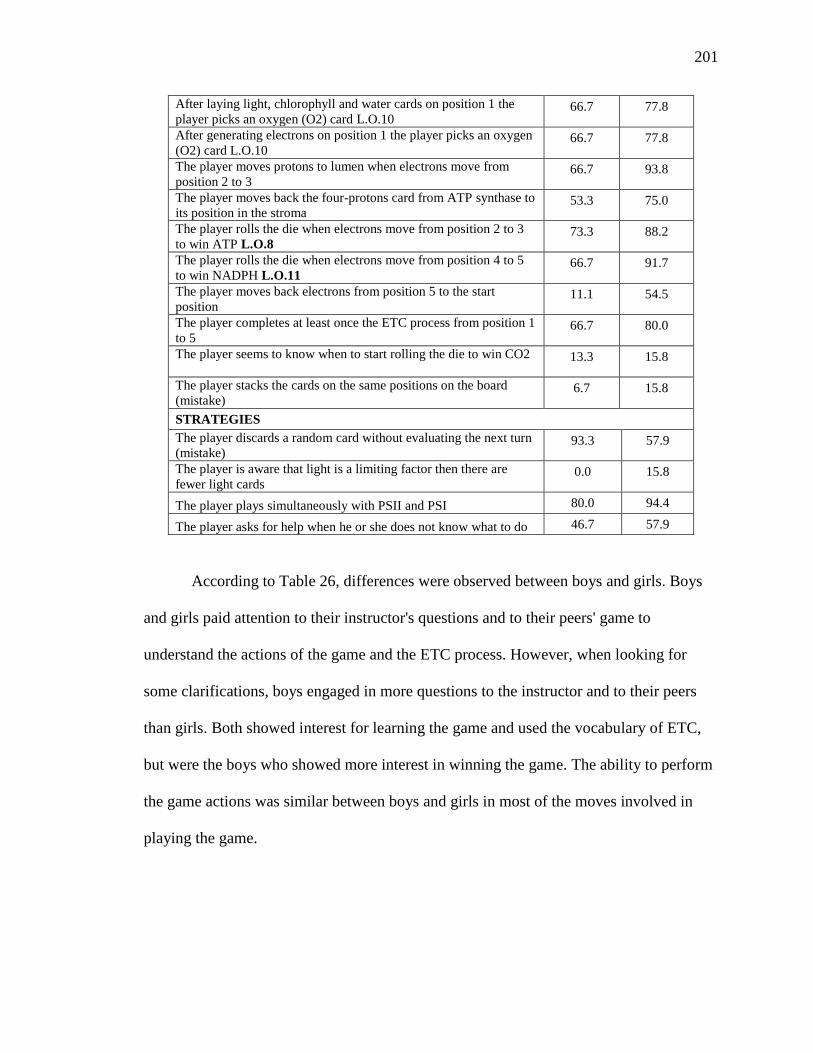
201
After laying light, chlorophyll and water cards on position 1 the
player picks an oxygen (O2) card L.O.10 66.7 77.8
After generating electrons on position 1 the player picks an oxygen
(O2) card L.O.10 66.7 77.8
The player moves protons to lumen when electrons move from
position 2 to 3 66.7 93.8
The player moves back the four-protons card from ATP synthase to
its position in the stroma 53.3 75.0
The player rolls the die when electrons move from position 2 to 3
to win ATP L.O.8 73.3 88.2
The player rolls the die when electrons move from position 4 to 5
to win NADPH L.O.11 66.7 91.7
The player moves back electrons from position 5 to the start
position 11.1 54.5
The player completes at least once the ETC process from position 1
to 5 66.7 80.0
The player seems to know when to start rolling the die to win CO2
13.3 15.8
The player stacks the cards on the same positions on the board
(mistake) 6.7 15.8
STRATEGIES
The player discards a random card without evaluating the next turn
(mistake) 93.3 57.9
The player is aware that light is a limiting factor then there are
fewer light cards 0.0 15.8
The player plays simultaneously with PSII and PSI 80.0 94.4
The player asks for help when he or she does not know what to do 46.7 57.9
According to Table 26, differences were observed between boys and girls. Boys
and girls paid attention to their instructor's questions and to their peers' game to
understand the actions of the game and the ETC process. However, when looking for
some clarifications, boys engaged in more questions to the instructor and to their peers
than girls. Both showed interest for learning the game and used the vocabulary of ETC,
but were the boys who showed more interest in winning the game. The ability to perform
the game actions was similar between boys and girls in most of the moves involved in
playing the game.
202
4.4.1 Game Actions that do not Follow the Rules
This section showed the moves and actions students were doing while playing the
game. These actions have the particularity that do not follow the rules explained to the
students before playing the game. These rules were developed by the researcher based on
the learning objectives of the game. Before starting playing, the researcher gave to each
one of the classes a presentation about the rules (Appendix G). Also, each team received
the instructions with the rules in a hard copy. However, few students looked at them at
the beginning of or during the game. Rules are restrictions that constrain the actions or
moves and support players to learn specific content (Charsky, 2010). The moves
presented in this section helped the researcher to visualize the different way the game
could be play without affecting the learning objective of the game. The learning objective
is helping students to connect the transformation of light energy into chemical energy
(ATP, NADPH) to a flow of electrons using the ETC visual representation (Gordin &
Pea, 1995; Mayer & Moreno, 2002) and mimicking the process while playing. In other
cases, the violations of the rules made the game unplayable. In this last case, a
summarized set of rules-instruction- of the main moves of the game was delineated from
this analysis to facilitate the flow of the game. They are presented at the end of this
section. See the image of the board in Figure 5.
4.4.1.1 In Each Turn, the Player does not Lay Down all Possible Cards
a) Fact: In this case, water and chlorophyll cards should have been laid down on
the board to favor the production of a two-electrons card in his next turn. Instead of
finishing his turn with three cards, the player should have been finishing with only one
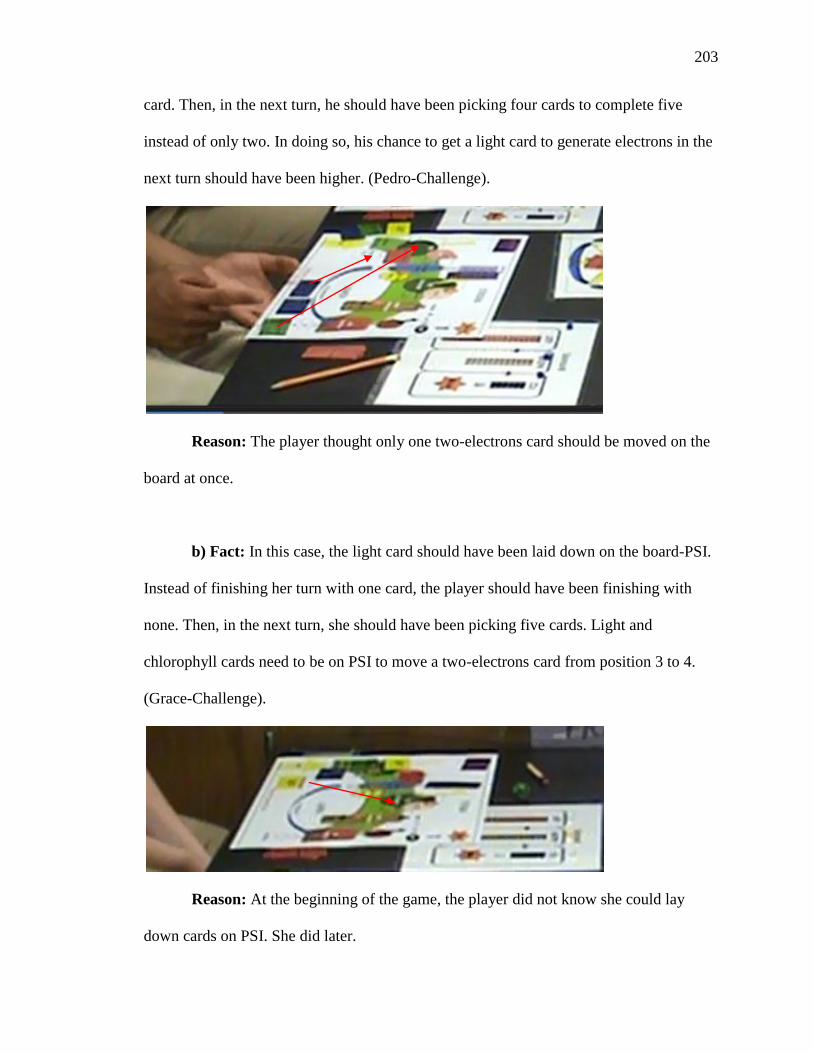
203
card. Then, in the next turn, he should have been picking four cards to complete five
instead of only two. In doing so, his chance to get a light card to generate electrons in the
next turn should have been higher. (Pedro-Challenge).
Reason: The player thought only one two-electrons card should be moved on the
board at once.
b) Fact: In this case, the light card should have been laid down on the board-PSI.
Instead of finishing her turn with one card, the player should have been finishing with
none. Then, in the next turn, she should have been picking five cards. Light and
chlorophyll cards need to be on PSI to move a two-electrons card from position 3 to 4.
(Grace-Challenge).
Reason: At the beginning of the game, the player did not know she could lay
down cards on PSI. She did later.
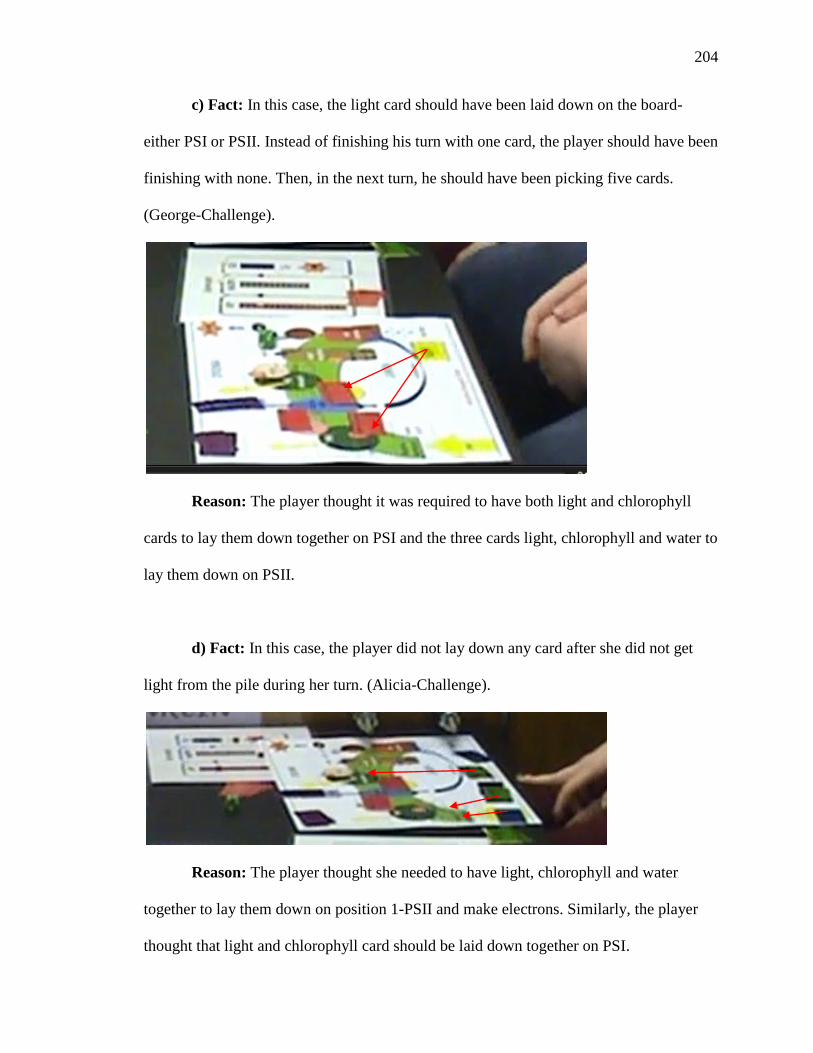
204
c) Fact: In this case, the light card should have been laid down on the board-
either PSI or PSII. Instead of finishing his turn with one card, the player should have been
finishing with none. Then, in the next turn, he should have been picking five cards.
(George-Challenge).
Reason: The player thought it was required to have both light and chlorophyll
cards to lay them down together on PSI and the three cards light, chlorophyll and water to
lay them down on PSII.
d) Fact: In this case, the player did not lay down any card after she did not get
light from the pile during her turn. (Alicia-Challenge).
Reason: The player thought she needed to have light, chlorophyll and water
together to lay them down on position 1-PSII and make electrons. Similarly, the player
thought that light and chlorophyll card should be laid down together on PSI.
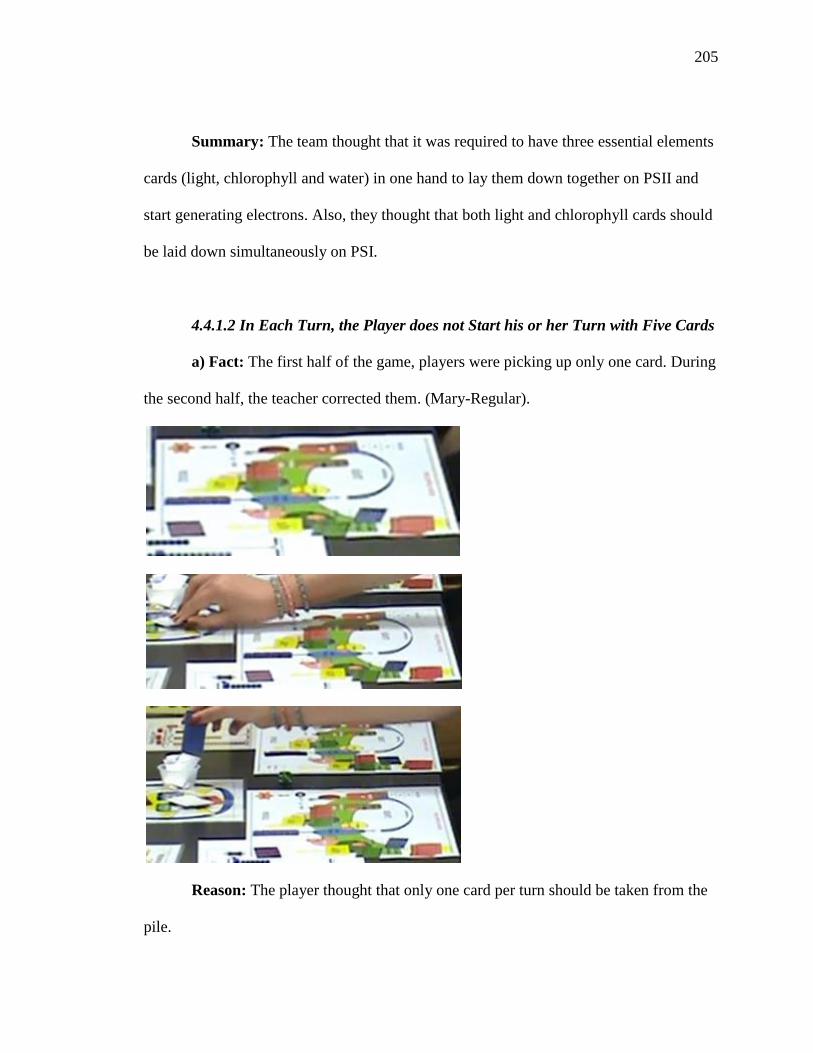
205
Summary: The team thought that it was required to have three essential elements
cards (light, chlorophyll and water) in one hand to lay them down together on PSII and
start generating electrons. Also, they thought that both light and chlorophyll cards should
be laid down simultaneously on PSI.
4.4.1.2 In Each Turn, the Player does not Start his or her Turn with Five Cards
a) Fact: The first half of the game, players were picking up only one card. During
the second half, the teacher corrected them. (Mary-Regular).
Reason: The player thought that only one card per turn should be taken from the
pile.
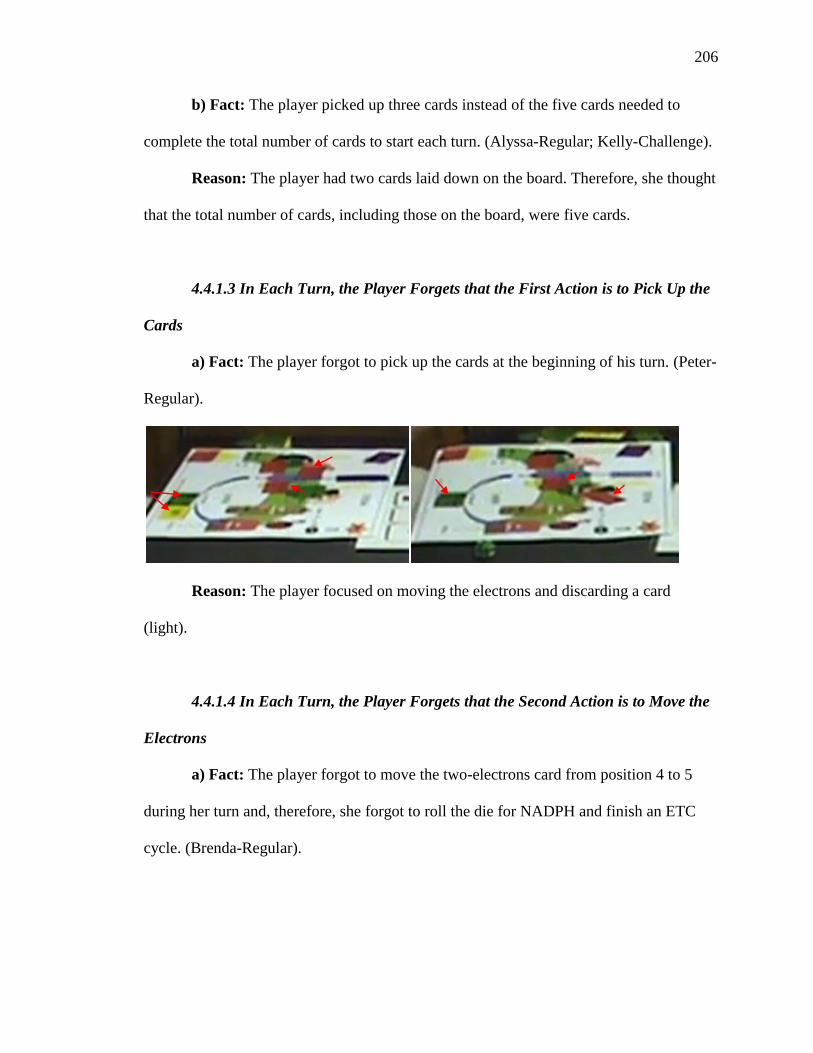
206
b) Fact: The player picked up three cards instead of the five cards needed to
complete the total number of cards to start each turn. (Alyssa-Regular; Kelly-Challenge).
Reason: The player had two cards laid down on the board. Therefore, she thought
that the total number of cards, including those on the board, were five cards.
4.4.1.3 In Each Turn, the Player Forgets that the First Action is to Pick Up the
Cards
a) Fact: The player forgot to pick up the cards at the beginning of his turn. (Peter-
Regular).
Reason: The player focused on moving the electrons and discarding a card
(light).
4.4.1.4 In Each Turn, the Player Forgets that the Second Action is to Move the
Electrons
a) Fact: The player forgot to move the two-electrons card from position 4 to 5
during her turn and, therefore, she forgot to roll the die for NADPH and finish an ETC
cycle. (Brenda-Regular).
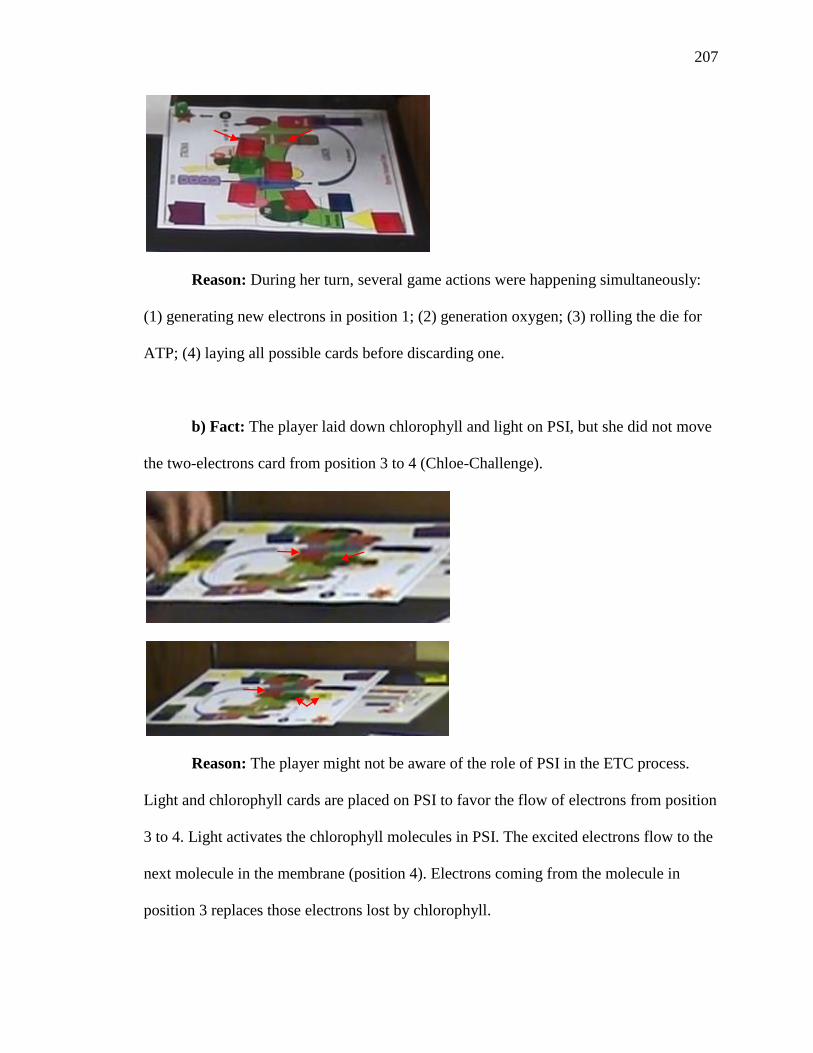
207
Reason: During her turn, several game actions were happening simultaneously:
(1) generating new electrons in position 1; (2) generation oxygen; (3) rolling the die for
ATP; (4) laying all possible cards before discarding one.
b) Fact: The player laid down chlorophyll and light on PSI, but she did not move
the two-electrons card from position 3 to 4 (Chloe-Challenge).
Reason: The player might not be aware of the role of PSI in the ETC process.
Light and chlorophyll cards are placed on PSI to favor the flow of electrons from position
3 to 4. Light activates the chlorophyll molecules in PSI. The excited electrons flow to the
next molecule in the membrane (position 4). Electrons coming from the molecule in
position 3 replaces those electrons lost by chlorophyll.
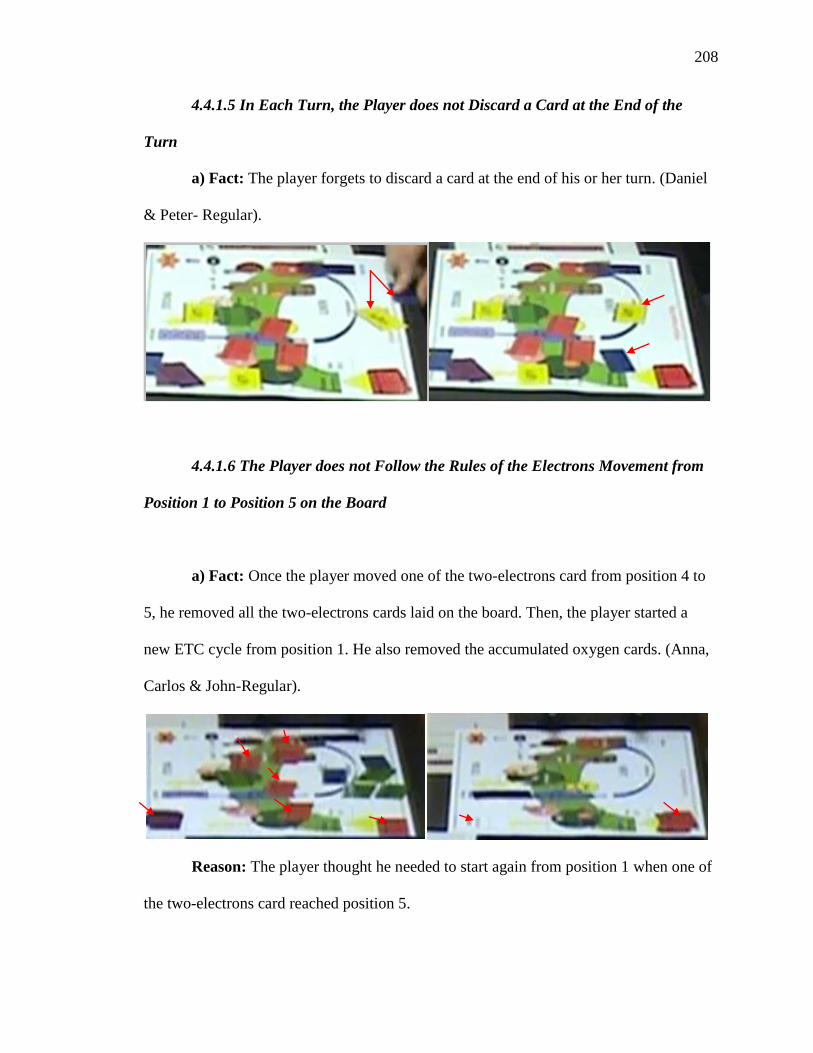
208
4.4.1.5 In Each Turn, the Player does not Discard a Card at the End of the
Turn
a) Fact: The player forgets to discard a card at the end of his or her turn. (Daniel
& Peter- Regular).
4.4.1.6 The Player does not Follow the Rules of the Electrons Movement from
Position 1 to Position 5 on the Board
a) Fact: Once the player moved one of the two-electrons card from position 4 to
5, he removed all the two-electrons cards laid on the board. Then, the player started a
new ETC cycle from position 1. He also removed the accumulated oxygen cards. (Anna,
Carlos & John-Regular).
Reason: The player thought he needed to start again from position 1 when one of
the two-electrons card reached position 5.
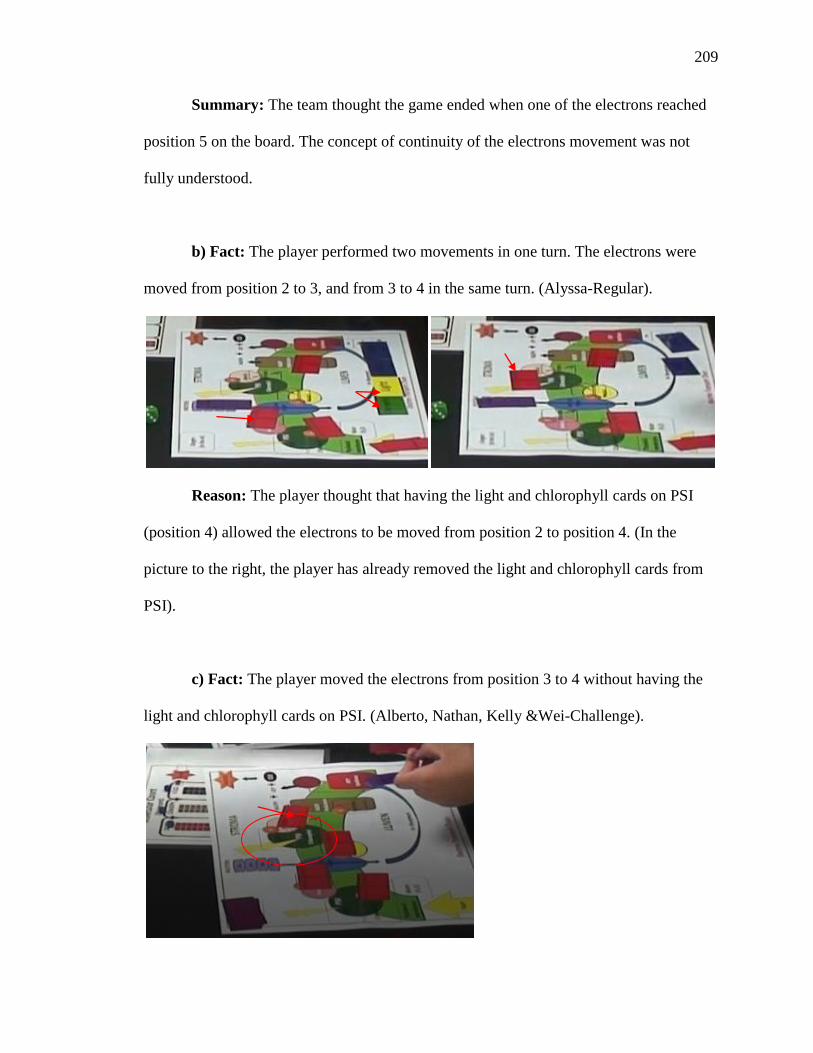
209
Summary: The team thought the game ended when one of the electrons reached
position 5 on the board. The concept of continuity of the electrons movement was not
fully understood.
b) Fact: The player performed two movements in one turn. The electrons were
moved from position 2 to 3, and from 3 to 4 in the same turn. (Alyssa-Regular).
Reason: The player thought that having the light and chlorophyll cards on PSI
(position 4) allowed the electrons to be moved from position 2 to position 4. (In the
picture to the right, the player has already removed the light and chlorophyll cards from
PSI).
c) Fact: The player moved the electrons from position 3 to 4 without having the
light and chlorophyll cards on PSI. (Alberto, Nathan, Kelly &Wei-Challenge).
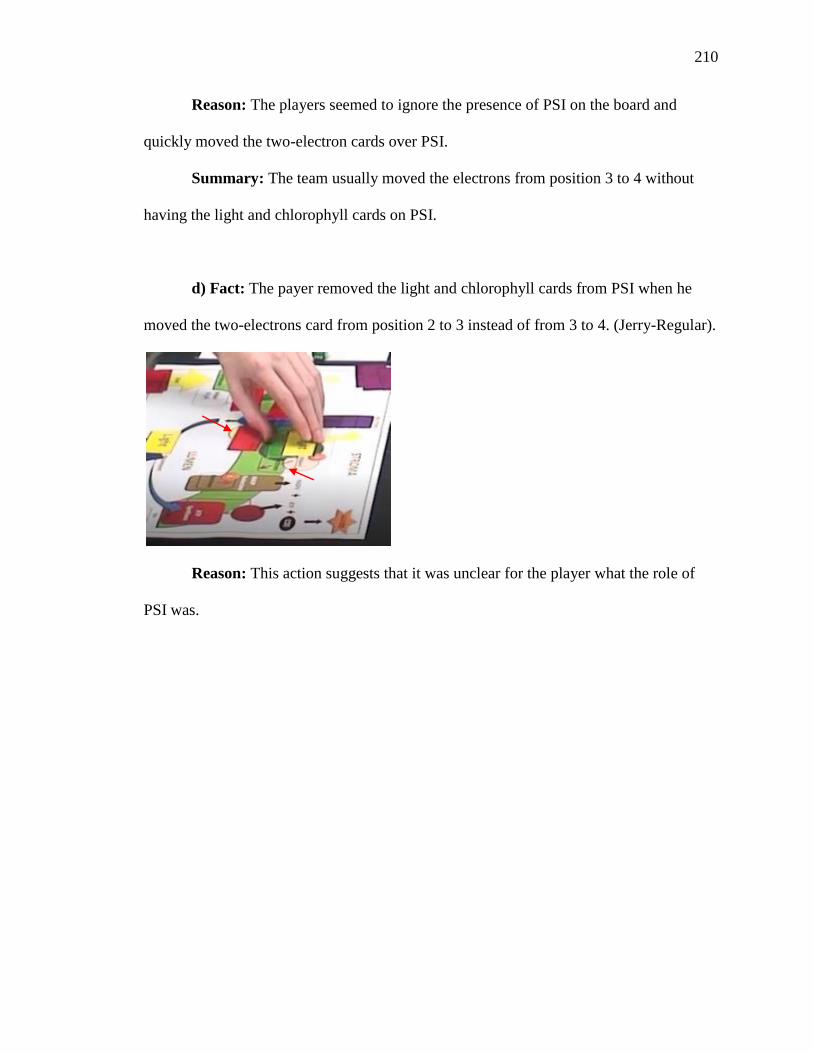
210
Reason: The players seemed to ignore the presence of PSI on the board and
quickly moved the two-electron cards over PSI.
Summary: The team usually moved the electrons from position 3 to 4 without
having the light and chlorophyll cards on PSI.
d) Fact: The payer removed the light and chlorophyll cards from PSI when he
moved the two-electrons card from position 2 to 3 instead of from 3 to 4. (Jerry-Regular).
Reason: This action suggests that it was unclear for the player what the role of
PSI was.
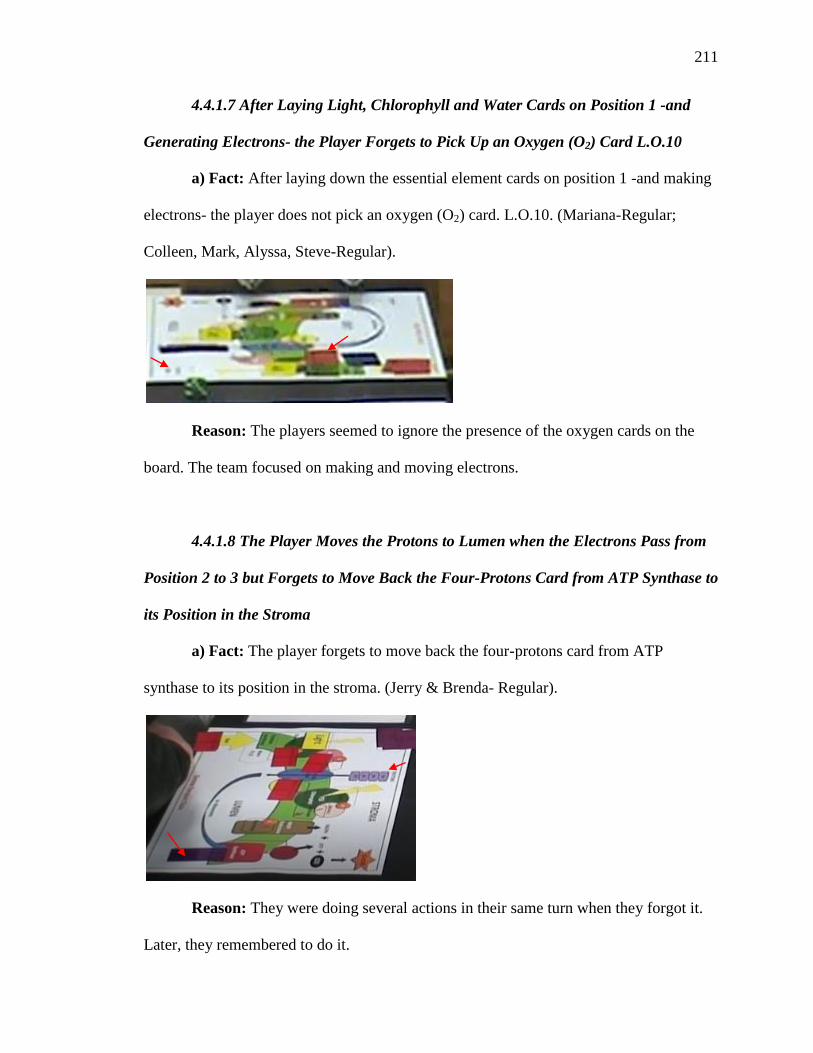
211
4.4.1.7 After Laying Light, Chlorophyll and Water Cards on Position 1 -and
Generating Electrons- the Player Forgets to Pick Up an Oxygen (O2) Card L.O.10
a) Fact: After laying down the essential element cards on position 1 -and making
electrons- the player does not pick an oxygen (O2) card. L.O.10. (Mariana-Regular;
Colleen, Mark, Alyssa, Steve-Regular).
Reason: The players seemed to ignore the presence of the oxygen cards on the
board. The team focused on making and moving electrons.
4.4.1.8 The Player Moves the Protons to Lumen when the Electrons Pass from
Position 2 to 3 but Forgets to Move Back the Four-Protons Card from ATP Synthase to
its Position in the Stroma
a) Fact: The player forgets to move back the four-protons card from ATP
synthase to its position in the stroma. (Jerry & Brenda- Regular).
Reason: They were doing several actions in their same turn when they forgot it.
Later, they remembered to do it.
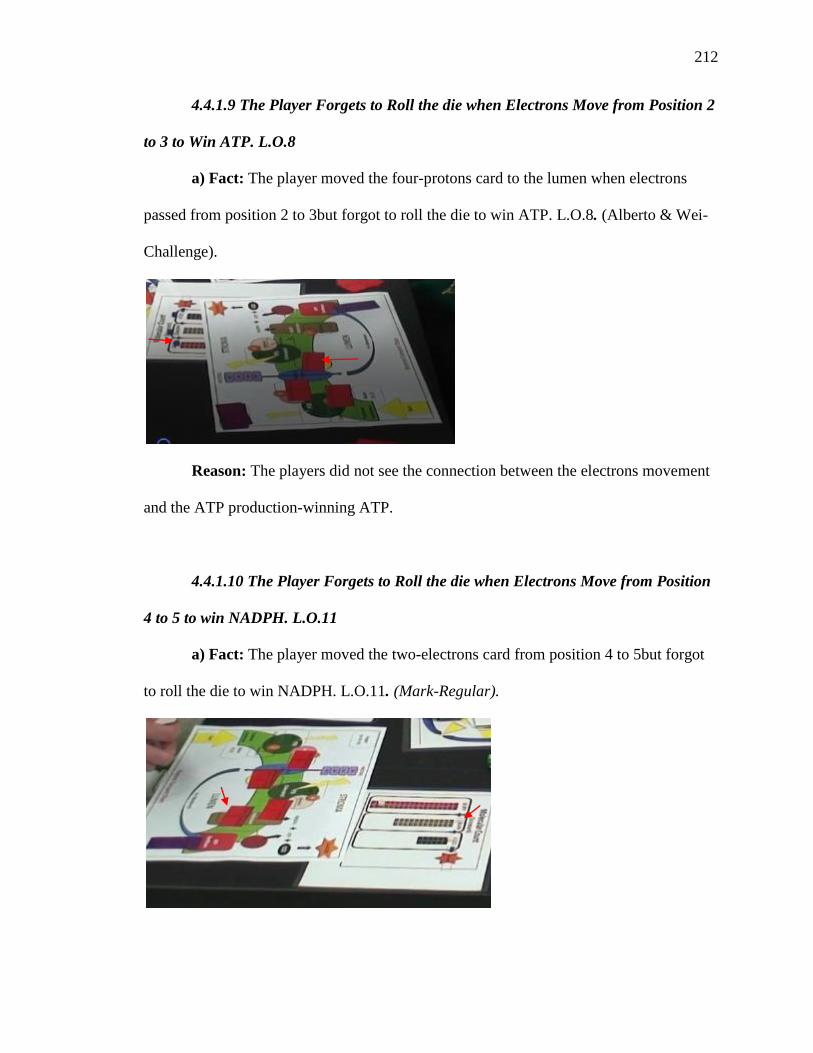
212
4.4.1.9 The Player Forgets to Roll the die when Electrons Move from Position 2
to 3 to Win ATP. L.O.8
a) Fact: The player moved the four-protons card to the lumen when electrons
passed from position 2 to 3but forgot to roll the die to win ATP. L.O.8. (Alberto & Wei-
Challenge).
Reason: The players did not see the connection between the electrons movement
and the ATP production-winning ATP.
4.4.1.10 The Player Forgets to Roll the die when Electrons Move from Position
4 to 5 to win NADPH. L.O.11
a) Fact: The player moved the two-electrons card from position 4 to 5but forgot
to roll the die to win NADPH. L.O.11. (Mark-Regular).
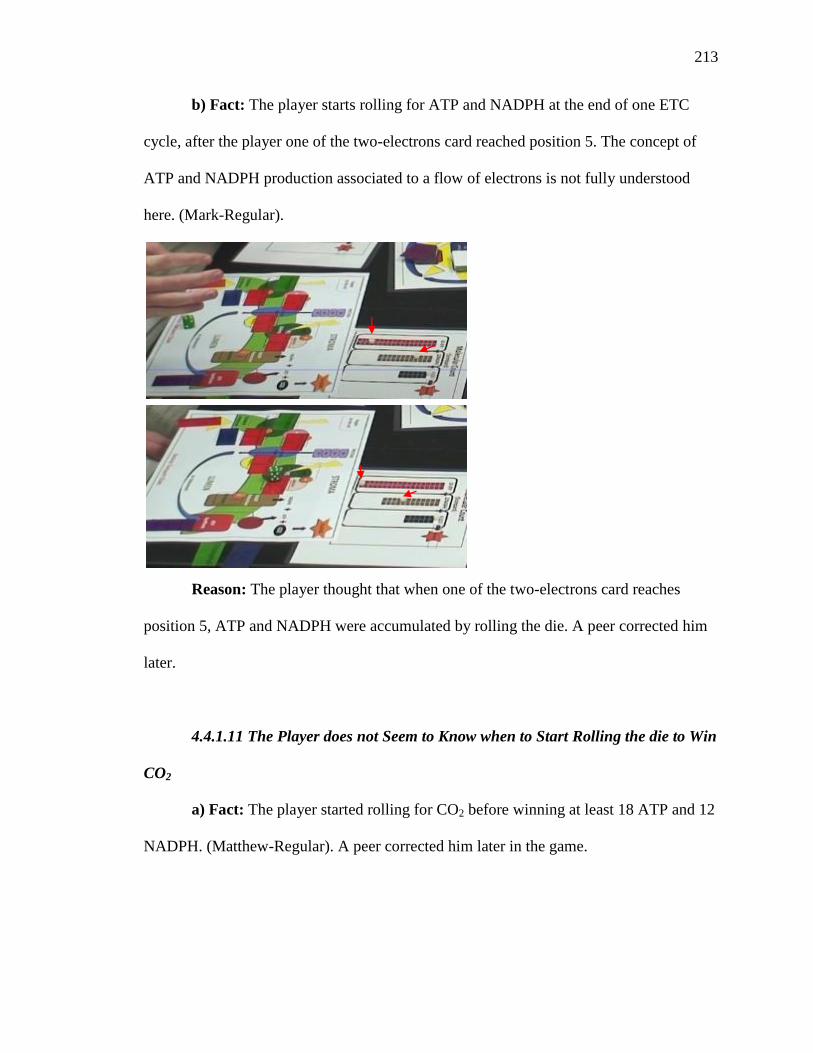
213
b) Fact: The player starts rolling for ATP and NADPH at the end of one ETC
cycle, after the player one of the two-electrons card reached position 5. The concept of
ATP and NADPH production associated to a flow of electrons is not fully understood
here. (Mark-Regular).
Reason: The player thought that when one of the two-electrons card reaches
position 5, ATP and NADPH were accumulated by rolling the die. A peer corrected him
later.
4.4.1.11 The Player does not Seem to Know when to Start Rolling the die to Win
CO2
a) Fact: The player started rolling for CO2 before winning at least 18 ATP and 12
NADPH. (Matthew-Regular). A peer corrected him later in the game.
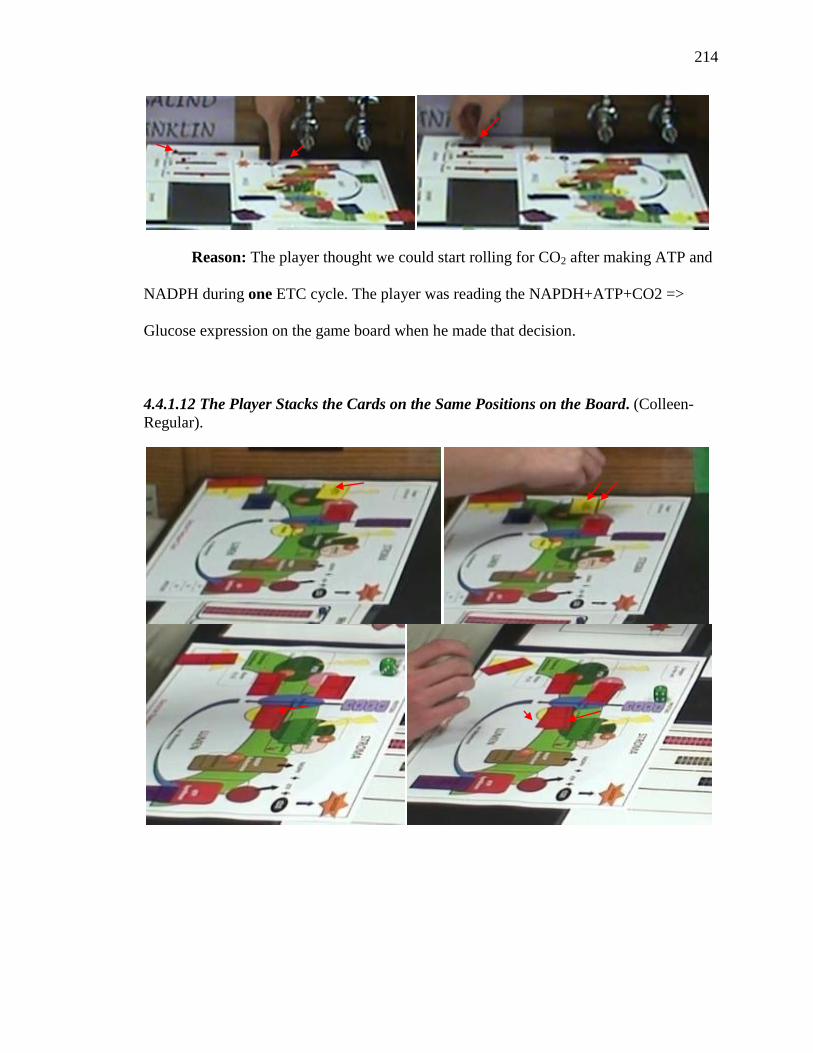
214
Reason: The player thought we could start rolling for CO2 after making ATP and
NADPH during one ETC cycle. The player was reading the NAPDH+ATP+CO2 =>
Glucose expression on the game board when he made that decision.
4.4.1.12 The Player Stacks the Cards on the Same Positions on the Board. (Colleen-
Regular).
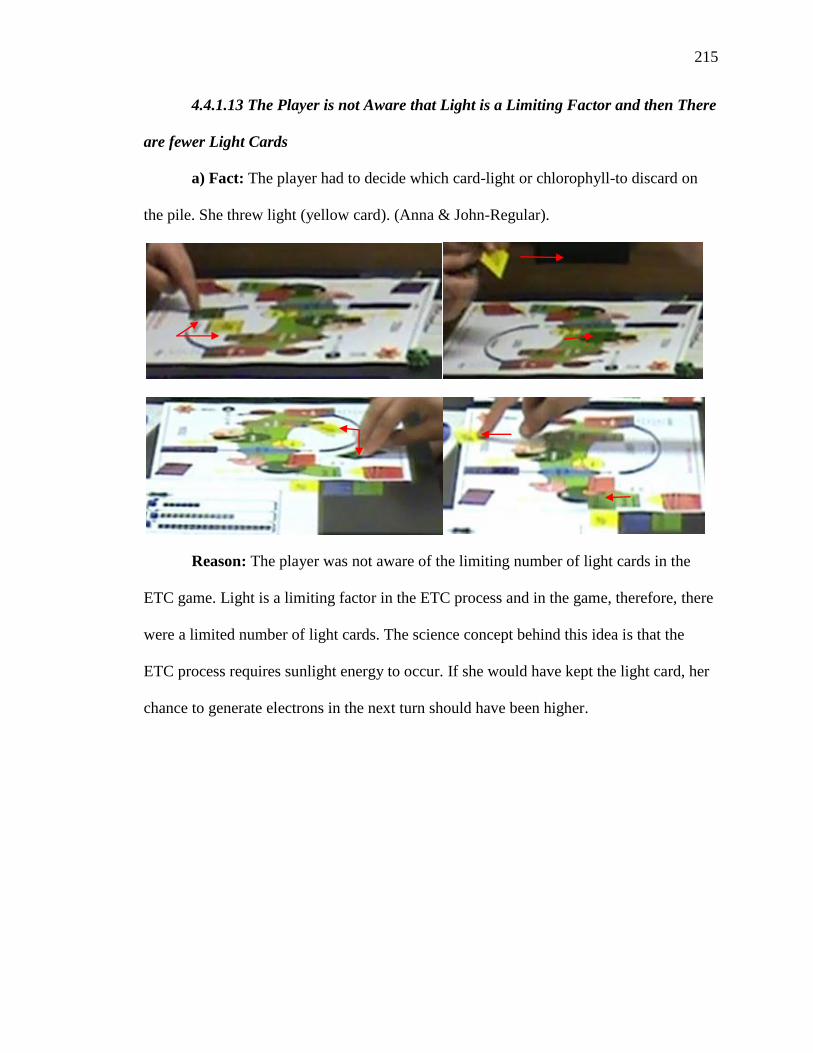
215
4.4.1.13 The Player is not Aware that Light is a Limiting Factor and then There
are fewer Light Cards
a) Fact: The player had to decide which card-light or chlorophyll-to discard on
the pile. She threw light (yellow card). (Anna & John-Regular).
Reason: The player was not aware of the limiting number of light cards in the
ETC game. Light is a limiting factor in the ETC process and in the game, therefore, there
were a limited number of light cards. The science concept behind this idea is that the
ETC process requires sunlight energy to occur. If she would have kept the light card, her
chance to generate electrons in the next turn should have been higher.
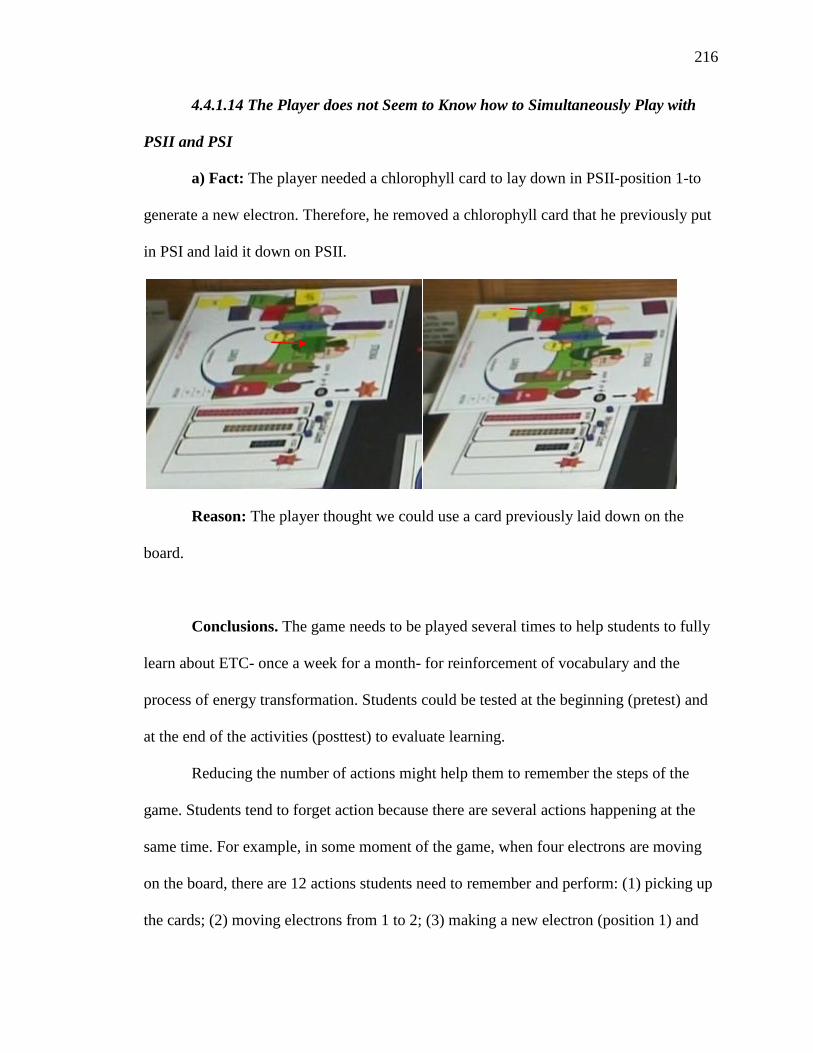
216
4.4.1.14 The Player does not Seem to Know how to Simultaneously Play with
PSII and PSI
a) Fact: The player needed a chlorophyll card to lay down in PSII-position 1-to
generate a new electron. Therefore, he removed a chlorophyll card that he previously put
in PSI and laid it down on PSII.
Reason: The player thought we could use a card previously laid down on the
board.
Conclusions. The game needs to be played several times to help students to fully
learn about ETC- once a week for a month- for reinforcement of vocabulary and the
process of energy transformation. Students could be tested at the beginning (pretest) and
at the end of the activities (posttest) to evaluate learning.
Reducing the number of actions might help them to remember the steps of the
game. Students tend to forget action because there are several actions happening at the
same time. For example, in some moment of the game, when four electrons are moving
on the board, there are 12 actions students need to remember and perform: (1) picking up
the cards; (2) moving electrons from 1 to 2; (3) making a new electron (position 1) and
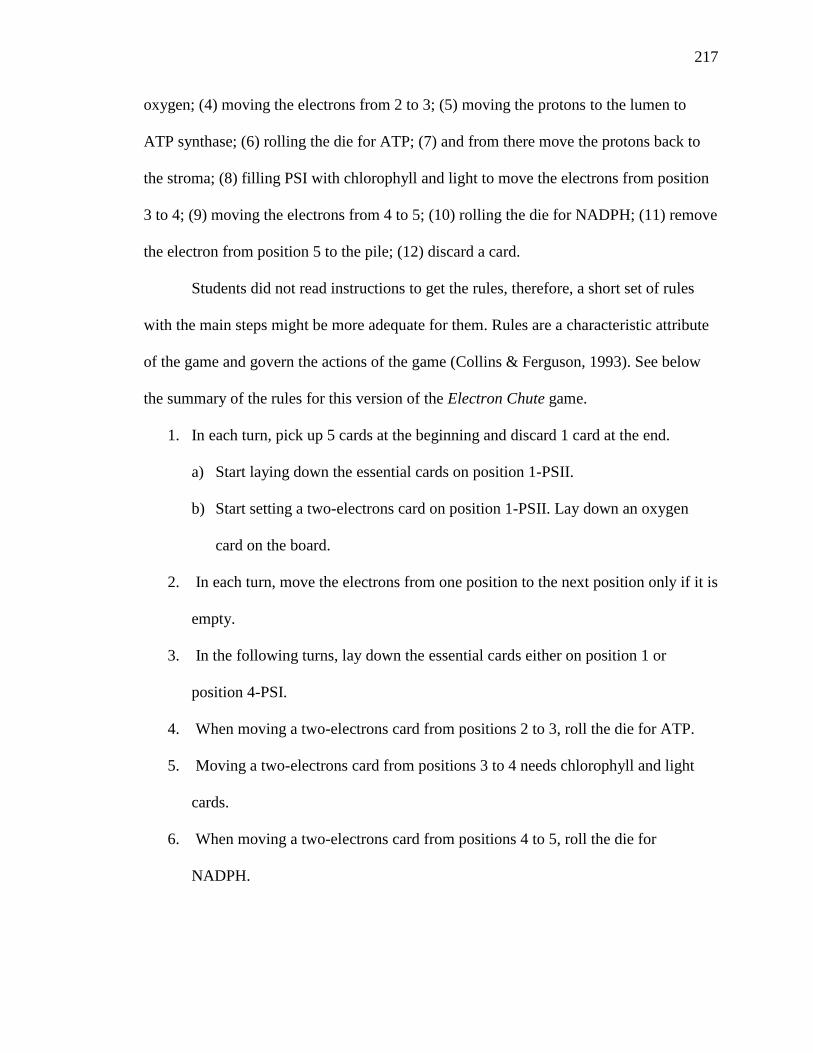
217
oxygen; (4) moving the electrons from 2 to 3; (5) moving the protons to the lumen to
ATP synthase; (6) rolling the die for ATP; (7) and from there move the protons back to
the stroma; (8) filling PSI with chlorophyll and light to move the electrons from position
3 to 4; (9) moving the electrons from 4 to 5; (10) rolling the die for NADPH; (11) remove
the electron from position 5 to the pile; (12) discard a card.
Students did not read instructions to get the rules, therefore, a short set of rules
with the main steps might be more adequate for them. Rules are a characteristic attribute
of the game and govern the actions of the game (Collins & Ferguson, 1993). See below
the summary of the rules for this version of the Electron Chute game.
1. In each turn, pick up 5 cards at the beginning and discard 1 card at the end.
a) Start laying down the essential cards on position 1-PSII.
b) Start setting a two-electrons card on position 1-PSII. Lay down an oxygen
card on the board.
2. In each turn, move the electrons from one position to the next position only if it is
empty.
3. In the following turns, lay down the essential cards either on position 1 or
position 4-PSI.
4. When moving a two-electrons card from positions 2 to 3, roll the die for ATP.
5. Moving a two-electrons card from positions 3 to 4 needs chlorophyll and light
cards.
6. When moving a two-electrons card from positions 4 to 5, roll the die for
NADPH.
218
7. In the turn after scoring 18 ATP and 12 NADPH, roll the die for CO2 once per
turn.
8. The player who scores at least 6CO2 gets the Glucose and win the game.
Peers' meaningful discussions about the game support students' learning about
how to play the game. Peers helped each other in the completion of the task. Mistakes
were minimal and were corrected over the course of the game.
Some of the "mistakes" do not affect the learning objectives of the game. This is
connecting the concept of electrons movement to the transformation of sunlight energy
into chemical energy, ATP, and NADPH. For example, moving the two-electrons card
from position 2 to position 4 in the same turn when light and chlorophyll are laid down
on PSI could be an interesting modification to the game. Also, changing mind and
moving a card from PSII to PSI in the same turn could increase the speed of the game and
keep players engaged on it.
The vocabulary used by students focused on particles and molecules. These are:
electrons, chlorophyll, water, light, oxygen, protons, ATP, NADPH, CO2, glucose.
Students did not mention more complex concepts such as PSII, PSI, mobile protein, ATP
synthase, NADP Reductase, lumen, stroma, thylakoid membrane. Students used
"these,""here," "there" to refer to them. Electrons was the most used word.
219
4.5 Exit Survey Results
The survey was designed to collect students' feedback from their learning
experiences after watching the ETC video and playing the Electron Chute game. The
survey results were presented in two sections (1) quantitative analysis of the survey; (2)
qualitative analysis for the open-ended questions of the survey. The quantitative analysis
target students’ understanding of information in the video and game, their comprehension
of the rules of the game and their interest in the content area and future learning. A
qualitative analysis was performed to help validate these results and identify any
unforeseen issues or opportunities the students might have had about the learning
experience. The following summarizes the results of the analysis.
The presentation of results from the quantitative analysis section was divided in
four parts (1) students' reactions to the ETC video and the Electron Chute game learning
experiences; (2) effect of treatments on students' reactions to the video and game and
interest in science; (3) effect of academic readiness on students' reactions to the video and
game and interest in science; (4) effect of treatments between academic readiness on
students' reactions to the video and game and interest in science.
These results focused on comparing students’ feedback after watching the ETC
video and playing Electron Chute. The survey analysis was performed for both
treatments. The video+game group experienced the ETC video and played Electron
Chute on the same day. The video only group experienced a one day delay between
watching the ETC video and playing the game. The delay provided the video only group
the opportunity to complete the posttest that measured their learning gains from just the
220
ETC video experience. The assumption was this delay would not significantly impact
their overall learning experience.
4.5.1 Quantitative Analysis of the Survey
Results of a quantitative comparison between treatments and classes are described
in the following sections. As it was mentioned above, information about students’
understanding of the ETC process in the video and game and rules are presented below.
4.5.1.1 Students' Reactions to the Video and Game Learning Experiences
Strongly agree to strongly disagree scale responses. Ninety-three percent
(93%) of the students who took the survey (N=120) have not studied the ETC process in
photosynthesis before the treatments. The data suggested that students' schema of ETC
seems to be inexistent (Anderson,1978). Table 27 summarizes the eighth grade students'
affirmative responses for the whole class and for the treatments to statements on the exit
survey related to various target outcomes. The statements are ordered relative to the
target outcome of the learning activity.
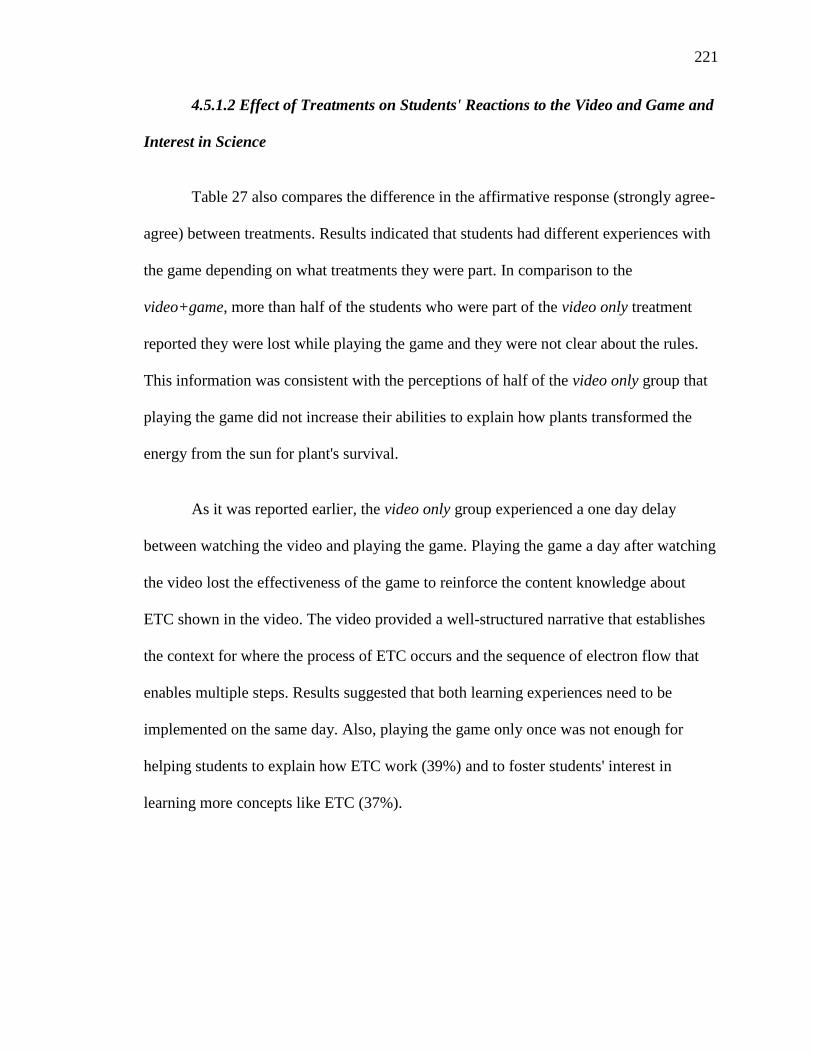
221
4.5.1.2 Effect of Treatments on Students' Reactions to the Video and Game and
Interest in Science
Table 27 also compares the difference in the affirmative response (strongly agree-
agree) between treatments. Results indicated that students had different experiences with
the game depending on what treatments they were part. In comparison to the
video+game, more than half of the students who were part of the video only treatment
reported they were lost while playing the game and they were not clear about the rules.
This information was consistent with the perceptions of half of the video only group that
playing the game did not increase their abilities to explain how plants transformed the
energy from the sun for plant's survival.
As it was reported earlier, the video only group experienced a one day delay
between watching the video and playing the game. Playing the game a day after watching
the video lost the effectiveness of the game to reinforce the content knowledge about
ETC shown in the video. The video provided a well-structured narrative that establishes
the context for where the process of ETC occurs and the sequence of electron flow that
enables multiple steps. Results suggested that both learning experiences need to be
implemented on the same day. Also, playing the game only once was not enough for
helping students to explain how ETC work (39%) and to foster students' interest in
learning more concepts like ETC (37%).
222
Table 27: Students' Affirmative Responses about the Video and Game -Effect of
Treatments
Statement
Strongly Agree-Agree Responses (%)
Treatments
Whole Class (N=120)
Video only (N=52)
Video+game (N=68)
Learning outcomes
The video on ETC clearly explains were ETC occurs in
the plant
75* 67 81
Playing the ETC board game increased my ability to
explain how plants convert light energy into energy they
need to survive
68* 52** 79**
After playing the game I feel I can explain how ETC
process works
39* 38 40
I remember most of the names of the key elements in the
ETC process
53 48 57
I like playing the ETC board game 61* 54 66
I was lost while playing the ETC board game 54 69** 43**
By the end of playing the game I was clear on the rules and
how to play
63* 46** 76**
These past few weeks I have learned a lot more about
photosynthesis
81* 79 82
I am interested in learning more concepts like ETC 37* 33 40
*p < 0.0 5 α 0.05, two-tailed normal distribution Z; Z critical value z α/2 =1.96; -z α/2 =-1.96); single-group statistical tests with a
binary dependent variable
** p < 0.0 5 α 0.05, two-tailed normal distribution Z; Z critical value z α/2 =1.96; -z α/2 =-1.96); inferences concerning difference between population proportions-video only and video+game treatments
4.5.1.3 Effect of Academic Readiness on Students' Reactions to the Video and
Game and Interest in Science
Table 28 summarizes the eighth grade students' affirmative responses of students
who attended the regular and the challenges classes to statements on the exit survey
related to various target outcomes. Results indicated that there were differences between
both classes. Half (50%) of the students who attended the challenge classes did not like
playing the game and few of them (24%) were interested in learning more concepts like
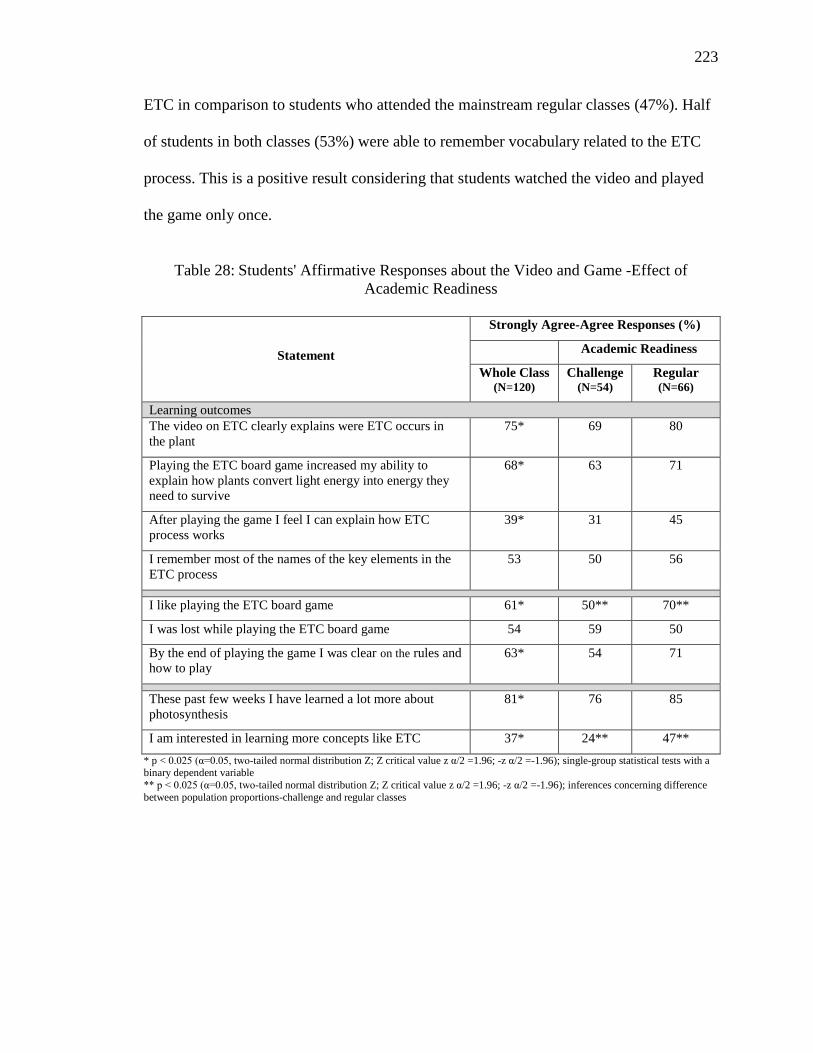
223
ETC in comparison to students who attended the mainstream regular classes (47%). Half
of students in both classes (53%) were able to remember vocabulary related to the ETC
process. This is a positive result considering that students watched the video and played
the game only once.
Table 28: Students' Affirmative Responses about the Video and Game -Effect of
Academic Readiness
Statement
Strongly Agree-Agree Responses (%)
Academic Readiness
Whole Class (N=120)
Challenge (N=54)
Regular (N=66)
Learning outcomes
The video on ETC clearly explains were ETC occurs in
the plant
75* 69 80
Playing the ETC board game increased my ability to
explain how plants convert light energy into energy they
need to survive
68* 63 71
After playing the game I feel I can explain how ETC
process works
39* 31 45
I remember most of the names of the key elements in the
ETC process
53 50 56
I like playing the ETC board game 61* 50** 70**
I was lost while playing the ETC board game 54 59 50
By the end of playing the game I was clear on the rules and
how to play
63* 54 71
These past few weeks I have learned a lot more about
photosynthesis
81* 76 85
I am interested in learning more concepts like ETC 37* 24** 47**
* p < 0.0 5 α 0.05, two-tailed normal distribution Z; Z critical value z α/2 =1.96; -z α/2 =-1.96); single-group statistical tests with a binary dependent variable
** p < 0.0 5 α 0.05, two-tailed normal distribution Z; Z critical value z α/2 =1.96; -z α/2 =-1.96); inferences concerning difference
between population proportions-challenge and regular classes
224
4.5.1.4 Effect of Treatment between Academic Readiness on Students'
Reactions to the Video and Game and Interest in Science
Table 29 summarizes the eighth grade students' affirmative responses per
treatments between academic readiness to statements on the exit survey related to various
target outcomes. The analysis of students' responses disaggregated in treatments and
classes help to elucidate the results observed in Tables 17 and 18.
Students who were part of the video only treatment and attended the challenge
classes were the most affected by playing the game a day after watching the video. Most
of the students (84%) in this group reported they were lost while playing the game and
only a third (34%) were clear about the rules. This group also had the lowest number of
students (46%) who informed that playing the game increased their abilities to explain
how plants transformed the energy from the sun for plant's survival. Also, only a third of
this group of students (38%) reported they liked playing the game in comparison to the
70% reported by students who attended the regular class and the 60% informed by
students in the challenge-video+game treatment.
Independently of the treatment, few students who attended the challenge class
(24%) were interested in learning more concepts like ETC in comparison to students who
attended the mainstream regular classes (47%). Overall, independently of the treatments
and the classes, students need to play the game more than once to reinforce how ETC
works and to support students' abilities to explain the process.

225
Table 29: Students' Affirmative Responses about the Video and Game-Effect of
Treatments between Academic Readiness
Statement
Strongly Agree-Agree Responses (%)
Treatments
Video only (N=52) Video+game (N=68)
Challenge
Classes
(N=24)
Regular
Classes
(N=28)
Challenge
Classes
(N=28)
Regular
Classes
(N=40)
Learning outcomes
The video on ETC clearly explains
were ETC occurs in the plant 57.7 76.9 78.6 82.5
Playing the ETC board game
increased my ability to explain how
plants convert light energy into
energy they need to survive
46.2** 57.7** 78.6** 80.0**
After playing the game I feel I can
explain how the ETC process works
34.6 42.3 28.6 47.5
I remember most of the names of the
key elements in the ETC process
50.0 46.2 50.0 62.5
Playing the game
I like playing the ETC board game 38.5* 69.2* 60.7 70.0
I was lost while playing the ETC
board game
84.6*/** 53.8* 35.7** 47.5
By the end of playing the game I was
clear on the rules and how to play
34.6** 57.7** 71.4** 80.0**
Learning about photosynthesis and interest in science concepts like ETC
These past few weeks I have learned
a lot more about photosynthesis
80.8 76.9 71.4 90.0
I am interested in learning more
concepts like ETC
23.1 42.3 25.0* 50.0*
*p < 0.05; difference between population proportions using Pearson Chi-Square Test-for treatments
** p < 0.05; difference between population proportions using Pearson Chi-Square Test-for classes
226
Summary of the section. Playing Electron Chute on the same day than watching
the video provided learning experience that lead to students having a positive reaction to
their ability to explain how plants convert light energy into energy plants need to survive.
Participants who played Electron Chute on the same day than the video were more likely
to agree that they understood the rules of the game and were not lost while playing the
game. The challenge class in both treatments report the lowest interest in learning more
concepts like ETC and demanded more explanations about how to play. They may have a
higher expectation in their ability to explain scientific concepts that Electron Chute did
not provide. The regular class was the most positive about learning with Electron Chute.
They were most likely to report understanding the rules of the game, finding it
interesting, and being able to explain the ETC process. This kind of informal education
might be more suitable for the mainstream students.
227
4.5.2 Qualitative Analysis for the Open-Ended Questions of the Survey
The qualitative complemented the quantitative section results by informing
additional comments students might have had about the learning experience. Students
provided responses to three questions (1) What would you change about the video?; (2)
What would you change about the game; (3) What did you like about the game? The
following summarizes the results of the analysis for the whole class. Later in the section,
a comparison between challenge and regular classes is presented.
Students' feedback after the video and game learning experiences. When
students were asked what they would change about the ETC video and the Electron
Chute game, their answers were consistent across all classes. In both questions, almost a
third (29%) of the whole class indicated that they would change nothing while about 18%
of them would include more explanations and examples of ETC in the video. Similarly,
about 22% of all participants would spend more time explaining how to play the game at
the beginning of the activity (Table 30).
Some of the students' responses regarding the video are reported here as they were
written: (1) Use things we already know to compare; (2) The video has to be more
explanatory; (3) Showing more examples; (4) I would have each process be explained a
lot more thoroughly. In the case of the game students' reported: (1) The directions were
a bit unclear; (2) I would make the rules a little [more] easier to understand; (3) I would
have the game explained more; (4) Explain the rules more (Table 30).
According to the information presented in Table 27, almost two thirds of the
whole class (61%) liked playing the game. When researchers asked students what they
liked about the game, about 20% of the class informed the game was cool, entertaining
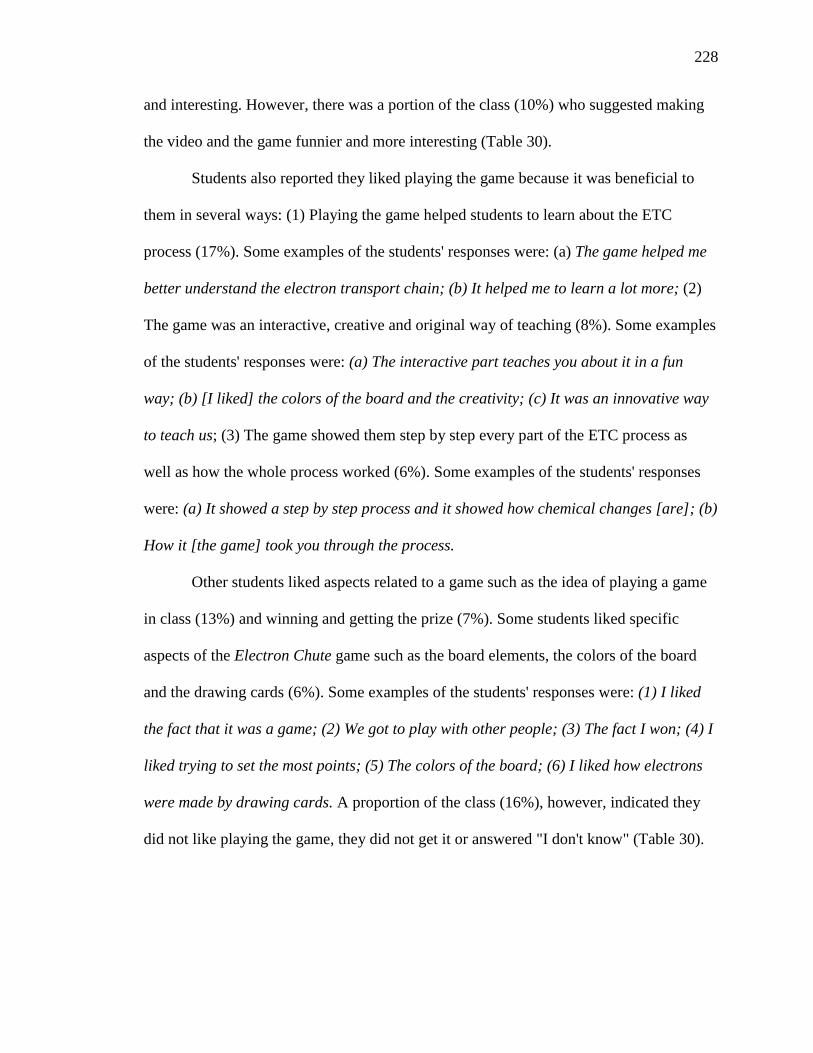
228
and interesting. However, there was a portion of the class (10%) who suggested making
the video and the game funnier and more interesting (Table 30).
Students also reported they liked playing the game because it was beneficial to
them in several ways: (1) Playing the game helped students to learn about the ETC
process (17%). Some examples of the students' responses were: (a) The game helped me
better understand the electron transport chain; (b) It helped me to learn a lot more; (2)
The game was an interactive, creative and original way of teaching (8%). Some examples
of the students' responses were: (a) The interactive part teaches you about it in a fun
way; (b) [I liked] the colors of the board and the creativity; (c) It was an innovative way
to teach us; (3) The game showed them step by step every part of the ETC process as
well as how the whole process worked (6%). Some examples of the students' responses
were: (a) It showed a step by step process and it showed how chemical changes [are]; (b)
How it [the game] took you through the process.
Other students liked aspects related to a game such as the idea of playing a game
in class (13%) and winning and getting the prize (7%). Some students liked specific
aspects of the Electron Chute game such as the board elements, the colors of the board
and the drawing cards (6%). Some examples of the students' responses were: (1) I liked
the fact that it was a game; (2) We got to play with other people; (3) The fact I won; (4) I
liked trying to set the most points; (5) The colors of the board; (6) I liked how electrons
were made by drawing cards. A proportion of the class (16%), however, indicated they
did not like playing the game, they did not get it or answered "I don't know" (Table 30).
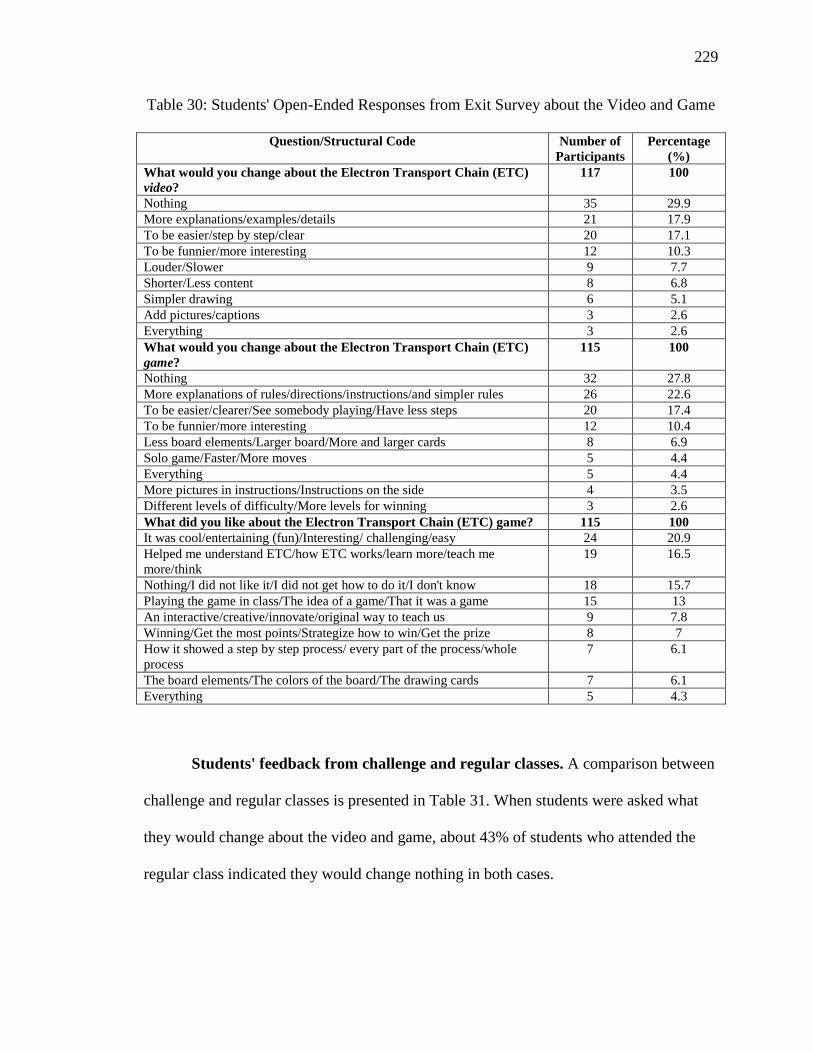
229
Table 30: Students' Open-Ended Responses from Exit Survey about the Video and Game
Question/Structural Code Number of
Participants
Percentage
(%)
What would you change about the Electron Transport Chain (ETC)
video?
117 100
Nothing 35 29.9
More explanations/examples/details 21 17.9
To be easier/step by step/clear 20 17.1
To be funnier/more interesting 12 10.3
Louder/Slower 9 7.7
Shorter/Less content 8 6.8
Simpler drawing 6 5.1
Add pictures/captions 3 2.6
Everything 3 2.6
What would you change about the Electron Transport Chain (ETC)
game?
115 100
Nothing 32 27.8
More explanations of rules/directions/instructions/and simpler rules 26 22.6
To be easier/clearer/See somebody playing/Have less steps 20 17.4
To be funnier/more interesting 12 10.4
Less board elements/Larger board/More and larger cards 8 6.9
Solo game/Faster/More moves 5 4.4
Everything 5 4.4
More pictures in instructions/Instructions on the side 4 3.5
Different levels of difficulty/More levels for winning 3 2.6
What did you like about the Electron Transport Chain (ETC) game? 115 100
It was cool/entertaining (fun)/Interesting/ challenging/easy 24 20.9
Helped me understand ETC/how ETC works/learn more/teach me
more/think
19 16.5
Nothing/I did not like it/I did not get how to do it/I don't know 18 15.7
Playing the game in class/The idea of a game/That it was a game 15 13
An interactive/creative/innovate/original way to teach us 9 7.8
Winning/Get the most points/Strategize how to win/Get the prize 8 7
How it showed a step by step process/ every part of the process/whole
process
7 6.1
The board elements/The colors of the board/The drawing cards 7 6.1
Everything 5 4.3
Students' feedback from challenge and regular classes. A comparison between
challenge and regular classes is presented in Table 31. When students were asked what
they would change about the video and game, about 43% of students who attended the
regular class indicated they would change nothing in both cases.
230
In the case of the challenge class,14.8 % reported they would change nothing
about the video and 9.3% responded they would change nothing about the game. A
comparison between the challenge and regular classes indicated about 30% of the
challenge class reported that the video and game should include more explanations, and
less than 15% of the regular class demanded more explanations. This qualitative data also
supported the quantitative observation regarding the challenge class being unclear about
the rules of the game and demanding more explanations about how to play Electron
Chute. Specifically, students who attended the challenge class and were part of the video
only treatment (Table 30) reported to be lost while playing and unclear about the rules of
the game.
Table 31: Students' Open-Ended Responses about the Video and Game - A Comparison
between Challenge and Regular Classes
Questions Open-Ended Responses (%)
What would you change about the
Electron Transport Chain (ETC) video?
Whole Class
(N=117)
Challenge
(N=54)
Regular
(N=63)
Nothing 29.9 14.8* 42.8*
More explanations/examples/details 17.9 25.9* 11.1*
To be easier/step by step/clear 17.1 22.3 12.7
To be funnier/more interesting 10.3 9.5 11.1
What would you change about the
Electron Transport Chain (ETC) game?
Nothing 27.8 9.3* 44.3*
More explanations of rules/ directions/
instructions/and simpler rules 22.6 31. 5* 14.7*
To be easier/clearer/See somebody
playing/Have less steps 17.4 20.4 14.8
To be funnier/more interesting 10.4 9.3 11.5
*p < 0.0 5 α=0.05, two-tailed normal distribution Z); inferences concerning difference between population
proportions -challenge and academic classes

231
4.6 Summary
Chapter 4 presented the results to answer the research question of this study. In
this chapter, results were organized in three sections: (1) knowledge test results; (2) class
recording results; (3) exit survey results. The knowledge test was designed to measure
students’ achievement of the learning outcomes after participating in the instructional
intervention presented in Chapter 2. The class recording provided insights about students'
engagement with the game process and the benefits of peer interactions for learning. The
survey collected students’ feedback after watching the ETC video and playing Electron
Chute. The instrument or knowledge test was divided in two sections (1) multiple-choice;
(2) essay. The multiple-choice section collected information about the learning outcomes
associated to the academic standards and students' misconceptions. The essay section
provided general information regarding students' ability to interpret the ETC
representation. The survey results were presented in two sections (1) quantitative analysis
of the survey; (2) qualitative analysis for the open-ended questions of the survey. The
results from the quantitative analysis targeted students’ understanding of information in
the video and game. The qualitative results provided information about any issue the
students had about the learning experiences to improve the video and game for future
learners.
232
CHAPTER 5. DISCUSSION
The National Research Council (2012) defines photosynthesis as one of the
learning outcomes for students in middle school in life sciences. The Indiana Academic
Standards -Biology Standard 2 (Indiana Department of Education, 2016)- states that
middle school students should learn about the plant structure involved in photosynthesis
and the role of the gas exchange process of plants -intake of carbon dioxide (CO2) and
release of oxygen (O2)- for human consumption. The Next Generation Science Standards
(NGSS, n.d.) for the life sciences -LS1.C stated that students should learn the inputs
(sunlight energy, H2O and CO2) and outputs (CO2 and carbohydrates) of photosynthesis.
The NGSS also defined as a core idea the use of matter and energy organisms need to
live and grow (NGSS, 2013). Therefore, learning about energy transformation in
photosynthesis is key to understand why gaseous output such O2 does not come from
gaseous input such as CO2 (Figure 2), but comes from the photolysis of water (H2O)
molecules. Seeing photosynthesis as a gas exchange process is a common misconception
students hold (Marmaroti & Galanopoulou , 2006). Understanding the energy
transformation process in photosynthesis, known as the electron transport chain (ETC),
would help learners to be aware of their own misconceptions and, by doing that, helped
them toward reaching their own conceptual change needed for learning (Galli, 2016).
This study aimed to contribute to the research done about how to enhance
students' learning of energy transformation in biological settings connected to the flow of
electrons. This work explored an instructional approach for supporting students’
knowledge of energy transformation in a biological system and their ability to use this

233
knowledge to explain the process. The instructional approach consisted of an ETC video
and a game known as Electron Chute. They are models of how ETC works and they
focused on developing students' learning of ETC in a way that could support their ability
to remember new vocabulary of ETC and explain the process at the molecular level. The
learning outcomes of the instructional approach were developed based on the common
misconceptions students hold about photosynthesis. These misconceptions were
described in section 2.3.1.2 in Chapter 2.
The design of learning experiences provided by the video and the game were
supported by the constructivist theory of knowing and the how people learn framework
(Bransford et al., 2000). Under the constructivist theory of knowing a visual
representation of ETC was designed to provide a schema that supported students' ability
to recall the parts of the ETC process (Anderson, 1978; Gordin & Pea, 1995; Mayer &
Moreno, 2002). In the game format, the rules that governed the movements of cards were
supported by the epistemic game framework (Collins & Ferguson, 1993) and they
represented the chemical reactions associated with the flow of electrons in ETC. The flow
of electrons in the ETC process transform sunlight energy into chemical energy in the
form of ATP and NADPH. The ETC representation was accurate and aligned to the
formal model used by scientists to explain ETC (Lehninger, Nelson & Cox, 2005).
Playing the game provided a transition between learning about science by watching
visual images and learning science by mimicking a real process scientists study in their
work. This is aligned to what NGSS states about students learning science by using
methods that represent the scientific work (NGSS, 2013).
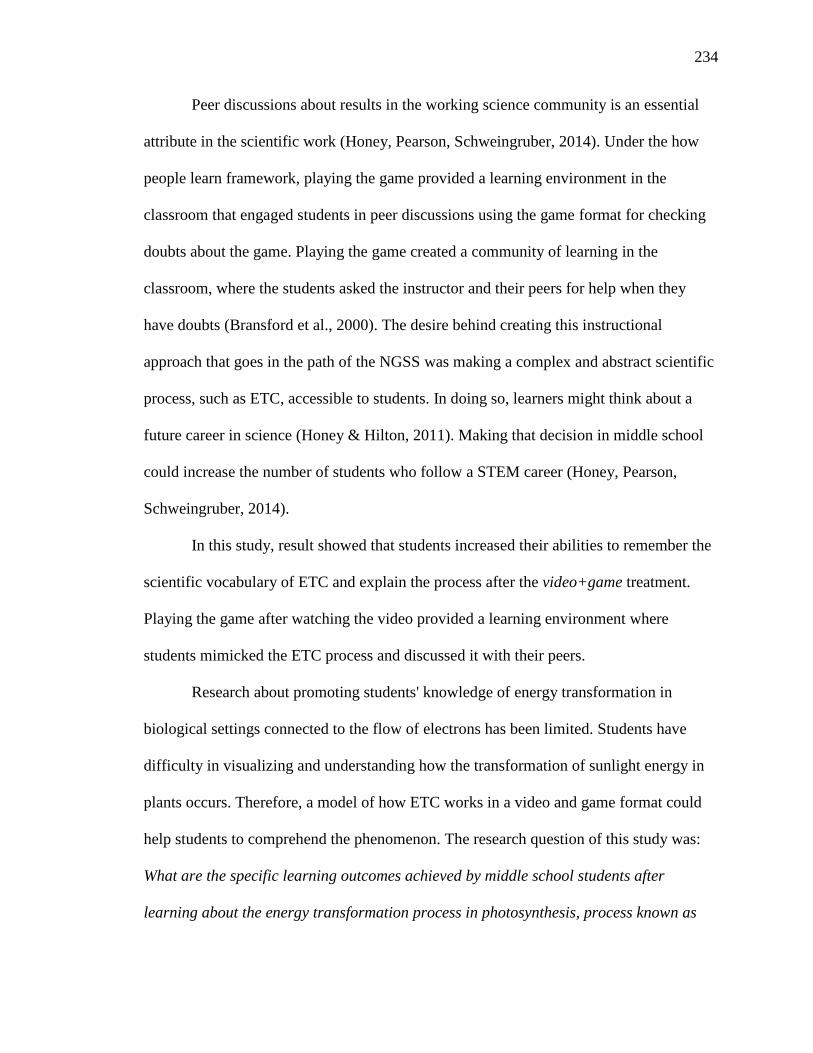
234
Peer discussions about results in the working science community is an essential
attribute in the scientific work (Honey, Pearson, Schweingruber, 2014). Under the how
people learn framework, playing the game provided a learning environment in the
classroom that engaged students in peer discussions using the game format for checking
doubts about the game. Playing the game created a community of learning in the
classroom, where the students asked the instructor and their peers for help when they
have doubts (Bransford et al., 2000). The desire behind creating this instructional
approach that goes in the path of the NGSS was making a complex and abstract scientific
process, such as ETC, accessible to students. In doing so, learners might think about a
future career in science (Honey & Hilton, 2011). Making that decision in middle school
could increase the number of students who follow a STEM career (Honey, Pearson,
Schweingruber, 2014).
In this study, result showed that students increased their abilities to remember the
scientific vocabulary of ETC and explain the process after the video+game treatment.
Playing the game after watching the video provided a learning environment where
students mimicked the ETC process and discussed it with their peers.
Research about promoting students' knowledge of energy transformation in
biological settings connected to the flow of electrons has been limited. Students have
difficulty in visualizing and understanding how the transformation of sunlight energy in
plants occurs. Therefore, a model of how ETC works in a video and game format could
help students to comprehend the phenomenon. The research question of this study was:
What are the specific learning outcomes achieved by middle school students after
learning about the energy transformation process in photosynthesis, process known as
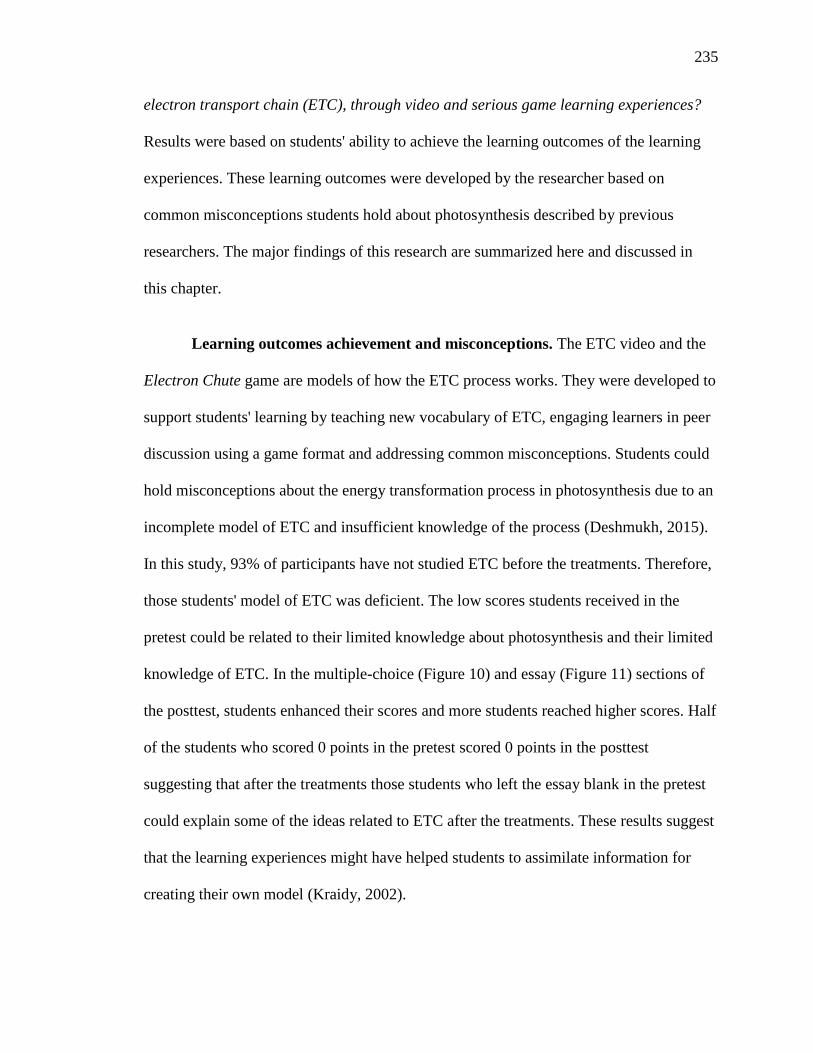
235
electron transport chain (ETC), through video and serious game learning experiences?
Results were based on students' ability to achieve the learning outcomes of the learning
experiences. These learning outcomes were developed by the researcher based on
common misconceptions students hold about photosynthesis described by previous
researchers. The major findings of this research are summarized here and discussed in
this chapter.
Learning outcomes achievement and misconceptions. The ETC video and the
Electron Chute game are models of how the ETC process works. They were developed to
support students' learning by teaching new vocabulary of ETC, engaging learners in peer
discussion using a game format and addressing common misconceptions. Students could
hold misconceptions about the energy transformation process in photosynthesis due to an
incomplete model of ETC and insufficient knowledge of the process (Deshmukh, 2015).
In this study, 93% of participants have not studied ETC before the treatments. Therefore,
those students' model of ETC was deficient. The low scores students received in the
pretest could be related to their limited knowledge about photosynthesis and their limited
knowledge of ETC. In the multiple-choice (Figure 10) and essay (Figure 11) sections of
the posttest, students enhanced their scores and more students reached higher scores. Half
of the students who scored 0 points in the pretest scored 0 points in the posttest
suggesting that after the treatments those students who left the essay blank in the pretest
could explain some of the ideas related to ETC after the treatments. These results suggest
that the learning experiences might have helped students to assimilate information for
creating their own model (Kraidy, 2002).
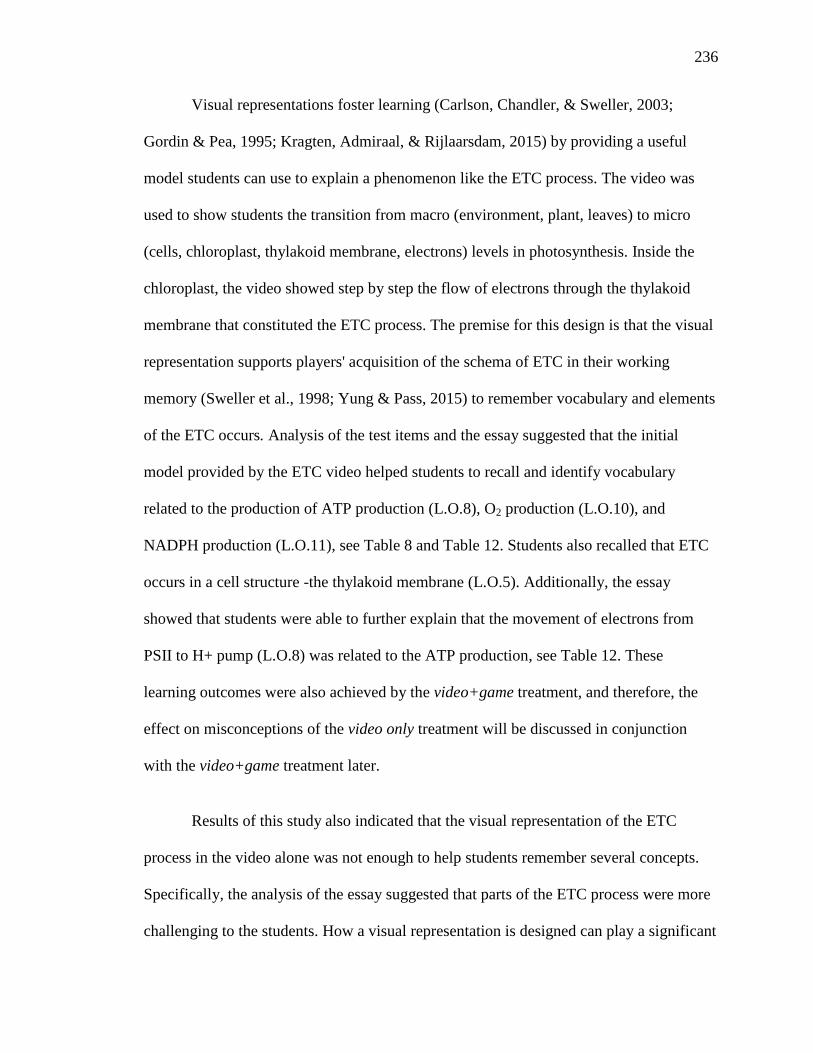
236
Visual representations foster learning (Carlson, Chandler, & Sweller, 2003;
Gordin & Pea, 1995; Kragten, Admiraal, & Rijlaarsdam, 2015) by providing a useful
model students can use to explain a phenomenon like the ETC process. The video was
used to show students the transition from macro (environment, plant, leaves) to micro
(cells, chloroplast, thylakoid membrane, electrons) levels in photosynthesis. Inside the
chloroplast, the video showed step by step the flow of electrons through the thylakoid
membrane that constituted the ETC process. The premise for this design is that the visual
representation supports players' acquisition of the schema of ETC in their working
memory (Sweller et al., 1998; Yung & Pass, 2015) to remember vocabulary and elements
of the ETC occurs. Analysis of the test items and the essay suggested that the initial
model provided by the ETC video helped students to recall and identify vocabulary
related to the production of ATP production (L.O.8), O2 production (L.O.10), and
NADPH production (L.O.11), see Table 8 and Table 12. Students also recalled that ETC
occurs in a cell structure -the thylakoid membrane (L.O.5). Additionally, the essay
showed that students were able to further explain that the movement of electrons from
PSII to H+ pump (L.O.8) was related to the ATP production, see Table 12. These
learning outcomes were also achieved by the video+game treatment, and therefore, the
effect on misconceptions of the video only treatment will be discussed in conjunction
with the video+game treatment later.
Results of this study also indicated that the visual representation of the ETC
process in the video alone was not enough to help students remember several concepts.
Specifically, the analysis of the essay suggested that parts of the ETC process were more
challenging to the students. How a visual representation is designed can play a significant
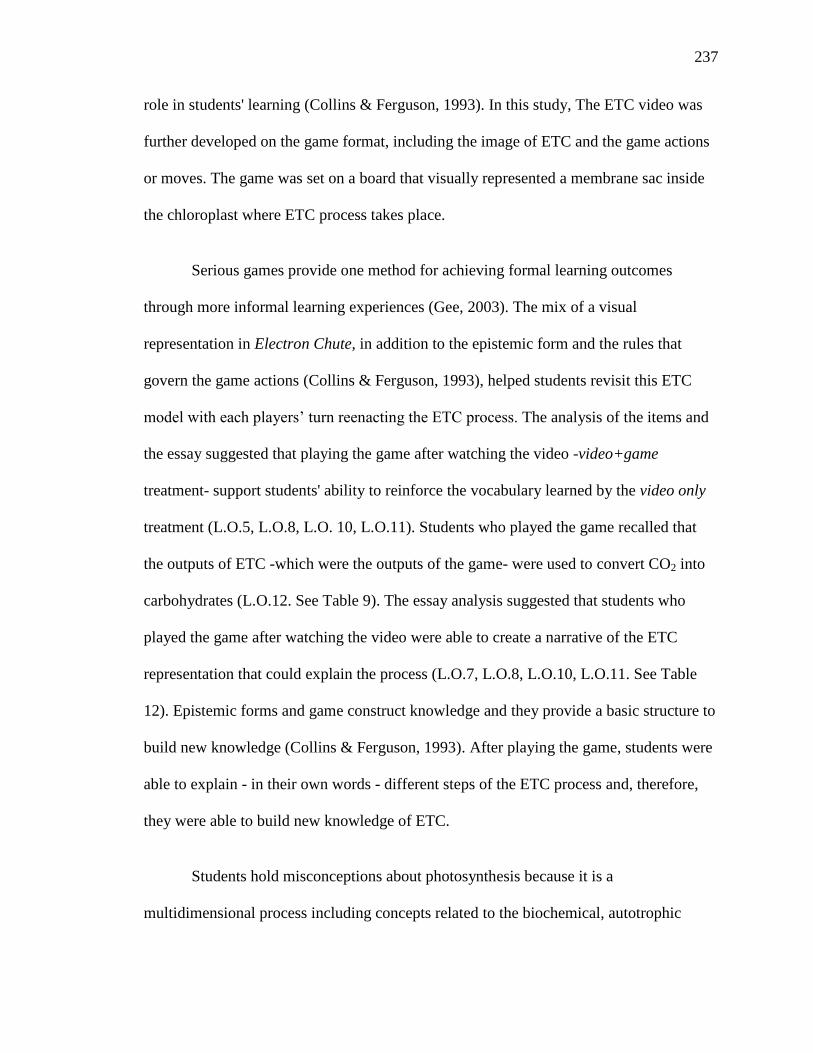
237
role in students' learning (Collins & Ferguson, 1993). In this study, The ETC video was
further developed on the game format, including the image of ETC and the game actions
or moves. The game was set on a board that visually represented a membrane sac inside
the chloroplast where ETC process takes place.
Serious games provide one method for achieving formal learning outcomes
through more informal learning experiences (Gee, 2003). The mix of a visual
representation in Electron Chute, in addition to the epistemic form and the rules that
govern the game actions (Collins & Ferguson, 1993), helped students revisit this ETC
model with each players’ turn reenacting the ETC process. The analysis of the items and
the essay suggested that playing the game after watching the video -video+game
treatment- support students' ability to reinforce the vocabulary learned by the video only
treatment (L.O.5, L.O.8, L.O. 10, L.O.11). Students who played the game recalled that
the outputs of ETC -which were the outputs of the game- were used to convert CO2 into
carbohydrates (L.O.12. See Table 9). The essay analysis suggested that students who
played the game after watching the video were able to create a narrative of the ETC
representation that could explain the process (L.O.7, L.O.8, L.O.10, L.O.11. See Table
12). Epistemic forms and game construct knowledge and they provide a basic structure to
build new knowledge (Collins & Ferguson, 1993). After playing the game, students were
able to explain - in their own words - different steps of the ETC process and, therefore,
they were able to build new knowledge of ETC.
Students hold misconceptions about photosynthesis because it is a
multidimensional process including concepts related to the biochemical, autotrophic

238
feeding, ecological, energetic and physiological dimensions (Russell, Netherwood, &
Robinson, 2004). In the physiological dimension, students identified the leaves as the
place where photosynthesis occurs (Kose, 2008) but they could have difficulties
visualizing the cell structures where ETC takes place. Learning outcome 5 (L.O.5)
measured students' ability to recall that ETC in photosynthesis occurs in the thylakoid
membrane, see Table 8. The thylakoid is a structure inside the chloroplast, which is
surrounded by the stroma, the liquid inside the chloroplast. See the back of the board in
Figure 5 for the location of these structures.
Learning outcome 5 aimed to address a misconception held by students in regard
to the cell location of photosynthesis as a whole, including the ETC process:
Photosynthesis takes place in chlorophyll (Deshmukh, 2015). This misconception could
also be related to the similarities between the words "chloroplast" and "chlorophyll."
Photosynthesis takes place in the chloroplast. The first phase of photosynthesis, known as
the ETC process, occurs in the thylakoid membrane that is inside the chloroplast.
Chlorophyll molecules are pigments physically located in the thylakoid membrane inside
the chloroplast. See Chapter 2 for more details. After treatments, 45% of students in the
whole class remembered that the thylakoid membrane was the structure were ETC took
place. Results suggested a positive effect of both treatments on students' achievement of
L.O.5 and on addressing this misconception.
Learning outcome 7 (L.O.7) measured students' ability to recall that the ETC
process started when the sunlight energy was captured by chlorophyll molecules, see
Table 8 and Figure 6. Learning outcome 7 aimed to address a misconception focused on
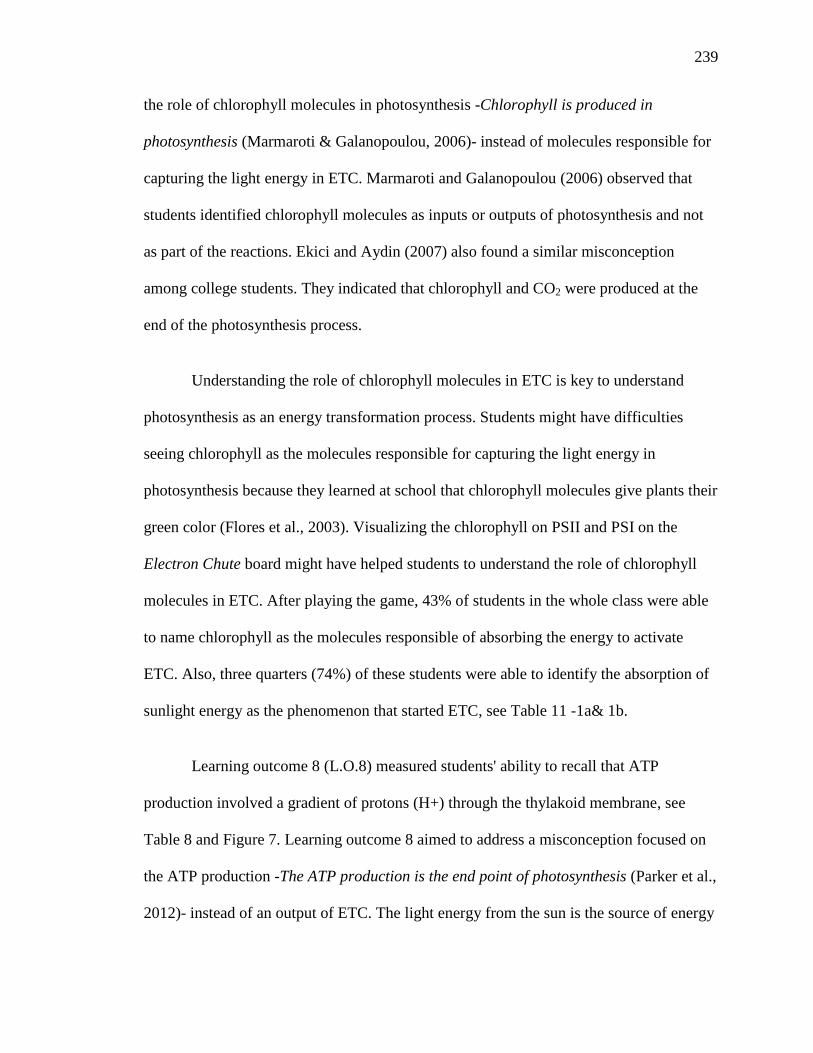
239
the role of chlorophyll molecules in photosynthesis -Chlorophyll is produced in
photosynthesis (Marmaroti & Galanopoulou, 2006)- instead of molecules responsible for
capturing the light energy in ETC. Marmaroti and Galanopoulou (2006) observed that
students identified chlorophyll molecules as inputs or outputs of photosynthesis and not
as part of the reactions. Ekici and Aydin (2007) also found a similar misconception
among college students. They indicated that chlorophyll and CO2 were produced at the
end of the photosynthesis process.
Understanding the role of chlorophyll molecules in ETC is key to understand
photosynthesis as an energy transformation process. Students might have difficulties
seeing chlorophyll as the molecules responsible for capturing the light energy in
photosynthesis because they learned at school that chlorophyll molecules give plants their
green color (Flores et al., 2003). Visualizing the chlorophyll on PSII and PSI on the
Electron Chute board might have helped students to understand the role of chlorophyll
molecules in ETC. After playing the game, 43% of students in the whole class were able
to name chlorophyll as the molecules responsible of absorbing the energy to activate
ETC. Also, three quarters (74%) of these students were able to identify the absorption of
sunlight energy as the phenomenon that started ETC, see Table 11 -1a& 1b.
Learning outcome 8 (L.O.8) measured students' ability to recall that ATP
production involved a gradient of protons (H+) through the thylakoid membrane, see
Table 8 and Figure 7. Learning outcome 8 aimed to address a misconception focused on
the ATP production -The ATP production is the end point of photosynthesis (Parker et al.,
2012)- instead of an output of ETC. The light energy from the sun is the source of energy
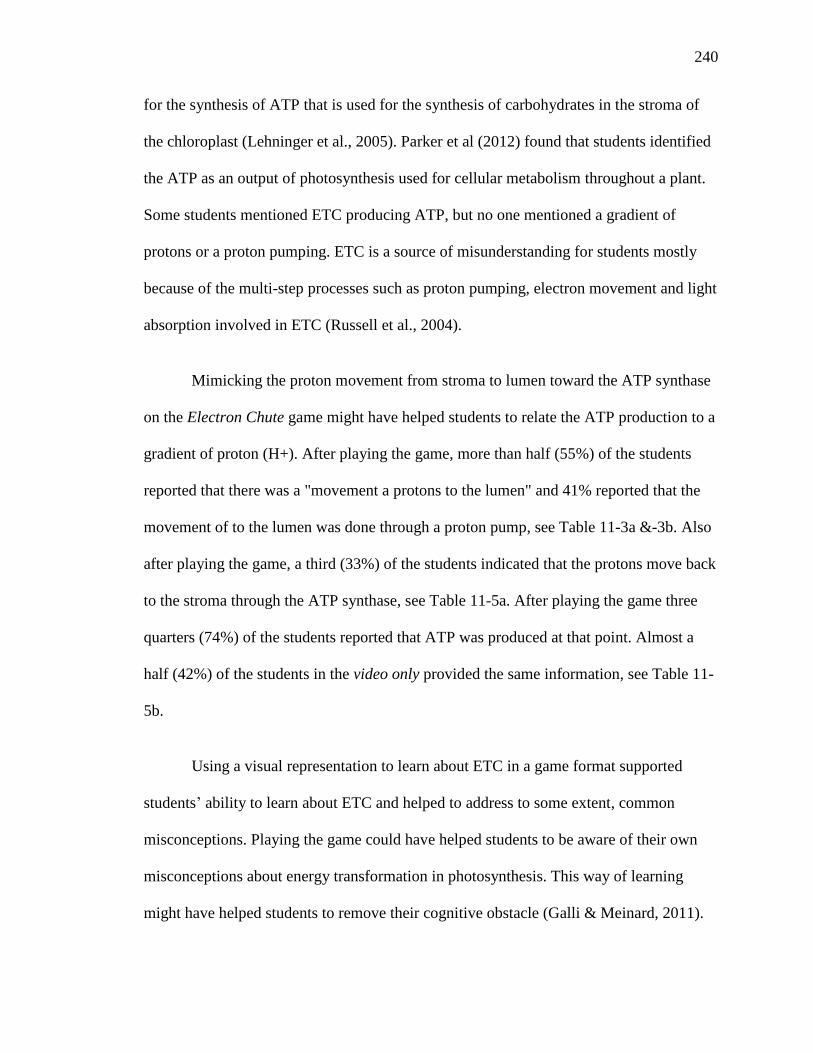
240
for the synthesis of ATP that is used for the synthesis of carbohydrates in the stroma of
the chloroplast (Lehninger et al., 2005). Parker et al (2012) found that students identified
the ATP as an output of photosynthesis used for cellular metabolism throughout a plant.
Some students mentioned ETC producing ATP, but no one mentioned a gradient of
protons or a proton pumping. ETC is a source of misunderstanding for students mostly
because of the multi-step processes such as proton pumping, electron movement and light
absorption involved in ETC (Russell et al., 2004).
Mimicking the proton movement from stroma to lumen toward the ATP synthase
on the Electron Chute game might have helped students to relate the ATP production to a
gradient of proton (H+). After playing the game, more than half (55%) of the students
reported that there was a "movement a protons to the lumen" and 41% reported that the
movement of to the lumen was done through a proton pump, see Table 11-3a &-3b. Also
after playing the game, a third (33%) of the students indicated that the protons move back
to the stroma through the ATP synthase, see Table 11-5a. After playing the game three
quarters (74%) of the students reported that ATP was produced at that point. Almost a
half (42%) of the students in the video only provided the same information, see Table 11-
5b.
Using a visual representation to learn about ETC in a game format supported
students’ ability to learn about ETC and helped to address to some extent, common
misconceptions. Playing the game could have helped students to be aware of their own
misconceptions about energy transformation in photosynthesis. This way of learning
might have helped students to remove their cognitive obstacle (Galli & Meinard, 2011).
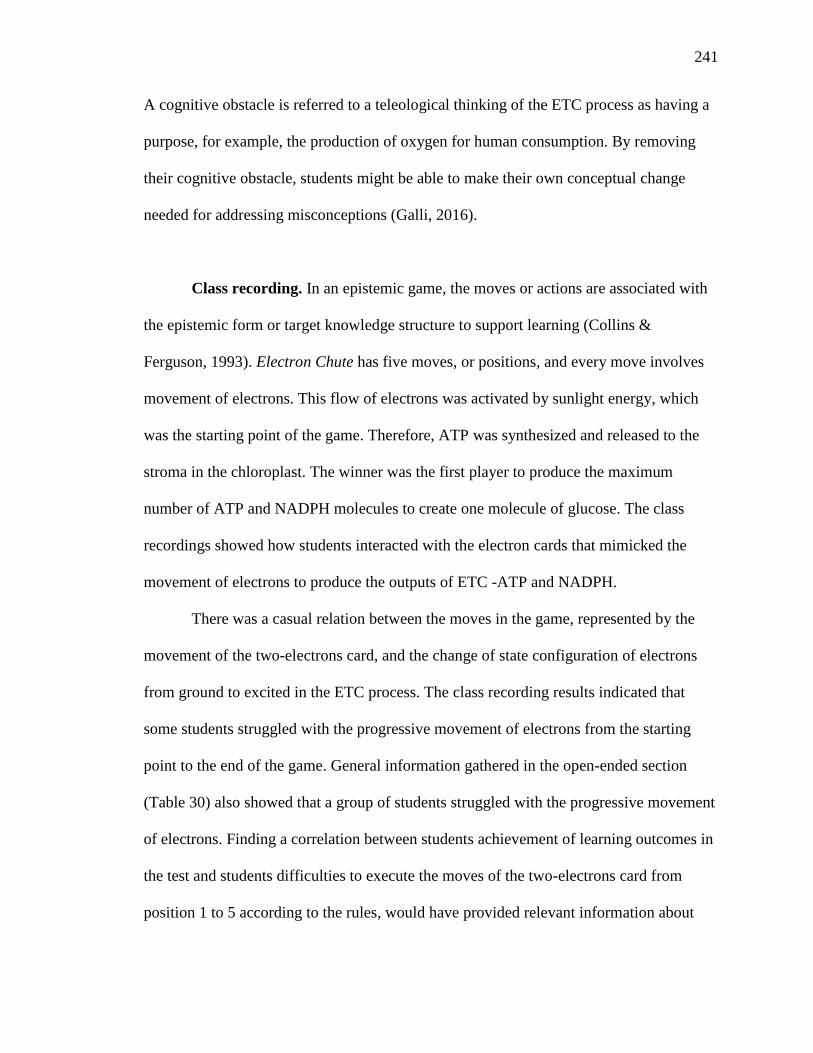
241
A cognitive obstacle is referred to a teleological thinking of the ETC process as having a
purpose, for example, the production of oxygen for human consumption. By removing
their cognitive obstacle, students might be able to make their own conceptual change
needed for addressing misconceptions (Galli, 2016).
Class recording. In an epistemic game, the moves or actions are associated with
the epistemic form or target knowledge structure to support learning (Collins &
Ferguson, 1993). Electron Chute has five moves, or positions, and every move involves
movement of electrons. This flow of electrons was activated by sunlight energy, which
was the starting point of the game. Therefore, ATP was synthesized and released to the
stroma in the chloroplast. The winner was the first player to produce the maximum
number of ATP and NADPH molecules to create one molecule of glucose. The class
recordings showed how students interacted with the electron cards that mimicked the
movement of electrons to produce the outputs of ETC -ATP and NADPH.
There was a casual relation between the moves in the game, represented by the
movement of the two-electrons card, and the change of state configuration of electrons
from ground to excited in the ETC process. The class recording results indicated that
some students struggled with the progressive movement of electrons from the starting
point to the end of the game. General information gathered in the open-ended section
(Table 30) also showed that a group of students struggled with the progressive movement
of electrons. Finding a correlation between students achievement of learning outcomes in
the test and students difficulties to execute the moves of the two-electrons card from
position 1 to 5 according to the rules, would have provided relevant information about
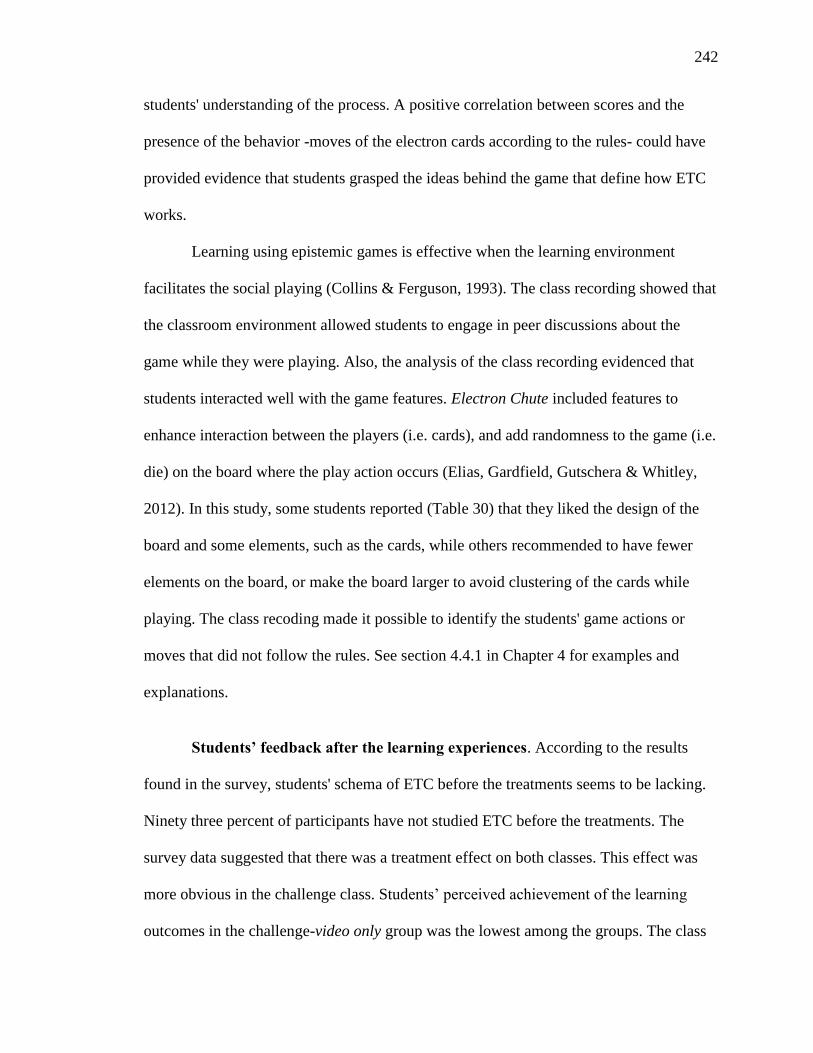
242
students' understanding of the process. A positive correlation between scores and the
presence of the behavior -moves of the electron cards according to the rules- could have
provided evidence that students grasped the ideas behind the game that define how ETC
works.
Learning using epistemic games is effective when the learning environment
facilitates the social playing (Collins & Ferguson, 1993). The class recording showed that
the classroom environment allowed students to engage in peer discussions about the
game while they were playing. Also, the analysis of the class recording evidenced that
students interacted well with the game features. Electron Chute included features to
enhance interaction between the players (i.e. cards), and add randomness to the game (i.e.
die) on the board where the play action occurs (Elias, Gardfield, Gutschera & Whitley,
2012). In this study, some students reported (Table 30) that they liked the design of the
board and some elements, such as the cards, while others recommended to have fewer
elements on the board, or make the board larger to avoid clustering of the cards while
playing. The class recoding made it possible to identify the students' game actions or
moves that did not follow the rules. See section 4.4.1 in Chapter 4 for examples and
explanations.
S n ’ b ck h n ng x nc . According to the results
found in the survey, students' schema of ETC before the treatments seems to be lacking.
Ninety three percent of participants have not studied ETC before the treatments. The
survey data suggested that there was a treatment effect on both classes. This effect was
more obvious in the challenge class. Students’ perceived achievement of the learning
outcomes in the challenge-video only group was the lowest among the groups. The class
243
recording did not show evident differences between both classes while they were playing
the game (video+game treatment). This also suggested that the delayed time for viewing
the video and playing the game might have reduced the learning potential of the
challenge students who were part of the video only treatment. This situation could be
associated to the characteristics of a challenge class or the rules of the game or both. An
intent to improve the rules is in the appendix section (Appendix G).
Challenge students in the video only treatment could have experienced frustration
(Moon, 2009) because they were not comfortable to learn about the ETC process using an
informal learning approach as it was playing the Electron Chute game. Regular students
in both treatments appeared to like to game and to have more interest for learning through
informal instruction such as playing a game, in comparison to the challenge students.
This could be related to (a) the level of pressure for success or the classroom environment
stressors students encounter because of their comparable above average ability (Moon,
2009); (b) fear to look incompetent in front of their peers (Bonanno & Kommers, 2008);
(c) frustration or low resilience when they face a more challenging activity (Moon, 2009).
All of these factors affect the emotional state of the player, which has an important
impact on the player experience (Gilleade & Dix, 2004). These stress factors could have
affected to the students who attended period 1 (challenge-video only) and that could
explain on some level, that most of them reported to be lost while playing the game and
few of them reported to be clear on the rules and how to play by the end of the game.
How learners learn to play a game must be clear (Salen & Zimmerman, 2004).
Students who were part of the video only treatment reported they were unclear about the
244
rules, most of them from the challenge class. Rules were vital in the Electron Chute game
because they constrained the movement a player could or could not take. The moves in
the game were linked to the causal relations of electron change of state configuration
from ground to excited in the ETC process. The rules supported players to learn specific
content (Charsky, 2010) about the steps of ETC. Students in the video only treatment
played the game after taking the posttest. Therefore, it is possible that their lower scores
of the video only, in comparison to the video+game treatment, were not related to the
unclear rules, but to the fact that these students took the posttest after only watching the
video. A test after the video only group played the game would have helped the
researcher to elucidate the quantifiable negative impact of the delay on students’
achievement of learning outcomes.
The time provided to read the rules was not enough for all students. Time
constraint is an important element of the design of a game (Deterding, Dixon, Khaled &
Nacke, 2011). In this case, the playing time was 20-25 minutes. From the class recording,
few students read the instructions. The researcher explained the instructions to the class
before playing the game. There were three to five trained adults available during the
activity to answer all students' questions regarding how to play the game. At the
beginning of the game activity, most of the students spent at least 2 minutes asking
instructors how to play instead of reading the instructions. Some of the teams were able
to follow the instructions provided by the instructors and ask for clarification to them and
to their teammates, but some of them struggled with the time constraint.
245
Besides the difficulties students faced with the rules and time constrain at the
beginning of the ETC game, other explanations for the low interest of participants in
learning other concepts similar to ETC could be related to the students': (a) attitude about
learning science (Singh, Mido & Dika, 2005); (b) interest in getting engaged in gaming
for learning (Bonanno & Kommers, 2008); (c) interest in learning science through games
(Israel, Wang, & Marino, 2016); (d) gender (Bonanno & Kommers, 2008). Students'
attitude in regard to science influences their engagement to learn science (Singh, Mido, &
Dika, 2005). Students' interest in learning science by playing a game depends on the
content and personal characteristics (Israel, Wang, & Marino, 2016).
One conjecture for using serious games in formal educational settings is that
learners see games as fun (Elias, Garfield, Gutschera & Whitley, 2012) and less school-
like (Gee, 2003). However, a game format might be less suitable for students who see
games as a source of entertainment more than as a learning experiences (Bonanno &
Kommers, 2008) and for those students who require formal instructional curriculum (Reis
& Renzulli, 2004). Students with positive views of learning are more likely to engage in
informal learning (Bell, Lewenstein, Shouse, & Feder, 2007). Using a serious game such
as Electron Chute in formal education could be a plausible instructional approach for
those students who have a positive view of learning with different methods, such as the
mainstream regular students in this study. Through more refinements of the game, these
learning experiences could be a viable learning experience that accommodates the needs
of a diverse population of students who might prefer different learning methods.
246
Summary. The ETC video and the Electron Chute learning experiences had a
positive impact on students' achievement of several learning outcomes. Playing Electron
Chute one day after watching the ETC video affected the learning experience of
challenge-video only group, who reported being lost unclear about the rules of the game.
Students' feedback could be used to make adjustment to the video's form and the game’s
form and play rules to provide a better learning experience. A revised version of the rules
is proposed in Appendix G.
247
CHAPTER 6. CONCLUSIONS
This study explored a video and a game learning experiences for supporting
students’ learning of the ETC process. This instructional intervention focused on helping
learners’ conceptual representation of the ETC process in a way that would support their
ability to explain the process at the molecular level. The conclusions of this study derived
from the implementation of a pretest-posttest design to measure the effect of the
treatment and academic readiness on score gain. Students' feedback was collected from a
survey at the end of the treatments and it provided insights of how to improve the game
for future learners.
6.1 Conclusions of the Study
In an era where knowledge is provided to learners from many different channels,
engaging students in serious game like the Electron Chute game could invite learners to
gain understanding of abstract and complex scientific concepts. The schema of ETC
provided by the video and reinforced by playing the Electron Chute game fostered
students' ability to remember the vocabulary of ETC and helped them explaining how the
ETC works. Several key points of this study are as follows.
1) Prompting understanding of photosynthesis as an energy transformation process
with a straightforward video and game.
a. Understanding the role of chlorophyll in ETC is key to understand
photosynthesis as an energy transformation process. Visualizing the
chlorophyll on PSII and PSI on the Electron Chute board might have
248
helped students to understand the role of chlorophyll molecules in ETC.
The ETC video and the Electron Chute game learning experiences had a
positive impact on students' achievement of several learning outcome
goals of the study, which included understanding the role of chlorophyll in
ETC.
b. The majority of students in the video+game treatment declared having an
increased ability to explain how plants convert light energy into energy
plants need to survive. Students learned new vocabulary of ETC and they
were able to write down several sequential ideas of the ETC process.
Learning key ideas could help students make connections with other
similar scientific processes they would learn in a similar learning context
and that scientist do in their everyday work.
c. Iterations of the game learning activity would have helped students to
fully target the desire learning outcomes and misconceptions. The learning
outcomes were based on the understanding -remembering and explaining-
of the ETC process. The ETC process is a representation of the
transformation of one type of energy -light energy- into another type-
chemical energy by the activation of particles known as electrons. Playing
the game several times could reinforce the scientific language and the
process by mimicking its steps continuously.
2) Visual representation of abstract science concept supported learning and
addressing misconceptions.
249
a. Using a visual representation of ETC in photosynthesis as a game
supported students’ ability to learn about ETC and helped to address to
some extent, common misconceptions. Playing the game could have
helped students to be aware of their own misconceptions about energy
transformation in photosynthesis.
b. The design of a serious game for learning unseen processes needs to have
a simplified but accurate representation of the process to be meaningful
for the learners. The video was designed to introduce the idea of energy
transformation represented by the ETC process. The game was designed
as a model of causal ideas related to this energy transformation. The game
explicitly triggered students' discussions about the rules that were
intentionally designed to match the learning outcomes of the game and
increase the learners' abilities to articulate explanations. Indirectly by
learning how to play the game, students were addressing misconceptions
and learning the science behind the game.
c. To learn science well, learners should learn key concepts and the
relationship between them. For example, the key concepts of the ETC
process of photosynthesis that were displayed in the Electron Chute game
are similar to the ETC process of cellular respiration.
3) Viable alternate instructional approach aligned with NCSS standards promotes
positive views of learning.
a. Playing the game provided a transition between learning about science by
watching visual images and learning science by mimicking a real process
250
scientists study in their work. This is aligned to NGSS that indicate
students learning science through methods that represent the scientific
work.
b. Students were able to remember the basics of the scientific language of a
complex process -such as ETC- and to explain those concepts in an essay
after playing the game just one time. This suggested that students were
able to process data and information in a manner that allowed them to
engage with science using different learning methods, such as a serious
game. This kind of instructional intervention is challenging for students
but it fosters group participation that allows them to actively engage in
their own learning.
c. Using a serious game such as Electron Chute in formal education could be
a plausible instructional approach for those students who have a positive
view of learning with different methods, such as the mainstream regular
students in this study. Through more refinements of the game, these
learning exercises could be a viable learning experience that
accommodates the needs of a diverse population of students who might
prefer different learning methods.
d. Mainstream regular students were positive about learning with the game.
They were most likely to report understanding the rules of the game,
finding it interesting, and being able to explain how plants transform
energy from the sun into energy plants need to survive. Students with
positive views of learning are more likely to engage in informal learning.
251
4) Social interaction in the learning environment created through game play.
a. Learning using serious games such as ETC can be effective when the
learning environment facilitates social interactions. In this study, the
classroom environment allowed students to engage in peer discussions
about the game while they were playing. Additionally, students interacted
well with the game features. Electron Chute included features to enhance
interaction between the players (i.e. cards) and add randomness to the
game (i.e. die).
b. A Reinforcement of ideas came from peer discussion. Playing the game
within a community of learning -such as a classroom- provided the
opportunity for all team members to learn through peer's discussions, even
for those who were listeners.
6.2 Limitations
Some additional limitations were found during the development of this
dissertation, beside those mentioned in Chapter 1.
This research did not find the misconceptions participants' hold about the energy
transformation process in photosynthesis by asking them to draw how they thought ETC
occurs. Rather, the misconceptions were obtained from the literature review. Also, the
ETC video and the Electron Chute game were not suitable for blind participants, but no
participant in this study had a visual disability.
In regard to the lessons prior the treatments, there was not a pre-test that measures
the effectiveness of the lessons about photosynthesis. Those lessons (Appendix D & E)
252
were taught prior to treatments to help students gain the basic knowledge of
photosynthesis -inputs and outputs- required to study the ETC process. The learning
outcomes -1 to 4- of the lessons were measured with the items 1 to 4 of the instrument.
In this study, students did not have the chance to play a second round to reinforce
retention of knowledge and aid students to improve knowledge performance (Grechus &
Brown, 2000). Considering that students had to fulfill the requirements of the school
curriculum before the end of the academic year, students were available to play Electron
Chute only once at the end of the school year. Also, the lapse of time students had to
interact with the Electron Chute game might have not been enough to complete the task
and retain what they were learning while playing (Ausubel, 2012).
For future research, the game should be played more than once to help students in
remembering information. The number of repetition and the time allotted for playing
would depend on the time and resource constraints the teacher has for his or her classes.
Learning under a constructivist view involves iteration to improve students'
understanding of a process (Lee & Hannafin, 2016).
Absence of repetition or playing Electron Chute only once reduced opportunities
to reinforce learning outcomes. If students would have had the opportunity to play the
game several times until they mastered the game, they could understand the energy
transformation process in photosynthesis better. If students learn the ETC process in
photosynthesis well, they could use the general concepts learned of this complex process
in a similar process (Barnett & Ceci, 2002). Another study needs to be done to identify
how many iterations it takes until achieving the learning goals is achieved.
253
In a way to best capture thoughts from the regular and challenge classes,
interviews could have been conducted with a small number of students per group.
nterviews give the researcher the chance to ask for students’ clarifications and expand
their answers (Saldaña, 2009). In doing that, cognitive obstacle -teleological thinking- for
understanding of ETC could be detected (Galli, 2011). A cognitive obstacle is referred to
a teleological thinking of the ETC process as having a purpose, for example, the
production of oxygen for human consumption. With the right questions, the researcher
could pursue conjectures associated with the differences between the regular and
challenge classes in regard to games as entertainment versus learning experiences
(Bonanno & Kommers, 2008).
In the same context, it would have been enriching to have request from students to
build their own representation or schema of ETC to determine their misconceptions and if
their schema was sufficient for remembering and make sense of how ETC works
(Vosniadou, 2009). .Providing additional questions could have helped the researcher to
identify any cognitive obstacle-teleological thinking- that might be obstructing students'
understanding of ETC (Galli &Meinard, 2011). In doing so, inferences about the
conceptual change needed for learning ETC could have been done (Galli, 2016).
254
6.3 Recommendations
The recommendations are general and are based on the conclusions of this
learning experience. They are for teachers who wish to use this instructional approach in
the classroom and for designer who wish to improve the design of the Electron Chute
game to improve students' learning experience with the game.
6.3.1 Recommendations for Teachers
How to apply and assess the video and game experiences in the classroom.
The author has four recommendations for applying these learning experiences in the
classroom: (1) Watch the ETC video and play the game on the same day; (2) Distribute 2-
3 players per team to increase the chance of participation; (3) Read the rules aloud and
discuss them with the class; (4) Play Electron Chute more than once (iteration). In regard
to the assessment, teachers need to develop an effective test. In the case of test items,
teachers need to exactly match the learning outcomes and the steps of the game with the
content in the item. In the case of essays, teachers could ask students to draw and explain
the steps of ETC representation. Teachers could decide to evaluate students with different
strategies, but these need to be appropriately design to measure the learning outcomes of
the game.
6.3.2 Recommendations for Designers
Refinement of the Electron Chute game. One of author's recommendation for
the refinement of the game is to develop different levels of the Electron Chute game.
Creating short versions of the game might help students who require different
255
instructional methods (Reis & Renzulli, 2004) to reduce cognitive load (Sweller, 1994).
These levels in order are: (1) only PSII system -position 1- activation of chlorophyll and
water by light and production of oxygen; (2) the ATP production -movement of the two-
electron cards from position 2 to 3; (3) only PSI system- movement from position 3 to 4 -
chlorophyll molecules are activated by light; (4) the NADPH production -movement of
the two-electron card from position 4 to 5. If the intention is to work with a game with
the five positions, based on the results of this study the researcher recommends to split
the PSII system in two steps: (1) activation of chlorophyll molecules by sunlight; (2)
photolysis of water molecules and production of oxygen. In doing so, the game makes
clear that the activation of chlorophyll occurs first, and as a consequence of that event
water molecules are split by the sunlight energy. Those reactions occur almost
simultaneously. First the activation of light produces that electrons from chlorophyll "are
lost" from PSII. Then, and therefore, there is a need to fill those lost electrons from others
that come from the photolysis of water molecules. As a consequence, oxygen is produced
from the split of water molecules by the sunlight energy.
A second recommendation is to create a video or game or both about the second
phase of photosynthesis -Calvin Cycle- to complete the photosynthesis process. The
outputs of ETC -ATP and NADPH- transform molecules of CO2 from the air into
carbohydrates- in the stroma of the chloroplast. Carbohydrates are used by plants for
storage, cell metabolism for maintenance and build its structure and, therefore, for their
survival.
The video and the game glance those ideas at the end and visualize that
transformation with the scorecard (18ATP+12NADPH+6CO2=> 1Glucose). However,
256
this transformation remained unveil for students during the video and game learning
experiences. Also, learning about the Calvin-Cycle as sequel game or video could help
students to have a global picture of the relationship between energy and matter. Any
molecule described in ETC and the Calvin Cycle has weight and then matter (Lehninger
et al., 2005). The transformation of molecules of CO2 into carbohydrates is a matter
transformation as well. The matter of plants, such as, the wood in the trees- bark and
branches- come from an invisible molecule in the air known as CO2 that leaves take in.
Therefore, most of the mass of trees come from the air. Differently to energy, which is
one direction, matter in the planet is recycled over and over. This concept is frequently
described in the Standards Indiana Academic Standards (Indiana Department of
Education, 2016);and the NGSS standards (NGSS, 2013).
6.4 Summary
The active participation of students during the Electron Chute game and the
positive results in the test and essay provided evidence to suggest that a serious game
might be suitable for learning complex scientific processes for middle school students in
an mainstream integrated classroom. The video and game learning experience might have
the potential for engaging students’ interest in science. Serious games could support
science understanding by allowing learners to visualize a phenomenon in the classroom
and mentally create a link between the representation and the unseen process. The final
goal is developing a serious game that supports the learning of ETC taking into account
the different learning methods of students who attend integrated classrooms in public
schools.
257
REFERENCES
Aldrich, C. (2009). Virtual worlds, simulations, and games for education: A unifying
view. Innovate: Journal of Online Education, 5(5), 1.
Ananyev, G., & Dismukes, G. C. (2005). How fast can Photosystem II split water?
Kinetic performance at high and low frequencies w, 355-365.
Anderson, R. C. (1978). Schema-directed processes in language comprehension. In
Cognitive psychology and instruction (pp. 67-82). Springer US.
Anderson, L. W., Krathwohl, D. R., & Bloom, B. S. (2001). A taxonomy for learning,
teaching, and assessing: A revision of Bloom's taxonomy of educational
objectives. Allyn & Bacon.
Annetta L.A., Minogue J., Holmes S.Y., & Cheng M.T. (2009) Investigating the impact
of video games on high school students’ engagement and learning about genetics.
Computers& Education 53, 74–85.
Ausubel, D. P. (2012). The acquisition and retention of knowledge: A cognitive view.
Springer Science & Business Media.
Baker, S. K. (1995). Vocabulary Acquisition: Synthesis of the Research. Technical
Report No. 13.
Barak, J., Gorodetsky, M., & Chipman, D. (1997). Understanding of energy in biology
and vitalistic conceptions. International Journal of Science Education, 19(1), 21-
30.
Barnett, S. M., & Ceci, S. J. (2002). When and where do we apply what we learn? A
taxonomy for far transfer. Psychological Bulletin, 128(4), 612–637.
doi:10.1037//0033-2909.128.4.612
258
Bassham, J. A., Benson, A. A., & Calvin, M. (1950). The path of carbon in
photosynthesis VIII. The role of malic acid. Lawrence Berkeley National
Laboratory.
Bell, P., Lewenstein, B., Shouse, A.W., & Feder, M.A. (2007). Learning Science in
Informal Environments: People, Places, and Pursuits. Committee on Learning
Science in Informal Environments: National Research Council.
Bielaczyc, K., & Kapur, M. (2010). Playing epistemic games in science and mathematics
classrooms.
Blankenship, R. E. (2013). Molecular mechanisms of photosynthesis. John Wiley & Sons.
Blessing, L. T., & Chakrabarti, A. (2009). DRM: A Design Reseach Methodology (pp.
13-42). Springer London.
Bonanno, P., & Kommers, P. A. M. (2008). Exploring the influence of gender and
gaming competence on attitudes towards using instructional games. British
Journal of Educational Technology, 39(1), 97-109.
Bransford, J., Brown, A., Cocking, R., Donovan, M. S., & Pellegrino, J. W. (2000).
Expanded Edition. How People Learn: Brain, Mind, Experience and School.
Carlson, R., Chandler, P., & Sweller, J. (2003). Learning and understanding science
instructional material. Journal of educational psychology, 95(3), 629.
Chabalengula, V. M., Sanders, M., & Mumba, F. (2012). Diagnosing students'
understanding of energy and its related concepts in biological context.
International Journal of Science and Mathematics Education, 10(2), 241-266.
Chaichian, M., Perez, H., & Tureanu, A. (2014). Basic Concepts in Physics: From the
Cosmos to Quarks. Springer Science & Business Media.Charsky, D. (2010). From
259
edutainment to serious games: A change in the use of game characteristics.
Games and culture.
Chi, M. T. (2008). Three types of conceptual change: Belief revision, mental model
transformation, and categorical shift. International handbook of research on
conceptual change, 61-82.
Collier, C. (2010). RTI for diverse learners: More than 200 instructional interventions.
Corwin Press.
Collins, A., & Ferguson, W. (1993). Epistemic forms and epistemic games: Structures
and strategies to guide inquiry. Educational Psychologist, 28(1), 25-42.
Cowley, B., Charles, D., Black, M., & Hickey, R. (2008). Toward an understanding of
flow in video games. Computers in Entertainment (CIE), 6(2), 20.
Davidson, J. E., Deuser, R., & Sternberg, R. J. (1994). The role of metacognition in
problem solving. In J. Metcalfe & A. Shimamura. (1996). (Eds.), Metacognition:
Knowing about knowing. The MIT Press.
Derry, S. J. (1996). Cognitive schema theory in the constructivist debate. Educational
Psychologist, 31(3-4), 163-174.
Deshmukh, N. D. (2015). Why Do School Students Have Misconceptions About Life
Processes?. In Biology Education and Research in a Changing Planet (pp. 31-43).
Springer Singapore.
Deterding, S., Dixon, D., Khaled, R., & Nacke, L. (2011, September). From game design
elements to gamefulness: defining gamification. In Proceedings of the 15th
international academic MindTrek conference: Envisioning future media
environments (pp. 9-15). ACM.
260
Diehl, L. A., Souza, R. M., Alves, J. B., Gordan, P. A., Esteves, R. Z., Jorge, M. L. S. G.,
& Coelho, I. C. M. (2013). InsuOnline, a serious game to teach insulin therapy to
primary care physicians: design of the game and a randomized controlled trial for
educational validation. JMIR Research Protocols, 2(1), e5.
Eaton-Rye, J. J., Tripathy, B. C., & Sharkey, T. D. (Eds.). (2011). Photosynthesis: Plastid
biology, energy conversion and carbon assimilation (Vol. 34). Springer Science
& Business Media.
Elias, G. S., Garfield, R., Gutschera, K. R., & Whitley, P. (2012). Characteristics of
games. MIT Press.
Fleming, S. M., Dolan, R. J., & Frith, C. D. (2012). Metacognition: computation, biology
and function.
Flores, F., Tovar, M. E., & Gallegos, L. (2003). Representation of the cell and its
processes in high school students: an integrated view. International Journal of
Science Education, 25(2), 269-286.
Galli, L. G. (2016). El problema de la teleología y la metáfora del diseño en biología:
cuestiones epistemológicas e implicancias didácticas. TED: Tecné, Episteme y
Didaxis, (40).
Galli, L. G. & Meinardi, E. (2011). The Role of Teleological Thinking in Learning the
Darwinian Model of Evolution. Evolution: Education and Outreach. 4 (1): 145–
152.
Gee, J. P. (2003). What video games have to teach us about learning and literacy.
Computers in Entertainment (CIE), 1(1), 20-20.
261
Gilleade, K. M., & Dix, A. (2004, September). Using frustration in the design of adaptive
videogames. In Proceedings of the 2004 ACM SIGCHI International Conference
on Advances in computer entertainment technology (pp. 228-232). ACM.
Gordin, D. N., & Pea, R. D. (1995). Prospects for scientific visualization as an
educational technology. The Journal of the learning sciences, 4(3), 249-279.
Graphiq. (n.d.). StartClass: Lafayette Tecumseh Jr High School in Lafayette, Indiana.
Retrieved from http://public-schools.startclass.com/l/32067/Lafayette -Tecumseh-
Jr-High-School
Grechus, M., & Brown, J. (2000). Comparison of individualized computer game
reinforcement versus peer-interactive board game reinforcement on retention of
nutrition label knowledge. Journal of Health Education, 31(3), 138-142.
Hainey T., Connolly T., Stansfield M. & Boyle E.A. (2011). Evaluation of a game to
teach requirements collection and analysis in software engineering at tertiary
education level. Computers & Education 56, 21–35.
Honey, M., & Hilton, M. (2011). Learning Science Through Computer Games and
Simulations. Committee on Science Learning: Computer Games, Simulations, and
Education: National Research Council.
Honey, M., Pearson, G., & Schweingruber, H. (2014). STEM Integration in K-12
Education: Status, Prospects, and an Agenda for Research. Committee on
Integrated STEM Education: National Research Council.
Indiana Department of Education. (2016). Indiana Academic Standards. (2016).
Retrieved from: http://www.doe.in.gov/standards/biology-resources
http://www.doe.in.gov/standards/integrated-chemistry-physics-resources
262
Israel, M., Wang, S., & Marino, M. T. (2016). A multilevel analysis of diverse learners
playing life science video games: Interactions between game content, learning
disability status, reading proficiency, and gender. Journal of Research in Science
Teaching, 53(2), 324-345.
Johnson-Laird, P. N. (1983). Mental models: Towards a cognitive science of language,
inference, and consciousness (No. 6). Harvard University Press.
Joliot, P., Barbieri, G., Chabaud, R. (1969). Un nouveau modele des centres
photochimisques du systeme II. Photochemistry and Photobiology, 10(16), 309-
329.
Kampourakis, K. (2013). The philosophy of biology. Springer Science & Business Media.
Keeley, K. (2011). Uncovering Students Ideas in Life Sciences. NSTA Press.
Kim, B., Park, H., & Baek, Y. (2009). Not just fun, but serious strategies: Using meta-
cognitive strategies in game-based learning. Computers & Education, 52(4), 800-
810.
Kraidy, U. (2002). Digital media and education: cognitive impact of information
visualization. Journal of Educational Media, 27(3), 95-106.
Kragten, M., Admiraal, W., & Rijlaarsdam, G. 015 . Students’ Learning Activities
While Studying Biological Process Diagrams. International Journal of Science
Education, 37(12), 1915-1937.
Krippendorff, K. (2004). Content analysis: An introduction to its methodology. Sage.
Lafayette School Corporation (2016). Retrieved from: http://www.lsc.k12.in.us/
Lawlor, D. W., & Cornic, G. (2002). Photosynthetic carbon assimilation and associated
metabolism in relation to water deficit in higher plants. Plant, cell & environment,
263
25(2), 275–294. Retrieved from: http://www.ncbi.nlm.nih.gov/pubmed/11841670
doi: 10.1046/j.0016-8025.2001.00814.x
Lee, E., & Hannafin, M.J. (2016). A design framework for enhancing engagement in
student-centered learning: own it, learn it, and share it. Education Tech Research
Dev, 64, 707–734.
Lehninger, A. L., Nelson, D. L., & Cox, M. M. (2005). Lehninger's Principles of
Biochemistry. W. H Freeman.
Lennox, J. G., & Kampourakis, K. (2013). Biological teleology: the need for history. In
The Philosophy of Biology (pp. 421-454). Springer Netherlands.
Lin, C. Y., & Hu, R. (2003). Students' understanding of energy flow and matter cycling
in the context of the food chain, photosynthesis, and respiration. Int. J. Sci. Educ.,
25(12), 1529-1544.
Lonergan, T.A., (2000). The photosynthetic dark reactions do not operate in the dark. The
American Biology Teacher, 62(3), 166-170.
Marmaroti, P., & Galanopoulou, D. (2006). Pupils' understanding of photosynthesis: A
questionnaire for the simultaneous assessment of all aspects. International
Journal of Science Education, 28(4), 383-403.
Mayer, R. E. (1997). Multimedia learning: Are we asking the right questions?.
Educational psychologist, 32(1), 1-19.
Mayer, R. E. (2002). Multimedia learning. Psychology of learning and motivation, 41,
85-139.
Mayer, R. E., & Moreno, R. (2002). Animation as an aid to multimedia learning.
Educational psychology review, 14(1), 87-99.
264
Moon, S. M. (2009). Myth 15: High-ability students don't face problems and challenges.
The Gifted Child Quarterly, 53(4), 274.
National Research Council. (2012). A framework for K-12 science education: Practices,
crosscutting concepts, and core ideas. National Academies Press. Retrieved from:
https://doi.org/10.17226/13165
Neumann, K., Viering, T., Boone, W. J., & Fischer, H. E. (2013). Towards a learning
progression of energy. Journal of Research in Science Teaching, 50(2), 162-188.
NGSS. (2013). HS-LS1 from molecules to organisms: Structures and processes Next
generation science standards: For states, by states. Retrieved from:
http://www.nextgenscience.org/dci-arrangement/hs-ls1-molecules-organisms-
structures-and-processes
NGSS. (n.d.). LS1.C: Organization for matter and energy flow in organisms. Sand Diego,
CA: San Diego County Office of Education, Next Generation Science Standards.
Retrieved from https://ngss.sdcoe.net/Disciplinary-Core-Ideas/DCI -Life-
Sciences/LS1C-Organization-for-Matter-and-Energy-Flow-in-OrganismsNGSS
Resource Center. (2017). Retrieved from: https://ngss.sdcoe.net/Disciplinary-
Core-Ideas/DCI-Life-Sciences/LS1C-Organization-for-Matter-and-Energy-Flow-
in-Organisms
North Dakota State University. (2004). Virtual Cell Animation Collection. Retrieved
from: http://vcell.ndsu.edu/animations/photosynthesis/movie-flash.htm
Parker, J. M., Anderson, C. W., Heidemann, M., Merrill, J., Merritt, B., Richmond, G., &
Urban-Lurain, M. (2012). Exploring undergraduates' understanding of
photosynthesis using diagnostic question clusters. CBE-Life Sciences Education,
265
11(1), 47-57. Popham, W. J. (2013). Classroom Assessment – What Teachers
Need to Know. Pearson.
Quinn, H. (2011). A Framework for K-12 Science Education (No. November). doi:
10.17226/13165
Ramesh, S., Sidhu, S. M., & Watugala, G. K. (2005). Exploring the potential of multiple
choice questions in computer-based assessment of student learning. Malaysian
Online Journal of Instructional Technology, 2(1), 1-15.
Rankin, Y. A., McNeal, M., Shute, M. W., & Gooch, B. (2008, August). User centered
game design: evaluating massive multiplayer online role playing games for
second language acquisition. In Proceedings of the 2008 ACM SIGGRAPH
symposium on Video games (pp. 43-49). ACM.
Reis, S. M., & Renzulli, J. S. (2004). Current research on the social and emotional
development of gifted and talented students: Good news and future possibilities.
Psychology in the Schools, 41(1), 119-130.
Robinson, C. (2002). Real world research: a resource for social scientists and
practitioner-researchers.
Saldaña, J. (2009). The Coding Manual for Qualitative Researchers (1st Ed.). London,
Sage Publications Ltd. Salen, K., & Zimmerman, E. (2004). Rules of play: Game
design fundamentals. MIT press.
Savery, J. R., & Duffy, T. M. 1 5 . Problem based learning: An instructional model and
its constructivist framework. Educational Technology, 35(5), 31–38. doi: 47405-
1006.
266
Schwartz, R., & Brown, M. H. (2013). Understanding Photosynthesis and Cellular
Respiration: Encouraging a View of Biological Nested Systems. In Multiple
Representations in Biological Education (pp. 203-223). Springer Netherlands.
Schwartz, D. L., Lin, X., Brophy, S., & Bransford, J. D. (1999). Toward the development
of flexibly adaptive instructional designs. Instructional-design theories and
models: A new paradigm of instructional theory, 2, 183-213.
Singh, K., Chang, M., & Dika, S. (2005). Affective and Motivational Factors in
Engagement and Achievement in Science. International Journal of Learning,
12(6).
Shaffer, D. W., & Resnick, M. (1999). "Thick" Authenticity: New Media and Authentic
Learning. Journal of interactive learning research, 10(2), 195.
Solomon, J. (1983). Learning about energy: How pupils think in two domains. European
Journal of Science Education, 5(1), 49-59.
Svandova, K. 014 . Secondary school students’ misconceptions about photosynthesis
and plant respiration: Preliminary results. Eurasia Journal of Mathematics,
Science & Technology Education, 10(1), 59-67.
Sweller, J. (1994). Cognitive load theory, learning difficulty, and instructional design.
Learning and instruction, 4(4), 295-312.
Sweller, J., Van Merrienboer, J., & Paas, F. G. (1998). Cognitive architecture and
instructional design. Educational psychology review, 10(3), 251-296.
Treagust, D. F., Chittleborough, G., & Mamiala, T. L. (2002). Students' understanding of
the role of scientific models in learning science. International Journal of Science
Education, 24(4), 357-368.
267
Treagust, D.F., & Tsui, C.Y. (Eds.). (2013). Multiple representation in biological
education. Springer Science & Business Media.
Trochim, W. M., & Donnelly, J. P. (2001). Research methods knowledge base.
Tulving, E., & Madigan, S. A. (1970). Memory and verbal learning. Annual review of
psychology, 21(1), 437-484.
Vosniadou, S. (Ed.). (2009). International handbook of research on conceptual change.
Routledge.
Wilson, J. R., & Rutherford, A. (1989). Mental models: Theory and application in human
factors. Human Factors: The Journal of the Human Factors and Ergonomics
Society, 31(6), 617-634.
Wong, W. L., Shen, C., Nocera, L., Carriazo, E., Tang, F., Bugga, S., ... & Ritterfeld, U.
(2007, June). Serious video game effectiveness. In Proceedings of the
international conference on Advances in computer entertainment technology (pp.
49-55). ACM.
Yung, H. I., & Paas, F. (2015). Effects of computer-based visual representation on
mathematics learning and cognitive load. Journal of Educational Technology &
Society, 18(4), 70.

268
APPENDICES
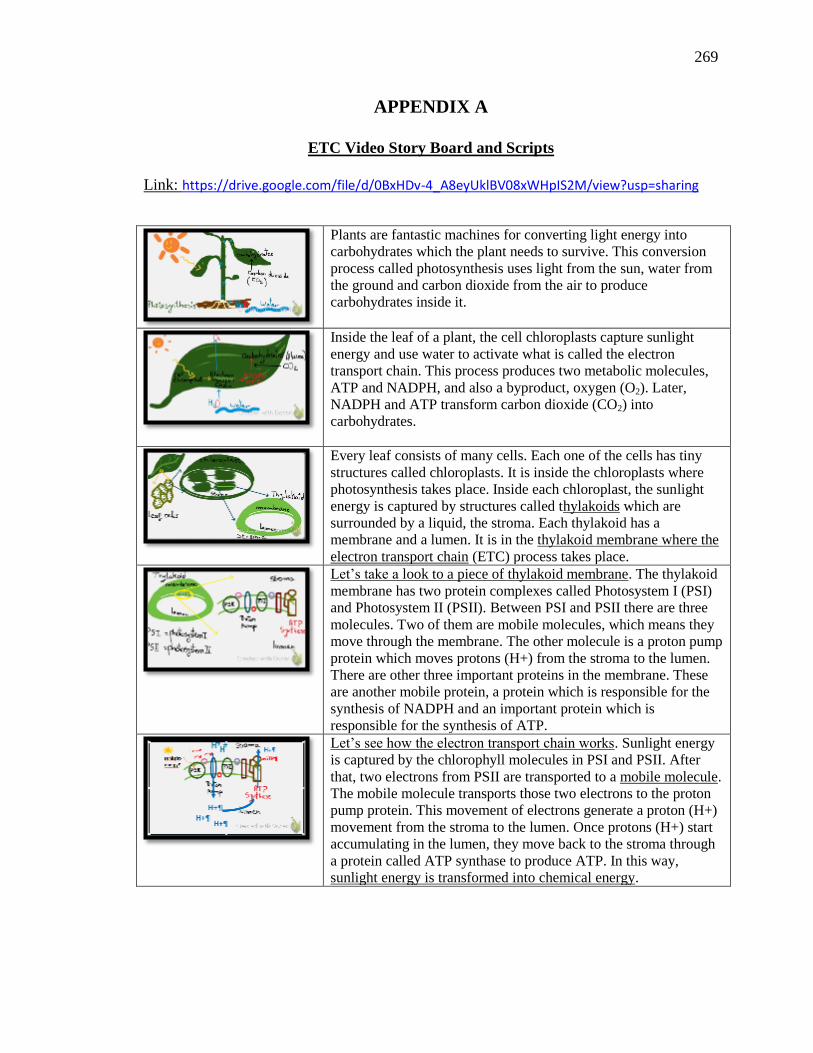
269
APPENDIX A
ETC Video Story Board and Scripts
Link: https://drive.google.com/file/d/0BxHDv-4_A8eyUklBV08xWHpIS2M/view?usp=sharing
Plants are fantastic machines for converting light energy into
carbohydrates which the plant needs to survive. This conversion
process called photosynthesis uses light from the sun, water from
the ground and carbon dioxide from the air to produce
carbohydrates inside it.
Inside the leaf of a plant, the cell chloroplasts capture sunlight
energy and use water to activate what is called the electron
transport chain. This process produces two metabolic molecules,
ATP and NADPH, and also a byproduct, oxygen (O2). Later,
NADPH and ATP transform carbon dioxide (CO2) into
carbohydrates.
Every leaf consists of many cells. Each one of the cells has tiny
structures called chloroplasts. It is inside the chloroplasts where
photosynthesis takes place. Inside each chloroplast, the sunlight
energy is captured by structures called thylakoids which are
surrounded by a liquid, the stroma. Each thylakoid has a
membrane and a lumen. It is in the thylakoid membrane where the
electron transport chain (ETC) process takes place.
Let’s take a look to a piece of thylakoid membrane. The thylakoid
membrane has two protein complexes called Photosystem I (PSI)
and Photosystem II (PSII). Between PSI and PSII there are three
molecules. Two of them are mobile molecules, which means they
move through the membrane. The other molecule is a proton pump
protein which moves protons (H+) from the stroma to the lumen.
There are other three important proteins in the membrane. These
are another mobile protein, a protein which is responsible for the
synthesis of NADPH and an important protein which is
responsible for the synthesis of ATP.
Let’s see how the electron transport chain works. Sunlight energy
is captured by the chlorophyll molecules in PSI and PSII. After
that, two electrons from PSII are transported to a mobile molecule.
The mobile molecule transports those two electrons to the proton
pump protein. This movement of electrons generate a proton (H+)
movement from the stroma to the lumen. Once protons (H+) start
accumulating in the lumen, they move back to the stroma through
a protein called ATP synthase to produce ATP. In this way,
sunlight energy is transformed into chemical energy.
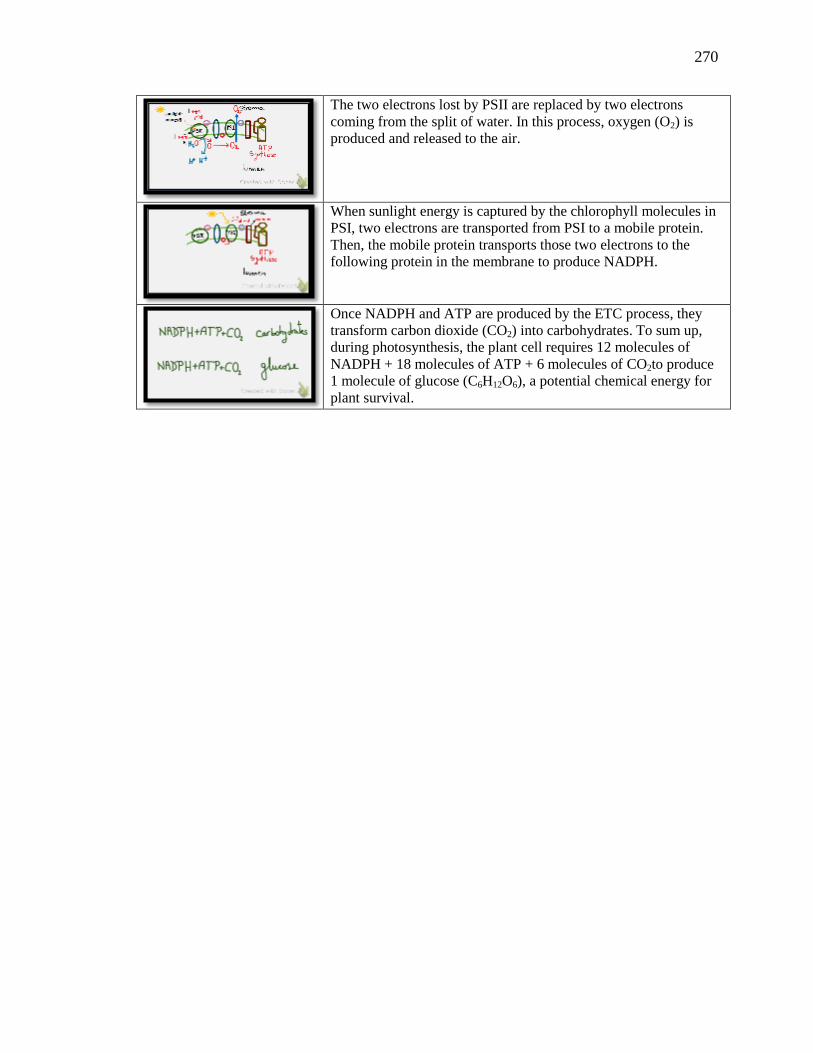
270
The two electrons lost by PSII are replaced by two electrons
coming from the split of water. In this process, oxygen (O2) is
produced and released to the air.
When sunlight energy is captured by the chlorophyll molecules in
PSI, two electrons are transported from PSI to a mobile protein.
Then, the mobile protein transports those two electrons to the
following protein in the membrane to produce NADPH.
Once NADPH and ATP are produced by the ETC process, they
transform carbon dioxide (CO2) into carbohydrates. To sum up,
during photosynthesis, the plant cell requires 12 molecules of
NADPH + 18 molecules of ATP + 6 molecules of CO2to produce
1 molecule of glucose (C6H12O6), a potential chemical energy for
plant survival.
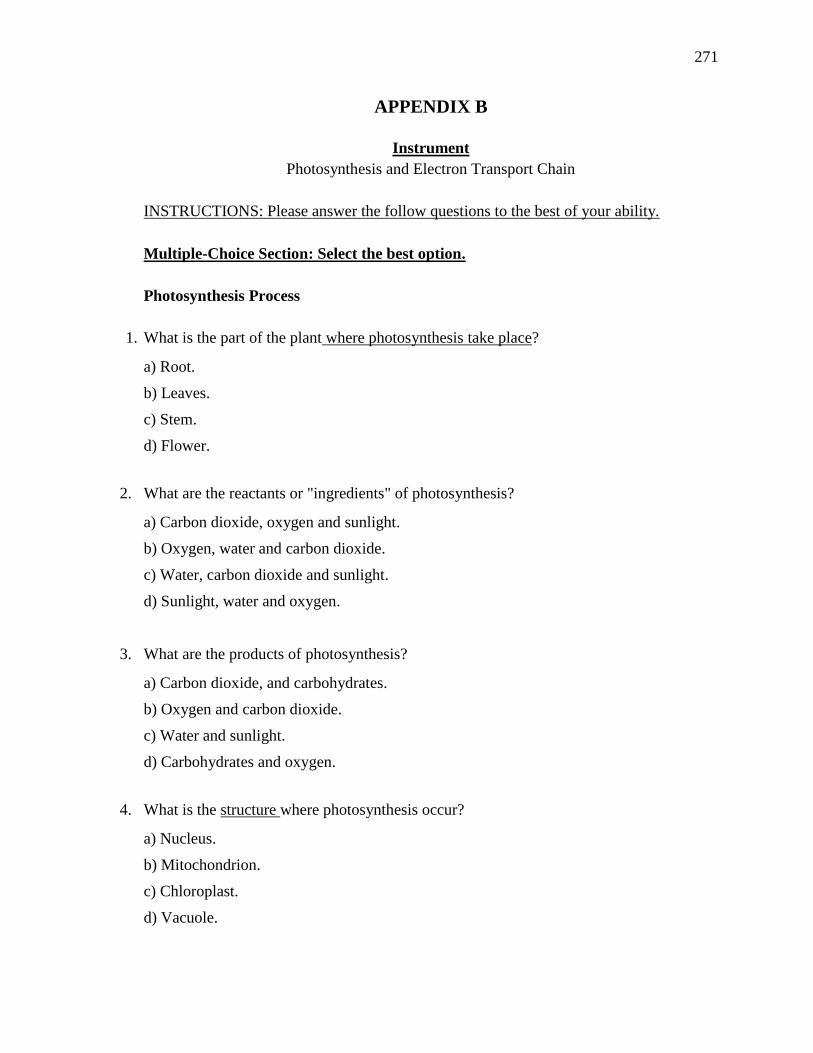
271
APPENDIX B
Instrument
Photosynthesis and Electron Transport Chain
INSTRUCTIONS: Please answer the follow questions to the best of your ability.
Multiple-Choice Section: Select the best option.
Photosynthesis Process
1. What is the part of the plant where photosynthesis take place?
a) Root.
b) Leaves.
c) Stem.
d) Flower.
2. What are the reactants or "ingredients" of photosynthesis?
a) Carbon dioxide, oxygen and sunlight.
b) Oxygen, water and carbon dioxide.
c) Water, carbon dioxide and sunlight.
d) Sunlight, water and oxygen.
3. What are the products of photosynthesis?
a) Carbon dioxide, and carbohydrates.
b) Oxygen and carbon dioxide.
c) Water and sunlight.
d) Carbohydrates and oxygen.
4. What is the structure where photosynthesis occur?
a) Nucleus.
b) Mitochondrion.
c) Chloroplast.
d) Vacuole.
272
5. What is the name of the membrane where the electron transport chain (ETC) occur?
a) Mitochondrion membrane.
b) Thylakoid membrane.
c) Cell membrane.
d) Chloroplast membrane.
6. Inside the chloroplast, where is glucose produced?
a) Matrix.
b) Cytosol.
c) Stroma.
d) Lumen.
Electron Transport Chain (ETC) in Photosynthesis
7. When does the ETC process start?
a) When protons (H+) move into the lumen.
b) When the sunlight energy is captured by chlorophyll.
c) When NADPH gets the electrons.
d) When ATP is produced.
8. How is ATP produced?
a) Oxygen gives electrons to produce ATP.
b) A movement of protons (H+) across the membrane which produces ATP.
c) The electrons from water (H2O) moves through the membrane producing ATP.
d) NADPH transfers electrons to the ATP synthase to produce ATP.
9. What is the best definition of ETC?
a) ETC transforms sunlight energy into chemical energy (ATP).
b) ETC consists of a flow of oxygen through a membrane.
c) ETC transforms carbon dioxide (CO2) into carbohydrates.
d) ETC consists of a movement of protons (H+) across a membrane.
273
10. How is oxygen (O2) produced?
a) ETC transforms carbon dioxide into oxygen.
b) Oxygen is produced as a consequence of water splitting.
c) ETC transforms light energy from the sun into oxygen.
d) Oxygen is produced as a consequence of ATP production.
11. How is NADPH produced?
a) Oxygen provides the electrons to produce NADPH.
b) Sunlight energy activates the flow of electrons to produce NADPH.
c) The movement of protons (H+) produces NADPH.
d) ATP provides the energy to produce NADPH.
12. What molecules transform carbon dioxide (CO2) into carbohydrates?
a) Water and NADPH.
b) Oxygen and ATP.
c) ATP and NADPH.
d) Water and ATP.
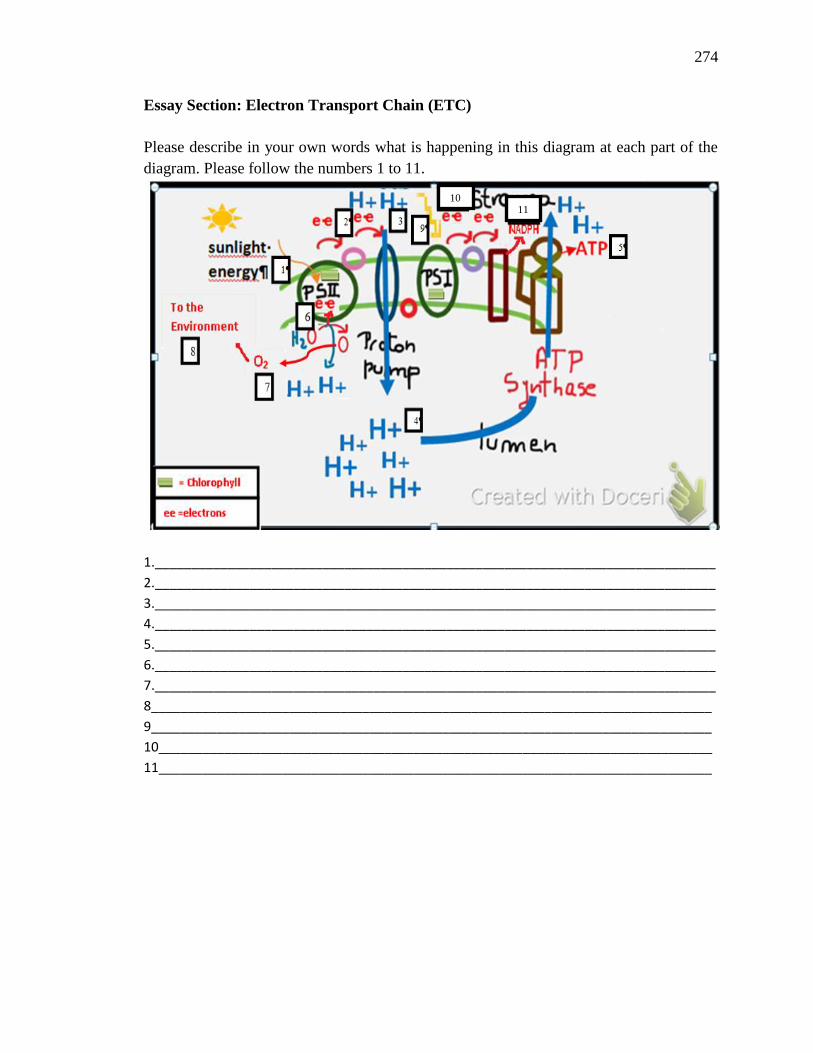
274
Essay Section: Electron Transport Chain (ETC)
Please describe in your own words what is happening in this diagram at each part of the
diagram. Please follow the numbers 1 to 11.
1._____________________________________________________________________________
2._____________________________________________________________________________
3._____________________________________________________________________________
4._____________________________________________________________________________
5._____________________________________________________________________________
6._____________________________________________________________________________
7._____________________________________________________________________________
8_____________________________________________________________________________
9_____________________________________________________________________________
10____________________________________________________________________________
11____________________________________________________________________________
10 11
275
Rubric for Data Analysis
Photosynthesis and Electron Transport Chain
Description and purpose: This instrument (knowledge test) consists of two main sections
based on the revised version of Bloom's Taxonomy (Anderson, Krathwohl, & Bloom,
2001). There are no penalties for misspelling words. The purpose of the instrument is to
determine students' ability to (1) recall vocabulary related to photosynthesis and ETC; (2)
identify the sequence of events happening in the ETC process; (3) explain a
representation of ETC.
Multiple-Choice Section: Select the best option.
Objective: to determine students' ability to recall and recognize vocabulary of the main
concepts of photosynthesis and the electron transport chain (ETC) process and to identify
how the process of ETC occurs in a way that makes sense to the representation they were
exposed during the ETC video and Electron Chute, the board game. All of them are
worth 1 point.
1. What is the part of the plant where photosynthesis take place?
a) Root.
b) Leaves. Learning outcome 1 (Table 1).
c) Stem.
d) Flower.
2. What are the reactants or "ingredients" of photosynthesis?
a) Carbon dioxide, oxygen and sunlight.
b) Oxygen, water and carbon dioxide.
c) Water, carbon dioxide and sunlight. Learning outcomes 1 and 2.
d) Sunlight, water and oxygen.
3. What are the products of photosynthesis?
a) Carbon dioxide and carbohydrates.
b) Oxygen and carbon dioxide.
c) Water and sunlight.
d) Carbohydrates and oxygen. Learning outcomes 1 and 3.
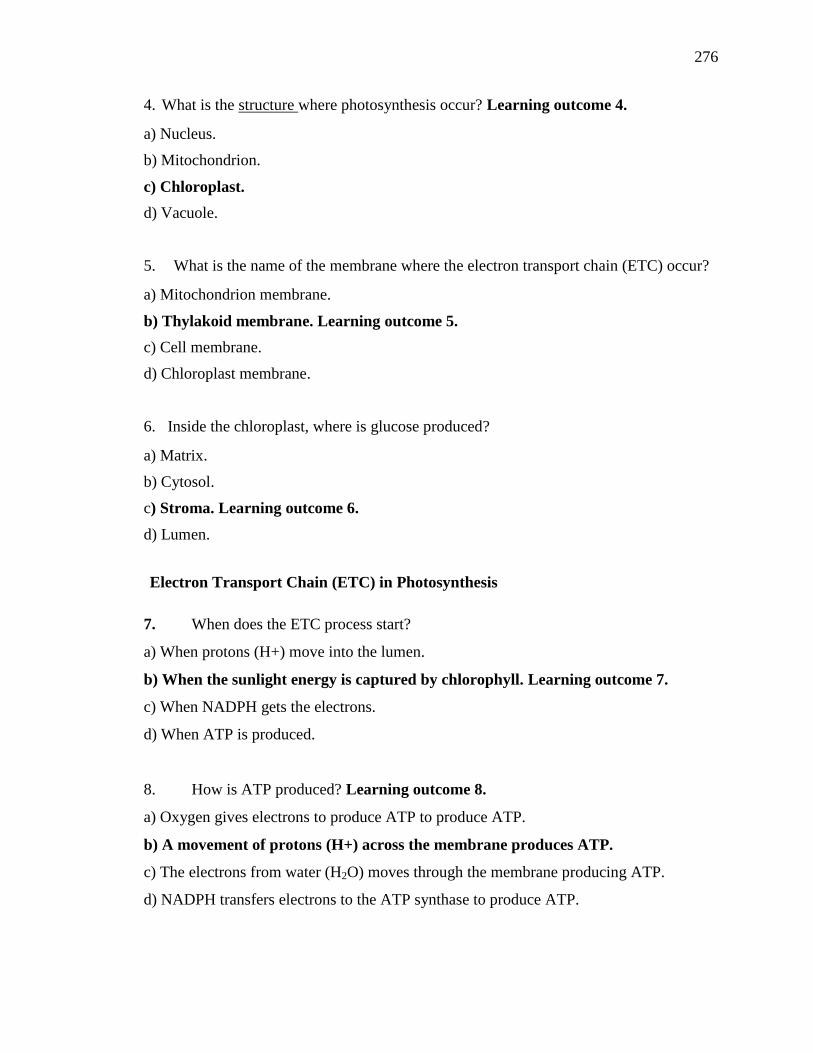
276
4. What is the structure where photosynthesis occur? Learning outcome 4.
a) Nucleus.
b) Mitochondrion.
c) Chloroplast.
d) Vacuole.
5. What is the name of the membrane where the electron transport chain (ETC) occur?
a) Mitochondrion membrane.
b) Thylakoid membrane. Learning outcome 5.
c) Cell membrane.
d) Chloroplast membrane.
6. Inside the chloroplast, where is glucose produced?
a) Matrix.
b) Cytosol.
c) Stroma. Learning outcome 6.
d) Lumen.
Electron Transport Chain (ETC) in Photosynthesis
7. When does the ETC process start?
a) When protons (H+) move into the lumen.
b) When the sunlight energy is captured by chlorophyll. Learning outcome 7.
c) When NADPH gets the electrons.
d) When ATP is produced.
8. How is ATP produced? Learning outcome 8.
a) Oxygen gives electrons to produce ATP to produce ATP.
b) A movement of protons (H+) across the membrane produces ATP.
c) The electrons from water (H2O) moves through the membrane producing ATP.
d) NADPH transfers electrons to the ATP synthase to produce ATP.
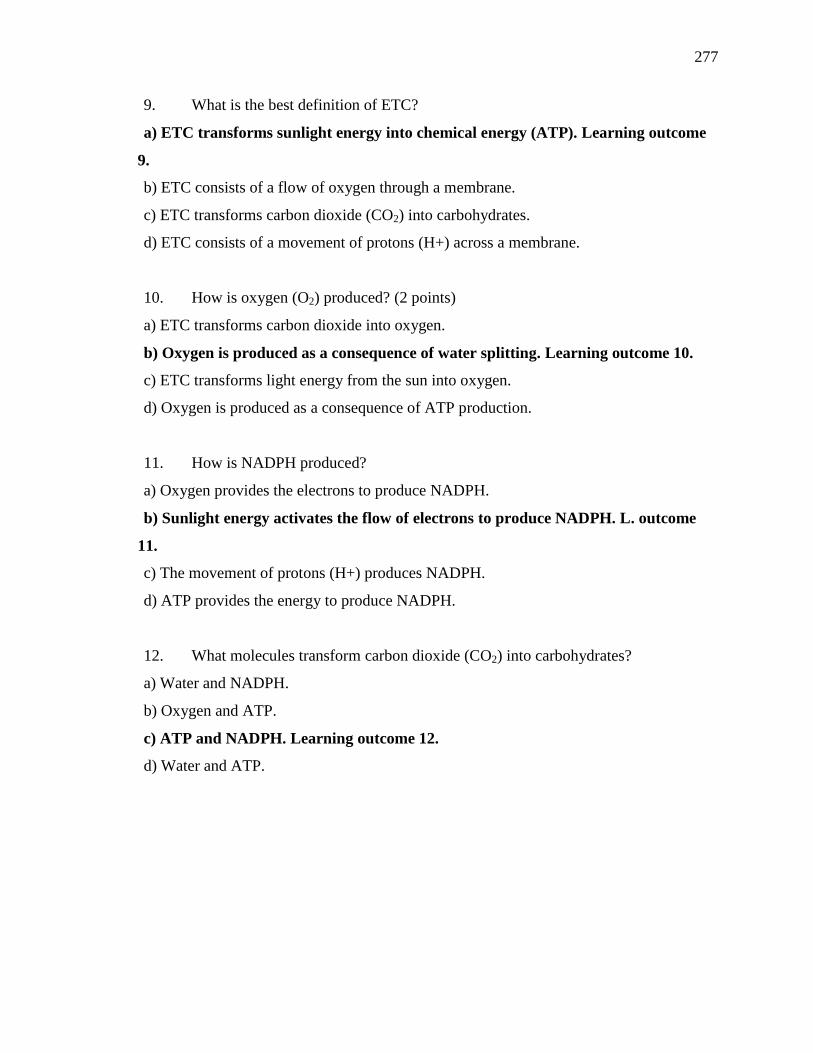
277
9. What is the best definition of ETC?
a) ETC transforms sunlight energy into chemical energy (ATP). Learning outcome
9.
b) ETC consists of a flow of oxygen through a membrane.
c) ETC transforms carbon dioxide (CO2) into carbohydrates.
d) ETC consists of a movement of protons (H+) across a membrane.
10. How is oxygen (O2) produced? (2 points)
a) ETC transforms carbon dioxide into oxygen.
b) Oxygen is produced as a consequence of water splitting. Learning outcome 10.
c) ETC transforms light energy from the sun into oxygen.
d) Oxygen is produced as a consequence of ATP production.
11. How is NADPH produced?
a) Oxygen provides the electrons to produce NADPH.
b) Sunlight energy activates the flow of electrons to produce NADPH. L. outcome
11.
c) The movement of protons (H+) produces NADPH.
d) ATP provides the energy to produce NADPH.
12. What molecules transform carbon dioxide (CO2) into carbohydrates?
a) Water and NADPH.
b) Oxygen and ATP.
c) ATP and NADPH. Learning outcome 12.
d) Water and ATP.
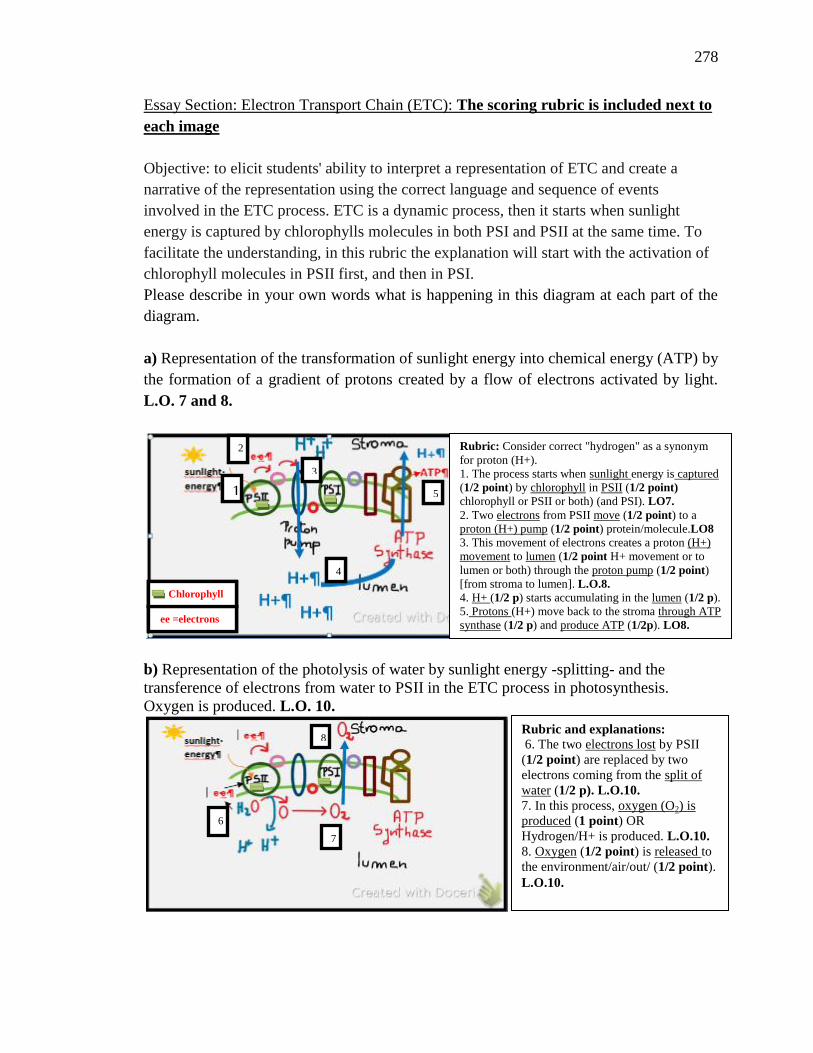
278
Essay Section: Electron Transport Chain (ETC): The scoring rubric is included next to
each image
Objective: to elicit students' ability to interpret a representation of ETC and create a
narrative of the representation using the correct language and sequence of events
involved in the ETC process. ETC is a dynamic process, then it starts when sunlight
energy is captured by chlorophylls molecules in both PSI and PSII at the same time. To
facilitate the understanding, in this rubric the explanation will start with the activation of
chlorophyll molecules in PSII first, and then in PSI.
Please describe in your own words what is happening in this diagram at each part of the
diagram.
a) Representation of the transformation of sunlight energy into chemical energy (ATP) by
the formation of a gradient of protons created by a flow of electrons activated by light.
L.O. 7 and 8.
b) Representation of the photolysis of water by sunlight energy -splitting- and the
transference of electrons from water to PSII in the ETC process in photosynthesis.
Oxygen is produced. L.O. 10.
ee =electrons
Chlorophyll
1
2
3
4
5
ee =electrons
Chlorophyll
Rubric: Consider correct "hydrogen" as a synonym
for proton (H+).
1. The process starts when sunlight energy is captured
(1/2 point) by chlorophyll in PSII (1/2 point)
chlorophyll or PSII or both) (and PSI). LO7.
2. Two electrons from PSII move (1/2 point) to a
proton (H+) pump (1/2 point) protein/molecule.LO8
3. This movement of electrons creates a proton (H+)
movement to lumen (1/2 point H+ movement or to
lumen or both) through the proton pump (1/2 point)
[from stroma to lumen]. L.O.8.
4. H+ (1/2 p) starts accumulating in the lumen (1/2 p).
5. Protons (H+) move back to the stroma through ATP
synthase (1/2 p) and produce ATP (1/2p). LO8.
________________________________
________________________________
________________________________
________________________________
________________________________
________________________________
________________________________
________________________________
___________
1
1
22
3
3
4
4
5
ee =electrons
Chlorophyll
Rubric and explanations:
6. The two electrons lost by PSII
(1/2 point) are replaced by two
electrons coming from the split of
water (1/2 p). L.O.10.
7. In this process, oxygen (O2) is
produced (1 point) OR
Hydrogen/H+ is produced. L.O.10.
8. Oxygen (1/2 point) is released to
the environment/air/out/ (1/2 point).
L.O.10.
6
7
8
7
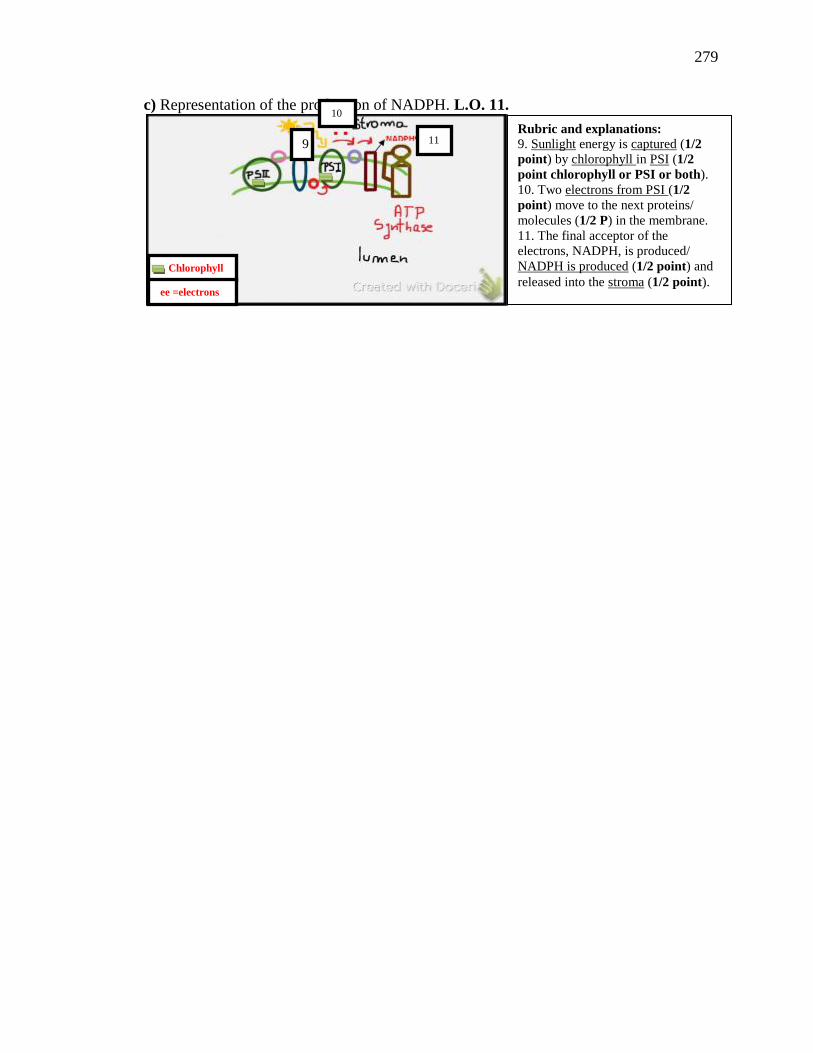
279
c) Representation of the production of NADPH. L.O. 11.
Chlorophyll
ee =electrons
Rubric and explanations:
9. Sunlight energy is captured (1/2
point) by chlorophyll in PSI (1/2
point chlorophyll or PSI or both).
10. Two electrons from PSI (1/2
point) move to the next proteins/
molecules (1/2 P) in the membrane.
11. The final acceptor of the
electrons, NADPH, is produced/
NADPH is produced (1/2 point) and
released into the stroma (1/2 point).
9
10
11
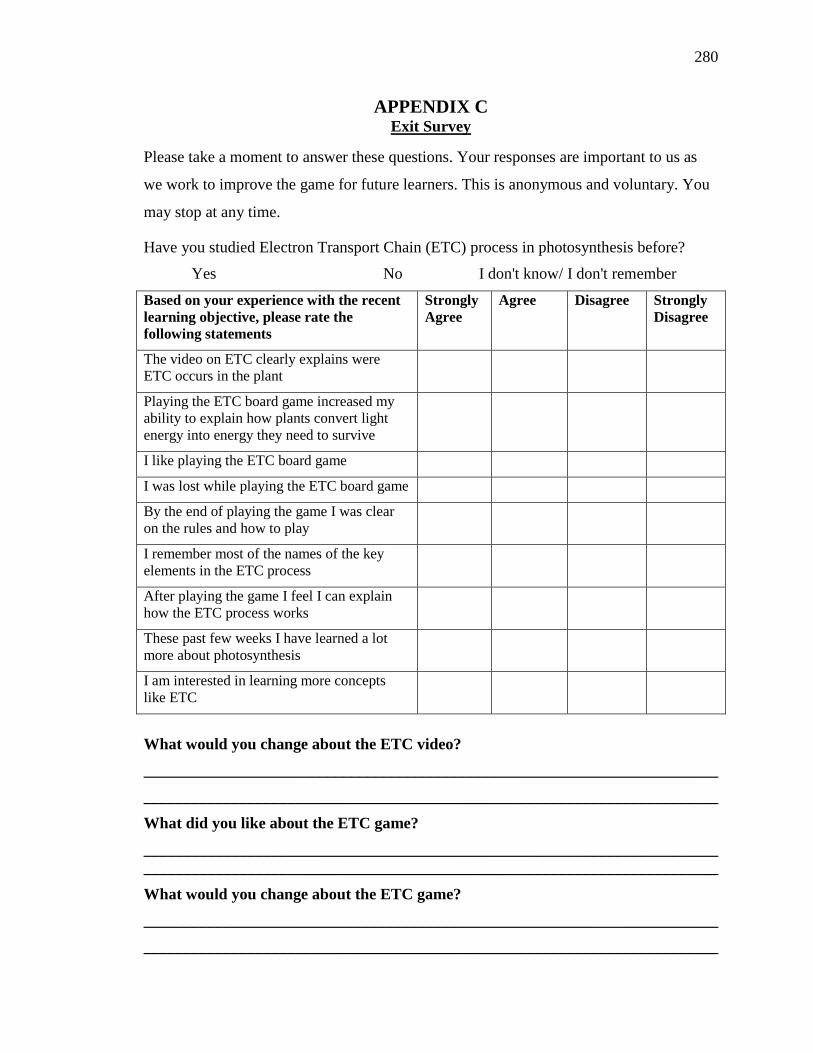
280
APPENDIX C Exit Survey
Please take a moment to answer these questions. Your responses are important to us as
we work to improve the game for future learners. This is anonymous and voluntary. You
may stop at any time.
Have you studied Electron Transport Chain (ETC) process in photosynthesis before?
Yes No I don't know/ I don't remember
Based on your experience with the recent
learning objective, please rate the
following statements
Strongly
Agree
Agree Disagree Strongly
Disagree
The video on ETC clearly explains were
ETC occurs in the plant
Playing the ETC board game increased my
ability to explain how plants convert light
energy into energy they need to survive
I like playing the ETC board game
I was lost while playing the ETC board game
By the end of playing the game I was clear
on the rules and how to play
I remember most of the names of the key
elements in the ETC process
After playing the game I feel I can explain
how the ETC process works
These past few weeks I have learned a lot
more about photosynthesis
I am interested in learning more concepts
like ETC
What would you change about the ETC video?
________________________________________________________________________
________________________________________________________________________
What did you like about the ETC game?
________________________________________________________________________
________________________________________________________________________
What would you change about the ETC game?
________________________________________________________________________
________________________________________________________________________

281
APPENDIX D
Lesson-Introduction to Photosynthesis
5E Strategy Model
(Engage, Explore, Explain, Extend & Evaluate)
Learning Objectives:
1. Students will be able to identify the basic vocabulary of the photosynthesis
process: reactants (light, carbon dioxide and water), plant part (leaves) and
molecule (chlorophyll) involve in photosynthesis, and products (carbohydrates
and oxygen).
2. Students will be able to determine through experimentation that light from the sun
gives energy to plants for their growth.
Part 1
Engage (5-7 minutes):
Why is important to learn about photosynthesis? To engage students in this topic,
make connections between a process that occurs in the plants and students'
previous experiences. For that, ask students questions that relate to their daily
lives, such as meal preferences. For example, who eat vegetables? Who eat meat?
The majority of them eat meat. From there ask them: What kind of food do cows
eat? Most of them have seen cows eating grass. Then, ask them what grass is?
Some of them are familiar with grass and can see grass as a plant. Thus, reinforce
the idea that the process of photosynthesis is not only vital for the plants survival
282
but also to continue the existence of human and animals in their different forms as
we know it exists today.
Give students the instructions they need to follow for the class activities (1)
watching a video and fill a handout; (2) class discussion; (3) experimental
activity. If possible, explain the experimental procedure and encourage them to
think what the goal of the experimental activity is. In doing so, scientific inquiry
is promoted.
Explore (7-8 minutes):
Watching a video (see link below, 5 minutes) and fill a handout (see page 3) to
familiarize students with the basic vocabulary of photosynthesis:
https://www.youtube.com/watch?v=ttFoPiRBwrY
Pair discussion (2 minutes) about their answers in the handout.
Explain (10-15 minutes):
1. Class discussion following the handout: Start asking for a volunteer to draw on
the blackboard one part of the plant. Continue doing the same until the plant is
complete.
2. To foster class discussion, give students cards with the vocabulary of
photosynthesis: reactants (light, carbon dioxide and water), plant part (leaves) and
molecule (chlorophyll) involve in photosynthesis, and products (carbohydrates
and oxygen).
283
3. Ask them to raise a card up if they have the answer for the question in the
handout. Encourage them to connect that answer with the drawing of the plant
they have on the blackboard. If it is possible, students can go to the board and
circle the part of the plant related to their answers (e.g. leaves) or add more
information to the plant drawing (e.g. diffusion of carbon dioxide into the plant).
Expand (10-15 minutes):
Experimental activity (see instruction on next page): Planting. The goal of this
activity is that students are able to determine through experimentation that light
from the sun is which promotes plant growth.
The task consists of measuring plant growth (height) under light and dark
conditions over a 10 week period (See Plant Growth Observation).
Part 2
Evaluation (next class)
Give students the same handout but randomize the questions.
Class discussion and feedback.
Complete the Plant Growth Observation sheet.
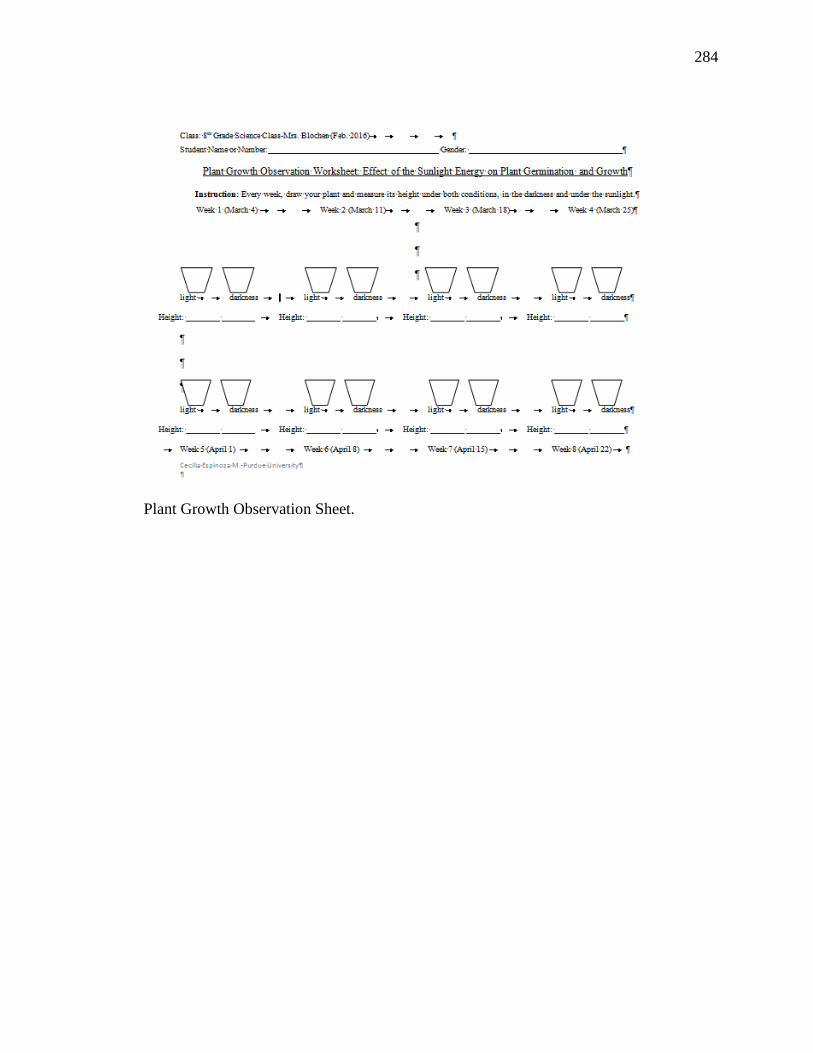
284
Plant Growth Observation Sheet.
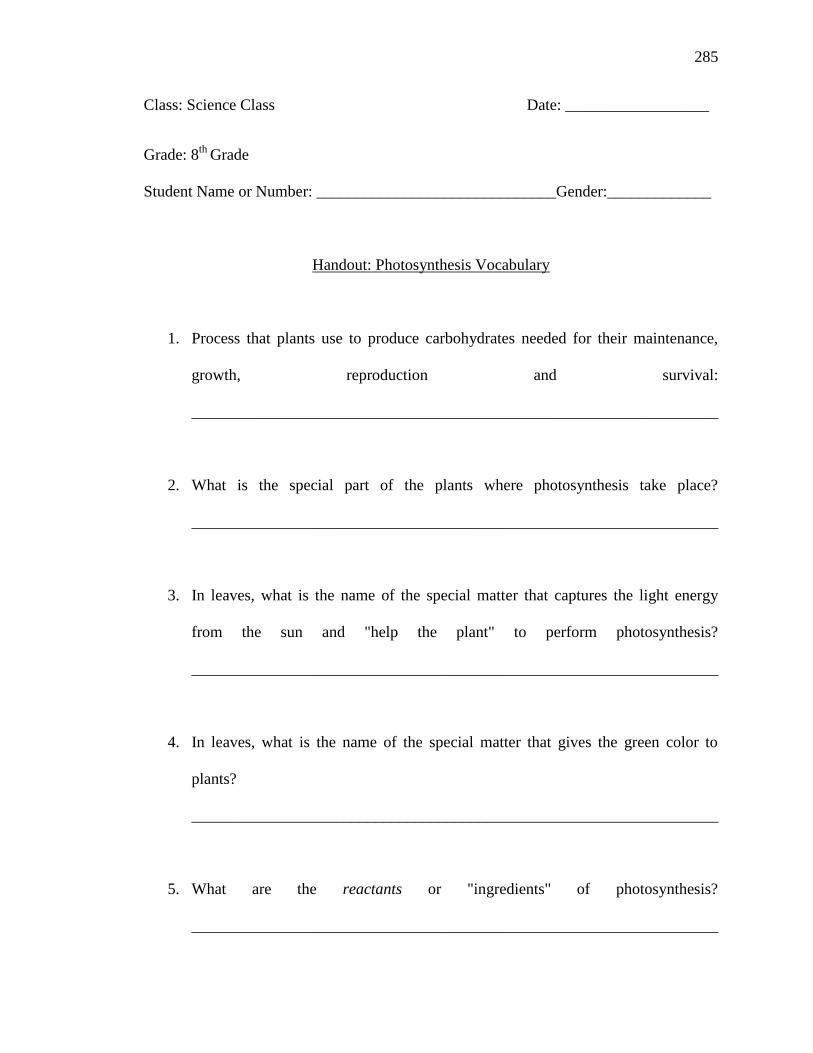
285
Class: Science Class Date: __________________
Grade: 8th
Grade
Student Name or Number: ______________________________Gender:_____________
Handout: Photosynthesis Vocabulary
1. Process that plants use to produce carbohydrates needed for their maintenance,
growth, reproduction and survival:
__________________________________________________________________
2. What is the special part of the plants where photosynthesis take place?
__________________________________________________________________
3. In leaves, what is the name of the special matter that captures the light energy
from the sun and "help the plant" to perform photosynthesis?
__________________________________________________________________
4. In leaves, what is the name of the special matter that gives the green color to
plants?
__________________________________________________________________
5. What are the reactants or "ingredients" of photosynthesis?
__________________________________________________________________
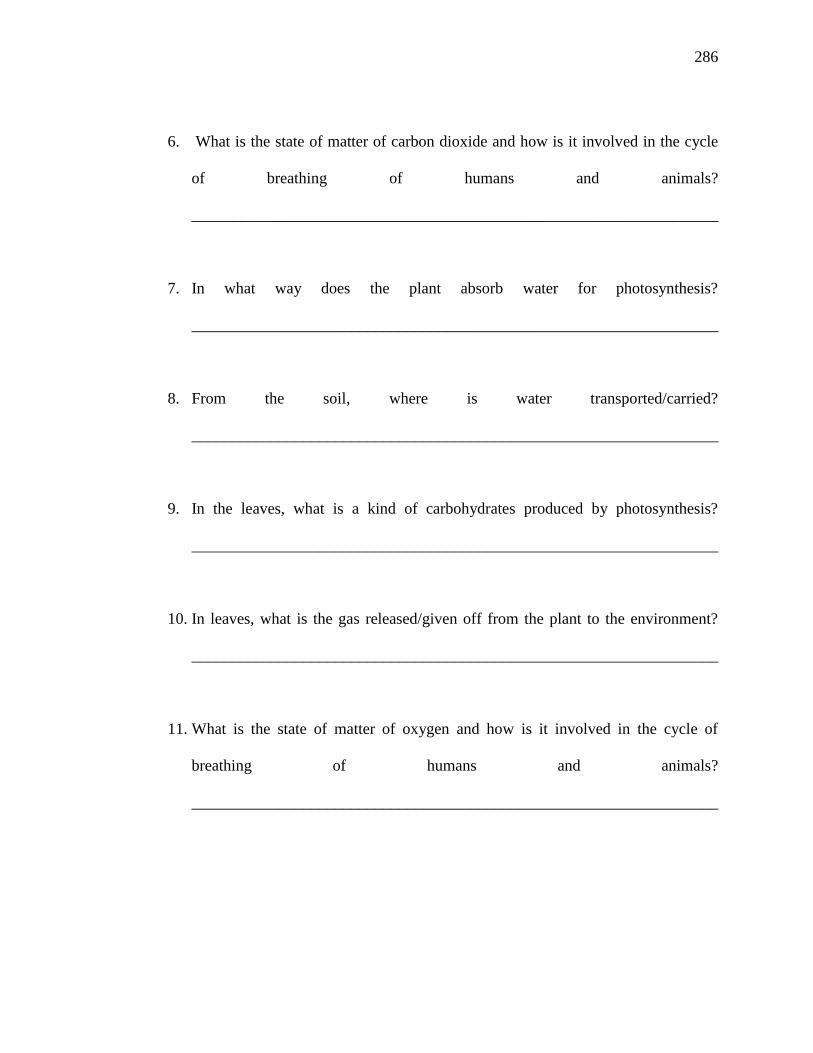
286
6. What is the state of matter of carbon dioxide and how is it involved in the cycle
of breathing of humans and animals?
__________________________________________________________________
7. In what way does the plant absorb water for photosynthesis?
__________________________________________________________________
8. From the soil, where is water transported/carried?
__________________________________________________________________
9. In the leaves, what is a kind of carbohydrates produced by photosynthesis?
__________________________________________________________________
10. In leaves, what is the gas released/given off from the plant to the environment?
__________________________________________________________________
11. What is the state of matter of oxygen and how is it involved in the cycle of
breathing of humans and animals?
__________________________________________________________________
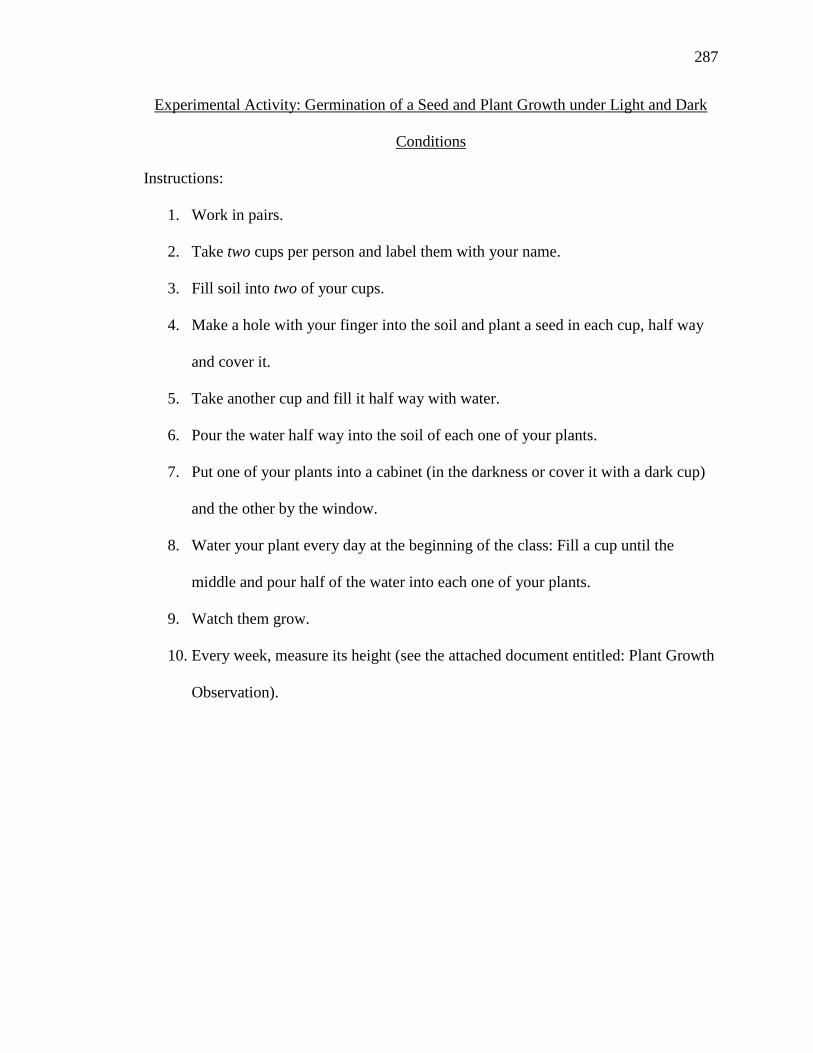
287
Experimental Activity: Germination of a Seed and Plant Growth under Light and Dark
Conditions
Instructions:
1. Work in pairs.
2. Take two cups per person and label them with your name.
3. Fill soil into two of your cups.
4. Make a hole with your finger into the soil and plant a seed in each cup, half way
and cover it.
5. Take another cup and fill it half way with water.
6. Pour the water half way into the soil of each one of your plants.
7. Put one of your plants into a cabinet (in the darkness or cover it with a dark cup)
and the other by the window.
8. Water your plant every day at the beginning of the class: Fill a cup until the
middle and pour half of the water into each one of your plants.
9. Watch them grow.
10. Every week, measure its height (see the attached document entitled: Plant Growth
Observation).
288
APPENDIX E
Lesson- Determination of Starch in the Leaves
5E Strategy Model
(Engage, Explore, Explain, Extend & Evaluate)
Learning Objective:
1. Learning objective: Students will be able to determine through experimentation
that plants produce carbohydrates (e.g. starch) as a consequence of
photosynthesis.
Engage (5 minutes):
Review previous lesson, calling out: What is the process we have been studying
recently? (Photosynthesis); what are the reactants or "ingredients" of
photosynthesis? (Water, carbon dioxide and sunlight energy); what are the
products? (Oxygen and carbohydrates, e.g. glucose).
Introduce another type of carbohydrate: starch. What kind of food have starch?
(Potatoes, corn, cookies, leaves).
Present the learning objective using a simplified vocabulary: Today we are going
to determine the presence of starch in a spinach leaf.
Explore (5 minutes):
Power point presentation: Show pictures with the steps students need to follow for
the experimental activity (see pictures below). Ask questions to check
understanding of the steps.
289
Explain (5 minutes):
Demonstrate the experimental procedure and encourage students to think what the
hypothesis of the experimental activity is. In doing so, scientific inquiry is
promoted.
Team discussion in their lab tables (2 minutes): Identify the hypothesis of the
experimental activity. Visit their lab tables to check and discuss with the students
their hypothesis.
Expand (20 minutes):
Experimental activity (see instructions below). The goal of this activity is that
students are able to see the presence of the starch in the leaves using a colorant of
starch (iodine).
The task consists of boiling a leaf in hot water to destroy its structure. This allows
the colorant (iodine) interact with the starch (blue spots). To make the blue spots
visible, the chlorophyll pigments are removed by boiling the leaf in denatured
alcohol. After the leaf is colorless, it is soaked in a iodine solution.
Evaluation (5 minutes):
Handout students filled during the lab experience (below).
Class discussion and feedback about the laboratory activity.
290
Materials
1. Leaves which have been exposed to the sun (photosynthesis has occurred).
2. A hot plate (or a microwave) to heat the beaker with water.
3. A beaker (250-500 ml) to boil a leaf in water.
4. An assay tube (20 ml) with denatured alcohol (5 ml) to boil a leaf in alcohol.
5. Goggles.
6. Gloves to manipulate the assay tube.
7. Forceps to remove the leaf from the boiling water.
8. Iodine solution to dye the leaf and see the starch.
9. Two small cups.
Instructions (steps)
1. Wear goggles and fill a beaker with 150 ml of water.
2. Put the leaf into the beaker with boiling water.
3. Boil the leaf for 1-2 minutes until it looks soft. Do not destroy the leaf.
4. Remove the leaf from the beaker with forceps or tweezers.
5. Put the leaf into an assay tube.
6. Ask for alcohol from the teacher or instructor.
7. Pour the alcohol into the assay tube. Do not put the lid on.
8. Put the tube into the beaker with boiling water. When the solution turns dark
green, use the gloves to remove the tube from the beaker.
9. Take the leaf and put it into a cup. Add iodine solution.
10. Observe the color change in the leaf.

291
Class: Science Class Date: __________________
Grade: 8th
Grade
Student Name: ______________________________________Gender:______________
Handout: Determination of starch in the leaves.
The objective of this activity is that you determine through experimentation that
plants produce carbohydrates as a consequence of photosynthesis. In this case, the
carbohydrate to be tested is starch. To do that, we are using the iodine test for the
presence of starch in a spinach leaf. If starch is present in the leaf, you will see a deep
blue color after adding iodine to the spinach leaf.
1) What would be a hypothesis for this experiment?
________________________________________________________________________
________________________________________________________________________
________________________________________________________________________
2) Why does the alcohol solution change to green when the leaf is put into the assay
tube?
________________________________________________________________________
________________________________________________________________________
________________________________________________________________________
3) What happens when the iodine solution is added to the leaf?
________________________________________________________________________
________________________________________________________________________
292
4) Is the hypothesis accepted or rejected? Explain why.
________________________________________________________________________
________________________________________________________________________
________________________________________________________________________
Instructions
1. Wear your goggles.
2. Put the leaf into the beaker with boiling water.
3. Boil the leaf for 1-2 minutes until it looks soft. Do not destroy the leaf.
4. Remove the leaf from the beaker with a forceps.
5. Put the leaf into an assay tube.
6. Ask for alcohol from the teacher or instructor.
7. Pour the alcohol into the assay tube. Do not put the lid on.
8. Put the tube into the beaker with boiling water.
9. When the solution turns dark green, use the gloves to remove the tube from the
beaker.
10. Pour the contents from the tube into a cup.
11. Take the leaf and put it into the cup with iodine solution.
12. Observe the color change in the leaf.
293
APPENDIX F
IRB Form
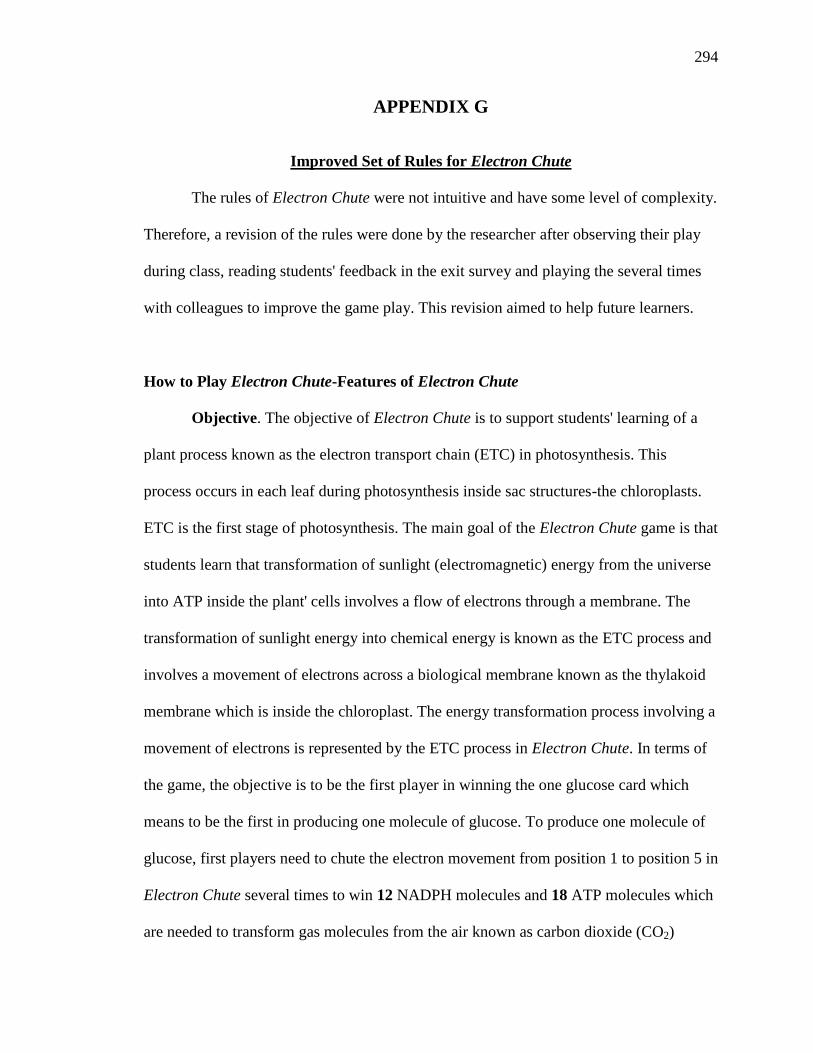
294
APPENDIX G
Improved Set of Rules for Electron Chute
The rules of Electron Chute were not intuitive and have some level of complexity.
Therefore, a revision of the rules were done by the researcher after observing their play
during class, reading students' feedback in the exit survey and playing the several times
with colleagues to improve the game play. This revision aimed to help future learners.
How to Play Electron Chute-Features of Electron Chute
Objective. The objective of Electron Chute is to support students' learning of a
plant process known as the electron transport chain (ETC) in photosynthesis. This
process occurs in each leaf during photosynthesis inside sac structures-the chloroplasts.
ETC is the first stage of photosynthesis. The main goal of the Electron Chute game is that
students learn that transformation of sunlight (electromagnetic) energy from the universe
into ATP inside the plant' cells involves a flow of electrons through a membrane. The
transformation of sunlight energy into chemical energy is known as the ETC process and
involves a movement of electrons across a biological membrane known as the thylakoid
membrane which is inside the chloroplast. The energy transformation process involving a
movement of electrons is represented by the ETC process in Electron Chute. In terms of
the game, the objective is to be the first player in winning the one glucose card which
means to be the first in producing one molecule of glucose. To produce one molecule of
glucose, first players need to chute the electron movement from position 1 to position 5 in
Electron Chute several times to win 12 NADPH molecules and 18 ATP molecules which
are needed to transform gas molecules from the air known as carbon dioxide (CO2)
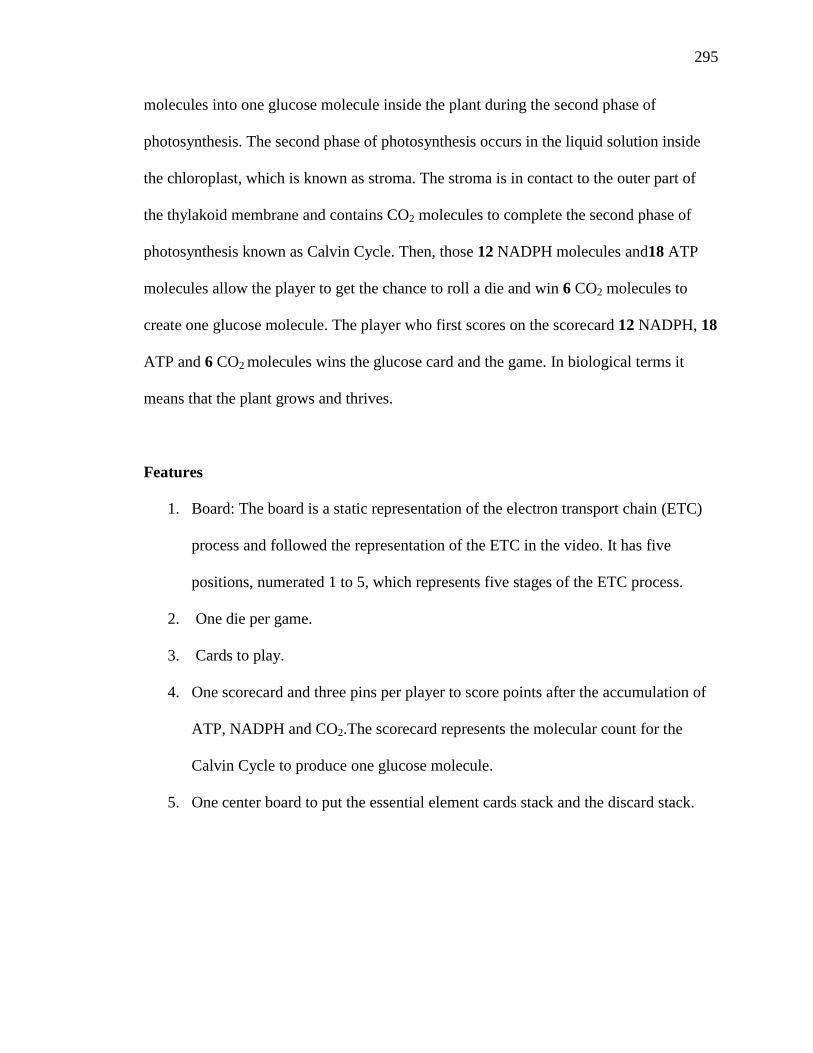
295
molecules into one glucose molecule inside the plant during the second phase of
photosynthesis. The second phase of photosynthesis occurs in the liquid solution inside
the chloroplast, which is known as stroma. The stroma is in contact to the outer part of
the thylakoid membrane and contains CO2 molecules to complete the second phase of
photosynthesis known as Calvin Cycle. Then, those 12 NADPH molecules and18 ATP
molecules allow the player to get the chance to roll a die and win 6 CO2 molecules to
create one glucose molecule. The player who first scores on the scorecard 12 NADPH, 18
ATP and 6 CO2 molecules wins the glucose card and the game. In biological terms it
means that the plant grows and thrives.
Features
1. Board: The board is a static representation of the electron transport chain (ETC)
process and followed the representation of the ETC in the video. It has five
positions, numerated 1 to 5, which represents five stages of the ETC process.
2. One die per game.
3. Cards to play.
4. One scorecard and three pins per player to score points after the accumulation of
ATP, NADPH and CO2.The scorecard represents the molecular count for the
Calvin Cycle to produce one glucose molecule.
5. One center board to put the essential element cards stack and the discard stack.
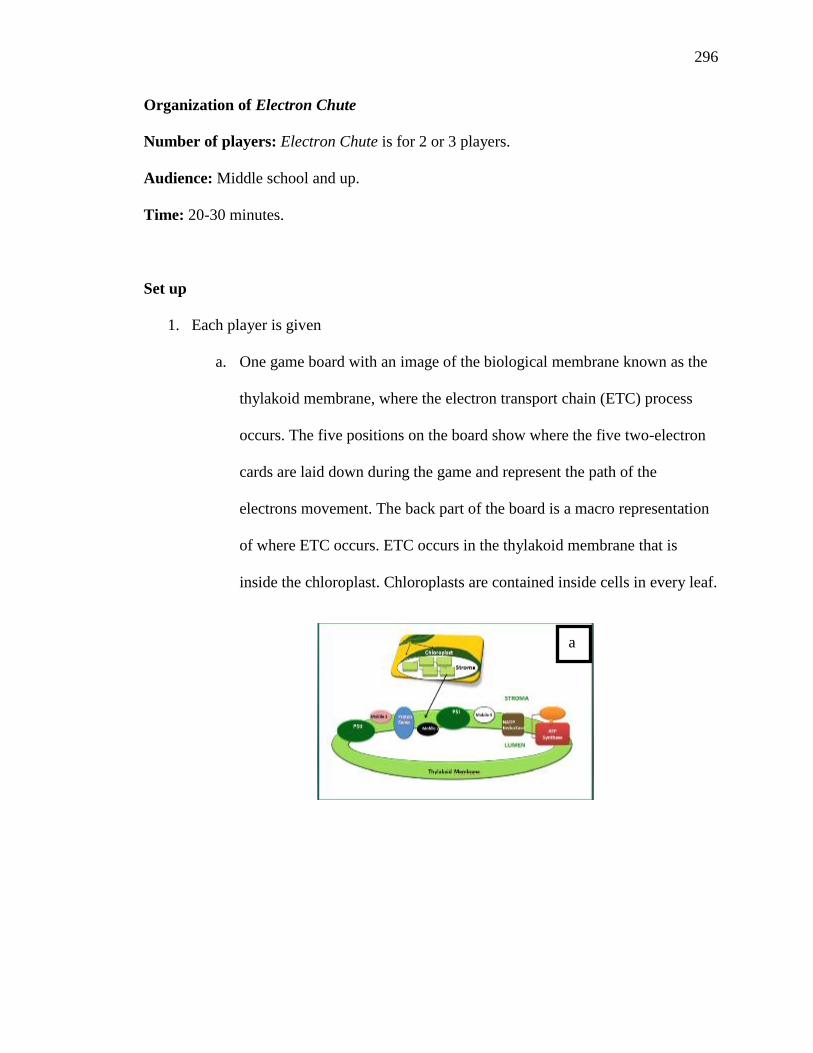
296
Organization of Electron Chute
Number of players: Electron Chute is for 2 or 3 players.
Audience: Middle school and up.
Time: 20-30 minutes.
Set up
1. Each player is given
a. One game board with an image of the biological membrane known as the
thylakoid membrane, where the electron transport chain (ETC) process
occurs. The five positions on the board show where the five two-electron
cards are laid down during the game and represent the path of the
electrons movement. The back part of the board is a macro representation
of where ETC occurs. ETC occurs in the thylakoid membrane that is
inside the chloroplast. Chloroplasts are contained inside cells in every leaf.
a
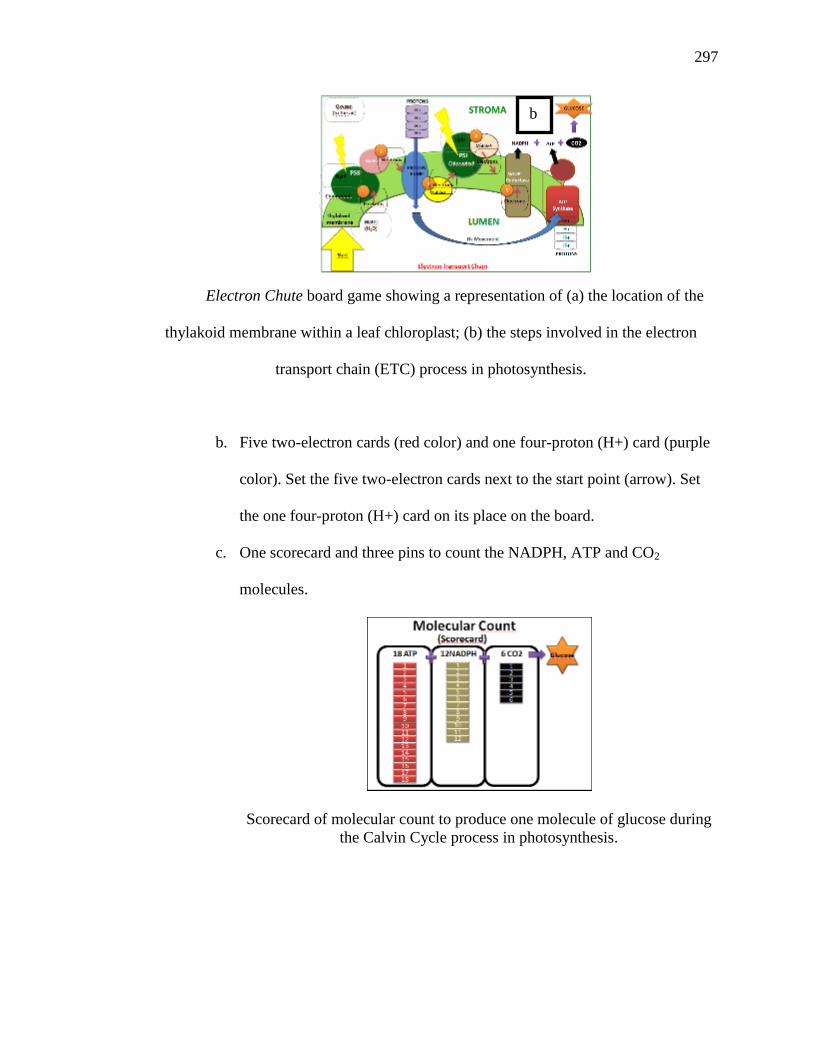
297
Electron Chute board game showing a representation of (a) the location of the
thylakoid membrane within a leaf chloroplast; (b) the steps involved in the electron
transport chain (ETC) process in photosynthesis.
b. Five two-electron cards (red color) and one four-proton (H+) card (purple
color). Set the five two-electron cards next to the start point (arrow). Set
the one four-proton (H+) card on its place on the board.
c. One scorecard and three pins to count the NADPH, ATP and CO2
molecules.
Scorecard of molecular count to produce one molecule of glucose during
the Calvin Cycle process in photosynthesis.
b
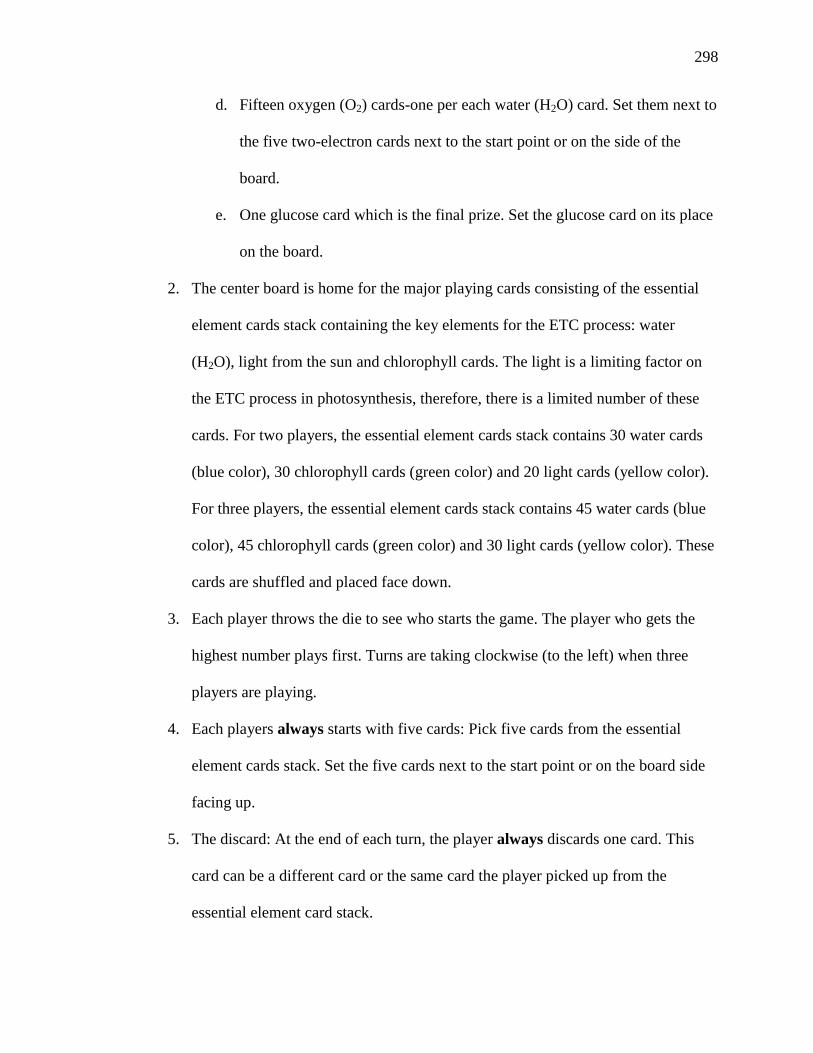
298
d. Fifteen oxygen (O2) cards-one per each water (H2O) card. Set them next to
the five two-electron cards next to the start point or on the side of the
board.
e. One glucose card which is the final prize. Set the glucose card on its place
on the board.
2. The center board is home for the major playing cards consisting of the essential
element cards stack containing the key elements for the ETC process: water
(H2O), light from the sun and chlorophyll cards. The light is a limiting factor on
the ETC process in photosynthesis, therefore, there is a limited number of these
cards. For two players, the essential element cards stack contains 30 water cards
(blue color), 30 chlorophyll cards (green color) and 20 light cards (yellow color).
For three players, the essential element cards stack contains 45 water cards (blue
color), 45 chlorophyll cards (green color) and 30 light cards (yellow color). These
cards are shuffled and placed face down.
3. Each player throws the die to see who starts the game. The player who gets the
highest number plays first. Turns are taking clockwise (to the left) when three
players are playing.
4. Each players always starts with five cards: Pick five cards from the essential
element cards stack. Set the five cards next to the start point or on the board side
facing up.
5. The discard: At the end of each turn, the player always discards one card. This
card can be a different card or the same card the player picked up from the
essential element card stack.

299
6. If the essential elements card stack runs out, the discard stack turns over.
Shuffling is optional.
Turn Taking
Each turn consists of the following parts:
1. The draw: Each player draws cards only from the essential elements card stack to
replenish their hand to five cards. Players always need to start their turn with five
cards.
2. The lay down: In the first turn, players can only lay down cards at position 1.
After that, players can lay down the cards at positions 1 or 4 or both. At position 1
which is PSII (Photosystem II protein complex) , players lay down light (yellow),
water (blue) and chlorophyll (green) cards. If the players do not have the three of
them, they lay down the ones they have. At position 4 which is PSI (Photosystem
I protein complex), players lay down light (yellow) and chlorophyll (green) cards.
The game starts in position 1.
3. Electron movement in the ETC process: The first step is to move the two-electron
cards than can be moved from one position to the following position. The two-
electron card moves one step in order from position 1 to 2, from position 2 to 3,
from position 3 to 4 and from position 4 to 5. The movement of the five two-
electron cards from position 1 to position 3 produces one ATP. Throwing the die
multiplies the number of ATP molecules to score on the scorecard. If the die
marks 2 points, the player put the pin on number 2 in the ATP column in the
scorecard. The movement of the five two-electron cards from position 4 to
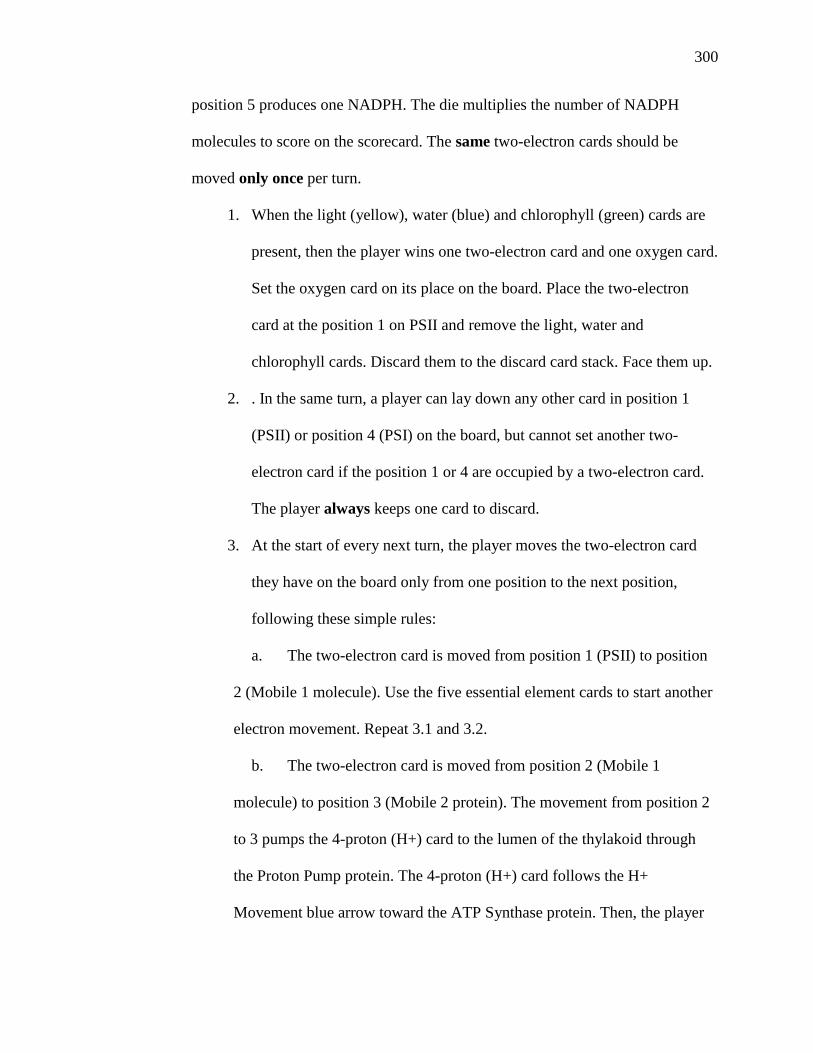
300
position 5 produces one NADPH. The die multiplies the number of NADPH
molecules to score on the scorecard. The same two-electron cards should be
moved only once per turn.
1. When the light (yellow), water (blue) and chlorophyll (green) cards are
present, then the player wins one two-electron card and one oxygen card.
Set the oxygen card on its place on the board. Place the two-electron
card at the position 1 on PSII and remove the light, water and
chlorophyll cards. Discard them to the discard card stack. Face them up.
2. . In the same turn, a player can lay down any other card in position 1
(PSII) or position 4 (PSI) on the board, but cannot set another two-
electron card if the position 1 or 4 are occupied by a two-electron card.
The player always keeps one card to discard.
3. At the start of every next turn, the player moves the two-electron card
they have on the board only from one position to the next position,
following these simple rules:
a. The two-electron card is moved from position 1 (PSII) to position
2 (Mobile 1 molecule). Use the five essential element cards to start another
electron movement. Repeat 3.1 and 3.2.
b. The two-electron card is moved from position 2 (Mobile 1
molecule) to position 3 (Mobile 2 protein). The movement from position 2
to 3 pumps the 4-proton (H+) card to the lumen of the thylakoid through
the Proton Pump protein. The 4-proton (H+) card follows the H+
Movement blue arrow toward the ATP Synthase protein. Then, the player
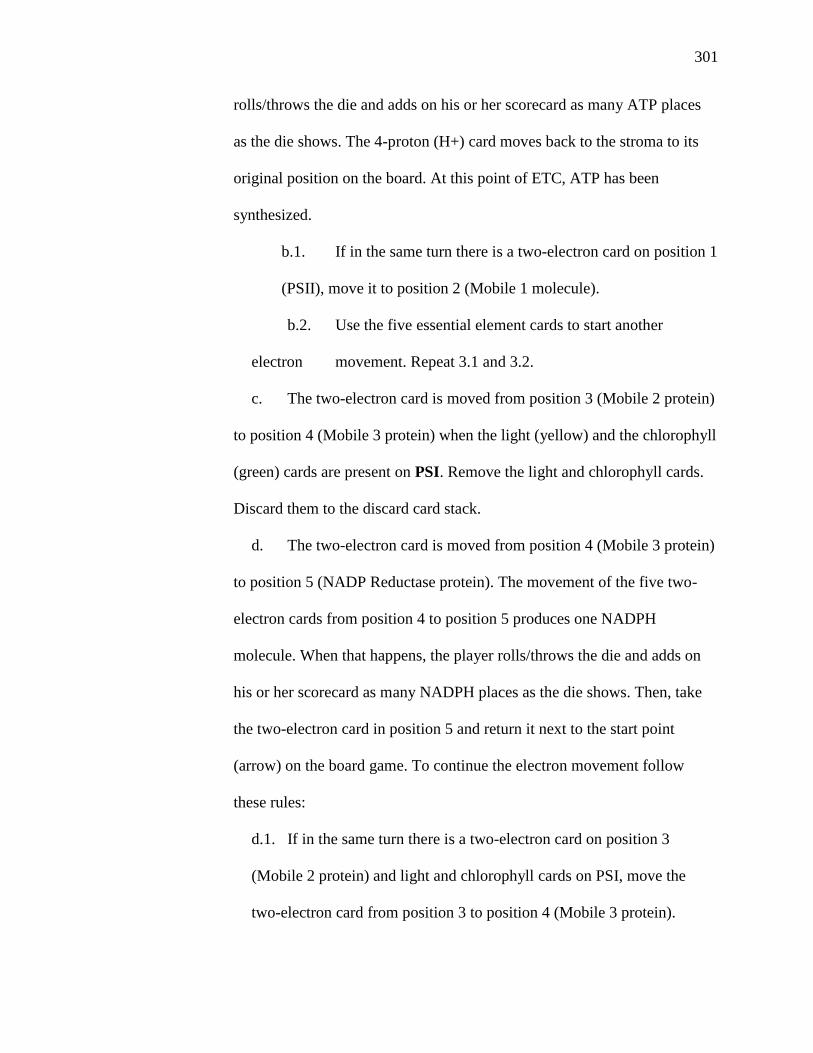
301
rolls/throws the die and adds on his or her scorecard as many ATP places
as the die shows. The 4-proton (H+) card moves back to the stroma to its
original position on the board. At this point of ETC, ATP has been
synthesized.
b.1. If in the same turn there is a two-electron card on position 1
(PSII), move it to position 2 (Mobile 1 molecule).
b.2. Use the five essential element cards to start another
electron movement. Repeat 3.1 and 3.2.
c. The two-electron card is moved from position 3 (Mobile 2 protein)
to position 4 (Mobile 3 protein) when the light (yellow) and the chlorophyll
(green) cards are present on PSI. Remove the light and chlorophyll cards.
Discard them to the discard card stack.
d. The two-electron card is moved from position 4 (Mobile 3 protein)
to position 5 (NADP Reductase protein). The movement of the five two-
electron cards from position 4 to position 5 produces one NADPH
molecule. When that happens, the player rolls/throws the die and adds on
his or her scorecard as many NADPH places as the die shows. Then, take
the two-electron card in position 5 and return it next to the start point
(arrow) on the board game. To continue the electron movement follow
these rules:
d.1. If in the same turn there is a two-electron card on position 3
(Mobile 2 protein) and light and chlorophyll cards on PSI, move the
two-electron card from position 3 to position 4 (Mobile 3 protein).
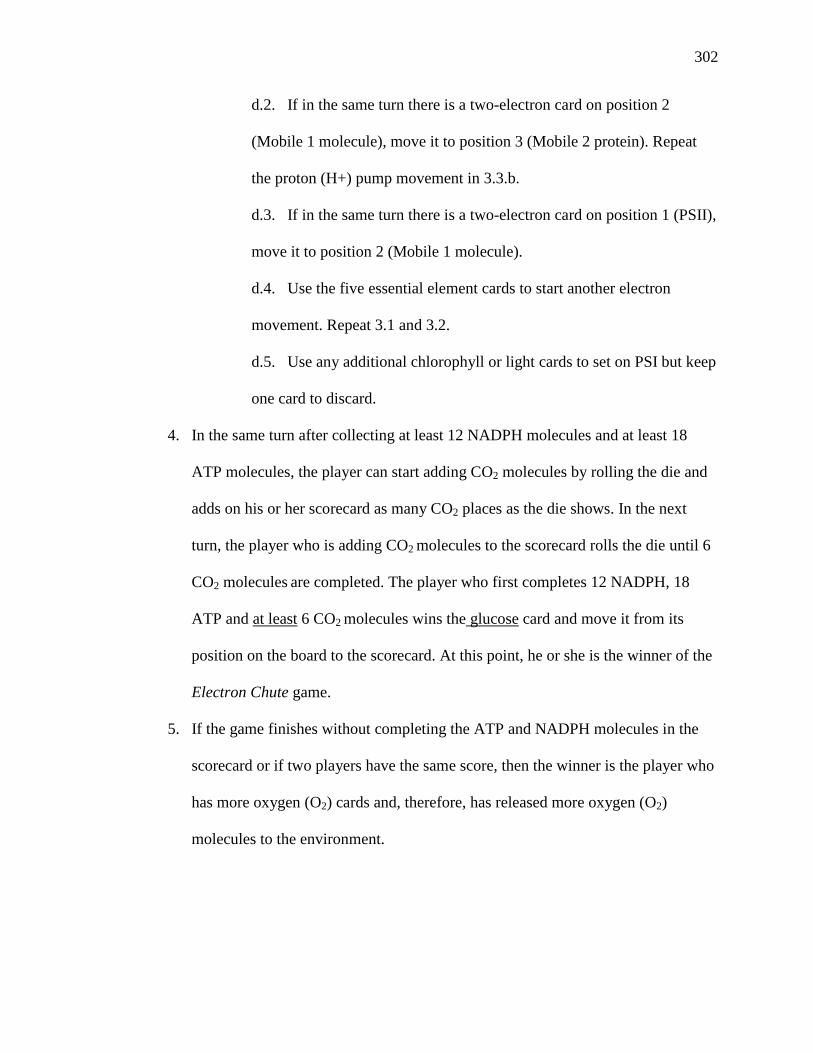
302
d.2. If in the same turn there is a two-electron card on position 2
(Mobile 1 molecule), move it to position 3 (Mobile 2 protein). Repeat
the proton (H+) pump movement in 3.3.b.
d.3. If in the same turn there is a two-electron card on position 1 (PSII),
move it to position 2 (Mobile 1 molecule).
d.4. Use the five essential element cards to start another electron
movement. Repeat 3.1 and 3.2.
d.5. Use any additional chlorophyll or light cards to set on PSI but keep
one card to discard.
4. In the same turn after collecting at least 12 NADPH molecules and at least 18
ATP molecules, the player can start adding CO2 molecules by rolling the die and
adds on his or her scorecard as many CO2 places as the die shows. In the next
turn, the player who is adding CO2 molecules to the scorecard rolls the die until 6
CO2 molecules are completed. The player who first completes 12 NADPH, 18
ATP and at least 6 CO2 molecules wins the glucose card and move it from its
position on the board to the scorecard. At this point, he or she is the winner of the
Electron Chute game.
5. If the game finishes without completing the ATP and NADPH molecules in the
scorecard or if two players have the same score, then the winner is the player who
has more oxygen (O2) cards and, therefore, has released more oxygen (O2)
molecules to the environment.

303
6. Special Token: The ETC process has light as the limiting factor for Electron
Chute. Therefore, a player has the option to request a light card twice during the
game. Every time a player request a light card, he or she loses one turn.
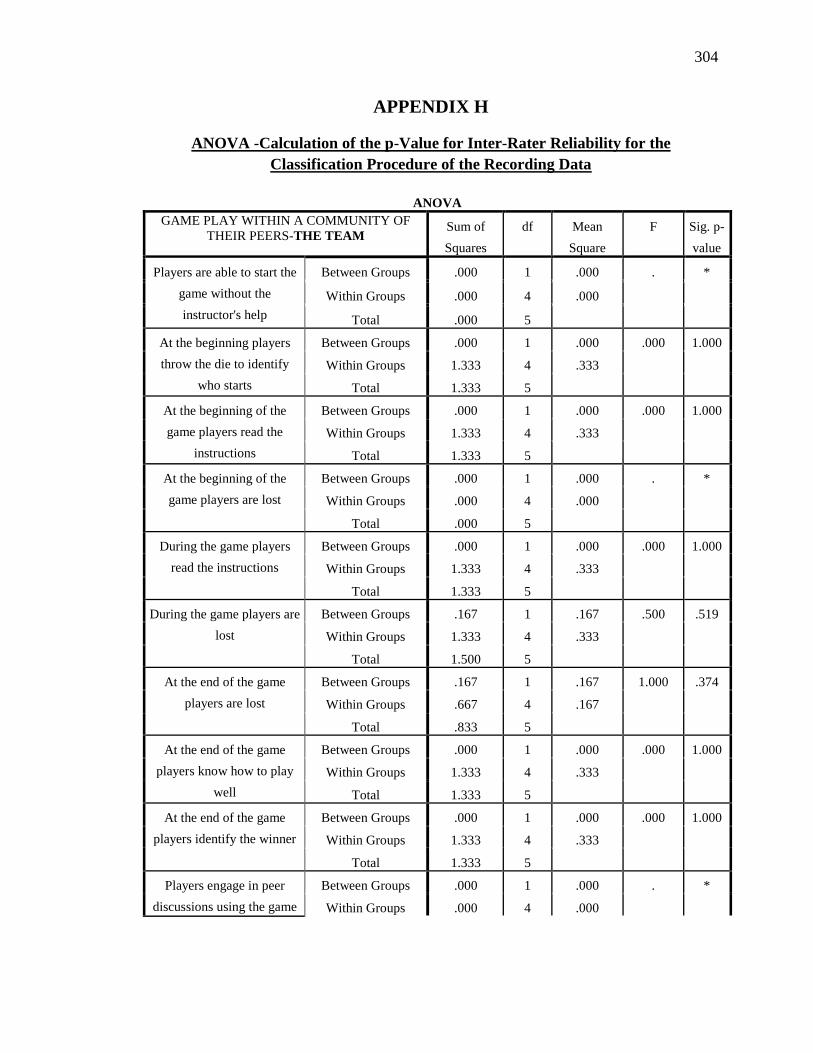
304
APPENDIX H
ANOVA -Calculation of the p-Value for Inter-Rater Reliability for the
Classification Procedure of the Recording Data
ANOVA
GAME PLAY WITHIN A COMMUNITY OF
THEIR PEERS-THE TEAM Sum of
Squares
df Mean
Square
F Sig. p-
value
Players are able to start the
game without the
instructor's help
Between Groups .000 1 .000 . *
Within Groups .000 4 .000
Total .000 5
At the beginning players
throw the die to identify
who starts
Between Groups .000 1 .000 .000 1.000
Within Groups 1.333 4 .333
Total 1.333 5
At the beginning of the
game players read the
instructions
Between Groups .000 1 .000 .000 1.000
Within Groups 1.333 4 .333
Total 1.333 5
At the beginning of the
game players are lost
Between Groups .000 1 .000 . *
Within Groups .000 4 .000
Total .000 5
During the game players
read the instructions
Between Groups .000 1 .000 .000 1.000
Within Groups 1.333 4 .333
Total 1.333 5
During the game players are
lost
Between Groups .167 1 .167 .500 .519
Within Groups 1.333 4 .333
Total 1.500 5
At the end of the game
players are lost
Between Groups .167 1 .167 1.000 .374
Within Groups .667 4 .167
Total .833 5
At the end of the game
players know how to play
well
Between Groups .000 1 .000 .000 1.000
Within Groups 1.333 4 .333
Total 1.333 5
At the end of the game
players identify the winner
Between Groups .000 1 .000 .000 1.000
Within Groups 1.333 4 .333
Total 1.333 5
Players engage in peer
discussions using the game
Between Groups .000 1 .000 . *
Within Groups .000 4 .000
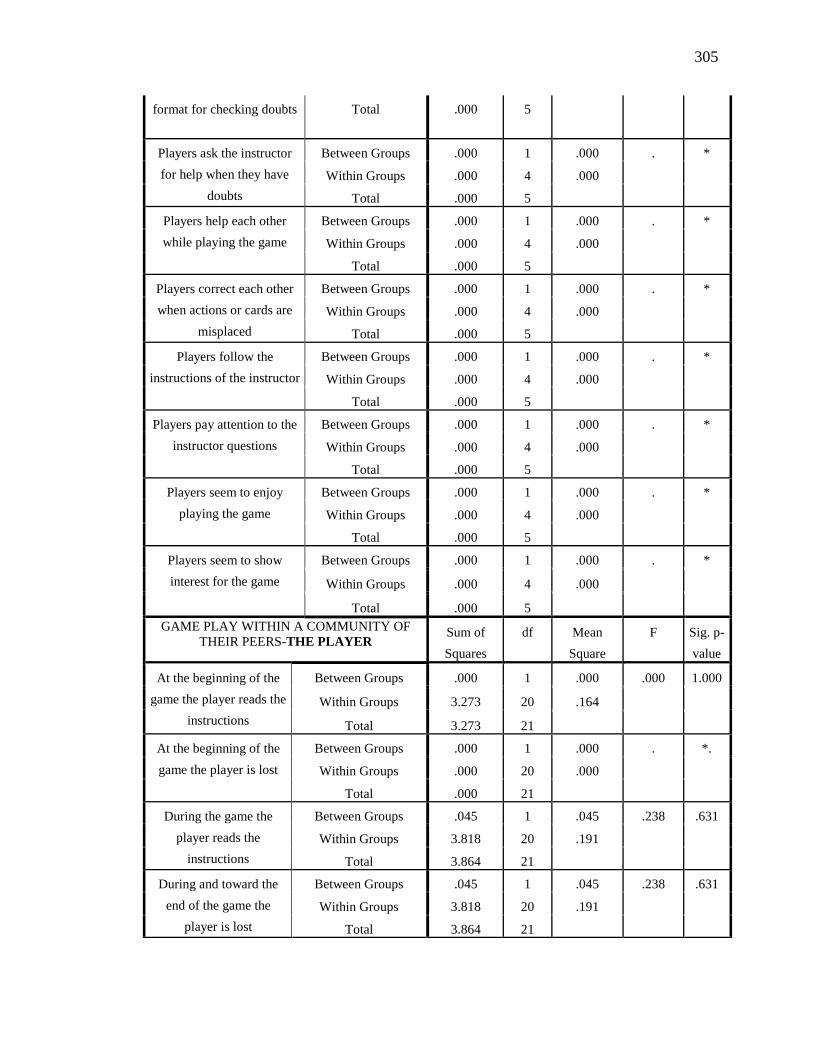
305
format for checking doubts
Total .000 5
Players ask the instructor
for help when they have
doubts
Between Groups .000 1 .000 . *
Within Groups .000 4 .000
Total .000 5
Players help each other
while playing the game
Between Groups .000 1 .000 . *
Within Groups .000 4 .000
Total .000 5
Players correct each other
when actions or cards are
misplaced
Between Groups .000 1 .000 . *
Within Groups .000 4 .000
Total .000 5
Players follow the
instructions of the instructor
Between Groups .000 1 .000 . *
Within Groups .000 4 .000
Total .000 5
Players pay attention to the
instructor questions
Between Groups .000 1 .000 . *
Within Groups .000 4 .000
Total .000 5
Players seem to enjoy
playing the game
Between Groups .000 1 .000 . *
Within Groups .000 4 .000
Total .000 5
Players seem to show
interest for the game
Between Groups .000 1 .000 . *
Within Groups .000 4 .000
Total .000 5
GAME PLAY WITHIN A COMMUNITY OF
THEIR PEERS-THE PLAYER Sum of
Squares
df Mean
Square
F Sig. p-
value
At the beginning of the
game the player reads the
instructions
Between Groups .000 1 .000 .000 1.000
Within Groups 3.273 20 .164
Total 3.273 21
At the beginning of the
game the player is lost
Between Groups .000 1 .000 . *.
Within Groups .000 20 .000
Total .000 21
During the game the
player reads the
instructions
Between Groups .045 1 .045 .238 .631
Within Groups 3.818 20 .191
Total 3.864 21
During and toward the
end of the game the
player is lost
Between Groups .045 1 .045 .238 .631
Within Groups 3.818 20 .191
Total 3.864 21
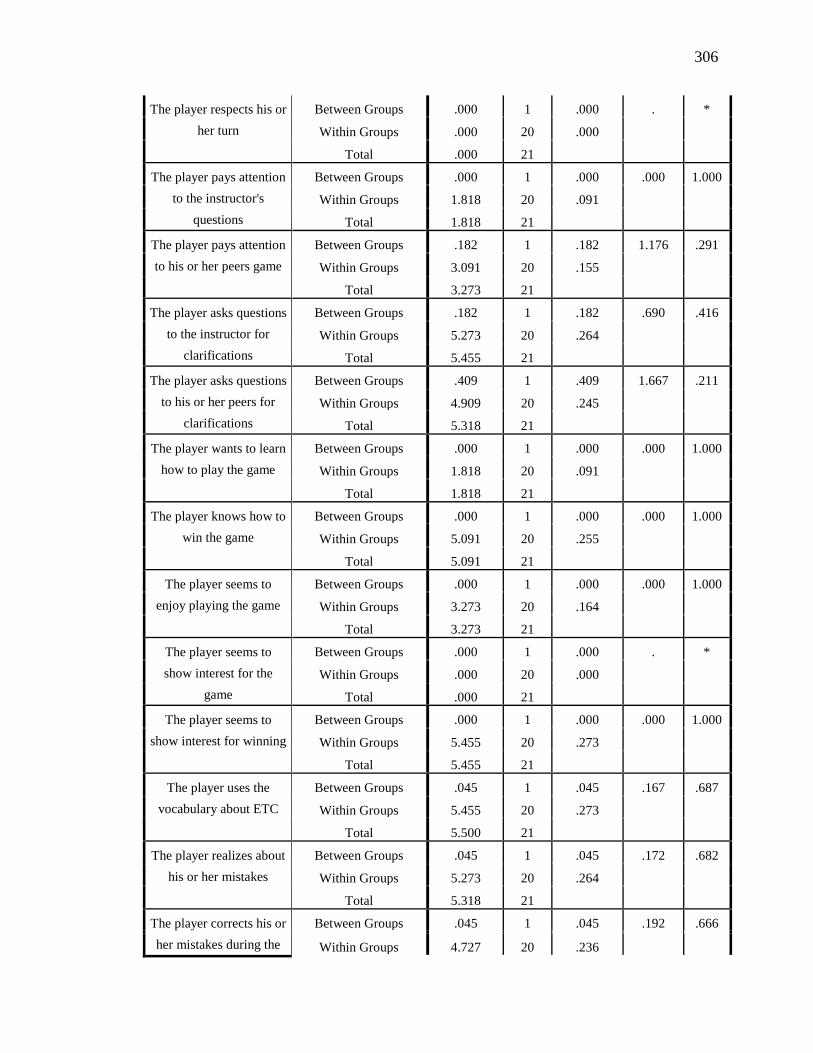
306
The player respects his or
her turn
Between Groups .000 1 .000 . *
Within Groups .000 20 .000
Total .000 21
The player pays attention
to the instructor's
questions
Between Groups .000 1 .000 .000 1.000
Within Groups 1.818 20 .091
Total 1.818 21
The player pays attention
to his or her peers game
Between Groups .182 1 .182 1.176 .291
Within Groups 3.091 20 .155
Total 3.273 21
The player asks questions
to the instructor for
clarifications
Between Groups .182 1 .182 .690 .416
Within Groups 5.273 20 .264
Total 5.455 21
The player asks questions
to his or her peers for
clarifications
Between Groups .409 1 .409 1.667 .211
Within Groups 4.909 20 .245
Total 5.318 21
The player wants to learn
how to play the game
Between Groups .000 1 .000 .000 1.000
Within Groups 1.818 20 .091
Total 1.818 21
The player knows how to
win the game
Between Groups .000 1 .000 .000 1.000
Within Groups 5.091 20 .255
Total 5.091 21
The player seems to
enjoy playing the game
Between Groups .000 1 .000 .000 1.000
Within Groups 3.273 20 .164
Total 3.273 21
The player seems to
show interest for the
game
Between Groups .000 1 .000 . *
Within Groups .000 20 .000
Total .000 21
The player seems to
show interest for winning
Between Groups .000 1 .000 .000 1.000
Within Groups 5.455 20 .273
Total 5.455 21
The player uses the
vocabulary about ETC
Between Groups .045 1 .045 .167 .687
Within Groups 5.455 20 .273
Total 5.500 21
The player realizes about
his or her mistakes
Between Groups .045 1 .045 .172 .682
Within Groups 5.273 20 .264
Total 5.318 21
The player corrects his or
her mistakes during the
Between Groups .045 1 .045 .192 .666
Within Groups 4.727 20 .236
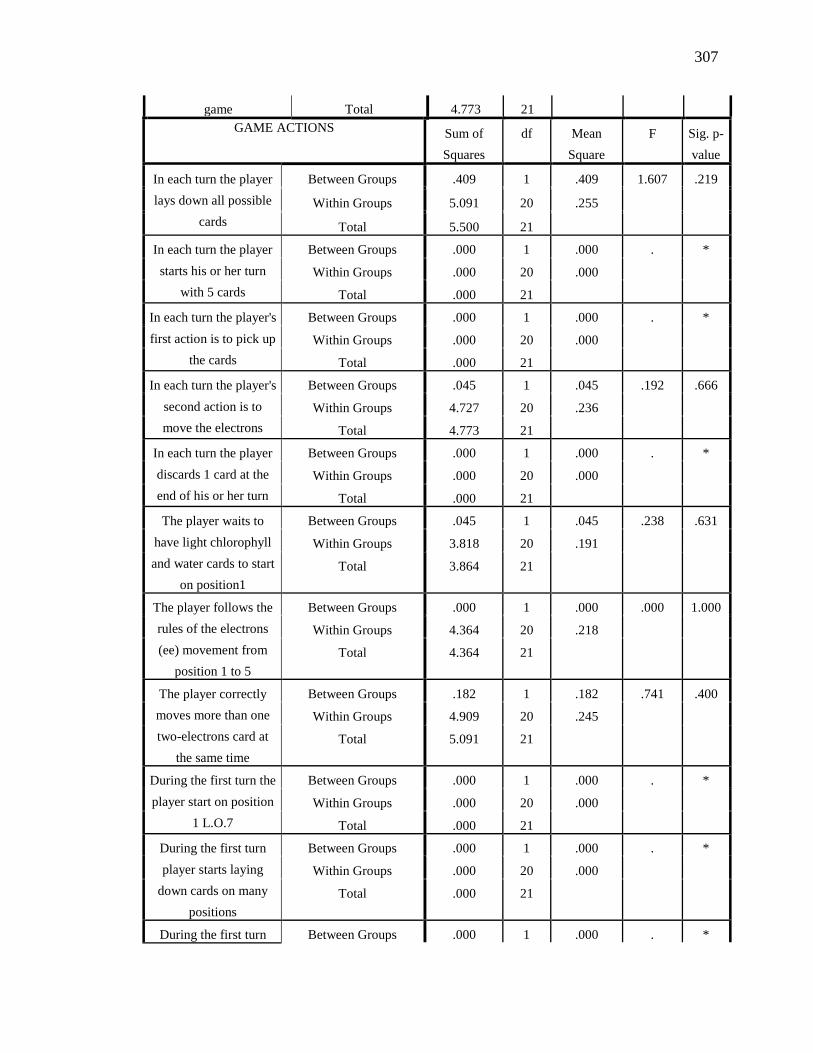
307
game Total 4.773 21
GAME ACTIONS Sum of
Squares
df Mean
Square
F Sig. p-
value
In each turn the player
lays down all possible
cards
Between Groups .409 1 .409 1.607 .219
Within Groups 5.091 20 .255
Total 5.500 21
In each turn the player
starts his or her turn
with 5 cards
Between Groups .000 1 .000 . *
Within Groups .000 20 .000
Total .000 21
In each turn the player's
first action is to pick up
the cards
Between Groups .000 1 .000 . *
Within Groups .000 20 .000
Total .000 21
In each turn the player's
second action is to
move the electrons
Between Groups .045 1 .045 .192 .666
Within Groups 4.727 20 .236
Total 4.773 21
In each turn the player
discards 1 card at the
end of his or her turn
Between Groups .000 1 .000 . *
Within Groups .000 20 .000
Total .000 21
The player waits to
have light chlorophyll
and water cards to start
on position1
Between Groups .045 1 .045 .238 .631
Within Groups 3.818 20 .191
Total 3.864 21
The player follows the
rules of the electrons
(ee) movement from
position 1 to 5
Between Groups .000 1 .000 .000 1.000
Within Groups 4.364 20 .218
Total 4.364 21
The player correctly
moves more than one
two-electrons card at
the same time
Between Groups .182 1 .182 .741 .400
Within Groups 4.909 20 .245
Total 5.091 21
During the first turn the
player start on position
1 L.O.7
Between Groups .000 1 .000 . *
Within Groups .000 20 .000
Total .000 21
During the first turn
player starts laying
down cards on many
positions
Between Groups .000 1 .000 . *
Within Groups .000 20 .000
Total .000 21
During the first turn Between Groups .000 1 .000 . *
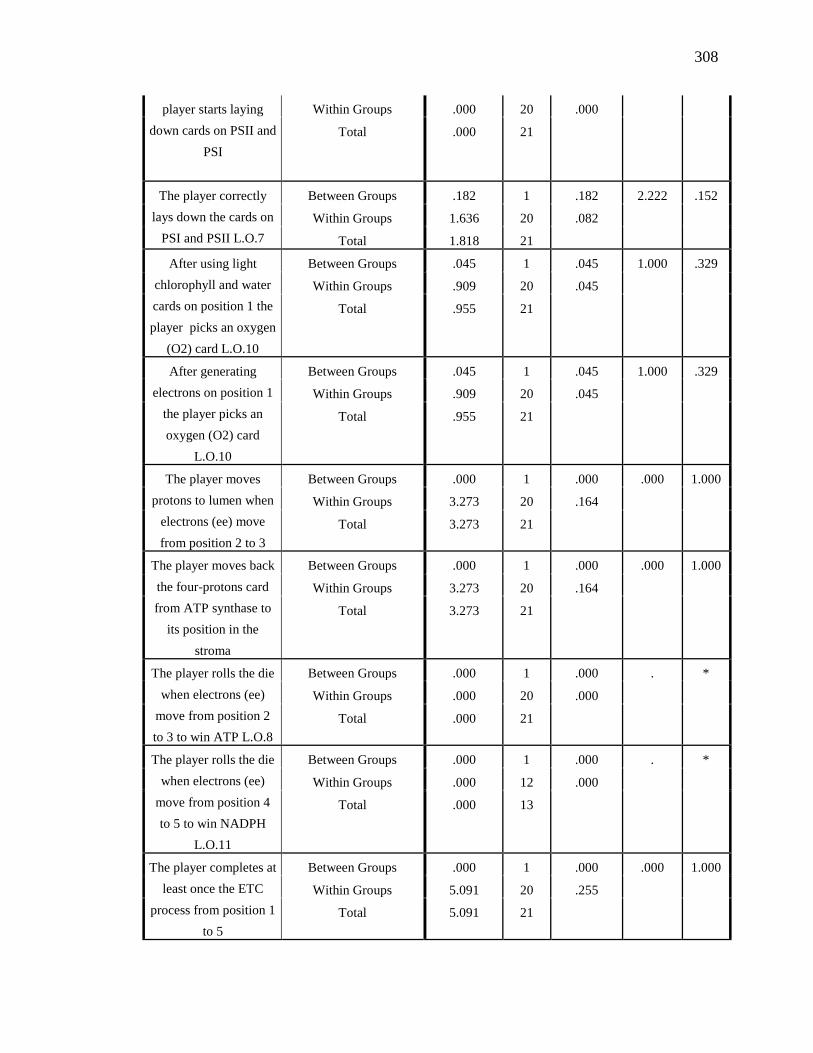
308
player starts laying
down cards on PSII and
PSI
Within Groups .000 20 .000
Total .000 21
The player correctly
lays down the cards on
PSI and PSII L.O.7
Between Groups .182 1 .182 2.222 .152
Within Groups 1.636 20 .082
Total 1.818 21
After using light
chlorophyll and water
cards on position 1 the
player picks an oxygen
(O2) card L.O.10
Between Groups .045 1 .045 1.000 .329
Within Groups .909 20 .045
Total .955 21
After generating
electrons on position 1
the player picks an
oxygen (O2) card
L.O.10
Between Groups .045 1 .045 1.000 .329
Within Groups .909 20 .045
Total .955 21
The player moves
protons to lumen when
electrons (ee) move
from position 2 to 3
Between Groups .000 1 .000 .000 1.000
Within Groups 3.273 20 .164
Total 3.273 21
The player moves back
the four-protons card
from ATP synthase to
its position in the
stroma
Between Groups .000 1 .000 .000 1.000
Within Groups 3.273 20 .164
Total 3.273 21
The player rolls the die
when electrons (ee)
move from position 2
to 3 to win ATP L.O.8
Between Groups .000 1 .000 . *
Within Groups .000 20 .000
Total .000 21
The player rolls the die
when electrons (ee)
move from position 4
to 5 to win NADPH
L.O.11
Between Groups .000 1 .000 . *
Within Groups .000 12 .000
Total .000 13
The player completes at
least once the ETC
process from position 1
to 5
Between Groups .000 1 .000 .000 1.000
Within Groups 5.091 20 .255
Total 5.091 21
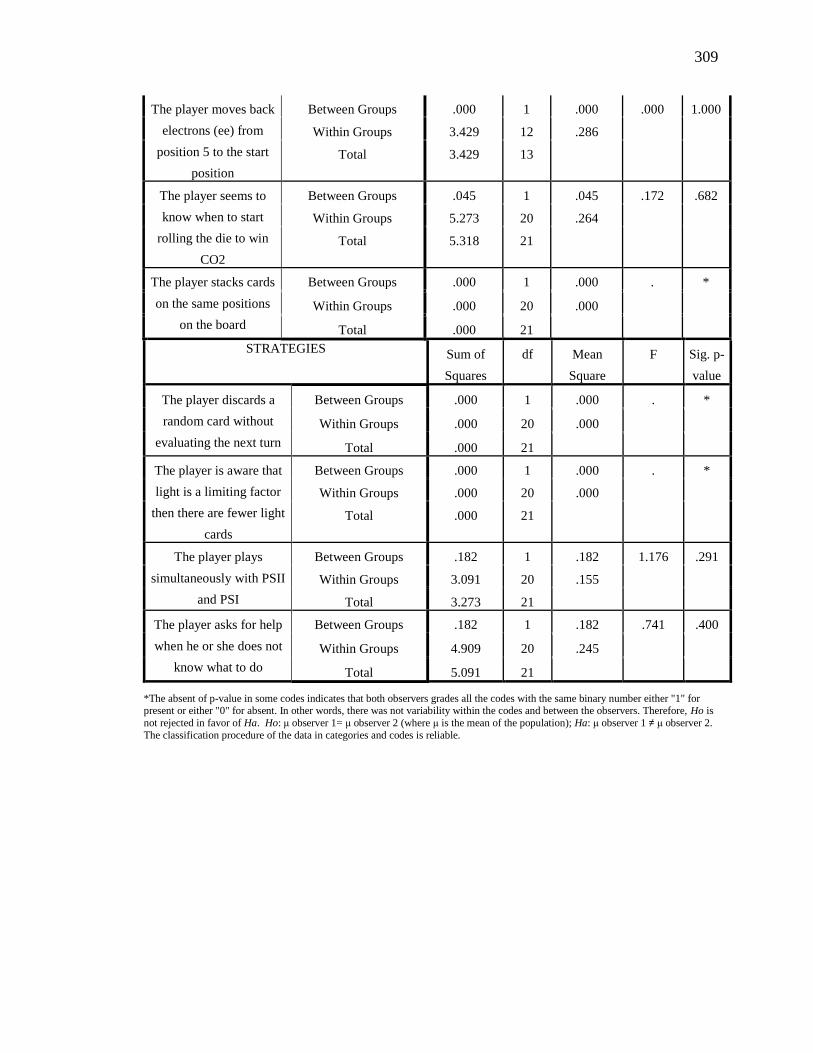
309
The player moves back
electrons (ee) from
position 5 to the start
position
Between Groups .000 1 .000 .000 1.000
Within Groups 3.429 12 .286
Total 3.429 13
The player seems to
know when to start
rolling the die to win
CO2
Between Groups .045 1 .045 .172 .682
Within Groups 5.273 20 .264
Total 5.318 21
The player stacks cards
on the same positions
on the board
Between Groups .000 1 .000 . *
Within Groups .000 20 .000
Total .000 21
STRATEGIES Sum of
Squares
df Mean
Square
F Sig. p-
value
The player discards a
random card without
evaluating the next turn
Between Groups .000 1 .000 . *
Within Groups .000 20 .000
Total .000 21
The player is aware that
light is a limiting factor
then there are fewer light
cards
Between Groups .000 1 .000 . *
Within Groups .000 20 .000
Total .000 21
The player plays
simultaneously with PSII
and PSI
Between Groups .182 1 .182 1.176 .291
Within Groups 3.091 20 .155
Total 3.273 21
The player asks for help
when he or she does not
know what to do
Between Groups .182 1 .182 .741 .400
Within Groups 4.909 20 .245
Total 5.091 21
*The absent of p-value in some codes indicates that both observers grades all the codes with the same binary number either "1" for present or either "0" for absent. In other words, there was not variability within the codes and between the observers. Therefore, Ho is
not rejected in favor of Ha. Ho: μ observer 1= μ observer 2 (where μ is the mean of the population); Ha: μ observer 1 ≠ μ observer 2.
The classification procedure of the data in categories and codes is reliable.
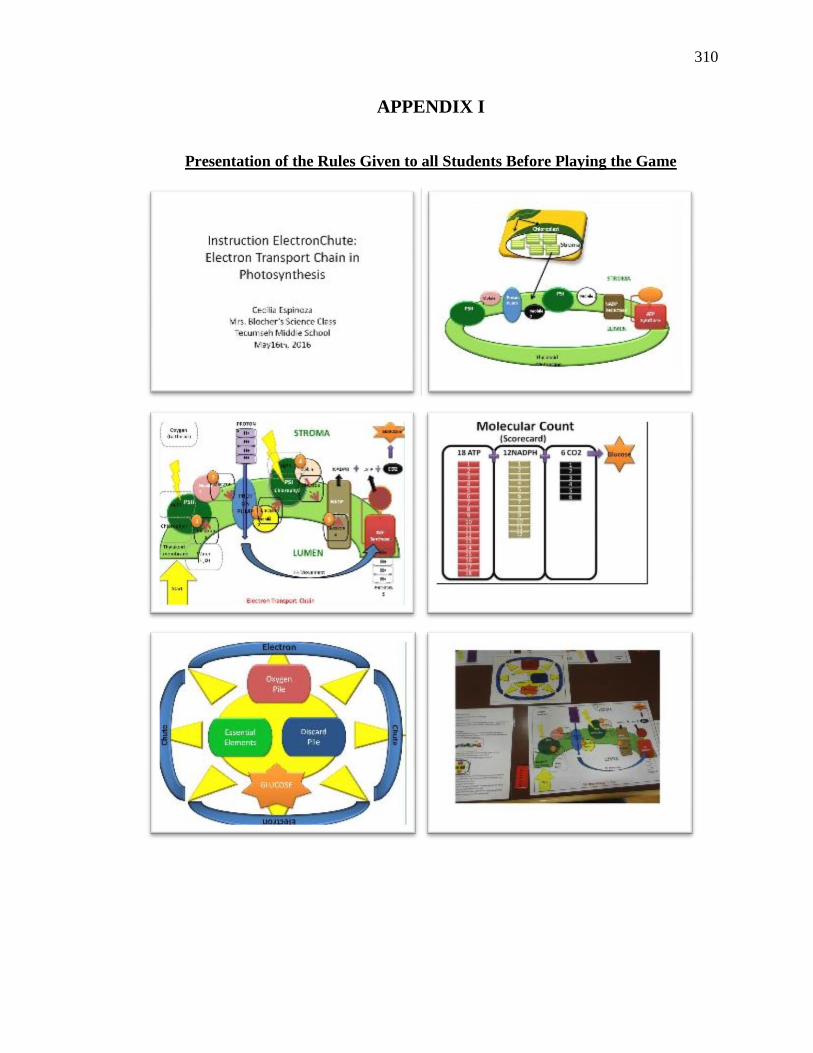
310
APPENDIX I
Presentation of the Rules Given to all Students Before Playing the Game
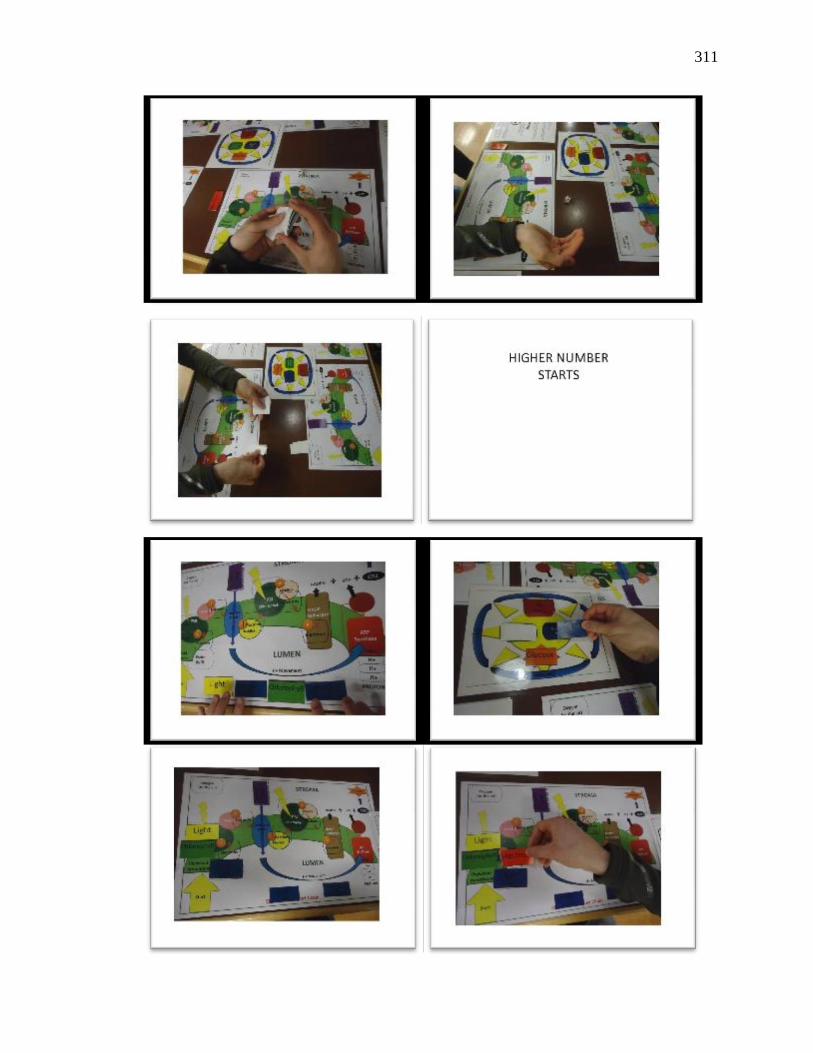
311
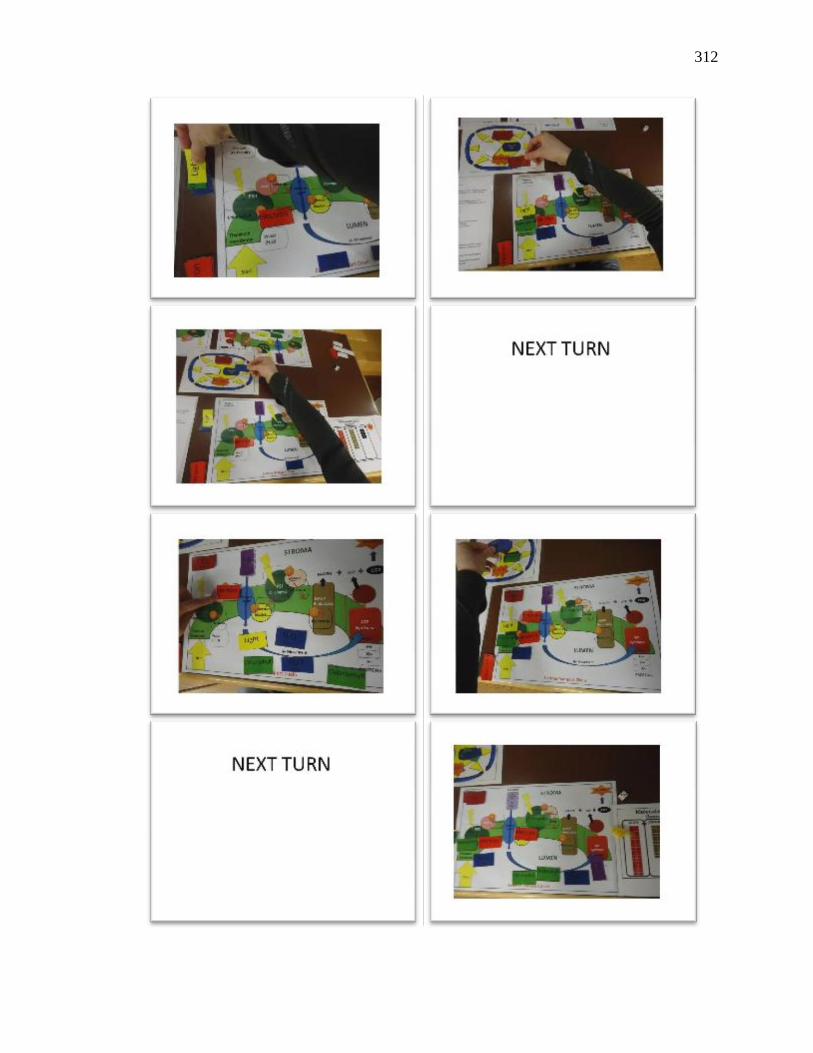
312
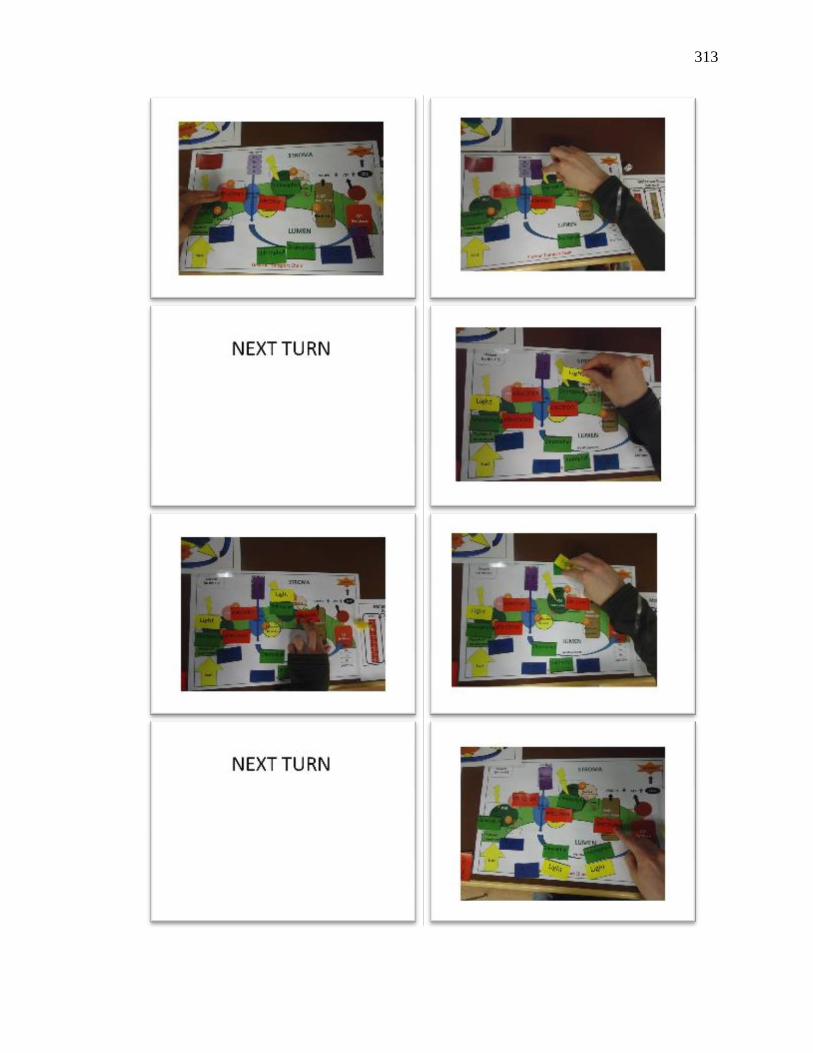
313
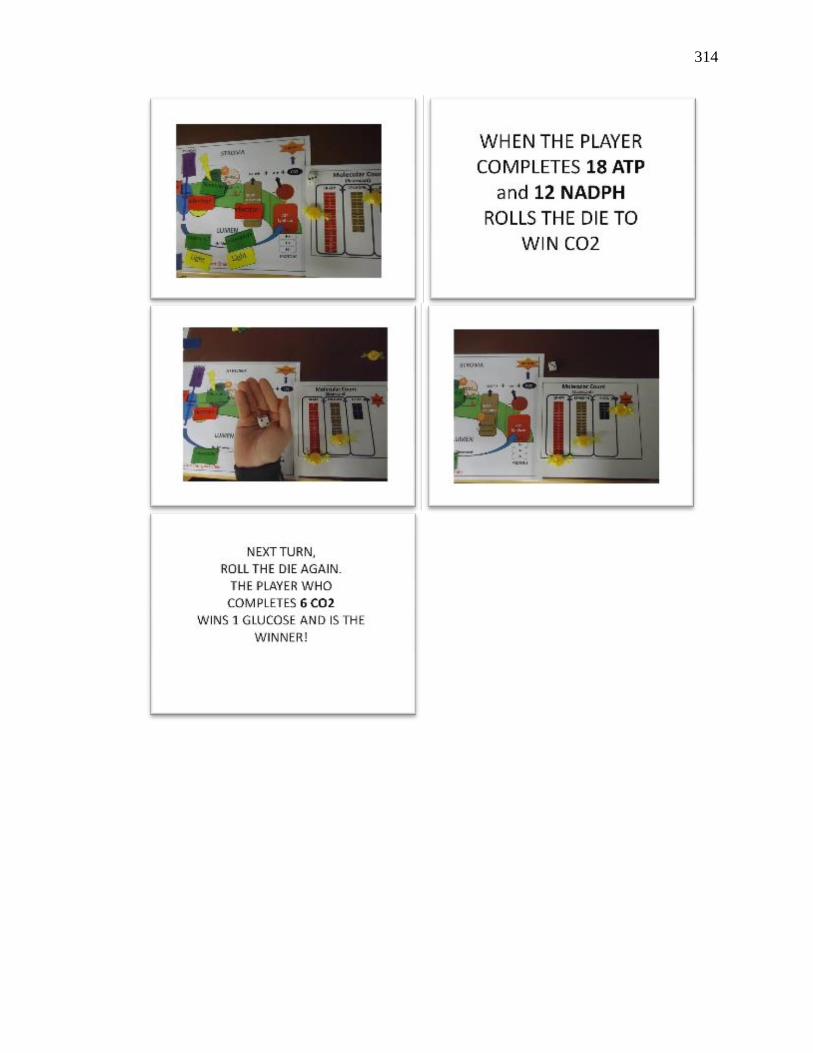
314
315
VITA
Cecilia Espinoza
E-mail: [email protected]
Education
2012-present PhD program, Youth Development & Ag. Education (YDAE), Purdue
University, USA.
2010-2012 Master’s degree in science, Fulbright Commission, Purdue University, USA.
2006 Biochemist (B.S. in biochemistry), P. Catholic University (PUC), Chile.
2003 Agronomist (B.S. in agriculture and natural resources), PUC, Chile.
Academic and Work Experience
2016 Teaching instructor of horticulture, laboratory section, Department of
Horticulture, Purdue U., USA.
2013-2015 Graduate researcher, enhancing science and mathematics learning through
agricultural concepts, Department of Youth Development & Ag. Education,
Purdue University, USA.
2009 Laboratory technician, mining laboratory, PUC, Chile.
2007 Teaching instructor, biochemistry, Professional Institute of Chile, Chile.
2006-2007 Teaching assistant, chemistry laboratory, Department of Chemistry, PUC,
Chile.
2006 Laboratory technician, biochemistry laboratory, Biosonda S.A., Chile.
2001-2006 Agronomist technician in post-harvest fruit quality processes & administrative
research. Summer internship, Product Quality Assurance Company
(PQA), Chile.
Research Projects & Grants
2016 GSOGA (Graduate Student Organization Grant Allocation) grant for the
DBER-GS (Discipline Based Education Research Graduate Students)
organization, Purdue University.
2016 Student Grant Program for Service Learning Project, Purdue University.
Project Title: Learning about Photosynthesis through Experimentation-
Determination of Carbohydrates in a Leaf.
2015 DEAL (Discovery and Learning) grant for the DBER community at Purdue
University (not awarded).
2013-2015 Graduate researcher. Enhancing Science Capacity in Introductory Animal,
Plant, and Food Sciences Courses. USDA NIFA Higher Education Challenge
Grant (2010-14). Retrieved from:
http://www.ydae.purdue.edu/esc/plant/login.cfm
2011 Student Grant Program for Service Learning Project, Purdue University.
Project Title: How Similar is a Potato to a Stem? Identifying what Part of the
Plant you Eat in your Dinner.
316
2011 Student Grant Program for Community Service, Purdue University. Project
title: Increasing Eighth Grade Students' Knowledge of Agriculture through
place-based learning at Fair Oaks Dairy Farm.
2009 Effect of Sulphate, Chloride and Nitrate Adsorption on Copper Release on
Drinking Water, PUC.
2007 Optimization of Methodology to Quantify As+3 in Biological Samples by
Chromatography, PUC.
2007 Research thesis: Biochemistry and Immunogenic Characterization of
Hemocyanin of three Limpet Species of Fissurellidae Family: F latimarginata,
F. cumingi y F. maxima, Biosonda, Chile.
2005 Stepmothers of O. degus Transfer IgA to Litters during Lactation.
Biochemistry lab, Biosonda, Chile.
2003 Research thesis: Effect of the Modified and Controlled Atmosphere, Alone or
Combined, over the Kiwi Fruits Firmness, Actinidia deliciosa, post-harvest
laboratory, PUC, Chile.
Fellowships & Honors
YDAE diamond award, peer recognition for excellence, Purdue University, USA, 2015.
Becas Chile, scholarship for doctoral program, Commission for Scientific &Tech.
Research (CONICYT), 2012-2016.
Ross fellowship, scholarship for master’s degree, Purdue University, USA, 010-2011.
Fulbright fellowship, scholarship for master’s degree, Fulbright Commission, USA,
2010-2012.
PUC fellowship, scholarship for bachelor's degree program, Chile, 2003.
Publications & Conference Presentations
Espinoza, C. (2017). A graduate service-learning experience: Teaching about photosynthesis
to eighth grade science students. Purdue Journal of Service-Learning and Engagement, 4,
55–58. http://dx.doi.org/10.5703 /1288284316191
Orvis, K.S., Espinoza, C. (2017). Concept Maps to Address Misconceptions in Introductory
Science Courses, presented at the North American Colleges and Teachers of Agriculture
(NACTA) Conference, West Lafayette, 2017.NACTA Publishing.
El Debs L., Brophy S.P., Espinoza C. (2017). Identifying Student Communication Strategies
Involving Spatial Information, the Institute of Electrical Engineers (IEEE) Frontiers in
Education Conference (FIE), Indianapolis, 2017 (submitted).
Espinoza C., Orvis K.S., Ramírez, J. (2017). Chilean Elementary Teachers' Beliefs about
Using Agricultural Concepts to Enhance Life Sciences and Mathematics Learning.
Pensamiento Educativo. Revista Ed. Latinoamericana, 54(1), 1-20.
Espinoza C., Brophy S.P, Orvis K.S. (2016). Eighth Grade Students' Inputs of a Video and
an Serious Game to Learn about the Electron Transport Chain Process in Photosynthesis in a
Science Class at a Local Public School (submitted).
Arancibia S., Espinoza C., Del Campo M., Becker M.I. (2014). A Novel Hemocyanin from
Fissurella latimarginata Promotes Anti-Tumor Activity in Melanoma. PLoS ONE 9(1):
e87240. doi:10.1371/journal.pone.0087240.
317
Certificates
Grad. Instructional Development Certificate (GIDC) for Teaching, Center for
Instructional Excellence, Purdue, 2017.
Family Educational Rights and Privacy Act (FERPA), U.S. Department of Education,
2016.
Communicating Science: Fundamentals for Public Engagement, Career Development
Center, American Association for the Advancement of Science (AAAS), 2016.
Avoiding Common Errors in Proposal Writing Career Development Center, AAAS, 2016.
Teaching Strategies to Enhance Scientific Thinking Skills in Middle School Students,
PUC, Chile, 2015.
Social and Behavioral Responsible Conduct of Research, Collaborative Institutional
Training Initiative (CITI) program, Miami University, 2012-present.
Social Behavioral Research Investigators and Key Personal, CITI program, Miami
University, 2012-present.
English Proficiency Program, Center for English Teaching (CET), The University of
Sydney, Australia, 2008.
Posters Presentations
Espinoza, C., Orvis, K.S. Assessing College Students' Misconceptions of Photosynthesis
and Respiration in an Introductory Plant Science Course. National Association for
Research in Science Teaching, USA. April 14-17, 2016.
Espinoza, C., Blocher, A. Teaching about Photosynthesis: A Graduate Student Service-
Learning Experience with Eighth Grade Students in a Science Class. Engagement and
Service Learning Summit, Purdue U., March 10, 2016.
Espinoza C., Xu S, Orvis K.S, Knobloch N.A, Welsh, M. Plants get sick too! Learning
about Food Safety in the Classroom. Fulbright Association 38th
Annual Conference,
Atlanta, USA. November 12-15, 2015.
Orvis K.S., Espinoza C. Evaluating Plant Science Concepts in an Introductory
Horticulture Course Using Conceptual Maps as Assessment Tools. American Society for
Hort. Science Conference, USA. July 27-31, 2014.
Espinoza C., Knobloch N.A., Orvis K.S., Keefe L.M., Chang S, Hains B. A Pilot Study
of College Students’ Experiences with an Educational Game to Learn Difficult Plant
Science Concepts. International Conference on Improving University Teaching (IUT),
Santiago, Chile. July 17-19, 2013.
Espinoza C., Orvis K.S, Knobloch N.A. Exploring Chilean Elementary Teachers' Beliefs
Regarding Agriculture as an Educational Context to Enhance Student Learning in Natural
Sciences. The Association for International Agricultural and Extension Education
(AIAEE).Texas, USA. May 19-22, 2013.
Becker MI, Arancibia S, Espinoza C, Salazar F, Del Campo M, Born R, Ferreira J,
Manubens A, De Ioannes A. Novel hemocyanin from the Fissurella latimarginata
exhibits an outstanding immunogenicity and non-specific immunomodulatory effects in a
melanoma model. J Immunol. 188: 53.6 (Abstract). Boston, USA. May 4-8, 2012.
Espinoza C., Knobloch N.A. Connecting 8th
Grade Students to a Dairy Farm Experience.
Purdue Annual Graduate Student Educational Research Symposium (AGSERS). Indiana,
USA. March 27, 2012.
318
Arancibia S., Espinoza C., Del Campo M., Salazar F., Manubens A., De Ioannes A.,
Becker M.I. Fissurella latimarginata hemocyanin exhibits outstanding adjuvant
properties for potential use in therapeutic vaccines against cancer. 9th Annual Meeting
Cancer Immunotherapy. Mainz, Germany. May 25-27, 2011.
Arancibia S., Espinoza C., Del Campo M., Becker M.I. Exceptional immunologic and
anticancer properties of a new hemocyanin from Fissurella latimarginata (FLH). 25th
Annual Meeting International Society of Biological Therapy of Cancer. Washington,
USA. October 1-4, 2010.
Arancibia S., Espinoza C., Becker M.I. Fissurella latimarginata hemocyanins a novel
non-specific immunostimulant and antitumor agent. XXIV Annual Meeting of Cellular
Biology Society of Chile. Pucón, Chile. November 1-5, 2010.
Del Río R., Gutierrez C., Espinoza C., Armijo F., Schrebler R. Electrocatalytic Behavior
of Gold Nanoparticles Electrodeposited in Templates of Block Copolymers Films. 59th
Annual Meeting International Society of Electrochemistry. Seville, Spain. September 7-
12, 2008.
Espinoza C., De Ioannes A.E., Becker M.I. Biochemistry Characterization of
Hemocyanin of three limpet species of Fissurellidae family. Biochemistry and Molecular
Biology Society of Chile. Chile. November 22-25, 2006.
Becker M.I., Moltedo B., Oliva H., Lagos L., Espinoza C., Manubens A., De Ioannes A.
Hemocyanins from C. concholepas (CCH) and M. crenulata (KLH), which broadly differ
in their origin and subunit organization, display similar immunomodulatory properties.
16th
European Congress of Immunology. Paris, France. September 6-9, 2006
Attendance to Workshops & Conferences
Chilean Mathematics Teachers' Experiences after a Novel Training Program in the
Classroom, January 2017, Chile.
National Association for Research in Science Teaching (NARST), April 2015-2016,
USA.
American Educational Research Association (AERA), April 2015, USA.
Teaching Through Inquiry Using the Chilean Natural Sciences Curriculum for K-12,
PUC, January 2015, Chile.
Youth, Culture and Education in Chile and Spain, Center for Studies, Ministry of
Education, March 2013, Chile.
Professional Development Activities at Purdue University
Teaching assistant in the GK-12 Educational Program at Lafayette Tecumseh Junior
High School, 2016.
Treasurer of the Discipline-Based Educational Research Graduate Student Organization
(DBER-GS), 2015-2016.
Teaching volunteer at the Lafayette Adult Resource Academy (LARA), Lafayette, IN,
2015.
Secretary of the Graduate Women Student Organization of the College of Agriculture
(WCOA), 2015.
Member of the Graduate Mentoring Task Force, College of Agriculture, 2013.
Assistant for the 4-H international program organized by YDAE, 2011 & 2015.

319
International advisory mentor of the Graduate Student Recruitment Service in the Grad.
School, 2011-2014
Senator of the Purdue Graduate Student Government (PGSG), 2011-2013.
Participant of International Programs in Agriculture (IPIA)'s Latin America Initiative
series, College of Ag., 2011.
Association
National Association for Research in Science Teaching (NARST).
American Educational Research Association (AERA).


