Embed Size (px)
Citation preview
Lipidomic analysis and electron transport chain activities inC57BL/6J mouse brain mitochondria
Michael A. Kiebish*, Xianlin Han†, Hua Cheng†, Adam Lunceford‡, Catherine F. Clarke‡,Hwi Moon*, Jeffrey H. Chuang*, and Thomas N. Seyfried*
*Biology Department, Boston College, Chestnut Hill, Massachusetts, USA†Department of Internal Medicine, Washington University School of Medicine, St Louis, Missouri,USA‡Department of Chemistry and Biochemistry, University of California-Los Angeles, Los Angeles,California, USA
AbstractThe objective of this study was to characterize the lipidome and electron transport chain activitiesin purified non-synaptic (NS) and synaptic (Syn) mitochondria from C57BL/6J mouse cerebralcortex. Contamination from subcellular membranes, especially myelin, has hindered past attemptsto accurately characterize the lipid composition of brain mitochondria. An improved Ficoll andsucrose discontinuous gradient method was employed that yielded highly enriched mitochondrialpopulations free of myelin contamination. The activities of Complexes I, II, III, and II/III werelower in Syn than in NS mitochondria, while Complexes I/III and IV activities were similar inboth populations. Shotgun lipidomics showed that levels of cardiolipin (Ptd2Gro) were lower,whereas levels of ceramide and phosphatidylserine were higher in Syn than in NS mitochondria.Coenzyme Q9 and Q10 was also lower in Syn than in NS mitochondria. Gangliosides, phosphatidicacid, sulfatides, and cerebrosides were undetectable in brain mitochondria. The distribution ofPtd2Gro molecular species was similar in both populations and formed a unique pattern, consistingof seven major molecular species groups, when arranged according to mass to charge ratios.Remodeling involving choline and ethanolamine phosphoglycerides could explain Ptd2Groheterogeneity. NS and Syn mitochondrial lipidomic heterogeneity could influence energymetabolism, which may contribute to metabolic compartmentation of the brain.
© 2008 The AuthorsAddress Correspondence and reprint requests to Thomas N. Seyfried, PhD, Biology Department, Boston College, Chestnut Hill, MA02467, USA. [email protected] materialThe following supplementary material is available for this article:Table S1 Mass content of ethanolamine glycerophospholipid molecular species in mouse brain mitochondria.Table S2 Mass content of choline glycerophospholipid molecular species in mouse brain mitochondria.Table S3 Mass content of cardiolipin molecular species in brain mitochondria.Table S4 Mass content of phosphatidylinositol molecular species in mouse brain mitochondria.Table S5 Mass content of phosphatidylglycerol molecular species in mouse brain mitochondria.Table S6 Mass content of sphingomyelin molecular species in mouse brain mitochondria.Table S7 Mass content of phosphatidylserine molecular species in mouse brain mitochondria.Table S8 Mass content of lysophosphatidyicholine molecular species in mouse brain mitochondria.Table S9 Mass content of ceramide molecular species in mouse brain mitochondria.This material is available as part of the online article from:http://www.blackwell-synergy.com/doi/abs/10.1111/j.1471-4159.2008.05383.x. (This link will take you to the article abstract).Please note: Blackwell Publishing are not responsible for the content or functionality of any supplementary materials supplied by theauthors. Any queries (other than missing material) should be directed to the corresponding author for the article.
NIH Public AccessAuthor ManuscriptJ Neurochem. Author manuscript; available in PMC 2011 May 30.
Published in final edited form as:J Neurochem. 2008 July ; 106(1): 299–312. doi:10.1111/j.1471-4159.2008.05383.x.
NIH
-PA Author Manuscript
NIH
-PA Author Manuscript
NIH
-PA Author Manuscript

Keywordscardiolipin; lipidome; myelin; non-synaptic; shotgun lipidomics; synaptic
Lipids of the mitochondrial membrane can influence numerous mitochondrial functions toinclude electron transport chain (ETC) activities, nucleotide transport, mitochondrial proteinimport, membrane fluidity/permeability properties, and ATP synthesis (Petrushka et al.1959; Daum 1985; Hoch 1992; Brand et al. 2003; Shinzawa-Itoh et al. 2007). Brain containsat least two major populations of mitochondria, based on cellular localization (Lai and Clark1989). These include the non-synaptic (NS) mitochondria, which originate from neuronaland glial cell bodies, and the synaptic (Syn) mitochondria, which primarily originate fromthe Syn bouton of neurons. These mitochondrial populations express differences in specificETC activities, believed to contribute to the metabolic compartmentation of the brain (Lai etal. 1977; Battino et al. 1991). The origin of this metabolic compartmentation could arisefrom differences in lipid composition of the mitochondrial membrane. However,contamination from subcellular membranes to include myelin has hindered past attempts toaccurately characterize the lipid composition of brain mitochondria (Cuzner and Davison1968; Lai and Clark 1989; Villa et al. 1989b; Bangur et al. 1995).
Shotgun lipidomics by electrospray ionization mass spectrometry (ESI/MS) can provide arapid and detailed analysis of lipids in biological membranes (Han and Gross 2005a). Thisapproach recently identified nearly 100 molecular species of brain cardiolipin (1,3-diphosphatidyl-sn-glycerol, Ptd2Gro), a mitochondrial specific lipid (Cheng et al.,unpublished observation). The origin of brain Ptd2Gro heterogeneity is not well defined, butmay be related to the unique synthesis of Ptd2Gro (Hauff and Hatch 2006; Schlame and Ren2006). Ptd2Gro is synthesized as immature Ptd2Gro through the condensation ofphosphatidylglycerol (PtdGro) and CDP-diacylglycerol. Ptd2Gro is then deacylated tomonolysocardiolipin (MLCL) and reacylated to form mature Ptd2Gro (Hauff and Hatch2006). This Ptd2Gro remodeling process uses fatty acyl groups from the sn-2 position ofdonor choline (ChoGpl) and ethanolamine (EtnGpl) glycerophospholipids (Xu et al. 2003;Schlame and Ren 2006). No prior studies have evaluated Ptd2Gro heterogeneity in purifiedNS and Syn mitochondrial populations.
The objective of this study was to analyze the lipid composition of NS and Synmitochondria. We designed a modified Ficoll and sucrose discontinuous gradient system forthe isolation and purification of mitochondria from mouse brain free of contaminatingmyelin or organelle and plasma membranes (Lai et al. 1977; Dagani et al. 1983). Shotgunlipidomics and HPLC connected to an electrochemical detector were used to determine ifquantitative or qualitative differences in lipid composition existed between these two brainmitochondrial populations. Moreover, ours is the first comprehensive examination of thebrain mitochondrial lipidome, including molecular species and mass content of ceramide(Cer), PtdGro, and lysophosphatidylcholine (LysoPtdCho). ETC activities were measured todetermine if differences in enzyme activities correlated with differences in the lipidcomposition of mitochondrial populations. Our results provide new insight into theimportance of brain mitochondrial lipids, which could contribute to metaboliccompartmentation of the brain.
Materials and methodsAnimals
C57BL/6J (B6) mice were obtained from the Jackson Laboratory (Bar Harbor, ME, USA).All mice were propagated at the Boston College Animal Facility and were housed in plastic
Kiebish et al. Page 2
J Neurochem. Author manuscript; available in PMC 2011 May 30.
NIH
-PA Author Manuscript
NIH
-PA Author Manuscript
NIH
-PA Author Manuscript

cages with filter tops containing Sani-Chip bedding (P. J. Murphy Forest Products Corp.,Montville, NJ, USA). The room was maintained at 22°C on a 12 h light/dark cycle. Food(Prolab RMH 3000; PMI LabDiet, Richmond, IN, USA) and water were provided adlibitum. This study was conducted with the National Institutes of Health Guide for the Careand Use of Laboratory Animals and was approved by the Institutional Animal CareCommittee.
Non-synaptic and synaptic brain mitochondrial isolationC57BL/6J mice (4 months of age) were killed by cervical dislocation and the cerebral cortexwas dissected. Mitochondria were isolated in a cold room (4°C) and all reagents were kepton ice. The isolation procedure employed a combination of gradients and strategies aspreviously described (Lai and Clark 1976; Lai et al. 1977; Mena et al. 1980; Dagani et al.1983; Rendon and Masmoudi 1985; Battino et al. 1991; Brown et al. 2006) (Fig. 1). Thecerebral cortexes (a pool of six per sample) were diced on an ice cold metal plate and thenplaced in 12 mL of mitochondria isolation buffer (MIB; 0.32 M sucrose, 10 mM Tris–HCl,and 1 mM EDTA-K, pH 7.4). The pooled cerebral cortexes were homogenized using aPotter Elvehjem homogenizer with a Teflon coated pestle attached to a hand-held drill(Wheaton, Millville, NJ, USA). Samples were homogenized using 15 up- and downstrokesat 500 rpm. The homogenate was centrifuged at 1000 g for 5 min. The supernatant wascollected and the pellet was washed twice by centrifugation at 1000 g for 5 min, collectingthe supernatants each time. The supernatants were pooled and centrifuged at 1000 g for 5min. The collected supernatant was then spun at 14 000 g for 15 min. The supernatant wasdiscarded and the pellet, which contained primarily NS mitochondria, synaptosomes, andmyelin, was resuspended in 12 mL MIB and was layered on a 7.5/12% discontinuous Ficollgradient. Each Ficoll gradient layer contained 12 mL for a total volume of 36 mL. The Ficollgradients were made from a 20% Ficoll stock with MIB. The gradient was centrifuged at 73000 g for 36 min (4°C) in a Sorvall SW 28 rotor with slow acceleration and deceleration(Optima L-90K Ultracentrifuge, Beckman Coulter, Fullerton, CA, USA). The centrifugationtime used permitted sufficient acceleration and deceleration to achieve maximum g force(Battino et al. 1991) and to prevent synaptosomal contamination of the mitochondrialfraction below the 12% Ficoll layer. Crude myelin collected at the MIB/7.5% Ficollinterface was discarded. Synaptosomes were collected at the 7.5/12% interface and wereresuspended in MIB and centrifuged at 16 000 g for 15 min. The Ficoll gradient purified NSmitochondria (FM) were collected as a pellet below 12% Ficoll.
Purification of non-synaptic mitochondria—The FM pellet, containing NSmitochondria, was resuspended in MIB containing 0.5 mg/mL bovine serum albumin (BSA)and was centrifuged at 12 000 g for 15 min. The resulting pellet was collected andresuspended in 6 mL of MIB. The resuspended FM pellet was layered on a discontinuoussucrose gradient containing 0.8/1.0/1.3/1.6 M sucrose. The volumes for the sucrose gradientwere 6/6/10/8 mL, respectively. The gradients were made from a 1.6 M sucrose stockcontaining 1 mM EDTA-K and 10 mM Tris–HCl, pH 7.4. The discontinuous sucrosegradient was centrifuged at 50 000 g for 2 h (4°C) in a Sorvall SW 28 rotor using slowacceleration and deceleration to prevent disruption of the gradient. Purified NS mitochondriawere collected at the interface of 1.3 and 1.6 M sucrose. NS mitochondria were collectedand resuspended in (1 : 3, v/v) Tris-EDTA buffer (1 mM EDTA-K and 10 mM Tris–HCl,pH 7.4) containing 0.5 mg/mL BSA and centrifuged at 18 000 g for 15 min. The pellet wasthen resuspended in MIB and centrifuged at 12 000 g for 10 min. The pellet was againresuspended in MIB and centrifuged at 8200 g for 10 min.
Purification of synaptic mitochondria—Synaptosomes were burst by homogenizationin 6 mM Tris–HCl, pH 8.1, using five up- and downstrokes. The homogenized
Kiebish et al. Page 3
J Neurochem. Author manuscript; available in PMC 2011 May 30.
NIH
-PA Author Manuscript
NIH
-PA Author Manuscript
NIH
-PA Author Manuscript
synaptosomes were transferred to a 15 mL conical tube and then placed on a rocker for 1 h(4°C). The burst synaptosomes were centrifuged at 10 000 g for 10 min. The pellet wasresuspended in 6 mL of MIB. The resuspended pellet was layered on a discontinuoussucrose gradient and centrifuged following the same procedure as described above for NSmitochondria.
Western blot analysis of subcellular fractionsProtein concentration of isolated subcellular fractions was determined by the Dc ProteinAssay using BSA standards (Bio-Rad, Hercules, CA, USA). Total protein (2–20 μg) fromfractions were loaded on 4–12% NuPage Bis–Tris gradient gels using MES sodium dodecylsulfate running buffer (Invitrogen, Carlsbad, CA, USA) and electrophoresed. Proteins weretransferred to an immobilon TM-P membrane (Millipore, Bedford, MA, USA) for 2 h at 80V at 4°C. The TM-P membrane was then washed with Tris- or phosphate-buffered saline(PBS), depending on manufacturers’ instructions for primary antibody and then blocked in5% non-fat powdered milk in Tris-buffered saline or PBS with Tween 20, pH 7.6, for 1 h orovernight. Primary antibodies were used at the dilutions suggested by the manufacturers’protocols and included Complex IV, subunit IV (1 : 1250) (clone 20E8; Molecular Probes,Eugene, OR, USA), monoamine oxidase-A (1 : 200) (clone T-19; Santa CruzBiotechnology, Santa Cruz, CA, USA), SNAP25 (1 : 10 000) (clone, SMI 81; Sternbergermonoclonal, Lutherville, MD, USA), β-actin (1 : 7000) (AC-15; Abcam, Cambridge, UK),tuberin (1 : 400) (clone C-20; Santa Cruz Biotechnology), proliferating cell nuclear antigen(1 : 100) (clone PC10; Dako, Carpinteria, CA, USA), calnexin (1 : 500) (clone C8.B6; CellSignaling, Beverly, MA, USA), and proteolipid protein (1 : 200) (clone AA3). Also, proteinsrepresentative of individual ETC Complexes (I–V) were evaluated using the Rodent TotalOXPHOS Complexes Detection Kit (1 : 500) (MS604; Mitosciences, Eugene, OR, USA).The kit consisted of antibodies to Complex I (ND6), Complex II (FeS 30 kDa), Complex III(Core 2 subunit), Complex IV (subunit I), and Complex V (α subunit). Blots were incubatedwith corresponding secondary antibody conjugated with horseradish peroxidase. Bands werevisualized using the Pierce chemiluminescence detection system (Pierce, Rockford, IL,USA). Band densities were quantified using a densitometer (Molecular Dynamics,Sunnyvale, CA, USA) and IQ Mac software (version 1.2, GE Healthcare, Piscataway, NJ,USA). Protein was loaded in incremental amounts to confirm that the signal detected wasnot saturated.
Ganglioside GM1a analysis using cholera toxin b immunostainingGangliosides were isolated and purified from subcellular fractions as we previouslydescribed (Hauser et al. 2004). The ganglioside fraction was desalted by LH-20 Sephadexcolumn chromatography (Varian, Harbor City, CA, USA). Purified gangliosides werespotted on a plastic backed Nagel PolyGram Sil G TLC plate (Macherey-Nagel, Germany)based on 100 μg protein, as previously described (Hirabayashi et al. 1990). Immunostainingfor GM1a was performed as previously described (Brigande et al. 1998). Approximately 1.6ng of purified GM1a was spotted as a standard. The concentration of GM1a standard usedwas calculated based its level of immunoreactivity with cholera toxin b. The TLC plate wasdeveloped in one ascending run for 45 min in CHCl3/CH3OH/0.2% CaCl2 (55 : 45 : 10).The plate was thoroughly dried after development and was then blocked in PBS containing1% BSA for 2 h at 37°C on a rocker. The plate was then washed with PBS for 5 min. Next,the plate was incubated with the β-subunit of cholera toxin/peroxidase conjugated (1 μg/mL)(List Biological Laboratories Inc., Campbell, CA, USA) in PBS containing 1% BSA for 2 hat 37°C. Post-incubation, the plate was washed five times (5 min each time) with PBS andwas then developed using 10 mL PBS, 2 mL 4-chloro-1-napthol (3 mg/mL in CH3OH), and20 μL 30% H2O2 at 22°C for 15 min.
Kiebish et al. Page 4
J Neurochem. Author manuscript; available in PMC 2011 May 30.
NIH
-PA Author Manuscript
NIH
-PA Author Manuscript
NIH
-PA Author Manuscript

Materials for mass spectrometrySynthetic phospholipids including 1,2-dimyristoleoyl-sn-glycero-3-phosphocholine(14:1-14:1 PtdCho), 1,2-dipalmitoleoyl-sn-glycero-3-phosphoethanolamine (16:1-16:1PtdEtn), 1,2-dipentadecanoyl-sn-glycero-3-phosphoglycerol (15:0-15:0 PtdGro), 1,2-dimyristoyl-sn-glycero-3-phosphoserine (14:0-14:0 phosphatidylserine; PtdSer), N-laurorylsphingomyelin (N12:0 CerPCho), 1,1′,2,2′-tetramyristoyl cardiolipin (T14:0 Ptd2Gro),heptadecanoyl ceramide (N17:0 Cer), and 1-heptadecanoyl-2-hydroxy-sn-glycero-3-phosphocholine (17:0 LysoPtdCho) were purchased from Avanti Polar Lipids Inc.(Alabaster, AL, USA). It should be noted that the prefix ‘N’ denotes the amide-linked acylchain. Deuterated cholesterol was purchased from Cambridge Isotope Laboratories Inc.(Cambridge, MA, USA). All the solvents were obtained from Burdick and Jackson(Honeywell International Inc., Burdick and Jackson, Muskegon, MI, USA). All otherchemicals were purchased from Sigma-Aldrich (St Louis, MO, USA).
Sample preparation for mass spectrometric analysisAn aliquot of the mitochondrial preparation was transferred to a disposable cultureborosilicate glass tube (16 × 100 mm). Internal standards were added based on proteinconcentration and included 16:1-16:1 PtdEtn (100 nmol/mg protein), 14:1-14:1 PtdCho (45nmol/mg protein), T14:0 Ptd2Gro (3 nmol/mg protein), 15:0-15:0 PtdGro (7.5 nmol/mgprotein), 14:0-14:0 PtdSer (20 nmol/mg protein), 17:0 LysoPtdCho (1.5 nmol/mg protein),N12:0 CerPCho (20 nmol/mg protein), and N17:0 Cer (5 nmol/mg protein). This allowed thefinal quantified lipid content to be normalized to the protein content and eliminated potentialloss from the incomplete recovery. The molecular species of internal standards were selectedbecause they represent < 0.1% of the endogenous cellular lipid mass as demonstrated byESI/MS lipid analysis.
A modified Bligh and Dyer procedure was used to extract lipids from each mitochondrialpreparation as previously described (Cheng et al. 2006). Each lipid extract was reconstitutedwith a volume of 500 μL/mg protein (which was based on the original protein content of thesamples as determined from protein measurement) in CHCl3/MeOH (1 : 1, v/v). The lipidextracts were flushed with nitrogen, capped, and stored at −20°C for ESI/MS analysis. Eachlipid solution was diluted approximately 50-fold immediately prior to infusion and lipidanalysis.
Instrumentation and mass spectrometryA triple-quadrupole mass spectrometer (Thermo Scientific TSQ Quantum Ultra, Plus, SanJose, CA, USA), equipped with an electrospray ion source and Xcalibur system software,was utilized as previously described (Han et al. 2004). The first and third quadrupoles serveas independent mass analyzers using a mass resolution setting of peak width 0.7 Th whilethe second quadrupole serves as a collision cell for tandem MS. The diluted lipid extract wasdirectly infused into the ESI source at a flow rate of 4 μL/min with a syringe pump.Typically, a 2-min period of signal averaging in the profile mode was employed for eachmass spectrum. For tandem MS, a collision gas pressure was set at 1.0 mTorr, but thecollision energy varied with the classes of lipids as described previously (Han et al. 2004;Han and Gross 2005b). Typically, a 2- to 5-min period of signal averaging in the profilemode was employed for each tandem MS spectrum. All the mass spectra and tandem MSspectra were automatically acquired by a customized sequence subroutine operated underXcalibur software. Data processing of 2D MS analyses including ion peak selection, datatransferring, peak intensity comparison, and quantitation was conducted using self-programmed MicroSoft Excel macros (Han et al. 2004).
Kiebish et al. Page 5
J Neurochem. Author manuscript; available in PMC 2011 May 30.
NIH
-PA Author Manuscript
NIH
-PA Author Manuscript
NIH
-PA Author Manuscript

Mathematical computation for predicting the distribution of cardiolipin molecular speciesA PERL script was developed for predicting the distribution of molecular species in mousebrain Ptd2Gro. This program calculated the expected concentration F × c1 × c2 × c3 × c4 foreach Ptd2Gro species, given the concentration of each fatty acid found in Ptd2Gro; crepresents a given concentration of fatty acids in any one of the four possible fatty acid tailsof Ptd2Gro. F was calculated for each possible Ptd2Gro molecular species using anenumerative approach, with trivial computation time.
Isolation and quantification of coenzyme QAliquots of NS and Syn mitochondria were subjected to lipid extraction and analyzed for Qcontent as previously described (Jonassen et al. 2002). Q6 was used to gauge coenzyme Qrecovery in the lipid extracts and was added to all standards and samples. Lipids wereextracted by adding 0.05 mL water, 0.9 mL methanol, and 0.6 mL petroleum ether to eachsample. The mixtures were vortexed for 1 min, centrifuged at 1422 g, and the top layer ofpetroleum ether was removed from each mixture and saved in a separate vial. Freshpetroleum ether (0.6 mL) was added to each vial containing the aqueous phase and vortexedfor 1 min. The vials were subjected to centrifugation as before and the second petroleumether layer removed. The process was repeated once more, and the three pooled petroleumether fractions were dried under nitrogen and resuspended in 150 μL methanol. The Q6 andQ10 standards were from Sigma-Aldrich, and Q9 was a gift from Dr Youssef Hatefi.
The coenzyme Q present in extracted standards and samples were separated and quantifiedby HPLC connected to an electrochemical detector as previously described (Jonassen et al.2002), with the following exceptions: the pre-column electrode was the only electrode usedand was set at +650 mV to oxidize all coenzyme Q, and a Gilson 118 UV/Vis detector(Gilson, Middletown, WI, USA) was utilized to detect coenzyme Q as they eluted from thecolumn. The amounts of Q9 and Q10 in the standards and samples were normalized to theamount of Q6 recovered in the individual lipid extracts.
Electron transport chain enzyme activitiesPurified mitochondrial samples were freeze-thawed three times before use in enzymeanalysis to give substrate access to the inner mitochondrial membrane. All assays wereperformed on a temperature controlled SpectraMax M5 plate reader (Molecular Devices,Palo Alto, CA, USA) and were performed in triplicate. Specific enzyme activities werecalculated using ETC complex inhibitors to subtract background activities.
Complex I—Complex I (NADH-ubiquinone oxidoreductase) activity was determined bymeasuring the decrease in the concentration of NADH at 340 nm as previously described(Birch-Machin and Turnbull 2001; Ellis et al. 2005). The assay was performed in buffercontaining 50 mM potassium phosphate, pH 7.4, 2 mM KCN, 5 mM MgCl2, 2.5 mg/mLBSA, 2 μM antimycin, 100 μM decylubiquinone, and 0.3 mM K2NADH. The reaction wasinitiated by adding purified mitochondria (20 μg). The enzyme activity was measured for 5min and values were recorded 30 s after the initiation of the reaction. Specific activities weredetermined by calculating the slope of the reaction in the linear range in the presence orabsence of 1 μM rotenone (Complex I inhibitor).
Complex II—Complex II (succinate decylubiquinone 2,6-dichloroindophenol (DCIP)oxidoreductase) activity was determined by measuring the reduction of DCIP at 600 nm aspreviously described (King 1967; Ellis et al. 2005). The Complex II assay was performed inbuffer containing 25 mM potassium phosphate, pH 7.4, 20 mM succinate, 2 mM KCN, 50μM DCIP, 2 μg/mL rotenone, and 2 μg/mL antimycin. Purified mitochondria (10 μg) wereadded prior to initiation of the reaction. The reaction was initiated by adding 56 μM
Kiebish et al. Page 6
J Neurochem. Author manuscript; available in PMC 2011 May 30.
NIH
-PA Author Manuscript
NIH
-PA Author Manuscript
NIH
-PA Author Manuscript

decylubiquinone. Specific activities were determined by calculating the slope of the reactionin the linear range in the presence or absence of 0.5 mM thenoyltrifluoroacetone (ComplexII inhibitor).
Complex III—Complex III (ubiquinol-cytochrome c reductase) activity was determined bymeasuring the reduction of cytochrome c at 550 nm. The Complex III assay was performedin buffer containing (25 mM potassium phosphate, pH 7.4, 1 mM EDTA, 1 mM KCN, 0.6mM dodecyl maltoside, and 32 μM oxidized cytochome c) using purified mitochondria (2.5μg). The reaction was initiated by adding 35 μM decylubiquinol. The reaction was measuredfollowing the linear slope for 1 min in the presence or absence of 2 μM antimycin (ComplexIII inhibitor). Decylubiquinol was made by dissolving decylubiquinone (10 mg) in 2 mLacidified ethanol, pH 2, and using sodium dithionite as a reducing agent. Decylubiquinolwas further purified by cyclohexane (Birch-Machin and Turnbull 2001; Degli Esposti 2001;Ellis et al. 2005).
Complex IV—Complex IV (cytochrome c oxidase) activity was determined by measuringthe oxidation of ferrocytochrome c at 550 nm. The Complex IV assay was performed inbuffer containing (10 mM Tris–HCl and 120 mM KCl, pH 7.0) using purified mitochondria(5 μg). The reaction was initiated by adding 11 μM reduced ferrocytochrome c andmonitoring the slope for 30 s in the presence or absence of 2.2 mM KCN (Complex IVinhibitor) (Yonetan 1967; Ellis et al. 2005). Cytochrome c oxidase was additionallymeasured by a multiplexing assay (MS446; Mitosciences).
Complex I/III—Complex I/III (NADH cytochrome c reductase) activity was determined bymeasuring the reduction of cytochrome c at 550 nm. The Complex I/III assay was performedin buffer (50 mM potassium phosphate, pH 7.4, 1 mM EDTA, 2 mM KCN, 32 μM oxidizedcytochrome c, and 105 μM K2NADH) and was initiated by adding purified mitochondria(10 μg). The reaction was measured for 30 s with a linear slope in the presence or absence of1 μM rotenone and 2 μM antimycin (Complexes I and III inhibitors) (Birch-Machin andTurnbull 2001; Degli Esposti 2001; Ellis et al. 2005).
Complex II/III—Complex II/III (succinate cytochrome c reductase) activity was measuredfollowing the reduction of cytochrome c at 550 nm. The Complex II/III assay was performedin buffer (25 mM potassium phosphate, pH 7.4, 20 mM succinate, 2 mM KCN, 2 μg/mLrotenone) using purified mitochondria (10 μg). The reaction was initiated by adding 40 μMoxidized cytochrome c in the presence or absence of 2 μM antimycin (Complex III inhibitor)(Birch-Machin and Turnbull 2001; Ellis et al. 2005).
ResultsAnalysis of mitochondrial purity
Ficoll as well as sucrose discontinuous gradients were used to purify NS and Synmitochondria (Fig. 1). As FM contained markers for cytoskeletal (β-actin) and membrane(SNAP25, PCNA, tuberin, PLP, and calnexin) contamination, we further purifiedmitochondria using a discontinuous sucrose gradient. None of these markers were present inthe Ficoll and sucrose discontinuous gradient purified mitochondria, which contained onlymitochondrial-enriched markers representing the inner mitochondrial membrane (ComplexIV, subunit IV) and the outer mitochondrial membrane (monoamine oxidase-A) (Fig. 2a).Cholera toxin b immunostaining is a sensitive procedure for detecting gangliosides with theGM1a structure in cells and tissues (Brigande et al. 1998). The toxin can have slight cross-reactivity with GD1a. GM1a and a low amount of GD1a was found in the total homogenate,crude myelin, and FM fractions, indicating the presence of myelin and microsomal
Kiebish et al. Page 7
J Neurochem. Author manuscript; available in PMC 2011 May 30.
NIH
-PA Author Manuscript
NIH
-PA Author Manuscript
NIH
-PA Author Manuscript

membranes in these subcellular fractions (Fig. 2b). Only a trace amount of GM1a wasdetected in the NS mitochondria and no GM1a was detected in Syn mitochondria. Thesefinding attest to the high degree of mitochondrial purity achieved with the isolationprocedure and also indicate that GM1a is not present in B6 mouse brain mitochondria.
Lipid composition of C57BL/6J mouse brain mitochondriaWe used shotgun lipidomics to evaluate lipid content and distribution of fatty acid molecularspecies in the NS and Syn mitochondria. The lipid classes were listed according to theirrelative abundance (Table 1). Although the content of most lipids was similar in the NS andSyn mitochondria, the content of Ptd2Gro was lower whereas the content of PtdSer and Cerwere higher in the Syn mitochondria than in the NS mitochondria. The myelin-enrichedlipids, sulfatides and cerebrosides, were not detected in either NS or Syn mitochondria.
The distribution of fatty acid molecular species within each major lipid of the NS and theSyn mitochondria is shown in Figs 3 and 4 and in supplementary Tables S1–S9. Theindividual phospholipids were arranged according to the number of molecular species withphosphatidylinositol having the fewest and Ptd2Gro having the greatest number.Phosphatidylinositol contained predominantly 18:0-20:4, with lower amounts of 16:0-20:4(Fig. 3a and Table S4). CerPCho contained predominantly N20:0 and N18:0 (Fig. 3b andTable S6). PtdSer contained predominantly 18:0-22:6 (Fig. 3c and Table S7). PtdGrocontained predominantly 16:0-18:1 (Fig. 3d and Table S5). LysoPtdCho consisted of a rangeof fatty acids, but predominantly 16:0, 18:1, 18:0, and 22:6 (Fig. 3e and Table S8). ChoGplcontained predominantly D16:0-18:1, D18:2-18:2/D16:0-20:4, D16:0-22:6/D18:2-20:4,D18:2-20:2/D18:0-20:4, D16:0-16:0, and A16:0-20:0 (Fig. 3f and Table S2). EtnGplcontained predominantly D18:0-20:4/D16:0-22:4 and D18:0-22:6/D18:1-22:5 (Fig. 3g andTable S1). Cer consisted primarily of N18:0 (Table S9).
Cardiolipin composition in non-synaptic and synaptic mitochondriaDespite a lower amount of Ptd2Gro in the Syn than in the NS mitochondria, the molepercentage of Ptd2Gro molecular species was remarkably similar for NS and Synmitochondria (Fig. 4 and Table S3). Both NS and Syn mitochondria contained Ptd2Grospecies enriched in 18:1, 20:4, 22:6, 18:2, and 16:1 fatty acids (Table S3). The predominantmolecular species of Ptd2Gro were 18:1-18:1-18:1-18:1, 20:4-18:1-18:1-18:1,20:4-20:4-18:1-18:1, 22:6-20:4-18:1-18:1, 22:6-18:1-18:1-18:1/20:4-20:3-18:1-18:1, and20:4-18:2-18:1-18:1/22:6-18: 1-18:1-16:0 (Fig. 4). A unique pattern was discoveredcomparing mole percentage based on the mass to charge ratios. The unique pattern consistedof seven major molecular species groups, with group I having the shortest chains and theleast unsaturation, and group VII having the longest chains and the greatest unsaturation.
Mathematical model for the distribution of mouse brain cardiolipin molecular speciesWe hypothesized that the unique distribution of Ptd2Gro molecular species detected withshotgun lipidomics could be explained by a mathematical model in which Ptd2Gro fattyacids are at equilibrium with respect to the available quantities of each fatty acid chain. Inother words, we expected that the concentration c of a given species of Ptd2Gro (specifiedby its four fatty acids) would be proportional to the product of the concentrations of its fourfatty acids (c1 × c2 × c3 × c4). As there are multiple permutations in which fatty acids can bearranged in the four Ptd2Gro fatty acid positions, c should also be proportional to acombinatorial pre-factor F. For example, if there are four distinct fatty acids attached to thePtd2Gro, there are F = 4! = 24 possible permutations in which these fatty acids can bearranged. However, if the four fatty acids are identical, there is only one way to arrangethem, i.e. F = 1. The F × c1 × c2 × c3 × c4 data were summed in groups of Ptd2Gro specieswith identical numbers of carbons and double bonds. This grouping allows the predictions of
Kiebish et al. Page 8
J Neurochem. Author manuscript; available in PMC 2011 May 30.
NIH
-PA Author Manuscript
NIH
-PA Author Manuscript
NIH
-PA Author Manuscript

the model to be compared directly with the observed data from shotgun lipidomic analysis.Our results show that the distribution of Ptd2Gro fatty acid molecular species predicted bythe mathematical model fell into seven major groups that corresponded closely with dataobtained from shotgun lipidomic analysis (Fig. 5). Data were condensed from about 1800possible Ptd2Gro molecular species to 54 species that represented greater than 99% of thetotal Ptd2Gro species. Subtle differences between the theoretical and observed distributionof Ptd2Gro molecular species, as demonstrated in the molecular species between 72:7 and72:4, could be the result of a slight difference in the rate of Ptd2Gro synthesis or remodeling.Our analysis showed that the unique pattern of Ptd2Gro molecular species could arise from asimple process of random fatty acid incorporation.
Coenzyme Q content in non-synaptic and synaptic mitochondriaCoenzyme Q content was measured as this is a lipid constituent and involved inmitochondrial ETC activities (Lenaz 2001). The relative amounts of Q9 and Q10 wereapproximately 24% lower in the Syn mitochondria than in the NS mitochondria. The Q9 :Q10 ratio was about 3 : 1 in both the NS and Syn mitochondria (Fig. 6).
Electron transport chain activities of brain mitochondrial complexesElectron transport chain activities have been used to characterize the metabolic properties ofNS and Syn mitochondrial populations (Lai and Clark 1976; Lai et al. 1977; Gorini et al.1989; Hevner and Wong-Riley 1989; Villa et al. 1989a; Battino et al. 1991). We examinedthe activities of the individual ETC complexes (Complexes I, II, III, and IV) as well as thoseof the linked enzyme complexes (Complexes I/III and II/III) (Table 2). The activities ofComplexes I, II, III, and II/III were 55%, 53%, 63%, and 69%, respectively, in Synmitochondria than those observed in NS mitochondria (Table 2). The activities ofComplexes IV and I/III were similar in the NS and the Syn mitochondria. To determinewhether differences in ETC enzyme activities might be associated with differences inprotein content of complexes, we evaluated protein markers representative for ETCcomplexes using the Rodent OXPHOS Complexes Detection Kit. No differences were foundfor the expression of ETC protein markers for each of the complexes (Fig. 7). These dataindicate that the differences found between the NS and Syn mitochondria for ETC enzymeactivities were not observed for the content of individual ETC protein markers.
DiscussionThe objective of this study was to characterize the lipidome and ETC activities in highlypurified populations of NS and Syn mitochondria from B6 mice. Information on the lipidcomposition of NS and Syn mitochondria can provide insight into the metaboliccompartmentation in brain (Sonnewald et al. 2004). However, subcellular contamination ortechnical limitations have hindered past attempts to accurately characterize the lipidome ofbrain mitochondria (Villa et al. 1989b; Ruggiero et al. 1992; Bangur et al. 1995). This hasbeen due in large part to contamination from myelin, a lipidrich membrane that is difficult toseparate from mitochondria (Seminario et al. 1964; Villa et al. 1989b). The failure toremove contaminating membranes or differences in experimental procedures could accountfor the variability in brain mitochondrial lipid composition found in previous studies(Ruggiero et al. 1992; Bangur et al. 1995). We used multiple discontinuous gradients toobtain highly enriched brain mitochondrial populations free from detectable contaminationincluding that from myelin and cytoskeletal proteins. As the primary goal of thisinvestigation was to isolate highly enriched NS and Syn mitochondria free from anydetectable level of contamination, the length as well as choice of discontinuous gradientsemployed was designed solely for the purpose of mitochondrial lipid analysis as well asassessment of ETC enzyme activities by standard biochemical procedures. GM1a content of
Kiebish et al. Page 9
J Neurochem. Author manuscript; available in PMC 2011 May 30.
NIH
-PA Author Manuscript
NIH
-PA Author Manuscript
NIH
-PA Author Manuscript
the isolated fractions was also evaluated as an independent marker for membranecontamination, as GM1a is enriched in myelin (Seyfried et al. 1979). Our data show that theganglioside GM1a, sulfatides, cerebrosides, and cytoskeletal proteins do not exist in neuralcell mitochondria. We suggest that the presence of glycosphingolipids in brain mitochondriawould indicate contamination from non-mitochondrial subcellular membranes or aphysiological environment different from that which exists normally in mouse cerebralcortex.
We used mouse cerebral cortex in this study as previous studies in rats showed that therelative differences between NS and Syn mitochondria for ETC enzyme activities andcoenzyme Q content are generally similar across brain regions (Leong et al. 1984; Battino etal. 1991, 1995). It is therefore likely that our findings for mitochondrial lipids and ETCactivities in the cerebral cortex would be similar for other brain regions. We chose toexamine B6 mice because many existing neurological mutations that alter CNS function andbehavior are expressed on this genetic background (Bedell et al. 1997a,b). Consequently,our study will provide useful information on brain mitochondrial function to a broad rangeof neurological and neurodegenerative diseases expressed in B6 mice.
Membrane lipids can influence the activity of mitochondrial enzymes to include those of theETC (Daum 1985; Di Paola et al. 2000; Chicco and Sparagna 2007). We found that thelevels of Ptd2Gro, coenzyme Q9, and Q10 were lower and the levels of Cer and PtdSer werehigher in the Syn mitochondria than in the NS mitochondria. Additionally, we found that theETC activities of Complexes I, II, III, and II/III were lower in the Syn mitochondria than inthe NS mitochondria. As enzyme activities from individual (unlinked) complexes(Complexes I, II, and III) could include activities of the combined (linked) measurements(Complexes I/III and II/III), it is possible that these differences arise from the ETC existingin two states, a random collisions state or a solid electron channeling state (Lenaz andGenova 2007). Linked ETC activities can represent the combined activity of individualcomplexes or the activity of the supercomplex (Schagger and Pfeiffer 2000). Recently, itwas shown that the Complex I/III linked activity in the α-synuclein knockout mouse brainwas lower than that of normal mouse brain without corresponding changes in either theComplexes I or III individual ETC activities (Ellis et al. 2005). This suggests that the linkedactivity corresponded to the measurement of the ETC complexes in the supercomplex state.Hence, differences in individual ETC activities may not always correspond to differences inlinked ETC activities.
No differences were found between NS and Syn mitochondria for the content of majorprotein markers for the individual ETC complexes. This suggests that other factors, such asdifferences in lipid content, may account the differences found between NS and Synmitochondria for linked ETC activities. As Ptd2Gro is required for the enzymatic activitiesof Complexes I and III (Fry and Green 1981; Gohil et al. 2004; Chicco and Sparagna 2007),a lower Ptd2Gro content in Syn than in NS mitochondria could account for the loweractivities of Complexes I and III in Syn mitochondria. We suggest that the differences foundin ETC complex activities between the NS and Syn mitochondria might be due in part toquantitative differences in their lipid composition, which could differentially affect unlinkedor linked enzyme activities.
It is interesting that Ptd2Gro content is lower, while PtdSer content is higher in Syn than NSmitochondria. These lipid differences might be related to the greater susceptibility of Synmitochondria to calcium overload and permeability transition than non-synapticmitochondria (Brown et al. 2006; Naga et al. 2007). Although Ptd2Gro and PtdSer are bothanionic lipids that can buffer calcium, PtdSer is less prone than Ptd2Gro to calcium-inducedperoxidation, which would occur during intense Syn activity (Grijalba et al. 1999; Brown et
Kiebish et al. Page 10
J Neurochem. Author manuscript; available in PMC 2011 May 30.
NIH
-PA Author Manuscript
NIH
-PA Author Manuscript
NIH
-PA Author Manuscript

al. 2006). Differences in Ptd2Gro content between Syn and NS mitochondria might alsoinfluence susceptibility to apoptosis, cytochrome c retention, or lipid peroxidation (Kagan etal. 2004). We do not exclude the possibility that the difference between NS and Synmitochondria for PtdSer content is related to differences in lipid synthesis, transport proteinactivity, or cellular heterogeneity related to Syn activity (Zborowski et al. 1983; Daum andVance 1997).
Plasmalogen glycerophospholipids contain a vinyl-ether linkage in the sn-1 position and canfunction as antioxidants and facilitators of membrane fusion (Gross 1984; Zoeller et al.1988; Farooqui and Horrocks 2001). The ESI/MS procedures we used can easily measurethe content and composition of plasmalogens (Han et al. 2001; Han and Gross 2005a). Onlybrain and heart mitochondria contain significant quantities of choline and ethanolamineplasmalogen glycerophospholipids suggesting a unique role for plasmalogens in thesetissues (Eichberg et al. 1964; Getz et al. 1968). We found that the content ofplasmenylethanolamine and plasmenylcholine was similar in the NS and the Synmitochondria. Hence, the role of plasmalogens is likely similar in the NS and Synmitochondria. This role could involve management of free radicals or regulation of uniquefusogenic properties of brain mitochondrial membranes.
Almost 100 molecular species of Ptd2Gro were detected in the NS and Syn mitochondria ofB6 mice. Moreover, these molecular species formed a unique pattern consisting of sevenmajor groups when arranged according to mass to charge ratios. Interestingly, this Ptd2Gropattern in brain was also observed in human, rat, and rabbit, suggesting conservation acrosssome mammalian species (Cheng et al., unpublished observation). Molecular speciesheterogeneity was greater in the most abundant groups (groups II–VI) than in the leastabundant groups (groups I and VII). This Ptd2Gro species pattern in brain differs markedlyfrom those found previously in non-neural tissues, which contain predominantly tetralinoleicPtd2Gro (18:2-18:2-18:2-18:2) (Schlame et al. 2005). Surprisingly, no tetralinoleic Ptd2Growas found in brain mitochondria. Hence, Ptd2Gro composition from brain differs markedlyfrom the Ptd2Gro composition found in non-neural tissues.
We suggest that the unique brain Ptd2Gro pattern arises from the remodeling activities ofphospholipases and acyl transferases, which remove and transfer, respectively, fatty acidspecies from the sn-2 position of the ChoGpl and EtnGpl to form mature Ptd2Gro fromMLCL. This suggestion comes from finding an abundance of fatty acids in mature Ptd2Grothat match those expressed in the predicted sn-2 position of ChoGpl and EtnGpl. Ourfindings also indicate that only a small percentage of mature Ptd2Gro contains fatty acidsoriginating from the condensation of PtdGro and CDP-diacylglycerol, which containpredominantly shorter chain fatty acids.
The mechanism by which the acyl transferases select the sn-2 fatty acids from either ChoGplor EtnGpl remains unclear. Taffazin is the only known Ptd2Gro acyltransferase (AT) that ishighly expressed in brain (Bione et al. 1993; Ma et al. 1999; Lu et al. 2004). Althoughtaffazin may have specificity for linoleic acid in non-neural tissues (Xu et al. 2003), linoleicacid is a minor fatty acid in mature Ptd2Gro of brain. Our findings together with those ofother groups indicate that brain Ptd2Gro contains predominantly oleic, arachidonic, anddocosahexaenoic fatty acids (Yamaoka et al. 1988; Nakahara et al. 1992; Bayir et al. 2007).Although other enzymes have been implicated in Ptd2Gro remodeling to include scramblase3, acyl-CoA:lysocardiolipin AT, MLCL AT, and acylglycerol-3-phosphate ATs, the ATsinvolved in the complex remodeling of brain Ptd2Gro have yet to be determined (Hauff andHatch 2006). Nevertheless, our mathematical model indicates that the unique Ptd2Gropattern for normal brain can arise from a random incorporation of selected fatty acids duringthe Ptd2Gro remodeling process.
Kiebish et al. Page 11
J Neurochem. Author manuscript; available in PMC 2011 May 30.
NIH
-PA Author Manuscript
NIH
-PA Author Manuscript
NIH
-PA Author Manuscript
The functional significance of the unique brain Ptd2Gro molecular species pattern remainsunclear. A greater ratio of PUFA to saturated fatty acids could cause Ptd2Gro to be moreprone to form a non-bilayer HII hexagonal phase lipid (Sankaram et al. 1989; Kraffe et al.2002). This conformational change can create regions of small curvature within themembrane, which could affect cristae structure (Hoch 1992; Stuart et al. 1998). Increaseddocosahexaenoic containing Ptd2Gro results in decreased Complex IV activity, but increasesF1 ATPase activities (Yamaoka et al. 1988). This might explain the lower Complex IVactivities that we found in the NS and Syn mitochondria relative to those found in non-neural tissues (Benard et al. 2006). Long-chain PUFA Ptd2Gro species could also enhancemembrane phase transformations thus allowing optimal activity of oxidativephosphorylation in response to environmental changes (Kraffe et al. 2002). The prevalenceof oleic fatty acids in Ptd2Gro could also enhance mitochondrial respiratory chain ratios anddegree of coupling (Brand et al. 2003). The unique Ptd2Gro species pattern of brain mightalso be interesting with regard to the ‘respirasome’ formation, as Ptd2Gro can ‘glue’ thecomplexes together in an organized supercomplex to increase efficiency of ATP production(Zhang et al. 2002; Pfeiffer et al. 2003). Further studies are needed to resolve the role of theunique pattern of Ptd2Gro molecular species in brain mitochondrial function.
Alterations in brain energy metabolism have been implicated in variety of neurological andneurodegenerative disorders to include Parkinson’s disease, Alzheimer’s disease,Huntington’s disease, epilepsy, brain tumors, storage diseases, bipolar disorder,schizophrenia, and autism to name a few (Bowling and Beal 1995; Lombard 1998; Blass2002; Seyfried and Mukherjee 2005). Abnormalities in NS and Syn mitochondrial lipids, atthe quantitative as well as the molecular species level, may occur in these disorders as eithera cause or an effect of disease pathogenesis. Although differences in lipid content as well asETC activities exist between NS and Syn mitochondria, these differences likely representmetabolic compartmentation in the brain. However, these populations of brain mitochondriamight be affected differently in disease states. We suggest that the integrity of themitochondrial lipidome is critical for efficient ATP production and that alterations in thelipidome will impair oxidative phosphorylation thus compromising normal neurologicalfunction.
Supplementary MaterialRefer to Web version on PubMed Central for supplementary material.
AcknowledgmentsWe would like to thank Susan Bothwell, Christopher Ellis, Mary F. Roberts, Purna Mukherjee, Rena Baek, andJohn Mantis for technical assistance and helpful discussions.We would also like to thank Steven Pfeiffer and Cara-Lynne Schengrund for the gifts of the PLP and SNAP25 antibodies, respectively. This work was supported byGrants from NIH (HD39722), NCI (CA102135), and NIA (AG23168).
ReferencesBangur CS, Howland JL, Katyare SS. Thyroid hormone treatment alters phospholipid composition and
membrane fluidity of rat brain mitochondria. Biochem J. 1995; 305:29–32. [PubMed: 7826343]Battino M, Bertoli E, Formiggini G, Sassi S, Gorini A, Villa RF, Lenaz G. Structural and functional
aspects of the respiratory chain of synaptic and nonsynaptic mitochondria derived from selectedbrain regions. J Bioenerg Biomembr. 1991; 23:345–363. [PubMed: 1646801]
Battino M, Gorini A, Villa RF, Genova ML, Bovina C, Sassi S, Littarru GP, Lenaz G. Coenzyme Qcontent in synaptic and non-synaptic mitochondria from different brain regions in the ageing rat.Mech Ageing Dev. 1995; 78:173–187. [PubMed: 7596200]
Kiebish et al. Page 12
J Neurochem. Author manuscript; available in PMC 2011 May 30.
NIH
-PA Author Manuscript
NIH
-PA Author Manuscript
NIH
-PA Author Manuscript

Bayir H, Tyurin VA, Tyurina YY, et al. Selective early cardiolipin peroxidation after traumatic braininjury: an oxidative lipidomics analysis. Ann Neurol. 2007; 62:154–169. [PubMed: 17685468]
Bedell MA, Jenkins NA, Copeland NG. Mouse models of human disease Part I: techniques andresources for genetic analysis in mice. Genes Dev. 1997a; 11:1–10. [PubMed: 9000047]
Bedell MA, Largaespada DA, Jenkins NA, Copeland NG. Mouse models of human disease Part II:recent progress and future directions. Genes Dev. 1997b; 11:11–43. [PubMed: 9000048]
Benard G, Faustin B, Passerieux E, et al. Physiological diversity of mitochondrial oxidativephosphorylation. Am J Physiol Cell Physiol. 2006; 291:C1172–C1182. [PubMed: 16807301]
Bione S, Tamanini F, Maestrini E, Tribioli C, Poustka A, Torri G, Rivella S, Toniolo D.Transcriptional organization of a 450-kb region of the human X chromosome in Xq28. Proc NatlAcad Sci USA. 1993; 90:10977–10981. [PubMed: 8248200]
Birch-Machin MA, Turnbull DM. Assaying mitochondrial respiratory complex activity inmitochondria isolated from human cells and tissues. Methods Cell Biol. 2001; 65:97–117.[PubMed: 11381612]
Blass JP. Glucose/mitochondria in neurological conditions. Int Rev Neurobiol. 2002; 51:325–376.[PubMed: 12420364]
Bowling AC, Beal MF. Bioenergetic and oxidative stress in neurodegenerative diseases. Life Sci.1995; 56:1151–1171. [PubMed: 7475893]
Brand MD, Turner N, Ocloo A, Else PL, Hulbert AJ. Proton conductance and fatty acyl compositionof liver mitochondria correlates with body mass in birds. Biochem J. 2003; 376:741–748.[PubMed: 12943530]
Brigande JV, Platt FM, Seyfried TN. Inhibition of glycosphingolipid biosynthesis does not impairgrowth or morphogenesis of the postimplantation mouse embryo. J Neurochem. 1998; 70:871–882. [PubMed: 9453585]
Brown MR, Sullivan PG, Geddes JW. Synaptic mitochondria are more susceptible to Ca2+ overloadthan nonsynaptic mitochondria. J Biol Chem. 2006; 281:11658–11668. [PubMed: 16517608]
Cheng H, Guan S, Han X. Abundance of triacylglycerols in ganglia and their depletion in diabeticmice: implications for the role of altered triacylglycerols in diabetic neuropathy. J Neurochem.2006; 97:1288–1300. [PubMed: 16539649]
Chicco AJ, Sparagna GC. Role of cardiolipin alterations in mitochondrial dysfunction and disease. AmJ Physiol Cell Physiol. 2007; 292:C33–C44. [PubMed: 16899548]
Cuzner ML, Davison AN. The lipid composition of rat brain myelin and subcellular fractions duringdevelopment. Biochem J. 1968; 106:29–34. [PubMed: 5721466]
Dagani F, Gorini A, Polgatti M, Villa RF, Benzi G. Synaptic and non-synaptic mitochondria from ratcerebral cortex. Characterization and effect of pharmacological treatment on some enzymeactivities related to energy transduction. Farmaco [Sci]. 1983; 38:584–594.
Daum G. Lipids of mitochondria. Biochim Biophys Acta. 1985; 822:1–42. [PubMed: 2408671]Daum G, Vance JE. Import of lipids into mitochondria. Prog Lipid Res. 1997; 36:103–130. [PubMed:
9624424]Degli Esposti M. Assessing functional integrity of mitochondria in vitro and in vivo. Methods Cell
Biol. 2001; 65:75–96. [PubMed: 11381611]Di Paola M, Cocco T, Lorusso M. Ceramide interaction with the respiratory chain of heart
mitochondria. Biochemistry. 2000; 39:6660–6668. [PubMed: 10828984]Eichberg J, Whittaker VP, Dawson RM. Distribution of lipids in subcellular particles of guinea-pig
brain. Biochem J. 1964; 92:91–100. [PubMed: 5840391]Ellis CE, Murphy EJ, Mitchell DC, Golovko MY, Scaglia F, Barcelo-Coblijn GC, Nussbaum RL.
Mitochondrial lipid abnormality and electron transport chain impairment in mice lacking alpha-synuclein. Mol Cell Biol. 2005; 25:10190–10201. [PubMed: 16260631]
Farooqui AA, Horrocks LA. Plasmalogens: workhorse lipids of membranes in normal and injuredneurons and glia. Neuroscientist. 2001; 7:232–245. [PubMed: 11499402]
Fry M, Green DE. Cardiolipin requirement for electron transfer in complex I and III of themitochondrial respiratory chain. J Biol Chem. 1981; 256:1874–1880. [PubMed: 6257690]
Kiebish et al. Page 13
J Neurochem. Author manuscript; available in PMC 2011 May 30.
NIH
-PA Author Manuscript
NIH
-PA Author Manuscript
NIH
-PA Author Manuscript
Getz GS, Bartley W, Lurie D, Notton BM. The phospholipids of various sheep organs, rat liver and oftheir subcellular fractions. Biochim Biophys Acta. 1968; 152:325–339. [PubMed: 5639262]
Gohil VM, Hayes P, Matsuyama S, Schagger H, Schlame M, Greenberg ML. Cardiolipin biosynthesisand mitochondrial respiratory chain function are interdependent. J Biol Chem. 2004; 279:42612–42618. [PubMed: 15292198]
Gorini A, Arnaboldi R, Ghigini B, Villa RF. Brain cytochrome oxidase activity of synaptic andnonsynaptic mitochondria during aging. Basic Appl Histochem. 1989; 33:139–145. [PubMed:2547357]
Grijalba MT, Vercesi AE, Schreier S. Ca2+-induced increased lipid packing and domain formation insubmitochondrial particles. A possible early step in the mechanism of Ca2+-stimulated generationof reactive oxygen species by the respiratory chain. Biochemistry. 1999; 38:13279–13287.[PubMed: 10529202]
Gross RW. High plasmalogen and arachidonic acid content of canine myocardial sarcolemma: a fastatom bombardment mass spectroscopic and gas chromatography-mass spectroscopiccharacterization. Biochemistry. 1984; 23:158–165. [PubMed: 6419772]
Han X, Gross RW. Shotgun lipidomics: electrospray ionization mass spectrometric analysis andquantitation of cellular lipidomes directly from crude extracts of biological samples. MassSpectrom Rev. 2005a; 24:367–412. [PubMed: 15389848]
Han X, Gross RW. Shotgun lipidomics: multidimensional MS analysis of cellular lipidomes. Exp RevProteomics. 2005b; 2:253–264.
Han X, Holtzman DM, McKeel DW Jr. Plasmalogen deficiency in early Alzheimer’s disease subjectsand in animal models: molecular characterization using electrospray ionization mass spectrometry.J Neurochem. 2001; 77:1168–1180. [PubMed: 11359882]
Han X, Yang J, Cheng H, Ye H, Gross RW. Toward fingerprinting cellular lipidomes directly frombiological samples by two-dimensional electrospray ionization mass spectrometry. Anal Biochem.2004; 330:317–331. [PubMed: 15203339]
Hauff KD, Hatch GM. Cardiolipin metabolism and Barth Syndrome. Prog Lipid Res. 2006; 45:91–101. [PubMed: 16442164]
Hauser EC, Kasperzyk JL, d’Azzo A, Seyfried TN. Inheritance of lysosomal acid beta-galactosidaseactivity and gangliosides in crosses of DBA/2J and knockout mice. Biochem Genet. 2004; 42:241–257. [PubMed: 15487588]
Hevner RF, Wong-Riley MT. Brain cytochrome oxidase: purification, antibody production, andimmunohistochemical/histochemical correlations in the CNS. J Neurosci. 1989; 9:3884–3898.[PubMed: 2555458]
Hirabayashi Y, Hyogo A, Nakao T, Tsuchiya K, Suzuki Y, Matsumoto M, Kon K, Ando S. Isolationand characterization of extremely minor gangliosides, GM1b and GD1 alpha, in adult bovinebrains as developmentally regulated antigens. J Biol Chem. 1990; 265:8144–8151. [PubMed:2186036]
Hoch FL. Cardiolipins and biomembrane function. Biochim Biophys Acta. 1992; 1113:71–133.[PubMed: 1550861]
Jonassen T, Marbois BN, Faull KF, Clarke CF, Larsen PL. Development and fertility inCaenorhabditis elegans clk-1 mutants depend upon transport of dietary coenzyme Q8 tomitochondria. J Biol Chem. 2002; 277:45020–45027. [PubMed: 12324451]
Kagan VE, Borisenko GG, Tyurina YY, Tyurin VA, Jiang J, Potapovich AI, Kini V, Amoscato AA,Fujii Y. Oxidative lipidomics of apoptosis: redox catalytic interactions of cytochrome c withcardiolipin and phosphatidylserine. Free Radic Biol Med. 2004; 37:1963–1985. [PubMed:15544916]
King, TE. Preparation of succinate dehydrogenase and reconstitution of succinate oxidase. In:Estabrook, RW.; Pullman, ME., editors. Methods Enzymol. Academic Press; New York: 1967. p.322-331.
Kraffe E, Soudant P, Marty Y, Kervarec N, Jehan P. Evidence of a tetradocosahexaenoic cardiolipin insome marine bivalves. Lipids. 2002; 37:507–514. [PubMed: 12056594]
Lai JC, Clark JB. Preparation and properties of mitochondria derived from synaptosomes. Biochem J.1976; 154:423–432. [PubMed: 938457]
Kiebish et al. Page 14
J Neurochem. Author manuscript; available in PMC 2011 May 30.
NIH
-PA Author Manuscript
NIH
-PA Author Manuscript
NIH
-PA Author Manuscript

Lai, JCK.; Clark, JB. Isolation and characterization of synaptic and nonsynaptic mitochondria frommammalian brain. In: Boulton, AA.; Baker, GB.; Butterworth, RF., editors. Carbohydrates andEnergy Metabolism. Vol. 11. The Humana Press Inc.; Clifton, NJ: 1989. p. 43-98.
Lai JC, Walsh JM, Dennis SC, Clark JB. Synaptic and non-synaptic mitochondria from rat brain:isolation and characterization. J Neurochem. 1977; 28:625–631. [PubMed: 16086]
Lenaz G. A critical appraisal of the mitochondrial coenzyme Q pool. FEBS Lett. 2001; 509:151–155.[PubMed: 11741580]
Lenaz G, Genova ML. Kinetics of integrated electron transfer in the mitochondrial respiratory chain:random collisions vs. solid state electron channeling. Am J Physiol Cell Physiol. 2007;292:C1221–C1239. [PubMed: 17035300]
Leong SF, Lai JC, Lim L, Clark JB. The activities of some energy-metabolising enzymes innonsynaptic (free) and synaptic mitochondria derived from selected brain regions. J Neurochem.1984; 42:1306–1312. [PubMed: 6707635]
Lombard J. Autism: a mitochondrial disorder? Med Hypotheses. 1998; 50:497–500. [PubMed:9710323]
Lu B, Kelher MR, Lee DP, Lewin TM, Coleman RA, Choy PC, Hatch GM. Complex expressionpattern of the Barth syndrome gene product tafazzin in human cell lines and murine tissues.Biochem Cell Biol. 2004; 82:569–576. [PubMed: 15499385]
Ma BJ, Taylor WA, Dolinsky VW, Hatch GM. Acylation of monolysocardiolipin in rat heart. J LipidRes. 1999; 40:1837–1845. [PubMed: 10508203]
Mena EE, Hoeser CA, Moore BW. An improved method of preparing rat brain synaptic membranes.Elimination of a contaminating membrane containing 2′,3′-cyclic nucleotide 3′-phosphohydrolaseactivity. Brain Res. 1980; 188:207–231. [PubMed: 6245753]
Naga KK, Sullivan PG, Geddes JW. High cyclophilin D content of synaptic mitochondria results inincreased vulnerability to permeability transition. J Neurosci. 2007; 27:7469–7475. [PubMed:17626207]
Nakahara I, Kikuchi H, Taki W, Nishi S, Kito M, Yonekawa Y, Goto Y, Ogata N. Changes in majorphospholipids of mitochondria during postischemic reperfusion in rat brain. J Neurosurg. 1992;76:244–250. [PubMed: 1309864]
Petrushka E, Quastel JH, Scholefield PG. Role of phospholipids in oxidative phosphorylation andmitochondrial structure. Can J Biochem Physiol. 1959; 37:989–998. [PubMed: 13671387]
Pfeiffer K, Gohil V, Stuart RA, Hunte C, Brandt U, Greenberg ML, Schagger H. Cardiolipin stabilizesrespiratory chain supercomplexes. J Biol Chem. 2003; 278:52873–52880. [PubMed: 14561769]
Rendon A, Masmoudi A. Purification of non-synaptic and synaptic mitochondria and plasmamembranes from rat brain by a rapid Percoll gradient procedure. J Neurosci Methods. 1985;14:41–51. [PubMed: 2993759]
Ruggiero FM, Cafagna F, Petruzzella V, Gadaleta MN, Quagliariello E. Lipid composition in synapticand non-synaptic mitochondria from rat brains and effect of aging. J Neurochem. 1992; 59:487–491. [PubMed: 1629722]
Sankaram MB, Powell GL, Marsh D. Effect of acyl chain composition on salt-induced lamellar toinverted hexagonal phase transitions in cardiolipin. Biochim Biophys Acta. 1989; 980:389–392.[PubMed: 2713413]
Schagger H, Pfeiffer K. Supercomplexes in the respiratory chains of yeast and mammalianmitochondria. EMBO J. 2000; 19:1777–1783. [PubMed: 10775262]
Schlame M, Ren M. Barth syndrome, a human disorder of cardiolipin metabolism. FEBS Lett. 2006;580:5450–5455. [PubMed: 16973164]
Schlame M, Ren M, Xu Y, Greenberg ML, Haller I. Molecular symmetry in mitochondrialcardiolipins. Chem Phys Lipids. 2005; 138:38–49. [PubMed: 16226238]
Seminario LM, Hren N, Gomez CJ. Lipid distribution in subcellular fractions of the rat brain. JNeurochem. 1964; 11:197–209. [PubMed: 14165155]
Seyfried TN, Mukherjee P. Targeting energy metabolism in brain cancer: review and hypothesis. NutrMetab (Lond). 2005; 2:30. [PubMed: 16242042]
Seyfried TN, Glaser GH, Yu RK. Genetic variability for regional brain gangliosides in five strains ofyoung mice. Biochem Genet. 1979; 17:43–55. [PubMed: 454360]
Kiebish et al. Page 15
J Neurochem. Author manuscript; available in PMC 2011 May 30.
NIH
-PA Author Manuscript
NIH
-PA Author Manuscript
NIH
-PA Author Manuscript

Shinzawa-Itoh K, Aoyama H, Muramoto K, et al. Structures and physiological roles of 13 integrallipids of bovine heart cytochrome c oxidase. EMBO J. 2007; 26:1713–1725. [PubMed: 17332748]
Sonnewald U, Schousboe A, Qu H, Waagepetersen HS. Intracellular metabolic compartmentationassessed by 13C magnetic resonance spectroscopy. Neurochem Int. 2004; 45:305–310. [PubMed:15145546]
Stuart JA, Gillis TE, Ballantyne JS. Remodeling of phospholipid fatty acids in mitochondrialmembranes of estivating snails. Lipids. 1998; 33:787–793. [PubMed: 9727609]
Villa RF, Gorini A, Geroldi D, Lo Faro A, Dell’Orbo C. Enzyme activities in perikaryal and synapticmitochondrial fractions from rat hippocampus during development. Mech Ageing Dev. 1989a;49:211–225. [PubMed: 2554073]
Villa RF, Gorini A, Lo Faro A, Dell’Orbo C. A critique on the preparation and enzymaticcharacterization of synaptic and nonsynaptic mitochondria from hippocampus. Cell MolNeurobiol. 1989b; 9:247–262. [PubMed: 2743381]
Xu Y, Kelley RI, Blanck TJ, Schlame M. Remodeling of cardiolipin by phospholipid transacylation. JBiol Chem. 2003; 278:51380–51385. [PubMed: 14551214]
Yamaoka S, Urade R, Kito M. Mitochondrial function in rats is affected by modification of membranephospholipids with dietary sardine oil. J Nutr. 1988; 118:290–296. [PubMed: 3351630]
Yonetan, T. Cytochrome oxidase: beef heart. In: Estabrook, RW.; Pullman, ME., editors. MethodsEnzymol. Academic Press; New York: 1967. p. 332-335.
Zborowski J, Dygas A, Wojtczak L. Phosphatidylserine decarboxylase is located on the external sideof the inner mitochondrial membrane. FEBS Lett. 1983; 157:179–182. [PubMed: 6862014]
Zhang M, Mileykovskaya E, Dowhan W. Gluing the respiratory chain together. Cardiolipin is requiredfor supercomplex formation in the inner mitochondrial membrane. J Biol Chem. 2002; 277:43553–43556. [PubMed: 12364341]
Zoeller RA, Morand OH, Raetz CR. A possible role for plasmalogens in protecting animal cellsagainst photosensitized killing. J Biol Chem. 1988; 263:11590–11596. [PubMed: 3403547]
Abbreviations used
A plasmanyl
AT acyltransferase
B6 C57BL/6J mice
BSA bovine serum albumin
Cer ceramide
CerPCho sphingomyelin
ChoGpl choline glycerophospholipids
D phosphatidyl
DCIP 2,6-dichloroindophenol
ESI/MS electrospray ionization mass spectrometry
ETC electron transport chain
EtnGpl ethanolamine glycerophospholipids
FM Ficoll purified NS mitochondria
LysoPtdCho lysophosphatidylcholine
MIB mitochondrial isolation buffer
MLCL monolysocardiolipin
NS non-synaptic
Kiebish et al. Page 16
J Neurochem. Author manuscript; available in PMC 2011 May 30.
NIH
-PA Author Manuscript
NIH
-PA Author Manuscript
NIH
-PA Author Manuscript

P plasmenyl
PBS phosphate-buffered saline
Ptd2Gro cardiolipin
PtdCho phosphatidylcholine
PtdCho phosphatidylcholine
PtdGro phosphatidylglycerol
PtdSer phosphatidylserine
Syn synaptic
Kiebish et al. Page 17
J Neurochem. Author manuscript; available in PMC 2011 May 30.
NIH
-PA Author Manuscript
NIH
-PA Author Manuscript
NIH
-PA Author Manuscript

Fig. 1.Procedure used for the isolation and purification of NS and Syn mitochondria from mousecerebral cortex.
Kiebish et al. Page 18
J Neurochem. Author manuscript; available in PMC 2011 May 30.
NIH
-PA Author Manuscript
NIH
-PA Author Manuscript
NIH
-PA Author Manuscript

Fig. 2.Distribution of protein markers on western blots (a) and of gangliosides on TLC (b) insubcellular fractions from mouse cerebral cortex. Subcellular fractions included totalhomogenate (TH), crude myelin (My), Ficoll gradient purified NS mitochondria (FM),Ficoll and sucrose gradient purified non-synaptic mitochondria (NS), and Ficoll and sucrosegradient purified synaptic mitochondria (Syn). Western blots were performed to determinethe distribution of specific protein markers for the inner mitochondria membrane (ComplexIV, subunit IV), outer mitochondrial membrane (monoamine oxidase-A), myelin(proteolipid protein), synaptosomal membrane (SNAP25), cytoskeleton (β-actin), nuclearmembrane (proliferating cell nuclear antigen), Golgi membrane (tuberin), and microsomalmembrane (calnexin). GM1a was visualized on TLC plates with cholera toxin bimmunostaining as described in Materials and methods. Std, is GM1a.
Kiebish et al. Page 19
J Neurochem. Author manuscript; available in PMC 2011 May 30.
NIH
-PA Author Manuscript
NIH
-PA Author Manuscript
NIH
-PA Author Manuscript

Fig. 3.Distribution of fatty acid molecular species in NS (black bar) and Syn (white bar)mitochondrial phospholipids. Phospholipids included (a) phosphatidylinositol (PtdIns), (b)sphingomyelin (CerPCho), (c) phosphatidylserine (PtdSer), (d) phosphatidylglycerol(PtdGro), (e) lysophosphatidylcholine (LysoPtdCho), (f) choline glycerophospholipids(ChoGpl), and (g) ethanolamine glycerophospholipids (EtnGpl). Molar percentages less than2% of the total lipid are not shown. Glycerolipid subclasses include D (phosphatidyl), P(plasmenyl), and A (plasmanyl). The total molecular species content of each lipid class ispresented in supplementary Tables S1–S9. All values are expressed as the mean of threeindependent samples (n = 3), where six cortexes were pooled for each sample.
Kiebish et al. Page 20
J Neurochem. Author manuscript; available in PMC 2011 May 30.
NIH
-PA Author Manuscript
NIH
-PA Author Manuscript
NIH
-PA Author Manuscript

Fig. 4.Distribution of Ptd2Gro molecular species in NS (black bar) and Syn (white bar)mitochondria. Ptd2Gro molecular species were arranged according to the mass to chargeratio based on percentage distribution. Ptd2Gro molecular species were subdivided intoseven groups, which contained a predominance of oleic, arachidonic, and/or docosahexanoicfatty acids in varying concentrations. Corresponding mass content of molecular species inNS and Syn mitochondria can be found in supplementary Table S3. All values are expressedas the mean of three independent samples (n = 3), where six cortexes were pooled for eachsample.
Kiebish et al. Page 21
J Neurochem. Author manuscript; available in PMC 2011 May 30.
NIH
-PA Author Manuscript
NIH
-PA Author Manuscript
NIH
-PA Author Manuscript
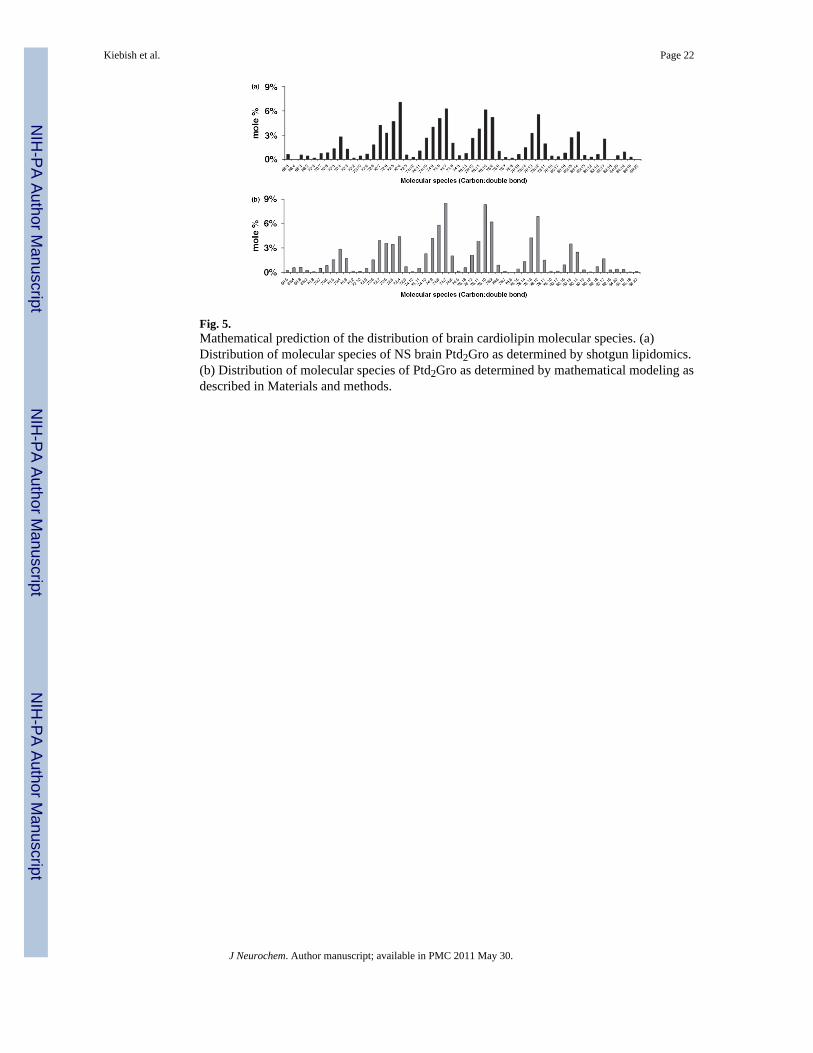
Fig. 5.Mathematical prediction of the distribution of brain cardiolipin molecular species. (a)Distribution of molecular species of NS brain Ptd2Gro as determined by shotgun lipidomics.(b) Distribution of molecular species of Ptd2Gro as determined by mathematical modeling asdescribed in Materials and methods.
Kiebish et al. Page 22
J Neurochem. Author manuscript; available in PMC 2011 May 30.
NIH
-PA Author Manuscript
NIH
-PA Author Manuscript
NIH
-PA Author Manuscript
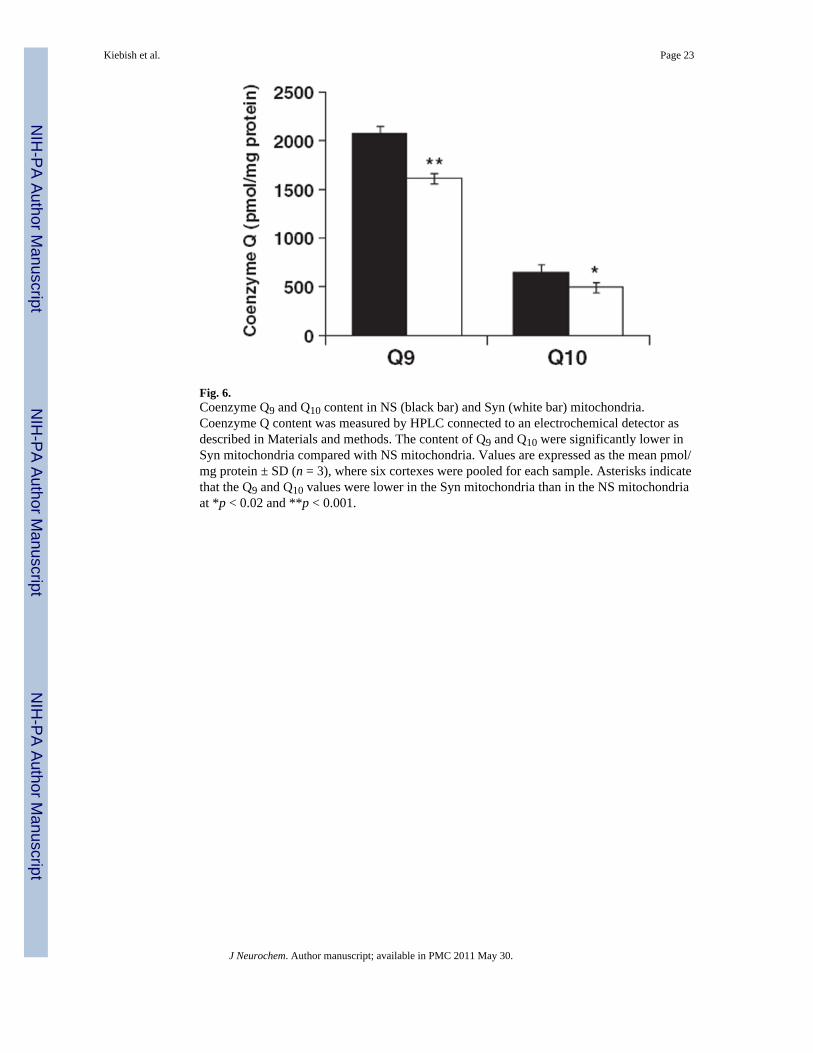
Fig. 6.Coenzyme Q9 and Q10 content in NS (black bar) and Syn (white bar) mitochondria.Coenzyme Q content was measured by HPLC connected to an electrochemical detector asdescribed in Materials and methods. The content of Q9 and Q10 were significantly lower inSyn mitochondria compared with NS mitochondria. Values are expressed as the mean pmol/mg protein ± SD (n = 3), where six cortexes were pooled for each sample. Asterisks indicatethat the Q9 and Q10 values were lower in the Syn mitochondria than in the NS mitochondriaat *p < 0.02 and **p < 0.001.
Kiebish et al. Page 23
J Neurochem. Author manuscript; available in PMC 2011 May 30.
NIH
-PA Author Manuscript
NIH
-PA Author Manuscript
NIH
-PA Author Manuscript
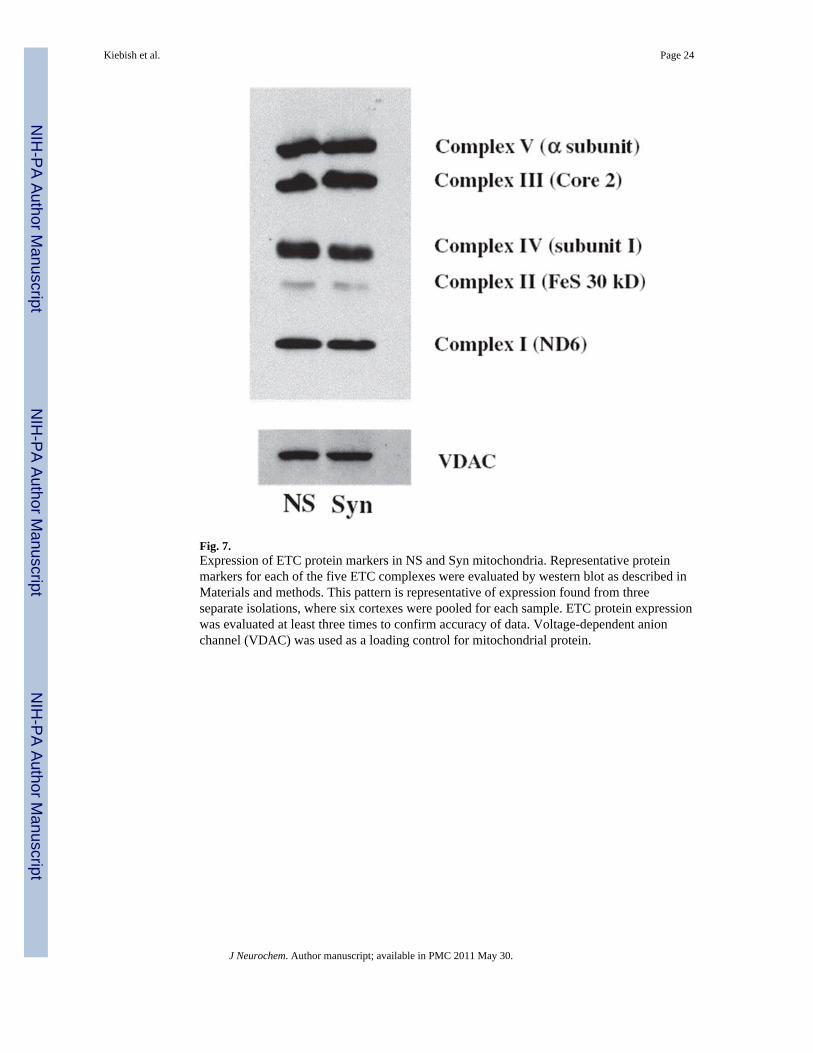
Fig. 7.Expression of ETC protein markers in NS and Syn mitochondria. Representative proteinmarkers for each of the five ETC complexes were evaluated by western blot as described inMaterials and methods. This pattern is representative of expression found from threeseparate isolations, where six cortexes were pooled for each sample. ETC protein expressionwas evaluated at least three times to confirm accuracy of data. Voltage-dependent anionchannel (VDAC) was used as a loading control for mitochondrial protein.
Kiebish et al. Page 24
J Neurochem. Author manuscript; available in PMC 2011 May 30.
NIH
-PA Author Manuscript
NIH
-PA Author Manuscript
NIH
-PA Author Manuscript

NIH
-PA Author Manuscript
NIH
-PA Author Manuscript
NIH
-PA Author Manuscript
Kiebish et al. Page 25
Table 1
Lipid composition of C57BL/6J mouse brain mitochondria
Lipid Non-synaptic Synaptic
Ethanolamine glycerophospholipids 187.4 ± 12.1 211.7 ± 21.3
Phosphatidylethanolamine 164.9 ± 10.0 184.6 ± 20.3
Plasmenylethanolamine 22.5 ± 2.2 27.0 ± 1.0
Choline glycerophospholipids 129.9 ± 7.7 156.3 ± 26.1
Phosphatidylcholine 119.6 ± 5.3 137.4 ± 17.2
Plasmenylcholine 1.2 ± 0.1 2.4 ± 1.1
Plasmanylcholine 9.1 ± 3.2 16.5 ± 8.5
Cholesterol 139.0 ± 46.7 126.7 ± 31.2
Cardiolipin 52.7 ± 4.5 39.9 ± 3.4*
Phosphatidylinositol 9.4 ± 0.8 10.2 ± 0.9
Phosphatidylglycerol 7.1 ± 0.5 6.4 ± 0.7
Sphingomyelin 5.3 ± 1.2 6.5 ± 0.6
Phosphatidylserine 4.6 ± 1.5 14.1 ± 3.0*
Lysophosphatidylcholine 2.7 ± 0.6 3.3 ± 0.4
Ceramide 0.7 ± 0.2 1.6 ± 0.2**
Values are expressed as mean nmol/mg protein ± SD (n = 3). Significantly different values from NS mitochondria at
*p < 0.02;
**p < 0.005 as determined from the two-tailed t-test.
J Neurochem. Author manuscript; available in PMC 2011 May 30.

NIH
-PA Author Manuscript
NIH
-PA Author Manuscript
NIH
-PA Author Manuscript
Kiebish et al. Page 26
Table 2
Electron transport chain activities of C57BL/6J mouse brain mitochondria
Non-synaptic Synaptic
Complex I 975 ± 64 533 ± 37***
NADH ubiquinone oxidoreductase
Complex II 292 ± 18 177 ± 27**
Succinate decylubiquinone DCIP oxidoreductase
Complex III 437 ± 71 235 ± 47*
Ubiquinol cytochrome c oxidoreductase
Complex IV 179 ± 17 184 ± 50
Cytochrome c oxidase
Complex I/III 269 ± 59 244 ± 40
NADH cytochrome c oxidoreductase
Complex II/III 309 ± 30 212 ± 22*
Succinate cytochrome c reductase
aEnzyme activities are expressed as (nmol/min/mg protein) ± SD (n = 3). Significantly different values from NS mitochondria at
*p < 0.025;
**p < 0.01;
***p < 0.005 as determined from the two-tailed t-test. DCIP, 2,6-dichloroindophenol.
J Neurochem. Author manuscript; available in PMC 2011 May 30.


