Embed Size (px)
Citation preview
Running head: PHOTO AND LIVE ITEM TEST MEDIA 1
The Effect of Photographic and Live Item Test Media on South African Young Adult
Identification Accuracy
Jade L. Mac Donnell
Supervisors: Colin G. Tredoux, Alicia Nortje, Calvyn DuToit
ACSENT Laboratory
Department of Psychology
University of Cape Town
Word count:
Abstract: [237 ]
Body: [7861 ]

PHOTO AND LIVE ITEM TEST MEDIA 2
Abstract
Eyewitness testimony can provide valuable information which can be used within criminal
proceedings to determine the culpability of a suspect. The problem however is that eyewitness
testimony is not always accurate and misidentifications can result in the false non identification
of a perpetrator or an incorrect identification of an innocent suspect. To mitigate the problem of
misidentifications South Africa insists on the conduct of a live identification parade. It endures
all the pragmatic difficulties associated with the conduct of this medium, which have the
potential to inflate misidentifications, because of the belief that live lineups will produce more
accurate identifications by eyewitnesses. However, available research is too underdeveloped to
definitively ascertain if the live superiority hypothesis and by extension the conduct of live
lineups, with its intrinsic difficulties, has merit. This study randomized 54 young adults into
‘item test media’ (ITM) (photographic, live) and lineup composition (target-absent, target
present) to test this belief. Participants viewed a spontaneous, live, non-criminal event with two
targets and their identification responses were captured. Results showed that ITM was not a
significant predictor of accuracy. Results did however show that when a live medium is tested
against a photographic medium, using a preferential rule to facilitate this comparison, there is
evidence to suggest that live be preferred over photographic media in both conservative and high
guilty base rates (.06 & .09).
Keywords: Identification accuracy, item test media, photographic, live, lineup, young
adult
PHOTO AND LIVE ITEM TEST MEDIA 3
Table of Contents
Abstract ............................................................................................................................... 2
The Fallibility of Eyewitness Testimony ........................................................................ 7
Factors Affecting Accuracy ............................................................................................. 7
South Africa’s Response to Misidentifications ............................................................... 9
Item Test Media ............................................................................................................ 10
Relationship between ITM and Accuracy, Literature Findings .....................................11
Limitations of Equivocal Findings................................................................................ 12
Relationship between ITM and accuracy in applied settings........................................ 13
Rationale, Specific Aims and Hypotheses ........................................................................ 14
Method .............................................................................................................................. 15
Design and Setting ........................................................................................................ 15
Participants .................................................................................................................... 15
Materials ....................................................................................................................... 16
Lineup Construction.................................................................................................. 16
Presentation Materials ............................................................................................... 17
Answering Materials ................................................................................................. 17
Evaluating materials.................................................................................................. 18
Procedure ...................................................................................................................... 18
PHOTO AND LIVE ITEM TEST MEDIA 4
Ethical Considerations .................................................................................................. 19
Results ........................................................................................................................... 20
Blonde Identification Responses............................................................................... 21
Brunette Identification Responses. ........................................................................... 22
Summary. .................................................................................................................. 23
Confound Contingency Testing. ............................................................................... 24
Attention. .................................................................................................................. 24
Lineup Bias and effective Size. ................................................................................ 24
Expected Utility. ....................................................................................................... 25
Discussion ..................................................................................................................... 29
Acknowledgements ........................................................................................................... 31
References ......................................................................................................................... 33
Appendix A ....................................................................................................................... 37
Appendix B ....................................................................................................................... 38
An example of the Consent Form (Orange Dot) ............................................................... 38
Appendix C ....................................................................................................................... 40
Demographic Survey ........................................................................................................ 40
Appendix D ....................................................................................................................... 41
Free recall description ....................................................................................................... 41
Appendix E ....................................................................................................................... 42
PHOTO AND LIVE ITEM TEST MEDIA 5
Live Lineup Selection Form ............................................................................................. 42
Appendix F........................................................................................................................ 42
Confidence ........................................................................................................................ 42
Appendix F........................................................................................................................ 43
Confidence ........................................................................................................................ 43
Appendix G ....................................................................................................................... 44
Attention and Familiarity Questions ................................................................................. 44
Appendix H ....................................................................................................................... 45
Debriefing ......................................................................................................................... 45
Appendix I ........................................................................................................................ 48
Photographicgraphic lineup selection form ...................................................................... 48
Appendix J ........................................................................................................................ 49
Appendix K ....................................................................................................................... 51
Ethical Approval ............................................................................................................... 51
Appendix L ....................................................................................................................... 52

PHOTO AND LIVE ITEM TEST MEDIA 6
PLAGIARISM DECLARATION
PLAGIARISM
This means that you present substantial portions or elements of another’s work,
ideas or data as your own, even if the original author is cited occasionally. A signed
photocopy or other copy of the Declaration below must accompany every piece of work
that you hand in.
DECLARATION
1. I know that Plagiarism is wrong. Plagiarism is to use another’s work and pretend that it is
one’s own.
2. I have used the American Psychological Association formatting for citation and
referencing. Each significant contribution to, and quotation in, this essay/report/project
from the work or works, of other people has been attributed, cited and referenced.
3. This essay/report/project is my own work.
4. I have not allowed, and will not allow anyone to copy my work with the intention of
passing it off as his or her own work.
NAME: Jade Lee Mac Donnell
SIGNATURE: J. Mac Donnell
Dated 24.10.2019
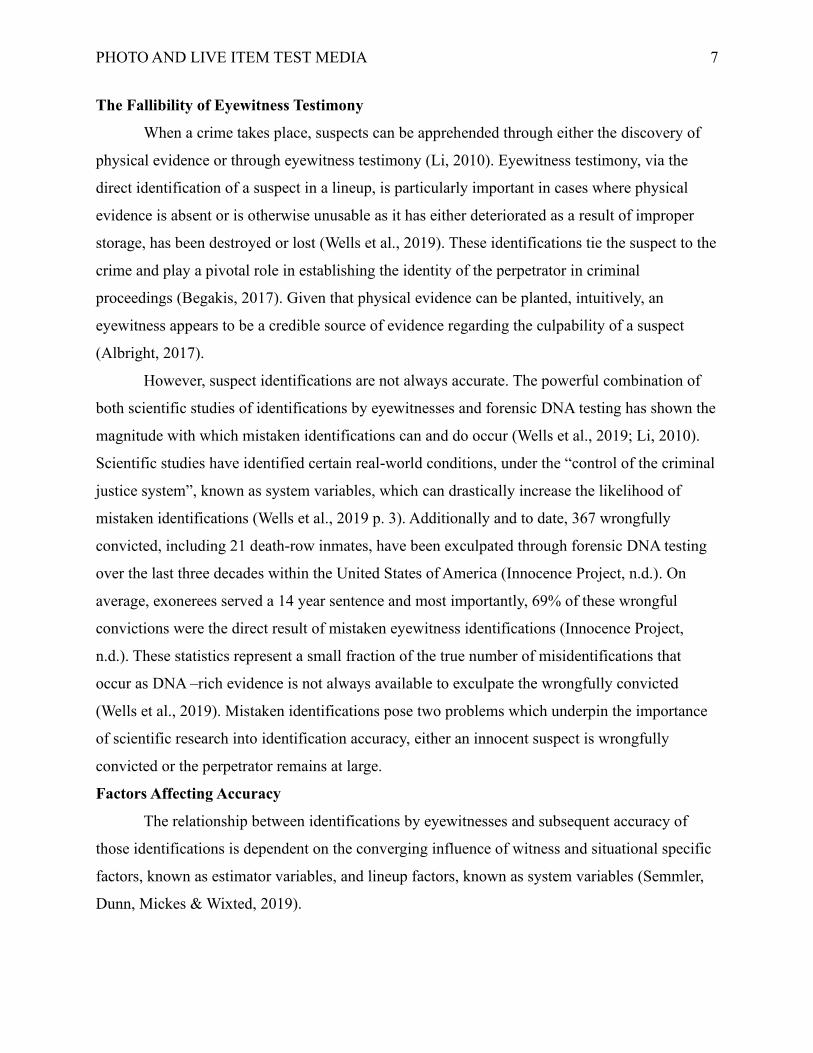
PHOTO AND LIVE ITEM TEST MEDIA 7
The Fallibility of Eyewitness Testimony
When a crime takes place, suspects can be apprehended through either the discovery of
physical evidence or through eyewitness testimony (Li, 2010). Eyewitness testimony, via the
direct identification of a suspect in a lineup, is particularly important in cases where physical
evidence is absent or is otherwise unusable as it has either deteriorated as a result of improper
storage, has been destroyed or lost (Wells et al., 2019). These identifications tie the suspect to the
crime and play a pivotal role in establishing the identity of the perpetrator in criminal
proceedings (Begakis, 2017). Given that physical evidence can be planted, intuitively, an
eyewitness appears to be a credible source of evidence regarding the culpability of a suspect
(Albright, 2017).
However, suspect identifications are not always accurate. The powerful combination of
both scientific studies of identifications by eyewitnesses and forensic DNA testing has shown the
magnitude with which mistaken identifications can and do occur (Wells et al., 2019; Li, 2010).
Scientific studies have identified certain real-world conditions, under the “control of the criminal
justice system”, known as system variables, which can drastically increase the likelihood of
mistaken identifications (Wells et al., 2019 p. 3). Additionally and to date, 367 wrongfully
convicted, including 21 death-row inmates, have been exculpated through forensic DNA testing
over the last three decades within the United States of America (Innocence Project, n.d.). On
average, exonerees served a 14 year sentence and most importantly, 69% of these wrongful
convictions were the direct result of mistaken eyewitness identifications (Innocence Project,
n.d.). These statistics represent a small fraction of the true number of misidentifications that
occur as DNA –rich evidence is not always available to exculpate the wrongfully convicted
(Wells et al., 2019). Mistaken identifications pose two problems which underpin the importance
of scientific research into identification accuracy, either an innocent suspect is wrongfully
convicted or the perpetrator remains at large.
Factors Affecting Accuracy
The relationship between identifications by eyewitnesses and subsequent accuracy of
those identifications is dependent on the converging influence of witness and situational specific
factors, known as estimator variables, and lineup factors, known as system variables (Semmler,
Dunn, Mickes & Wixted, 2019).
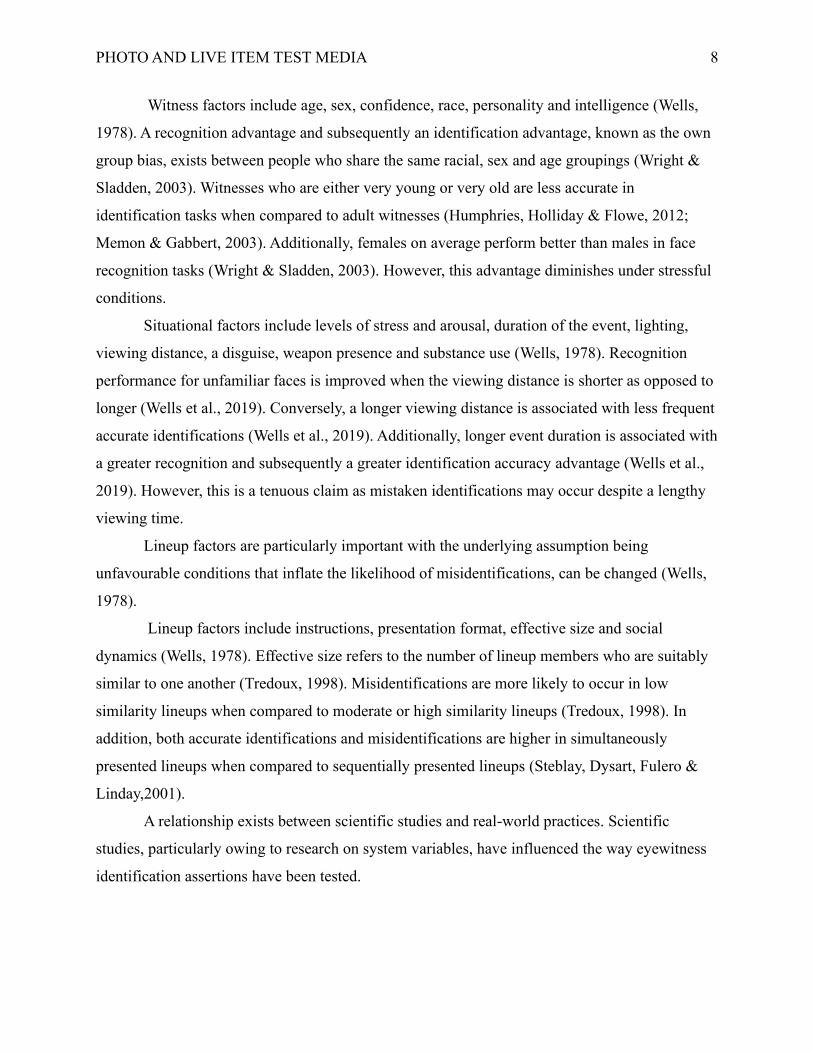
PHOTO AND LIVE ITEM TEST MEDIA 8
Witness factors include age, sex, confidence, race, personality and intelligence (Wells,
1978). A recognition advantage and subsequently an identification advantage, known as the own
group bias, exists between people who share the same racial, sex and age groupings (Wright &
Sladden, 2003). Witnesses who are either very young or very old are less accurate in
identification tasks when compared to adult witnesses (Humphries, Holliday & Flowe, 2012;
Memon & Gabbert, 2003). Additionally, females on average perform better than males in face
recognition tasks (Wright & Sladden, 2003). However, this advantage diminishes under stressful
conditions.
Situational factors include levels of stress and arousal, duration of the event, lighting,
viewing distance, a disguise, weapon presence and substance use (Wells, 1978). Recognition
performance for unfamiliar faces is improved when the viewing distance is shorter as opposed to
longer (Wells et al., 2019). Conversely, a longer viewing distance is associated with less frequent
accurate identifications (Wells et al., 2019). Additionally, longer event duration is associated with
a greater recognition and subsequently a greater identification accuracy advantage (Wells et al.,
2019). However, this is a tenuous claim as mistaken identifications may occur despite a lengthy
viewing time.
Lineup factors are particularly important with the underlying assumption being
unfavourable conditions that inflate the likelihood of misidentifications, can be changed (Wells,
1978).
Lineup factors include instructions, presentation format, effective size and social
dynamics (Wells, 1978). Effective size refers to the number of lineup members who are suitably
similar to one another (Tredoux, 1998). Misidentifications are more likely to occur in low
similarity lineups when compared to moderate or high similarity lineups (Tredoux, 1998). In
addition, both accurate identifications and misidentifications are higher in simultaneously
presented lineups when compared to sequentially presented lineups (Steblay, Dysart, Fulero &
Linday,2001).
A relationship exists between scientific studies and real-world practices. Scientific
studies, particularly owing to research on system variables, have influenced the way eyewitness
identification assertions have been tested.
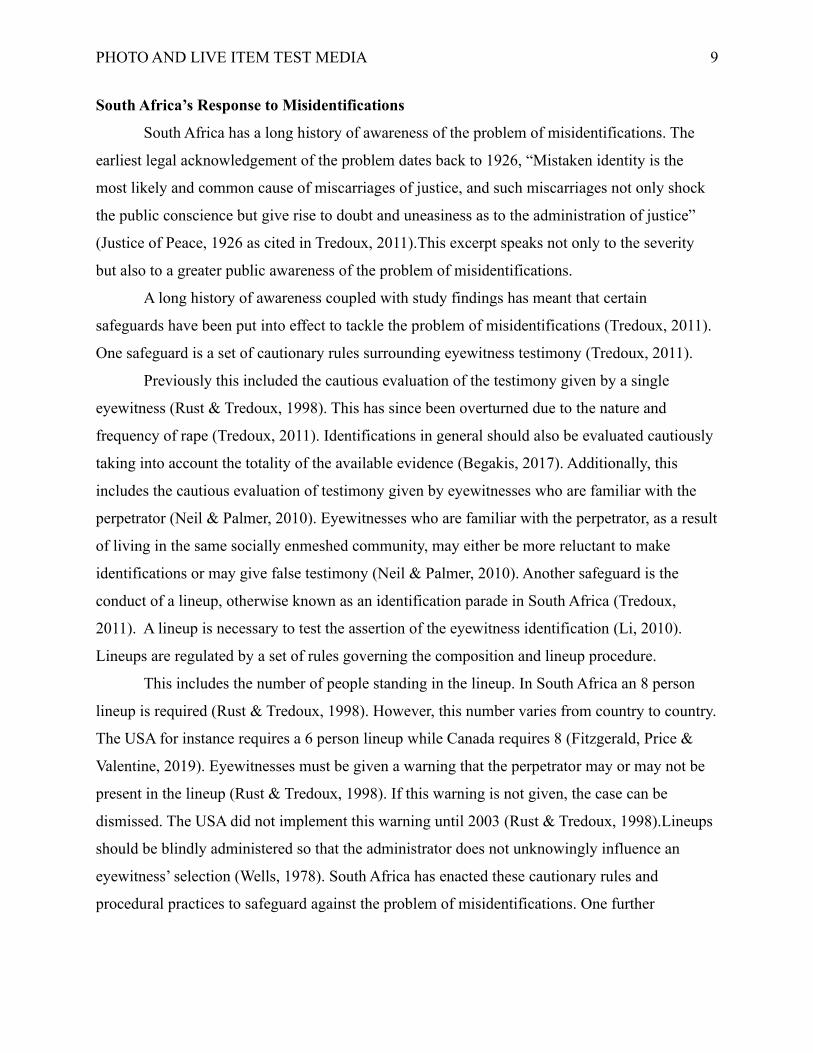
PHOTO AND LIVE ITEM TEST MEDIA 9
South Africa’s Response to Misidentifications
South Africa has a long history of awareness of the problem of misidentifications. The
earliest legal acknowledgement of the problem dates back to 1926, “Mistaken identity is the
most likely and common cause of miscarriages of justice, and such miscarriages not only shock
the public conscience but give rise to doubt and uneasiness as to the administration of justice”
(Justice of Peace, 1926 as cited in Tredoux, 2011).This excerpt speaks not only to the severity
but also to a greater public awareness of the problem of misidentifications.
A long history of awareness coupled with study findings has meant that certain
safeguards have been put into effect to tackle the problem of misidentifications (Tredoux, 2011).
One safeguard is a set of cautionary rules surrounding eyewitness testimony (Tredoux, 2011).
Previously this included the cautious evaluation of the testimony given by a single
eyewitness (Rust & Tredoux, 1998). This has since been overturned due to the nature and
frequency of rape (Tredoux, 2011). Identifications in general should also be evaluated cautiously
taking into account the totality of the available evidence (Begakis, 2017). Additionally, this
includes the cautious evaluation of testimony given by eyewitnesses who are familiar with the
perpetrator (Neil & Palmer, 2010). Eyewitnesses who are familiar with the perpetrator, as a result
of living in the same socially enmeshed community, may either be more reluctant to make
identifications or may give false testimony (Neil & Palmer, 2010). Another safeguard is the
conduct of a lineup, otherwise known as an identification parade in South Africa (Tredoux,
2011). A lineup is necessary to test the assertion of the eyewitness identification (Li, 2010).
Lineups are regulated by a set of rules governing the composition and lineup procedure.
This includes the number of people standing in the lineup. In South Africa an 8 person
lineup is required (Rust & Tredoux, 1998). However, this number varies from country to country.
The USA for instance requires a 6 person lineup while Canada requires 8 (Fitzgerald, Price &
Valentine, 2019). Eyewitnesses must be given a warning that the perpetrator may or may not be
present in the lineup (Rust & Tredoux, 1998). If this warning is not given, the case can be
dismissed. The USA did not implement this warning until 2003 (Rust & Tredoux, 1998).Lineups
should be blindly administered so that the administrator does not unknowingly influence an
eyewitness’ selection (Wells, 1978). South Africa has enacted these cautionary rules and
procedural practices to safeguard against the problem of misidentifications. One further
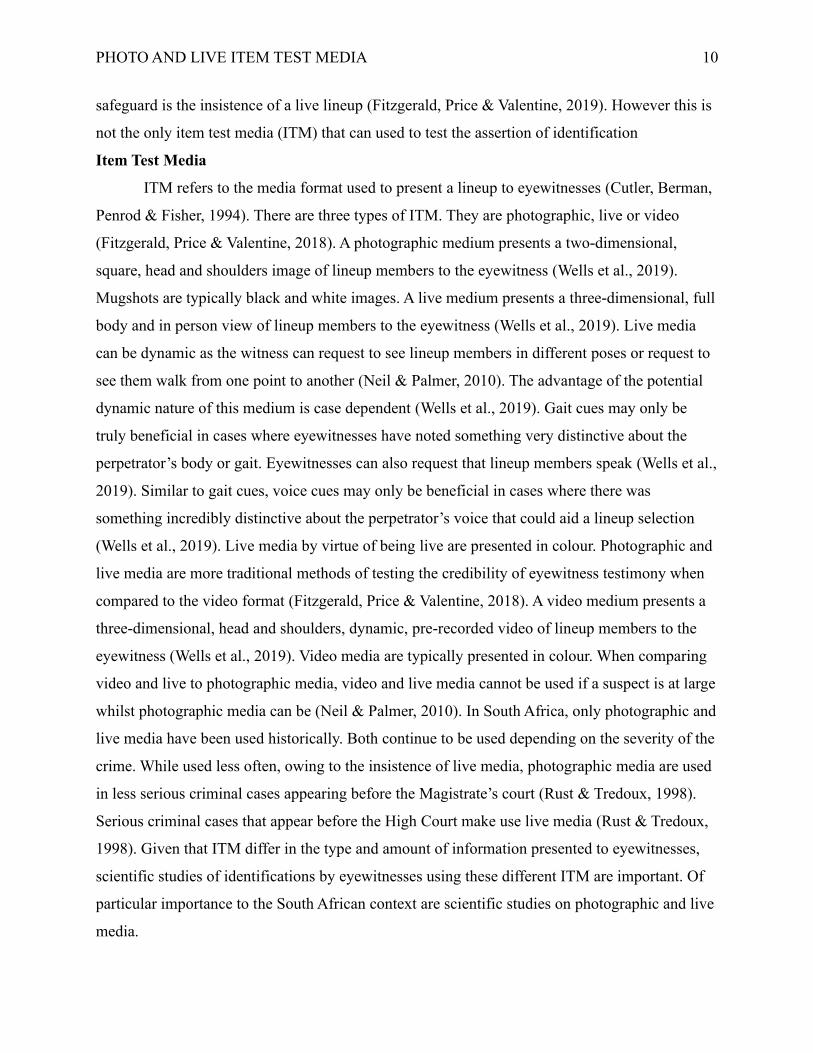
PHOTO AND LIVE ITEM TEST MEDIA 10
safeguard is the insistence of a live lineup (Fitzgerald, Price & Valentine, 2019). However this is
not the only item test media (ITM) that can used to test the assertion of identification
Item Test Media
ITM refers to the media format used to present a lineup to eyewitnesses (Cutler, Berman,
Penrod & Fisher, 1994). There are three types of ITM. They are photographic, live or video
(Fitzgerald, Price & Valentine, 2018). A photographic medium presents a two-dimensional,
square, head and shoulders image of lineup members to the eyewitness (Wells et al., 2019).
Mugshots are typically black and white images. A live medium presents a three-dimensional, full
body and in person view of lineup members to the eyewitness (Wells et al., 2019). Live media
can be dynamic as the witness can request to see lineup members in different poses or request to
see them walk from one point to another (Neil & Palmer, 2010). The advantage of the potential
dynamic nature of this medium is case dependent (Wells et al., 2019). Gait cues may only be
truly beneficial in cases where eyewitnesses have noted something very distinctive about the
perpetrator’s body or gait. Eyewitnesses can also request that lineup members speak (Wells et al.,
2019). Similar to gait cues, voice cues may only be beneficial in cases where there was
something incredibly distinctive about the perpetrator’s voice that could aid a lineup selection
(Wells et al., 2019). Live media by virtue of being live are presented in colour. Photographic and
live media are more traditional methods of testing the credibility of eyewitness testimony when
compared to the video format (Fitzgerald, Price & Valentine, 2018). A video medium presents a
three-dimensional, head and shoulders, dynamic, pre-recorded video of lineup members to the
eyewitness (Wells et al., 2019). Video media are typically presented in colour. When comparing
video and live to photographic media, video and live media cannot be used if a suspect is at large
whilst photographic media can be (Neil & Palmer, 2010). In South Africa, only photographic and
live media have been used historically. Both continue to be used depending on the severity of the
crime. While used less often, owing to the insistence of live media, photographic media are used
in less serious criminal cases appearing before the Magistrate’s court (Rust & Tredoux, 1998).
Serious criminal cases that appear before the High Court make use live media (Rust & Tredoux,
1998). Given that ITM differ in the type and amount of information presented to eyewitnesses,
scientific studies of identifications by eyewitnesses using these different ITM are important. Of
particular importance to the South African context are scientific studies on photographic and live
media.
PHOTO AND LIVE ITEM TEST MEDIA 11
Relationship between ITM and Accuracy, Literature Findings
Given the importance of photographic and live ITM to the South African context, the
relationship between photographic and live ITM and accuracy within eyewitness studies will be
discussed below.
A study conducted by Shepard, Ellis & Davies (1982) reported no significant difference
in identification accuracy between live, photographic, colour and black and white slide
conditions.
Kerstholt, Koster & Amelsvoort (2004) reported no significant difference was present
between live, photographic and video media when the number of correct perpetrator
identifications, known as hits, was compared. However, a significant difference for mistaken
identifications was reported in target absent lineups between photographic live and video media.
Sporer (1991 as cited in Price, Harvey, Anderson, Chadwick & Fitzgerald, 2018) studied
the effect of both ITM, video and photographic, and viewing order, simultaneous or sequential
presentation, on identification performance. Looking specifically at findings for sequentially
presented live and photographic media, in order to report findings attributable to only ITM, no
significant difference was reported when hits, misidentifications or correct rejections in target
absent line ups were compared.
When the lineup contained the perpetrator, Cutler & Fisher (1990) reported no significant
differences in eyewitness identifications were found between combined video and live conditions
compared to a photographic condition. Additionally, accurate identifications when the perpetrator
was in the lineup were significantly greater when the video and live conditions were compared to
the photographic condition.
Egan, Pittner & Goldstein (1997) reported a significant difference in identification
performance between live and photographic ITM. The live medium produced significantly more
hits when compared to the photographic medium.
Another study by DuToit & Tredoux (2018) comparing photographic and live media,
reported similar results for participants who viewed a live target event, referred to as a live
encoding. Accurate identifications were significantly higher in the live medium when compared
to the photographic medium. This pattern of results was not mirrored for participants who
viewed a photographic at encoding.
PHOTO AND LIVE ITEM TEST MEDIA 12
When individual studies comparing photographic and live ITM were aggregated into a
meta-analysis, results showed that no significant differences were found when the selection of an
innocent suspect, known as a false-alarm, was compared (Cutler, Berman, Penrod & Fisher,
1994). In addition more hits were reported for live compared to photographic media however, the
difference was not significant.
These equivocal eyewitness findings are at odds with a commonly held belief that live
media, by virtue of the information offered to an eyewitness, will produce more accurate
identifications than photographic media (Fitzgerald, Price & Valentine, 2018). This belief is
known as the live superiority hypothesis and intuitively, this is a plausible inference (Fitzgerald,
Price & Valentine, 2018). Although unsubstantiated by eyewitness findings, this belief continues
to influence applied practices, such as the insistence of a live parade in SA, and shapes triers of
facts perceptions of eyewitness testimony, where greater credibility is afforded to testimony from
live as opposed to photographic media (Price, Harvey, Anderson, Chadwick & Fitzgerald, 2018).
If eyewitness findings were consistently replicable ITM would still be an important area of
research because of this discrepancy. But, how credible are these findings and what could explain
them?
Limitations of Equivocal Findings
Equivocal findings could be attributed to individual study limitations. These include a
relatively small sample size, lack of a target absent lineup condition as well as the potential
presence of other methodological confounds (Neil & Palmer, 2010). These confounds could
include the influence of own group bias, viewing distance, the use of a single distinctive
perpetrator and a small effective lineup size (Neil & Palmer, 2010).
Additionally, the relative search strategy employed by eyewitnesses in an identification
task could account for the equivalent findings (Rice, Phillips & O'Toole, 2013). While both the
body and the face offer information that could aid identifications, facial recognition research has
shown that identifications predominately rely on facial when compared to body information
(Rice, Phillips & O'Toole, 2013). This strategy is mediated by the quality of the medium seen by
participants. In moderate to good quality conditions, facial information produced more accurate
information compared to body information while in poor quality conditions, no significant
difference was observed between face and body information in terms of accurate identifications
(Rice, Phillips & O'Toole, 2013). This suggests that equivalent findings could be plausible if the
PHOTO AND LIVE ITEM TEST MEDIA 13
quality of the photographic medium was sufficiently good so as to be comparable to the quality
of viewing live media.
In order to move beyond tentative claims regarding the relationship between ITM and
identifications by eyewitnesses, more studies are needed which address previous study
limitations (Fitzgerald, Price & Valentine, 2018). Compounding the importance of this research
are practical limitations intrinsic to the real-world conduct of a live as opposed to a photographic
lineup which could also influence accuracy.
Relationship between ITM and accuracy in applied settings
Live lineups require suitably similar lineup members in order to be a fair test of the
assertion of the identification. Finding suitably similar people to participate in the lineup is time
consuming and difficult task (Neil & Palmer, 2010). Additionally, all persons conducting or in
the lineup must be orchestrated to be in the right place at the right time (Neil & Palmer, 2010).
The difficulties of effectively completing these tasks inflate the likelihood of a biased lineup and
in turn the likelihood of misidentifications (Neil & Palmer, 2010).
These difficulties account for the longer delays in the conduct of a live when compared to
photographic lineups. Longer delays increase the possibility of natural memory trace degradation
and possible memory trace contamination (Fitzgerald, Price & Valentine, 2018). This in turn can
negatively influence identification performance.
Unlike photographic media which can preserve the likeness of a suspect at the time of an
arrest, live media offers suspects the opportunity to intentionally change their appearance before
appearing in the lineup (Fitzgerald, Price & Valentine, 2018). When the information available to
eyewitnesses is inconsistent between the crime and the lineup, accurate identifications are less
likely (Fitzgerald, Price & Valentine, 2018).
Live lineups elicit a greater stress response when compared to photographic lineups. This
holds true within experimental conditions where participants are assured that the target event was
staged (Brace, Pike, Kemp & Turner, 2009). Eyewitnesses can in turn refuse to make
identification, owing to the stress of the task.
In South Africa, lineup members are sourced from the inmate population (Rust &
Tredoux, 1998). Each inmate must be accompanied by two law enforcement escourts (Rust &
Tredoux, 1998). Not only is this financially costly and dangerous to both law enforcement
PHOTO AND LIVE ITEM TEST MEDIA 14
officials and witnesses but the difficulties of such a task increase the likelihood of a biased lineup
and subsequently misidentifications occurring.
Rationale, Specific Aims and Hypotheses
South Africa insists on the conduct of live identification parades and endures all the
practical limitations associated with the conduct of this medium which can inflate
misidentifications because of the belief that live lineups will produce more accurate
identifications by eyewitnesses (Fitzgerald, Price & Valentine, 2018). However, the body of
evidence examining live and photographic ITM and identification accuracy is too
underdeveloped to definitively ascertain if the live superiority hypothesis and by extension the
conduct of live lineups, with its intrinsic difficulties, has merit (Neil & Palmer, 2010). More
research is desperately needed to expand the available research base (Neil & Palmer, 2010).
Additionally, research should address study limitations that are present within the available
literature.
Between April 2018 and March 2019, 617 210 contact crimes were reported in South
Africa (South African Police Services, 2018). A higher prevalence of crime in turn increases the
demand for the conduct of live identification parades. It has been roughly estimates that the
conduct of a live identification parade totals R30 000(C. Tredoux, personal communication,
September 18, 2019). The importance of such research is therefore magnified within the South
African context when both the financial cost of administering live lineups and prevalence of
crime are considered.
An analysis of the South African Victims of Crime Survey for the period spanning
2018/2019, identified young adults as being the most frequent victims of theft, assault and home
robberies (Statistics SA, 2019). Responding to both the underdeveloped body of research on ITM
and the high likelihood of young adults witnessing a crime, this study aimed to investigate the
effect of photographic and live ITM on South African young adult identification accuracy.
In order to test the live superiority hypothesis, this study first hypothesized that there
would be a greater probability of observing a correct outcome with live media when compared to
photographic media. Secondly, it was hypothesized that there would be a greater probability of
observing a correct outcome with a target present lineup when compared to a target absent
lineup. Finally, it was hypothesized that live should be preferred to photographic lineups.
Available studies have typically used white samples which is unreflective of the demographic

PHOTO AND LIVE ITEM TEST MEDIA 15
composition within South Africa. Therefore this study accounted for the effects of self-identified
racial grouping on the observed young adult identification responses captured.
Method
Design and Setting
A randomized, 2 x 2 design was used which included the independent variable ‘ITM’
(photographic, video) as well as the independent variable ‘lineup composition’ (target present,
target absent), with ‘identification accuracy’ (correct, incorrect) as the dependent variable. Two
targets (blonde, brunette) were used for each participant as a manipulation check to control for
the potential influence of distinctive facial characteristics on identification accuracy. Lineup bias
and effective size were calculated to test the fairness of each of the lineups viewed by
participants (blonde, brunette).Participants were randomized according to ‘ITM’ (photographic,
video), ‘lineup composition’ (target present, target absent), ‘viewing order’ (first, second), ‘target
position’ (5, 2, 6, 1), and ‘target order’ (brunette-blonde, blonde-brunette). Participants were
placed into these groups when they received their testing forms. Testing forms were ordered and
distributed according to the stratified random assignment function on MS Excel
2010.Participants who self-reported familiarity (yes, no) with lineup members outside of the
testing session were excluded during data-analysis. Only unfamiliar identification responses have
been reported. Testing took place within a single session, in a lecture theatre at the University of
Cape Town where participants viewed an unexpected, live, non-criminal event.
Participants
This study obtained 54 undergraduate students who were above the age of 19 (M=22.39,
SD=5.23), from the University of Cape Town. Participants signed up within the testing session
after viewing a spontaneous, non-criminal event in a lecture theatre. Each consenting participant
received one Student Research Participation Programme Point, which forms part of their course
requirement, and their identification results (correct/incorrect). In addition to age, participants
were asked to self-identify their gender, racial grouping and to capture their position in the
lecture venue. This study contained 14 males (25.9%), 36 females (66.7%), 1 non binary (1.9%)
and 3 gender non disclosures (5.6%). As both targets were white, racial grouping was grouped
according to ‘same-race’, ‘other-race’. This study contained 20 same-race (37%), 30 other-race
(55.6%) and 4 racial non disclosures (7.4%). On average participants viewed the live event while

PHOTO AND LIVE ITEM TEST MEDIA 16
seated in the fifth row of desks (M=5.13, SD=3.24).Additionally, 20 participants were seated in
the left section of the lecture theatre (37%), 18 participants were seated in middle section
(33.3%) and 13 participants were seated in the right section (24.1%).
Materials
Lineup Construction.
Photographic. A simultaneous 6 person lineup consisting of head and shoulder, colour
photographs of South African white females was constructed on a computer. Target present
lineups consisted of the target and five suitably similar lineup members, otherwise referred to as
foils. Target absent lineups consisted of an innocent suspect and five foils. A target absent and a
target present lineup was constructed for both blonde and brunette targets. Photographs were
standardized to 3cm in width and 3.8cm in height. Three photographs appeared in the top row
and three photographs appeared in the bottom row. This layout was standardized across lineups
using a custom template. Each photograph was placed onto the same coloured background and
the same white t-shirt was overlaid onto each photograph. The target (blonde, brunette) appeared
in a different lineup position depending on the random assignment of lineup conditions. In the
first viewing order, the brunette target appeared in position 5 and the blonde target appeared in
position 2. In the second viewing order the brunette target appeared in position 6 and the blonde
target appeared in position 2. Alternating the position of the target in the lineup ensured that
lineup selections were not influenced by target position. A total of 14 photographs were used. All
lineup individuals gave permission to both have their photograph taken and for that photograph
to be used for research purposes. All foils were suitably similar to the target in physical
appearance, gender, age and racial grouping. The suitability of the foils was determined in a pre-
study using 6 independent observers who viewed a target and wrote a description of that target.
Half the independent observers viewed and wrote a description for the blonde followed by the
brunette target while the other half viewed and wrote a description for the brunette followed by
the blonde target. Alternating the viewing of the targets in the pre-study ensured that descriptions
were not influenced by the order the targets were viewed. If an aspect of a description appeared
in 3 or more of the descriptions, it was used as a foil selection criterion. For each of the targets
(blonde, brunette) an individual who most resembled the selection criteria was chosen as the
innocent suspect.
PHOTO AND LIVE ITEM TEST MEDIA 17
Live. Simultaneous, 6 person lineups were constructed using the same individuals that
were used in the photographic lineups. A target present and target absent lineup was constructed
for each target (blonde/brunette).
Presentation Materials
Photographic. All photographic lineups and lineup instructions appeared on a printed
lineup selection form. Lineups were printed in black and white to simulate common, real-world
photographic ITM procedures.
Live. Lineup members stood side by side holding a printed number which corresponded
to their lineup position. As with the photographic lineup, physical appearance was standardized
to hair tied back and no jewelry. All members wore a black t-shirt and black jeans. To standardize
ITM, participants viewed static (no gait, voice or pose information) lineups.
Answering Materials
Participants’ captured their self-reported demographic characteristics on a printed
demographic survey. This was included to account for the influence of own group bias on
identification performance.
Lineup selections were captured on a printed lineup selection form. Participants marked
their selections using a cross (X) in the appropriate box (1,2,3,4,5,6, do not know, not present).
Identification confidence was captured after each identification using a printed
confidence form. Participants rated the confidence in their decisions (1-100) both graphically and
numerically. This was captured owing to the assumption that the more accurate you are the more
confident you will be (Wixted & Wells, 2017).
Description data for both participants was captured using a printed free recall form. This
was used to simulate real-world law enforcement practices. The order in which participants
described the targets was not prompted thereby ensuring there was no inadvertent influence
during this task.
Participant familiarity with lineup members outside of the testing session (yes, no) and
attention during the live event were captured on a printed, manipulation check form. Responses
were marked ‘correct’, ‘incorrect’. Attention was tested by asking participants a question about a
detail of the live event. Attention was included to account for the influence of inattention on
identification accuracy.
PHOTO AND LIVE ITEM TEST MEDIA 18
Evaluating materials
Fifty-eight post-study lineups were administered to independent observers. This mock
witness procedure tested the fairness of the lineups (Malpass & Lindsay, 1999). Independent
observers were asked to identify the target (blonde, brunette) on the basis of a description. If the
lineup were fair and had suitability similar foils, the target would not have been selected above
chance level (16.67%) (Malpass & Lindsay, 1999). Viewing of the blonde and brunette lineups
were alternated to ensure viewing order did not influence this task. This evaluation procedure
was administered to account for the influence of bias on young adult identification performance.
Procedure
Participants viewed a spontaneous, non-criminal event while seated in a lecture. The
event consisted of the targets (blonde, brunette) appealing to the students to take part in a
fictitious research study of ‘numerology’. During the event, participants were exposed to both
targets for 1.15min. After they had viewed the event, participants were invited to take part in a
research study that would test their memory for the fictitious study appeal. A pack of testing
forms was handed out to each student.
Participants were randomly assorted into lineup groups on the basis of the testing forms
they received (Appendix A). Participants were reminded to remember the name of the group they
were assigned too
Participants gave permission to participate in the study by signing a consent form
(Appendix B). Students not wanting to participate were free to leave the lecture early. All
participants were then instructed to complete a demographic survey and a free recall description
(Appendix C; Appendix D). Once they had completed these tasks, completed testing forms were
collected and a 15min distractor video was shown. The video content was course related.
‘Photographicgraphic’, ‘live-target absent’ and ‘live-target present’ lineup groups
completed the lineup task in different venues. After the video had been viewed, research
assistants led participants to their respective lineup venues. Testing took place within
neighboring lecture theatres that were quiet and comfortable.
Participants were instructed to break the seals on their remaining testing forms to begin
the identification task.
PHOTO AND LIVE ITEM TEST MEDIA 19
Live. First viewing order participants were seated in the front and second viewing order
participants were seated at the back of the venue. Second viewers were instructed to place their
heads on their desks, to cover their eyes and to not peak until it was their turn. First viewers
viewed an in person lineup, made their identifications using a lineup selection form and rated the
confidence of their lineup selection (Appendix E & F). A further live lineup was shown and
participants made their identifications and rated confidence in the same way. No time restrictions
were imposed during the identification tasks. Lineup members exited once all participants had
made their identifications. Participants completed an attention and a familiarity question
(Appendix G). Participants were then debriefed and acknowledged this debriefing with a
signature (Appendix H). First viewers were then free to leave the venue. Second viewers moved
to the front of the venue and the lineups were administered in the same way.
Photographic. Photographic lineups were administered in the same way using a lineup
selection form (Appendix I) however, photographic participants viewed a printed photographic
lineup (Appendix J) and both viewing orders completed the identification task at the same time.
Ethical Considerations
This study followed the ethical code of conduct for research involving human
participants, as set out by the University of Cape Town. Ethical approval was granted by the
Research Ethics Committee of the University of Cape Town, Department of Psychology
(Appendix K).
Participation was voluntary. Undergraduate students above the age of 18 were invited to
participate. Students were informed of what would be asked of them if they decided to sign up
for the study. It was emphasized that participation was by no means compulsory and that
participants would not suffer any negative repercussions as a result of deciding not to participate.
Participants gave permission to take part in the study by signing a consent form (Appendix B).
Once they had signed, they were reminded that they were free to change their minds at any point
in the study. Students who did not wish to participate were free to leave the lecture early.
A unique participant number was given to each participant’s responses to ensure
anonymity during data analysis. Sensitive information that would be able to link a participant to
their responses was stored on an encrypted computer and was omitted from the study.
PHOTO AND LIVE ITEM TEST MEDIA 20
Participants were debriefed once they had completed the study (Appendix H). A second
debriefing took place six days later, in which the research design and preliminary findings were
discussed.
Each participant received one Student Research Participation Programme Point and their
identification results. This study involved minimal risk. However, as a precautionary measure,
participants received the contact information of neighboring counselling services.
Results
Identification responses were organized in the following way:
Correct. Participant identified the target in a target present lineup.
Participant identified the target as ‘not present’ in a target absent lineup.
Incorrect.Participant identified a foil in a target present lineup.
Participant identified target as ‘not present’ in a target present lineup.
Participant could not make an identification (selected ‘do not know’).
Participant identified the suspect in a target absent lineup.
Participant identified a foil in a target absent lineup.
Data analysis was conducted using IBM Statistical Package for the Social Sciences
Version 25. Analyses for both blonde and brunette identification responses were run to ensure
pattern of results was not the result of a particularly distinctive face. Both sets of results have
been reported. Significance was set at p<.05.
Assumptions. There is a dichotomous dependent variable (correct, incorrect) and two
nominal, dichotomous predictor variables (item test media, lineup composition). Different
participants were used in each of the lineup groups and the dependent variable had both mutually
exclusive and exhaustive categories (correct, incorrect). As all assumptions were upheld, a binary
logistic regression was run to test the effects of ITM and lineup composition on the likelihood
that a participant will make a correct identification. More specifically the logistic regression
tested the following study hypotheses:
• That there will be a greater probability of observing a correct outcome with live
media when compared to photographic media.
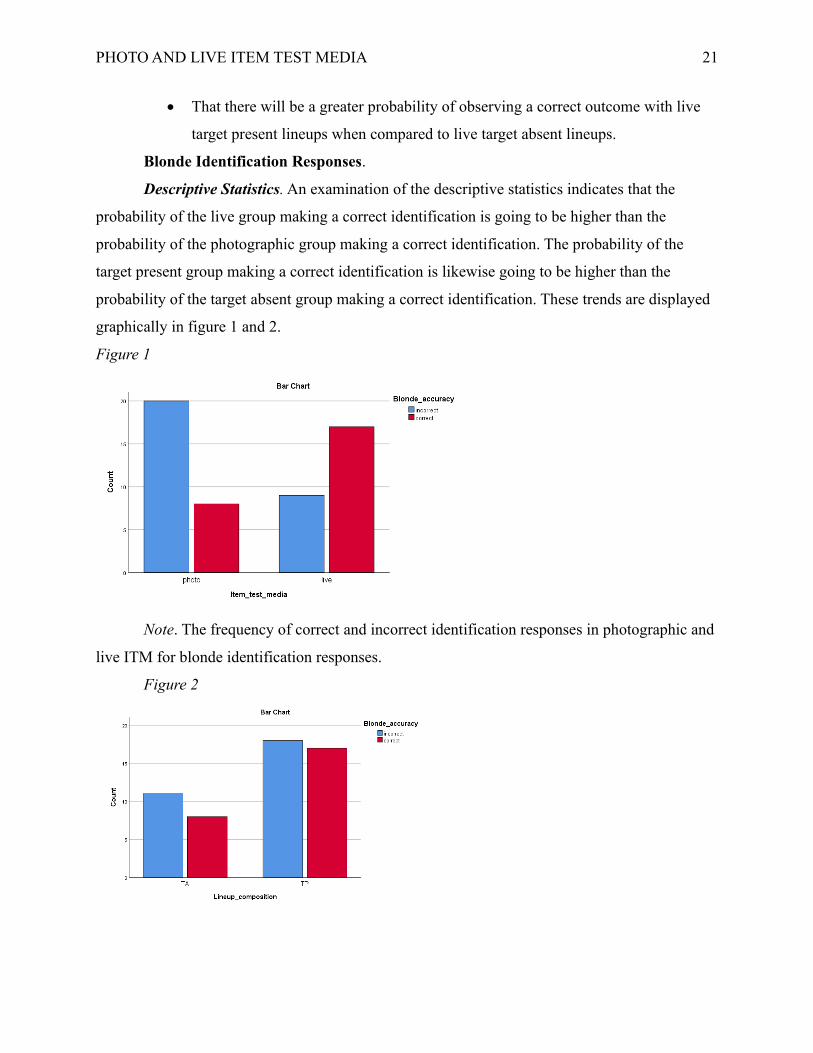
PHOTO AND LIVE ITEM TEST MEDIA 21
• That there will be a greater probability of observing a correct outcome with live
target present lineups when compared to live target absent lineups.
Blonde Identification Responses.
Descriptive Statistics. An examination of the descriptive statistics indicates that the
probability of the live group making a correct identification is going to be higher than the
probability of the photographic group making a correct identification. The probability of the
target present group making a correct identification is likewise going to be higher than the
probability of the target absent group making a correct identification. These trends are displayed
graphically in figure 1 and 2.
Figure 1
Note. The frequency of correct and incorrect identification responses in photographic and
live ITM for blonde identification responses.
Figure 2
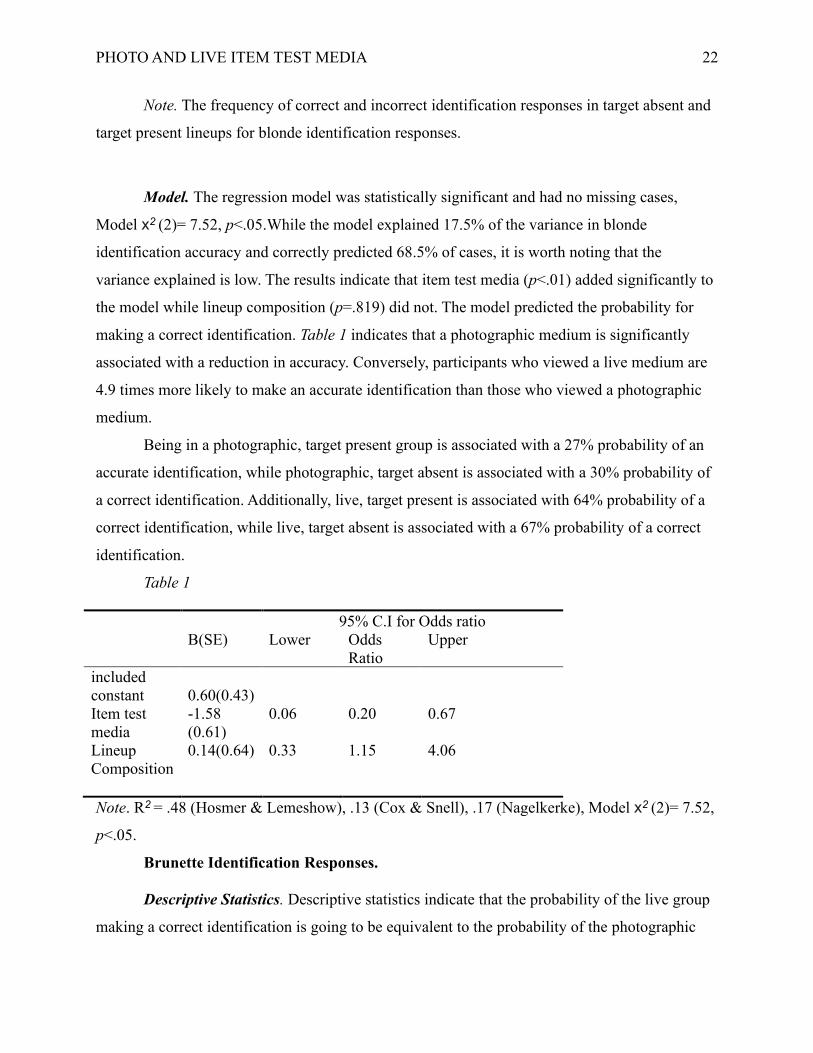
PHOTO AND LIVE ITEM TEST MEDIA 22
Note. The frequency of correct and incorrect identification responses in target absent and
target present lineups for blonde identification responses.
Model. The regression model was statistically significant and had no missing cases,
Model x2 (2)= 7.52, p<.05.While the model explained 17.5% of the variance in blonde
identification accuracy and correctly predicted 68.5% of cases, it is worth noting that the
variance explained is low. The results indicate that item test media (p<.01) added significantly to
the model while lineup composition (p=.819) did not. The model predicted the probability for
making a correct identification. Table 1 indicates that a photographic medium is significantly
associated with a reduction in accuracy. Conversely, participants who viewed a live medium are
4.9 times more likely to make an accurate identification than those who viewed a photographic
medium.
Being in a photographic, target present group is associated with a 27% probability of an
accurate identification, while photographic, target absent is associated with a 30% probability of
a correct identification. Additionally, live, target present is associated with 64% probability of a
correct identification, while live, target absent is associated with a 67% probability of a correct
identification.
Table 1
95% C.I for Odds ratio
B(SE) Lower Odds
Ratio
Upper
included
constant 0.60(0.43)
Item test
media
-1.58
(0.61)
0.06 0.20 0.67
Lineup
Composition
0.14(0.64) 0.33 1.15 4.06
Note. R2 = .48 (Hosmer & Lemeshow), .13 (Cox & Snell), .17 (Nagelkerke), Model x2 (2)= 7.52,
p<.05.
Brunette Identification Responses.
Descriptive Statistics. Descriptive statistics indicate that the probability of the live group
making a correct identification is going to be equivalent to the probability of the photographic
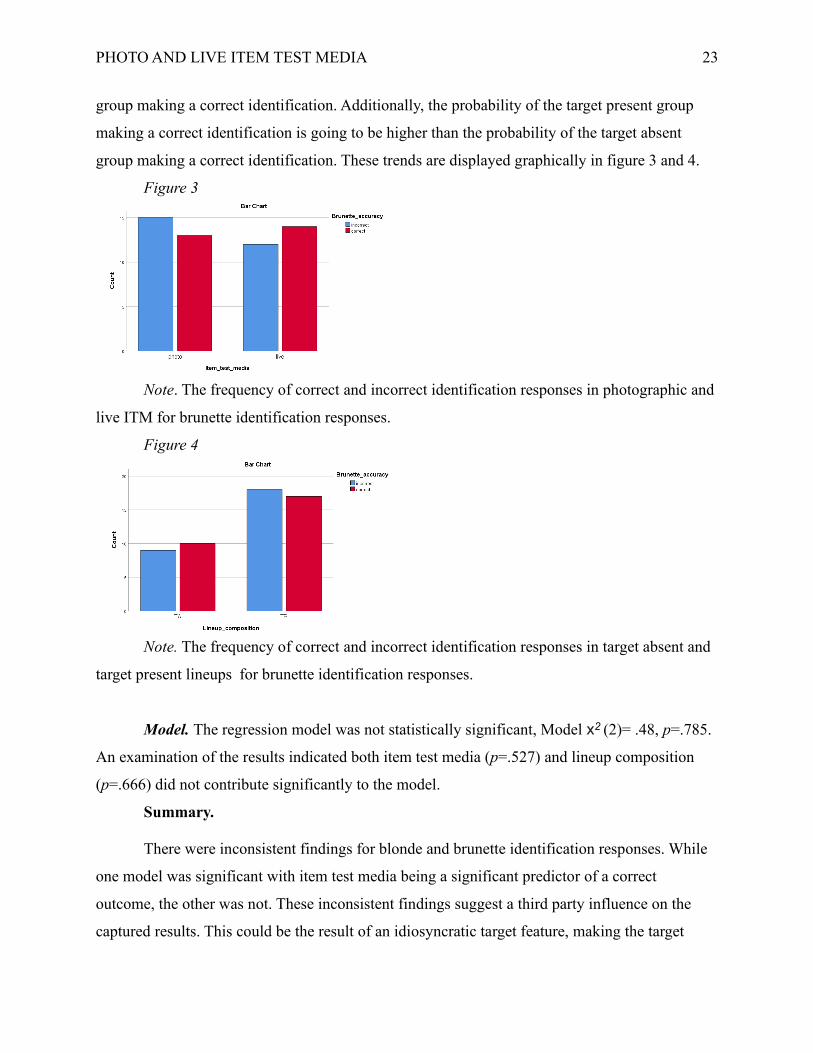
PHOTO AND LIVE ITEM TEST MEDIA 23
group making a correct identification. Additionally, the probability of the target present group
making a correct identification is going to be higher than the probability of the target absent
group making a correct identification. These trends are displayed graphically in figure 3 and 4.
Figure 3
Note. The frequency of correct and incorrect identification responses in photographic and
live ITM for brunette identification responses.
Figure 4
Note. The frequency of correct and incorrect identification responses in target absent and
target present lineups for brunette identification responses.
Model. The regression model was not statistically significant, Model x2 (2)= .48, p=.785.
An examination of the results indicated both item test media (p=.527) and lineup composition
(p=.666) did not contribute significantly to the model.
Summary.
There were inconsistent findings for blonde and brunette identification responses. While
one model was significant with item test media being a significant predictor of a correct
outcome, the other was not. These inconsistent findings suggest a third party influence on the
captured results. This could be the result of an idiosyncratic target feature, making the target
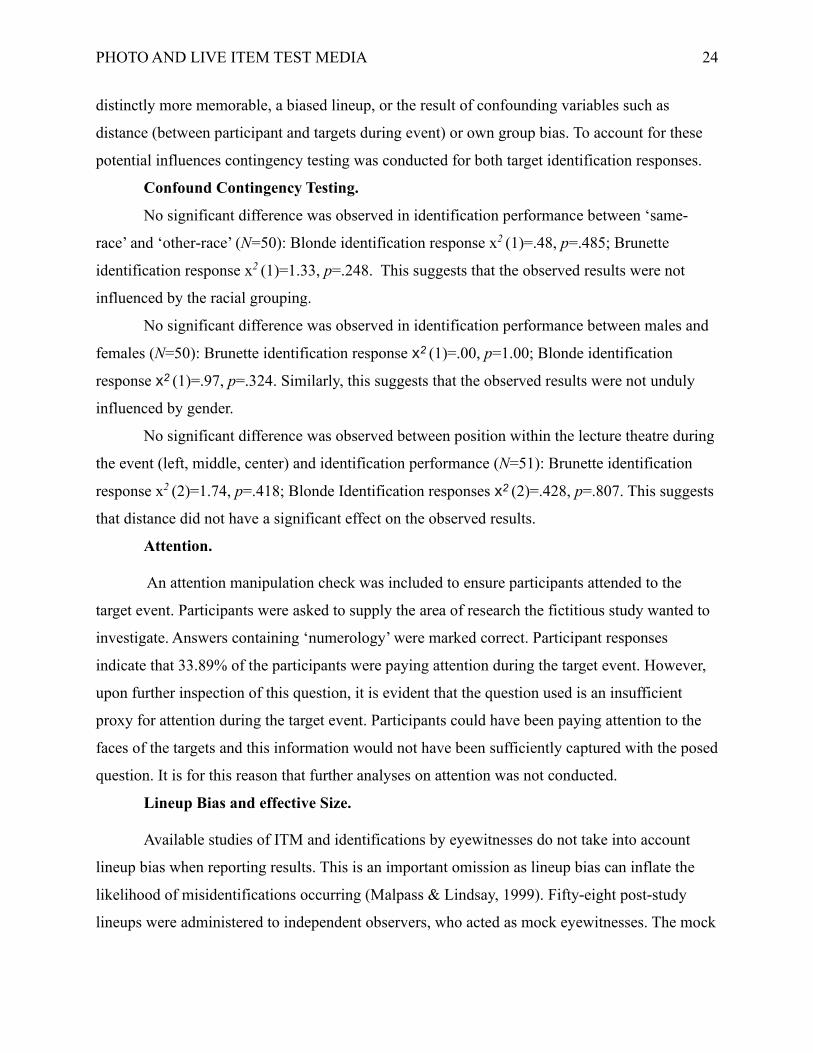
PHOTO AND LIVE ITEM TEST MEDIA 24
distinctly more memorable, a biased lineup, or the result of confounding variables such as
distance (between participant and targets during event) or own group bias. To account for these
potential influences contingency testing was conducted for both target identification responses.
Confound Contingency Testing.
No significant difference was observed in identification performance between ‘same-
race’ and ‘other-race’ (N=50): Blonde identification response x2 (1)=.48, p=.485; Brunette
identification response x2 (1)=1.33, p=.248. This suggests that the observed results were not
influenced by the racial grouping.
No significant difference was observed in identification performance between males and
females (N=50): Brunette identification response x2 (1)=.00, p=1.00; Blonde identification
response x2 (1)=.97, p=.324. Similarly, this suggests that the observed results were not unduly
influenced by gender.
No significant difference was observed between position within the lecture theatre during
the event (left, middle, center) and identification performance (N=51): Brunette identification
response x2 (2)=1.74, p=.418; Blonde Identification responses x2 (2)=.428, p=.807. This suggests
that distance did not have a significant effect on the observed results.
Attention.
An attention manipulation check was included to ensure participants attended to the
target event. Participants were asked to supply the area of research the fictitious study wanted to
investigate. Answers containing ‘numerology’ were marked correct. Participant responses
indicate that 33.89% of the participants were paying attention during the target event. However,
upon further inspection of this question, it is evident that the question used is an insufficient
proxy for attention during the target event. Participants could have been paying attention to the
faces of the targets and this information would not have been sufficiently captured with the posed
question. It is for this reason that further analyses on attention was not conducted.
Lineup Bias and effective Size.
Available studies of ITM and identifications by eyewitnesses do not take into account
lineup bias when reporting results. This is an important omission as lineup bias can inflate the
likelihood of misidentifications occurring (Malpass & Lindsay, 1999). Fifty-eight post-study
lineups were administered to independent observers, who acted as mock eyewitnesses. The mock
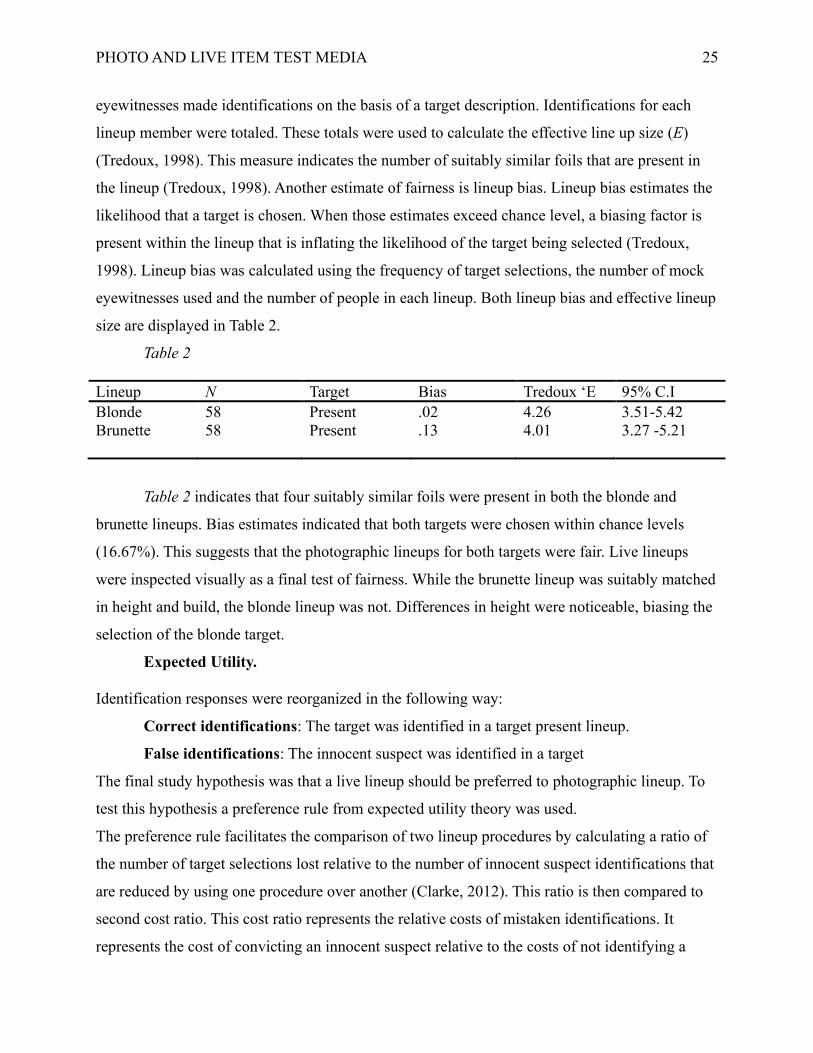
PHOTO AND LIVE ITEM TEST MEDIA 25
eyewitnesses made identifications on the basis of a target description. Identifications for each
lineup member were totaled. These totals were used to calculate the effective line up size (E)
(Tredoux, 1998). This measure indicates the number of suitably similar foils that are present in
the lineup (Tredoux, 1998). Another estimate of fairness is lineup bias. Lineup bias estimates the
likelihood that a target is chosen. When those estimates exceed chance level, a biasing factor is
present within the lineup that is inflating the likelihood of the target being selected (Tredoux,
1998). Lineup bias was calculated using the frequency of target selections, the number of mock
eyewitnesses used and the number of people in each lineup. Both lineup bias and effective lineup
size are displayed in Table 2.
Table 2
Lineup N Target Bias Tredoux ‘E 95% C.I
Blonde 58 Present .02 4.26 3.51-5.42
Brunette 58 Present .13 4.01 3.27 -5.21
Table 2 indicates that four suitably similar foils were present in both the blonde and
brunette lineups. Bias estimates indicated that both targets were chosen within chance levels
(16.67%). This suggests that the photographic lineups for both targets were fair. Live lineups
were inspected visually as a final test of fairness. While the brunette lineup was suitably matched
in height and build, the blonde lineup was not. Differences in height were noticeable, biasing the
selection of the blonde target.
Expected Utility.
Identification responses were reorganized in the following way:
Correct identifications: The target was identified in a target present lineup.
False identifications: The innocent suspect was identified in a target
The final study hypothesis was that a live lineup should be preferred to photographic lineup. To
test this hypothesis a preference rule from expected utility theory was used.
The preference rule facilitates the comparison of two lineup procedures by calculating a ratio of
the number of target selections lost relative to the number of innocent suspect identifications that
are reduced by using one procedure over another (Clarke, 2012). This ratio is then compared to
second cost ratio. This cost ratio represents the relative costs of mistaken identifications. It
represents the cost of convicting an innocent suspect relative to the costs of not identifying a
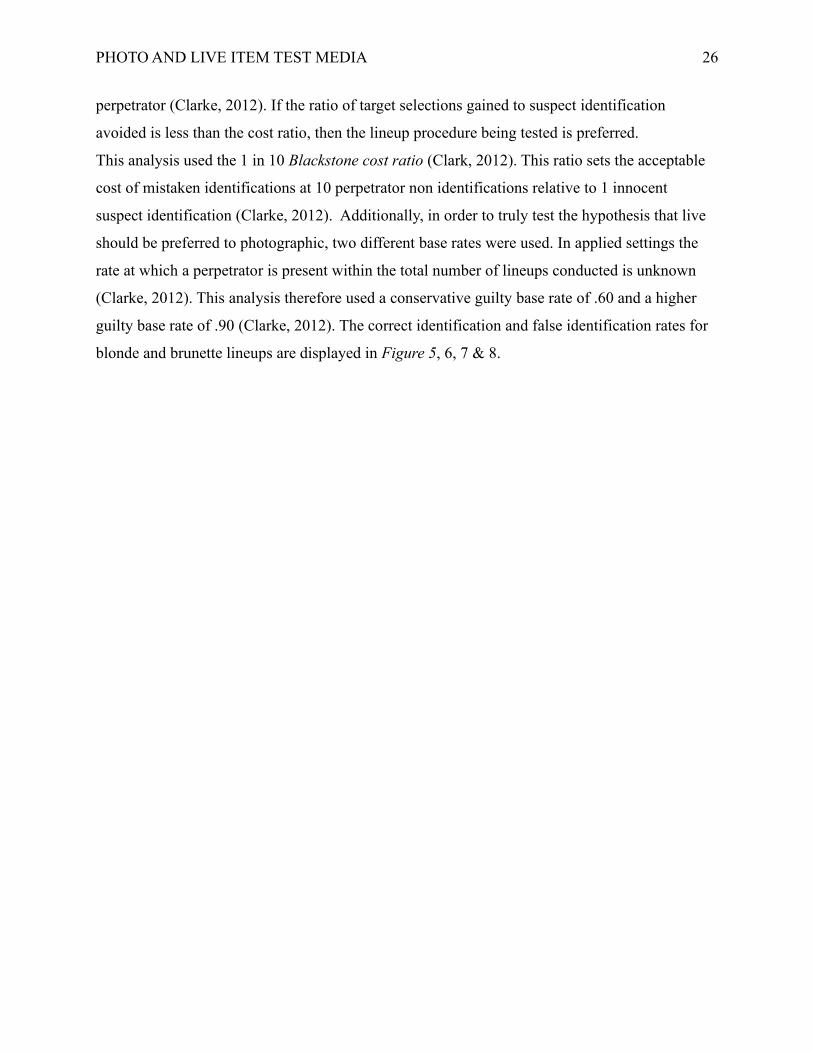
PHOTO AND LIVE ITEM TEST MEDIA 26
perpetrator (Clarke, 2012). If the ratio of target selections gained to suspect identification
avoided is less than the cost ratio, then the lineup procedure being tested is preferred.
This analysis used the 1 in 10 Blackstone cost ratio (Clark, 2012). This ratio sets the acceptable
cost of mistaken identifications at 10 perpetrator non identifications relative to 1 innocent
suspect identification (Clarke, 2012). Additionally, in order to truly test the hypothesis that live
should be preferred to photographic, two different base rates were used. In applied settings the
rate at which a perpetrator is present within the total number of lineups conducted is unknown
(Clarke, 2012). This analysis therefore used a conservative guilty base rate of .60 and a higher
guilty base rate of .90 (Clarke, 2012). The correct identification and false identification rates for
blonde and brunette lineups are displayed in Figure 5, 6, 7 & 8.
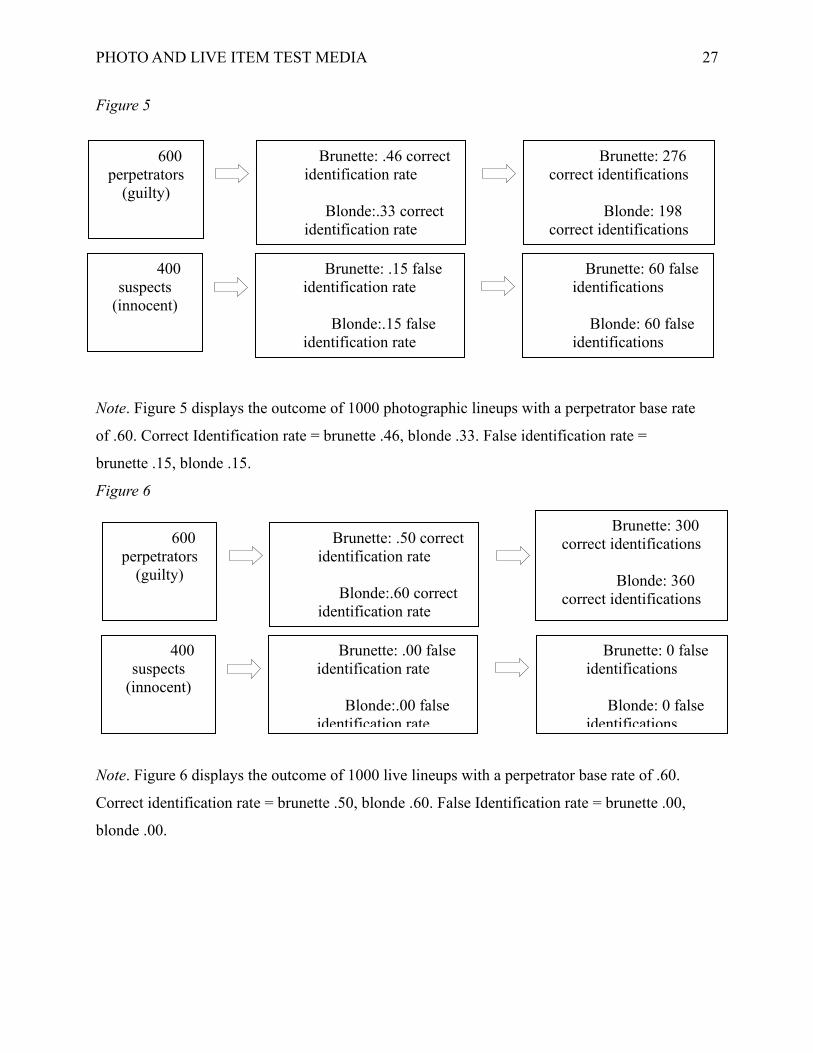
PHOTO AND LIVE ITEM TEST MEDIA 27
Figure 5
Note. Figure 5 displays the outcome of 1000 photographic lineups with a perpetrator base rate
of .60. Correct Identification rate = brunette .46, blonde .33. False identification rate =
brunette .15, blonde .15.
Figure 6
Note. Figure 6 displays the outcome of 1000 live lineups with a perpetrator base rate of .60.
Correct identification rate = brunette .50, blonde .60. False Identification rate = brunette .00,
blonde .00.
600
perpetrators
(guilty)
Brunette: .46 correct
identification rate
Blonde:.33 correct
identification rate
400
suspects
(innocent)
Brunette: .15 false
identification rate
Blonde:.15 false
identification rate
Brunette: 60 false
identifications
Blonde: 60 false
identifications
Brunette: 276
correct identifications
Blonde: 198
correct identifications
600
perpetrators
(guilty)
Brunette: .50 correct
identification rate
Blonde:.60 correct
identification rate
400
suspects
(innocent)
Brunette: .00 false
identification rate
Blonde:.00 false
identification rate
Brunette: 0 false
identifications
Blonde: 0 false
identifications
Brunette: 300
correct identifications
Blonde: 360
correct identifications
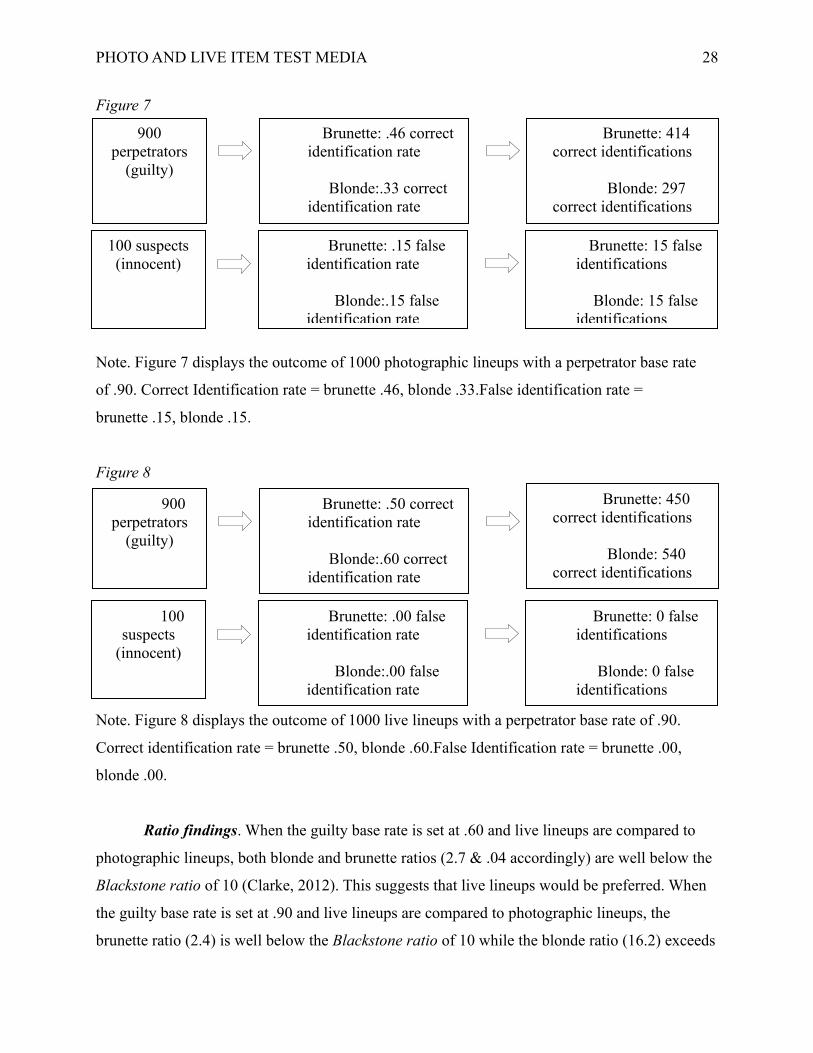
PHOTO AND LIVE ITEM TEST MEDIA 28
Figure 7
Note. Figure 7 displays the outcome of 1000 photographic lineups with a perpetrator base rate
of .90. Correct Identification rate = brunette .46, blonde .33.False identification rate =
brunette .15, blonde .15.
Figure 8
Note. Figure 8 displays the outcome of 1000 live lineups with a perpetrator base rate of .90.
Correct identification rate = brunette .50, blonde .60.False Identification rate = brunette .00,
blonde .00.
Ratio findings. When the guilty base rate is set at .60 and live lineups are compared to
photographic lineups, both blonde and brunette ratios (2.7 & .04 accordingly) are well below the
Blackstone ratio of 10 (Clarke, 2012). This suggests that live lineups would be preferred. When
the guilty base rate is set at .90 and live lineups are compared to photographic lineups, the
brunette ratio (2.4) is well below the Blackstone ratio of 10 while the blonde ratio (16.2) exceeds
900
perpetrators
(guilty)
Brunette: .46 correct
identification rate
Blonde:.33 correct
identification rate
100 suspects
(innocent)
Brunette: .15 false
identification rate
Blonde:.15 false
identification rate
Brunette: 15 false
identifications
Blonde: 15 false
identifications
Brunette: 414
correct identifications
Blonde: 297
correct identifications
900
perpetrators
(guilty)
Brunette: .50 correct
identification rate
Blonde:.60 correct
identification rate
100
suspects
(innocent)
Brunette: .00 false
identification rate
Blonde:.00 false
identification rate
Brunette: 0 false
identifications
Blonde: 0 false
identifications
Brunette: 450
correct identifications
Blonde: 540
correct identifications
PHOTO AND LIVE ITEM TEST MEDIA 29
it. This suggests that when the guilty base rate is higher, brunette data suggests that live is
preferred while blonde data does not support this assertion.
Discussion
The study first hypothesized that there would be a greater probability of observing a
correct outcome with live media when compared to photographic media. In order to test this live
superiority hypothesis, a logistic regression was run to test the effects of ITM (photographic,
live) on identification accuracy. Blonde identification responses produced a significant model
with ITM being a significant predictor of a correct identification; however brunette identification
responses did not. Within the brunette model, ITM did not significantly predict accuracy.
Inconsistencies between findings for blonde and brunette identification responses were attributed
to noticeable differences between the blonde target’s height and the blonde foils height within the
live lineup. This biased the blonde identification responses captured. However, brunette
photographic and live lineups were found to be reasonably fair. If the blonde identification
responses are excluded from the analyses, the brunette responses suggest that the live superiority
hypothesis is unsupported. Within the young adults sampled, a live medium was not associated
with a higher likelihood of a correct outcome occurring. This finding is consistent with the
conclusion drawn from a meta-analytic review of ITM in which no evidentiary basis for the live
superiority hypothesis was observed (Price, Harvey, Anderson, Chadwick & Fitzgerald, 2018).
The results of this study add to an underdeveloped body of research using live ITM. The
limited availability of studies using live ITM ensures that only tentative conclusions can be
drawn. Only through replication and a greater number of studies can generalizable assertions be
made about the merit of the commonly held belief that live media produces more accurate
identifications when compared to photographic media. This belief is particularly important
within the South African context where this belief shapes triers of facts opinions of the
credibility attached to eyewitness testimony given through one medium relative to another, and
this in turn shapes the procedural conduct of identifications, whereby a live lineup is insisted
upon. Given the importance of investigations into the live superiority hypothesis within the
South African context and the fact that available studies are typically conducted using samples
with distinctly different demographic compositions to those found within South Africa, this study
added to the literature with the inclusion of a diverse, South African sample. The generalizability
of this finding is however, limited by a small sample size. While this finding still hold merit and
PHOTO AND LIVE ITEM TEST MEDIA 30
adds to the available literature, further research is needed to test the replicability of these results.
If this finding is replicable this would suggest that both photographic and live are suitable
mediums, with one not more associated with a correct outcome relative to the other.
This study also hypothesized that there would be a greater probability of observing a
correct outcome in a target present as opposed to target absent lineup. This hypothesis was tested
using a logistic regression, where lineup composition (target absent, target present) was included
as a predictor of identification accuracy. A significant trend was noted in both blonde and
brunette identification responses wherein the frequency of correct outcomes was higher for target
present when compared to target absent lineups. However, this trend did not translate into lineup
composition being a significant predictor of accuracy. The brunette responses suggest that while
the hypothesis may be true for the young adults sampled, the probability of observing a correct
outcome within a target present lineup was not significantly greater than the probability of a
correct outcome within a target absent lineup. This finding was inconsistent with available
research which reports higher identification accuracy is associated with a target present lineup
when compared to a target absent lineup.
Lastly, this study hypothesized that live media should be preferred to photographic
media. In order to test this assumption a preference rule from expected utility theory was used to
compare the ratio of correct identifications lost to the number of false identifications that were
avoided in live and photographic lineups at varying guilty base rates. When the guilty base rate is
at a conservative .60 rate, both blonde and brunette identification responses suggested that a live
lineup be preferred to a photographic lineup. When a higher guilty base rate was tested brunette
responses again suggested that the live be preferred while the blonde suggested it should not. If
the blonde identification responses are removed from the analyses, thereby removing all bias, the
brunette responses suggest that live lineups should be preferred. This finding lends support to the
live superiority hypotheses under low and high guilty base rates. This was unexpected given the
results for the logistic regression, which showed ITM was not significantly associated with a
correct outcome. The observed results could be reflective of only one cost ratio being used.
Future research should consider implementing additional cost ratio estimates, beyond the
Blackstone ratio to see if the pattern of results remains constant.
Conclusion

PHOTO AND LIVE ITEM TEST MEDIA 31
This study tested the effect of both ITM and lineup composition on the identification
responses of South African young adults. Given the prevalence of the belief that a live medium is
associated with an increased probability of a correct identification being made, three aligned
study hypotheses were formulated to test this belief. Results showed that ITM, and by extension,
a live medium were not a significant predictor of correct identifications. A further result showed
that live lineups could be preferred to photographic lineups when compared to a 10-to-1
Blackstone ratio. The results therefore suggest an equal refutation and equal support for the live
superiority hypothesis within the tested sample.
PHOTO AND LIVE ITEM TEST MEDIA 32
Acknowledgements
I would first like to thank my supervisors Prof. Tredoux, Dr. Alicia Nortje & Calyvyn DuToit
(Hons).
Prof. Tredoux, your insights and guidance at every stage of this study provided so much support.
Thank you.
Dr. Alicia Nortje, your door was always open for a chat, priceless advice and insights at every
stage of the process. This was so appreciated.
Calvyn DuToit, your advice and support has been so appreciated.
Thank you to both Rosalind Adams and Dr. Leigh Schrieff for all that you do.
I would like to thank all members of the EYE research team who not only provided continued
support throughout the year but who helped administer the testing session. Thank you.
I would like to thank Milton Gerring for his statistical prowess and assistance in this study.
I would like thank Jason Love for his continued friendship, support and assistance throughout the
year. It is so appreciated!
I would like to thank Kyra Scott. Thank you for the all the late night memes, support and advice
I would like to personally thank all the members of the tea crew for the support and laughs
you’ve provided throughout the year. Thank you for making this year all that it was.
Lastly, I would like to thank my mother for her continued support. This was invaluable.
PHOTO AND LIVE ITEM TEST MEDIA 33
References
Albright, T. (2017). Why eyewitnesses fail. Proceedings Of The National Academy Of
Sciences, 114(30), 7758-7764. doi: 10.1073/pnas.1706891114
Begakis, C. (2017). Eyewitness Misidentifications: A comparative Analysis between the United
States and England, Santa Clara Journal of International Law, 15, 173 – 196.
Brace, N., Pike, G., Kemp, R., & Turner, J. (2009). Eye-Witness Identification Procedures and
Stress: A Comparison of Live and Video Identification Parades. International Journal Of
Police Science & Management, 11(2), 183-192. doi: 10.1350/ijps.2009.11.2.122
Brewer, N., & Palmer, M. (2010). Eyewitness identification tests. Legal And Criminological
Psychology, 15(1), 77-96. doi: 10.1348/135532509x414765
Clark, S. (2012) Costs and Benefits of Eyewitness Identification Reform: Psychological
Science and Public Policy. Perspectives on Psychological Science 7(3) 238– 259.
doi: 10.1177/1745691612439584
Clark, S. (2012) Costs and Benefits of Eyewitness Identification Reform: Psychological
Science and Public Policy. Perspectives on Psychological Science 7(3) 238– 259.
doi: 10.1177/1745691612439584
Cutler, B. L., Berman, G. L., Penrod, S., & Fisher, R. P. (1994). Conceptual, practical, and
empirical issues associated with eyewitness identification test media. In D. F. Ross, J. D.
Read, & M. P. Toglia (Eds.), Adult eyewitness testimony: Current trends and
developments (pp. 163-181). New York, NY, US: Cambridge University Press.
doi:10.1017/CBO9780511759192.009
doi:10.1037/0022-3514.36.12.1546
DuToit, C. & Tredoux, C. (2018). Increased Eyewitness Accuracy Through Live Encoding and
Recognition Mediums. Retrieved 6 July 2019, from
PHOTO AND LIVE ITEM TEST MEDIA 34
http://www.psychology.uct.ac.za/sites/default/files/image_tool/images/117/Logos/thesi
s/Calvin%20Du%20Toit%20Increased%20Eyewitness%20Accuracy%20Through%20Li
ve %20Encoding%20and%20Recognition%20Mediums.pdf
Egan, D., Pittner, M., & Goldstein, A. (1977). Eyewitness identification: Photographs vs. live
models. Law And Human Behavior, 1(2), 199-206. doi: 10.1007/bf01053439
Ellis, H.D. (1981). Theoretical aspects of face recognition. In G.M. Davies, H.D. Ellis & J.W.
Shepherd (eds.), Perceiving and Remembering Faces. pp. 171–200. London: Academic
Press.
Fitzgerald, R., Price, H., & Valentine, T. (2018). Eyewitness identification: Live, photo, and
video lineups. Psychology, Public Policy, And Law, 24(3), 307-325. doi:
10.1037/law0000164
Humphries, J., Holliday, R. & Flowe, H. (2012). Faces in Motion:Age-Related Changes in
Eyewitness Identification Performance in Simultaneous, Sequential, and Elimination
Video Lineups, Applied Cognitive Psychology, 26, 149 – 158. DOI: 10.1002/acp.1808
Innocence Project. (2019). DNA Exonerations in the United States, Retrieved 1 October 2019,
from https://www.innocenceproject.org/dna-exonerations-in-the-united-states/
Kerstholt, J., Koster, E., & van Amelsvoort, A. (2004). Eyewitnesses: A comparison of live,
video, and photographic line-ups. Journal of Police and Criminal Psychology, 19(2), 15–
22. doi:10.1007/BF02813869
Li, K. (2010). Who Did You See? An Evaluation of the Criminal Justice System’s Response to
the Danger of Eyewitness Misidentification, Auckland University Law Review, 16(217),
217-242.
PHOTO AND LIVE ITEM TEST MEDIA 35
Malpass, R. & Lindsay, R. (1999). Measuring Lineup Fairness, Applied Cognitive Psychology,
13, S1-S7.
Memon, A. & Gabbert, F.(2003). Improving The Identification Accuracy of Senior Witnesses:
Do Prelineup and Sequential Testing Help?, Journal of Applied Psychology, 88(2), 341 –
347. DOI: 10.1037/0021-9010.88.2.341
Person Identification. Applied Cognitive Psychology, 27(6), 761–768.
doi:10.1002/acp.2969
Price, H., Harvey, M., Anderson, S., Chadwick, L., & Fitzgerald, R. (2018). Evidence for the
Belief in Live Lineup Superiority. Journal Of Police And Criminal Psychology, 34(3),
263-269. doi: 10.1007/s11896-018-9305-x
Rice, A., Phillips, P., & O’Toole, A. (2013). The Role of the Face and Body in Unfamiliar
Rice, A., Phillips, P., & O'Toole, A. (2013). The Role of the Face and Body in Unfamiliar
Person Identification. Applied Cognitive Psychology, 27(6), 761-768. doi:
10.1002/acp.2969
Rust, A. & Tredoux, A. (1998). An Empirical Survey of Legal Recommendations and Police
Practice in South Africa, South African Journal of Criminal Justice, 11, 196 – 212.
Semmler, C., Dunn, J., Mickes, L., & Wixted, J. (2019). The role of estimator variables in
eyewitness identification. Retrieved 13 October 2019, from
https://digital.library.adelaide.edu.au/dspace/bitstream/2440/115100/3/hdl_115100.pd
f
South African Police Services. (2018). Annual Crime Report 2017/2018. Retrieved 1 October
2019, from https://www.saps.gov.za/services/annual_crime_report2019.pdf
PHOTO AND LIVE ITEM TEST MEDIA 36
Statistics SA. (2019). Governance, Public Safety and Justice Survey, GPSJS 2018/19. Retrieved
5 October 2019, from http://www.statssa.gov.za/publications/P0341/P03412018.pdf
Steblay, N., Dysart, J., Fulero, S., & Lindsay, R. (2001). Eyewitness accuracy rates in sequential
and simultaneous lineup presentations: A meta-analytic comparison. Law And Human
Behavior, 25(5), 459-473. doi: 10.1023/a:1012888715007
Tredoux, C. (1988). Statistical Inference on measures of lineup fairness, Law and Human
Behaviour, 22(2), 219 -237. Doi:10.1023/A:1025746220886
Tredoux, C. (2011). Inaugural Lecture. Retrieved 16 September 2019, from
http://citeseerx.ist.psu.edu/viewdoc/download?doi=10.1.1.462.7700&rep=rep1&type=p
df
Wells, G. (1978). Applied Eyewitness-Testimony Research: System Variables and Estimator
Variables, Journal of Personality and Social Psychology, 36(12), 1546 – 1557.
Wells, G. L. (1978). Applied eyewitness-testimony research: System variables and estimator
variables. Journal of Personality and Social Psychology, 36(12), 1546-1557.
Wells, G., Kovera, B., Douglass, A., Brewer, N., Meissner, C. & Wixted, J. (2019). Policy and
Procedure Recommendations for the Collection and Preservation of Eyewitness
Identification Evidence [draft]
Wixted, J., & Wells, G. (2017). The Relationship Between Eyewitness Confidence and
Identification Accuracy: A New Synthesis. Psychological Science In The Public
Interest, 18(1), 10-65. doi: 10.1177/1529100616686966
Wright, D., & Sladden, B. (2003). An own gender bias and the importance of hair in face
recognition. Acta Psychologica, 114(1), 101-114. doi: 10.1016/s0001-6918(03)00052-0

PHOTO AND LIVE ITEM TEST MEDIA 37
Appendix A
Randomized lineup conditions and their group names.
Yellow dot. First viewing order, live-target absent.
Yellow no dot. Second viewing order, live-target absent.
Orange dot. First viewing order, live-target present.
Orange no dot. Second viewing order, live-target present.
Pink dot. First viewing order, photographic-target present.
Pink no dot. Second viewing order, photographic-target present.
Purple dot. First viewing order, photographic-target absent.
Purple no dot. Second viewing order, photographic-target present.
Target absent Target present
Viewing order
1 (dot)
First
lineup:
Brunette,
position 5
Second lineup:
Blonde,
Position 2
First lineup:
Blonde,
position 2
Second lineup:
Brunette, position 5
Viewing order
2
(no dot)
First
lineup:
Blonde,
position 1
Second lineup:
Brunette,
position 6
First lineup:
Blonde,
position 6
Second lineup:
Brunette, position 1
PHOTO AND LIVE ITEM TEST MEDIA 38
Orange
Appendix B
An example of the Consent Form (Orange Dot)
Your group:
This study investigates memory for an unexpected event and will be incorporated into
this course as a teaching exercise. This study is a core component of my Honour’s coursework
and is under the supervision of Prof. Tredoux, Dr. Nortje and Mr. DuToit (Hons). This study will
take place within this lecture period and will take 30minutes to complete.
Procedure
You will be asked to remember the colour of the group you are assigned too (printed at
the top of the page) and if that group assignment had a dot or no dot. You will be given two tasks
to complete. Both tasks will ask you various short answer questions about the staged SRPP
advertisement you saw at the beginning of the lecture.
Benefits
For your time and your participation, you will receive 1 SRPP point towards your SRPP
requirement. This study is designed to complement the memory lecture series and to be used as a
teaching tool. To this end, you will receive a copy of your individual results via email and the
overall study results will be discussed during Tuesday’s lecture (1.10.19). It is expected that not
everyone will remember the information accurately.
Risk
This study involves minimal risk.
Voluntary Participation
Participation in this study is voluntary. You do not have to participate in this study. Even
if you do, you can refuse any question without needing to give a reason for your decision. Your
decision to participate in this study will not affect your marks or your academic career. If you
choose to participate, you can change your mind at any time and there will be no negative
consequences.
PHOTO AND LIVE ITEM TEST MEDIA 39
Confidentiality
Your name and student number will be collected so you can get 1 SRPP point for your
participation, and so that your individual results can be emailed to your student account. This
information will not be distributed. Consent and study forms will be kept in a locked desk.
Participant names and student numbers will not be used in the project (we will assign participant
numbers or unique IDs instead), nor will they be used in the overall study results presentation or
in any future publication based on this research. This study will make every effort to ensure
participant confidentiality and that data is anonymized. You can choose whether or not you wish
to share your individual results with your classmates and friends, you are under no obligation to
do so.
If you would like more information regarding the study, you can talk to the researcher
any time, using [email protected].
If you have any questions about the rights you have as a study participant, comments or
complaints about this study, please contact:
Rosalind Adams, UCT Department of Psychology
Contact: 021 650 3417
Email: [email protected]
I have read the above and I am satisfied with my understanding of the study including its
possible benefits and risks. I voluntarily consent to participate.
Name:_____________________________________________________________
Student number:______________________________________________________
Participant signature:_______________________ Date: 25.09.19
Researchers signature:______________________ Date: 25.09.19

PHOTO AND LIVE ITEM TEST MEDIA 40
Appendix C
Demographic Survey
Demographic and additional Information
Some demographic and additional information is required which can be filled in on the
spaces provided (see below).
Name:__________________________________________________________
Age:____________________________________________________________
What gender do you identify with?____________________________________
What race do you identify with?_______________________________________
What is the number of the row you are sitting in (Row 1 is closest to the front of the
lecture venue)?___________________________________________________________
Are you sitting in the left / middle or right hand section of the lecture venue (from your
perspective, facing the front of the lecture venue)? __________________________________
Course code you would like your SRPP point to go towards: PSY2014S
Please read before tearing
Please tear off the consent and demographic forms from your pack. Please pass these
forms, turned upside down, to the end of your row where they will be collected.
Next, please complete the first task on the next page.

PHOTO AND LIVE ITEM TEST MEDIA 41
Target 1 description:
__________________________________________________________________________
________________________________________________________________________________
________________________________________________________________________________
________________________________________________________________________________
________________________________________________________________________________
________________________________________________________________________________
________________________________________________________________________________
__________________________________________________________________________
_________ Target 2 description:
__________________________________________________________________________
________________________________________________________________________________
________________________________________________________________________________
________________________________________________________________________________
________________________________________________________________________________
________________________________________________________________________________
________________________________________________________________________________
_______
Appendix D
Free recall description
I would now like you to describe the two people you saw, who gave a staged SRPP
advertisement at the beginning of the lecture. Your descriptions could be used as the basis for
identifying those people.
When you are finished please tear off this form. When everyone is finished please pass
this form, turned upside down, to the end of your row where it will be collected.
Name:_____________________________________________________________
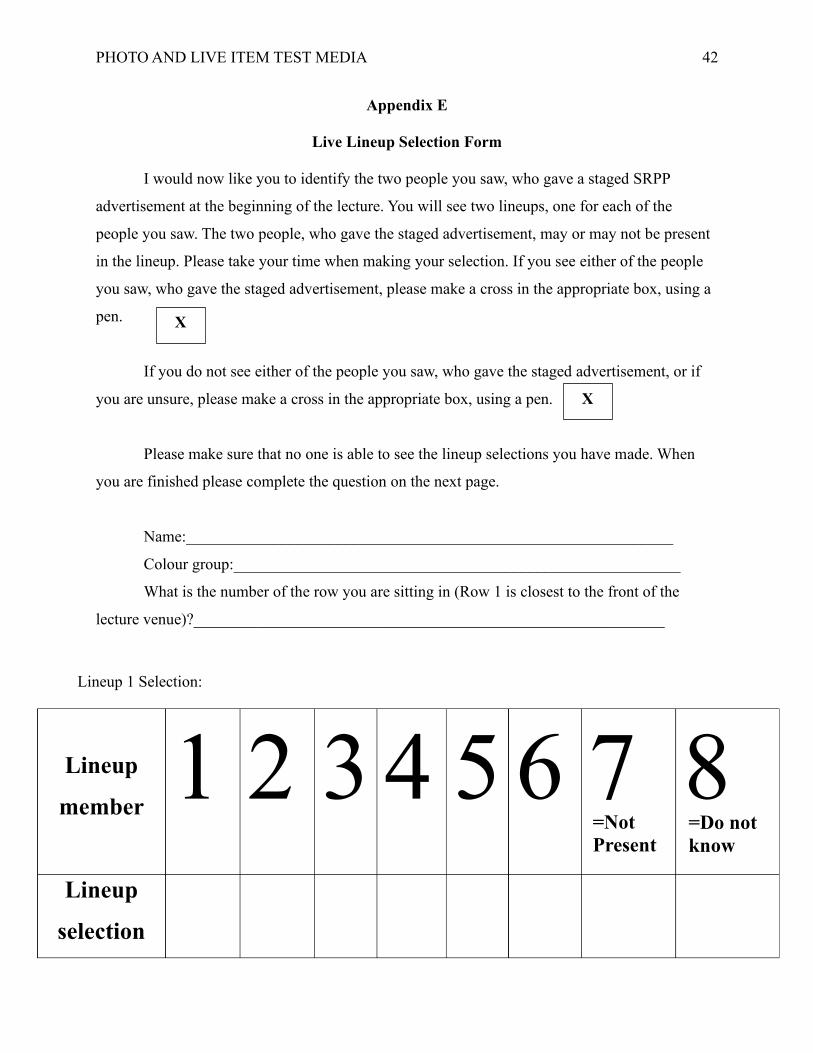
PHOTO AND LIVE ITEM TEST MEDIA 42
Appendix E
Live Lineup Selection Form
I would now like you to identify the two people you saw, who gave a staged SRPP
advertisement at the beginning of the lecture. You will see two lineups, one for each of the
people you saw. The two people, who gave the staged advertisement, may or may not be present
in the lineup. Please take your time when making your selection. If you see either of the people
you saw, who gave the staged advertisement, please make a cross in the appropriate box, using a
pen.
If you do not see either of the people you saw, who gave the staged advertisement, or if
you are unsure, please make a cross in the appropriate box, using a pen.
Please make sure that no one is able to see the lineup selections you have made. When
you are finished please complete the question on the next page.
Name:_____________________________________________________________
Colour group:________________________________________________________
What is the number of the row you are sitting in (Row 1 is closest to the front of the
lecture venue)?___________________________________________________________
Appendix F
Confidence
Using a scale of 0 to a 100, where 0 is extremely not confident to 100 being
extremely confident, how confident are you with the lineup selection you just made?
Please draw a vertical line or dash on the scale below to indicate how confident
you are, and please write the corresponding confidence value in the space provided (see below)
i.e. 60%
Lineup 1 Selection:
Lineup
member 1 2 3 4 5 6 7 8
Lineup
selection
=Not
Present
=Do not
know
X
X

PHOTO AND LIVE ITEM TEST MEDIA 43
Appendix F
Confidence
Using a scale of 0 to a 100, where 0 is extremely not confident to 100 being extremely
confident, how confident are you with the lineup selection you just made? Please draw a vertical
line or dash on the scale below to indicate how confident you are, and please write the
corresponding confidence value in the space provided (see below) i.e. 60%
Please read before tearing
Please tear off lineup 1 selection and confidence forms from your pack. Please pass these
forms, turned upside down, to the end of your row where they will be collected.
Next, please turn to the task on the next page and wait for the next lineup to enter.
Lineup 1 Confidence:
0 50
100
Extremely not confident Moderately confident Extremely
confident
Corresponding confidence value:___________________________

PHOTO AND LIVE ITEM TEST MEDIA 44
Appendix G
Attention and Familiarity Questions
Familiarity
Do you know anyone in either of the lineups you saw?
Please answer this question with a yes or a no in the space provided (see below):
Attention
What kind of study was the staged advertisement advertising?
Please read before tearing
Please tear off lineup 2 selection, confidence and control question forms from your pack.
Please pass these forms, turned upside down, to the end of your row where they will be collected.
Lastly, please turn to the next page, and read the debriefing form
PHOTO AND LIVE ITEM TEST MEDIA 45
Appendix H
Debriefing
Thank you for taking the time to participate in this study. This study was conducted under the supervision
of Prof. Tredoux, Dr. Nortje & Mr. DuToit (Hons).
While we can recognize familiar faces fairly quickly and accurately, unfamiliar faces pose a greater
challenge. Reliable face identification is critically important in police investigations and a lineup task usually tests
memory for an unfamiliar face. This is a difficult task. Mistaken identifications are mostly the result of errors of
cognition, either a failure in the encoding or in retrieval process (found in 70% of cases) (Innocence Project, n.d.).
Mistaken identifications translate into one of the greatest causes of a miscarriage of justice wherein an innocent
suspect is wrongfully imprisoned (Innocence Project, n.d.). It is therefore expected that not everyone that
participated in this study will remember the information accurately.
Given the challenges involved in unfamiliar face recognition, a universal, common-sensical belief exists in
the superiority of a live as opposed to a photographic recognition medium (Fitzgerald, Price & Valentine, 2018).
This belief is based on the fact that live and photographic recognition mediums differ in the amount of information,
or cues, available to an eyewitness. Unlike a photographic, a live recognition medium offers gait and whole body
information (Fitzgerald, Price & Valentine, 2018). It also offers a chance to see the unfamiliar face in different poses
(turning left or right) (Fitzgerald, Price & Valentine, 2018). The belief is therefore that the more information
available to the eyewitness, the better their chances of making a correct identification. This holds true within South
Africa. Serious crimes, which appear before the high court, require a live identification parade be held whereas less
severe crimes, which appear before lower or magistrate courts, require a photographic parade to be held.
It should then follow that these differences translate into discernible identification performance (accuracy)
patterns across photographic and live recognition mediums. However, this is not the case within the eyewitness
literature. Additionally, live parades cost significantly more to conduct than their photographic counterparts.
The study aim was therefore to investigate and compare the effects of recognition medium (photographic or
live) on identification performance (accuracy), to test the live superiority hypothesis (Fitzgerald, Price & Valentine,
2018). This will be achieved by measuring and comparing the number of correct hits (correct identifications) and
misses (incorrect rejection of a lineup when a target is present or incorrectly identifying a known innocent lineup
member, known as a foil).
What happened in the study?
You were asked to describe the two people you saw, who gave the staged SRPP advertisement. You were
also asked to identify these two people in a lineup task. You were shown two lineups, one for each of the people you
saw. You were randomly assigned into one of four groups when you received the study forms. Based on your group
allocation, you will have seen either a live-target absent, live-target present, photographic-target absent or
photographic-target present lineups.
Why was I not told to remember the two faces prior to the staged advertisement?

PHOTO AND LIVE ITEM TEST MEDIA 46
https://outlook.office365.com/owa/cale
ndar/STUDENTWELLNESSSERVICEPSYCH
bookings/
Lineups are a test of eyewitness memory for a specific event and it is known that attentional factors such as
whether an object or event was intentionally or incidentally (unexpectedly) encoded can “affect memory
performance” (Brewer & Williams, 2005 pg.101).
If you intentionally memorize something you are more likely to recall more information and more accurate
information about the thing you memorized (Brewer & Williams, 2005). Events in real life are rarely intentionally
committed to memory, this holds true for memories of a crime (Brewer & Williams, 2005). Using an incidental or
unexpected live event increases the validity of eyewitness study data.
Counselling Services
If, for any reason, you feel distressed as a result of participating in this study, please tell the researcher/s.
We will talk to you about free and/or donation based counselling services that are near to UCT. Once you are
comfortable with your options, and should you need it, you can book an appointment with any of the counselling
service providers listed below:
1. UCT Student Wellness 2. Hope Counselling Centre
The Student Wellness Service Counselling Services operating
Address: Ivan Toms Building on donations
28 Rhodes Ave i.14 Silverhurst Way
Mowbray 7700 Bergvliet
Tel: 021 650 1017 Email:[email protected]
Online booking portal: ii. 6 Lang Street
Kuils River
Tel: 021 903 0521
Email:[email protected]
iii. 236 Blaauwberg Road
Table View
Tel: 021 522 9228
Email:[email protected]
3. LifeLine 4. South African Depression &
Anonymous telephonic counselling Anxiety Group (SADAG)
between 09h00 and 22h00 UCT 24/7 helpline
Tel : 021 461 1111 Tel : 0800 24 25 26 (free from Telkom
Whatsapp Call : 063 709 2620 landline)
Free, in person counselling SMS : 31393 for a call-me-back
Tel : 021 461 1113
Campus Protection Services
PHOTO AND LIVE ITEM TEST MEDIA 47
If you see any criminal activity on campus please, report it to Campus Protective Services, using this 24/7
line : 021 650 2222/3
If you would like more information regarding the study, you can talk to the researcher any time, using
Signature
By signing this form, I am satisfied that I have been fully informed on the purpose of the study, the data
collection methods used and the reasons behind them.
Participant name:__________________________________________
Participant signature:_______________________ Date: 25.09.19
Please read
There are two copies of this form in your pack. Please sign both copies. When you are finished, please tear
off one copy for you to keep. Please raise your hand so the other signed copy can be collected. You are now finished
and may leave the venue quietly.
References
Brewer, N., & Williams, K. D. (Eds.). (2005). Psychology and law: An empirical perspective.
New York, NY, US: The Guilford Press
Fitzgerald, R., Price, H., & Valentine, T. (2018). Eyewitness Identification: Live, Photographic, and Video
Lineups. Psychology, Public Policy, and Law, 24(3), 307–325.
doi: 10.1037/law0000164
Innocence Project. (n.d.). Eyewitness Identification Reform. Retrieved September 5, 2019, from
https://www.innocenceproject.org/eyewitness-identification-reform/

PHOTO AND LIVE ITEM TEST MEDIA 48
Appendix I
Photographicgraphic lineup selection form
I would now like you to identify the two people you saw, who gave a staged SRPP
advertisement at the beginning of the lecture. You will see two lineups, one for each of the
people you saw. The two people, who gave the staged advertisement, may or may not be present
in the lineup. Please take your time when making your selection. If you see either of the people
you saw, who gave the staged advertisement, please make a cross in the appropriate box, using a
pen.
If you do not see either of the people you saw, who gave the staged advertisement, or if
you are unsure, please make a cross in the appropriate box, using a pen.
Please make sure that no one is able to see the lineup selections you have made. The first
lineup can be found on the next page. When you are finished, please turn two pages ahead and
complete the next question.
Name:_____________________________________________________________
Colour group:_______________________________________________________
What is the number of the row you are sitting in (Row 1 is closest to the front of the
lecture venue)?___________________________________________________________
X
X
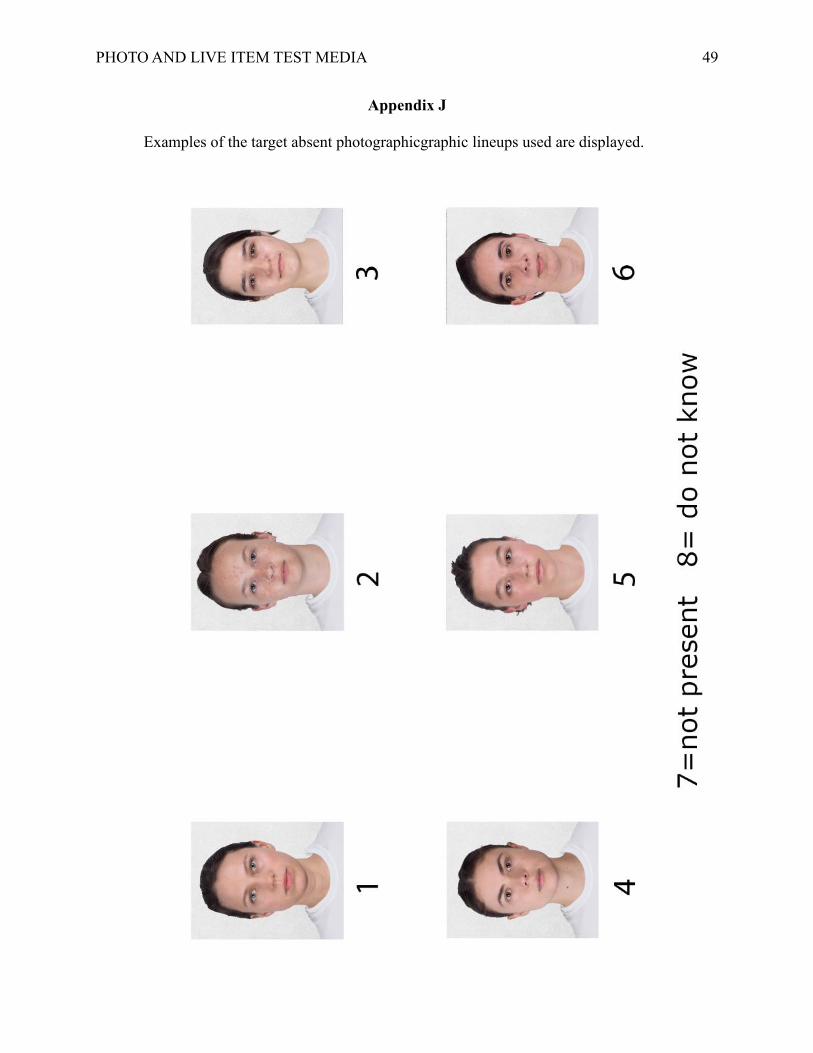
PHOTO AND LIVE ITEM TEST MEDIA 49
Appendix J
Examples of the target absent photographicgraphic lineups used are displayed.
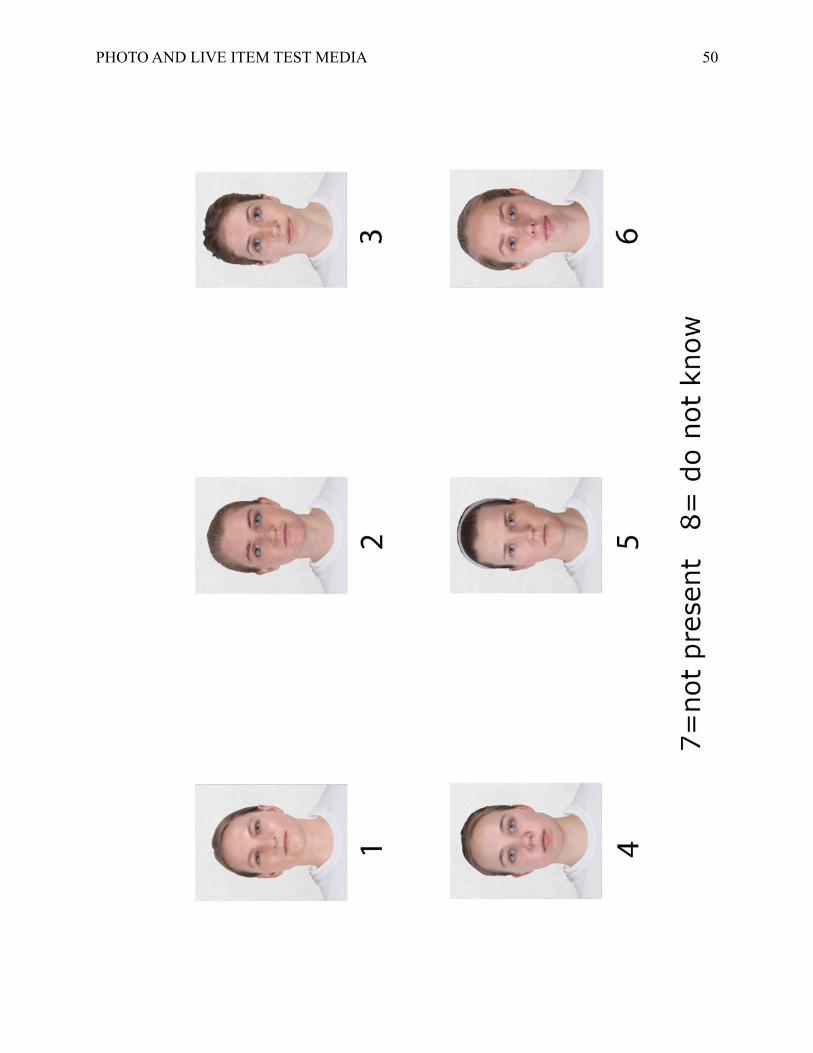
PHOTO AND LIVE ITEM TEST MEDIA 50

PHOTO AND LIVE ITEM TEST MEDIA 51
Appendix K
Ethical Approval
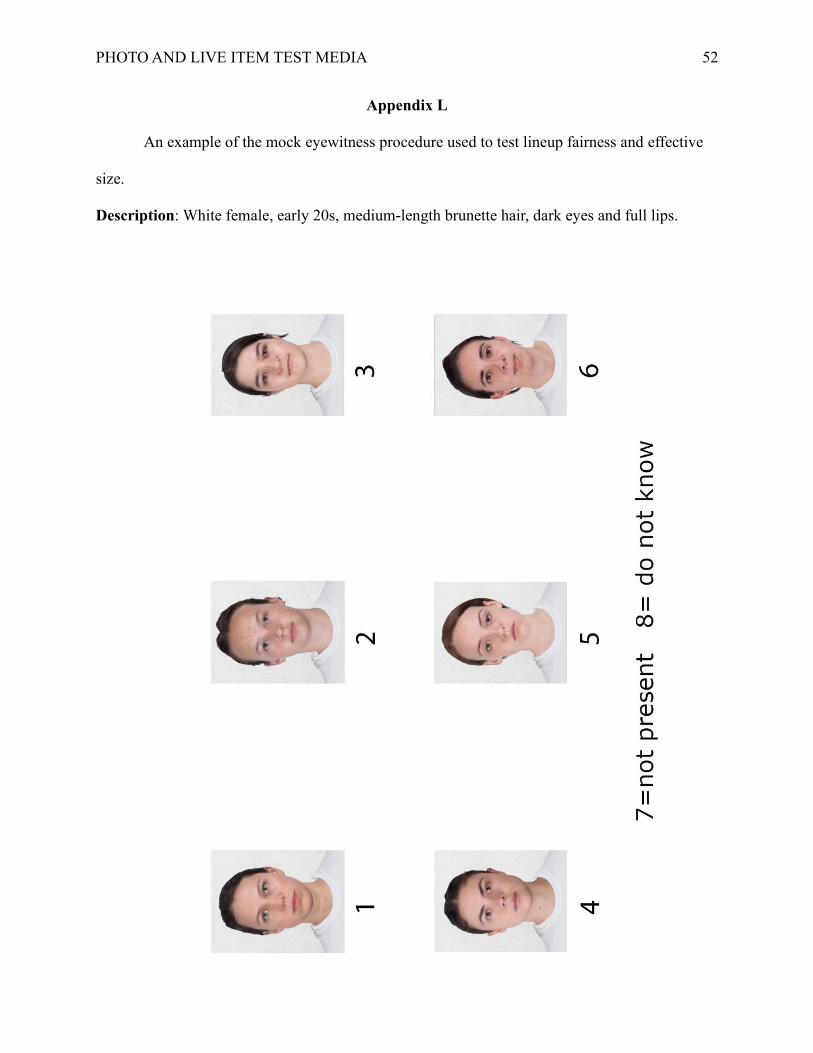
PHOTO AND LIVE ITEM TEST MEDIA 52
Appendix L
An example of the mock eyewitness procedure used to test lineup fairness and effective
size.
Description: White female, early 20s, medium-length brunette hair, dark eyes and full lips.