Embed Size (px)
Citation preview
Influence of sialic acid modification
on HIV GP120 binding and
Syncytia formation
Dissertation zur Erlangung des akademischen Grades des
Doktors der Naturwissenschaften (Dr. rer. nat.)
eingereicht im Fachbereich Biologie, Chemie, Pharmazie
der Freien Universität Berlin
vorgelegt von
YUJING YAO
2018
Die Arbeit wurde vom Juli 2010 bis Juni 2018 am
Institut für Laboratoriumsmedizin, klinische Chemie und Pathobiochemie
Campus Benjamin Franklin
Charité – Universitätsmedizin Berlin
Arnimallee 22, 14195 Berlin-Dahlem
unter der Leitung von Prof. Dr. Werner Reutter und Prof. Dr. Rudolf Tauber
angefertigt.
1. Gutachter: Prof. Dr. Rudolf Tauber
2. Gutachter: Prof. Dr. Rupert Mutzel
Disputation am 05.11.2018

for my family

4
Acknowledgments
On this journey, from the bottom of my heart, I have so many people to thank. Without them I would
not have reached this final state. This PhD was for me not just an academic training, but also a
challenge to become a better person in life.
Firstly, I would like to thank Professor Rudolf Tauber for kindly accepting me to work in his laboratory
after Professor Reutter passed away, providing me with a unique opportunity to finish this project. I
greatly appreciate his continuing support, guidance and encouragement, even though he is already
loaded with work.
I would like to thank Professor Werner Reutter. It was my honor to work with this great scientist. I
thank him for not giving up on me when things got very difficult. I am deeply grateful for his influencing
and enlightening me. I will always remember his wisdom, brilliant insight of science and his endless
passion for glycan research. Even though, he has passed away, I will always keep learning from him.
My special thanks go to PD Dr. Hua Fan, who introduced me into Professor Reutter’s group. I was so
inexperience at that time. It must have been difficult on her to supervise me. Thanks for her patient
guidance and close concerns in the first two years.
There are so many people in the previous Professor Reutter’s lab I would like to thank: Dr. Felista
Lemnyui Tansi, Hoang Giang Nguyen, Dr. Jing Hu, Dr. Long Duc Nguyen, Dr. Paul Robin Wratil, Dr. Maria
Kontou, Christiane Kilian, Christiane Ossadnik, Felisitas Kern, Seynel Gün, Susanne Thamm. Special
thank to Dr. Felista Lemnyui Tansi, Dr. Long Duc Nguyen and Dr. Paul Robin Wratil, for everything they
have done for me. I cherished every moment I have been with them. Our lab was a better place when
they were there.
I would like to thank Professor Peter Seeberger for letting me to perform important experiments in
his laboratory. I enjoyed working in the supportive environment of his department very much. I would
like to thank people in this institute: Dr. Andreas Geissner, Dr. Chakkumkal Anish, Dr. Felix Bröcker,
Jonel Jaurigue, Dr. Moscovitz Oren, Paulina Kaplonek, Adam Peters, Bruna Seco, Dr. Falko Shirmeister,
Varela Silvia, Ye Zhou, Katrin Sellrie, Annette Wahlbrink. Special thanks to Dr. Andreas Geissner, Dr.
Felix Bröcker and Paulina Kaplonek, who always gave me a hand and lent me an ear.
I would like to thank Professor Véronique Blanchard and Dr. Jens Dernedde for kindly offering me their
lab resources and valuable advices. Special thanks to Dr. Karina Biskup, Marta Wieczorek and Serena
Rossi for helping me carry out experiments there.

5
I would like to thank Professor Oliver T. Keppler for his generous gift of plasmid and helpful opinion
on this work.
I would like to thank PD Dr. Daniel Kolarich, for kindly helping me order reagents I urgently needed for
my experiments. Special thanks to Dr. Falko Shirmeister for sharing his laboratory and thesis writing
experience with me.
I would like to thank Professor Rupert Mutzel for his willingness to be my 2nd supervisor and grade my
thesis.
I would like to thank Dr. Uwe Schöneberger and Katrin Büttner from professor Burghardt Wittig’s
group for help in IT support and experiments.
I would like to thank Dr. Andreas Geissner, Dr. Long Duc Nguyen, Dr. Paul Robin Wratil and Hoang
Giang Nguyen for proofreading this work.
I would like to thank my parents for bring me to this world; for their caring for me as much as they
have. I can count on their unconditional support. Thanks to my two daughters for just being there.
This already give me untold energy to fight till the end. Thank to my husband for his unconditional
support and unwavering faith in me - even when I did not entirely believe in myself.
Thanks everyone, who has been with me on this journey.
6
Table of Contents
Acknowledgements ............................................................................................................................. 4
Abbreviations ...................................................................................................................................... 9
Zusammenfassung (Deutsch) ............................................................................................................ 11
Abstract (English) .............................................................................................................................. 12
1. Introduction .................................................................................................................................. 13
1.1. HIV and AIDS .......................................................................................................................... 13
1.2. HIV types ................................................................................................................................ 13
1.3. Stages of HIV Infection ........................................................................................................... 13
1.4. The human immunodeficiency virus ...................................................................................... 15
1.4.1. HIV life cycle .................................................................................................................... 15
1.4.2. Viral binding and entry process ...................................................................................... 16
1.4.3. Syncytia formation of T-lymphocytes in lymph nodes ................................................... 22
1.4.4. N-Glycans of gp120 ......................................................................................................... 23
1.5. Sialic acid ................................................................................................................................ 25
1.5.1. Sialic acid in innate immunity ......................................................................................... 25
1.5.2. Sialic acid in adaptive immunity ...................................................................................... 27
1.5.3. Sialic acid in pathogen binding and infection ................................................................. 27
1.5.4. Biosynthesis of N-Acetylneuraminic Acid (Neu5Ac) ....................................................... 28
1.6. Sialic acid function and modification ..................................................................................... 30
1.6.1. Neu5Ac modification and virus infection ........................................................................ 31
1.6.2. Neu5Ac modification in tumor cells ................................................................................ 31
1.6.3. Neu5Ac modification and neuron cells ........................................................................... 32
1.6.4. Neu5Ac modification and immune system ..................................................................... 32
1.7. Goal of the work .................................................................................................................... 34
2. Material and methods .................................................................................................................. 35
2.1 Instruments ............................................................................................................................. 35
2.2. Materials ................................................................................................................................ 36
2.3. Protein biochemical methods ................................................................................................ 36
2.3.1. Nano Drop ....................................................................................................................... 36
2.3.2. BCA assay ........................................................................................................................ 36
2.3.3. SDS-PAGE ........................................................................................................................ 37
2.3.4. Coomassie staining ......................................................................................................... 37
2.3.5. Silver staining .................................................................................................................. 37
2.3.6. Western Blot ................................................................................................................... 38
2.3.7. DMB labeling and Sialic acid analysis (HPLC) .................................................................. 39
2.4. DNA biochemical methods ..................................................................................................... 40
Table of contents
7
2.4.1. Polymerase chain reaction .............................................................................................. 40
2.4.2. DNA purification .............................................................................................................. 40
2.4.3. DNA concentration determination ................................................................................. 40
2.4.4 Agarose gel electrophoresis ............................................................................................. 40
2.4.5. DNA digestion with restriction endonuclease ................................................................ 41
2.4.6. Production of PCR blunt plasmids ................................................................................... 41
2.4.7. DNA ligation .................................................................................................................... 41
2.4.8. Sequencing ...................................................................................................................... 42
2.5. Bacteria cell culture ............................................................................................................... 42
2.5.1. Competent Escherichia coli ............................................................................................. 43
2.5.2. Transformation of plasmid-DNA in E. coli ....................................................................... 43
2.5.3. Overnight culture production ......................................................................................... 43
2.5.4. Plasmid amplification in Escherichia coli ........................................................................ 43
2.5.5. Plasmid DNA preparation................................................................................................ 44
2.6. Insect cell culture ................................................................................................................... 44
2.6.1. Baculovirus amplification in Sf9 cells .............................................................................. 45
2.6.2. Protein expression .......................................................................................................... 45
2.6.3. Glutathione affinity chromatography ............................................................................. 45
2.6.4. Immunoprecipitation with anti-GFP antibody ................................................................ 46
2.6.5. Ni-NTA affinity chromatography ..................................................................................... 46
2.7. Mammalian cell culture ......................................................................................................... 47
2.7.1. Cell counting assay .......................................................................................................... 49
2.7.2. Proliferation assay with AlamarBlue ............................................................................... 49
2.7.4. Cell treatment with ManNAc derivates .......................................................................... 49
2.8. Gp120 isolation ...................................................................................................................... 49
2.8.1. Fluorescein isothiocyanate (FITC) labeling of gp120 ...................................................... 50
2.9. Gp120-CD4-CXCR4 binding Assay .......................................................................................... 51
2.10. Syncytia formation ............................................................................................................... 51
2.10.1. DiI and DiO labeling ....................................................................................................... 51
2.10.2. Syncytia formation ........................................................................................................ 51
3. Results ........................................................................................................................................... 53
3.1. Expression and detection of modified Neu5Ac in cells .......................................................... 53
3.2. Gp120 preparation ................................................................................................................. 56
3.2.1. Gp120 expression and purification ................................................................................. 56
3.2.2. Gp120 Neu5Ac modification ........................................................................................... 58
3.2.3. Gp120 FITC labeling ........................................................................................................ 60
3.3. Gp120 binding to target cells (indirect assay) ....................................................................... 61
3.3.1. Optimization of binding conditions ................................................................................ 61
Table of contents
8
3.3.2. Modified gp120 fractions binding to TZM-bl cells (indirect assay) ................................. 63
3.4. FITC labeled gp120 fraction binding to target cells (direct assay) ......................................... 64
3.4.1. FITC labeled modified gp120 binding to HeLa cells ........................................................ 65
3.4.2. FITC labeled gp120 binding to cells treated with ManNAc derivates ............................. 66
3.4.3. FITC labeled modified gp120 binding to untreated cells ................................................ 67
Fig 3.4.5. Binding of different FITC labeled modified gp120s to untreated cells ...................... 67
3.5. HIV Envelope protein (Env) induced syncytia ........................................................................ 68
3.5.1. Establishing staining conditions for syncytia .................................................................. 69
3.5.2. Establishing optimal cell pair and conditions for syncytia .............................................. 70
3.5.3. Sialic acid inhibition using 3Fax-Neu5Ac .......................................................................... 75
3.5.4. Sialic acid modification and HIV-Env-induced syncytia ................................................... 76
4. Discussion ...................................................................................................................................... 80
4.1. Sialic acid modification with ManNAc derivates .................................................................... 80
4.2. Gp120 preparation ................................................................................................................. 82
4.3. Gp120 binding to target cells ................................................................................................. 83
4.3.1. Gp120 binding to TZM-bl ................................................................................................ 83
4.3.2. Gp120 modification and antibody binding ..................................................................... 84
4.3.3. Gp120 modification and binding to HeLa cells ............................................................... 85
4.3.4. Neu5Ac modification and binding of gp120 to TZM-bl ................................................... 85
4.4. HIV I Env induced syncytium formation ................................................................................. 85
4.4.1. Establishing optimal syncytia conditions ........................................................................ 86
4.4.2. Neu5Ac modification and syncytia formation ................................................................ 86
4.5. Expression and Purification of CXCR4-GST............................................................................. 87
5. Supplemental data ........................................................................................................................ 89
5.1. Purification of CXCR4-GST ...................................................................................................... 89
5.1.1. Vector design and plasmid purification .......................................................................... 89
5.1.2. CXCR4 Protein expression and purification .................................................................... 91
5.2 Vector ...................................................................................................................................... 93
5.3 Primary peptide sequences ..................................................................................................... 94
Table 5.3.1 CXCR4-GST .............................................................................................................. 94
5.4 Alamar Blue results CHO and TZM-bl cells .............................................................................. 95
6. References .................................................................................................................................... 96
9
Abbreviations AB Antibody
ADA Adenosine deaminase
APC Antigen-presenting cells
APS Ammoniumperoxodisulfate (w/v)
AIDS Acquired immunodeficiency syndrome
AMC Attack membrane complex formation
BKV Polyomavirus 1
BLT Bone marrow/liver/thymus
bnAb Broad neutralizing antibody
CMP Cytidine monophosphate
CMP-Neu5Prop CMP-N-propanoylneuraminic acid
CMPNT CMP-Sia/CMP anti-transporter
COS-1 Monkey kidney epithelial cells
DC Dendritic cells
DEAE Diethylaminoethylcellulose
DiI 1,1’-Dioctadecyl-3,3,3’,3’-tetramethylindocarbocyanine perchlorate
DiO 3,3’-Dioctadecyloxacarbocyanine perchlorate
DNP 2,4-dinitrophenyl
DMAB 4-Dimethylaminobenzaldehyd
DMB 1,2-Diamino-4,5-methylendioxybenzen
DMEM Dulbecco’s modified Eagle medium
DMSO Dimethyl sulfoxide
dNTPs Deoxyribonucleotide
ddTTP Dideoxyribonucleotide
ECL Extracellular loop
ECM Extracellular matrix
EDTA Ethylenediaminetetraacetic acid
Env viral envelope glycoprotein
ESI-MS Electrospray ionization mass spectrometry
FACS Fluorescence-activated cell sorting
FITC Fluorescein isothiocyanate
GABA γ-aminobutyric acid
GalNAc N-Acetylgalactosamine
GPCR G protein-coupled receptors
GNA Galanthus nivalis
GNE/MNK UDP-GlcNAc-2-epimerase/ManNAc-kinase
GS4FF Glutathione Sepharose 4 Fast Flow
GST Glutathione-S-transferase
HA Haemagglutinin
HEPES (4-(2-Hydroxyethyl)-1-piperazineethanesulfonic acid)
HIV Human immunodeficiency virus
HIVE HIV encephalitis
IgV Variable immunoglobulin domains
IPTG Isopropyl-ß-D-thiogalactopyranoside
iMDDCs Immature dendritic cells
ITIMs Immune receptor tyrosine-based inhibitory motifs
10
KDN 2-keto-3-deoxynononic acid
Kvs Voltage-gated potassium channels
LPV Lymphotropic polyomavirus
mAb Monoclonal antibody
ManNAc N-Acetylmannosamine
ManNBut N-Butanoylmannosamine
ManPAc N-Phenylacetyl-D-mannosamine
ManNProp N-Propanoylmannosamine
MEM Minimum essential medium
MGE Metabolic glycoengineering
MMP Methyl-α-D-mannopyranoside
MPER Membrane-proximal external region
MSX Methionine sulfoximine
NA Neuraminidase
Neu5Ac N-Acetylneuraminic acid
Neu5Gc N-Glycolylneuraminic acid
OI Opportunistic infections
pab Polyclonal antibody
PBS Phosphate buffered saline
PBMC Peripheral blood mononuclear cells
PEP Phosphoenolpyruvate
PI Propidium iodide
PMSF Phenylmethylsulfonylfluoride
PNGS Potential N-glycan sites
RPMI Roswell Park Memorial Institute 1640 medium
PSA Polysialic acid
RT Room temperature
SAS Sialic acid synthase
Sia Sialic acid
SDF-1 Stromal cell-derived factor-1
SDS Sodiumdodecylsulfate
SEC Size exclusion chromatography
SNA Sambucus nigra lectin
ST Sialyltransferase
TACAs Tumor-associated carbohydrate antigens
TCR T cell receptor
TEMED Tetramethylendiamine
TFA Trifluoroacetic acid
TMD the transmembrane domain
Tris Tris(hydroxymethyl)aminomethane
UDP-GlcNAc UDP-N-acetylglucosamine
VP1 Capsular viral protein 1 WGA Wheat Germ agglutinin lectin
11
Zusammenfassung (Deutsch)
Das Humane Immundefizienz-Virus (HIV) ist ein Retrovirus, das seit Jahrzehnten im Fokus weltweiter
Untersuchungen und Forschungen steht. Das einzige Protein, welches in der Hülle von HIV glykosyliert
ist, ist das Glykoprotein Gp120, das die Bindung vom Virus zur Wirtszelle vermittelt. Die dichte Schicht
von Glykanen, die Gp120 umgibt, macht ungefähr 50% seiner molekularen Masse aus und besteht
hauptsächlich aus N-Glykanen. Die meisten davon sind vom High-Mannose-Typ, der Rest vom
komplexen Typ. Es wurde gezeigt, dass Infektionen, trans-Infektionen und Syncytiumbildung durch
Veränderungen der Glykanmotive oder durch Mutationen der spezifischen N-Glykanpositionen auf
Gp120 beeinflusst werden können.
In dieser Arbeit habe ich die Rolle von Sialinsäuren in der Gp120-Bindung, Syncytiumbildung und der
Erkennung von allgemein neutralisierenden HIV-Antikörpern untersucht. Zu diesem Zweck wurden die
natürlichen Sialinsäurenstrukturen auf Gp120 und der Oberfläche von CD4/CXCR4 exprimierenden
Zielzellen mittels metabolischem Glykoengineering durch Zugabe von N-Acetylmannosamin
(ManNAc)-Analoga gezielt verändert. Diese modifizierten Proben wurden daraufhin für
Proteinbindungsassays sowie zellbasierte Syncytiumbildungsexperimente verwendet.
Als Erstes wurde beobachtet, dass die in dieser Arbeit herbeigeführten Veränderungen der
Sialinsäurestruktur in vitro keinen Einfluss auf die Bindung von Gp120 zu den Zellen hatte. Diese
Veränderungen am Gp120 führten jedoch zum Verlust der Erkennung durch 2G12, einem allgemein
neutralisierenden Antikörper.
Als Zweites wurde gezeigt, dass die Inhibition der allgemeinen Sialylierung einen Anstieg an Env
induzierter Syncytiumbildung bewirkte. Die Verwendung von 3Fax-Neu5Ac, einem globalen
Sialyltransferaseinhibitor, ließ die Syncytiumbildung bei CHO-WT (Angreiferzelle) um 65% und bei
HeLa-CD4 (Zielzelle) um 31% ansteigen. Schwache Wirkungen konnten hier auch für Sialinsäure-
Modifizierungen beobachtet werden.
Aus diesen Ergebnissen wurde schlussgefolgert, dass die Inhibition oder Modifikation der
Sialinsäurestruktur auf Gp120 nicht der Hauptgrund für den Anstieg an Syncytiumbildung war,
obgleich die Präsenz von Gp120 und CD4/CXCR4 an der Zelloberfläche für die Syncytiumbildung
unabdingbar ist. Vielmehr ist dieser Effekt durch breitere Veränderungen der
Zelloberflächensialylierung zu erklären.
Obwohl diese Ergebnisse noch durch virale Synctiumbildungs-Assays verifiziert werden müsste, stellen
sie eine gute Basis für fortführende Studien dar, um die Wirkung von Sialinsäuren auf HIV-
Syncytiumbildung zu verstehen und weitere Co-Faktoren in diesem Prozess zu finden.
12
Abstract (English)
The human immunodeficiency virus (HIV) is a retrovirus that has been in the focus of worldwide
investigation and research for many years. The only glycosylated protein present in the envelope of
HIV is glycoprotein gp120, which mediates the binding of the virus to the host cell. Gp120 itself is
covered with a dense layer of glycans, which accounts for approximately 50% of its molecular mass.
The majority of these glycans are N-glycans consisting mostly of high mannose structures and, to a
lesser extent, complex structures. It was shown that infection, trans-infection, transmission and
syncytia formation can be affected by altering the glycan motifs or mutating specific N-glycan sites on
gp120.
In this thesis, I was investigating the role of sialic acid in gp120 binding, syncytia formation and
recognition by broadly neutralizing antibodies of HIV. For this, the expression of sialic acid on isolated
gp120 as well as on the surface of target cells expressing CD4/CXCR4 were modified via metabolic
glycoengineering with N-acetylmannosamine (ManNAc) analogs. These modified samples were
subsequently used in protein binding assays and cell based syncytia formation experiments.
First, it was observed that altering the sialylation pattern of the isolated gp120 had no effect on the
binding to target cells in vitro. Modification of sialic acid expression on isolated gp120, however, led
to a loss of recognition from the broadly neutralizing antibody 2G12.
Second, it was shown that the inhibition of sialic acid expression caused increased Env protein induced
syncytia formation. Applying 3Fax-Neu5Ac, a global sialyltransferase inhibitor, on CHO-WT (attack cell)
a 65% increase in syncytia formation was observed, while on HeLa-CD4 (target cell) it was 31%. Weaker
effects were also observed with cell surface sialic acid modification.
With these results, it was concluded that although gp120 and CD4/CXCR4 expression are required for
syncytia formation, increased syncytia formation after sialic acid inhibition or modification is not
caused directly by changes on sialylation of gp120, but is rather a result of broader changes on cell
surface sialylation.
Even though these findings still need to be verified using viral syncytia formation assays, they provide
a good basis for further studies in order to understand the effect of sialic acid on HIV syncytia
formation and for finding other co-factors involved in this process.
13
1. Introduction
1.1. HIV and AIDS
The human immunodeficiency virus (HIV) causes acquired immunodeficiency syndrome (AIDS), which
is a serious threat to millions of individuals across the whole world. According to the World Health
Organization (WHO), until 2016 more than 35 million people worldwide have died from HIV infection
(http://www.who.int/en/news-room/fact-sheets/detail/hiv-aids). Huge efforts have been undertaken
to understand the disease and manage this epidemic. However, AIDS remains one of the most
refractory diseases with high cost and long-term treatment, which still requires a large amount of
attention for more effective therapeutic strategies.
1.2. HIV types
There are two types of human immunodeficiency virus HIV-1 and HIV-2. HIV-1 is the more widespread
type (95% of infections), while HIV-2 is endemic in western Africa. An example of differences for the
two HIV types on the molecular level is that HIV-1 contains the vpu gene, encoding an accessory
protein, virus protein U, and enhances virus release from infected cells and tissue [1]. HIV-2, on the
other side, has a vpx gene encoding virus protein X that enhances virus replication by counteracting
the deoxynucleotide triphosphatase SAMHD1 [2]. On a functional level, HIV-1 is known to be more
transmissive and pathogenic than HIV-2. However, the phenotype and transmission efficiency of
different HIV-1 subtypes can vary greatly [3]. The detailed description of infection below focuses
mainly on HIV-1 to describe HIV characteristics in general.
1.3. Stages of HIV Infection
Normally, an untreated HIV-infected human being goes through three stages of HIV infection [4]. The
first few weeks after HIV infection are referred to as primary infection. In this acute stage of HIV
infection, the virus spreads within the organism and seeds in the lymphoid organs. This acute infection
is accompanied by decreasing numbers of CD4+ T-lymphocytes, the main target cells of HIV. Flu-like
symptoms may be observed, indicating activation of the immune system to counteract the virus.
Afterwards, the virus enters a clinic latency stage without clinic symptoms. In this stage, the virus
replicates and gradually depletes the reservoir of CD4+ T-lymphocytes indicated by slowly decreasing
the number of CD4+ T-lymphocytes. In the majority of untreated patients, this second stage lasts for
several years. However, the decreasing number of CD4+ T-lymphocytes affects the functional integrity
of the adaptive immune system. In the last stage, CD4+ T-lymphocytes counts are very low, HIV
replication is greatly enhanced and the risk of opportunistic infection and other pathologies that
Introduction
14
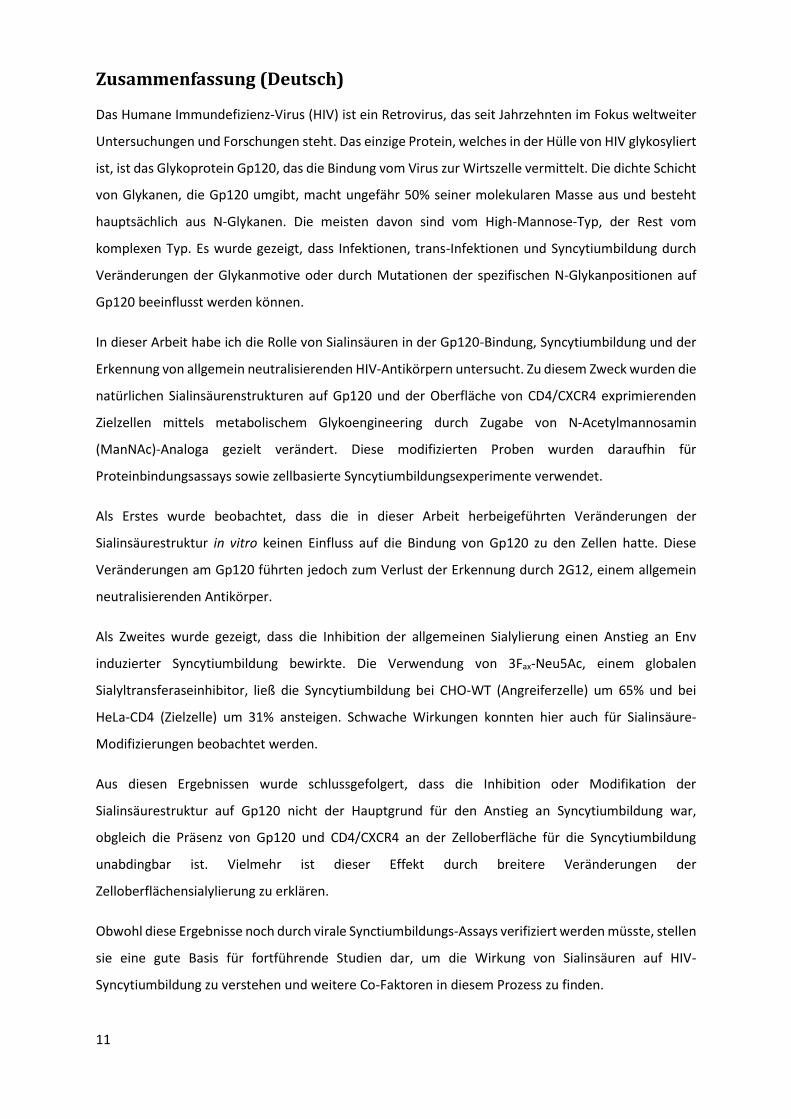
define AIDS is dramatically increased. AIDS is accompanied by short life expectancy and overall poor
prognosis (Fig 1.1).
Fig 1.1. HIV load and CD4+ T-lymphocyte counts in a human over the course of a treatment-naive HIV infection. During the first 9-12 weeks, HIV load grows highly and CD4+ T-lymphocyte drops to almost half the amount; then the virus enters a latent clinical stage, during which both virus load increases and CD4+ T-lymphocytes amount drops in a slow and gradual manner until CD4+ T-lymphocytes amount drops below a threshold. Afterwards, the immune system is unable to protect the human body from opportunistic infection and replication of HIV, which leads to the AIDS [5, 6].
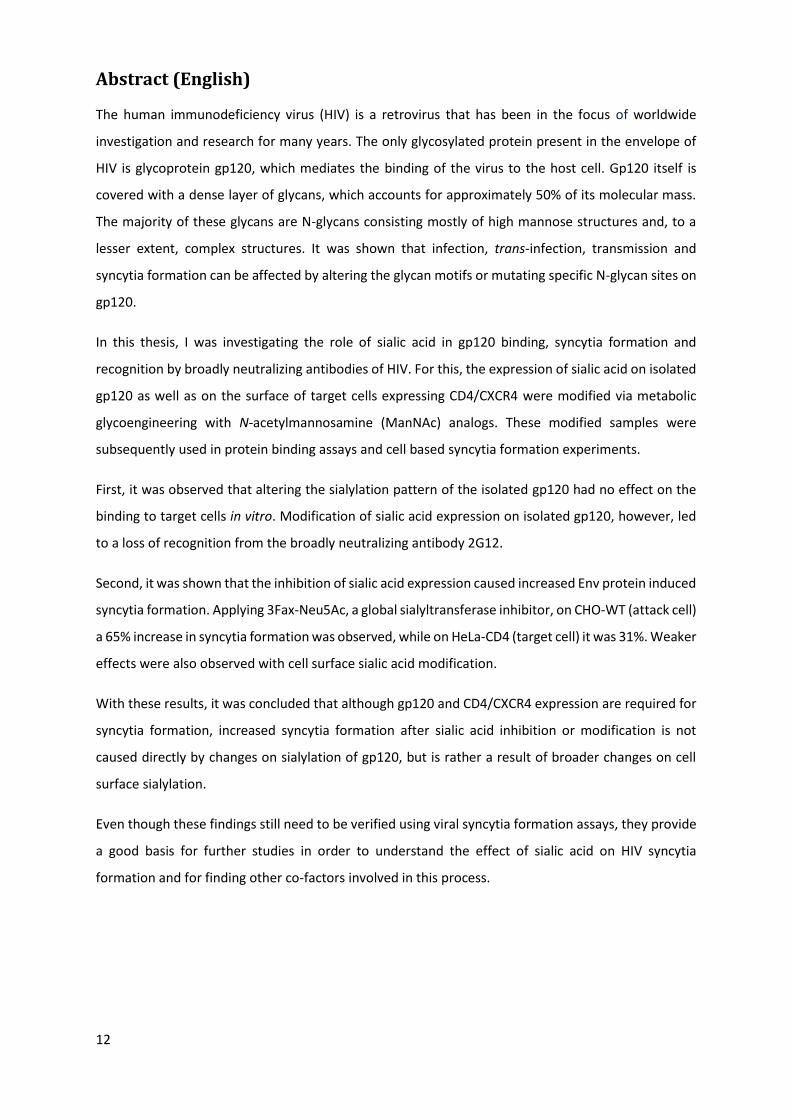
Fig 1.2. Schematic representation of an HIV-1 [7]
Introduction
15
1.4. The human immunodeficiency virus
HIV is a lentivirus that predominantly infects CD4+ T-lymphocytes [8]. It is of spherical shape and
carries a bilayer lipid membrane as its outmost shell that is derived from the host cells membrane. On
the surface of the virion, there are approximately 72 spikes embedded, which are heterotrimers of
the gp120 and gp41 (Fig 1.2). This gp120/gp41 heteromer complex is also referred to as viral envelope
glycoprotein (Env) [9]. The inner layer consists of a protein matrix, which surrounds the conical capsid.
The capsid itself encloses two single-stranded RNA molecules that are tightly bound to the
nucleocapsid proteins (p7) and enzymes required for the virus development.
1.4.1. HIV life cycle
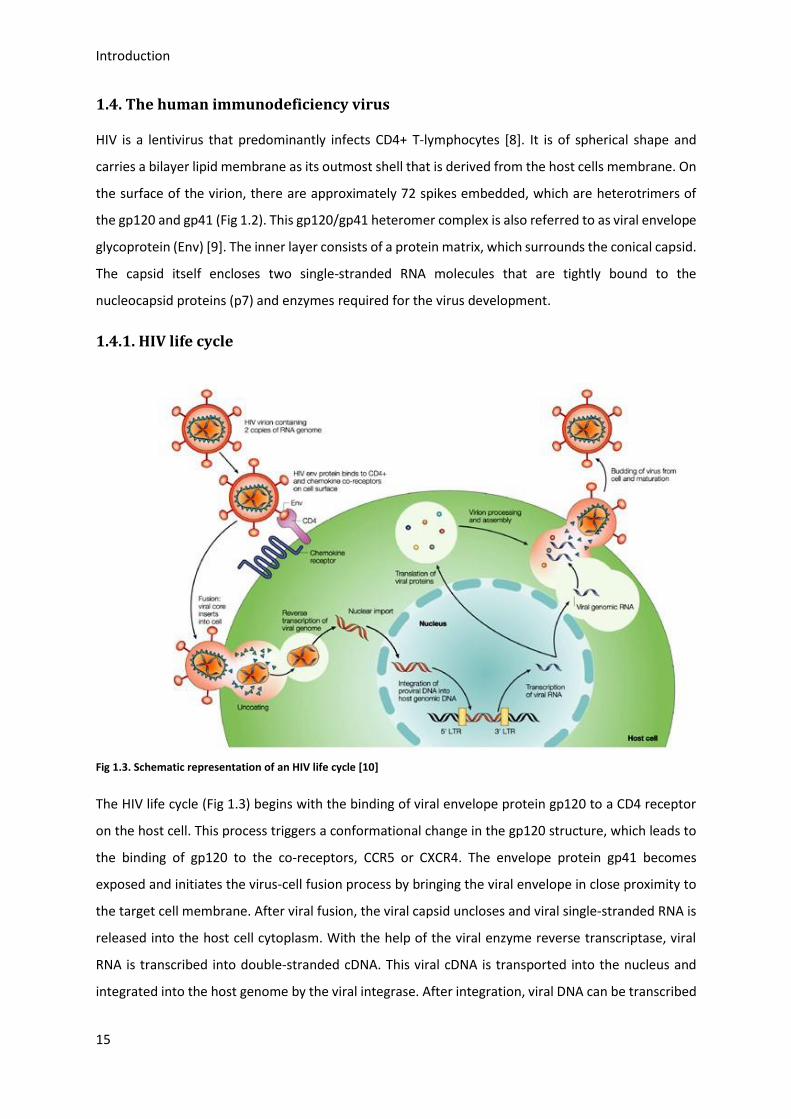
Fig 1.3. Schematic representation of an HIV life cycle [10]
The HIV life cycle (Fig 1.3) begins with the binding of viral envelope protein gp120 to a CD4 receptor
on the host cell. This process triggers a conformational change in the gp120 structure, which leads to
the binding of gp120 to the co-receptors, CCR5 or CXCR4. The envelope protein gp41 becomes
exposed and initiates the virus-cell fusion process by bringing the viral envelope in close proximity to
the target cell membrane. After viral fusion, the viral capsid uncloses and viral single-stranded RNA is
released into the host cell cytoplasm. With the help of the viral enzyme reverse transcriptase, viral
RNA is transcribed into double-stranded cDNA. This viral cDNA is transported into the nucleus and
integrated into the host genome by the viral integrase. After integration, viral DNA can be transcribed
Introduction
16
to RNA. Viral RNA is exported into the cytoplasm and translated into viral proteins. Via proteolytical
cleavage of a glycosylated polyprotein precursor (gp160) in the Golgi, mature gp120 and gp41 are
formed and secreted to the plasma membrane. There, they assemble with other viral proteins and
new viral RNA to form immature particles [11]. After the virion buds and is released from the host
cells, the immature Gag and GagPol polyprotein precursors are cleaved by proteases to complete the
maturation of the virion (Fig 1.3). Finally, the mature virions can infect other CD4+ T-lymphocytes
completing the HIV life cycle.
1.4.2. Viral binding and entry process
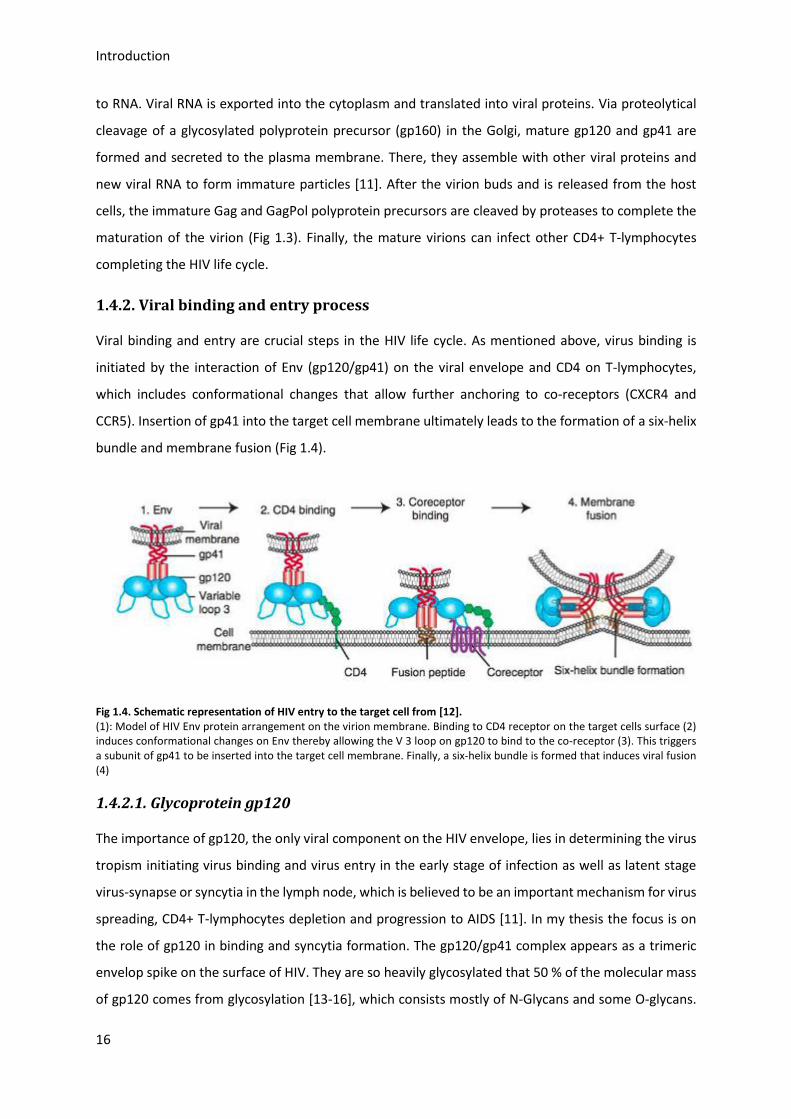
Viral binding and entry are crucial steps in the HIV life cycle. As mentioned above, virus binding is
initiated by the interaction of Env (gp120/gp41) on the viral envelope and CD4 on T-lymphocytes,
which includes conformational changes that allow further anchoring to co-receptors (CXCR4 and
CCR5). Insertion of gp41 into the target cell membrane ultimately leads to the formation of a six-helix
bundle and membrane fusion (Fig 1.4).
Fig 1.4. Schematic representation of HIV entry to the target cell from [12]. (1): Model of HIV Env protein arrangement on the virion membrane. Binding to CD4 receptor on the target cells surface (2) induces conformational changes on Env thereby allowing the V 3 loop on gp120 to bind to the co-receptor (3). This triggers a subunit of gp41 to be inserted into the target cell membrane. Finally, a six-helix bundle is formed that induces viral fusion (4)
1.4.2.1. Glycoprotein gp120
The importance of gp120, the only viral component on the HIV envelope, lies in determining the virus
tropism initiating virus binding and virus entry in the early stage of infection as well as latent stage
virus-synapse or syncytia in the lymph node, which is believed to be an important mechanism for virus
spreading, CD4+ T-lymphocytes depletion and progression to AIDS [11]. In my thesis the focus is on
the role of gp120 in binding and syncytia formation. The gp120/gp41 complex appears as a trimeric
envelop spike on the surface of HIV. They are so heavily glycosylated that 50 % of the molecular mass
of gp120 comes from glycosylation [13-16], which consists mostly of N-Glycans and some O-glycans.
Introduction
17
The glycoprotein gp120 has five conserved regions (C1-C5) alternating with five variable regions (V1-
V5). Variable regions are the products of inaccuracies in the reverse transcriptase reaction. Each
variable region from V1 to V4 has a disulfide bond at the base, which forms a loop in these regions
(Fig 1.5) [17-19].
Fig 1.5. The topology of gp120 [18, 20] Y: high mannose-type and/or hybrid-type oligosaccharide; F: complex-type oligosaccharide; V1-V5: variable loops; I-V: conserved loops
Fig 1.6. Ribbon representation of the gp120 core [21] red is the inner domain, yellow is the outer domain, and blue is the bridging sheet.
The crystal structure of gp120, harboring neither V1, V2, V3-loops nor N-and C- terminals, in complex
with D1 and D2 domain of CD4 as well as the Fab fragment from the antibody 17b reveals the core
structure of gp120 (Fig 1.6). It consists of two domains: an inner and an outer domain connected by
Introduction
18
two anti-parallel bridging sheets, wherein the variable loops containing outer domain is facing the
outside of the trimer [17].
1.4.2.2. CD4 binding process
Conformational changes in gp120 follow the binding to CD4. After binding to CD4, two anti-parallel
bridging sheets are induced in gp120 and form a pocket structure with the inner and outer domain,
where CD4 binds [22]. Moreover, this conformational change enables co-receptor binding (Fig 1.4)
[23, 24].
The binding interface with CD4 in the gp120 core domain forms two cavities. The larger one is filled
with water, and is formed by the conserved residues of gp120, which may direct the binding to CD4.
The smaller hydrophobic one is occupied by the phenyl ring from CD4. This Phe43 of CD4 is crucial for
CD4 and gp120 binding [25].
While the lack of V1, V2 or V1/V2 still allows for binding between gp120 and CD4, deletion of V1/V2
leads to impairment of HIV fusion, as demonstrated in in vitro cell-cell fusion assays [26].
1.4.2.3. Co-receptors binding
The co-receptor binding happens after gp120 binds to the CD4 receptor. Chemokine receptors CCR5
and CXCR4 are the two main co-receptors for HIV. They are 7-transmembrane G protein-coupled
receptors (GPCR) [27, 28]. The ability of HIV strain to use the co-receptor is referred to as tropism. The
R5 tropic strain uses CCR5, the X4 tropic strain uses CXCR4 and the R5X4 tropic strain uses both co-
receptors [29].
In the acute stage of HIV infection, most HIV strains are R5 tropic strains. In the clinical latency stage,
which is accompanied by the depletion of CD4+ T-Lymphocytes, the R5 strains switch to X4 or R5X4
strains. Therefore, R5 strains are more responsible for HIV transmission while X4 strains are more
related to the pathogenic development of HIV. The underlying reason for this switch is still not
completely understood.
CD4 and gp120 interaction exposes a CXCR4 co-receptor binding site in the V3 loop of gp120. The
binding site of CCR5 is on the gp120 core domain, close to the CD4 binding site and the bridging sheet
[24, 30-32].
The V3 loop has two different conformation modes and can bind to CCR5 and CXCR4 respectively [33,
34]. Also on the V3 loop different amino acid composition at position 11, 24 and 25 determines the
Introduction
19
binding of CXCR4 or CCR5. A positively charged amino acid at position 11, 24, or 25 defines an X4
strain; otherwise R5 [35]. The V3 loop, therefore, is a key element for HIV strain phenotype.
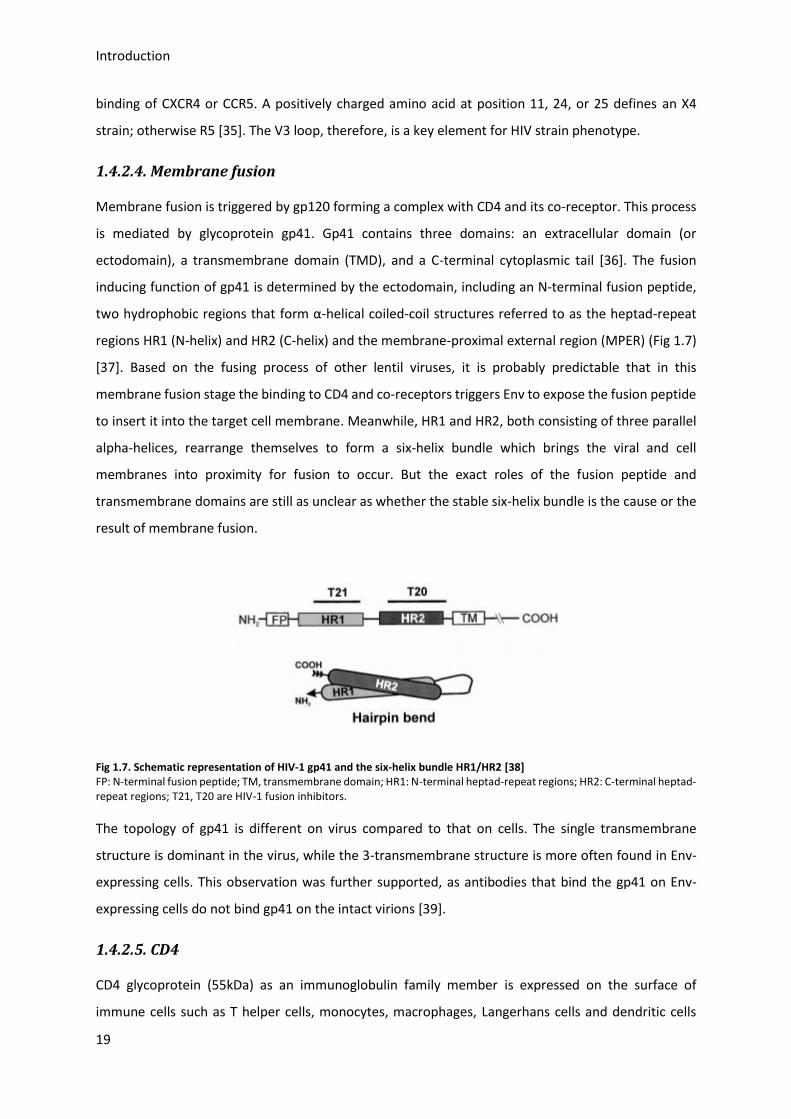
1.4.2.4. Membrane fusion
Membrane fusion is triggered by gp120 forming a complex with CD4 and its co-receptor. This process
is mediated by glycoprotein gp41. Gp41 contains three domains: an extracellular domain (or
ectodomain), a transmembrane domain (TMD), and a C-terminal cytoplasmic tail [36]. The fusion
inducing function of gp41 is determined by the ectodomain, including an N-terminal fusion peptide,
two hydrophobic regions that form α-helical coiled-coil structures referred to as the heptad-repeat
regions HR1 (N-helix) and HR2 (C-helix) and the membrane-proximal external region (MPER) (Fig 1.7)
[37]. Based on the fusing process of other lentil viruses, it is probably predictable that in this
membrane fusion stage the binding to CD4 and co-receptors triggers Env to expose the fusion peptide
to insert it into the target cell membrane. Meanwhile, HR1 and HR2, both consisting of three parallel
alpha-helices, rearrange themselves to form a six-helix bundle which brings the viral and cell
membranes into proximity for fusion to occur. But the exact roles of the fusion peptide and
transmembrane domains are still as unclear as whether the stable six-helix bundle is the cause or the
result of membrane fusion.
Fig 1.7. Schematic representation of HIV-1 gp41 and the six-helix bundle HR1/HR2 [38] FP: N-terminal fusion peptide; TM, transmembrane domain; HR1: N-terminal heptad-repeat regions; HR2: C-terminal heptad-repeat regions; T21, T20 are HIV-1 fusion inhibitors.
The topology of gp41 is different on virus compared to that on cells. The single transmembrane
structure is dominant in the virus, while the 3-transmembrane structure is more often found in Env-
expressing cells. This observation was further supported, as antibodies that bind the gp41 on Env-
expressing cells do not bind gp41 on the intact virions [39].
1.4.2.5. CD4
CD4 glycoprotein (55kDa) as an immunoglobulin family member is expressed on the surface of
immune cells such as T helper cells, monocytes, macrophages, Langerhans cells and dendritic cells
Introduction
20
[40]. It binds to the β2-domain of the major histocompatibility complex (MHC) class II molecules and
helps antigen presenting cells stimulate T helper cells, thereby enlarging the stimulatory signaling by
cooperating with the T cell receptor (TCR). The structure of CD4 contains three domains (Fig 1.8): an
extracellular domain, a transmembrane domain and an intracellular domain. D1 and D3 are variable
immunoglobulin domains (IgV) and D2 and D4 are constant immunoglobulin domains (IgC). D1, D2
and D4 each harbor a disulfide bridge at their bases, D3 and D4 each contain an N-linked glycosylation
site [40]. Only D1 participates in the HIV binding process [22]. The loss of CD4+ T-lymphocytes in the
HIV progression led to the identification of CD4 as HIV receptor. Also, monoclonal antibodies targeting
CD4 block syncytia formation and inhibit the production of HIV-1 pseudotypes (vesicular stomatitis
virus bearing retroviral Env) in selected susceptible cell types [41].
Fig 1.8. Schematic representation of CD4 structure [42] v: variable immunoglobulin domain, c: constant immunoglobulin domain.
1.4.2.6. CXCR4
CXCR4 is a 352-amino acid rhodopsin-like GPCR that selectively binds the CXC chemokine stromal cell-
derived factor-1 (SDF-1), also known as CXCL12. CXCR4 is normally expressed in a wide variety of
tissues and organs. Among these, the bone marrow, blood, spleen, thymus, lymph node, pituitary
gland, and adrenal glands seem to express the highest levels of CXCR4 [43, 44].
CXCR4 is the focus of extensive studies because it is involved in many physiological and pathological
processes, including HIV infection [45], hematopoiesis [46], embryonic development [47-51], as well
Introduction
21
as tumorigenesis and metastasis [52]. The CXCR4 structure consists of an extracellular N-terminal
domain, three extracellular loop domains (ECL), three intracellular loop domain, a seven-
transmembrane alpha helices and a cytoplasmic C-terminal tail (Fig 1.9) [43, 53].
Fig 1.9. The topology of the HIV-1 co-receptor CXCR4 located in the membrane [54]
Fig 1.10. Schematic structure of complex gp120-CD4- CXCR4 in HIV-1 entry stage [44] The entry complex of gp120-CD4-CXCR4. The crystal structure of CXCR4 here is shown as a homodimer in blue. The V3 loops of gp120 are shown in magenta.
Introduction
22
NMR structure analysis showed that gp120 binds to the extracellular N-terminal of CXCR4 [53]. Partial
deletion of the N-terminus in CXCR4 leads to a lower infection efficiency of different HIV strains. The
strength of this effect varies between strains, which suggests that different HIV strains might interact
with CXCR4 in a different way [27, 55-58]. Based on the crystal structure of CXCR4, Wu et al. showed
the binding mode of gp120 in complex with CD4 and CXCR4 (Fig 1.10) [44]. Point mutations of CXCR4
in the ECL-2, ECL-3 and in the second transmembrane domain also resulted in lower infection
efficiency of HIV strains. This might be due to altered electrostatic interactions with basic residues of
the HIV-1 envelope protein gp120 [57]. CXCR4 has two potential N-linked glycosylation sites: one is in
the ECL-2 domain, the other is in the N-terminal domain. Removal of the N-linked glycosylation sites
in CXCR4 allows the protein to serve as a universal co-receptor for certain X4 and R5 HIV-1 strains. The
removal of the N-linked carbohydrate on CXCR4 may have unmasked underlying conserved structures,
which are similar to the binding site on CCR5 [59].
1.4.2.7. CCR5
CCR5 is the other main co-receptor for HIV invasion. It is also a GPCR protein found mainly on the
surface of white blood cells. By interacting with several chemokines, it is involved in immune cell
chemotaxis and cell activation [60-62]. The CCR5 using viruses are R5 tropic viruses, which are
predominant in virus transmission and during early stages of viral infection [63]. It is the structural
plasticity of HIV which enables it to exploit CCR5 [64]. CCR5 is best known for the homozygous Δ32-
CCR5 mutation, a natural 32-bp deletion in the CCR5 gene corresponding to the second ECL of the
protein, which results in high resistance to R5 strains infection and immunity of the subjects to HIV-1
[65, 66].
The N-terminus and the ECL-1 of CCR5 are required for the entry of R5 tropic and dual-tropic HIV-1
viruses, even though binding mode and region dependency are different among different R5 tropic
viruses [67]. Unlike CXCR4, CCR5 was not found to possess N-linked glycosylation [68]. However, it has
been found to possess O-glycosylation. By undergoing tyrosine O-sulphation on the O-glycans in the
N-terminal region, it is possible for CCR5 to bind to gp120 [69].
1.4.3. Syncytia formation of T-lymphocytes in lymph nodes
Syncytia are a phenomenon of multi-nucleate enlarged cells that can be observed in HIV infected
patients, which are established by the interaction between HIV Env and CD4 as well as co-receptors.
Once the host cells are infected with the HIV-1, the newly synthesized Env in the cytoplasm traffics to
the membrane of infected cells, this enables infected cells to fuse with neighboring uninfected cells
to form multinucleated cells called syncytia [70-73].
Introduction
23
Syncytia formation is linked to a more pronounced CD4+ T-Lymphocytes decline and progression to
AIDS [74]. In vivo, multinucleated giant cells are the hallmark of HIV encephalitis (HIVE), and have also
been observed in lymphoid tissues of asymptomatic HIV-1 infected individuals [75-81]. The origin and
role of multinucleated cells in HIV pathogenesis are not clear. Initially, expression of myeloid markers
revealed that multinucleated cells might originate from dendritic cells or macrophages [78, 79, 81-83].
Until 2000, fused bi- and trinuclear lymphocytes were identified in HIV infected patients [84].
Furthermore, Murooka, Deruaz et al. proved that Env induced syncytia in bone marrow/liver/thymus
(BLT) humanized mice and HIV-infected T cells might facilitate viral dissemination in systemic areas
[85]. Later, Symeonides et al. revealed that these syncytia cells could transiently interact with
uninfected cells, leading to rapid virus transfer without cell-cell fusion by live-cell imaging in 3D-
hydrogels [86]. Contrary to apoptosis following syncytia formation in vitro, in vivo syncytia have longer
lifetimes and the increased size is observed with longer time of infection accompanied by ”dendritic”
morphological appearances [74]. Together with the finding that syncytia contribute to the cluster of
viral replication within the spleen of humanized mice [87], all this suggests that syncytia promote virus
transfer in vivo. This strategy used by HIV probably facilitates overcoming anatomical barriers, and
escaping immune scrutinies, such as complement and antibody response; even allowing virus spread
in individuals under certain anti-retroviral therapies (ARTs) [88-90].
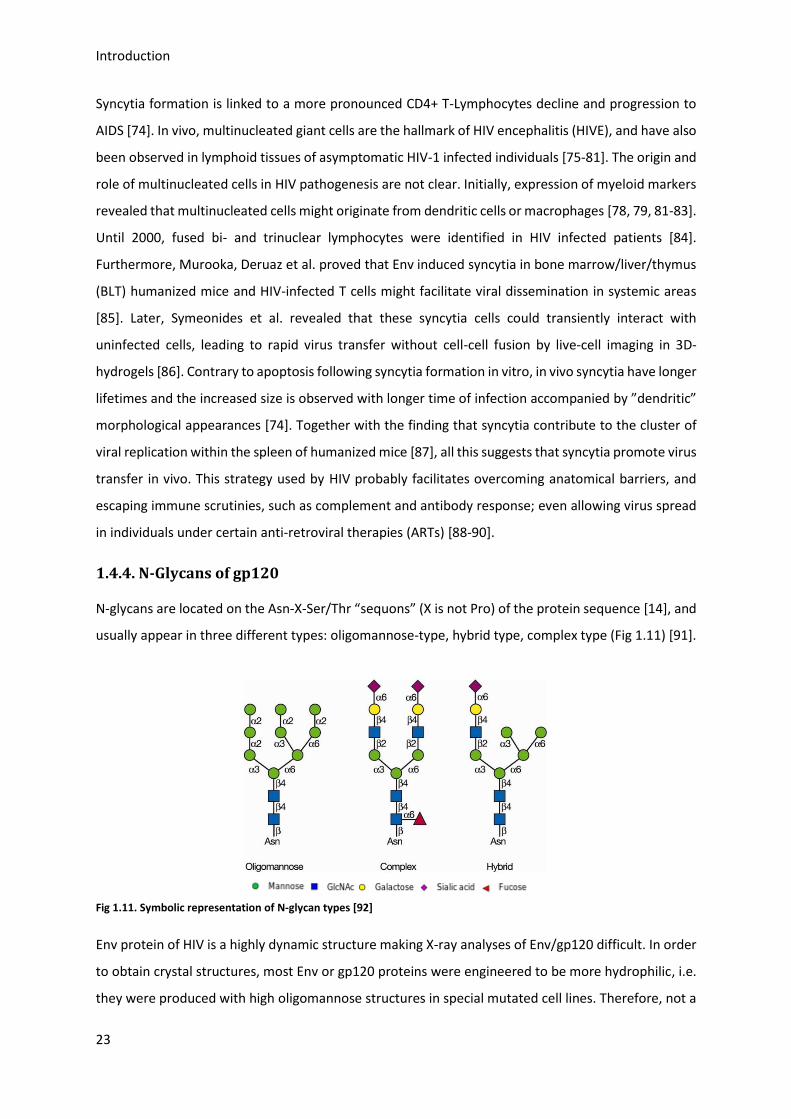
1.4.4. N-Glycans of gp120
N-glycans are located on the Asn-X-Ser/Thr “sequons” (X is not Pro) of the protein sequence [14], and
usually appear in three different types: oligomannose-type, hybrid type, complex type (Fig 1.11) [91].
Fig 1.11. Symbolic representation of N-glycan types [92]
Env protein of HIV is a highly dynamic structure making X-ray analyses of Env/gp120 difficult. In order
to obtain crystal structures, most Env or gp120 proteins were engineered to be more hydrophilic, i.e.
they were produced with high oligomannose structures in special mutated cell lines. Therefore, not a
Introduction
24
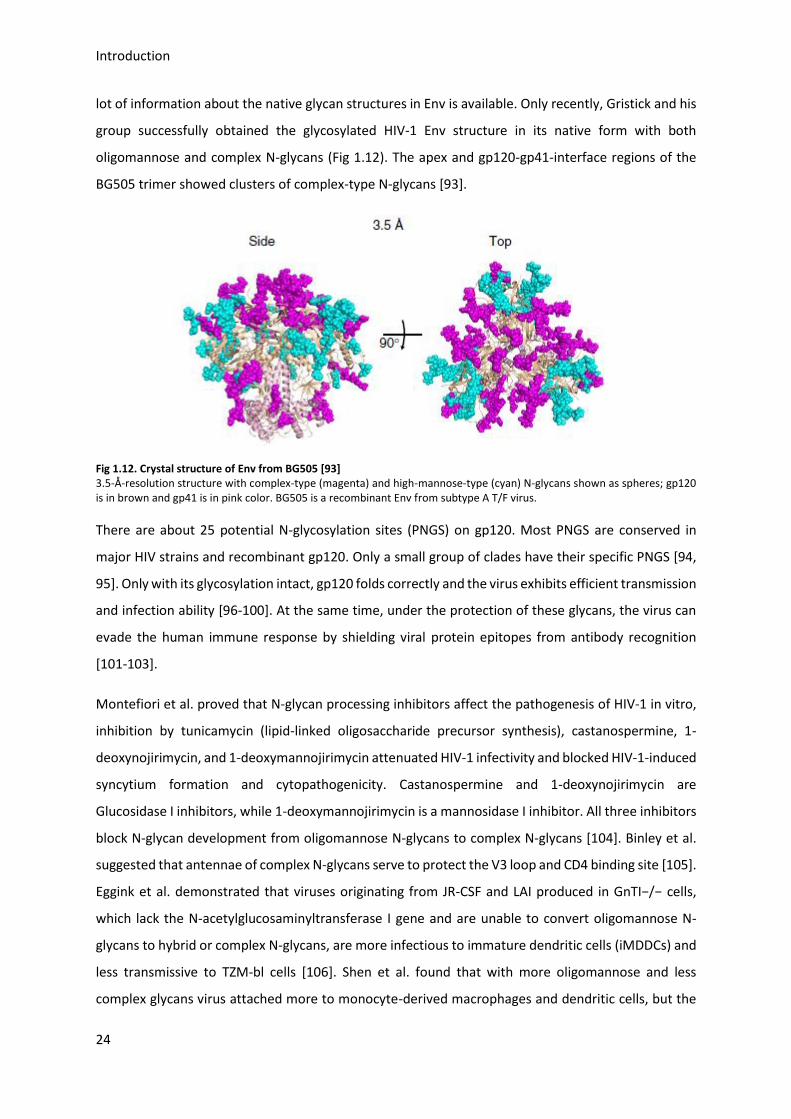
lot of information about the native glycan structures in Env is available. Only recently, Gristick and his
group successfully obtained the glycosylated HIV-1 Env structure in its native form with both
oligomannose and complex N-glycans (Fig 1.12). The apex and gp120-gp41-interface regions of the
BG505 trimer showed clusters of complex-type N-glycans [93].
Fig 1.12. Crystal structure of Env from BG505 [93] 3.5-Å-resolution structure with complex-type (magenta) and high-mannose-type (cyan) N-glycans shown as spheres; gp120 is in brown and gp41 is in pink color. BG505 is a recombinant Env from subtype A T/F virus.
There are about 25 potential N-glycosylation sites (PNGS) on gp120. Most PNGS are conserved in
major HIV strains and recombinant gp120. Only a small group of clades have their specific PNGS [94,
95]. Only with its glycosylation intact, gp120 folds correctly and the virus exhibits efficient transmission
and infection ability [96-100]. At the same time, under the protection of these glycans, the virus can
evade the human immune response by shielding viral protein epitopes from antibody recognition
[101-103].
Montefiori et al. proved that N-glycan processing inhibitors affect the pathogenesis of HIV-1 in vitro,
inhibition by tunicamycin (lipid-linked oligosaccharide precursor synthesis), castanospermine, 1-
deoxynojirimycin, and 1-deoxymannojirimycin attenuated HIV-1 infectivity and blocked HIV-1-induced
syncytium formation and cytopathogenicity. Castanospermine and 1-deoxynojirimycin are
Glucosidase I inhibitors, while 1-deoxymannojirimycin is a mannosidase I inhibitor. All three inhibitors
block N-glycan development from oligomannose N-glycans to complex N-glycans [104]. Binley et al.
suggested that antennae of complex N-glycans serve to protect the V3 loop and CD4 binding site [105].
Eggink et al. demonstrated that viruses originating from JR-CSF and LAI produced in GnTI−/− cells,
which lack the N-acetylglucosaminyltransferase I gene and are unable to convert oligomannose N-
glycans to hybrid or complex N-glycans, are more infectious to immature dendritic cells (iMDDCs) and
less transmissive to TZM-bl cells [106]. Shen et al. found that with more oligomannose and less
complex glycans virus attached more to monocyte-derived macrophages and dendritic cells, but the
Introduction
25
infectivity to those cells were less. Moreover, with the same glycan pattern, viruses were more
infectious to peripheral blood lymphocytes in the trans-infection way [107]. All the studies above
underscore the significant role of N-glycans in increasing or reducing HIV-1 infection and transmission.
Sialic acids are found at the terminal position of mammalian glycan structures. The localization at the
outmost position of the cell membrane enables sialic acid to act as a ligand for molecular interaction
and associated cell-cell and cell-microbe communication [108-110]. One of the most important bio-
functions of sialic acid is the regulation of the immune system by acting as a ‘self-molecular’ marker
or a “no self-molecular” marker through small structure modifications [111]. Therefore, it is
reasonable to assume that sialic acid alone can also play a crucial role in HIV infection and may
influence key functions of gp120.
1.5. Sialic acid
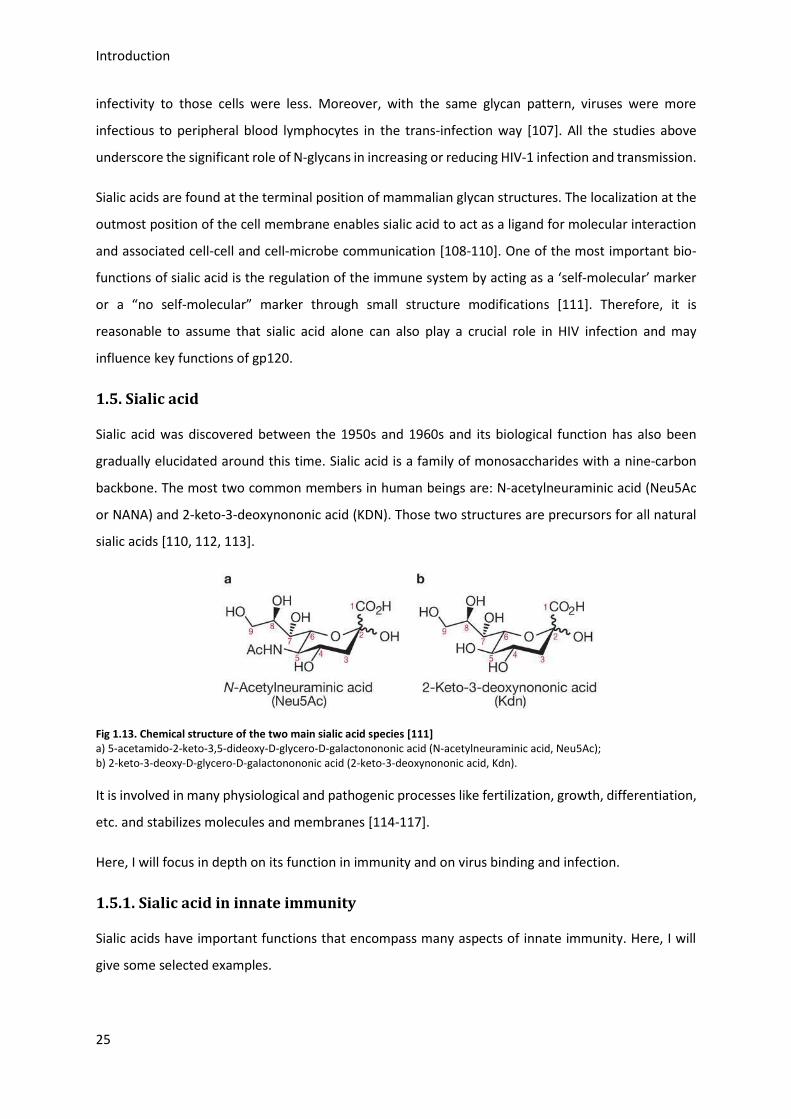
Sialic acid was discovered between the 1950s and 1960s and its biological function has also been
gradually elucidated around this time. Sialic acid is a family of monosaccharides with a nine-carbon
backbone. The most two common members in human beings are: N-acetylneuraminic acid (Neu5Ac
or NANA) and 2-keto-3-deoxynononic acid (KDN). Those two structures are precursors for all natural
sialic acids [110, 112, 113].
Fig 1.13. Chemical structure of the two main sialic acid species [111] a) 5-acetamido-2-keto-3,5-dideoxy-D-glycero-D-galactonononic acid (N-acetylneuraminic acid, Neu5Ac); b) 2-keto-3-deoxy-D-glycero-D-galactonononic acid (2-keto-3-deoxynononic acid, Kdn).
It is involved in many physiological and pathogenic processes like fertilization, growth, differentiation,
etc. and stabilizes molecules and membranes [114-117].
Here, I will focus in depth on its function in immunity and on virus binding and infection.
1.5.1. Sialic acid in innate immunity
Sialic acids have important functions that encompass many aspects of innate immunity. Here, I will
give some selected examples.
Introduction
26
In the airways, some areas of the mucous membrane secret a thick layer of mucus, which is a key
barrier for innate defense against pathogens. This mucus layer is composed of heavily sialylated
glycoproteins [118, 119]. They can bind and trap pathogens and prevent them from invading the
human body through mucociliary secretion [120].
In the alternative complement pathway, the combination of C3bBb and C3b leads to phagocytosis or
attack membrane complex formation (AMC), which can protect against invaders. Factor H, a critical
regulator of the complement system that prefers to bind to polyanion sites like sialic acid inhibits the
combination of C3bBb and C3b, and down-regulates complement system activity (Fig 1.14) [121]. It is
interesting to note that O-acetylation of sialic acid can block the recognition by Factor H, thereby
activating the complement system. These facts make sialic acid a critical regulatory component for
complement system activity [122-124].
Fig 1.14. The schematic representation of the complement system [125] The Factor H, intermediator C3bBbC3b and ficolins are underlined with orange.
Another example are ficolins, a group of sialic acid binding lectins. They recognize sialic acids on the
cell surfaces of bacteria and activate the lectin pathway of the complement system [126, 127].
Sialic acids are recognized by the immune system as “self-associated molecular patterns” (SAMPs) on
cell surface proteins [109]. For this reason, pathogens evolved to use sialic acid to mimic the
Introduction
27
physiological glycan patterns to evade immune surveillance. In response, the human body has to
develop a finely tuned immune system, which is capable of distinguishing between endogenous sialic
acid patterns in cellular functions and mimicking of sialic acid patterns from pathogens.
1.5.2. Sialic acid in adaptive immunity
Leukocytes trafficking is an important process where white blood cells migrate to a designated
location of infection. This rolling, adhesion, tight binding and migration process is a multi-cooperation
work. The selectins on leukocytes and endothelial venules interact with their corresponding ligands,
which is necessary for the adhesion and tight binding. The selectins on leukocytes are named L-
selectins to distinguish between P-selectin on platelets and E-selectin on endothelium. All selectins
can recognize Sialyl Lewis X/A motifs, which have an O-glycan structure of Siaα2-3Galβ1-3/4(Fucα1-
3/4)GlcNAcβ1 [128-135]. The key determinant for efficient binding of these lectins is the α2-3
conjugation of sialic acid and galactose [136-138].
Sialic acid-recognizing Ig-superfamily lectins (Siglecs), a subset of I-type lectins [139], are found
primarily on the surface of immune cells. Siglecs bind to sialic acid-containing cis-ligands on the same
cell surface and trans-ligands on the surface of different cells [140, 141]. Several Siglecs like CD-22 and
Siglec-G contain immune receptor tyrosine-based inhibitory motifs (ITIMs) in their cytosolic domain.
After binding to SAMPs, ITIMs can recruit SH2-domain-containing tyrosine phosphatases, which act as
an inhibitory regulator of immune signal transduction. Thus, siglecs are related to autoimmunity and
unregulated inflammation [141]. For example, the addition of O-acetylation to the C-9 position of sialic
acid, which blocks the proper interaction of CD22 and Siglec-G, is widely observed in autoimmune
diseases [142, 143].
A small amount of the circulating Immunoglobulin G (IgG) possesses α2-6-linked sialic acid on their N-
glycans. They interact with Dendritic Cell-Specific Intercellular adhesion molecule-3-Grabbing Non-
integrin (DC-SIGN) to upregulate FcRγ-IIB (Fc gamma receptor) expression on macrophages and inhibit
macrophage activity [144-146].
1.5.3. Sialic acid in pathogen binding and infection
Due to its abundant expression on human cells, many viruses use sialic acid as a primary receptor for
infection or host cells attachment and entry. The most prominent example for this is the Influenza
virus, which expresses the surface proteins haemagglutinin (HA) and neuraminidase (NA). The HA
binds to α2,3-linked and α2,6-linked sialic acid receptors on the host cells for the initial infection. After
replication inside the cells, it uses the NA to cleave off sialic acid, allowing virus release. Besides sialic
acid linkage type, other factors affect the virus binding and infection: modifications of sialic acids,
Introduction
28
underlying glycan chains, cell membrane properties and the nature of the HA in virus evolution [147-
151].
In contrast, other pathogens try to mimic the sialic acid expression on their surfaces to be recognized
as “self” and to escape from human immune recognition. Group B Streptococcus, for example,
possesses a capsular polysaccharide with Siaα2-3Galβ1-4GlcNAc units on the terminal [152], which
can be recognized by Siglec-9 on human neutrophils as “self”, and evade neutrophil defense functions.
This evasion of neutrophil responses works through the engagement of a host inhibitory Siglec with
sialic acid expression on the pathogen [153].
Viruses can also use the interaction between sialic acid and sialoadhesin in the human immune system
to spread. Antigen-presenting cells (APC) and dendritic cells (DC) can capture viruses and present it to
T cells to initiate an adaptive immune response. This defense process, however, can be hijacked by a
virus and used for its transmission to the target cells. In HIV-1 infection, for example, the HIV-1 is
captured by Siglec-1 on mature DCs, which recognize sialyllactose containing gangliosides on the viral
membrane. They then transfer the viruses to CD4+ T-Lymphocytes [154, 155]. This so-called trans-
infection is particularly efficient at low virus concentration, allowing efficient replication at the initial
stage of the viral infection [156-159].
Even small modifications of sialic acid in host cells play a big role in the evolution of virus tropism and
the intrinsic sialic acid biosynthesis pathway. For instance, many viruses express sialic acid-specific
enzymes, like sialidases, that can remove sialic acid, or esterases, that can remove an ester-bonded
acetyl group from the sialic acid. At the same time, some bacteria adapt their own biosynthesis
pathway to compensate for changes in sialic acids in their host [160-162].
1.5.4. Biosynthesis of N-Acetylneuraminic Acid (Neu5Ac)
Neu5Ac is the main precursors for all other sialic acid species. The biosynthesis pathway of Neu5Ac is
named the Roseman-Warren pathway after its discoverers [163]. Fructose-6-phosphate is ultimately
converted to UDP-N-acetylglucosamine (UDP-GlcNAc) in the hexosamine pathway. UDP-GlcNAc is an
important precursor for glycosylation of lipids and proteins and for conversion into other nucleotide-
sugars [113, 164]. It needs five steps and four key enzymes to form Neu5Ac from UPD-GlcNAc. First,
UDP-GlcNAc is catalyzed by UDP-GlcNAc-2-epimerase to form N-acetylmannosamine (ManNAc).
Second, ManNAc is phosphorylated to ManNAc-6-phosphate by the enzyme ManNAc-kinase. UDP-
GlcNAc-2-epimerase and ManNAc-kinase is a bifunctional enzyme: UDP-GlcNAc-2-
epimerase/ManNAc-kinase (GNE/MNK) [116, 165]. Third, Neu5Ac-9-phosphate is formed by a
condensation reaction between ManNAc-6-phosphate and phosphoenolpyruvate (PEP) in the
Introduction
29
presence of sialic acid synthase (SAS) [166, 167]. The last step in the cytosol is the release of phosphate
from Neu5Ac-9-phosphate by the Neu5Ac-9-phosphate phosphatase to form Neu5Ac.
Fig 1.15. Schematic representation of sialic acid biosynthesis in vertebrates [168] GNE catalyzes the first two steps of this pathway. The respective enzymatic reactions are indicated in bold. Note that UDP-GlcNAc is supplied from fructose-6-phosphate by the hexosamine pathway, and that CMP-Neu5Ac is formed in the nucleus. Feed-back inhibition of the UDP-GlcNAc 2-epimerase activity of GNE by CMP-Neu5Ac is further indicated.
In the nucleus, CMP-Neu5Ac, the activated form of Neu5Ac, is formed. It is essential for later
conjugation of Neu5Ac on glycans. In contrast to most other sugars, which are activated by
conjugation to uridine or guanine dinucleotides in the cytosol, Neu5Ac is an exception as it is activated
with cytidine monophosphate (CMP) in the nucleus. CMP-Neu5Ac is then transported into the Golgi
apparatus via a CMP-Sia/CMP anti-transporter (CMPNT) [169, 170]. From there, it is catalyzed by a
family of 20 different sialyltransferases (STs) [171] and transferred to glycosphingolipids, glycoproteins
or poly-/oligosaccharides (α2,3-, α2,6- or α2,8-linkage). Various substitutions on hydroxyl groups or
addition of O-acetyl esters also happen here [111]. These diverse linkages and substitutions make up
to 50 different naturally occurring structures of sialic acids [172].
Introduction
30
1.6. Sialic acid function and modification
There are several ways to investigate biological functions of sialic acids (Sias):
1. By blocking Sias with natural lectins, selectins or recombinant virus hemagglutinins
2. By treating samples with sialidases, to release Sias from cell surface or with esterases to release O-
acetyl groups on Sias
3. By using cell lines with genetic deficiencies in enzymes of the Neu5Ac biosynthesis pathway
(sialyltransferases, GNE)
4. By using small molecule inhibitors of sialyltransferases like 3-Fluoro sialic acid or inhibitors of GNE
like 3-O-Methyl-ManNAc
5. By metabolic glycoengineering (MGE)
The foundation for metabolic glycoengineering was laid when Tangvoranuntakul et al. discovered that
exogenous Neu5Gc uses the Neu5Ac-biosynthesis pathway to be incorporated into terminal glycans
of human tissues [173]. That finding indicates that the enzymes in the biosynthesis pathway of Neu5Ac
are tolerant to exogenous intermediates. This tolerance, together with the diversity of Neu5Ac, allows
the use of designed Neu5Ac analogs and intermediates to engineer new unnatural sialic acid
structures.
Today this field has expanded greatly to encompass a variety of further analogs and applications. Two
main intermediates in the Neu5Ac glycosylation pathway are exploited: Neu5Ac and ManNAc.
ManNAc is the main precursor of Neu5Ac, whose analogs can be easily converted to the corresponding
sialic acid [174, 175]. The pioneer work was laid by the group of Prof. Reutter, when they use ManNAc
analogs to successfully express modified Neu5Ac on the cell surface [176, 177], Since then many
different N-acetyl substitutions of ManNAc have been synthesized and systematically tested for
biological functions in protein/membrane interaction, neurophysiology, developmental and stem cell
biology, and cancer research [115, 174, 176, 178-184]. Most analogs contain N-acyl modifications at
position C2 and C4. They exhibit low cytotoxicity and are relatively easy to synthesize. However, due
to the restrictions of the SAS, bulky modifications with branches of more than 6 carbons dramatically
reduce their metabolic efficiency [185].
Neu5Ac analogs are the most efficient analogs for installing unnatural sialic acids. They can be taken
up easily by cells [186, 187], which is an important requirement for successful analog conversion.
Besides that, bulky modifications can also be introduced to the C-9 position without difficulties, which
would not be feasible with ManNAc analogs. However, the synthesis of modified Neu5Ac compared
to that of ManNAc is difficult and costly.
Introduction
31
There are also other intermediates like CMP-Neu5Ac and GlcNAc. CMP-Neu5Ac analogs are suitable
for introducing bulky substitutions, e.g. fluorophores, on the N-acyl position. However, their
membrane permeability is poor [188, 189]. GlcNAc analogs are mostly used for nucleocytoplasmic O-
GlcNAc-protein modification rather than for sialic acid modifications.
1.6.1. Neu5Ac modification and virus infection
Neu5Ac serves as the binding partner for many viruses and the N-acetyl side chain is crucial for this
binding step [179, 190].
Influenza A infects cells by binding to Neu5Ac residues on the target cells. This binding can be
weakened or hindered by modifying the N-acetyl side chain. The aliphatic elongation of N-acetyl side
chains in Neu5Ac leads to a reduction of influenza A binding and infection of MDCK II cells [180]. Since
the N-acetyl side chain is well coordinated in the HA binding pocket, modifications to the N-acetyl side
chain result in steric hindrance and binding inhibition [191]. Kelm et al. also found that substitution of
the N-acetyl side chain with other functional groups like hydroxyl, azido, or amino group had similar
effects [192].
The family of polyomavirus recognizes Neu5Ac on host cells via their capsular viral protein 1 (VP1).
Keppler et al. used modified surface Neu5Ac on monkey kidney epithelial cells (COS-1) to test the
infectivity of human polyomavirus 1 (BKV). The results showed that infectivity was increased fivefold
with N-Propionyl mannosamine (ManNProp) treatment and decreased fourfold with N-pentanoyl
mannosamine (ManNPent) [179]. With B lymphotropic polyomavirus (LPV), both binding and infection
were reduced by treating mouse fibroblasts (NIH-3T6) with ManNProp, N-butanoyl mannosamine
(ManNBut), ManNPent and N-hexanoyl mannosamine (ManNHex) [115, 193]. It was suggested that
the more stable binding of VP1 and Neu5Ac compared to the unnatural sialic acid, as demonstrated
by free energy (ΔG) measurements of VP1 in complex with modified sialic acids, is the main reason for
this effect [115].
1.6.2. Neu5Ac modification in tumor cells
Glycans on tumor cells appear aberrant compared to normal cells [194-196]. The glycans, which are
increased in tumor cells, are referred to as tumor-associated carbohydrate antigens (TACAs), such as
sialylated glycosphingolipid GM3 and polysialic acid (PSA).
Chefalo et al. found that N-phenylacetyl-D-mannosamine (ManPAc), which is converted to the
corresponding sialic acid on GM3, efficiently enhance immunogenicity of GM3. Moreover, these
tumor cells were more sensitive to anti-PAcGM3 immune serum [197]. This concept was applied in
Introduction
32
vivo, resulting in significant inhibition of tumor growth, prolonged survival and reduced metastasis
[198].
Expression of PSA was related to metastasis of several malignant tumors that originated from adult
brain [199-202]. When leukemia and myeloma cells were treated with ManNProp, the corresponding
modified unnatural Neu5Ac were incorporated into PSA. This modification elicited antibody
production and assisted in the elimination of these tumor cells [203, 204]. Moreover, ManNProp or
ManNPent treated neuroblastoma cells showed less sialyation, reduced metastasis and increased
sensitivity towards radiation or chemotherapeutics [205]. These results suggest that MGE is an
interesting way to develop new cancer therapies.
1.6.3. Neu5Ac modification and neuron cells
Human brain structure is very different from other mammals. Ganglioside levels are twice as high in
other species [206-208]. In the maturation process of the brain, sialylation in different stages of
development has varied biological functions. Aberrant sialylation is related to brain malfunctions [209-
211].
Using ManNProp in the cell medium, Neu5Prop was expressed on the cell surface of neuron cells. It
stimulates the proliferation of astrocytes and microglia but not of oligodendrocyte progenitor cells in
vitro. However, Neu5Prop might act as a regulator of oligodendroglial lineage regeneration, since its
expression stimulates the expression of the A2B5 epitope, an oligodendroglial progenitor marker, on
cerebellar neurons but not on astrocytes [182]. Schmidt et al. could also show that in the presence of
γ-amino butyric acid (GABA), Neu5Prop regulates intracellular calcium concentration in
oligodendroglial cells [212].
Voltage-gated potassium channels (Kvs) play a crucial role in building an action potential in neuron
cells. Kv3 voltage-gated K(+) channel has two conserved sialylated N-glycans, whose absence would
result in reduced activation, inactivation and deactivation kinetics of the ionic currents [213, 214].
Moreover, outward ionic currents of Kv3.1 transfected B35 cells, treated with ManNProp or ManNBut,
had slower activation and inactivation rates compared to untreated cells. Therefore, the N-acyl side
chain of sialic acid in Kv3.1 has a critical biological role [215].
ManNProp treated neurite cells increase their outgrowth [216, 217] and have improved peripheral
nerve regeneration in vivo [218, 219].
1.6.4. Neu5Ac modification and immune system
Introduction
33
Sialic acid plays an important part in the immune system. For example, the Neu5Ac–siglec axis is
critical for hemostasis [220]; there are changes in sialylated structures during DC maturation [221];
and resting B cells without Neu5Ac have enhanced capacity to present antigen to alloreactive T cells
[222].
Presenting ManNProp to human peripheral blood mononuclear cells (PBMC) results in proliferation,
increased IL-2 and CD25 production, IL-2 receptor and transferrin receptor upregulation [223]. These
results might be caused by CMP-N-propanoylneuraminic acid (CMP-Neu5Prop), which interacts with
proteins inside the nucleus responsible for gene expression.
34
1.7. Goal of the work
The goal of this work was to elucidate the role of sialic acid in the binding of gp120 to CD4 and CXCR4
and gp120 induced syncytia formation. In order to achieve this, a stable binding assay and a cell system
where syncytia formation can be observed needs to be established. Different sialic acid modifications
shall be introduced and tested for their effect on these established assays. Sialic acid modifications of
cells can be achieved by feeding cells with N-acetylmannosamine (ManNAc) analogs available from
previous studies in the lab.
With the result of this work, I hope to gain better insights into the relevancy of sialic acid for gp120
and HIV-infection. In case there are significant effects observable in these assays, Neu5Ac modification
via ManNAc analogs may become a useful tool for HIV research.
35
2. Material and methods
2.1 Instruments
Equipment Name Company
SDS-PAGE-System Mini-Protean II Biorad
Power Supply Power-Pac 1000 Biorad
Thermo block Thermomixer Compact Eppendorf
Thermo shaker Thermo shaker HT Infors
Ultrasonic Ultraschallprozessor M Labosonic
Centrifuges RC5-Superspeed DuPont
MultiFuge 1 Heraeus
3-18K Sigma
Biofuge 13 Heraeus
Vortex Genie 2 Scientific Instruments
Scale 1602 MP Sartorius
PCR thermos cycler Mastercycler Eppendorf
pH meter pH 211 HANNA Instruments
Vacuum concentrator speedDry Christ
Gel scanner Universal Hood Biorad
FPLC ÄKTApurifier GE Healthcare
Photometer Ultraspec500pro Amersham Bioscience
Multiscan GO Thermo scientific
Microscope Observer.Z1 Zeiss
FACS FACSCanto II BD Bioscience
HPLC Agilent 1100 Agilent Technologies
Incubator Lab-Shake Adolf Kühner
Sterile Bench LaminAir Holten
X ray film processor OPTIMAX 1170-1-0000 PROTEC
Material and Methods
36
2.2. Materials
In general, mammalian cell lines originated from ATCC (USA), NIH AIDS Reagent Program and DSMZ
(Germany). Bacteria strains and vectors were purchased from Invitrogen (Netherland). Insect cells (Sf9)
were from GibcoBRL (USA). Chemicals were from Sigma (Germany, Roth (Germany), Calbiochem
(Germany); enzymes from Sigma (Germany), Roche (Germany), antibodies from Sigma (Germany),
Dako (Germany); lectins from Gentaur (UK); cell culture medium from PAN Biotech (Germany) and
other reagents were purchased from Sigma (Germany), Roth (Germany), Roche (Germany),
Calbiochem (Germany), and GibcoBRL (USA).
Peroxidase-conjugated rabbit-anti-GST Antibody (Sigma), HRP-anti-Mouse and HRP-anti-Rabbit
(EnVision+® system DakoCytomation), FITC-conjugated anti-Mouse/ Rabbit IgG and Cy3-conjugated
anti-Mouse/ Rabbit IgG (Sigma), Monoclonal/polyclonal anti-GFP Antibody was from AG Reutter and
AG Fan (Charite, Berlin), Antiserum to HIV-1 rgp120 and monoclonal antibody to CXCR4 were obtained
from the National Institute for Biological Standards and Control (NIBSC).
ManNAc was purchased from Sigma (Germany). ManNProp, ManNBut were described and obtained
from previous experiments in the lab [224].
2.3. Protein biochemical methods
2.3.1. Nano Drop
This method uses the A280 absorbance value in combination with either the mass extinction
coefficient or the molar extinction coefficient to calculate the concentration of purified proteins. It
applies only to purified proteins that contain tryptophan, tyrosine and phenylalanine residues or
cysteine-cysteine disulfide and has no impurities in DNA or RNA. One load 2 µl of the protein sample
on the bottom pedestal and measure the protein concentration at 280 nm directly. The NanoDrop
2000/2000c Spectrophotometer automatically calculates the protein concentration on the basis of an
internal standard.
2.3.2. BCA assay
BCA assay is less susceptible to detergents and has a broader linear range (10 µg/ml to 1400 µg/ml
protein). Upon binding to proteins Cu2+ ions are reduced to Cu1+, which then form a stable chelate
complex with two molecules of bicinchoninic acid. This complex has a maximum absorption at 562 nm.
One adds 10 µl of a protein sample to 100 µl of freshly prepared BCA reagent (reagent A and B in a
ratio of 50:1 (Pierce, Rockford, USA)) and incubate the solution at 37°C for 30 min. Subsequently, the
protein concentration is measured at 570 nm and compared to a calibration curve.
Material and Methods
37
2.3.3. SDS-PAGE
SDS-PAGE stands for sodium dodecyl sulfate - Polyacrylamide Gel Electrophoresis. In this, one usually
uses a discontinued gel electrophoresis system with a stacking gel and a resolving gel. In the stacking
gel the protein sample will be collected and focused. In the resolving gel the proteins samples are
separated according to their molecular mass.
Sodium dodecyl sulfate (SDS) is a detergent containing a 12-carbon hydrophobic chain and a polar
sulfated head. The hydrophobic chain intercalates into hydrophobic parts of the protein and denatures
its tertiary structure. The hydrophilic head remains in contact with water and keeps the protein
soluble. In this way, SDS coats proteins uniformly with a layer of negative charge and allows them to
migrate towards the anode when placed in an electric field. The electrophoresis takes place usually at
150 V for 60 min. Protein standards (Biorad, Germany) serve as indicator and control for the run.
Protein samples can also be denatured completely prior to loading onto the stacking gel.
Resolving Gels
7,5% Gel: 2.25 ml A, 2.25 ml B, 4.5 ml H2O, 100 µl 10% APS (w/v), 10 µl TEMED.
10% Gel: 3.0 ml A, 2.25 ml B, 3.7 ml H2O, 100 µl 10% APS (w/v), 10 µl TEMED.
Stacking Gels
4% Gel: 0.4 ml A, 0.75 ml C, 1.85 ml H2O, 24 µl 10% APS, 6 µl Tetramethylendiamine(TEMED).
Solution A: 30% Acrylamide (w/w), 0,8% N, N-Methylenbisacrylamid (w/v).
Solution B: 0.2% SDS (w/v), 1.5 M Tris-HCl, pH 8.8.
Solution C: 0.4% SDS (w/v), 0.5 M Tris-HCl, pH 6.8.
Running buffer: 25 mM Tris-HCl, 192 mM Glycine, 0.1% SDS (w/v).
5xSample buffer: 0.3 M Tris-HCl, pH 6.8, 50 % Glycerin (v/v), 15 % SDS (w/v), 0.015 % Bromophenol
blue (w/v), 25% 2-mercaptoethanol (only in reducing sample buffer).
2.3.4. Coomassie staining
In order to visualize the protein bands after SDS-PAGE several methods are used. The easiest one is
Coomassie staining. This works for protein samples with amounts higher than 0.5 µg. The Coomassie
dye forms a complex with proteins and makes protein bands blue. After electrophoresis gels are
washed 3 times for 5 min. with 200 ml double distilled H2O, then incubated for 1 h at RT with Bio-Safe™
Coomassie G-250 Stain (Bio-Rad Laboratories). After this, the stained gel will be washed in 200 ml
ddH2O until background color disappears.
2.3.5. Silver staining
Material and Methods
38
For lower protein concentration, this alternative staining method can be applied. It can stain protein
amounts as low as 50 ng. For this assay, the gels are incubated 20 min at RT in fixing solution;
subsequently washed 3x for 5 min in 50% ethanol. Then for exactly 60 s the gel is immersed in 25 ml
of solution A, washed 3x shortly with ddH2O; then incubated for 15 min in solution B and washed 3x
again with ddH2O. The protein bands should be visible after 1-5 min of reaction in solution C. This
reaction can be stopped with fixing solution.
Fixing solution: 40% Ethanol (v/v), 10% Acetic acid (v/v), 0.05% formaldehyde (v/v).
Solution A: 0.02% Na2S2O3.
Solution B: 0.16% AgNO3, 0.08% formaldehyde (v/v).
Solution C: 5% Na2CO3, 0.0005% Na2S2O3 (w/v), 0.05% formaldehyde.
2.3.6. Western Blot
This method is used widely to detect the protein band of interest with an antibody. For this the SDS-
PAGE gel with the separated protein bands is transferred onto a nitrocellulose membrane. The transfer
takes place at a constant current of 250 mA for 60 min in ice-cold blot buffer. The protein gel and
nitrocellulose membrane (Protan® Nitrocellulose Transfer Membrane; Schleicher & Schuell, Germany)
are put together in the blot chamber so that the membrane is on the side of the anode.
To verify the transfer of the protein, the membrane is stained with Ponceau-solution for 1 min and
destained with 1% acetic acid until protein bands are visible. The dye can be removed completely with
2x washing in PBS + 0.1% Tween-20.
The membrane can now be stained with antibodies (AB) or lectins. For this, the membrane is first
incubated in 5% (w/v) milk powder in PBS for 30 min at RT to block unspecific binding sites.
Subsequently, the membrane is washed 2x with PBS-Tween for 5 min and immersed in the primary
antibody solution. Antibodies solutions are diluted depending on the quality of the AB from a ratio of
1:2000 to 1:500 (v/v) in PBS. The incubation time also depends on the AB and can vary from 1 h at RT
to 12 hours at 4°C.
After this, the membrane will be washed again 2 x with PBS-Tween and incubated 1 h at RT with the
second antibody. This second AB is usually an anti-mouse or anti-rabbit antibody, which is conjugated
to peroxidase. Specific protein bands can now be visualized with DAB substrate (Roche), a color
reaction triggered by H2O2 radicals or with chemiluminescence (ECL) substrate combined with X-ray
film (GE Amersham Hyperfilm ECL).
Material and Methods
39
After incubation with second antibody, the blot is washed with PBS-Tween before being dried on a
clean facial tissue. The ECL substrate need to be prepared freshly.
Pick the blot membrane up and place it on a clean dry plate. Add the prepared ECL reagent. Let the
ECL reagent incubate evenly for at least 1 min. After incubation, carefully dry the blot membrane,
transfer it face up onto the sheet protector, and put it to the inside of the film cassette. Dry the sheet
protector thoroughly to remove excess ECL as well as any air. Afterwards, expose the film for 10 s to
the membrane before developing the film.
Blot buffer: 25 mM Tris, 160 mM glycine, 10% (v/v) EtOH.
Ponceau-solution: 0.2% (w/v) Ponceau-Red, 3% (v/v) trichloracetic acid, 3% (w/v) sulfosalicylacid.
PBS: 137 mM NaCl, 2.7 mM KCl, 10 mM Na2HPO4, 1.76 mM KH2PO4, pH 7.4.
PBS-Tween: 137 mM NaCl, 2.7 mM KCl, 10 mM Na2HPO4, 1.76 mM KH2PO4, 0.1% Tween-20, pH 7.4.
Luminescence substrate solution A: 200 ml 0.1M Tris Hcl PH 8.6, 50 mg luminol.
Luminescence substrate solution B: 11 mg p-Coumaric acid in 10 ml DMSO.
ECL substrate: mixture of 2 ml Luminescence substrate solution A, 200 µl Luminescence substrate
solution B and 1 µl H2O2.
2.3.7. DMB labeling and Sialic acid analysis (HPLC)
One of the most common quantification methods for sialic acid involves releasing sialic acids from the
glycoprotein, derivatizing Neu5Ac and Neu5Gc with 1,2-diamino-4, 5-methylenedioxybenzene (DMB),
and analyzing by C18-HPLC with fluorescence detection. Cells were cultured in their growth medium
together with the ManNAc derivatives at 5mM. After 5 days, these cells were collected in lysis buffer,
then the cells sonicated using a probe sonicator (3 30-s pulses) on ice, then centrifuged at 21000×g 2
hours at 4°C to separate the membrane from the cytosolic fractions. The protein concentration of the
cytosolic part was determined by BCA assay. The separated fractions were hydrolyzed in 1 M
trifluoroacetic acid (TFA) for 4 h at 80°C. The samples were subsequently lyophilized and taken up in a
5 µl TFA (120mM) solution. By adding 30 µl of the DMB solution and incubating for 2 h at 56°C the
DMB reagent will be conjugated to the sialic acids moieties. Samples were prepared for HPLC analysis
via a reverse phase column.
Lysis buffer: 150 mM NaCl, 10 mM Tris, 5 mM EDTA, 1 mM PMSF, 40 µM leupeptine, 1.5 µM aprotinine,
pH 8,0.
DMB solution: 6,9 mM 1,2-diamino-4,5-methylendioxybenzen (DMB), 0,67 mM β-mercaptoethanol,
39% sodium bisulfite, store at -20 °C in dark.
Material and Methods
40
Labeled samples are analyzed with a C18 RP column (110 Å, 3 µm particle size, 4.6 x 150 mm) on an
HPLC system with a fluorescence detector. The column temperature is 40 °C and the detection
wavelength is 373 nm for excitation and 448 nm for emission, respectively. 10 µl of the sample will be
injected and separated for 50 min at 0.5 ml/min flow rate of initial methanol/acetonitrile/water
(6:8:86) as eluent. After measuring of each sample the column will be washed for 7.5 min at 1.0 ml/min
flow rate (≈ 1.5 column volumes) with methanol/acetonitrile/water (6:25:69) and re-equilibrated for
7.5 min at 1.0 ml/min flow rate with methanol/acetonitrile/water (6:8:86). The area under the curve
of the sialic acid peaks will be used to calculate the concentration compared to Neu5Ac standard and
predetermined protein concentration. All reagents are HPLC grade.
2.4. DNA biochemical methods
2.4.1. Polymerase chain reaction
This is a standard method for amplifying a chosen DNA sequence in vitro. One uses this method for
example to amplify the gene of interest for cloning. The basic components of a PCR are DNA template,
specific primers, heat-stable polymerase and dNTPs.
A PCR sample (50 µl total) usually consists of: 10-100 ng DNA template, 20 pmol of forward and reverse
primers, PCR Supermix by Invitrogen (Darmstadt) containing dNTPs each 200 µM, Taq DNA polymerase
1 U and buffer (20 mM Tris-HCl, pH 8.4, 50 mM KCl, 1.5 mM MgCl2). The thermo cycling conditions are
optimized to the primers and are repeats of denaturation, annealing and elongation phases.
2.4.2. DNA purification
Using Machery-Nagel NucleoSpin® Extract II columns according to their manual, DNA samples were
purified of unwanted oligonucleotide primers, salt, enzymes, agarose gel, oil and detergents.
2.4.3. DNA concentration determination
The concentration of a DNA solution was determined by spectral photometric measurements at 260
nm and 280 nm. A pure DNA solution has an extinction ratio 260 nm/280 nm of around 1.8.
2.4.4 Agarose gel electrophoresis
Like the SDS-PAGE, agarose gel electrophoresis is an important method to analyze DNA fragments
according to size. The running velocity of a DNA is linear to the inverse proportional logarithm of the
molecular mass. Plasmid DNA can exist in different tertiary forms: linear, coiled and supercoiled. Due
to their compact nature, coiled and supercoiled structures tend to move faster in the gel. Therefore,
prior to gel separation plasmid DNA should be linearized with a specific restriction enzyme.
Material and Methods
41
The electrophoretic separation takes place horizontally in 0.8-1.5% agarose gels. Agarose powder is
suspended in TAE buffer and heated in a microwave for ca. 3 min until the gel is completely dissolved.
The gel will cool down and polymerize in a gel chamber of choice. Depending on the sample pocket
10-50 µl of a DNA sample, which was previously mixed with DNA sample buffer, can be added to the
gel pockets. 5 µl of 1 kb DNA standard ladder (Gibco-BRL, USA) is used as the standard. The
electrophoresis then takes place in 1xTAE buffer under a constant field of 0.5 V/cm2 gel surface. After
the run, the agarose gel is soaked in ethidium bromide solution for 10 min and DNA bands are
visualized under UV light at 254 nm.
TAE buffer: 40 mM Tris, 5 mM sodium acetate, 1 mM EDTA, pH 7.9.
6xDNA sample buffer: 30% glycerin, 0.25% bromophenol blue.
Ethidium bromide solution: 0.5 g/l ethidium bromide in TAE-buffer.
2.4.5. DNA digestion with restriction endonuclease
Restriction endonucleases are used to cut double-stranded DNA at restriction sites for cloning
purposes. The reactions take place with 1-40 µg DNA and 1-40 U restriction enzymes in the
recommended buffer of the manufacturer for 1 h at 37°C.
2.4.6. Production of PCR blunt plasmids
Blunt vectors (Zero Blunt® PCR vectors) are used to clone blunt PCR products into a bacterial plasmid.
This method serves to preserve blunt DNA fragments and to amplify these fragments in E.coli. The
pCR®-Blunt vector contains the lethal E.coli ccdB gene fused to the C-terminus of LacZα. Usually E.coli
transformed with this vector are killed by the ccdB- LacZα fusion protein when plated. The ligation of
a blunt fragment disrupts the formation of this fusion gene, allowing transformed cells with an insert
to survive on kanamycin selective plates.
1 µl pCR®-Blunt vector is used with up to 5 µl of purified PCR products. 1 µl 10x ligation buffer (+ATP),
1 µl T4-DNA-ligase and ddH2O are added to a total volume of 10 µl. The ligation reaction takes place at
16 °C overnight.
2.4.7. DNA ligation
In the ligation DNA fragments with overlapping ends were connected to each other via ligase enzymes.
This method is applied to insert the DNA gene of choice into an expression vector. This procedure is
most successful when the molar ratio of insert to vector is at least 3:1.
Material and Methods
42
In a ligation reaction (20 µl total) one add 1 µl T4-DNA-Ligase (10 U), 2 µl 10xligation buffer, 1 µl Vector
(100 ng), 5 µl DNA insert (500 ng) and 11 µl ddH2O and leave at 16°C overnight. After the ligation is
completed, usually 10 µl of this mixture is used directly for E.coli transformation.
2.4.8. Sequencing
All plasmid constructs used in this work are verified with the Sanger dideoxy sequencing method
according to the manufacturer’s instructions using the Thermo Sequenase Primer Cycle Sequencing Kit
(Amersham Biosciences).
In a typical protocol one adds 1 µl primer solution (2 pM) to 1.3 µg template DNA diluted in 12 µl
ddH2O. From this stock solution (total 13 µl) 3 µl is transferred into 4 tubes containing 3 µl of each
sequencing reagent A, C, G or T. Beside a mixture of dNTPs (deoxyribonucleotide) each of the reagents
contains the respective ddATP, ddCTP, ddGTP, ddTTP (dideoxyribonucleotide) which cause the
interruption of polymerization at those sites.
Following thermo cycling condition are performed:
Initial step: Denaturation 3 min 94 °C
24 Cycles: Denaturation 20 s 94 °C
Annealing 20 s 45-60 °C
Elongation 20 s 72 °C
The reaction is stopped by adding 5 µl of stop solution and run for another 3 min. The PCR products
are then separated on a 6% acrylamide gel and analyzed in an automatic sequence analyzer (Licor
4000, MWG-Biotech)
Sequencing primers tagged with 3’-IRD700 or IRD800 were used
GST Seq Fw 5’ - GCAAGCTACCTGAAATGCTG
GST Seq Rv 5’ - GTATCACGAGGCCCT
The sequencing experiments were carried out by Katrin Büttner (Prof. B. Wittig’s lab, FU Berlin).
2.5. Bacteria cell culture
Escherichia coli are cultured in a 37°C shaking incubator (225 rpm) in LB-medium. The stock of certain
strains are stored at –80°C with 20% glycerin. Stored strains can be defrozen and resuspended in
medium for cultivation after several years
LB-Medium: 10 g/l Peptone, 5 g/l yeast extract, 10 g/l NaCl (as low salt only 5 g/l NaCl), 15 g/l agar
(only for LB plates).
Material and Methods
43
SOC-Medium: 20 g/l peptone, 5 g/l yeast extract, 0.5 g/l NaCl, 4 g/l MgCl2, 0.186 g/l KCl, 3.6 g/l glucose.
SOB-Medium: 20 g/l peptone, 5 g/l yeast extract, 0.6 g/l NaCl, 0.2 g/l KCl, 10 mM MgCl2, 10 mM MgSO4,
Mg2+ solutions are added after autoclaving, before use.
LB agar plates for DH10Bac™ transformants: LB Agar plates containing 50 µg/mL kanamycin, 7 µg/mL
gentamicin, 10 µg/mL tetracycline, 100 µg/mL Blue-gal, and 40 µg/mL IPTG.
2.5.1. Competent Escherichia coli
Competent cells have permeable membranes, so that they can better take up free DNA fragments.
They allow target plasmids to diffuse inside the bacteria and cell transformation to take place. This
permeability allows various results included: amplify a known plasmid DNA for further isolation (E. coli
cell lines Top10 and InvαF’), the preparation of bacmid for transfection in insect cells (E. coli cell line
DH10 BAC) or for protein expression (E. coli BL21 starTM (DE3) pLysS). In this lab, one exposes the
E.coli to a cold 100 mM CaCl2 according to Dagert und Ehrlich 1979. One E.coli clone (Top10, BL21 RIL,
InvF) is cultured overnight in the SOB medium. 2 ml of this culture is then added to 100 ml of SOB
and further cultured until the suspension density reaches an OD600 of 0.2-0.3. Cells are than centrifuged
down (4000 rpm) for 10 min, resuspended in 20 ml cold CaCl2, and put on ice for 30 min. Subsequently,
E.coli cells are centrifuged down again and incubated in 1 ml of ice-cold CaCl2 for at least 1 h. Finally,
these cells can be directly used for transformation or stored at – 80 °C.
2.5.2. Transformation of plasmid-DNA in E. coli
Transformation is the process of transforming a bacteria’s DNA with foreign DNA plasmids. For this, 10
µl of the ligation mixture or 100 ng plasmid DNA is added to 100 µl of competent cells and incubated
for 30 min on ice. Depending on the cell lines, these cells are then heat-shocked for exactly 25-45 s in
42 °C water bath and cooled down again for 2 min. Subsequently, 250 µl of pre-warmed SOC medium
is added to the mixture and cells are left to recover for at least 1 h at 37 °C. 50-200 µl of this culture is
plated on pre-warmed LB Agar plates with selective medium and cultured overnight.
2.5.3. Overnight culture production
A chosen clone on the agar plate is picked and grown in selective LB-medium at 37 °C overnight. The
overnight culture contains a saturated suspension of target bacteria and can be used to prepare
protein expression cultures or to isolate plasmid DNA.
2.5.4. Plasmid amplification in Escherichia coli
For plasmid amplification, plasmids or vectors are transformed into Top10 E.coli cells. Top10 E.coli
strain has a high transformation efficiency (up to 1x10⁹ cfu/µg) and is adapted for cloning and plasmid
Material and Methods
44
propagation. There is an intrinsic expression of Endonuclease I and non-specific DNAs are digested.
The transformed Top10 cell line is then cultured overnight for pDNA isolation.
2.5.5. Plasmid DNA preparation
All plasmid purification methods were adapted from the alkaline extraction method of Birnhoim and
Doly (1979) [225]. In the lab the buffer system of the Machery-Nagel NucleoBond® Xtra Kit is used for
pDNA purification.
For a mini plasmid preparation (20-30 µg), 2 ml of E.coli overnight culture is collected and centrifuged
for 10 min at 7000 rpm. The bacteria pellet is then completely resuspended in 200 µl RES buffer (100
mg/l RNase added). Subsequently, 200 µl of LYS buffer is added to the suspension and gently mixed by
inverting the tubes 5 times. This alkaline NaOH/SDS solution lyses the cell and releases the plasmid
DNA. The addition of 200 µl NEU buffer (acetic acid) neutralizes this solution and precipitate proteins
and chromosomal DNA due to its high salt concentration. The precipitation is completed after 15 min
on ice. The precipitate is then separated from the solution in two centrifugations and washing steps,
each for 15 min at 13000 rpm. pDNA is then precipitated via 450 µl 2-propanol at –20°C for 30 min and
collected as a pellet after centrifugation of 15 min at 13000 rpm. To desalt the collected pDNA, the
pellet is washed in 500 µl of ice-cold 70% EtOH. The pellet is then dried and dissolved in 20-50 µl of
ddH2O or TE buffer. DNA samples should be stored in TE buffer at – 20 °C.
For the extraction of higher DNA amount, 50-200 ml overnight cultures are produced. The isolation is
the same principle via a Qiagen Maxi-preparation kit according to the user manual.
TE buffer: 10 mM Tris.HCl, 1 mM EDTA, pH 7.5.
2.6. Insect cell culture
For membrane protein expression Sf9 cells from Invitrogen are cultured. They grow as suspension
culture at 27 °C and 115 rpm. Like normal cells, they are stored in 90% FCS and 10% DMSO in liquid
nitrogen. Two times a week cells diluted to 2x10⁶ cells/ml with fresh medium. For better protein
production Sf9 cells are accustomed to serum-free Sf900 medium.
Sf9-Medium:
1 L SF900 II medium (Invitrogen)
10 ml L-Glutamine (200 mM)
100 ml FCS
Material and Methods
45
Sf900-Medium: serum free Sf9 medium
1 L SF900 II medium (Invitrogen)
10 ml L-Glutamine (200 mM)
2.6.1. Baculovirus amplification in Sf9 cells
The generation of high-titer recombinant baculovirus (> 109 viral particles per mL) was achieved using
the Bac-to-Bac Baculovirus Expression System (Invitrogen). Initial transfection was carried out by
adding a pre-mixture containing 1ul recombinant bacmid, 8ul of Cellfectin®II Transfection Reagent
(Invitrogen), and 200ul of Transfection Medium (Expression Systems) into 2.5mLof Sf9 cells at a density
of 1.5×10⁶ cells/mL. Cell suspensions were incubated at 27 °C for 72 hours with shaking. P1 viral stocks
were then isolated by centrifugation and used to seed P2 viral stocks.
100 ml of Sf9 cells at a density of 0.5x10⁶ cells/ml were co-infected with 5ml P1 virus for 5 days. After
this, the supernatants are harvested (centrifugation at 2000 rpm for 5 min) and stored at 4 °C.
2.6.2. Protein expression
Sf9 cells are cultured in medium to 2x10⁶ cells/ml and transfected with MOI 1 of the virus titer. The
transfected cells are then harvested after 48 h for protein isolation.
2.6.3. Glutathione affinity chromatography
Glutathione affinity chromatography is a widely-used method to purify recombinant proteins with a
Glutathione-S-Transferase (GST) tag. For this, one uses the Glutathione Sepharose 4 Fast Flow (GS4FF)
affinity chromatography (GE Healthcare) method. For 1 ml of column material up to 12 ml of the GST-
tagged proteins can bind. Usually, 2 ml of the GS4FF is prepared in one Econo-Pac® Chromatography
Columns (Biorad). The GS4FF beads stored in 20% ethanol need to be washed 2 times with 5 ml GST
wash buffer. After this the protein lysate, can be added to the column and then incubated together
overnight at 4°C.
After proper binding took place, the column is washed 3x with GST wash buffer again and eluted
several times with 500 µl GST elution buffer. The collected protein fractions can be analyzed by SDS-
PAGE and BCA assay.
The column material will be cleaned with 5 ml 6 M Guanidinium hydrochloride, washed with 10 ml GST
wash buffer and stored in 20% Ethanol at 4°C for reuse.
GST wash buffer: 140 mM NaCl, 2.7 mM KCl, 10 mM Na2HPO4, 1.8 mM K2HPO4, pH 7.3.
GST elution buffer: 50 mM Tris-HCl, 10 mM Glutathione, pH 8.0.
Material and Methods
46
2.6.4. Immunoprecipitation with anti-GFP antibody
This method is used to isolate the target protein from a protein lysate. A specific antibody bound to a
solid beat, can be used to precipitate and isolate selectively the protein of interest from the lysate
solution.
2.6.4.1. Purification of Ab from cell culture supernatant
Anti-GFP monoclonal antibodies were purified from cell culture medium of anti-GFP hybridoma cells
with the Affi-Gel® Protein A MAPS® II Kit (Biorad) according to the manufacturer’s instructions. 1 ml of
the Affi-Gel protein-A-agarose could bind up to 8 mg/ml IgG1. The agarose was washed with H2O and
5 times with 1 ml binding buffer (pH 9.0). 2 ml of cell culture medium was added to 2 ml of binding
buffer and transferred to the column. After incubation for 15 min at RT, unbound components were
washed away with 6 x 2 ml binding buffer. The GFP antibodies were eluted with 7 x 750 μl elution
buffer (pH 3.0) and neutralized by adding 100 μl of 1M Tris HCl (pH 9.0) for each tube. After the elution,
the column was washed 5 times with 1 ml regeneration buffer and stored in PBS containing 0.05%
(w/v) sodium azide. The eluates were further analyzed by BCA and SDS PAGE, concentrated with a
Vivaspin column (Vivascience) at 4°C and 3,000 g for further use.
2.6.4.2 Coupling mAb to Protein G and isolate proteins with the coupled Protein G
For the coupling of monoclonal antibodies (mAb), 50 µl of Protein G Sepharose (GE Healthcare) is
resuspended in 1 ml PBS and rotated with 200 µl of mAb supernatant overnight at 4°C. The suspension
is then washed twice with 1 ml PBS and aliquot into 4 tubes (each containing 250 µl).
Now, the cell lysate is added to the tubes and incubated overnight at 4 °C. Afterwards, the precipitate
is washed twice with RIPA, twice with PREWASH and twice with PBS. The supernatant is discarded as
completely as possible and 8 µl of 5x sample buffer is added to the precipitation. Target proteins and
Ab are than detached from the sepharose beads by denaturing at 98 °C for 5 min. This protein sample
is now ready for SDS-PAGE.
Binding Buffer: Dissolve 31.4 g buffer solids from manufacture in 100 ml ddH2O, filtered through a 0.22
μm filter, keep PH around 9.0 ± 0.2, stored at 4 °C.
Elution Buffer: Dissolve 2.2 g buffer solids from manufacture in 100 ml ddH2O, filtered through a 0.22
μm filter, keep PH around 3.0 ± 0.2, stored at 4 °C.
Regeneration buffer: one bottle provided by manufacture in 400 ml bottle.
RIPA: 50 mM Tris-HCl, 150 mM NaCl, 1% sodium deoxycholate, 1% Triton X-100, 0.1% SDS, pH 7.4.
PREWASH: 10 mM Tris-HCl, 1 M NaCl, 0.1% Triton X-100, pH 7.2.
2.6.5. Ni-NTA affinity chromatography
Material and Methods
47
Nickel nitrilotriacetic acid affinity chromatography is another very popular method for protein
purification. Hexa histidine tagged proteins are selectively bound to the Ni-NTA-agarose column
(Qiagen). The binding capacity of this resin is up to 50 mg/ml.
For the assay, 1 ml of this material is washed with 10 ml Ni-NTA wash buffer prior to addition of the
protein lysate. The column with the protein mixture is incubated overnight at 4°C, before being
thoroughly washed with 10 ml of Ni-NTA wash buffer. The bound His-tagged proteins are then eluted
with Ni-NTA elution buffer containing 100 mM imidazole.
Ni-NTA wash buffer: 50 mM Na3PO4, 300 mM NaCl, 20 mM Imidazol, pH 7.5.
Ni-NTA elution buffer: 50 mM Na3PO4, 300 mM NaCl, 100 mM Imidazol, pH 7.5.
2.7. Mammalian cell culture
Table 2.1. Mammalian cell lines and media
Cell lines Cell type Growth
medium
Detaching
solution
Origin
CHO Chinese Hamster Ovary RPMI 0.5% EDTA DSMZ
CHO-gp120 CHO cells transfected to secrete a gp120 protein that originated from 92UG21-9, a primary X4 virus.
DMEM 0.5% EDTA NIH AIDS
CHO-WT CHO cells transfected with HIV-1 Env gene [226] GMEM-S 0.5% EDTA NIH AIDS
HeLa Human epitheloid cervix carcinoma DMEM 1 % EDTA DSMZ
TZM-bl Hela cells expressing human CD4, CCR5 and CXCR4 HIV-1 and Tat-regulated reporter genes for firefly luciferase and ß-galactosidase [227]
DMEM 1 % EDTA NIH AIDS
HeLa-CD4+ HeLa cells rendered CD4 positive; susceptible to HIV-1 infection and exhibits syncytia formation [228]
DMEM 1 % EDTA NIH AIDS
HL2/3 HeLa cells expressing HIV Gag, Env, Tat, Rev, and Nef proteins [229]
DMEM 1 % EDTA NIH AIDS
Material and Methods
48
Solutions and media are sterilized either by autoclaving at 121°C for 20 min or sterile filtration through
a 0.22 µm filter. Equipment is bought sterile or is sterilized with the same methods.
DMEM Medium:
500 ml DMEM (PAN Biotech)
5 ml L-Glutamine (200 mM) (PAN Biotech)
5 ml Sodium pyruvate (100 mM) (PAN Biotech)
5 ml Penicillin/Streptomycin (10000 U/10 mg)/ml (PAN Biotech)
50 ml FCS (Perbio, Thermo Scientific)
For CHO-gp120 cell lines, supplemented with 0.2% proline (Sigma). For HeLa-CD4 cell lines, supplement with 100mg G418 (Sigma) and 1ml hygromycin B (Bio Vision).
RPMI Medium:
500 ml RPMI (PAN Biotech)
5 ml L-Glutamine (200 mM) (PAN Biotech)
5 ml Sodium pyruvate (100 mM) (PAN Biotech)
5 ml Penicillin/Streptomycin (10000 U/10 mg)/ml (PAN Biotech)
50 ml FCS (PAN Biotech)
Glutamine-deficient minimal essential medium (GMEM-S):
704 ml sterile water
100 ml 10X MEM w/o L-glutamine (Gibco)
100 ml FBS (PAN Biotech)
36 ml 7.5% sodium bicarbonate (Sigma)
10 ml 100X nucleosides (Sigma)
10 ml 100X glutamate + asparagine (Sigma)
10 ml 100 mM sodium pyruvate (PAN Biotech)
10 ml penicillin-streptomycin 5000 U/ml (PAN Biotech)
10 ml non-essential amino acids
Sigma reagents for 100X G+A:
600 mg L-glutamic acid
600 mg L-asparagine
Make in 100 ml ddH2O and filter-sterilize through a 2 μm filter. Store frozen.
For complete selection medium, supplemented with 400 μM methionine sulfoximine (MSX) (Sigma,).
Prepare MSX stock at 18 mg/ml in medium, filter-sterilize, and store at – 20 °C.
Material and Methods
49
Cell strains were taken out from liquid nitrogen, thawed rapidly (< 1 minute) in a 37 °C water bath, pre-
warmed media were used to wash thawed cells, pelleted cells, then transferred to a 10cm Petric dish
with fresh pre-warmed media in an even distribution manner. All cell lines are grown at 37 °C in 5%
CO2 atmosphere. Media were replaced with fresh pre-warmed one after 2H incubation. Once 80% of
cells confluency achieved, cells can be sub-cultured for storage or further experiments. For storage,
fully grown cells of one 10 cm Petri dish (about 80% confluence) or one 25 cm2 flask are collected and
stored in 10% DMSO/FCS (v/v) at – 175 °C in cryogenic vials (Nalgene).
2.7.1. Cell counting assay
Fully-grown cells are detached and collected in PBS. About 100 µl of this suspension is then diluted in
trypan blue dye to separate viable from non-viable cells. Using a cell counting chamber, the number
of cells is then manually counted under the microscope. Since each square is 0.1 mm3 or 10-4 cm3 (=10-
4 ml), one cell count per square is equal to 104 cells per ml.
2.7.2. Proliferation assay with AlamarBlue
This assay measures chemical oxidation as a result cell proliferation. AlamarBlue© consists of an
indicator dye, which changes color and fluorescence according to the oxidation reduction state of a
solution. To a 200 µl cell suspension 20 µl of the AlamarBlue© solution is added, incubated for 6 h and
measured at 570 nm and 620 nm. The same solutions are measured prior AlamarBlue© addition as
blanks. Proliferation rates are calculated based on the method provided by AbD Serotec (Oxford, UK).
2.7.4. Cell treatment with ManNAc derivates
50 x stock solution of ManNAc derivatives are diluted in PBS and sterile filtrated. Adhesion cells are
plated with an initial concentration of 104 cells/ml to a total volume of 95ul. After 2 h, when cells
completely adhere, 2 µl of the substrate stock solution is added to the medium. The final concentration
is usually 5mM. The incubation time after derivate treatment is usually 5 days.
2.8. Gp120 isolation
Over expression gp120 mammalian system, secrete gp120 to medium, is used in the experiment
requires a large amount of protein. The purification processes include 3 steps: enrichment of gp120
from the medium by using GNA (Galanthus nivalis lectin), which binding to terminal D-mannose on
gp120 of HIV-1; reducing contaminating proteins by using DEAE-column; separation of monomeric and
dimeric gp120 by size exclusion chromatography.
Gp120 purification was adapted from a previously published protocol [230]. CHO cells, secreting gp120
to the media, were obtained through the NIH AIDS Reagent Program. Cells were maintained in the
Material and Methods
50
medium without selection for 3 days, then the cell medium was collected. Cell debris was centrifuged
down at 3000 g and 4 °C for 1 h. After this the medium can be stored at 4 °C for later usage. All
purification steps are kept at 4 °C. Before load on the GNA column, the sample was prepared with the
addition of Empigen BB (Sigma) to a final concentration of 0.25%. After pre-equilibrating the column
with binding buffer, the sample was loaded at 0.5ml/min. The column is washed thoroughly with
washing buffer and gp120 was eluted with elution buffer as 500 µl fractions. Eluted gp120 of every
fraction was checked on SDS-PAGE with Coomassie blue staining. The fractions with the most eluted
gp120 were concentrated via Amicon Ultra centrifugal filter (30 kDa). ÄKTA purifier UPC10 system
(FPLC, GE Life Sciences) was used for further purification. The concentrated sample was loaded on a
pre-packed 1-ml DEAE Sepharose column (GE Healthcare) and the flow through was collected. After
concentrating the flow through in Amicon Ultra centrifugal filter units, the sample was loaded on a
Superdex™ 200 10/300 GL column (GE Life Sciences) for size exclusion chromatography (SEC) and run
at 0.2 ml/min in DPBS. Peak fractions were collected and concentrated. Protein concentration was
determined by BCA protein assay and the purity was checked by SDS-PAGE.
Binding buffer: 150 mM NaCl, 20 mM Tris-HCl, 0.25% Empigen BB, pH 7.5.
Washing buffer: 500 mM NaCl, 20 mM Tris-HCl, 0.25% Empigen BB, pH 7.5.
Elution buffer: 150 mM NaCl, 20 mM Tris-HCl, 0.25% Empigen BB, 1 M MMP, pH 7.5, methyl-α-D-
mannopyranoside (MMP, Sigma).
2.8.1. Fluorescein isothiocyanate (FITC) labeling of gp120
Fig 2.1. General formula of F/P ratio calculation C is a constant value given to a protein. MW is the molecular weight of the protein. 389 is the molecular weight of FITC. 195 is the absorption of bound FITC at 490 nm at pH 13.0. (0.35 X A495) is the correction factor due to the absorbance of FITC at 280 nm. E0.1% is the absorption at 280 nm of a protein at 1.0 mg/ml.
Using fluorescein isothiocyanate (FITC) is an easy and robust way to attach a fluorescent label to
proteins via the reaction of isothiocyanate group and amine groups on the protein. The experiment
was carried out according to the instruction from Sigma. FITC was prepared in anhydrous dimethyl
Sulfoxide (DMSO) at 1.5 mg/ml. Gp120 protein was prepared in a 0.1 M sodium carbonate buffer, pH
Material and Methods
51
9, with the concentration of 1mg/ml (Nano Drop read out at 495 nm of 0.5). 20 µl DMSO were added
to 80 µl gp120 solution gently and incubated at 37 °C for 90 min. After this, the sample was washed
with a Vivaspin at 14000 g at 4 °C with DPBS several times until no residual FITC was visible. The ratio
of fluorescein to protein (F/P ratio) of the sample was determined by measuring the absorbance at 495
nm and 280 nm in Nano Drop and calculated with the below equation (Fig 2.1).
2.9. Gp120-CD4-CXCR4 binding Assay
Indirect Gp120-CD4-CXCR4 binding experiments were performed with primary antibodies to gp120.
1.5×10⁵ TZM-bl cells were incubated with various gp120 (4µg) in HEPES++ buffer for 1 H in 100µl total
in the round bottom 96-well plate at 25°C and washed twice with DPBS buffer to remove un-bound
gp120 [231]. The cells were re-suspended and incubated for 40 minutes with gp120 mAb 2G12, then
washed two times in DPBS and incubated with FITC mAb secondary antibody (1:400) for 30mins on a
shaker. Finally, cells were washed two times, resuspended in 100 µl DPBS for flow cytometry analysis
(FACSscan, Becton Dickinson, CA).
Direct binding experiments were performed with FITC-labeled gp120, which can be directly detected
via flow cytometry. The initial binding procedure was carried out like the indirect binding assay.
HEPES ++ buffer: 50 mM HEPES (pH 7.4), 5 mM MgCl2, 1 mM CaCl2, 5% BSA, 0.1% NaN3.
2.10. Syncytia formation
2.10.1. DiI and DiO labeling
3,3’-dioctadecyloxacarbocyanine perchlorate (DiO) and 1,1’-dioctadecyl-3,3,3’,3’
tetramethylindocarbocyanine perchlorate (DiI) were fluorescent lipophilic dyes and hence bind to the
cell membrane [232]. They have low cytotoxicity and high resistance to intercellular transfer. A 3.5
mg/ml solution of DiI in DMSO and 240 ug/ml DiO in DMSO were prepared as a stock solution. The
working solutions were prepared by diluting the stocks 1:200 in the sample. Cells labeled with DiO
have an Absorption/Emission range of 484/501 nm and with DiI a range of 549/565 nm.
This labeling method is best for adherent cells. They were cultured in 10 cm Petric dishes or in 24-well
plates until 80% confluence. The medium is then removed and replaced with staining medium
containing 1:200 stock solution of DiI or DiO; 4 ml staining medium for 10 cm Petric dishes, 400 µl
staining medium for 24-well plate. The plate is then incubated at 37 °C for 15 min. The staining medium
is then removed and the cells are washed three times with fresh pre-warmed culture medium for 10
min each time.
2.10.2. Syncytia formation
Material and Methods
52
Syncytia formation was performed with the cell lines (CHO-WT and HeLa-CD4). Both cell lines were
incubated with the respective ManNAc analogs for 3 days before labeling. CHO-WT cells were cultured
in 24-well plates and HeLa-CD4 cells normally in 10 cm Petric dishes. On day 3, CHO-WT cells and HeLa-
CD4 cells were stained with either DiI or DiO, respectively. Both stained cell lines were incubated
overnight, the medium of CHO-WT was supplemented with ManNAc derivatives. On day 4, both cell
lines were detached from the plate and adjusted to a cell concentration of 1×10⁶ cells/ml in GMEM (no
selection). 100µl of each labeled cell solution was mix together in a 48-well plate and cocultured for
24 h. On day 5, flow cytometry analysis was performed.
53
3. Results
3.1. Expression and detection of modified Neu5Ac in cells
In the metabolic glycoengineering approach, cells are treated with N-acyl side chain modified
mannosamines that act as metabolic precursors for sialic acids biosynthesis leading to the expression
of the corresponding N-acyl modified sialosides in cell surface glycoconjugates. We confirmed the
expression of these non-natural, modified sialic acid species on the plasma membrane using HPLC [233,
234].
Cells (CHO, TZM-bl) were cultured in the presence of ManNAc and two different synthetic N-acyl-
modified ManNAc analogs (Fig 3.1.1 a) for 5 days. After lysing the cells and hydrolyzing their
glycoconjugates from the plasma membrane, sialic acids were conjugated to DMB and subsequently
analyzed using HPLC (Fig 3.1.1 c). The chemically synthesized and purified DMB-labeled sialic acids
DMB-Neu5Gc, DMB-Neu5Ac and DMB-Neu5But (Fig 3.1.1 b) were used as standards. The properties
of Neu5Prop in this chromatography setup, including its retention time, have been previously
confirmed in our lab via ESI-MS (electrospray ionization mass spectrometry) [224].
a
b
Results
54
Fig 3.1.1. Sialic acid modification with N-acyl-modified D-mannosamines a) Schematic representation of ManNAc and analogs with the modified N-acyl group (indicated as R). b) Chromatograms of DMB-labeled sialic acid standards. Retention times (dashed lines) and peak areas of the sialic acid standards were determined after injecting 10 ng DMB-Neu5Ac and 16.7 ng DMB-Neu5Gc and DMB-Neu5But into the HPLC system. c) Analysis of DMB-labeled sialic acid species in the plasma membrane of CHO and TZM-bl cells after treatment with ManNAc and different ManNAc analogs.
Treatment of CHO or TZM-bl cells with ManNProp or ManNBut led to the expression of the
corresponding non-natural sialic acid species (Fig 3.1.1 c). Treatment with ManNAc led to increased
expression of Neu5Ac and, at the same time, inhibited cellular expression of Neu5Gc. However, the
c
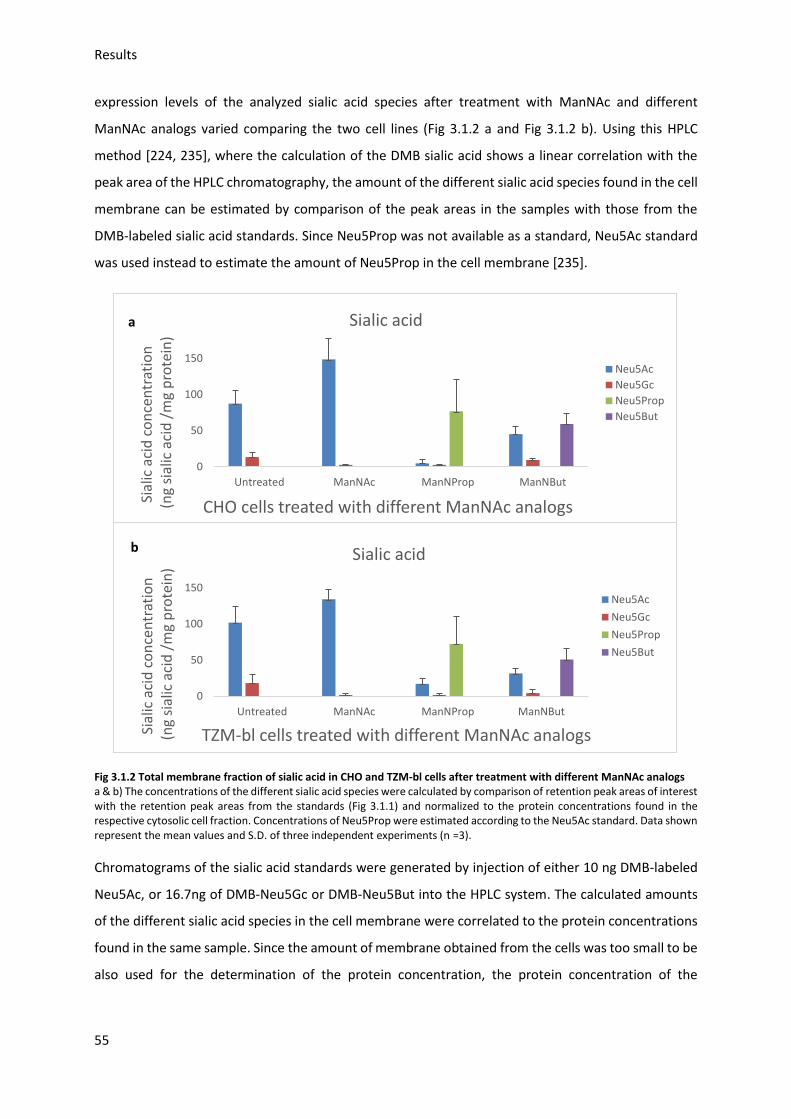
Results
55
expression levels of the analyzed sialic acid species after treatment with ManNAc and different
ManNAc analogs varied comparing the two cell lines (Fig 3.1.2 a and Fig 3.1.2 b). Using this HPLC
method [224, 235], where the calculation of the DMB sialic acid shows a linear correlation with the
peak area of the HPLC chromatography, the amount of the different sialic acid species found in the cell
membrane can be estimated by comparison of the peak areas in the samples with those from the
DMB-labeled sialic acid standards. Since Neu5Prop was not available as a standard, Neu5Ac standard
was used instead to estimate the amount of Neu5Prop in the cell membrane [235].
Fig 3.1.2 Total membrane fraction of sialic acid in CHO and TZM-bl cells after treatment with different ManNAc analogs a & b) The concentrations of the different sialic acid species were calculated by comparison of retention peak areas of interest with the retention peak areas from the standards (Fig 3.1.1) and normalized to the protein concentrations found in the respective cytosolic cell fraction. Concentrations of Neu5Prop were estimated according to the Neu5Ac standard. Data shown represent the mean values and S.D. of three independent experiments (n =3).
Chromatograms of the sialic acid standards were generated by injection of either 10 ng DMB-labeled
Neu5Ac, or 16.7ng of DMB-Neu5Gc or DMB-Neu5But into the HPLC system. The calculated amounts
of the different sialic acid species in the cell membrane were correlated to the protein concentrations
found in the same sample. Since the amount of membrane obtained from the cells was too small to be
also used for the determination of the protein concentration, the protein concentration of the
0
50
100
150
Untreated ManNAc ManNProp ManNBut
Sial
ic a
cid
co
nce
ntr
atio
n(n
g si
alic
aci
d /
mg
pro
tein
)
CHO cells treated with different ManNAc analogs
Sialic acid
Neu5Ac
Neu5Gc
Neu5Prop
Neu5But
a
0
50
100
150
Untreated ManNAc ManNProp ManNBut
Sial
ic a
cid
co
nce
ntr
atio
n(n
g si
alic
aci
d /
mg
pro
tein
)
TZM-bl cells treated with different ManNAc analogs
Sialic acid
Neu5Ac
Neu5Gc
Neu5Prop
Neu5But
b
Results
56
cytosolic cell fraction was taken instead. This is based on the assumption that the relationship of
membrane protein to cytosolic protein is constant in the different cell samples examined.
ManNAc treatment led to increased expression of Neu5Ac on the plasma membrane in both cell lines.
In CHO cells, it almost doubled to 148 ng/mg protein and in TZM-bl cells an increase in Neu5Ac
expression of approximately 35% was observed. Treatment with ManNProp reduced the expression of
Neu5Ac by 94% in CHO cells and 83% in TZM-bl cells, making Neu5Prop the predominant sialic acid
species in these cells. Treatment with ManNBut also led to reduced Neu5Ac expression (30-40%), but
was proven to be not as effective as ManNProp treatment. Under all tested conditions the expression
of Neu5Gc on the surface of treated cells was reduced compared to non-treated cells. In conclusion,
treating cells with ManNAc and ManNAc analogs for 5 days using the given conditions resulted in
detectable expression of the corresponding sialic acid species on the plasma membranes of both CHO
and TZM-bl cells.
3.2. Gp120 preparation
3.2.1. Gp120 expression and purification
CHO cells with stable expression of gp120 (CHO-gp120) were obtained from the NIH AIDS reagent
program. When cultured under the given conditions, these cells secret gp120 into the cell culture
supernatant. CHO-gp120 cells were cultured for 5 days and the supernatant was subsequently
collected. After addition of Empigen BB (30%) to a final concentration of 0.25%, the collected
supernatant containing gp120 was loaded onto a GNA (Galanthus nivalis) lectin column. After washing
the column, gp120 was eluted by addition of 0.5 M methyl-α-D-mannopyranoside (MMP). The
collected eluate was filtered and concentrated using a centrifugal size exclusion filter unit (30 kDa pore
size). Gp120 was then further purified via anion exchange chromatography (DEAE column) and by size
exclusion chromatography using a Superdex 200 (10/300 GL) column (Fig 3.2.1 a). Gp120 samples were
collected after each purification step and analyzed by SDS-PAGE.
On the SDS-polyacrylamide gel one could observe two bands, one between Mr 100 kDa and 150 kDa
indicating the gp120 monomer, the other one between Mr 150 kDa and 250 kDa. The second band
might indicate the existence of a gp120 dimer. This is consistent with previous reports, that
dimerization of secreted gp120 may be caused by an aberrant covalent disulfide bond between two
monomers [230, 236, 237]. Therefore, the two bands on the SDS-PAGE assumingly represent a mixture
of dimeric and monomeric gp120.
Results
57
Fig 3.2.1 gp120 size exclusion chromatogram and SDS-PAGE analysis a) Workflow of gp120 purification: cell supernatant containing gp120 was subjected to three purification steps: affinity chromatography (GNA column), anion exchange chromatography (DEAE), and size exclusion chromatography (FPLC). b) Analysis of gp120 samples from each purification step in SDS-PAGE: affinity purification, anion exchange purification, and size exclusion purification. c) Size exclusion chromatogram of gp120 previously purified via affinity- and anion exchange chromatography. The protein size of the retention peaks was estimated by correlation to a gel filtration standard (see (d)). d) Correlation of the gel filtration standard (Biorad) with the chromatogram of purified gp120.
The size exclusion chromatograms revealed mainly two retention peaks at 9.8 ml and 9.0 ml,
respectively (Fig 3.2.1 c), that might also indicate the existence of monomeric and dimeric gp120 in
solution (Fig 3.2.1 b).
Comparing the SDS-PAGE results, we observed that the purity of gp120 was slightly increased after
every purification step (Fig 3.2.1 b). Especially, contamination with proteins of lower molecular weight
was less after the final purification step. However, purification via anion exchange and size exclusion
chromatography caused the protein yield to decrease greatly down to amounts that would have been
insufficient for subsequent studies with the purified gp120. Therefore, we used the affinity isolated
protein for all further experiments.
a b
d c
Results
58
In order to verify that the two polypeptide bands of interest observed in the Coomassie stained SDS-
polyacrylamide gel contained gp120, we further examined the gel by Western blotting using a
polyclonal anti-gp120 antibody from rabbit (Fig 3.2.2 a).
Fig 3.2.2 a. Coomassie stained SDS-PAGE (left) and Western blot (right) of isolated gp120 SDS-PAGE and Western blotting of gp120 using polyclonal anti-gp120 serum from rabbit (1:1500 dilution), secondary antibody: HRP-anti-rabbit IgG.
The Western blot demonstrated that the anti-g120 poly-antibody could recognize the two bands on
the SDS PAGE, representing gp120 monomer and dimer, respectively. This result confirmed that gp120
could be isolated after the GNA affinity purification.
The SDS PAGE showed two polypeptide bands at Mr 120 kDa and 180 kDa corresponding to the
monomer and the dimer of gp120. The dimer should normally be disassociated into monomers under
denaturing conditions using 2-mercaptoethanol in the sample buffer [236]. The possible reason for the
given observation is the higher expression of gp120 dimers in this system (up to 50%) than in
comparable expression systems (dimeric gp120 < 20%) [236]. This amount of dimer probably needs
longer cooking time before it is completely disassociated. The same observation is also found in the
work of Guo et al., showing the same SDS-PAGE results in that no complete dimer disassociation was
achieved even under denaturing conditions [230].
3.2.2. Gp120 Neu5Ac modification
Gp120 containing different N-acyl modified sialic acid species was generated by treating CHO-gp120
cells with ManNAc and its analogs: ManNProp and ManNBut. Gp120 was isolated by GNA affinity
chromatography and analyzed by SDS-PAGE (Fig 3.2.2 b).
The SDS PAGE of different isolated gp120 fractions after treatment with ManNAc analogs revealed that
sialic acid modifications do not alter the expression pattern of gp120 glycoprotein in this system. The
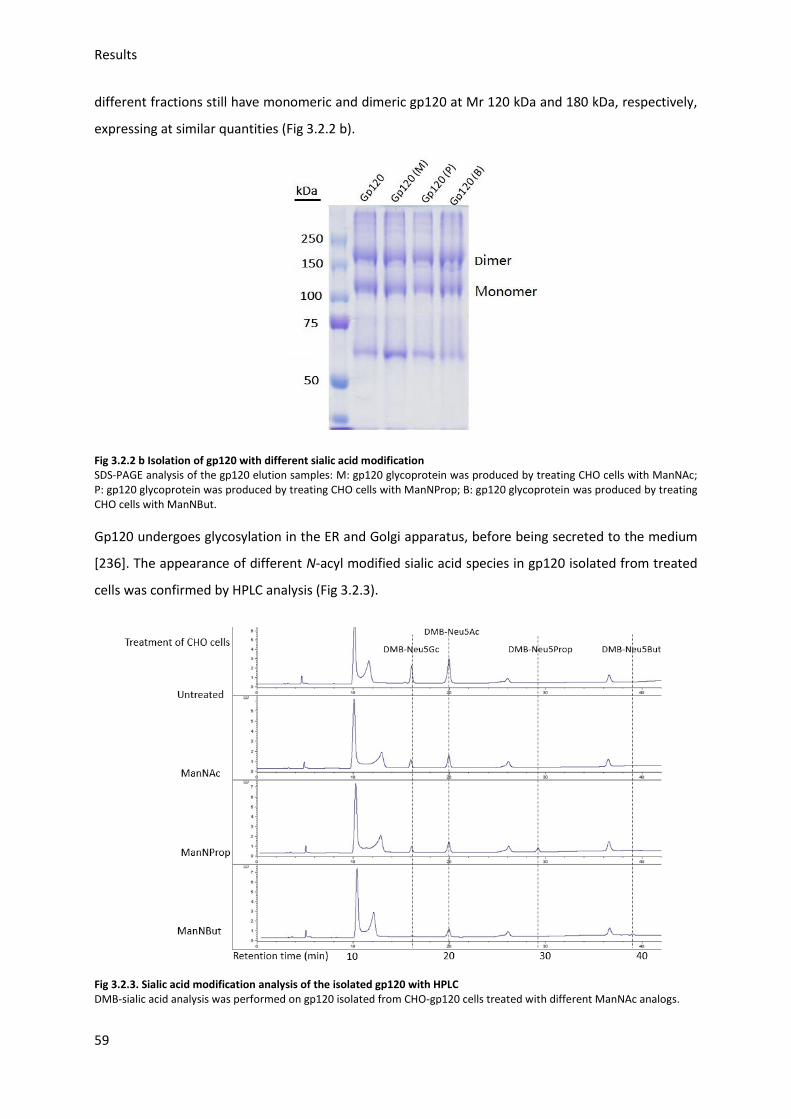
Results
59
different fractions still have monomeric and dimeric gp120 at Mr 120 kDa and 180 kDa, respectively,
expressing at similar quantities (Fig 3.2.2 b).
Fig 3.2.2 b Isolation of gp120 with different sialic acid modification SDS-PAGE analysis of the gp120 elution samples: M: gp120 glycoprotein was produced by treating CHO cells with ManNAc; P: gp120 glycoprotein was produced by treating CHO cells with ManNProp; B: gp120 glycoprotein was produced by treating CHO cells with ManNBut.
Gp120 undergoes glycosylation in the ER and Golgi apparatus, before being secreted to the medium
[236]. The appearance of different N-acyl modified sialic acid species in gp120 isolated from treated
cells was confirmed by HPLC analysis (Fig 3.2.3).
Fig 3.2.3. Sialic acid modification analysis of the isolated gp120 with HPLC DMB-sialic acid analysis was performed on gp120 isolated from CHO-gp120 cells treated with different ManNAc analogs.
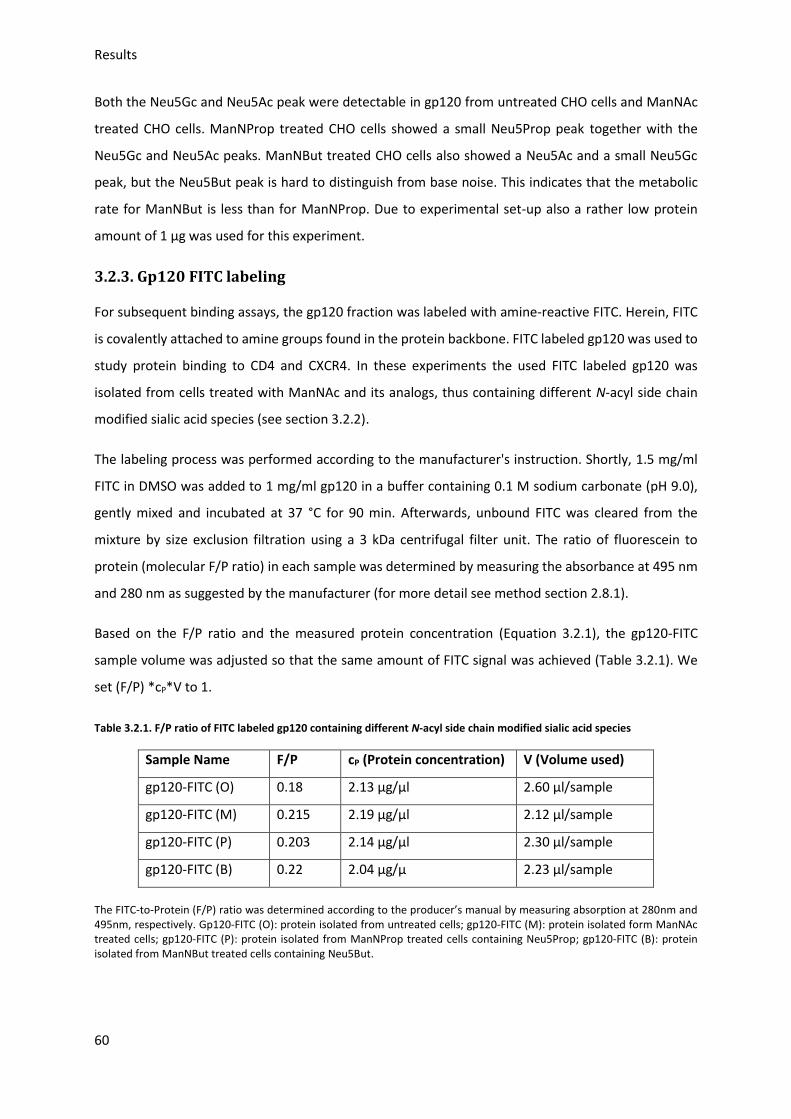
Results
60
Both the Neu5Gc and Neu5Ac peak were detectable in gp120 from untreated CHO cells and ManNAc
treated CHO cells. ManNProp treated CHO cells showed a small Neu5Prop peak together with the
Neu5Gc and Neu5Ac peaks. ManNBut treated CHO cells also showed a Neu5Ac and a small Neu5Gc
peak, but the Neu5But peak is hard to distinguish from base noise. This indicates that the metabolic
rate for ManNBut is less than for ManNProp. Due to experimental set-up also a rather low protein
amount of 1 µg was used for this experiment.
3.2.3. Gp120 FITC labeling
For subsequent binding assays, the gp120 fraction was labeled with amine-reactive FITC. Herein, FITC
is covalently attached to amine groups found in the protein backbone. FITC labeled gp120 was used to
study protein binding to CD4 and CXCR4. In these experiments the used FITC labeled gp120 was
isolated from cells treated with ManNAc and its analogs, thus containing different N-acyl side chain
modified sialic acid species (see section 3.2.2).
The labeling process was performed according to the manufacturer's instruction. Shortly, 1.5 mg/ml
FITC in DMSO was added to 1 mg/ml gp120 in a buffer containing 0.1 M sodium carbonate (pH 9.0),
gently mixed and incubated at 37 °C for 90 min. Afterwards, unbound FITC was cleared from the
mixture by size exclusion filtration using a 3 kDa centrifugal filter unit. The ratio of fluorescein to
protein (molecular F/P ratio) in each sample was determined by measuring the absorbance at 495 nm
and 280 nm as suggested by the manufacturer (for more detail see method section 2.8.1).
Based on the F/P ratio and the measured protein concentration (Equation 3.2.1), the gp120-FITC
sample volume was adjusted so that the same amount of FITC signal was achieved (Table 3.2.1). We
set (F/P) *cP*V to 1.
Table 3.2.1. F/P ratio of FITC labeled gp120 containing different N-acyl side chain modified sialic acid species
Sample Name F/P cP (Protein concentration) V (Volume used)
gp120-FITC (O) 0.18 2.13 µg/µl 2.60 µl/sample
gp120-FITC (M) 0.215 2.19 μg/µl 2.12 µl/sample
gp120-FITC (P) 0.203 2.14 µg/µl 2.30 µl/sample
gp120-FITC (B) 0.22 2.04 µg/µ 2.23 µl/sample
The FITC-to-Protein (F/P) ratio was determined according to the producer’s manual by measuring absorption at 280nm and 495nm, respectively. Gp120-FITC (O): protein isolated from untreated cells; gp120-FITC (M): protein isolated form ManNAc treated cells; gp120-FITC (P): protein isolated from ManNProp treated cells containing Neu5Prop; gp120-FITC (B): protein isolated from ManNBut treated cells containing Neu5But.
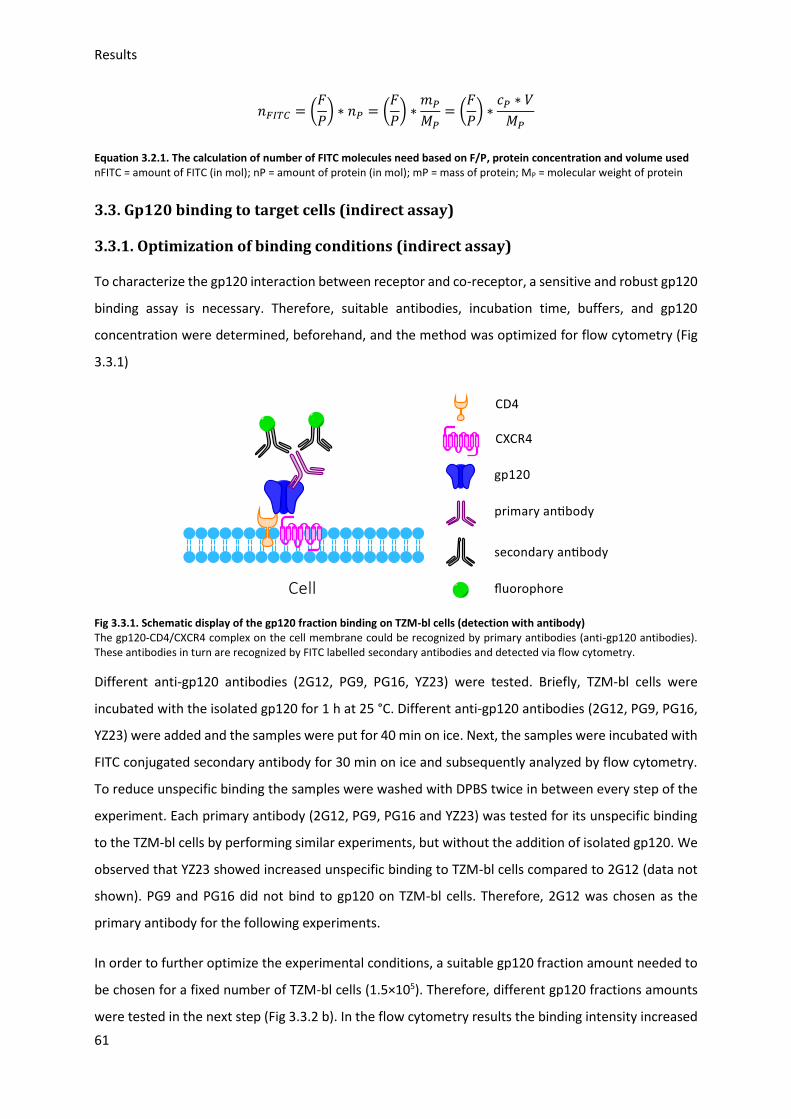
Results
61
𝑛𝐹𝐼𝑇𝐶 = (𝐹
𝑃) ∗ 𝑛𝑃 = (
𝐹
𝑃) ∗
𝑚𝑃
𝑀𝑃= (
𝐹
𝑃) ∗
𝑐𝑃 ∗ 𝑉
𝑀𝑃
Equation 3.2.1. The calculation of number of FITC molecules need based on F/P, protein concentration and volume used nFITC = amount of FITC (in mol); nP = amount of protein (in mol); mP = mass of protein; MP = molecular weight of protein
3.3. Gp120 binding to target cells (indirect assay)
3.3.1. Optimization of binding conditions (indirect assay)
To characterize the gp120 interaction between receptor and co-receptor, a sensitive and robust gp120
binding assay is necessary. Therefore, suitable antibodies, incubation time, buffers, and gp120
concentration were determined, beforehand, and the method was optimized for flow cytometry (Fig
3.3.1)
Fig 3.3.1. Schematic display of the gp120 fraction binding on TZM-bl cells (detection with antibody) The gp120-CD4/CXCR4 complex on the cell membrane could be recognized by primary antibodies (anti-gp120 antibodies). These antibodies in turn are recognized by FITC labelled secondary antibodies and detected via flow cytometry.
Different anti-gp120 antibodies (2G12, PG9, PG16, YZ23) were tested. Briefly, TZM-bl cells were
incubated with the isolated gp120 for 1 h at 25 °C. Different anti-gp120 antibodies (2G12, PG9, PG16,
YZ23) were added and the samples were put for 40 min on ice. Next, the samples were incubated with
FITC conjugated secondary antibody for 30 min on ice and subsequently analyzed by flow cytometry.
To reduce unspecific binding the samples were washed with DPBS twice in between every step of the
experiment. Each primary antibody (2G12, PG9, PG16 and YZ23) was tested for its unspecific binding
to the TZM-bl cells by performing similar experiments, but without the addition of isolated gp120. We
observed that YZ23 showed increased unspecific binding to TZM-bl cells compared to 2G12 (data not
shown). PG9 and PG16 did not bind to gp120 on TZM-bl cells. Therefore, 2G12 was chosen as the
primary antibody for the following experiments.
In order to further optimize the experimental conditions, a suitable gp120 fraction amount needed to
be chosen for a fixed number of TZM-bl cells (1.5×10⁵). Therefore, different gp120 fractions amounts
were tested in the next step (Fig 3.3.2 b). In the flow cytometry results the binding intensity increased
Results
62
with the dosage of gp120 (4 µg compared to 2 µg). However, adding 6 μg or more did not significantly
improve the binding. On account of these results, 4 µg of gp120 was chosen for the further binding
assays with 1.5×10⁵ TZM-bl cells.
Gp120 appears to be cytotoxic and may induce cell apoptosis and lysis [238, 239]. The binding assay
includes many washing steps, which could also create physical damages to the cells. Finding a suitable
binding buffer and incubation time could relatively minimize the influence from the experimental
settings and contribute to more stable and reliable results. With this in mind, the following different
conditions were applied: FCS 10 % in DPBS or HEPES ++ for an incubation time of 1 h or 2 h. The results
show that using the HEPES ++ buffer the binding ratio of gp120 fraction to TZM-bl cells could be
improved (Fig 3.3.2 c). 1 h incubation time showed a better binding (Fig 3.3.2 d). After the evaluation
of all the optimization steps above, the experimental condition was finally set to be: 4 µg gp120 on
1.5×10⁵ TZM-bl cells in 100 µl HEPES++ buffer for 1 h incubation at 25 ℃.
Fig 3.3.2. Optimization of gp120 fraction binding to TZM-bl cells a) Different anti-gp120 antibodies were used to detect the binding of 4 µg isolated gp120 to TZM-bl cells. Each antibody was previously tested for their unspecific binding to the TZM-bl cells. b) Different amounts of isolated gp120 were added per test using the gp120 antibody 2G12. c) Different binding buffers were tested in the binding assay with 4 µg gp120 and antibody 2G12. d) Different incubation time was tested with 4 µg gp120 and antibody 2G12. In all experiments, TZM-bl cells that were not treated with isolated gp120 but with the gp120 detecting antibodies as well as secondary antibody were used as controls.
a
c
b
d
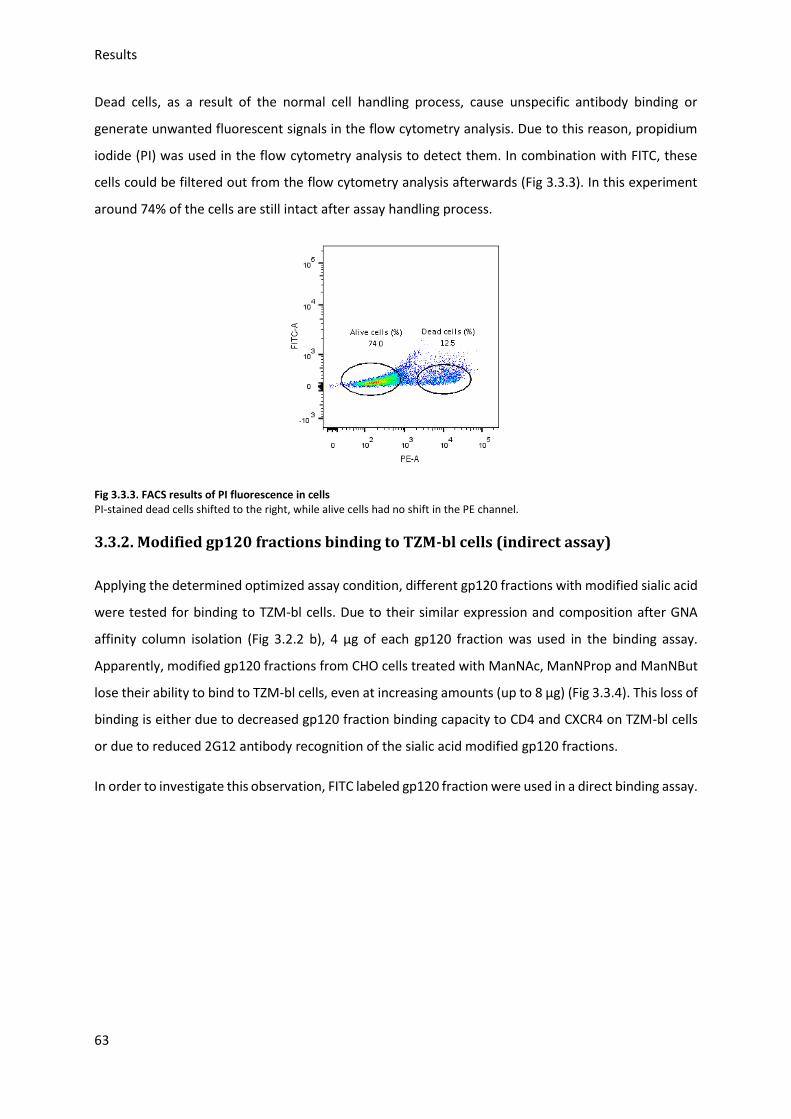
Results
63
Dead cells, as a result of the normal cell handling process, cause unspecific antibody binding or
generate unwanted fluorescent signals in the flow cytometry analysis. Due to this reason, propidium
iodide (PI) was used in the flow cytometry analysis to detect them. In combination with FITC, these
cells could be filtered out from the flow cytometry analysis afterwards (Fig 3.3.3). In this experiment
around 74% of the cells are still intact after assay handling process.
Fig 3.3.3. FACS results of PI fluorescence in cells PI-stained dead cells shifted to the right, while alive cells had no shift in the PE channel.
3.3.2. Modified gp120 fractions binding to TZM-bl cells (indirect assay)
Applying the determined optimized assay condition, different gp120 fractions with modified sialic acid
were tested for binding to TZM-bl cells. Due to their similar expression and composition after GNA
affinity column isolation (Fig 3.2.2 b), 4 µg of each gp120 fraction was used in the binding assay.
Apparently, modified gp120 fractions from CHO cells treated with ManNAc, ManNProp and ManNBut
lose their ability to bind to TZM-bl cells, even at increasing amounts (up to 8 µg) (Fig 3.3.4). This loss of
binding is either due to decreased gp120 fraction binding capacity to CD4 and CXCR4 on TZM-bl cells
or due to reduced 2G12 antibody recognition of the sialic acid modified gp120 fractions.
In order to investigate this observation, FITC labeled gp120 fraction were used in a direct binding assay.
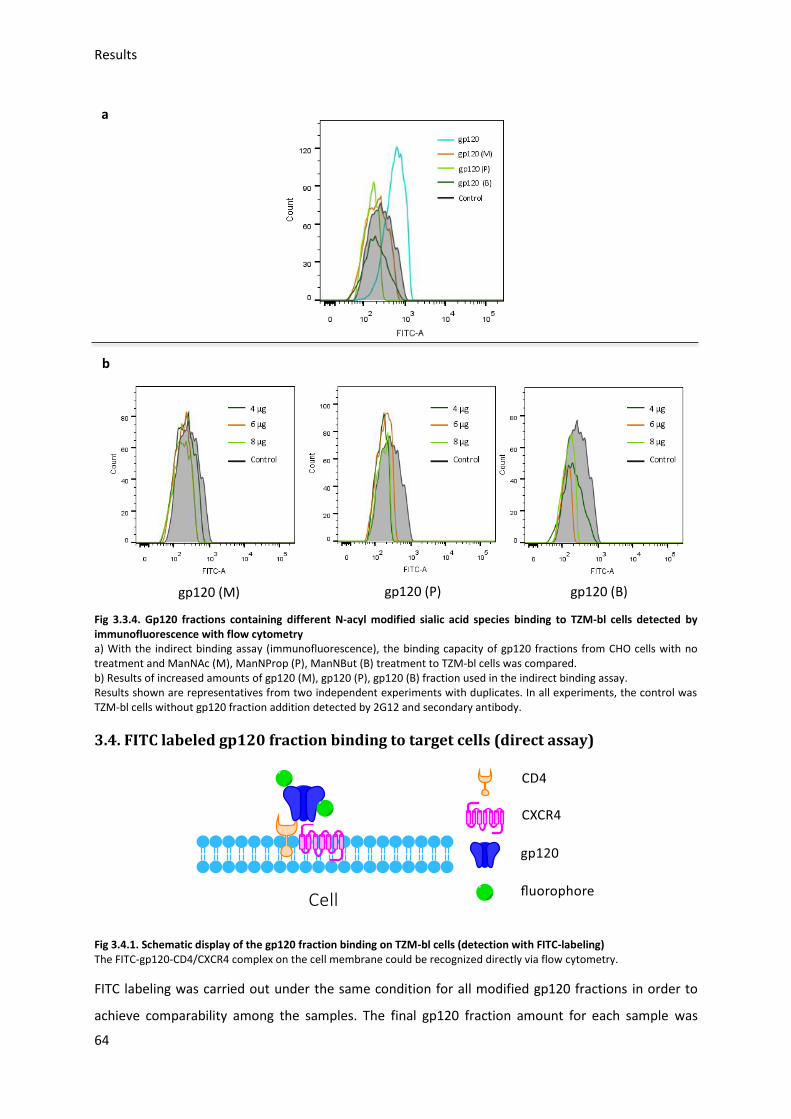
Results
64
Fig 3.3.4. Gp120 fractions containing different N-acyl modified sialic acid species binding to TZM-bl cells detected by immunofluorescence with flow cytometry a) With the indirect binding assay (immunofluorescence), the binding capacity of gp120 fractions from CHO cells with no treatment and ManNAc (M), ManNProp (P), ManNBut (B) treatment to TZM-bl cells was compared. b) Results of increased amounts of gp120 (M), gp120 (P), gp120 (B) fraction used in the indirect binding assay. Results shown are representatives from two independent experiments with duplicates. In all experiments, the control was TZM-bl cells without gp120 fraction addition detected by 2G12 and secondary antibody.
3.4. FITC labeled gp120 fraction binding to target cells (direct assay)
Fig 3.4.1. Schematic display of the gp120 fraction binding on TZM-bl cells (detection with FITC-labeling) The FITC-gp120-CD4/CXCR4 complex on the cell membrane could be recognized directly via flow cytometry.
FITC labeling was carried out under the same condition for all modified gp120 fractions in order to
achieve comparability among the samples. The final gp120 fraction amount for each sample was
gp120 (M) gp120 (B) gp120 (P)
a
b
Results
65
determined based on their protein concentration and F/P ratio (see table 3.2.1) to give comparable
signals.
The binding of gp120-FITC (O) was carried out for CHO, HeLa and TZM-bl cells. While gp120-FITC (O)
only showed weak unspecific binding to CHO cells, it bound specially to TZM-bl cells. Surprisingly, it
also bound to HeLa cells, even though those cells do not have CD4 on their membrane (Fig 3.4.2).
Fig 3.4.2. Binding of gp120 FITC (O) fraction to CHO, HeLa and TZM-bl cells a) Binding of gp120-FITC (O) fraction to CHO cells; Control: CHO cells. b) Binding of gp120-FITC (O) fraction to HeLa cells; Control: HeLa cells. c) Binding of gp120-FITC (O) fraction to TMZ-bl cells; Control: TZM-bl cells.
In general gp120 first binds to CD4 on the cell membrane which leads to a change in its structure. This
makes it possible for CXCR4 to bind to it, inducing the fusion process. TZM-bl cells express CD4 and
CXCR4 on their membrane, to which gp120-FITC binds (Fig 3.4.2 c). Since HeLa cells only have an
intrinsic CXCR4 expression and no CD4 on their cell surface, the result suggests that the gp120 faction
probably bound directly to CXCR4 or the binding was of unspecific nature (Fig 3.4.2 b). The report from
Zerhouni et al. showed the existence of a CD4 independent HIV-1 strain of clade D from Uganda, which
has the ability to bind and invade target cells without CD4 as the primary receptor. In my experiment
the gp120 glycoprotein in use originated from the 92UG21-9 strain of HIV-1 clade D in Uganda. If this
HIV-1 strain used the gp120 binding mechanism to invade its host cells, this would support the
hypothesis that the gp120 fraction in my experiment bound directly to CXCR4 and does not need CD4
as a precursor binding receptor.
3.4.1. FITC labeled modified gp120 binding to HeLa cells (direct assay)
In order to further test this hypothesis, the binding assay with the same gp120 fraction was used again
in an indirect binding assay with 2G12 as primary antibody. In this assay the binding of gp120 to HeLa
cells could not be observed anymore (Fig 3.4.3 a). In contrast to this result, in our former indirect
binding assay with TZM-bl cells, which have both CD4 and CXCR4 on its cell surface, the binding was
a b c
Results
66
observed under the same antibody-secondary antibody combination (see above Fig 3.3.2 a). This
suggests that 2G12 could recognize and bind to the gp120-CD4-CXCR4 complex on TZM-bl cells, but
not to a possible gp120-CXCR4 complex on HeLa cells (Fig 3.4.3 a). As a complementary experiment,
using an anti-CXCR4 antibody to partially block the CXCR4 binding sites resulted in a reduction of the
binding of gp120-FITC (O) to HeLa cells in the direct binding assay (Fig 3.4.3 b). The two experiments
above when taken together suggest that gp120 fraction in this experiment does bind to CXCR4 on HeLa
cells and form a complex, which could not be recognized by 2G12.
Fig 3.4.3. Binding of gp120 to HeLa cells in indirect assay vs direct assay a) Binding of gp120 to HeLa cells using anti-gp120 antibody 2G12 and 2nd Ab; Control: HeLa cells+2G12+2nd Ab. b) The anti-CXCR4 antibody was added prior to gp120-FITC (O) binding to HeLa cells; Control: HeLa cells.
In conclusion, the data indicate that the gp120 in this experiment might be from a CD4 independent
HIV strain and may bind to cells through binding to CXCR4. Using the 2G12 antibody a CD4 dependent
binding of the isolated gp120 to a CD4-CXCR4 complex could be observed, but not under conditions
when gp120 might form a complex with only CXCR4.
3.4.2. FITC labeled gp120 binding to cells treated with ManNAc derivates (direct
assay)
After addressing the binding nature of gp120-FITCs to HeLa cells, FITC labeled gp120 proteins were
tested for their binding capacity to TZM-bl and HeLa cells treated with ManNac analogs. TZM-bl cells
and HeLa cells were initially treated with ManNAc, ManNProp and ManNBut to express modified sialic
acids on their cell membrane. This overall glycan modification shall presumably also affect the
glycosylation structure of the membrane proteins CD4 and CXCR4. Gp120-FITC (O) was used to bind to
TZM-bl and HeLa cells treated with ManNAc analogs (Fig 3.4.4).
a b
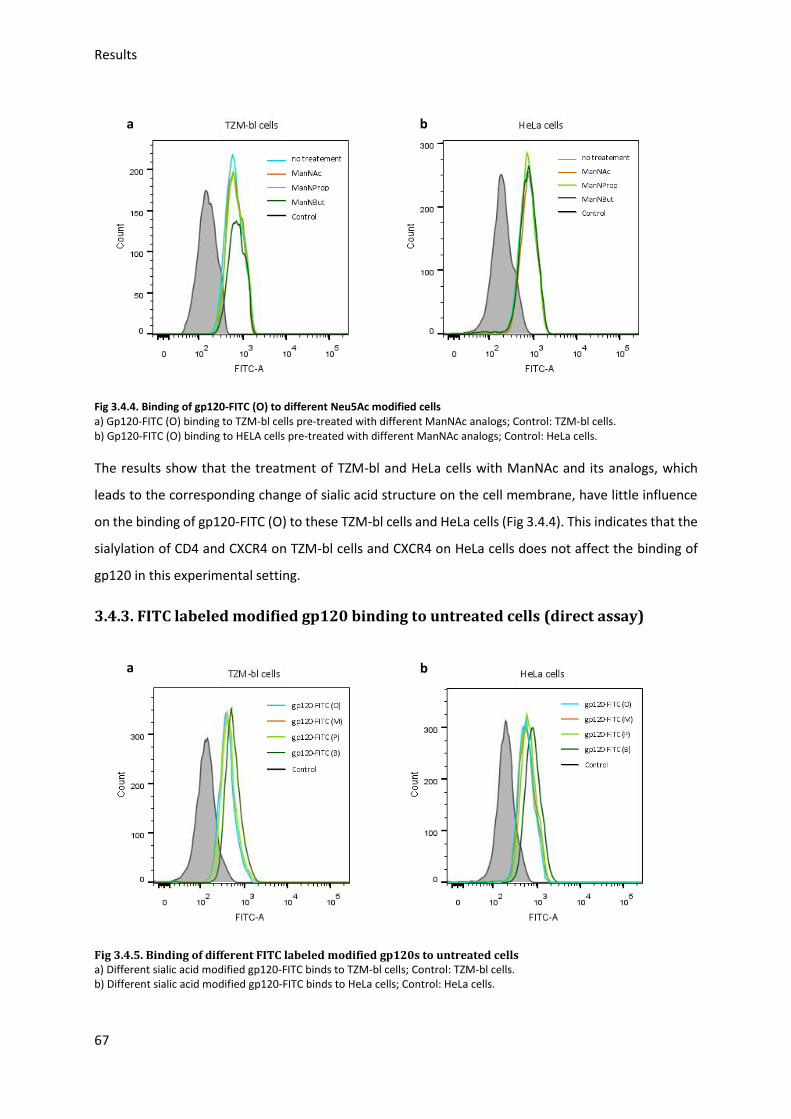
Results
67
Fig 3.4.4. Binding of gp120-FITC (O) to different Neu5Ac modified cells a) Gp120-FITC (O) binding to TZM-bl cells pre-treated with different ManNAc analogs; Control: TZM-bl cells. b) Gp120-FITC (O) binding to HELA cells pre-treated with different ManNAc analogs; Control: HeLa cells.
The results show that the treatment of TZM-bl and HeLa cells with ManNAc and its analogs, which
leads to the corresponding change of sialic acid structure on the cell membrane, have little influence
on the binding of gp120-FITC (O) to these TZM-bl cells and HeLa cells (Fig 3.4.4). This indicates that the
sialylation of CD4 and CXCR4 on TZM-bl cells and CXCR4 on HeLa cells does not affect the binding of
gp120 in this experimental setting.
3.4.3. FITC labeled modified gp120 binding to untreated cells (direct assay)
Fig 3.4.5. Binding of different FITC labeled modified gp120s to untreated cells a) Different sialic acid modified gp120-FITC binds to TZM-bl cells; Control: TZM-bl cells. b) Different sialic acid modified gp120-FITC binds to HeLa cells; Control: HeLa cells.
a b
a b
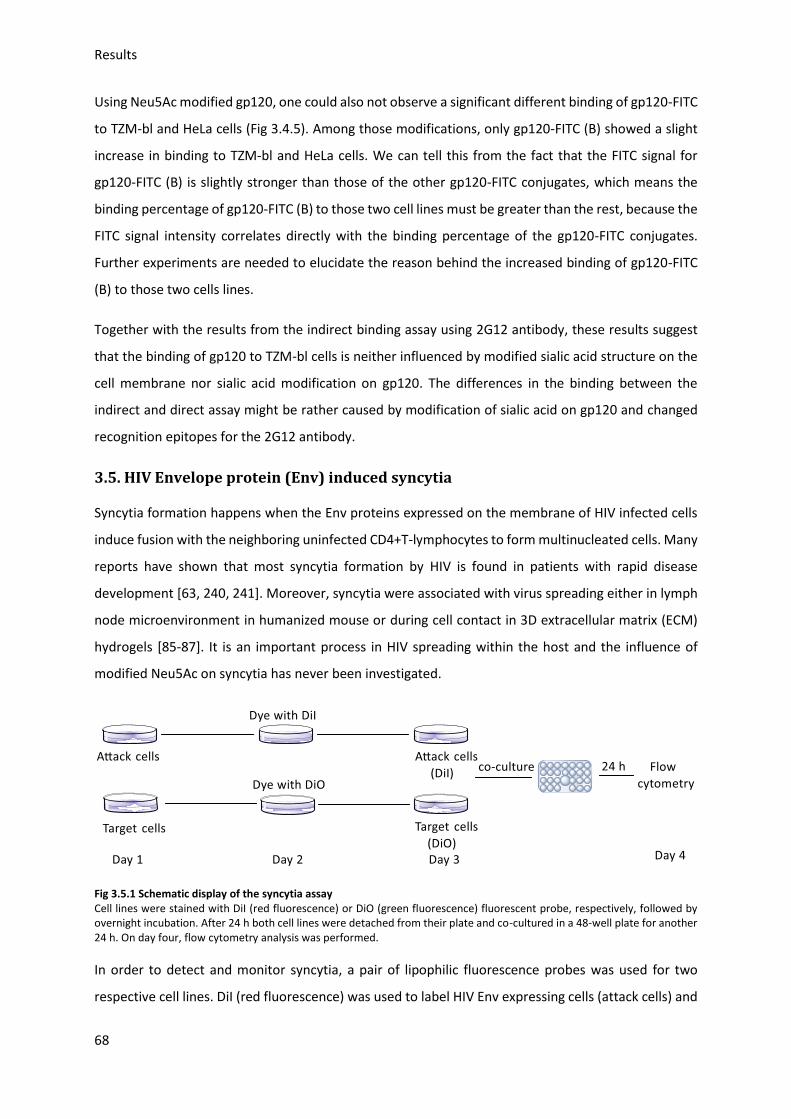
Results
68
Using Neu5Ac modified gp120, one could also not observe a significant different binding of gp120-FITC
to TZM-bl and HeLa cells (Fig 3.4.5). Among those modifications, only gp120-FITC (B) showed a slight
increase in binding to TZM-bl and HeLa cells. We can tell this from the fact that the FITC signal for
gp120-FITC (B) is slightly stronger than those of the other gp120-FITC conjugates, which means the
binding percentage of gp120-FITC (B) to those two cell lines must be greater than the rest, because the
FITC signal intensity correlates directly with the binding percentage of the gp120-FITC conjugates.
Further experiments are needed to elucidate the reason behind the increased binding of gp120-FITC
(B) to those two cells lines.
Together with the results from the indirect binding assay using 2G12 antibody, these results suggest
that the binding of gp120 to TZM-bl cells is neither influenced by modified sialic acid structure on the
cell membrane nor sialic acid modification on gp120. The differences in the binding between the
indirect and direct assay might be rather caused by modification of sialic acid on gp120 and changed
recognition epitopes for the 2G12 antibody.
3.5. HIV Envelope protein (Env) induced syncytia
Syncytia formation happens when the Env proteins expressed on the membrane of HIV infected cells
induce fusion with the neighboring uninfected CD4+T-lymphocytes to form multinucleated cells. Many
reports have shown that most syncytia formation by HIV is found in patients with rapid disease
development [63, 240, 241]. Moreover, syncytia were associated with virus spreading either in lymph
node microenvironment in humanized mouse or during cell contact in 3D extracellular matrix (ECM)
hydrogels [85-87]. It is an important process in HIV spreading within the host and the influence of
modified Neu5Ac on syncytia has never been investigated.
Fig 3.5.1 Schematic display of the syncytia assay Cell lines were stained with DiI (red fluorescence) or DiO (green fluorescence) fluorescent probe, respectively, followed by overnight incubation. After 24 h both cell lines were detached from their plate and co-cultured in a 48-well plate for another 24 h. On day four, flow cytometry analysis was performed.
In order to detect and monitor syncytia, a pair of lipophilic fluorescence probes was used for two
respective cell lines. DiI (red fluorescence) was used to label HIV Env expressing cells (attack cells) and
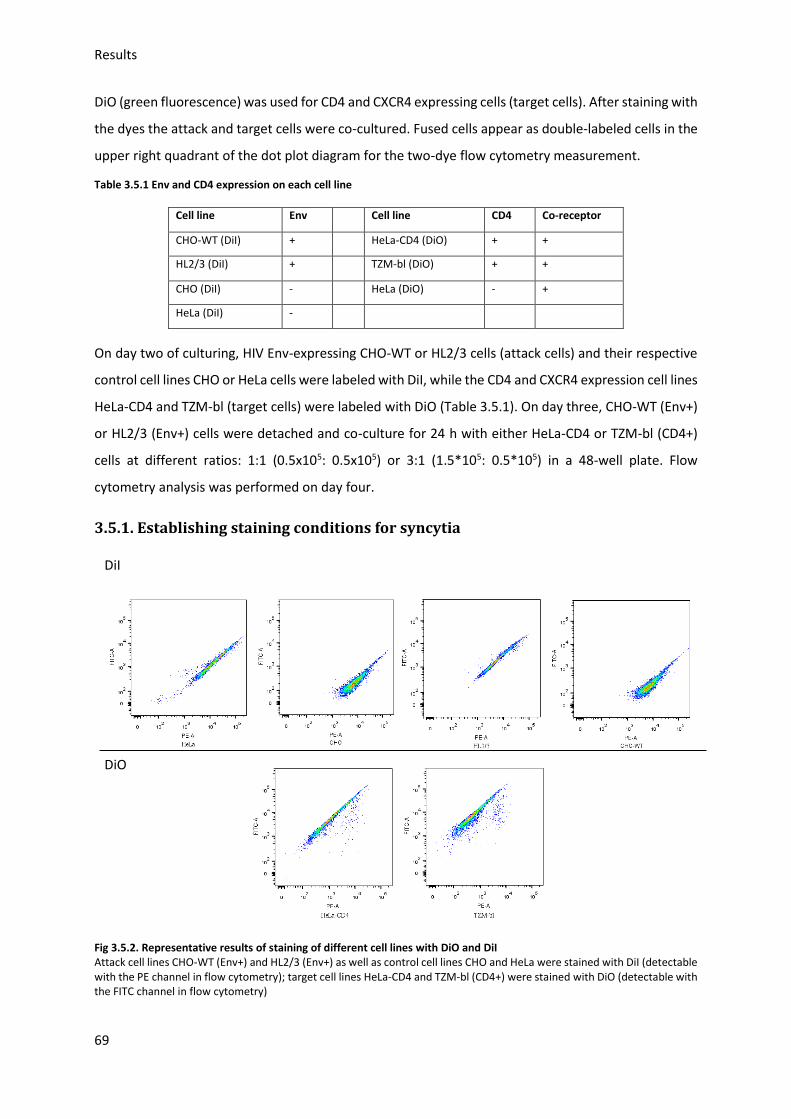
Results
69
DiO (green fluorescence) was used for CD4 and CXCR4 expressing cells (target cells). After staining with
the dyes the attack and target cells were co-cultured. Fused cells appear as double-labeled cells in the
upper right quadrant of the dot plot diagram for the two-dye flow cytometry measurement.
Table 3.5.1 Env and CD4 expression on each cell line
On day two of culturing, HIV Env-expressing CHO-WT or HL2/3 cells (attack cells) and their respective
control cell lines CHO or HeLa cells were labeled with DiI, while the CD4 and CXCR4 expression cell lines
HeLa-CD4 and TZM-bl (target cells) were labeled with DiO (Table 3.5.1). On day three, CHO-WT (Env+)
or HL2/3 (Env+) cells were detached and co-culture for 24 h with either HeLa-CD4 or TZM-bl (CD4+)
cells at different ratios: 1:1 (0.5x10⁵: 0.5x10⁵) or 3:1 (1.5*105: 0.5*105) in a 48-well plate. Flow
cytometry analysis was performed on day four.
3.5.1. Establishing staining conditions for syncytia
Fig 3.5.2. Representative results of staining of different cell lines with DiO and DiI Attack cell lines CHO-WT (Env+) and HL2/3 (Env+) as well as control cell lines CHO and HeLa were stained with DiI (detectable with the PE channel in flow cytometry); target cell lines HeLa-CD4 and TZM-bl (CD4+) were stained with DiO (detectable with the FITC channel in flow cytometry)
Cell line Env Cell line CD4 Co-receptor
CHO-WT (DiI) + HeLa-CD4 (DiO) + +
HL2/3 (DiI) + TZM-bl (DiO) + +
CHO (DiI) - HeLa (DiO) - +
HeLa (DiI) -
DiI
DiO
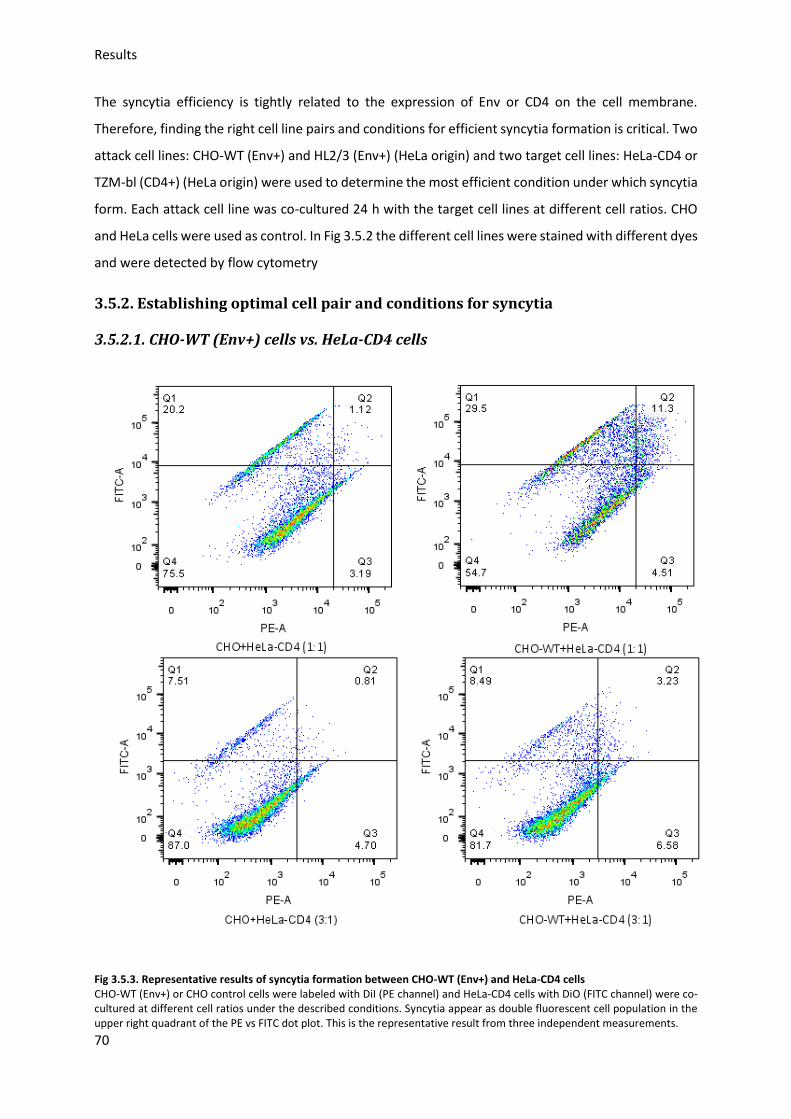
Results
70
The syncytia efficiency is tightly related to the expression of Env or CD4 on the cell membrane.
Therefore, finding the right cell line pairs and conditions for efficient syncytia formation is critical. Two
attack cell lines: CHO-WT (Env+) and HL2/3 (Env+) (HeLa origin) and two target cell lines: HeLa-CD4 or
TZM-bl (CD4+) (HeLa origin) were used to determine the most efficient condition under which syncytia
form. Each attack cell line was co-cultured 24 h with the target cell lines at different cell ratios. CHO
and HeLa cells were used as control. In Fig 3.5.2 the different cell lines were stained with different dyes
and were detected by flow cytometry
3.5.2. Establishing optimal cell pair and conditions for syncytia
3.5.2.1. CHO-WT (Env+) cells vs. HeLa-CD4 cells
Fig 3.5.3. Representative results of syncytia formation between CHO-WT (Env+) and HeLa-CD4 cells CHO-WT (Env+) or CHO control cells were labeled with DiI (PE channel) and HeLa-CD4 cells with DiO (FITC channel) were co-cultured at different cell ratios under the described conditions. Syncytia appear as double fluorescent cell population in the upper right quadrant of the PE vs FITC dot plot. This is the representative result from three independent measurements.
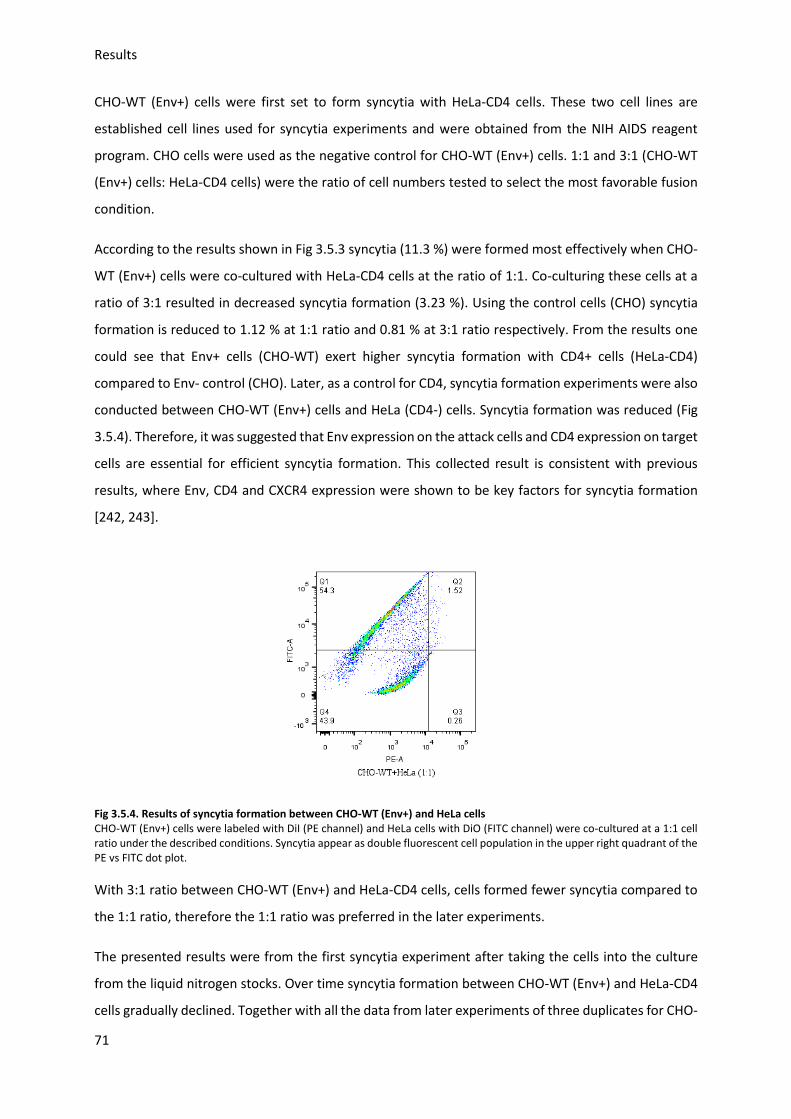
Results
71
CHO-WT (Env+) cells were first set to form syncytia with HeLa-CD4 cells. These two cell lines are
established cell lines used for syncytia experiments and were obtained from the NIH AIDS reagent
program. CHO cells were used as the negative control for CHO-WT (Env+) cells. 1:1 and 3:1 (CHO-WT
(Env+) cells: HeLa-CD4 cells) were the ratio of cell numbers tested to select the most favorable fusion
condition.
According to the results shown in Fig 3.5.3 syncytia (11.3 %) were formed most effectively when CHO-
WT (Env+) cells were co-cultured with HeLa-CD4 cells at the ratio of 1:1. Co-culturing these cells at a
ratio of 3:1 resulted in decreased syncytia formation (3.23 %). Using the control cells (CHO) syncytia
formation is reduced to 1.12 % at 1:1 ratio and 0.81 % at 3:1 ratio respectively. From the results one
could see that Env+ cells (CHO-WT) exert higher syncytia formation with CD4+ cells (HeLa-CD4)
compared to Env- control (CHO). Later, as a control for CD4, syncytia formation experiments were also
conducted between CHO-WT (Env+) cells and HeLa (CD4-) cells. Syncytia formation was reduced (Fig
3.5.4). Therefore, it was suggested that Env expression on the attack cells and CD4 expression on target
cells are essential for efficient syncytia formation. This collected result is consistent with previous
results, where Env, CD4 and CXCR4 expression were shown to be key factors for syncytia formation
[242, 243].
Fig 3.5.4. Results of syncytia formation between CHO-WT (Env+) and HeLa cells CHO-WT (Env+) cells were labeled with DiI (PE channel) and HeLa cells with DiO (FITC channel) were co-cultured at a 1:1 cell ratio under the described conditions. Syncytia appear as double fluorescent cell population in the upper right quadrant of the PE vs FITC dot plot.
With 3:1 ratio between CHO-WT (Env+) and HeLa-CD4 cells, cells formed fewer syncytia compared to
the 1:1 ratio, therefore the 1:1 ratio was preferred in the later experiments.
The presented results were from the first syncytia experiment after taking the cells into the culture
from the liquid nitrogen stocks. Over time syncytia formation between CHO-WT (Env+) and HeLa-CD4
cells gradually declined. Together with all the data from later experiments of three duplicates for CHO-
Results
72
WT (Env+) and HeLa-CD4 cells (1:1), syncytia formation was calculated to be 6.19 ± 0.65%. Since the
CD4 expression appears to be more stable, the decline in syncytia might be due to the loss of Env
expression on CHO-WT cells after each cell passage.
3.5.2.2. HL2/3 (Env+) cells vs. HeLa-CD4 cells
Fig 3.5.5. Representative results of syncytia formation between HL2/3 (Env+) and HeLa-CD4 cells HL2/3 (Env+) or HeLa control cells were labeled with DiI (PE channel) and HeLa-CD4 cells with DiO (FITC channel) were co-cultured at different cell ratios under the described conditions. Syncytia appear as double fluorescent cell population in the upper right quadrant of the PE vs FITC dot plot.
The syncytia formation was tested between attack cells HL2/3 (Env+) and target cells HeLa-CD4 at 1:1
or 3:1 ratio. HeLa cells were used as control cells. Fig 3.5.5 indicated that the 1:1 and the 3:1 ratio have
Results
73
increased syncytia formation between HL2/3 and HeLa-CD4 cells, but compared to that between CHO-
WT (Env+) and HeLa-CD4 cells, this effect was rather small.
3.5.2.3. CHO-WT (Env+) cells vs. TZM-bl (CD4+) cells
Fig 3.5.6. Representative results of syncytia formation between CHO-WT (Env+) and TZM-bl (CD4+) cells CHO-WT (Env+) or CHO control cells were labeled with DiI (PE channel) and TZM-bl (CD4+) cells with DiO (FITC channel) were co-cultured at different cell ratios under the described conditions. Syncytia appear as double fluorescent cell population in the upper right quadrant of the PE vs FITC dot plot.
Here the syncytia formation between attack cells CHO-WT (Env+) and target cells TZM-bl (CD4+) was
tested at cell ratios of 1:1 or 3:1. CHO cells were used as control attack cells. In Fig 3.5.6 neither the
1:1 nor the 3:1 ratio show any obvious syncytia formation between CHO-WT (Env+) and TZM-bl (CD4+)
cells.
Results
74
3.5.2.4. HL2/3 (Env+) cells vs. TZM-bl (CD4+) cells
Fig 3.5.7. Representative results of syncytia formation between HL2/3 (Env+) and TZM-bl (CD4+) cells HL2/3 (Env+) or HeLa control cells were labeled with DiI (PE channel) and TZM-bl (CD4+) cells with DiO (FITC channel) were co-cultured at different cell ratios under the described conditions. Syncytia appear as double fluorescent cell population in the upper right quadrant of the PE vs FITC dot plot.
The last syncytia formation was tested between attack cells HL2/3 (Env+) and target cells TZM-bl
(CD4+). HeLa cells were used as control. Here, with both ratios 1:1 or 3:1, no significant higher syncytia
formation between HL2/3 (Env+) and TZM-bl (CD4+) cells could be achieved compared to the control
(Fig 3.5.7).
Taken together all the flow cytometry results, the best syncytia formation was found between CHO-
WT (Env+) and HeLa-CD4 cells at the 1:1 cell ratio (0.5x10⁵: 0.5x10⁵ co-culturing for 24 h). Therefore
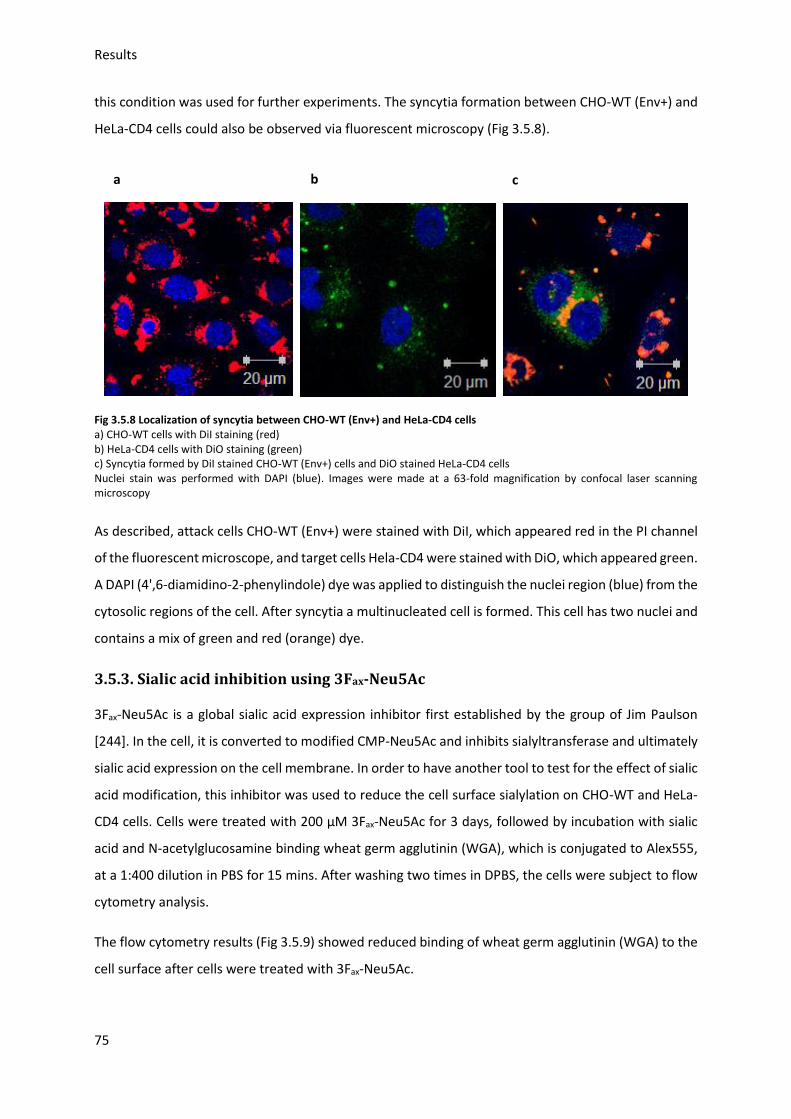
Results
75
this condition was used for further experiments. The syncytia formation between CHO-WT (Env+) and
HeLa-CD4 cells could also be observed via fluorescent microscopy (Fig 3.5.8).
Fig 3.5.8 Localization of syncytia between CHO-WT (Env+) and HeLa-CD4 cells a) CHO-WT cells with DiI staining (red) b) HeLa-CD4 cells with DiO staining (green) c) Syncytia formed by DiI stained CHO-WT (Env+) cells and DiO stained HeLa-CD4 cells Nuclei stain was performed with DAPI (blue). Images were made at a 63-fold magnification by confocal laser scanning microscopy
As described, attack cells CHO-WT (Env+) were stained with DiI, which appeared red in the PI channel
of the fluorescent microscope, and target cells Hela-CD4 were stained with DiO, which appeared green.
A DAPI (4',6-diamidino-2-phenylindole) dye was applied to distinguish the nuclei region (blue) from the
cytosolic regions of the cell. After syncytia a multinucleated cell is formed. This cell has two nuclei and
contains a mix of green and red (orange) dye.
3.5.3. Sialic acid inhibition using 3Fax-Neu5Ac
3Fax-Neu5Ac is a global sialic acid expression inhibitor first established by the group of Jim Paulson
[244]. In the cell, it is converted to modified CMP-Neu5Ac and inhibits sialyltransferase and ultimately
sialic acid expression on the cell membrane. In order to have another tool to test for the effect of sialic
acid modification, this inhibitor was used to reduce the cell surface sialylation on CHO-WT and HeLa-
CD4 cells. Cells were treated with 200 µM 3Fax-Neu5Ac for 3 days, followed by incubation with sialic
acid and N-acetylglucosamine binding wheat germ agglutinin (WGA), which is conjugated to Alex555,
at a 1:400 dilution in PBS for 15 mins. After washing two times in DPBS, the cells were subject to flow
cytometry analysis.
The flow cytometry results (Fig 3.5.9) showed reduced binding of wheat germ agglutinin (WGA) to the
cell surface after cells were treated with 3Fax-Neu5Ac.
a b c
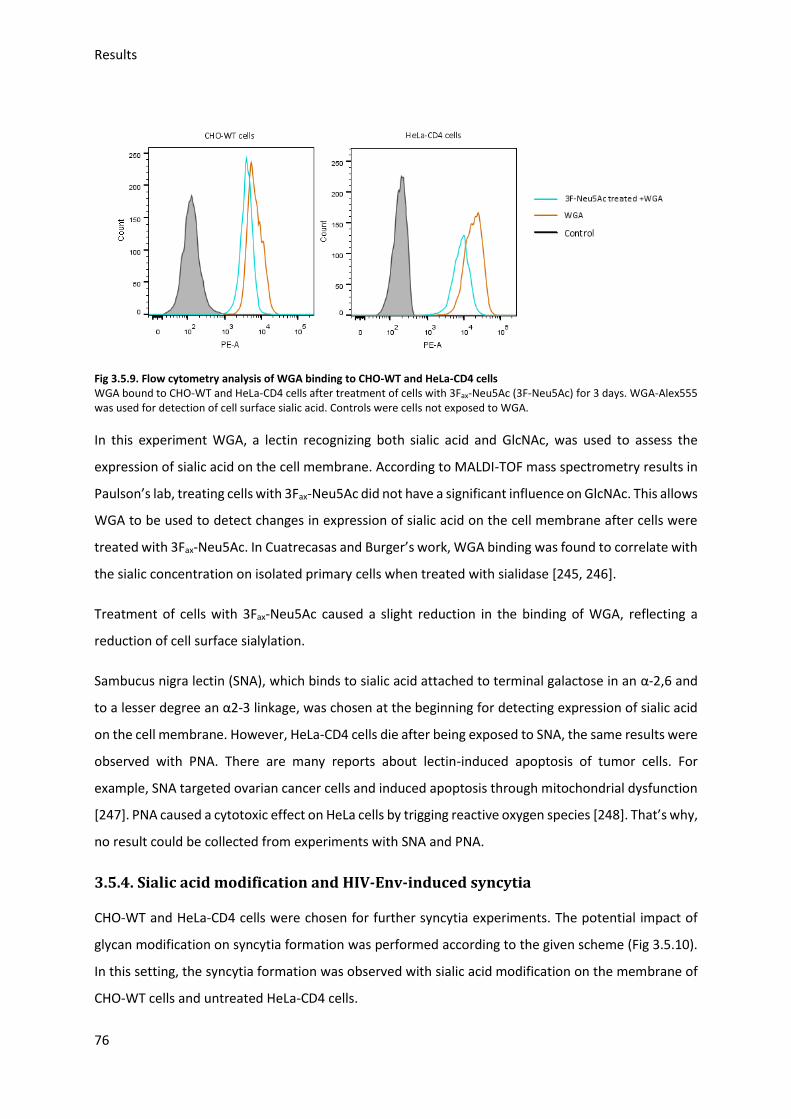
Results
76
Fig 3.5.9. Flow cytometry analysis of WGA binding to CHO-WT and HeLa-CD4 cells WGA bound to CHO-WT and HeLa-CD4 cells after treatment of cells with 3Fax-Neu5Ac (3F-Neu5Ac) for 3 days. WGA-Alex555 was used for detection of cell surface sialic acid. Controls were cells not exposed to WGA.
In this experiment WGA, a lectin recognizing both sialic acid and GlcNAc, was used to assess the
expression of sialic acid on the cell membrane. According to MALDI-TOF mass spectrometry results in
Paulson’s lab, treating cells with 3Fax-Neu5Ac did not have a significant influence on GlcNAc. This allows
WGA to be used to detect changes in expression of sialic acid on the cell membrane after cells were
treated with 3Fax-Neu5Ac. In Cuatrecasas and Burger’s work, WGA binding was found to correlate with
the sialic concentration on isolated primary cells when treated with sialidase [245, 246].
Treatment of cells with 3Fax-Neu5Ac caused a slight reduction in the binding of WGA, reflecting a
reduction of cell surface sialylation.
Sambucus nigra lectin (SNA), which binds to sialic acid attached to terminal galactose in an α-2,6 and
to a lesser degree an α2-3 linkage, was chosen at the beginning for detecting expression of sialic acid
on the cell membrane. However, HeLa-CD4 cells die after being exposed to SNA, the same results were
observed with PNA. There are many reports about lectin-induced apoptosis of tumor cells. For
example, SNA targeted ovarian cancer cells and induced apoptosis through mitochondrial dysfunction
[247]. PNA caused a cytotoxic effect on HeLa cells by trigging reactive oxygen species [248]. That’s why,
no result could be collected from experiments with SNA and PNA.
3.5.4. Sialic acid modification and HIV-Env-induced syncytia
CHO-WT and HeLa-CD4 cells were chosen for further syncytia experiments. The potential impact of
glycan modification on syncytia formation was performed according to the given scheme (Fig 3.5.10).
In this setting, the syncytia formation was observed with sialic acid modification on the membrane of
CHO-WT cells and untreated HeLa-CD4 cells.
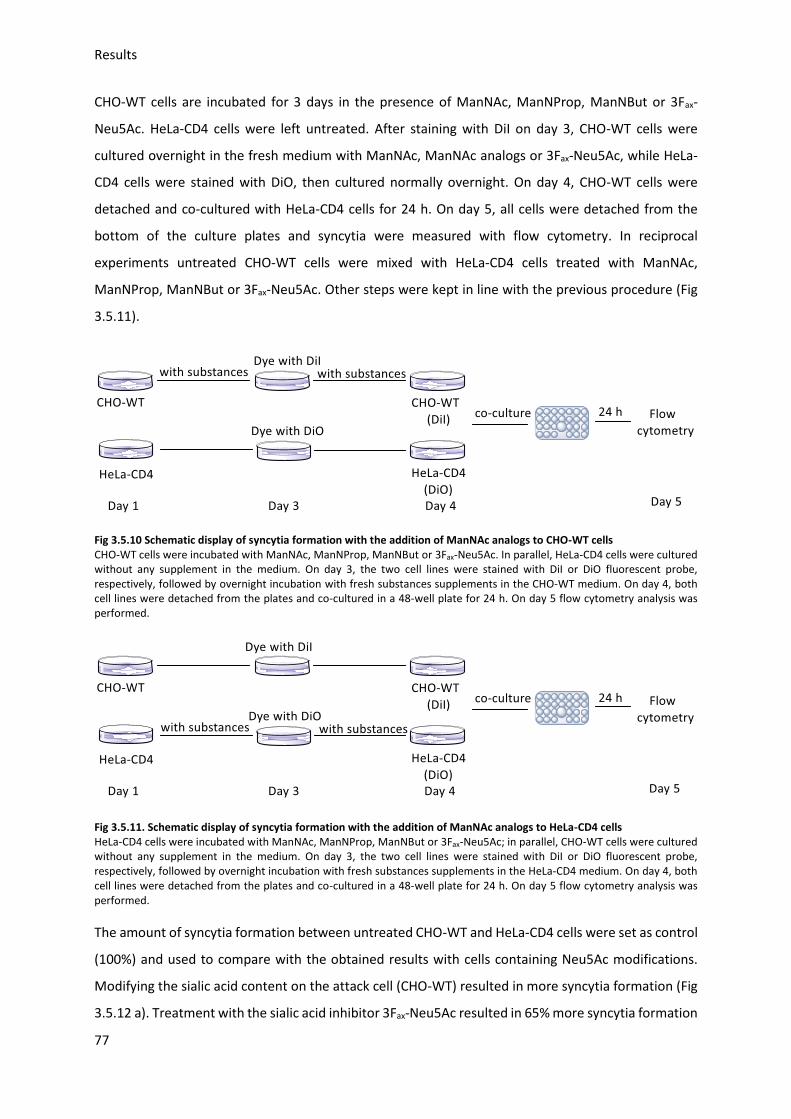
Results
77
CHO-WT cells are incubated for 3 days in the presence of ManNAc, ManNProp, ManNBut or 3Fax-
Neu5Ac. HeLa-CD4 cells were left untreated. After staining with DiI on day 3, CHO-WT cells were
cultured overnight in the fresh medium with ManNAc, ManNAc analogs or 3Fax-Neu5Ac, while HeLa-
CD4 cells were stained with DiO, then cultured normally overnight. On day 4, CHO-WT cells were
detached and co-cultured with HeLa-CD4 cells for 24 h. On day 5, all cells were detached from the
bottom of the culture plates and syncytia were measured with flow cytometry. In reciprocal
experiments untreated CHO-WT cells were mixed with HeLa-CD4 cells treated with ManNAc,
ManNProp, ManNBut or 3Fax-Neu5Ac. Other steps were kept in line with the previous procedure (Fig
3.5.11).
Fig 3.5.10 Schematic display of syncytia formation with the addition of ManNAc analogs to CHO-WT cells CHO-WT cells were incubated with ManNAc, ManNProp, ManNBut or 3Fax-Neu5Ac. In parallel, HeLa-CD4 cells were cultured without any supplement in the medium. On day 3, the two cell lines were stained with DiI or DiO fluorescent probe, respectively, followed by overnight incubation with fresh substances supplements in the CHO-WT medium. On day 4, both cell lines were detached from the plates and co-cultured in a 48-well plate for 24 h. On day 5 flow cytometry analysis was performed.
Fig 3.5.11. Schematic display of syncytia formation with the addition of ManNAc analogs to HeLa-CD4 cells HeLa-CD4 cells were incubated with ManNAc, ManNProp, ManNBut or 3Fax-Neu5Ac; in parallel, CHO-WT cells were cultured without any supplement in the medium. On day 3, the two cell lines were stained with DiI or DiO fluorescent probe, respectively, followed by overnight incubation with fresh substances supplements in the HeLa-CD4 medium. On day 4, both cell lines were detached from the plates and co-cultured in a 48-well plate for 24 h. On day 5 flow cytometry analysis was performed.
The amount of syncytia formation between untreated CHO-WT and HeLa-CD4 cells were set as control
(100%) and used to compare with the obtained results with cells containing Neu5Ac modifications.
Modifying the sialic acid content on the attack cell (CHO-WT) resulted in more syncytia formation (Fig
3.5.12 a). Treatment with the sialic acid inhibitor 3Fax-Neu5Ac resulted in 65% more syncytia formation
Results
78
when applied to CHO-WT. ManNBut and ManNAc treated CHO-WT cells showed slight increased
syncytia formation of 26% and 16% respectively. ManNProp treatment CHO-WT cells showed almost
no change in syncytia formation with HeLa-CD4 cells (2%) compared to the control.
Fig 3.5.12. Effect of ManNAc analogs and 3Fax-Neu5Ac on syncytia formation a) ManNAc, ManNAc analogs or 3Fax-Neu5Ac treated CHO-WT cells formed syncytia with CHO-WT cells. b) ManNAc, ManNAc analogs or 3Fax-Neu5Ac treated HeLa-CD4 cells formed syncytia with HeLa-CD4 cells. Syncytia formation of untreated CHO-WT cells and untreated HeLa-CD4 cells were set as 100%. Other syncytia were calculated relative to this. Error bars represent mean values ± SD of 2 independent experiments carried out in triplicates.
On the other side, when ManNAc, ManNAc analogs and inhibitor 3Fax-Neu5Ac treated HeLa-CD4 cells
were mixed with untreated CHO-WT cells, syncytia formation also increased (Fig 3.5.12 b). 3Fax-
Neu5Ac, ManProp and ManNBut treated HeLa-CD4 cells showed 31%, 29% and 35% more syncytia
b
a
0
50
100
150
200
Control 3Fax-Neu5Ac ManNAc ManNProp ManNBut
Syn
cyti
a fo
rmat
ion
[%
]
Syncytia formation of treated CHO-WT cells
0
50
100
150
200
Control 3Fax-Neu5Ac ManNAc ManNProp ManNBut
Syn
cyti
a fo
ram
atio
n [
%]
Syncytia formation of treated HeLa-CD4 cells
Results
79
formation compared to the untreated control. Here, ManNAc treated HeLa-CD4 cells did not increase
syncytia formation significantly (9%) compared to the control.
With the cell passage, the syncytia formation between CHO-WT (Env+) and HeLa-CD4 cells gradually
reduced. Therefore, there are big variances between different batches of experiments. However,
taking all the triplicated results from 2 independent measurements together, sialic acid modification
on either attack CHO-WT cells or target HeLa-CD4 cells has clear influences on syncytia formation.
The biggest increase in syncytia formation was observed when sialic acid expression was inhibited by
3Fax-Neu5Ac: 65% for CHO-WT cells and 31% for HeLa-CD4 cells. As for ManNAc treatment, the effect
on syncytia formation was rather small. As for ManNProp and ManNBut, where the sialic acid structure
was modified, ManNBut showed a consistent result for both cell lines (attack and target), making their
effect rather unspecific. ManNProp treated HeLa-CD4 cells showed 29% more syncytia formation, but
the same treatment in CHO-WT cells only has almost no effect (2%).
Taking these results together one may conclude that in these syncytia formation experiments,
inhibition of sialic acid has the biggest impact on syncytia formation. Treatment with ManNAc or a
structural modification of Neu5AC only has a mild effects on syncytia formation.
80
4. Discussion
4.1. Sialic acid modification with ManNAc derivates
Being at the terminal end of glycans and gangliosides, sialic acid exerts important functions by
interacting with other proteins and bio-molecules. With the development of new chemical and
biochemical methods, more and more biological functions of sialic acid have been revealed [211, 249].
Prominent methods to manipulate sialic acids and to investigate their functions are: sialidase
treatment (an enzymatic method to remove sialic acids), sialic acid deficient cell lines (created by
expressing deficient enzymes, e.g. GNE, in the de novo sialic acid biosynthesis pathway), glycan
biosynthesis inhibition (preventing the formation of complex or hybrid N-glycans with small molecules,
like 1-deoxynojirimycin) or sialyltransferases transfection (increasing sialic acid expression) [250]. All
these methods, however, have their drawbacks in cells and limited application in vivo.
Due to the promiscuous character of enzymes in the Neu5Ac biosynthesis pathway [251], ManNAc
analogs were introduced into Neu5Ac biosynthesis pathway and got catalyzed to modified CMP-
Neu5Ac. These modified sialic acids were ultimately built into the corresponding sialic acid structures
in cells and in vivo via sialyltransferases (STs). This application, metabolic glycoengineering (MGE), was
pioneered by the group of Prof. Reutter [163]. It has been applied to other glycol derivates like Fuc,
Neu5Ac, GalNAc, and GlcNAc and helped revealing numerous novel biological functions of sialic acid
in cells [218, 224, 252].
In cellular or in vivo assays, ManNAc derivatives are usually used in the per-acetylated form. In this
form, they can easily pass through the hydrophobic cell membrane barrier. In the cytoplasm, the
acetate groups will be hydrolyzed by unspecific esterases releasing the original ManNAc derivate
structures. However, those peracetylated derivatives can only be used at low concentrations, since the
freed acetate groups reduce the pH in the cytoplasm and may impair cell proliferation [183, 253, 254].
Without peracetylation, ManNAc derivatives need to be added at a higher concentration, but it is less
toxic and can also be converted to the corresponding Neu5Ac [186, 224].
In these experiments I used ManNAc, ManNProp and ManNBut without peracetylation and
demonstrated that for CHO and TZM-bl/HeLa cells these substances could be applied up to a 10 mM
in the medium without any significant proliferation reduction (see supplemental data Fig 5.3).
HPLC analysis of DMB-labeled sialic acids, a sensitive and reliable method for monitoring sialic acid
expression and modification, was used to verify the successful expression of modified sialic acids on
the cell membrane [111]. Based on established standards, it was possible to qualify and quantify the
corresponding unnatural Neu5Ac.
Discussion
81
In my experiments, when treated with ManNAc, cells expressed more Neu5Ac (Fig 3.1.2). The increase
varies between different cell lines. The amount of Neu5Ac in treated CHO cells doubled, while the
amount of Neu5Ac in treated TZM-bl cells increased only by 35%. CHO cells are immortalized ovarian
cells from Chinese hamster and HeLa cells are derived from human cervical cancer cells. The
differences in Neu5Ac increase could be due to different expression of enzymes in the sialic acid
biosynthesis pathway, especially the sialyltransferases (STs).
When treated with excessive amounts of ManNProp, the unnatural Neu5NProp were predominantly
expressed on the cell membrane, decreasing the expression of Neu5Ac and Neu5Gc in both cell lines.
In CHO cells Neu5Ac was reduced to 4.8 ng/mg protein from normally 87.4 ng/mg protein. In HeLa cells
the amount went from 101.8 ng/mg protein to 16.9 ng/mg protein. For CHO cells, Neu5Gc is reduced
to 2.5 ng/mg protein from 13.38 ng/mg and could not be detected in TZM-bl cells after the treatment.
This demonstrates a high tolerance of ManNProp in the sialic acid biosynthesis pathway, making it
possible for Neu5Prop to be overexpressed. In addition to that, Neu5Prop may be less susceptible to
native sialidases, allowing it to have a longer turnover time on the cell surface.
Treated with ManNBut, the amount of Neu5Ac and Neu5Gc on both cell lines was also reduced; albeit
not as strong as with ManNProp treated cells: to 45.3 ng/mg protein Neu5Ac in CHO cells and to 31.7
ng/mg protein in TZM-bl. Even though ManNBut conversion efficiency was not as high as that of
ManNProp, Neu5But amount was assessed to be still higher than 50% of the total sialic acid amount
on cells, i.e. 59.1 ng/mg protein in CHO and 50.8 ng/mg protein in TZM-bl cells.
The different metabolic efficiency of ManNAc analogs is most likely due to their different specificity to
STs in the sialic acid biosynthesis pathway. There are around 20 STs in the cells, which have different
preferences for different glycan structures and/or linkages. For example: the ST6Gal and ST6GalNAc
family prefer alpha-2,6 linkage to galactose or N-acetylgalactosamine, the ST3Gal family favors alpha-
2,3 linkage to galactose, and the ST8SA family prefers alpha-2,8 linkage mainly found in polysialic acid.
It is unknown which ST group favors which sialic acid analogs. Also, it also unknown whether besides
quantitative changes there are also structural changes in the glycan [244]. With the available methods
(e.g. HPLC) structural changes could not be assessed.
In further studies it would be interesting to use mass spectrometry like MALDI-TOF and ESI-MS to
analyze the structure of the modified glycans on the cell membrane or on the target proteins (Gp120,
CXCR4 and CD4). Alternatively, one could also use lectins (examples: PNA SNA, MAA and PSL) and flow
cytometry to quickly gain insights into changes of cell surface sialic acids.
Discussion
82
The observation, that membrane Neu5Ac amount is increased after feeding CHO and TZM-bl cells with
ManNAc, is consistent with that of previous work of Erikson et al. [224], where 293T cells were used.
In contrast, the treatment with ManNAc does not influence Neu5Ac expression in PC12 cells [235].
Treated with ManNProp, all four cell lines mentioned above produced Neu5Prop and reduced Neu5Ac
compared to the untreated cells. Membrane Neu5Prop was predominant in CHO, TZM-bl and 293T
cells, and only in PC12 cells still lower than Neu5Ac. Those results reinforce the general applicability of
ManNAc analogs to modify cell surface sialic acids in different cell lines, although individual differences
in their expression level may exist.
4.2. Gp120 preparation
Secreted gp120 was collected from the medium of gp120 over-expressing cells followed by three
purification steps according to the literatures [230, 236, 238, 255]. The first purification step is a lectin
affinity chromatography with a GNA column, which can bind the terminal α (1-3)-linked mannose on
oligo-mannose of gp120. The second step is the removal of charged contaminants from the medium
through a weak ion exchange column (DEAE FF) followed by the third step, a size exclusion
chromatography (FPLC), which can separate dimeric gp120 from monomeric gp120.
In this experiment, secreted gp120, produced by transfected CHO cells, was isolated from the medium
using the methods described above. The GNA affinity chromatography was efficient in enriching and
isolating the expressed gp120 dimers and monomers from the medium. In dimeric gp120 the
monomers are linked by disulfide bonds and often occur in systems which artificially overexpress the
viral protein [230, 236, 237]. Under the given FPLC conditions, it was not possible to separate the gp120
monomers from the dimers. The size exclusion column used was a 25 ml Superdex 200 10/300 GL (GE)
while other groups used two connected size exclusion columns: Superdex 200 10/300 GL (GE) and a
HILOAD 16/60 Superdex 200 PG (GE) or a 320-ml HighLoad 26/600 Superdex 200 column (GE) to
separate dimeric and monomeric gp120s [230, 238]. In their experiments it has been demonstrated
that the gp120-GFP protein mix, containing dimer and monomer taken directly from the growth
medium, can effectively bind to TZM-bl cells similar to purified monomeric gp120 [237]. Often the
gp120 obtained from the one step GNA isolation was successfully used for further experiments [256].
Although the unspecific protein band between Mr 75 kDa and 50 kDa was slightly reduced by additional
purification steps (Fig 3.2.1 b), based on the previous insights and the fact that there was a big yield
loss after each purification step, the gp120 fraction after the GNA column was used directly for further
experimentations. In contrast to previous reports, where only monomeric gp120 was observed in SDS-
PAGE under denaturing conditions [236, 257], my results still show dimeric gp120 residues under
treatment with 2-mercaptoethanol. Apparently, my samples contain a larger portion of dimer as
compared to monomer and might need longer cooking time to completely break the disulfide bonds
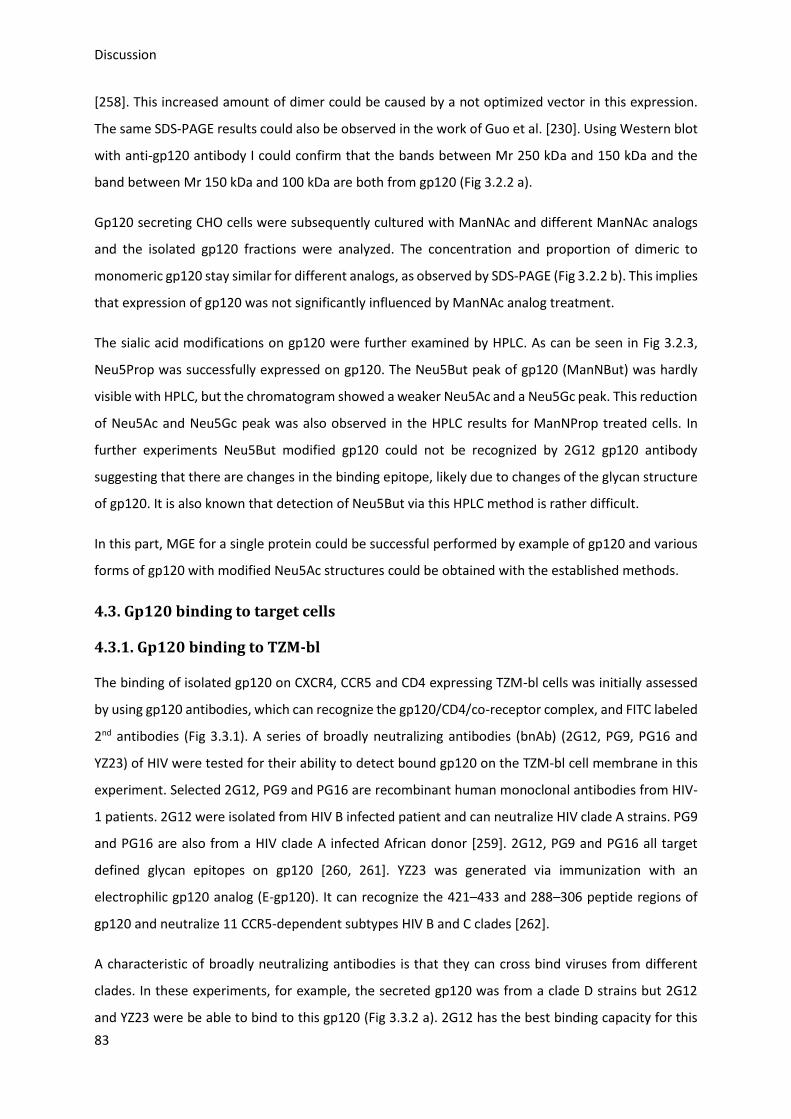
Discussion
83
[258]. This increased amount of dimer could be caused by a not optimized vector in this expression.
The same SDS-PAGE results could also be observed in the work of Guo et al. [230]. Using Western blot
with anti-gp120 antibody I could confirm that the bands between Mr 250 kDa and 150 kDa and the
band between Mr 150 kDa and 100 kDa are both from gp120 (Fig 3.2.2 a).
Gp120 secreting CHO cells were subsequently cultured with ManNAc and different ManNAc analogs
and the isolated gp120 fractions were analyzed. The concentration and proportion of dimeric to
monomeric gp120 stay similar for different analogs, as observed by SDS-PAGE (Fig 3.2.2 b). This implies
that expression of gp120 was not significantly influenced by ManNAc analog treatment.
The sialic acid modifications on gp120 were further examined by HPLC. As can be seen in Fig 3.2.3,
Neu5Prop was successfully expressed on gp120. The Neu5But peak of gp120 (ManNBut) was hardly
visible with HPLC, but the chromatogram showed a weaker Neu5Ac and a Neu5Gc peak. This reduction
of Neu5Ac and Neu5Gc peak was also observed in the HPLC results for ManNProp treated cells. In
further experiments Neu5But modified gp120 could not be recognized by 2G12 gp120 antibody
suggesting that there are changes in the binding epitope, likely due to changes of the glycan structure
of gp120. It is also known that detection of Neu5But via this HPLC method is rather difficult.
In this part, MGE for a single protein could be successful performed by example of gp120 and various
forms of gp120 with modified Neu5Ac structures could be obtained with the established methods.
4.3. Gp120 binding to target cells
4.3.1. Gp120 binding to TZM-bl
The binding of isolated gp120 on CXCR4, CCR5 and CD4 expressing TZM-bl cells was initially assessed
by using gp120 antibodies, which can recognize the gp120/CD4/co-receptor complex, and FITC labeled
2nd antibodies (Fig 3.3.1). A series of broadly neutralizing antibodies (bnAb) (2G12, PG9, PG16 and
YZ23) of HIV were tested for their ability to detect bound gp120 on the TZM-bl cell membrane in this
experiment. Selected 2G12, PG9 and PG16 are recombinant human monoclonal antibodies from HIV-
1 patients. 2G12 were isolated from HIV B infected patient and can neutralize HIV clade A strains. PG9
and PG16 are also from a HIV clade A infected African donor [259]. 2G12, PG9 and PG16 all target
defined glycan epitopes on gp120 [260, 261]. YZ23 was generated via immunization with an
electrophilic gp120 analog (E-gp120). It can recognize the 421–433 and 288–306 peptide regions of
gp120 and neutralize 11 CCR5-dependent subtypes HIV B and C clades [262].
A characteristic of broadly neutralizing antibodies is that they can cross bind viruses from different
clades. In these experiments, for example, the secreted gp120 was from a clade D strains but 2G12
and YZ23 were be able to bind to this gp120 (Fig 3.3.2 a). 2G12 has the best binding capacity for this
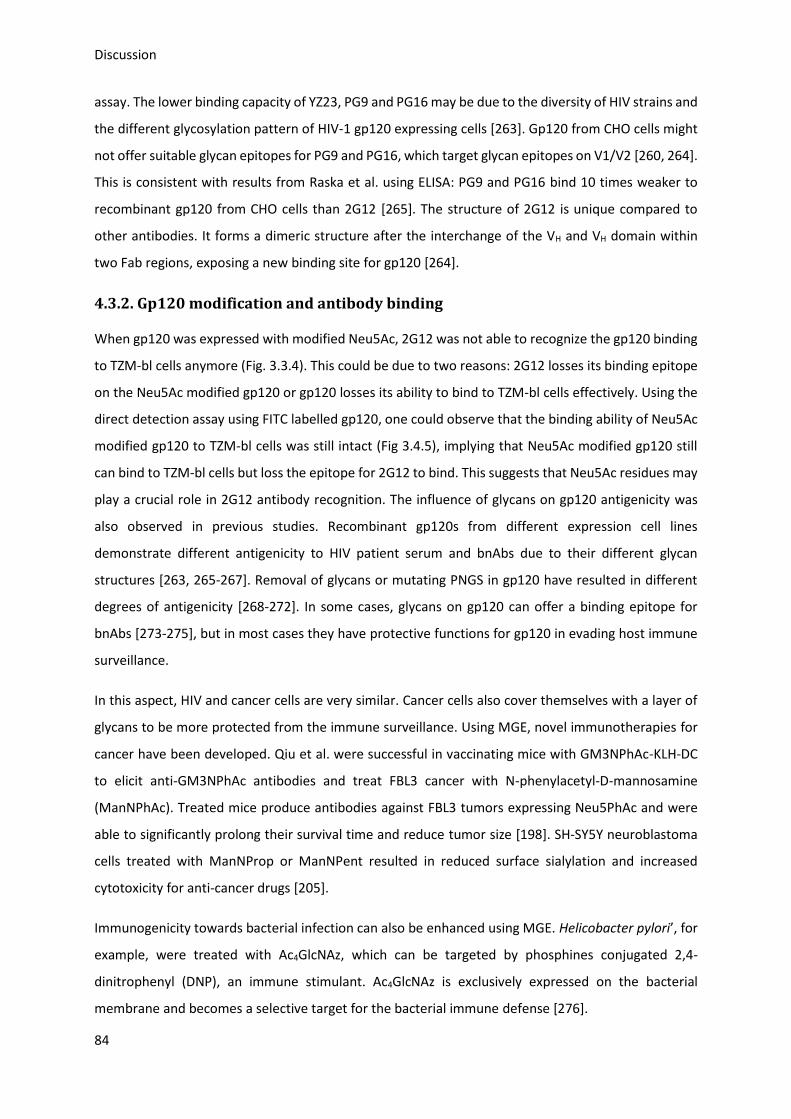
Discussion
84
assay. The lower binding capacity of YZ23, PG9 and PG16 may be due to the diversity of HIV strains and
the different glycosylation pattern of HIV-1 gp120 expressing cells [263]. Gp120 from CHO cells might
not offer suitable glycan epitopes for PG9 and PG16, which target glycan epitopes on V1/V2 [260, 264].
This is consistent with results from Raska et al. using ELISA: PG9 and PG16 bind 10 times weaker to
recombinant gp120 from CHO cells than 2G12 [265]. The structure of 2G12 is unique compared to
other antibodies. It forms a dimeric structure after the interchange of the VH and VH domain within
two Fab regions, exposing a new binding site for gp120 [264].
4.3.2. Gp120 modification and antibody binding
When gp120 was expressed with modified Neu5Ac, 2G12 was not able to recognize the gp120 binding
to TZM-bl cells anymore (Fig. 3.3.4). This could be due to two reasons: 2G12 losses its binding epitope
on the Neu5Ac modified gp120 or gp120 losses its ability to bind to TZM-bl cells effectively. Using the
direct detection assay using FITC labelled gp120, one could observe that the binding ability of Neu5Ac
modified gp120 to TZM-bl cells was still intact (Fig 3.4.5), implying that Neu5Ac modified gp120 still
can bind to TZM-bl cells but loss the epitope for 2G12 to bind. This suggests that Neu5Ac residues may
play a crucial role in 2G12 antibody recognition. The influence of glycans on gp120 antigenicity was
also observed in previous studies. Recombinant gp120s from different expression cell lines
demonstrate different antigenicity to HIV patient serum and bnAbs due to their different glycan
structures [263, 265-267]. Removal of glycans or mutating PNGS in gp120 have resulted in different
degrees of antigenicity [268-272]. In some cases, glycans on gp120 can offer a binding epitope for
bnAbs [273-275], but in most cases they have protective functions for gp120 in evading host immune
surveillance.
In this aspect, HIV and cancer cells are very similar. Cancer cells also cover themselves with a layer of
glycans to be more protected from the immune surveillance. Using MGE, novel immunotherapies for
cancer have been developed. Qiu et al. were successful in vaccinating mice with GM3NPhAc-KLH-DC
to elicit anti-GM3NPhAc antibodies and treat FBL3 cancer with N-phenylacetyl-D-mannosamine
(ManNPhAc). Treated mice produce antibodies against FBL3 tumors expressing Neu5PhAc and were
able to significantly prolong their survival time and reduce tumor size [198]. SH-SY5Y neuroblastoma
cells treated with ManNProp or ManNPent resulted in reduced surface sialylation and increased
cytotoxicity for anti-cancer drugs [205].
Immunogenicity towards bacterial infection can also be enhanced using MGE. Helicobacter pylori’, for
example, were treated with Ac4GlcNAz, which can be targeted by phosphines conjugated 2,4-
dinitrophenyl (DNP), an immune stimulant. Ac4GlcNAz is exclusively expressed on the bacterial
membrane and becomes a selective target for the bacterial immune defense [276].
Discussion
85
Those applications of MGE in cancer treatment and bacteria defense may be an inspiration for using
glycan modification in HIV antibody production and therapy.
4.3.3. Gp120 modification and binding to HeLa cells
When the binding of FITC-gp120 to TZM-bl cells was measured, HeLa cells were used as a negative
control. Surprisingly, an equally strong binding of FITC-gp120 to HeLa cells was observed (Fig 3.4.2 b).
Even though HeLa cells do not express CD4, it intrinsically expresses CXCR4. Gp120 did not bind
specifically to CHO cells (Fig 3.4.2 a), which do not express CXCR4, indicating that the binding to HeLa
cells was not unspecific. In addition, pretreating HeLa with anti-CXCR4 antibodies reduces the binding
capacity of gp120 (Fig 3.4.3 b), indicated that this binding was CXCR4 dependent. The gp120 used for
this assay originates from clade D HIV-1 from Uganda, where CD4 independent isolates were reported
[277]. Therefore, these HIV isolates usually bind CD4 positive cells, e.g. TZM-bl cells, but still keep their
ability to bind to CXCR4 in an CD4 independent manner (like with HeLa cells)
Repeating the same experiments using 2G12 antibody to recognize the gp120 binding on HeLa cells
showed a negative result (Fig 3.4.3 a). This suggests that without binding to CD4, the complex between
gp120/CXCR4 alone does not offer a suitable epitope for 2G12 to bind. This fact further corroborates
the well-known plasticity of the gp120 structure [278].
4.3.4. Neu5Ac modification and binding of gp120 to TZM-bl
Neu5Ac modification on TZM-bl and HeLa cells with different ManNAc analogs demonstrated no
changes in their binding characteristic to gp120, as assessed with the direct binding assay (Fig 3.4.4).
CD4 and CXCR4 have few glycosylation sites. CXCR4 possess two potential N-linked glycosylation sites:
one in the ECL-2 domain, the other in the N-terminal domain. Although removal of the N-linked
glycosylation sites in CXCR4 makes it more susceptible to R5X4-dual-tropic HIV-1 strains [279],
modifications of terminal Neu5Ac alone seem not to have a significant effect on the binding to gp120.
For CD4, the two glycosylation sites are located on the D3 and D4 domain, but only the D1 and D2
domains are involved in gp120 binding [22].
Neu5Ac modification on gp120s seems also to have no significant effect on binding of gp120 to TZM-
bl or HeLa cells (Fig 3.4.5). In previous experiments, it has been shown that the binding characteristic
of gp120 to CD4 can be altered when the glycan barrier around or in the tertiary structure of the gp120
binding site to CD4 is modified [105, 270, 280, 281]. But in our case the modifications of sialic acid
alone cannot induce this effect.
4.4. HIV I Env induced syncytium formation
Discussion
86
4.4.1. Establishing optimal syncytia conditions
Syncytia formation is associated with a pronounced CD4+ T cell decline and progression to AIDS [70,
74, 282]. Although the mechanism of syncytia formation is still not fully understood, it has been
reported to be a vessel for HIV dissemination [85, 86]. HIV Env protein and receptors are important
determinants for syncytia formation. In theory, an attack cell lines with HIV Env expression could fuse
with any target cell line expressing CD4 and CXCR4. In reality, for efficient fusion to happen many other
factors need to be optimized: Env, CD4 or CXCR4 expression on the cell membrane, cell conditions,
incubation time, etc. [283, 284]. Therefore, I had to test different attack cell lines (CHO-WT, HL2/3)
and target cell lines (HeLa-CD4, TZM-bl) to determine the best syncytia formation partners. They were
cultured together and the co-culture times and ratios were registered. When co-culturing cells with
ManNAc analogs, an optimal time for syncytia formation and Neu5Ac metabolism need to be found.
Syncytia formation occurs after 6 hours of co-culturing and increases steadily with time to a certain
threshold [262, 263]. Modified Neu5Ac on Env will be gradually eliminated without further ManNAc
analogs treatment. Due to these constraints, 24 h co-culturing time was determined to be the best for
this setting. In previous works, the co-culture ratio of 1:1 was taken as the best ratio besides other
ratios [232], which were also applied in cell fusion experiments [285, 286]. In my experiments, I
investigated the 1:1 and 3:1 ratio (attack cells number: target cells number). As the result, CHO-WT
and HeLa-CD4 cells at ratio 1:1 formed the most syncytia after 24 h co-culturing. Other cell pairs
demonstrated weak and insignificant syncytia formation and were not used for further experiments.
4.4.2. Neu5Ac modification and syncytia formation
The effect of the Neu5Ac modification on syncytia formation was evaluated in two steps. First, attack
cells were treated with ManNAc analogs and 3Fax-Neu5Ac (sialic acid inhibitor) and co-cultured with
target cells, then, the same procedure was repeated with treated target cells. The modification has a
global effect on the cell membrane and cannot be confined to Env and CD4/co-receptor alone.
However, as shown with controls, without Env and/or CD/co-receptor expression, only a low degree
of syncytia formation took place.
As the results demonstrated, inhibition of sialic acid expression by 3Fax-Neu5Ac on either attack cells
or target cells strongly increased syncytia formation, which is consistent with previous studies using
neuraminidases [287]. This increased effect on syncytia formation is probably due to stronger cell-cell
interaction [112]. Sialic acid with its negative charge is known to act as a repulsive barrier between
cells. Reduction of cell surface sialic acid concentration, whether with sialidase or with a
sialyltransferase inhibitor, may weaken this barrier allowing more syncytia formation to occur. In
addition, several studies have shown that HIV-1 virus binding, trans-infection and syncytia formation
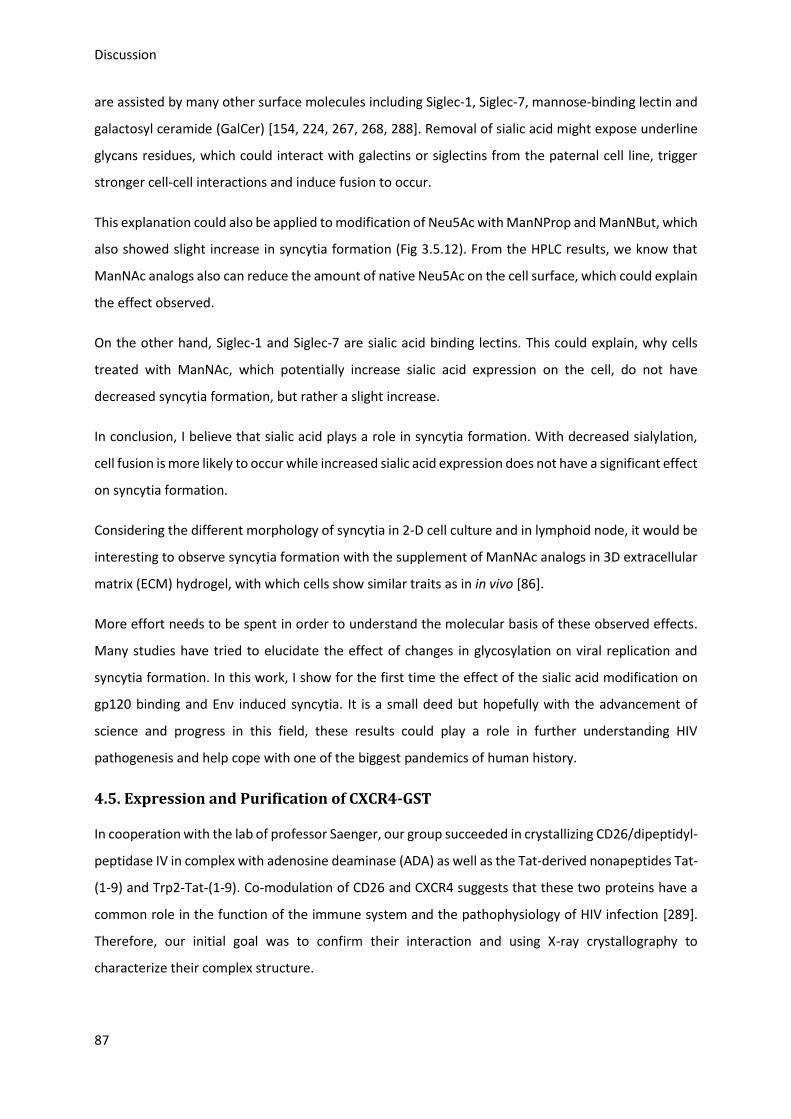
Discussion
87
are assisted by many other surface molecules including Siglec-1, Siglec-7, mannose-binding lectin and
galactosyl ceramide (GalCer) [154, 224, 267, 268, 288]. Removal of sialic acid might expose underline
glycans residues, which could interact with galectins or siglectins from the paternal cell line, trigger
stronger cell-cell interactions and induce fusion to occur.
This explanation could also be applied to modification of Neu5Ac with ManNProp and ManNBut, which
also showed slight increase in syncytia formation (Fig 3.5.12). From the HPLC results, we know that
ManNAc analogs also can reduce the amount of native Neu5Ac on the cell surface, which could explain
the effect observed.
On the other hand, Siglec-1 and Siglec-7 are sialic acid binding lectins. This could explain, why cells
treated with ManNAc, which potentially increase sialic acid expression on the cell, do not have
decreased syncytia formation, but rather a slight increase.
In conclusion, I believe that sialic acid plays a role in syncytia formation. With decreased sialylation,
cell fusion is more likely to occur while increased sialic acid expression does not have a significant effect
on syncytia formation.
Considering the different morphology of syncytia in 2-D cell culture and in lymphoid node, it would be
interesting to observe syncytia formation with the supplement of ManNAc analogs in 3D extracellular
matrix (ECM) hydrogel, with which cells show similar traits as in in vivo [86].
More effort needs to be spent in order to understand the molecular basis of these observed effects.
Many studies have tried to elucidate the effect of changes in glycosylation on viral replication and
syncytia formation. In this work, I show for the first time the effect of the sialic acid modification on
gp120 binding and Env induced syncytia. It is a small deed but hopefully with the advancement of
science and progress in this field, these results could play a role in further understanding HIV
pathogenesis and help cope with one of the biggest pandemics of human history.
4.5. Expression and Purification of CXCR4-GST
In cooperation with the lab of professor Saenger, our group succeeded in crystallizing CD26/dipeptidyl-
peptidase IV in complex with adenosine deaminase (ADA) as well as the Tat-derived nonapeptides Tat-
(1-9) and Trp2-Tat-(1-9). Co-modulation of CD26 and CXCR4 suggests that these two proteins have a
common role in the function of the immune system and the pathophysiology of HIV infection [289].
Therefore, our initial goal was to confirm their interaction and using X-ray crystallography to
characterize their complex structure.
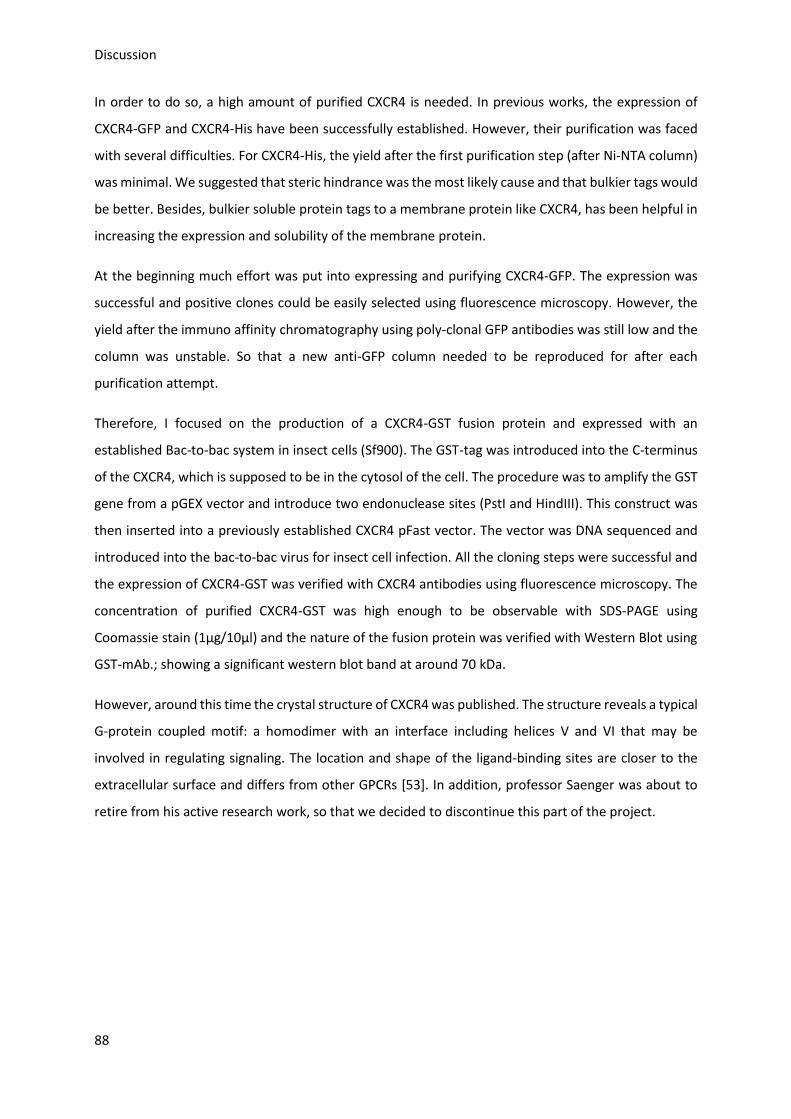
Discussion
88
In order to do so, a high amount of purified CXCR4 is needed. In previous works, the expression of
CXCR4-GFP and CXCR4-His have been successfully established. However, their purification was faced
with several difficulties. For CXCR4-His, the yield after the first purification step (after Ni-NTA column)
was minimal. We suggested that steric hindrance was the most likely cause and that bulkier tags would
be better. Besides, bulkier soluble protein tags to a membrane protein like CXCR4, has been helpful in
increasing the expression and solubility of the membrane protein.
At the beginning much effort was put into expressing and purifying CXCR4-GFP. The expression was
successful and positive clones could be easily selected using fluorescence microscopy. However, the
yield after the immuno affinity chromatography using poly-clonal GFP antibodies was still low and the
column was unstable. So that a new anti-GFP column needed to be reproduced for after each
purification attempt.
Therefore, I focused on the production of a CXCR4-GST fusion protein and expressed with an
established Bac-to-bac system in insect cells (Sf900). The GST-tag was introduced into the C-terminus
of the CXCR4, which is supposed to be in the cytosol of the cell. The procedure was to amplify the GST
gene from a pGEX vector and introduce two endonuclease sites (PstI and HindIII). This construct was
then inserted into a previously established CXCR4 pFast vector. The vector was DNA sequenced and
introduced into the bac-to-bac virus for insect cell infection. All the cloning steps were successful and
the expression of CXCR4-GST was verified with CXCR4 antibodies using fluorescence microscopy. The
concentration of purified CXCR4-GST was high enough to be observable with SDS-PAGE using
Coomassie stain (1µg/10µl) and the nature of the fusion protein was verified with Western Blot using
GST-mAb.; showing a significant western blot band at around 70 kDa.
However, around this time the crystal structure of CXCR4 was published. The structure reveals a typical
G-protein coupled motif: a homodimer with an interface including helices V and VI that may be
involved in regulating signaling. The location and shape of the ligand-binding sites are closer to the
extracellular surface and differs from other GPCRs [53]. In addition, professor Saenger was about to
retire from his active research work, so that we decided to discontinue this part of the project.
89
5. Supplemental data
5.1. Purification of CXCR4-GST
At the beginning of my work, purified CXCR4 was needed to do protein interaction assays with gp120
and CD26. The goal was also to crystallize the membrane protein alone or in complex with these
proteins.
5.1.1. Vector design and plasmid purification
For crystal structure analysis of CXCR4, a large amount of purified protein was needed. Since
established expression systems in the lab with CXCR4-GFP and CXCR4-His did not offer sufficient yield
and protein purity, a new protein expression system with a GST-tag was established. For large scale
production of membrane proteins, an insect cells expression system (Sf9 cells) was usually the method
of choice. A GST-tag was inserted at the N-terminal of a CXCR4 expression vector (Fig 5.1.1).
Primer 1: C-HindIII-GST: ATTAACAAGCTTGATCCTGGGGATCCACG (5’-3’)
Primer 2: N-PstI-GST: TATTACTGCAGCGTTCATGTCCCCTATACTAGG (5’-3’)
A: HindIII site A: Thrombin sequence A: PstI site A: GST sequence
Fig 5.1.1. Schematic representation of the expression vector design The GST gene part from a pGEX 4T.2 vector was isolated using two endonucleases (PstI and HindIII) and inserted in a previously established CXCR4 pFast vector
Supplemental data
90
The Bac-to-bac baculovirus system was chosen for expressing the CXCR4-GST protein in Sf9 cells. pGEX
4T2 vector and pFast CXCR4 plasmid were used to construct the new pFast CXCR4-GST plasmid. GST
DNA was isolated from the pGEX 4T2 vector by PCR, and was inserted into the pFast CXCR4 plasmid to
form a pFast-Bac. PstI and HindIII endonuclease sites were introduced to each terminus of the GST
genes (717bp). As expected, the bands around 700bp are visible in the gel (Fig 5.1.2).
Fig 5.1.2. Determination of optimal pGEX 4T2 concentration for PCR pGEX 4T2 vector was used in different concentrations as a template. 1 µl (10µM) of both primers were added to the reaction. The whole PCR process has 30 circles of 30 s 94 °C denaturation, 30 s 55 °C annealing and 150 s elongation. 1: 5000 ng pGEX 4T2; 2: 1000 ng pGEX 4T2; 3: 50 ng pGEX 4T2; 4: 10 ng pGEX 4T2.
Fig 5.1.3. Isolation of pFAST CXCR4-GST DNA Agarose gel of isolated double digested (PstI and HindIII) DNA fragments after ligation of GST and CXCR4. After digestion,
pFast CXCR4 and GST gene fragment could be seen on the gel. 1: pFast CXCR4-GST Clone 5; pFast CXCR4-GST Clone 4; 3: pFast CXCR4-GST Clone 2.
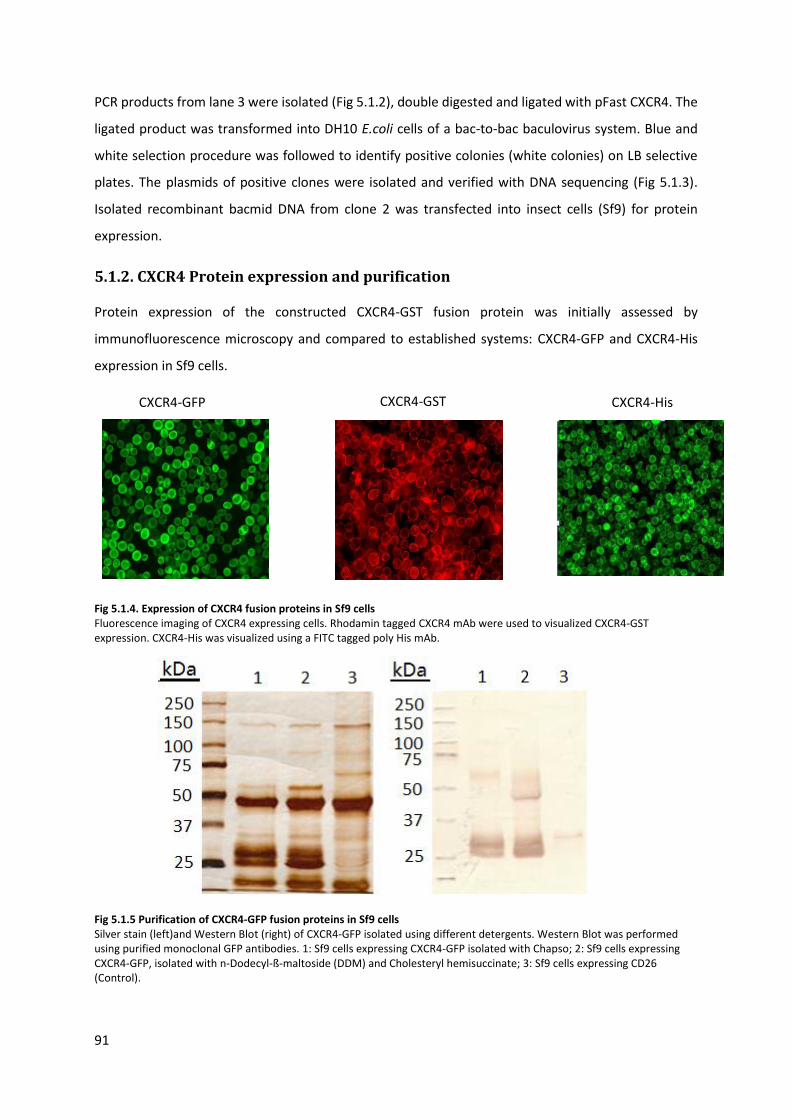
91
PCR products from lane 3 were isolated (Fig 5.1.2), double digested and ligated with pFast CXCR4. The
ligated product was transformed into DH10 E.coli cells of a bac-to-bac baculovirus system. Blue and
white selection procedure was followed to identify positive colonies (white colonies) on LB selective
plates. The plasmids of positive clones were isolated and verified with DNA sequencing (Fig 5.1.3).
Isolated recombinant bacmid DNA from clone 2 was transfected into insect cells (Sf9) for protein
expression.
5.1.2. CXCR4 Protein expression and purification
Protein expression of the constructed CXCR4-GST fusion protein was initially assessed by
immunofluorescence microscopy and compared to established systems: CXCR4-GFP and CXCR4-His
expression in Sf9 cells.
Fig 5.1.4. Expression of CXCR4 fusion proteins in Sf9 cells Fluorescence imaging of CXCR4 expressing cells. Rhodamin tagged CXCR4 mAb were used to visualized CXCR4-GST expression. CXCR4-His was visualized using a FITC tagged poly His mAb.
Fig 5.1.5 Purification of CXCR4-GFP fusion proteins in Sf9 cells Silver stain (left)and Western Blot (right) of CXCR4-GFP isolated using different detergents. Western Blot was performed using purified monoclonal GFP antibodies. 1: Sf9 cells expressing CXCR4-GFP isolated with Chapso; 2: Sf9 cells expressing CXCR4-GFP, isolated with n-Dodecyl-ß-maltoside (DDM) and Cholesteryl hemisuccinate; 3: Sf9 cells expressing CD26 (Control).
CXCR4-His CXCR4-GFP CXCR4-GST
Supplemental data
92
Based on the immunofluorescence image one can see that CXCR4-GST was highly expressed using the
designed vector (Fig 5.1.4). The expression of CXCR4-His was also good in cells, but the yield for CXCR4-
His was very low using Ni-NTA column purification. It was suspected that steric hindrance at the poly-
His site was the major cause for this shortcoming and that bulkier tags will not be affected as much.
Fig 5.1.6. Purification of CXCR4-GST fusion proteins in Sf9 cells Coomassie Stain (left) and Western Blot (right) with purified CXCR4-GST after glutathione affinity chromatography. Western Blot was performed using commercial available anti-GST antibodies. 1: Sf9 cells expressing CD26 (Control); 2: Sf9 cells expressing CXCR4-GST.
Continous effort was put into the optimization of the purification condition for CXCR4-GFP (Fig 5.1.5).
However, the problem remains the relatively low yield of the membrane protein (CXCR4-GFP 67 kDa)
and the availability of working GFP antibodies.
Unfortunately, at this point in the experiment the crystal structure of CXCR4 was first published by
Beili Wu [53], so this part of the project was discontinued.
Fig 5.1.7. CXCR4/IT1t complex structure compared to other GPCR structures. a): the overall fold of the CXCR4-2/IT1t. The receptor is colored blue. The N-terminus, ECL1, ECL2 and ECL3 are highlighted in brown, blue, green and red, respectively. The compound IT1t is shown in a magenta stick representation. The disulfide bonds are yellow. Conserved water molecules (67) are shown as red spheres. b): Comparison of TM helices for CXCR4 (blue), β2AR (PDB ID: 2RH1; yellow), A2AAR (PDB ID: 3EML; green) and rhodopsin (PDB ID: 1U19; pink) [44].
a b
93
5.2 Vector
Figure 5.2.1: pGEX-4T2- vector Arrow indicates the direction of transcription.
Figure 5.2.2: pFastBac1 vector The vector conferred ampicillin, kanamycin, gentamicin, and tetracycline resistance in E. coli. Arrow indicates the direction of transcription.
Supplemental data
94
Figure 5.2.3: pCR™-Blunt Vektor Arrow indicates the direction of transcription.
5.3 Primary peptide sequences
Table 5.3.1 CXCR4-GST
MEGISIYTSDNYTEEMGSGDYDSMKEPCFREENANFNKIFLPTIYSIIFLTGIVGNGLVILVMGYQKKLRSM
TDKYRLHLSVADLLFVITLPFWAVDAVANWYFGNFLCKAVHVIYTVNLYSSVLILAFISLDRYLAIVHATNSQ
RPRKLLAEKVVYVGVWIPALLLTIPDFIFANVSEADDRYICDRFYPNDLWVVVFQFQHIMVGLILPGIVILSC
YCIIISKLSHSKGHQKRKALKTTVILILAFFACWLPYYIGISIDSFILLEIIKQGCEFENTVHKWISITEALAFFHCC
LNPILYAFLGAKFKTSAQHALTSVSRGSSLKILSKGKRGGHSSVSTESESSSFHSSLEPAAFMSPILGYWKIKG
LVQPTRLLLEYLEEKYEEHLYERDEGDKWRNKKFELGLEFPNLPYYIDGDVKLTQSMAIIRYIADKHNMLG
GCPKERAEISMLEGAVLDIRYGVSRIAYSKDFETLKVDFLSKLPEMLKMFEDRLCHKTYLNGDHVTHPDFM
LYDALDVVLYMDPMCLDAFPKLVCFKKRIEAIPQIDKYLKSSKYIAWPLQGWQATFGGGDHPPKSDLVPR
GSPGSSLSRSTRGS
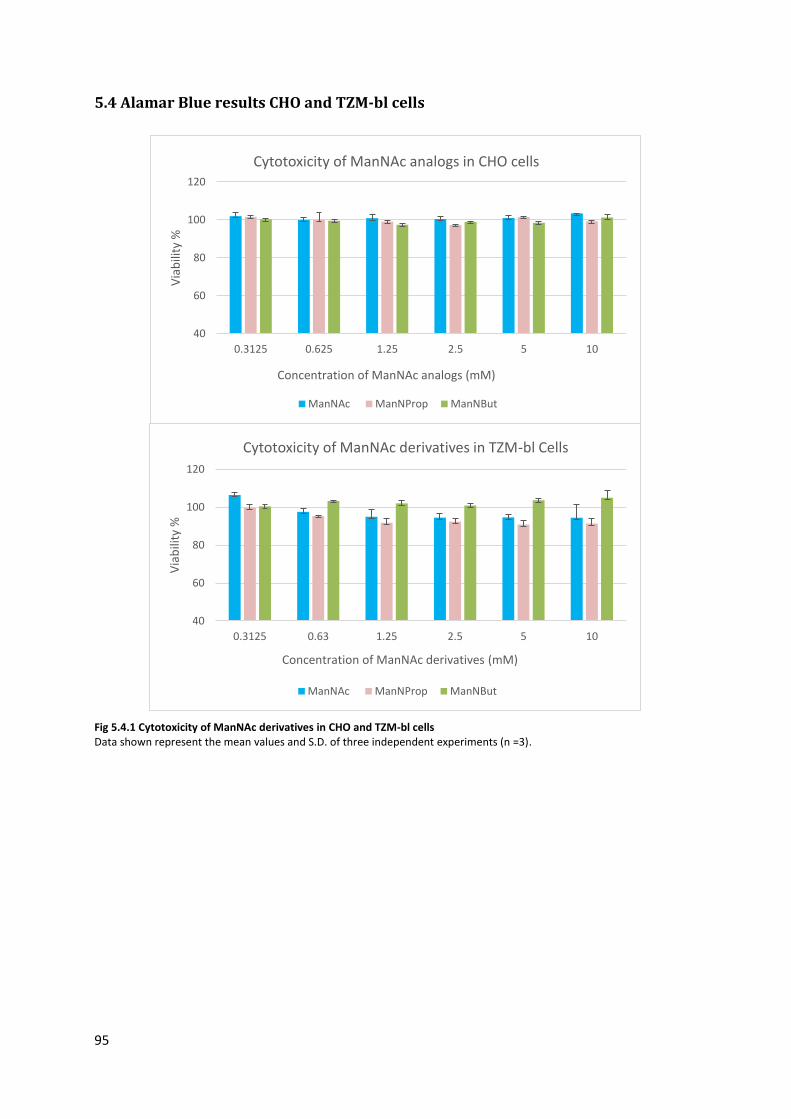
95
5.4 Alamar Blue results CHO and TZM-bl cells
Fig 5.4.1 Cytotoxicity of ManNAc derivatives in CHO and TZM-bl cells Data shown represent the mean values and S.D. of three independent experiments (n =3).
40
60
80
100
120
0.3125 0.63 1.25 2.5 5 10
Via
bili
ty %
Concentration of ManNAc derivatives (mM)
Cytotoxicity of ManNAc derivatives in TZM-bl Cells
ManNAc ManNProp ManNBut
40
60
80
100
120
0.3125 0.625 1.25 2.5 5 10
Via
bili
ty %
Concentration of ManNAc analogs (mM)
Cytotoxicity of ManNAc analogs in CHO cells
ManNAc ManNProp ManNBut
96
6. References
1. Bour, S., R. Geleziunas, and M.A. Wainberg, The human immunodeficiency virus type 1 (HIV-1) CD4 receptor and its central role in promotion of HIV-1 infection. Microbiol Rev, 1995. 59(1): p. 63-93.
2. Miyake, A., et al., Poly-proline motif in HIV-2 Vpx is critical for its efficient translation. Journal of General Virology, 2014. 95(1): p. 179-189.
3. Nyamweya, S., et al., Comparing HIV-1 and HIV-2 infection: Lessons for viral immunopathogenesis. Rev Med Virol, 2013. 23(4): p. 221-40.
4. Okoye, A.A. and L.J. Picker, CD4+ T‐ cell depletion in HIV infection: mechanisms of immunological failure. Immunological reviews, 2013. 254(1): p. 54-64.
5. Piatak Jr, M., et al., High levels of HIV-1 in plasma during all stages of infection determined by competitive PCR. SCIENCE-NEW YORK THEN WASHINGTON-, 1993. 259: p. 1749-1749.
6. Pantaleo, G. and A.S. Fauci, New concepts in the immunopathogenesis of HIV infection. Annual review of immunology, 1995. 13(1): p. 487-512.
7. Karlsson Hedestam, G.B., et al., The challenges of eliciting neutralizing antibodies to HIV-1 and to influenza virus. Nat Rev Microbiol, 2008. 6(2): p. 143-55.
8. Garg, H., J. Mohl, and A. Joshi, HIV-1 induced bystander apoptosis. Viruses, 2012. 4(11): p. 3020-43.
9. McGovern, S.L., et al., A common mechanism underlying promiscuous inhibitors from virtual and high-throughput screening. Journal of medicinal chemistry, 2002. 45(8): p. 1712-1722.
10. Rambaut, A., et al., The causes and consequences of HIV evolution. Nature Reviews Genetics, 2004. 5(1): p. 52-61.
11. Checkley, M.A., B.G. Luttge, and E.O. Freed, HIV-1 envelope glycoprotein biosynthesis, trafficking, and incorporation. Journal of molecular biology, 2011. 410(4): p. 582-608.
12. Wilen, C.B., J.C. Tilton, and R.W. Doms, Molecular mechanisms of HIV entry, in Viral Molecular Machines. 2012, Springer. p. 223-242.
13. Lasky, L.A., et al., Neutralization of the AIDS retrovirus by antibodies to a recombinant envelope glycoprotein. Science, 1986. 233(4760): p. 209-12.
14. Mizuochi, T., et al., Carbohydrate structures of the human-immunodeficiency-virus (HIV) recombinant envelope glycoprotein gp120 produced in Chinese-hamster ovary cells. Biochem J, 1988. 254(2): p. 599-603.
15. Kozarsky, K., et al., Glycosylation and processing of the human immunodeficiency virus type 1 envelope protein. J Acquir Immune Defic Syndr, 1989. 2(2): p. 163-9.
16. Fenouillet, E., J.C. Gluckman, and I.M. Jones, Functions of HIV envelope glycans. Trends Biochem Sci, 1994. 19(2): p. 65-70.
17. Wyatt, R., et al., The antigenic structure of the HIV gp120 envelope glycoprotein. Nature, 1998. 393(6686): p. 705-11.
18. Leonard, C.K., et al., Assignment of intrachain disulfide bonds and characterization of potential glycosylation sites of the type 1 recombinant human immunodeficiency virus envelope glycoprotein (gp120) expressed in Chinese hamster ovary cells. J Biol Chem, 1990. 265(18): p. 10373-82.
19. Starcich, B.R., et al., Identification and characterization of conserved and variable regions in the envelope gene of HTLV-III/LAV, the retrovirus of AIDS. Cell, 1986. 45(5): p. 637-48.
20. Modrow, S., et al., Computer-assisted analysis of envelope protein sequences of seven human immunodeficiency virus isolates: prediction of antigenic epitopes in conserved and variable regions. J Virol, 1987. 61(2): p. 570-8.
21. Wyatt, R., et al., Structure of the core of the HIV-1 gp120 exterior envelope glycoprotein. Human Retroviruses and AIDS 1998, 1998.
22. Kwong, P.D., et al., Structure of an HIV gp120 envelope glycoprotein in complex with the CD4 receptor and a neutralizing human antibody. Nature, 1998. 393(6686): p. 648-59.
97
23. Trkola, A., et al., CD4-dependent, antibody-sensitive interactions between HIV-1 and its co-receptor CCR-5. Nature, 1996. 384(6605): p. 184-7.
24. Wu, L., et al., CD4-induced interaction of primary HIV-1 gp120 glycoproteins with the chemokine receptor CCR-5. Nature, 1996. 384(6605): p. 179-83.
25. Myszka, D.G., et al., Energetics of the HIV gp120-CD4 binding reaction. Proceedings of the National Academy of Sciences, 2000. 97(16): p. 9026-9031.
26. Stamatatos, L., M. Wiskerchen, and C. Cheng-Mayer, Effect of major deletions in the V1 and V2 loops of a macrophage-tropic HIV type 1 isolate on viral envelope structure, cell entry, and replication. AIDS Res Hum Retroviruses, 1998. 14(13): p. 1129-39.
27. Aiamkitsumrit, B., et al., Bioinformatic analysis of HIV-1 entry and pathogenesis. Curr HIV Res, 2014. 12(2): p. 132-61.
28. Ahmad, N., et al., Genetic analysis of human immunodeficiency virus type 1 envelope V3 region isolates from mothers and infants after perinatal transmission. J Virol, 1995. 69(2): p. 1001-12.
29. Briggs, D.R., et al., Envelope V3 amino acid sequence predicts HIV-1 phenotype (co-receptor usage and tropism for macrophages). Aids, 2000. 14(18): p. 2937-2939.
30. Farzan, M., et al., A tyrosine-rich region in the N terminus of CCR5 is important for human immunodeficiency virus type 1 entry and mediates an association between gp120 and CCR5. J Virol, 1998. 72(2): p. 1160-4.
31. Dragic, T., et al., Amino-terminal substitutions in the CCR5 coreceptor impair gp120 binding and human immunodeficiency virus type 1 entry. J Virol, 1998. 72(1): p. 279-85.
32. Rabut, G.E., et al., Alanine substitutions of polar and nonpolar residues in the amino-terminal domain of CCR5 differently impair entry of macrophage- and dualtropic isolates of human immunodeficiency virus type 1. J Virol, 1998. 72(4): p. 3464-8.
33. Stanfield, R., et al., Dual conformations for the HIV-1 gp120 V3 loop in complexes with different neutralizing fabs. Structure, 1999. 7(2): p. 131-42.
34. Sharon, M., et al., Alternative conformations of HIV-1 V3 loops mimic beta hairpins in chemokines, suggesting a mechanism for coreceptor selectivity. Structure, 2003. 11(2): p. 225-36.
35. Cardozo, T., et al., Structural basis for coreceptor selectivity by the HIV type 1 V3 loop. AIDS Res Hum Retroviruses, 2007. 23(3): p. 415-26.
36. Mulinge, M.M., E. Santos da Silva, and D.P. Bercoff, The frantic play of the concealed HIV envelope cytoplasmic tail. 2013.
37. Munro, J.B. and W. Mothes, Structure and dynamics of the native HIV-1 Env trimer. Journal of virology, 2015. 89(11): p. 5752-5755.
38. Melikyan, G.B., et al., Evidence that the transition of HIV-1 gp41 into a six-helix bundle, not the bundle configuration, induces membrane fusion. The Journal of cell biology, 2000. 151(2): p. 413-424.
39. Steckbeck, J.D., et al., Topology of the C-terminal tail of HIV-1 gp41: differential exposure of the Kennedy epitope on cell and viral membranes. PloS one, 2010. 5(12): p. e15261.
40. Maddon, P.J., et al., The isolation and nucleotide sequence of a cDNA encoding the T cell surface protein T4: a new member of the immunoglobulin gene family. Cell, 1985. 42(1): p. 93-104.
41. Dalgleish, A.G., et al., The CD4 (T4) antigen is an essential component of the receptor for the AIDS retrovirus. 1984.
42. Littman, D.R., The CD4 molecule: roles in T lymphocytes and in HIV disease. Vol. 205. 2012: Springer Science & Business Media.
43. Baggiolini, M., B. Dewald, and B. Moser, Human chemokines: an update. Annu Rev Immunol, 1997. 15: p. 675-705.
44. Wu, B., et al., Structures of the CXCR4 chemokine GPCR with small-molecule and cyclic peptide antagonists. Science, 2010. 330(6007): p. 1066-1071.
45. Dragic, T., An overview of the determinants of CCR5 and CXCR4 co-receptor function. Journal of General Virology, 2001. 82(8): p. 1807-1814.
References
98
46. Maekawa, T. and T. Ishii, Chemokine/receptor dynamics in the regulation of hematopoiesis. Internal medicine, 2000. 39(2): p. 90-100.
47. Nagasawa, T., et al., Defects of B-cell lymphopoiesis and bone-marrow myelopoiesis in mice lacking the CXC chemokine PBSF/SDF-1. Nature, 1996. 382(6592): p. 635.
48. Tachibana, K., et al., The chemokine receptor CXCR4 is essential for vascularization of the gastrointestinal tract. Nature, 1998. 393(6685): p. 591-594.
49. Zou, Y.-R., et al., Function of the chemokine receptor CXCR4 in haematopoiesis and in cerebellar development. Nature, 1998. 393(6685): p. 595-599.
50. McGrath, K.E., et al., Embryonic expression and function of the chemokine SDF-1 and its receptor, CXCR4. Developmental biology, 1999. 213(2): p. 442-456.
51. Lu, M., E.A. Grove, and R.J. Miller, Abnormal development of the hippocampal dentate gyrus in mice lacking the CXCR4 chemokine receptor. Proceedings of the National Academy of Sciences, 2002. 99(10): p. 7090-7095.
52. Burger, J.A. and T.J. Kipps, CXCR4: a key receptor in the crosstalk between tumor cells and their microenvironment. Blood, 2006. 107(5): p. 1761-1767.
53. Wu, B., et al., Structures of the CXCR4 chemokine GPCR with small-molecule and cyclic peptide antagonists. Science, 2010. 330(6007): p. 1066-71.
54. De Clercq, E., The bicyclam AMD3100 story. Nature Reviews Drug Discovery, 2003. 2(7): p. 581-587.
55. Picard, L., et al., Role of the amino-terminal extracellular domain of CXCR-4 in human immunodeficiency virus type 1 entry. Virology, 1997. 231(1): p. 105-11.
56. Brelot, A., et al., Role of the first and third extracellular domains of CXCR-4 in human immunodeficiency virus coreceptor activity. J Virol, 1997. 71(6): p. 4744-51.
57. Brelot, A., et al., Identification of residues of CXCR4 critical for human immunodeficiency virus coreceptor and chemokine receptor activities. J Biol Chem, 2000. 275(31): p. 23736-44.
58. Rao, Z., et al., Crystal structure of SIV matrix antigen and implications for virus assembly. Nature, 1995. 378(6558): p. 743-7.
59. Chabot, D.J., et al., N-linked glycosylation of CXCR4 masks coreceptor function for CCR5-dependent human immunodeficiency virus type 1 isolates. J Virol, 2000. 74(9): p. 4404-13.
60. Lapham, C.K., et al., Evidence for cell-surface association between fusin and the CD4-gp120 complex in human cell lines. Science, 1996. 274(5287): p. 602.
61. Sorce, S., R. Myburgh, and K.-H. Krause, The chemokine receptor CCR5 in the central nervous system. Progress in neurobiology, 2011. 93(2): p. 297-311.
62. Vasto, S., et al., Inflammatory networks in ageing, age-related diseases and longevity. Mechanisms of ageing and development, 2007. 128(1): p. 83-91.
63. Berger, E.A., P.M. Murphy, and J.M. Farber, Chemokine receptors as HIV-1 coreceptors: roles in viral entry, tropism, and disease. Annual review of immunology, 1999. 17(1): p. 657-700.
64. Zheng, Y., et al., Structure of CC Chemokine Receptor 5 with a Potent Chemokine Antagonist Reveals Mechanisms of Chemokine Recognition and Molecular Mimicry by HIV. Immunity, 2017. 46(6): p. 1005-1017. e5.
65. Alkhatib, G., The biology of CCR5 and CXCR4. Curr Opin HIV AIDS, 2009. 4(2): p. 96-103. 66. O'Brien, T.R., et al., HIV-1 infection in a man homozygous for CCR5 delta 32. Lancet, 1997.
349(9060): p. 1219. 67. Rucker, J., et al., Regions in beta-chemokine receptors CCR5 and CCR2b that determine HIV-1
cofactor specificity. Cell, 1996. 87(3): p. 437-46. 68. Farzan, M., et al., Tyrosine sulfation of the amino terminus of CCR5 facilitates HIV-1 entry. Cell,
1999. 96(5): p. 667-76. 69. Tsibris, A., Update on CCR5 inhibitors: scientific rationale, clinical evidence, and anticipated
uses. PRN Notebook, 2007. 12. 70. Lifson, J.D., et al., AIDS retrovirus induced cytopathology: giant cell formation and involvement
of CD4 antigen. Science, 1986. 232: p. 1123-1128.
99
71. Jin, J., N. Sherer, and W. Mothes, Surface transmission or polarized egress? Lessons learned from HTLV cell-to-cell transmission. Viruses, 2010. 2(2): p. 601-605.
72. Jolly, C., et al., HIV-1 cell to cell transfer across an Env-induced, actin-dependent synapse. Journal of Experimental Medicine, 2004. 199(2): p. 283-293.
73. Pique, C. and K.S. Jones, Pathways of cell-cell transmission of HTLV-1. Frontiers in microbiology, 2012. 3.
74. Murooka, T.T., R.R. Sharaf, and T.R. Mempel, Large syncytia in lymph nodes induced by CCR5-tropic HIV-1. AIDS research and human retroviruses, 2015. 31(5): p. 471-472.
75. Koenig, S. and A.S. Fauci, Detection of AIDS virus in macrophages in brain tissue from AIDS patients with encephalopathy. Science, 1986. 233: p. 1089-1094.
76. Pumarola‐Sune, T., et al., HIV antigen in the brains of patients with the AIDS dementia complex. Annals of neurology, 1987. 21(5): p. 490-496.
77. Harbison, C., et al., Giant cell encephalitis and microglial infection with mucosally transmitted simian-human immunodeficiency virus SHIVSF162P3N in rhesus macaques. Journal of neurovirology, 2014. 20(1): p. 62-72.
78. Rinfret, A., et al., Human immunodeficiency virus-infected multinucleated histiocytes in oropharyngeal lymphoid tissues from two asymptomatic patients. The American journal of pathology, 1991. 138(2): p. 421.
79. Frankel, S.S., et al., Replication of HIV-1 in dendritic cell-derived syncytia at the mucosal surface of the adenoid. Science, 1996. 272(5258): p. 115.
80. Lewin-Smith, M., S.M. Wahl, and J.M. Orenstein, Human immunodeficiency virus-rich multinucleated giant cells in the colon: a case report with transmission electron microscopy, immunohistochemistry, and in situ hybridization. Modern pathology: an official journal of the United States and Canadian Academy of Pathology, Inc, 1999. 12(1): p. 75-81.
81. Dargent, J.-L., et al., HIV-associated multinucleated giant cells in lymphoid tissue of the Waldeyer's ring: a detailed study. Modern Pathology, 2000. 13(12): p. 1293-1299.
82. Frankel, S.S., et al., Active replication of HIV-1 at the lymphoepithelial surface of the tonsil. The American journal of pathology, 1997. 151(1): p. 89.
83. Kapadia, S.B., et al., HIV-associated Waldeyer's ring lymphoid hyperplasias: Characterization of multinucleated giant cells and the role of Epstein-Barr virus. Human pathology, 1999. 30(11): p. 1383-1388.
84. Orenstein, J.M., In vivo cytolysis and fusion of human immunodeficiency virus type 1-infected lymphocytes in lymphoid tissue. Journal of Infectious Diseases, 2000. 182(1): p. 338-342.
85. Murooka, T.T., et al., HIV-infected T cells are migratory vehicles for viral dissemination. Nature, 2012. 490(7419): p. 283.
86. Symeonides, M., et al., HIV-1-induced small T cell syncytia can transfer virus particles to target cells through transient contacts. Viruses, 2015. 7(12): p. 6590-6603.
87. Law, K.M., et al., In vivo HIV-1 cell-to-cell transmission promotes multicopy micro-compartmentalized Infection. Cell reports, 2016. 15(12): p. 2771-2783.
88. Titanji, B.K., et al., Protease inhibitors effectively block cell-to-cell spread of HIV-1 between T cells. Retrovirology, 2013. 10(1): p. 161.
89. Sattentau, Q., Avoiding the void: cell-to-cell spread of human viruses. Nature Reviews Microbiology, 2008. 6(11): p. 815-826.
90. Ferri, K., et al., Apoptosis and karyogamy in syncytia induced by the HIV-1-envelope glycoprotein complex. Cell death and differentiation, 2000. 7: p. 1137-1139.
91. Stanley, P., H. Schachter, and N. Taniguchi, Essentials of glycobiology. Varki, A, 2009. 92. Stanley, P., H. Schachter, and N. Taniguchi, N-Glycans, in Essentials of Glycobiology, A. Varki,
et al., Editors. 2009: Cold Spring Harbor (NY). 93. Gristick, H.B., et al., Natively glycosylated HIV-1 Env structure reveals new mode for antibody
recognition of the CD4-binding site. Nature Structural & Molecular Biology, 2016.
References
100
94. Zhang, M., et al., Tracking global patterns of N-linked glycosylation site variation in highly variable viral glycoproteins: HIV, SIV, and HCV envelopes and influenza hemagglutinin. Glycobiology, 2004. 14(12): p. 1229-1246.
95. Travers, S.A., Conservation, compensation, and evolution of N-linked glycans in the HIV-1 group M subtypes and circulating recombinant forms. Isrn Aids, 2012. 2012.
96. Liu, Y., et al., Env length and N-linked glycosylation following transmission of human immunodeficiency virus Type 1 subtype B viruses. Virology, 2008. 374(2): p. 229-33.
97. Li, Y., et al., Glycosylation is necessary for the correct folding of human immunodeficiency virus gp120 in CD4 binding. J Virol, 1993. 67(1): p. 584-8.
98. Land, A. and I. Braakman, Folding of the human immunodeficiency virus type 1 envelope glycoprotein in the endoplasmic reticulum. Biochimie, 2001. 83(8): p. 783-90.
99. Geijtenbeek, T.B. and Y. van Kooyk, DC-SIGN: a novel HIV receptor on DCs that mediates HIV-1 transmission. Curr Top Microbiol Immunol, 2003. 276: p. 31-54.
100. Chohan, B., et al., Selection for human immunodeficiency virus type 1 envelope glycosylation variants with shorter V1-V2 loop sequences occurs during transmission of certain genetic subtypes and may impact viral RNA levels. J Virol, 2005. 79(10): p. 6528-31.
101. Doores, K.J., The HIV glycan shield as a target for broadly neutralizing antibodies. FEBS J, 2015. 282(24): p. 4679-91.
102. Reitter, J.N., R.E. Means, and R.C. Desrosiers, A role for carbohydrates in immune evasion in AIDS. Nat Med, 1998. 4(6): p. 679-84.
103. McCaffrey, R.A., et al., N-linked glycosylation of the V3 loop and the immunologically silent face of gp120 protects human immunodeficiency virus type 1 SF162 from neutralization by anti-gp120 and anti-gp41 antibodies. J Virol, 2004. 78(7): p. 3279-95.
104. Montefiori, D.C., W.E. Robinson, and W.M. Mitchell, Role of protein N-glycosylation in pathogenesis of human immunodeficiency virus type 1. Proceedings of the National Academy of Sciences, 1988. 85(23): p. 9248-9252.
105. Binley, J.M., et al., Role of complex carbohydrates in human immunodeficiency virus type 1 infection and resistance to antibody neutralization. J Virol, 2010. 84(11): p. 5637-55.
106. Eggink, D., et al., Lack of complex N-glycans on HIV-1 envelope glycoproteins preserves protein conformation and entry function. Virology, 2010. 401(2): p. 236-247.
107. Shen, R., et al., HIV-1 envelope glycan moieties modulate HIV-1 transmission. Journal of virology, 2014. 88(24): p. 14258-14267.
108. Varki, A., Sialic acids in human health and disease. Trends in molecular medicine, 2008. 14(8): p. 351-360.
109. Varki, A., Since there are PAMPs and DAMPs, there must be SAMPs? Glycan "self-associated molecular patterns" dampen innate immunity, but pathogens can mimic them. Glycobiology, 2011. 21(9): p. 1121-4.
110. Schauer, R., Sialic acids as regulators of molecular and cellular interactions. Curr Opin Struct Biol, 2009. 19(5): p. 507-14.
111. Varki, A. and R. Schauer, Sialic Acids, in Essentials of Glycobiology, A. Varki, et al., Editors. 2009: Cold Spring Harbor (NY).
112. Varki, A., Sialic acids in human health and disease. Trends Mol Med, 2008. 14(8): p. 351-60. 113. Du, J., et al., Metabolic glycoengineering: sialic acid and beyond. Glycobiology, 2009. 19(12): p.
1382-401. 114. Varki, A. and P. Gagneux, Multifarious roles of sialic acids in immunity. Ann N Y Acad Sci, 2012.
1253: p. 16-36. 115. Herrmann, M., et al., Consequences of a subtle sialic acid modification on the murine
polyomavirus receptor. J Virol, 1997. 71(8): p. 5922-31. 116. Hinderlich, S., et al., A bifunctional enzyme catalyzes the first two steps in N-acetylneuraminic
acid biosynthesis of rat liver. Purification and characterization of UDP-N-acetylglucosamine 2-epimerase/N-acetylmannosamine kinase. J Biol Chem, 1997. 272(39): p. 24313-8.
101
117. Roda, R.H., et al., Neurologic syndrome associated with homozygous mutation at MAG sialic acid binding site. Ann Clin Transl Neurol, 2016. 3(8): p. 650-4.
118. Thornton, D.J., K. Rousseau, and M.A. McGuckin, Structure and function of the polymeric mucins in airways mucus. Annu Rev Physiol, 2008. 70: p. 459-86.
119. Deplancke, B. and H.R. Gaskins, Microbial modulation of innate defense: goblet cells and the intestinal mucus layer. Am J Clin Nutr, 2001. 73(6): p. 1131S-1141S.
120. Knowles, M.R. and R.C. Boucher, Mucus clearance as a primary innate defense mechanism for mammalian airways. J Clin Invest, 2002. 109(5): p. 571-7.
121. Ferreira, V.P., M.K. Pangburn, and C. Cortes, Complement control protein factor H: the good, the bad, and the inadequate. Mol Immunol, 2010. 47(13): p. 2187-97.
122. Nydegger, U.E., D.T. Fearon, and K.F. Austen, Autosomal locus regulates inverse relationship between sialic acid content and capacity of mouse erythrocytes to activate human alternative complement pathway. Proc Natl Acad Sci U S A, 1978. 75(12): p. 6078-82.
123. Schauer, R., et al., O-Acetylated sialic acids and their role in immune defense. Adv Exp Med Biol, 2011. 705: p. 525-48.
124. Arming, S., et al., The human Cas1 protein: a sialic acid-specific O-acetyltransferase? Glycobiology, 2011. 21(5): p. 553-64.
125. Kopp, A., et al., Factor h: a complement regulator in health and disease, and a mediator of cellular interactions. Biomolecules, 2012. 2(1): p. 46-75.
126. Honore, C., et al., Tethering of Ficolin-1 to cell surfaces through recognition of sialic acid by the fibrinogen-like domain. J Leukoc Biol, 2010. 88(1): p. 145-58.
127. Kjaer, T.R., et al., Investigations on the pattern recognition molecule M-ficolin: quantitative aspects of bacterial binding and leukocyte association. J Leukoc Biol, 2011. 90(3): p. 425-37.
128. McEver, R.P., Selectins: novel receptors that mediate leukocyte adhesion during inflammation. Thromb Haemost, 1991. 65(3): p. 223-8.
129. Cummings, R.D. and D.F. Smith, The selectin family of carbohydrate-binding proteins: structure and importance of carbohydrate ligands for cell adhesion. Bioessays, 1992. 14(12): p. 849-56.
130. Zhou, Q., et al., The selectin GMP-140 binds to sialylated, fucosylated lactosaminoglycans on both myeloid and nonmyeloid cells. J Cell Biol, 1991. 115(2): p. 557-64.
131. Tyrrell, D., et al., Structural requirements for the carbohydrate ligand of E-selectin. Proc Natl Acad Sci U S A, 1991. 88(22): p. 10372-6.
132. Handa, K., et al., Selectin GMP-140 (CD62; PADGEM) binds to sialosyl-Le(a) and sialosyl-Le(x), and sulfated glycans modulate this binding. Biochem Biophys Res Commun, 1991. 181(3): p. 1223-30.
133. Berg, E.L., et al., Comparison of L-selectin and E-selectin ligand specificities: the L-selectin can bind the E-selectin ligands sialyl Le(x) and sialyl Le(a). Biochem Biophys Res Commun, 1992. 184(2): p. 1048-55.
134. Foxall, C., et al., The three members of the selectin receptor family recognize a common carbohydrate epitope, the sialyl Lewis(x) oligosaccharide. J Cell Biol, 1992. 117(4): p. 895-902.
135. Moore, K.L., et al., Identification of a specific glycoprotein ligand for P-selectin (CD62) on myeloid cells. J Cell Biol, 1992. 118(2): p. 445-56.
136. Larkin, M., et al., Spectrum of sialylated and nonsialylated fuco-oligosaccharides bound by the endothelial-leukocyte adhesion molecule E-selectin. Dependence of the carbohydrate binding activity on E-selectin density. J Biol Chem, 1992. 267(19): p. 13661-8.
137. Norgard-Sumnicht, K.E., N.M. Varki, and A. Varki, Calcium-dependent heparin-like ligands for L-selectin in nonlymphoid endothelial cells. Science, 1993. 261(5120): p. 480-3.
138. Nelson, R.M., et al., Heparin oligosaccharides bind L- and P-selectin and inhibit acute inflammation. Blood, 1993. 82(11): p. 3253-8.
139. Powell, L.D. and A. Varki, I-type lectins. J Biol Chem, 1995. 270(24): p. 14243-6. 140. Collins, B.E., et al., High-affinity ligand probes of CD22 overcome the threshold set by cis ligands
to allow for binding, endocytosis, and killing of B cells. J Immunol, 2006. 177(5): p. 2994-3003.
References
102
141. Mahajan, V.S. and S. Pillai, Sialic acids and autoimmune disease. Immunol Rev, 2016. 269(1): p. 145-61.
142. Cariappa, A., et al., B cell antigen receptor signal strength and peripheral B cell development are regulated by a 9-O-acetyl sialic acid esterase. J Exp Med, 2009. 206(1): p. 125-38.
143. Pillai, S., A. Cariappa, and S.P. Pirnie, Esterases and autoimmunity: the sialic acid acetylesterase pathway and the regulation of peripheral B cell tolerance. Trends Immunol, 2009. 30(10): p. 488-93.
144. Kaneko, Y., F. Nimmerjahn, and J.V. Ravetch, Anti-inflammatory activity of immunoglobulin G resulting from Fc sialylation. Science, 2006. 313(5787): p. 670-3.
145. Anthony, R.M. and J.V. Ravetch, A novel role for the IgG Fc glycan: the anti-inflammatory activity of sialylated IgG Fcs. J Clin Immunol, 2010. 30 Suppl 1: p. S9-14.
146. Anthony, R.M., et al., Intravenous gammaglobulin suppresses inflammation through a novel T(H)2 pathway. Nature, 2011. 475(7354): p. 110-3.
147. Stevens, J., et al., Glycan microarray analysis of the hemagglutinins from modern and pandemic influenza viruses reveals different receptor specificities. J Mol Biol, 2006. 355(5): p. 1143-55.
148. Xiong, X., et al., Receptor binding by a ferret-transmissible H5 avian influenza virus. Nature, 2013. 497(7449): p. 392-6.
149. Xiong, X., et al., Receptor binding by an H7N9 influenza virus from humans. Nature, 2013. 499(7459): p. 496-9.
150. Gulati, S., et al., Human H3N2 Influenza Viruses Isolated from 1968 To 2012 Show Varying Preference for Receptor Substructures with No Apparent Consequences for Disease or Spread. PLoS One, 2013. 8(6): p. e66325.
151. Crusat, M., et al., Changes in the hemagglutinin of H5N1 viruses during human infection--influence on receptor binding. Virology, 2013. 447(1-2): p. 326-37.
152. Wessels, M.R., et al., Immunogenicity in animals of a polysaccharide-protein conjugate vaccine against type III group B Streptococcus. J Clin Invest, 1990. 86(5): p. 1428-33.
153. Carlin, A.F., et al., Molecular mimicry of host sialylated glycans allows a bacterial pathogen to engage neutrophil Siglec-9 and dampen the innate immune response. Blood, 2009. 113(14): p. 3333-6.
154. Izquierdo-Useros, N., et al., HIV-1 capture and transmission by dendritic cells: the role of viral glycolipids and the cellular receptor Siglec-1. PLoS Pathog, 2014. 10(7): p. e1004146.
155. Izquierdo-Useros, N., et al., Capture and transfer of HIV-1 particles by mature dendritic cells converges with the exosome-dissemination pathway. Blood, 2009. 113(12): p. 2732-41.
156. Granelli-Piperno, A., et al., Immature dendritic cells selectively replicate macrophagetropic (M-tropic) human immunodeficiency virus type 1, while mature cells efficiently transmit both M- and T-tropic virus to T cells. J Virol, 1998. 72(4): p. 2733-7.
157. Sanders, R.W., et al., Differential transmission of human immunodeficiency virus type 1 by distinct subsets of effector dendritic cells. J Virol, 2002. 76(15): p. 7812-21.
158. McDonald, D., et al., Recruitment of HIV and its receptors to dendritic cell-T cell junctions. Science, 2003. 300(5623): p. 1295-7.
159. Geijtenbeek, T.B., et al., DC-SIGN, a dendritic cell-specific HIV-1-binding protein that enhances trans-infection of T cells. Cell, 2000. 100(5): p. 587-97.
160. Lewis, A.L., et al., Innovations in host and microbial sialic acid biosynthesis revealed by phylogenomic prediction of nonulosonic acid structure. Proc Natl Acad Sci U S A, 2009. 106(32): p. 13552-7.
161. Schoenhofen, I.C., et al., The CMP-legionaminic acid pathway in Campylobacter: biosynthesis involving novel GDP-linked precursors. Glycobiology, 2009. 19(7): p. 715-25.
162. Schoenhofen, I.C., et al., Elucidation of the CMP-pseudaminic acid pathway in Helicobacter pylori: synthesis from UDP-N-acetylglucosamine by a single enzymatic reaction. Glycobiology, 2006. 16(9): p. 8C-14C.
163. Wratil, P.R., R. Horstkorte, and W. Reutter, Metabolic Glycoengineering with N-Acyl Side Chain Modified Mannosamines. Angew Chem Int Ed Engl, 2016. 55(33): p. 9482-512.
103
164. Willems, A.P., B.G. van Engelen, and D.J. Lefeber, Genetic defects in the hexosamine and sialic acid biosynthesis pathway. Biochim Biophys Acta, 2016. 1860(8): p. 1640-54.
165. Keppler, O.T., et al., UDP-GlcNAc 2-epimerase: a regulator of cell surface sialylation. Science, 1999. 284(5418): p. 1372-6.
166. Roseman, S., et al., Enzymatic synthesis of sialic acid 9-phosphates. Proc Natl Acad Sci U S A, 1961. 47: p. 958-61.
167. Hao, J., et al., Cloning, expression, and characterization of sialic acid synthases. Biochem Biophys Res Commun, 2005. 338(3): p. 1507-14.
168. Hinderlich, S., et al., UDP-GlcNAc 2-epimerase/ManNAc kinase (GNE): a master regulator of sialic acid synthesis, in SialoGlyco Chemistry and Biology I. 2013, Springer. p. 97-137.
169. Eckhardt, M., et al., Expression cloning of the Golgi CMP-sialic acid transporter. Proc Natl Acad Sci U S A, 1996. 93(15): p. 7572-6.
170. Eckhardt, M., B. Gotza, and R. Gerardy-Schahn, Membrane topology of the mammalian CMP-sialic acid transporter. J Biol Chem, 1999. 274(13): p. 8779-87.
171. Harduin-Lepers, A., et al., The human sialyltransferase family. Biochimie, 2001. 83(8): p. 727-37.
172. Tian, S., et al., Distinct functional sites for human immunodeficiency virus type 1 and stromal cell-derived factor 1alpha on CXCR4 transmembrane helical domains. J Virol, 2005. 79(20): p. 12667-73.
173. Tangvoranuntakul, P., et al., Human uptake and incorporation of an immunogenic nonhuman dietary sialic acid. Proc Natl Acad Sci U S A, 2003. 100(21): p. 12045-50.
174. Stehling, P., et al., In vivo modulation of the acidic N-glycans from rat liver dipeptidyl peptidase IV by N-propanoyl-D-mannosamine. Biochem Biophys Res Commun, 1999. 263(1): p. 76-80.
175. Bateman, L.A., et al., N-Propargyloxycarbamate monosaccharides as metabolic chemical reporters of carbohydrate salvage pathways and protein glycosylation. Chem Commun (Camb), 2013. 49(39): p. 4328-30.
176. Kayser, H., et al., Incorporation of N-acyl-2-amino-2-deoxy-hexoses into glycosphingolipids of the pheochromocytoma cell line PC 12. FEBS Lett, 1992. 301(2): p. 137-40.
177. Kayser, H., et al., Biosynthesis of a nonphysiological sialic acid in different rat organs, using N-propanoyl-D-hexosamines as precursors. J Biol Chem, 1992. 267(24): p. 16934-8.
178. Kayser, H., et al., New amino sugar analogues are incorporated at different rates into glycoproteins of mouse organs. Experientia, 1993. 49(10): p. 885-7.
179. Keppler, O.T., et al., Biosynthetic modulation of sialic acid-dependent virus-receptor interactions of two primate polyoma viruses. J Biol Chem, 1995. 270(3): p. 1308-14.
180. Keppler, O.T., et al., Elongation of the N-acyl side chain of sialic acids in MDCK II cells inhibits influenza A virus infection. Biochem Biophys Res Commun, 1998. 253(2): p. 437-42.
181. Wieser, J.R., et al., In vivo modulated N-acyl side chain of N-acetylneuraminic acid modulates the cell contact-dependent inhibition of growth. FEBS Lett, 1996. 395(2-3): p. 170-3.
182. Schmidt, C., et al., Biochemical engineering of neural cell surfaces by the synthetic N-propanoyl-substituted neuraminic acid precursor. J Biol Chem, 1998. 273(30): p. 19146-52.
183. Collins, B.E., et al., Conversion of cellular sialic acid expression from N-acetyl- to N-glycolylneuraminic acid using a synthetic precursor, N-glycolylmannosamine pentaacetate: inhibition of myelin-associated glycoprotein binding to neural cells. Glycobiology, 2000. 10(1): p. 11-20.
184. Wu, J. and Z. Guo, Improving the antigenicity of sTn antigen by modification of its sialic acid residue for development of glycoconjugate cancer vaccines. Bioconjug Chem, 2006. 17(6): p. 1537-44.
185. Jacobs, C.L., et al., Substrate specificity of the sialic acid biosynthetic pathway. Biochemistry, 2001. 40(43): p. 12864-74.
186. Oetke, C., et al., Evidence for efficient uptake and incorporation of sialic acid by eukaryotic cells. Eur J Biochem, 2001. 268(16): p. 4553-61.
References
104
187. Bardor, M., et al., Mechanism of uptake and incorporation of the non-human sialic acid N-glycolylneuraminic acid into human cells. J Biol Chem, 2005. 280(6): p. 4228-37.
188. Gross, H.J., Fluorescent CMP-sialic acids as a tool to study the specificity of the CMP-sialic acid carrier and the glycoconjugate sialylation in permeabilized cells. Eur J Biochem, 1992. 203(1-2): p. 269-75.
189. Brossmer, R. and H.J. Gross, Fluorescent and photoactivatable sialic acids. Methods Enzymol, 1994. 247: p. 177-93.
190. Burness, A.T. and I.U. Pardoe, Effect of enzymes on the attachment of influenza and encephalomyocarditis viruses to erythrocytes. J Gen Virol, 1981. 55(Pt 2): p. 275-88.
191. Herrler, G., et al., Use of a sialic acid analogue to analyze the importance of the receptor-destroying enzyme for the interaction of influenza C virus with cells. Acta Histochem Suppl, 1990. 40: p. 39-41.
192. Kelm, S., et al., Use of sialic acid analogues to define functional groups involved in binding to the influenza virus hemagglutinin. Eur J Biochem, 1992. 205(1): p. 147-53.
193. Dridi, L., et al., Positive regulation of insulin signaling by neuraminidase 1. Diabetes, 2013. 62(7): p. 2338-46.
194. Grewal, P.K., The Ashwell-Morell receptor. Methods Enzymol, 2010. 479: p. 223-41. 195. Chen, S. and M. Fukuda, Cell type-specific roles of carbohydrates in tumor metastasis. Methods
Enzymol, 2006. 416: p. 371-80. 196. Samraj, A.N., et al., Corrigendum: involvement of a non-human sialic Acid in human cancer.
Front Oncol, 2014. 4: p. 83. 197. Chefalo, P., et al., Efficient metabolic engineering of GM3 on tumor cells by N-phenylacetyl-D-
mannosamine. Biochemistry, 2006. 45(11): p. 3733-9. 198. Qiu, L., et al., A novel cancer immunotherapy based on the combination of a synthetic
carbohydrate-pulsed dendritic cell vaccine and glycoengineered cancer cells. Oncotarget, 2015. 6(7): p. 5195-203.
199. Michalides, R., et al., Ncam and Lung-Cancer. International Journal of Cancer, 1994: p. 34-37. 200. Scheidegger, E.P., et al., In vitro and in vivo growth of clonal sublines of human small cell lung
carcinoma is modulated by polysialic acid of the neural cell adhesion molecule. Lab Invest, 1994. 70(1): p. 95-106.
201. Daniel, L., et al., A nude mice model of human rhabdomyosarcoma lung metastases for evaluating the role of polysialic acids in the metastatic process. Oncogene, 2001. 20(8): p. 997-1004.
202. Kloos, A., et al., PolySia-Specific Retargeting of Oncolytic Viruses Triggers Tumor-Specific Immune Responses and Facilitates Therapy of Disseminated Lung Cancer. Cancer Immunol Res, 2015. 3(7): p. 751-63.
203. Liu, T., et al., Biochemical engineering of surface alpha 2-8 polysialic acid for immunotargeting tumor cells. J Biol Chem, 2000. 275(42): p. 32832-6.
204. Xiong, H., et al., N-Propionyl polysialic acid precursor enhances the susceptibility of multiple myeloma to antitumor effect of anti-NprPSA monoclonal antibody. Acta Pharmacol Sin, 2012. 33(12): p. 1557-62.
205. Gnanapragassam, V.S., et al., Sialic acid metabolic engineering: a potential strategy for the neuroblastoma therapy. PLoS One, 2014. 9(8): p. e105403.
206. Wang-Gillam, A., I. Pastuszak, and A.D. Elbein, A 17-amino acid insert changes UDP-N-acetylhexosamine pyrophosphorylase specificity from UDP-GalNAc to UDP-GlcNAc. J Biol Chem, 1998. 273(42): p. 27055-7.
207. Wang, B. and J. Brand-Miller, The role and potential of sialic acid in human nutrition. Eur J Clin Nutr, 2003. 57(11): p. 1351-69.
208. Schnaar, R.L., Glycolipid-mediated cell-cell recognition in inflammation and nerve regeneration. Arch Biochem Biophys, 2004. 426(2): p. 163-72.
209. Li, Y.T., et al., Presence of an unusual GM2 derivative, taurine-conjugated GM2, in Tay-Sachs brain. J Biol Chem, 2003. 278(37): p. 35286-91.
105
210. Strehle, E.M., Sialic acid storage disease and related disorders. Genet Test, 2003. 7(2): p. 113-21.
211. Schnaar, R.L., R. Gerardy-Schahn, and H. Hildebrandt, Sialic acids in the brain: gangliosides and polysialic acid in nervous system development, stability, disease, and regeneration. Physiol Rev, 2014. 94(2): p. 461-518.
212. Schmidt, C., et al., Incorporation of N-propanoylneuraminic acid leads to calcium oscillations in oligodendrocytes upon the application of GABA. FEBS Lett, 2000. 478(3): p. 276-80.
213. Brooks, N.L., M.J. Corey, and R.A. Schwalbe, Characterization of N-glycosylation consensus sequences in the Kv3.1 channel. FEBS J, 2006. 273(14): p. 3287-300.
214. Cartwright, T.A., M.J. Corey, and R.A. Schwalbe, Complex oligosaccharides are N-linked to Kv3 voltage-gated K+ channels in rat brain. Biochim Biophys Acta, 2007. 1770(4): p. 666-71.
215. Hall, M.K., et al., Biochemical engineering of the N-acyl side chain of sialic acids alters the kinetics of a glycosylated potassium channel Kv3.1. FEBS Lett, 2011. 585(20): p. 3322-7.
216. Buttner, B., et al., Biochemical engineering of cell surface sialic acids stimulates axonal growth. J Neurosci, 2002. 22(20): p. 8869-75.
217. Kontou, M., et al., Sialic acid metabolism is involved in the regulation of gene expression during neuronal differentiation of PC12 cells. Glycoconj J, 2008. 25(3): p. 237-44.
218. Koulaxouzidis, G., et al., In vivo stimulation of early peripheral axon regeneration by N-propionylmannosamine in the presence of polysialyltransferase ST8SIA2. J Neural Transm (Vienna), 2015. 122(9): p. 1211-9.
219. Witzel, C., et al., N-Propionylmannosamine stimulates axonal elongation in a murine model of sciatic nerve injury. Neural Regen Res, 2015. 10(6): p. 976-81.
220. Bull, C., et al., Sialic Acid Mimetics to Target the Sialic Acid-Siglec Axis. Trends Biochem Sci, 2016. 41(6): p. 519-31.
221. Bax, M., et al., Dendritic cell maturation results in pronounced changes in glycan expression affecting recognition by siglecs and galectins. J Immunol, 2007. 179(12): p. 8216-24.
222. Cowing, C. and J.M. Chapdelaine, T cells discriminate between Ia antigens expressed on allogeneic accessory cells and B cells: a potential function for carbohydrate side chains on Ia molecules. Proc Natl Acad Sci U S A, 1983. 80(19): p. 6000-4.
223. Roehlecke, C., R. Horstkorte, and W. Reutter, Stimulation of human peripheral blood mononuclear cells by the sialic acid precursor N-propanoylmannosamine. Glycoconj J, 2013. 30(8): p. 813-8.
224. Erikson, E., et al., Mouse Siglec-1 Mediates trans-Infection of Surface-bound Murine Leukemia Virus in a Sialic Acid N-Acyl Side Chain-dependent Manner. J Biol Chem, 2015. 290(45): p. 27345-59.
225. Birnboim, H.C. and J. Doly, A rapid alkaline extraction procedure for screening recombinant plasmid DNA. Nucleic Acids Res, 1979. 7(6): p. 1513-23.
226. Weiss, C.D. and J.M. White, Characterization of stable Chinese hamster ovary cells expressing wild-type, secreted, and glycosylphosphatidylinositol-anchored human immunodeficiency virus type 1 envelope glycoprotein. Journal of virology, 1993. 67(12): p. 7060-7066.
227. Perez, L.G., et al., Utilization of immunoglobulin G Fc receptors by human immunodeficiency virus type 1: a specific role for antibodies against the membrane-proximal external region of gp41. Journal of virology, 2009. 83(15): p. 7397-7410.
228. Maddon, P.J., et al., The T4 gene encodes the AIDS virus receptor and is expressed in the immune system and the brain. Cell, 1986. 47(3): p. 333-348.
229. CIMINALE, V., et al., A bioassay for HIV-1 based on Env-CD4 interaction. AIDS research and human retroviruses, 1990. 6(11): p. 1281-1287.
230. Guo, W., et al., Purification of recombinant vaccinia virus-expressed monomeric HIV-1 gp120 to apparent homogeneity. Protein expression and purification, 2013. 90(1): p. 34-39.
231. Doranz, B.J., S.S. Baik, and R.W. Doms, Use of a gp120 binding assay to dissect the requirements and kinetics of human immunodeficiency virus fusion events. Journal of virology, 1999. 73(12): p. 10346-10358.
References
106
232. Huerta, L., et al., Human immunodeficiency virus envelope‐dependent cell‐cell fusion: A quantitative fluorescence cytometric assay. Cytometry Part A, 2002. 47(2): p. 100-106.
233. Keppler, O.T., et al., Biochemical engineering of the N-acyl side chain of sialic acid: biological implications. Glycobiology, 2001. 11(2): p. 11R-18R.
234. Luchansky, S.J. and C.R. Bertozzi, Azido Sialic Acids Can Modulate Cell‐Surface Interactions. ChemBioChem, 2004. 5(12): p. 1706-1709.
235. Galuska, S.P., et al., Quantification of nucleotide-activated sialic acids by a combination of reduction and fluorescent labeling. Analytical chemistry, 2010. 82(11): p. 4591-4598.
236. Finzi, A., et al., Conformational characterization of aberrant disulfide-linked HIV-1 gp120 dimers secreted from overexpressing cells. Journal of virological methods, 2010. 168(1): p. 155-161.
237. Costantini, L.M., et al., Engineering and exploitation of a fluorescent HIV-1 gp120 for live cell CD4 binding assays. Virology, 2015. 476: p. 240-248.
238. Coutu, M. and A. Finzi, HIV-1 gp120 dimers decrease the overall affinity of gp120 preparations for CD4-induced ligands. Journal of virological methods, 2015. 215: p. 37-44.
239. Wu, P., et al., Direct cytotoxicity of HIV-1 envelope protein gp120 on human NT neurons. Neuroreport, 1996. 7(5): p. 1045-1049.
240. Blaak, H., et al., In vivo HIV-1 infection of CD45RA+ CD4+ T cells is established primarily by syncytium-inducing variants and correlates with the rate of CD4+ T cell decline. Proceedings of the National Academy of Sciences, 2000. 97(3): p. 1269-1274.
241. Etemad-Moghadam, B., et al., Membrane-fusing capacity of the human immunodeficiency virus envelope proteins determines the efficiency of CD4+ T-cell depletion in macaques infected by a simian-human immunodeficiency virus. Journal of virology, 2001. 75(12): p. 5646-5655.
242. Lifson, J.D., et al., Induction of CD4-dependent cell fusion by the HTLV-III/LAV envelope glycoprotein. Nature, 1986. 323(6090): p. 725.
243. Kowalski, M., et al., Functional regions of the envelope glycoprotein of human immunodeficiency virus type 1. Science, 1987. 237: p. 1351-1356.
244. Rillahan, C.D., et al., Global metabolic inhibitors of sialyl- and fucosyltransferases remodel the glycome. Nat Chem Biol, 2012. 8(7): p. 661-8.
245. Cuatrecasas, P., Interaction of wheat germ agglutinin and concanavalin A with isolated fat cells. Biochemistry, 1973. 12(7): p. 1312-1323.
246. Burger, M.M. and A.R. Goldberg, Identification of a tumor-specific determinant on neoplastic cell surfaces. Proceedings of the National Academy of Sciences, 1967. 57(2): p. 359-366.
247. Chowdhury, S.R., et al., Targeted apoptosis in ovarian cancer cells through mitochondrial dysfunction in response to Sambucus nigra agglutinin. Cell Death & Disease, 2017. 8(5): p. e2762.
248. Mukhopadhyay, S., et al., In vitro and in vivo antitumor effects of Peanut agglutinin through induction of apoptotic and autophagic cell death. Food and chemical toxicology, 2014. 64: p. 369-377.
249. Colley, K.J., K. Kitajima, and C. Sato, Polysialic acid: Biosynthesis, novel functions and applications. Critical reviews in biochemistry and molecular biology, 2014. 49(6): p. 498-532.
250. Dekkers, G., et al., Multi-level glyco-engineering techniques to generate IgG with defined Fc-glycans. Scientific reports, 2016. 6: p. 36964.
251. Roseman, S., The synthesis of complex carbohydrates by multiglycosyltransferase systems and their potential function in intercellular adhesion. Chemistry and physics of lipids, 1970. 5(1): p. 270-297.
252. Kallolimath, S., et al., Engineering of complex protein sialylation in plants. Proceedings of the National Academy of Sciences, 2016. 113(34): p. 9498-9503.
253. Sarkar, A.K., J.R. Brown, and J.D. Esko, Synthesis and glycan priming activity of acetylated disaccharides. Carbohydrate Research, 2000. 329(2): p. 287-300.
107
254. Jones, M.B., et al., Characterization of the cellular uptake and metabolic conversion of
acetylated N‐acetylmannosamine (ManNAc) analogues to sialic acids. Biotechnology and bioengineering, 2004. 85(4): p. 394-405.
255. Park, C., et al., The HIV-1 envelope protein gp120 is captured and displayed for B cell recognition by SIGN-R1+ lymph node macrophages. eLife, 2015. 4: p. e06467.
256. GILLJAM, G., Envelope glycoproteins of HIV-1, HIV-2, and SIV purified with Galanthus nivalis agglutinin induce strong immune responses. AIDS research and human retroviruses, 1993. 9(5): p. 431-438.
257. Sanders, R.W., et al., A next-generation cleaved, soluble HIV-1 Env trimer, BG505 SOSIP. 664 gp140, expresses multiple epitopes for broadly neutralizing but not non-neutralizing antibodies. PLoS pathogens, 2013. 9(9): p. e1003618.
258. Grigorian, A.L., et al., Extraordinarily stable disulfide‐linked homodimer of human growth hormone. Protein science, 2005. 14(4): p. 902-913.
259. Walker, L.M., et al., Broad and potent neutralizing antibodies from an African donor reveal a new HIV-1 vaccine target. Science, 2009. 326(5950): p. 285-289.
260. McLellan, J.S., et al., Structure of HIV-1 gp120 V1/V2 domain with broadly neutralizing antibody PG9. Nature, 2011. 480(7377): p. 336-43.
261. Trkola, A., et al., Human monoclonal antibody 2G12 defines a distinctive neutralization epitope on the gp120 glycoprotein of human immunodeficiency virus type 1. J Virol, 1996. 70(2): p. 1100-8.
262. Nishiyama, Y., et al., Toward Effective HIV Vaccination INDUCTION OF BINARY EPITOPE REACTIVE ANTIBODIES WITH BROAD HIV NEUTRALIZING ACTIVITY. Journal of Biological Chemistry, 2009. 284(44): p. 30627-30642.
263. Raska, M., et al., Glycosylation patterns of HIV-1 gp120 depend on the type of expressing cells and affect antibody recognition. J Biol Chem, 2010. 285(27): p. 20860-9.
264. Horiya, S., I.S. MacPherson, and I.J. Krauss, Recent strategies targeting HIV glycans in vaccine design. Nat Chem Biol, 2014. 10(12): p. 990-9.
265. Raska, M., et al., Differential glycosylation of envelope gp120 is associated with differential recognition of HIV-1 by virus-specific antibodies and cell infection. AIDS research and therapy, 2014. 11(1): p. 23.
266. Go, E.P., et al., Glycosylation site-specific analysis of HIV envelope proteins (JR-FL and CON-S) reveals major differences in glycosylation site occupancy, glycoform profiles, and antigenic epitopes' accessibility. J Proteome Res, 2008. 7(4): p. 1660-74.
267. Yu, B., et al., Glycoform and net charge heterogeneity in gp120 immunogens used in HIV vaccine trials. PLoS One, 2012. 7(8): p. e43903.
268. Wang, W., et al., A systematic study of the N-glycosylation sites of HIV-1 envelope protein on infectivity and antibody-mediated neutralization. Retrovirology, 2013. 10: p. 14.
269. Hart, M.L., M. Saifuddin, and G.T. Spear, Glycosylation inhibitors and neuraminidase enhance human immunodeficiency virus type 1 binding and neutralization by mannose-binding lectin. Journal of general virology, 2003. 84(2): p. 353-360.
270. Huang, X., et al., Highly conserved HIV-1 gp120 glycans proximal to CD4-binding region affect viral infectivity and neutralizing antibody induction. Virology, 2012. 423(1): p. 97-106.
271. Townsley, S., et al., Conserved role of an N-linked glycan on the surface antigen of human immunodeficiency virus type 1 modulating virus sensitivity to broadly neutralizing antibodies against the receptor and coreceptor binding sites. Journal of virology, 2016. 90(2): p. 829-841.
272. Kumar, R., et al., Improving immunogenicity of HIV-1 envelope gp120 by glycan removal and immune complex formation. Vaccine, 2011. 29(48): p. 9064-9074.
273. Kong, L., et al., Supersite of immune vulnerability on the glycosylated face of HIV-1 envelope glycoprotein gp120. Nat Struct Mol Biol, 2013. 20(7): p. 796-803.
274. Pancera, M., et al., Structural basis for diverse N-glycan recognition by HIV-1–neutralizing V1–V2–directed antibody PG16. Nature structural & molecular biology, 2013. 20(7): p. 804-813.
References
108
275. Garces, F., et al., Structural evolution of glycan recognition by a family of potent HIV antibodies. Cell, 2014. 159(1): p. 69-79.
276. Kaewsapsak, P., O. Esonu, and D.H. Dube, Recruiting the host's immune system to target Helicobacter pylori's surface glycans. ChemBioChem, 2013. 14(6): p. 721-726.
277. Zerhouni, B., J.A. Nelson, and K. Saha, Isolation of CD4-independent primary human immunodeficiency virus type 1 isolates that are syncytium inducing and acutely cytopathic for CD8+ lymphocytes. Journal of virology, 2004. 78(3): p. 1243-1255.
278. Korkut, A. and W.A. Hendrickson, Structural plasticity and conformational transitions of HIV envelope glycoprotein gp120. PloS one, 2012. 7(12): p. e52170.
279. Thordsen, I., S. Polzer, and M. Schreiber, Infection of cells expressing CXCR4 mutants lacking N-glycosylation at the N-terminal extracellular domain is enhanced for R5X4-dualtropic human immunodeficiency virus type-1. BMC Infect Dis, 2002. 2: p. 31.
280. François, K.O. and J. Balzarini, The highly conserved glycan at asparagine 260 of HIV-1 gp120 is indispensable for viral entry. Journal of Biological Chemistry, 2011. 286(50): p. 42900-42910.
281. Mathys, L., et al., Deletion of the highly conserved N-glycan at Asn260 of HIV-1 gp120 affects folding and lysosomal degradation of gp120, and results in loss of viral infectivity. PloS one, 2014. 9(6): p. e101181.
282. Meissner, E.G., et al., Fusion-induced apoptosis contributes to thymocyte depletion by a pathogenic human immunodeficiency virus type 1 envelope in the human thymus. Journal of virology, 2006. 80(22): p. 11019-11030.
283. Yuste, E., et al., Modulation of Env content in virions of simian immunodeficiency virus: correlation with cell surface expression and virion infectivity. Journal of virology, 2004. 78(13): p. 6775-6785.
284. Schiller, J. and B. Chackerian, Why HIV virions have low numbers of envelope spikes: implications for vaccine development. PLoS pathogens, 2014. 10(8): p. e1004254.
285. Chong, H., et al., The MT hook structure is critical for design of HIV-1 fusion inhibitors. Journal of Biological Chemistry, 2012. 287(41): p. 34558-34568.
286. Cavrois, M., C. de Noronha, and W.C. Greene, A sensitive and specific enzyme-based assay detecting HIV-1 virion fusion in primary T lymphocytes. Nature biotechnology, 2002. 20(11): p. 1151.
287. Sun, J., et al., Syncytium formation and HIV-1 replication are both accentuated by purified influenza and virus-associated neuraminidase. Journal of Biological Chemistry, 2002. 277(12): p. 9825-9833.
288. Magérus-Chatinet, A., et al., Galactosyl ceramide expressed on dendritic cells can mediate HIV-1 transfer from monocyte derived dendritic cells to autologous T cells. Virology, 2007. 362(1): p. 67-74.
289. Herrera, C., et al., Comodulation of CXCR4 and CD26 in human lymphocytes. Journal of Biological Chemistry, 2001. 276(22): p. 19532-19539.