Embed Size (px)
Citation preview

Π8: Indoor Positioning System using WLAN Received Signal Strength Measurements
Preface
In this deliverable we provide the details of building an indoor positioning
system using WLAN Received Signal Strength (RSS) fingerprints. The
positioning system has been deployed at the premises of KIOS Research
Center and follows a terminal-based-network-assisted architecture. In our
case, users that carry a terminal (Tablet PC) are able to self-locate and
positioning is performed entirely on the device using the observed RSS
fingerprint. Currently, one positioning method, i.e. K-Nearest Neighbors (KNN)
and one filtering method, i.e. Kalman filter, has been integrated into our
positioning platform. In the future we plan to implement and integrate more
positioning and filtering modules, while at the same time try to improve the
performance with respect to the positioning error by tweaking and fine-tuning
both modules.
The rest of this report is structured as follows. Section 1 provides the details
of our experimentation area in the premises of KIOS Research Center,
University of Cyprus. In Section 2 we describe the hardware components that
we used, including the WLAN Access Points (AP) and Tablet PCs, while the
software, including free or open source programs and custom software written
in MATLAB, is detailed in Section 3. The experimental setup, e.g. installation,
verification and testing of the APs is presented in Section 4, while the data
collection process to build the so called RSS radio map that contains the
training RSS fingerprints is described in Section 5. Finally, performing
positioning inside KIOS with our MATLAB software and Graphical User
Interface (GUI) is presented in Section 6.
1. Experimentation Area
Our indoor positioning system is deployed at the premises of the KIOS
Research Center for Intelligent Systems & Networks, University of Cyprus.
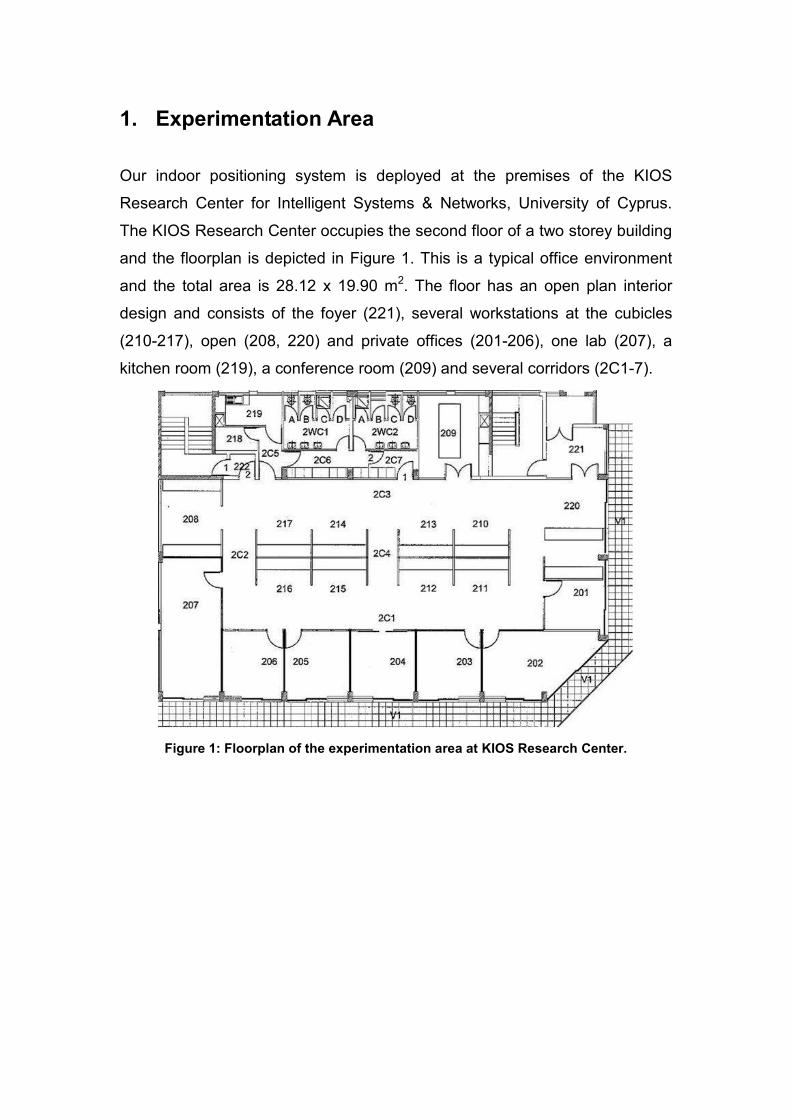
The KIOS Research Center occupies the second floor of a two storey building
and the floorplan is depicted in Figure 1. This is a typical office environment
and the total area is 28.12 x 19.90 m2. The floor has an open plan interior
design and consists of the foyer (221), several workstations at the cubicles
(210-217), open (208, 220) and private offices (201-206), one lab (207), a
kitchen room (219), a conference room (209) and several corridors (2C1-7).
Figure 1: Floorplan of the experimentation area at KIOS Research Center.
2. Hardware Components
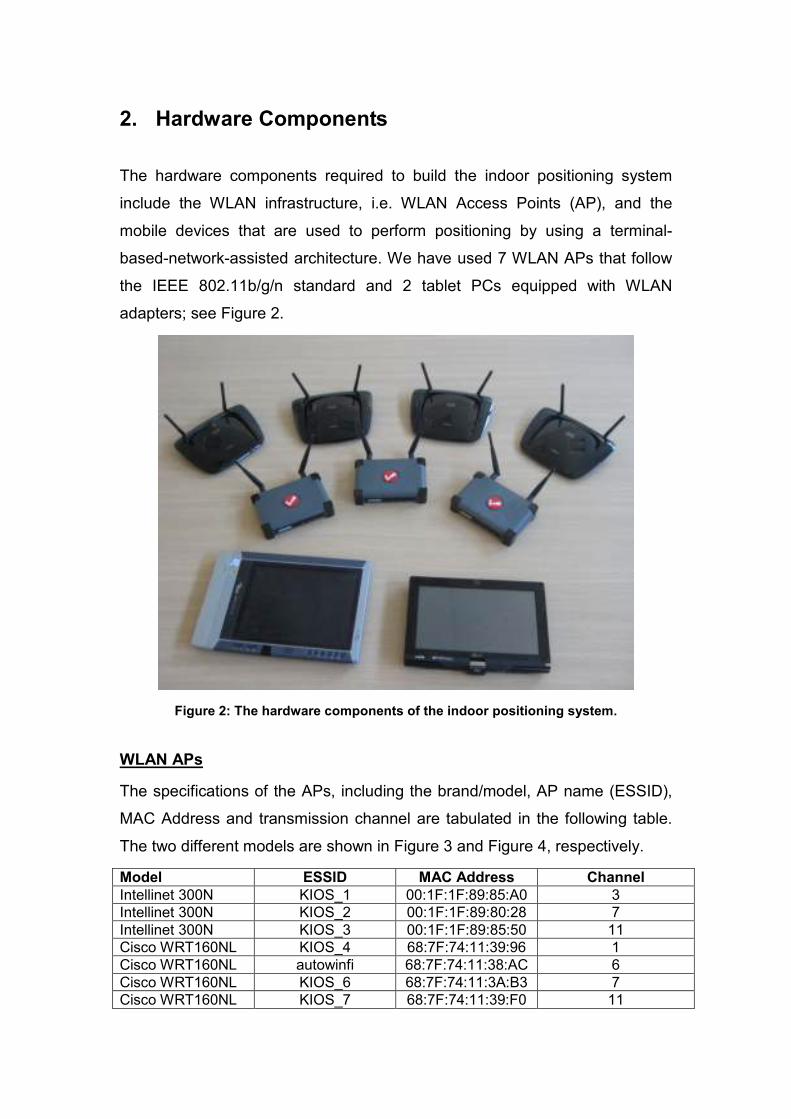
The hardware components required to build the indoor positioning system
include the WLAN infrastructure, i.e. WLAN Access Points (AP), and the
mobile devices that are used to perform positioning by using a terminal-
based-network-assisted architecture. We have used 7 WLAN APs that follow
the IEEE 802.11b/g/n standard and 2 tablet PCs equipped with WLAN
adapters; see Figure 2.
Figure 2: The hardware components of the indoor positioning system.
WLAN APs
The specifications of the APs, including the brand/model, AP name (ESSID),
MAC Address and transmission channel are tabulated in the following table.
The two different models are shown in Figure 3 and Figure 4, respectively.
Model ESSID MAC Address Channel
Intellinet 300N KIOS_1 00:1F:1F:89:85:A0 3
Intellinet 300N KIOS_2 00:1F:1F:89:80:28 7
Intellinet 300N KIOS_3 00:1F:1F:89:85:50 11
Cisco WRT160NL KIOS_4 68:7F:74:11:39:96 1
Cisco WRT160NL autowinfi 68:7F:74:11:38:AC 6
Cisco WRT160NL KIOS_6 68:7F:74:11:3A:B3 7
Cisco WRT160NL KIOS_7 68:7F:74:11:39:F0 11
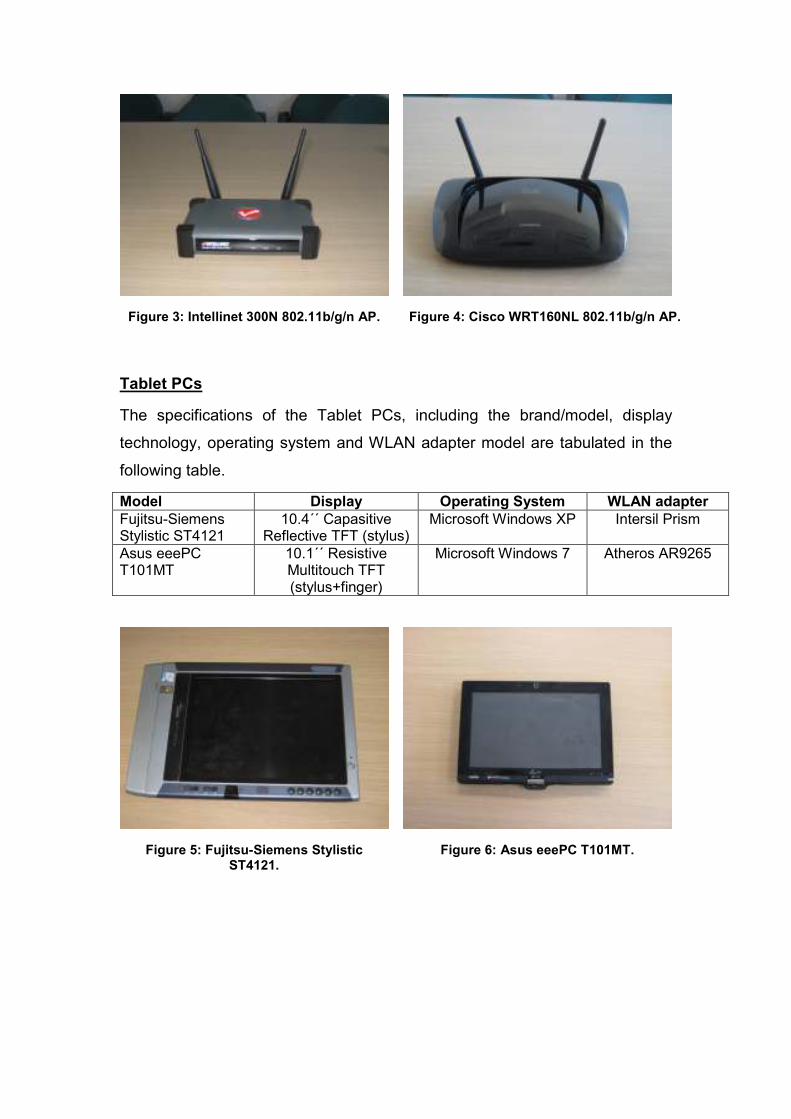
Figure 3: Intellinet 300N 802.11b/g/n AP.
Figure 4: Cisco WRT160NL 802.11b/g/n AP.
Tablet PCs
The specifications of the Tablet PCs, including the brand/model, display
technology, operating system and WLAN adapter model are tabulated in the
following table.
Model Display Operating System WLAN adapter
Fujitsu-Siemens Stylistic ST4121
10.4΄΄ Capasitive Reflective TFT (stylus)
Microsoft Windows XP Intersil Prism
Asus eeePC T101MT
10.1΄΄ Resistive Multitouch TFT (stylus+finger)
Microsoft Windows 7 Atheros AR9265
Figure 5: Fujitsu-Siemens Stylistic ST4121.
Figure 6: Asus eeePC T101MT.
3. List of Software Components
In the deployment of the indoor positioning system we have used some open
source or freely available software in order to test the functionality of the
WLAN APs and analyze the coverage in the area of interest. Moreover, we
have developed custom software using MATLAB for collecting the training
data (i.e. RSS fingerprints), analyzing these data (e.g. RSS levels of a specific
AP at the reference locations inside the area, number of detected APs per
reference location). Finally, we have also developed a piece of software and a
Graphical User Interface (GUI) in MATLAB to perform positioning and plot the
user location on the floorplan map of KIOS Research Center. Specifically, we
have used the following software components.
Open source and free software
Ekahau HeatMapper
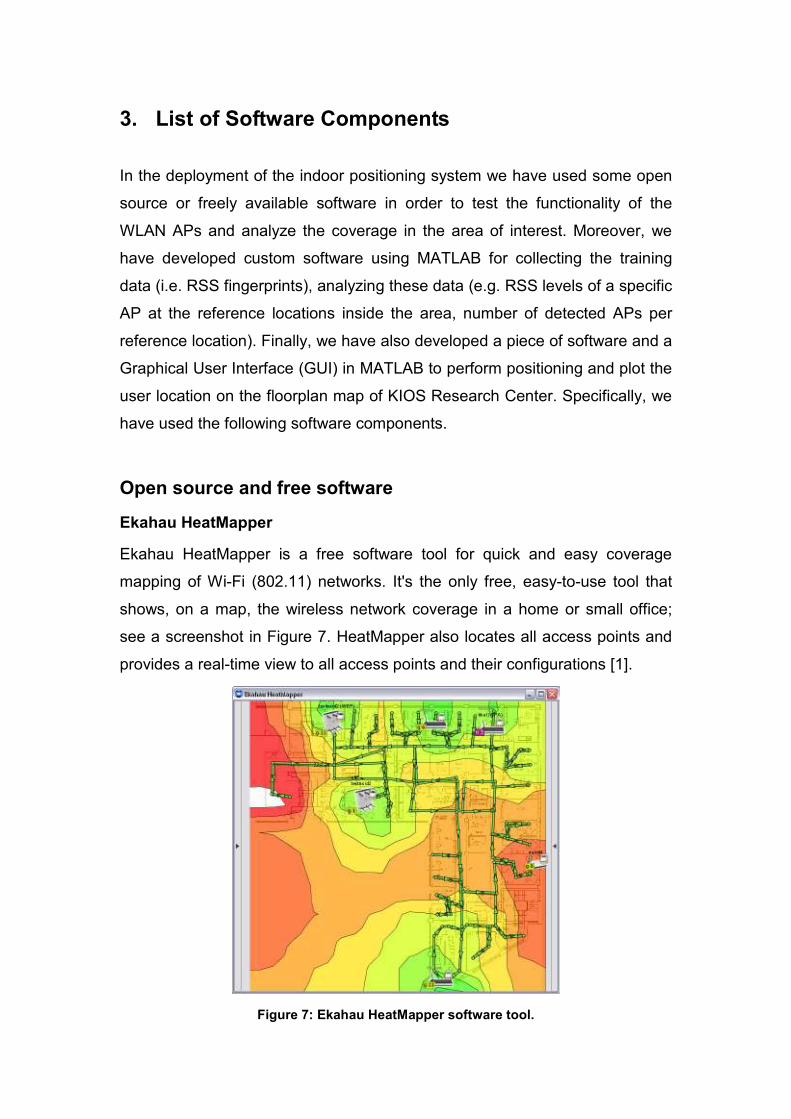
Ekahau HeatMapper is a free software tool for quick and easy coverage
mapping of Wi-Fi (802.11) networks. It's the only free, easy-to-use tool that
shows, on a map, the wireless network coverage in a home or small office;
see a screenshot in Figure 7. HeatMapper also locates all access points and
provides a real-time view to all access points and their configurations [1].
Figure 7: Ekahau HeatMapper software tool.
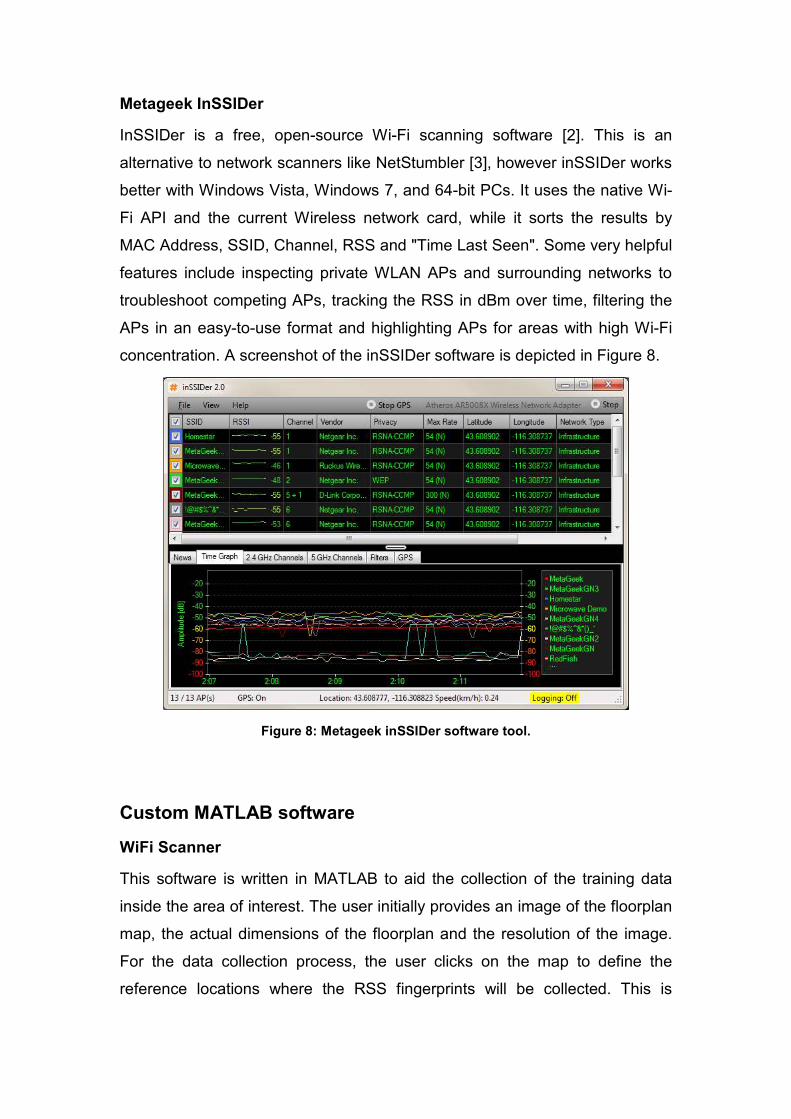
Metageek InSSIDer
InSSIDer is a free, open-source Wi-Fi scanning software [2]. This is an
alternative to network scanners like NetStumbler [3], however inSSIDer works
better with Windows Vista, Windows 7, and 64-bit PCs. It uses the native Wi-
Fi API and the current Wireless network card, while it sorts the results by
MAC Address, SSID, Channel, RSS and "Time Last Seen". Some very helpful
features include inspecting private WLAN APs and surrounding networks to
troubleshoot competing APs, tracking the RSS in dBm over time, filtering the
APs in an easy-to-use format and highlighting APs for areas with high Wi-Fi
concentration. A screenshot of the inSSIDer software is depicted in Figure 8.
Figure 8: Metageek inSSIDer software tool.
Custom MATLAB software
WiFi Scanner
This software is written in MATLAB to aid the collection of the training data
inside the area of interest. The user initially provides an image of the floorplan
map, the actual dimensions of the floorplan and the resolution of the image.
For the data collection process, the user clicks on the map to define the
reference locations where the RSS fingerprints will be collected. This is
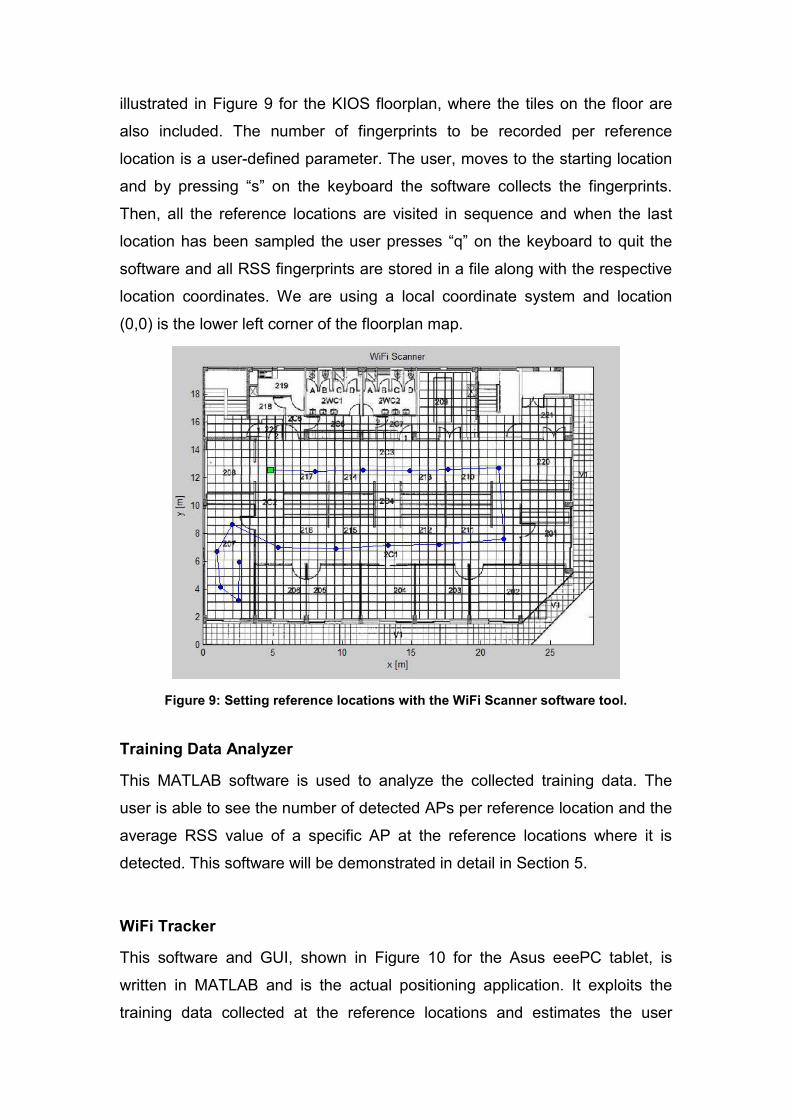
illustrated in Figure 9 for the KIOS floorplan, where the tiles on the floor are
also included. The number of fingerprints to be recorded per reference
location is a user-defined parameter. The user, moves to the starting location
and by pressing “s” on the keyboard the software collects the fingerprints.
Then, all the reference locations are visited in sequence and when the last
location has been sampled the user presses “q” on the keyboard to quit the
software and all RSS fingerprints are stored in a file along with the respective
location coordinates. We are using a local coordinate system and location
(0,0) is the lower left corner of the floorplan map.
Figure 9: Setting reference locations with the WiFi Scanner software tool.
Training Data Analyzer
This MATLAB software is used to analyze the collected training data. The
user is able to see the number of detected APs per reference location and the
average RSS value of a specific AP at the reference locations where it is
detected. This software will be demonstrated in detail in Section 5.
WiFi Tracker
This software and GUI, shown in Figure 10 for the Asus eeePC tablet, is
written in MATLAB and is the actual positioning application. It exploits the
training data collected at the reference locations and estimates the user
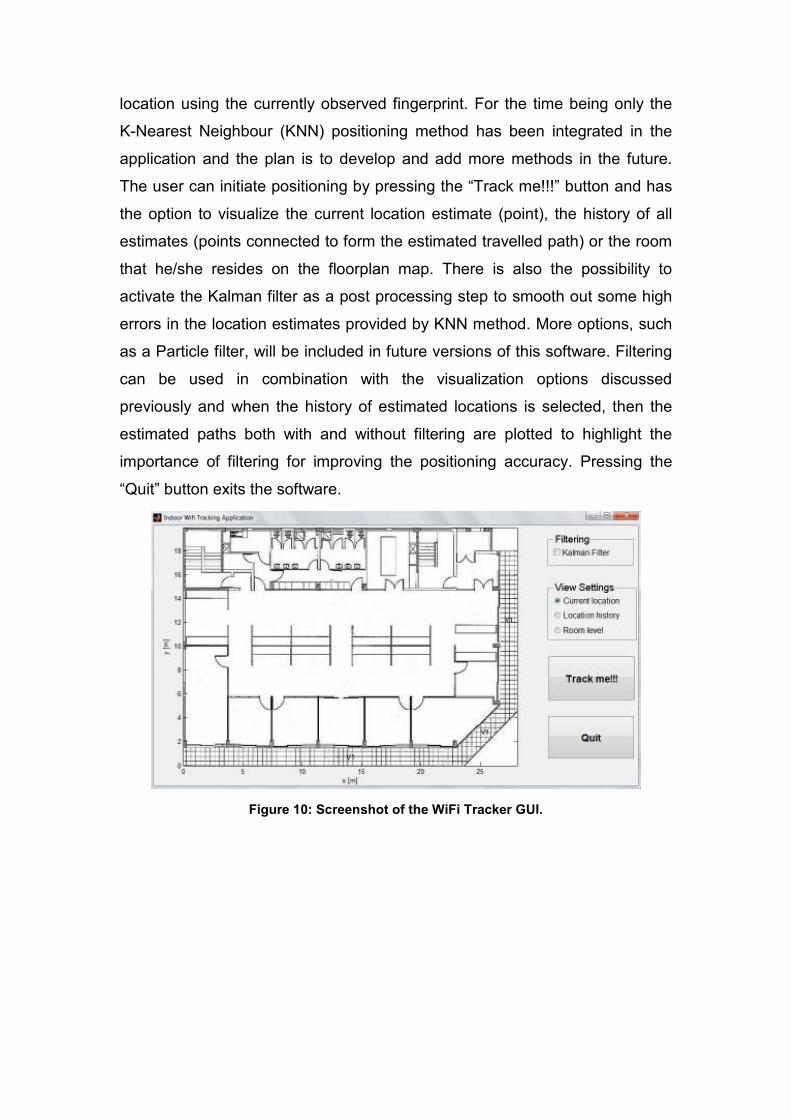
location using the currently observed fingerprint. For the time being only the
K-Nearest Neighbour (KNN) positioning method has been integrated in the
application and the plan is to develop and add more methods in the future.
The user can initiate positioning by pressing the “Track me!!!” button and has
the option to visualize the current location estimate (point), the history of all
estimates (points connected to form the estimated travelled path) or the room
that he/she resides on the floorplan map. There is also the possibility to
activate the Kalman filter as a post processing step to smooth out some high
errors in the location estimates provided by KNN method. More options, such
as a Particle filter, will be included in future versions of this software. Filtering
can be used in combination with the visualization options discussed
previously and when the history of estimated locations is selected, then the
estimated paths both with and without filtering are plotted to highlight the
importance of filtering for improving the positioning accuracy. Pressing the
“Quit” button exits the software.
Figure 10: Screenshot of the WiFi Tracker GUI.
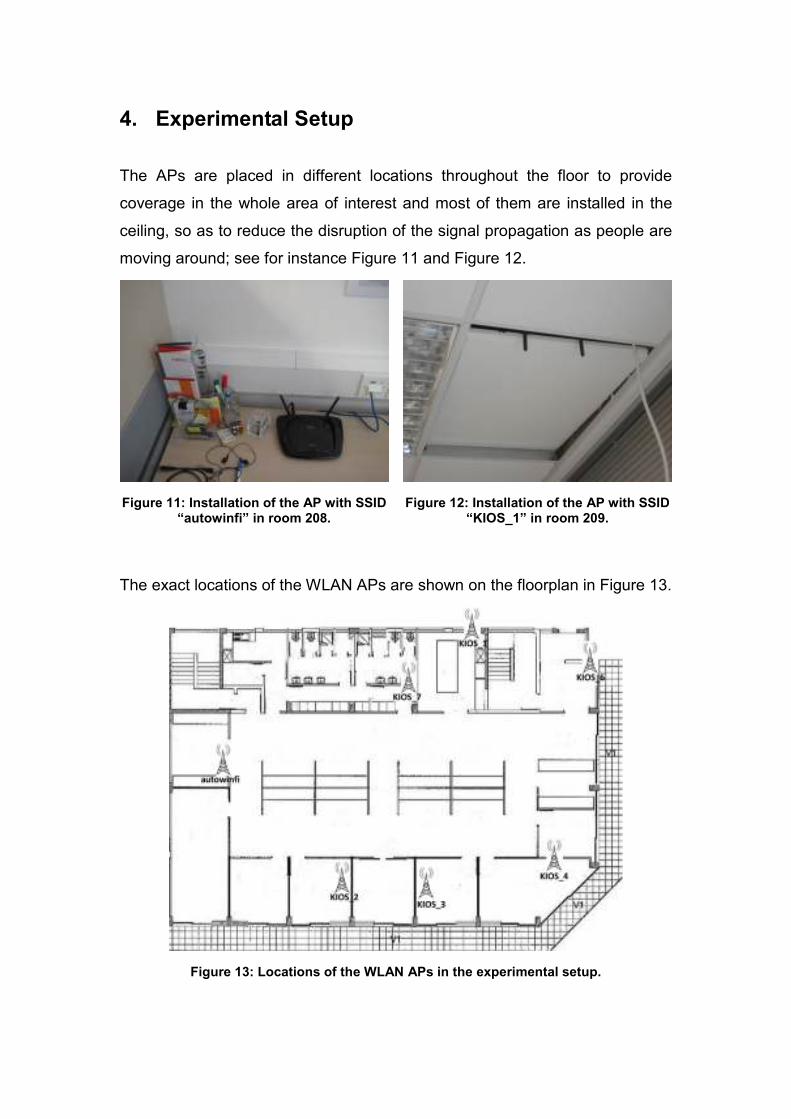
4. Experimental Setup
The APs are placed in different locations throughout the floor to provide
coverage in the whole area of interest and most of them are installed in the
ceiling, so as to reduce the disruption of the signal propagation as people are
moving around; see for instance Figure 11 and Figure 12.
Figure 11: Installation of the AP with SSID “autowinfi” in room 208.
Figure 12: Installation of the AP with SSID “KIOS_1” in room 209.
The exact locations of the WLAN APs are shown on the floorplan in Figure 13.
Figure 13: Locations of the WLAN APs in the experimental setup.

Next, we used the Ekahau HeatMapper software to check the coverage
throughout the floor and the coverage of each AP. In Figure 14 the WLAN
coverage in the whole area is plotted and we observe that the WLAN signals
are quite strong almost everywhere (darker green colour indicates stronger
signal) and there is at least one AP that provides strong signal to every
location in the floor. We can also see that the software has more or less
accurately placed the APs on the map, quite close to their actual locations.
Figure 14: WLAN coverage in KIOS Research Center.
We used this software to verify the coverage of a specific AP and get a rough
idea of the RSS values related to that AP. The coverage of the AP with SSID
“autowinfi” (placed in room 208) is depicted in Figure 15. We can see that the
RSS values from that AP are getting weaker as we move away from it, i.e.
from the left to the right part of the floor. Similarly, the coverage of the AP with
SSID “KIOS_4” (placed in room 202) is depicted in Figure 16 and we can see
that in this case the RSS values are getting weaker as we move away from it,
i.e. from the right to the left part of the floor.
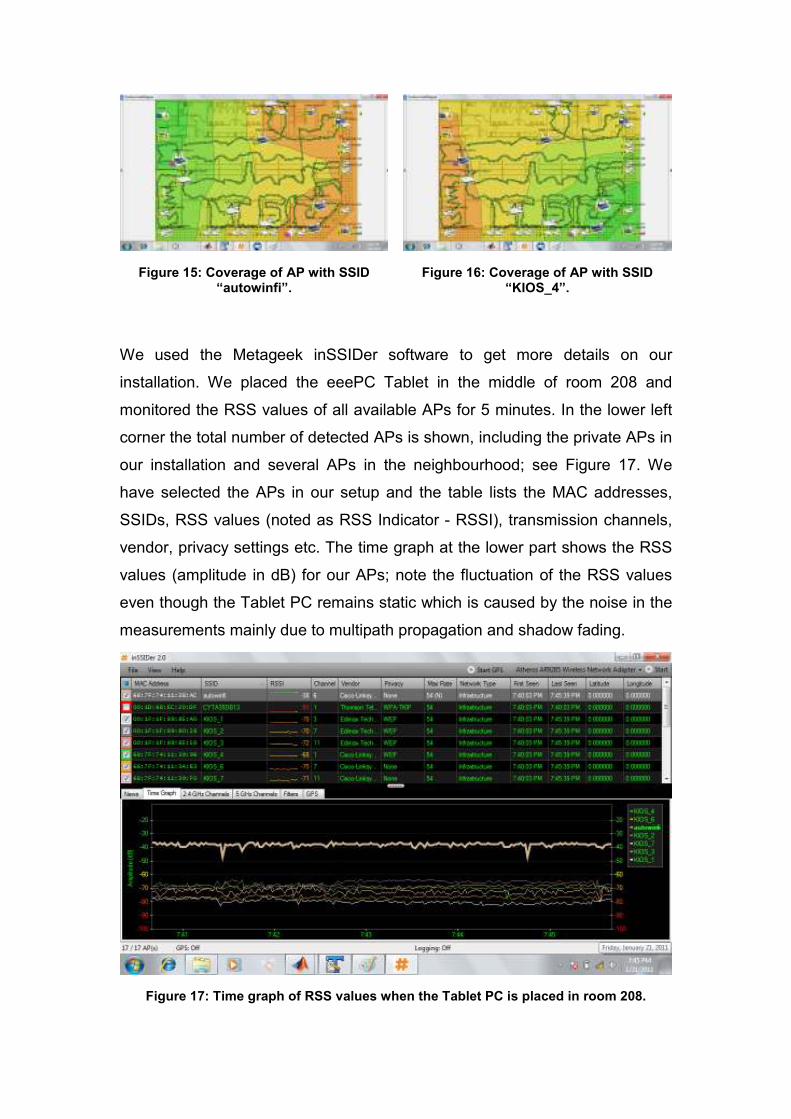
Figure 15: Coverage of AP with SSID “autowinfi”.
Figure 16: Coverage of AP with SSID “KIOS_4”.
We used the Metageek inSSIDer software to get more details on our
installation. We placed the eeePC Tablet in the middle of room 208 and
monitored the RSS values of all available APs for 5 minutes. In the lower left
corner the total number of detected APs is shown, including the private APs in
our installation and several APs in the neighbourhood; see Figure 17. We
have selected the APs in our setup and the table lists the MAC addresses,
SSIDs, RSS values (noted as RSS Indicator - RSSI), transmission channels,
vendor, privacy settings etc. The time graph at the lower part shows the RSS
values (amplitude in dB) for our APs; note the fluctuation of the RSS values
even though the Tablet PC remains static which is caused by the noise in the
measurements mainly due to multipath propagation and shadow fading.
Figure 17: Time graph of RSS values when the Tablet PC is placed in room 208.
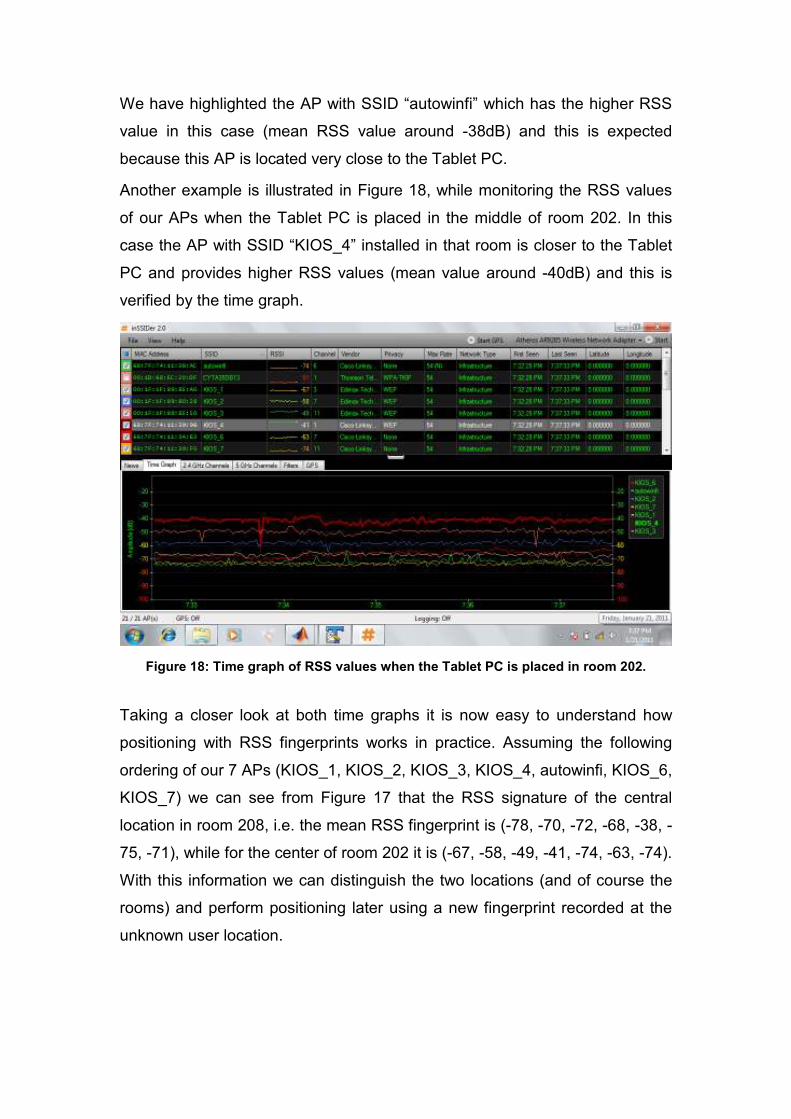
We have highlighted the AP with SSID “autowinfi” which has the higher RSS
value in this case (mean RSS value around -38dB) and this is expected
because this AP is located very close to the Tablet PC.
Another example is illustrated in Figure 18, while monitoring the RSS values
of our APs when the Tablet PC is placed in the middle of room 202. In this
case the AP with SSID “KIOS_4” installed in that room is closer to the Tablet
PC and provides higher RSS values (mean value around -40dB) and this is
verified by the time graph.
Figure 18: Time graph of RSS values when the Tablet PC is placed in room 202.
Taking a closer look at both time graphs it is now easy to understand how
positioning with RSS fingerprints works in practice. Assuming the following
ordering of our 7 APs (KIOS_1, KIOS_2, KIOS_3, KIOS_4, autowinfi, KIOS_6,
KIOS_7) we can see from Figure 17 that the RSS signature of the central
location in room 208, i.e. the mean RSS fingerprint is (-78, -70, -72, -68, -38, -
75, -71), while for the center of room 202 it is (-67, -58, -49, -41, -74, -63, -74).
With this information we can distinguish the two locations (and of course the
rooms) and perform positioning later using a new fingerprint recorded at the
unknown user location.
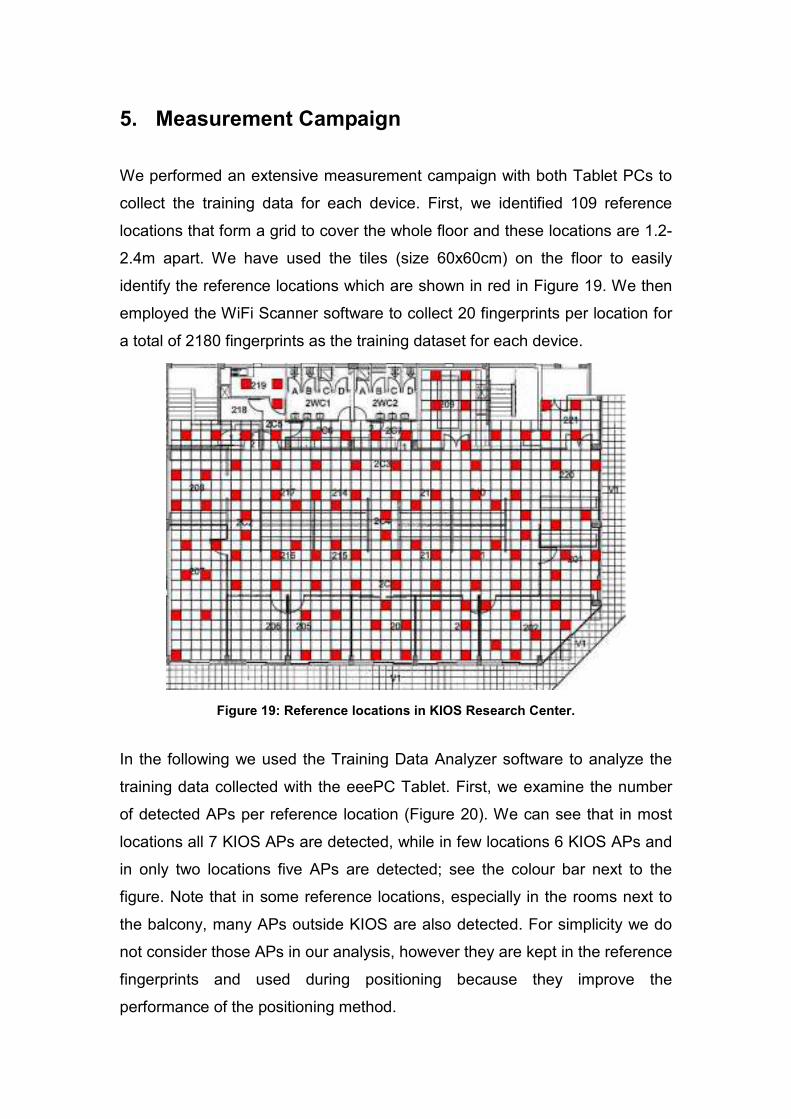
5. Measurement Campaign
We performed an extensive measurement campaign with both Tablet PCs to
collect the training data for each device. First, we identified 109 reference
locations that form a grid to cover the whole floor and these locations are 1.2-
2.4m apart. We have used the tiles (size 60x60cm) on the floor to easily
identify the reference locations which are shown in red in Figure 19. We then
employed the WiFi Scanner software to collect 20 fingerprints per location for
a total of 2180 fingerprints as the training dataset for each device.
Figure 19: Reference locations in KIOS Research Center.
In the following we used the Training Data Analyzer software to analyze the
training data collected with the eeePC Tablet. First, we examine the number
of detected APs per reference location (Figure 20). We can see that in most
locations all 7 KIOS APs are detected, while in few locations 6 KIOS APs and
in only two locations five APs are detected; see the colour bar next to the
figure. Note that in some reference locations, especially in the rooms next to
the balcony, many APs outside KIOS are also detected. For simplicity we do
not consider those APs in our analysis, however they are kept in the reference
fingerprints and used during positioning because they improve the
performance of the positioning method.
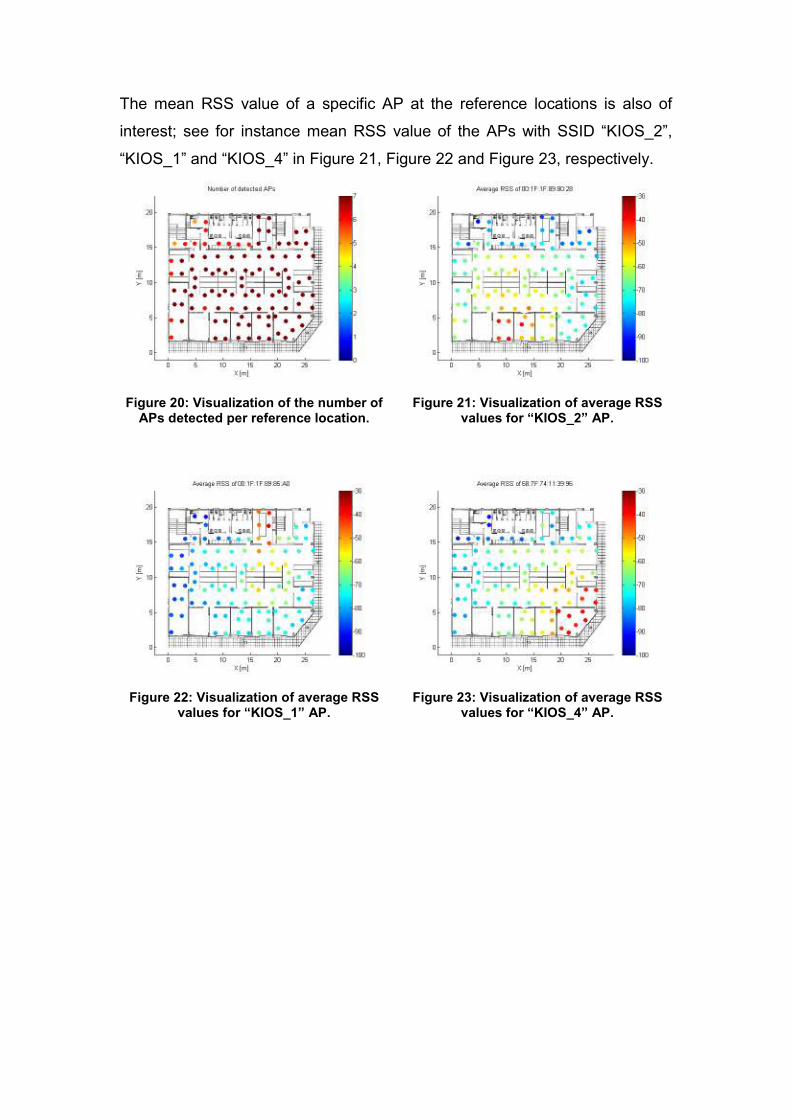
The mean RSS value of a specific AP at the reference locations is also of
interest; see for instance mean RSS value of the APs with SSID “KIOS_2”,
“KIOS_1” and “KIOS_4” in Figure 21, Figure 22 and Figure 23, respectively.
Figure 20: Visualization of the number of APs detected per reference location.
Figure 21: Visualization of average RSS values for “KIOS_2” AP.
Figure 22: Visualization of average RSS values for “KIOS_1” AP.
Figure 23: Visualization of average RSS values for “KIOS_4” AP.
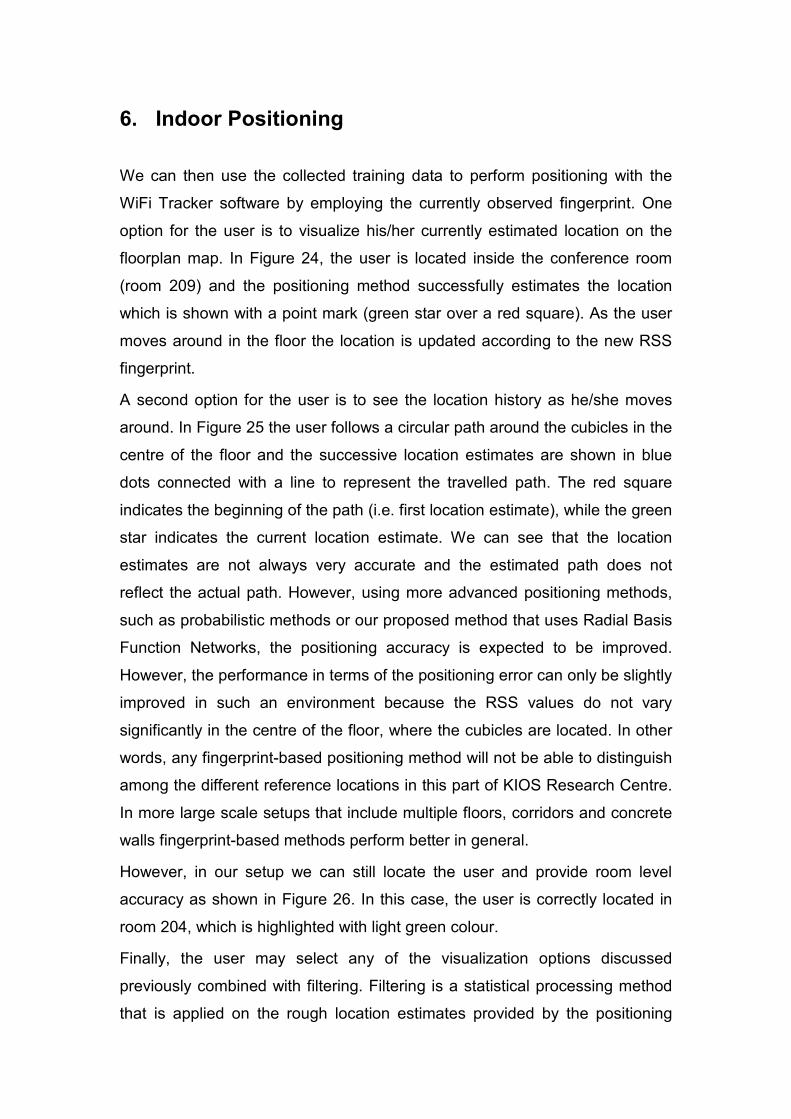
6. Indoor Positioning
We can then use the collected training data to perform positioning with the
WiFi Tracker software by employing the currently observed fingerprint. One
option for the user is to visualize his/her currently estimated location on the
floorplan map. In Figure 24, the user is located inside the conference room
(room 209) and the positioning method successfully estimates the location
which is shown with a point mark (green star over a red square). As the user
moves around in the floor the location is updated according to the new RSS
fingerprint.
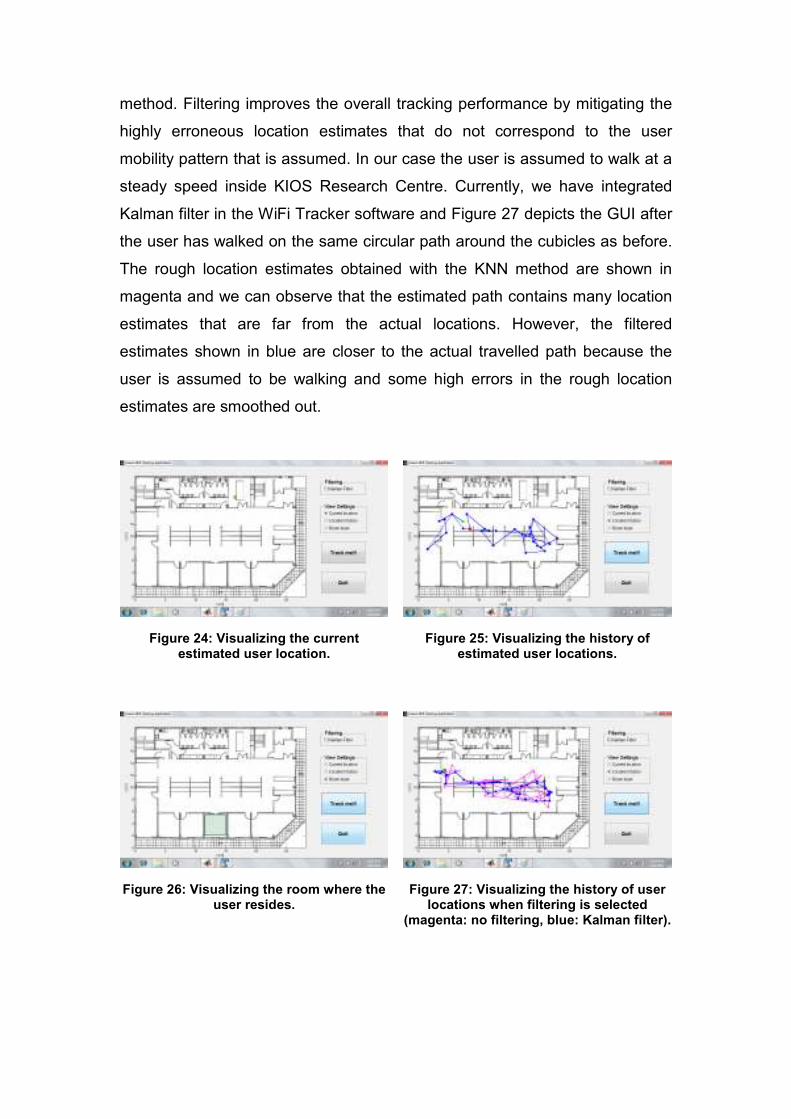
A second option for the user is to see the location history as he/she moves
around. In Figure 25 the user follows a circular path around the cubicles in the
centre of the floor and the successive location estimates are shown in blue
dots connected with a line to represent the travelled path. The red square
indicates the beginning of the path (i.e. first location estimate), while the green
star indicates the current location estimate. We can see that the location
estimates are not always very accurate and the estimated path does not
reflect the actual path. However, using more advanced positioning methods,
such as probabilistic methods or our proposed method that uses Radial Basis
Function Networks, the positioning accuracy is expected to be improved.
However, the performance in terms of the positioning error can only be slightly
improved in such an environment because the RSS values do not vary
significantly in the centre of the floor, where the cubicles are located. In other
words, any fingerprint-based positioning method will not be able to distinguish
among the different reference locations in this part of KIOS Research Centre.
In more large scale setups that include multiple floors, corridors and concrete
walls fingerprint-based methods perform better in general.
However, in our setup we can still locate the user and provide room level
accuracy as shown in Figure 26. In this case, the user is correctly located in
room 204, which is highlighted with light green colour.
Finally, the user may select any of the visualization options discussed
previously combined with filtering. Filtering is a statistical processing method
that is applied on the rough location estimates provided by the positioning
method. Filtering improves the overall tracking performance by mitigating the
highly erroneous location estimates that do not correspond to the user
mobility pattern that is assumed. In our case the user is assumed to walk at a
steady speed inside KIOS Research Centre. Currently, we have integrated
Kalman filter in the WiFi Tracker software and Figure 27 depicts the GUI after
the user has walked on the same circular path around the cubicles as before.
The rough location estimates obtained with the KNN method are shown in
magenta and we can observe that the estimated path contains many location
estimates that are far from the actual locations. However, the filtered
estimates shown in blue are closer to the actual travelled path because the
user is assumed to be walking and some high errors in the rough location
estimates are smoothed out.
Figure 24: Visualizing the current estimated user location.
Figure 25: Visualizing the history of estimated user locations.
Figure 26: Visualizing the room where the user resides.
Figure 27: Visualizing the history of user locations when filtering is selected
(magenta: no filtering, blue: Kalman filter).
References
[1] http://www.ekahau.com/products/heatmapper/overview.html
[2] http://www.metageek.net/products/inssider
[3] http://www.netstumbler.com/downloads/


