Embed Size (px)
Citation preview
Impacts of water table management on N2O and N2 from a sandy
loam soil in southwestern Quebec, Canada
Abdirashid Elmi1,*, David Burton2, Robert Gordon1 and Chandra Madramootoo31Department of Engineering, Nova Scotia Agricultural College, Resource Stewardship Building, 20 TowerRoad, P.O. Box 550, Truro, NS, Canada B2N 5E3; 2Department of Environmental Sciences, Nova ScotiaAgricultural College, Cox’s Institute, P.O. Box 550, Truro, NS, Canada B2N 5E3; 3Brace Centre for WaterResources Management, Macdonald Campus of McGill University, 21 111 Lakeshore Rd. Ste-Anne-de-Bellevue, Quebec, Canada H9X 3V9; *Author for correspondence (e-mail: abdirashid,[email protected];phone: +1-902-893-6592; fax: +1-902- 893-0335)
Received 28 July 2004; accepted in revised form 22 February 2005
Key words: Atmosphere, Denitrification, Drainage, Nitrous oxide, Ozone, Water-filled pore space
Abstract
Nitrous oxide (N2O) is primarily produced as intermediate in denitrification and, to a lesser extent, throughnitrification processes. Nitrous oxide emission and, consequently, its atmospheric impacts depend on theextent to which N2O is reduced to dinitrogen gas (N2) by denitrifiers. Field experiments were conductedfrom 1998 through 2000 growing seasons at St. Emmanuel, Quebec, Canada, to investigate the combinedimpact of water table management (WTM) and N fertilization rate on the soil denitrification (N2O + N2)rate, rate of N2O production, and the N2O:N2O + N2 ratio. Water table treatments included subirrigation(SI) with a target water table depth of 0.6 m and free drainage (FD) with open drains. The tile drains(75 mm diameter) were laid at a 1.0 m depth from the soil surface. Nitrogen fertilizer was applied at tworates:120 and 200 kg N ha�1 as ammonium nitrate (34-0-0). The N2O + N2 evolution rates were greater inSI (12.9 kg N ha�1) than in FD (5.8 kg N ha�1) plots. The percentages of N2O relative to overallN2O + N2 evolution were 35 and 11% for 1998, 29 and 8% for 1999, and 37 and 20% for 2000, under FDand SI, respectively. The reduced N2O production under SI was due to a greater reduction of N2O to N2.Results indicate that greater N2O + N2 evolution under shallow water tables are not necessarily accom-panied by higher N2O emissions.
Introduction
As a result of emerging environmental pressurethere is currently emphasis on the management ofsubsurface drainage systems to reduce pollutantlevels in effluents. In many areas, water tablemanagement (WTM) has been widely used to re-duce nitrate (NO3
�) in the soil–water system andincrease or sustain crop yield (Kalita and Kanwar1993; Drury et al. 1996; Cooper et al. 1999; Elmiet al. 2002a, b). Water table management,
consisting of controlled drainage (CD) and subir-rigation (SI), combines drainage and irrigation.Under CD, the drainage discharge can be re-stricted or prevented from exiting the system. Nosupplemental water, other than the rainfall, is ad-ded to the field. Subirrigation is similar to CD,except that supplemental irrigation water ispumped into the system during dry periods tomaintain water table at a target depth and, there-fore, provide crops with water in times of need. Inthe remainder of this paper, conventional subsurface
Nutrient Cycling in Agroecosystems (2005) 72: 229–240 � Springer 2005
DOI 10.1007/s10705-005-2920-9
(tile) drainage (free drainage; FD), where ex-cess water can be freely drained, is also discussedas an integral part of WTM system. Raising thewater table through SI increases soil water con-tent, restricts O2 diffusion in soil pores and, thus,enhances denitrification process.
Denitrification is the major biological process bywhich nitrous oxide (N2O) is produced and canenter the atmosphere. With an atmospheric lifetimeof nearly 120 years and a global warming potential320-fold of CO2 (IPCC 2001) the contributions ofN2O to climate change is greater than its lowatmospheric concentration might suggest. Agricul-tural soils contribute about 80% of the anthropo-genic N2O emissions (Isemann 1994). Concernshave been raised that reductions in soil NO3
�
achieved through enhanced denitrification mayactually result in increased N2O emissions. Undercertain conditions however, N2O produced in thesoil may be further reduced biologically to N2,which has neither a global warming nor ozonedepletion activity. Thus, denitrification can bebeneficial to the environment if N2O is reduced toN2.Water-filled pore space (WFPS) has been shownto be a key parameter in determining the extent towhich N2O is produced during denitrification (Linnand Doran 1984; Weier et al. 1993). In general, theratio of N2O to N2O + N2 decreases by increasingWFPS with maximum value between 60 and 80%WFPS (Linn and Doran 1984; Weier et al. 1993).
Understanding the proportion of denitrificationgaseous end-products is necessary to devise man-agement strategies which reduce NO3
�-N pollutionthrough denitrification without concomitantlyincreasing N2O emissions. Our present understand-ing of the N2O:N2O + N2 ratios under WTM isbased mainly on limited laboratory studies (Kliewerand Gilliam 1995; Jacinthe et al. 2000). The objec-tives of this study were to examine the combinedeffects of WTM and N fertilization under field con-ditions over three growing seasons on N2O + N2
and N2O evolution rates, and N2O:N2O + N2 ra-tios in a corn monoculture agroecosystem.
Materials and methods
Site description and field management
The study was conducted on a 4.2-ha research site atSt. Emmanuel, Quebec (74�11¢15¢¢ N; 45�21¢0¢¢ E),
30 km southwest of the Macdonald Campus ofMcGill University. The soil, a Soulanges finesandy loam [fine silty; mixed, non-acid, frigidHumaquept, Gleysol; (FAO classification system)],is of sedimentary origin. The soil contained50 g C kg�1 soil (fresh wt.) in the 0–25 cm.Experimental plots were under conventional till-age: moldboard – plowed to 20 cm depth in falland disced in spring. The field was planted on May8 1998, May 4 1999, and May 23 2000 with corn(Pioneer hybrid 3905) at a density of 75,000seeds ha�1. Potassium (muriate of potash, 0-0-60)was side-dressed at a rate of 90 kg K2O ha�1
roughly one week before planting.
Experimental design and field layout
Field layout and treatment arrangements are de-tailed in Elmi et al. (2000). Briefly, there were twoWTM treatments: FD with open drains and SIwith a target water table depth of 0.6 m, factori-ally combined with two N fertilizer rates:120(N120)and 200 (N200) kg N ha�1. Diammonium phosphate(18-46-0) was banded at planting to provide approx-imately 24 kg N ha�1 and 130 kg P2O5 ha
�1. Ineach year one month after seeding, 97 and178 kg N ha�1 were broadcast as ammoniumnitrate (34-0-0) for the N120 and N200 treatments,respectively, to reach the desired N levels. Thesesecond applications occurred on June 8, 1998,June 10, 1999 and June 20, 2000.
There were three blocks (120 m wide and 75 mlong) each containing four treatment plots (15 mwide and 75 m length). Blocks were separated by a30 m wide strip of undrained land. In the middleof each plot, 75 mm diameter subsurface drainpipes were laid (1.0 m depth and 30 m spacing) ona 0.3% slope. The SI treatment was imposed twoweeks after planting and maintained until cropmaturity in late September. Subirrigation wasswitched to FD on September 28, 1998, September17, 1999 and September 15, 2000.
Due to deep seepage it was difficult to maintainwater tables at the desired depth. Following heavyrainfall events, pumping was stopped manually inSI plots and excess water drained until a 0.6 mwater table depth was achieved. Three observationwells (pipes) wrapped with geotextile (Zodiac,London, ON) were installed diagonally acrosseach of the treatment and buffer plots to a depth of
230
approximately 1.5 m. A graduated rod with a so-nic water sensor was used to monitor water tablelevels. Rainfall and air temperature data wereobtained from an Environment Canada weatherstation 500 m from the site. Soil temperature wasrecorded using a water-resistant probe thermom-eter [Hanna Instrument, H19024/H19025,(Woonsocket, RI)] inserted at 20 cm depth.
Sampling strategy and analysis
Denitrification rates and N2O were determinedfrom the topsoil (0–15 cm depth) using the intactcore method with and without acetylene (C2H2)inhibition (Ryden et al. 1987). Soil core method issufficiently simple and can be employed routinelyfor the field measurement of denitrification Nlosses. These features make the technique morecommonly applicable than other methods. How-ever, drawbacks with the soil core method in-clude: (1) damage to the experimental plotsthrough large soil sample removals; (2) spatialvariability due to limited sample area; and (3)assumes that the depth of cores (mostly between 0and 15 cm) represents the zones where denitrifi-cation occurs.
Aluminum cylinders (5 cm diameter · 15 cmlong), perforated along the sides in a 0.5 cm grid,were used to collect soil cores. In 1998 and 1999,soil cores (0–15 cm depth) were collected weeklyfrom late May through July, and bi-weekly fromAugust through October, whereas in 2000 sam-pling was performed in each month. On each oc-casion, paired soil cores were taken from arandomly selected non-wheel-tracked row. Soilcylinders were placed in 2-l plastic jars fitted withrubber septa for gas sampling and incubated inshaded outdoors to mimic field conditions for24 h. One of the paired sample was incubated withC2H2 (5% v/v) to inhibit reduction of N2O to N2,which represented a measure of N2O + N2 pro-duction (Yoshinari et al. 1977), and the otherwithout C2H2. The molar ratio of N2O(N2O:N2O + N2) was computed as the ratio ofN2O produced without C2H2 to that producedwith C2H2 (Aulakh et al. 1984).
Headspace gas was thoroughly mixed byinserting a syringe and pumping several timesbefore gas sampling. About 4 ml of headspace gaswere removed from the Jars and injected into a
gas chromatograph [GC, (5870 series II HewlettPackard), Avondale, PA] equipped with a 63Nielectron capture detector (ECD) using Ar:CH4
(95:5) as a carrier gas, with oven and detectortemperatures adjusted to 70 and 400 �C, respec-tively.
To assess NO3�-N concentration, three sets of
soil samples were taken from 0 to 25 cm using ahand-held auger at the same time as sampling fordenitrification measurements. The samples weremixed thoroughly and a 10 g subsample of thefresh soil was shaken with 100 ml of 1 M KCl(1:10 soil: extractant) for 60 min, filtered throughWhatman # 5 filter paper, and frozen beforeNO3
�-N analysis. Nitrate-N was quantified usinga Lachat flow injection autoanalyzer (LachatQuickehem, Milwaukee, WI).
Soil water content was determined by ovendrying soil cores at 105 �C for 48 h. Soul bulkdensity (BD) at each sampling date was deter-mined by the core method and percent water-filledpore space (%WFPS) was then calculated.
Statistical analysis
Analysis of variance (ANOVA) was performedseparately on individual sampling dates. Datawere analyzed as a split plot with WTM treatmentas the main plot and N fertility treatment as thesub-plot, using the interaction between block andthe main plot (WTM treatment) as an error term.Cumulative N2O + N2 and N2O emissions overthe monitoring period were estimated by applyinga linear interpolation between experimentalobservations. Correlation was performed to assessthe relationship between N2O + N2 and N2O andselected soil properties. All statistical analyseswere conducted using Statistical Analysis System,SAS (2000), release 6.12 for Windows (SASInstitute, Cary, NC). Except where noted, differ-ences between values were declared significant atthe 5% probability level.
Results and discussion
Climatic data
There was a substantial variation in the timing andamount of precipitation received during the three
231
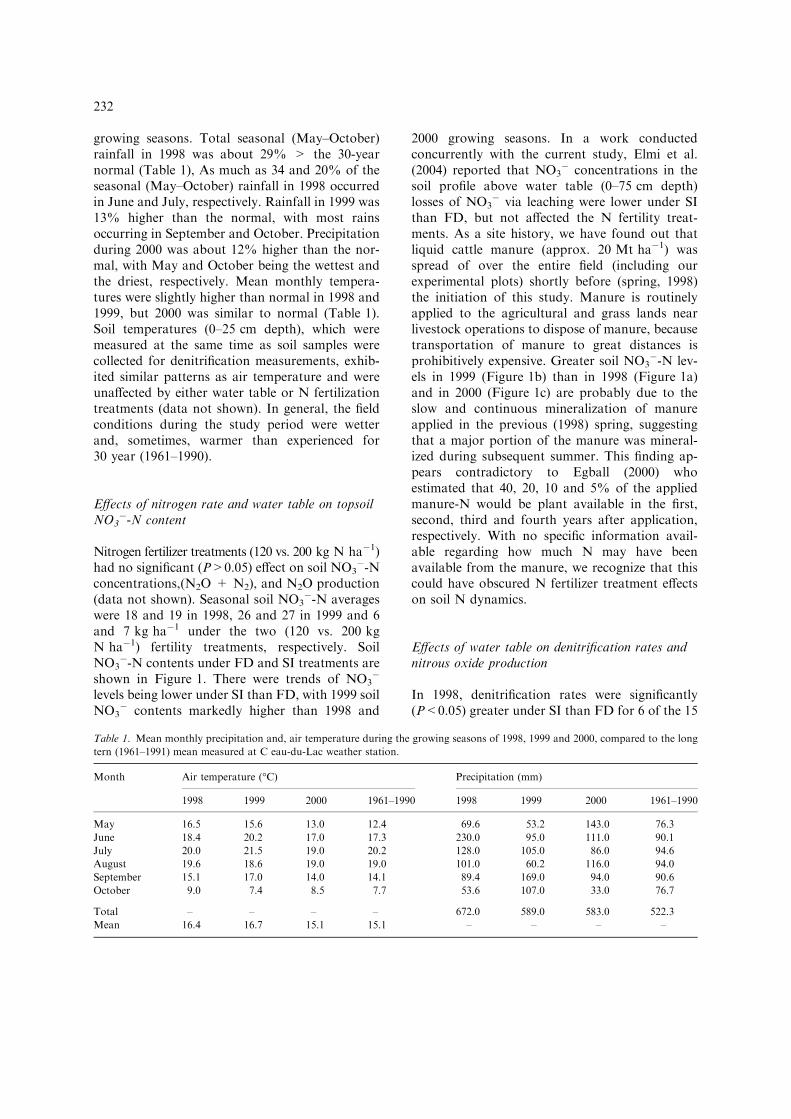
growing seasons. Total seasonal (May–October)rainfall in 1998 was about 29% > the 30-yearnormal (Table 1), As much as 34 and 20% of theseasonal (May–October) rainfall in 1998 occurredin June and July, respectively. Rainfall in 1999 was13% higher than the normal, with most rainsoccurring in September and October. Precipitationduring 2000 was about 12% higher than the nor-mal, with May and October being the wettest andthe driest, respectively. Mean monthly tempera-tures were slightly higher than normal in 1998 and1999, but 2000 was similar to normal (Table 1).Soil temperatures (0–25 cm depth), which weremeasured at the same time as soil samples werecollected for denitrification measurements, exhib-ited similar patterns as air temperature and wereunaffected by either water table or N fertilizationtreatments (data not shown). In general, the fieldconditions during the study period were wetterand, sometimes, warmer than experienced for30 year (1961–1990).
Effects of nitrogen rate and water table on topsoilNO3
�-N content
Nitrogen fertilizer treatments (120 vs. 200 kg N ha�1)had no significant (P>0.05) effect on soil NO3
�-Nconcentrations,(N2O + N2), and N2O production(data not shown). Seasonal soil NO3
�-N averageswere 18 and 19 in 1998, 26 and 27 in 1999 and 6and 7 kg ha�1 under the two (120 vs. 200 kgN ha�1) fertility treatments, respectively. SoilNO3
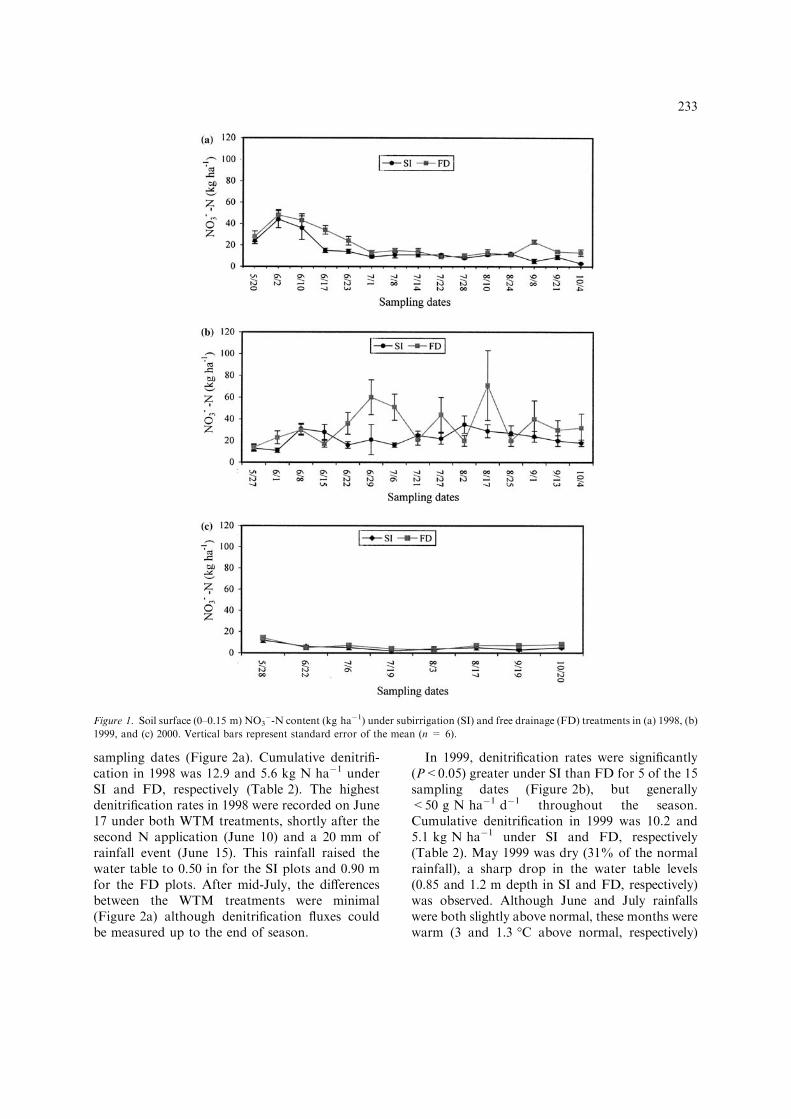
�-N contents under FD and SI treatments areshown in Figure 1. There were trends of NO3
�
levels being lower under SI than FD, with 1999 soilNO3
� contents markedly higher than 1998 and
2000 growing seasons. In a work conductedconcurrently with the current study, Elmi et al.(2004) reported that NO3
� concentrations in thesoil profile above water table (0–75 cm depth)losses of NO3
� via leaching were lower under SIthan FD, but not affected the N fertility treat-ments. As a site history, we have found out thatliquid cattle manure (approx. 20 Mt ha�1) wasspread of over the entire field (including ourexperimental plots) shortly before (spring, 1998)the initiation of this study. Manure is routinelyapplied to the agricultural and grass lands nearlivestock operations to dispose of manure, becausetransportation of manure to great distances isprohibitively expensive. Greater soil NO3
�-N lev-els in 1999 (Figure 1b) than in 1998 (Figure 1a)and in 2000 (Figure 1c) are probably due to theslow and continuous mineralization of manureapplied in the previous (1998) spring, suggestingthat a major portion of the manure was mineral-ized during subsequent summer. This finding ap-pears contradictory to Egball (2000) whoestimated that 40, 20, 10 and 5% of the appliedmanure-N would be plant available in the first,second, third and fourth years after application,respectively. With no specific information avail-able regarding how much N may have beenavailable from the manure, we recognize that thiscould have obscured N fertilizer treatment effectson soil N dynamics.
Effects of water table on denitrification rates andnitrous oxide production
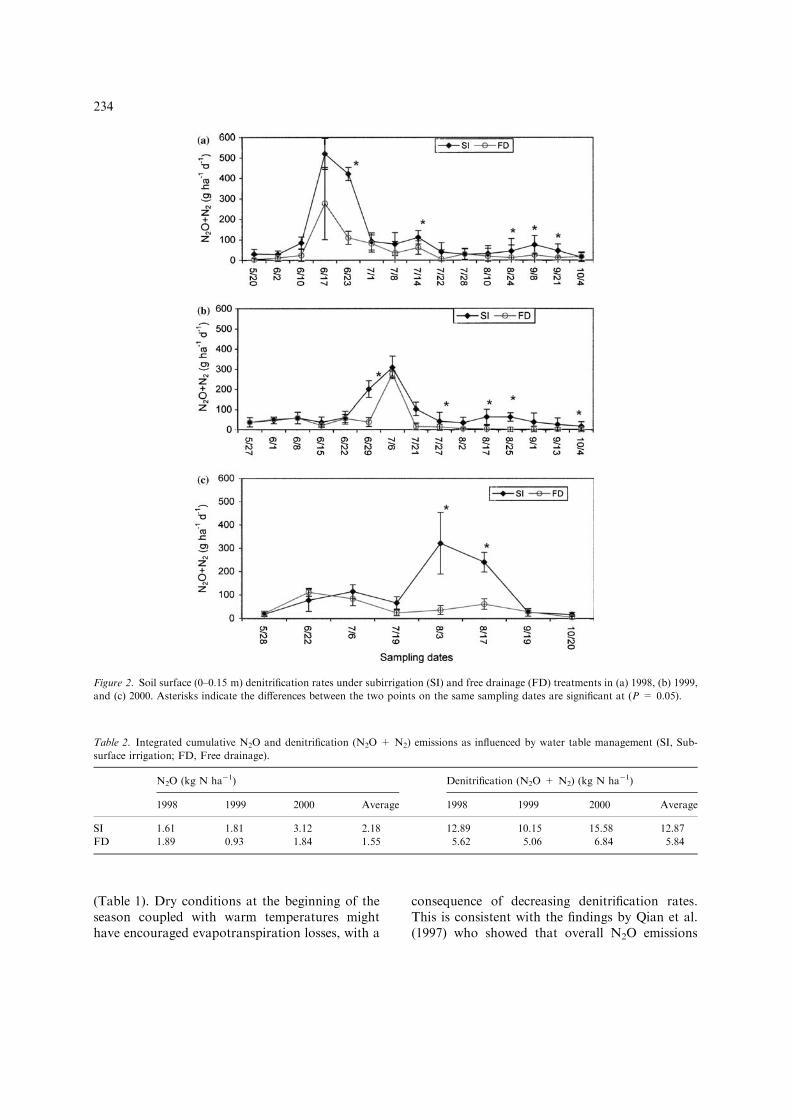
In 1998, denitrification rates were significantly(P<0.05) greater under SI than FD for 6 of the 15
Table 1. Mean monthly precipitation and, air temperature during the growing seasons of 1998, 1999 and 2000, compared to the long
tern (1961–1991) mean measured at C eau-du-Lac weather station.
Month Air temperature (�C) Precipitation (mm)
1998 1999 2000 1961–1990 1998 1999 2000 1961–1990
May 16.5 15.6 13.0 12.4 69.6 53.2 143.0 76.3
June 18.4 20.2 17.0 17.3 230.0 95.0 111.0 90.1
July 20.0 21.5 19.0 20.2 128.0 105.0 86.0 94.6
August 19.6 18.6 19.0 19.0 101.0 60.2 116.0 94.0
September 15.1 17.0 14.0 14.1 89.4 169.0 94.0 90.6
October 9.0 7.4 8.5 7.7 53.6 107.0 33.0 76.7
Total – – – – 672.0 589.0 583.0 522.3
Mean 16.4 16.7 15.1 15.1 – – – –
232
sampling dates (Figure 2a). Cumulative denitrifi-cation in 1998 was 12.9 and 5.6 kg N ha�1 underSI and FD, respectively (Table 2). The highestdenitrification rates in 1998 were recorded on June17 under both WTM treatments, shortly after thesecond N application (June 10) and a 20 mm ofrainfall event (June 15). This rainfall raised thewater table to 0.50 in for the SI plots and 0.90 mfor the FD plots. After mid-July, the differencesbetween the WTM treatments were minimal(Figure 2a) although denitrification fluxes couldbe measured up to the end of season.
In 1999, denitrification rates were significantly(P<0.05) greater under SI than FD for 5 of the 15sampling dates (Figure 2b), but generally<50 g N ha�1 d�1 throughout the season.Cumulative denitrification in 1999 was 10.2 and5.1 kg N ha�1 under SI and FD, respectively(Table 2). May 1999 was dry (31% of the normalrainfall), a sharp drop in the water table levels(0.85 and 1.2 m depth in SI and FD, respectively)was observed. Although June and July rainfallswere both slightly above normal, these months werewarm (3 and 1.3 �C above normal, respectively)
Figure 1. Soil surface (0–0.15 m) NO3�-N content (kg ha�1) under subirrigation (SI) and free drainage (FD) treatments in (a) 1998, (b)
1999, and (c) 2000. Vertical bars represent standard error of the mean (n = 6).
233
(Table 1). Dry conditions at the beginning of theseason coupled with warm temperatures mighthave encouraged evapotranspiration losses, with a
consequence of decreasing denitrification rates.This is consistent with the findings by Qian et al.(1997) who showed that overall N2O emissions
Figure 2. Soil surface (0–0.15 m) denitrification rates under subirrigation (SI) and free drainage (FD) treatments in (a) 1998, (b) 1999,
and (c) 2000. Asterisks indicate the differences between the two points on the same sampling dates are significant at (P = 0.05).
Table 2. Integrated cumulative N2O and denitrification (N2O + N2) emissions as influenced by water table management (SI, Sub-
surface irrigation; FD, Free drainage).
N2O (kg N ha�1) Denitrification (N2O + N2) (kg N ha�1)
1998 1999 2000 Average 1998 1999 2000 Average
SI 1.61 1.81 3.12 2.18 12.89 10.15 15.58 12.87
FD 1.89 0.93 1.84 1.55 5.62 5.06 6.84 5.84
234
were greater in dry growing seasons. During the2000 growing season, the effects of the WTMtreatments were minimal. Under SI, denitrificationpeaked from August 3 to 17 (Figure 2c).
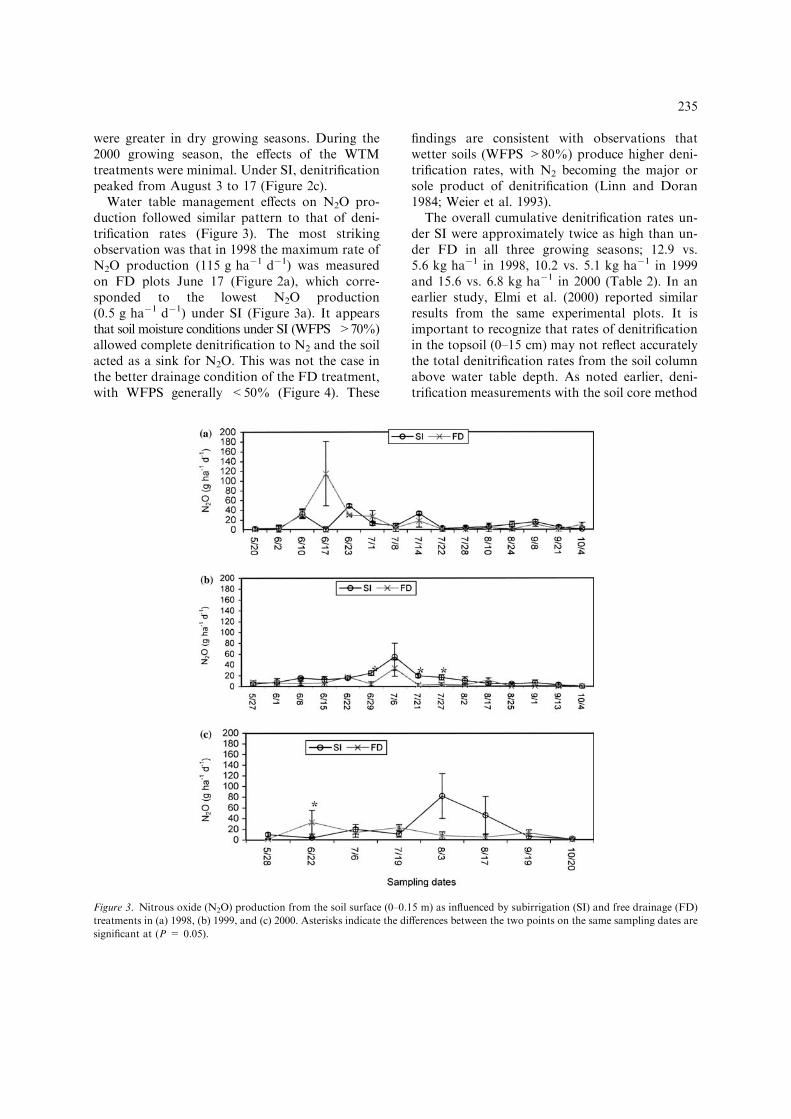
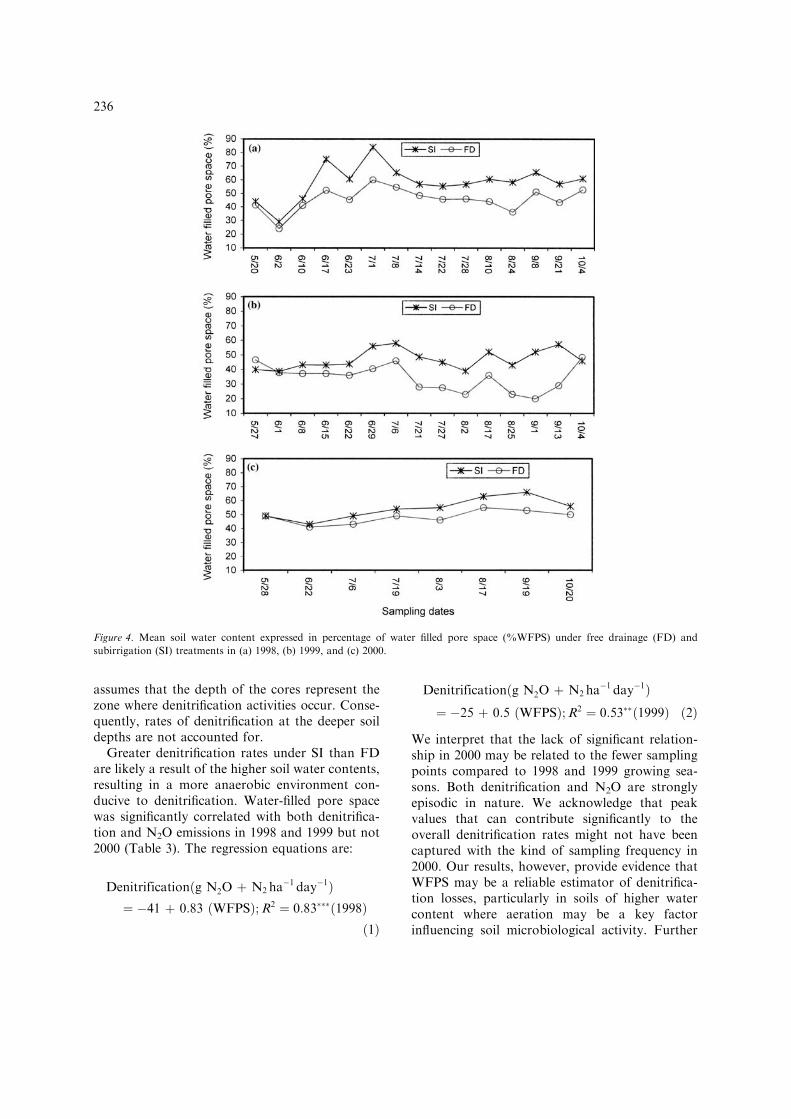
Water table management effects on N2O pro-duction followed similar pattern to that of deni-trification rates (Figure 3). The most strikingobservation was that in 1998 the maximum rate ofN2O production (115 g ha�1 d�1) was measuredon FD plots June 17 (Figure 2a), which corre-sponded to the lowest N2O production(0.5 g ha�1 d�1) under SI (Figure 3a). It appearsthat soil moisture conditions under SI (WFPS >70%)allowed complete denitrification to N2 and the soilacted as a sink for N2O. This was not the case inthe better drainage condition of the FD treatment,with WFPS generally <50% (Figure 4). These
findings are consistent with observations thatwetter soils (WFPS >80%) produce higher deni-trification rates, with N2 becoming the major orsole product of denitrification (Linn and Doran1984; Weier et al. 1993).
The overall cumulative denitrification rates un-der SI were approximately twice as high than un-der FD in all three growing seasons; 12.9 vs.5.6 kg ha�1 in 1998, 10.2 vs. 5.1 kg ha�1 in 1999and 15.6 vs. 6.8 kg ha�1 in 2000 (Table 2). In anearlier study, Elmi et al. (2000) reported similarresults from the same experimental plots. It isimportant to recognize that rates of denitrificationin the topsoil (0–15 cm) may not reflect accuratelythe total denitrification rates from the soil columnabove water table depth. As noted earlier, deni-trification measurements with the soil core method
Figure 3. Nitrous oxide (N2O) production from the soil surface (0–0.15 m) as influenced by subirrigation (SI) and free drainage (FD)
treatments in (a) 1998, (b) 1999, and (c) 2000. Asterisks indicate the differences between the two points on the same sampling dates are
significant at (P = 0.05).
235
assumes that the depth of the cores represent thezone where denitrification activities occur. Conse-quently, rates of denitrification at the deeper soildepths are not accounted for.
Greater denitrification rates under SI than FDare likely a result of the higher soil water contents,resulting in a more anaerobic environment con-ducive to denitrification. Water-filled pore spacewas significantly correlated with both denitrifica-tion and N2O emissions in 1998 and 1999 but not2000 (Table 3). The regression equations are:
Denitrificationðg N2O þ N2 ha�1 day�1Þ
¼ �41 þ 0:83 ðWFPSÞ;R2 ¼ 0:83���ð1998Þð1Þ
Denitrificationðg N2O þ N2 ha�1 day�1Þ
¼ �25 þ 0:5 ðWFPSÞ;R2 ¼ 0:53��ð1999Þ ð2Þ
We interpret that the lack of significant relation-ship in 2000 may be related to the fewer samplingpoints compared to 1998 and 1999 growing sea-sons. Both denitrification and N2O are stronglyepisodic in nature. We acknowledge that peakvalues that can contribute significantly to theoverall denitrification rates might not have beencaptured with the kind of sampling frequency in2000. Our results, however, provide evidence thatWFPS may be a reliable estimator of denitrifica-tion losses, particularly in soils of higher watercontent where aeration may be a key factorinfluencing soil microbiological activity. Further
Figure 4. Mean soil water content expressed in percentage of water filled pore space (%WFPS) under free drainage (FD) and
subirrigation (SI) treatments in (a) 1998, (b) 1999, and (c) 2000.
236
indication of the critical role of soil moisture incontrolling denitrification is demonstrated by thelower denitrification rates in 1999 and 2000 duringwhich WFPS values were generally <60% (Fig-ure 4b, c). This WFPS threshold has been identi-fied as the point below which denitrification islimited (Weier et al. 1993; Granli and Bøckman1994).
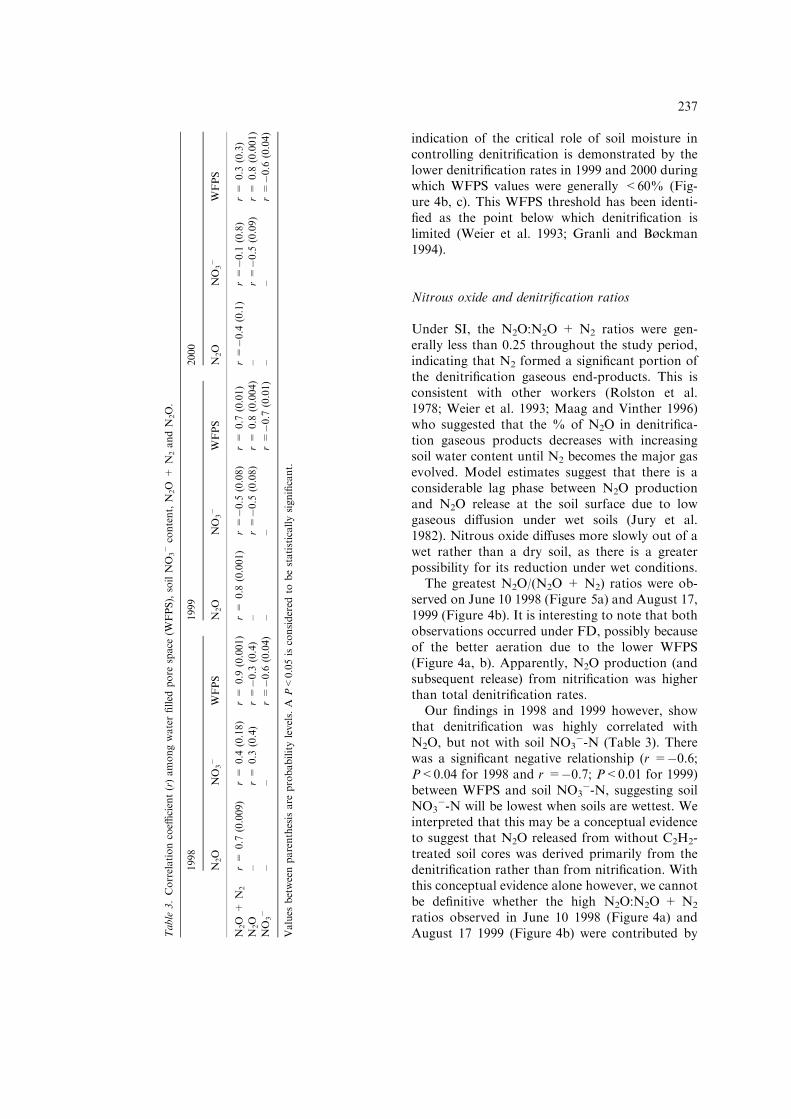
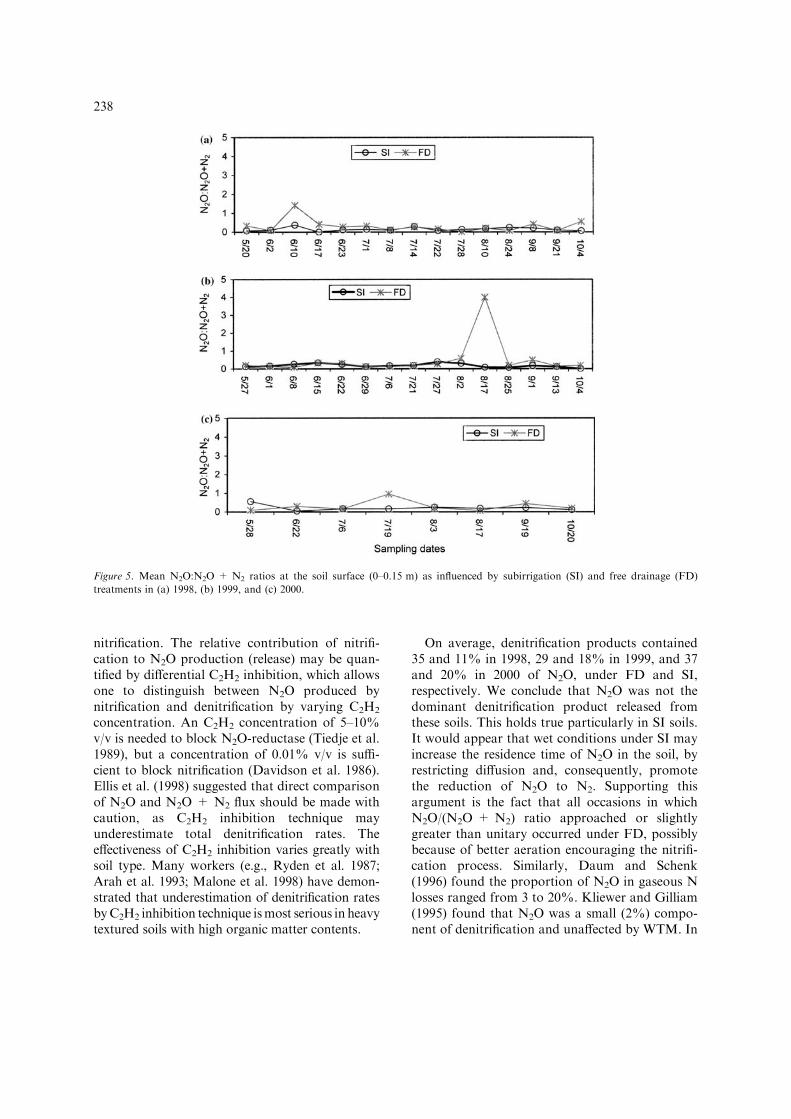
Nitrous oxide and denitrification ratios
Under SI, the N2O:N2O + N2 ratios were gen-erally less than 0.25 throughout the study period,indicating that N2 formed a significant portion ofthe denitrification gaseous end-products. This isconsistent with other workers (Rolston et al.1978; Weier et al. 1993; Maag and Vinther 1996)who suggested that the % of N2O in denitrifica-tion gaseous products decreases with increasingsoil water content until N2 becomes the major gasevolved. Model estimates suggest that there is aconsiderable lag phase between N2O productionand N2O release at the soil surface due to lowgaseous diffusion under wet soils (Jury et al.1982). Nitrous oxide diffuses more slowly out of awet rather than a dry soil, as there is a greaterpossibility for its reduction under wet conditions.
The greatest N2O/(N2O + N2) ratios were ob-served on June 10 1998 (Figure 5a) and August 17,1999 (Figure 4b). It is interesting to note that bothobservations occurred under FD, possibly becauseof the better aeration due to the lower WFPS(Figure 4a, b). Apparently, N2O production (andsubsequent release) from nitrification was higherthan total denitrification rates.
Our findings in 1998 and 1999 however, showthat denitrification was highly correlated withN2O, but not with soil NO3
�-N (Table 3). Therewas a significant negative relationship (r =�0.6;P<0.04 for 1998 and r =�0.7; P<0.01 for 1999)between WFPS and soil NO3
�-N, suggesting soilNO3
�-N will be lowest when soils are wettest. Weinterpreted that this may be a conceptual evidenceto suggest that N2O released from without C2H2-treated soil cores was derived primarily from thedenitrification rather than from nitrification. Withthis conceptual evidence alone however, we cannotbe definitive whether the high N2O:N2O + N2
ratios observed in June 10 1998 (Figure 4a) andAugust 17 1999 (Figure 4b) were contributed byT
able
3.Correlationcoeffi
cient(r)amongwaterfilled
pore
space
(WFPS),soilNO
3�content,N
2O
+N
2andN
2O.
1998
1999
2000
N2O
NO
3�
WFPS
N2O
NO
3�
WFPS
N2O
NO
3�
WFPS
N2O
+N
2r=
0.7
(0.009)
r=
0.4
(0.18)
r=
0.9
(0.001)
r=
0.8
(0.001)
r=�0.5
(0.08)
r=
0.7
(0.01)
r=�0.4
(0.1)
r=�0.1
(0.8)
r=
0.3
(0.3)
N2O
–r=
0.3
(0.4)
r=�0.3
(0.4)
–r=�0.5
(0.08)
r=
0.8
(0.004)
–r=�0.5
(0.09)
r=
0.8
(0.001)
NO
3�
––
r=�0.6
(0.04)
––
r=�0.7
(0.01)
––
r=�0.6
(0.04)
Values
betweenparenthesisare
probabilitylevels.A
P<0.05isconsidered
tobestatisticallysignificant.
237
nitrification. The relative contribution of nitrifi-cation to N2O production (release) may be quan-tified by differential C2H2 inhibition, which allowsone to distinguish between N2O produced bynitrification and denitrification by varying C2H2
concentration. An C2H2 concentration of 5–10%v/v is needed to block N2O-reductase (Tiedje et al.1989), but a concentration of 0.01% v/v is suffi-cient to block nitrification (Davidson et al. 1986).Ellis et al. (1998) suggested that direct comparisonof N2O and N2O + N2 flux should be made withcaution, as C2H2 inhibition technique mayunderestimate total denitrification rates. Theeffectiveness of C2H2 inhibition varies greatly withsoil type. Many workers (e.g., Ryden et al. 1987;Arah et al. 1993; Malone et al. 1998) have demon-strated that underestimation of denitrification ratesbyC2H2 inhibition technique ismost serious in heavytextured soils with high organic matter contents.
On average, denitrification products contained35 and 11% in 1998, 29 and 18% in 1999, and 37and 20% in 2000 of N2O, under FD and SI,respectively. We conclude that N2O was not thedominant denitrification product released fromthese soils. This holds true particularly in SI soils.It would appear that wet conditions under SI mayincrease the residence time of N2O in the soil, byrestricting diffusion and, consequently, promotethe reduction of N2O to N2. Supporting thisargument is the fact that all occasions in whichN2O/(N2O + N2) ratio approached or slightlygreater than unitary occurred under FD, possiblybecause of better aeration encouraging the nitrifi-cation process. Similarly, Daum and Schenk(1996) found the proportion of N2O in gaseous Nlosses ranged from 3 to 20%. Kliewer and Gilliam(1995) found that N2O was a small (2%) compo-nent of denitrification and unaffected by WTM. In
Figure 5. Mean N2O:N2O + N2 ratios at the soil surface (0–0.15 m) as influenced by subirrigation (SI) and free drainage (FD)
treatments in (a) 1998, (b) 1999, and (c) 2000.
238
their study, water tables were controlled at muchshallower depth than ours (15 cm), which appar-ently promoted a complete reduction of N2O toN2. This kind of shallow water tables can only berecommended for non-growing season application,in order not to interfere with the crop growth andfield operations. For WTM system to be success-ful, water table depth must be high enough topermit capillary rise into the root zone and lowenough to ensure adequate soil aeration and fieldtrafficability.
Conclusions
Reduction of N2O to N2 by denitrifiers is animportant natural sink for N2O. Although deni-trification rates were greater under SI than FD, thequantity of N2O evolved to the atmosphere wassimilar for the two WTM treatments. This is anindication that N2O + N2 losses were greater inwet soils, but that N2O comprised a minor part ofthe total N gaseous emissions. These findingsconfirm the importance of assessingN2O:N2O + N2 losses to gain a better under-standing of the ecological significance of denitrifi-cation. WFPS was highly correlated withdenitrification losses, with greater losses producedas the water content of the pore spaces increase.Higher WFPS in 1998 facilitated a complete pre-dominance of denitrification to N2, with N2Ocomprising only a minor fraction of the total Ngaseous emissions. We found that denitrificationrates and N2O production were not affected by Nfertilizer treatments in our corn agroecosystem.This observation was likely influenced by N sup-plied from other sources such as mineralization ofmanure applied shortly before this study was ini-tiated. Therefore, this questions the generalassumption that lowering N fertilizer rate is in allcases a sufficient strategy to reduce N2O emissions.
Acknowledgements
The authors thank owners of the research site fortheir willingness to contribute to scientific knowl-edge, Peter Enright and Peter Kirby for their fieldtechnical assistance. We also thank two anony-mous reviewers for their useful suggestions, which
helped us sharpen the focus of the paper. Thisresearch was supported by a Natural Sciences andEngineering Research Council of Canada(NSERC) grant.
References
Arah J.R.M., Crichton I.J. and Smith K.A. 1993. Denitrifica-
tion measured directly using a single-inlet mass spectrometry
and acetylene inhibition. Soil Biol. Biochem. 25: 233–238.
Aulakh M.S., Renie D.A. and Paul E.A. 1984. Gaseous N
losses from soil under zero-till compared with conventional-
till management systems. J. Environ. Qual. 13: 130–136.
Cooper R.L., Fausey N.R. and Johnson J.W. 1999. Yield
response of corn to a subirrigation/drainage management
system in northern Ohio. J. Prod. Agric. 12: 74–77.
Daum D. and Schenk M.K. 1996. Gaseous nitrogen losses from
a soilless culture system in the greenhouse. Plant Soil 183:
69–78.
Davidson E.A., Swank W.T. and Perry T.O. 1986. Distin-
guishing between nitrification and denitrification as sources
of gaseous nitrogen production in soil. Appl. Environ.
Microbiol. 52: 1280–1286.
Drury C.F., Tan C.S., Gaynor J.D., Oloyo T.O. and Welacky
T.W. 1996. Influence of controlled drainage-subirrigation on
surface and tile drainage nitrate loss. J. Environ. Qual.
25: 317–324.
Eghball B. 2000. Nitrogen mineralization from field-applied
beef cattle feedlot manure or compost. Soil Sci. Soc. Am. J.
64: 2024–2030.
Ellis S., Yamulk E., Dixon R., Harrison R. and Jarvis S.C.
1998. Denitrification and N2O emissions from a UK pasture
soil following early spring application of cattle slurry and
mineral fertiliser. Plant Soil 202: 15–25.
Elmi A.A., Madramootoo C., Egeh M. and Hamel C. 2004.
Water and fertilizer nitrogen management to minimize nitrate
pollution from a cropped soil in southwestern Quebec,
Canada. Water Air Soil Pollut. 151: 117–134.
Elmi A.A., Madramootoo C., Egeh M., Liu A. and Hamel C.
2002a. Environmental and agronomic implications of water
table and nitrogen fertilization management. J. Environ.
Qual. 31: 1858–1867.
Elmi A.A., Madramootoo C., Egeh M., Dodds G. and Hamel
C. 2002b. Water table management as a natural bio-reme-
diation technique of nitrate pollution. Water Qual. Res. J.
Can. 37: 563–576.
Elmi A.A., Madramootoo C. and Hamel C. 2000. Influence
of water table and nitrogen management on residual soil
NO3� and denitirification rate in under corn production in
sandy loam soil in Quebec. Agric. Ecosyst. Environ. 79: 187–
197.
Granli T. and Bøckman O. 1994. Nitrous oxide from agricul-
ture. Nor. J. Agric. Sci., 12: 7–127.
Intergovernmental Panel on Climate Change (IPCC) 2001.
Climate change 2001. The scientific basis. Cambridge Univ.
Press, Cambridge, U.K.
Isemann K. 1994. Agriculture’s share in the emission of trace
gases affecting the climate change and some cause-oriented
239
proposals for reducing this share. Environ. Pollut. 83:
95–111.
Jacinthe P.A., Dick W.A. and Brown L.C. 2000. Bioremedia-
tion of nitrate-contaminated shallow soils using water table
management techniques: production and evolution of nitrous
oxide. Soil Biol. Biochem. 32: 371–382.
Jury W.A., Letey J. and Collins T. 1982. Analysis of chamber
methods used for measuring nitrous oxide production in the
field. Soil Sci. Soc. Am. J. 46: 250–256.
Kalita P.K. and Kanwar R.S. 1993. Effect of water table
management practices on the transport of nitrate-N to shal-
low groundwater. Trans ASAE. 36: 413–421.
Kliewer B.A. and Gilliam J.W. 1995. Water management effects
on denitrification and nitrous oxide evolution. Soil Sci. Soc.
Am. J. 59: 1694–1701.
Linn D. and Doran J. 1984. Effect of water-filled pore space on
carbon dioxide and nitrous oxide production in tilled and
nontilled soils. Soil Sci. Soc. Am. J. 48: 1267–1272.
Maag M. and Vinther F.P. 1996. Nitrous oxide emission by
nitrification and denitrification in different soil types and at
different soil moisture contents and temperatures. Appl. Soil
Ecol. 4: 5–15.
Malone J.P., Stevens R.J. and Laughlin R.J. 1998. Combining
the 15N and acetylene inhibition techniques to examine the
effects of acetylene on denitrification. Soil Boil. Biochem.
30: 31–37.
Qian J.H., Doran J.W., Weier K.L., Mosier A.R., Peterson
T.A. and Power J.F. 1997. Soil denitrification and nitrous
oxide losses under corn irrigated with high-nitrate ground-
water. J. Environ. Qual. 26: 348–360.
Rolston D.E., Hoffman D.L. and Toy D.W. 1978. Field mea-
surement of denitrification: I. Flux of N2 and N2O. Soil Sci.
Soc. Am. J. 42: 863–869.
Ryden J.C., Skinner J.H. and Nixon D.J. 1987. Soil core incu-
bation system for the field measurement of denitrification using
acetylene inhibition method. Soil Biol. Biochem. 19: 753–757.
SAS Institute Inc. 2000. SAS Online Doce�, Version 9.0. SAS
Institute Inc., North Carolina.
Tiedje J.M., Simkins S. and Groffman P.M. 1989. Perspectives
on measurement of denitrification in the field including rec-
ommended protocols for acetylene based methods. Soil Plant
115: 261–284.
Weier K.L., Doran J.W., Power J.F. and Walters D.T. 1993.
Denitrification and the dintrogen/nitrous oxide ratio as af-
fected by soil water, available carbon, and nitrate. Soil Sci.
Soc. Am. J. 57: 66–72.
Yashinari T., Hynes R. and Knowles R. 1977. Acetylene in-
hibition of nitrous oxide reduction and measurement of de-
nitrification and nitrogen fixation in soil. Soil Biol. Biochem.
9: 177–183.
240