Embed Size (px)
Citation preview

Journal of Hydrology 524 (2015) 1–14
Contents lists available at ScienceDirect
Journal of Hydrology
journal homepage: www.elsevier .com/ locate / jhydrol
Groundwater age investigation of eskers in the Amos region, Quebec,Canada
http://dx.doi.org/10.1016/j.jhydrol.2015.01.0720022-1694/� 2015 Elsevier B.V. All rights reserved.
⇑ Corresponding author at: GEOTOP and Département des sciences de la Terre etde l’atmosphère, Université du Québec à Montréal, CP8888 succ. Centre-Ville,Montréal, QC, Canada. Tel.: +1 514 987 3000/2572; fax: +1 514 987 3635.
E-mail address: [email protected] (D.L. Pinti).
Christine Boucher a, Daniele L. Pinti a,d,⇑, Martin Roy a, M. Clara Castro b, Vincent Cloutier c,Daniel Blanchette c, Marie Larocque a, Chris M. Hall b, Tao Wen b, Yuji Sano d
a GEOTOP and Département des sciences de la Terre et de l’atmosphère, Université du Québec à Montréal, CP8888 succ. Centre-Ville, Montréal, QC, Canadab Department of Earth and Environmental Sciences, University of Michigan, 1100 N. University, Ann Arbor, MI 48109-1005, USAc Groupe de recherche sur l’eau souterraine, Institut de recherche en mines et en environnement, Université du Québec en Abitibi-Témiscamingue, Campus d’Amos, Amos, QC, Canadad Atmosphere and Ocean Research Institute, The University of Tokyo, Kashiwa, Chiba 277-8564, Japan
a r t i c l e i n f o s u m m a r y
Article history:Received 7 February 2014Received in revised form 9 January 2015Accepted 30 January 2015Available online 16 February 2015This manuscript was handled by LaurentCharlet, Editor-in-Chief, with the assistanceof Nico Goldscheider, Associate Editor
Keywords:EskerGroundwater age3H/3HeU–Th/4HeHelium fluxAbitibi-Temiscamingue
Noble gases, in particular 3He/4He (R) ratios, were measured together with tritium activity in groundwa-ter from eskers and moraines of the Abitibi-Temiscamingue region of northwestern Quebec (easternCanada). These high-latitude glaciofluvial landforms contain precious freshwater resources that needto be quantified. Here we provide estimates of residence time for groundwater in glaciofluvial sedimentsforming the Saint-Mathieu–Berry (SMB) and Barraute eskers, the Harricana moraine and in the underly-ing fractured bedrock aquifer. The 3He/4He ratios range from 0.224 ± 0.012 to 1.849 ± 0.036Ra, where Rais the atmospheric 3He/4He ratio (1.386 � 10�6). These results suggest the occurrence of 3He produced bydecay of tritium and terrigenic 4He produced by decay of U and Th. Calculated 3H/3He apparent ages ofgroundwater from the SMB esker and the Harricana moraine range from 6.6 ± 1.1 a to 32 ± 7.4 a.Terrigenic 4He (4Heterr) was found in the deeper wells of the SMB esker and in the wells tapping waterfrom the deeper fractured aquifer located below the eskers and moraines and confined by postglacialclays. The amount of 4Heterr ranges from 3.4 � 10�9 to 2.2 � 10�6 cm3STP g�1 and shows a clear gradientwith depth, suggesting addition of a 4Heterr flux entering the bottom of the eskers. Modeled 4Heterr fluxesrange from 2.0 � 10�8 cm3STP cm�2 yr�1 at the Harricana moraine to 6.6 � 10�7 cm3STP cm�2 yr�1 in thesouthern section of the SMB esker. Calculated fluxes are highly variable and 5–165 times lower than thehelium continental crustal flux, suggesting local helium sources, with helium being driven upwardthrough preferential pathways such as local faults. Maximum U–Th/4He ages obtained for the groundwa-ter in the fractured bedrock range from 1473 ± 300 a to 137 ± 28 ka, suggesting the occurrence of severalgenerations of fossil meltwater trapped under the clay plain after the last two glaciations.
� 2015 Elsevier B.V. All rights reserved.
1. Introduction
Continental areas of the Northern Hemisphere, notably Canada,were severely affected by ice cover during the late Pliocene andPleistocene. A wide range of glacial and deglacial landforms wereformed during this period, notably eskers, which consist in long,linear and relatively narrow ridges composed of stratified sandand gravel. Eskers were mainly deposited within ice-walled tun-nels by highly organized meltwater flow systems (e.g., Banerjeeand McDonald, 1975; Shilts et al., 1987; Clark and Walder, 1994).Moraines also represent heterogeneous accumulations of sand
and gravel that were generally deposited at or near the ice marginduring ice retreat. From a hydrogeological perspective, these land-forms (eskers and moraines) may be considered equivalent entitiesdue to their similar composition (sorted granular material).
The last deglaciation in the Abitibi-Temiscamingue region,Quebec (Fig. 1), was marked by the breakup of the ice margin intotwo lobes, as recorded by the Harricana interlobate moraine, a largebody of sand and gravel oriented north–south that extends for sev-eral hundred kilometers (Veillette, 1996; Dyke, 2004). Ice retreatresulted in the deposition of eskers that show two different trends:those oriented NW–SE to the west of the Harricana moraine, andthose oriented NE–SW to the east of this major landform (Veilletteet al., 2004, 2007). Meltwater produced during the deglaciation alsoled to the development of Lake Ojibway, a large proglacial lake thatinundated the area. As a result, thick accumulations of fine-grained

2 C. Boucher et al. / Journal of Hydrology 524 (2015) 1–14
rhythmites (clay and silt) cover entirely or partially most eskers,thereby forming confined or semi-confined aquifers, with porosityreaching up to 30% near the core of the landform. The groundwaterhas generally very low salinity and excellent organoleptic character-istics as drinking water, which is commercialized as the bottledwater ESKA� near the city of Amos. Accordingly, these eskers andthe Harricana moraine represent an important water resource inthis area, as its quality is superior to slightly salty groundwater fromthe fractured bedrock. The hydraulic regime of these systems is notfully understood, mainly because of the spatial complexity andheterogeneous character of these glaciofluvial deposits (Boultonet al., 1995, 2009).
The hydrogeology of this area has been recently the focus of astudy by the Université du Québec en Abitibi-Témiscamingue (UQAT)(Cloutier et al., 2011, 2013). The goals of this study were to betterunderstand the hydraulic regime of eskers and moraines, and toassess their potential as a long-term source of drinking water inthe region, as well as to evaluate their vulnerability to pollution(Cloutier et al., 2013). Except for a few unpublished 14C ages(Riverin, 2006) and 3H measurements (Castelli, 2012), there areno chronological constraints on the groundwater of this region.The aim of this work was to fill this gap by producing 3H/3Heand U–Th/4He residence times based on noble gases measurementsof groundwater, and to provide a basis for future high-resolutiongroundwater age surveys.
2. Geology and hydrogeology of the studied area
The study area (Fig. 1a) has a surface area of 860 km2 andincludes the municipalities of Amos, Barraute, La Motte and Landri-enne, in Abitibi-Temiscamingue, Quebec, Canada. This region lieson crystalline bedrock of the Canadian Shield, more specificallyin the Abitibi greenstone belt of the Superior Province, which isupper Archean in age (2.85–2.65 Ga). The bedrock is composed ofmafic to intermediate volcanic rocks intercepted by lenses of felsicvolcanic rocks and metasediment belts (wacke, conglomerates andiron formations). These lithologies are intruded by Archean graniticand tonalitic plutons (and later by Proterozoic diabases) and cross-cut by gneissic rocks (Weber and Latulippe, 1964). Precambrianmetamorphic rocks constitute an aquifer characterized by a lowhydraulic conductivity whose potential increases locally withfractures and fissures (Cloutier et al., 2007).
The Abitibi-Temiscamingue region was completely covered bythe Laurentide Ice Sheet during the last glacial cycle and deglacia-tion began at �9 ka (Dyke, 2004). Progressive thinning of the icemargin led to the isolation of the Hudson Bay ice dome and theNew-Quebec ice dome, in between which a major complex ofglaciofluvial sediments was deposited (the Harricana interlobatemoraine; Fig. 1) along with a dense network of eskers (Veilletteet al., 2003). Subsequent ice retreat occurred away from theHarricana glaciofluvial sediment complex, toward the northwestand northeast, in contact with the waters of glacial Lake Ojibway(Veillette, 1994; Roy et al., 2011). These deglacial landforms arecomposed of heterometric and chaotic accumulations of pebble,gravel and sand derived from the glacial erosion of the localArchean bedrock (Veillette et al., 2004). The study area is crossed,from west to east, by three major glaciofluvial bodies: theSaint-Mathieu–Berry (hereafter denoted as SMB) esker, theHarricana interlobate moraine and the Barraute esker (Fig. 1a).The SMB esker is 120 km in length, 25–45 m thick, and 1–5 kmwide. The Harricana moraine is the most voluminous in the region,with a total length of 278 km and a maximum width of 4.4 km.The Barraute esker is 20 km in length, with height and widthresembling the SMB esker.
Eskers and moraine are deposited on the Precambrian bedrock,sometimes separated by glacial deposits (tills). Glacial deposits
can be continuous with a thickness of several meters or discon-tinuous with a thickness of less than 1 meter (Cloutier et al.,2013). Often isolated patches of tills are found in glaciallyscoured bedrock depressions, protected from glacial erosion. Theextension of these deposits under the eskers is difficult toevaluate because they are often mixed with glaciofluvialdeposits (Cloutier et al., 2013).
The presence of Lake Ojibway left a strong imprint on the land-scape (Roy et al., 2011). Thick accumulations of fine-grainedglaciolacustrine sediments cover most deglacial features (eskersand ice-marginal deposits, such as moraines). The vast expansesof Ojibway clay form a very low permeability unit, which mightconfine totally or partially the esker’s aquifers (Veillette et al.,2004). The Ojibway clay plain is broken in places by rare bedrockknobs (hills) and the crests of some eskers or the Harricana moraine(Fig. 1a). Eskers deposited near the former lake level may bereworked into beaches onto their crests or flanks, whereas eskersdeposited in deep-water conditions may be associated withsubaqueous outwash fans.
This particular depositional environment led to a classificationof eskers of the Abitibi-Temiscamingue region into four types(A–D) on the basis of the depositional setting and sedimentologicalcharacteristics of the confined and unconfined eskers (Veilletteet al., 2004, 2007; Nadeau, 2011). In the study area, eskers are oftype C, which consists in eskers and moraines partially confinedby clay (SMB and Harricana), and of type D that consists ineskers completely buried by clay (parts of SMB and Barraute).This classification may vary for a given esker, mainly due tochanges in the clay cover along its length. Direct recharge fromprecipitation occurs in partially confined aquifers (eskers type C)while recharge areas of buried landforms (such as Barraute esker)remain to be fully determined. For example, the Harricanamoraine, located about 10 km to the west of the buried Barrauteesker, could correspond to its recharge zone (Veillette et al.,2007). This moraine, partially covered by clays and characterizedby a high permeability, is directly recharged by rainfall. According-ly, water from this formation is expected to be young. South of thismoraine, the elevated zone of Mont Video (Fig. 1a) could be apreferential recharge zone for both the Harricana moraine andthe nearby Barraute esker (buried). In the SMB esker, two typesof flow were documented (Riverin, 2006). One is longitudinaland controlled by the topography of bedrock, with water movingfrom the southern and northern elevated zones toward the centerof the esker. The second flow is transversal to the esker andoriginates from infiltration toward the edge of the esker and issubsequently diffused into bogs or contact zones between clayand gravel.
Groundwater flows rapidly within the highly porous (porosity�25–30%) and permeable gravel aquifers formed by eskers. Adetailed geochemical study of springs associated with eskersshowed that the water is mainly of Ca–HCO3 type, with averagetotal dissolved solids (TDS) of 87 mg L�1 (Castelli et al., 2011).However, the bedrock is locally fractured and local aquifers showhigher salinities reaching 760 mg L�1 (Table 1). Riverin (2006) esti-mated qualitatively groundwater residence times for the SMBesker. Tritium (3H) measurements and uncorrected 14C ages point-ed to the presence of an active (top part of the aquifer) and a lessactive (lower portions of the confined aquifer) flow zones. Based onuncorrected 14C ages, these zones might contain modern (1–25 a),intermediate (300–6000 a) and fossil groundwater (>6000 a)(Riverin, 2006).
3. Sampling and analytical methods
A total of fifteen groundwater samples (Fig. 1a; Tables 1 and 3)were collected in the study area during the summers of 2011

Fig. 1. (a) Schematic geographical map of the study area with the localization of samples in Saint-Mathieu–Berry and Barraute eskers (white dots), in the Harricanainterlobate moraine (black dots) and from the fractured rock aquifer under the clay plain (gray squares); (b) with 3H/3He groundwater apparent ages and U–Th/4He ages (inbold).
C. Boucher et al. / Journal of Hydrology 524 (2015) 1–14 3
(12 samples) and 2012 (3 samples). In the fractured bedrock aqui-fer underlying the clay plain, one sample was collected from themunicipality well of Landrienne and two others located in thesame aquifer were collected from domestic wells (101CH and55HB; Fig. 1a). Two wells drilled by the Ministry of Environmentof the Province of Quebec (MDDEP-S and MDDEP-P) and one welldrilled by UQAT (PACES 1-03) were sampled from the Harricanamoraine. The municipal well of Barraute was sampled from theBarraute esker. The Amos municipal well and seven wells drilledand instrumented by UQAT were sampled from the SMB esker
(TSAM-P1, P2, TSSM-P1, P3, P5, PACES 1-12, 1-13). One of them,TSSMP-3, is a flowing artesian well.
Wells in the fractured bedrock (Landrienne, 55HB and 101CH)have no casing. All other MDDEP and UQAT drilled wells have acasing and short screens of 1.5 m long, except for well TSSM-P5(3 m) and Barraute (4.6 m; Table 2). Amos municipality is amultidrain well (Feldman-type), consisting of 8 horizontal drainsdeparting from the base of the vertical borehole with lengthsvariable between 7.2 and 45.8 m and a diameter of 0.2 m. Screenscover between 70% and 90% of the drain’s length.

Table 1Noble gas concentrations and He, Ne and Ar isotopic ratios in groundwater of Amos region, Abitibi-Temiscamingue.
Well name Coordinates Coordinates Altitude Welldepth
TDS T pH 4He 20Ne 36Ar 84Kr 132Xe (3He/4He)meas20Ne 2Ne 21Ne/22Ne 38Ar/36Ar 40Ar/36Ar
Longitude Latitude (m) (m) (mg L�1) (�C) cm3STP g�1 � 10�7 (3He/4He)AIR
UTM NAD 83Z17
R/Ra
Saint-Mathieu–Berry eskerAmos
municipality706095 5379631 312.3 23.34 106 9.4 8.3 0.59 1.83 13.56 0.521 0.0362 1.849 ± 0.036 9.91 0.03 0.0278 ± 0.0002 0.1880 ± 0.0010 294.4 ± 1.0
PACES 1-12 707125 5370880 337.9 53.51 103 5.8 8.6 12.87 2.06 n.d. n.d. n.d. 0.225 ± 0.004 n.d n.d. n.d. ± n.d. n.d. ± n.d. n.d. ± n.d.PACES 1-13 707122 5370884 337.9 22.87 86 6.0 8.9 0.69 2.86 n.d. n.d. n.d. 1.007 ± 0.012 n.d n.d. n.d. ± n.d. n.d. ± n.d. n.d. ± n.d.TSAM-P1 706783 5379259 310.0 10.50 92 13.7 8.5 0.54 1.79 12.56 0.469 0.0318 1.193 ± 0.064 9.90 0.03 0.0278 ± 0.0002 0.1854 ± 0.0006 294.5 ± 0.7TSAM-P2 706782 5379258 310.6 16.46 128 12.2 8.3 1.03 2.37 15.38 0.576 0.0381 1.099 ± 0.022 9.86 0.02 0.0276 ± 0.0002 0.1882 ± 0.0012 294.5 ± 0.7TSSM-P1 705807 5370919 314.6 26.80 92 7.8 8.7 0.67 1.64 12.76 0.489 0.0337 1.117 ± 0.027 9.88 0.03 0.0275 ± 0.0002 0.1865 ± 0.0009 294.7 ± 0.7TSSM-P3 705166 5371107 309.1 27.61 96 6.3 8.9 4.54 2.00 13.73 0.520 0.0349 0.351 ± 0.014 9.85 0.02 0.0278 ± 0.0001 0.1857 ± 0.0008 295.2 ± 0.9TSSM-P5 707580 5370894 331.8 29.03 96 5.0 7.5 2.05 1.87 14.29 0.539 0.0374 0.709 ± 0.033 9.91 0.02 0.0275 ± 0.0001 0.1873 ± 0.0006 293.7 ± 0.7
Barraute eskerBarraute
municipality747825 5369108 305.0 22.86 251 5.7 7.9 1.18 2.20 15.50 0.597 0.0408 0.935 ± 0.022 9.87 0.02 0.0280 ± 0.0002 0.1874 ± 0.0010 293.6 ± 0.6
Harricana moraineMDDEP-S 735432 5377299 375.1 41.76 226 13.1 8.3 0.54 2.02 15.10 0.596 0.0423 1.118 ± 0.025 9.85 0.02 0.0277 ± 0.0002 0.1875 ± 0.0010 295.0 ± 0.8MDDEP-P 716109 5375475 375.3 70.56 185 8.0 8.1 0.47 1.66 12.71 0.492 0.0341 1.207 ± 0.021 9.92 0.02 0.0277 ± 0.0002 0.1880 ± 0.0010 296.5 ± 1.2PACES 1-03 294017 5385992 375.0 64.40 115 6.5 8.4 0.55 1.89 n.d. n.d. n.d. 1.586 ± 0.018 n.d n.d. n.d. ± n.d. n.d. ± n.d. n.d. ± n.d.
Clay plainLandrienne
municipality724345 5382191 318.0 89.60 351 6.4 7.1 1.24 2.80 17.47 0.653 0.0429 0.946 ± 0.024 9.84 0.03 0.0281 ± 0.0002 0.1878 ± 0.0010 295.4 ± 0.7
55HB 714669 5377299 316.0 109.80 763 7.8 7.2 42.79 2.54 17.94 0.706 0.0473 0.224 ± 0.012 9.85 0.02 0.0281 ± 0.0002 0.1896 ± 0.0009 294.8 ± 0.8101CH 716109 5375475 302.0 35.05 527 8.0 7.8 2.34 2.70 18.16 0.709 0.0492 0.520 ± 0.019 9.84 0.01 0.0277 ± 0.0002 0.1869 ± 0.0008 295.7 ± 0.7Atmospheric value 1.000 9.7 0.0290 0.1880 295.5
Note: uncertainties on noble gas isotopic concentrations at University of Michigan (1r) are ±1.5% (4He), 1.3% (20Ne), 1.3% (36Ar), 1.5% (84Kr) and 2.2% (132Xe).Uncertainties on 4He and 20Ne concentrations at University of Tokyo are (1r) ±3%.n.d. = not determined
4C.Boucher
etal./Journal
ofH
ydrology524
(2015)1–
14
/2
±
. ±
. ±±±±±±
±
±±
. ±
±
±±
7

ble 2uifer and well physical parameters together with 3H/3He and U–Th/4He ages.
Well name Screen Aquifer Watertable
Lithology Aquifer 3H ± 3Hetri ± 4Heeq4Heea DNe Excess air 4Hterr ± 3H/3He ± U–
Th/4He±
length (m) thickness level at screen type TU TU (%) cm3STP � 10�3 cm3STPg�1 � 10�8
age age
z0 (m) m a a
Saint-Mathieu de Berry eskerAmos municipality 0.2 26.33 7.96 Gravel � 12.72 1.05 33.68 1.48 4.52 0.13 2.18 0.24 ± 0.28 1.23 0.12 23.0 1.2 12.5 0.5PACES 12-1 1.5 53.83 21.79 Sand Unconfined � � � � 120.92 12.11 � � 57.6 1.1PACES 13-1 1.5 53.83 21.81 Sand Unconfined � � 8.44 0.90 1.73 0.17 � � 24.2 0.4TSAM-P1 1.5 37.13 1.28 Sand,
gravelConfined 11.07 0.93 9.33 2.00 4.44 0.23 4.03 0.44 ± 0.30 0.70 0.07 10.9 1.9 62.4 2.0
TSAM-P2 1.5 37.13 1.59 Sand,gravel
Confined 13.14 1.03 23.45 1.67 4.56 1.80 23.66 3.44 ± 0.50 3.89 0.39 18.2 1.2 272.4 9.4
TSSM-P1 1.5 28.40 1.59 Sand,gravel
Confined 12.21 1.03 18.45 1.34 4.48 �0.37 �7.02 �0.70 ± 0.29 3.00 0.26 15.2 1.2 3.1 0.1
TSSM-P3 1.5 28.40 �1.00 Diamicton Confined 3.10 0.04 15.73 7.74 4.50 0.72 11.29 1.38 ± 0.33 40.16 4.02 32.0 7.4 27.4 0.5TSSM-P5 3.0 29.03 16.15 Diamicton Confined 12.83 1.03 37.55 4.72 4.54 0.21 3.50 0.40 ± 0.45 15.76 1.58 24.3 2.0 10.5 0.2
Barraute eskerBarraute municipality 4.6 23.80 1.85 � � � � 23.21 1.96 4.60 1.12 15.86 2.14 ± 0.39 6.06 0.61 � � 64.8 2.7Barraute municipality 8.7 0.2
Harricana moraineMDDEP-S 1.5 74.06 36.70 Sand,
gravelUnconfined 12.23 1.05 5.51 0.94 4.60 0.50 7.81 0.96 ± 0.25 0.34 0.03 6.6 1.1 121 9
MDDEP-P 1.5 74.06 36.51 Sand Unconfined 11.49 0.95 9.87 0.80 4.47 �0.29 �5.46 �0.55 ± 0.22 0.82 0.05 9.9 0.9 41.0 1.9PACES 1-03 1.5 74.06 36.57 Sand,
gravelUnconfined � � 21.76 0.92 0.76 0.08 � � 91.0 4.9
18.16 2.07
Clay plainLandrienne
municipalityUnscreened 89.6 1.50 Basalt Confined � � 18.16 2.07 4.64 2.99 33.13 5.70 ± 0.71 4.81 0.48 � � 1473 292
55HB Unscreened 97.3 7.25 Basalt Confined � � 32.34 77.33 4.73 1.92 23.48 3.66 ± 0.60 421.21 42.17 � � 137,000 28,000101CH Unscreened 10.7 � Basalt Confined � � 10.49 3.80 4.73 2.39 27.66 4.57 ± 0.44 16.23 1.62 � � 207 6101CH 28 1
C.Boucheret
al./Journalof
Hydrology
524(2015)
1–14
5
TaAq

6 C. Boucher et al. / Journal of Hydrology 524 (2015) 1–14
In UQAT and MDDEP wells, water for noble gas measurementswas collected using a Waterra� Inertial Pump System which con-sists of a foot valve fixed at the bottom of a high-density polyethy-lene tube with a variable diameter of 5/8–100 and an electricactuator pump Hydrolift-2�. In municipal wells, the water wascollected directly at the wellhead. Water from domestic wellswas collected at the closest water faucet, taking precautions toavoid intermediate reservoirs where the water could undergodegassing. Water was purged from wells and piezometers untilmeasurement of main chemo-physical parameters (e.g., conduc-tivity, pH, and temperature) stabilized. Water was subsequentlyallowed to flow through armored PVC tubes connected to a14 cm3, 3/800 diameter, refrigeration-type copper tube. After a fewminutes the open tube was sealed using two steel clamps.
Water samples were measured for noble gas compositions at theNoble Gas Laboratory at the University of Michigan, except for threesamples that were collected during the summer of 2012 (PACES 1-03, PACES 1-12 and PACES 1-13). Helium isotopic ratio was mea-sured at Tokyo University. Water samples at University of Michiganwere connected to a vacuum extraction system and noble gaseswere quantitatively extracted for inletting into a MAP-215-50 massspectrometer. Extracted gases were passed over two Ti sponge get-ters to remove reactive gases, and sequentially allowed to enter theMAP-215-50 mass spectrometer using a cryogenic separator. Thecryogenic separator temperatures were set at 35, 65, 200, 215,and 270 K for analysis of He, Ne, Ar, Kr, and Xe, respectively. The4He, 20Ne and 40Ar were measured using a Faraday detector whileall other noble gas isotopes were measured using an electron mul-tiplier in ion counting mode. During neon isotope analysis, a liquidN2 cold trap was applied to minimize peak interferences and appro-priate mass peaks were monitored to correct for interferences of40Ar++ and H2
18O+ on 20Ne and CO2++ on 22Ne. The interference correc-
tions for 20Ne and 22Ne were typically�1.1% and 0.17%, respectively.Before each sample analysis, a calibrated amount of air standardwas analyzed following the same procedure as the sample measure-ment for checking sensitivity of the MAP215-50 mass spectrometer.The blank correction was applied to all measured peaks, but wasnegligible. Isotopic abundances for each sample were normalizedto the air standard after blank correction. Elemental abundancesof 4He, 22Ne, 36Ar, 84Kr, and 132Xe have typical uncertainties of1.5%, 1.3%, 1.3%, 1.5% and 2.2%, respectively and all uncertaintiesare at ±1r level. Additional details on the noble gas analytical pro-cedure at University of Michigan can be found in Ma et al. (2005).
The three samples collected in summer 2012 (PACES-03, PACES1-12 and 1-3; Table 1) were analyzed at the Atmosphere and OceanResearch Institute (AORI) at the University of Tokyo for helium iso-topes and 20Ne. These samples were degassed offline using adedicated line evacuated with a turbo-molecular pump. Extractedgas was collected in a lead-rich glass ampoule. The ampoule wasconnected to a stainless steel line for purification on a Ti-getterand cryogenic separation of He from other noble gases. The heliumaliquot was then analyzed for the 3He/4He isotopic ratio using aHelix SFT calibrated against the HESJ standard (Helium Standardof Japan; Matsuda et al., 2002). Precision on the 3He/4He ratio ofHESJ is typically ±0.2% (2r) (Sano et al., 2008). Prior to being cryo-genically adsorbed, the amount of 4He and 20Ne was measured on aPfeiffer QMS Prisma™ 80 connected to the preparation line with atypical precision of ±3% (1r).
Water samples for tritium (3H) analysis were collected using 1 LNalgene� bottle filled up to prevent degassing and sealed beforeshipment to the Environmental Isotopes Laboratory (EIL) of theUniversity of Waterloo. Liquid scintillation counting (LSC) is thetechnique used by EIL for quantification of tritium. Samples beinganalyzed for tritium are concentrated 15 times by electrolysis andsubsequently counted. Detection limit for enriched samples is 0.8TU (Heemskerk and Johnson, 1998).
To calculate radiogenic 4He production rates from the sedi-ments of the aquifers, U and Th were measured by neutron activa-tion at the Slowpoke Laboratory of the University of Montreal, insediments and rock fragments from the top of the Harricana mor-aine, a few tens of meters from the position of MDDEP-S and -Pwells (Fig. 1a). U and Th concentrations ranged from 0.2 to0.84 ppm and from 0.34 to 3.52 ppm, respectively.
4. Results
Table 1 reports the concentrations of major noble gas isotopes(4He, 20Ne, 36Ar, 84Kr and 132Xe) and He, Ne and Ar isotopic ratiosexcept for the three samples analyzed at the University of Tokyofor which only He isotopes and 20Ne were measured. 4He concen-trations range from 4.7 to 5.5 � 10�8 cm3STPg�1, values that areclose to the concentration at solubility equilibrium with the atmo-sphere (ASW or Air Saturated Water; Smith and Kennedy, 1983), to4.28 � 10�6 cm3STP/g�1 which was measured in groundwater col-lected from the deepest well in the fractured bedrock aquifer (55HB; Fig. 1; Table 1). Measured 3He/4He ratios (R) normalized to thatof the atmosphere (Ra = 1.386 � 10�6; Lupton, 1983) range from1.849 ± 0.036 times (Amos municipality well) to 0.224 ± 0.012times the atmospheric ratio (55HB; Table 1).
20Ne/22Ne ratios in most samples are slightly higher thanthe atmospheric value of 9.768 (Sano et al., 2013)(9.83 < 20Ne/22Ne < 9.91), but are inversely correlated with40Ar/36Ar ratios, which vary between 294.4 and 296.5 (Table 1)(atmospheric value is 295.5; Ozima and Podosek, 1983), indicatingmass-dependent fractionation of Ne and Ar of atmospheric compo-sition (Marty, 1984). The 38Ar/36Ar ratios range from 0.1854 to0.1896 (atmospheric value of 0.1880; Ozima and Podosek, 1983)and do not display a correlation with the 40Ar/36Ar ratios. Kr andXe isotopic compositions are entirely atmospheric and they havebeen not reported.
Table 2 reports technical specifications of the sampled wells(e.g., depth, screen length, and aquifer thickness), calculatedhelium components dissolved in water (4Heeq, 4Heea, 4Heterr and3Hetri) and measured tritium content (3H in TU, corrected of thetime interval between 3Hetri and 3H analyses), which are neededfor calculating apparent 3H/3He ages and U–Th/4He ages (see dis-cussion). 4Heeq is the dissolved helium in solubility equilibriumwith the atmosphere (4Heeq). 4Heea is the atmospheric helium inexcess of the solubility equilibrium concentration. The latter,known as the ‘‘excess air component’’ result from air bubblesentering the water table and dissolved in groundwater (Heaton andVogel, 1981). DNe (%) ([Ne]measured/[Ne]atmospheric equilibrium� 1)� 100expresses the total amount of excess air (Table 2; Aeschbach-Hertig et al., 2001). These parameters (4Heeq, 4Heea and DNe (%);Table 2) have been estimated from calculation of Noble GasTemperatures (NGT) based on Ne, Ar, Kr and Xe concentrations ingroundwater and applying the UA (Unfractionated Air) model ofexcess air incorporation in groundwater (Stute and Schlosser,1993) through an error-weighted, nonlinear inverse technique(Ballentine and Hall, 1999).
The 4Heterr is the terrigenic helium produced by U and Thdecay in Earth’s crust or derived from the mantle and it iscalculated as 4Heterr = 4Hetot � (4Heeq + 4Heea), where 4Hetot is thetotal initial amount of helium, as reported in Table 1. Finally, tritio-genic 3He derived from decay of post-bomb tritium in young water(3Hetri) has been calculated using the equation (Schlosser et al.,1989):
3Hetri ¼ 4Hetot � Rtot � Rterrð Þ � 4Heeq � Req � Rterr� �
�4He
20Ne
� �ea
� 20Netot � 20Neeq� �
� Rea � Rterrð Þ ð1Þ

C. Boucher et al. / Journal of Hydrology 524 (2015) 1–14 7
where �R� refers to the 3He/4He ratio. Rtot is the measured3He/4He ratio. Rea is the 3He/4He ratio for the ‘‘excess air’’ compo-nent and it is assumed to be atmospheric (Rea = Ratm = 1.386 � 10�6;Lupton, 1983). Req is the 3He/4He ratio at ASW condition and it isequal to a ⁄ Ratm (1.36 � 10�6) with a representing the fractionationfactor of 0.983 (Benson and Krause, 1980). Rterr corresponds to thetime-integrated 3He/4He ratio from 3He and 4He crustal production.Finally, the (4He/20Ne)ea ratio of the ‘‘excess air’’ component is alsoassumed to be atmospheric and equal to 0.3185.
5. Discussion
5.1. Helium component separation
Helium components dissolved in Amos groundwater can bevisualized in a Weise-plot (Weise and Moser, 1987; Fig. 2). In thisplot, the excess-air-corrected helium isotopic ratio ((3Hetot–3Heea)/(4Hetot–4Heea)) is plotted versus the ratio between the Heeq
concentration and the normalized excess-air-corrected heliumconcentration (4Heeq/(4Hetot–4Heea)). In the following discussion,as well as Fig. 2, all 3He/4He values (R) have been normalized toRatm (1.386 � 10�6). Addition of 3Hetri will shift the (3Hetot–3Heea)/(4Hetot–4Heea) ratio up from its initial ASW isotopic composition atthe recharge (Req; Fig. 2). Addition of 3Heterr produced by nucle-ogenic reactions with Li (Morrison and Pine, 1955) and 4Heterr froma-decay of U and Th in crustal rocks will shift ratios to the lowerleft corner of the plot with a 4Heeq/(4Hetot–4Heea) value of zero(i.e., containing only 4Heterr) and a Rterr value corresponding tothe time-integrated ratio from 3He and 4He crustal production(typically 0.02–0.03Ra; e.g., Andrews and Lee, 1979). Mixingbetween the different end-members will be represented by astraight line of equation Y = mX + b (e.g., Stute et al., 1992):
3Hetot � 3Heexc� �
4Hetot � 4Heexcð Þ|fflfflfflfflfflfflfflfflfflfflfflfflfflffl{zfflfflfflfflfflfflfflfflfflfflfflfflfflffl}Y
¼ Req � Rterr þ3Hetri4Heeq
� �|fflfflfflfflfflfflfflfflfflfflfflfflfflfflfflfflfflfflffl{zfflfflfflfflfflfflfflfflfflfflfflfflfflfflfflfflfflfflffl}
m
�4Heeq
4Hetot � 4Heexc|fflfflfflfflfflfflfflfflfflfflfflffl{zfflfflfflfflfflfflfflfflfflfflfflffl}X
þ Rterr|{z}b
ð2Þ
Fig. 2. Weise-plot for groundwater samples from Saint-Mathieu–Berry (SMB) andBarraute eskers (white dots); from Harricana moraine (black dots) and from thefractured aquifer under the clay plain (gray squares). The dashed line represents themixing line between water containing atmospherically derived helium at airsaturated water conditions or ASW (3He/4He ratio = Req = 0.983Ra) and waterenriched in terrigenic helium, represented by the helium composition of samplePACES 12-1. The plain line represents the mixing between water containing 35 TU3Hetri (equivalent to 8.47 � 10�14 cm3STP g�1 of 3Hetri) mixed with water enrichedin terrigenic helium 4He, here represented by the helium composition of sample55HB.
All groundwater samples plot between two mixing lines (Fig. 2).The first passes through the ASW end-member (Req) and the sam-ple PACES 12-1. The Y-intercept of this mixing line (correspondingto Rterr) is 0.1765. The second mixing line passes through thewaters of Amos municipality, TSSM-P5 and 55HB wells with a Y-in-tercept of 0.2198. This straight line corresponds to a groundwatercontaining 35 TU tritiogenic 3He mixed with an older groundwaterenriched in terrigenic helium. For X = 0 term ‘‘b’’ of Eq. (2), weassumed an average (±std dev) Rterr value of 0.198 ± 0.031.
The obtained Rterr value is higher than the expected crustal val-ue of 0.02–0.03Ra and clearly denotes the presence of 3Heterr
excesses. These 3Heterr excesses could be caused either by the addi-tion of 2.4% of mantle helium to the groundwater or from anenhanced contribution of nucleogenic 3He from lithium decay incrustal rocks. Production of the Rterr with a value of 0.2Ra by in situnucleogenic processes would require reservoir rocks to contain Liconcentrations between 600 and 2200 ppm, depending on U andTh concentrations in these same rocks (Andrews and Lee, 1979).These lithium concentrations, not unusual in this area, are fargreater than the average upper crust value of 20 ppm (Ballentineand Burnard, 2002). The crystalline basement underneath theeskers contains pegmatite intrusions known to be very rich in lithi-um. For example, 20 km southeast of the SMB esker (area of MontVideo, see Fig. 1a), Canada Lithium Corp. has carried out a feasi-bility study for mining carbonate phases in a pegmatitic intrusioncontaining up to 1.2 wt.% (12,000 ppm) lithium (http://www.canadalithium.com/fr/QuebecLithium.asp). Thus, we cannotexclude that groundwater flowing through the crystalline base-ment underneath the eskers has interacted with these Li-rich orebodies, charging them with 3Heterr.
Fig. 2 shows that groundwater flowing in eskers and in the clayplain contains a mixture of 3Hetri and terrigenic helium. It is possi-ble to take advantage of these helium components to estimategroundwater residence times and to reconstruct the age of eskeraquifers using both the 3H/3He (e.g., Tolstikhin and Kamenskiy,1969; Takaoka and Mizutani, 1987) and U–Th/4He dating methods(e.g., Torgersen and Clarke, 1985).
5.2. 3H/3He apparent groundwater ages
Natural background of tritium (3H) is derived from spallationreactions with N in the troposphere. This relatively low back-ground has undergone a remarkable change during the 60s. Indeed,fallout of anthropogenic tritium from atmospheric nuclear weapontests conducted to a peak record of tritium content in precipitationduring this period (e.g., Clark and Fritz, 1997). Tritium has beennormally used, coupled to tritium records in precipitation, to esti-mate groundwater age. Nevertheless, since tritium is returned toits natural background, the exact time of 3H delivery to the aquiferis difficult to well evaluate based only on the initial tritiumconcentration. Thus, since 3He is produced by tritium decay witha half-life (T1/2) of 12.32 ± 0.02 years (Lucas and Unterweger,2000), the coupled measurements of these two elements can beuseful to partially remedy to this problem. Indeed, it has theadvantage to be independent of the initial tritium concentrationof the water sample. If the amount of 3H and 3Hetri are measured,the 3H/3He apparent age (t) can be calculated using the followingequation:
t ¼ T1=2
ln 2� ln 1þ
3Hetri3H
� �ð3Þ
The main difficulty and source of uncertainties in the calculated3H/3He groundwater age is the separation of 3Hetri from the otherhelium components (‘‘ea’’, ‘‘terr’’ and ‘‘eq’’), which is addressedusing Eq. (1). Uncertainties in 3H/3He apparent were calculatedas propagated error, which takes into account all the uncertainties
8 C. Boucher et al. / Journal of Hydrology 524 (2015) 1–14
for each variable used in Eqs. (1) and (3). The total uncertainty ofthe 3H/3He ages ranges from 5.3% (Amos) to 23% (TSSM-P3) ofthe calculated age. The source of the larger uncertainty in the3H/3He ages of TSSM-P3 derives from the poor fitting to the UAmodel with consequent larger uncertainties in the calculated‘‘eq’’ and ‘‘ea’’ helium components (Table 2). The youngest3H/3He ages were measured for the Harricana moraine (6.6 ± 1.1a for MDDEP-S and 9.6 ± 0.9 a for MDDEP-P) while the SMB eskergroundwater showed older apparent 3H/3He ages from 10.9 ± 1.9a (TSAMP-1) to 32.0 ± 7.4 a (TSSM-P3) (Table 2 and Fig. 1b).
The calculated 3H/3He ages are valid if one assumes that thetracer traveled from the recharge area to the well without hydro-dynamic dispersion or mixing, i.e., following a piston flow (PFM)behavior. This is the case for tracers measured from shallow, short-screened monitoring wells in unconfined aquifers with a smallrecharge area or confined aquifers, as it is the case for the shallow-er SMB and Harricana wells (Table 2). We cannot rule out disper-sion or water mixing, in particular for the deeper wells or theAmos municipality well, which is a horizontal multi-drain wellwith long screens. Binary mixing is certainly occurring in theeskers as indicated by the presence of tritiogenic 3He and radio-genic 4He in the same water parcel (Fig. 2). An important limitingcase is the addition of pre-bomb water virtually free of tritium.This water will dilute both tritium and 3Hetri with very smalleffects on the ratio and thus on the calculated age.
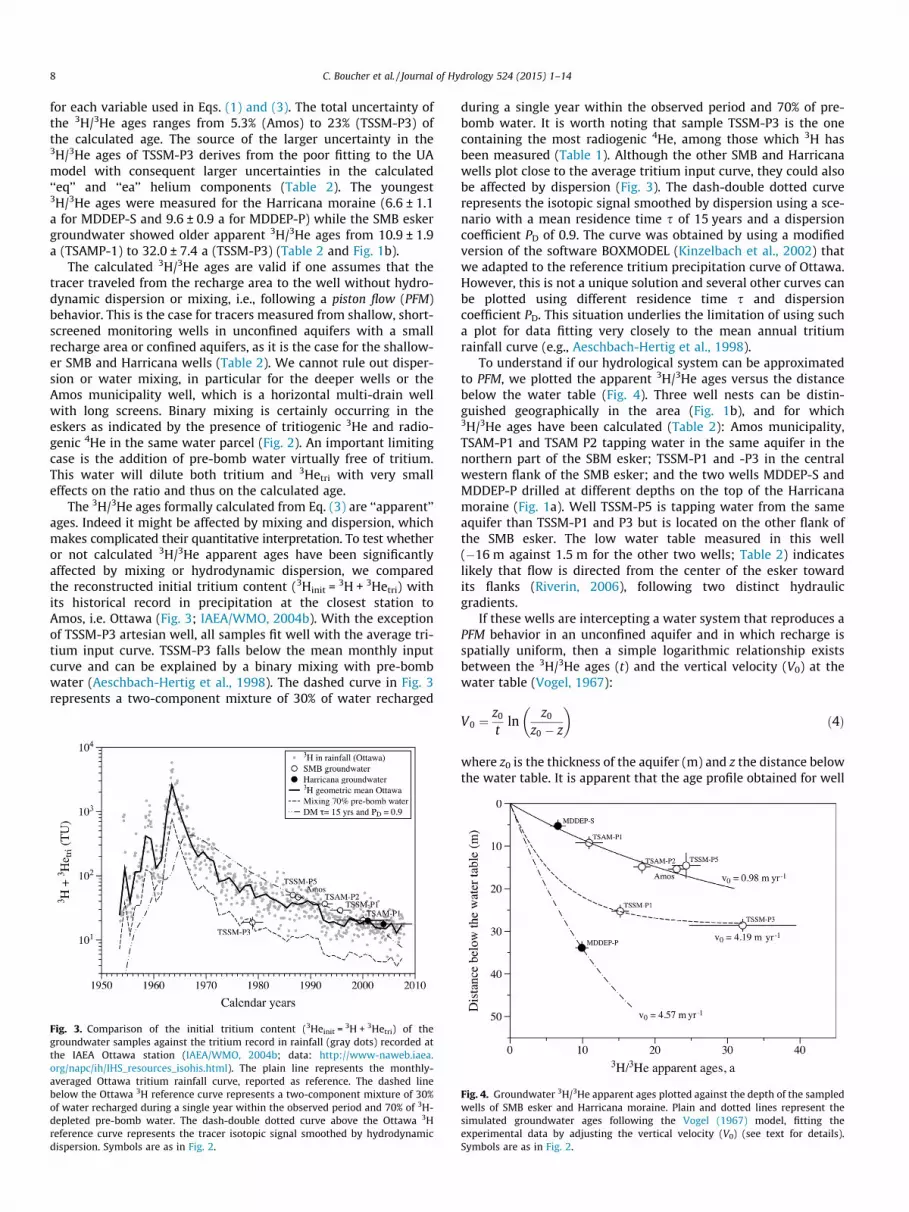
The 3H/3He ages formally calculated from Eq. (3) are ‘‘apparent’’ages. Indeed it might be affected by mixing and dispersion, whichmakes complicated their quantitative interpretation. To test whetheror not calculated 3H/3He apparent ages have been significantlyaffected by mixing or hydrodynamic dispersion, we comparedthe reconstructed initial tritium content (3Hinit = 3H + 3Hetri) withits historical record in precipitation at the closest station toAmos, i.e. Ottawa (Fig. 3; IAEA/WMO, 2004b). With the exceptionof TSSM-P3 artesian well, all samples fit well with the average tri-tium input curve. TSSM-P3 falls below the mean monthly inputcurve and can be explained by a binary mixing with pre-bombwater (Aeschbach-Hertig et al., 1998). The dashed curve in Fig. 3represents a two-component mixture of 30% of water recharged
Fig. 3. Comparison of the initial tritium content (3Heinit = 3H + 3Hetri) of thegroundwater samples against the tritium record in rainfall (gray dots) recorded atthe IAEA Ottawa station (IAEA/WMO, 2004b; data: http://www-naweb.iaea.org/napc/ih/IHS_resources_isohis.html). The plain line represents the monthly-averaged Ottawa tritium rainfall curve, reported as reference. The dashed linebelow the Ottawa 3H reference curve represents a two-component mixture of 30%of water recharged during a single year within the observed period and 70% of 3H-depleted pre-bomb water. The dash-double dotted curve above the Ottawa 3Hreference curve represents the tracer isotopic signal smoothed by hydrodynamicdispersion. Symbols are as in Fig. 2.
during a single year within the observed period and 70% of pre-bomb water. It is worth noting that sample TSSM-P3 is the onecontaining the most radiogenic 4He, among those which 3H hasbeen measured (Table 1). Although the other SMB and Harricanawells plot close to the average tritium input curve, they could alsobe affected by dispersion (Fig. 3). The dash-double dotted curverepresents the isotopic signal smoothed by dispersion using a sce-nario with a mean residence time s of 15 years and a dispersioncoefficient PD of 0.9. The curve was obtained by using a modifiedversion of the software BOXMODEL (Kinzelbach et al., 2002) thatwe adapted to the reference tritium precipitation curve of Ottawa.However, this is not a unique solution and several other curves canbe plotted using different residence time s and dispersioncoefficient PD. This situation underlies the limitation of using sucha plot for data fitting very closely to the mean annual tritiumrainfall curve (e.g., Aeschbach-Hertig et al., 1998).
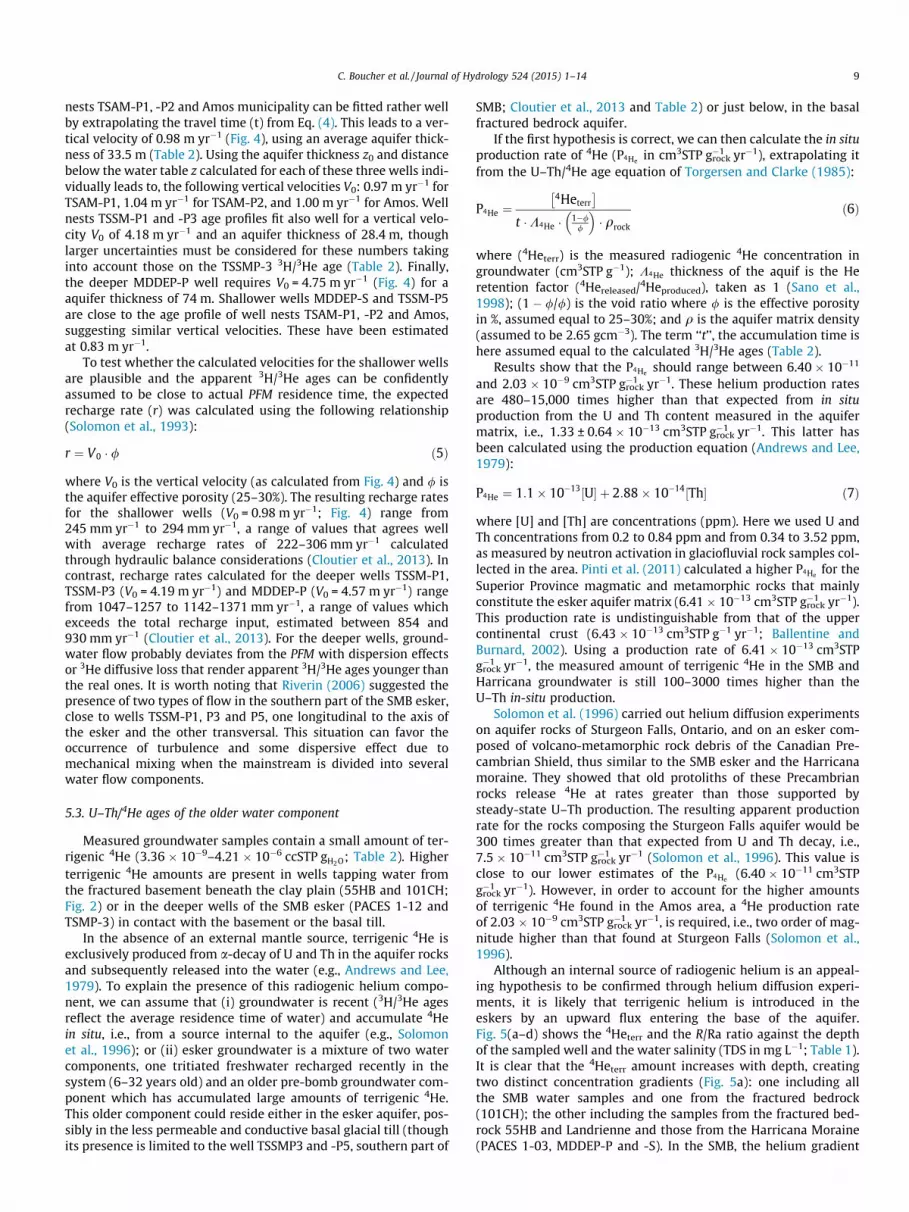
To understand if our hydrological system can be approximatedto PFM, we plotted the apparent 3H/3He ages versus the distancebelow the water table (Fig. 4). Three well nests can be distin-guished geographically in the area (Fig. 1b), and for which3H/3He ages have been calculated (Table 2): Amos municipality,TSAM-P1 and TSAM P2 tapping water in the same aquifer in thenorthern part of the SBM esker; TSSM-P1 and -P3 in the centralwestern flank of the SMB esker; and the two wells MDDEP-S andMDDEP-P drilled at different depths on the top of the Harricanamoraine (Fig. 1a). Well TSSM-P5 is tapping water from the sameaquifer than TSSM-P1 and P3 but is located on the other flank ofthe SMB esker. The low water table measured in this well(�16 m against 1.5 m for the other two wells; Table 2) indicateslikely that flow is directed from the center of the esker towardits flanks (Riverin, 2006), following two distinct hydraulicgradients.
If these wells are intercepting a water system that reproduces aPFM behavior in an unconfined aquifer and in which recharge isspatially uniform, then a simple logarithmic relationship existsbetween the 3H/3He ages (t) and the vertical velocity (V0) at thewater table (Vogel, 1967):
V0 ¼z0
tln
z0
z0 � z
� �ð4Þ
where z0 is the thickness of the aquifer (m) and z the distance belowthe water table. It is apparent that the age profile obtained for well
Fig. 4. Groundwater 3H/3He apparent ages plotted against the depth of the sampledwells of SMB esker and Harricana moraine. Plain and dotted lines represent thesimulated groundwater ages following the Vogel (1967) model, fitting theexperimental data by adjusting the vertical velocity (V0) (see text for details).Symbols are as in Fig. 2.
C. Boucher et al. / Journal of Hydrology 524 (2015) 1–14 9
nests TSAM-P1, -P2 and Amos municipality can be fitted rather wellby extrapolating the travel time (t) from Eq. (4). This leads to a ver-tical velocity of 0.98 m yr�1 (Fig. 4), using an average aquifer thick-ness of 33.5 m (Table 2). Using the aquifer thickness z0 and distancebelow the water table z calculated for each of these three wells indi-vidually leads to, the following vertical velocities V0: 0.97 m yr�1 forTSAM-P1, 1.04 m yr�1 for TSAM-P2, and 1.00 m yr�1 for Amos. Wellnests TSSM-P1 and -P3 age profiles fit also well for a vertical velo-city V0 of 4.18 m yr�1 and an aquifer thickness of 28.4 m, thoughlarger uncertainties must be considered for these numbers takinginto account those on the TSSMP-3 3H/3He age (Table 2). Finally,the deeper MDDEP-P well requires V0 = 4.75 m yr�1 (Fig. 4) for aaquifer thickness of 74 m. Shallower wells MDDEP-S and TSSM-P5are close to the age profile of well nests TSAM-P1, -P2 and Amos,suggesting similar vertical velocities. These have been estimatedat 0.83 m yr�1.
To test whether the calculated velocities for the shallower wellsare plausible and the apparent 3H/3He ages can be confidentlyassumed to be close to actual PFM residence time, the expectedrecharge rate (r) was calculated using the following relationship(Solomon et al., 1993):
r ¼ V0 � / ð5Þ
where V0 is the vertical velocity (as calculated from Fig. 4) and / isthe aquifer effective porosity (25–30%). The resulting recharge ratesfor the shallower wells (V0 = 0.98 m yr�1; Fig. 4) range from245 mm yr�1 to 294 mm yr�1, a range of values that agrees wellwith average recharge rates of 222–306 mm yr�1 calculatedthrough hydraulic balance considerations (Cloutier et al., 2013). Incontrast, recharge rates calculated for the deeper wells TSSM-P1,TSSM-P3 (V0 = 4.19 m yr�1) and MDDEP-P (V0 = 4.57 m yr�1) rangefrom 1047–1257 to 1142–1371 mm yr�1, a range of values whichexceeds the total recharge input, estimated between 854 and930 mm yr�1 (Cloutier et al., 2013). For the deeper wells, ground-water flow probably deviates from the PFM with dispersion effectsor 3He diffusive loss that render apparent 3H/3He ages younger thanthe real ones. It is worth noting that Riverin (2006) suggested thepresence of two types of flow in the southern part of the SMB esker,close to wells TSSM-P1, P3 and P5, one longitudinal to the axis ofthe esker and the other transversal. This situation can favor theoccurrence of turbulence and some dispersive effect due tomechanical mixing when the mainstream is divided into severalwater flow components.
5.3. U–Th/4He ages of the older water component
Measured groundwater samples contain a small amount of ter-rigenic 4He (3.36 � 10�9–4.21 � 10�6 ccSTP gH2O; Table 2). Higherterrigenic 4He amounts are present in wells tapping water fromthe fractured basement beneath the clay plain (55HB and 101CH;Fig. 2) or in the deeper wells of the SMB esker (PACES 1-12 andTSMP-3) in contact with the basement or the basal till.
In the absence of an external mantle source, terrigenic 4He isexclusively produced from a-decay of U and Th in the aquifer rocksand subsequently released into the water (e.g., Andrews and Lee,1979). To explain the presence of this radiogenic helium compo-nent, we can assume that (i) groundwater is recent (3H/3He agesreflect the average residence time of water) and accumulate 4Hein situ, i.e., from a source internal to the aquifer (e.g., Solomonet al., 1996); or (ii) esker groundwater is a mixture of two watercomponents, one tritiated freshwater recharged recently in thesystem (6–32 years old) and an older pre-bomb groundwater com-ponent which has accumulated large amounts of terrigenic 4He.This older component could reside either in the esker aquifer, pos-sibly in the less permeable and conductive basal glacial till (thoughits presence is limited to the well TSSMP3 and -P5, southern part of
SMB; Cloutier et al., 2013 and Table 2) or just below, in the basalfractured bedrock aquifer.
If the first hypothesis is correct, we can then calculate the in situproduction rate of 4He (P4He
in cm3STP grock�1 yr�1), extrapolating it
from the U–Th/4He age equation of Torgersen and Clarke (1985):
P4He ¼4Heterr� �
t �K4He � 1�//
� qrock
ð6Þ
where (4Heterr) is the measured radiogenic 4He concentration ingroundwater (cm3STP g�1); K4He thickness of the aquif is the Heretention factor (4Hereleased/4Heproduced), taken as 1 (Sano et al.,1998); (1 � ///) is the void ratio where / is the effective porosityin %, assumed equal to 25–30%; and q is the aquifer matrix density(assumed to be 2.65 gcm�3). The term ‘‘t’’, the accumulation time ishere assumed equal to the calculated 3H/3He ages (Table 2).
Results show that the P4He should range between 6.40 � 10�11
and 2.03 � 10�9 cm3STP grock�1 yr�1. These helium production rates
are 480–15,000 times higher than that expected from in situproduction from the U and Th content measured in the aquifermatrix, i.e., 1.33 ± 0.64 � 10�13 cm3STP grock
�1 yr�1. This latter hasbeen calculated using the production equation (Andrews and Lee,1979):
P4He ¼ 1:1� 10�13 U½ � þ 2:88� 10�14 Th½ � ð7Þ
where [U] and [Th] are concentrations (ppm). Here we used U andTh concentrations from 0.2 to 0.84 ppm and from 0.34 to 3.52 ppm,as measured by neutron activation in glaciofluvial rock samples col-lected in the area. Pinti et al. (2011) calculated a higher P4He
for theSuperior Province magmatic and metamorphic rocks that mainlyconstitute the esker aquifer matrix (6.41 � 10�13 cm3STP grock
�1 yr�1).This production rate is undistinguishable from that of the uppercontinental crust (6.43 � 10�13 cm3STP g�1 yr�1; Ballentine andBurnard, 2002). Using a production rate of 6.41 � 10�13 cm3STPgrock�1 yr�1, the measured amount of terrigenic 4He in the SMB and
Harricana groundwater is still 100–3000 times higher than theU–Th in-situ production.
Solomon et al. (1996) carried out helium diffusion experimentson aquifer rocks of Sturgeon Falls, Ontario, and on an esker com-posed of volcano-metamorphic rock debris of the Canadian Pre-cambrian Shield, thus similar to the SMB esker and the Harricanamoraine. They showed that old protoliths of these Precambrianrocks release 4He at rates greater than those supported bysteady-state U–Th production. The resulting apparent productionrate for the rocks composing the Sturgeon Falls aquifer would be300 times greater than that expected from U and Th decay, i.e.,7.5 � 10�11 cm3STP grock
�1 yr�1 (Solomon et al., 1996). This value isclose to our lower estimates of the P4He
(6.40 � 10�11 cm3STPgrock�1 yr�1). However, in order to account for the higher amounts
of terrigenic 4He found in the Amos area, a 4He production rateof 2.03 � 10�9 cm3STP grock
�1 yr�1, is required, i.e., two order of mag-nitude higher than that found at Sturgeon Falls (Solomon et al.,1996).
Although an internal source of radiogenic helium is an appeal-ing hypothesis to be confirmed through helium diffusion experi-ments, it is likely that terrigenic helium is introduced in theeskers by an upward flux entering the base of the aquifer.Fig. 5(a–d) shows the 4Heterr and the R/Ra ratio against the depthof the sampled well and the water salinity (TDS in mg L�1; Table 1).It is clear that the 4Heterr amount increases with depth, creatingtwo distinct concentration gradients (Fig. 5a): one including allthe SMB water samples and one from the fractured bedrock(101CH); the other including the samples from the fractured bed-rock 55HB and Landrienne and those from the Harricana Moraine(PACES 1-03, MDDEP-P and -S). In the SMB, the helium gradient

Fig. 5. Helium concentration and helium isotopic (3He/4He) gradients versus the depth of sampled wells (a–b) and the total dissolved salinity (TDS) of groundwater (c–d).Symbols are as in Fig. 2.
10 C. Boucher et al. / Journal of Hydrology 524 (2015) 1–14
can be interpreted as upward flux of helium progressively dilutedand dispersed by flowing freshwater essentially depleted in 4Heterr,but which contains a 3Hetri component (Fig. 5b). In the case of theHarricana moraine, the terrigenic 4He concentration gradient isaccompanied by a salinity gradient suggesting that helium is trans-ported in slightly saline water phase up into the moraine, wherehelium and salinity inputs are subsequently diluted by freshwater.The source of salt is groundwater located in the fractured bedrockunder the clay plain (55HB and 101CH; Table 1) (Figs. 5c–d).
In order to quantify both flux from below and accumulation of4Heterr in a confined aquifer, Torgersen and Ivey (1985) proposed asimple model assuming that steady-state flow and transport isreached in the system. The advection–dispersion equation describ-ing their model is given by:
vx@C@xþ DT
@2C@z2 ¼ P ð8Þ
where vx is the horizontal flow velocity, C is the 4Heterr concentra-tion, x is the distance from the recharge, z is the relative verticalposition inside the aquifer, DT is the coefficient of hydrodynamic
transverse dispersion (Freeze and Cherry, 1979) that take intoaccount the vertical dispersivity and the molecular diffusion ofthe solute (here 4Heterr) in the porous medium. P is a source termand in our case it represents the accumulation of 4He in the waterresulting from in situ production P4He
. The prescribed boundary con-ditions for this model are (1) a 4Heterr concentration that initially iszero for all depths in the aquifer; and (2) a constant flux J0 of 4Heterr
entering the aquifer across the bottom boundary z0. Torgersen andIvey (1985) gave the analytical solution of the differential Eq. (7):
C¼Ptþ J0tz0q/
þ J0t0
DTq/
3 zz0
�1
6� 2
p2
X1m¼1
�1ð Þm
m2 exp �DT m2p2tz2
0
� �cos
mpzz0
� �24
35ð9Þ
where z0 is the thickness of the aquifer, q is the water density, / isthe porosity, J0 is the upward 4He flux entering the bottom of theconfined aquifer, and t is the groundwater age. Because the exactrecharge distance of SMB and Harricana wells is not well known,

C. Boucher et al. / Journal of Hydrology 524 (2015) 1–14 11
we calculated the 4Heterr concentrations (C) and present them as afunction of 3H/3He groundwater ages (t) (Fig. 6a–d).
It is worth noting that there is a logarithmic correlation betweenthe 3H/3He ages and the concentration of 4Heterr (Fig. 6a–f), asobserved in several other aquifers (e.g., Castro et al., 1998, 2000;Castro and Goblet, 2005; Ma et al., 2005). This correlation indicatesthat the accumulation of 4Heterr in the aquifer is a function of thewater residence time. Further, for each well nest identified above(Amos, TSAM-P1 and P2; TSSM-P1, -P3, -P5; MDDEP-S and -P),the higher 4Heterr concentrations are found in the deeper wells,i.e., wells approaching the bottom of the aquifer (z/z0 ? 1;Fig. 6a–f). This observation supports the hypothesis of an externalupward 4He flux entering the bottom of the aquifer (Fig. 5a).
Simulated 4Heterr fluxes using Eq. (8) were calculated using zand z0 data from Table 2. DT was assumed equal to 0.13 m2 yr�1.This value has been obtained from measurements of transversedispersion performed in homogeneous sandstone (Freeze andCherry, 1979) and it is roughly constant for a wide range ofvelocities (varying from 0.32 to 16 m yr�1; Castro et al., 2000).Simulation results are reported for the well nest Amos, TSAM-P1and -P2, the nest composed of TSSAM-P1, P3 and P5 and the nestMDDEP-S and -P (Fig. 6a–f). Simulations were carried out forporosity values varying from 25% to 30%, which give us a minimumand maximum 4Heterr flux J0 estimate for each well nest. 4Heterr
fluxes range from 8.0–8.5 � 10�8 cm3STP cm�2 yr�1 (Fig. 6a–b) to5.8–6.6 � 10�7 cm3STP cm�2 yr�1 (Fig. 6c–d) in the SMB esker.Much lower 4Heterr fluxes, on the order of 2.0–2.7 � 10�8
cm3STP cm�2 yr�1, are derived for the Harricana moraine due todilution by freshwater as mentioned earlier (Fig. 6e–f).
Calculated 4He fluxes are 5–165 times lower than the averagehelium continental crustal flux of 3.3 � 10�6 cm3STP cm�2 yr�1
(O’Nions and Oxburgh, 1983) and even lower if compared to thehelium flux from the Canadian Precambrian Shield (5.83 � 10�6 -cm3STP cm�2 yr�1; Torgersen, 2010). Helium fluxes similar tothose estimated for the Amos region are present in shallow aqui-fers of the Paris Basin (Castro et al., 1998; Marty et al., 1993), Aus-tria Molasse basin (Andrews et al., 1985) and in the extensionalEastern Morongo basin in California (Kulongoski et al., 2005).
The variability in the magnitude of helium degassing fluxes inthe Amos region could indicate localized sources of heliumemplaced at lower depths, as observed in other continental set-tings (e.g., Kulongoski et al., 2005) as well as different rechargelevels in different areas. The helium source could be local Archeanand Proterozoic magmatic plutons such as the monozograniticintrusion of La Motte (Fig. 1a), which contain up to 18 ppm Uand 9.5 ppm of Th in localized quartz veins (Mulja et al., 1995). Ter-rigenic helium could be driven toward the surface by tectonic acci-dents (faults) such as those affecting the southern part of the SMBesker (TSSM-P1, -P3 and -P5 well nest).
Estimated 4Heterr fluxes can be cross validated by calculating U–Th/4He ages of groundwater in SMB and Harricana eskers, and toobtain independent water ages for the wells in the clay plain.The U–Th/4He age ‘‘t’’ is calculated using equation (e.g.,Torgersen and Clarke, 1985; Kulongoski et al., 2003):
t ¼4Heterr� �
P4He �K4He � 1�//
� qrock þ
J0zx/qwater
ð10Þ
The density of rock (qrock) and water (qwater) are assumed to be2.65 and 1 g cm�3, respectively. zx is the depth (m) at which thisflux enters the aquifer, taken as the distance from the mid-screenin the well casing to the contact with the basement (Kulogonskiet al., 2005). For the unscreened bedrock wells Landrienne,101CH and 55HB we used the total thickness of the bedrockaquifer, i.e., 89.6 m (Landrienne), 10.67 m (101CH) and 97.30 m
(55HB), respectively (Table 2). Porosities of 25–30% and calculatedhelium fluxes (Fig. 6a–f) were used in these calculations. For thebasal fractured aquifer, Cloutier et al. (2013) assume porosities ofless than 10% (here taken as a maximum value). The P4He
produc-tion rate is assumed to range between 1.33 ± 0.64 � 10�13
cm3STP grock yr�1 (this study) and the local crustal value of6.40 � 10�13 cm3STP grock yr�1 (Pinti et al., 2011).
The apparent 4Heterr gradients in Fig. 5a suggests that clay plainwells Landrienne and 55HB are affected by the same helium fluxthan that entering the bottom of the Harricana esker (2.0–2.7 � 10�8 cm3STP cm�2 yr�1) but different levels of freshwaterinput as seen in many other aquifers with Harricana having thehighest freshwater dilution levels (e.g., Castro et al., 2000, 2005;Patriarche et al., 2004). On the other hand, modeling results suggestthat Barraute and 101CH, which are part of a different system, havea helium flux comparable to those estimated in the SMB esker (8.0–8.5 � 10�8 cm3STP cm�2 yr�1 to 5.8–6.6 � 10�7 cm3STP cm�2 yr�1).
Calculated U–Th/4He ages are reported in Table 2 and Fig. 1b.Uncertainties have been calculated as propagated errors includingthose for helium fluxes, in situ production rates and porosity(Table 2). However, model age errors can be considerably higher,over 50% (Torgersen and Clarke, 1985) depending on naturalparameter variations, including porosity, rock density, U and Thconcentration distribution and helium fluxes, which are a firstorder approximation due to the simplifications implemented inthe model (Ma et al., 2005).
Calculated U–Th/4He groundwater ages for the SMB esker rangefrom 3.0 ± 0.1 a (TSSM-P1) to 272 ± 9 a (TSAM-P2). Most wells dis-play U–Th/4He ages within the same order of magnitude of thoseestimated by 3H/3He.
Calculated U–Th/4He ages for the Harricana wells are higher(41.0 ± 1.9–121.2 ± 9.4 a) than the calculated 3H/3He ages(6.6 ± 1.1–9.9 ± 0.9 a; Table 2). It is very common to obtain agesthat do not agree using different methods (see e.g., Castro andGoblet, 2005). Assuming fluxes of 0.8–6.6� 10�7 cm3STP cm�2 yr�1,equal to those estimated for the SMB esker, we obtain ages similarto those calculated using the 3H/3He method.
The U–Th/4He method can be useful to determining groundwa-ter residence times of the buried Barraute esker and those in thefractured bedrock under the plain (Landrienne, 55HB and 101CH)for which tritium data is not available. Groundwater from thefractured basement displays ages varying between 1473 ± 292 afor the Landrienne municipality well to 137 ± 28 ka for the mostsaline and deep groundwater form well 55H. Domestic wellCH101 groundwater has U–Th/4He ages from 28 ± 1 a to 208 ± 6a; Barraute groundwater exhibits U–Th/4He ages between8.7 ± 0.2 and 65 ± 3 a (Table 2). The wide range of calculatedU–Th/4He water ages for these two last wells is depending onthe chosen helium flux which is highly variable in the area(8.0 � 10�8–6.6 � 10�7 cm3STP cm�2 yr�1; Fig. 6). These variablefluxes can also account for the mismatch between 3H/3He agesand U–Th/4He ages for the younger waters (Table 2).
The Barraute esker is buried and does not receive directrecharge. Veillette et al. (2007) suggested that the Barrauterecharge might originate from water infiltrated through theHarricana moraine, in particular from the elevated area of MontVideo (Fig. 1), 10 km west of the Barraute esker. The piezometricmap produced by Cloutier et al. (2013) shows a major hydraulicgradient (0.014 m/m) between Mont Video and Barraute esker.Assuming a travel time between these two structures of 9–65 a,horizontal flow velocities of 3.5–4.9 � 10�6 ms-1 can be derived.For porosities ranging between 10% (if the flow is through glacialtills and fractured bedrock) and 25–30% (if flow is through buriedgranular aquifers), the calculated average horizontal hydraulicconductivities Kx range between 3.48 � 10�5 and 7.5 � 10�4 ms.

Fig. 6. Evolution of the 4Heterr concentrations in groundwater plotted as a function of the calculated 3H/3He apparent ages. Plain curves (a–f) represent the simulatedevolution of the 4Heterr concentration in groundwater as a function of age for the three well nest geographically identified in the study area, i.e., Amos, TSAM-P1 and -P2 (a–b);TSSM-P1 and -P2, (TSSM-P5) (c–d); MDEEP-S and MDDEP-P (e–f), and for aquifer porosities of 25–30%. Dashed and dash and dot curves represent the simulated evolution ofthe 4Heterr concentration in groundwater as a function of age based exclusively on in situ production using P4 He
rate of 1.33 � 10�13 and 6.40 � 10�13 cm3STP g rock yr�1,respectively.
12 C. Boucher et al. / Journal of Hydrology 524 (2015) 1–14
Cloutier et al. (2013) calculated hydraulic conductivities Kx
for till deposits, fractured bedrock and esker/moraine of9.3 � 10�7–1.4 � 10�4 ms�1, 5.0 � 10�9–4.3 � 10�5 ms�1 and4.9 � 10�6–3.2 � 10�1 ms�1, respectively. Hydraulic conductivitiescalculated for the aquifer between Barraute and Mont Video are inthe upper end of the estimates by Cloutier et al. (2013) suggesting
that there is a continuum between the granular structure of theHarricana moraine and that of the Barraute esker, allowing for fastrecharge.
U–Th/4He age estimations suggest that older waters reside inthe fractured bedrock below the glaciofluvial formations.Maximum U–Th/4He ages in the fractured bedrock aquifer range
C. Boucher et al. / Journal of Hydrology 524 (2015) 1–14 13
from 1472 ± 292 a for groundwater tapped by the Landriennemunicipality well up to 137 ± 28 ka for the most saline and deepestgroundwater found in domestic well 55HB (Fig. 1b). These agessuggest that the Superior Province bedrock aquifer could havepreserved isolated pockets of fossil meltwater following the penul-timate (Illinoian, marine isotope stage, MIS, 6) and last glaciations(Wisconsinan, MIS 2) (Lisiecki and Raymo, 2005). This postglacialwater, which accumulated large amounts of radiogenic 4He mayhave mixed with younger, post-bomb water enriched in tritiogenic3He, flowing rapidly in the aquifers closer to the top of the eskerstructures.
6. Conclusions
Noble gas isotopic compositions of groundwater circulating ineskers (SMB and Barraute) and interlobate glaciofluvial sediments(Harricana moraine) of the Amos region in northwester Quebecshow the presence of anthropogenic, terrigenic and atmospherichelium. These helium components reflect the occurrence oflarge-scale mixing between different water bodies having evolvedin different geological environments. The esker aquifers contain atleast two types of groundwater. The first one flows through thehighly porous and permeable sandy and gravely layers formingthese glaciofluvial landforms. It contains variable amounts ofpost-bomb tritiogenic 3He and 3H/3He ages point to modern water,recharged recently (<32 years). The second type of groundwatermay be considered fossil, likely consisting of glacial meltwatertrapped within the fractured volcano-metamorphic bedrock aqui-fer that underlie the eskers and moraines. These fossil watersmix with the younger waters at the top of the eskers, releasing con-siderable amounts of radiogenic 4He. Exchange between these twogroundwater masses are clearly evidenced by (helium) concentra-tions, isotopic and salinity gradients (Fig. 5a–d), and have beenmodeled here as helium fluxes entering the base of the esker andmoraine aquifers (Fig. 6a–f).
These results further document the stratification of the water inthe aquifers present in these deglacial landforms, as suggested byRiverin (2006), whereby old water (P6000 a based on uncorrected14C ages and P1000 a based on U–Th/4He ages; this study) may befound in the confined (basal) part of the eskers and modernwater in the unconfined (upper) part of the eskers, close to thetop of the structure. Noble gases were also used to constrain thewater ages present and the occurrence of possible mixing betweenthe different water masses.
Calculated groundwater ages have important implications forthe sustainable management of this precious freshwater resource.This resource needs to be preserved from overexploitation sincethe deeper portion of these aquifers is not renewed on a humantimescale (P1000 a old). Furthermore, short water residence timesclearly indicate that the resource is at risk of being contaminated inaddition to being subjected to climatic stresses. It is worth notingthat in this region, eskers are the sites of numerous activities, suchas sand and gravel extraction and old urban and sanitary wasterepositories. If these sites are not properly managed, pollutionfrom chemicals through highly permeable aquifers where flow israpid could seriously compromise the groundwater resource.
Acknowledgements
We wish to thank one anonymous reviewer and Andrew Huntfor their thorough comments and suggestions that deeply improvedthis manuscript. Funding support was obtained from Ministry ofEnvironment of Québec, Fonds de Recherche Québec Nature etTechnologie (contract no. 136990 of the Programme de recherche enpartenariat sur les eaux souterraines du Québec to DLP, MRand ML) and the NSERC Discovery Grant to DLP no. 314496. Local
municipalities of Amos, Landrienne and Barraute and local indi-viduals are thanked for their help and cooperation during sampling.
References
Aeschbach-Hertig, W., Schlosser, P., Stute, M., Simpson, H.J., Ludin, A., Clark, J.F.,1998. A 3H/3He study of groundwater flow in a fractured bedrock aquifer.Ground Water 36, 661–670.
Aeschbach-Hertig, W., Beyerle, U., Holocher, J., Peeters, F., Kipfer, R., 2001. Excess airin groundwater as a potential indicator of past environmental changes. In:International Conference on the Study of Environmental Change Using IsotopeTechniques IAEA-CN-80/29. IAEA, Wien, pp. 34–36.
Andrews, J.N., Lee, P.J., 1979. Inert gases in groundwater from the Bunter Sandstoneof England as indicators of age and paleoclimatic trends. J. Hydrol. 41, 233–252.
Andrews, J.N., Goldbrunner, J.E., Darling, W.G., Hooker, P.J., Wilson, G.B., Youngman,M.J., Eichinger, L., Rauert, W., Stichler, W., 1985. A radiochemical,hydrochemical and dissolved gas study of groundwaters in the Molasse basinof Upper Austria. Earth Planet. Sci. Lett. 73, 317–332.
Ballentine, C.J., Burnard, P.G., 2002. Production, release and transport of noble gasesin the continental crust. Rev. Mineral. Geochem. 47, 481–538.
Ballentine, C.J., Hall, C.M., 1999. Determining paleotemperature and other variablesby using an error-weighted, nonlinear inversion of noble gas concentrations inwater. Geochim. Cosmochim. Acta 63, 2315–2336.
Banerjee, I., McDonald, B.C., 1975. Nature of esker sedimentation. In: Jopling, A.V.,Mc-Donald, B.C. (Eds.), Glaciofluvial and glaciolacustrine sedimentation. Soc.Econom. Paleontol. Mineral. Spec. Publ. vol. 23, pp. 132–154.
Benson, B.B., Krause, D., 1980. Isotopic fractionation of helium during solution: Aprobe for the liquid state. J. Solut. Chem. 9, 895–909.
Boulton, G.S., Caban, P.E., Van Gijssel, K., 1995. Groundwater flow beneath icesheets: Part I – Large scale patterns. Quat. Sci. Rev. 14, 545–562.
Boulton, G.S., Hagdorn, M., Maillot, P.B., Zatsepin, S., 2009. Drainage beneath icesheets: groundwater–channel coupling, and the origin of esker systems fromformer ice sheets. Quat. Sci. Rev. 28, 621–638.
Castelli, S. 2012. Hydrogéochimie des sources associées aux eskers de l’Abitibi,Québec. MSc Thesis. Montréal, Département de génies civil, géologique et desmines, École Polytechnique de Montréal, 107 p.
Castelli, S., Cloutier, V., Blanchette, D., 2011. Hydrogéochimie et qualité de l’eau dessources associées aux eskers de l’Abitibi, Québec. Proceedings, Geohydro 2011,Joint/IAH-CNC, Québec, 4 p.
Castro, M.C., Goblet, P., 2005. Calculation of groundwater ages – a comparativeanalysis. Ground Water 43, 368–380.
Castro, M.C., Goblet, P., Ledoux, E., Violette, S., de Marsily, G., 1998. Noble gases asnatural tracers of water circulation in the Paris Basin 2. Calibration of agroundwater flow model using noble gas isotope data. Water Resour. Res. 34,2467–2483.
Castro, M.C., Stute, M., Schlosser, P., 2000. Comparison of 4He ages and 14C ages insimple aquifer systems: implications for groundwater flow and chronologies.Appl. Geochem. 15, 1137–1167.
Castro, M.C., Patriarche, D., Goblet, P., 2005. 2-D numerical simulations ofgroundwater flow, heat transfer and 4He transport – implications for the Heterrestrial budget and the mantle helium-heat imbalance. Earth Planet. Sci. Lett.237, 893–910.
Clark, I.D., Fritz, P., 1997. Environmental Isotopes in Hydrogeology. CRC Press, 352 p.Clark, P.U., Walder, J.S., 1994. Subglacial drainage, eskers, and deforming beds
beneath the Laurentide and Eurasian ice sheets. GSA Bull. 106, 304–314.Cloutier, V., Veillette, J., Roy, M., Gagnon, F., Bois, D., 2007. Regional
hydrogeochemistry of groundwater in fractured Canadian Shield rock andglaciofluvial formations in Abitibi, Québec. In: Proceedings, 60th CanadianGeotechnical Conference and 8th Joint CGS/IAH-CNC Groundwater Conference,Ottawa, pp. 355–362.
Cloutier, V., Aubert, T., Audet-Gagnon, F., Blanchette, D., Castelli, S., Cheng, L. Z.,Dallaire, P.-L., Fallara, F., Godbout, G., Nadeau, S., Pitre, O., Rey, N., Roy, M.,Veillette, J.J., 2011. Projet d’acquisition de connaissances sur les eauxsouterraines de l’Abitibi-Témiscamingue, Québec. In: Proceedings, Geohydro2011, Joint/IAH-CNC, Québec, 4 p.
Cloutier, V., Blanchette, D., Dallaire, P.-L., Nadeau, S., Rosa, E., Roy, M. 2013. Projetd’acquisition de connaissances sur les eaux souterraines de l’Abitibi-Témiscamingue (partie 1). Research report P001. GRES, IRME, Université duQuébec en Abitibi-Témiscamingue, 135 p.
Dyke, A.S., 2004. An outline of North American deglaciation with emphasis oncentral and northern Canada. In: Ehlers, J., Gibbard, P.L. (Eds.), QuaternaryGlaciations – Extent and Chronology, Part II: North America. Elsevier,Amsterdam, pp. 373–424.
Freeze, R.A., Cherry, J.A., 1979. Groundwater. Prentice-Hall Inc., Englewood Cliffs,New Jersey.
Heaton, T.H.E., Vogel, J.C., 1981. ‘‘Excess air’’ in groundwater. J. Hydrol. 50, 201–216.Heemskerk, A.R., Johnson, J., 1998. Tritium Analysis: Technical Procedure 1.0.
University of Waterloo, Waterloo, ON.IAEA/WMO (International Atomic Energy Agency/World Meteorological
Organization). 2004b. Global network of isotopes in precipitation. The GNIPdatabase. Available at: <http://isohis.iaea.org>.
Kinzelbach, W., et al., 2002. A survey of methods for analysing groundwaterrecharge in arid and semi-arid regions, Division of Early Warning andAssessment. United Nations Environmental Program. UNEP/DEWA/RS.02-2.
14 C. Boucher et al. / Journal of Hydrology 524 (2015) 1–14
Kulongoski, J.T., Hilton, D.R., Izbicki, J.A., 2003. Helium isotope studies in the MojaveDesert, California: implications for groundwater chronology and regionalseismicity. Chem. Geol. 202, 95–113.
Kulongoski, J.T., Hilton, D.R., Izbicki, J.A., 2005. Source and movement of helium inthe eastern Morongo groundwater Basin: the influence of regional tectonics oncrustal and mantle helium fluxes. Geochim. Cosmochim. Acta 69, 3857–3872.
Lisiecki, L., Raymo, M.R., 2005. A Pliocene-Pleistocene stack of 57 globallydistributed benthic d18O records. Paleocean. vol 20, No. 1, PA100310 (1029/2004PA001071).
Lucas, L.L., Unterweger, M.P., 2000. Comprehensive review and critical evaluation ofthe half-life of tritium. J. Res. Natl. Inst. Stand. Technol. 105, 541–549.
Lupton, J.E., 1983. Terrestrial inert gases: isotope tracer studies and clues toprimordial components in the mantle. Annu. Rev. Earth Planet. Sci. 11, 371–414.
Ma, L., Castro, M.C., Hall, C.M., Walter, L.M., 2005. Cross-formational flow andsalinity sources inferred from a combined study of helium concentrations,isotopic ratios and major elements in the Marshall aquifer, southern Michigan.Geochem. Geophys. Geosyst. 6 (10), Q10004. http://dx.doi.org/10.1029/2005GC001010.
Marty, B., 1984. On the noble gas isotopic fractionation in naturally occurring gases.Geochem. J. 18, 157–162.
Marty, B., Torgersen, T., Meynier, V., O’Nions, R.K., de Marsily, G., 1993. Heliumisotope fluxes and groundwater ages in the Dogger Aquifer, Paris Basin. WaterResour. Res. 29, 1025–1035.
Matsuda, J., Matsumoto, T., Sumino, H., Nagao, K., Yamamoto, J., Miura, Y., Kaneoka,I., Takahata, N., Sano, Y., 2002. The 3He/4He ratio of the new internal Hestandard of Japan (HESJ). Geochem. J. 36, 191–195.
Morrison, P., Pine, J., 1955. Radiogenic origin of the helium isotopes in rocks. Ann.N.Y. Acad. Sci. 62, 69–92.
Mulja, T., Williams-Jones, A., Wood, S., Boily, M., 1995. Geology and mineralogy: therare-element-enriched monzogranite-pegmatite-quartz vein systems in thePreissac-La Corne batholith, Quebec. Can. Mineral. 33, 793–815.
Nadeau, S. 2011. Estimation de la ressource granulaire et du potentiel aquifère deseskers de l’Abitibi-Témiscamingue et du sud de la Baie-James (Québec). MscThesis, Université du Québec à Montréal (UQÀM), Montreal, 145 p.
O’Nions, R.K., Oxburgh, E.R., 1983. Heat and helium in the earth. Nature 306, 429–431.
Ozima, M., Podosek, F.A., 1983. Noble Gas Geochemistry. Cambridge UniversityPress, Cambridge.
Patriarche, D., Castro, M.C., Goblet, P., 2004. Large-scale hydraulic conductivitiesinferred from three-dimensional groundwater flow and 4He transport modelingin the Carrizo aquifer, Texas. J. Geophys. Res. 109, B11202. http://dx.doi.org/10.1029/2004JB003173.
Pinti, D.L., Béland-Otis, C., Tremblay, A., Castro, M.C., Hall, C.M., Marcil, J.-S., Lavoie,J.-Y., Lapointe, R., 2011. Fossil brines preserved in the St-Lawrence Lowlands,Québec, Canada as revealed by their chemistry and noble gas isotopes.Geochim. Cosmochim. Acta 75, 4228–4243.
Riverin, M.N. 2006. Caractérisation et modélisation de la dynamique d’écoulementdans le système aquifère de l’esker Saint-Mathieu–Berry, Abitibi, Québec. MscThesis, INRS-ETE, Quebec, 181 p.
Roy, M., Dell’Oste, F., Parent, M., Veillette, J.J., de Vernal, A., Hélie, J.-F., Parent, M.,2011. Insights on the events surrounding the final drainage of Lake Ojibwaybased on James Bay stratigraphic sequences. Quat. Sci. Rev. 30, 682–692.
Sano, Y., Takahata, N., Igarashi, G., Koizumi, N., Sturchio, N.C., 1998. Heliumdegassing related to the Kobe earthquake. Chem. Geol. 150, 171–179.
Sano, Y., Tokutake, T., Takahata, N., 2008. Accurate measurement of atmospherichelium isotopes. Anal. Sci. 24, 521–525.
Sano, Y., Marty, B., Burnard, P., 2013. Noble gases in the atmosphere. In: Burnard, P.(Ed.), The Noble Gases as Geochemical Tracers, Advances in IsotopeGeochemistry. Springer-Verlag, Berlin Heidelberg, pp. 17–31.
Schlosser, P., Stute, M., Sonntag, C., Munnich, K.O., 1989. Tritiogenic 3He in shallowgroundwaters. Earth Planet. Sci. Lett. 94, 245–256.
Shilts, W.W., Aylsworth, J.M., Kaszycki, C.A., Klassen, R.A., 1987. In: Graf, W.L. (Ed.),Canadian Shield: Geomorphic systems of North America. Boulder, Colorado,Geological Society of America, Centennial Special 2, pp. 119–150.
Smith, S.P., Kennedy, B.M., 1983. The solubility of noble gases in water and NaClbrine. Geochim. Cosmochim. Acta 47, 503–515.
Solomon, D.K., Schiff, S.L., Poreda, R.J., Clarke, W.B., 1993. A validation of the 3H/3Hemethod for determining groundwater recharge. Water Resour. Res. 29 (2951–2962), 1993.
Solomon, D.K., Hunt, A., Poreda, R.J., 1996. Source of radiogenic helium 4 in shallowaquifers: implications for dating young groundwater. Water Resour. Res. 32,1805–1813.
Stute, M., Schlosser, P., 1993. Principles and applications of the noble gaspaleothermometer. In: Swart, P.K., Lohmann, K.C., McKenzie, J., Savin, S.(Eds.), Climate Change in Continental Isotopic Records. AGU, Washington DC,pp. 89–100.
Stute, M., Sonntag, C., Déak, J., Schlosser, P., 1992. Helium in deep circulatinggroundwater in the Great Hungarian Plain: flow dynamics and crustal andmantle helium fluxes. Geochim. Cosmochim. Acta 56, 2051–2067.
Takaoka, N., Mizutani, Y., 1987. Tritiogenic 3He in groundwater in Takaoka. EarthPlanet. Sci. Lett. 85, 74–78.
Tolstikhin, I.N., Kamenskiy, I.L., 1969. Determination of ground-water ages byT–He-3 method. Geochem. Int. 6, 810–811.
Torgersen, T., 2010. Continental degassing flux of 4He and its variability. Geochem.Geophys. Geosyst. 11, Q06002. http://dx.doi.org/10.01029/02009GC002930.
Torgersen, T., Clarke, W.B., 1985. Helium accumulation in groundwater, I: anevaluation of sources and the continental flux of crustal 4He in the GreatArtesian Basin, Australia. Geochim. Cosmochim. Acta 49, 1211–1218.
Torgersen, T., Ivey, G.N., 1985. Helium accumulation in groundwater, II:Mechanisms for the accumulation of the crustal 4He degassing flux. Geochim.Cosmochim. Acta 49, 2445–2452.
Veillette, J.J., 1994. Evolution and paleohydrology of glacial lakes Barlow andOjibway. Quat. Sci. Rev. 13, 945–971.
Veillette, J.J., 1996. Géomorphologie et géologie du Quaternaire du Témiscamingue,Québec et Ontario. Geol. Surv. Canada Bull. 476, 6 maps 1/100,000, Ottawa,269 p.
Veillette, J.J., Paradis, S.J., Thibaudeau, P., 2003. Les cartes de formation en surface del’Abitibi. Geological Survey of Canada, Open File 1523, 10 maps, 1:100,000 scale.
Veillette, J.J., Maqsoud, A., De Corta, H., Bois, D., 2004. Hydrogéologie des eskers dela MRC d’Abitibi, Québec. In: 57th Canadian Geotechnical Conference, 5th JointCGS/IAH-CNC Conference, Québec city, October 2004, Session 3B2, pp. 6–13.
Veillette, J.J., Cloutier, V., de Corta, H., Gagnon, F., Roy, M., Douma, M., Bois D., 2007.A complex recharge network, the Barraute Esker, Abitibi, Québec. In:Proceedings, 60th Canadian Geotechnical Conference and 8th Joint CGS/IAH-CNC Groundwater Conference, Ottawa, pp. 347–354.
Vogel, J.C., 1967. Investigation of groundwater flow with radiocarbon. In Isotopes inHydrology, 355–369. IAEA-SM 83/24, Vienna, Austria, pp. 355–368.
Weber, W.W., Latulippe M., 1964. Amos-Barraute Area, Abitibi East County: QuebecDept. Nat. Resour. Mines Branch Geol. Report G. R., 109 p.
Weise, S., Moser, H., 1987. Groundwater Dating with Helium Isotopes. Techniquesin Water Resource Development. IAEA, Wien, pp. 105–126.


