Embed Size (px)
Citation preview
University of Nebraska - LincolnDigitalCommons@University of Nebraska - Lincoln
USGS Staff -- Published Research US Geological Survey
1-1-2008
Developing conceptual hydrogeological model forPotsdam sandstones in southwestern Quebec,CanadaM. NastevGeological Survey of Canada, [email protected]
Roger H. MorinDenver Federal Center, [email protected]
R. GodinUniversité du Québec à Chicoutimi,
A. RouleauUniversité du Québec à Chicoutimi,
This Article is brought to you for free and open access by the US Geological Survey at DigitalCommons@University of Nebraska - Lincoln. It has beenaccepted for inclusion in USGS Staff -- Published Research by an authorized administrator of DigitalCommons@University of Nebraska - Lincoln. Formore information, please contact [email protected].
Nastev, M.; Morin, Roger H.; Godin, R.; and Rouleau, A., "Developing conceptual hydrogeological model for Potsdam sandstones insouthwestern Quebec, Canada" (2008). USGS Staff -- Published Research. Paper 355.http://digitalcommons.unl.edu/usgsstaffpub/355

Developing conceptual hydrogeological model for Potsdam sandstonesin southwestern Quebec, CanadaM. Nastev & R. Morin & R. Godin & A. Rouleau
Abstract A hydrogeological study was conducted inPotsdam sandstones on the international border betweenCanada (Quebec) and the USA (New York). Twosandstone formations, arkose and conglomerate (base)and well-cemented quartz arenite (upper), underlie thestudy area and form the major regional aquifer unit.Glacial till, littoral sand and gravel, and marine silt andclay discontinuously overlie the aquifer. In both sandstoneformations, sub-horizontal bedding planes are ubiquitousand display significant hydraulic conductivities that areorders of magnitude more permeable than the intact rockmatrix. Aquifer tests demonstrate that the two formationshave similar bulk hydrologic properties, with averagehydraulic conductivities ranging from 2×10⁻⁵ to 4×10⁻⁵
m/s. However, due to their different lithologic andstructural characteristics, these two sandstones imposerather different controls on groundwater flow patterns inthe study area. Flow is sustained through two types offracture networks: sub-horizontal, laterally extensivefractures in the basal sandstone, where hydraulic connec-tivity is very good horizontally but very poor verticallyand each of the water-bearing bedding planes can beconsidered as a separate planar two-dimensional aquiferunit; and the more fractured and vertically jointed systemfound in the upper sandstone that promotes a moredispersed, three-dimensional movement of groundwater.
Résumé Une étude hydrogéologique a été entreprise dansles grès de Potsdam, sur la frontière entre le Canada(Québec) et les Etats-Unis (New York). Sous le secteurd’étude, deux formations gréseuses, les arkoses et con-glomérats (base) et les arénites quartzeuses cimentées(sommet), forment une unité aquifère majeure à l’échellerégionale. Les moraines glaciaires, les sables et gravierslittoraux, et les argiles et silts marins recouvrent l’aquifèrede manière discontinue. Dans les deux formations gré-seuses, les litages sub-horizontaux sont omniprésents, etprésentent des conductivités hydrauliques significatives,supérieures de plusieurs ordres de grandeur à celles de lamatrice rocheuse intacte. Les pompages d’essai démon-trent que les deux formations ont des propriétés hydro-logiques apparentes comparables, avec notamment desconductivités hydrauliques comprises entre 2×10⁻⁵ et 4×10⁻⁵ m/s. Cependant, du fait de leurs lithologies et deleurs caractéristiques structurales contrastées, ces deuxformations gréseuses imposent des contrôles différents surles écoulements souterrains dans le secteur d’étude.L’écoulement est soutenu par deux types de réseaux defractures : des fractures latéralement extensives sub-horizontales dans les grès de base, où la connectivitéhydraulique est très bonne horizontalement mais médiocreverticalement, et où chacun des plans aquifères peut êtreconsidéré comme une unité aquifère isolée plane bidi-mensionnelle, et un système fissuré verticalement et plusfracturé situé dans les grès supérieurs, qui favorise desécoulements souterrains tridimensionnels et plus dispersés.
Resumen Se realizó un estudio hidrogeológico en lasareniscas Potsdam sobre el límite internacional entreCanadá (Quebec) y Estados Unidos de América (NuevaYork). Dos formaciones de arenisca, arkosa y conglom-erado (en la base) y arenita de cuarzo bien cementada (enla cima), componen el área de estudio y forman laprincipal unidad regional de acuífero. Conglomeradoglacial, grava y arena litoral, y arcilla y limo marinosobreyacen discordantemente el acuífero. En ambasformaciones de arenisca existen abundantes planos deestratificación subhorizontales que muestran conductivi-dades hidráulicas significativas que son varios órdenes demagnitud más permeables que la matriz de roca intacta.Las pruebas de acuífero demuestran que las dos forma-ciones tienen propiedades hidrológicas globales similares,con conductividades hidráulicas promedio que varían de
Received: 17 January 2006 /Accepted: 10 December 2007Published online: 10 January 2008
* Springer-Verlag 2007
M. Nastev ())Geological Survey of Canada,490 de la Couronne,Quebec, QC G1K 9A9, Canadae-mail: [email protected]
R. MorinUS Geological Survey,Denver Federal Center,Mail Stop 403,Denver, CO 80225, USA
R. Godin :A. RouleauUniversité du Québec à Chicoutimi,555 blvd. de l’Université,Chicoutimi, QC G7H 2B1, Canada
Hydrogeology Journal (2008) 16: 373–388 DOI 10.1007/s10040-007-0267-9
2×10⁻⁵ a 4×10⁻⁵ m/s. Sin embargo, debido a diferenciaslitológicas y características estructurales, estas dos arenis-cas imponen controles muy distintos en los patrones deflujo de agua subterránea en el área de estudio. El flujo essostenido a través de dos tipos de redes de fracturas:fracturas subhorizontales lateralmente extensivas en laarenisca basal, donde la conectividad hidráulica es muybuena horizontalmente pero muy pobre verticalmente ycada uno de los planos de estratificación acuíferos puedeser considerado como una unidad acuífero en 2 dimen-siones plana y separada; y el sistema de fracturasverticales que se encuentra en la arenisca superior quepromueve un movimiento de agua subterránea másdisperso en 3 dimensiones.
Keywords Canada . Sedimentary rocks .Conceptual models . Geophysical methods
Introduction
The study area coincides with the lateral extent of thePotsdam sandstones in southwestern Quebec (Canada)
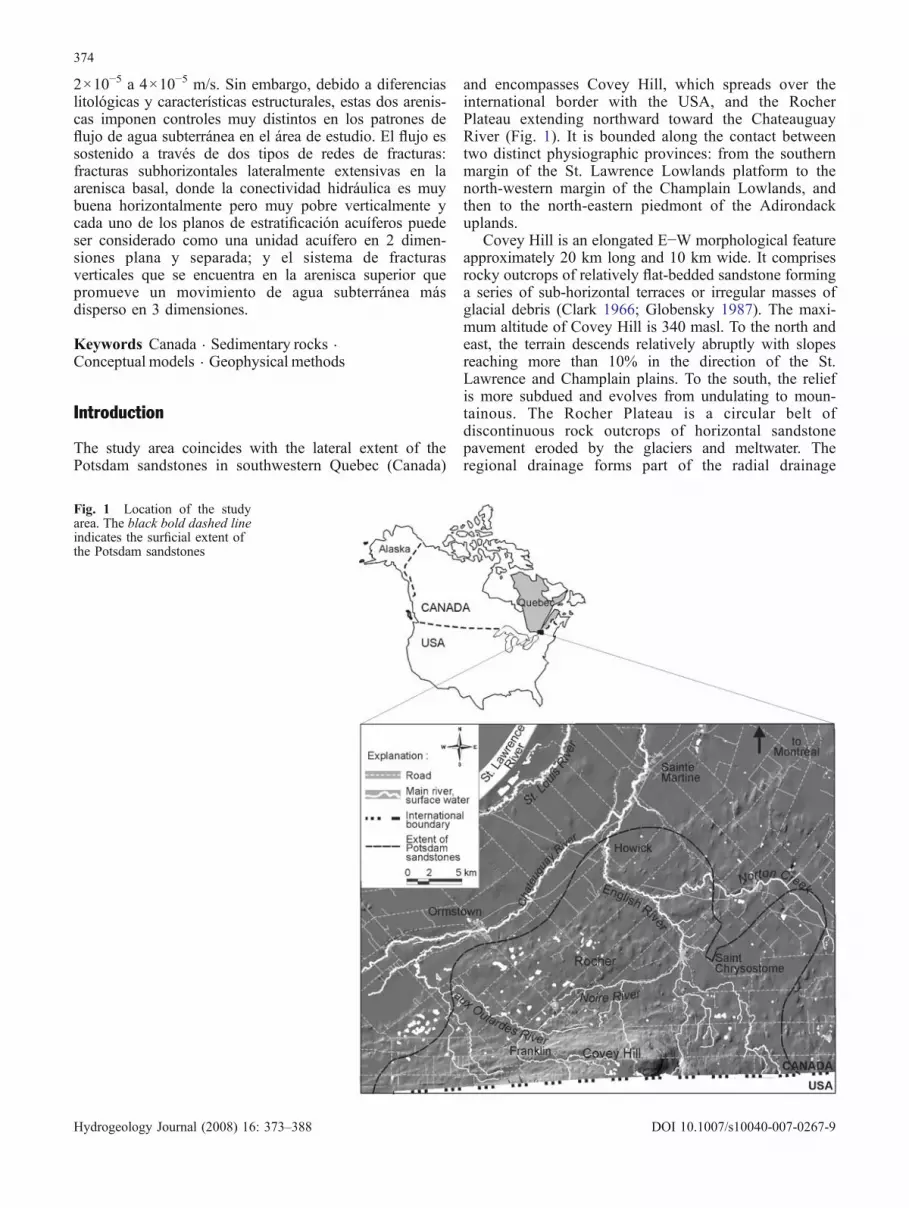
and encompasses Covey Hill, which spreads over theinternational border with the USA, and the RocherPlateau extending northward toward the ChateauguayRiver (Fig. 1). It is bounded along the contact betweentwo distinct physiographic provinces: from the southernmargin of the St. Lawrence Lowlands platform to thenorth-western margin of the Champlain Lowlands, andthen to the north-eastern piedmont of the Adirondackuplands.
Covey Hill is an elongated E−W morphological featureapproximately 20 km long and 10 km wide. It comprisesrocky outcrops of relatively flat-bedded sandstone forminga series of sub-horizontal terraces or irregular masses ofglacial debris (Clark 1966; Globensky 1987). The maxi-mum altitude of Covey Hill is 340 masl. To the north andeast, the terrain descends relatively abruptly with slopesreaching more than 10% in the direction of the St.Lawrence and Champlain plains. To the south, the reliefis more subdued and evolves from undulating to moun-tainous. The Rocher Plateau is a circular belt ofdiscontinuous rock outcrops of horizontal sandstonepavement eroded by the glaciers and meltwater. Theregional drainage forms part of the radial drainage
Fig. 1 Location of the studyarea. The black bold dashed lineindicates the surficial extent ofthe Potsdam sandstones
374
Hydrogeology Journal (2008) 16: 373–388 DOI 10.1007/s10040-007-0267-9

network originating at the Adirondack Uplands. Thisdrainage system is relatively sparse on Covey Hill proper,where coarser unconsolidated sediments at the surface(reworked till) seem to have a high capacity to accumulateprecipitation waters. With few exceptions, the drainage ofsurface water occurs mainly by infiltration and subsequentsub-surface runoff and groundwater flow. On the RocherPlateau, numerous lakes and wetlands are disposed ataltitudes ranging primarily between 60 and 80 masl. Theyprovide a surface expression of the intense runoff anddischarge processes taking place at Covey Hill (Nastevet al. 2004).
With an approximate population density of 10−20persons per km2, the study area represents a relativelysparsely populated, rural region that depends entirely ongroundwater for its source of potable water. Althoughunfit for large-scale farming, this stony region is ideallysuited for apple orchards and sugar-maple groves. Otheragricultural activities include mainly dairy and livestockfarming, equine centers, and vegetable and small fruitgrowing (Dagenais and Nastev 2005). The intensiveapplication of fertilizers, herbicides and pesticides to fruittrees may potentially contribute to the alteration of thegroundwater quality. The increasingly popular planting ofdwarf apple trees, perfectly adapted to the shallow soilsand rock outcrops, represents an additional stress ongroundwater resources as these plants require almost dailywatering during the hot summer months.
Historically, the Potsdam sandstones have been re-nowned for their good quality water and, currently, onelocal company withdraws groundwater for bottling; twoother commercial applications are under evaluation (Nastevet al. 2004a). In addition, Covey Hill is the sole region inCanada where Mountain Dusky salamanders are found.Their habitat, in the vicinity of natural springs, small creeksand seepage areas, is threatened by continued deforestation,and by agricultural and industrial activities (see URL,Environment Canada 2006). Despite the relative abundanceof potable water in the region, the steady increase ingroundwater use (Dagenais and Nastev 2005) combinedwith prolonged drought conditions evident over the lastseveral years, have contributed to occasional shortages andpotential disputes between various users who share theheavily exploited areas. Currently, the lack of a generalunderstanding regarding the underlying hydrologic systemand the availability of good quality groundwater precludesthe formulation of suitable management plans by localwater authorities.
The Quaternary sediments and the bedrock imposeseveral distinct modes of hydrogeologic control that, whenintegrated, define the general hydrologic characteristics inthe region. Coarse littoral sediments (reworked till), due totheir relatively high porosity and hydraulic conductivity,are characterized with relatively low rates of surfacerunoff and high rates of infiltration and sub-surface runoff(Tremblay and Lamothe 2005; Croteau et al. 2005). Thestudy area represents a major recharge zone for theregional aquifers found in the fractured rock units and,simultaneously, is an area that has a relatively high
potential for surface contamination. The primary sand-stone units have different structural characteristics as welland differ in the way they control the flow of groundwater(McCormack 1981; Lavoie 2005).
This study reviews the current state of knowledgeregarding the groundwater resources of the Covey Hillarea and reports on the results of a hydrogeological studyrecently undertaken to improve our conceptual under-standing of the underlying hydrologic system (Nastev etal. 2004a).
Geology
Bedrock geologyThe stratigraphic framework and structural geology of thestudy area is based primarily on fieldwork conducted bythe Quebec Department of Natural Resources over a circa20-year period (Clark 1966; Wiesnet and Clark 1966;Globensky 1987) and subsequent thematic studiesconcerned with the region’s tectono-stratigraphic frame-work (Salad Hersi et al. 2002). The bedrock consists ofLower Paleozoic sedimentary rocks that overlie an unevensurface of crystalline rocks of Precambrian age. There aresubstantial differences among investigators over theprecise definition of the lithology and spatial extent ofthe sedimentary units. The official bedrock map of theQuebec Department of Natural Resources (Globensky1987) is referenced here for the purposes of this study(Fig. 2a). The bedrock structure, however, as described byClark (1966) and by Wiesnet and Clark (1966), seems tobetter represent field observations and is used for the crosssection presented in Fig. 2b (Lavoie 2005).
The oldest Paleozoic formation is the Covey Hillsandstone of the Potsdam Group. It is composed ofinterbeds of locally conglomeratic fine to commonlycoarse-grained quartz (>50%) and feldspar (<50%), withsome mudrock and pebbles. Locally, thin (≤5 m)fossiliferous and dolomitic sandstone unit was identifiedby Clark (1966) as Rivière aux Outards member at the topof this formation. Red shales are often found at the base ofthe Covey Hill formation. Compact beds are massive witha thickness of usually several tens of centimetres to ametre, but can also reach 2 m. In many places but mostlyin lower beds, it can be conglomeratic with quartz pebblesas large as 2.5 cm and feldspar as large as 1.2 cm (Clark1966). This rock has many varieties: white, gray toreddish-brown due to the presence of iron minerals inthe cementing materials. These minerals influence thegroundwater quality as well. The cementation in CoveyHill sandstones varies from loose to strong, and rocks canoccasionally be very poorly consolidated and friable.
The upper part of the Potsdam Group is comprised ofthe Cairnside formation. It consists of crossbeddedhomogeneous light grey to creamy white quartz arenite(∼98%) at the base and similar upper quartz arenite withsubordinate interbedded dolomitic sandstone (Clark 1966;Globensky 1987). The grains are well-graded, roundedand well-cemented with siliceous cement or rarely with
375
Hydrogeology Journal (2008) 16: 373–388 DOI 10.1007/s10040-007-0267-9

dolomitic cement (in its upper part). Cairnside sandstonetypically is relatively thin bedded, with most beds lessthan 15 cm thick and rarely reaching 60 cm. Thicker bedsare usually more resistant and stand out as continuousescarpments. This is noticeable at sloping topographywhere harder beds form step-like elevation changes whichgive an undulating shape to the ground surface. Based ondrilling experience, Cairnside sandstone is the hardestsedimentary rock in the region.
Bedrock folds and faults, mainly developed by E−Wcompression during the Appalachian orogenies, locallycomplicate aquifer geometry. As most of the tectonic
elements trend northerly, regional compression wasimposed in an E−W direction (Wiesnet and Clark 1966).On Covey Hill proper, sandstone beds are disposed alonga synclinal axis plunging W−SW. Located a few kilo-metres to the north is the Stockwell fault, striking in an E–NE direction. This feature bounds Covey Hill on the northand is manifested as a reverse fault, thereby indicatingsignificant compression (Lavoie 2005). The Stockwellfault accounts for the relatively abrupt-sloping terrain onthe northwestern flanks of Covey Hill. Since the sandstonebeds remain horizontal to sub-horizontal in this area, thisfault represents a significant upward displacement of the
Fig. 2 a Bedrock map (modi-fied from Globensky 1987,and Clark 1966), and location ofmonitoring wells; b Crosssection (modified fromLavoie 2005)
376
Hydrogeology Journal (2008) 16: 373–388 DOI 10.1007/s10040-007-0267-9
southern block elevating the Covey Hill formation to itspresent outcroping level. To the east, Covey Hill isbounded by the Havelock fault which forms an importantsynclinal feature to the north but that gradually dies out tothe south (Wiesnet and Clark 1966). The verticaldisplacement along the Havelock fault is estimated to bebetween 400 and 500 m (Clark 1966). Large blocks andangular fragments of Potsdam sandstones and brecciatedcarbonate rocks are aligned with this fault (Lavoie 2005).Two major anticlines border the Havelock fault to the eastand to the west, plunging north and north-east. Severalother low intensity folds are also observed. The relativelyweak regional tectonics result in horizontal to sub-horizontal bedding planes with very low dips of 1–3° ingeneral; along the hill slopes, dips can reach 4–5° (Clark1966). The thickness from exposed field sections andcores for the Covey Hill ranges from 200 up to 500 m.The thickness of the Cairnside is more uniform reachingapproximately 100 m.
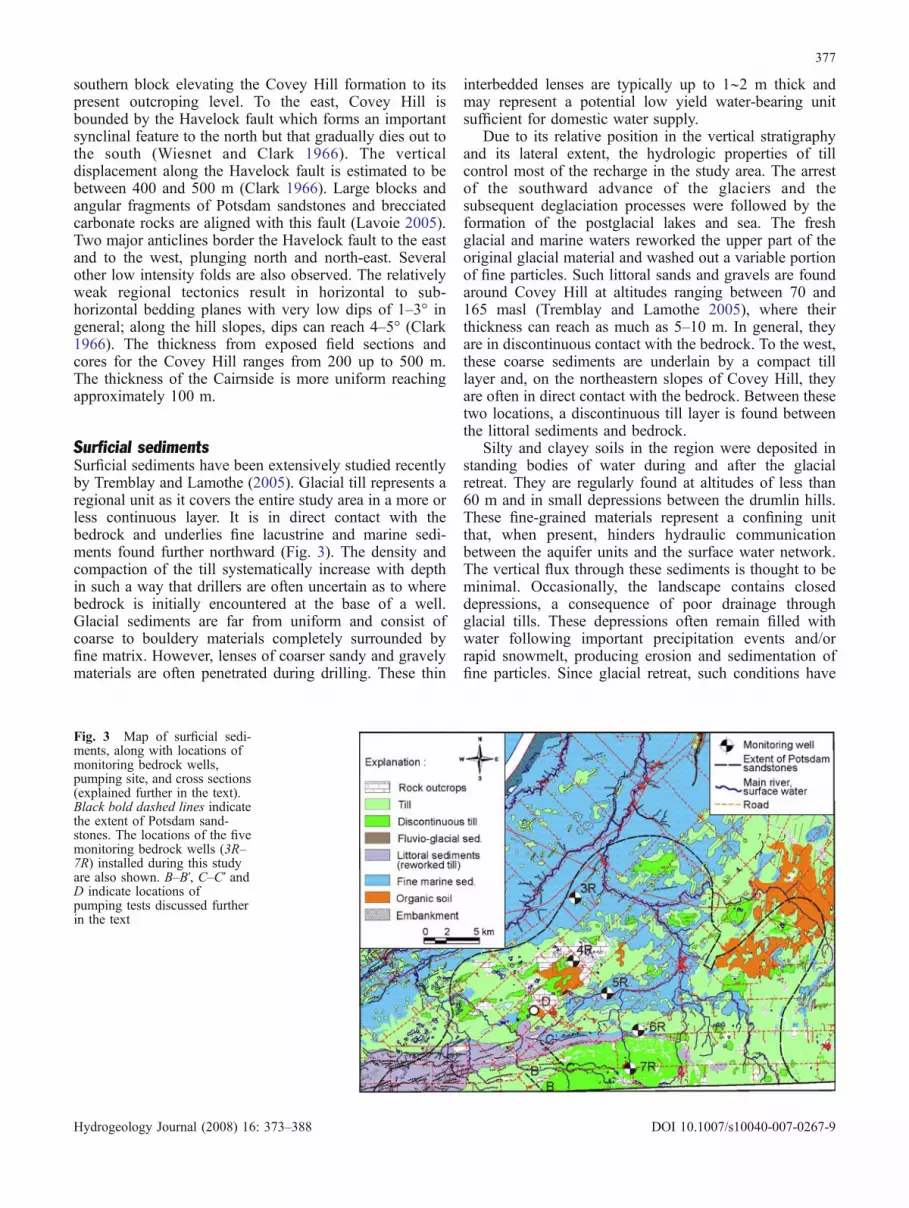
Surficial sedimentsSurficial sediments have been extensively studied recentlyby Tremblay and Lamothe (2005). Glacial till represents aregional unit as it covers the entire study area in a more orless continuous layer. It is in direct contact with thebedrock and underlies fine lacustrine and marine sedi-ments found further northward (Fig. 3). The density andcompaction of the till systematically increase with depthin such a way that drillers are often uncertain as to wherebedrock is initially encountered at the base of a well.Glacial sediments are far from uniform and consist ofcoarse to bouldery materials completely surrounded byfine matrix. However, lenses of coarser sandy and gravelymaterials are often penetrated during drilling. These thin
interbedded lenses are typically up to 1∼2 m thick andmay represent a potential low yield water-bearing unitsufficient for domestic water supply.
Due to its relative position in the vertical stratigraphyand its lateral extent, the hydrologic properties of tillcontrol most of the recharge in the study area. The arrestof the southward advance of the glaciers and thesubsequent deglaciation processes were followed by theformation of the postglacial lakes and sea. The freshglacial and marine waters reworked the upper part of theoriginal glacial material and washed out a variable portionof fine particles. Such littoral sands and gravels are foundaround Covey Hill at altitudes ranging between 70 and165 masl (Tremblay and Lamothe 2005), where theirthickness can reach as much as 5–10 m. In general, theyare in discontinuous contact with the bedrock. To the west,these coarse sediments are underlain by a compact tilllayer and, on the northeastern slopes of Covey Hill, theyare often in direct contact with the bedrock. Between thesetwo locations, a discontinuous till layer is found betweenthe littoral sediments and bedrock.
Silty and clayey soils in the region were deposited instanding bodies of water during and after the glacialretreat. They are regularly found at altitudes of less than60 m and in small depressions between the drumlin hills.These fine-grained materials represent a confining unitthat, when present, hinders hydraulic communicationbetween the aquifer units and the surface water network.The vertical flux through these sediments is thought to beminimal. Occasionally, the landscape contains closeddepressions, a consequence of poor drainage throughglacial tills. These depressions often remain filled withwater following important precipitation events and/orrapid snowmelt, producing erosion and sedimentation offine particles. Since glacial retreat, such conditions have
Fig. 3 Map of surficial sedi-ments, along with locations ofmonitoring bedrock wells,pumping site, and cross sections(explained further in the text).Black bold dashed lines indicatethe extent of Potsdam sand-stones. The locations of the fivemonitoring bedrock wells (3R–7R) installed during this studyare also shown. B–B’, C–C’ andD indicate locations ofpumping tests discussed furtherin the text
377
Hydrogeology Journal (2008) 16: 373–388 DOI 10.1007/s10040-007-0267-9

resulted in the creation of bogs and wetlands, and in theaccumulation of organic plant material surrounding andprogressively spreading over the body of open water.
Hydrogeology
Groundwater levelsA regional potentiometric map (Fig. 4) was generatedbased on 150 field measurements of water levels inbedrock wells obtained during a regional survey per-formed in 2003, data collected from drillers’ logs, anddata for surface water elevations (Benoît et al. 2005). Thepotentiometric surface closely drapes the major topo-graphic features: it has a dome shape originating at CoveyHill and discharges radially toward the Rocher plateau andthe Chateauguay River further to the north, the auxOutardes River to the west, and the English River to theeast. At topographic highs, depth to water occasionallyattains several tens of metres and, close to the summit ofCovey Hill, groundwater elevations reach approximately250–300 masl. An important seepage zone was observedN–NE of Franklin near the Stockwell fault at an altitude ofapproximately 100–110 masl. This is a source area for theNoire River. Hydraulic gradients weaken near the Rocherplateau where the regional potentiometric levels stabilizeat altitudes of 60–80 masl and flow becomes nearlyhorizontal. Further downgradient in the discharge zone,water levels are much closer to the ground surface andfluctuations are dampened.
On Covey Hill, bedrock water levels are stronglydependent upon the depth of individual wells. Due to thedownward flow (recharge), wells intercepting deeper rockunits (50∼100 m) record deeper water levels, whereaswater levels in shallower bedrock wells (<20 m) are closerto the ground surface. Thus, using the difference in the
observed charges of two neighbouring wells as nominatorin the hydraulic gradient and the vertical distance betweenthe centers of the screened sections (open borehole) asdenominator, strong hydraulic gradients have been esti-mated : i∼0.5 at the monitoring well 7R (Fig. 3), and i∼1at the site of the pumping test No. 2 (Fig. 5b).
Besides the effects of topography and hydraulicgradient, groundwater level can be strongly influencedlocally by the structure and distribution of bedding planes.Water levels in wells intercepting the same bedding planeremain relatively similar, with a slight slope downhill,even if wells are installed at different altitudes and severalhundreds of metres apart (Fig. 5a and b). During drillingand well installation, a shallow water table is usuallyencountered at the contact between glacial sediments andbedrock. Cascading wells can also be observed in theregion, where shallow water infiltrates the well at the baseof casing or from the upper bedding plane partings andfalls freely along the walls of the well. Depending on theinput and output fluxes, a relatively stable but dynamicwater level is reached in the open borehole. Occasionally,steep terrain and variable topography contribute toproducing upward flow conditions, artesian pressuresalong bedding planes and flowing wells. Such is the siteof the pumping test No. 3 (Fig. 5b).
Groundwater rechargeRecharge from precipitation infiltrating through Quaterna-ry sediments and attaining bedrock aquifers was estimatedby Croteau et al. (2005) and Croteau (2006). HELPsoftware (Schroeder et al. 1994) has been used to obtainthe spatial distribution of the water budget parameters.HELP simulates a comprehensive set of hydrologicprocesses on daily basis: surface runoff (SCS curve-number method); prediction of frozen soil conditions
Fig. 4 Regional potentiometricsurface
378
Hydrogeology Journal (2008) 16: 373–388 DOI 10.1007/s10040-007-0267-9

based on antecedent air temperatures; snow accumulationand melt; rainfall interception by foliage; potentialevapotranspiration using the energy-based Penman model(surface and water evaporation and plant transpiration);vegetative growth; gravity driven saturated and/or unsat-urated vertical drainage; lateral saturated drainage. Thehydrograph separation method provided independentestimates of the bulk water-budget parameters representa-tive for areas upstream of the gauging stations. These wereused to calibrate HELP simulations. For the consideredperiod between 1964∼2002, the measured average annualprecipitation in the study area was 956 mm. The estimatedbulk annual rates of the real evapotranspiration, surfacerunoff and infiltration over the study area were 546, 224and 186 mm respectively. The calibrated recharge rate tobedrock aquifers was approximately 150 mm. Dependingof the type of the unconsolidated sediments overlying thebedrock aquifers, the average recharge rates were: 21 mm
for fine marine sediments, 112 mm for glacial sediments,251 mm for coarse sand and gravel, and 191 mm inareas of shallow glacial sediments and/or rock outcrops(Croteau 2006).
Aquifer hydraulic properties
Existing multi-well pumping testsFive large-scale, multi-well pumping tests were conductedin the study area by private companies to designgroundwater supply systems. Three test sites were set inthe Covey Hill formation: pumping test No. 1 (indicatedby B–B’ line in Fig. 3), and pumping tests No. 2 and No.3, (indicated by C–C’ line in Fig. 3), and the fourth site,where two pumping tests (No. 4 and No. 5) wereconducted, is located in the Cairnside formation (indicatedby D in Fig. 3). Figures 5a and b show the installationgeometry for pumping tests No. 1 through No. 3. Aquiferhydraulic properties were obtained by interpreting the
Fig. 5 Diagram of local piezometric levels. a Cross sections B−B’, and b cross section C–C’ (shown in Fig. 3). Wells identified asPW were used as pumping wells for aquifer tests discussed in text
Fig. 6 Drawdown observed during pumping test No. 1 and No. 2in Covey Hill sandstones. a Drawdown measured at the end of the3-day pumping period of pumping test No. 1; distances toobservation wells (OW) are given in parentheses. Δh is drawdownfor log-distance, T is transmissivity, S is storage coefficient, and Q iswithdrawal rate. b Drawdown variation in three piezometers located1.5 m from pumping well PW-3
379
Hydrogeology Journal (2008) 16: 373–388 DOI 10.1007/s10040-007-0267-9

recorded drawdown/recovery curves by using Theis and/or Cooper-Jacob straight line solutions for confinedaquifers. Note that for these aquifer tests as well as forthe single-well pumping tests discussed next, relativelysmall drawdown was observed. It occurred mainly inthe well casing without observing any ‘drying’ of theintercepted water bearing bedding planes. Thus, in theapplied interpretation methods, the assumption of equiv-alent porous medium at the test scale appears to beadequate. The obtained results of the multi-well pumpingtests indicate transmissivity range of 5.8×10⁻⁴∼2.6×10⁻³m/s2 and storativity range of 5×10⁻⁵∼4×10⁻⁴. What ismore important, these tests provided useful informationregarding the various interconnections that exist betweenthe bedding planes and the aquifer anisotropy.
Pumping test No. 1. Observed drawdown produced bywater extraction in pumping well PW-1 is given inFigs. 5a and 6a. As a result of the imposed constantwithdrawal rate of 9.2 L/s, the drawdown in the vicinityof the pumping well PW-1 was ∼7 m and the cone ofdepression decreased logarithmically with distance. Theobserved aquifer responses strongly suggest that pump-ing well PW-1 and the observation wells OW-2 andOW-4 on one hand, and OW-1 and OW-5 on the other,intercept same water-bearing bedding planes, whichconstitute distinct groundwater flow paths of a relativelylarge lateral extent, more or less isolated from the upperand lower geologic units. The Jacob straight linedistance-drawdown method yields two estimates for theaquifer transmissivity and storativity (Fig. 6a). In the firstcase, the distance at which the pumping is affecting thewater levels is approximately 1∼1.5 km (OW-2, OW-4),whereas in the second case it may reach several kilometres(OW-1, OW-5). Drawdown is negligible in observationwells OW-3 and OW-6 which appear not to be hydraulicallyconnected to PW-1.
Pumping test No. 2. The pumping well PW-2 and the twobedrock piezometers, distanced 10 and 32 m respectively,were screened over the same sub-horizontal water bearingbedding plane located at approximate depth of 65 m (Fig.5b). Each bedrock piezometer was doubled with shallowpiezometer screened at the bedrock/granular sedimentsinterface to monitor the shallow water table. The appliedextraction rate of 3.0 L/s over a period of 72 h generated adrawdown of 3.8 m in the pumped well, and 2.7 and 1.6 min the bedrock piezometers. At the same time, the shallowpiezometers did not show any measurable drawdown,indicating that the top of the bedrock and the granularsediments behave as a perched aquifer and at the test-scalethe hydraulic contact with the deeper aquifer unit isinsignificant.
Pumping test No. 3. Three major water-bearing beddingplanes were intercepted during the drilling of the pumpingwell PW-3 (Fig. 5b). Three piezometers (PZ) were theninstalled at the same radial distance of 1.5 m from the
pumping well and screened over each of the beddingplanes. The hydraulic heads were measured using ma-nometers dedicated to each well. Artesian head is observedat the site, approximately 2 m above ground surface in thedeepest bedding plane (PZ-3), and decreasing linearly by3∼4 cm per bedding plane in the upward direction. Thedrawdown curves recorded by the piezometers show verysimilar variation, but the magnitudes differ. Figure 6bindicates a particular interconnectivity among beddingplanes intercepted by PZ-2 and PZ-3, since these showsimilar drawdowns. The upper bedding plane interceptedby PZ-1 seems to have a weaker hydraulic contact with theother two. The diurnal (day/night) and weekly (week-end)fluctuations in water levels superimposed upon the typicaltime/drawdown records are due to the influence exerted bya pumping at a nearby commercial facility. The generaldecreasing trend of the drawdown by almost a metre overthe considered period of 2.5 months is most probably dueto the increased autumnal recharge.
Pumping test No. 4 and No. 5. The two aquifer testsundertaken in the Carnside formation (No. 4 and No. 5)consisted of two pumping wells and one observation wellbetween them. The wells were aligned in a N–S directionwith distances from the observation well to the pumpingwells PW-4 and PW-5 of 350 and 450 m, respectively. Thegeneral direction of the groundwater flow is northwardand depth to the initial water level is approximately 1.5 m.After 4 days of pumping, an extraction rate of 6.3 L/s inPW-4 produced drawdown of 21 m in the withdrawal wellitself and 0.3 m in the observation well. Well PW-5 waspumped at a rate of 15.8 L/s during three days, and thisresulted in a drawdown of 15.2 m in the pumped well and0.5 m in the observation well. Thus, the estimated bedrocktransmissivity is approximately 3.5 times greater in thevicinity of well PW-5 than it is near well PW-4, evidenceof the heterogeneous nature of these fractured sedimentaryrock aquifers.
Single-well pumping testsData extracted from the Quebec Ministry of Environmentdrillers’ database provided valuable information about theregional hydraulic properties of the aquifers. The specificcapacity of a well, defined as the ratio between theobserved yield and the corresponding final drawdown, isusually obtained immediately after the completion of thedrilling to determine the potential yield of the well. Thisdata represents only a rough estimate for the aquifertransmissivity and a rigorous screening procedure wasneeded to eliminate incomplete and potentially erroneousdata. The retained dataset consisted of 51 specific capacitydata (41 in Cairnside and 10 in Covey Hill). The averagewell depth was 21 m (6∼61 m); the open borehole lengthvaried from 2 to 56 m; the average pumping rate was 1.7L/s (0.2∼19 L/s); the observed drawdown range was0.3∼29 m for an average of 5.3 m; and the test durationvaried between 2 and 24 h. The hydraulic conductivityestimation for each measurement was obtained by thecomputerized technique presented by Bradbury and
380
Hydrogeology Journal (2008) 16: 373–388 DOI 10.1007/s10040-007-0267-9
Rothschild (1985) based on the Jacob’s solution. Theobtained range of the hydraulic conductivity was 5.1×10⁻⁶∼9.9×10⁻⁴ m2/s.
During the course of this study, short duration single-well pumping tests were undertaken in four bedrock wells(3R, 4R, 5R, and 6R, Fig. 3). Digital pressure transducerswere used to measure water levels during the tests.Pumping tests were interpreted with the Theis solutionfor confined aquifers, Neuman method with delayedgravity response, and with the Hantush’s analyticalsolution for leaky confined aquifers. For all tests, datainterpretation focused on the late drawdown in order toavoid the influence of the well-bore storage.
The same bedrock wells were hydraulically tested withslug tests, and with constant-head injection tests (see thefollowing section). Water displacement curves for the slugtests were interpreted with the Bouwer and Rice method.The combined results for aquifer tests undertaken in themonitoring bedrock wells are given in Table 1.
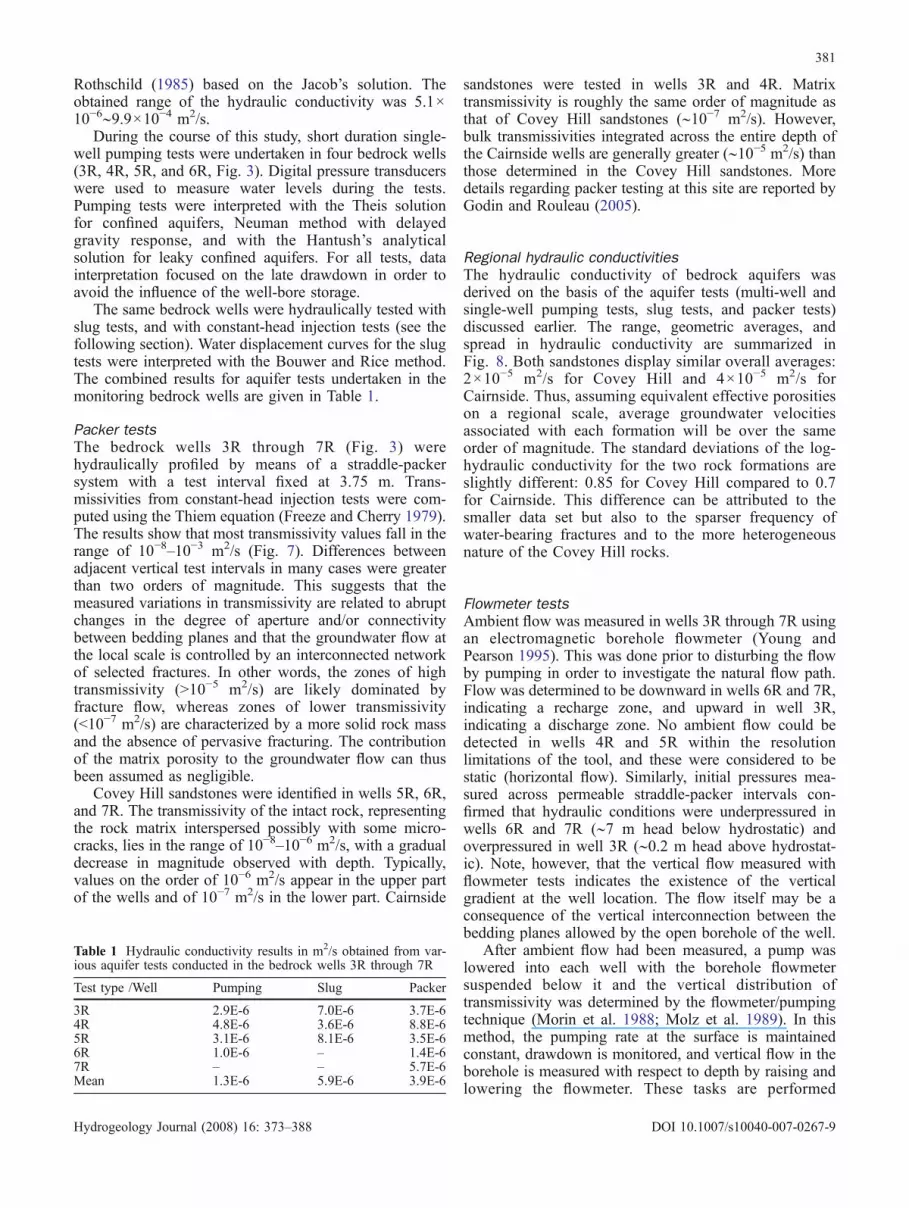
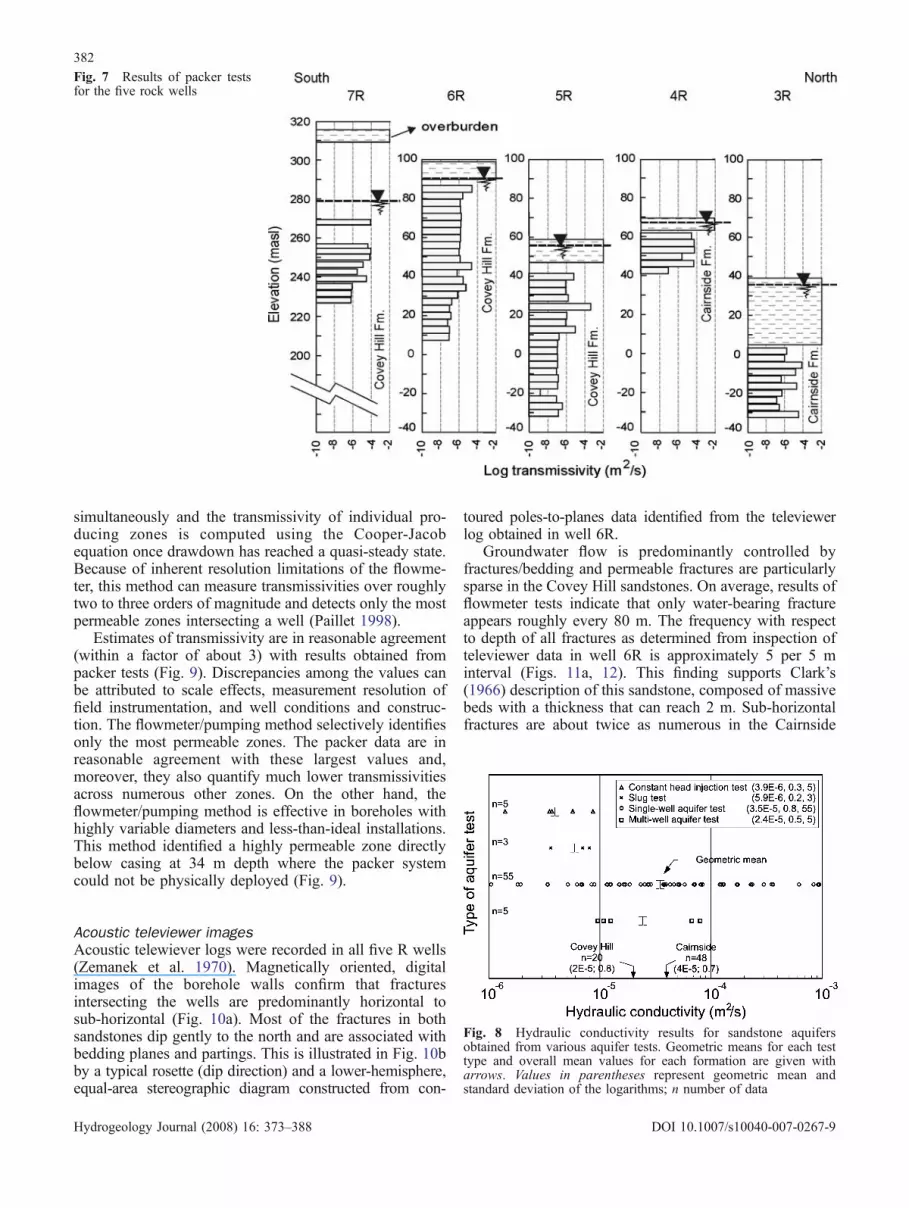
Packer testsThe bedrock wells 3R through 7R (Fig. 3) werehydraulically profiled by means of a straddle-packersystem with a test interval fixed at 3.75 m. Trans-missivities from constant-head injection tests were com-puted using the Thiem equation (Freeze and Cherry 1979).The results show that most transmissivity values fall in therange of 10−8–10−3 m2/s (Fig. 7). Differences betweenadjacent vertical test intervals in many cases were greaterthan two orders of magnitude. This suggests that themeasured variations in transmissivity are related to abruptchanges in the degree of aperture and/or connectivitybetween bedding planes and that the groundwater flow atthe local scale is controlled by an interconnected networkof selected fractures. In other words, the zones of hightransmissivity (>10−5 m2/s) are likely dominated byfracture flow, whereas zones of lower transmissivity(<10−7 m2/s) are characterized by a more solid rock massand the absence of pervasive fracturing. The contributionof the matrix porosity to the groundwater flow can thusbeen assumed as negligible.
Covey Hill sandstones were identified in wells 5R, 6R,and 7R. The transmissivity of the intact rock, representingthe rock matrix interspersed possibly with some micro-cracks, lies in the range of 10−8–10−6 m2/s, with a gradualdecrease in magnitude observed with depth. Typically,values on the order of 10−6 m2/s appear in the upper partof the wells and of 10−7 m2/s in the lower part. Cairnside
sandstones were tested in wells 3R and 4R. Matrixtransmissivity is roughly the same order of magnitude asthat of Covey Hill sandstones (∼10−7 m2/s). However,bulk transmissivities integrated across the entire depth ofthe Cairnside wells are generally greater (∼10−5 m2/s) thanthose determined in the Covey Hill sandstones. Moredetails regarding packer testing at this site are reported byGodin and Rouleau (2005).
Regional hydraulic conductivitiesThe hydraulic conductivity of bedrock aquifers wasderived on the basis of the aquifer tests (multi-well andsingle-well pumping tests, slug tests, and packer tests)discussed earlier. The range, geometric averages, andspread in hydraulic conductivity are summarized inFig. 8. Both sandstones display similar overall averages:2×10⁻⁵ m2/s for Covey Hill and 4×10⁻⁵ m2/s forCairnside. Thus, assuming equivalent effective porositieson a regional scale, average groundwater velocitiesassociated with each formation will be over the sameorder of magnitude. The standard deviations of the log-hydraulic conductivity for the two rock formations areslightly different: 0.85 for Covey Hill compared to 0.7for Cairnside. This difference can be attributed to thesmaller data set but also to the sparser frequency ofwater-bearing fractures and to the more heterogeneousnature of the Covey Hill rocks.
Flowmeter testsAmbient flow was measured in wells 3R through 7R usingan electromagnetic borehole flowmeter (Young andPearson 1995). This was done prior to disturbing the flowby pumping in order to investigate the natural flow path.Flow was determined to be downward in wells 6R and 7R,indicating a recharge zone, and upward in well 3R,indicating a discharge zone. No ambient flow could bedetected in wells 4R and 5R within the resolutionlimitations of the tool, and these were considered to bestatic (horizontal flow). Similarly, initial pressures mea-sured across permeable straddle-packer intervals con-firmed that hydraulic conditions were underpressured inwells 6R and 7R (∼7 m head below hydrostatic) andoverpressured in well 3R (∼0.2 m head above hydrostat-ic). Note, however, that the vertical flow measured withflowmeter tests indicates the existence of the verticalgradient at the well location. The flow itself may be aconsequence of the vertical interconnection between thebedding planes allowed by the open borehole of the well.
After ambient flow had been measured, a pump waslowered into each well with the borehole flowmetersuspended below it and the vertical distribution oftransmissivity was determined by the flowmeter/pumpingtechnique (Morin et al. 1988; Molz et al. 1989). In thismethod, the pumping rate at the surface is maintainedconstant, drawdown is monitored, and vertical flow in theborehole is measured with respect to depth by raising andlowering the flowmeter. These tasks are performed
Table 1 Hydraulic conductivity results in m2/s obtained from var-ious aquifer tests conducted in the bedrock wells 3R through 7R
Test type /Well Pumping Slug Packer
3R 2.9E-6 7.0E-6 3.7E-64R 4.8E-6 3.6E-6 8.8E-65R 3.1E-6 8.1E-6 3.5E-66R 1.0E-6 – 1.4E-67R – – 5.7E-6Mean 1.3E-6 5.9E-6 3.9E-6
381
Hydrogeology Journal (2008) 16: 373–388 DOI 10.1007/s10040-007-0267-9
simultaneously and the transmissivity of individual pro-ducing zones is computed using the Cooper-Jacobequation once drawdown has reached a quasi-steady state.Because of inherent resolution limitations of the flowme-ter, this method can measure transmissivities over roughlytwo to three orders of magnitude and detects only the mostpermeable zones intersecting a well (Paillet 1998).
Estimates of transmissivity are in reasonable agreement(within a factor of about 3) with results obtained frompacker tests (Fig. 9). Discrepancies among the values canbe attributed to scale effects, measurement resolution offield instrumentation, and well conditions and construc-tion. The flowmeter/pumping method selectively identifiesonly the most permeable zones. The packer data are inreasonable agreement with these largest values and,moreover, they also quantify much lower transmissivitiesacross numerous other zones. On the other hand, theflowmeter/pumping method is effective in boreholes withhighly variable diameters and less-than-ideal installations.This method identified a highly permeable zone directlybelow casing at 34 m depth where the packer systemcould not be physically deployed (Fig. 9).
Acoustic televiewer imagesAcoustic telewiever logs were recorded in all five R wells(Zemanek et al. 1970). Magnetically oriented, digitalimages of the borehole walls confirm that fracturesintersecting the wells are predominantly horizontal tosub-horizontal (Fig. 10a). Most of the fractures in bothsandstones dip gently to the north and are associated withbedding planes and partings. This is illustrated in Fig. 10bby a typical rosette (dip direction) and a lower-hemisphere,equal-area stereographic diagram constructed from con-
toured poles-to-planes data identified from the televiewerlog obtained in well 6R.
Groundwater flow is predominantly controlled byfractures/bedding and permeable fractures are particularlysparse in the Covey Hill sandstones. On average, results offlowmeter tests indicate that only water-bearing fractureappears roughly every 80 m. The frequency with respectto depth of all fractures as determined from inspection ofteleviewer data in well 6R is approximately 5 per 5 minterval (Figs. 11a, 12). This finding supports Clark’s(1966) description of this sandstone, composed of massivebeds with a thickness that can reach 2 m. Sub-horizontalfractures are about twice as numerous in the Cairnside
Fig. 8 Hydraulic conductivity results for sandstone aquifersobtained from various aquifer tests. Geometric means for each testtype and overall mean values for each formation are given witharrows. Values in parentheses represent geometric mean andstandard deviation of the logarithms; n number of data
Fig. 7 Results of packer testsfor the five rock wells
382
Hydrogeology Journal (2008) 16: 373–388 DOI 10.1007/s10040-007-0267-9
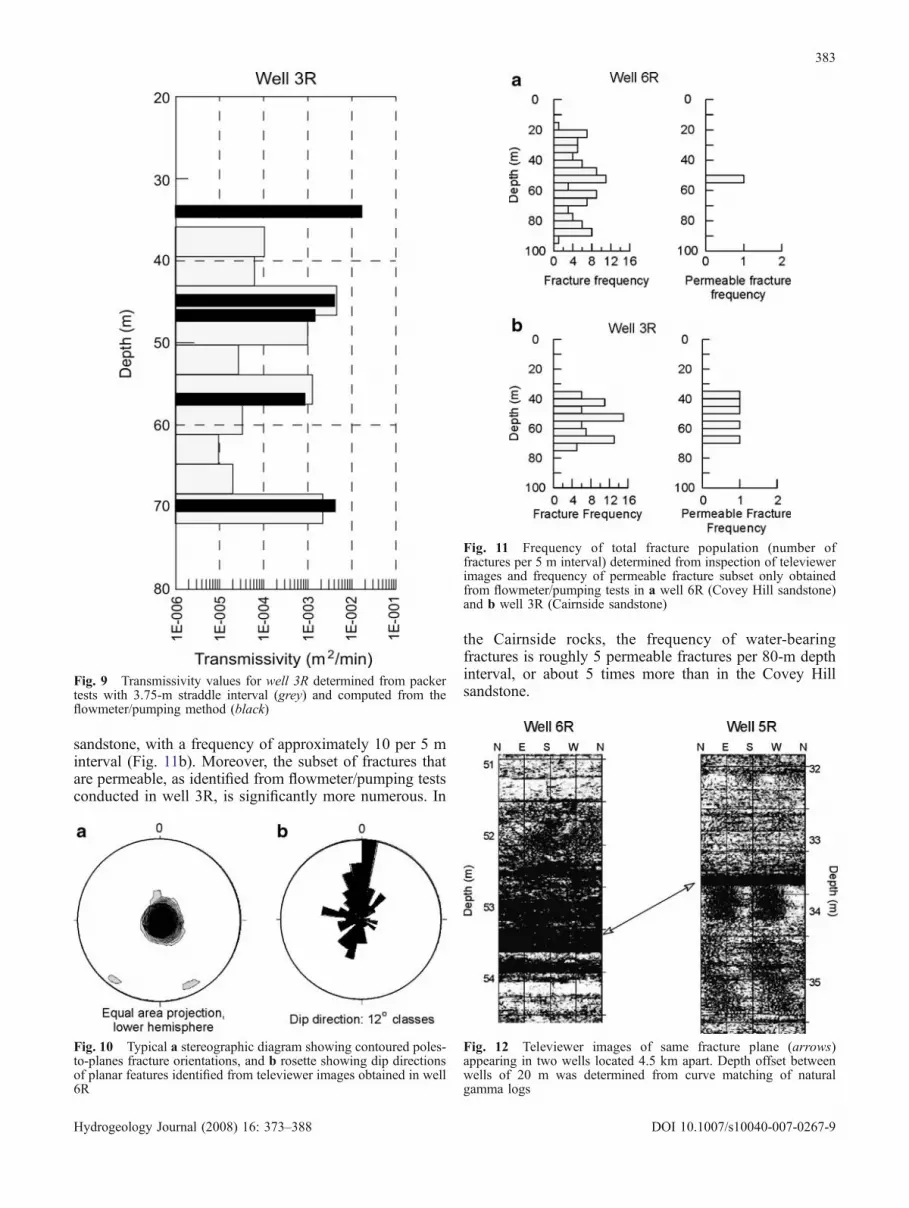
sandstone, with a frequency of approximately 10 per 5 minterval (Fig. 11b). Moreover, the subset of fractures thatare permeable, as identified from flowmeter/pumping testsconducted in well 3R, is significantly more numerous. In
the Cairnside rocks, the frequency of water-bearingfractures is roughly 5 permeable fractures per 80-m depthinterval, or about 5 times more than in the Covey Hillsandstone.
Fig. 10 Typical a stereographic diagram showing contoured poles-to-planes fracture orientations, and b rosette showing dip directionsof planar features identified from televiewer images obtained in well6R
Fig. 11 Frequency of total fracture population (number offractures per 5 m interval) determined from inspection of televiewerimages and frequency of permeable fracture subset only obtainedfrom flowmeter/pumping tests in a well 6R (Covey Hill sandstone)and b well 3R (Cairnside sandstone)
Fig. 12 Televiewer images of same fracture plane (arrows)appearing in two wells located 4.5 km apart. Depth offset betweenwells of 20 m was determined from curve matching of naturalgamma logs
Fig. 9 Transmissivity values for well 3R determined from packertests with 3.75-m straddle interval (grey) and computed from theflowmeter/pumping method (black)
383
Hydrogeology Journal (2008) 16: 373–388 DOI 10.1007/s10040-007-0267-9
Tab
le2
Chemical
data
from
selected
domestic
andmon
itoring
wells(datasource
Blanchette
2006
)
Well
code
Rock
form
ation
Well
depth
Open
borehole
Flow
condition
Position
onthe
flow
path
EC-
Electrical
cond
uctiv
ity
TDS-
Total
dissolved
solid
s
Hardness
Alkalinity
Ca
Mg
Na
KCl
SO4
HCO3
FFe
Mn
H2S
NO3
Sr
Br
(m)
(m)
(μS/cm)
(mg/L)
(mgCaC
O3/L)
(mg/L)
(ug/L)
CH-049
Cov
eyHill
25.9
11.5
SC
U311
240
128
130
28.6
13.8
11.6
1.0
1116
.915
2.5
39.3
14.2
6.4
1.1
0.1
433.4
3.4
CH-062
36.6
34.4
WT
U1,38
931
068
193
268.0
2.8
2.2
13.7
2.4
630.1
109.1
194.9
115.6
87.2
7.6
1.6
3476
3.3
R7
91.4
85.3
WT
U61
378
189
4.7
1.5
1.2
2.0
1.6
9.8
10.6
175.7
9.0
5.0
15.4
3.7
27.6
3.5
CH-115
123.4
93.3
SC
U60
735
524
6110
84.8
8.2
7.7
3.3
1217
6.6
131.7
154.6
11.6
15.6
8.6
0.0
1,657
30CH-122
––
SC
U25
017
8113
110
29.9
9.3
2.5
0.6
0.6
12.4
131.7
39.3
1.9
0.3
3.2
1.1
125.6
2.3
CH-123
25.9
19.5
WT
U96
503
3229
7.9
3.1
1.4
1.7
2.2
6.7
35.1
19.2
3591
71.3
14.7
0.0
42.4
2.5
R6
91.4
85.0
WT
U13
929
047
2013
.92.9
4.0
2.5
1817
.024
.319
5.4
374.9
34.3
14.7
0.0
215.2
4.0
CH-011
39.6
34.4
WT
I18
549
946
2613
.13.1
15.0
1.0
3010
.431
.6115.8
9.2
1.6
13.5
0.7
89.6
4.7
CH-050
30.5
26.3
WT
I23
931
389
7125
.36.3
11.9
1.2
2314
.685
.978
.216
.80.8
11.8
3.9
146.4
3.2
CH-101
38.7
32.7
WT
I34
534
214
086
44.5
6.9
4.6
2.4
466
.410
3.3
116.5
52.0
51.9
4.9
0.1
540.8
16.0
CH-109
51.8
43.8
SC
I1,06
236
640
722
012
2.4
24.6
34.8
7.7
7817
3.8
260.1
38.9
713.9
19.9
6.3
0.0
2,731
76.0
CH-134
24.1
16.6
WT
I89
71,148
281
210
76.8
21.8
60.9
4.8
130
34.5
250.0
233.0
109.5
48.9
6.6
0.0
912.6
11.0
R5
91.4
77.2
CD
1,61
637
943
017
015
1.0
12.8
138.4
19.8
100
423.4
200.3
212.4
565.2
38.7
5.1
0.0
6,680
150
CH-105
15.8
8.2
SC
D60
056
724
216
077
.312
.07.9
3.2
2792
.119
0.6
117.1
557.9
48.4
4.9
0.5
1,556
13.0
CH-108
53.3
31.8
CD
1,06
576
115
419
034
.116
.714
9.5
13.3
160
79.9
226.9
151.5
165.9
13.5
3.4
0.0
927.3
200
CH-131
16.5
7.4
CD
1,117
348
442
330
115.6
37.3
35.8
9.1
7513
2.6
389.9
154.5
1604
52.7
9.0
0.0
3,666
40CH-049
25.9
11.5
SC
U311
628
128
130
28.6
13.8
11.6
1.0
1116
.915
2.5
94.8
14.2
6.4
1.1
0.1
433.4
3.4
CH-121
Carnside
16.5
13.8
SC
I34
645
213
913
040
.88.9
7.4
0.8
1235
.415
6.6
57.6
58.8
21.7
9.1
0.0
83.7
5.8
CH-006
13.7
3.2
SC
I40
558
218
417
051
.213
.76.5
2.4
531
.820
3.1
407.1
293.4
53.0
6.1
0.2
542.2
4.9
R4
30.5
24.1
WT
I47
153
921
521
068
.210
.96.5
4.8
1615
.225
1.4
308.0
825.9
132.9
11.6
0.0
413.8
6.2
CH-046
30.5
1.0
SC
I49
322
720
320
045
.721
.518
.04.7
8.8
42.9
236.2
136.6
410.0
46.9
2.1
0.0
433.3
12CH-052
38.1
10.8
WT
I24
61,267
116
9232
.28.7
4.0
0.9
8.6
10.8
111.0
97.7
0.4
0.0
9.6
7.1
117.3
5.7
CH-080
22.9
18.2
SC
I61
731
287
300
73.7
25.1
11.5
12.6
1041
.035
7.8
53.0
0.5
1.5
8.1
4.7
121.7
6.8
CH-087
12.2
2.0
SC
I66
741
928
621
079
.321
.514
.21.0
6253
.524
8.7
333.4
349.7
63.8
3.7
0.0
291.1
6.6
CH-088
10.7
2.0
SC
I41
418
318
815
056
.011.7
3.9
1.9
3.8
47.2
177.6
78.3
0.0
0.1
2.1
1.2
207.1
11.0
CH-099
60.0
53.5
WT
I42
454
173
130
48.0
12.9
8.4
3.5
5.6
69.6
155.7
52.1
101.8
89.5
5.2
0.0
817.4
12.0
CH-104
30.5
23.6
WT
I46
010
520
718
054
.217
.43.3
1.8
1030
.721
5.4
90.1
1.0
0.3
5.8
19.9
200.3
4.4
CH-132
22.9
21.2
WT
I55
417
118
216
061
.46.9
34.0
1.3
635.6
191.2
78.8
3459
354.2
10.9
0.0
77.0
13R3
73.2
40.3
CD
1,98
184
176
240
39.9
18.5
386.6
7.5
330
309.2
283.6
112.6
255.6
13.2
2.1
0.0
1,687
430
CH-034
57.6
41.2
CD
573
229
189
240
38.0
22.7
42.9
4.2
3119
.128
5.9
157.6
162.8
41.4
3.3
0.2
688.8
32CH-035
29.0
3.1
SC
D77
576
937
615
013
7.2
8.2
15.4
3.3
1.7
259.2
176.6
191.9
383.2
82.1
4.4
0.2
2,062
13CH-072
16.8
1.5
CD
1,01
859
237
630
089
.836
.847
.84.6
95111.9
354.2
96.2
2295
206.2
6.5
0.0
903.3
11CH-073
30.5
14.0
SC
D48
499
619
122
041
.021
.425
.93.6
1543
.126
1.7
485.4
288.7
119.8
3.3
0.0
563.4
14CH-079
15.8
15.9
SC
D78
043
135
628
085
.234
.816
.83.8
5571
.833
0.7
214.8
744.8
61.1
4.9
0.0
304.3
12CH-081
14.3
10.5
SC
D56
855
827
026
066
.825
.04.9
1.2
6.7
45.4
307.1
447.7
347.1
71.7
3.0
0.0
280.4
4.5
CH-096
56.4
47.9
WT
D1,07
885
218
917
043
.019
.812
9.4
16.2
150
131.1
202.8
264.8
286.9
17.7
4.0
0.0
1,262
280
CH-128
61.0
28.0
CD
974
240
217
280
44.7
25.6
109.5
5.6
8177
.433
3.0
39.3
361.4
45.5
3.7
0.0
1,012
110
min
10.7
1.0
––
61.0
30.5
17.9
8.6
4.7
1.5
1.2
0.6
0.6
5.6
10.6
19.2
0.0
0.0
1.1
0.0
27.6
2.3
Avg
.40
.028
.1–
–64
7.4
448.5
222.6
167.7
63.7
15.4
38.5
4.8
45.7
93.0
199.3
161.0
515
53.3
6.7
1.3
980.6
43.3
max
123.4
93.3
––
1,98
11,267
681
330
268
37.3
387
19.8
330
630
390
485.4
3591
354
15.4
19.9
6,681
430.0
WTwater
table;
SCsemi-confi
ned;
Cconfi
ned;
Uup
stream
;Iinterm
ediate;D
downstream
384
Hydrogeology Journal (2008) 16: 373–388 DOI 10.1007/s10040-007-0267-9
Curve matching of natural gamma logs obtained inwells 5R and 6R (not shown here) indicates a relativelylow elevation offset of approximately 20 m between thesetwo wells located about 4.5 km apart, with well 5R beingdownslope of 6R. Consequently, a distinctive feature orzone identified at a certain elevation in 6R reappears in 5Rat an elevation that is 20 m shallower. This is an importantobservation because the predominant transmissive zoneidentified in 6R (at 53 m depth) displays this same 20-melevation offset as it aligns itself with the major permeablezone seen in 5R (at 33 m depth). In other words, the onemajor zone that controls permeability in 6R seems to bethe same one that controls permeability 4.5 km away inwell 5R. Televiewer images of this dominant hydrologicfeature are presented in Fig. 12 as it appears in both wells.Packer tests indicate that the fracture in well 6R has atransmissivity of 10−5 m2/s and an even higher transmis-sivity of 10−3 m2/s in well 5R.
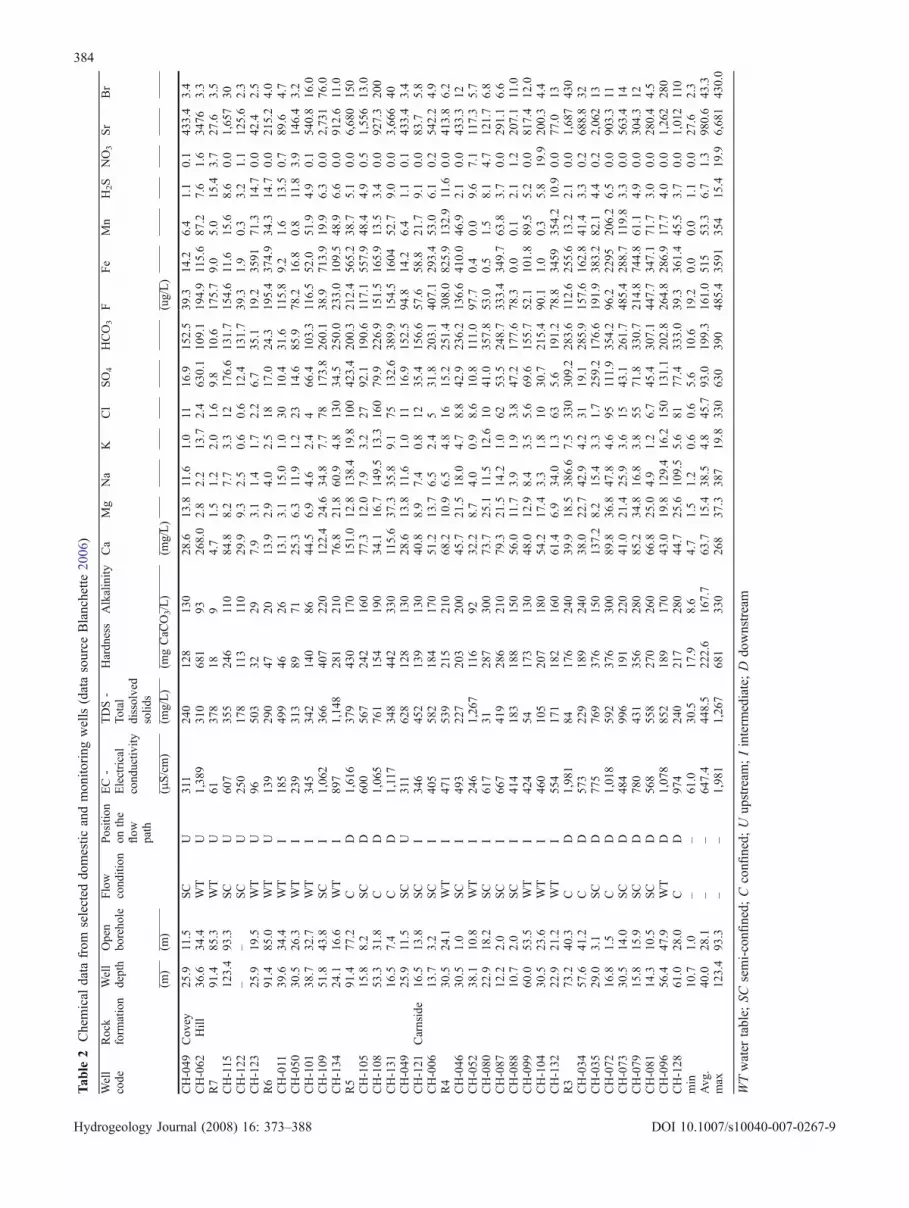
Groundwater chemistryTo define the natural quality of the groundwater, watersamples have been collected from 32 domestic wells andfrom the five monitoring bedrock wells. Seventeen wellsderive their water from the Covey Hill formation and theother 20 from the Cairnside formation. Collected sampleswere analysed in situ for pH, temperature, Redox potentialand electrical conductivity, and in laboratory for major,minor and trace inorganic elements. Table 2 presents asynthesis of select analytical results and descriptivestatistics. Characteristics of the sampled wells, respectiveflow conditions (water table, semi-confined, confined),and position of the wells on the general flow pathdirection: (upstream-recharge area, intermediate, anddownstream-discharge area) are also presented.
No marked difference exists in groundwater chemicalcomposition in both sandstone formations. The majorelements: Ca2+, Mg2+, Na+, K+, Cl−, SO2�
4 and HCO�3 ,
have highest concentrations: 630 mg/L for SO2�4 , more
than 300 mg/L Na+, Cl−, and HCO�3 , and 268 mg/L for
Ca2+. The low TDS range of 30–1,267 mg/L is character-istic for relatively fresh groundwater indicating bothsandstone formations have low chemical reactivity limit-ing the interactions with groundwater. The electricalconductivity reflects closely the variation in TDS contentwith high correlation coefficient of r=0.96. The majorelements account for more than 90% of the total dissolvedsolids (TDS). Few minor elements: F−, Fe2+, Mn2+, andSr2+ show concentrations close to 1 mg/L. Usuallyconsidered as trace element, Br− shows occasionallyrelatively high concentration. Marked correlations areobserved between Ca2+ and SO2�
4 and between Mg2+
and SO2�4 concentrations with r=0.84 and r=0.92
respectively. Groundwater derive calcium and magnesiummost probably from leaching of carbonate minerals:dolomite (Mg2+, HCO�
3 ) and gypsum (Ca2+, SO2�4 )
commonly present in the unconsolidated sediments,particularly glacial till, and occasionally in thin layerswithin the upper sandstone formations (Globensky 1987;
Tremblay and Lamothe 2005). The noticeable increase inTDS, electrical conductivity and Na–Cl concentrations inwells sited at the end of the flow path (indicated asdownstream wells) may be explained from both dissolu-tion of halite (NaCl) also present in unconsolidatedsediments and in bedrock (Globensky 1987; Tremblayand Lamothe 2005), and/or because of mixing with oldermore mineralized Champlain Sea waters left in place some9,500 years ago (Blanchette 2006). Major problem withpotable water, however, is of aesthetic nature and comesfrom increased Fe and Mn chemical content. Iron andmanganese, ubiquitous in groundwater over the studyarea, are found in minerals contained in cementingmaterials and show a significant correlation of r=0.72.
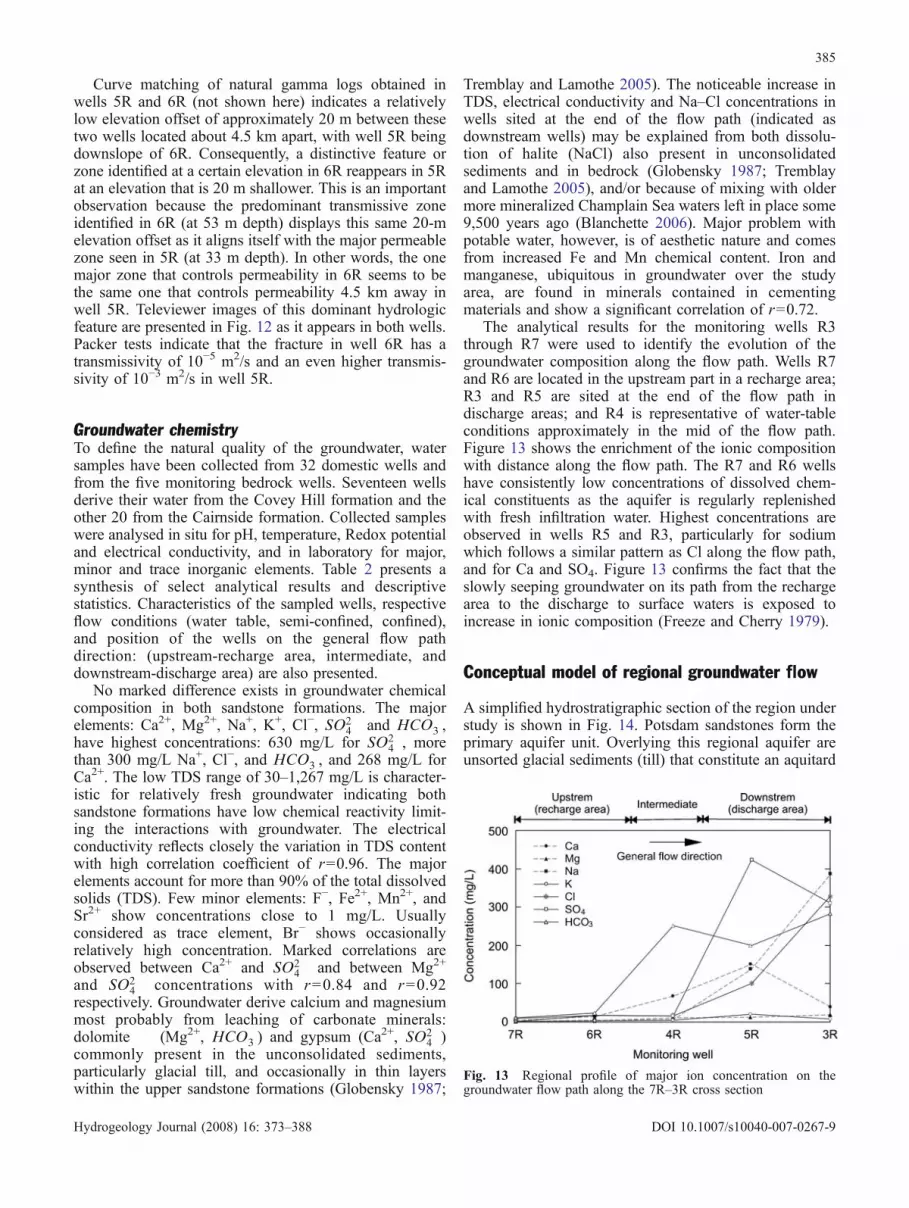
The analytical results for the monitoring wells R3through R7 were used to identify the evolution of thegroundwater composition along the flow path. Wells R7and R6 are located in the upstream part in a recharge area;R3 and R5 are sited at the end of the flow path indischarge areas; and R4 is representative of water-tableconditions approximately in the mid of the flow path.Figure 13 shows the enrichment of the ionic compositionwith distance along the flow path. The R7 and R6 wellshave consistently low concentrations of dissolved chem-ical constituents as the aquifer is regularly replenishedwith fresh infiltration water. Highest concentrations areobserved in wells R5 and R3, particularly for sodiumwhich follows a similar pattern as Cl along the flow path,and for Ca and SO4. Figure 13 confirms the fact that theslowly seeping groundwater on its path from the rechargearea to the discharge to surface waters is exposed toincrease in ionic composition (Freeze and Cherry 1979).
Conceptual model of regional groundwater flow
A simplified hydrostratigraphic section of the region understudy is shown in Fig. 14. Potsdam sandstones form theprimary aquifer unit. Overlying this regional aquifer areunsorted glacial sediments (till) that constitute an aquitard
Fig. 13 Regional profile of major ion concentration on thegroundwater flow path along the 7R–3R cross section
385
Hydrogeology Journal (2008) 16: 373–388 DOI 10.1007/s10040-007-0267-9
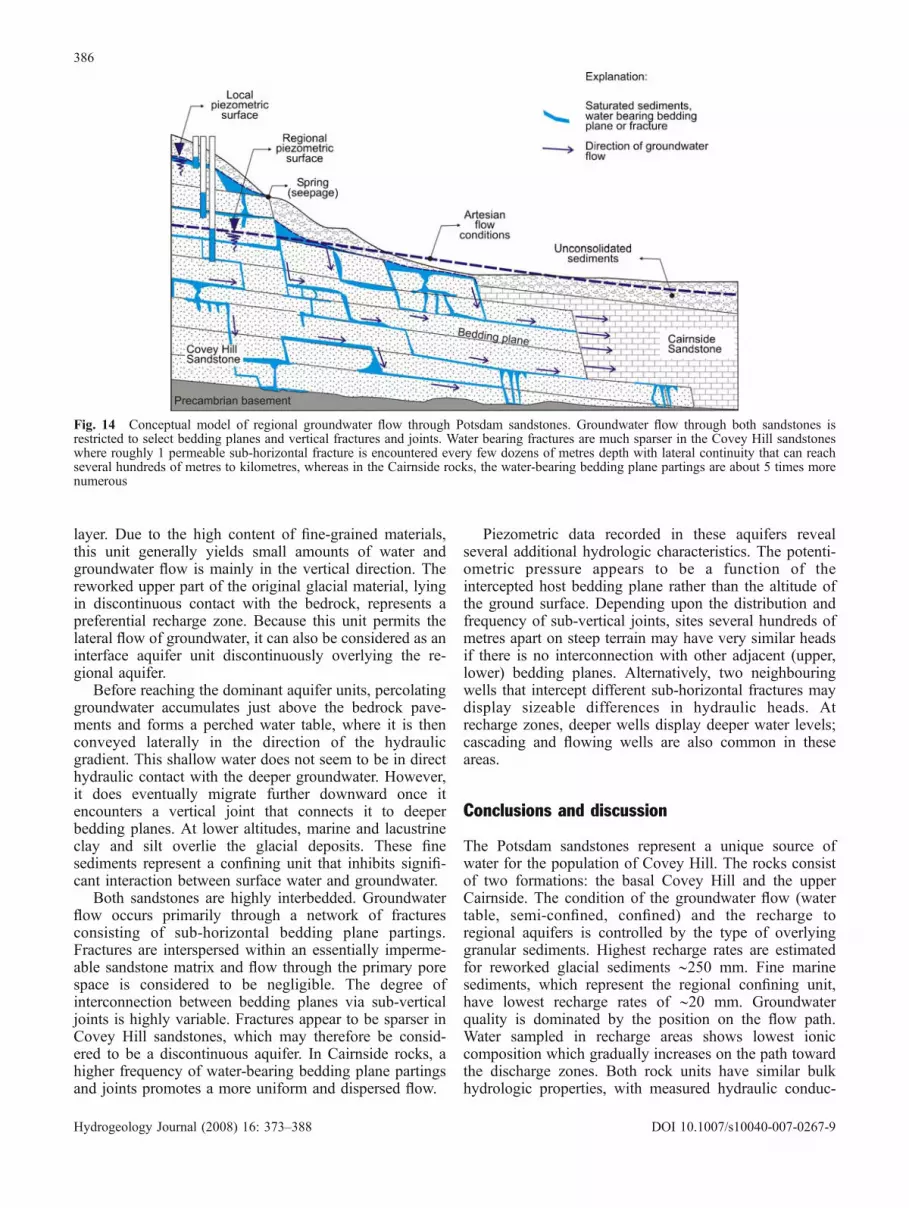
layer. Due to the high content of fine-grained materials,this unit generally yields small amounts of water andgroundwater flow is mainly in the vertical direction. Thereworked upper part of the original glacial material, lyingin discontinuous contact with the bedrock, represents apreferential recharge zone. Because this unit permits thelateral flow of groundwater, it can also be considered as aninterface aquifer unit discontinuously overlying the re-gional aquifer.
Before reaching the dominant aquifer units, percolatinggroundwater accumulates just above the bedrock pave-ments and forms a perched water table, where it is thenconveyed laterally in the direction of the hydraulicgradient. This shallow water does not seem to be in directhydraulic contact with the deeper groundwater. However,it does eventually migrate further downward once itencounters a vertical joint that connects it to deeperbedding planes. At lower altitudes, marine and lacustrineclay and silt overlie the glacial deposits. These finesediments represent a confining unit that inhibits signifi-cant interaction between surface water and groundwater.
Both sandstones are highly interbedded. Groundwaterflow occurs primarily through a network of fracturesconsisting of sub-horizontal bedding plane partings.Fractures are interspersed within an essentially imperme-able sandstone matrix and flow through the primary porespace is considered to be negligible. The degree ofinterconnection between bedding planes via sub-verticaljoints is highly variable. Fractures appear to be sparser inCovey Hill sandstones, which may therefore be consid-ered to be a discontinuous aquifer. In Cairnside rocks, ahigher frequency of water-bearing bedding plane partingsand joints promotes a more uniform and dispersed flow.
Piezometric data recorded in these aquifers revealseveral additional hydrologic characteristics. The potenti-ometric pressure appears to be a function of theintercepted host bedding plane rather than the altitude ofthe ground surface. Depending upon the distribution andfrequency of sub-vertical joints, sites several hundreds ofmetres apart on steep terrain may have very similar headsif there is no interconnection with other adjacent (upper,lower) bedding planes. Alternatively, two neighbouringwells that intercept different sub-horizontal fractures maydisplay sizeable differences in hydraulic heads. Atrecharge zones, deeper wells display deeper water levels;cascading and flowing wells are also common in theseareas.
Conclusions and discussion
The Potsdam sandstones represent a unique source ofwater for the population of Covey Hill. The rocks consistof two formations: the basal Covey Hill and the upperCairnside. The condition of the groundwater flow (watertable, semi-confined, confined) and the recharge toregional aquifers is controlled by the type of overlyinggranular sediments. Highest recharge rates are estimatedfor reworked glacial sediments ∼250 mm. Fine marinesediments, which represent the regional confining unit,have lowest recharge rates of ∼20 mm. Groundwaterquality is dominated by the position on the flow path.Water sampled in recharge areas shows lowest ioniccomposition which gradually increases on the path towardthe discharge zones. Both rock units have similar bulkhydrologic properties, with measured hydraulic conduc-
Fig. 14 Conceptual model of regional groundwater flow through Potsdam sandstones. Groundwater flow through both sandstones isrestricted to select bedding planes and vertical fractures and joints. Water bearing fractures are much sparser in the Covey Hill sandstoneswhere roughly 1 permeable sub-horizontal fracture is encountered every few dozens of metres depth with lateral continuity that can reachseveral hundreds of metres to kilometres, whereas in the Cairnside rocks, the water-bearing bedding plane partings are about 5 times morenumerous
386
Hydrogeology Journal (2008) 16: 373–388 DOI 10.1007/s10040-007-0267-9

tivities ranging from 2×10⁻⁵ to 4×10⁻⁵ m/s. However,their individual fracture patterns significantly influence thespatial distribution of groundwater flow. These sandstonesare characterized by an orthogonal fracture networkconsisting of sub-horizontal bedding planes combinedwith a series of sub-vertical joints that are enclosed in anessentially impermeable sandstone matrix. For both for-mations, distinct permeable zones display significanttransmissivities that are orders of magnitude greater thanthat of the competent, unfractured rock. In Covey Hillfractures are relatively sparse, with only about onepermeable sub-horizontal fracture encountered every fewdozens of metres depth. Field tests demonstrate that sub-horizontal bedding plane partings in this unit can belaterally continuous for several hundreds of metres tokilometres. Water-bearing bedding plane partings areabout 5 times more numerous in Cairnside and, conse-quently, groundwater flow through these rocks is consid-erably more dispersed; the more numerous permeablezones are scattered throughout the formation. The proba-bility of intersecting vertical fractures with verticallydrilled wells is low, and high-angle fractures were rarelyobserved in the televiewer logs. Nevertheless, based uponthe visual investigation of quarry walls, vertical fractureswere quite common. However, the probability of inter-secting vertical fractures with vertically drilled wells islow. Consequently, high-angle fractures were rarelyobserved in the televiewer logs and those that wererecognized did not appear to be associated with permeablebedding planes. This type of fracture distribution enhancesaquifer anisotropy (horizontal to vertical) produced bylayered sedimentary rocks and promotes dominant flowpaths that are aligned with dip of bedding.
These findings potentially have important implicationsfor developing wellhead protection strategies for theregion. Different flow regimes are associated with thetwo different formations and, consequently, the localgeology imposes structural controls on the local hydrol-ogy. The flow regime defined by Covey Hill sandstones iscontrolled by only a few distinct fractures or beddingplanes. These are sub-horizontal, separated vertically bythick, massive units, and are laterally continuous. Hy-draulic communication in these rocks appears to be verygood horizontally but very poor vertically, and each ofthese water-bearing bedding planes may be considered asa separate, two-dimensional aquifer unit. This implies thatgroundwater users hundreds of metres to kilometres apartwho exploit the same permeable zone may be vulnerableto each other’s production activities. The second flowregime occurs in Cairnside sandstones, where permeablefractures/bedding planes are again sub-horizontal, but alsomore frequent and vertically more interconnected. Planar,sub-horizontal flow is still dominant but horizontal-vertical anisotropy is less substantial. As a result,groundwater flow is more dispersed three dimensionally.
Acknowledgements This work was supported in part by Geolog-ical Survey of Canada, US Geological Survey and Quebec Ministryof Sustainable Development, Environment and Parks. Dr. Claudio
Paniconi from the Institut National de la Recherche Scientifique-Quebec is thanked for his constructive comments and review of thefirst draft of this manuscript.
References
Benoît N, Pasquier P, Marcotte D, Nastev M (2005) Conditionalstochastic inverse modelling of the Châteauguay river aquifers.ModelCare 2005, The Hague, Netherlands, 6 pp, CD version
Blanchette D (2006) Caractérisation géochimique des eaux souter-raines de la région du bassin versant de la rivière Châteauguay,Québec, Canada [Groundwater chemistry in the ChateauguayRiver watershed, Quebec, Canada]. MSc Thesis, InstitutNational de la Recherché Scientifique INRS-ETE, Quebec,71 pp
Bradbury KR, Rothschild ER (1985) A computerized technique forestimating the hydraulic conductivity of aquifers from specificcapacity test data. Ground Water 23:240-246
Clark TH (1966) Chateauguay area. Geological report 122, QuebecDepartment of Natural Resources, 63 pp
Croteau A (2006) Détermination de la distribution spatiale ettemporelle de la recharge à l’aquifère régional transfrontalierdu Bassin Versant de la Rivière Châteauguay, Québec et Etats-Unis [Estimation of spatial and temporal recharge in theChateauguay River transboundary aquifers, Quebec and UnitedStates]. MSc Thesis, Institut National de la Recherché Scienti-fique INRS-ETE, Quebec, 71 pp
Croteau A, Nastev M, Lefebvre R, Lamontagne L, Lamontagne C,Lavigne MA, Blanchette D (2005) Estimation of spatial andtemporal distribution of recharge to The English River aquifersystem, Quebec. 6th Joint IAH-CNC and CGS Groundwaterspecialty conference, Saskatoon, SK, September 2005, 8 pp, CDversion
Dagenais MP, Nastev M (2005) A case study of a conflict overgroundwater-when hydrogeology is not sufficient. 6th JointIAH-CNC and CGS Groundwater specialty conference, Saska-toon, SK, September 2005, 8 pp, CD version
Environment Canada (2007) Species at risk http://www.speciesatrisk.gc.ca. Cited 24 December 2007
Freeze RA, Cherry JA (1979) Ground water. Prentice-Hall, Engle-wood Cliffs, NJ
Globensky Y (1987) Geology of the St. Lawrence Lowlands.General Direction for Geologic and Mineral Exploitation,Report MM 85-02, Quebec Ministry of Energy and Resources,Quebec, 63 pp
Godin R, Rouleau A (2005) Essais permeametriques en foragesdans le socle rocheux du bassin versant de la RiviereChateauguay [Constant head injection tests in bedrock wells inthe Chateauguay River watershed]. Report prepared for theMinistère de l’Environnement du Quebec, Quebec
Lavoie D (2005) Geological, stratigraphical and structural settingsof the Chateauguay area, St. Lawrence platform of southernQuebec. http://www.ess.nrcan.gc.ca/2002_2006/gwp/p3/a8/bed_e.php. Cited 24 December 2007
McCormack R (1981) Étude hydrogéologique-Bassin versant de laChâteauguay [Hydrogeological study of the Chateauguay Riverwatershed]. Inventory and Research Division, Quebec Ministryof Environment, Quebec, 175 pp
Molz FJ, Morin RH, Hess AE, Melville JG, Guven O (1989) Theimpeller meter for measuring aquifer permeability variations:evaluation and comparison with other tests. Water Resour Res25:1677–1683
Morin RH, Hess AE, Paillet FL (1988) Determining the distributionof hydraulic conductivity in a fractured limestone aquifer bysimultaneous injection and geophysical logging. Ground Water26:587–595
Nastev M, Lamontagne C, Tremblay T, Lavoie D, Hardy F,Lamothe L, Croteau A, Blanchette D, Lavigne M-A, Roy N,Paradis D, Benoît N, Lefebvre R, Marcotte D, Gaudin R,Rouleau A (2004a) Hydrogeological overview of the trans-
387
Hydrogeology Journal (2008) 16: 373–388 DOI 10.1007/s10040-007-0267-9

boundary aquifers in the Châteauguay River Basin, Canada-United States. 5th joint IAH-CNC and CGS groundwaterspecialty conference, Quebec, October 2004, 7 pp, CD version
Paillet FL (1998) Flow modeling and permeability estimation usingborehole flow logs in heterogeneous fractured formations. WaterResourc Res 34(5):997–1010
Salad Hersi O, Lavoie D, Mohamed AH, Nowlan GS (2002)Subaerial unconformity at the Potsdam-Beekmantown contactin the Quebec Reentrant: regional significance for the Lau-rentian continental margin history. Bull Can Pet Geol 50:419–440
Schroeder PR, Aziz NM, Lloyd CM, Zappi PA (1994) TheHydrologic Evaluation of Landfill Performance (HELP) Model:Engineering Documentation for Version 3.07, EPA/600/R-94/168b, USEPA, Washington, DC, 116 pp
Tremblay T, Lamothe M (2005) Géologie des formations super-ficielles du bassin-versant de la rivière Châteauguay [Geologyof Quaternary sediments in the Chateauguay River watershed].Une contribution de l’UQÀM au Projet Châteauguay, rapportfinal, 34 pp. http://www.ess.nrcan.gc.ca/2002_2006/gwp/p3/a8/quat_e.php. Cited 24 December 2007
Wiesnet DR, Clark TH (1966) The bedrock structure of Covey Hilland vicinity, northern New York and southern Quebec. US GeolSurv Profl Pap 550-D, pp D35–D38
Young SC, Pearson HS (1995) The electromagnetic boreholeflowmeter: description and application. Ground Water MonitRemediat 15(4):138–147
Zemanek J, Glenn EE, Norton LJ, Caldwell RL (1970) Formationevaluation by inspection with the borehole televiewer. Geo-physics 35:254–269
388
Hydrogeology Journal (2008) 16: 373–388 DOI 10.1007/s10040-007-0267-9


