Embed Size (px)
Citation preview

Dear Author,
Here are the proofs of your article.
• You can submit your corrections online, via e-mail or by fax.• For online submission please insert your corrections in the online correction form. Always
indicate the line number to which the correction refers.• You can also insert your corrections in the proof PDF and email the annotated PDF.• For fax submission, please ensure that your corrections are clearly legible. Use a fine black
pen and write the correction in the margin, not too close to the edge of the page.• Remember to note the journal title, article number, and your name when sending your
response via e-mail or fax.• Check the metadata sheet to make sure that the header information, especially author names
and the corresponding affiliations are correctly shown.• Check the questions that may have arisen during copy editing and insert your answers/
corrections.• Check that the text is complete and that all figures, tables and their legends are included. Also
check the accuracy of special characters, equations, and electronic supplementary material ifapplicable. If necessary refer to the Edited manuscript.
• The publication of inaccurate data such as dosages and units can have serious consequences.Please take particular care that all such details are correct.
• Please do not make changes that involve only matters of style. We have generally introducedforms that follow the journal’s style.Substantial changes in content, e.g., new results, corrected values, title and authorship are notallowed without the approval of the responsible editor. In such a case, please contact theEditorial Office and return his/her consent together with the proof.
• If we do not receive your corrections within 48 hours, we will send you a reminder.• Your article will be published Online First approximately one week after receipt of your
corrected proofs. This is the official first publication citable with the DOI. Further changesare, therefore, not possible.
• The printed version will follow in a forthcoming issue.
Please noteAfter online publication, subscribers (personal/institutional) to this journal will have access to thecomplete article via the DOI using the URL: http://dx.doi.org/[DOI].If you would like to know when your article has been published online, take advantage of our freealert service. For registration and further information go to: http://www.springerlink.com.Due to the electronic nature of the procedure, the manuscript and the original figures will only bereturned to you on special request. When you return your corrections, please inform us if you wouldlike to have these documents returned.
Metadata of the article that will be visualized in OnlineFirst
ArticleTitle Towards a better understanding of the Oulmes hydrogeological system (Mid-Atlas, Morocco)Article Sub-Title
Article CopyRight Springer-Verlag(This will be the copyright line in the final PDF)
Journal Name Environmental Earth Sciences
Corresponding Author Family Name WildemeerschParticle
Given Name SamuelSuffix
Division Hydrogeology and Environmental Geology, GEO3, ArGEnCo
Organization University of Liege
Address Building B52/3 Sart-Tilman, Liege, 4000, Belgium
Email [email protected]
Author Family Name OrbanParticle
Given Name PhilippeSuffix
Division Hydrogeology and Environmental Geology, GEO3, ArGEnCo
Organization University of Liege
Address Building B52/3 Sart-Tilman, Liege, 4000, Belgium
Division Aquapôle
Organization University of Liege
Address Liege, Belgium
Author Family Name RuthyParticle
Given Name IngridSuffix
Division Hydrogeology and Environmental Geology, GEO3, ArGEnCo
Organization University of Liege
Address Building B52/3 Sart-Tilman, Liege, 4000, Belgium
Author Family Name GrièreParticle
Given Name OlivierSuffix
Division
Organization G2H Conseils
Address 29 Rue Blanche Hottinguer, Guermantes, 77600, France
Author Family Name OliveParticle
Given Name PhilippeSuffix
Division
Organization
Address 1C Avenue du Léman, Thonon-Les-Bains, 74200, France
Author Family Name El YoubiParticle
Given Name AbdelkhalekSuffix
Division
Organization Parc Industriel de Bouskoura, Eaux Minérales d’Oulmès
Address Casablanca, Morocco
Author Family Name DassarguesParticle
Given Name AlainSuffix
Division Hydrogeology and Environmental Geology, GEO3, ArGEnCo
Organization University of Liege
Address Building B52/3 Sart-Tilman, Liege, 4000, Belgium
Schedule
Received 13 December 2008
Revised
Accepted 25 September 2009
Abstract Located in the Mid-Atlas (Morocco), the Oulmes plateau is famous for its mineral water springs “Sidi Ali”and “Lalla Haya” commercialised by the company “Les Eaux minérales d’Oulmès S.A”. Additionally,groundwater of the Oulmes plateau is intensively exploited for irrigation. The objective of this study,essentially performed from data collected during isotopic (summer 2004) and piezometric andhydrogeochemical field campaigns (spring 2007), is to improve the understanding of the Oulmeshydrogeological system. Analyses and interpretation of these data lead to the statement that this system isconstituted by a main deep aquifer of large extension and by minor aquifers in a perched position. However,these aquifers interact enough to be in total equilibrium during the cold and wet period. As highlighted byisotopes, the origin of groundwater is mainly infiltration water except a small part of old groundwater withdissolved gas rising up from the granite through the schists.
Keywords (separated by '-') Hydrogeological characterisation - Hydrogeochemistry - Isotopes - Morocco
Footnote Information

Author Query Form
Please ensure you fill out your response to the queries raised below
and return this form along with your corrections
Dear Author
During the process of typesetting your article, the following queries have arisen. Please
check your typeset proof carefully against the queries listed below and mark the
necessary changes either directly on the proof/online grid or in the ‘Author’s response’
area provided below
Query Details required Author’s response
1. Please check and confirm the author
names and initials are correct. Also
please check and confirm the affiliation
details are identified correctly.
2. Please check all the references are
correctly identified.
3. References Winckel 2002 is cited in
text but not provided in the reference
list. Please provide reference in the list
or delete these citations.
4 Please check the equations are correct.
It has symbol( ) mismatch instead of
δ.
Journal: 12665
Article: 312
UNCORRECTEDPROOF
ORIGINAL ARTICLE1
2 Towards a better understanding of the Oulmes hydrogeological
3 system (Mid-Atlas, Morocco)
4 Samuel Wildemeersch • Philippe Orban •
5 Ingrid Ruthy • Olivier Griere • Philippe Olive •
6 Abdelkhalek El Youbi • Alain Dassargues
7 Received: 13 December 2008 / Accepted: 25 September 20098 � Springer-Verlag 2009
9 Abstract Located in the Mid-Atlas (Morocco), the Oul-
10 mes plateau is famous for its mineral water springs ‘‘Sidi
11 Ali’’ and ‘‘Lalla Haya’’ commercialised by the company
12 ‘‘Les Eaux minerales d’Oulmes S.A’’. Additionally,
13 groundwater of the Oulmes plateau is intensively exploited
14 for irrigation. The objective of this study, essentially per-
15 formed from data collected during isotopic (summer 2004)
16 and piezometric and hydrogeochemical field campaigns
17 (spring 2007), is to improve the understanding of the
18 Oulmes hydrogeological system. Analyses and interpreta-
19 tion of these data lead to the statement that this system is
20 constituted by a main deep aquifer of large extension and
21 by minor aquifers in a perched position. However, these
22 aquifers interact enough to be in total equilibrium during
23 the cold and wet period. As highlighted by isotopes, the
24 origin of groundwater is mainly infiltration water except a
25 small part of old groundwater with dissolved gas rising up
26 from the granite through the schists.
27Keywords Hydrogeological characterisation �
28Hydrogeochemistry � Isotopes � Morocco
29Introduction
30All over the world, water resources are under serious
31pressure and their efficient management and protection
32constitute a key issue for the future. This is especially the
33case in country with semi-arid zones where such resources
34are strongly exploited for irrigation. The first step in order
35to manage and protect groundwater resources consists in
36understanding precisely the local hydrogeological system.
37It can be particularly uneasy to reach this objective in
38fractured hard rock geological formations.
39The Oulmes plateau, located in the Mid-Atlas (Mor-
40occo), with its famous ‘‘Sidi Ali’’ and ‘‘Lalla Haya’’ min-
41eral water springs, is a particularly challenging case study.
42The main objective of this work is to improve the under-
43standing of the hydrodynamic and hydrogeochemical pro-
44cesses occurring in a very complex geological and
45hydrogeological system located in a contrasting climate
46zone with increasing man-induced pressures. These pres-
47sures, including groundwater extraction for commerciali-
48sation and irrigation as well as use of fertilizers for
49farming, are suspected of modifying the hydrogeological
50system in terms of quantity and quality, which justifies the
51necessity of such a scientific study.
52Previous private and unpublished hydrogeological
53studies, including local piezometric surveys and hydrog-
54eochemical studies, lead to a conceptual and general
55statement that the groundwater pumped in wells owned by
56the company comes from a mixing of shallow groundwater
57(with the resulting possible contamination), intermediate
58groundwater fairly mineralised and deep mineralised
A1 S. Wildemeersch (&) � P. Orban � I. Ruthy � A. DassarguesA2 Hydrogeology and Environmental Geology, GEO3, ArGEnCo,
A3 University of Liege, Building B52/3 Sart-Tilman,
A4 4000 Liege, Belgium
A5 e-mail: [email protected]
A6 O. Griere
A7 G2H Conseils, 29 Rue Blanche Hottinguer,
A8 77600 Guermantes, France
A9 P. Olive
A10 1C Avenue du Leman, 74200 Thonon-Les-Bains, France
A11 A. El Youbi
A12 Parc Industriel de Bouskoura, Eaux Minerales d’Oulmes,
A13 Casablanca, Morocco
A14 P. Orban
A15 Aquapole, University of Liege, Liege, Belgium
123Journal : Large 12665 Dispatch : 5-10-2009 Pages : 17
Article No. : 312h LE h TYPESET
MS Code : ENGE-D-08-00110 h CP h DISK4 4
Environ Earth Sci
DOI 10.1007/s12665-009-0312-1
Au
tho
r P
ro
of
UNCORRECTEDPROOF
59 groundwater with dissolved gas in variable proportions
60 linked to the granitic intrusion. However, these previous
61 studies lacked data and could not be considered as
62 exhaustive enough to produce results with a high degree of
63 certainty. The present study, focused mainly on the ‘‘Sidi
64 Ali’’ spring, is based on a larger set of data collected during
65 field campaigns carried out during summer 2004 and spring
66 2007. Among others, these campaigns produced measured
67 groundwater levels and groundwater samples from many
68 springs and wells. Temperature and precipitations data
69 ranging from October 1985 and September 2006 were also
70 collected in the ‘‘Baa’’ farm located at immediate prox-
71 imity of the ‘‘Sidi Ali’’ spring. Thanks to this large set of
72 data, a comprehensive hydrogeological study including
73 hydrodynamic, hydrogeochemical, and isotopic parts was
74 undertaken providing the results described here below.
75 Study zone
76 The Oulmes plateau (Mid-Atlas, Morocco), located
77 150 km southeast of Rabat, is entirely included in the
78Moroccan central plateau (Termier 1936; Beaudet 1969;
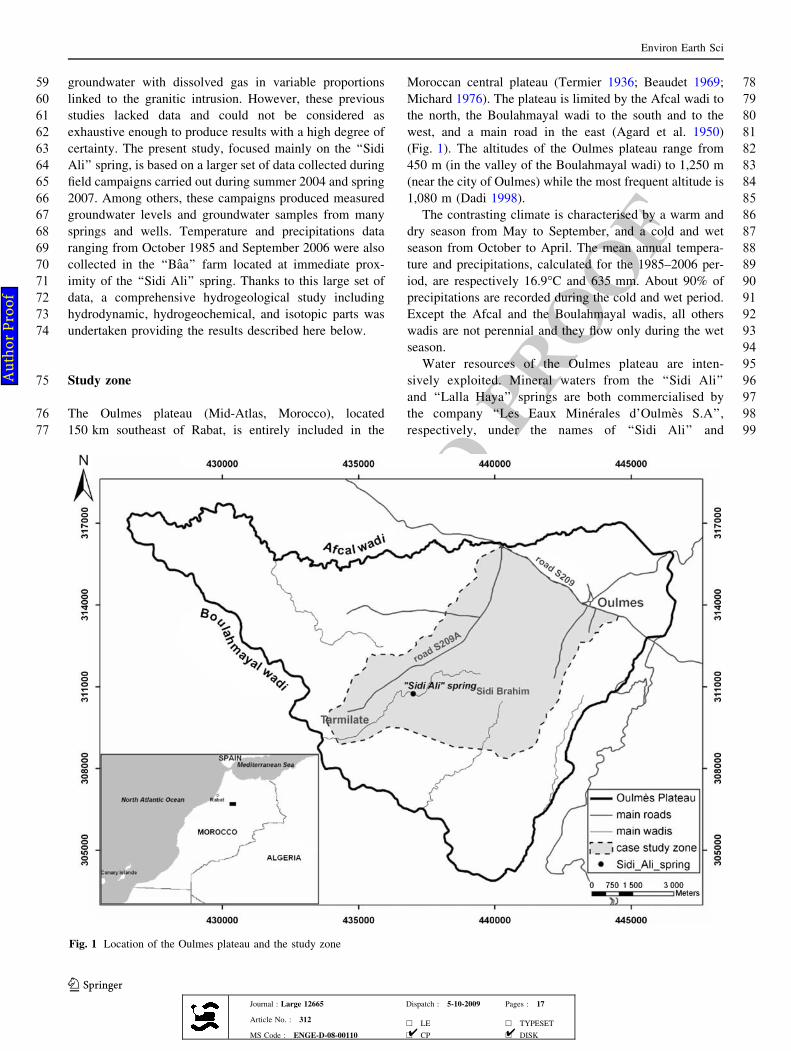
79Michard 1976). The plateau is limited by the Afcal wadi to
80the north, the Boulahmayal wadi to the south and to the
81west, and a main road in the east (Agard et al. 1950)
82(Fig. 1). The altitudes of the Oulmes plateau range from
83450 m (in the valley of the Boulahmayal wadi) to 1,250 m
84(near the city of Oulmes) while the most frequent altitude is
851,080 m (Dadi 1998).
86The contrasting climate is characterised by a warm and
87dry season from May to September, and a cold and wet
88season from October to April. The mean annual tempera-
89ture and precipitations, calculated for the 1985–2006 per-
90iod, are respectively 16.9�C and 635 mm. About 90% of
91precipitations are recorded during the cold and wet period.
92Except the Afcal and the Boulahmayal wadis, all others
93wadis are not perennial and they flow only during the wet
94season.
95Water resources of the Oulmes plateau are inten-
96sively exploited. Mineral waters from the ‘‘Sidi Ali’’
97and ‘‘Lalla Haya’’ springs are both commercialised by
98the company ‘‘Les Eaux Minerales d’Oulmes S.A’’,
99respectively, under the names of ‘‘Sidi Ali’’ and
Fig. 1 Location of the Oulmes plateau and the study zone
Environ Earth Sci
123Journal : Large 12665 Dispatch : 5-10-2009 Pages : 17
Article No. : 312h LE h TYPESET
MS Code : ENGE-D-08-00110 h CP h DISK4 4
Au
tho
r P
ro
of
UNCORRECTEDPROOF
100 ‘‘Oulmes’’ but groundwater is also exploited for inten-
101 sive irrigation to cultivate various fruits species in
102 modern orchards producing early fruits for Europe.
103 Additionally, private and public wells of the ‘‘Office
104 National de l’Eau Potable’’ (ONEP) located all over the
105 zone but mainly near the town of Oulmes produce
106 water supply for local inhabitants.
107 Geological and hydrogeological settings
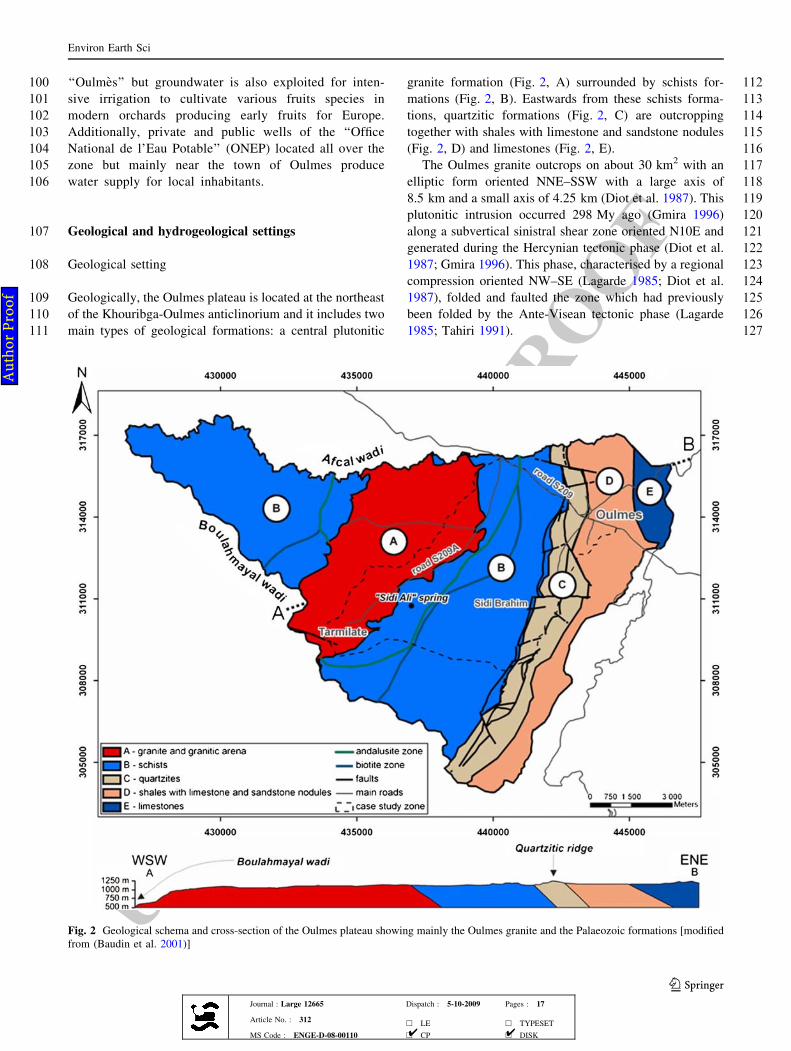
108 Geological setting
109 Geologically, the Oulmes plateau is located at the northeast
110 of the Khouribga-Oulmes anticlinorium and it includes two
111 main types of geological formations: a central plutonitic
112granite formation (Fig. 2, A) surrounded by schists for-
113mations (Fig. 2, B). Eastwards from these schists forma-
114tions, quartzitic formations (Fig. 2, C) are outcropping
115together with shales with limestone and sandstone nodules
116(Fig. 2, D) and limestones (Fig. 2, E).
117The Oulmes granite outcrops on about 30 km2 with an
118elliptic form oriented NNE–SSW with a large axis of
1198.5 km and a small axis of 4.25 km (Diot et al. 1987). This
120plutonitic intrusion occurred 298 My ago (Gmira 1996)
121along a subvertical sinistral shear zone oriented N10E and
122generated during the Hercynian tectonic phase (Diot et al.
1231987; Gmira 1996). This phase, characterised by a regional
124compression oriented NW–SE (Lagarde 1985; Diot et al.
1251987), folded and faulted the zone which had previously
126been folded by the Ante-Visean tectonic phase (Lagarde
1271985; Tahiri 1991).
Fig. 2 Geological schema and cross-section of the Oulmes plateau showing mainly the Oulmes granite and the Palaeozoic formations [modified
from (Baudin et al. 2001)]
Environ Earth Sci
123Journal : Large 12665 Dispatch : 5-10-2009 Pages : 17
Article No. : 312h LE h TYPESET
MS Code : ENGE-D-08-00110 h CP h DISK4 4
Au
tho
r P
ro
of
UNCORRECTEDPROOF
128 The Palaeozoic schists formations, predominantly Ordo-
129 vician, are the results of the metamorphism induced in the
130 formations surrounding the granitic intrusion. This metamor-
131 phism, locally hydrothermal, increases as the rocks are close to
132 the granitic intrusion (Michard 1976; Boutaleb 1988; Gmira
133 1996). Themostmetamorphised zones are the andalusite zone
134 and the biotite zone. Beyond these zones, less metamorphised
135 zones are foundwhich are the greenmica zone and the chlorite
136 zone (Boutaleb 1988; Baudin et al. 2001).
137 Eastwards, the quartzitic formations form a main topo-
138 graphical ridge of the plateau. Towards the east and beyond
139 these erosion resistant formations, Silurian and Devonian
140 shales with limestone and sandstone nodules are found. In
141 the extreme northeast of the zone, Visean limestones are
142 observed in unconformity with the former formations
143 because of the Ante-Visean tectonic phase. Consequently,
144 the Tournaisian formations are missing on the Oulmes
145 plateau. Volcanic and superficial formations such as the
146 pinkish granitic gravely sands arena, resulting from the
147 granite alteration and lying on a wide outcropping surface
148 with a mean thickness of 0.6 m (Agard et al. 1950), are
149 also present in the zone.
150Hydrogeological setting
151The main hydrogeological units of the Oulmes plateau can
152be considered as: (1) the superficial formations, charac-
153terised by a granular porosity, and (2) the fissured granitic
154and schists formations, essentially characterised by a
155fracture porosity.
156The superficial formations, resulting from the granite,
157schists and quartzites weathering constitute very thin shallow
158aquifers. The granitic and schists formations are considered as
159aquifers only when a significant hydraulic conductivity is
160induced by interconnected fissure networks. The main mea-
161sured fracture directions of the case study zone are orientated
162N10–N30 and N120–N140 and they are mostly subvertical
163(Dadi 1998). Pumping tests performed in the case study zone
164provide an average hydraulic conductivity of 10-5 m/s.
165The ‘‘Sidi Ali’’ spring is currently exploited and bottled
166by the company ‘‘Les Eaux Minerales d’Oulmes S.A’’
167thanks to wells drilled in metamorphised schists very close
168to the Oulmes granite (andalusite zone). Consequently, the
169original ‘‘Sidi Ali’’ spring does not flow anymore, proving
170that pumpings have already modified the original
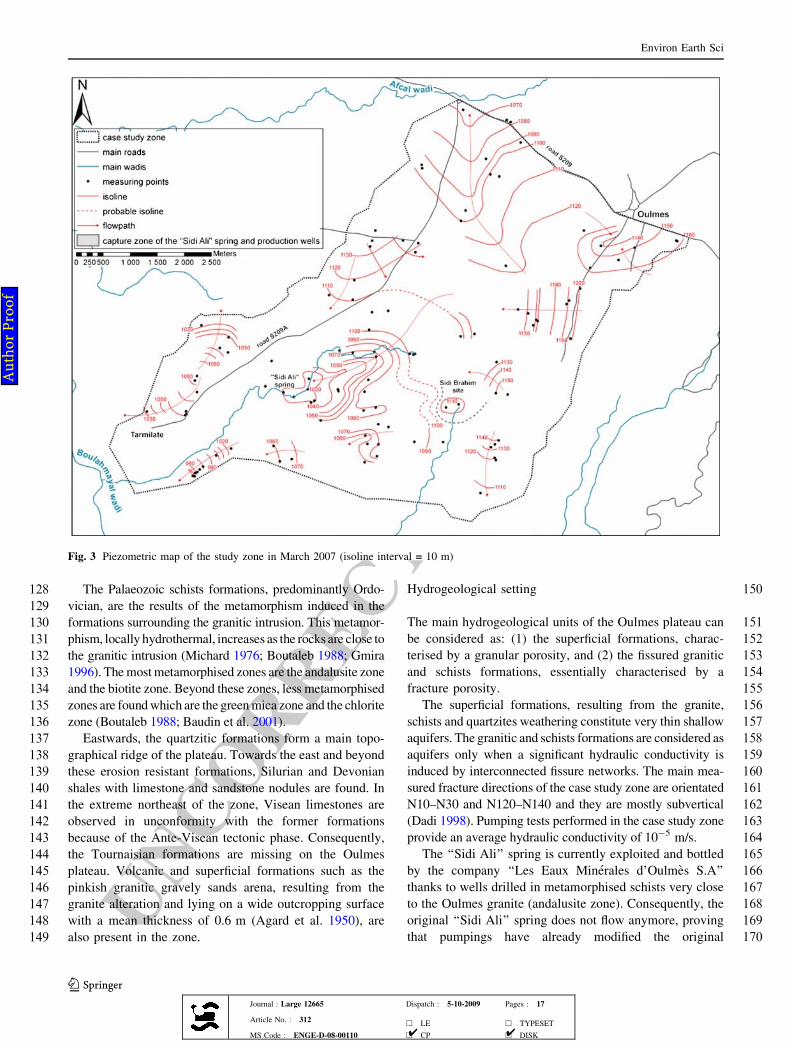
Fig. 3 Piezometric map of the study zone in March 2007 (isoline interval = 10 m)
Environ Earth Sci
123Journal : Large 12665 Dispatch : 5-10-2009 Pages : 17
Article No. : 312h LE h TYPESET
MS Code : ENGE-D-08-00110 h CP h DISK4 4
Au
tho
r P
ro
of
UNCORRECTEDPROOF171 hydrogeological system. The company owns also produc-
172 tion wells on the ‘‘Sidi Brahim’’ site located to the east
173 from the ‘‘Sidi Ali’’ site (Fig. 1).
174 Materials and methods
175 Three kinds of data were collected for this study: isotopic
176 data, hydrogeochemical data and piezometric data.
177 Groundwater samples used for isotopic analyses were
178 collected during a field campaign carried out in summer
179 2004. These isotopic samples were taken from 15 wells and
180 springs chosen at different altitudes and located over the
181 whole Mid-Atlas. The isotopic samples, representative of
182 small watersheds and representative of precipitations, were
183 analysed following standard procedures in Hydroisotop
184 GmbH laboratory in Schweitenkirchen (Germany).
185 Water levels measurements and sampling of ground-
186 water for geochemical analyses were performed during a
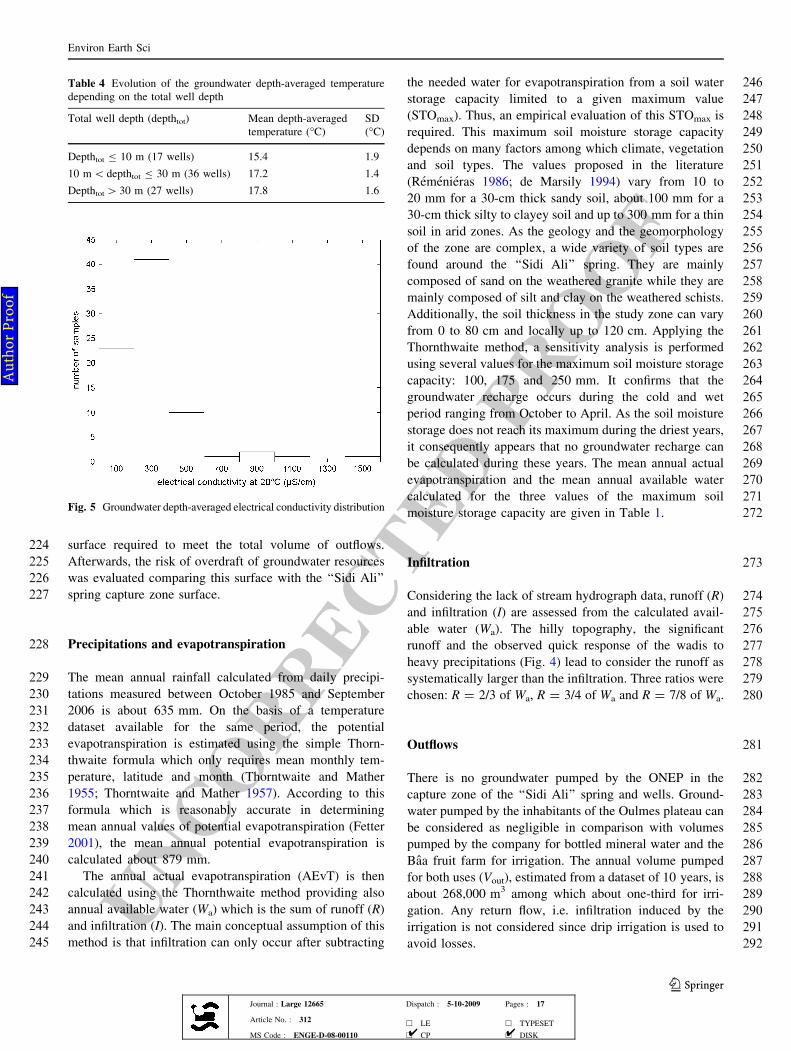
187 field campaign in spring 2007. These 110 geochemical
188 samples were taken manually from springs, shallow and
189 deep wells without any pumping (except for three wells of
190 the company). The piezometric head were measured with a
191 piezometric probe and the hydrogeochemical analyses of
192 major ions were performed using standard techniques in
193 the laboratory of the University of Liege. The acceptable
194 error on the ion balance of each sample is taken at 5%.
195Results
196Piezometric map
197The piezometric map of the study zone (Fig. 3) was plotted
198including both static heads measured in private wells and
199dynamic heads measured in the three production wells of
200the company producing at this period (March 2007).
201The piezometric map indicates that the topography
202strongly influences the piezometric heads which are
203underlined by steeper hydraulic gradients near crests.
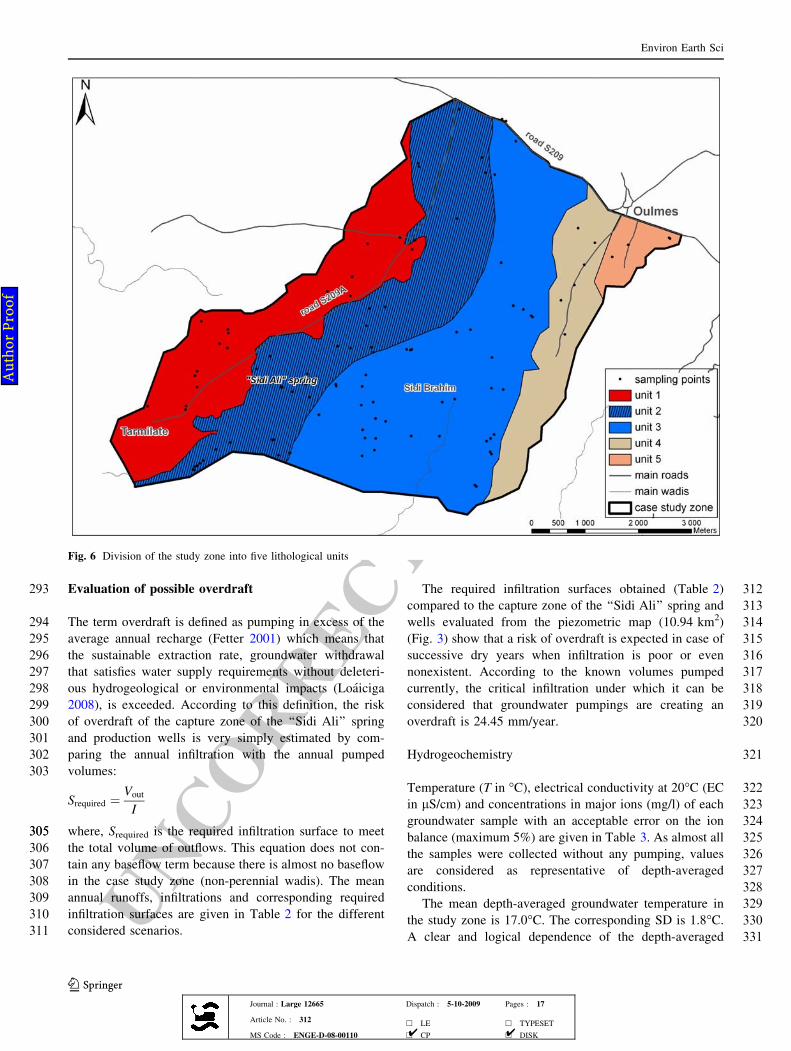
204Groundwater, as surface waters, is drained by two main
205wadis which are the Afcal northward and the Boulahmayal
206southward and westward. Consequently, groundwater flow
207occurs to the north and to the southwest to join, respec-
208tively, the Afcal and the Boulahmayal wadis. Where
209groundwater is not directly drained by these wadis, it is
210drained by their main tributaries. Groundwater flow occurs
211also from east to west along the principal ridge of the
212Oulmes plateau which constitutes both a hydrological and a
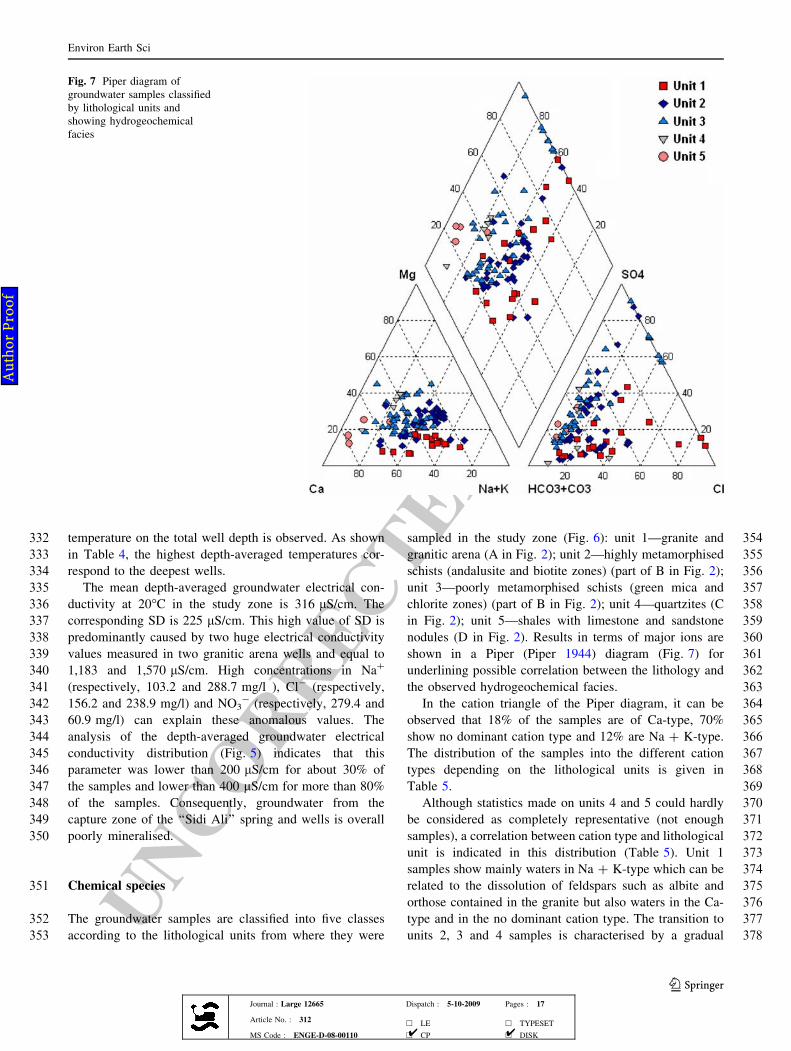
213hydrogeological limit. Influence of the pumping is clearly
214visible through the cones of depression induced in Sidi Ali
215and Sidi Brahim sites. Furthermore, the Sidi Brahim
216pumping influences the hydrogeological system of the
217‘‘Sidi Ali’’ spring by capturing a part of the groundwater
218that would flow naturally towards the ‘‘Sidi Ali’’ spring.
219The ‘‘Sidi Ali’’ groundwater capture zone as delineated
220from this piezometric map covers 10.94 km2.
221Annual groundwater budget
222An annual groundwater budget is established for the ‘‘Sidi
223Ali’’ spring capture zone in order to estimate the infiltration
Table 1 Mean annual actual evapotranspiration (AEvT) and mean
annual available water (Wa) calculated using the Thornthwaite
method for three different values of maximum soil moisture storage
capacity (STOmax)
STOmax (mm) AEvT (mm) Wa (mm)
100 366 269
175 429 205
250 457 158
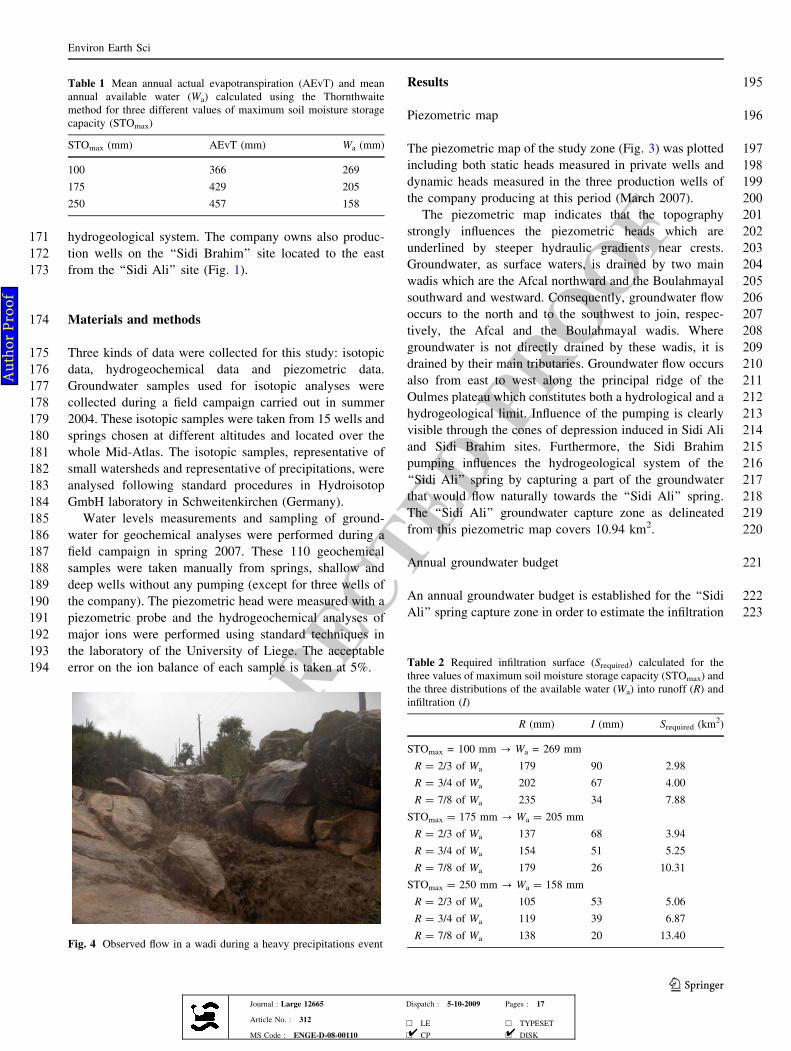
Fig. 4 Observed flow in a wadi during a heavy precipitations event
Table 2 Required infiltration surface (Srequired) calculated for the
three values of maximum soil moisture storage capacity (STOmax) and
the three distributions of the available water (Wa) into runoff (R) and
infiltration (I)
R (mm) I (mm) Srequired (km2)
STOmax = 100 mm ? Wa = 269 mm
R = 2/3 of Wa 179 90 2.98
R = 3/4 of Wa 202 67 4.00
R = 7/8 of Wa 235 34 7.88
STOmax = 175 mm ? Wa = 205 mm
R = 2/3 of Wa 137 68 3.94
R = 3/4 of Wa 154 51 5.25
R = 7/8 of Wa 179 26 10.31
STOmax = 250 mm ? Wa = 158 mm
R = 2/3 of Wa 105 53 5.06
R = 3/4 of Wa 119 39 6.87
R = 7/8 of Wa 138 20 13.40
Environ Earth Sci
123Journal : Large 12665 Dispatch : 5-10-2009 Pages : 17
Article No. : 312h LE h TYPESET
MS Code : ENGE-D-08-00110 h CP h DISK4 4
Au
tho
r P
ro
of

UNCORRECTEDPROOF
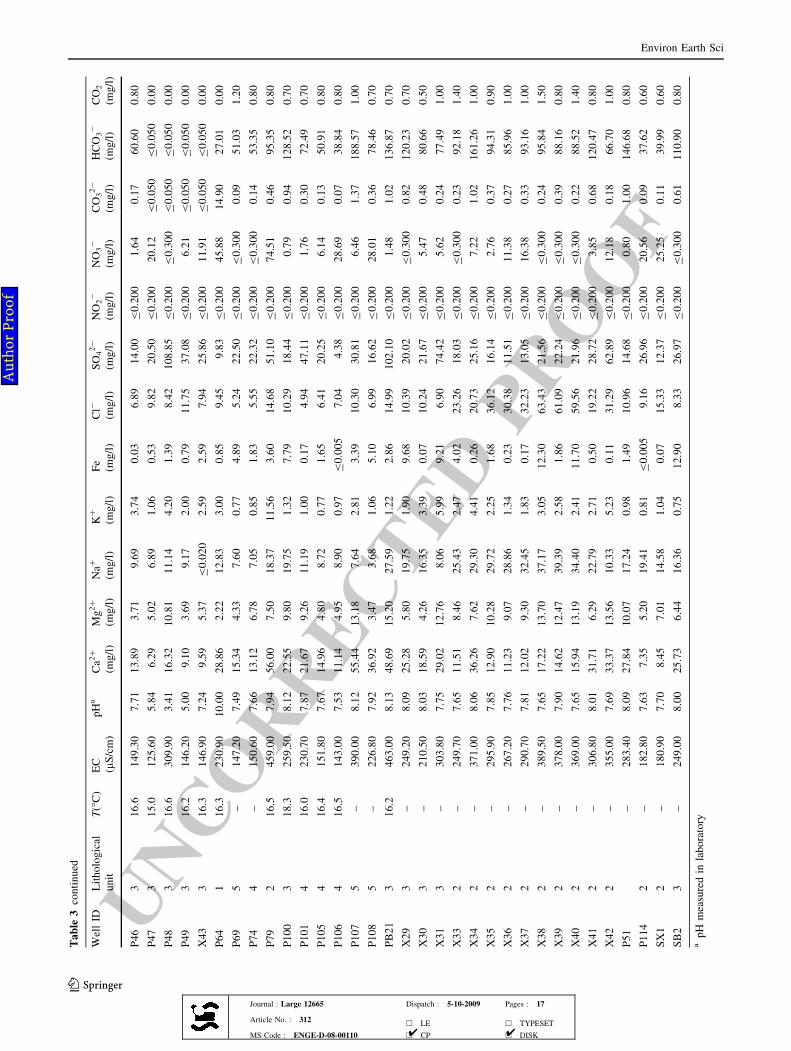
Table
3Tem
perature
(Tin
�C),electrical
conductivity(EC
inlS/cm),pH
andconcentrationsin
mainchem
ical
species(inmg/l)ofeach
groundwater
sample
collectedduringthefield
campaign
WellID
Lithological
unit
T(�C)
EC
(lS/cm)
pHa
Ca2
?
(mg/l)
Mg2?
(mg/l)
Na?
(mg/l)
K?
(mg/l)
Fe
(mg/l)
Cl-
(mg/l)
SO42-
(mg/l)
NO2-
(mg/l)
NO3-
(mg/l)
CO32-
(mg/l)
HCO3-
(mg/l)
CO2
(mg/l)
PB1
319.2
386.00
8.28
27.09
10.48
35.73
2.32
0.49
22.86
65.18
B0.200
3.01
1.04
98.95
0.40
PB2
318.0
334.00
8.40
24.25
10.07
30.78
1.35
1.31
13.89
51.98
B0.200
B0.300
1.51
108.95
0.30
PB3
317.7
319.30
7.91
27.77
9.32
22.20
2.47
2.10
12.48
33.07
B0.200
15.22
0.51
113.52
1.00
PB5
317.9
374.00
8.36
26.29
9.28
37.58
1.64
1.59
21.56
58.56
B0.200
B0.300
1.38
109.25
0.30
PB6
317.5
443.00
8.11
32.03
11.49
42.30
1.58
0.26
21.95
91.83
B0.200
1.46
0.73
103.28
0.60
PB8
318.1
376.00
7.99
24.47
10.48
33.53
2.52
17.30
19.05
89.43
B0.200
1.51
0.37
68.71
0.50
PB11
316.8
444.00
8.26
46.08
15.68
22.59
1.96
1.38
15.74
78.32
B0.200
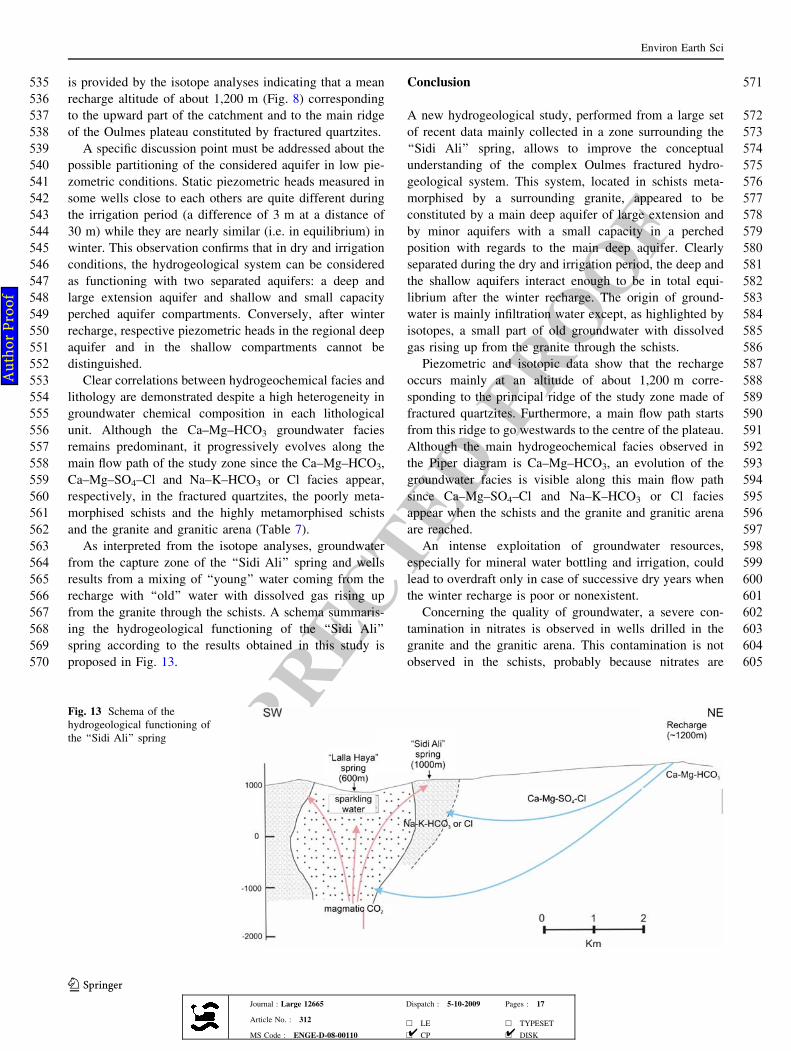
0.92
1.45
144.49
0.60
PB12
315.4
316.00
8.20
18.98
9.93
30.26
2.33
1.83
14.60
52.78
B0.200
B0.300
0.82
93.34
0.40
PB17
313.9
219.90
8.07
16.83
5.80
18.43
2.62
16.40
7.40
22.71
B0.200
B0.300
0.59
90.17
0.50
PB20
315.9
173.80
7.66
10.05
4.42
18.05
0.86
1.44
12.29
18.48
B0.200
8.08
0.11
44.87
0.70
PB24
317.6
403.00
8.15
39.34
12.90
25.04
1.35
0.38
13.07
88.62
B0.200
B0.300
0.82
105.53
0.50
PB25
317.1
417.50
8.32
43.98
11.51
25.48
1.85
0.58
12.21
74.87
B0.200
0.72
1.57
135.71
0.50
PB26
316.6
371.00
7.99
30.46
10.92
25.37
1.62
1.31
11.23
106.00
B0.200
1.49
0.30
55.42
0.40
PB27
317.3
300.20
8.33
26.02
11.99
18.91
1.48
1.27
11.17
18.92
B0.200
0.86
1.68
142.78
0.50
PB28
316.6
354.00
8.16
37.01
11.24
21.01
2.09
2.08
9.35
23.96
B0.200
1.17
1.39
173.88
0.80
SA
217.8
239.30
7.76
16.68
7.06
21.81
1.38
4.11
12.31
37.38
B0.200
B0.300
0.26
82.37
1.00
Pz5
220.7
230.10
7.63
12.15
6.88
21.91
3.57
5.75
12.58
35.42
B0.200
B0.300
0.16
69.14
1.10
S11
113.6
120.00
7.45
6.82
1.84
13.42
1.24
0.14
7.86
3.65
B0.200
19.70
0.05
30.36
0.80
S13
220.3
139.00
7.45
4.43
2.17
19.47
1.42
0.07
10.20
3.70
B0.200
21.47
0.05
32.80
0.80
F4
219.0
302.20
7.44
14.78
9.97
26.50
2.89
19.10
13.99
87.84
B0.200
1.24
0.05
31.58
0.80
F6
217.7
350.00
6.80
21.21
11.75
24.56
3.10
0.63
13.72
128.09
B0.200
2.91
B0.050
B0.050
0.00
F7
218.2
267.70
7.82
13.73
7.41
26.41
3.42
1.86
24.11
41.85
B0.200
0.83
0.22
60.48
0.60
F8
318.9
338.00
7.87
20.08
12.19
28.76
2.62
5.53
13.43
82.87
B0.200
B0.300
0.31
74.93
0.70
F9
219.0
269.30
7.92
12.38
8.56
28.25
2.86
6.59
14.33
47.06
B0.200
B0.300
0.36
77.24
0.60
X2
315.8
166.50
7.87
10.90
5.39
16.26
0.93
0.23
7.64
19.10
B0.200
3.43
0.26
62.86
0.60
X4
112.7
127.00
7.33
7.30
1.71
13.52
1.33
14.50
8.68
4.16
B0.200
21.76
0.04
30.42
1.00
X7
117.3
613.00
7.65
36.65
11.73
66.18
5.82
0.15
71.92
44.57
B0.200
108.88
0.13
54.57
0.90
X10
314.8
174.30
6.38
11.64
6.85
7.55
1.12
0.18
10.43
18.60
B0.200
48.68
B0.050
B0.050
0.00
X13
118.6
157.10
7.83
15.19
1.24
13.69
2.00
0.20
6.99
3.04
B0.200
21.69
0.20
54.44
0.60
X3
114.0
165.50
7.61
9.12
2.38
19.02
1.05
0.26
13.39
2.88
B0.200
25.79
0.09
37.62
0.60
X5
113.2
133.70
7.53
7.14
1.80
16.40
0.99
1.07
7.93
2.71
B0.200
22.05
0.07
37.62
0.80
X9
313.5
187.10
4.50
5.67
8.02
10.51
2.65
0.77
15.16
51.07
B0.200
1.83
B0.050
B0.050
0.00
X11
317.4
165.30
7.39
8.70
4.88
15.16
0.76
0.94
12.12
20.90
B0.200
16.11
0.04
30.36
0.90
X12
318.2
402.00
7.76
47.59
11.32
22.15
4.63
1.45
11.66
24.90
B0.200
5.51
0.64
199.85
2.40
X14
116.5
158.30
7.35
10.65
2.81
17.43
1.44
0.40
6.81
3.20
B0.200
19.24
0.07
59.56
1.90
Environ Earth Sci
123Journal : Large 12665 Dispatch : 5-10-2009 Pages : 17
Article No. : 312h LE h TYPESET
MS Code : ENGE-D-08-00110 h CP h DISK4 4
Au
tho
r P
ro
of
UNCORRECTEDPROOF
Table
3continued
WellID
Lithological
unit
T(�C)
EC
(lS/cm)
pHa
Ca2
?
(mg/l)
Mg2?
(mg/l)
Na?
(mg/l)
K?
(mg/l)
Fe
(mg/l)
Cl-
(mg/l)
SO42-
(mg/l)
NO2-
(mg/l)
NO3-
(mg/l)
CO32-
(mg/l)
HCO3-
(mg/l)
CO2
(mg/l)
X15
116.2
144.60
7.36
16.82
1.35
9.93
2.36
0.42
6.43
4.89
B0.200
3.40
0.09
68.10
2.10
X16
215.4
129.40
7.01
10.19
2.07
10.74
1.74
0.18
7.08
2.26
B0.200
27.94
0.02
30.42
2.10
X17
218.5
399.00
7.88
39.42
9.26
30.72
6.16
0.22
27.42
8.64
B0.200
12.31
0.72
171.62
1.60
X19
218.2
471.00
8.36
47.55
9.85
26.14
23.09
0.15
24.64
36.37
B0.200
2.75
2.43
192.47
0.60
X21
115.5
268.10
7.51
20.34
5.03
20.33
3.76
0.10
18.17
11.16
B0.200
66.85
0.06
31.58
0.70
X22
218.5
215.10
8.02
17.73
6.06
17.99
1.44
1.10
9.68
14.58
B0.200
B0.300
0.56
97.55
0.70
X23
317.7
227.60
8.06
30.95
5.15
6.59
1.04
2.41
7.49
30.09
B0.200
B0.300
0.54
85.41
0.50
X25
3–
117.50
5.95
5.66
5.16
7.20
0.53
0.33
11.85
22.28
B0.200
9.44
B0.050
B0.050
0.00
X26
4–
168.80
7.44
11.81
7.35
6.62
1.71
0.25
13.28
1.85
B0.200
36.38
0.05
30.36
0.80
X27
5–
432.80
8.22
73.54
9.58
5.99
B0.050
0.41
7.09
50.30
B0.200
4.18
1.82
198.63
0.80
SB1
318.5
226.50
7.81
20.29
6.18
17.57
1.10
1.44
9.46
25.31
B0.200
B0.300
0.33
91.94
1.00
SB3
319.8
248.90
7.76
26.49
5.66
17.13
B0.050
4.61
9.19
21.86
B0.200
B0.300
0.35
110.23
1.30
SB4
318.8
208.20
7.45
14.00
5.07
17.83
4.32
0.74
10.33
26.49
B0.200
1.87
0.11
71.70
1.80
P1
217.5
148.90
6.95
6.62
2.37
18.31
1.42
0.61
8.19
2.91
B0.200
29.54
0.02
36.52
2.90
P35-S3
112.8
256.20
7.58
23.73
4.97
19.61
1.57
0.05
25.57
12.99
2.02
19.04
0.14
64.32
1.20
P10
218.0
161.30
7.42
12.76
2.79
13.57
2.40
0.04
7.69
18.13
0.47
14.47
0.06
42.55
1.10
P11
215.9
148.70
7.54
18.69
2.01
7.07
2.29
0.03
5.68
1.85
B0.200
24.63
0.10
53.41
1.10
P12
218.9
210.50
6.68
9.51
6.13
17.64
2.42
0.48
10.23
64.13
B0.200
6.86
B0.050
B0.050
0.00
P13
216.5
213.80
7.50
10.76
5.74
20.45
4.55
0.46
15.17
29.02
B0.200
10.62
0.09
51.03
1.10
P14
219.1
152.20
7.55
10.83
7.26
6.52
3.88
3.10
8.21
2.33
B0.200
10.53
0.13
67.98
1.30
PB15
317.3
401.00
8.00
48.04
10.81
19.94
1.59
21.20
11.79
57.36
B0.200
3.07
0.88
159.12
1.10
P17
217.3
238.30
7.57
15.66
7.81
19.77
0.96
0.24
19.18
15.11
B0.200
13.38
0.16
80.11
1.50
P18
317.1
181.20
7.61
12.67
5.56
15.73
1.44
3.58
9.58
14.35
B0.200
B0.300
0.18
78.89
1.40
P19-S5
313.8
228.50
7.49
17.24
7.73
14.33
1.70
0.74
12.36
35.81
B0.200
11.73
0.09
54.69
1.20
P20
218.0
202.90
7.72
15.85
5.96
18.26
1.33
1.30
10.32
14.45
B0.200
B0.300
0.27
93.28
1.20
P26b
416.1
250.90
7.95
38.83
6.68
6.80
0.99
1.76
8.98
2.02
B0.200
3.86
0.69
139.98
1.10
P28
120.9
1173.00
7.56
88.13
21.24
103.23
4.86
0.17
156.19
33.40
B0.200
279.39
0.10
49.75
1.00
P30
117.7
862.00
8.01
64.90
17.01
94.04
5.74
0.14
86.72
135.69
B0.200
38.90
0.86
151.81
1.00
P31
118.8
1684.50
8.40
81.92
23.51
288.74
16.90
0.11
238.89
62.72
B0.200
60.88
6.95
501.51
1.40
P32
117.7
773.30
8.21
80.84
6.57
75.94
10.28
0.21
57.49
78.07
B0.200
61.45
1.99
222.65
1.00
P34
115.0
540.00
7.81
29.09
7.48
69.72
3.38
0.22
45.29
85.46
B0.200
55.82
0.22
62.92
0.70
P36
115.3
227.30
7.29
15.09
5.24
17.10
3.86
0.31
24.90
6.12
1.16
80.90
B0.050
B0.050
0.00
P37
218.3
140.20
7.41
13.72
1.75
10.16
2.03
0.04
6.33
2.16
B0.200
26.04
0.06
41.34
1.10
P40
316.5
244.50
8.00
27.50
5.40
16.13
1.17
0.94
8.00
19.63
B0.200
2.94
0.62
112.06
0.80
P43
118.2
116.90
7.26
7.33
1.38
10.44
3.53
B0.005
10.50
1.76
B0.200
41.65
B0.050
B0.050
0.00
P45
319.0
188.90
7.63
22.45
5.49
5.67
2.37
8.41
8.92
18.08
B0.200
6.36
0.16
66.70
1.10
Environ Earth Sci
123Journal : Large 12665 Dispatch : 5-10-2009 Pages : 17
Article No. : 312h LE h TYPESET
MS Code : ENGE-D-08-00110 h CP h DISK4 4
Au
tho
r P
ro
of
UNCORRECTEDPROOF
Table
3continued
WellID
Lithological
unit
T(�C)
EC
(lS/cm)
pHa
Ca2
?
(mg/l)
Mg2?
(mg/l)
Na?
(mg/l)
K?
(mg/l)
Fe
(mg/l)
Cl-
(mg/l)
SO42-
(mg/l)
NO2-
(mg/l)
NO3-
(mg/l)
CO32-
(mg/l)
HCO3-
(mg/l)
CO2
(mg/l)
P46
316.6
149.30
7.71
13.89
3.71
9.69
3.74
0.03
6.89
14.00
B0.200
1.64
0.17
60.60
0.80
P47
315.0
125.60
5.84
6.29
5.02
6.89
1.06
0.53
9.82
20.50
B0.200
20.12
B0.050
B0.050
0.00
P48
316.6
309.90
3.41
16.32
10.81
11.14
4.20
1.39
8.42
108.85
B0.200
B0.300
B0.050
B0.050
0.00
P49
316.2
146.20
5.00
9.10
3.69
9.17
2.00
0.79
11.75
37.08
B0.200
6.21
B0.050
B0.050
0.00
X43
316.3
146.90
7.24
9.59
5.37
B0.020
2.59
2.59
7.94
25.86
B0.200
11.91
B0.050
B0.050
0.00
P64
116.3
230.90
10.00
28.86
2.22
12.83
3.00
0.85
9.45
9.83
B0.200
45.88
14.90
27.01
0.00
P69
5–
147.20
7.49
15.34
4.33
7.60
0.77
4.89
5.24
22.50
B0.200
B0.300
0.09
51.03
1.20
P74
4–
150.60
7.66
13.12
6.78
7.05
0.85
1.83
5.55
22.32
B0.200
B0.300
0.14
53.35
0.80
P79
216.5
459.00
7.94
56.00
7.50
18.37
11.56
3.60
14.68
51.10
B0.200
74.51
0.46
95.35
0.80
P100
318.3
259.50
8.12
22.55
9.80
19.75
1.32
7.79
10.29
18.44
B0.200
0.79
0.94
128.52
0.70
P101
416.0
230.70
7.87
21.67
9.26
11.19
1.00
0.17
4.94
47.11
B0.200
1.76
0.30
72.49
0.70
P105
416.4
151.80
7.67
14.96
4.80
8.72
0.77
1.65
6.41
20.25
B0.200
6.14
0.13
50.91
0.80
P106
416.5
143.00
7.53
11.14
4.95
8.90
0.97
B0.005
7.04
4.38
B0.200
28.69
0.07
38.84
0.80
P107
5–
390.00
8.12
55.44
13.18
7.64
2.81
3.39
10.30
30.81
B0.200
6.46
1.37
188.57
1.00
P108
5–
226.80
7.92
36.92
3.47
3.68
1.06
5.10
6.99
16.62
B0.200
28.01
0.36
78.46
0.70
PB21
316.2
463.00
8.13
48.69
15.20
27.59
1.22
2.86
14.99
102.10
B0.200
1.48
1.02
136.87
0.70
X29
3–
249.20
8.09
25.28
5.80
19.75
1.90
9.68
10.39
20.02
B0.200
B0.300
0.82
120.23
0.70
X30
3–
210.50
8.03
18.59
4.26
16.35
3.39
0.07
10.24
21.67
B0.200
5.47
0.48
80.66
0.50
X31
3–
303.80
7.75
29.02
12.76
8.06
5.99
9.21
6.90
74.42
B0.200
5.62
0.24
77.49
1.00
X33
2–
249.70
7.65
11.51
8.46
25.43
2.47
4.02
23.26
18.03
B0.200
B0.300
0.23
92.18
1.40
X34
2–
371.00
8.06
36.26
7.62
29.30
4.41
0.26
20.73
25.16
B0.200
7.22
1.02
161.26
1.00
X35
2–
295.90
7.85
12.90
10.28
29.72
2.25
1.68
36.12
16.14
B0.200
2.76
0.37
94.31
0.90
X36
2–
267.20
7.76
11.23
9.07
28.86
1.34
0.23
30.38
11.51
B0.200
11.38
0.27
85.96
1.00
X37
2–
290.70
7.81
12.02
9.30
32.45
1.83
0.17
32.23
13.05
B0.200
16.38
0.33
93.16
1.00
X38
2–
389.50
7.65
17.22
13.70
37.17
3.05
12.30
63.43
21.56
B0.200
B0.300
0.24
95.84
1.50
X39
2–
378.00
7.90
14.62
12.47
39.39
2.58
1.86
61.09
22.24
B0.200
B0.300
0.39
88.16
0.80
X40
2–
369.00
7.65
15.94
13.19
34.40
2.41
11.70
59.56
21.96
B0.200
B0.300
0.22
88.52
1.40
X41
2–
306.80
8.01
31.71
6.29
22.79
2.71
0.50
19.22
28.72
B0.200
3.85
0.68
120.47
0.80
X42
2–
355.00
7.69
33.37
13.56
10.33
5.23
0.11
31.29
62.89
B0.200
12.18
0.18
66.70
1.00
P51
–283.40
8.09
27.84
10.07
17.24
0.98
1.49
10.96
14.68
B0.200
0.80
1.00
146.68
0.80
P114
2–
182.80
7.63
7.35
5.20
19.41
0.81
B0.005
9.16
26.96
B0.200
20.56
0.09
37.62
0.60
SX1
2–
180.90
7.70
8.45
7.01
14.58
1.04
0.07
15.33
12.37
B0.200
25.25
0.11
39.99
0.60
SB2
3–
249.00
8.00
25.73
6.44
16.36
0.75
12.90
8.33
26.97
B0.200
B0.300
0.61
110.90
0.80
apH
measuredin
laboratory
Environ Earth Sci
123Journal : Large 12665 Dispatch : 5-10-2009 Pages : 17
Article No. : 312h LE h TYPESET
MS Code : ENGE-D-08-00110 h CP h DISK4 4
Au
tho
r P
ro
of
UNCORRECTEDPROOF
224 surface required to meet the total volume of outflows.
225 Afterwards, the risk of overdraft of groundwater resources
226 was evaluated comparing this surface with the ‘‘Sidi Ali’’
227 spring capture zone surface.
228 Precipitations and evapotranspiration
229 The mean annual rainfall calculated from daily precipi-
230 tations measured between October 1985 and September
231 2006 is about 635 mm. On the basis of a temperature
232 dataset available for the same period, the potential
233 evapotranspiration is estimated using the simple Thorn-
234 thwaite formula which only requires mean monthly tem-
235 perature, latitude and month (Thorntwaite and Mather
236 1955; Thorntwaite and Mather 1957). According to this
237 formula which is reasonably accurate in determining
238 mean annual values of potential evapotranspiration (Fetter
239 2001), the mean annual potential evapotranspiration is
240 calculated about 879 mm.
241 The annual actual evapotranspiration (AEvT) is then
242 calculated using the Thornthwaite method providing also
243 annual available water (Wa) which is the sum of runoff (R)
244 and infiltration (I). The main conceptual assumption of this
245 method is that infiltration can only occur after subtracting
246the needed water for evapotranspiration from a soil water
247storage capacity limited to a given maximum value
248(STOmax). Thus, an empirical evaluation of this STOmax is
249required. This maximum soil moisture storage capacity
250depends on many factors among which climate, vegetation
251and soil types. The values proposed in the literature
252(Remenieras 1986; de Marsily 1994) vary from 10 to
25320 mm for a 30-cm thick sandy soil, about 100 mm for a
25430-cm thick silty to clayey soil and up to 300 mm for a thin
255soil in arid zones. As the geology and the geomorphology
256of the zone are complex, a wide variety of soil types are
257found around the ‘‘Sidi Ali’’ spring. They are mainly
258composed of sand on the weathered granite while they are
259mainly composed of silt and clay on the weathered schists.
260Additionally, the soil thickness in the study zone can vary
261from 0 to 80 cm and locally up to 120 cm. Applying the
262Thornthwaite method, a sensitivity analysis is performed
263using several values for the maximum soil moisture storage
264capacity: 100, 175 and 250 mm. It confirms that the
265groundwater recharge occurs during the cold and wet
266period ranging from October to April. As the soil moisture
267storage does not reach its maximum during the driest years,
268it consequently appears that no groundwater recharge can
269be calculated during these years. The mean annual actual
270evapotranspiration and the mean annual available water
271calculated for the three values of the maximum soil
272moisture storage capacity are given in Table 1.
273Infiltration
274Considering the lack of stream hydrograph data, runoff (R)
275and infiltration (I) are assessed from the calculated avail-
276able water (Wa). The hilly topography, the significant
277runoff and the observed quick response of the wadis to
278heavy precipitations (Fig. 4) lead to consider the runoff as
279systematically larger than the infiltration. Three ratios were
280chosen: R = 2/3 of Wa, R = 3/4 of Wa and R = 7/8 of Wa.
281Outflows
282There is no groundwater pumped by the ONEP in the
283capture zone of the ‘‘Sidi Ali’’ spring and wells. Ground-
284water pumped by the inhabitants of the Oulmes plateau can
285be considered as negligible in comparison with volumes
286pumped by the company for bottled mineral water and the
287Baa fruit farm for irrigation. The annual volume pumped
288for both uses (Vout), estimated from a dataset of 10 years, is
289about 268,000 m3 among which about one-third for irri-
290gation. Any return flow, i.e. infiltration induced by the
291irrigation is not considered since drip irrigation is used to
292avoid losses.
Table 4 Evolution of the groundwater depth-averaged temperature
depending on the total well depth
Total well depth (depthtot) Mean depth-averaged
temperature (�C)
SD
(�C)
Depthtot B 10 m (17 wells) 15.4 1.9
10 m\ depthtot B 30 m (36 wells) 17.2 1.4
Depthtot[ 30 m (27 wells) 17.8 1.6
Fig. 5 Groundwater depth-averaged electrical conductivity distribution
Environ Earth Sci
123Journal : Large 12665 Dispatch : 5-10-2009 Pages : 17
Article No. : 312h LE h TYPESET
MS Code : ENGE-D-08-00110 h CP h DISK4 4
Au
tho
r P
ro
of
UNCORRECTEDPROOF
293 Evaluation of possible overdraft
294 The term overdraft is defined as pumping in excess of the
295 average annual recharge (Fetter 2001) which means that
296 the sustainable extraction rate, groundwater withdrawal
297 that satisfies water supply requirements without deleteri-
298 ous hydrogeological or environmental impacts (Loaiciga
299 2008), is exceeded. According to this definition, the risk
300 of overdraft of the capture zone of the ‘‘Sidi Ali’’ spring
301 and production wells is very simply estimated by com-
302 paring the annual infiltration with the annual pumped
303 volumes:
Srequired ¼Vout
I
305305 where, Srequired is the required infiltration surface to meet
306 the total volume of outflows. This equation does not con-
307 tain any baseflow term because there is almost no baseflow
308 in the case study zone (non-perennial wadis). The mean
309 annual runoffs, infiltrations and corresponding required
310 infiltration surfaces are given in Table 2 for the different
311 considered scenarios.
312The required infiltration surfaces obtained (Table 2)
313compared to the capture zone of the ‘‘Sidi Ali’’ spring and
314wells evaluated from the piezometric map (10.94 km2)
315(Fig. 3) show that a risk of overdraft is expected in case of
316successive dry years when infiltration is poor or even
317nonexistent. According to the known volumes pumped
318currently, the critical infiltration under which it can be
319considered that groundwater pumpings are creating an
320overdraft is 24.45 mm/year.
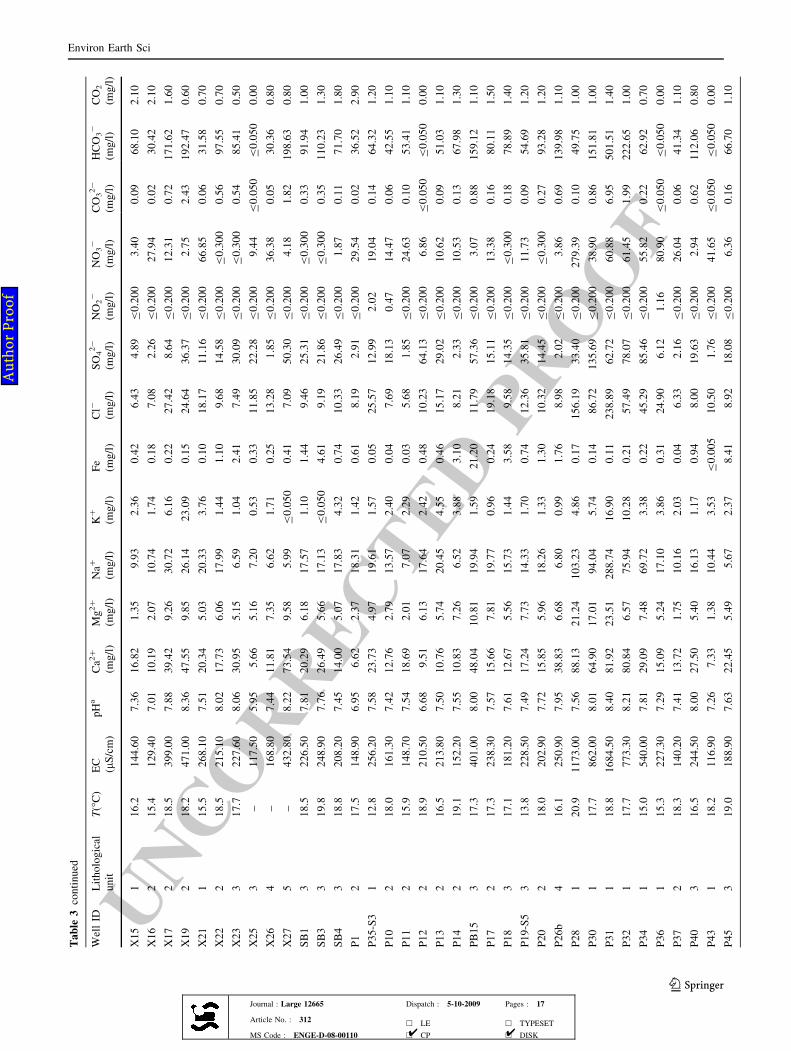
321Hydrogeochemistry
322Temperature (T in �C), electrical conductivity at 20�C (EC
323in lS/cm) and concentrations in major ions (mg/l) of each
324groundwater sample with an acceptable error on the ion
325balance (maximum 5%) are given in Table 3. As almost all
326the samples were collected without any pumping, values
327are considered as representative of depth-averaged
328conditions.
329The mean depth-averaged groundwater temperature in
330the study zone is 17.0�C. The corresponding SD is 1.8�C.
331A clear and logical dependence of the depth-averaged
Fig. 6 Division of the study zone into five lithological units
Environ Earth Sci
123Journal : Large 12665 Dispatch : 5-10-2009 Pages : 17
Article No. : 312h LE h TYPESET
MS Code : ENGE-D-08-00110 h CP h DISK4 4
Au
tho
r P
ro
of
UNCORRECTEDPROOF
332 temperature on the total well depth is observed. As shown
333 in Table 4, the highest depth-averaged temperatures cor-
334 respond to the deepest wells.
335 The mean depth-averaged groundwater electrical con-
336 ductivity at 20�C in the study zone is 316 lS/cm. The
337 corresponding SD is 225 lS/cm. This high value of SD is
338 predominantly caused by two huge electrical conductivity
339 values measured in two granitic arena wells and equal to
340 1,183 and 1,570 lS/cm. High concentrations in Na?
341 (respectively, 103.2 and 288.7 mg/l ), Cl- (respectively,
342 156.2 and 238.9 mg/l) and NO3- (respectively, 279.4 and
343 60.9 mg/l) can explain these anomalous values. The
344 analysis of the depth-averaged groundwater electrical
345 conductivity distribution (Fig. 5) indicates that this
346 parameter was lower than 200 lS/cm for about 30% of
347 the samples and lower than 400 lS/cm for more than 80%
348 of the samples. Consequently, groundwater from the
349 capture zone of the ‘‘Sidi Ali’’ spring and wells is overall
350 poorly mineralised.
351 Chemical species
352 The groundwater samples are classified into five classes
353 according to the lithological units from where they were
354sampled in the study zone (Fig. 6): unit 1—granite and
355granitic arena (A in Fig. 2); unit 2—highly metamorphised
356schists (andalusite and biotite zones) (part of B in Fig. 2);
357unit 3—poorly metamorphised schists (green mica and
358chlorite zones) (part of B in Fig. 2); unit 4—quartzites (C
359in Fig. 2); unit 5—shales with limestone and sandstone
360nodules (D in Fig. 2). Results in terms of major ions are
361shown in a Piper (Piper 1944) diagram (Fig. 7) for
362underlining possible correlation between the lithology and
363the observed hydrogeochemical facies.
364In the cation triangle of the Piper diagram, it can be
365observed that 18% of the samples are of Ca-type, 70%
366show no dominant cation type and 12% are Na ? K-type.
367The distribution of the samples into the different cation
368types depending on the lithological units is given in
369Table 5.
370Although statistics made on units 4 and 5 could hardly
371be considered as completely representative (not enough
372samples), a correlation between cation type and lithological
373unit is indicated in this distribution (Table 5). Unit 1
374samples show mainly waters in Na ? K-type which can be
375related to the dissolution of feldspars such as albite and
376orthose contained in the granite but also waters in the Ca-
377type and in the no dominant cation type. The transition to
378units 2, 3 and 4 samples is characterised by a gradual
Fig. 7 Piper diagram of
groundwater samples classified
by lithological units and
showing hydrogeochemical
facies
Environ Earth Sci
123Journal : Large 12665 Dispatch : 5-10-2009 Pages : 17
Article No. : 312h LE h TYPESET
MS Code : ENGE-D-08-00110 h CP h DISK4 4
Au
tho
r P
ro
of
UNCORRECTEDPROOF
379 enrichment in Ca2? and Mg2? against Na? and K? leading
380 in majority to the no dominant cation type. Unit 5 samples
381 are entirely included in the Ca-type waters which can be
382 related to the dissolution of limestone nodules contained in
383 the shales.
384 The anion triangle indicates that 63% are of the samples
385 HCO3 ? CO3-type, 13% are of the SO4-type, 4% are Cl-
386 type and 20% show no dominant anion type. The distri-
387 bution of the samples into anion types depending on the
388 lithological units is given in Table 6.
389 As for the cations and despite of few exceptions in units
390 4 and 5, a correlation between the dominant anion type and
391 the lithological unit is suggested in this distribution
392 (Table 6). Unit 1 samples show waters of the
393 HCO3 ? CO3-type, Cl-type and no dominant anion type.
394 The transition to units 2 and 3 samples is characterised by a
395 gradual enrichment of groundwater in SO42- against Cl-
396and, in a minor way, against HCO3- and CO3
2-, which can
397be related to the dissolution of pyrite favouring the SO4-
398type. Samples of units 4 and 5 are entirely belonging to the
399HCO3 ? CO3-type of water related to the dissolution of
400the limestone nodules contained in the shales.
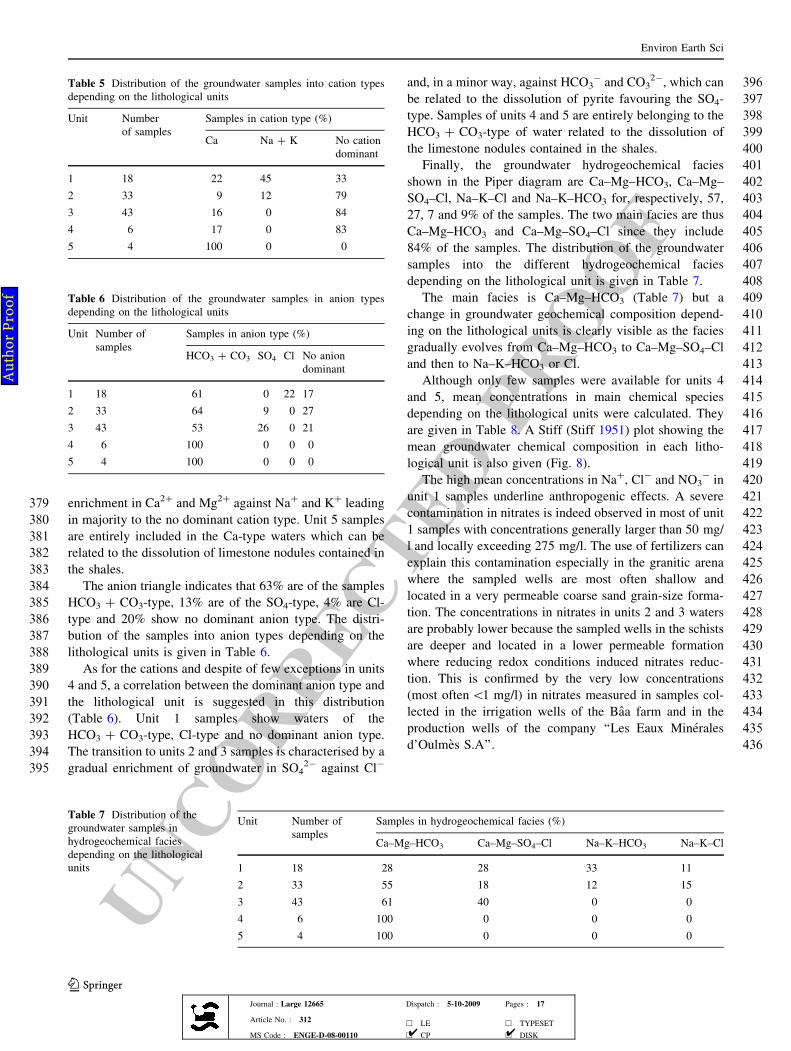
401Finally, the groundwater hydrogeochemical facies
402shown in the Piper diagram are Ca–Mg–HCO3, Ca–Mg–
403SO4–Cl, Na–K–Cl and Na–K–HCO3 for, respectively, 57,
40427, 7 and 9% of the samples. The two main facies are thus
405Ca–Mg–HCO3 and Ca–Mg–SO4–Cl since they include
40684% of the samples. The distribution of the groundwater
407samples into the different hydrogeochemical facies
408depending on the lithological unit is given in Table 7.
409The main facies is Ca–Mg–HCO3 (Table 7) but a
410change in groundwater geochemical composition depend-
411ing on the lithological units is clearly visible as the facies
412gradually evolves from Ca–Mg–HCO3 to Ca–Mg–SO4–Cl
413and then to Na–K–HCO3 or Cl.
414Although only few samples were available for units 4
415and 5, mean concentrations in main chemical species
416depending on the lithological units were calculated. They
417are given in Table 8. A Stiff (Stiff 1951) plot showing the
418mean groundwater chemical composition in each litho-
419logical unit is also given (Fig. 8).
420The high mean concentrations in Na?, Cl- and NO3- in
421unit 1 samples underline anthropogenic effects. A severe
422contamination in nitrates is indeed observed in most of unit
4231 samples with concentrations generally larger than 50 mg/
424l and locally exceeding 275 mg/l. The use of fertilizers can
425explain this contamination especially in the granitic arena
426where the sampled wells are most often shallow and
427located in a very permeable coarse sand grain-size forma-
428tion. The concentrations in nitrates in units 2 and 3 waters
429are probably lower because the sampled wells in the schists
430are deeper and located in a lower permeable formation
431where reducing redox conditions induced nitrates reduc-
432tion. This is confirmed by the very low concentrations
433(most often\1 mg/l) in nitrates measured in samples col-
434lected in the irrigation wells of the Baa farm and in the
435production wells of the company ‘‘Les Eaux Minerales
436d’Oulmes S.A’’.
Table 5 Distribution of the groundwater samples into cation types
depending on the lithological units
Unit Number
of samples
Samples in cation type (%)
Ca Na ? K No cation
dominant
1 18 22 45 33
2 33 9 12 79
3 43 16 0 84
4 6 17 0 83
5 4 100 0 0
Table 6 Distribution of the groundwater samples in anion types
depending on the lithological units
Unit Number of
samples
Samples in anion type (%)
HCO3 ? CO3 SO4 Cl No anion
dominant
1 18 61 0 22 17
2 33 64 9 0 27
3 43 53 26 0 21
4 6 100 0 0 0
5 4 100 0 0 0
Table 7 Distribution of the
groundwater samples in
hydrogeochemical facies
depending on the lithological
units
Unit Number of
samples
Samples in hydrogeochemical facies (%)
Ca–Mg–HCO3 Ca–Mg–SO4–Cl Na–K–HCO3 Na–K–Cl
1 18 28 28 33 11
2 33 55 18 12 15
3 43 61 40 0 0
4 6 100 0 0 0
5 4 100 0 0 0
Environ Earth Sci
123Journal : Large 12665 Dispatch : 5-10-2009 Pages : 17
Article No. : 312h LE h TYPESET
MS Code : ENGE-D-08-00110 h CP h DISK4 4
Au
tho
r P
ro
of
UNCORRECTEDPROOF
437 Isotopes
438 The content in oxygen-18 (d18O in%) and hydrogen-2 (dD
439 in %) of samples collected over the whole Mid-Atlas and
440 in a zone surrounding the ‘‘Sidi Ali’’ spring are given in
441 Table 9.
442d18O
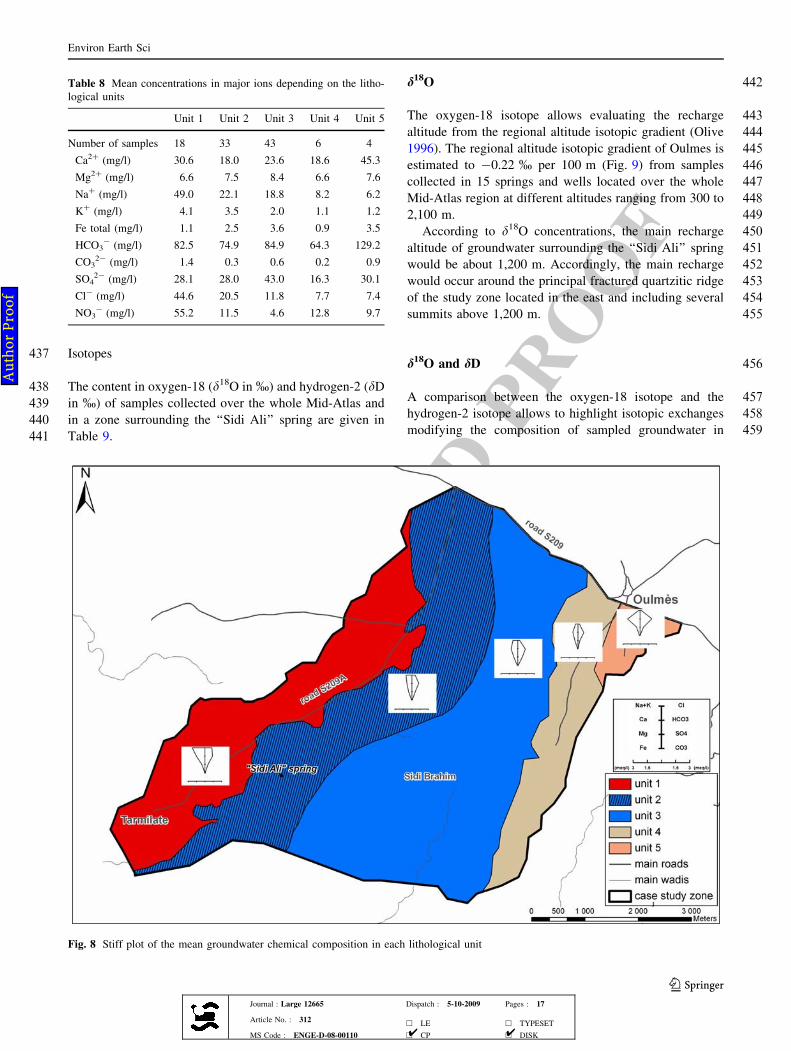
443The oxygen-18 isotope allows evaluating the recharge
444altitude from the regional altitude isotopic gradient (Olive
4451996). The regional altitude isotopic gradient of Oulmes is
446estimated to -0.22 % per 100 m (Fig. 9) from samples
447collected in 15 springs and wells located over the whole
448Mid-Atlas region at different altitudes ranging from 300 to
4492,100 m.
450According to d18O concentrations, the main recharge
451altitude of groundwater surrounding the ‘‘Sidi Ali’’ spring
452would be about 1,200 m. Accordingly, the main recharge
453would occur around the principal fractured quartzitic ridge
454of the study zone located in the east and including several
455summits above 1,200 m.
456d18O and dD
457A comparison between the oxygen-18 isotope and the
458hydrogen-2 isotope allows to highlight isotopic exchanges
459modifying the composition of sampled groundwater in
Fig. 8 Stiff plot of the mean groundwater chemical composition in each lithological unit
Table 8 Mean concentrations in major ions depending on the litho-
logical units
Unit 1 Unit 2 Unit 3 Unit 4 Unit 5
Number of samples 18 33 43 6 4
Ca2? (mg/l) 30.6 18.0 23.6 18.6 45.3
Mg2? (mg/l) 6.6 7.5 8.4 6.6 7.6
Na? (mg/l) 49.0 22.1 18.8 8.2 6.2
K? (mg/l) 4.1 3.5 2.0 1.1 1.2
Fe total (mg/l) 1.1 2.5 3.6 0.9 3.5
HCO3- (mg/l) 82.5 74.9 84.9 64.3 129.2
CO32- (mg/l) 1.4 0.3 0.6 0.2 0.9
SO42- (mg/l) 28.1 28.0 43.0 16.3 30.1
Cl- (mg/l) 44.6 20.5 11.8 7.7 7.4
NO3- (mg/l) 55.2 11.5 4.6 12.8 9.7
Environ Earth Sci
123Journal : Large 12665 Dispatch : 5-10-2009 Pages : 17
Article No. : 312h LE h TYPESET
MS Code : ENGE-D-08-00110 h CP h DISK4 4
Au
tho
r P
ro
of
UNCORRECTEDPROOF
460 oxygen-18 isotope (Olive 1996; Akouvi et al. 2008). The
461 local meteoric water line (LMWL) (Fig. 10) of the region
462 is estimated to be: dD = 8 d18O ? 9 %. Very similar to
463 the World Meteoric Water Line (WMWL) defined by Craig
464 (1957), this linear relation with a gradient of eight indicates
465 that the chemical composition of sampled groundwater was
466 not significantly modified by evaporation.
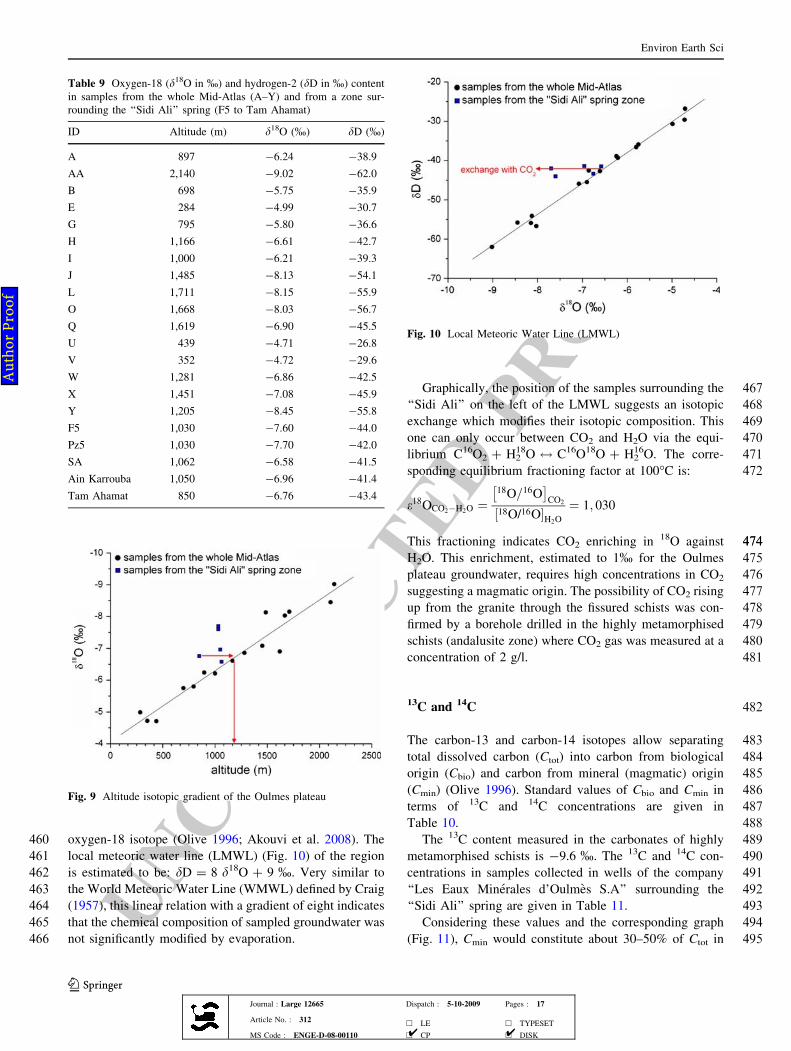
467Graphically, the position of the samples surrounding the
468‘‘Sidi Ali’’ on the left of the LMWL suggests an isotopic
469exchange which modifies their isotopic composition. This
470one can only occur between CO2 and H2O via the equi-
471librium C16O2 ? H218O $ C16O18O ? H2
16O. The corre-
472sponding equilibrium fractioning factor at 100�C is:
e18OCO2�H2O ¼
18O=16O� �
CO2
18O/16O½ �H2O
¼ 1; 030
474474This fractioning indicates CO2 enriching in 18O against
475H2O. This enrichment, estimated to 1% for the Oulmes
476plateau groundwater, requires high concentrations in CO2
477suggesting a magmatic origin. The possibility of CO2 rising
478up from the granite through the fissured schists was con-
479firmed by a borehole drilled in the highly metamorphised
480schists (andalusite zone) where CO2 gas was measured at a
481concentration of 2 g/l.
48213C and 14C
483The carbon-13 and carbon-14 isotopes allow separating
484total dissolved carbon (Ctot) into carbon from biological
485origin (Cbio) and carbon from mineral (magmatic) origin
486(Cmin) (Olive 1996). Standard values of Cbio and Cmin in
487terms of 13C and 14C concentrations are given in
488Table 10.
489The 13C content measured in the carbonates of highly
490metamorphised schists is -9.6 %. The 13C and 14C con-
491centrations in samples collected in wells of the company
492‘‘Les Eaux Minerales d’Oulmes S.A’’ surrounding the
493‘‘Sidi Ali’’ spring are given in Table 11.
494Considering these values and the corresponding graph
495(Fig. 11), Cmin would constitute about 30–50% of Ctot in
Table 9 Oxygen-18 (d18O in%) and hydrogen-2 (dD in%) content
in samples from the whole Mid-Atlas (A–Y) and from a zone sur-
rounding the ‘‘Sidi Ali’’ spring (F5 to Tam Ahamat)
ID Altitude (m) d18O (%) dD (%)
A 897 -6.24 -38.9
AA 2,140 -9.02 -62.0
B 698 -5.75 -35.9
E 284 -4.99 -30.7
G 795 -5.80 -36.6
H 1,166 -6.61 -42.7
I 1,000 -6.21 -39.3
J 1,485 -8.13 -54.1
L 1,711 -8.15 -55.9
O 1,668 -8.03 -56.7
Q 1,619 -6.90 -45.5
U 439 -4.71 -26.8
V 352 -4.72 -29.6
W 1,281 -6.86 -42.5
X 1,451 -7.08 -45.9
Y 1,205 -8.45 -55.8
F5 1,030 -7.60 -44.0
Pz5 1,030 -7.70 -42.0
SA 1,062 -6.58 -41.5
Ain Karrouba 1,050 -6.96 -41.4
Tam Ahamat 850 -6.76 -43.4
Fig. 9 Altitude isotopic gradient of the Oulmes plateau
Fig. 10 Local Meteoric Water Line (LMWL)
Environ Earth Sci
123Journal : Large 12665 Dispatch : 5-10-2009 Pages : 17
Article No. : 312h LE h TYPESET
MS Code : ENGE-D-08-00110 h CP h DISK4 4
Au
tho
r P
ro
of
UNCORRECTEDPROOF
496 groundwater surrounding the ‘‘Sidi Ali’’ spring which
497 confirms once more that gas is rising up from the granite
498 through the schists.
499 Another process likely to produce CO2 is decarbonata-
500 tion at high temperature. This possibility is negligible in
501 this case study since there is almost no carbonate in the
502 highly metamorphised schists (Table 10). Additionally, if a
503 decarbonatation process producing a CO2 enriched of 1–
504 2 % in 13C, was active, the 13C concentration measured in
505 Lalla Haya should be about -8 % instead of the measured
506 -3.5 % (Table 10). Consequently, such a process can be
507 considered as inactive in the study zone.
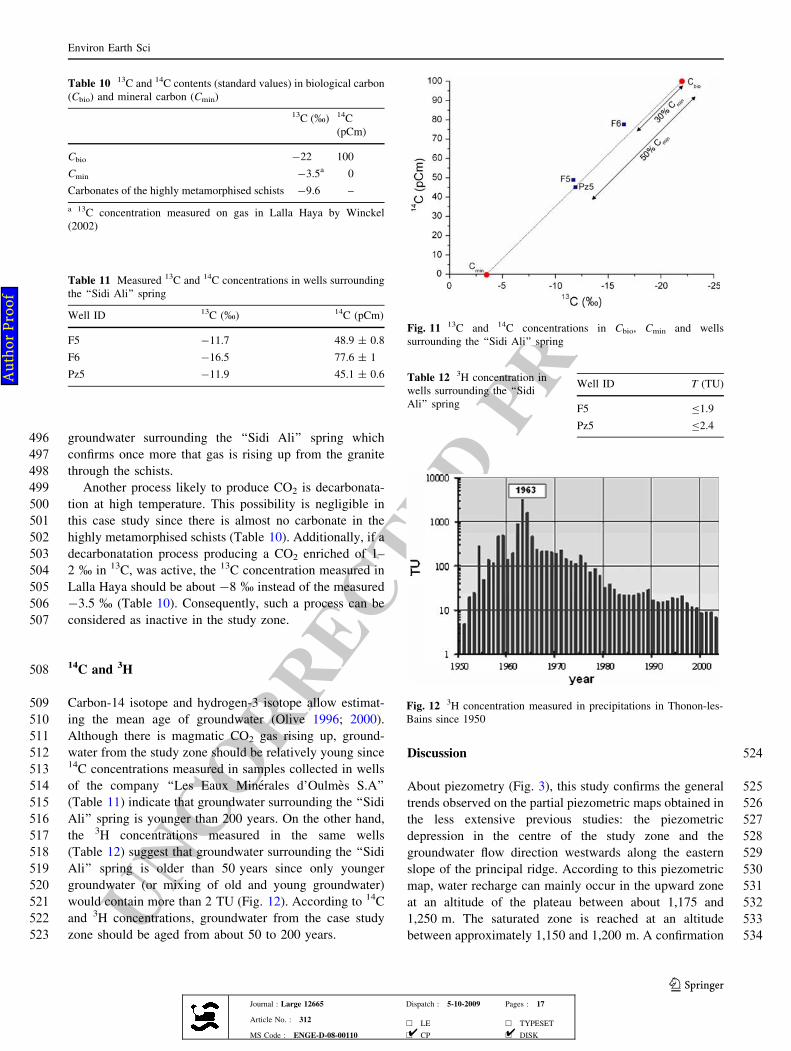
50814C and 3H
509 Carbon-14 isotope and hydrogen-3 isotope allow estimat-
510 ing the mean age of groundwater (Olive 1996; 2000).
511 Although there is magmatic CO2 gas rising up, ground-
512 water from the study zone should be relatively young since
51314C concentrations measured in samples collected in wells
514 of the company ‘‘Les Eaux Minerales d’Oulmes S.A’’
515 (Table 11) indicate that groundwater surrounding the ‘‘Sidi
516 Ali’’ spring is younger than 200 years. On the other hand,
517 the 3H concentrations measured in the same wells
518 (Table 12) suggest that groundwater surrounding the ‘‘Sidi
519 Ali’’ spring is older than 50 years since only younger
520 groundwater (or mixing of old and young groundwater)
521 would contain more than 2 TU (Fig. 12). According to 14C
522 and 3H concentrations, groundwater from the case study
523 zone should be aged from about 50 to 200 years.
524Discussion
525About piezometry (Fig. 3), this study confirms the general
526trends observed on the partial piezometric maps obtained in
527the less extensive previous studies: the piezometric
528depression in the centre of the study zone and the
529groundwater flow direction westwards along the eastern
530slope of the principal ridge. According to this piezometric
531map, water recharge can mainly occur in the upward zone
532at an altitude of the plateau between about 1,175 and
5331,250 m. The saturated zone is reached at an altitude
534between approximately 1,150 and 1,200 m. A confirmation
Fig. 11 13C and 14C concentrations in Cbio, Cmin and wells
surrounding the ‘‘Sidi Ali’’ spring
Table 12 3H concentration in
wells surrounding the ‘‘Sidi
Ali’’ spring
Well ID T (TU)
F5 B1.9
Pz5 B2.4
Fig. 12 3H concentration measured in precipitations in Thonon-les-
Bains since 1950
Table 11 Measured 13C and 14C concentrations in wells surrounding
the ‘‘Sidi Ali’’ spring
Well ID 13C (%) 14C (pCm)
F5 -11.7 48.9 ± 0.8
F6 -16.5 77.6 ± 1
Pz5 -11.9 45.1 ± 0.6
Table 10 13C and 14C contents (standard values) in biological carbon
(Cbio) and mineral carbon (Cmin)
13C (%) 14C
(pCm)
Cbio -22 100
Cmin -3.5a 0
Carbonates of the highly metamorphised schists -9.6 –
a 13C concentration measured on gas in Lalla Haya by Winckel
(2002)
Environ Earth Sci
123Journal : Large 12665 Dispatch : 5-10-2009 Pages : 17
Article No. : 312h LE h TYPESET
MS Code : ENGE-D-08-00110 h CP h DISK4 4
Au
tho
r P
ro
of
UNCORRECTEDPROOF
535 is provided by the isotope analyses indicating that a mean
536 recharge altitude of about 1,200 m (Fig. 8) corresponding
537 to the upward part of the catchment and to the main ridge
538 of the Oulmes plateau constituted by fractured quartzites.
539 A specific discussion point must be addressed about the
540 possible partitioning of the considered aquifer in low pie-
541 zometric conditions. Static piezometric heads measured in
542 some wells close to each others are quite different during
543 the irrigation period (a difference of 3 m at a distance of
544 30 m) while they are nearly similar (i.e. in equilibrium) in
545 winter. This observation confirms that in dry and irrigation
546 conditions, the hydrogeological system can be considered
547 as functioning with two separated aquifers: a deep and
548 large extension aquifer and shallow and small capacity
549 perched aquifer compartments. Conversely, after winter
550 recharge, respective piezometric heads in the regional deep
551 aquifer and in the shallow compartments cannot be
552 distinguished.
553 Clear correlations between hydrogeochemical facies and
554 lithology are demonstrated despite a high heterogeneity in
555 groundwater chemical composition in each lithological
556 unit. Although the Ca–Mg–HCO3 groundwater facies
557 remains predominant, it progressively evolves along the
558 main flow path of the study zone since the Ca–Mg–HCO3,
559 Ca–Mg–SO4–Cl and Na–K–HCO3 or Cl facies appear,
560 respectively, in the fractured quartzites, the poorly meta-
561 morphised schists and the highly metamorphised schists
562 and the granite and granitic arena (Table 7).
563 As interpreted from the isotope analyses, groundwater
564 from the capture zone of the ‘‘Sidi Ali’’ spring and wells
565 results from a mixing of ‘‘young’’ water coming from the
566 recharge with ‘‘old’’ water with dissolved gas rising up
567 from the granite through the schists. A schema summaris-
568 ing the hydrogeological functioning of the ‘‘Sidi Ali’’
569 spring according to the results obtained in this study is
570 proposed in Fig. 13.
571Conclusion
572A new hydrogeological study, performed from a large set
573of recent data mainly collected in a zone surrounding the
574‘‘Sidi Ali’’ spring, allows to improve the conceptual
575understanding of the complex Oulmes fractured hydro-
576geological system. This system, located in schists meta-
577morphised by a surrounding granite, appeared to be
578constituted by a main deep aquifer of large extension and
579by minor aquifers with a small capacity in a perched
580position with regards to the main deep aquifer. Clearly
581separated during the dry and irrigation period, the deep and
582the shallow aquifers interact enough to be in total equi-
583librium after the winter recharge. The origin of ground-
584water is mainly infiltration water except, as highlighted by
585isotopes, a small part of old groundwater with dissolved
586gas rising up from the granite through the schists.
587Piezometric and isotopic data show that the recharge
588occurs mainly at an altitude of about 1,200 m corre-
589sponding to the principal ridge of the study zone made of
590fractured quartzites. Furthermore, a main flow path starts
591from this ridge to go westwards to the centre of the plateau.
592Although the main hydrogeochemical facies observed in
593the Piper diagram is Ca–Mg–HCO3, an evolution of the
594groundwater facies is visible along this main flow path
595since Ca–Mg–SO4–Cl and Na–K–HCO3 or Cl facies
596appear when the schists and the granite and granitic arena
597are reached.
598An intense exploitation of groundwater resources,
599especially for mineral water bottling and irrigation, could
600lead to overdraft only in case of successive dry years when
601the winter recharge is poor or nonexistent.
602Concerning the quality of groundwater, a severe con-
603tamination in nitrates is observed in wells drilled in the
604granite and the granitic arena. This contamination is not
605observed in the schists, probably because nitrates are
Fig. 13 Schema of the
hydrogeological functioning of
the ‘‘Sidi Ali’’ spring
Environ Earth Sci
123Journal : Large 12665 Dispatch : 5-10-2009 Pages : 17
Article No. : 312h LE h TYPESET
MS Code : ENGE-D-08-00110 h CP h DISK4 4
Au
tho
r P
ro
of
UNCORRECTEDPROOF
606 reduced in this anoxic media. However, this last statement
607 can be biased by the fact that most of the wells drilled in
608 the schists are deeper and more protected than those drilled
609 in the granite and the granitic arena.
610 Acknowledgments Authors are grateful to the company ‘‘Les Eaux611 Minerales d’Oulmes S.A’’ for supporting this study and the needed612 field campaigns.
613 References
614 Agard J, Termier H, Odowenko B (1950) Les gıtes d’etain et de615 tungstene de la region d’Oulmes (Maroc Central), vol 82.616 Editions du Service Geologique du Maroc, Rabat 326617 Akouvi A, Dray M, Violette S, de Marsily G, Zuppi GM (2008) The618 sedimentary coastal basin of Togo: example of a multi-layered619 aquifer still influenced by a palaeo-seawater intrusion. Hydro-620 geol J 16(3):419–436621 Baudin T, Roger J, Chevremont P, Rachdi H, Chenakeb M, Cailleux622 Y, Razin P, Bouhdadi S (2001) Carte geologique du Maroc (1/50623 000)—Feuille d’Oulmes. Editions du Service Geologique du624 Maroc, Rabat625 Beaudet G (1969) Le Plateau Central Marocain et ses bordures:626 etudes geomorphologiques. Ph.D. Thesis, Universite de Paris,627 Paris, p 478628 Boutaleb M (1988) Reconstitution de l’evolution tectono-metamor-629 phique, magmatique et hydrothermale du district stanno-630 wolframifere de Walmes (Maroc Central)—implications metal-631 logeniques. Ph.D. Thesis, Nancy, Institut National Polytechnique632 de Lorraine, p 310633 Craig H (1957) Isotopic standards for carbon and oxygen and634 correlation factors for mass spectrometric analysis of carbon635 dioxide. Geochim Cosmochim Acta 12:133–149636 Dadi S (1998) Contribution a l’etude hydrologique et hydrochimique637 du Plateau d’Oulmes (Maroc Central, Maroc). Ph.D. Thesis,638 Universite Cadi Ayyad, Marrakech, p 182639 de Marsily G (1994) Hydrogeologie: comprendre et estimer les640 ecoulements souterrains et le transport de polluants. Pierre et641 Marie Curie, Universite Paris VI, Paris
642Diot H, Bouchez J-L, Boutaleb M, Macaudiere J (1987) Le granite643d’Oulmes (Maroc Central): structures de l’etat magmatique a644l’etat solide et modele de mise en place. Bulletin de la Societe645Geologique de France numero special 3(1):157–168 (serie 8)646Fetter CWJ (2001) Applied hydrogeology. Pearson education.647Prentice-Hall, Upper Saddle River, p 598648Gmira A (1996) Alteration des granites d’Oulmes (Maroc Central),649vol 139. Documents du Laboratoire Geologique de Lyon, Lyon,650p 148651Lagarde J-L (1985) Cisaillements ductiles et plutons granitiques652contemporains de la deformation hercynienne post-viseenne de653la Meseta Centrale. Hercynia 1–1:29–37654Loaiciga HA (2008) Aquifer storage capacity and maximum annual655yield from long-term aquifer fluxes. Hydrogeol J 16:399–403656Michard A (1976) Elements de geologie marocaine, vol 252. Editions657du Service Geologique du Maroc, Rabat, p 408658Olive P (1996) Introduction a la geochimie des eaux continentales.659Editura Didactica I Pedogagica, Bucarest, p 127660Olive P (2000) La datation des eaux souterraines a long temps de661residence par le radiocarbone Mode d’emploi. Hydrogeologie6621:3–19663Piper AM (1944) A graphic procedure in the geochemical interpre-664tation of water analyses. Trans Am Geophys Union 25:914–923665Remenieras G (1986) L’hydrologie de l’ingenieur, 2nd edn. Eyrolles,666Paris667Stiff HAJ (1951) The interpretation of chemical water analysis by668means of patterns. J Petrol Technol 3:15–17669Tahiri A (1991) Le Maroc Central Septentrional: stratigraphie,670sedimentologie et tectonique du Paleozoıque; un exemple de671passage des zones internes aux zones externes de la chaıne672hercynienne du Maroc. Ph.D. Thesis, Universite de Bretagne673Occidentale, Brest, p 300674Termier H (1936) Etudes geologiques sur le Maroc central et le675Moyen Atlas septentrional, vol 33. Editions du Service Geolog-676ique du Maroc, Rabat, p 1566677Thorntwaite CW, Mather JR (1955) The water balance. N.J. Lab678Climatol Publ 8:1–86679Thorntwaite CW, Mather JR (1957) Instructions and tables for680computing potential evapotranspiration and the water balance.681N.J. Lab Climatol Publ 10:185–311
682
Environ Earth Sci
123Journal : Large 12665 Dispatch : 5-10-2009 Pages : 17
Article No. : 312h LE h TYPESET
MS Code : ENGE-D-08-00110 h CP h DISK4 4
Au
tho
r P
ro
of


