Embed Size (px)
Citation preview

CSLS Conference on the State of Living Standards and the Quality of Life in Canada
October 30 - 31, 1998 Château Laurier Hotel, Ottawa, Ontario
Centre for theStudy of Living Standards
Centre d'étude desniveaux de vie
Human Capital and Regional Convergence in Canada
Serge CoulombeUniversity of Ottawa
Jean-François TremblayQueen's University
Session 3 Sustainability I: “Intergenerational Bequests of Natural and Human Capital”October 30 11:30 AM - 12:30 PM

19 October 98
Human Capital and Regional Convergence in Canada
To be presented at the Conference on The State of Living Standards and the Quality ofLife in Canada, October 30-31, 1998, Ottawa, organized by the Centre for the Study of LivingStandards.
Serge Coulombe*Jean-François Tremblay**
*Associate ProfessorDepartment of EconomicsUniversity of [email protected]
**Graduate StudentDepartment of EconomicsQueen’s [email protected]
A first version of this paper was presented at the 1998 meetings of the Canadian EconomicAssociation and of the Société canadienne de sciences économiques held in May 1998 in Ottawaand Québec City. The authors benefitted from comments from Doug May and the otherparticipants. They also benefitted from discussions with Thomas Lemieux and the otherparticipants of a seminar given at the University of Montréal. They want to thank Andrew Sharpefor editorial assistance. The authors, however, remain solely responsible for any remainingerrors or omissions.

The following empirical studies focus on regional convergence in Canada: Coulombe1
and Day (1996 and 1998), Coulombe and Lee (1993, 1995, and 1998), Helliwell (1994), Lee andCoulombe (1995), and Lefebvre (1994).
1
1. Introduction
In growth theory, convergence refers to the tendency of poor economies to grow faster
than rich ones. Recently, the convergence hypothesis has received considerable support from
cross-country empirical analysis for the post-WWII period (Barro and Sala-i-Martin 1995, Barro
1997). The evolution of regional economies in Canada is also characterized by convergence
(Helliwell and Chung, 1991, Coulombe and Lee 1993, Lefebvre, 1994, and Helliwell, 1994).1
The growth rates of a variety of per capita income and output measures and productivity have
tended to be higher in the poor provinces than in the rich ones since 1950 and the dispersion
across provinces of these economic indicators is considerably smaller today than it was after
WWII. Pointing out that convergence was faster for income indicators that include government
transfers, Coulombe and Lee (1995) highlight the potential role of interregional redistribution
operated through the working of fiscal federalism. Lee and Coulombe (1995) show that
productivity across provinces has converged even more rapidly than other income or output
indicators. The analysis of Coulombe and Day (1996 and 1998) suggests that, since the mid-
1980s, the dispersion of per capita income and output indicators might have reached the
neighborhood of its long-run equilibrium value.
The empirical evidence of convergence suggests that the neoclassical growth framework
is a good candidate to explain post-WWII regional growth patterns in Canada. Convergence to a
steady state that is independent of initial conditions is a key property of the neoclassical growth
framework. The further an economy is from its long-run equilibrium, the faster it grows and the
growth rates asymptotically decreases to its long-run level during the transition process . The
convergence property follows from the law of decreasing returns to capital accumulation.
Capital tends to accumulate faster in regions where it is relatively scarce.
In this paper, we show that most of the relative growth profile of per capita income across
Canadian provinces since the early 1950s could be explained by the convergence process of
human capital indicators. The empirical analysis is a direct application of the ‘new-neoclassical

2
growth’ model of an open economy suggested by Barro, Mankiw and Sala-i-Martin (1995) to the
analysis of regional convergence in Canada. The analysis indicates that in an open economy
with perfect capital mobility, the dynamics of human capital accumulation is the driving force of
growth. During the convergence process, the accumulation of physical capital is driven by the
accumulation of human capital, and per capita income disparities across economies are explained
by disparities in human capital stock.
Section 2 focuses on the theoretical foundations of the empirical study by highlighting the
role of human capital in neoclassical growth models. Speeds of convergence of human capital
indicators and per capita income measures across Canadian provinces between 1951 and 1996
are estimated in section 3. Following the traditional approach in labor economics and in growth
studies, we use data on educational achievements as proxies for human capital stock. In section
4, the relative evolution across the provinces of per capita income measures are explained by the
provinces` initial relative endowments of human capital. We conclude by drawing some lessons
for economic policy.

Y A K Legt= −α α( ) ,1
On this topic, refer to Mankiw (1995).2
3
2. The Role of Human Capital
From a quantitative point of view, the basic Solow-Swan framework is unable to explain
adequately many stylized facts observed at the cross-country level . In this section, we show why2
the introduction of human capital might be a solution to reconcile the neoclassical growth model
with stylized facts. We first underline why it is important to increase the capital share above the
accounting share of profits in national income. Then, we analyze the role of human capital
accumulation in the framework of an open economy with perfect capital mobility.
2.1 The Capital Share
Traditionally, the elasticity of output with respect to capital was associated with the share
of profits in national income. Data on national accountings reveal that the share of profits is
approximately 1/3 of national income versus 2/3 for wages. The elasticity of output Y with
respect to capital K is the exponent . in the familiar Cobb-Douglas production function:
where g is the growth rate of labor L in efficiency unit and A is an exogenous technological
variable. This production function was specifically designed to adequately explain the invariance
across time and across economies of the relative share of capital and labor in national
accountings.
If the elasticity of output with respect to capital accumulation is limited to 1/3, the
neoclassical growth model encounters many problems in explaining important stylized facts of
economic development. Two important problems deal with the magnitudes of income gaps and
rate of returns differentials. If labor is homogeneous and all economies have access to the same
technology, the long-run level of output per capita is determined by the saving rate and the
population growth rate. International data show that the saving rate is approximately four times
higher and the population growth rate roughly 2 percentage points lower in the richer countries
than in the poorer countries. Such discrepancies between savings and population growth could
only account for per capita income gaps in the order of magnitude of two to one between the rich

Y A K H Legt= − −α η α η( ) ,1
4
(1)
and the poor countries. The observed gaps often exceed 10 to one. Furthermore, the model
predicts that the rate of return on capital should be 100 times higher in a country 10 times poorer
than the rich ones.
According to Mankiw, Romer and Weil (1992), most of the empirical problems of the
neoclassical growth model could be solved if the concept of capital is broadened to include both
human and physical capital. The availability of data largely explains why the earlier
formulations of the neoclassical growth model focused mainly on physical capital: Only data on
physical capital accumulation are provided by the national accountings. However, on theoretical
grounds, the accumulation of capital should correspond to the value of all present consumption
forgone for the purpose of increasing future production. Education and on-the-job-training
represent forms of investment in human capital accumulation. Since the return to human capital
accumulation is implicitly incorporated in wages in national accountings, the contribution of
capital accumulation to output growth is underestimated if the capital share is limited to the share
of profits.
Following Barro, Mankiw and Sala-i-Martin (1995), a Cobb-Douglas production with a
broad capital concept could be specified as:
where � is the elasticity of output with respect to human capital accumulation. On steady-state, �
equals the share of the implicit return to human capital. On the basis of the difference between
the average wage and the minimum wage in the US, Mankiw (1995) estimates that � should be
approximately 1/2. The elasticity of output with respect to the accumulation of broad capital is
then around 0.8. Mankiw (1995) argues that the quantitative predictions of a neoclassical growth
model with a broad capital share around 0.8 are relatively consistent with most stylized facts on
economic development.
An alternative, and sometime complementary, approach is to model adjustment costs for3
investment. See Barro and Sala-i-Martin (1995, section 3.5).
The revival of neo-classical growth theory in the 1990s, following the development of4
endogenous growth models, came with the empirical and theoretical works of Mankiw, Romerand Weil (1992), Barro and Sala-i-Martin (1995), and Barro, Mankiw and Sala-i-Martin (1995).
5
2.2 Capital Mobility in an Open Economy
It is only recently that the neoclassical growth model has been extended to capture the
process of capital accumulation in an open economy with capital mobility (Cohen and Sachs,
1986, Barro, Mankiw and Sala-i-Martin, 1995). The open economy framework modifies the
fundamental dynamic of capital accumulation because external borrowing breaks the connection
between domestic saving and investment. If there were no limit to foreign borrowing and capital
was perfectly mobile, the predictions of the neoclassical growth framework would contradict
most observed facts. Capital would flow instantaneously to economies where the capital- labour
ratio is smaller and all economies would converge to their steady state at an infinite rate. Not
surprisingly, one of the roads followed to improve the explanatory power of the neoclassical
growth framework in an open economy was to introduce a constraint on international borrowing
(Cohen and Sachs, 1986).3
The intrinsic nature of human capital provides an intuitively appealing motivation
for modeling of a constraint on international borrowing. In a seminal paper that has contributed
to restore the popularity of neoclassical growth models, Barro, Mankiw and Sala-i-Martin (1995)
argue that investment in human capital should be financed with domestic saving because
domestic residents cannot borrow abroad with human capital, or raw labor, as collateral. Human4
capital could hardly be financed through domestic financial markets if lenders want to secure
their loans. Without public intervention, human capital investment by the young could only be
financed within the family circle, which requires some forms of altruism or implicit inter-
generational contracts. It is even hard to have investment in human capital fully recognized by
the legal system in case of divorce and assets division. Recent graduates who benefit from public
financing of their education have the incentive to default on their debt because their loan could

The financing of human capital accumulation in financial markets or by direct5
investments could be achieved without the intervention of the state in slavery or colonialregimes.
6
not be secured by human capital. From a general point of view, the intrinsic problem of
financing investment in human capital in a free-market economy comes from the specific nature
of human capital, but it is also the result of modern institutional, political, and legal
organizations. The history of human beings demonstrates that other institutional arrangements
regarding property rights and political status allow for the use of human capital as collateral on
loans.5
With a binding constraint for the financing of human capital, the complementarity
between the two types of capital in the production function implies that the dynamics of human
capital accumulation determines, by an unidirectional causal channel, the evolution of most
important macro variables during the transitory process towards long-run equilibrium. The speed
of convergence of physical capital, per capita income and output, is determined by, and equal to,
the speed of convergence of human capital. If initially, the human capital/labor ratio is below its
steady-state level, the physical capita/labor ratio would only gradually adjust to its steady-state
value even if physical capital is perfectly mobile across regions.
Consider the example of a region where the physical capital/labor ratio is below the
national average. If physical capital and labor are the only two factors of productions, one must
conclude that the marginal product of capital is higher in this region than elsewhere and one
would expect capital (financial capital or direct investment) to flow from the rest of the economy
to this region. However in the framework set out by Barro, Mankiw and Sala-i-Martin (1995), the
relative scarcity of human capital in the poor region translates by a rapid decrease in the marginal
product of physical capital. Consequently, during the transition towards steady-state, the
marginal product of capital is the same in the poor region than elsewhere, even if the physical-
capital-labour ratio is smaller. Barro and Sala-i-Martin (1995, section 3.2.3) show that the
equalization of the rate of return on physical capital across economies implies that the physical

Note that the discussion in Barro, Mankiw and Sala-i-Martin (1995, p. 108) regarding6
the evolution of the capital/ labor ratio during the transitory process is incorrect since Barro andSala-i-Martin (1995, section 3.2.3) demonstrate algebraically the constancy of the capital/labourratio for the case of a Cobb-Douglass production function.
7
capital/output ratio will be constant during the transition process. This is precisely one of6
Kaldor’s (1963) “stylized facts” regarding economic development.
In a federal system, the centralized funding of education might relax the assumption that
investment in education has to be financed by regional domestic saving. In Canada, the Federal
government has established an ambitious program of interregional redistribution with the
development of the welfare state in the post-WWII period. One of the purpose of interregional
redistribution was to assist the provinces in the financing of higher education. But even if
important resources are redistributed through the working of fiscal federalism, the dynamic
process of human capital accumulation will be the driving force of regional growth if physical
capital cannot be financed freely on international markets. The speed of convergence of poor
provinces to the rich ones will then be determined by the incentive to invest in education in the
poor provinces. As this study will show, the relatively slow speed of convergence observed at the
regional level in Canada since the 1950s, despite the amounts involved in interregional
redistribution, might be explained by the fact that most of the investment in education is made by
young people, only a subset of the population.
Perfect capital mobility, for the financing of nonhuman capital, is one of the key premises
of the Barro, Mankiw and Sala-i-Martin (1995) framework. We briefly look at the realistic
nature of this assumption for the case of the Canadian provinces before testing the model
empirically. On institutional grounds, one must recognize that barriers to capital mobility across
provinces are practically inexistent. The Canadian financial system is mainly made up of large
multi-branch banks that can redistribute savings across regions. Since regions are relatively
homogeneous on cultural, political, and social grounds, Québec and the rest of Canada being a
notable exception from the point of view of language, capital should flow freely to finance the
most profitable investments. For a given risk, rates of return on physical capital should be
equalized across regions.

See for example Tesar (1991).7
8
From an empirical point of view, the assumption of perfect capital mobility cannot be
tested directly. Since Feldstein and Horioka (1980), a common test of the assumption is to look
at the correlation between investment and domestic saving across countries. If capital is not free
to move geographically, one should observe a positive correlation between domestic saving and
investment since the later is constraint by the former. On theoretical grounds however, this
approach has been widely criticized. Barro, Mankiw and Sala-i-Martin (1995) demonstrated7
that in their neoclassical growth framework with perfect capital mobility and a credit constraint
on human capital, the Feldstein-Horioka correlation should be observed on steady-state across
economies that differ only from taxation rates.
Despite the theoretical problems of the Feldstein-Horioka approach, Brown (1992)
concludes that capital is more mobile across Canadian provinces than across OECD countries on
the basis of a Feldstein-Horioka empirical analysis. In Appendix A, correlations between
investment and domestic saving across Canadian provinces and across countries are presented for
illustrative purposes. Results are compatible with Brown’s (1992) findings. Contrary to what is
observed at the cross-country level, correlation coefficients between domestic savings and
investment are not significantly different from zero across Canadian provinces. We do not
however interpret these results as an empirical proof of the assumption of perfect capital mobility
across Canadian provinces. Notwithstanding our prudent interpretation of the very indirect
testing of this crucial assumption, we think that perfect capital mobility is a palatable working
assumption for the analysis of long-run regional growth in Canada.

However, part of the investment in human capital follows from non-market activities8
within the family circle and one could argue that the human capital of non-participating membersis an input in the human capital accumulation process.
9
3. Convergence of Human Capital and Per Capita Income.
In this section, we estimate and compare the convergence speed of alternative indicators
of human capital and per-capita income across Canadian provinces during the 1951-1996 period.
We begin with a brief discussion of the problems associated with the measure of human capital.
3.1 The Measure of Human Capital.
As explained above, given its intrinsic nature, human capital is not exchanged in markets.
That complicates the economic measurement of human capital. An ideal measure of human
capital, that would include both educational achievement and on-the-job-training, does not exist
and one has to rely on proxies. Fortunately, in this study, the empirical analysis relies only on
relative measures, across provinces, of the stock of human capital. Most of the problems
associated with the imperfect measure of human capital are then overturned. Our indexes of
human capital are based on the census data that measure the percentage of the population who
have at least achieved a given level of education. Even though this approach to evaluate human
capital is widely used by labor economists (Romer, 1993), it is not a perfect measure and some
problems associated with it need to be discussed.
One can argue that the determinant of growth dynamics is the stock of human capital of
the labor force, not of the total population. Since it is practically impossible to account for the
entries and exits in the labor pool, it is much tractable to construct a measure of the educational
achievement of the total population. As discussed by Barro and Lee (1993), it might be8
important to account for the quality of education, not only for the number of years at schooling.
The heterogeneity of educational systems complicates the comparison of educational
achievement indexes across different institutional frameworks. This problem however in not
very important for comparing educational achievement across Canadian provinces since their
educational systems are fairly homogeneous. Moreover, one could argue than in order to build
an exact index of human capital, one should weight appropriately the different levels of

10
education. It is very difficult however to determine which weights to give to different levels of
education. Barro and Lee (1993) argue that one might try to weight each level of education with
its average market return. They acknowledge however that such approach might introduce a bias
since, on the one hand, the level of education is likely to be positively correlated with individual
skills and, on the other hand, market returns of education exclude external benefits generated by
human capital.
Even though everyone concedes that on-the job-training contributes to human capital, it is
very difficult to measure. Efforts spend by employers and employees for training provide
information for investment flows and could not be easily compared with data on educational
achievement. Even though measures of the stock of human capital acquired through on-the job-
training were available, one would have to determine the appropriate weight of formal education
and on-the-job-training in order to combined them in an aggregate measure of the human capital
stock . This appears to be a non-palatable exercise, to say the least. Psacharopoulos and
Arriagada (1986) argue that for the U.S., the number of workers participating in on-the-job-
training activities is almost equal to the number of students in colleges and universities. This
fact, as valuable as it is, does not provide much information on the relative weight of on-the-job-
training in the production process.
When interpreting the results of the empirical part of this study, one should bear in mind
the various difficulties encounter to measure the human capital stock of an economy.
3.2 A Look at the Data and 1-Convergence
The indicators of human capital come from Statistics Canada census data on educational
achievement. We use all the information available on a consistent basis since 1951. Given the
format of the first census questionnaires, it is possible to build an index going back to 1951 for
the ten provinces based on the percentage of the population (15-years and over, 15 to 24-years,
and 25-years and over, for males, females and population of both sexes) who have at least
achieved two alternative benchmark levels of education: Grade 9 and a university degree. The
data are available for the censuses of 1951, 1961 and 1971, and, since, for every five years up to
1996. Such indexes based on the percentage of the population with at least a benchmark level of

The analysis presented in section 3 is robust with respect to alternative educational9
achievement indexes that are available since 1971 only. The main results for the convergence ofhuman capital indicators for alternative age groups and sexes apply to the percentage of thepopulation with at least some post-secondary education since 1971.
11
education might not be very useful for measuring the total stock of human capital in an economy.
However, it is an interesting measure for our empirical analysis that focuses only on relative
levels for a province, with respect to the average of the 10 provinces, of alternative indicators of
human capital. For the case of the population 15-years and over, the trends in human capital
indicators for the 10 provinces are depicted in Figures 1 and 2.
Insert Figures 1-2.
A clear convergence pattern emerges for the visual analysis of the two Figures. On average, the9
provinces which were lagging behind in terms of educational achievement seem to get closer to
the average during the period. The provinces which were initially better endowed tend to come
back to the average. Following Barro and Sala-i-Martin (1995), the concept of 1-convergence, 1
refers here to the standard-deviation of the economic indicators cross-sectional distribution, can
be used to qualify the evolution through time of the dispersion of human capital indicators. 1-
convergence is said to occur if the dispersion of the cross-sectional distribution tends to decrease
through time.
Insert Figure 3.
The dispersion of the two human capital indicators across the provinces, shown in Figure 3,
unambiguously demonstrates a tendency to decrease through time during the entire period.
Regarding the indicators based on university education, the standard-deviation decreases from
45.5% in 1951 to 16.4% in 1996. Since we are using relative indexes, the standard deviation can
be interpreted as a coefficient of variation and, for the actual discussion, numbers are translated
in %. For the indicator based on grade 9, the standard deviation decreases from 17.5% to 4.2%.

ln yt e�tln y0 � (1e�t)ln y�
Detail analysis of census data indicates that the better educated Quebeckers in 1951,10
relative to the other provinces, were the male population, 25-years and over.
12
(2)
The detailed analysis by province reveals some interesting facts. Provinces with higher
per capita income, Ontario, and B-C, have a better educated population. In general, provinces
with lower per-capita income are below average in terms of educational achievement. Nova-
Scotia and Québec are however two notable exceptions regarding the university education
indicator. For Québec, the evolution of the indicators based on grade 9 and university education
behave asymmetrically. Regarding the grade-9 indicator, Québec behaves like the other
relatively poor provinces with, initially, a below average index of human capital. The indicator
gets closer to the provincial average, from 82.7% to 93.8%, between 1951 and 1996. However,
form the point of view of university education, Québec’s indicator starts clearly above the
average, like the rich provinces. So in 1951, Québec was very well endowed in specialized labor
but general or basic education was lacking. Coulombe (1998) suggests that this interesting
phenomenon could be explained by the elitist nature of the educational system in Québec, before
the reforms of the 1960s, and to the large exodus of the Anglophone population in the 1970s, a
population typically well educated. 10
3.3 �-convergence of Human Capital
During the transitory period toward steady-state, Barro and Sala-i-Martin (1995, chap. 2)
demonstrate, from a log-linear approximation in the neighborhood of steady-state, that per-capita
output (in effective units of labor) at time t, y , is a weighted average of its initial level y and itst 0
steady-state level y*:
This is the fundamental dynamic equation for the analysis of �-convergence in the neoclassical
growth framework. The parameter � is the speed of convergence toward steady-state and it is a
function of exogenous variables such as preferences, the depreciation rate, the rate of population
growth, the rate of growth of technological progress, and the share of capital. As shown by

y Bh�
1. .
ln ht e�tln h0 � (1e�t)ln h�
13
(3)
(4)
Barro, Mankiw and Sala-i-Martin (1995), this equation could be used to model the evolution of
per capita output in an open economy model with a broad concept of capital and a constraint on
human capital financing. Under the assumptions of a Cobb-Douglas production function and a
constant and exogenous world interest rate, Barro, Mankiw and Sala-i-Martin (1995)
demonstrate that the production function could be modified in the following form:
B, a constant term, is a function of exogenous variables (independent of the capital/labor ratio)
and h is the human capital/labor ratio (in effective units of labor). Since the production function
exhibits constant returns to scale, .+� is smaller than one and decreasing returns apply to capital
accumulation. The open economy with a credit constraint on human capital behaves like a
closed economy with a broad capital share of �/(1-.). It could be shown that the capital/labor
ratio follows the transitory dynamics imposed by the accumulation of human capital. From
equation (2) and (3), one gets the equation that describes the dynamics evolution of the human
capital/labor ratio:
The human capital/labor ratio at time t, as for output per worker, is a weighted average of its
initial level h and its steady-state value h*. The evolution of the human capital/labor ratio can0
then be described by the same type of equation as the one usually used for estimating the
convergence speed � of per-capita output. Furthermore, the predicted speed of convergence of
human capital (�) is the same as the one predicted for per capita output.
The hypothesis of conditional convergence refers to the case when a cross-section of
economies converges to different steady-state values for y and h . In this case, when estimating* *
�-convergence, additional variables have to be included on the right-hand side of the regression
equation like (5) in order to capture the steady-state determinants that differ across economies.
Variables used for cross-country empirical analysis of conditional convergence are: saving rates,

14
growth rates of the population, and variables capturing heterogeneous social and political
institutional frameworks. Barro (1997) concludes that the hypothesis of conditional convergence
cannot be rejected for a large set of developed and underdeveloped countries. In this study, the
empirical analysis of �-convergence for the Canadian provinces is based on the hypothesis of
absolute convergence. In this case, the speed of convergence is estimated under the assumption
that the different economies converge to identical steady-state values. For the analysis of growth
patterns within regions of the same country, there is good evidence of absolute convergence for
the U.S. States since 1880, for the Japanese Prefectures since 1930, and for the regions of eight
European countries since 1950 (Barro and Sala-i-Martin, 1995, chapter 11). This phenomenon is
interpreted as evidence that, contrary to a cross-section of countries, regions within a country
share important determinants that account for different long-run equilibrium levels of economic
indicators (Aghion and Howitt, 1998, section 1.5.2). In Canada, empirical studies following
different methodologies, conclude that the hypothesis of absolute convergence cannot be rejected
for the ten provinces for alternative indicators of per capita income, output and productivity
(Coulombe and Lee (1993, 1995), Lee and Coulombe (1995), Lefebvre (1994) Coulombe and
Day (1998)).
Equations (2) and (4) could be tested using a cross-section of economies, a time series of
data for an economy, or by pooling time-series and cross-section observations. In this paper, for
estimating the average convergence speed of various indicators across the Canadian provinces,
we use a variant of the Barro and Sala-i-Martin (1991, 1992) cross-section technique proposed by
Coulombe and Lee (1995) and Coulombe and Day (1996) for the purpose of increasing the
degrees of freedom in the study of small samples of economies. The idea is to pool cross-section
(the provinces) and time-series observations during the 1951-1996 period in order to use all the
available information regarding relative regional growth. The 1951-96 sample is divided into
five sub-periods. Given the change in the frequency of census observations, from 10 years to 5
years in 1971, we have to use a mix of ten-year periods and at least one five-year period in order
to cover the entire period of the survey. We chose to divide the sample in four ten-year periods
and one five-year period. As shown in Appendix B, the results are robust to alternative divisions
of sub-periods. With five sub-periods and ten cross-section observations, we have 50 pooled

110
ln (hi, t�P / Ht�P
hi, t / Ht
) ( 1 eM�h
M) ln (
hi, t
Ht
) � ui,
The empirical analysis is robust with respect with the use of the national average, i.e.,11
the weighted provincial average, for calculating ratios in convergence equations. The use of anun-weighted provincial average follows from the well-established custom in convergence studiesto give equal weight to cross-section observations.
15
(5)
time-series and cross-sections observations. The estimated equation for the convergence speed �
of the human capital indicators h is:
where the subscript i denotes the province, H denotes the un-weighted provincial average of the11
human capital indicator and u represents the error term. P, the length of the period, equals 10i
when the date t is set to 1951, 1961, 1971, and 1981 and P equals 5 when t is set to 1991. M is
set to 9, the average length of the sub-period, in the coefficient on the right-hand side, in order to
obtain estimates of � that could be interpreted as annual speed of convergence. Note that the
proposed estimation technique gives the same importance to the information contained in a ten-
year period as that in a five-year period. Following Coulombe and Lee (1995), we exclude the
common trend component by dividing the provincial indexes by the provincial average. Since
both the independent and the dependant variables are measured as deviations from the sample
mean, the constant term in the right hand-side of the equation equals zero. Equation (5) is first
estimated using linear least-squares and then the speed of convergence � is computed from the
value of the estimated coefficient following the non-linear formula specified in equation (5).
Estimation results are presented in Table 1 for 18 indicators of human capital based on the
percentage of the population according to the age group, the sex, and the benchmark level of
education.
Insert Table 1
First, a key finding is that the null hypothesis of no-convergence (� = 0) could be rejected
at the one percent level for all indicators. Thus, indicators of human capital have grown faster

Regarding the Wald test, refer to Greene (1993, section 4.8.3b). 12
16
since 1951 in the provinces that were originally less endowed in human capital. The high t-
statistics for the 18 indicators illustrate the robustness of this result.
Second, it is interesting to note that the estimated speed of convergence varies
considerably for alternative indicators. On theoretical ground, Barro, Mankiw and Sala-i-Martin
(1995) have demonstrated that, in the framework of their open-economy neoclassical growth
model with a credit constraint for the financing of human capital, the speed of convergence of per
capita output and human capital should be in the interval [0,014; 0,035]. Estimated convergence
speeds for the human capital indicators for the population 15 years and over and 25 years and
over are in the neighborhood of the upper bracket of this interval. Convergence speeds are
however much faster for the 15 to 24 years. It is also interesting to note that convergence speeds
are slightly faster for the females than for the males in the 15 to 24 years. We have computed a
Wald statistic to test the null hypothesis � = � where � and � are the convergences speed of1 2, 1 2
two independent samples. For this test, the Wald statistics W is defined as:
W = (� - � ) / (V + V )1 2 1 22
where V and V are the estimated variances of � and � . The Wald statistics are presented in1 2 1 212
Tables 2 and 3.
Insert Tables 2 and 3
The results regarding the comparison of the convergence speeds between the 15-24 years
and the 25 years are intuitively appealing (Table 2). The null hypothesis is rejected at the 5
percent level in all cases. Thus, the convergence speeds of human capital indicators are
significatively faster, from the statistical point of view, for the 15-24 years than for the 25 years
and over. This indicates that, if the total population had behaved like the young people in the 15-
24 years group, estimated convergence speeds for the total adult population might have been two
to three times faster. Based on those findings, one could provide a new interpretation to the
relative slowness of the speed of convergence estimated for alternative samples of regional and
national economies as in Barro and Sala-i-Martin (1995). If investment in human capital is the
driving force of the convergence process, the slowness of the catch-up process could be imputed

110
ln (yi, t�P / Yt�P
yi, t / Yt
) ( 1 eP�y
P) ln (
yi, t
Yt
) �ui
The data for personal income come from CANSIM series D11701-D11710 and those13
for government transfers from various series in Statistics Canada catalogue No. 13-213. Detailsavailable on request.
17
(6)
to the fact that an important portion of the total population does not have a clear incentive to
invest in education. The opportunity cost for investing in education is usually higher for the
population over 25 years of age and the expected return of the investment decreases when people
get older.
Regarding the analysis of Table 3, the null hypothesis of equality of the estimated
convergence speed across sexes cannot be rejected for 5 of the 6 cases. There is one notable
exception however, the convergence speed of females is two times faster for the 15-24 age group
for the percentage of the population with at least grade 9.
3.4 Comparison of convergence speeds of per-capita income and human capital
indicators
We use the same methodology than employed for human capital to estimate the
convergence speed of per-capita income across the Canadian provinces during the 1951-1996
period. Two alternative measures of income are used: Personal income, and personal income
minus government transfers. The following equation was estimated using linear least-squares:13
Y is the provincial average of per-capita income indicator y and � is the convergence speed ofy
income. Five-year periods are used and P is set to 5. Results are presented in Table 4.
Insert Tables 4 and 5
For the two measures of income, the null hypothesis of no-convergence is rejected at the
5 percent level. As first shown by Coulombe and Lee (1995) for the period 1961-1991, the
convergence speed is slower when government transfers are subtracted from income. This was
interpreted by the redistributive effect of the fiscal federalism and the tax-transfers system.

18
As predicted by Barro, Mankiw and Sala-i-Martin’s (1995) framework, convergence
speeds of human capital and per capita income should be equal. The Wald statistics to test for
the equality between the convergence speeds of alternatives indicators of human capital on the
one side, and the convergence speed of the post- and the pre-transfers measures of income on the
other are presented in Table 7.
The null hypothesis is easily rejected for all the convergence speeds estimated for human
capital indicators of the 15-24 years. This result is not surprising since the human capital
indicators of the 15-24 years are certainly bad proxies for the overall level of human capital in a
regional economy. On the other side, for the population 25 years and over, the null hypothesis of
equality between the convergence speeds of income and human capital could not be rejected at
the 5 percent level whatever the sex groups, the benchmark level of education, and the income
measure used. The same finding applies for the population 15 years and over with one notable
exception: The null hypothesis could be rejected at the 5 percent level whatever the sex group
when one considers the human capital indicator based on the population with at least grade 9 on
the one side and per capita income minus transfers on the other side. This result suggests that the
human capital indicator based on the percentage of the population with at least grade 9 might not
be an appropriate proxy for the overall level of human capital in the framework of Barro,
Mankiw and Sala-i-Martin (1995).
4 The Contribution of Human Capital to Regional Growth
The purpose of the exercise is three-fold. First, the analysis of section 3 does not
establish a direct relationship from human capital accumulation to the convergence of income per
capita. The convergence of both human capital and per capita income might be only coincidental
if, initially, the well-endowed provinces in human capital were the ones with per-capita income
below the national average. By testing directly a transformed version of the production function
(3), we are measuring in this section the contribution of the human capital accumulation process
to the relative growth of per capita income in the 1951-1996 period. Second, we are able to
provide an estimation of the elasticity of national income to human capital, i.e., the share of
human capital in national income on steady-state, with a transformation of the estimated

ln(yit
Yt
) (�
1.) ln(
hit
Ht
)
For this calculation, we exclude agriculture incomes for which the relative contribution14
of profits and wages are difficult to separate. The accounting measure varies between 0.33 and0.25 in the period under study. Data come from Statistics Canada catalogue 13-531.
19
(3')
coefficient of human capital in the production function. Third, by comparing the estimation
results for alternative indicators of human capital, we can highlight which one is the best
predictor of relative income growth at the regional level.
Taking the logarithm of equation (3), the per capita income of province i with respect to
the provincial average could be expressed as a function of the ratio of the human capital stock of
province i to the provincial average:
The physical capital share . is measured residually from non-wage income in the national
accounts. This share, which is relatively constant through time, averaged 0.287 between 1951
and 1996. The elasticity of output with respect with human capital � can be estimated by14
equation (3') based only on the relative measure of human capital, an interesting feature again
since most of the criticisms of the measure of human capital do not apply when relative measures
are used. Equation (3') is estimated by pooling time-series and cross-section observations for the
ten provinces and the eight censuses between 1951 and 1996. Here again, the same importance
is given to ten-years and five-years periods. As a measure of the human capital stock, we use 18
alternative indicators based on educational achievement of the two benchmark levels (grade 9
and university degree), for three age groups (15 years and over, 15-24 years, and 25 years and
over), and, for both sexes, males, and females. Estimation results are presented in Table 6 for the
pre- and the post-transfers measure of national income.
Insert Table 6 here
For all indicators of human capital, whatever the subgroup of the population considered,
the t-statistics are very high indicating that the accumulation of human capital at the regional
level has a significant effect of the convergence on the two per-capita income measures since

20
1951. Many interesting findings emerge from the detailed analysis of Table 6. First, comparing
the numbers between the pre- and the post transfers measures (comparing columns 1 to 3, and 2
to 4), one can see that the estimated income-share of human capital is higher for all indicators
when transfers are excluded from national income. This result is not surprising since it indicates
that investment in education increases the potential to earn labor income and decreases the
dependency on income support programs.
Second, the estimated output-share of human capital is very high, in the neighborhood of
one, when the grade-9 benchmark level of education is used as a proxy of human capital. If those
estimates indicate the actual contribution of aggregate human capital investment to output
growth, the sum of the coefficients . and � would be largely superior to one. In this case, the
accumulation of both physical and human capital generates increasing returns. This does not
mean however that increasing public investment in basic education will generate increasing
returns to scale since, nowadays, virtually all Canadians reach at least grade 9. In order to
generate increasing returns to scale, the human-capital/labor ratio has to be increased. A detailed
analysis of census data indicates that since 1991 the standard deviation across the provinces for
the population 15 to 24 years of this indicator of basic skills is extremely low, around 1.5%.
Since this number is still below the standard deviation for the population 15 years and over, 4.2%
in 1996, one should expect, ceteris paribus, further decrease in the dispersion of per capita
income in Canada as the population without grade 9 eventually leaves the labor market as they
get older.
Third, maybe the most important point that comes out of the analysis, is related with the
points estimates of the income elasticity of human capital based on university degree (the last
column). The point estimates of � for the population 15 years and over, and 25 years and over,
for both sexes and male, are around 0.5 with a confidence interval at 95% typically between 0.42
and 0.57. Those estimates coincide with Mankiw’s (1995) estimate of the human capital share
for the US base on the gap between the minimum wage and average wage. Furthermore,
regressions using this indicator of human capital provide the higher R ; between 0.71 and 0.73. 2
Such R are very high given that the regression does not include a constant term or a dependant2
lagged-variable on the right-hand side. Slightly more than 70% of relative per-capita income

21
growth across the Canadian provinces since 1951 could then be explained by the catch up in
human capital stocks as measured by the advance-education indicator. That leaves, at most, 30%
for the other factors combined! This result corroborates Barro and Sala-i-Martin (1995) and
Barro (1997) findings that, at the cross-country level, investment in advanced education is one of
the most important determinants of long-run growth. Overall, the analysis indicates that the best
proxy of human capital for the purpose of regional economic growth in Canada is the indicator
based on university education of both sexes, or the males only, for the population 25 years and
over, or 15 years and over. Point estimates for the female population are smaller.
Finally, if one accepts that the best proxy for the overall human capital stock is the
percentage of the population with at least a university degree, the analysis suggests that regional
economies are facing decreasing returns to the accumulation of broad-capital, as assumed in the
neoclassical growth framework. On theoretical ground, the critical value of � is 0.71 since . is
set at 0.29 from the national accounting share of profits. In an AK model of endogenous growth
(see Aghion and Howitt, 1998, section 1), .+� equals 1 and the accumulation of capital is a
long-run source of growth. If .+� is smaller than 1, the economy is facing decreasing returns to
capital accumulation and convergence should be observed when some economies are lagging
behind in terms of capital accumulation. Since convergence is observed for both the human
capital stock and per capita income, the endogenous growth assumption of .+�=1 should be
rejected for the sake of internal consistency of the results. From the confidence intervals at 95%,
one can see from Table 6 that the endogenous growth assumption is rejected for all indicators of
human capital based on advance education.

22
5 Conclusion
The convergence of per-capita income, output and productivity indicators across the
Canadian provinces in the post-WWII period is now a well-established fact. However, little
empirical analysis has been done before to explain this phenomenon. The explanation matters
because convergence of per capita income is consistent with alternative economic frameworks.
For example, as pointed-out by Aghion and Howitt (1998, chapter 2), the Schumpeterian
approach to endogenous growth, when the model is extended to capture technology transfers, is
consistent with convergence across a set of economies. In order to directly relate the
convergence process to neoclassical growth and decreasing returns, convergence has to be related
to the dynamic accumulation process of capital. The key contribution of this paper is to show
that convergence across the Canadian provinces could be explained by the dynamic accumulation
of human capital as predicted by the open-economy version of the neoclassical growth
framework à la Barro, Mankiw, and Sala-i-Martin (1995). By doing this, this study shed new
light on an old Canadian problem. The study contributes to the understanding of regional
disparities and clearly indicates directions for economic policy that would aim at alleviating the
consequences of the old Canadian problem.
From a quantitative point of view, our findings suggest that the effect of human capital
accumulation is not a minor factor, among others, that could explain the relative evolution of
regional economies in Canada. By itself, the human capital catch-up process, based on the
advance education indicator, explains roughly 70% of the relative evolution of per-capita income
since 1951 across the Canadian provinces.
From this paper, a new story comes out for explaining the slow process of convergence
across the Canadian provinces observed since 1951 despite the well integrated financial
networks, the mobility of physical capital, and the interregional redistribution of resources.
Despite the relative scarcity of physical capital in the poorer regions, capital did not flow to these
regions because the availability of a well-educated population is a necessary requirement for the
productivity of machines. Private markets in Toronto cannot finance the investment in advanced
education by a bright young Newfoundlander because he cannot use human capital as a collateral
on a loan. Since a subset only of the total population, the young, has a clear incentive to invest

23
in education, the catch up process of human capital is slowed-down by the stock effect of the
less-educated older people who remains in the poorer provinces. One of the findings of this
paper is that the convergence speed might have been two to three times faster if all persons had
invested in education at the same rate as the young did.
Outside a restraint circuit, individuals have difficulty finding funds to finance their
investment in education because of a credit constraint. However, within a federal state, the
central government could redistribute resources that could be used to finance investment in
education at the regional level. In Canada, throughout the 1950s, 1960s, and 1970s, with the rise
of the welfare state and the creation of massive interregional redistribution programs, like
equalization payments, unemployment-insurance and the joint-financing of public spending in
education, health, and social assistance, the relatively poor provinces have been able to build a
public infrastructure that could compare, in quality, with the one of the richer provinces.
Coulombe and Day (1998) illustrate that, just after WWII, per capita income disparities across
the Canadian provinces were much larger that the ones then observed across the US border
states. Economic development seems to have spread out more evenly just south of the Canadian
border. Goldin and Katz (1997) relate regional economic growth in the US in the first part of the
century to the phenomenal public investment in secondary education in the Far West, the Great
Plains, and parts of New England between 1910 and 1940. They show that secondary enrolments
were much higher in the US border states at that time than in their Canadian provinces directly to
the north. According to Coulombe and Day (1998), the gap in the dispersion index across the
provinces and across the border states have gradually decreased since the 1950s. One should
note that this catch-up phenomenon coincides with the set-up of the interregional redistribution
scheme in Canada. The analysis in this paper does not provide a direct test of the relationship
between interregional redistribution and regional convergence. However, it provides an
analytical framework that stresses the unidirectional causal relationship between the financing of
education and the catch-up process of human capital and per capita income of underdeveloped
regions.
Migration is an important phenomenon that has to be added in further research to the
analytical framework if one wants to have a more complete picture of the relationship between

Migration has been introduced in recent studies on growth (Braun, 1993 and Barro and15
Sala-i-Martin, 1992). Braun’s (1993) Ph.D. dissertation is analyzed in Barro and Sala-i-Martin(1995, chapter 9). Those models however are not directly applicable to the study of regionalgrowth in Canada following the analytical framework proposed in this paper.
For a recent study, see Cousineau and Vaillancourt (1997).16
The problem of the lost of regional resources from public spending on advanced17
education generated by the brain drain is not new. Lacroix and Proulx (1973) estimated the loss by the poor provinces and gain by the rich ones resulting the mobility of the well educated.
24
human capital and regional growth in Canada. The complete model has to take into15
consideration some important stylized facts regarding interregional migration in Canada. For
example, it is well known in Canadian empirical studies on migration that the younger and better
educated people in the poor provinces tend to migrate to richer provinces. This phenomenon by16
itself can potentially slow-down the convergence process. What this study shows however is that
convergence of a variety of human capital stock indicators has been observed at the regional level
in Canada since 1951 despite the ‘brain drain’.
From an economic policy perspective, our study emphasizes the key roles of public
administration in financing education and redistributing resources at the regional level. If
investment in education is the driving force of regional convergence, governments have a role to
play in promoting regional development since the financing of education is constrained by
institutional factors. At the individual level, the financing of education is often limited to a
person’s family. The government can alleviate this constraint with a variety of programs aimed
at lowering the cost of education and/or lending money directly to students, or by guaranteeing
loans. For local administrations (municipalities, universities, colleges and school boards) the
provincial and the federal governments could redistribute resources on a geographical basis for
the purpose of improving local public infrastructures. Since the young and well educated tend to
migrate from the poor to the rich provinces, the redistributive function of fiscal federalism should
prevent provincial governments in poor provinces from under investing in advanced education
since part of the local benefits of public investment in education is lost from a regional point of
view. In order to achieve this goal, transfers from the federal government to the provinces17
should be related to the amount actually spend in education at the provincial level. But, since

25
1977, with the creation of the Established Programs Financing, this is not the way inter-
government transfers have been designed in Canada. Recent modifications introduced with the
Canadian Health and Social Transfer have done nothing to prevent the provinces from spending
on health or on social security the resources transferred from the Federal government for post-
secondary education. If education is the key to economic growth, education policy should be
designed to provide the appropriate incentives.
References
Aghion, P., and P. Howitt, 1998, Endogenous Growth Theory, MIT Press, Cambridge.
Barro, R., 1997, Determinants of economic Growth: A Cross-Country Empirical Study, MITPress, Cambridge.
Barro, R. and J. W. Lee, 1993, “International Comparisons of Educational Attainment”, Journalof Monetary Economics, 32, p.363-394.
Barro, R. and X. Sala-i-Martin, 1991, “Convergence Across States and Regions”, BrookingsPapers on Economic Activity, 1, p.107-158.
___________________, 1992, “Convergence”, Journal of Political Economy, 100, p.223-251.
___________________, 1995, Economic Growth, McGraw-Hill, New-York.
Barro, R., G. Mankiw and X. Sala-i-Martin, 1995, “Capital Mobility in Neoclassical Models ofGrowth”, American Economic Review, 85, 1, pages 103-115.
Braun, J., 1993, Essays on Economic Growth and Migration”, Ph.D. Dissertation, HarvardUniversity.
Brown, D.M., 1992, “Efficiency, Capital Mobility, and the Economic Union”, In Free to Move:Strengthening the Canadian Economic Union, C.D. Howe Institute, Toronto.
Cohen, D. and J. Sachs, 1986, “Growth and External Debt under Risk of Debt Repudiation”,European Economic Review, 30, 3, juin, p.526-560.

26
Coulombe, S., 1998, “A Perspective on Regional Growth Patterns”, Forthcoming, The C.D.Howe Institute.
Coulombe, S. and K. Day, 1996, “�-convergence, 1-convergence, and the Stationnary-StateLevel of Regional Disparities: the Case of Canada”, cahier de recherche, Universitéd’Ottawa, no.9608E, juillet.
Coulombe, S. and K. Day, 1998, “Economic Growth and Regional Income Disparities in Canadaand the Northen United States”, mimeo, University of Ottawa.
Coulombe, S. and F. Lee, 1993, “Regional Economic Disparities in Canada”, University ofOttawa Research Paper 9317E.
____________________, 1995, “Convergence Across Canadian Provinces, 1961 to 1991",Canadian Journal of Economics, 28, 886-898.
, 1998, “Évolution à long terme de la convergence régionale auCanada”, L’Actualité économique - revue d’analyse économique, 74, 5-27.
Cousineau, J. M. and F. Vaillancourt, 1997, “Regional Disparities, Mobility and labor markets inCanada”, Mimeo, Université de Montréal.
Feldstein, M. and C. Horioka, 1980, “Domestic saving and international capital flows”,Economic Journal, 90, 314-329.
Goldin, C. and L. F. Katz, 1997, “Why the United States Led in Education: Lessons fromSecondary School Expansion, 1910 to 1940,” Working Paper 6144, National Bureau ofEconomic Research, August.
Greene, W. H., 1993, Econometric Analysis, Prentice-Hall, Englewoods Cliffs.
Helliwell, J. F. and A. Chung, 1991, “Are Bigger Countries Better Off?”, in R. Boadway, T.Courchene and D. Purvis, eds., Economic Dimensions of Constitutional Change, JohnDeutsch Institute, Kingston, 345-367.
Helliwell, J., 1994, “Convergence and Migration among Provinces”, PEAP Policy Study, 94-2,Institute for Policy Analysis, University of Toronto.
Lacroix. R. and M. Proulx, 1973, “Une évaluation partielle des pertes et des gains des provincesrésultant de la mobilité des étudiants et diplômés universitaires”, L’ActualitéÉconomique, 59, 379-402.

27
Lee, F. and S. Coulombe, 1995, “Regional Productivity Convergence in Canada”, CanadianJournal of Regional Science, 18, p. 39-56.
Lefebvre, M., 1994, “Les provinces canadiennes et la convergence: une évaluation empirique”,Bank of Canada Research Paper 94-10, November.
Mankiw, G., 1995, “The Growth of Nations”, Brookings Papers on Economic Activity, vol 1,p.275-325.
Mankiw,G., D. Romer and D. Weil, 1992, “A Contribution to the Empiric of Economic Growth”,Quarterly Journal of Economics, 107, p. 407-437.
Psacharopoulos, G. and A. N. Arriagada, 1986, “The Educational Composition of the laborForce: An International Comparaison”, International Labor Review, vol.125, no. 5,septembre-octobre.
Romer, P., 1993, “Idea Gaps and Object Gaps in Economic Development”, Journal of MonetaryEconomics, 32, 543-573.
Tesar, L.L., 1991, “Savings, investment and international capital flows”, Journal of InternationalEconomics, 31, p. 55-78.

The data are from Statistics Canada publication entitled “Provincial Economic18
Accounts”.
The data are from the following publications:19
International Financial Statistics Yearbook, 1994, International Monetary Fund.World Tables, 1995, John Hopkins University Press, published for the World Bank.
28
Appendix A
Correlation between domestic saving and investment of Canadian provinces and countries.
The assumption of perfect capital mobility can be indirectly tested by estimating the correlationbetween domestic saving and investment of the Canadian provinces. If there is perfect capitalmobility we should observe a correlation coefficient equal to 0. We have calculated average ratesof investment and saving as a percentage of GDP for each provinces for the period 1961-1991 aswell as for three sub-periods of ten years . The investment rate is calculated from private18
investment in fix capital and inventories. The saving rate includes private and public saving.Results are presented in table 7.
Table 7: Correlation between domestic saving and investment of Canadian provinces
1961-1991 1961-70 1971-80 1981-91
! = -0.306 ! = -0.508 ! = -0.345 ! = -0.217 (-0.908) (-1.667) (-1.041) (-0.630)
! = correlation coefficientT-statistics are in parenthesis
No correlation coefficient is significantly different from 0 at the 95 % confidence level (thecritical value is 1.81).
We have also estimated the correlation between the average rates of domestic investmentand saving as a percentage of GDP for different sets of countries . Results are presented in table19
8.

29
Table 8: Correlation between domestic savings and investment of countries
# of 1967-93 1967-73 1974-80 1981-87 1988-93countries
World 121 ! = 0.195 ! = 0.512 ! = 0.286 ! = 0.157 ! = 0.020(2.17) (6.51) (3.25) (1.73) (0.22)*
Sub-Saharian 40 ! = -0.054 ! = 0.302 ! = 0.255 ! = -0.101 ! = -0.331Africa (-0.34)* (1.96) (1.62)* (-0.62)* (-2.16)
Southern Asia 5 ! = 0.925 ! = 0.949 ! = 0.912 ! = 0.862 ! = 0.899(4.22) (5.24) (3.86) (2.95) (3.55)
Easthern Asia 12 ! = 0.104 ! = -0.061 ! = -0.081 ! = 0.581 ! = 0.412and Pacific (0.33)* (-0.19)* (-0.26)* (2.26) (1.43)*
Latin America 27 ! = 0.264 ! = 0.820 ! = 0.241 ! = 0.361 ! = 0.495and the (1.37)* (7.16) (1.24)* (1.94) (2.85)
Carrabian
Middle-East 9 ! = 0.160 ! = 0.522 ! = 0.241 ! = 0.150 ! = -0.067and North- (0.43)* (1.62)* (0.66)* (0.40)* (-0.18)*
Africa
Europe and 9 ! = 0.552 ! = 0.387 ! = 0.676 ! = 0.804 ! = 0.557Mediteranean (1.75)* (1.12)* (2.43) (3.58) (1.77)*
Industrialised 19 ! = 0.873 ! = 0.680 ! = 0.654 ! = 0.764 ! = 0.712Countries (7.38) (3.83) (3.56) (4.88) (4.19)
! = correlation coefficientT-statistics are in parenthesis
A * means that the t-statistics is smaller than the critical value which indicates that thecorrelation coefficient is not significantly different from 0.

30
Appendix B
Table 9: Human Capital Convergence Between Canadian Provinces from 1951 to 1996(Robustness analysis; 5 year period for 1971-1976)
Human Capital Indices
Percentage of the Percentage of thePopulation with at Least Population with a
Grade 9 University Degree
15 Both sexes � = 0.036 � = 0.032years (11.44) (6.32)and R = 0.73 R = 0.44over
2 2
Males � = 0.034 � = 0.031(10.55) (8.05)
R = 0.69 R = 0.562 2
Females � = 0.035 � = 0.042(12.24) (5.80)
R = 0.75 R = 0.392 2
15 - 24 Both sexes � = 0.063 � = 0.071years (12.02) (8.23)
R = 0.75 R = 0.572 2
Males � = 0.057 � = 0.074(10.50) (7.38)
R = 0.69 R = 0.522 2
Females � = 0.069 � = 0.095(14.24) (8.27)
R = 0.80 R = 0.572 2
25 Both sexes � = 0.029 � = 0.030years (9.67) (6.19)and R = 0.65 R = 0.43over
2 2
Males � = 0.028 � = 0.028(9.63) (7.17)
R = 0.63 R = 0.502 2
Females � = 0.028 � = 0.037(8.83) (5.32)
R = 0.61 R = 0.352 2

31
Table 10: Human Capital Convergence Between Canadian Provinces from 1951 to 1996(Robustness analysis; 5 year period for 1981-1986)
Human Capital Indices
Percentage of the Percentage of thePopulation with at Least Population with a
Grade 9 University Degree
15 Both sexes � = 0.034 � = 0.027years (11.52) (6.91)and R = 0.73 R = 0.48over
2 2
Males � = 0.033 � = 0.028(10.30) (8.93)
R = 0.68 R = 0.612 2
Females � = 0.033 � = 0.036(12.04) (6.25)
R = 0.75 R = 0.432 2
15 - 24 Both sexes � = 0.061 � = 0.068years (12.04) (9.66)
R = 0.75 R = 0.652 2
Males � = 0.055 � = 0.073(10.32) (8.45)
R = 0.68 R = 0.592 2
Females � = 0.067 � = 0.085(14.55) (9.56)
R = 0.81 R = 0.642 2
25 Both sexes � = 0.028 � = 0.025years (9.29) (6.82)and R = 0.64 R = 0.47over
2 2
Males � = 0.027 � = 0.025(8.77) (7.33)
R = 0.61 R = 0.512 2
Females � = 0.027 � = 0.030(8.63) (5.40)
R = 0.60 R = 0.362 2

For this human capital index, the speed of convergence is estimated for the period 1971-20
1996, as the data are unavailable for 1951 and 1961.
32
Table 1: Human Capital Convergence Between Canadian Provinces from 1951 to 1996
Human Capital Indices
Percentage of the Percentage of the Percentage of thePopulation with at Population with at Least Population with a
Least Grade 9 Some Postsecondary University Degree20
15 Both sexes � = 0.034 � = 0.038 � = 0.028years (11.67) (4.81) (6.83)and R = 0.73 R = 0.32 R = 0.47over
2 2 2
Males � = 0.033 � = 0.033 � = 0.028(10.30) (5.52) (8.95)
R = 0.68 R = 0.38 R = 0.612 2 2
Females � = 0.034 � = 0.040 � = 0.036(12.19) (5.34) (6.09)
R = 0.75 R = 0.37 R = 0.422 2 2
15 - 24 Both sexes � = 0.061 � = 0.042 � = 0.069years (11.83) (2.40) (9.79)
R = 0.74 R = 0.11 R = 0.652 2 2
Males � = 0.055 � = 0.033 � = 0.078(10.04) (2.23) (7.90)
R = 0.67 R = 0.09 R = 0.552 2 2
Females � = 0.067 � = 0.067 � = 0.085(14.46) (3.22) (10.49)
R = 0.81 R = 0.17 R = 0.682 2 2
25 Both sexes � = 0.027 � = 0.040 � = 0.025years (9.37) (6.49) (6.60)and R = 0.64 R = 0.46 R = 0.46over
2 2 2
Males � = 0.027 � = 0.041 � = 0.025(8.90) (6.97) (7.39)
R = 0.61 R = 0.49 R = 0.512 2 2
Females � = 0.027 � = 0.040 � = 0.030(8.61) (6.84) (5.25)
R = 0.60 R = 0.49 R = 0.352 2 2
T-ratios are in parenthesis below each estimated speed of convergence.

33
Table 2: Wald Statistics for the Comparison of the Speed of Convergence of the 15-24 yearsand 25 years and over
Human Capital Indices
Percentage of the Population Percentage of the Populationwith at Least Grade 9 with a University Degree
Both sexes W = 50.79 W = 50.16
Males W = 30.41 W = 47.28
Females W = 79.64 W = 52.62
Table 3: Wald Statistics for the Comparison of the Speed of Convergence of Males andFemales
Human Capital Indices
Percentage of the Population Percentage of the Populationwith at Least Grade 9 with a University Degree
15 years and over W = 0.07 W = 1.95
15-24 years W = 4.68 W = 0.59
25 years and over W = 0.004 W = 0.74
The Wald statistics have a Chi-Squared distribution with one degree of freedom. The criticalvalue at a confidence level of 95% is 3.84.

34
Table 4: Convergence of Income Between Canadian Provinces from 1951 to 1996
Personal Income per Person Personal Income per Person MinusGovernment Transfers to Persons
� = 0.037 � = 0.021(5.64) (4.50)
R = 0.26 R = 0.182 2
T-ratios are in parenthesis below each estimated speed of convergence.
Table 5: Wald Statistics for the Comparison Between the Speed of Convergence of HumanCapital and Income
Measure of Income and Human Capital Indices
Personal Income per Person Personal Income per Person MinusGovernment Transfers to Persons
Percentage of the Percentage of the Percentage of the Percentage of thePopulation with Population with Population with Population withat Least Grade 9 a University at Least Grade 9 a University
Degree Degree
15 years Both sexes W = 0.23 W = 1.84 W = 4.91 W = 1.16and over
Males W = 0.40 W = 2.09 W = 3.98 W = 1.33
Females W = 0.23 W = 0.01 W = 4.98 W = 4.21
15 - 24 Both sexes W = 12.66 W = 18.11 W = 36.57 W = 42.04years
Males W = 6.78 W = 21.04 W = 24.95 W = 41.53
Females W = 21.51 W = 37.10 W = 52.99 W = 68.05
25 years Both sexes W = 2.67 W = 3.41 W = 1.00 W = 0.38and over
Males W = 2.63 W = 3.63 W = 0.99 W = 0.41
Females W = 2.59 W = 0.86 W = 0.97 W = 1.49
The Wald statistics have a Chi-Squared distribution with one degree of freedom. The criticalvalue at a confidence level of 95% is 3.84.

35
Table 6: Share of Human Capital in National Income (1951-1996)
Measure of Income and Human Capital Indices
Personal Income per Person Personal Income per Person MinusGovernment Tranfers to Persons
Percentage of the Percentage of the Percentage of the Percentage of thePopulation with Population with Population with Population with at Least Grade 9 University at Least Grade 9 University Degree
Degree
15 years Both sexes � = 0.98 � = 0.39 � = 1.19 � = 0.49and over (9.18) (13.37) (8.85) (13.87)
R = 0.51 R = 0.69 R = 0.49 R = 0.712
[0.77, 1.19] [0.34, 0.45] [0.92, 1.46] [0.42, 0.56]
2 2 2
Males � = 1.02 � = 0.40 � = 1.24 � = 0.50(13.73) (13.50) (13.00) (14.23)
R = 0.70 R = 0.70 R = 0.68 R = 0.722
[0.87, 1.16] [0.34, 0.46] [1.05, 1.43] [0.43, 0.57]
2 2 2
Females � = 0.76 � = 0.34 � = 0.92 � = 0.42(5.73) (11.78) (5.56) (11.77)
R = 0.29 R = 0.63 R = 0.27 R = 0.632
[0.50, 1.02] [0.28, 0.40] [0.59, 1.25] [0.35, 0.49]
2 2 2
15 - 24 Both sexes � = 1.19 � = 0.24 � = 1.40 � = 0.29years (9.70) (6.43) (8.79) (6.16)
R = 0.54 R = 0.34 R = 0.49 R = 0.322
[0.94, 1.43] [0.16, 0.31] [1.08, 1.72] [0.19, 0.38]
2 2 2
Males � = 1.16 � = 0.25 � = 1.38 � = 0.31(12.96) (5.92) (11.45) (5.96)
R = 0.68 R = 0.30 R = 0.62 R = 0.302
[0.99, 1.35] [0.17, 0.33] [1.14, 1.62] [0.21, 0.42]
2 2 2
Females � = 1.04 � = 0.19 � = 1.22 � = 0.23(6.68) (4.63) (6.12) (4.51)
R = 0.36 R = 0.21 R = 0.31 R = 0.192
[0.74, 1.36] [0.11, 0.27] [0.83, 1.62] [0.13, 0.32]
2 2 2
25 years Both sexes � = 0.77 � = 0.41 � = 0.95 � = 0.51and over (8.29) (14.26) (8.17) (14.91)
R = 0.46 R = 0.72 R = 0.45 R = 0.732
[0.59, 0.95] [0.35, 0.47] [0.72, 1.17] [0.45, 0.58]
2 2 2
Males � = 0.84 � = 0.41 � = 1.02 � = 0.51(12.37) (13.58) (12.05) (14.38)
R = 0.66 R = 0.70 R = 0.64 R = 0.722
[0.70, 0.97] [0.35, 0.46] [0.86, 1.19] [0.44, 0.58]
2 2 2
Females � = 0.59 � = 0.35 � = 0.72 � = 0.44(5.31) (12.60) (5.26) (12.86)
R = 0.26 R = 0.66 R = 0.25 R = 0.672
[0.37, 0.81] [0.30, 0.41] [0.45, 0.99] [0.37, 0.51]
2 2 2
T-ratios are in parenthesis below each estimated share of human capital.In brackets is the 95% confidence interval for the share of human capital.

The data for 1951 to 1991 are from a Statistics Canada publication entitled the nation, catalogue number 93- 21
328. The published data for 1996 were organized under a different division of levels of schooling. The consistentdata for 1996 were constructed at our request by Statistics Canada. For the percentage of the population with somepost-secondary education, the data are unavailable for 1951 and 1961.
Appendix CHuman Capital Indices21
15 Years and Over
Percentage of the population 15 years and over with at least grade 9
Year NFLD PEI NS NB Qué Ont Man Sask Alb BC Average
1951 31.4 46.8 51.4 39.7 38.8 53.1 48.9 44.3 54 61 46.9
1961 44.9 54.5 59.5 46.6 47.9 58.6 59.2 53.6 62.9 68.3 55.6
1971 55.6 63.1 68.4 58.8 59.2 71.9 67.9 64.3 76.2 77.2 66.3
1976 63.1 70.7 75.2 66.5 67.6 77.8 73.7 70.9 80.4 82.7 72.9
1981 69.2 75.9 79.1 71.4 72.9 81.9 77.7 76.5 86.8 86.3 77.8
1986 73 80 82.4 75.6 75.7 84.9 81.5 80.4 88.9 88.3 81.1
1991 79.2 84.3 86.4 80 79.3 88.1 84.9 83.7 90.9 90.9 84.8
1996 82.1 86.3 88.5 83 81.5 89.6 87 86.4 92.1 92.3 86.9
Percentage of men 15 years and over with at least grade 9
Year NFLD PEI NS NB Qué Ont Man Sask Alb BC Average
1951 27.3 39 44.8 32.9 36.8 49.4 44.8 39.3 49 55.8 41.9
1961 41.3 45.8 53.7 40.8 46.8 55.9 56.2 49.1 59 65 51.4
1971 53 55.7 64.1 54.5 60 71.2 66.2 60.9 74 75.6 63.5
1976 60.9 64.1 71.9 63.2 68.5 77.5 72.5 68.1 81 81.9 71
1981 67.1 70.1 76 68.5 74 82 76.9 74.5 86.2 85.9 76.1
1986 71.2 75.2 80 73.4 76.9 85.2 80.9 78.8 88.4 88.1 79.8
1991 77.6 80.3 84.2 77.8 80.2 88.3 84.6 82.2 90.5 90.8 83.7
1996 80.7 82.9 86.6 81.2 82.2 90 86.7 85.2 91.9 92.4 86
Percentage of women 15 years and over with at least grade 9
Year NFLD PEI NS NB Qué Ont Man Sask Alb BC Average
1951 35.6 55 58 46.5 40.6 56.8 53 49.9 59.8 66.4 52.2
1961 48.8 63.7 65.7 52.5 48.9 61.2 62.3 58.6 67.1 71.9 60.1
1971 58.2 70.7 72.8 62.8 58.3 72.5 69.6 67.9 78.4 78.8 69
1976 65.4 77.2 78.3 69.7 66.5 78 74.8 73.9 83.8 83.6 75.1
1981 71.3 81.6 82 74.2 71.6 81.7 78.5 78.5 87.3 86.7 79.3
1986 75 84.4 84.9 77.8 74.5 84.8 82 82.1 89.3 88.5 82.3
1991 80.8 88.1 88.3 81.9 78.5 87.9 85.1 85.2 91.3 91.1 85.8
1996 83.5 89.7 90.3 84.8 80.9 89.2 87.3 87.6 92.4 92.2 87.8
Percentage of the population 15 years and over with at least some post-secondary education
Year NFLD PEI NS NB Qué Ont Man Sask Alb BC Average
1971 14.3 19.9 20.9 18.9 20.5 22.6 21.3 19.4 25.8 24.6 20.8
1976 23.9 29.9 30 25.7 29.1 30.9 29.3 26.8 33.4 34.4 29.3
1981 28.4 34.1 34.4 29.6 32.9 36.4 33.5 32.8 41.5 40.4 34.4
1986 31.7 38.8 39 33.7 36.4 40.8 37.4 37.1 45.5 44.5 38.5
1991 36.7 41.6 43.1 37.3 38.3 44.7 40.4 40.1 48.1 48.6 41.9
1996 41.8 44.6 47.2 41.7 42.5 48.9 44.1 43.2 51.3 52.5 45.8

Percentage of men 15 years and over with at least some post-secondary education
Year NFLD PEI NS NB Qué Ont Man Sask Alb BC Average
1971 14.9 17.6 20 17.9 23.2 24.2 22 17.4 26.3 25.9 20.9
1976 24.9 26.5 29.6 25.3 31.7 32.8 30 24.9 36.8 36.4 29.9
1981 29.3 31.5 33.9 29.7 35.9 38.1 33.7 31.2 43.3 42 34.9
1986 32.9 35.7 39.3 33.8 39.1 42.4 37.8 35.8 47.1 46.1 39
1991 36.6 37.1 42.7 36.4 39.9 45.6 40 37.7 48.9 49.4 41.4
1996 41.6 40 46.5 40.1 43.4 49.4 43 40.2 51.5 52.5 44.8
Percentage of women 15 years and over with at least some post-secondary education
Year NFLD PEI NS NB Qué Ont Man Sask Alb BC Average
1971 13.7 22.3 22 19.7 17.8 21 20.5 21.6 25.1 23.3 20.7
1976 22.8 33.3 30.4 26 26.4 29.1 28.6 28.8 33.9 32.5 29.2
1981 27.5 36.6 34.8 29.5 29.9 34.7 33.3 34.5 39.5 38.8 33.9
1986 30.7 41.7 38.9 33.6 33.8 39.3 37 38.4 43.8 42.9 38
1991 36.9 45.8 43.4 38 36.8 43.8 40.7 42.5 47.3 48 42.3
1996 42 49 47.9 43.1 41.6 48.4 45.2 46 51.2 52.5 46.7
Percentage of the population 15 years and over with a university degree
Year NFLD PEI NS NB Qué Ont Man Sask Alb BC Average
1951 0.5 0.8 1.3 0.9 1.9 2.6 1.3 1 1.3 2.2 1.4
1961 0.8 1.5 2.3 1.8 2.9 3.4 2.6 2 3 3.2 2.4
1971 2.1 3.2 4.1 3.4 4.6 5.3 4.6 3.5 5.5 5 4.1
1976 3.7 5.1 6 4.8 5.5 7.4 6.4 4.8 7.5 6.7 5.8
1981 4.7 6.1 7.4 6 7.1 9 7.4 6.1 9.6 8.2 7.2
1986 5.6 7.4 8.7 7.3 8.6 10.8 8.9 7.4 10.8 9.5 8.5
1991 6.6 8.5 10.4 8.4 10.3 13 10.2 8.6 11.9 11.2 9.9
1996 8.1 10.6 12.2 10.2 12.2 14.9 11.6 9.8 13.3 13.6 11.7
Percentage of men 15 years and over with a university degree
Year NFLD PEI NS NB Qué Ont Man Sask Alb BC Average
1951 0.6 1.3 1.8 1.4 3 3.6 1.9 1.4 1.9 2.9 2
1961 1.3 2.3 3.1 2.7 4.2 4.8 3.6 2.8 4.1 4.4 3.3
1971 3 4.3 5.4 4.6 6.6 7.3 6.2 4.8 7.2 6.6 5.6
1976 4.6 6.5 7.4 6 7.6 9.7 8.3 6.3 9.4 8.7 7.5
1981 5.7 7.3 8.7 7.1 9.1 11.1 8.9 7.6 11.3 10.1 8.7
1986 6.4 8.4 9.7 8.2 10.5 12.7 10.3 8.5 12.3 11.3 9.8
1991 7.2 9.1 11.1 9 12 14.6 11.1 9.5 13.2 12.9 11
1996 8.4 10.5 12.7 10.4 13.4 16.2 12.3 10.2 14.2 14.8 12.3
Percentage of women 15 years and over with a university degree
Year NFLD PEI NS NB Qué Ont Man Sask Alb BC Average
1951 0.3 0.3 0.7 0.4 0.7 1.6 0.6 0.5 0.7 1.4 0.7
1961 0.4 0.7 1.6 1 1.6 1.9 1.6 1.2 1.8 2.1 1.4
1971 1.2 2.1 2.9 2.1 2.7 3.3 3 2.2 3.7 3.3 2.7
1976 2.7 3.8 4.6 3.6 3.4 5.2 4.6 3.3 5.5 4.8 4.2
1981 3.6 4.8 6.1 5 5.1 7 6 4.7 7.7 6.3 5.6
1986 4.9 6.4 7.8 6.4 6.8 9 7.6 6.4 9.2 7.7 7.2
1991 6.1 7.9 9.7 7.8 8.7 11.4 9.3 7.8 10.6 9.7 8.9
1996 7.9 10.8 11.8 10 11.1 13.8 11 9.6 12.4 12.5 11.1

15-24 Years
Percentage of the population 15-24 years with at least grade 9
Year NFLD PEI NS NB Qué Ont Man Sask Alb BC Average
1951 42.5 56.2 59.4 49.3 43.5 68 63.3 62.4 69.7 75.9 59
1961 65.7 69.6 70.5 63.6 62.4 78.7 77.6 77.4 80.9 85.4 73.2
1971 72.6 78.1 80.7 77.8 84.5 90.9 87.9 88.4 92.7 92.1 84.6
1976 79.8 84.7 87.4 85.5 92.3 95 91.3 91.8 95.6 95.3 89.9
1981 82.9 89.2 89.3 88.8 94.1 96.5 92.3 92.5 95.8 96.1 91.8
1986 86.8 92.8 90.7 91.5 94 97.3 93.8 93.3 96 96.8 93.3
1991 94.3 95.6 94.2 94.7 93.9 97.9 95.2 94.5 96.6 97.8 95.5
1996 97.3 97.6 96.2 97 93.4 98.4 96.2 96.2 97.4 98.2 96.8
Percentage of men 15-24 years with at least grade 9
Year NFLD PEI NS NB Qué Ont Man Sask Alb BC Average
1951 37.1 47.2 52.9 42.4 42 63.2 58.2 55.7 63.9 71.5 53.4
1961 61.8 60.6 65.3 57.2 60.2 75.8 74.3 72.4 77.1 83 68.8
1971 70.2 71.8 77.8 74.4 83.8 90.5 86.8 86.3 91.5 91.1 82.4
1976 77.4 79.9 85 82.5 91.7 94.8 90.3 89.9 94.8 94.6 88.1
1981 79.5 85.1 86.9 85.7 93.4 96.2 91.1 91.2 95.3 95.4 90
1986 84.1 89.5 88.6 89.3 93 97.1 93 92.2 95.5 96.2 91.9
1991 93 93.9 92.7 93.2 92.7 97.8 94.9 94.3 96.3 97.4 94.6
1996 96.6 96.8 95.1 96.2 91.9 98.3 95.7 95.8 97.2 98 96.2
Percentage of women 15-24 years with at least grade 9
Year NFLD PEI NS NB Qué Ont Man Sask Alb BC Average
1951 48.1 65.5 65.8 55.7 45 72.8 68.3 69 75.7 80.4 64.6
1961 69.7 79.3 76 70.3 64.5 81.6 80.9 82.7 84.7 88.1 77.8
1971 75 84.7 83.6 81.4 85.3 91.3 89.1 90.5 93.8 93 86.8
1976 82.5 89.8 89.9 88.6 92.9 95.4 92.4 93.7 96.3 95.9 91.7
1981 86.4 93.3 91.7 91.8 94.8 96.8 93.4 93.8 96.6 96.8 93.5
1986 89.5 96 93 93.6 95 97.6 94.6 94.3 96.6 97.4 94.8
1991 95.7 97.5 95.6 96.1 95.2 98.1 95.6 95 97 98.1 96.4
1996 98 98.4 97.3 97.8 94.9 98.4 96.7 96.5 97.7 98.3 97.4
Percentage of the population 15-24 years with at least some post-secondary education
Year NFLD PEI NS NB Qué Ont Man Sask Alb BC Average
1971 18.8 23.9 23.5 20 24.5 22.4 23.7 22.8 25.7 23.3 22.9
1976 27.1 29.5 29.7 22.3 32.6 26.9 27 26.1 29.9 26.5 27.8
1981 28.4 29.2 30.1 22.8 34.3 28.7 26.5 26.8 31.5 29.6 28.8
1986 29.1 34.8 34.8 28.8 39.6 33.9 31 32 33.9 33.9 33.2
1991 33.8 35.9 37.1 33.4 41.3 35.8 32.1 33.2 35.5 37.6 35.6
1996 38.8 37.6 39.5 37.8 45 37.7 33.8 33.5 36.3 39 37.9
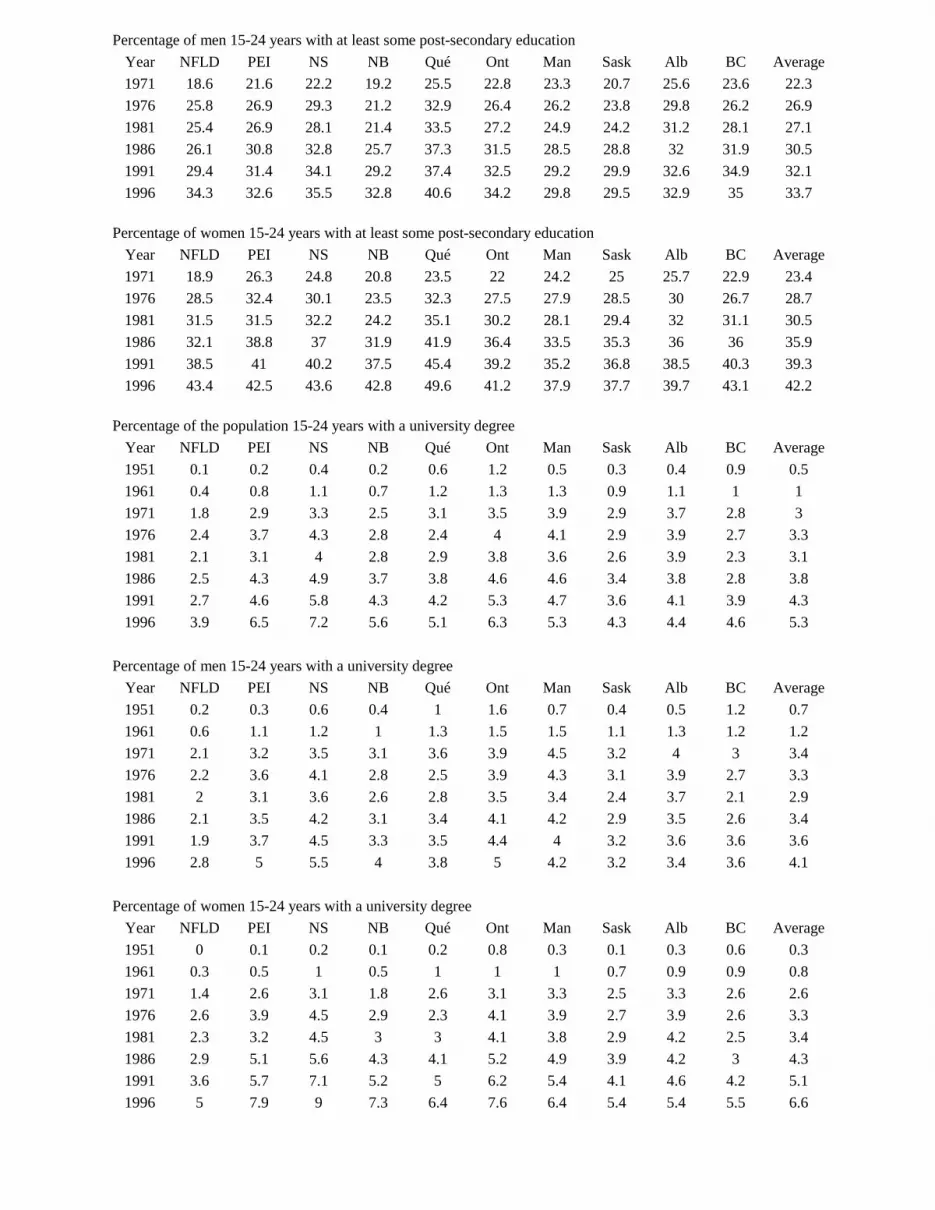
Percentage of men 15-24 years with at least some post-secondary education
Year NFLD PEI NS NB Qué Ont Man Sask Alb BC Average
1971 18.6 21.6 22.2 19.2 25.5 22.8 23.3 20.7 25.6 23.6 22.3
1976 25.8 26.9 29.3 21.2 32.9 26.4 26.2 23.8 29.8 26.2 26.9
1981 25.4 26.9 28.1 21.4 33.5 27.2 24.9 24.2 31.2 28.1 27.1
1986 26.1 30.8 32.8 25.7 37.3 31.5 28.5 28.8 32 31.9 30.5
1991 29.4 31.4 34.1 29.2 37.4 32.5 29.2 29.9 32.6 34.9 32.1
1996 34.3 32.6 35.5 32.8 40.6 34.2 29.8 29.5 32.9 35 33.7
Percentage of women 15-24 years with at least some post-secondary education
Year NFLD PEI NS NB Qué Ont Man Sask Alb BC Average
1971 18.9 26.3 24.8 20.8 23.5 22 24.2 25 25.7 22.9 23.4
1976 28.5 32.4 30.1 23.5 32.3 27.5 27.9 28.5 30 26.7 28.7
1981 31.5 31.5 32.2 24.2 35.1 30.2 28.1 29.4 32 31.1 30.5
1986 32.1 38.8 37 31.9 41.9 36.4 33.5 35.3 36 36 35.9
1991 38.5 41 40.2 37.5 45.4 39.2 35.2 36.8 38.5 40.3 39.3
1996 43.4 42.5 43.6 42.8 49.6 41.2 37.9 37.7 39.7 43.1 42.2
Percentage of the population 15-24 years with a university degree
Year NFLD PEI NS NB Qué Ont Man Sask Alb BC Average
1951 0.1 0.2 0.4 0.2 0.6 1.2 0.5 0.3 0.4 0.9 0.5
1961 0.4 0.8 1.1 0.7 1.2 1.3 1.3 0.9 1.1 1 1
1971 1.8 2.9 3.3 2.5 3.1 3.5 3.9 2.9 3.7 2.8 3
1976 2.4 3.7 4.3 2.8 2.4 4 4.1 2.9 3.9 2.7 3.3
1981 2.1 3.1 4 2.8 2.9 3.8 3.6 2.6 3.9 2.3 3.1
1986 2.5 4.3 4.9 3.7 3.8 4.6 4.6 3.4 3.8 2.8 3.8
1991 2.7 4.6 5.8 4.3 4.2 5.3 4.7 3.6 4.1 3.9 4.3
1996 3.9 6.5 7.2 5.6 5.1 6.3 5.3 4.3 4.4 4.6 5.3
Percentage of men 15-24 years with a university degree
Year NFLD PEI NS NB Qué Ont Man Sask Alb BC Average
1951 0.2 0.3 0.6 0.4 1 1.6 0.7 0.4 0.5 1.2 0.7
1961 0.6 1.1 1.2 1 1.3 1.5 1.5 1.1 1.3 1.2 1.2
1971 2.1 3.2 3.5 3.1 3.6 3.9 4.5 3.2 4 3 3.4
1976 2.2 3.6 4.1 2.8 2.5 3.9 4.3 3.1 3.9 2.7 3.3
1981 2 3.1 3.6 2.6 2.8 3.5 3.4 2.4 3.7 2.1 2.9
1986 2.1 3.5 4.2 3.1 3.4 4.1 4.2 2.9 3.5 2.6 3.4
1991 1.9 3.7 4.5 3.3 3.5 4.4 4 3.2 3.6 3.6 3.6
1996 2.8 5 5.5 4 3.8 5 4.2 3.2 3.4 3.6 4.1
Percentage of women 15-24 years with a university degree
Year NFLD PEI NS NB Qué Ont Man Sask Alb BC Average
1951 0 0.1 0.2 0.1 0.2 0.8 0.3 0.1 0.3 0.6 0.3
1961 0.3 0.5 1 0.5 1 1 1 0.7 0.9 0.9 0.8
1971 1.4 2.6 3.1 1.8 2.6 3.1 3.3 2.5 3.3 2.6 2.6
1976 2.6 3.9 4.5 2.9 2.3 4.1 3.9 2.7 3.9 2.6 3.3
1981 2.3 3.2 4.5 3 3 4.1 3.8 2.9 4.2 2.5 3.4
1986 2.9 5.1 5.6 4.3 4.1 5.2 4.9 3.9 4.2 3 4.3
1991 3.6 5.7 7.1 5.2 5 6.2 5.4 4.1 4.6 4.2 5.1
1996 5 7.9 9 7.3 6.4 7.6 6.4 5.4 5.4 5.5 6.6

25 Years and Over
Percentage of the population 25 years and over with at least grade 9
Year NFLD PEI NS NB Qué Ont Man Sask Alb BC Average
1951 27.4 44.1 49 36.7 37.2 49.4 45.1 39 49.4 57.8 43.5
1961 36.9 50.1 56.2 41.1 43.1 53.8 54.4 47.2 57.9 64.4 50.5
1971 47.7 57.3 63.9 50.9 49.4 65.3 60.8 56.2 69.9 72.4 59.4
1976 55.6 65.4 70.6 58.8 58.2 71.9 67.5 63.4 77.1 78.7 66.7
1981 63.7 71.3 75.6 65.2 65.6 77.2 73.1 71 83.1 83.4 72.9
1986 68.3 76 80 70.9 70.9 81.7 78.2 76.8 86.7 86.2 77.6
1991 74.6 81.5 84.5 76.3 76.3 85.8 82.4 81.3 89.4 89.6 82.2
1996 78.3 83.7 86.9 80 79.2 87.8 85 84.1 91 91.1 84.7
Percentage of men 25 years and over with at least grade 9
Year NFLD PEI NS NB Qué Ont Man Sask Alb BC Average
1951 24 36.7 42.6 30 35.1 46 41.3 34.8 44.8 52.7 38.8
1961 33.6 41.3 49.9 35.3 42.4 51.1 51.4 43 54.2 60.9 46.3
1971 45.1 49.3 58.7 46.1 50.5 64.4 58.8 52.2 67.5 70.3 56.3
1976 53.6 58 66.9 55.3 59.5 71.5 66.2 59.9 75.5 77.7 64.4
1981 62.2 64.7 72.2 62.3 67.3 77.4 72.1 68.8 82.7 82.9 71.3
1986 66.4 70.7 77.2 68.5 72.6 82 77.5 74.7 86.4 85.9 76.2
1991 72.7 76.7 82.2 73.8 77.4 86 82.1 79.3 89.1 89.4 80.9
1996 76.5 79.5 84.7 77.7 80.2 88.2 84.7 82.6 90.7 91.2 83.6
Percentage of women 25 years and over with at least grade 9
Year NFLD PEI NS NB Qué Ont Man Sask Alb BC Average
1951 31.1 51.9 55.7 43.4 39.2 52.9 48.9 43.9 54.8 63.3 48.5
1961 40.5 59.1 62.5 46.8 43.8 56.4 57.5 51.8 61.9 68.1 54.8
1971 50.2 65.4 69.1 55.5 48.2 66.2 62.8 60.3 72.5 74.2 62.4
1976 57.6 72.7 74.3 62.3 57 72.3 68.8 66.9 78.8 79.7 69
1981 65.1 77.7 78.9 67.9 64.1 77.1 73.9 73.3 83.7 83.8 74.6
1986 70 81.1 82.6 73.3 69.3 81.4 78.8 78.7 87.2 86.5 78.9
1991 76.4 86 86.8 78.6 75.3 85.8 82.8 83.1 89.9 89.7 83.4
1996 80 87.7 89 82 78.2 87.5 85.4 85.6 91.2 91 85.8
Percentage of the population 25 years and over with at least some post-secondary education
Year NFLD PEI NS NB Qué Ont Man Sask Alb BC Average
1971 12.3 18.3 20 18.4 18.9 22.6 20.4 18.4 25.7 25.1 20
1976 22.5 30 30.1 27 27.7 32.2 30.1 27.1 37.6 37.1 30.1
1981 28.4 35.8 35.8 32.1 32.4 38.7 35.8 34.9 45.4 43.6 36.3
1986 32.8 39.9 40.3 35.1 35.5 42.7 39.3 38.6 48.8 47 40
1991 37.6 42.9 44.5 38.2 37.7 46.5 42.3 41.7 51 50.9 43.3
1996 42.6 46.2 48.8 42.5 42 51.1 46.4 45.4 54.7 55.1 47.5

Percentage of men 25 years and over with at least some post-secondary education
Year NFLD PEI NS NB Qué Ont Man Sask Alb BC Average
1971 13.2 15.9 19.1 17.4 22.2 24.6 21.6 16.3 26.6 26.6 20.4
1976 24.6 26.2 29.7 27.1 31.3 35 31.5 25.3 39.7 39.9 31
1981 30.9 33.1 36 33 36.9 41.7 36.7 33.7 48.3 46.2 37.7
1986 35.3 37.2 41.2 36.3 39.7 45.6 40.5 37.7 51.7 49.5 41.5
1991 38.8 38.7 44.9 38.2 40.4 48.5 42.7 39.5 52.8 52.4 43.7
1996 43.6 41.7 48.9 41.8 44 52.6 46 42.9 55.7 56.1 47.3
Percentage of women 25 years and over with at least some post-secondary education
Year NFLD PEI NS NB Qué Ont Man Sask Alb BC Average
1971 11.2 20.8 21.1 19.4 15.6 20.6 19.2 20.5 24.9 23.4 19.7
1976 20.2 33.7 30.6 27 24.3 29.6 28.8 29 35.5 34.4 29.3
1981 25.8 38.4 35.7 31.2 28.2 36 34.9 36.2 42.5 41.1 35
1986 30.2 42.5 39.4 34.1 31.7 39.9 38 39.3 46.1 44.6 38.6
1991 36.4 46.9 44.2 38.2 35.2 44.8 42 43.8 49.3 49.4 43
1996 41.7 50.4 48.8 43.2 40.1 49.8 46.7 47.8 53.7 54.2 47.6
Percentage of the population 25 years and over with a university degree
Year NFLD PEI NS NB Qué Ont Man Sask Alb BC Average
1951 0.6 1 1.5 1.1 2.3 3 1.5 1.2 1.6 2.4 1.6
1961 1 1.7 2.7 2.2 3.4 3.9 3 2.3 3.5 3.7 2.7
1971 2.3 3.3 4.4 3.8 5.2 5.9 4.8 3.8 6.1 5.7 4.5
1976 4.3 5.6 6.6 5.6 6.6 8.5 7.2 5.5 9 8.1 6.7
1981 5.7 7.1 8.5 7.2 8.5 10.6 8.7 7.3 11.8 9.9 8.5
1986 6.8 8.3 9.8 8.3 9.8 12.5 10.2 8.6 12.8 11.1 9.8
1991 7.8 9.4 11.5 9.4 11.5 14.6 11.5 9.8 13.7 12.7 11.2
1996 9.2 11.6 13.3 11.2 13.6 16.7 13 11.1 15.3 15.4 13
Percentage of men 25 years and over with a university degree
Year NFLD PEI NS NB Qué Ont Man Sask Alb BC Average
1951 0.8 1.6 2.2 1.7 3.7 4.2 2.1 1.7 2.3 3.3 2.4
1961 1.5 2.6 3.6 3.2 5.2 5.6 4.1 3.2 4.9 5.1 3.9
1971 3.4 4.7 6.1 5.3 7.7 8.4 6.9 5.4 8.4 7.8 6.4
1976 5.7 7.5 8.7 7.4 9.6 11.7 9.8 7.5 11.7 10.7 9
1981 7.3 8.8 10.5 8.9 11.4 13.6 10.8 9.4 14.4 12.5 10.8
1986 7.9 10 11.3 9.8 12.5 15.2 12.1 10.1 15 13.4 11.7
1991 8.8 10.6 12.8 10.4 13.8 16.9 12.9 11 15.5 14.8 12.8
1996 9.9 11.9 14.3 11.9 15.4 18.5 14.2 11.8 16.6 17 14.1
Percentage of women 25 years and over with a university degree
Year NFLD PEI NS NB Qué Ont Man Sask Alb BC Average
1951 0.4 0.4 0.9 0.5 0.9 1.8 0.8 0.6 0.8 1.6 0.9
1961 0.5 0.7 1.7 1.1 1.8 2.2 1.8 1.3 2 2.3 1.5
1971 1.1 1.9 2.9 2.3 2.7 3.4 2.9 2.1 3.8 3.5 2.7
1976 2.7 3.8 4.7 3.9 3.8 5.5 4.8 3.6 6.2 5.5 4.5
1981 4.1 5.4 6.7 5.6 5.7 7.8 6.6 5.3 9.1 7.5 6.4
1986 5.6 6.7 8.4 7 7.4 9.9 8.4 7.1 10.7 8.8 8
1991 6.8 8.4 10.3 8.4 9.4 12.5 10.2 8.6 12 10.7 9.7
1996 8.6 11.4 12.4 10.5 12 14.9 11.9 10.5 13.9 13.8 12

0.2
0.4
0.6
0.8
1
1.2
1.4
1.6
1.8
2
1950 1960 1970 1980 1990 2000
NF P.E.I. N.S. N.B. QUE
ONT MAN SASK ALB B.C.
Figure 2: Relative Level of Human
Capital - University degree
0.6
0.7
0.8
0.9
1
1.1
1.2
1.3
1950 1960 1970 1980 1990 2000
NF P.E.I. N.S. N.B. QUE
ONT MAN SASK ALB B.C.
Figure 1: Relative Level
of Human Capital - at Least Grade 9
0
0.1
0.2
0.3
0.4
0.5
1950 1960 1970 1980 1990 2000
Minimum Grade 9 University Degree
Figure 3: Regional Dispersion of Human
Capital Indicators (15 years and over)
42


