Embed Size (px)
Citation preview
1 23
Water Quality, Exposure and Health ISSN 1876-1658Volume 7Number 4 Water Qual Expo Health (2015)7:515-524DOI 10.1007/s12403-015-0166-6
Groundwater Quality and itsHydrochemical Characteristics in a ShallowWeathered Rock Aquifer of Southern India
R. Rajesh, K. Brindha & L. Elango
1 23
Your article is protected by copyright and all
rights are held exclusively by Springer Science
+Business Media Dordrecht. This e-offprint
is for personal use only and shall not be self-
archived in electronic repositories. If you wish
to self-archive your article, please use the
accepted manuscript version for posting on
your own website. You may further deposit
the accepted manuscript version in any
repository, provided it is only made publicly
available 12 months after official publication
or later and provided acknowledgement is
given to the original source of publication
and a link is inserted to the published article
on Springer's website. The link must be
accompanied by the following text: "The final
publication is available at link.springer.com”.
ORIGINAL PAPER
Groundwater Quality and its Hydrochemical Characteristicsin a Shallow Weathered Rock Aquifer of Southern India
R. Rajesh1 • K. Brindha2 • L. Elango1
Received: 19 December 2014 / Revised: 30 March 2015 / Accepted: 31 March 2015 / Published online: 7 April 2015
� Springer Science+Business Media Dordrecht 2015
Abstract Suitability of groundwater for domestic and
irrigation purposes as well as its hydrochemical charac-
teristics was estimated in a part of Nalgonda district, Te-
langana state in southern India. Water samples were
collected from 45 wells once every 2 months from March
2008 to January 2010. EC and pH were measured in situ
while concentrations of calcium, magnesium, sodium,
potassium, sulphate and chloride in groundwater were
analysed using ion chromatograph. Carbonate and bicar-
bonate concentration were determined by acid base titra-
tion. General order of dominance of cations in the
groundwater of this study area is Na?[Ca2?[Mg2?[K? while that for anions is HCO3
-[Cl-[ SO4-2. Ca–
HCO3, Na–Cl, mixed Ca–Na–HCO3 and mixed Ca–Mg–Cl
types of groundwater were dominant in this area.
Groundwater is generally fresh with medium to high sali-
nity and low alkalinity. Chloride and bicarbonate concen-
trations were present within the permissible limits for
drinking whereas, some samples exceed the permissible
limits of the Bureau of Indian Standards for pH, TDS, TH,
sodium, calcium, magnesium and sulphate. Potassium ex-
ceeded the maximum permissible limits for drinking pro-
posed by World Health Organisation. Sodium adsorption
ratio, sodium percentage, residual sodium carbonate and
permeability index indicates that the groundwater quality
was suitable for irrigation in most parts of the study area.
Keywords Groundwater quality � Domestic use �Irrigation � Nalgonda district � Telangana � India
Introduction
Demand for freshwater has increased in the recent decades
due to population explosion and intense irrigation ac-
tivities. Availability of freshwater is decreasing especially
in several arid and semi-arid regions of the world. The
future adequacy of freshwater resources is difficult to
assess, owing to complex and rapidly changing geography
of water supply and use (Vorosmarty et al. 2000). Even
today, due to inadequate supply of surface water, most of
the people in developing countries depend on the use of
locally available groundwater resources for different pur-
poses. Quality of groundwater is affected by rainfall, cli-
mate, geology, irrigation practices, anthropogenic sources
of contamination and several other reasons. The hydro-
chemical characteristics of groundwater play a significant
role in assessing its quality for various purposes. It also
provides a better understanding of possible changes in
groundwater quality. Worldwide several researchers have
discussed the groundwater quality-related problems
(Stamatis et al. 2011; Li et al. 2012; Massoud 2012; Chen
and Feng 2013; Moosavirad et al. 2013). In India too,
numerous studies have been carried out to assess the suit-
ability of groundwater quality for drinking and irrigation
uses (Gowd 2005; Rao 2006; Brindha and Elango 2011;
Dar et al. 2011; Ramesh and Elango 2012; Sharma et al.
2012; Vetrimurugan et al. 2013). Thus, hydrochemical
study related to quality has become very important. Such a
study was carried out in a rural part of southern India where
people depend on groundwater for both domestic and ir-
rigation needs. This region is located in the administrative
& L. Elango
[email protected]; [email protected]
1 Department of Geology, Anna University, Chennai 600025,
India
2 International Water Management Institute, Vientiane,
Lao PDR
123
Water Qual Expo Health (2015) 7:515–524
DOI 10.1007/s12403-015-0166-6
Author's personal copy
district of Nalgonda, in the state of Telangana (formerly
Andhra Pradesh), southern India (Fig. 1) and is noted for
the high fluoride concentration in groundwater (Rao et al.
1993; Brindha et al. 2011a; Brindha and Elango 2013a).
Groundwater in watersheds near the present study area too
has high fluoride owing to the fluoride rich minerals in the
aquifer materials and high degree of weathering due to
alkaline groundwater (Reddy et al. 2010). Other studies in
this region include the exploration of unconformity-related
uranium mineralization in the Kurnool group sediments
located in the southeast of Nalgonda district (Singh et al.
2002). Geochemical processes affecting the groundwater
chemistry of this region and its temporal variation were
identified by Rajesh et al. (2012) and the occurrence of
bromide (Brindha and Elango 2010, 2013b), nitrate
(Brindha et al. 2010, 2012; Brindha and Elango 2012) and
uranium (Brindha et al. 2011b; Brindha and Elango 2013c)
in groundwater has also been reported. Solute transport and
geochemical modelling of various ions in groundwater of
this area was studied by Elango et al. (2012) and Brindha
and Elango (2014). However, these studies have not re-
ported about the general groundwater quality for any in-
tended use. So, this study was carried with an aim to
ascertain the groundwater quality and its suitability for
domestic and irrigation purposes in a part of Nalgonda
district, Telangana, southern India.
Methodology
Description of the Study Area
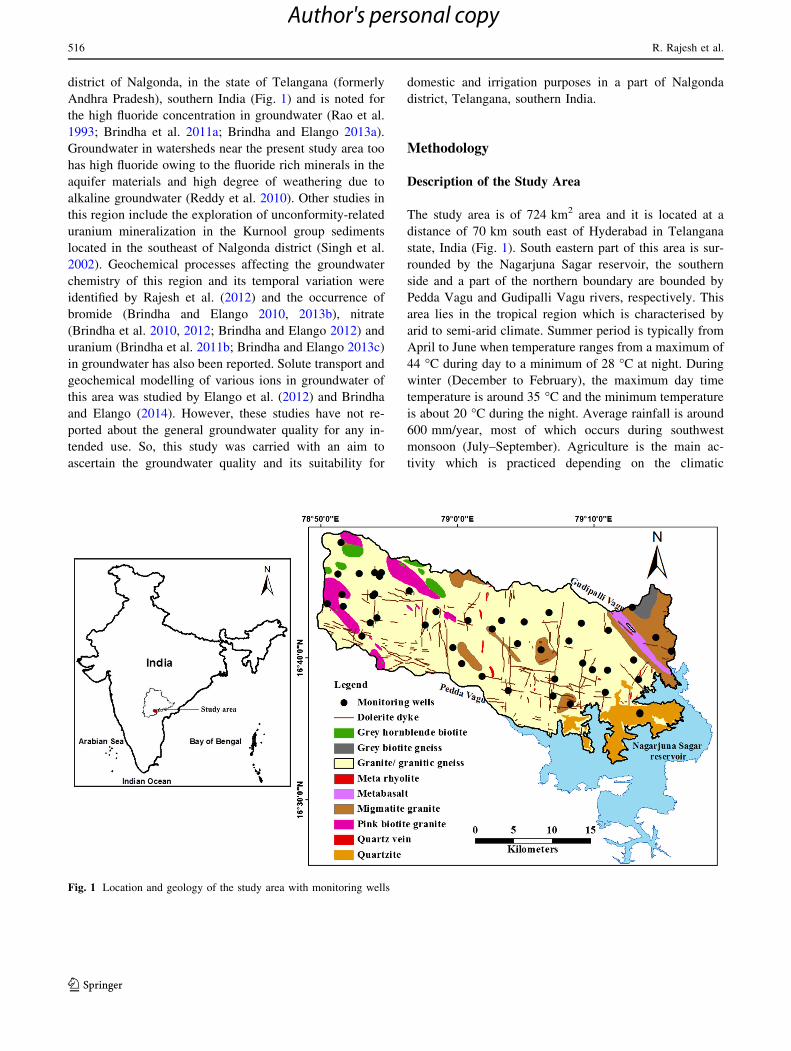
The study area is of 724 km2 area and it is located at a
distance of 70 km south east of Hyderabad in Telangana
state, India (Fig. 1). South eastern part of this area is sur-
rounded by the Nagarjuna Sagar reservoir, the southern
side and a part of the northern boundary are bounded by
Pedda Vagu and Gudipalli Vagu rivers, respectively. This
area lies in the tropical region which is characterised by
arid to semi-arid climate. Summer period is typically from
April to June when temperature ranges from a maximum of
44 �C during day to a minimum of 28 �C at night. During
winter (December to February), the maximum day time
temperature is around 35 �C and the minimum temperature
is about 20 �C during the night. Average rainfall is around
600 mm/year, most of which occurs during southwest
monsoon (July–September). Agriculture is the main ac-
tivity which is practiced depending on the climatic
Fig. 1 Location and geology of the study area with monitoring wells
516 R. Rajesh et al.
123
Author's personal copy
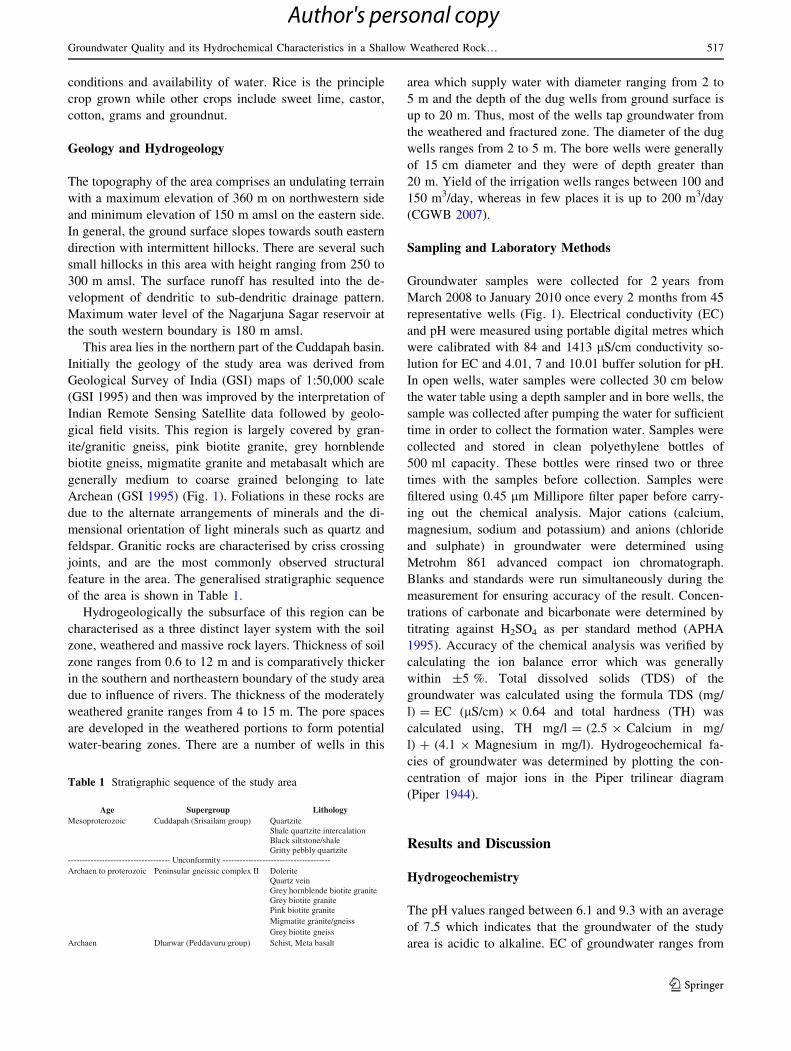
conditions and availability of water. Rice is the principle
crop grown while other crops include sweet lime, castor,
cotton, grams and groundnut.
Geology and Hydrogeology
The topography of the area comprises an undulating terrain
with a maximum elevation of 360 m on northwestern side
and minimum elevation of 150 m amsl on the eastern side.
In general, the ground surface slopes towards south eastern
direction with intermittent hillocks. There are several such
small hillocks in this area with height ranging from 250 to
300 m amsl. The surface runoff has resulted into the de-
velopment of dendritic to sub-dendritic drainage pattern.
Maximum water level of the Nagarjuna Sagar reservoir at
the south western boundary is 180 m amsl.
This area lies in the northern part of the Cuddapah basin.
Initially the geology of the study area was derived from
Geological Survey of India (GSI) maps of 1:50,000 scale
(GSI 1995) and then was improved by the interpretation of
Indian Remote Sensing Satellite data followed by geolo-
gical field visits. This region is largely covered by gran-
ite/granitic gneiss, pink biotite granite, grey hornblende
biotite gneiss, migmatite granite and metabasalt which are
generally medium to coarse grained belonging to late
Archean (GSI 1995) (Fig. 1). Foliations in these rocks are
due to the alternate arrangements of minerals and the di-
mensional orientation of light minerals such as quartz and
feldspar. Granitic rocks are characterised by criss crossing
joints, and are the most commonly observed structural
feature in the area. The generalised stratigraphic sequence
of the area is shown in Table 1.
Hydrogeologically the subsurface of this region can be
characterised as a three distinct layer system with the soil
zone, weathered and massive rock layers. Thickness of soil
zone ranges from 0.6 to 12 m and is comparatively thicker
in the southern and northeastern boundary of the study area
due to influence of rivers. The thickness of the moderately
weathered granite ranges from 4 to 15 m. The pore spaces
are developed in the weathered portions to form potential
water-bearing zones. There are a number of wells in this
area which supply water with diameter ranging from 2 to
5 m and the depth of the dug wells from ground surface is
up to 20 m. Thus, most of the wells tap groundwater from
the weathered and fractured zone. The diameter of the dug
wells ranges from 2 to 5 m. The bore wells were generally
of 15 cm diameter and they were of depth greater than
20 m. Yield of the irrigation wells ranges between 100 and
150 m3/day, whereas in few places it is up to 200 m3/day
(CGWB 2007).
Sampling and Laboratory Methods
Groundwater samples were collected for 2 years from
March 2008 to January 2010 once every 2 months from 45
representative wells (Fig. 1). Electrical conductivity (EC)
and pH were measured using portable digital metres which
were calibrated with 84 and 1413 lS/cm conductivity so-
lution for EC and 4.01, 7 and 10.01 buffer solution for pH.
In open wells, water samples were collected 30 cm below
the water table using a depth sampler and in bore wells, the
sample was collected after pumping the water for sufficient
time in order to collect the formation water. Samples were
collected and stored in clean polyethylene bottles of
500 ml capacity. These bottles were rinsed two or three
times with the samples before collection. Samples were
filtered using 0.45 lm Millipore filter paper before carry-
ing out the chemical analysis. Major cations (calcium,
magnesium, sodium and potassium) and anions (chloride
and sulphate) in groundwater were determined using
Metrohm 861 advanced compact ion chromatograph.
Blanks and standards were run simultaneously during the
measurement for ensuring accuracy of the result. Concen-
trations of carbonate and bicarbonate were determined by
titrating against H2SO4 as per standard method (APHA
1995). Accuracy of the chemical analysis was verified by
calculating the ion balance error which was generally
within ±5 %. Total dissolved solids (TDS) of the
groundwater was calculated using the formula TDS (mg/
l) = EC (lS/cm) 9 0.64 and total hardness (TH) was
calculated using, TH mg/l = (2.5 9 Calcium in mg/
l) ? (4.1 9 Magnesium in mg/l). Hydrogeochemical fa-
cies of groundwater was determined by plotting the con-
centration of major ions in the Piper trilinear diagram
(Piper 1944).
Results and Discussion
Hydrogeochemistry
The pH values ranged between 6.1 and 9.3 with an average
of 7.5 which indicates that the groundwater of the study
area is acidic to alkaline. EC of groundwater ranges from
Table 1 Stratigraphic sequence of the study area
Age Supergroup Lithology Quartzite Shale quartzite intercalation Black siltstone/shale
Mesoproterozoic Cuddapah (Srisailam group)
Gritty pebbly quartzite ------------------------------------ Unconformity -------------------------------------- Archaen to proterozoic Peninsular gneissic complex II Dolerite
nievztrauQetinargetitoibednelbnrohyerG
etinargetitoibyerGetinargetitoibkniP
ssieng/etinargetitamgiMssiengetitoibyerG
Archaen Dharwar (Peddavuru group) Schist, Meta basalt
Groundwater Quality and its Hydrochemical Characteristics in a Shallow Weathered Rock… 517
123
Author's personal copy
144 to 5030 lS/cm with an average of 1030 lS/cm. The
highest value of EC was observed in the southeast of the
study area. The minimum, maximum and mean value of all
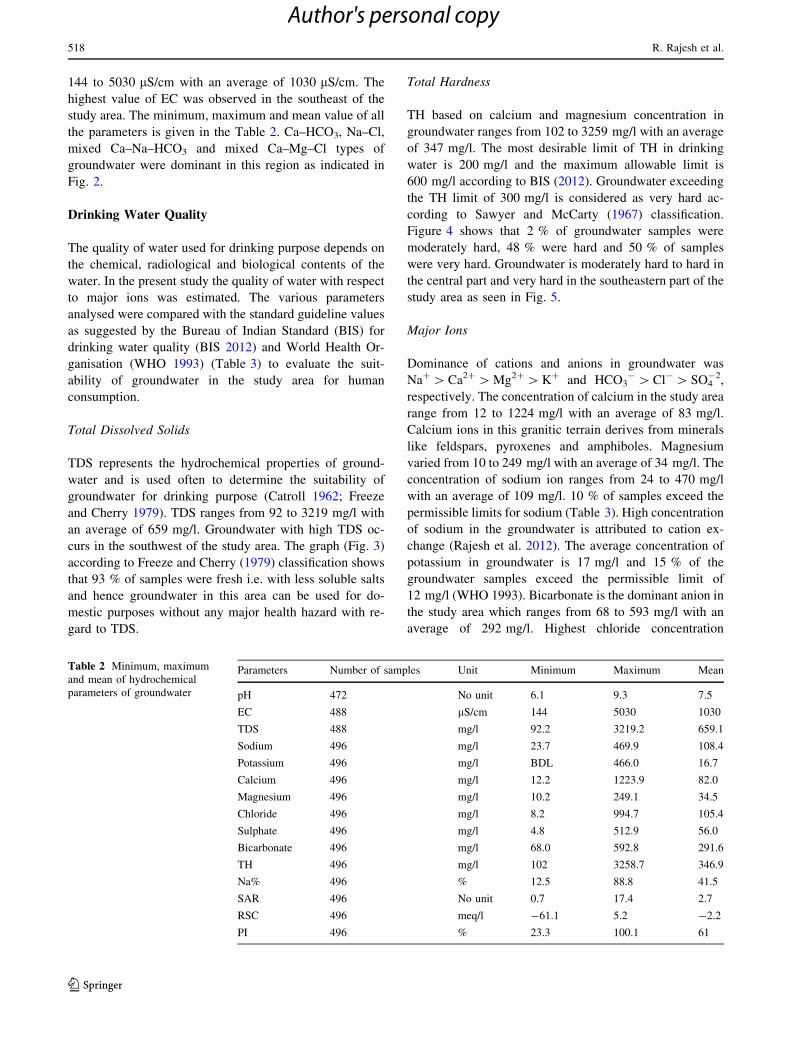
the parameters is given in the Table 2. Ca–HCO3, Na–Cl,
mixed Ca–Na–HCO3 and mixed Ca–Mg–Cl types of
groundwater were dominant in this region as indicated in
Fig. 2.
Drinking Water Quality
The quality of water used for drinking purpose depends on
the chemical, radiological and biological contents of the
water. In the present study the quality of water with respect
to major ions was estimated. The various parameters
analysed were compared with the standard guideline values
as suggested by the Bureau of Indian Standard (BIS) for
drinking water quality (BIS 2012) and World Health Or-
ganisation (WHO 1993) (Table 3) to evaluate the suit-
ability of groundwater in the study area for human
consumption.
Total Dissolved Solids
TDS represents the hydrochemical properties of ground-
water and is used often to determine the suitability of
groundwater for drinking purpose (Catroll 1962; Freeze
and Cherry 1979). TDS ranges from 92 to 3219 mg/l with
an average of 659 mg/l. Groundwater with high TDS oc-
curs in the southwest of the study area. The graph (Fig. 3)
according to Freeze and Cherry (1979) classification shows
that 93 % of samples were fresh i.e. with less soluble salts
and hence groundwater in this area can be used for do-
mestic purposes without any major health hazard with re-
gard to TDS.
Total Hardness
TH based on calcium and magnesium concentration in
groundwater ranges from 102 to 3259 mg/l with an average
of 347 mg/l. The most desirable limit of TH in drinking
water is 200 mg/l and the maximum allowable limit is
600 mg/l according to BIS (2012). Groundwater exceeding
the TH limit of 300 mg/l is considered as very hard ac-
cording to Sawyer and McCarty (1967) classification.
Figure 4 shows that 2 % of groundwater samples were
moderately hard, 48 % were hard and 50 % of samples
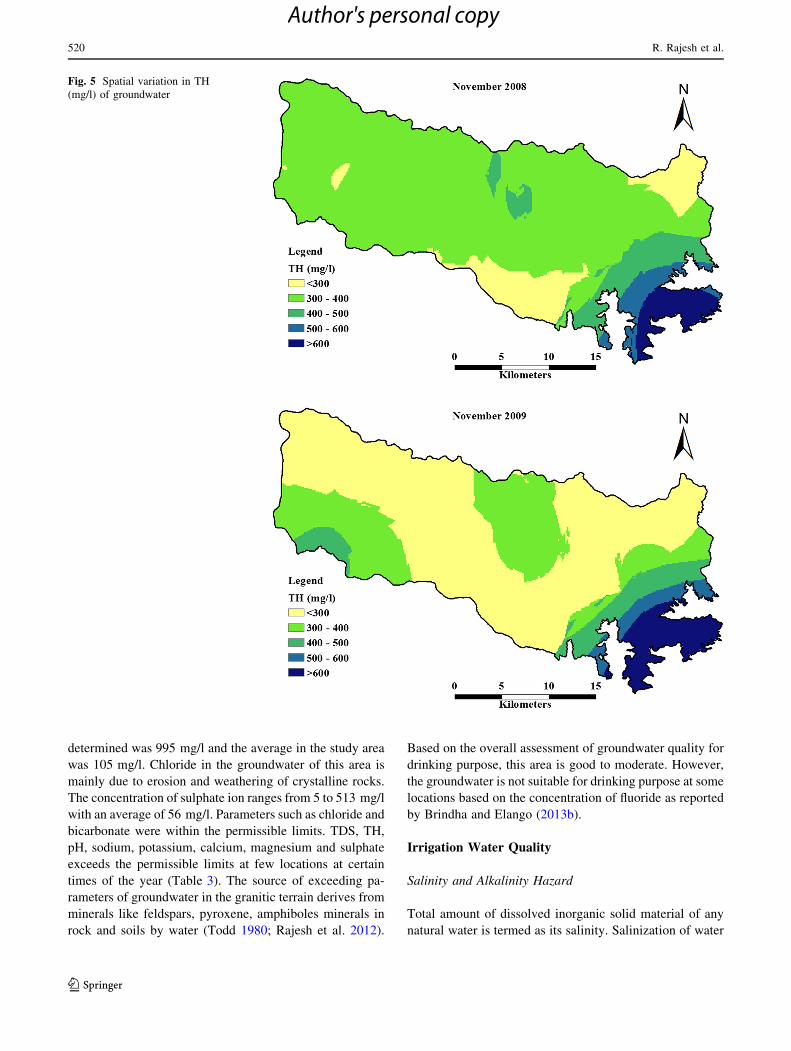
were very hard. Groundwater is moderately hard to hard in
the central part and very hard in the southeastern part of the
study area as seen in Fig. 5.
Major Ions
Dominance of cations and anions in groundwater was
Na?[Ca2?[Mg2?[K? and HCO3-[Cl-[ SO4
-2,
respectively. The concentration of calcium in the study area
range from 12 to 1224 mg/l with an average of 83 mg/l.
Calcium ions in this granitic terrain derives from minerals
like feldspars, pyroxenes and amphiboles. Magnesium
varied from 10 to 249 mg/l with an average of 34 mg/l. The
concentration of sodium ion ranges from 24 to 470 mg/l
with an average of 109 mg/l. 10 % of samples exceed the
permissible limits for sodium (Table 3). High concentration
of sodium in the groundwater is attributed to cation ex-
change (Rajesh et al. 2012). The average concentration of
potassium in groundwater is 17 mg/l and 15 % of the
groundwater samples exceed the permissible limit of
12 mg/l (WHO 1993). Bicarbonate is the dominant anion in
the study area which ranges from 68 to 593 mg/l with an
average of 292 mg/l. Highest chloride concentration
Table 2 Minimum, maximum
and mean of hydrochemical
parameters of groundwater
Parameters Number of samples Unit Minimum Maximum Mean
pH 472 No unit 6.1 9.3 7.5
EC 488 lS/cm 144 5030 1030
TDS 488 mg/l 92.2 3219.2 659.1
Sodium 496 mg/l 23.7 469.9 108.4
Potassium 496 mg/l BDL 466.0 16.7
Calcium 496 mg/l 12.2 1223.9 82.0
Magnesium 496 mg/l 10.2 249.1 34.5
Chloride 496 mg/l 8.2 994.7 105.4
Sulphate 496 mg/l 4.8 512.9 56.0
Bicarbonate 496 mg/l 68.0 592.8 291.6
TH 496 mg/l 102 3258.7 346.9
Na% 496 % 12.5 88.8 41.5
SAR 496 No unit 0.7 17.4 2.7
RSC 496 meq/l -61.1 5.2 -2.2
PI 496 % 23.3 100.1 61
518 R. Rajesh et al.
123
Author's personal copy
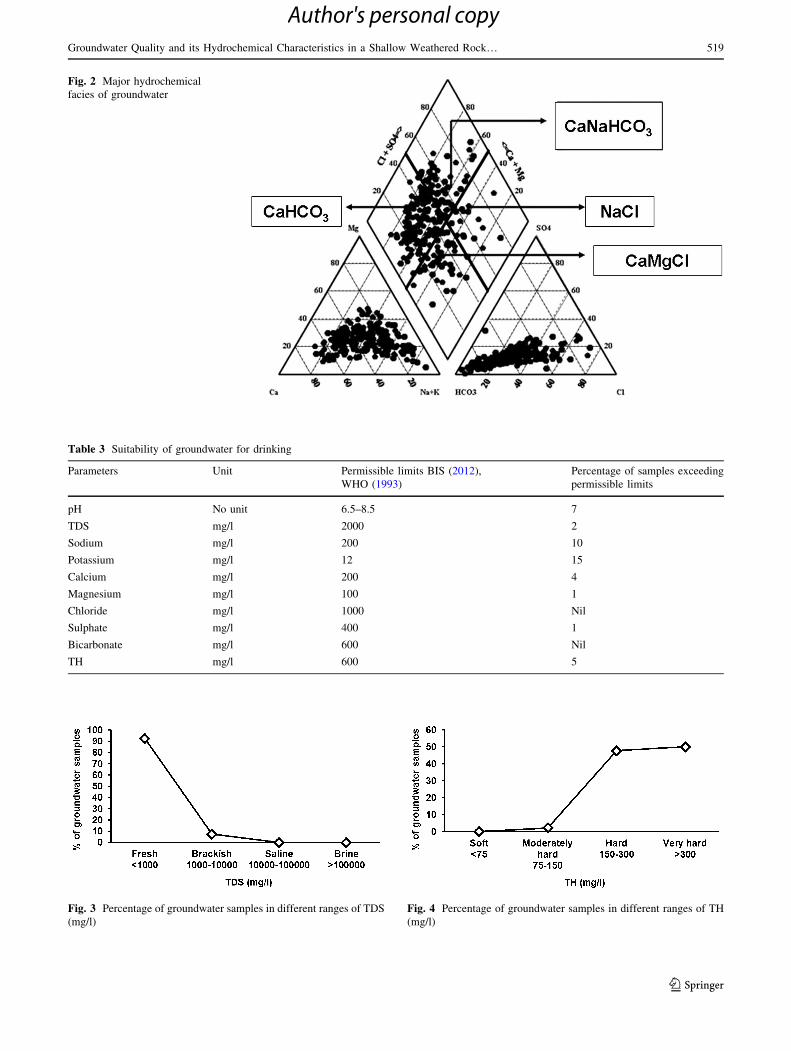
Fig. 3 Percentage of groundwater samples in different ranges of TDS
(mg/l)
Fig. 4 Percentage of groundwater samples in different ranges of TH
(mg/l)
Table 3 Suitability of groundwater for drinking
Parameters Unit Permissible limits BIS (2012),
WHO (1993)
Percentage of samples exceeding
permissible limits
pH No unit 6.5–8.5 7
TDS mg/l 2000 2
Sodium mg/l 200 10
Potassium mg/l 12 15
Calcium mg/l 200 4
Magnesium mg/l 100 1
Chloride mg/l 1000 Nil
Sulphate mg/l 400 1
Bicarbonate mg/l 600 Nil
TH mg/l 600 5
Fig. 2 Major hydrochemical
facies of groundwater
Groundwater Quality and its Hydrochemical Characteristics in a Shallow Weathered Rock… 519
123
Author's personal copy
determined was 995 mg/l and the average in the study area
was 105 mg/l. Chloride in the groundwater of this area is
mainly due to erosion and weathering of crystalline rocks.
The concentration of sulphate ion ranges from 5 to 513 mg/l
with an average of 56 mg/l. Parameters such as chloride and
bicarbonate were within the permissible limits. TDS, TH,
pH, sodium, potassium, calcium, magnesium and sulphate
exceeds the permissible limits at few locations at certain
times of the year (Table 3). The source of exceeding pa-
rameters of groundwater in the granitic terrain derives from
minerals like feldspars, pyroxene, amphiboles minerals in
rock and soils by water (Todd 1980; Rajesh et al. 2012).
Based on the overall assessment of groundwater quality for
drinking purpose, this area is good to moderate. However,
the groundwater is not suitable for drinking purpose at some
locations based on the concentration of fluoride as reported
by Brindha and Elango (2013b).
Irrigation Water Quality
Salinity and Alkalinity Hazard
Total amount of dissolved inorganic solid material of any
natural water is termed as its salinity. Salinization of water
Fig. 5 Spatial variation in TH
(mg/l) of groundwater
520 R. Rajesh et al.
123
Author's personal copy
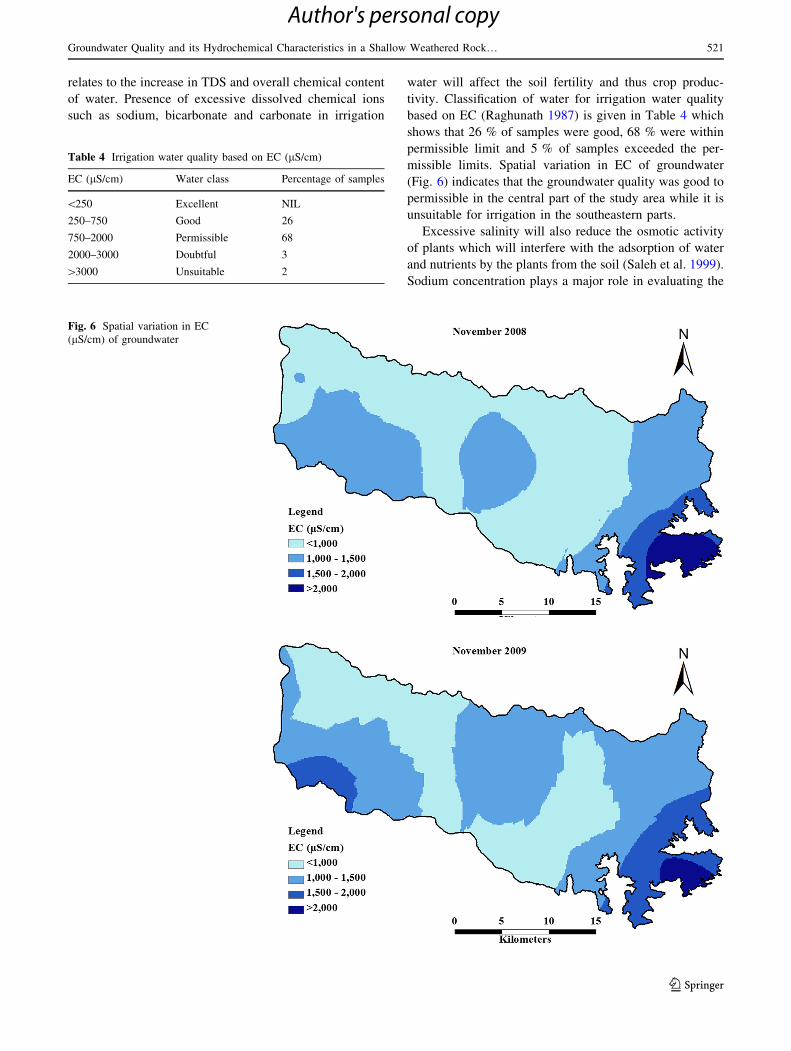
relates to the increase in TDS and overall chemical content
of water. Presence of excessive dissolved chemical ions
such as sodium, bicarbonate and carbonate in irrigation
water will affect the soil fertility and thus crop produc-
tivity. Classification of water for irrigation water quality
based on EC (Raghunath 1987) is given in Table 4 which
shows that 26 % of samples were good, 68 % were within
permissible limit and 5 % of samples exceeded the per-
missible limits. Spatial variation in EC of groundwater
(Fig. 6) indicates that the groundwater quality was good to
permissible in the central part of the study area while it is
unsuitable for irrigation in the southeastern parts.
Excessive salinity will also reduce the osmotic activity
of plants which will interfere with the adsorption of water
and nutrients by the plants from the soil (Saleh et al. 1999).
Sodium concentration plays a major role in evaluating the
Fig. 6 Spatial variation in EC
(lS/cm) of groundwater
Table 4 Irrigation water quality based on EC (lS/cm)
EC (lS/cm) Water class Percentage of samples
\250 Excellent NIL
250–750 Good 26
750–2000 Permissible 68
2000–3000 Doubtful 3
[3000 Unsuitable 2
Groundwater Quality and its Hydrochemical Characteristics in a Shallow Weathered Rock… 521
123
Author's personal copy
groundwater quality for irrigation because sodium causes
an increase in the hardness of soil as well as a reduction in
its permeability (Tijani 1994). High sodium can cause
damage to the soil structure by making it compact and
impervious by replacing the adsorbed calcium and mag-
nesium. Sodium adsorption ratio (SAR) which determines
the sodium or alkali hazard in water used for irrigation is
calculated by (Richards 1954),
SAR ¼ Naþffiffiffiffiffiffiffiffiffiffiffiffiffiffiffiffiffiffi
Ca2þþMg2þ
2
q ;
where the concentrations are represented in meq/l.
SAR values were at a minimum, mean and maximum of
1, 3 and 17, respectively. SAR values can indicate the
extent to which water tends to enter into cation exchange
reaction in soil (Raju 2007). Only one sample fall in the
doubtful range whereas most of the groundwater samples
were of low to medium sodium class (S1, S2) which im-
plies that there is no alkali hazard to the crops of this study
area (Fig. 7). SAR plotted against the EC on the US sali-
nity diagram (Richards 1954) is shown in Fig. 7. Most of
the groundwater samples fall in C2S1 and C3S1 indicating
the low sodium content and medium to high salinity nature
of groundwater. This water can be used for irrigation on all
soil types, however, it may result in minor problem relating
to exchangeable sodium. Few groundwater samples falling
under C4S1 and C3S2 type indicated high salinity and low
alkali hazard which is suitable only for crops with good salt
tolerance (Rajesh 2012). Overall the groundwater of this
study area falls under good to moderate category for irri-
gation purpose based on SAR.
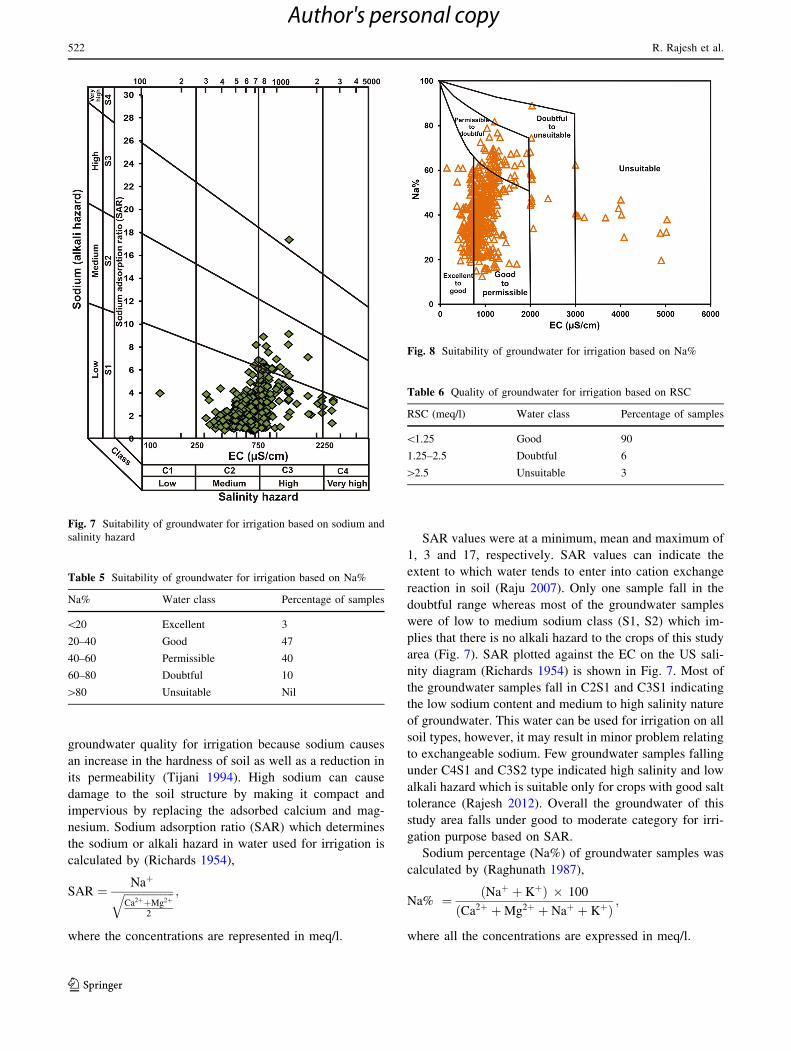
Sodium percentage (Na%) of groundwater samples was
calculated by (Raghunath 1987),
Na% ¼ Naþ þ Kþð Þ � 100
ðCa2þ þ Mg2þ þ Naþ þ KþÞ;
where all the concentrations are expressed in meq/l.
Fig. 7 Suitability of groundwater for irrigation based on sodium and
salinity hazard
Table 5 Suitability of groundwater for irrigation based on Na%
Na% Water class Percentage of samples
\20 Excellent 3
20–40 Good 47
40–60 Permissible 40
60–80 Doubtful 10
[80 Unsuitable Nil
Table 6 Quality of groundwater for irrigation based on RSC
RSC (meq/l) Water class Percentage of samples
\1.25 Good 90
1.25–2.5 Doubtful 6
[2.5 Unsuitable 3
Fig. 8 Suitability of groundwater for irrigation based on Na%
522 R. Rajesh et al.
123
Author's personal copy

In 47 and 40 % of groundwater samples, Na% is in the
good to permissible class, respectively, and 10 % of sam-
ples falls under doubtful range (Table 5). Na% plotted
against the total concentration of ions represented by
Wilcox (1955) diagram (Fig. 8) indicate that most of the
groundwater samples were good to permissible. Few
groundwater samples were doubtful and unsuitable for ir-
rigation (Fig. 8).
Residual Sodium Carbonate (RSC)
Occurrence of higher concentration of carbonate and bi-
carbonate than the concentration of calcium and magne-
sium determines its suitability for irrigation. This is
denoted by RSC, which is calculated as given by Raghu-
nath (1987).
RSC ¼ HCO3 þ CO3ð Þ � Ca þ Mgð Þ;
where the concentration as represented as meq/l.
Table 6 shows the classification of groundwater of this
area for irrigation purpose based on RSC. Though 3 % of
the groundwater samples fall under unsuitable category for
irrigation, 90 % of samples were good and 10 % were
doubtful for irrigation.
Permeability Index (PI)
Permeability of soil is affected by the long term use of water
and is influenced by, calcium, magnesium, sodium and bi-
carbonate concentration in the water. PI is calculated as,
PI ¼ðNaþ þ
ffiffiffiffiffiffiffiffiffiffiffiffiffi
HCO�3
p
� 100
ðCa2þ þ Mg2þ þ NaþÞ;
where the concentrations are represented as meq/l.
PI plotted against total salt concentration (Doneen 1964)
is used to classify the suitability of irrigation water (Fig. 9).
Most of the groundwater samples of the study area fall in
class I type which indicates that it is suitable for irrigation
purpose and few in class II which is permissible.
Conclusion
The groundwater quality assessed in a part of Nalgonda
district, Telangana, India was fresh and hard to very hard in
nature. The abundance of major ions was in the order of
Na?[Ca2?[Mg2?[K? = HCO3-[Cl-[ SO4
-2 and
the hydrochemical facies of groundwater was mainly Ca-
HCO3, Na–Cl, mixed Ca–Na–HCO3 and mixed Ca–Mg–Cl
types. Concentration of chloride and bicarbonate were
within the permissible limits of BIS for drinking. TDS, TH,
pH, sodium, potassium, calcium, magnesium and sulphate
exceeds the limits in few locations. Salinity hazard of the
study area is medium to high and low alkalinity hazard is
experienced. RSC indicates 90 % of the area is suitable
while PI and SAR values suggest that all groundwater
samples are usable for irrigation. Based on this study,
groundwater quality of the study area is suitable for
drinking as well as irrigational uses in most of the region
except for very few locations.
Acknowledgments Authors thank the Board of Research in Nuclear
Sciences, Department of Atomic Energy, Government of India (Grant
No. 2007/36/35) for their financial support. The Department of Sci-
ence and Technology’s Funds for Improvement in Science and
Technology scheme (Grant No. SR/FST/ESI-106/2010) and Univer-
sity Grants Commission’s Special Assistance Programme (Grant No.
UGC DRS II F.550/10/DRS/2007(SAP-1)) are also acknowledged as
the analytical facilities created from these funds were used to carry
out part of this work.
References
APHA (American Public Health Association) (1995) Standard
methods for the examination of water and wastewater, 17th
edn. APHA, Washington DC
BIS (Bureau of Indian Standards) (2012) Indian standard drinking
water specification, second revision ISO: 10500:2012, Bureau of
Fig. 9 Suitability of groundwater for irrigation based on permeability
index
Groundwater Quality and its Hydrochemical Characteristics in a Shallow Weathered Rock… 523
123
Author's personal copy
Indian Standards. Drinking Water Sectional Committee, FAD
25, New Delhi, India
Brindha K, Elango L (2010) Study on bromide in groundwater in
parts of Nalgonda district, Andhra Pradesh. Earth Sci India
3(1):73–80
Brindha K, Elango L (2011) Hydrochemical characteristics of
groundwater for domestic and irrigation purposes in Madhuran-
thakam, Tamil Nadu, India. Earth Sci Res J 15(2):101–108
Brindha K, Elango L (2012) Groundwater quality zonation in a
shallow weathered rock aquifer using GIS. Geo Spatial Inf Sci
15(2):95–104
Brindha K, Elango L (2013a) Occurrence of uranium in groundwater
of a shallow granitic aquifer and its suitability for domestic use
in southern India. J Radioanal Nucl Chem 295:357–367
Brindha K, Elango L (2013b) Geochemistry of fluoride rich
groundwater in a weathered granitic rock region, Southern
India. Water Qual Expo Health 5:127–138
Brindha K, Elango L (2013c) Causes for variation in bromide
concentration in groundwater of a granitic aquifer. Int J Res
Chem Environ 3(2):163–171
Brindha K, Elango L (2014) Geochemical modelling of the effects of
a proposed uranium tailings pond on groundwater quality. Mine
Water Environ 33:110–120
Brindha K, Rajesh R, Murugan R, Elango L (2010) Natural and
anthropogenic influence on the fluoride and nitrate concentration
of groundwater in parts of Nalgonda district, Andhra Pradesh,
India. J Appl Geochem 12(2):231–241
Brindha K, Elango L, Nair RN (2011a) Spatial and temporal variation
of uranium in a shallow weathered rock aquifer in southern
India. J Earth Syst Sci 120(5):911–920
Brindha K, Rajesh R, Murugan R, Elango L (2011b) Fluoride
contamination in groundwater in parts of Nalgonda district,
Andhra Pradesh, India. Environ Monit Assess 172:481–492
Brindha K, Rajesh R, Murugan R, Elango L (2012) Nitrate pollution
in groundwater in some rural areas of Nalgonda district, Andhra
Pradesh, India. J Environ Sci Eng 54(1):64–70
Catroll D (1962) Rain water as a chemical agent of geological
process—a view. USGS Water Supply 1533:18–20
CGWB (Central Ground Water Board) (2007) Groundwater informa-
tion. Nalgonda district, Andhra Pradesh, pp 1–41
Chen L, Feng Q (2013) Geostatistical analysis of temporal and spatial
variations in groundwater levels and quality in the Minqin oasis,
Northwest China. Environ Earth Sci 70:1367–1378
Dar IA, Sankar K, Shafi T, Dar MA (2011) Investigation of
groundwater quality in hardrock terrain using geoinformation
system. Environ Monit Assess 176:575–595
Doneen LD (1964) Notes on water quality in Agriculture. Published
as a water science and engineering paper 4001, Department of
Water Sciences and Engineering, University of California
Elango L, Brindha K, Kalpana L, Sunny Faby, Nair RN, Murugan R
(2012) Groundwater flow and radionuclide decay-chain transport
modelling around a proposed uranium tailings pond in India.
Hydrogeol J 20(4):797–812
Freeze RA, Cherry JA (1979) Groundwater. Printice-Hall, Upper
Saddle River
Gowd SS (2005) Assessment of groundwater quality for drinking and
irrigation purposes: a case study of Peddavanka watershed,
Anantapur District, Andhra Pradesh, India. Environ Geol
48:702–712
GSI (Geological Survey of India) (1995) Geology and minerals map
of Nalgonda district, Andhra Pradesh, India
Li P, Wu J, Qian H (2012) Assessment of groundwater quality for
irrigation purposes and identification of hydrogeochemical
evolution mechanisms in Pengyang County, China. Environ
Earth Sci 69:2211–2225
Massoud MA (2012) Assessment of water quality along a recreational
section of the Damour River in Lebanon using the water quality
index. Environ Monit Assess 184:4151–4160
Moosavirad SM, Janardhana MR, Khairy H (2013) Impact of
anthropogenic activities on the chemistry and quality of
groundwater: a case study from a terrain near Zarand City,
Kerman Province, SE Iran. Environ Earth Sci 69:2451–2467
Piper AM (1944) A graphical procedure in the geochemical interpre-
tation of water analysis. Am Geophys Union Trans 25:914–928
Raghunath HM (1987) Groundwater. Wiley Eastern Ltd, New Delhi
563
Rajesh R (2012) Hydrogeology and hydrogeochemical characterisation
of groundwater of a part of Nalgonda district, Andhra Pradesh,
India. Ph.D Thesis. Anna University, Chennai, India, p 121
Rajesh R, Brindha K, Murugan R, Elango L (2012) Influence of
hydrogeochemical processes on temporal changes in groundwa-
ter quality in a part of Nalgonda district, Andhra Pradesh, India.
Environ Earth Sci 65:1203–1213
Raju NJ (2007) Hydrogeochemical parameters for assessment of
groundwater quality in the upper Gunjanaeru River basin,
Cuddapah District, Andhra Pradesh, South India. Environ Geol
52:1067–1074
Ramesh K, Elango L (2012) Groundwater quality and its suitability
for domestic and agricultural use in Tondiar river basin, Tamil
Nadu, India. Environ Monit Assess 184:3887–3899
Rao NS (2006) Seasonal variation of groundwater quality in a part of
Guntur district, Andhra Pradesh, India. Environ Geol 49:413–429
Rao NVR, Rao KS, Schuiling RD (1993) Fluorine distribution in
waters of Nalgonda district, Andhra Pradesh, India. Environ
Geol 21:84–89
Reddy DV, Nagabhushanam P, Sukhija BS, Reddy AGS, Smedly PL
(2010) Fluoride dynamics in the granitic aquifer of the Wailapally
watershed, Nalgonda district, India. Chem Geol 269:278–289
Richards LA (1954) Diagnosis and improvement of saline and alkali
soils, US Department of Agriculture Handbook, p 60
Saleh A, Al-Ruwih F, Shehata M (1999) Hydrogeochemical process
operating within the main aquifers of Kuwait. J Arid Environ
42:195–209
Sawyer GN, McCarty DL (1967) Chemistry of sanitary engineers,
2nd edn. McGraw Hill, New York 518
Sharma P, Sarma HP, Mahanta C (2012) Evaluation of groundwater
quality with emphasis on fluoride concentration in Nalbari district,
Assam, Northeast India. Environ Earth Sci 65:2147–2159
Singh RV, Sinha RM, Bisht BS, Banerjee DC (2002) Hydrogeo-
chemical exploration for unconformity-related uranium miner-
alization: example from Palanudu sub-basin, Cuddapah Basin,
AndhraPradesh, India. Geochem Explor 76:71–92
Stamatis G, Alexakis D, Gamvroula D, Migiros G (2011) Ground-
water quality assessment in Oropos-Kalamos basin, Attica,
Greece. Environ Earth Sci 64:973–988
Tijani MN (1994) Hydrochemical assessment of groundwater in Moro
area, Kwara State, Nigeria. Environ Geol 24:194–202
Todd DK (1980) Groundwater Hydrology, 2nd edn. Wiley, NewYork, p 535
Vetrimurugan E, Elango L, Rajmohan N (2013) Sources of
contaminants and groundwater quality in the coastal part of a
river delta. Int J Environ Sci Technol 10:473–486
Vorosmarty CJ, Green P, Salisbury J, Lammers RB (2000) Global
water resources: vulnerability from climate change and popula-
tion growth. Science 289:284–288
Wilcox LV (1955) Classification and use of irrigation waters, USDA,
circular 969, Washington DC
WHO (World Health Organisation) (1993) Guidelines for drinking
water quality. In: Recommendations, vol 1, 2nd edn. WHO,
Geneva, p 130
524 R. Rajesh et al.
123
Author's personal copy


