Embed Size (px)
Citation preview
0016-7622/2008-72-3-405/$ 1.00 © GEOL. SOC. INDIA
JOURNAL GEOLOGICAL SOCIETY OF INDIAVol.72, September 2008, pp.405-414
Hydrochemical Evolution of Groundwater in the PhreaticAquifers of Chhattisgarh
R. K. RAY and RUMI MUKHERJEE
Central Ground Water Board, Dhamtari Road, Raipur - 492 001Email: [email protected], [email protected]
Abstract: The phreatic aquifers form the most important repository of groundwater in Chhattisgarh state, India. Basedon 323 representative water samples of the phreatic aquifers, the present study is conducted to trace the materials andprocesses controlling groundwater chemistry. Groundwater is mostly low in dissolved constituents. Bicarbonate type isthe dominant type of water irrespective of the rock type. Sulphate and Chloride type waters are restricted to smallpatches. δD and δ18O characteristics of groundwater samples suggest that recharge to the phreatic aquifer system is rapidwith little or no evaporative enrichment of the meteoric water.
Electrical conductivities and chloride concentrations, when plotted against the distance from water divide, do notshow any trend. Dissolution of bicarbonate by CO2 charged meteoric water is the principal process controllingbicarbonate content in groundwater. Dissolution of gypsum from the gypsiferous formations (Maniyari shale and RaigarhFormation) produces sulphate type water in parts of Durg, Janjgir Champa, Bilaspur and Raigarh districts. Chlorideconcentration in groundwater is low. Ca/Mg carbonates in sedimentaries, Ca-feldspars and ferromagnesian minerals inthe crystallines are the major sources of Ca and Mg in groundwater. Cation exchange process in the sedimentaries, andalbite weathering in the crystallines were found to be important processes controlling concentration of Na in groundwater.
Keywords: Hydrochemical evolution, Groundwater, Chhattisgarh.
The phreatic aquifer is the most important and most exploitedaquifer in the state. The objective of this study is tohydrochemically characterise groundwater in the phreaticaquifers and to analyse the processes involved inhydrochemical evolution of these waters.
GEOHYDROLOGICAL SETTING
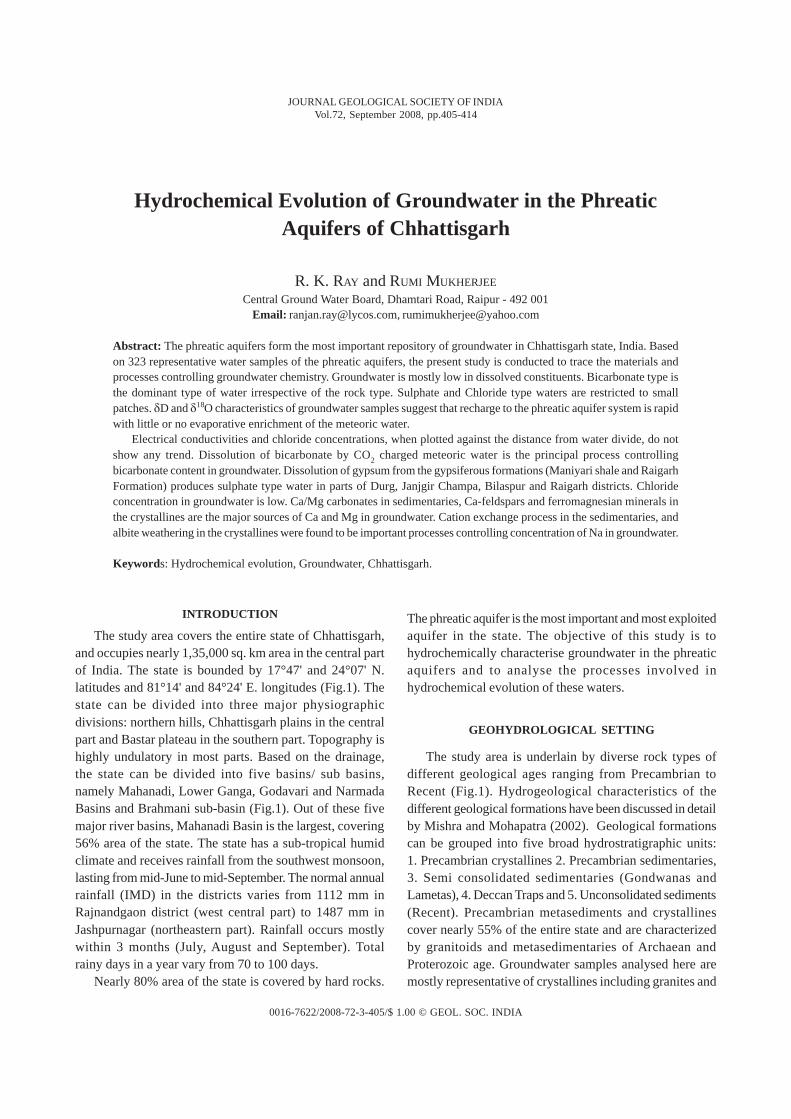
The study area is underlain by diverse rock types ofdifferent geological ages ranging from Precambrian toRecent (Fig.1). Hydrogeological characteristics of thedifferent geological formations have been discussed in detailby Mishra and Mohapatra (2002). Geological formationscan be grouped into five broad hydrostratigraphic units:1. Precambrian crystallines 2. Precambrian sedimentaries,3. Semi consolidated sedimentaries (Gondwanas andLametas), 4. Deccan Traps and 5. Unconsolidated sediments(Recent). Precambrian metasediments and crystallinescover nearly 55% of the entire state and are characterizedby granitoids and metasedimentaries of Archaean andProterozoic age. Groundwater samples analysed here aremostly representative of crystallines including granites and
INTRODUCTION
The study area covers the entire state of Chhattisgarh,and occupies nearly 1,35,000 sq. km area in the central partof India. The state is bounded by 17°47' and 24°07' N.latitudes and 81°14' and 84°24' E. longitudes (Fig.1). Thestate can be divided into three major physiographicdivisions: northern hills, Chhattisgarh plains in the centralpart and Bastar plateau in the southern part. Topography ishighly undulatory in most parts. Based on the drainage,the state can be divided into five basins/ sub basins,namely Mahanadi, Lower Ganga, Godavari and NarmadaBasins and Brahmani sub-basin (Fig.1). Out of these fivemajor river basins, Mahanadi Basin is the largest, covering56% area of the state. The state has a sub-tropical humidclimate and receives rainfall from the southwest monsoon,lasting from mid-June to mid-September. The normal annualrainfall (IMD) in the districts varies from 1112 mm inRajnandgaon district (west central part) to 1487 mm inJashpurnagar (northeastern part). Rainfall occurs mostlywithin 3 months (July, August and September). Totalrainy days in a year vary from 70 to 100 days.
Nearly 80% area of the state is covered by hard rocks.
JOUR.GEOL.SOC.INDIA, VOL.72, SEPT. 2008
406 R. K. RAY AND RUMI MUKHERJEE
Fig.1. Geology, sample locations and major river basins in Chhattisgarh.
19°
18°
24°
23°
22°
21°
20°
81° 82°
0 50 100
kilometres
83° 84°
JANJGIR - CHAMPA
RAIPUR
MAHASAMUNDRAJNANDGAON
KAWARDHA
RAIGARH
BASTAR
BILASPUR
DANTEWADA
DHAMTARI
JASHPUR
KANKER
KORIYA
SURGUJA
KORBA
Geology
Legend
Crystallines
Precambrian Sedimentaries
Semiconsolidated Sedimentaries(Gondwana)
Deccan Trap
District boundary
Basin boundary
Sample location
DURG
Ganga Basin
Mahanadi Basin
Bramhani Basin
Godavari Basin
Narmada Basin
Study Area
JOUR.GEOL.SOC.INDIA, VOL.72, SEPT. 2008
HYDROCHEMICAL EVOLUTION OF GROUNDWATER IN THE PHREATIC AQUIFERS OF CHHATTISGARH 407
gneisses. Weathered mantle and fractures form the mainrepository of groundwater in these formations. Theweathered part forms the phreatic aquifer and is extensivein nature. Precambrian (or Purana) sedimentaries occupynearly 28% area of the state. It consists of Proterozoic cyclicsequence of arenaceous-argillaceous-calcareous rocks (Daset al. 1992) belonging to Chhattisgarh Supergroup and alsoIndravati, Khariyar and Sukma Groups. Groundwaterpotential zones in this unit are confined to weathered mantle,caverns, fractures and formation contacts. Karsts, thoughfew and far between, form the repository of groundwater inthese sedimentary terrains. The semi consolidatedsedimentaries covering nearly 16% area, include sandstonesand shale belonging to Gondwana Supergroup, andsandstones of Lameta Group. Gondwana Supergroup isrepresented by Talchirs, Barakars and Supra Barakars.They form thick and extensive unconfined to confinedaquifers. Deccan traps occupy only negligible areas in thenorthern part of the state. Unconsolidated formations ofQuaternary age include alluvial sand, clay, silt, and laterite.Quaternary alluvium forms thin unconfined aquifers withthickness up to 30 m. Extent of this formation is verymuch limited, but it locally forms potential aquifers. Theyoccur in several isolated patches and along the majorriver courses.
In general, pre-monsoon (May) water levels in thephreatic aquifer (86% of the 382 wells monitored) in thestate remain within 10 m below ground level. Similarly,during post-monsoon (November) period, water levels in79 % of the wells monitored were within the range of 0 to 5m bgl. Details of groundwater levels and their fluctuationsare discussed in the reports of CGWB (2005, 2006).
MATERIALS AND METHODS
The study is based on groundwater samples collectedduring May 2004 (CGWB 2005) from phreatic aquifers.The samples were analysed in the chemical laboratory ofRegional office of Central Ground Water Board (Ministryof Water Resources, Govt. of India) situated at Raipur.The samples, in general, are low in total dissolved solids.Charge Balance Errors (CBE) were calculated for all thesamples and only those with CBE within ± 10% wereconsidered for interpretations.
The formula used for calculation of CBE is
(1)(Freeze and Cherry, 1979)
Where z is the ionic valence, mc the molarity of cation
species, and ma the molarity of anion species. However, forwater samples with low concentration of total dissolvedsolids, the zm terms can be substituted by millequivalentsper litre. Thus the equation used for calculation of CBEin this case is
(2)
Where meqc and meqa represent the concentrations inmillequivalents per litre of cations and anions respectively.
Out of 323 samples considered here, three representDeccan Traps, 59 represent semi consolidated sedimentaries,113 represent Precambrian sedimentaries and 148 representcrystallines (Table 1).
GROUNDWATER TYPES
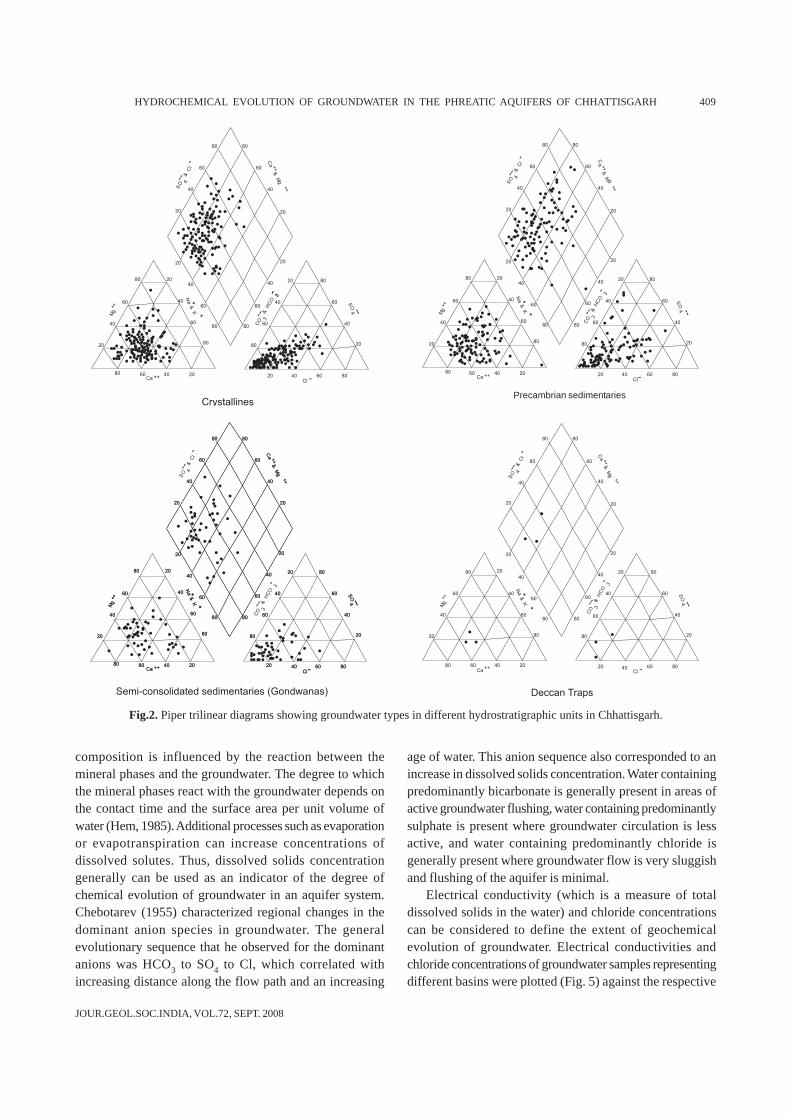
Groundwater types (Back, 1961, 1966; Seaber, 1962;Morgan and Winner, 1962) denote the diagnostic chemicalcharacter of water solutions in hydrologic systems. Pipertrilinear diagram (Hill, 1940; Piper, 1944) forms the basisfor this classification and water types can be identified basedon the region of data plots on the Piper diagram.Alternatively, water types may also be defined based ondominance of cations and anions (Meisler and Knobel,1994), for example, sodium chloride type, if sodium makesup more than 50% of the cations, and chloride makes upmore than 50% of the anions and so on.
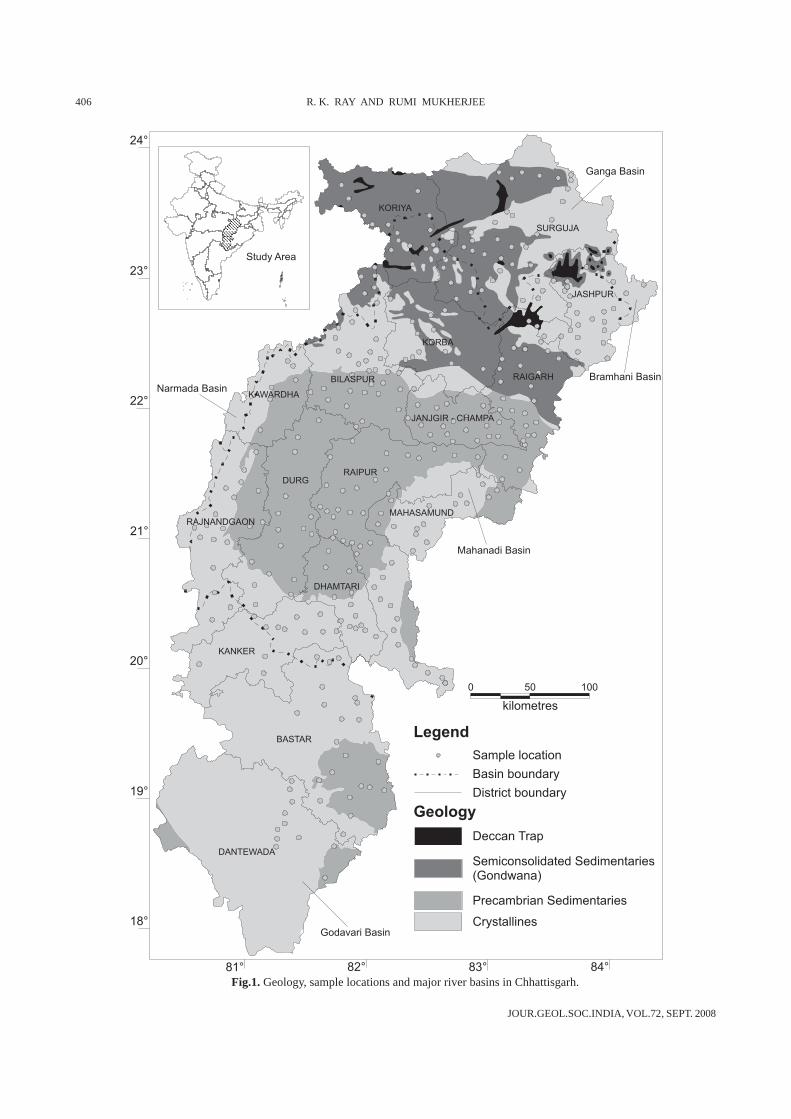
Groundwater in the phreatic aquifers of Chhattisgarh ismostly low in dissolved solids concentration. Electricalconductivities range from as low as 56 to as high as 2620microsiemens/cm at 25°C with an average of 525microsiemens/cm at 25°C. In general, groundwater in thecentral part of the state, which is covered by the Precambriansedimentaries, is relatively enriched in dissolvedconstituents. Groundwater samples representing differentgeological formations were plotted on Piper diagrams(Fig.2).
The dominant groundwater type in the phreatic aquifersis Ca-Mg-HCO3 type irrespective of the lithology. Ascompared to Ca-Mg-HCO3 type, other water types are rare.There are only three samples representing Deccan Traps,all of which fall in the field of Ca-Mg-HCO3. For thecrystallines, Gondwanas and Precambrian sedimentaries,some of the samples were plotted towards the field of NaHCO3 type. SO4 concentration varies from nil to 1350 mg/l,higher values being associated with the Maniyari shale(Precambrian sedimentaries). A few samples from JanjgirChampa and Raigarh districts have been grouped as Ca-Mg-SO4 type. Chloride concentration in groundwater varies
100×∑+∑
∑ ∑−=
ac
ac
zmzm
zmzmCBE
100×∑+∑
∑ ∑−=
ac
ac
meqmeq
meqmeqCBE
JOUR.GEOL.SOC.INDIA, VOL.72, SEPT. 2008
408 R. K. RAY AND RUMI MUKHERJEE
from 4 to 355 mg/l. Chloride constitutes the dominant ionin some of the cases.
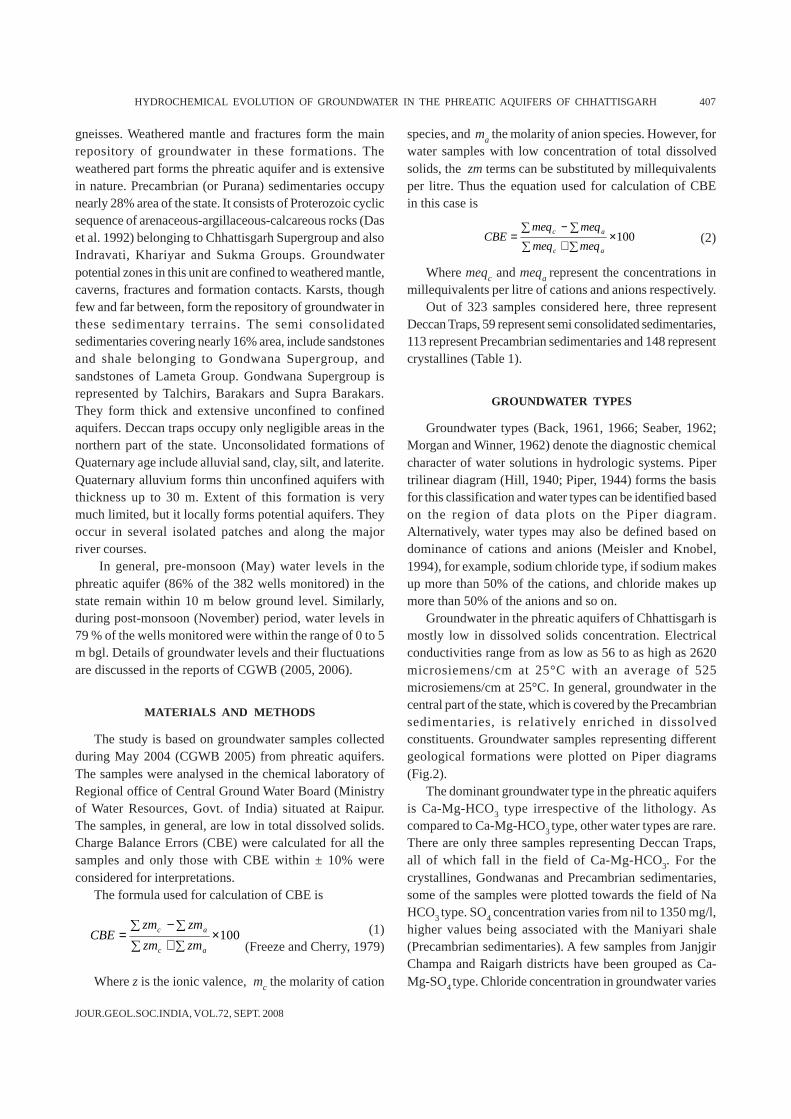
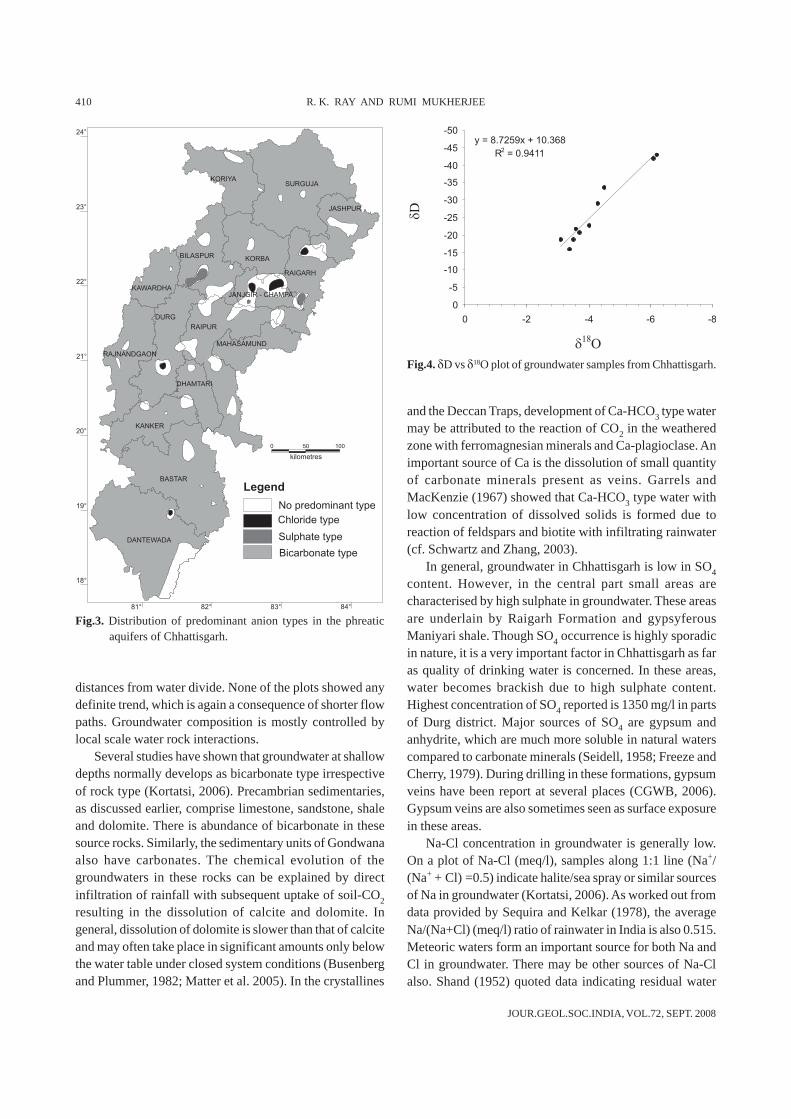
To study evolution of groundwater, predominant aniontypes were plotted (Fig.3). Nearly 80% area of the state ischaracterized by bicarbonate type of water. Sulphate typewater is restricted to very small areas and representsManiyari shale and Raigarh shale of Precambriansedimentaries. Chloride, like sulphate is a minor constituentin water in these aquifers and is also restricted to smallerpatches. Cl-type is restricted mostly to the shale formations.Cl-type water is also found as a small patch in the southernpart over the crystallines.
Stable Isotopes
Available data of stable isotopes were analysed to verifythe probability of evaporative enrichment of groundwater.δ18O and δD values of a limited number of groundwatersamples of the state are available. The data used here hasbeen reported by Gupta et al. (2005) and are available inthe form of an integrated dataset at http://www.prl.res.in/
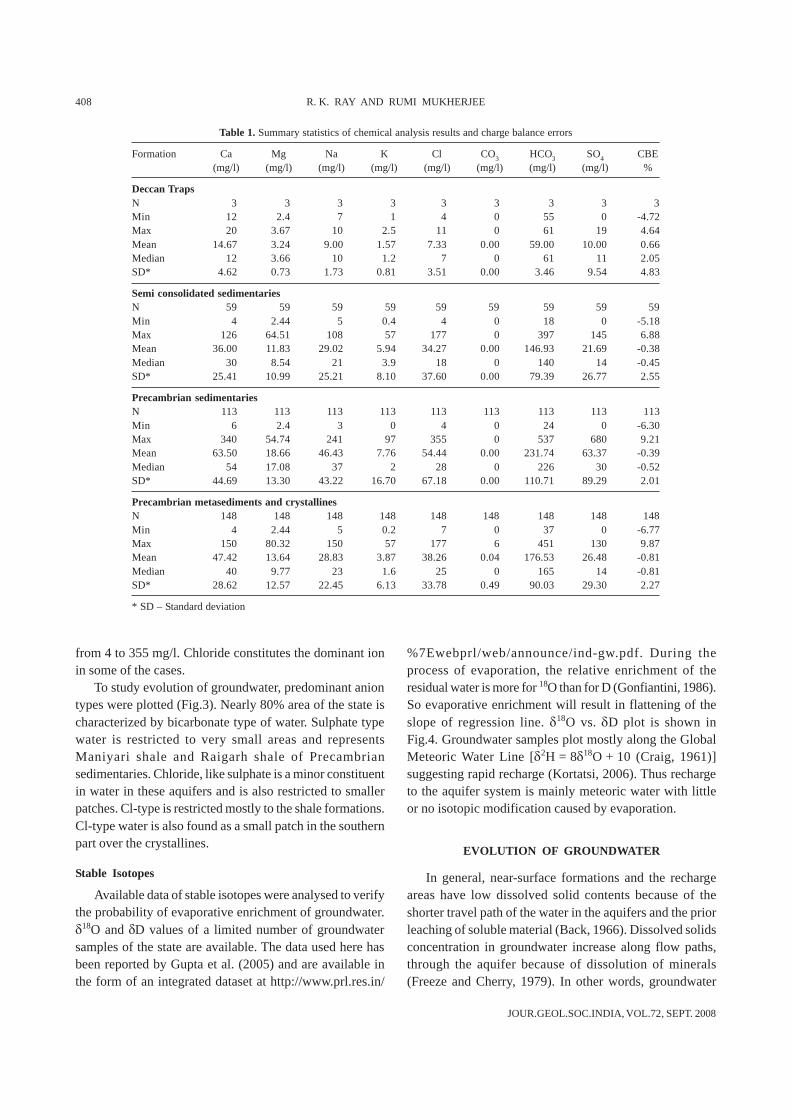
%7Ewebprl/web/announce/ind-gw.pdf. During theprocess of evaporation, the relative enrichment of theresidual water is more for 18O than for D (Gonfiantini, 1986).So evaporative enrichment will result in flattening of theslope of regression line. δ18O vs. δD plot is shown inFig.4. Groundwater samples plot mostly along the GlobalMeteoric Water Line [δ2H = 8δ18O + 10 (Craig, 1961)]suggesting rapid recharge (Kortatsi, 2006). Thus rechargeto the aquifer system is mainly meteoric water with littleor no isotopic modification caused by evaporation.
EVOLUTION OF GROUNDWATER
In general, near-surface formations and the rechargeareas have low dissolved solid contents because of theshorter travel path of the water in the aquifers and the priorleaching of soluble material (Back, 1966). Dissolved solidsconcentration in groundwater increase along flow paths,through the aquifer because of dissolution of minerals(Freeze and Cherry, 1979). In other words, groundwater
Table 1. Summary statistics of chemical analysis results and charge balance errors
Formation Ca Mg Na K Cl CO3 HCO3 SO4 CBE(mg/l) (mg/l) (mg/l) (mg/l) (mg/l) (mg/l) (mg/l) (mg/l) %
Deccan TrapsN 3 3 3 3 3 3 3 3 3Min 12 2.4 7 1 4 0 55 0 -4.72Max 20 3.67 10 2.5 11 0 61 19 4.64Mean 14.67 3.24 9.00 1.57 7.33 0.00 59.00 10.00 0.66Median 12 3.66 10 1.2 7 0 61 11 2.05SD* 4.62 0.73 1.73 0.81 3.51 0.00 3.46 9.54 4.83
Semi consolidated sedimentariesN 59 59 59 59 59 59 59 59 59Min 4 2.44 5 0.4 4 0 18 0 -5.18Max 126 64.51 108 57 177 0 397 145 6.88Mean 36.00 11.83 29.02 5.94 34.27 0.00 146.93 21.69 -0.38Median 30 8.54 21 3.9 18 0 140 14 -0.45SD* 25.41 10.99 25.21 8.10 37.60 0.00 79.39 26.77 2.55
Precambrian sedimentariesN 113 113 113 113 113 113 113 113 113Min 6 2.4 3 0 4 0 24 0 -6.30Max 340 54.74 241 97 355 0 537 680 9.21Mean 63.50 18.66 46.43 7.76 54.44 0.00 231.74 63.37 -0.39Median 54 17.08 37 2 28 0 226 30 -0.52SD* 44.69 13.30 43.22 16.70 67.18 0.00 110.71 89.29 2.01
Precambrian metasediments and crystallinesN 148 148 148 148 148 148 148 148 148Min 4 2.44 5 0.2 7 0 37 0 -6.77Max 150 80.32 150 57 177 6 451 130 9.87Mean 47.42 13.64 28.83 3.87 38.26 0.04 176.53 26.48 -0.81Median 40 9.77 23 1.6 25 0 165 14 -0.81SD* 28.62 12.57 22.45 6.13 33.78 0.49 90.03 29.30 2.27
* SD – Standard deviation
JOUR.GEOL.SOC.INDIA, VOL.72, SEPT. 2008
HYDROCHEMICAL EVOLUTION OF GROUNDWATER IN THE PHREATIC AQUIFERS OF CHHATTISGARH 409
composition is influenced by the reaction between themineral phases and the groundwater. The degree to whichthe mineral phases react with the groundwater depends onthe contact time and the surface area per unit volume ofwater (Hem, 1985). Additional processes such as evaporationor evapotranspiration can increase concentrations ofdissolved solutes. Thus, dissolved solids concentrationgenerally can be used as an indicator of the degree ofchemical evolution of groundwater in an aquifer system.Chebotarev (1955) characterized regional changes in thedominant anion species in groundwater. The generalevolutionary sequence that he observed for the dominantanions was HCO3 to SO4 to Cl, which correlated withincreasing distance along the flow path and an increasing
age of water. This anion sequence also corresponded to anincrease in dissolved solids concentration. Water containingpredominantly bicarbonate is generally present in areas ofactive groundwater flushing, water containing predominantlysulphate is present where groundwater circulation is lessactive, and water containing predominantly chloride isgenerally present where groundwater flow is very sluggishand flushing of the aquifer is minimal.
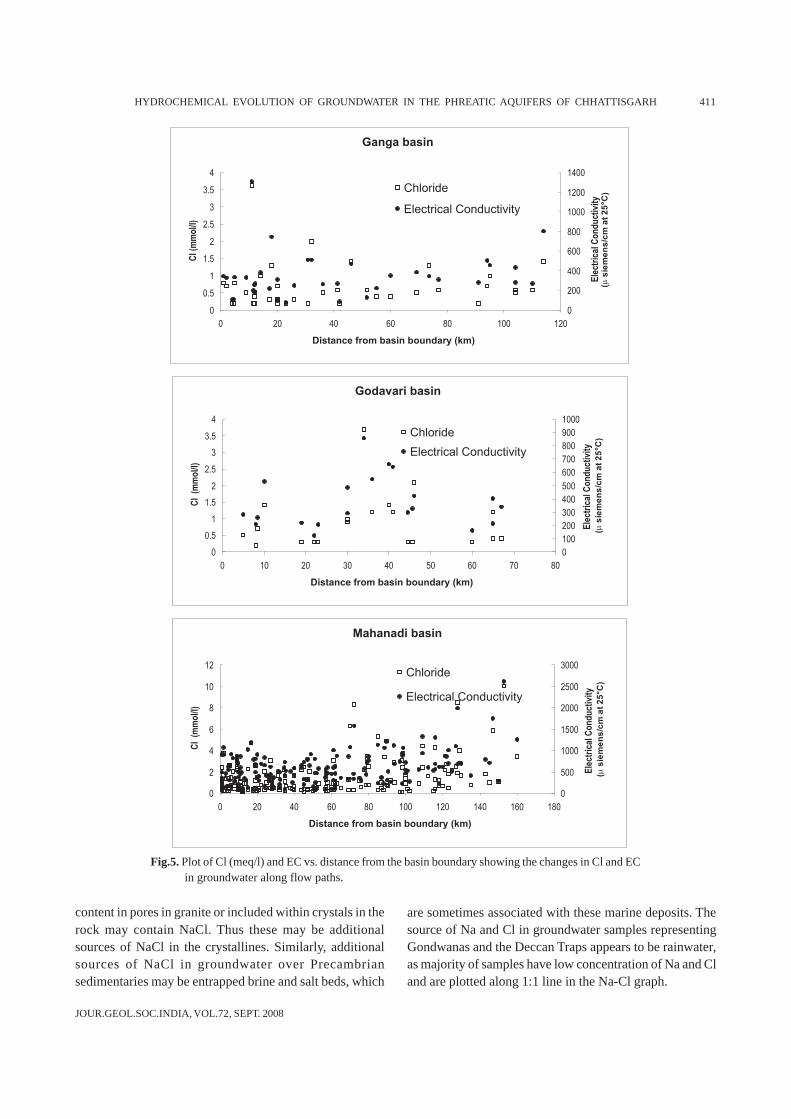
Electrical conductivity (which is a measure of totaldissolved solids in the water) and chloride concentrationscan be considered to define the extent of geochemicalevolution of groundwater. Electrical conductivities andchloride concentrations of groundwater samples representingdifferent basins were plotted (Fig. 5) against the respective
)
) -S
O4 -
80
60
40
20
)
) )
)))
)
)
)
)
))))
)
))
)
)
)
))
))
)))
)
)
))))
)
))))
))))
) )))
)
))))))
C
g
20
80
))
))
)
)))
)))))
))))))
))))
)
)
))))
))))
60
40
20
40Cl-
20 60 80
Precambrian Sedimentaries
)
))
)
Na
&K
+
+
80
20
a&
M++
++40
80
60
80 80
60
40
20
40
60
20
40
60
40
60
)) ) ))
)
)
))
))))
)))
)
)
)
))
))
)
))
)
)
))
)
)
20
SO
4 --
80
60
40
20
)
)
Ca
&M
g
40Cl -
20 60 80
Deccan Traps
80
+
80
++
++
Na
&K
+
+
80
20
40
80
60 60
40
20
60
40
60
4060
40
20
40
80
60
20
))
)
)
20
+
80
++Ca
80 60 40 20
60
Mg
++
20
40
80
)
) )
)
)
))
))) )
)
)
)
)
)))
))
)
))
)
)
)
)
)
))
)))
)
))
)) ) ))
))))
)
)
)
)
)
)
))
)))
)))) )
))
)
)
)))
))))
))))))
))
)
)
))
))
))
+
+
80
20
S
--
-4O
&C
l
)
)
)))
)
))
)))
)
)
))
))
)
++Ca80 60 40 20
)
))
)))
))
)
)))))
)
)
))))
)
)))))
))))))
))
)))))
))
)
)))
))))
)))
))
)
)
))
)
)
)
80
60
)
)
))
)
)))
)
) ))
))))
))
))
++M
g
20
40
20
60 SO
4--
80
40
)
)
)
)
))
)
)
)
)
Cl -20 40 60 80
)
)
)
)
)
)
)
)
)))))
))
))
))
)))))
)))))))
))
))
))))))) ))
) ))
))))
)))
))))))
))))
20
))))
))))))
))
))
80
80
60
40
20
))
)))))))
))))))))))))))))
))))))))
-
+
+
3Na
&K
)
+
+ &-C
O 3H
CO
3
-
-
40
++
++
20
80
60
)
80
60
40
20
40
60
20
))
Ca
&M
g
60
40
)
))
)))
)))))
))) )
))
))
))
)))
)
)
))
))))
))
))
)
)
)
)
))
)
))
))
) )
)
)
))
)
)
)
)
)))
))))
)
))))
)
) ))
))))
)
)
)
) )
)))
)))
)
)
))
))
))
)
)))
)
)))
)
)))))
)))
)))
))
)
)
)
)
))
)
)
60
40
20
80
SO
4--
20
4S
O --
80
60
40
80- 60- 60 80
))
)
)
)))
)))
)
)
80
20
80
20
)) )))) ))))))
)
)
)
60
40
20
)
)))
)
)
)))
))
))
)
)
))
)
8080
40Cl
20 40Cl
20
Semi-consolidated sedimentaries (Gondwanas)
20
+
20
+
+
+
Na
&K
+
60
40
20
40
80
60
20
60
40
60
404040
6060
))
40
80
60
20
))
)
))
)
)
++
++
Ca
&M
g++
++
80
20
40
80
60 60
40
20
80
20
40
80
60 60
40
20
)
)
)
)
)
)
) )
)
)
)
)
)
)
)
)
)
Ca
&M
g
80
40
60
)
Ca ++60 40 20
Crystallines
)
)
))))
))
)))
)
)
)
)
))
))
)))
)
)
)
)
20
80
))
))))) )
))
)))))
)))))))))
))))
)))))
)
)
))
)
)))
))
)
)
Mg
))
))) ))
))))
)))
))))
)
)))
))
)
)
)))
)))
))
)
))
)))
)
)))))))
)
)))
)))
)
80
++
20
40
80
60
)
)
))
))
))))
) ) )
)) )
))
)
)
)
)
)))
)
))
)
)
)
++
Na
&K
+
80
20
80
20
40Ca ++
40Ca ++
)
)
)
)
)
)
)
)))
)
)
)
)
)
)
)
)
)
60
80
80 6080 60
)
Mg
60
)
)
)
))))
))
)
)
)
))))))
)
))
))
)
80
Mg
++
20
4040
++
20
&-C
O 3H
CO
3
-
-
S
--
-4O
&C
l
&-C
O 3H
CO
3
-
-
&-C
O 3H
CO
3
-
-
S
--
-4O
&C
l
S
--
-4O
&C
l
)
) -S
O4 -
80
60
40
20
)
) )
)))
)
)
)
)
))))
)
))
)
)
)
))
))
)))
)
)
))))
)
))))
))))
) )))
)
))))))
C
g
20
80
))
))
)
)))
)))))
))))))
))))
)
)
))))
))))
60
40
20
40Cl-
20 60 80
Precambrian Sedimentaries
)
))
)
Na
&K
+
+
80
20
a&
M++
++40
80
60
80 80
60
40
20
40
60
20
40
60
40
60
)) ) ))
)
)
))
))))
)))
)
)
)
))
))
)
))
)
)
))
)
)
20
SO
4 --
80
60
40
20
)
)
Ca
&M
g
40Cl -
20 60 80
Deccan Traps
80
+
80
++
++
Na
&K
+
+
80
20
40
80
60 60
40
20
60
40
60
4060
40
20
40
80
60
20
))
)
)
20
+
80
++Ca
80 60 40 20
60
Mg
++
20
40
80
)
) )
)
)
))
))) )
)
)
)
)
)))
))
)
))
)
)
)
)
)
))
)))
)
))
)) ) ))
))))
)
)
)
)
)
)
))
)))
)))) )
))
)
)
)))
))))
))))))
))
)
)
))
))
))
+
+80
20
S
--
-4O
&C
l
)
)
)))
)
))
)))
)
)
))
))
)
++Ca80 60 40 20
)
))
)))
))
)
)))))
)
)
))))
)
)))))
))))))
))
)))))
))
)
)))
))))
)))
))
)
)
))
)
)
)
80
60
)
)
))
)
)))
)
) ))
))))
))
))
++M
g
20
40
20
60 SO
4--
80
40
)
)
)
)
))
)
)
)
)
Cl -20 40 60 80
)
)
)
)
)
)
)
)
)))))
))
))
))
)))))
)))))))
))
))
))))))) ))
) ))
))))
)))
))))))
))))
20
))))
))))))
))
))
80
80
60
40
20
))
)))))))
))))))))))))))))
))))))))
-
+
+
3Na
&K
)
+
+ &-C
O 3H
CO
3
-
-
40
++
++
20
80
60
)
80
60
40
20
40
60
20
))
Ca
&M
g
60
40
)
))
)))
)))))
))) )
))
))
))
)))
)
)
))
))))
))
))
)
)
)
)
))
)
))
))
) )
)
)
))
)
)
)
)
)))
))))
)
))))
)
) ))
))))
)
)
)
) )
)))
)))
)
)
))
))
))
)
)))
)
)))
)
)))))
)))
)))
))
)
)
)
)
))
)
)
60
40
20
80
SO
4--
20
4S
O --
80
60
40
80- 60- 60 80
))
)
)
)))
)))
)
)
80
20
80
20
)) )))) ))))))
)
)
)
60
40
20
)
)))
)
)
)))
))
))
)
)
))
)
8080
40Cl
20 40Cl
20
Semi-consolidated sedimentaries (Gondwanas)
20
+
20
+
+
+
Na
&K
+60
40
20
40
80
60
20
60
40
60
404040
6060
))
40
80
60
20
))
)
))
)
)
++
++
Ca
&M
g++
++
80
20
40
80
60 60
40
20
80
20
40
80
60 60
40
20
)
)
)
)
)
)
) )
)
)
)
)
)
)
)
)
)
Ca
&M
g
80
40
60
)
Ca ++60 40 20
Crystallines
)
)
))))
))
)))
)
)
)
)
))
))
)))
)
)
)
)
20
80
))
))))) )
))
)))))
)))))))))
))))
)))))
)
)
))
)
)))
))
)
)
Mg
))
))) ))
))))
)))
))))
)
)))
))
)
)
)))
)))
))
)
))
)))
)
)))))))
)
)))
)))
)
80
++
20
40
80
60
)
)
))
))
))))
) ) )
)) )
))
)
)
)
)
)))
)
))
)
)
)
++
Na
&K
+
80
20
80
20
40Ca ++
40Ca ++
)
)
)
)
)
)
)
)))
)
)
)
)
)
)
)
)
)
60
80
80 6080 60
)
Mg
60
)
)
)
))))
))
)
)
)
))))))
)
))
))
)
80
Mg
++
20
4040
++
20
&-C
O 3H
CO
3
-
-
S
--
-4O
&C
l
&-C
O 3H
CO
3
-
-
&-C
O 3H
CO
3
-
-
S
--
-4O
&C
l
S
--
-4O
&C
l
Fig.2. Piper trilinear diagrams showing groundwater types in different hydrostratigraphic units in Chhattisgarh.
Precambrian sedimentaries
JOUR.GEOL.SOC.INDIA, VOL.72, SEPT. 2008
410 R. K. RAY AND RUMI MUKHERJEE
distances from water divide. None of the plots showed anydefinite trend, which is again a consequence of shorter flowpaths. Groundwater composition is mostly controlled bylocal scale water rock interactions.
Several studies have shown that groundwater at shallowdepths normally develops as bicarbonate type irrespectiveof rock type (Kortatsi, 2006). Precambrian sedimentaries,as discussed earlier, comprise limestone, sandstone, shaleand dolomite. There is abundance of bicarbonate in thesesource rocks. Similarly, the sedimentary units of Gondwanaalso have carbonates. The chemical evolution of thegroundwaters in these rocks can be explained by directinfiltration of rainfall with subsequent uptake of soil-CO2
resulting in the dissolution of calcite and dolomite. Ingeneral, dissolution of dolomite is slower than that of calciteand may often take place in significant amounts only belowthe water table under closed system conditions (Busenbergand Plummer, 1982; Matter et al. 2005). In the crystallines
and the Deccan Traps, development of Ca-HCO3 type watermay be attributed to the reaction of CO2 in the weatheredzone with ferromagnesian minerals and Ca-plagioclase. Animportant source of Ca is the dissolution of small quantityof carbonate minerals present as veins. Garrels andMacKenzie (1967) showed that Ca-HCO3 type water withlow concentration of dissolved solids is formed due toreaction of feldspars and biotite with infiltrating rainwater(cf. Schwartz and Zhang, 2003).
In general, groundwater in Chhattisgarh is low in SO4
content. However, in the central part small areas arecharacterised by high sulphate in groundwater. These areasare underlain by Raigarh Formation and gypsyferousManiyari shale. Though SO4 occurrence is highly sporadicin nature, it is a very important factor in Chhattisgarh as faras quality of drinking water is concerned. In these areas,water becomes brackish due to high sulphate content.Highest concentration of SO4 reported is 1350 mg/l in partsof Durg district. Major sources of SO4 are gypsum andanhydrite, which are much more soluble in natural waterscompared to carbonate minerals (Seidell, 1958; Freeze andCherry, 1979). During drilling in these formations, gypsumveins have been report at several places (CGWB, 2006).Gypsum veins are also sometimes seen as surface exposurein these areas.
Na-Cl concentration in groundwater is generally low.On a plot of Na-Cl (meq/l), samples along 1:1 line (Na+/(Na+ + Cl) =0.5) indicate halite/sea spray or similar sourcesof Na in groundwater (Kortatsi, 2006). As worked out fromdata provided by Sequira and Kelkar (1978), the averageNa/(Na+Cl) (meq/l) ratio of rainwater in India is also 0.515.Meteoric waters form an important source for both Na andCl in groundwater. There may be other sources of Na-Clalso. Shand (1952) quoted data indicating residual water
Fig.3. Distribution of predominant anion types in the phreaticaquifers of Chhattisgarh.
y = 8.7259x + 10.368
R2 = 0.9411
-50
-45
-40
-35
-30
-25
-20
-15
-10
-5
0
-8-6-4-20
d18O
dD
Fig.4. δD vs δ18O plot of groundwater samples from Chhattisgarh.
Legend
Bicarbonate type
Chloride type
Sulphate type
No predominant type19°
18°
24°
23°
22°
21°
20°
81° 82°
0 50 100
kilometres
83° 84°
RAIGARH
JANJGIR - CHAMPA
JASHPUR
KORBA
DHAMTARI
RAIPUR
MAHASAMUND
DURG
RAJNANDGAON
KAWARDHA
BILASPUR
BASTAR
DANTEWADA
KANKER
KORIYASURGUJA
JOUR.GEOL.SOC.INDIA, VOL.72, SEPT. 2008
HYDROCHEMICAL EVOLUTION OF GROUNDWATER IN THE PHREATIC AQUIFERS OF CHHATTISGARH 411
content in pores in granite or included within crystals in therock may contain NaCl. Thus these may be additionalsources of NaCl in the crystallines. Similarly, additionalsources of NaCl in groundwater over Precambriansedimentaries may be entrapped brine and salt beds, which
are sometimes associated with these marine deposits. Thesource of Na and Cl in groundwater samples representingGondwanas and the Deccan Traps appears to be rainwater,as majority of samples have low concentration of Na and Cland are plotted along 1:1 line in the Na-Cl graph.
Ganga basin
0
0.5
1
1.5
2
2.5
3
3.5
4
0 20 40 60 80 100 120
Distance from basin boundary (km)
Cl(
mm
ol/l
)
0
200
400
600
800
1000
1200
1400
Ele
ctri
calC
on
du
ctiv
ity
Chloride
Electrical Conductivity
(ms
iem
en
s/c
ma
t2
5°C
)
Godavari basin
0
0.5
1
1.5
2
2.5
3
3.5
4
0 10 20 30 40 50 60 70 80
Distance from basin boundary (km)
Cl
(mm
ol/l
)
0
100
200
300
400
500
600
700
800
900
1000
Ele
ctri
calC
on
du
ctiv
ity
Chloride
Electrical Conductivity
(ms
iem
en
s/c
ma
t2
5°C
)
Mahanadi basin
0
2
4
6
8
10
12
0 20 40 60 80 100 120 140 160 180
Distance from basin boundary (km)
Cl
(mm
ol/l
)
0
500
1000
1500
2000
2500
3000
Ele
ctri
calC
on
du
ctiv
ity
Chloride
Electrical Conductivity
(ms
iem
en
s/c
ma
t2
5°C
)
Fig.5. Plot of Cl (meq/l) and EC vs. distance from the basin boundary showing the changes in Cl and ECin groundwater along flow paths.
JOUR.GEOL.SOC.INDIA, VOL.72, SEPT. 2008
412 R. K. RAY AND RUMI MUKHERJEE
Precambrian Sedimentaries
0
2
4
6
8
10
12
14
0 2 4 6 8 10 12 14
Cl (meq/l)
Na
(meq
/l)
Crystallines
0
2
4
6
8
10
12
14
0 2 4 6 8 10 12 14
Cl (meq/l)
Na
(meq
/l)
Gondwana
0
2
4
6
8
10
12
14
0 2 4 6 8 10 12 14
Cl (meq/l)
Na
(meq
/l)
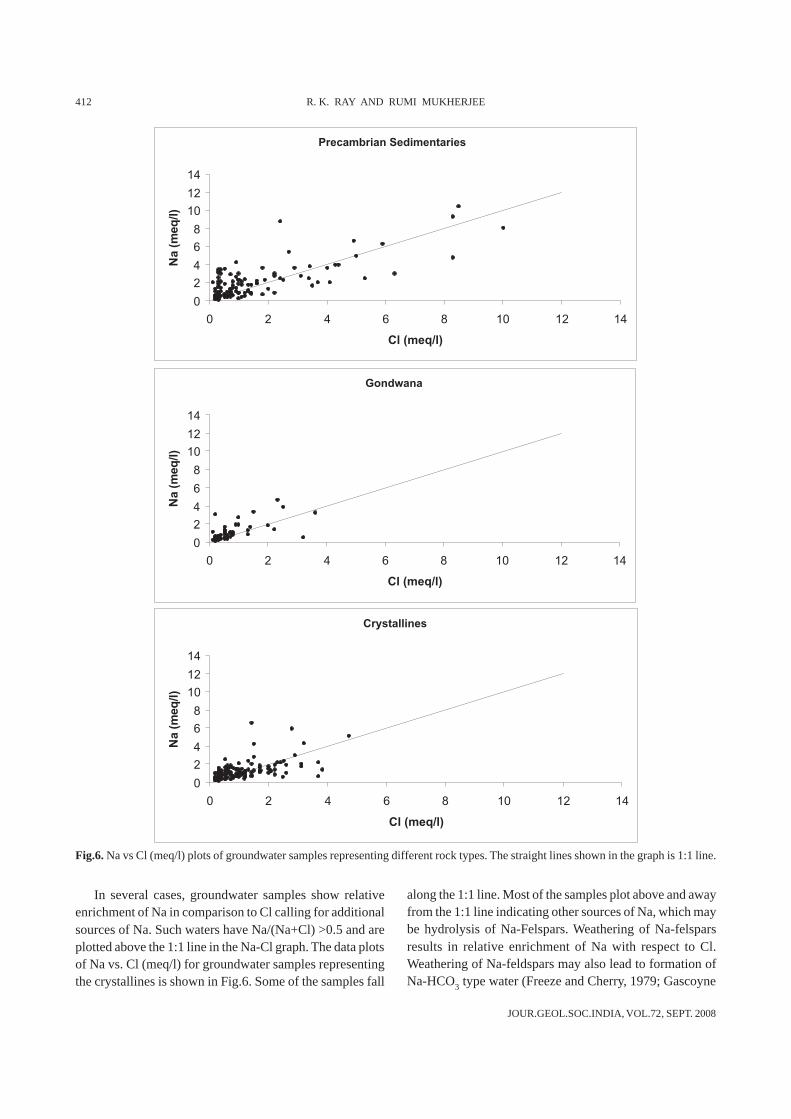
Fig.6. Na vs Cl (meq/l) plots of groundwater samples representing different rock types. The straight lines shown in the graph is 1:1 line.
In several cases, groundwater samples show relativeenrichment of Na in comparison to Cl calling for additionalsources of Na. Such waters have Na/(Na+Cl) >0.5 and areplotted above the 1:1 line in the Na-Cl graph. The data plotsof Na vs. Cl (meq/l) for groundwater samples representingthe crystallines is shown in Fig.6. Some of the samples fall
along the 1:1 line. Most of the samples plot above and awayfrom the 1:1 line indicating other sources of Na, which maybe hydrolysis of Na-Felspars. Weathering of Na-felsparsresults in relative enrichment of Na with respect to Cl.Weathering of Na-feldspars may also lead to formation ofNa-HCO3 type water (Freeze and Cherry, 1979; Gascoyne
JOUR.GEOL.SOC.INDIA, VOL.72, SEPT. 2008
HYDROCHEMICAL EVOLUTION OF GROUNDWATER IN THE PHREATIC AQUIFERS OF CHHATTISGARH 413
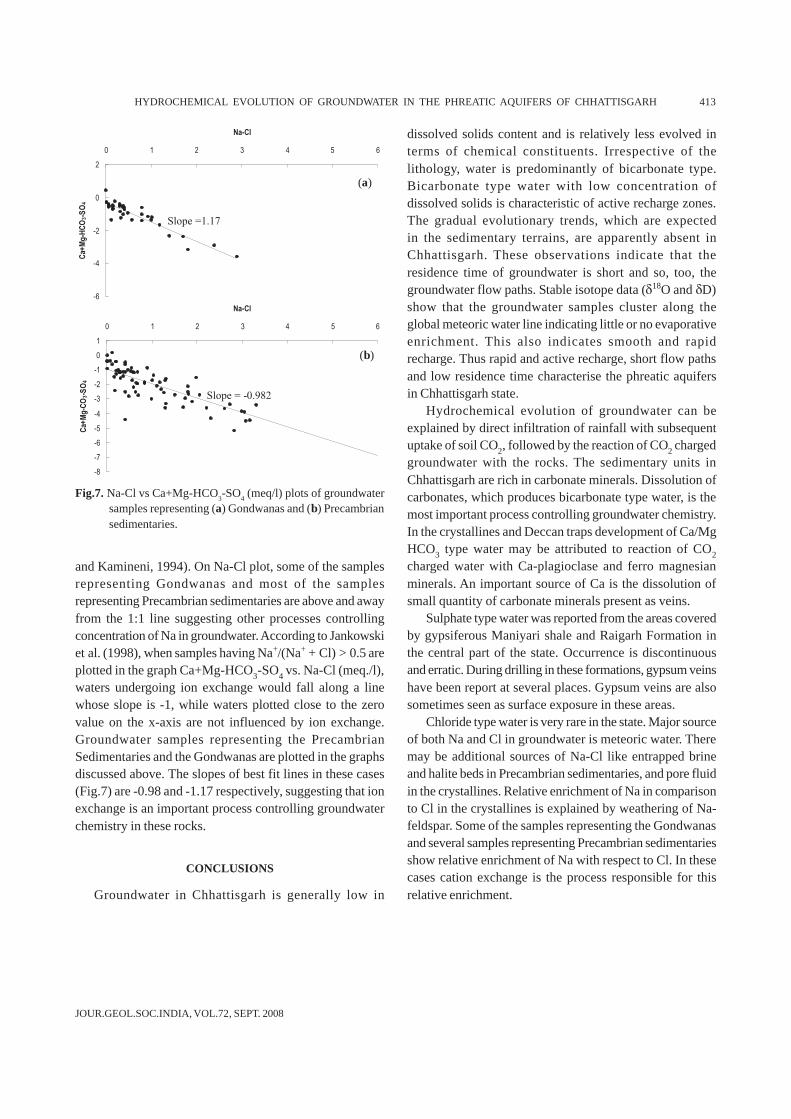
and Kamineni, 1994). On Na-Cl plot, some of the samplesrepresenting Gondwanas and most of the samplesrepresenting Precambrian sedimentaries are above and awayfrom the 1:1 line suggesting other processes controllingconcentration of Na in groundwater. According to Jankowskiet al. (1998), when samples having Na+/(Na+ + Cl) > 0.5 areplotted in the graph Ca+Mg-HCO3-SO4 vs. Na-Cl (meq./l),waters undergoing ion exchange would fall along a linewhose slope is -1, while waters plotted close to the zerovalue on the x-axis are not influenced by ion exchange.Groundwater samples representing the PrecambrianSedimentaries and the Gondwanas are plotted in the graphsdiscussed above. The slopes of best fit lines in these cases(Fig.7) are -0.98 and -1.17 respectively, suggesting that ionexchange is an important process controlling groundwaterchemistry in these rocks.
CONCLUSIONS
Groundwater in Chhattisgarh is generally low in
y = -1.1747x - 0.296
-6
-4
-2
0
2
0 1 2 3 4 5 6
Na-Cl
Ca+
Mg
-HC
O3-S
O4
a. Gondwanas
Slope =1.17
y = -0.9825x - 0.9733
-8
-7
-6
-5
-4
-3
-2
-1
0
1
0 1 2 3 4 5 6
Na-Cl
Ca+
Mg
-CO
3-S
O4
b. Precambrian sedimentaries
Slope = -0.982
Fig.7. Na-Cl vs Ca+Mg-HCO3-SO4 (meq/l) plots of groundwatersamples representing (a) Gondwanas and (b) Precambriansedimentaries.
dissolved solids content and is relatively less evolved interms of chemical constituents. Irrespective of thelithology, water is predominantly of bicarbonate type.Bicarbonate type water with low concentration ofdissolved solids is characteristic of active recharge zones.The gradual evolutionary trends, which are expectedin the sedimentary terrains, are apparently absent inChhattisgarh. These observations indicate that theresidence time of groundwater is short and so, too, thegroundwater flow paths. Stable isotope data (δ18O and δD)show that the groundwater samples cluster along theglobal meteoric water line indicating little or no evaporativeenrichment. This also indicates smooth and rapidrecharge. Thus rapid and active recharge, short flow pathsand low residence time characterise the phreatic aquifersin Chhattisgarh state.
Hydrochemical evolution of groundwater can beexplained by direct infiltration of rainfall with subsequentuptake of soil CO2, followed by the reaction of CO2 chargedgroundwater with the rocks. The sedimentary units inChhattisgarh are rich in carbonate minerals. Dissolution ofcarbonates, which produces bicarbonate type water, is themost important process controlling groundwater chemistry.In the crystallines and Deccan traps development of Ca/MgHCO3 type water may be attributed to reaction of CO2
charged water with Ca-plagioclase and ferro magnesianminerals. An important source of Ca is the dissolution ofsmall quantity of carbonate minerals present as veins.
Sulphate type water was reported from the areas coveredby gypsiferous Maniyari shale and Raigarh Formation inthe central part of the state. Occurrence is discontinuousand erratic. During drilling in these formations, gypsum veinshave been report at several places. Gypsum veins are alsosometimes seen as surface exposure in these areas.
Chloride type water is very rare in the state. Major sourceof both Na and Cl in groundwater is meteoric water. Theremay be additional sources of Na-Cl like entrapped brineand halite beds in Precambrian sedimentaries, and pore fluidin the crystallines. Relative enrichment of Na in comparisonto Cl in the crystallines is explained by weathering of Na-feldspar. Some of the samples representing the Gondwanasand several samples representing Precambrian sedimentariesshow relative enrichment of Na with respect to Cl. In thesecases cation exchange is the process responsible for thisrelative enrichment.
(a)
(b)
JOUR.GEOL.SOC.INDIA, VOL.72, SEPT. 2008
414 R. K. RAY AND RUMI MUKHERJEE
References
California. Trans. Amer. Geophys. Union, v.21, pp.46-49.JANKOWSKI, J., ACWORTH, R.I. and SHEKARFOROUSH, S. (1998)
Reverse ion-exchange in deeply weathered porphyritic dacitefractured aquifer system, Yass, New South Wales, Australia.In: G.B. Arehart and J.R. Hulston (Eds.), Proc. 9th Int. Symp.Water–Rock interaction. Taupo, New Zealand, 30 March–April1998, Balkema, Rotterdam, pp.243-246.
KORTATSI, B.K. (2006) Hydrochemical framework of groundwaterin the Ankora Basin, Ghana. Aquatic Geochemistry, 10.1007/s10498-006-9006-4
MATTER, J.M., WABER, H.N., LOEW, S. and MATTER, A. (2005)Recharge areas and geochemical evolution of groundwater inan alluvial aquifer system in the Sultanate of Oman.Hydrogeology Jour., v.14, pp.203–224.
MEISLER, H. and KNOBEL, L.L. (1994) Documentation ofhydrochemical facies data and ranges of dissolved solidsconcentrations for the north Atlantic Coastal Plain aquifersystem: New Jersey, Delaware, Maryland, Virginia and NorthCarolina. USGS open file report, 94,492, 9p.
MISHRA, A.K. and MOHAPATRA, P.K. (2002) Ground Water Scenarioin Chhattisgarh. National Seminar on Science, Technology andWater, Ravi Shankar Shukla University, Raipur.
MORGAN, C.O. and WINNER-JR, M.D. (1962) Hydrochemical faciesin the 400 foot and 600 foot sands of the Baton Rouge area,Louisana. USGS Prof. Paper, 450-B, pp.B120-B121.
PIPER, A.M. (1944) A graphic procedure in the geochemicalinterpretation of water analyses. Amer. Geophys. Union Trans.,v.25, pp.914-923.
SCHWARTZ, F.W. and ZHANG, H. (2003) Fundamentals ofGroundwater. John Wiley and sons Inc., 583p.
SEABER, P.R. (1962) Cation hydrochemical facies of groundwaterin the English town formation, New Jersey. USGS Prof. Paper,450-B, pp. B124-B126.
SEIDELL, A. (1958) Solubilities, 1, 4th edn., American ChemicalSociety, D van Nostrand Co., Princeton, N.J.
SEQUIRA, R. and KELKAR, D. (1978) Geochemical implications ofsummer monsoonal rainwater composition over India. Jour.Applied Meteorology (American Meteorological Society),v.17, pp.1390-1396.
SHAND, S.J. (1952) Rocks for chemists. Pitman Publishing Co.,New York.
BACK, W. (1961) Techniques for mapping of hydrochemical facies.USGS Prof. Paper, 424-D, pp.380-382.
BACK, W. (1966) Hydrochemical facies and groundwater flowpatterns in Northern part of Atlantic coastal plain. USGS Prof.Paper, 498-A, 42p.
BUSENBERG, E. and PLUMMER, L.N. (1982) The kinetics ofdissolution of dolomite in CO2–H2O systems at 1.5 to 65.Cand 0 to 1 atm. Amer. Jour. Sci., v.282, pp.45-78.
C.G.W.B. (2005) Ground Water Year Book of Chhattisgarh (2004-05). Unpublished Report, CGWB, NCCR, Raipur, India.
C.G.W.B. (2006) State Report: Hydrogeology of Chhattisgarh.Unpublished Report, CGWB, NCCR, Raipur, India, 184p.
CHEBOTAREV, I. I. (1955) Metamorphism of natural waters in thecrust of weathering. Geochim. Cosmochim. Acta, v.8, pp.22-48, 137-170, 198-212.
CRAIG, H. (1961) Isotope variations in meteoric waters. Science,v.133, pp.1702-1703.
DAS, D.P., KUNDU, A., DUTTA, D.R., KUMARAN, K., RAMAMURHTY ,S., THANAVELU, C. and RAGAIYA, V. (1992) Lithostratigraphyand sedimentation of Chhattisgarh basin. Indian Minerals,v.46(3&4), pp.271-288.
FREEZE, R.A. and CHERRY, J.A. (1979) Groundwater. Prentice HallInc., Englewood Cliffs, N.J., 604p.
GARRELS, R.M. and MACKENZIE, F.T. (1967) Origin of the chemicalcompositions of some springs and lakes. In: Gould RF(ed)Equilibrium concepts in natural water systems. Am. Chem.Soc., Adv. Chem. Ser. 67, Washington DC, pp.222-242.
GASCOYNE, M. and KAMINENI , D.C. (1994) The hydrogeochemistryof fractured plutonic rocks in the Canadian Shield. AppliedHydrogeology, v.2, pp.43-49.
GONFIANTINI, R. (1986) Environmental isotopes in lake studies.In: P. Fritz and J.-Ch Fontes (Eds.), The TerrestrialEnvironment. Handbook of Environmental IsotopeGeochemistry, v.2, Elsevier, Amsterdam, pp.113-168.
GUPTA, S.K. and DESHPANDE, R.D. (2005) Groundwater isotopicinvestigations in India: What has been learned? Curr. Sci.,v.89(5), pp.825-835.
HEM, J.D. (1985) Study and Interpretation of the ChemicalCharacteristics of Natural Water, 3rd Edn., USGS WSP, 2254,263p.
HILL , R.A. (1940) Geochemical patterns in Coachella Valley,
(Received: 19 November 2007; Revised form accepted: 4 March 2008)


