Embed Size (px)
Citation preview

(This is a sample cover image for this issue. The actual cover is not yet available at this time.)
This article appeared in a journal published by Elsevier. The attachedcopy is furnished to the author for internal non-commercial researchand education use, including for instruction at the authors institution
and sharing with colleagues.
Other uses, including reproduction and distribution, or selling orlicensing copies, or posting to personal, institutional or third party
websites are prohibited.
In most cases authors are permitted to post their version of thearticle (e.g. in Word or Tex form) to their personal website orinstitutional repository. Authors requiring further information
regarding Elsevier’s archiving and manuscript policies areencouraged to visit:
http://www.elsevier.com/copyright
Author's personal copy
Bacterial filtration rates in repacked and weathered soil columns
A. Safadoust a, A.A. Mahboubi a,⁎, B. Gharabaghi b, M.R. Mosaddeghi c, P. Voroney d, A. Unc e, Gh. Sayyad f
a Department of Soil Science, College of Agriculture, Bu-Ali Sina University, Hamadan, 65174, Iranb School of Engineering, University of Guelph, Guelph, Ontario, N1G 2W1, Canadac Department of Soil Science, College of Agriculture, Isfahan University of Technology, Isfahan, 84156-83111, Irand School of Environmental Sciences, University of Guelph, Guelph, Ontario, N1G 2W1, Canadae Plant and Environmental Sciences, New Mexico State University, Las Cruces, NM 88003-8003, USAf Department of Soil Science, College of Agriculture, Shahid Chamran University of Ahvaz, Iran
a b s t r a c ta r t i c l e i n f o
Article history:Received 29 November 2010Received in revised form 26 June 2011Accepted 24 August 2011Available online xxxx
Keywords:Repacked soilWeathered soilFiltration coefficientPreferential flowTension infiltrometer
Knowledge of the transport and deposition behavior for pathogenic Escherichia coli is needed to assess con-tamination and protect water resources. We evaluated the effects of repacked (R) and physically and biolog-ically weathered (PBW) columns of sandy loam and clay loam soils on the transport and retention of E. coliand bromide under saturated and unsaturated flow conditions. PBW soil columns were weathered outdoorsby exposure to wetting, drying, freezing and thawing cycles during the winter of 2008 and spring and sum-mer of 2009. These physically weathered soil columns were subjected to additional 6 months of biologicalweathering by 20 earthworms placed onto each soil columns. Nalidixic acid-resistant E. coli (E. coli NAR)and bromide (Br) were employed as pulse tracers and their temporal and spatial variabilities were monitoredin the leachate samples. The flow regimes (inlet suction 0 for saturated and 5 hPa for unsaturated) were con-trolled using a tension infiltrometer. Cumulative percentage and maximum concentrations (Cmax) of Br and E.coli NAR and filtration coefficients (λf) of E. coli NAR were assessed. In the repacked soil columns, averagebacterial concentration and Cmax in leachate were lower, likely due to enhanced pollutant/soil particle inter-actions at low water fluxes. The largest λf occurred in the repacked clay loam soil. Accelerated water veloci-ties through preferential flow pathways were likely responsible for the smaller filtration coefficients in thePBW columns. Unsaturated flow conditions resulted in larger λf values for E. coli NAR and smaller Cmax valuesfor both tracers.
© 2011 Elsevier B.V. All rights reserved.
1. Introduction
The processes governing transport of pathogenic microorganismsin soil have been described in several review articles (Abu-Ashouret al., 1994; Foppen and Schijven, 2006; Unc and Goss, 2004). Fonteset al. (1991) and Gannon et al. (1991) identified flow condition, filtra-tion, straining and retention as the major processes determining bac-terial transport through soil. Natsch et al. (1996) reported that rainfallinduced vertical displacement of bacteria deeper in the soil profile,which was attributed to macropore flow. This rainfall-induced prefer-ential flow resulted in bacterial transport to depth of at least 30 m(Crane and Moore, 1984). Soil structure and the velocity of soilwater flow are thus identified as critical factors for bacterial transportthrough soils (Smith et al., 1985). Water flow governing conditionssuch as soil water saturation status has also been documented as akey factor for bacteria displacement through the vadose zone(McMurry et al., 1998; Unc and Goss, 2003).
Retention of bacteria in soilsmay occur by either chemical (Marshall,1980) or physical (Smith et al., 1985)mechanisms. Clogging, sorption ofbacteria to the soil phase, the interplay of van derWaals and electrostat-ic forces are factors that govern apparent filtration of bacteria in soils(Mozes et al., 1986). Thus soil texture and structure, soil hydraulic prop-erties, organicmatter content, soil acidity and ionic strength of soil solu-tion may all affect bacterial transport through the soil profile (Gagliardiand Karns, 2000; Mosaddeghi et al., 2009; Schafer et al., 1998; Unc andGoss, 2003).
Soil columns are common models employed in microbial trans-port investigations. Repacked soil columns have been used in numer-ous bacterial and solute transport studies (e.g. Gannon et al., 1991;Smith et al., 1985) even though both the pore size distribution andpore continuity are altered. The use of intact field soil columns hasalso been reported (Dousset et al., 2007; Jiang et al., 2005; McLeodet al., 2003; Mosaddeghi et al., 2010). However even these relativelyundisturbed columns may produce ambiguous results (Dousset etal., 1995) due to possible changes in soil structure during sampling.We hypothesized that the use of repacked weathered columns thatallow natural formation of aggregates and pore networks may givemore realistic transport simulations. This study assessed the influence
Geoderma 167-168 (2011) 204–213
⁎ Corresponding author. Tel.: +98 811 4424366; fax: +98 811 4424012.E-mail address: [email protected] (A.A. Mahboubi).
0016-7061/$ – see front matter © 2011 Elsevier B.V. All rights reserved.doi:10.1016/j.geoderma.2011.08.014
Contents lists available at SciVerse ScienceDirect
Geoderma
j ourna l homepage: www.e lsev ie r .com/ locate /geoderma
Author's personal copy
of soil type on the movement of E. coli NAR and bromide in a labora-tory setting, using large repacked and weathered soil columns, undersaturated and unsaturated flow conditions. Major indicators of bacte-rial transport kinetics are reported.
2. Materials and methods
Repacked and weathered soil columns were used to evaluate theeffects of soil texture, soil structure and flow conditions on the trans-port parameters of E. coli NAR and Br as a function of soil depth.
2.1. Soil preparation and treatments
Sandy loam (SL) and clay loam (CL) soils that were classified asfine loamy mixed (calcareous) mesic typic Xerorthents and clayeyskeletal carbonic mesic typic Xerorthents, respectively according toUSDA classification (Soil Survey Staff, 2010) were sampled from theHamadan Province, in western Iran. The region has a semi-arid cli-mate, with long-term average annual precipitation of 328 mm, mostof precipitation occurs during the winter months. Monthly meantemperatures ranges from a high of 37.5 °C observed in July to a lowof −30 °C noted in January.
Five cylinders of 10 cm and one cylinder of 5 cmheight (all of 22 cmdiameter)were used to sample successive layers of the soil profile up to45 cm depth. For making repacked columns, fresh soil was gentlypassed through an 8-mm sieve (with minimal destruction of aggre-gates) to remove likely gravel and stones (even though this procedurewas carried out no stones or gravel were present). Each sieved samplecomposed of different-sized aggregates (mainly macroaggregate) andsoil particles were poured into large PVC cylinder respecting the origi-nal order of sampling. The repacked soil columns did not have anymacro-structural features, such as macropores and cracks, but retainedmicro-structural features, such as intra-aggregates micropores. All col-umnswere prepared in duplicate for a total of sixteen repacked soil col-umns (R). Average measured soil physical properties shown in Table 1illustrate the soil's relative homogeneity with depth, likely due tolong-term use of conventional tillage.
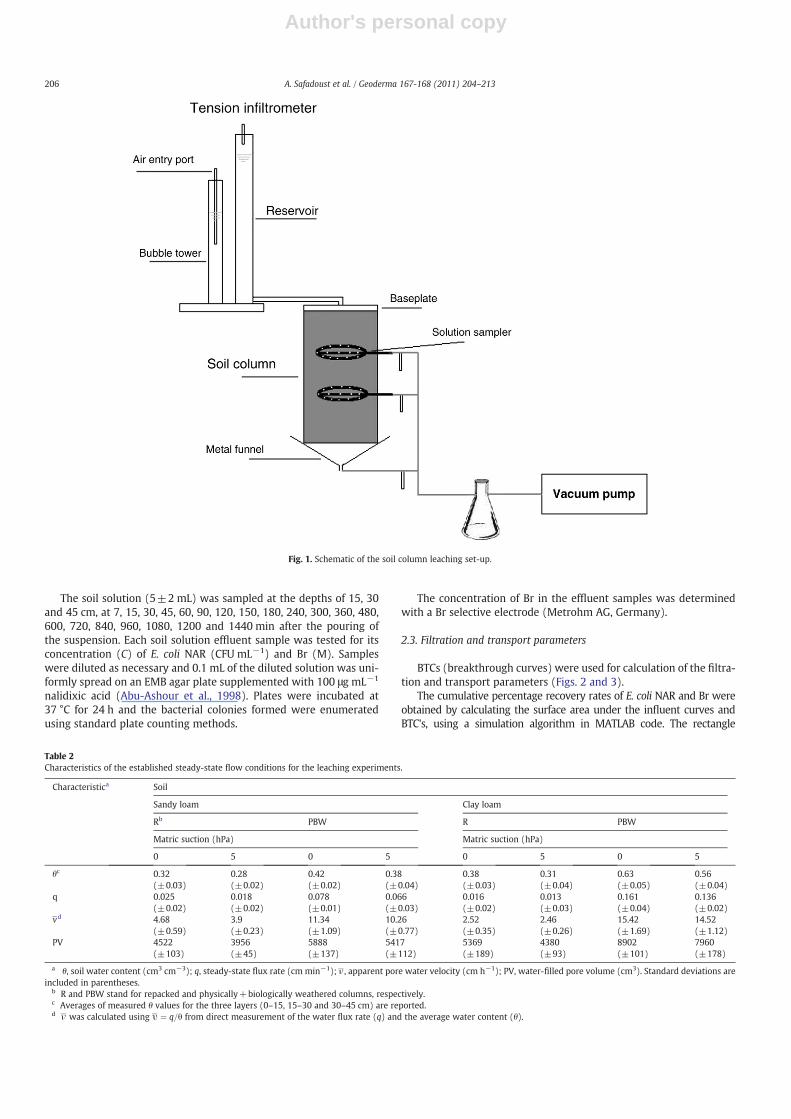
Solution samplers were installed at depths of 15 and 30 cm beforerepacking the soil similar to Mosaddeghi et al. (2010). However inorder to minimize changes in the soil water content around the sam-pler during vacuum application we manufactured a solution samplerfrom a plastic micro pump tube with the internal diameter of 1 mm.The top wall of the tube was porous allowing collection of the soil so-lution with minimal disturbance of the overall water flux (Fig. 1).
For reconstitution of soil structure through weathering, half of thepacked columns (8 columns) were subjected, at the sampling site, tonaturally occurring wetting/drying and freezing/thawing cycles fromthe winter of 2008 through the fall of 2009. For this the columns wereburied vertically into the soil, such that their top surface was levelwith the field surface. To avoid slaking of soil surface columnswere uni-formly covered with straw before sampling. The lower column inter-faces were in contact with the underlying soil, permitting naturaldrainage. During the weathering the columns were subjected to 5 and6 freeze/thaw, and wet/dry cycles respectively. Further, 6 months of
biological weathering was imposed in the spring of 2009 by placing20 earthworms (Red Worms, Eisenia fetida) onto the soil surface. Thusthe treatments included columns of repacked sandy loam (SL-R) andclay loam (CL-R) soils, and identical but weathered sandy loam (SL-PBW) and clay loam (CL-PBW) soil columns.
2.2. Tracers and leaching setup
A nalidixic acid-resistant E. coli strain (E. coli NAR) donated by thePasteur Institute of Iran was used as the biotracer. E. coli NAR is astrain of E. coli which is resistant to antibiotic nalidixic acid. This ad-vantage leads E. coli NAR to be used as a biotracer by many re-searchers, since except E. coli NAR other soil native bacteria are notable to grow in media containing nalidixic acid. Bromide as KBr wasused as the conservative non-reactive chemical tracer.
The bacterial cell suspension was prepared as described by Abu-Ashour et al. (1998) with minor modifications. The bacterial inocu-lums were prepared from colonies formed on nalidixic acid amendedEMB agar (Eosin Methylene Blue) (Abu-Ashour et al., 1998) after 24 hincubation at 37 °C. Colonies were removed by washing the agarplates with 10 mL of distilled water, twice. Bacterial cell density wasadjusted by serial dilution and colony counting.
The suspension had an influent of concentration (Cinfluent) of3.5×108 CFUs (colony forming units) mL−1 of E. coli NAR and0.025 mol Br L−1 with a pH of 7.2 (712 Conductometer, MetrohmAG, Filderstadt, Germany) and salinity (EC) of 4.656 dS m−1 (Jenway3510, Bibby Scientific Ltd., Staffordshire, UK).
Leaching experimentswere carried out under saturated and unsatu-rated steady state flow conditions, imposed and controlled through theuse of a tension infiltrometer (Soil Measurement Systems LLC, Tucson,Arizona). The physical characteristics of the soil columns under the cor-responding flow condition are summarized in Table 2. Liquid paraffinwas used to lubricate the internal walls of the cylinders before repack-ing the soil columns to prevent preferential flow along the columnwalls at saturated flow condition. Tomaintain a steady-state unsaturat-ed flow a 5 (±0.2)hPa suction was applied to the bottom of each soilcolumn using a vacuum pump. For the saturated flow condition the in-flow and outflow fluxes were equal with the exception of the repackedclay loam soil columns where a negative pressure head of 0.4 (±0.1)hPa was applied to establish the steady-state flow condition. A sche-matic of the leaching set-up is shown in Fig. 1.
After the steady-state flowwas established, the disk of the tensioninfiltrometer was lifted and 250 mL of the suspension containing3.5×108 CFUs of E. coli NAR mL−1 and 0.025 mol Br L−1 was pouredquickly and uniformly, over the surface of each column as describedby Jiang et al. (2005). The disk was replaced immediately. Monitoringof the effluent flow did not indicate any significant changes in the ef-fluent flow velocity. Subsequent leaching was carried out for the next24 h using the tension infiltrometer. Tap water with an EC of1.080 dS m−1 and pH of 7.56 was used. Since extended periods ofleaching could likely lead to growth and die-off of bacteria, thesame leaching time was applied for both saturated and unsaturatedflow conditions. The experiments were carried out at 20±2 °C.
Table 1Physical properties of the studied soils (average for 0–45 cm layer)a.
Texture Sand Silt Clay BDR MWDR BDPBW MWDPBW
(g 100 g−1) (g 100 g−1) (g 100 g−1) (Mg m−3) (mm) (Mg m−3) (mm)
Clay loam 41.00 31.00 28 1.36 1.91 1.28 2.23(±2.00) (±1.25) (±1.08) (±0.02) (±0.95) (±0.07) (±0.61)
Sandy loam 75.13 9.13 15.74 1.55 0.86 1.40 1.12(±2.88) (±0.72) (±2.20) (±0.03) (±0.41) (±0.05) (±0.07)
a BD, bulk density; MWD, mean weight diameter of soil aggregates; subscripts R and PBW stand for repacked and physically+biologically weathered columns, respectively. Stan-dard deviations are included in parentheses.
205A. Safadoust et al. / Geoderma 167-168 (2011) 204–213
Author's personal copy
The soil solution (5±2 mL) was sampled at the depths of 15, 30and 45 cm, at 7, 15, 30, 45, 60, 90, 120, 150, 180, 240, 300, 360, 480,600, 720, 840, 960, 1080, 1200 and 1440 min after the pouring ofthe suspension. Each soil solution effluent sample was tested for itsconcentration (C) of E. coli NAR (CFU mL−1) and Br (M). Sampleswere diluted as necessary and 0.1 mL of the diluted solution was uni-formly spread on an EMB agar plate supplemented with 100 μg mL−1
nalidixic acid (Abu-Ashour et al., 1998). Plates were incubated at37 °C for 24 h and the bacterial colonies formed were enumeratedusing standard plate counting methods.
The concentration of Br in the effluent samples was determinedwith a Br selective electrode (Metrohm AG, Germany).
2.3. Filtration and transport parameters
BTCs (breakthrough curves) were used for calculation of the filtra-tion and transport parameters (Figs. 2 and 3).
The cumulative percentage recovery rates of E. coli NAR and Br wereobtained by calculating the surface area under the influent curves andBTC's, using a simulation algorithm in MATLAB code. The rectangle
Fig. 1. Schematic of the soil column leaching set-up.
Table 2Characteristics of the established steady-state flow conditions for the leaching experiments.
Characteristica Soil
Sandy loam Clay loam
Rb PBW R PBW
Matric suction (hPa) Matric suction (hPa)
0 5 0 5 0 5 0 5
θc 0.32 0.28 0.42 0.38 0.38 0.31 0.63 0.56(±0.03) (±0.02) (±0.02) (±0.04) (±0.03) (±0.04) (±0.05) (±0.04)
q 0.025 0.018 0.078 0.066 0.016 0.013 0.161 0.136(±0.02) (±0.02) (±0.01) (±0.03) (±0.02) (±0.03) (±0.04) (±0.02)
vd 4.68 3.9 11.34 10.26 2.52 2.46 15.42 14.52(±0.59) (±0.23) (±1.09) (±0.77) (±0.35) (±0.26) (±1.69) (±1.12)
PV 4522 3956 5888 5417 5369 4380 8902 7960(±103) (±45) (±137) (±112) (±189) (±93) (±101) (±178)
a θ, soil water content (cm3 cm−3); q, steady-state flux rate (cm min−1); ν , apparent pore water velocity (cm h−1); PV, water-filled pore volume (cm3). Standard deviations areincluded in parentheses.
b R and PBW stand for repacked and physically+biologically weathered columns, respectively.c Averages of measured θ values for the three layers (0–15, 15–30 and 30–45 cm) are reported.d ν was calculated using υ ¼ q=θ from direct measurement of the water flux rate (q) and the average water content (θ).
206 A. Safadoust et al. / Geoderma 167-168 (2011) 204–213
Author's personal copy
method (also called mid-point or mid-ordinate rule) was employed inMATLAB for numerical integration. Thismethod computes an approxima-tion to a definite integral, made by finding the area of a collection of rect-angles whose heights are determined by the values of a function. Since aspecific function could not be used for the influent curves and BTC's, sam-pling time intervals and corresponding bacteria concentrations were en-tered as inputs and the simulation algorithm integrated numerically theinputs for calculation of the surface areas below the curves.
The following equation was used to determine the filtration coef-ficient (λf) (Mathess et al., 1988):
λf ¼ lnCinfluent
Ceffluent
!� 1Z
ð1Þ
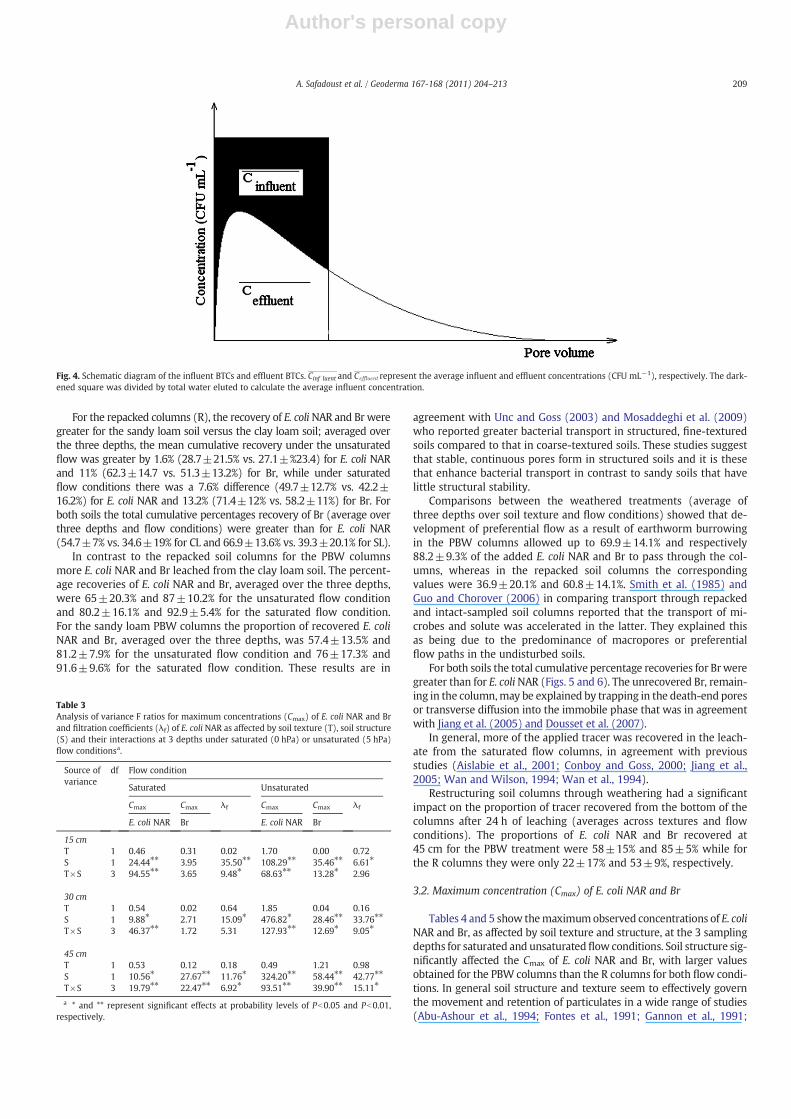
In this equation λf is expressed in m−1, Cinfluent and Ceffluent repre-sent the average influent and effluent concentrations over the leach-ing time (CFU mL−1), and Z is the sampling depth (m). The surfacearea under the influent curve and under the BTC calculated usingthe above-mentioned algorithm was divided by the cumulative efflu-ent volume after 24 h to determine the Cinfluent and Ceffluent values(Fig. 4).
2.4. Statistical analysis
The experiments were carried out using a randomized factorialdesign with two factors and two replicates. The treatments includedsoil texture with two levels, SL and CL, and soil structure with twolevels, repacked soil columns (R) and physically and biologically
0.000
0.002
0.004
0.006
0.008
0.010
0 0.5 1 1.5 2 2.5 3 0 0.5 1 1.5 2 2.5 3
0 0.5 1 1.5 2 2.5 3
0 0.5 1 1.5 2 2.5 3
0 0.5 1 1.5 2 2.5 3
0 0.5 1 1.5 2 2.5 3
0 0.5 1 1.5 2 2.5 3
0 0.5 1 1.5 2 2.5 3
1 5 c m3 0 c m4 5 c m
0.0E+00
2.0E+07
4.0E+07
6.0E+07
8.0E+07
1.0E+081 5 c m3 0 c m4 5 c m
0.000
0.002
0.004
0.006
0.008
0.0101 5 c m3 0 c m4 5 c m
0.0E+00
2.0E+07
4.0E+07
6.0E+07
8.0E+07
1.0E+081 5 c m3 0 c m4 5 c m
0.000
0.002
0.004
0.006
0.008
0.0101 5 c m3 0 c m4 5 c m
0.0E+00
2.0E+07
4.0E+07
6.0E+07
8.0E+07
1.0E+081 5 c m3 0 c m4 5 c m
Bro
mid
e co
ncen
trat
ion
(mol
L-1
)
0.000
0.002
0.004
0.006
0.008
0.0101 5 c m3 0 c m4 5 c m
E. c
oli N
AR
con
cent
rati
on (
CF
U m
L-1
)
0.0E+00
2.0E+07
4.0E+07
6.0E+07
8.0E+07
1.0E+081 5 c m3 0 c m4 5 c m
Pore volume
CL-R CL-R
SL-R SL-R
CL-PBW WBP-LC
SL-PBW WBP-LS
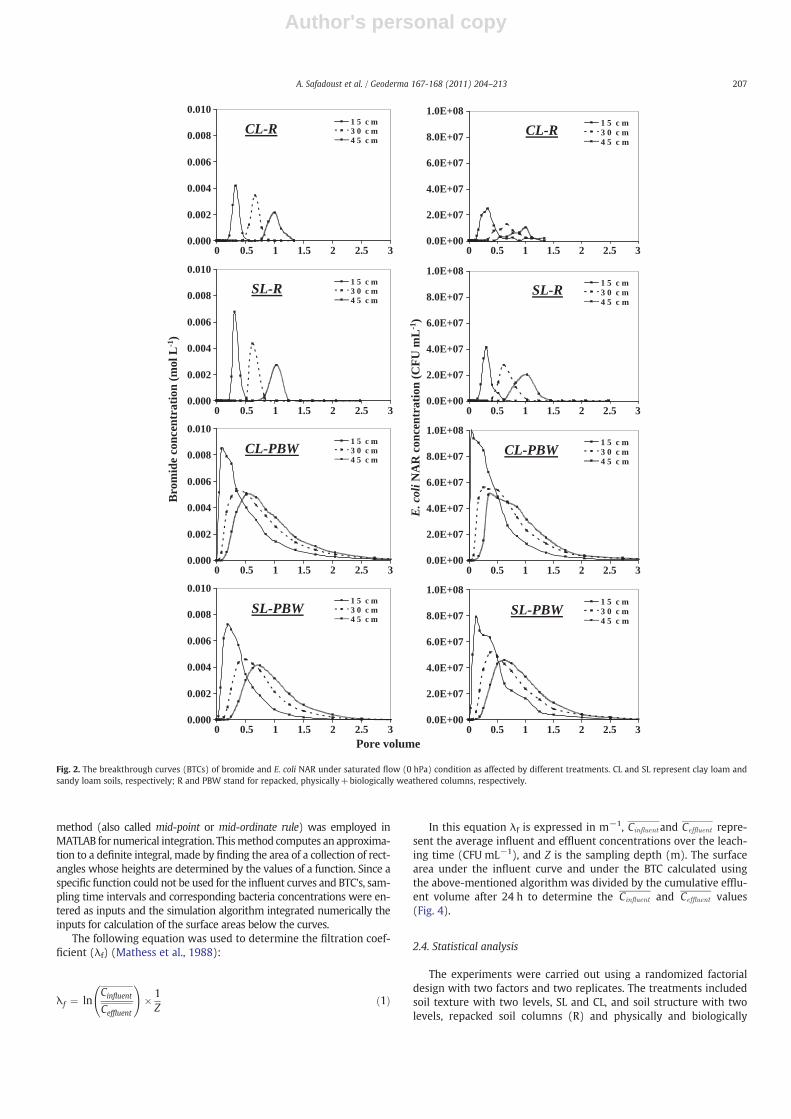
Fig. 2. The breakthrough curves (BTCs) of bromide and E. coli NAR under saturated flow (0 hPa) condition as affected by different treatments. CL and SL represent clay loam andsandy loam soils, respectively; R and PBW stand for repacked, physically+biologically weathered columns, respectively.
207A. Safadoust et al. / Geoderma 167-168 (2011) 204–213
Author's personal copy
weathered soil columns (PBW). The results presented in Table 3 re-flect the analyses of variance for each depth separately.
The effects of treatments on the maximum concentration of E. coliNAR and Br (Cmax E. coli NAR and Cmax Br) in the leachate and filtra-tion coefficient (λf) were studied. Mean comparisons were carriedout by LSD (SAS Institute, 1990).
3. Results and discussion
The F ratios obtained by analyses of variance for Cmax of E. coli NARand Br and λf of E. coli NAR for the two flow conditions are shown inTable 3. Soil structure under both flow conditions had significant ef-fect Cmax and λf of E. coli NAR and Br. Under unsaturated flow the ef-fects of soil structure on Cmax of Br were significant over all depths,while for the saturated flow this was true only for the 45 cm depth.
None of the parameters were significantly affected by soil texture.The interaction between treatments had significant effects on Cmax
of E. coli NAR and Br, with the exception of the depth of 15 and30 cm for Br under unsaturated flow. However, the filtration coeffi-cients were affected by soil texture and structure.
3.1. Cumulative percentage of recovered E. coli NAR and Br
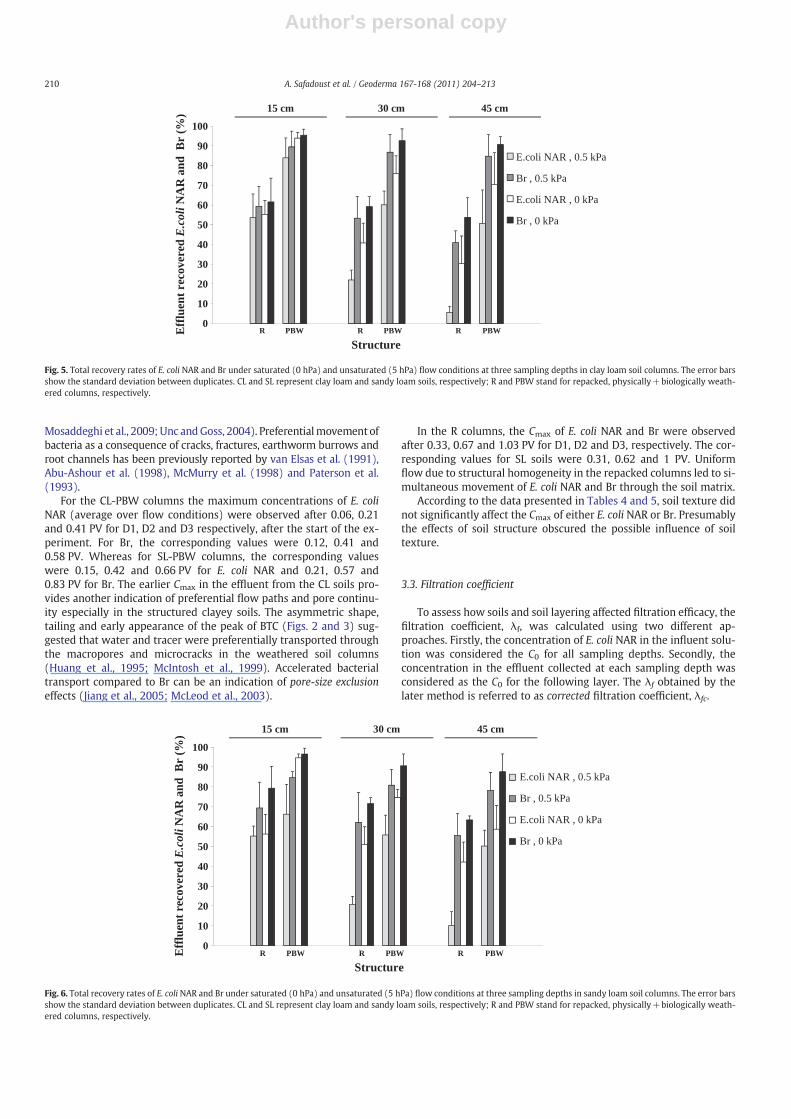
Figs. 5 and 6 show that the amounts of tracers recovered decreasedwith depth, regardless of soil texture and structure. Roodsari et al.(2005) while studying the effects of a vegetated filter on the transportof fecal coliform (FC) bacteria also reported a decrease in concentrationsof FC with soil depth. Mosaddeghi et al. (2010) reported a greater con-centration of E. coli at depth of 20 cm than of 40 cm in lysimeters of aclay loam soil.
0.000
0.002
0.004
0.006
0.008
0.010
0 0.5 1 1.5 2 2.5 3 0 0.5 1 1.5 2 2.5 3
0 0.5 1 1.5 2 2.5 3
0 0.5 1 1.5 2 2.5 3
0 0.5 1 1.5 2 2.5 3
0 0.5 1 1.5 2 2.5 3
0 0.5 1 1.5 2 2.5 3
0 0.5 1 1.5 2 2.5 3
1 5 c m3 0 c m4 5 c m
0.0E+00
2.0E+07
4.0E+07
6.0E+07
8.0E+07
1.0E+081 5 c m3 0 c m4 5 c m
0.000
0.002
0.004
0.006
0.008
0.0101 5 c m3 0 c m4 5 c m
0.0E+00
2.0E+07
4.0E+07
6.0E+07
8.0E+07
1.0E+081 5 c m3 0 c m4 5 c m
0.000
0.002
0.004
0.006
0.008
0.0101 5 c m3 0 c m4 5 c m
0.0E+00
2.0E+07
4.0E+07
6.0E+07
8.0E+07
1.0E+081 5 c m3 0 c m4 5 c m
0.000
0.002
0.004
0.006
0.008
0.0101 5 c m3 0 c m4 5 c m
0.0E+00
2.0E+07
4.0E+07
6.0E+07
8.0E+07
1.0E+081 5 c m3 0 c m4 5 c m
Pore volume
CL-R CL-R
SL-R SL-R
CL-PBW WBP-LC
SL-PBW WBP-LS
Bro
mid
e co
ncen
trat
ion
(mol
L-1
)
E. c
oli N
AR
con
cent
rati
on (
CF
U m
L-1
)
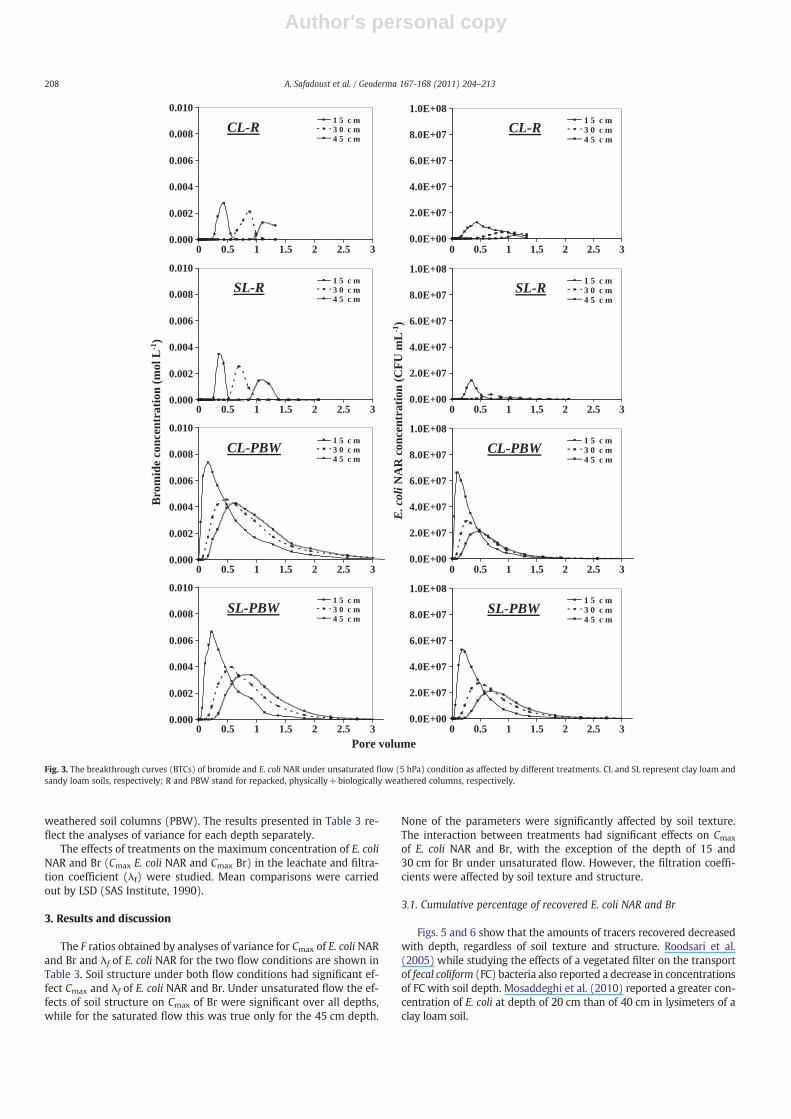
Fig. 3. The breakthrough curves (BTCs) of bromide and E. coli NAR under unsaturated flow (5 hPa) condition as affected by different treatments. CL and SL represent clay loam andsandy loam soils, respectively; R and PBW stand for repacked, physically+biologically weathered columns, respectively.
208 A. Safadoust et al. / Geoderma 167-168 (2011) 204–213
Author's personal copy
For the repacked columns (R), the recovery of E. coliNAR and Br weregreater for the sandy loam soil versus the clay loam soil; averaged overthe three depths, the mean cumulative recovery under the unsaturatedflow was greater by 1.6% (28.7±21.5% vs. 27.1±%23.4) for E. coli NARand 11% (62.3±14.7 vs. 51.3±13.2%) for Br, while under saturatedflow conditions there was a 7.6% difference (49.7±12.7% vs. 42.2±16.2%) for E. coli NAR and 13.2% (71.4±12% vs. 58.2±11%) for Br. Forboth soils the total cumulative percentages recovery of Br (average overthree depths and flow conditions) were greater than for E. coli NAR(54.7±7% vs. 34.6±19% for CL and 66.9±13.6% vs. 39.3±20.1% for SL).
In contrast to the repacked soil columns for the PBW columnsmore E. coli NAR and Br leached from the clay loam soil. The percent-age recoveries of E. coli NAR and Br, averaged over the three depths,were 65±20.3% and 87±10.2% for the unsaturated flow conditionand 80.2±16.1% and 92.9±5.4% for the saturated flow condition.For the sandy loam PBW columns the proportion of recovered E. coliNAR and Br, averaged over the three depths, was 57.4±13.5% and81.2±7.9% for the unsaturated flow condition and 76±17.3% and91.6±9.6% for the saturated flow condition. These results are in
agreement with Unc and Goss (2003) and Mosaddeghi et al. (2009)who reported greater bacterial transport in structured, fine-texturedsoils compared to that in coarse-textured soils. These studies suggestthat stable, continuous pores form in structured soils and it is thesethat enhance bacterial transport in contrast to sandy soils that havelittle structural stability.
Comparisons between the weathered treatments (average ofthree depths over soil texture and flow conditions) showed that de-velopment of preferential flow as a result of earthworm burrowingin the PBW columns allowed up to 69.9±14.1% and respectively88.2±9.3% of the added E. coli NAR and Br to pass through the col-umns, whereas in the repacked soil columns the correspondingvalues were 36.9±20.1% and 60.8±14.1%. Smith et al. (1985) andGuo and Chorover (2006) in comparing transport through repackedand intact-sampled soil columns reported that the transport of mi-crobes and solute was accelerated in the latter. They explained thisas being due to the predominance of macropores or preferentialflow paths in the undisturbed soils.
For both soils the total cumulative percentage recoveries for Brweregreater than for E. coliNAR (Figs. 5 and 6). The unrecovered Br, remain-ing in the column,may be explained by trapping in the death-end poresor transverse diffusion into the immobile phase that was in agreementwith Jiang et al. (2005) and Dousset et al. (2007).
In general, more of the applied tracer was recovered in the leach-ate from the saturated flow columns, in agreement with previousstudies (Aislabie et al., 2001; Conboy and Goss, 2000; Jiang et al.,2005; Wan and Wilson, 1994; Wan et al., 1994).
Restructuring soil columns through weathering had a significantimpact on the proportion of tracer recovered from the bottom of thecolumns after 24 h of leaching (averages across textures and flowconditions). The proportions of E. coli NAR and Br recovered at45 cm for the PBW treatment were 58±15% and 85±5% while forthe R columns they were only 22±17% and 53±9%, respectively.
3.2. Maximum concentration (Cmax) of E. coli NAR and Br
Tables 4 and 5 show themaximumobserved concentrations of E. coliNAR and Br, as affected by soil texture and structure, at the 3 samplingdepths for saturated and unsaturatedflow conditions. Soil structure sig-nificantly affected the Cmax of E. coli NAR and Br, with larger valuesobtained for the PBW columns than the R columns for both flow condi-tions. In general soil structure and texture seem to effectively governthe movement and retention of particulates in a wide range of studies(Abu-Ashour et al., 1994; Fontes et al., 1991; Gannon et al., 1991;
Fig. 4. Schematic diagram of the influent BTCs and effluent BTCs. Cinf luent and Ceffluent represent the average influent and effluent concentrations (CFU mL−1), respectively. The dark-ened square was divided by total water eluted to calculate the average influent concentration.
Table 3Analysis of variance F ratios for maximum concentrations (Cmax) of E. coli NAR and Brand filtration coefficients (λf) of E. coli NAR as affected by soil texture (T), soil structure(S) and their interactions at 3 depths under saturated (0 hPa) or unsaturated (5 hPa)flow conditionsa.
Source ofvariance
df Flow condition
Saturated Unsaturated
Cmax Cmax λf Cmax Cmax λf
E. coli NAR Br E. coli NAR Br
15 cmT 1 0.46 0.31 0.02 1.70 0.00 0.72S 1 24.44⁎⁎ 3.95 35.50⁎⁎ 108.29⁎⁎ 35.46⁎⁎ 6.61⁎
T×S 3 94.55⁎⁎ 3.65 9.48⁎ 68.63⁎⁎ 13.28⁎ 2.96
30 cmT 1 0.54 0.02 0.64 1.85 0.04 0.16S 1 9.88⁎ 2.71 15.09⁎ 476.82⁎ 28.46⁎⁎ 33.76⁎⁎
T×S 3 46.37⁎⁎ 1.72 5.31 127.93⁎⁎ 12.69⁎ 9.05⁎
45 cmT 1 0.53 0.12 0.18 0.49 1.21 0.98S 1 10.56⁎ 27.67⁎⁎ 11.76⁎ 324.20⁎⁎ 58.44⁎⁎ 42.77⁎⁎
T×S 3 19.79⁎⁎ 22.47⁎⁎ 6.92⁎ 93.51⁎⁎ 39.90⁎⁎ 15.11⁎
a * and ** represent significant effects at probability levels of Pb0.05 and Pb0.01,respectively.
209A. Safadoust et al. / Geoderma 167-168 (2011) 204–213
Author's personal copy
Mosaddeghi et al., 2009; Unc andGoss, 2004). Preferentialmovement ofbacteria as a consequence of cracks, fractures, earthworm burrows androot channels has been previously reported by van Elsas et al. (1991),Abu-Ashour et al. (1998), McMurry et al. (1998) and Paterson et al.(1993).
For the CL-PBW columns the maximum concentrations of E. coliNAR (average over flow conditions) were observed after 0.06, 0.21and 0.41 PV for D1, D2 and D3 respectively, after the start of the ex-periment. For Br, the corresponding values were 0.12, 0.41 and0.58 PV. Whereas for SL-PBW columns, the corresponding valueswere 0.15, 0.42 and 0.66 PV for E. coli NAR and 0.21, 0.57 and0.83 PV for Br. The earlier Cmax in the effluent from the CL soils pro-vides another indication of preferential flow paths and pore continu-ity especially in the structured clayey soils. The asymmetric shape,tailing and early appearance of the peak of BTC (Figs. 2 and 3) sug-gested that water and tracer were preferentially transported throughthe macropores and microcracks in the weathered soil columns(Huang et al., 1995; McIntosh et al., 1999). Accelerated bacterialtransport compared to Br can be an indication of pore-size exclusioneffects (Jiang et al., 2005; McLeod et al., 2003).
In the R columns, the Cmax of E. coli NAR and Br were observedafter 0.33, 0.67 and 1.03 PV for D1, D2 and D3, respectively. The cor-responding values for SL soils were 0.31, 0.62 and 1 PV. Uniformflow due to structural homogeneity in the repacked columns led to si-multaneous movement of E. coli NAR and Br through the soil matrix.
According to the data presented in Tables 4 and 5, soil texture didnot significantly affect the Cmax of either E. coli NAR or Br. Presumablythe effects of soil structure obscured the possible influence of soiltexture.
3.3. Filtration coefficient
To assess how soils and soil layering affected filtration efficacy, thefiltration coefficient, λf, was calculated using two different ap-proaches. Firstly, the concentration of E. coli NAR in the influent solu-tion was considered the C0 for all sampling depths. Secondly, theconcentration in the effluent collected at each sampling depth wasconsidered as the C0 for the following layer. The λf obtained by thelater method is referred to as corrected filtration coefficient, λfc.
0
10
20
30
40
50
60
70
80
90
100
R PBW R PBW R PBWEff
luen
t re
cove
red
E.c
oli N
AR
and
Br
(%)
Structure
E.coli NAR , 0.5 kPa
Br , 0.5 kPa
E.coli NAR , 0 kPa
Br , 0 kPa
15 cm 30 cm 45 cm
Fig. 5. Total recovery rates of E. coli NAR and Br under saturated (0 hPa) and unsaturated (5 hPa) flow conditions at three sampling depths in clay loam soil columns. The error barsshow the standard deviation between duplicates. CL and SL represent clay loam and sandy loam soils, respectively; R and PBW stand for repacked, physically+biologically weath-ered columns, respectively.
0
10
20
30
40
50
60
70
80
90
100
E.coli NAR , 0.5 kPa
Br , 0.5 kPa
E.coli NAR , 0 kPa
Br , 0 kPa
15 cm 30 cm 45 cm
Eff
luen
t re
cove
red
E.c
oli N
AR
and
Br
(%)
R PBW R PBW R PBW
Structure
Fig. 6. Total recovery rates of E. coli NAR and Br under saturated (0 hPa) and unsaturated (5 hPa) flow conditions at three sampling depths in sandy loam soil columns. The error barsshow the standard deviation between duplicates. CL and SL represent clay loam and sandy loam soils, respectively; R and PBW stand for repacked, physically+biologically weath-ered columns, respectively.
210 A. Safadoust et al. / Geoderma 167-168 (2011) 204–213
Author's personal copy
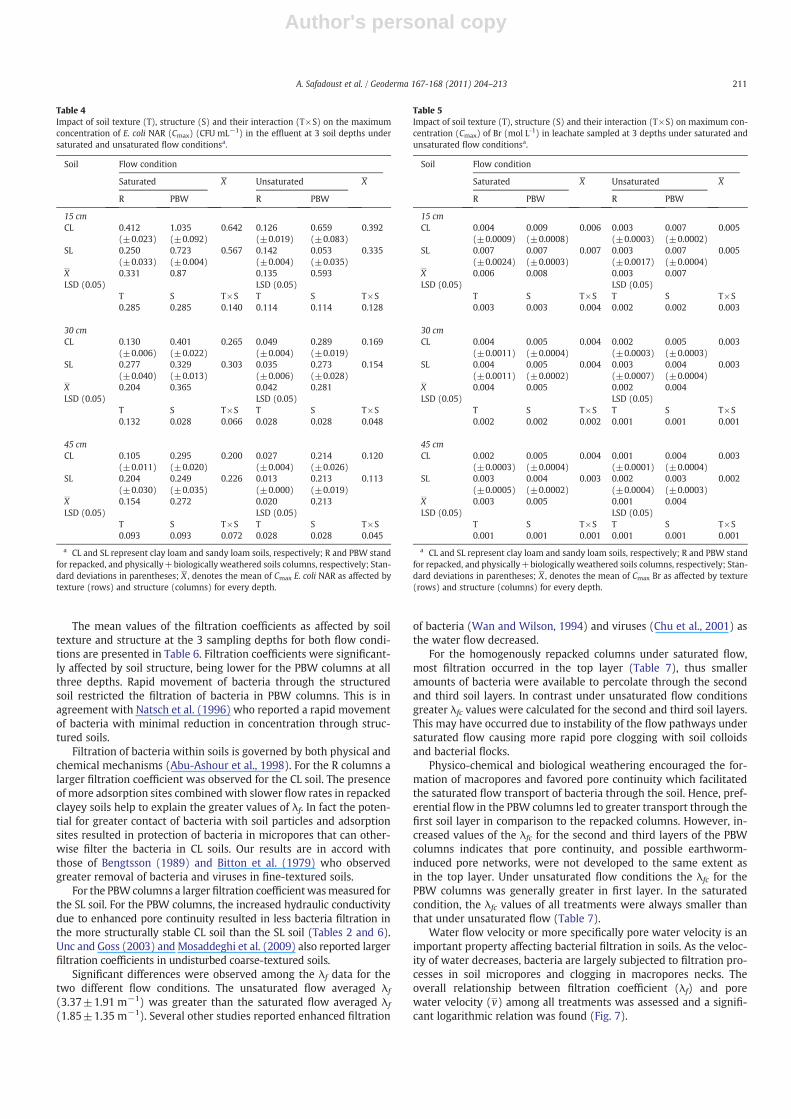
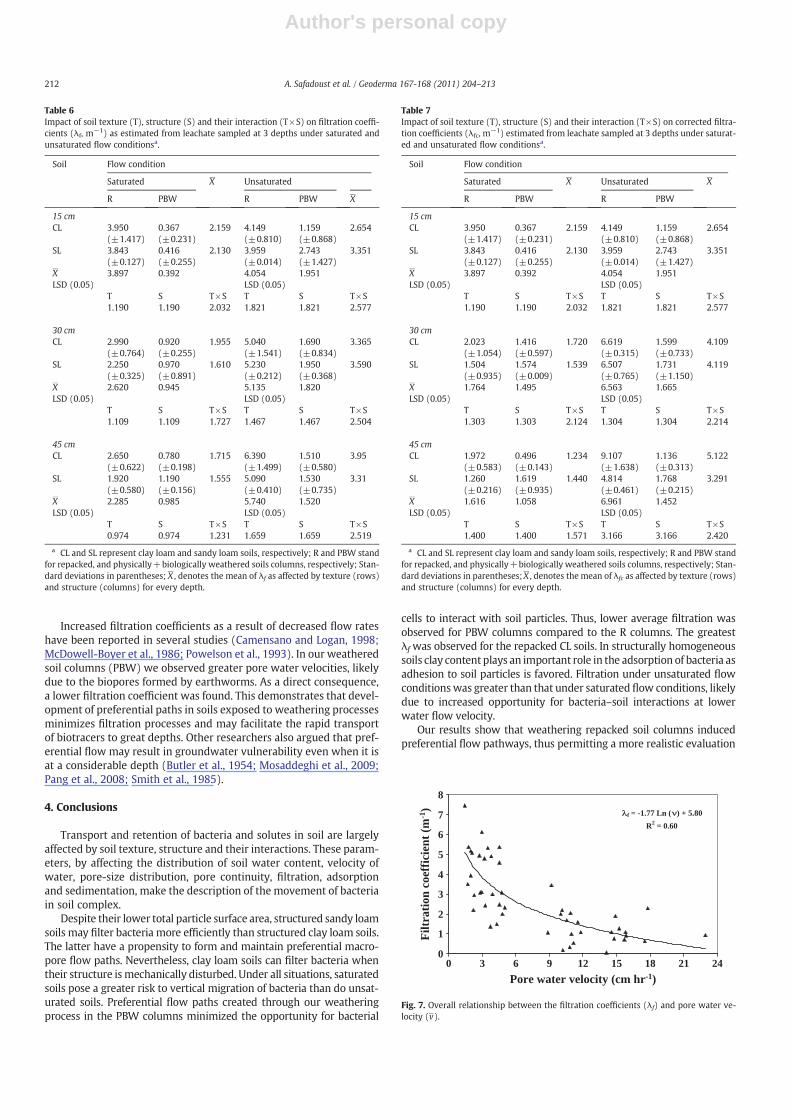
The mean values of the filtration coefficients as affected by soiltexture and structure at the 3 sampling depths for both flow condi-tions are presented in Table 6. Filtration coefficients were significant-ly affected by soil structure, being lower for the PBW columns at allthree depths. Rapid movement of bacteria through the structuredsoil restricted the filtration of bacteria in PBW columns. This is inagreement with Natsch et al. (1996) who reported a rapid movementof bacteria with minimal reduction in concentration through struc-tured soils.
Filtration of bacteria within soils is governed by both physical andchemical mechanisms (Abu-Ashour et al., 1998). For the R columns alarger filtration coefficient was observed for the CL soil. The presenceof more adsorption sites combined with slower flow rates in repackedclayey soils help to explain the greater values of λf. In fact the poten-tial for greater contact of bacteria with soil particles and adsorptionsites resulted in protection of bacteria in micropores that can other-wise filter the bacteria in CL soils. Our results are in accord withthose of Bengtsson (1989) and Bitton et al. (1979) who observedgreater removal of bacteria and viruses in fine-textured soils.
For the PBW columns a larger filtration coefficientwasmeasured forthe SL soil. For the PBW columns, the increased hydraulic conductivitydue to enhanced pore continuity resulted in less bacteria filtration inthe more structurally stable CL soil than the SL soil (Tables 2 and 6).Unc and Goss (2003) andMosaddeghi et al. (2009) also reported largerfiltration coefficients in undisturbed coarse-textured soils.
Significant differences were observed among the λf data for thetwo different flow conditions. The unsaturated flow averaged λf
(3.37±1.91 m−1) was greater than the saturated flow averaged λf
(1.85±1.35 m−1). Several other studies reported enhanced filtration
of bacteria (Wan and Wilson, 1994) and viruses (Chu et al., 2001) asthe water flow decreased.
For the homogenously repacked columns under saturated flow,most filtration occurred in the top layer (Table 7), thus smalleramounts of bacteria were available to percolate through the secondand third soil layers. In contrast under unsaturated flow conditionsgreater λfc values were calculated for the second and third soil layers.This may have occurred due to instability of the flow pathways undersaturated flow causing more rapid pore clogging with soil colloidsand bacterial flocks.
Physico-chemical and biological weathering encouraged the for-mation of macropores and favored pore continuity which facilitatedthe saturated flow transport of bacteria through the soil. Hence, pref-erential flow in the PBW columns led to greater transport through thefirst soil layer in comparison to the repacked columns. However, in-creased values of the λfc for the second and third layers of the PBWcolumns indicates that pore continuity, and possible earthworm-induced pore networks, were not developed to the same extent asin the top layer. Under unsaturated flow conditions the λfc for thePBW columns was generally greater in first layer. In the saturatedcondition, the λfc values of all treatments were always smaller thanthat under unsaturated flow (Table 7).
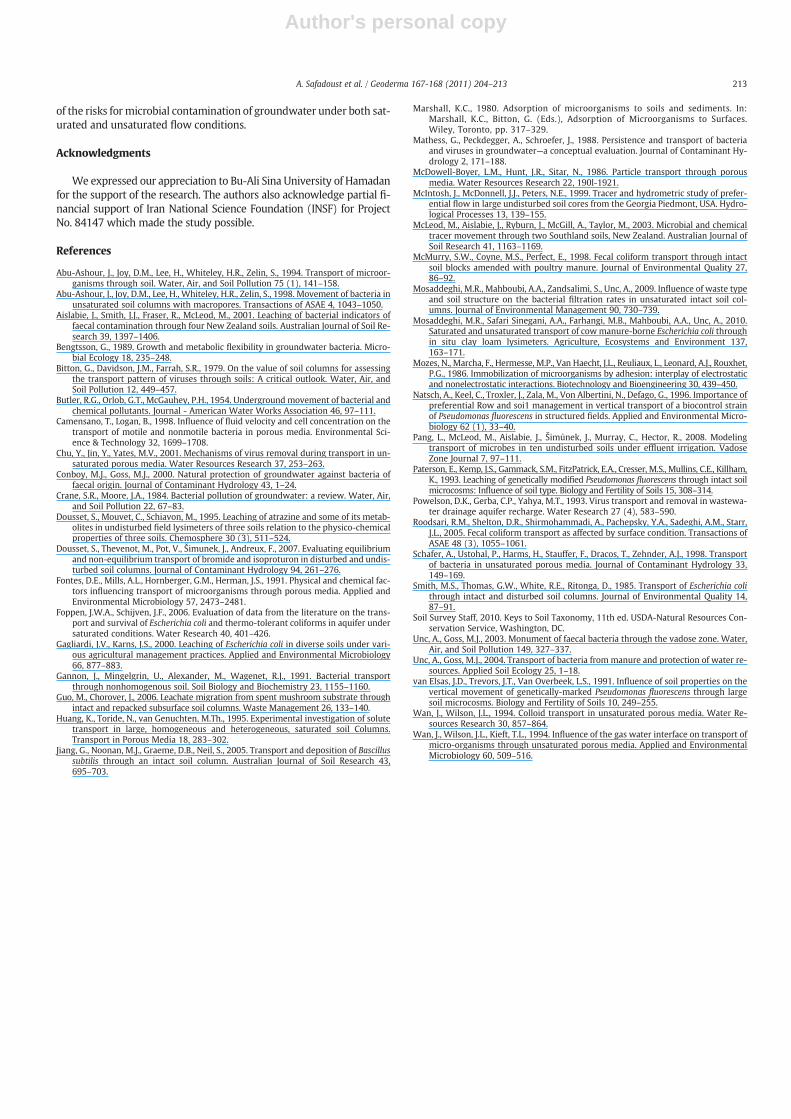
Water flow velocity or more specifically pore water velocity is animportant property affecting bacterial filtration in soils. As the veloc-ity of water decreases, bacteria are largely subjected to filtration pro-cesses in soil micropores and clogging in macropores necks. Theoverall relationship between filtration coefficient (λf) and porewater velocity (v) among all treatments was assessed and a signifi-cant logarithmic relation was found (Fig. 7).
Table 4Impact of soil texture (T), structure (S) and their interaction (T×S) on the maximumconcentration of E. coli NAR (Cmax) (CFU mL−1) in the effluent at 3 soil depths undersaturated and unsaturated flow conditionsa.
Soil Flow condition
Saturated X Unsaturated X
R PBW R PBW
15 cmCL 0.412 1.035 0.642 0.126 0.659 0.392
(±0.023) (±0.092) (±0.019) (±0.083)SL 0.250 0.723 0.567 0.142 0.053 0.335
(±0.033) (±0.004) (±0.004) (±0.035)X 0.331 0.87 0.135 0.593LSD (0.05) LSD (0.05)
T S T×S T S T×S0.285 0.285 0.140 0.114 0.114 0.128
30 cmCL 0.130 0.401 0.265 0.049 0.289 0.169
(±0.006) (±0.022) (±0.004) (±0.019)SL 0.277 0.329 0.303 0.035 0.273 0.154
(±0.040) (±0.013) (±0.006) (±0.028)X 0.204 0.365 0.042 0.281LSD (0.05) LSD (0.05)
T S T×S T S T×S0.132 0.028 0.066 0.028 0.028 0.048
45 cmCL 0.105 0.295 0.200 0.027 0.214 0.120
(±0.011) (±0.020) (±0.004) (±0.026)SL 0.204 0.249 0.226 0.013 0.213 0.113
(±0.030) (±0.035) (±0.000) (±0.019)X 0.154 0.272 0.020 0.213LSD (0.05) LSD (0.05)
T S T×S T S T×S0.093 0.093 0.072 0.028 0.028 0.045
a CL and SL represent clay loam and sandy loam soils, respectively; R and PBW standfor repacked, and physically+biologically weathered soils columns, respectively; Stan-dard deviations in parentheses; X , denotes the mean of Cmax E. coli NAR as affected bytexture (rows) and structure (columns) for every depth.
Table 5Impact of soil texture (T), structure (S) and their interaction (T×S) on maximum con-centration (Cmax) of Br (mol L-1) in leachate sampled at 3 depths under saturated andunsaturated flow conditionsa.
Soil Flow condition
Saturated X Unsaturated X
R PBW R PBW
15 cmCL 0.004 0.009 0.006 0.003 0.007 0.005
(±0.0009) (±0.0008) (±0.0003) (±0.0002)SL 0.007 0.007 0.007 0.003 0.007 0.005
(±0.0024) (±0.0003) (±0.0017) (±0.0004)X 0.006 0.008 0.003 0.007LSD (0.05) LSD (0.05)
T S T×S T S T×S0.003 0.003 0.004 0.002 0.002 0.003
30 cmCL 0.004 0.005 0.004 0.002 0.005 0.003
(±0.0011) (±0.0004) (±0.0003) (±0.0003)SL 0.004 0.005 0.004 0.003 0.004 0.003
(±0.0011) (±0.0002) (±0.0007) (±0.0004)X 0.004 0.005 0.002 0.004LSD (0.05) LSD (0.05)
T S T×S T S T×S0.002 0.002 0.002 0.001 0.001 0.001
45 cmCL 0.002 0.005 0.004 0.001 0.004 0.003
(±0.0003) (±0.0004) (±0.0001) (±0.0004)SL 0.003 0.004 0.003 0.002 0.003 0.002
(±0.0005) (±0.0002) (±0.0004) (±0.0003)X 0.003 0.005 0.001 0.004LSD (0.05) LSD (0.05)
T S T×S T S T×S0.001 0.001 0.001 0.001 0.001 0.001
a CL and SL represent clay loam and sandy loam soils, respectively; R and PBW standfor repacked, and physically+biologically weathered soils columns, respectively; Stan-dard deviations in parentheses; X , denotes the mean of Cmax Br as affected by texture(rows) and structure (columns) for every depth.
211A. Safadoust et al. / Geoderma 167-168 (2011) 204–213
Author's personal copy
Increased filtration coefficients as a result of decreased flow rateshave been reported in several studies (Camensano and Logan, 1998;McDowell-Boyer et al., 1986; Powelson et al., 1993). In our weatheredsoil columns (PBW) we observed greater pore water velocities, likelydue to the biopores formed by earthworms. As a direct consequence,a lower filtration coefficient was found. This demonstrates that devel-opment of preferential paths in soils exposed to weathering processesminimizes filtration processes and may facilitate the rapid transportof biotracers to great depths. Other researchers also argued that pref-erential flow may result in groundwater vulnerability even when it isat a considerable depth (Butler et al., 1954; Mosaddeghi et al., 2009;Pang et al., 2008; Smith et al., 1985).
4. Conclusions
Transport and retention of bacteria and solutes in soil are largelyaffected by soil texture, structure and their interactions. These param-eters, by affecting the distribution of soil water content, velocity ofwater, pore-size distribution, pore continuity, filtration, adsorptionand sedimentation, make the description of the movement of bacteriain soil complex.
Despite their lower total particle surface area, structured sandy loamsoils may filter bacteria more efficiently than structured clay loam soils.The latter have a propensity to form and maintain preferential macro-pore flow paths. Nevertheless, clay loam soils can filter bacteria whentheir structure is mechanically disturbed. Under all situations, saturatedsoils pose a greater risk to vertical migration of bacteria than do unsat-urated soils. Preferential flow paths created through our weatheringprocess in the PBW columns minimized the opportunity for bacterial
cells to interact with soil particles. Thus, lower average filtration wasobserved for PBW columns compared to the R columns. The greatestλf was observed for the repacked CL soils. In structurally homogeneoussoils clay content plays an important role in the adsorption of bacteria asadhesion to soil particles is favored. Filtration under unsaturated flowconditionswas greater than that under saturated flow conditions, likelydue to increased opportunity for bacteria–soil interactions at lowerwater flow velocity.
Our results show that weathering repacked soil columns inducedpreferential flow pathways, thus permitting a more realistic evaluation
f = -1.77 Ln ( ) + 5.80
R2 = 0.60
0
1
2
3
4
5
6
7
8
0 3 6 9 12 15 18 21 24
Pore water velocity (cm hr-1)
Filt
rati
on c
oeff
icie
nt (
m-1
)
Fig. 7. Overall relationship between the filtration coefficients (λf) and pore water ve-locity (v).
Table 6Impact of soil texture (T), structure (S) and their interaction (T×S) on filtration coeffi-cients (λf, m−1) as estimated from leachate sampled at 3 depths under saturated andunsaturated flow conditionsa.
Soil Flow condition
Saturated X Unsaturated
R PBW R PBW X
15 cmCL 3.950 0.367 2.159 4.149 1.159 2.654
(±1.417) (±0.231) (±0.810) (±0.868)SL 3.843 0.416 2.130 3.959 2.743 3.351
(±0.127) (±0.255) (±0.014) (±1.427)X 3.897 0.392 4.054 1.951LSD (0.05) LSD (0.05)
T S T×S T S T×S1.190 1.190 2.032 1.821 1.821 2.577
30 cmCL 2.990 0.920 1.955 5.040 1.690 3.365
(±0.764) (±0.255) (±1.541) (±0.834)SL 2.250 0.970 1.610 5.230 1.950 3.590
(±0.325) (±0.891) (±0.212) (±0.368)X 2.620 0.945 5.135 1.820LSD (0.05) LSD (0.05)
T S T×S T S T×S1.109 1.109 1.727 1.467 1.467 2.504
45 cmCL 2.650 0.780 1.715 6.390 1.510 3.95
(±0.622) (±0.198) (±1.499) (±0.580)SL 1.920 1.190 1.555 5.090 1.530 3.31
(±0.580) (±0.156) (±0.410) (±0.735)X 2.285 0.985 5.740 1.520LSD (0.05) LSD (0.05)
T S T×S T S T×S0.974 0.974 1.231 1.659 1.659 2.519
a CL and SL represent clay loam and sandy loam soils, respectively; R and PBW standfor repacked, and physically+biologically weathered soils columns, respectively; Stan-dard deviations in parentheses; X , denotes the mean of λf as affected by texture (rows)and structure (columns) for every depth.
Table 7Impact of soil texture (T), structure (S) and their interaction (T×S) on corrected filtra-tion coefficients (λfc, m−1) estimated from leachate sampled at 3 depths under saturat-ed and unsaturated flow conditionsa.
Soil Flow condition
Saturated X Unsaturated X
R PBW R PBW
15 cmCL 3.950 0.367 2.159 4.149 1.159 2.654
(±1.417) (±0.231) (±0.810) (±0.868)SL 3.843 0.416 2.130 3.959 2.743 3.351
(±0.127) (±0.255) (±0.014) (±1.427)X 3.897 0.392 4.054 1.951LSD (0.05) LSD (0.05)
T S T×S T S T×S1.190 1.190 2.032 1.821 1.821 2.577
30 cmCL 2.023 1.416 1.720 6.619 1.599 4.109
(±1.054) (±0.597) (±0.315) (±0.733)SL 1.504 1.574 1.539 6.507 1.731 4.119
(±0.935) (±0.009) (±0.765) (±1.150)X 1.764 1.495 6.563 1.665LSD (0.05) LSD (0.05)
T S T×S T S T×S1.303 1.303 2.124 1.304 1.304 2.214
45 cmCL 1.972 0.496 1.234 9.107 1.136 5.122
(±0.583) (±0.143) (±1.638) (±0.313)SL 1.260 1.619 1.440 4.814 1.768 3.291
(±0.216) (±0.935) (±0.461) (±0.215)X 1.616 1.058 6.961 1.452LSD (0.05) LSD (0.05)
T S T×S T S T×S1.400 1.400 1.571 3.166 3.166 2.420
a CL and SL represent clay loam and sandy loam soils, respectively; R and PBW standfor repacked, and physically+biologically weathered soils columns, respectively; Stan-dard deviations in parentheses;X , denotes the mean of λfc as affected by texture (rows)and structure (columns) for every depth.
212 A. Safadoust et al. / Geoderma 167-168 (2011) 204–213
Author's personal copy
of the risks formicrobial contamination of groundwater under both sat-urated and unsaturated flow conditions.
Acknowledgments
We expressed our appreciation to Bu-Ali Sina University of Hamadanfor the support of the research. The authors also acknowledge partial fi-nancial support of Iran National Science Foundation (INSF) for ProjectNo. 84147 which made the study possible.
References
Abu-Ashour, J., Joy, D.M., Lee, H., Whiteley, H.R., Zelin, S., 1994. Transport of microor-ganisms through soil. Water, Air, and Soil Pollution 75 (1), 141–158.
Abu-Ashour, J., Joy, D.M., Lee, H., Whiteley, H.R., Zelin, S., 1998. Movement of bacteria inunsaturated soil columns with macropores. Transactions of ASAE 4, 1043–1050.
Aislabie, J., Smith, J.J., Fraser, R., McLeod, M., 2001. Leaching of bacterial indicators offaecal contamination through four New Zealand soils. Australian Journal of Soil Re-search 39, 1397–1406.
Bengtsson, G., 1989. Growth and metabolic flexibility in groundwater bacteria. Micro-bial Ecology 18, 235–248.
Bitton, G., Davidson, J.M., Farrah, S.R., 1979. On the value of soil columns for assessingthe transport pattern of viruses through soils: A critical outlook. Water, Air, andSoil Pollution 12, 449–457.
Butler, R.G., Orlob, G.T., McGauhey, P.H., 1954. Underground movement of bacterial andchemical pollutants. Journal - American Water Works Association 46, 97–111.
Camensano, T., Logan, B., 1998. Influence of fluid velocity and cell concentration on thetransport of motile and nonmotile bacteria in porous media. Environmental Sci-ence & Technology 32, 1699–1708.
Chu, Y., Jin, Y., Yates, M.V., 2001. Mechanisms of virus removal during transport in un-saturated porous media. Water Resources Research 37, 253–263.
Conboy, M.J., Goss, M.J., 2000. Natural protection of groundwater against bacteria offaecal origin. Journal of Contaminant Hydrology 43, 1–24.
Crane, S.R., Moore, J.A., 1984. Bacterial pollution of groundwater: a review. Water, Air,and Soil Pollution 22, 67–83.
Dousset, S., Mouvet, C., Schiavon, M., 1995. Leaching of atrazine and some of its metab-olites in undisturbed field lysimeters of three soils relation to the physico-chemicalproperties of three soils. Chemosphere 30 (3), 511–524.
Dousset, S., Thevenot, M., Pot, V., Šimunek, J., Andreux, F., 2007. Evaluating equilibriumand non-equilibrium transport of bromide and isoproturon in disturbed and undis-turbed soil columns. Journal of Contaminant Hydrology 94, 261–276.
Fontes, D.E., Mills, A.L., Hornberger, G.M., Herman, J.S., 1991. Physical and chemical fac-tors influencing transport of microorganisms through porous media. Applied andEnvironmental Microbiology 57, 2473–2481.
Foppen, J.W.A., Schijven, J.F., 2006. Evaluation of data from the literature on the trans-port and survival of Escherichia coli and thermo-tolerant coliforms in aquifer undersaturated conditions. Water Research 40, 401–426.
Gagliardi, J.V., Karns, J.S., 2000. Leaching of Escherichia coli in diverse soils under vari-ous agricultural management practices. Applied and Environmental Microbiology66, 877–883.
Gannon, J., Mingelgrin, U., Alexander, M., Wagenet, R.J., 1991. Bacterial transportthrough nonhomogenous soil. Soil Biology and Biochemistry 23, 1155–1160.
Guo, M., Chorover, J., 2006. Leachate migration from spent mushroom substrate throughintact and repacked subsurface soil columns. Waste Management 26, 133–140.
Huang, K., Toride, N., van Genuchten, M.Th., 1995. Experimental investigation of solutetransport in large, homogeneous and heterogeneous, saturated soil Columns.Transport in Porous Media 18, 283–302.
Jiang, G., Noonan, M.J., Graeme, D.B., Neil, S., 2005. Transport and deposition of Bascillussubtilis through an intact soil column. Australian Journal of Soil Research 43,695–703.
Marshall, K.C., 1980. Adsorption of microorganisms to soils and sediments. In:Marshall, K.C., Bitton, G. (Eds.), Adsorption of Microorganisms to Surfaces.Wiley, Toronto, pp. 317–329.
Mathess, G., Peckdegger, A., Schroefer, J., 1988. Persistence and transport of bacteriaand viruses in groundwater—a conceptual evaluation. Journal of Contaminant Hy-drology 2, 171–188.
McDowell-Boyer, L.M., Hunt, J.R., Sitar, N., 1986. Particle transport through porousmedia. Water Resources Research 22, 190l-1921.
McIntosh, J., McDonnell, J.J., Peters, N.E., 1999. Tracer and hydrometric study of prefer-ential flow in large undisturbed soil cores from the Georgia Piedmont, USA. Hydro-logical Processes 13, 139–155.
McLeod, M., Aislabie, J., Ryburn, J., McGill, A., Taylor, M., 2003. Microbial and chemicaltracer movement through two Southland soils, New Zealand. Australian Journal ofSoil Research 41, 1163–1169.
McMurry, S.W., Coyne, M.S., Perfect, E., 1998. Fecal coliform transport through intactsoil blocks amended with poultry manure. Journal of Environmental Quality 27,86–92.
Mosaddeghi, M.R., Mahboubi, A.A., Zandsalimi, S., Unc, A., 2009. Influence of waste typeand soil structure on the bacterial filtration rates in unsaturated intact soil col-umns. Journal of Environmental Management 90, 730–739.
Mosaddeghi, M.R., Safari Sinegani, A.A., Farhangi, M.B., Mahboubi, A.A., Unc, A., 2010.Saturated and unsaturated transport of cowmanure-borne Escherichia coli throughin situ clay loam lysimeters. Agriculture, Ecosystems and Environment 137,163–171.
Mozes, N., Marcha, F., Hermesse, M.P., Van Haecht, J.L., Reuliaux, L., Leonard, A.J., Rouxhet,P.G., 1986. Immobilization of microorganisms by adhesion: interplay of electrostaticand nonelectrostatic interactions. Biotechnology and Bioengineering 30, 439–450.
Natsch, A., Keel, C., Troxler, J., Zala, M., Von Albertini, N., Defago, G., 1996. Importance ofpreferential Row and soi1 management in vertical transport of a biocontrol strainof Pseudomonas fluorescens in structured fields. Applied and Environmental Micro-biology 62 (1), 33–40.
Pang, L., McLeod, M., Aislabie, J., Šimůnek, J., Murray, C., Hector, R., 2008. Modelingtransport of microbes in ten undisturbed soils under effluent irrigation. VadoseZone Journal 7, 97–111.
Paterson, E., Kemp, J.S., Gammack, S.M., FitzPatrick, E.A., Cresser, M.S., Mullins, C.E., Killham,K., 1993. Leaching of genetically modified Pseudomonas fluorescens through intact soilmicrocosms: Influence of soil type. Biology and Fertility of Soils 15, 308–314.
Powelson, D.K., Gerba, C.P., Yahya, M.T., 1993. Virus transport and removal in wastewa-ter drainage aquifer recharge. Water Research 27 (4), 583–590.
Roodsari, R.M., Shelton, D.R., Shirmohammadi, A., Pachepsky, Y.A., Sadeghi, A.M., Starr,J.L., 2005. Fecal coliform transport as affected by surface condition. Transactions ofASAE 48 (3), 1055–1061.
Schafer, A., Ustohal, P., Harms, H., Stauffer, F., Dracos, T., Zehnder, A.J., 1998. Transportof bacteria in unsaturated porous media. Journal of Contaminant Hydrology 33,149–169.
Smith, M.S., Thomas, G.W., White, R.E., Ritonga, D., 1985. Transport of Escherichia colithrough intact and disturbed soil columns. Journal of Environmental Quality 14,87–91.
Soil Survey Staff, 2010. Keys to Soil Taxonomy, 11th ed. USDA-Natural Resources Con-servation Service, Washington, DC.
Unc, A., Goss, M.J., 2003. Monument of faecal bacteria through the vadose zone. Water,Air, and Soil Pollution 149, 327–337.
Unc, A., Goss, M.J., 2004. Transport of bacteria from manure and protection of water re-sources. Applied Soil Ecology 25, 1–18.
van Elsas, J.D., Trevors, J.T., Van Overbeek, L.S., 1991. Influence of soil properties on thevertical movement of genetically-marked Pseudomonas fluorescens through largesoil microcosms. Biology and Fertility of Soils 10, 249–255.
Wan, J., Wilson, J.L., 1994. Colloid transport in unsaturated porous media. Water Re-sources Research 30, 857–864.
Wan, J., Wilson, J.L., Kieft, T.L., 1994. Influence of the gas water interface on transport ofmicro-organisms through unsaturated porous media. Applied and EnvironmentalMicrobiology 60, 509–516.
213A. Safadoust et al. / Geoderma 167-168 (2011) 204–213