Embed Size (px)
Citation preview
PNWD-3045BNFL-RPT-038 Rev. 0
Characterization, Washing, Leaching, and Characterization, Washing, Leaching, and Filtration of AZFiltration of AZ--102 Sludge102 Sludge
K. P. BrooksP. R. BredtS. K. CooleyG. R. GolcarL. K. JagodaK. G. RappeM. W. Urie
August 2000
Prepared for BNFL, Inc.under Contract W375-LC-98-4168
LEGAL NOTICE
This report was prepared by Battelle Memorial Institute (Battelle) as an account of sponsored research activities. Neither Client nor Battelle nor any person acting on behalf of either:
MAKES ANY WARRANTY OR REPRESENTATION, EXPRESS OR IMPLIED, with respect to the accuracy, completeness, or usefulness of theinformation contained in this report, or that the use of any information, apparatus, process, or composition disclosed in this report may not infringe privately owned rights; or
Assumes any liabilities with respect to the use of, or for damages resulting from the use of, any information, apparatus, process, or composition disclosed in this report.
References herein to any specific commercial product, process, or service by trade name, trademark, manufacturer, or otherwise, does not necessarily constitute orimply its endorsement, recommendation, or favoring by Battelle. The views andopinions of authors expressed herein do not necessarily state or reflect those ofBattelle.
PNWD-3045BNFL-RPT-038 Rev. 0
CharacterizCharacterization, Washing, Leaching, and ation, Washing, Leaching, and Filtration of AZFiltration of AZ--102 Sludge102 Sludge
K. P. BrooksP. R. BredtS. K. CooleyG. R. GolcarL. K. JagodaK. G. RappeM. W. Urie
August 2000
Prepared forBNFL, Inc.under Contract W375-LC-98-4168
Battelle, Richland, Washington 99352
iii
Summary
BNFL, Inc. developed flowsheets for the River Protection Project Waste Treatment Plant that use caustic leaching and/or water washing to pretreat Envelope D Hanford sludge before vitrifying the high-level waste (HLW). The pretreatment steps would remove a number of components to reduce the quantity of HLW generated. The flowsheets also use crossflow filtration to separate the leach and wash solutions from the solids between each step. The work reported here tested crossflow filtration andevaluated the washing and leaching characteristics of sludge from Tank AZ-102.
Battelle staff evaluated approximately 400 g of wet Hanford Tank AZ-102 Sludge by the pretreatment processes of ultrafiltration, dilute caustic washing, and elevated-temperature caustic leaching. The filterability of diluted AZ-102 sludge was measured with a 0.1-µm sintered metal Mott filter using a 24-in.-long, single-element, crossflow filtration system (cells unit filter [CUF]). Before washing and leaching, a 5.1-wt% solids(a) slurry was filtered using a matrix of six 1-h conditions of varying transmembrane pressure (30 to 70 psid) and axial velocity (7 to 13 ft/s), with the filtrate being recirculated. The filtrate flux and backpulse efficiency were determined for each condition. The slurry was then concentrated to 13.7-wt% solids, a second matrix of six 1-h conditions performed at axial velocities ranging from 6 to 11.5 ft/s, and data analogous to that recorded in the first matrix obtained.
The low-solids-concentration matrix produced filtrate flux rates that ranged from 0.046 to 0.126 gpm/ft2. The high-solids-concentration matrix produced filtrate flux rates that ranged from 0.020 to 0.051 gpm/ft2. In the low solids matrix, the highest filtrate flux was at the first condition (50 psid, 9.5 ft/s). The initial filtrate flux declined significantly over the next four conditions, indicating filter fouling or more likely, particle deagglomeration. In the subsequent conditions, the initial filtrate flux remained steadier, and the highest filtrate flux was measured at the highest axial velocity. In the high solids matrix, the optimum condition was clearer and was found at the highest axial velocity.
For each matrix, the last test condition was a repeat of the first test condition. In both matrices, there was a significant decrease in filtrate flux between these two tests. This indicates some filter fouling occurred during each test matrix that could not be removed by backpulsing alone, although the backpulse number and duration were not optimized. The nitric acid cleaning performed at the end of the testing could partially recover the initial fluxes caused by this filter fouling.
Following testing of these two matrices, the material was washed in the CUF by continuously adding approximately 2.7 L of 0.01 M NaOH and then removing it as permeate by filtration. The purpose of these washing steps with 0.01 M NaOH was to remove water-soluble components. After washing the sludge with dilute caustic, it was combined with a concentrated caustic solution to produce a slurry containing ~3 M NaOH, which was then leached in a stirred, stainless steel vessel at 85°C for 8 h. This leaching was followed by two 0.01 M caustic washes, each conducted in a stainless steel vessel to dilute remaining soluble analytes from the interstitial liquids. Each rinse was performed at 85°C for 8 h.Permeate from each of these process steps was removed using the crossflow filter system. Samples of the permeate from each slurry-washing activity and all intermediate process steps were taken and analyzed
(a) Solids concentrations are generally reported on an insoluble solids basis. This is done by mathematically subtracting out the dissolved solids from the total solids.
iv
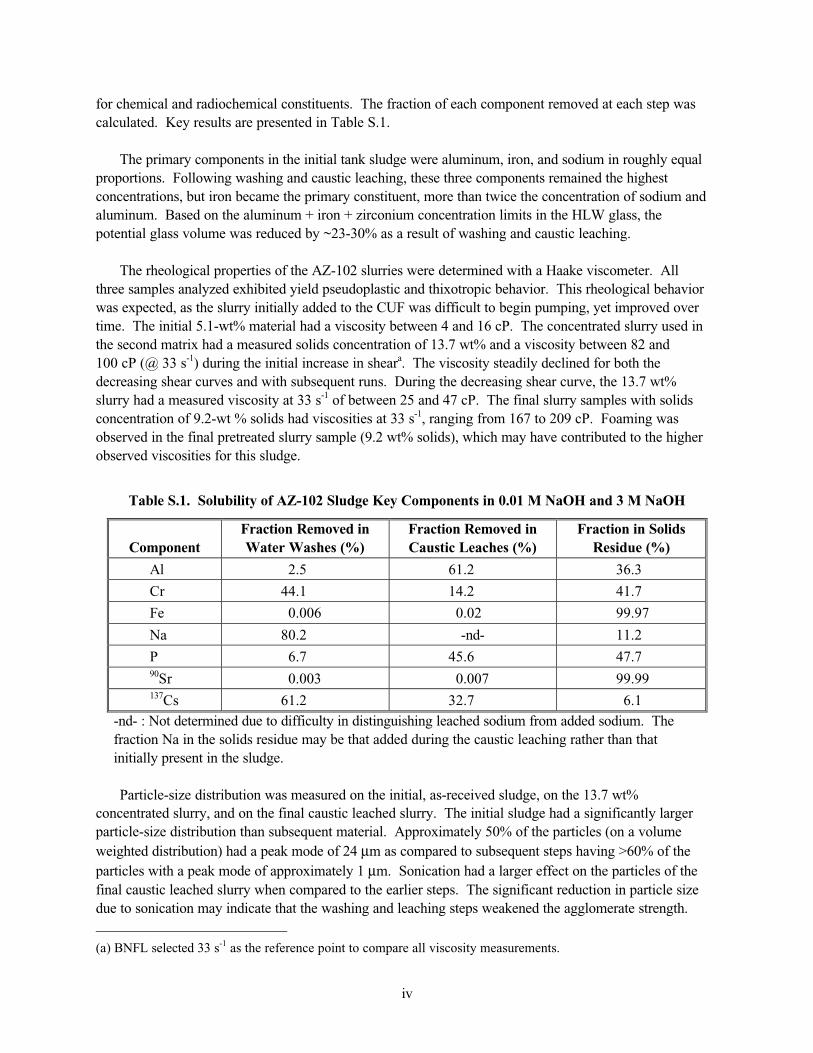
for chemical and radiochemical constituents. The fraction of each component removed at each step was calculated. Key results are presented in Table S.1.
The primary components in the initial tank sludge were aluminum, iron, and sodium in roughly equal proportions. Following washing and caustic leaching, these three components remained the highest concentrations, but iron became the primary constituent, more than twice the concentration of sodium and aluminum. Based on the aluminum + iron + zirconium concentration limits in the HLW glass, the potential glass volume was reduced by ~23-30% as a result of washing and caustic leaching.
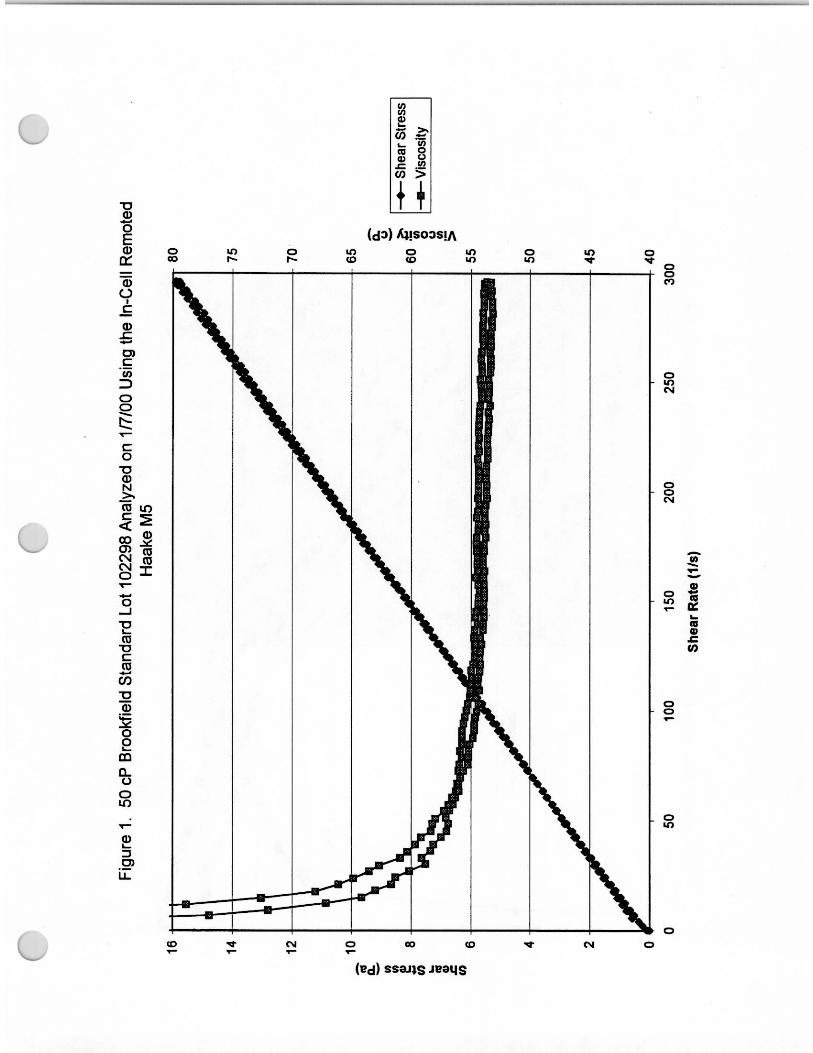
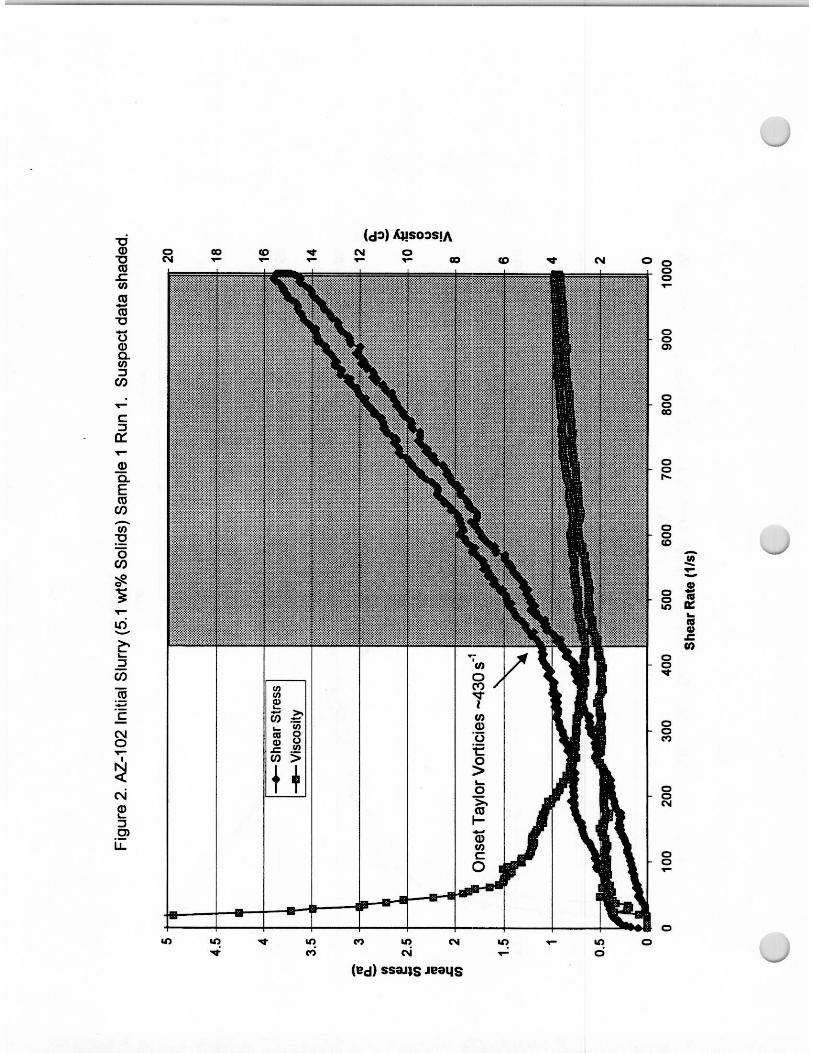
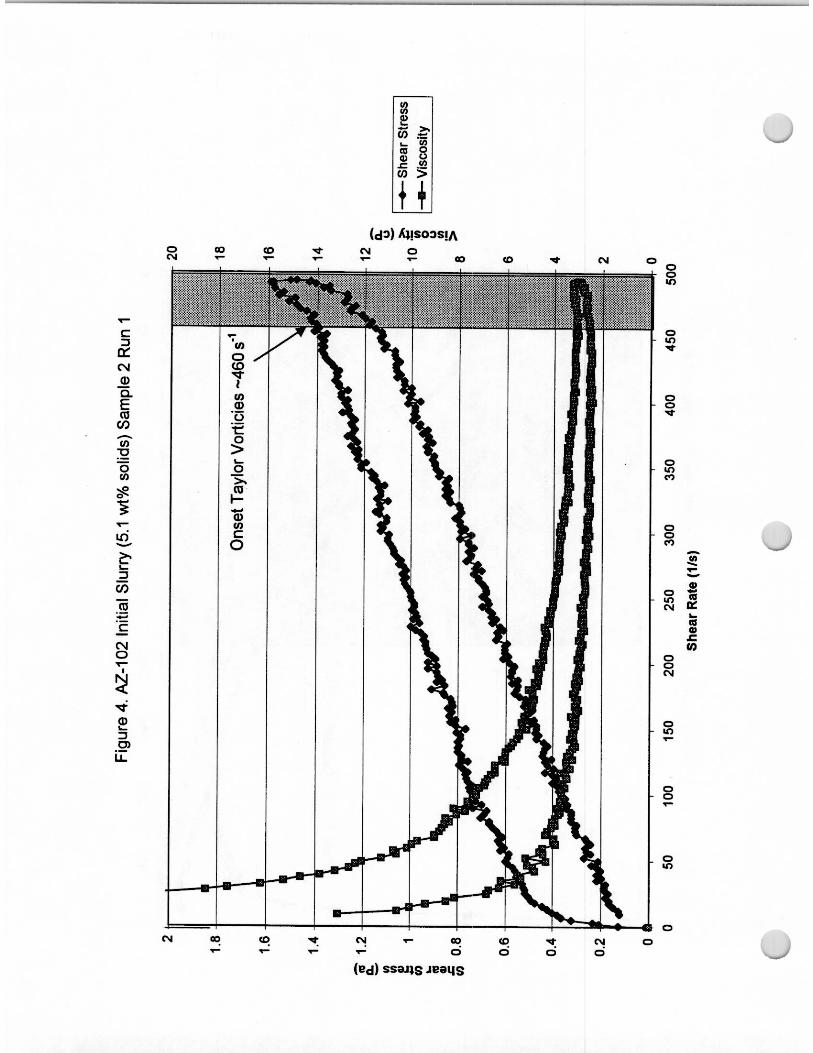
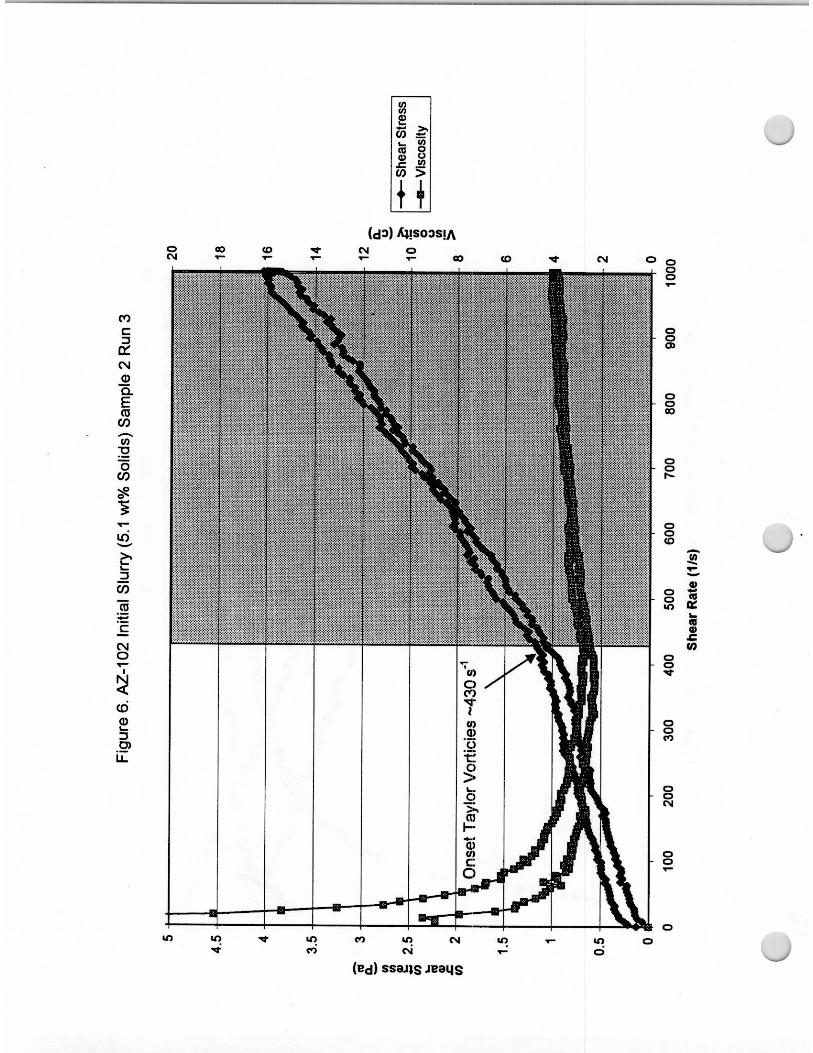
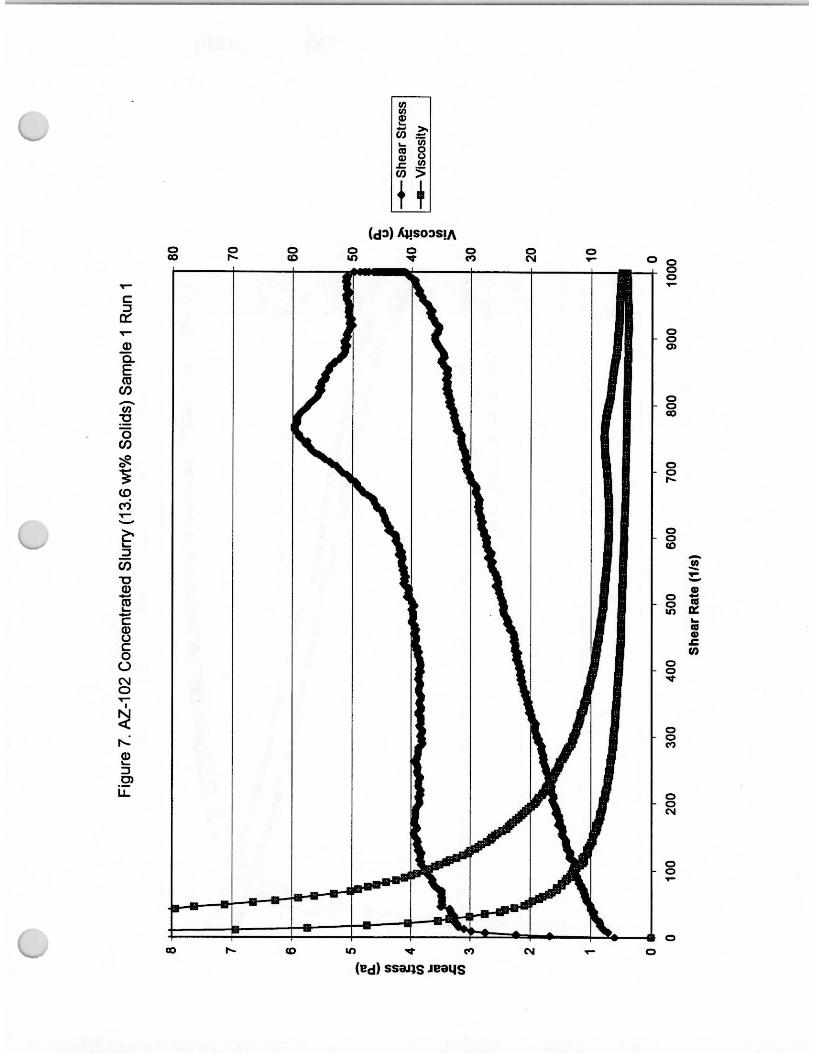
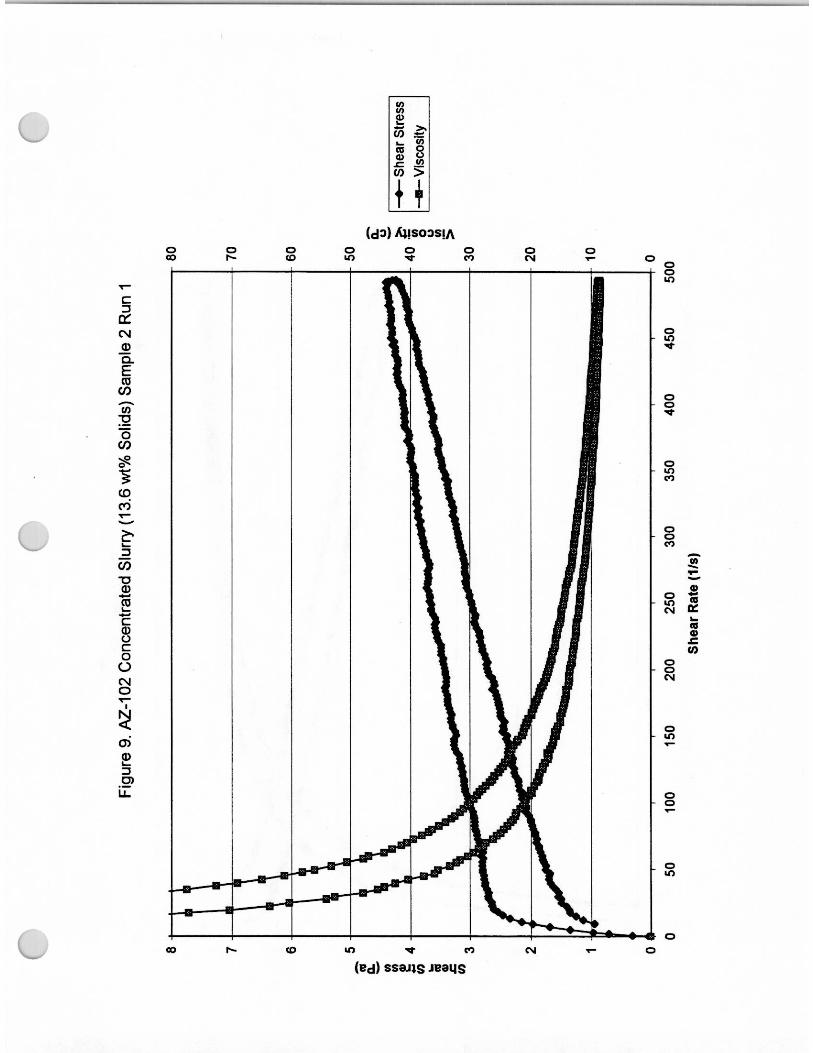
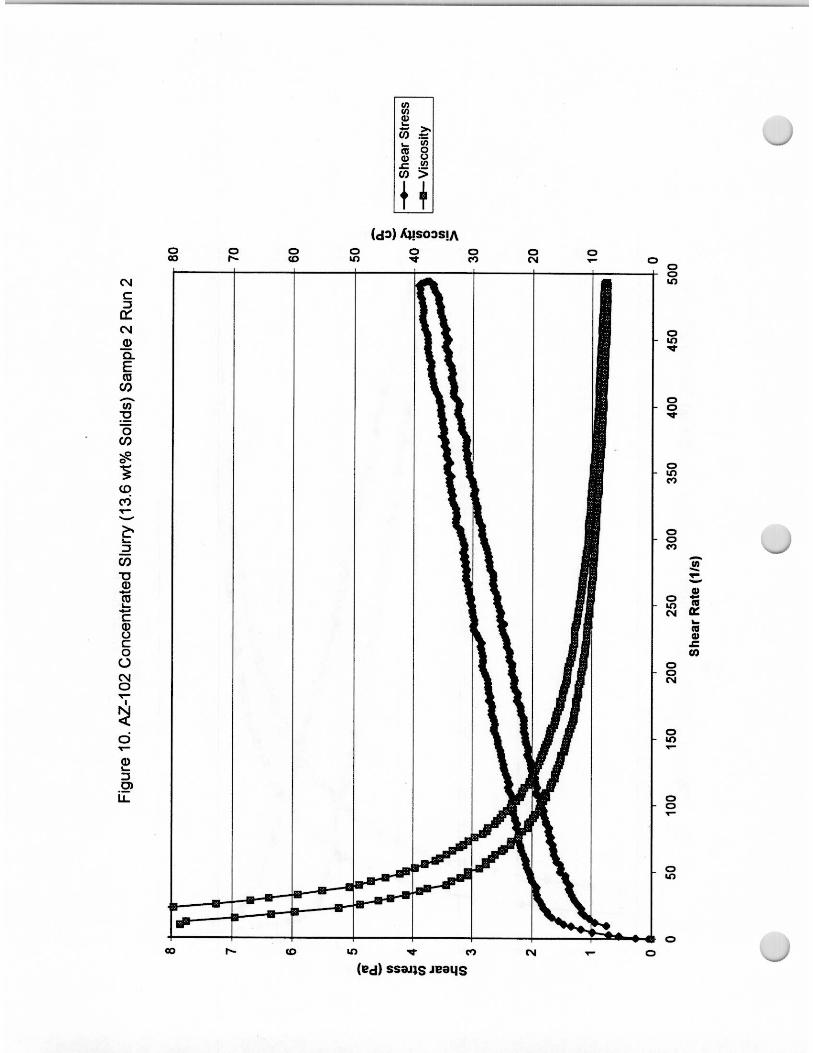
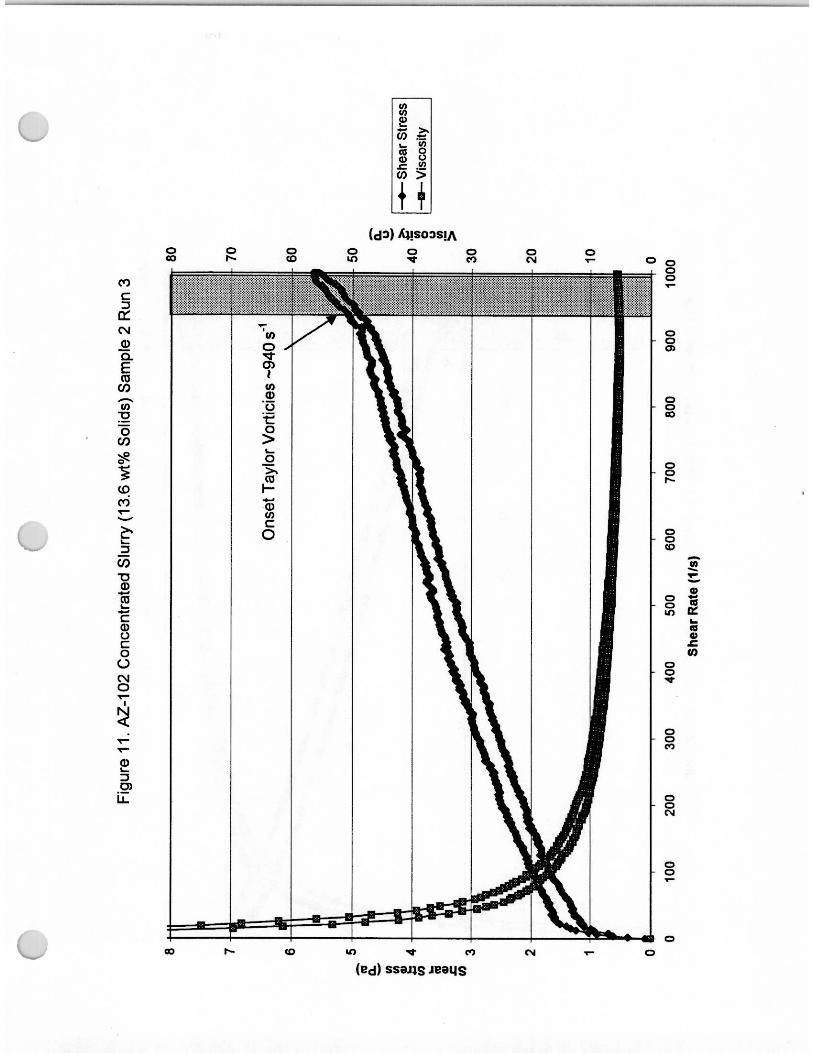
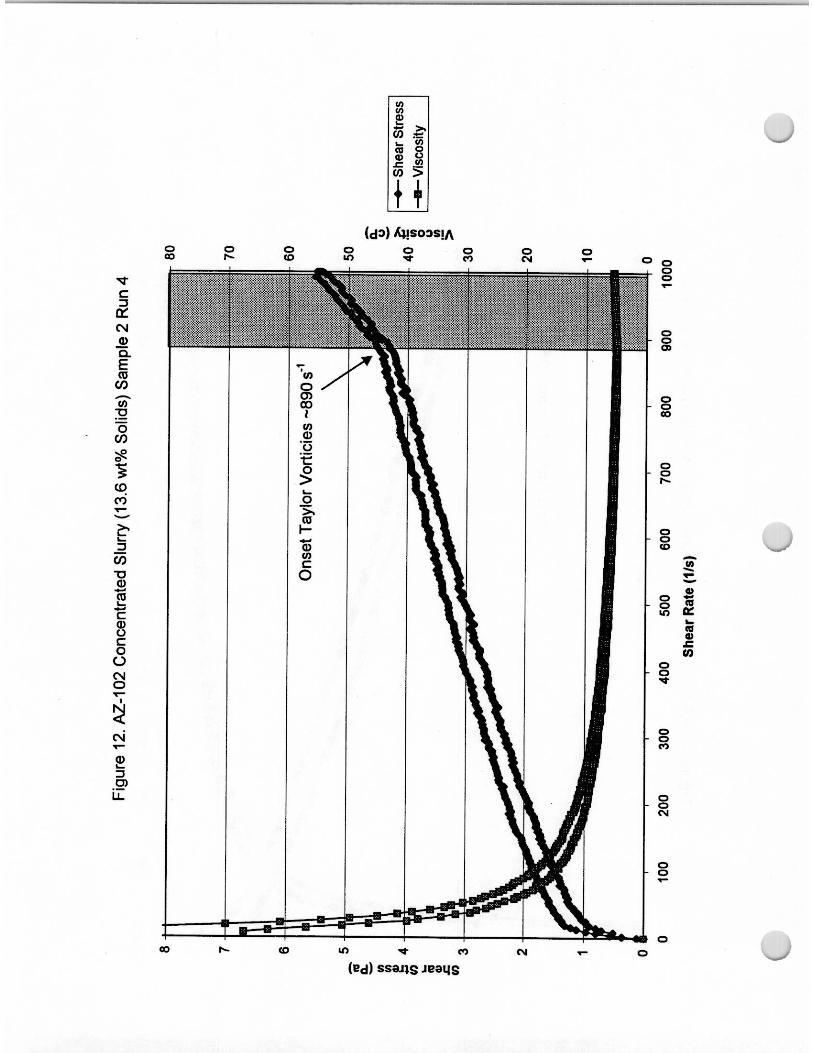
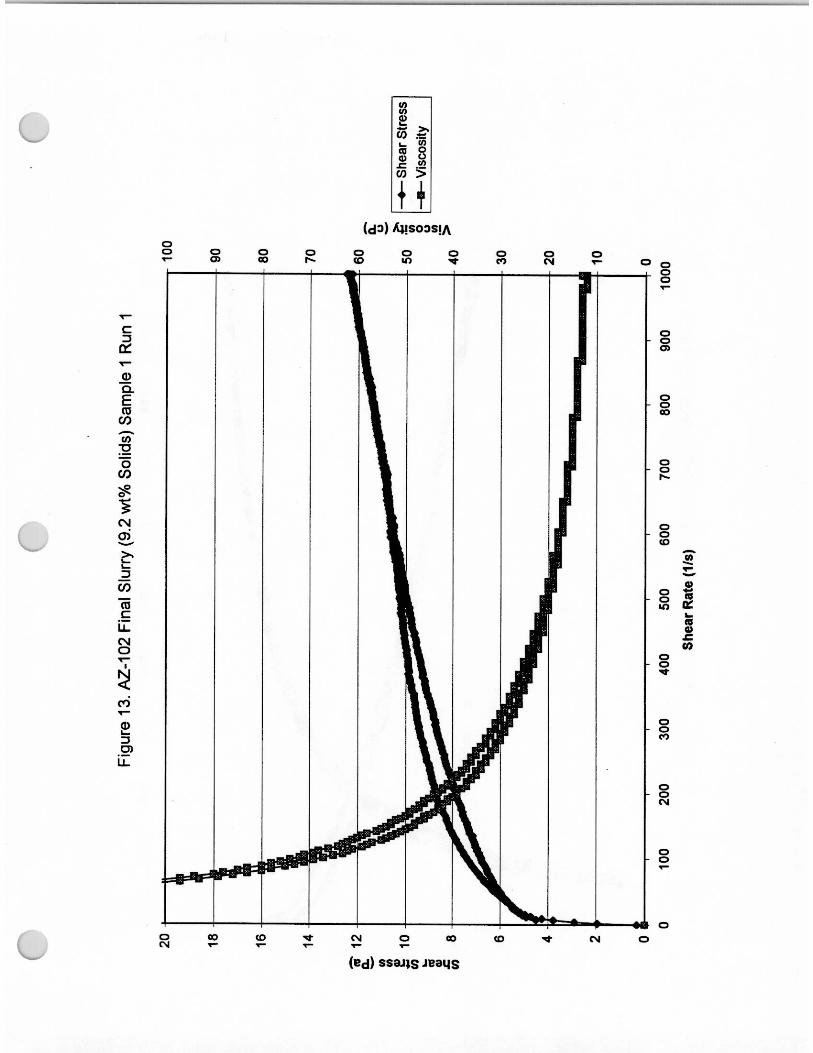
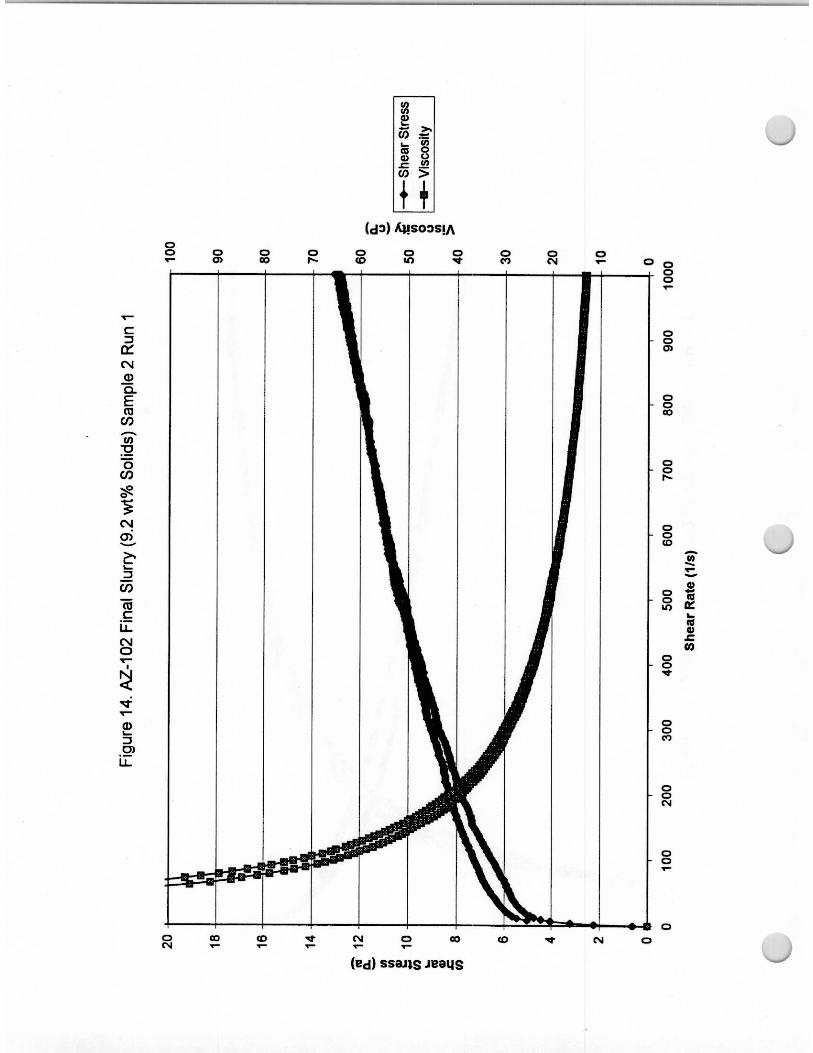
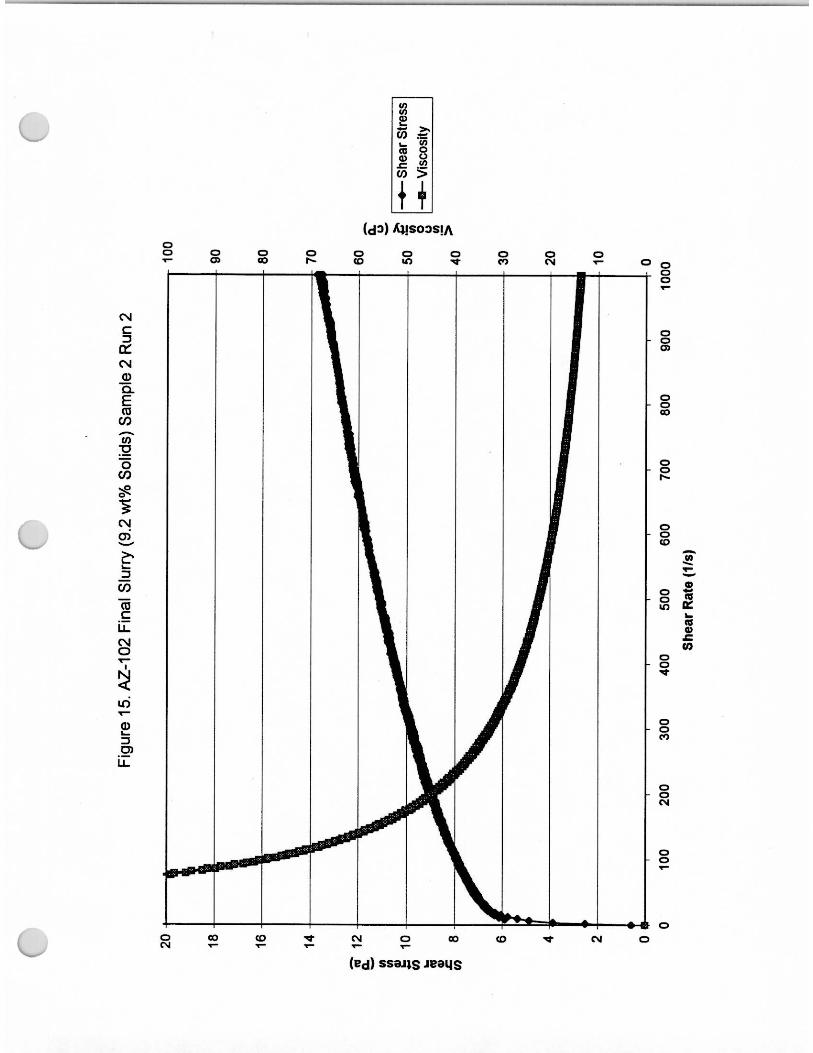
The rheological properties of the AZ-102 slurries were determined with a Haake viscometer. All three samples analyzed exhibited yield pseudoplastic and thixotropic behavior. This rheological behavior was expected, as the slurry initially added to the CUF was difficult to begin pumping, yet improved over time. The initial 5.1-wt% material had a viscosity between 4 and 16 cP. The concentrated slurry used in the second matrix had a measured solids concentration of 13.7 wt% and a viscosity between 82 and 100 cP (@ 33 s-1) during the initial increase in sheara. The viscosity steadily declined for both the decreasing shear curves and with subsequent runs. During the decreasing shear curve, the 13.7 wt% slurry had a measured viscosity at 33 s-1 of between 25 and 47 cP. The final slurry samples with solids concentration of 9.2-wt % solids had viscosities at 33 s-1, ranging from 167 to 209 cP. Foaming was observed in the final pretreated slurry sample (9.2 wt% solids), which may have contributed to the higher observed viscosities for this sludge.
Table S.1. Solubility of AZ-102 Sludge Key Components in 0.01 M NaOH and 3 M NaOH
ComponentFraction Removed in Water Washes (%)
Fraction Removed in Caustic Leaches (%)
Fraction in Solids Residue (%)
Al 2.5 61.2 36.3
Cr 44.1 14.2 41.7
Fe 0.006 0.02 99.97
Na 80.2 -nd- 11.2
P 6.7 45.6 47.790Sr 0.003 0.007 99.99137Cs 61.2 32.7 6.1
-nd- : Not determined due to difficulty in distinguishing leached sodium from added sodium. The fraction Na in the solids residue may be that added during the caustic leaching rather than that initially present in the sludge.
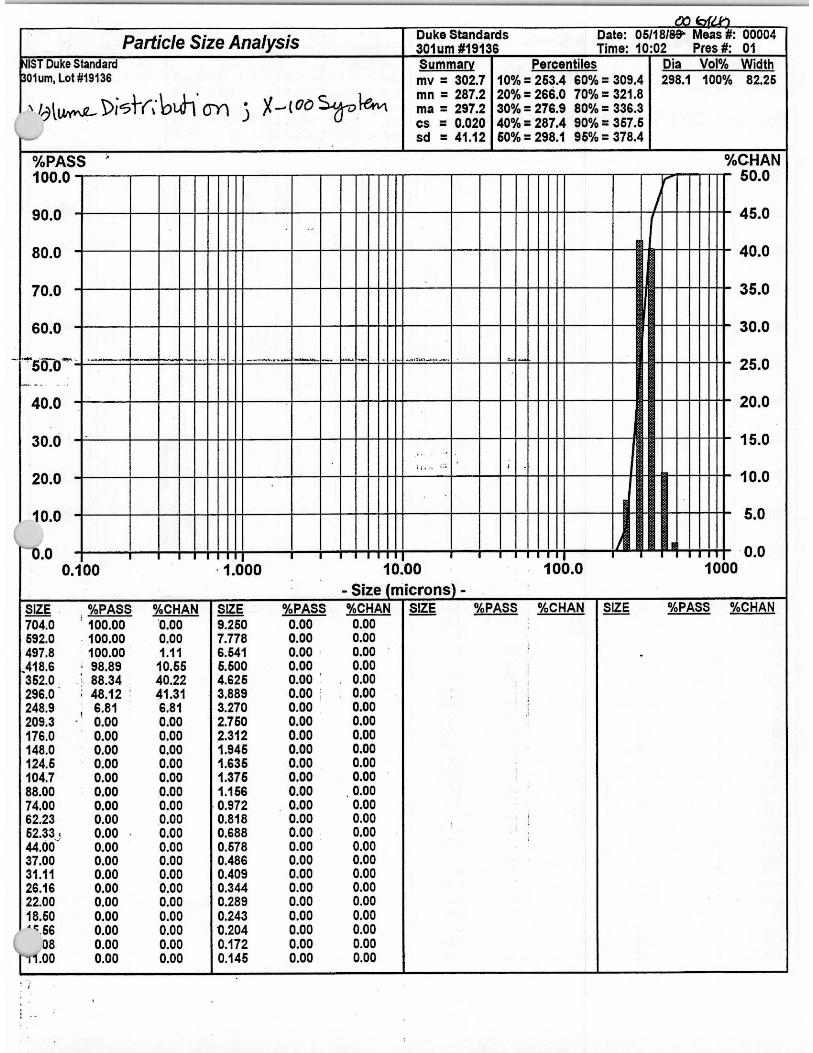
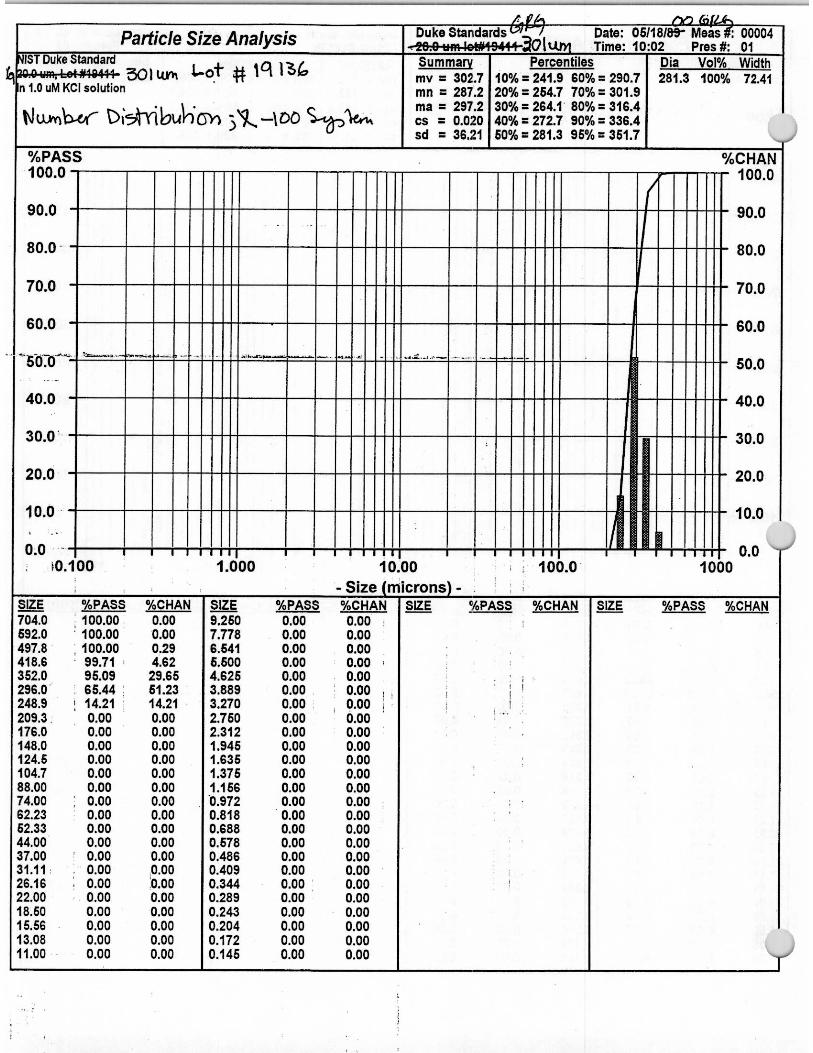
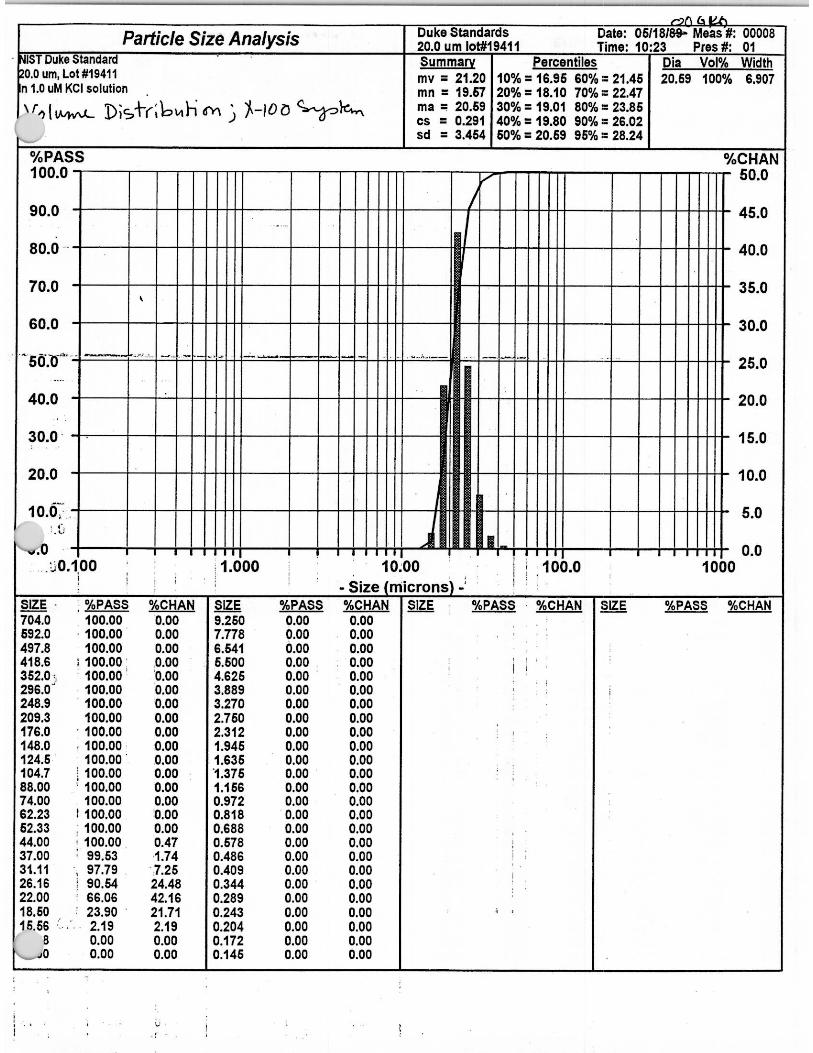
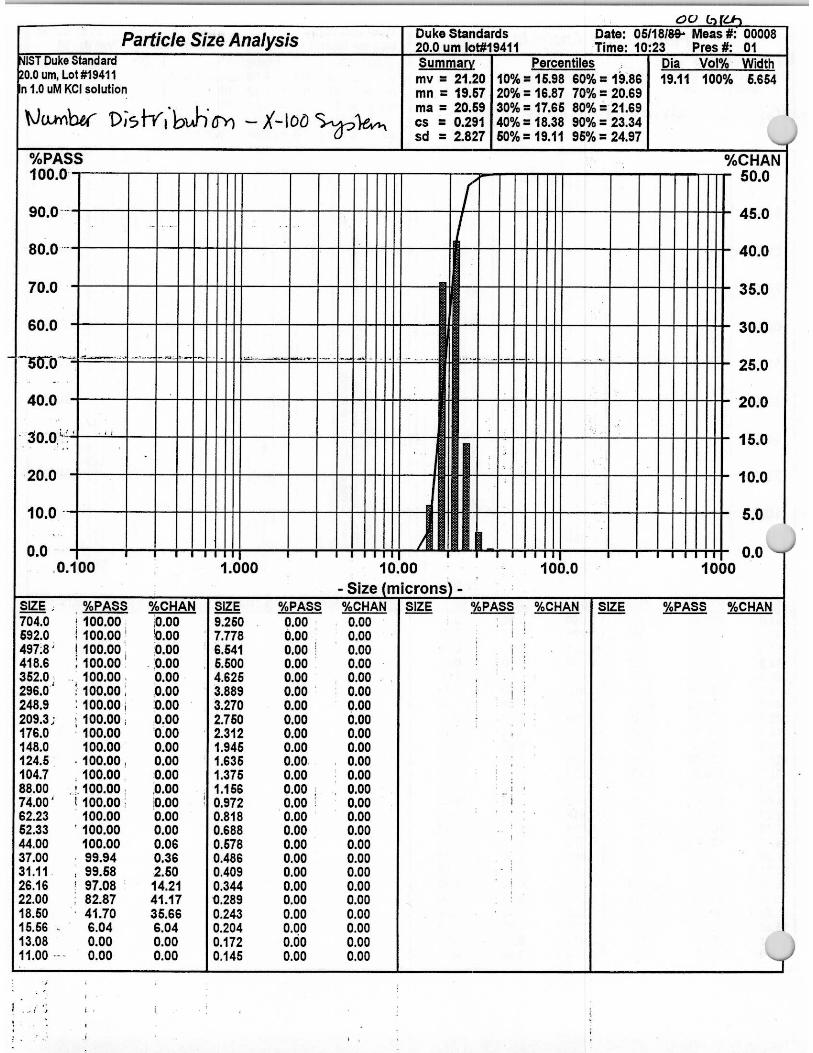
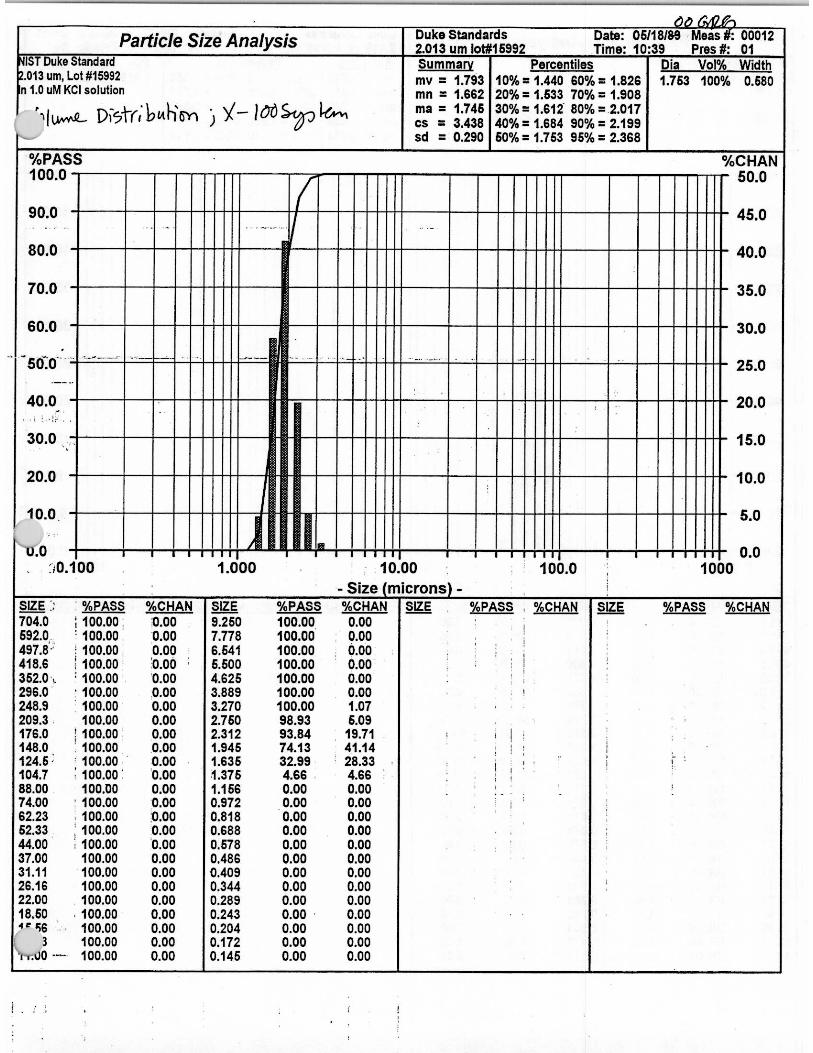
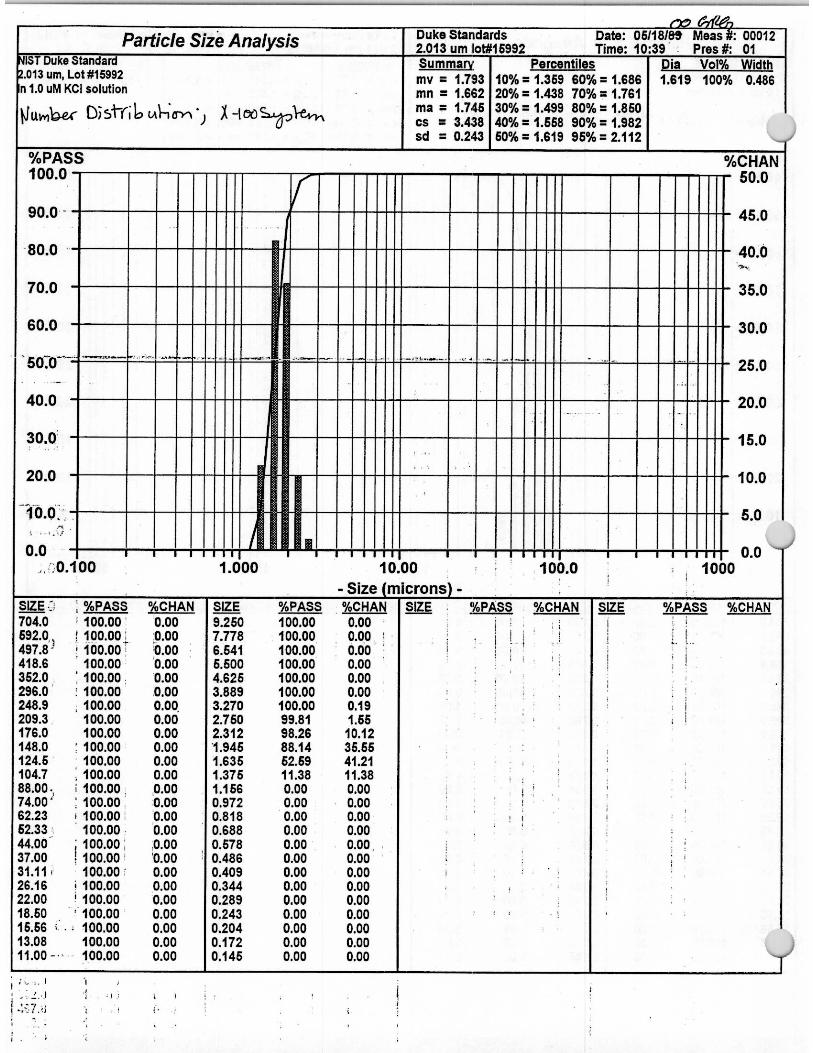
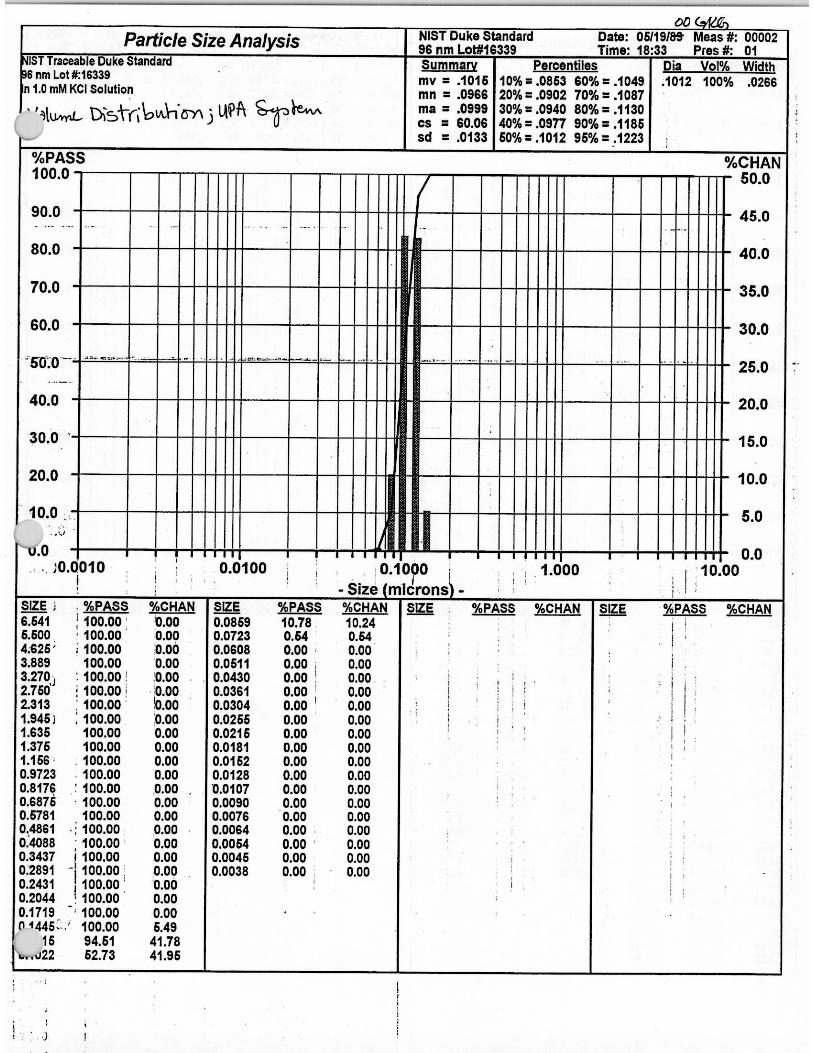
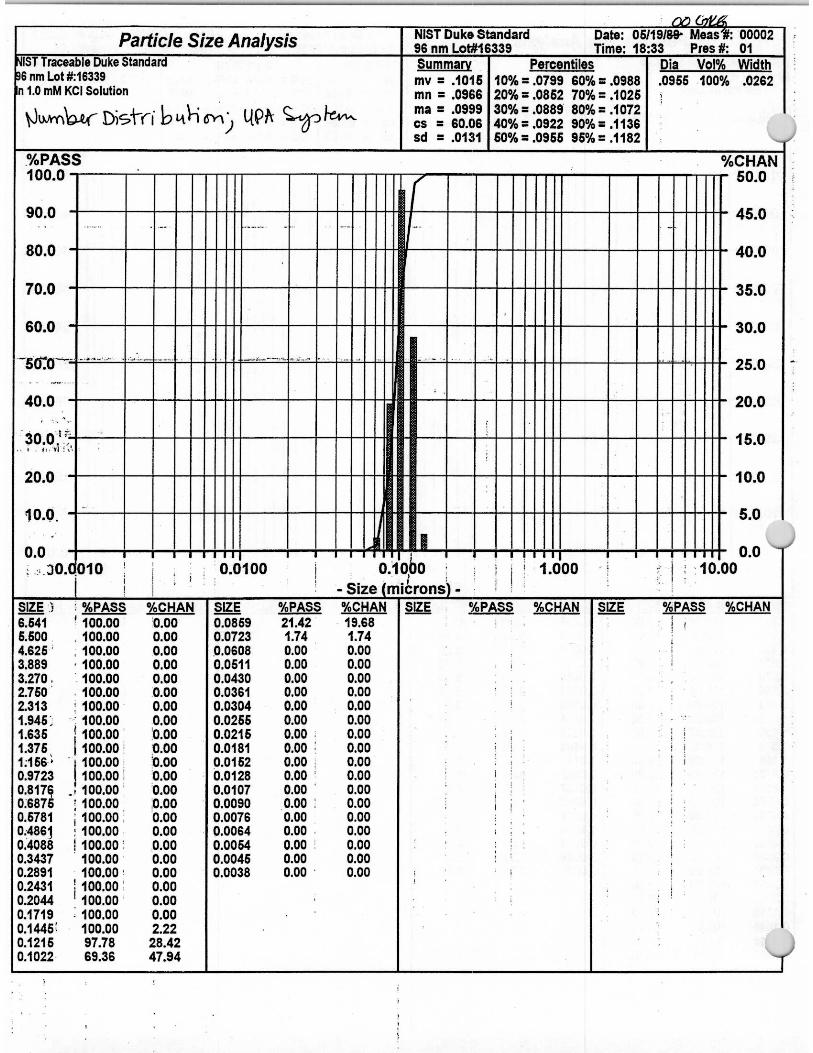
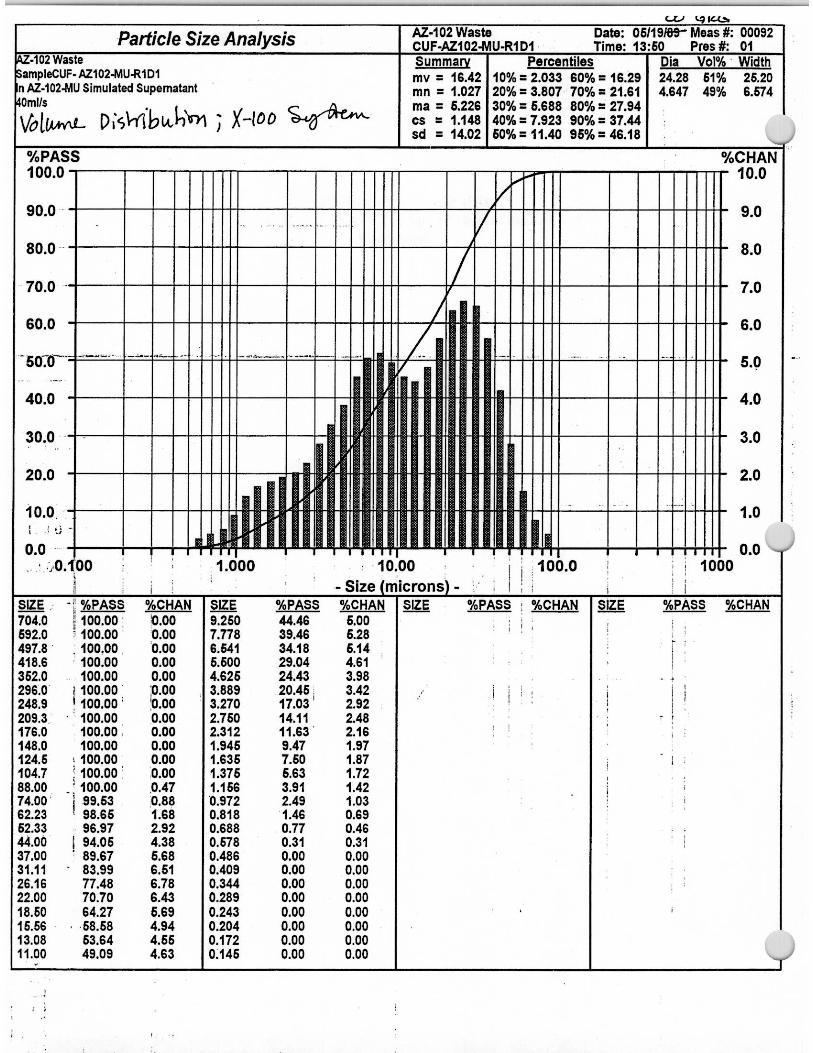
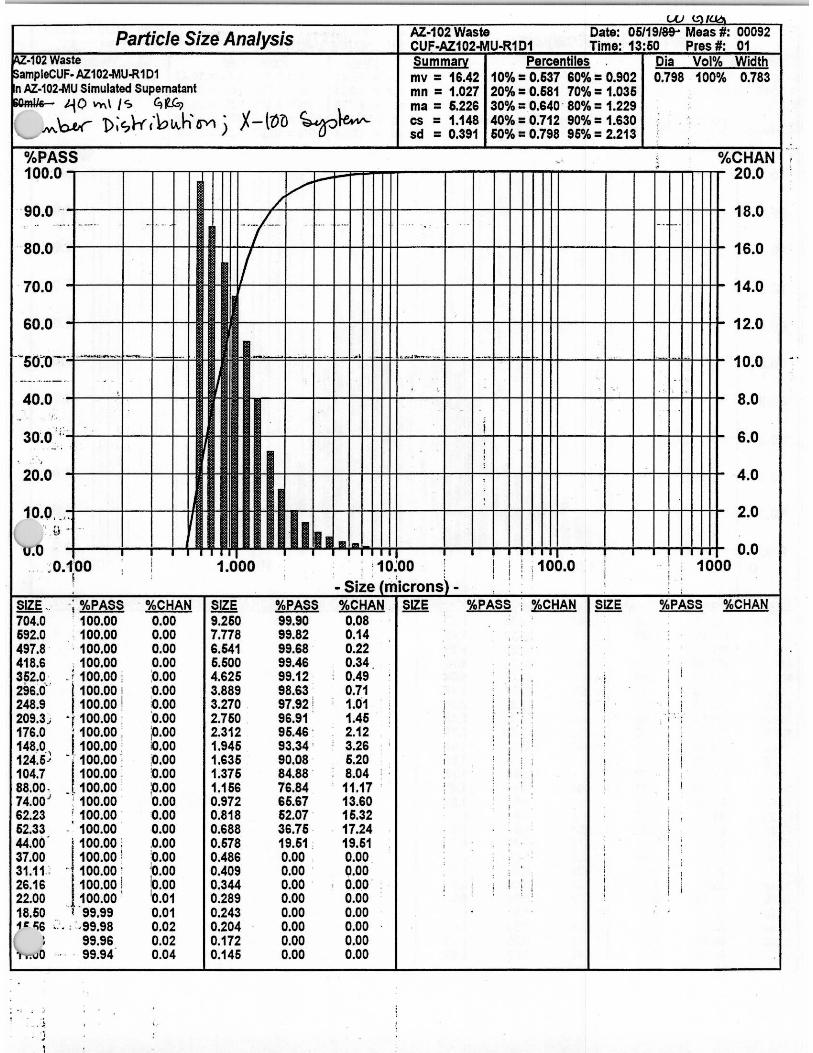
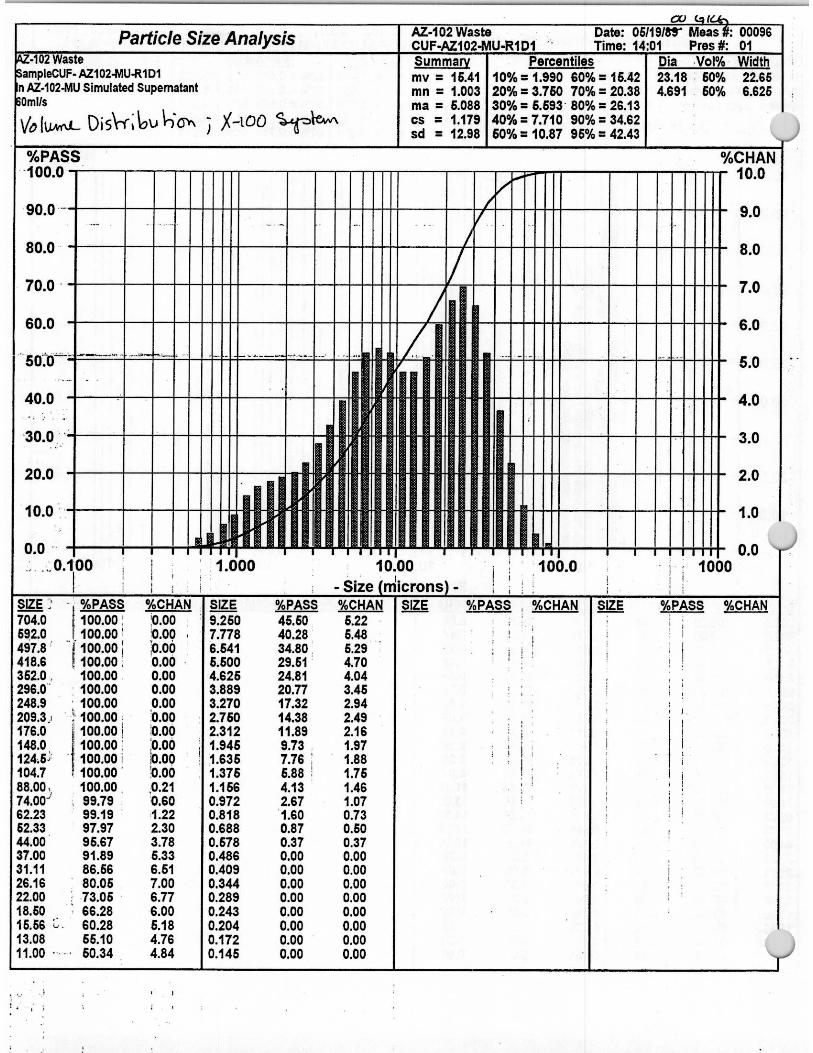
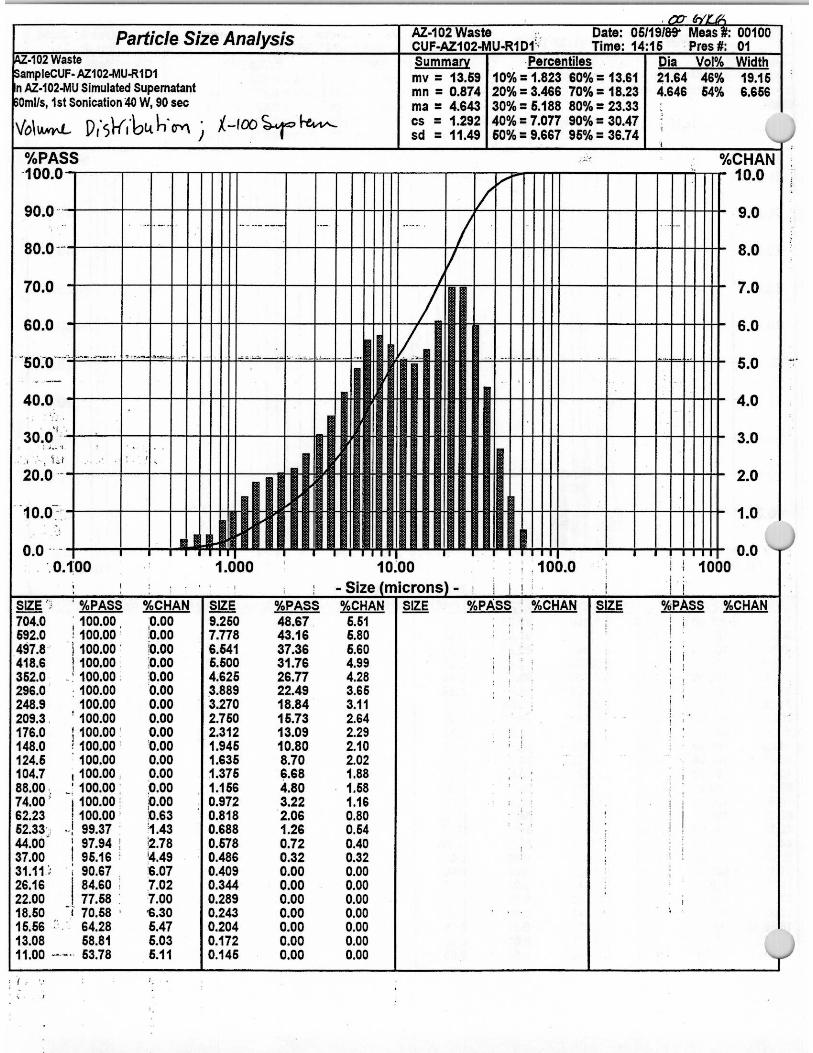
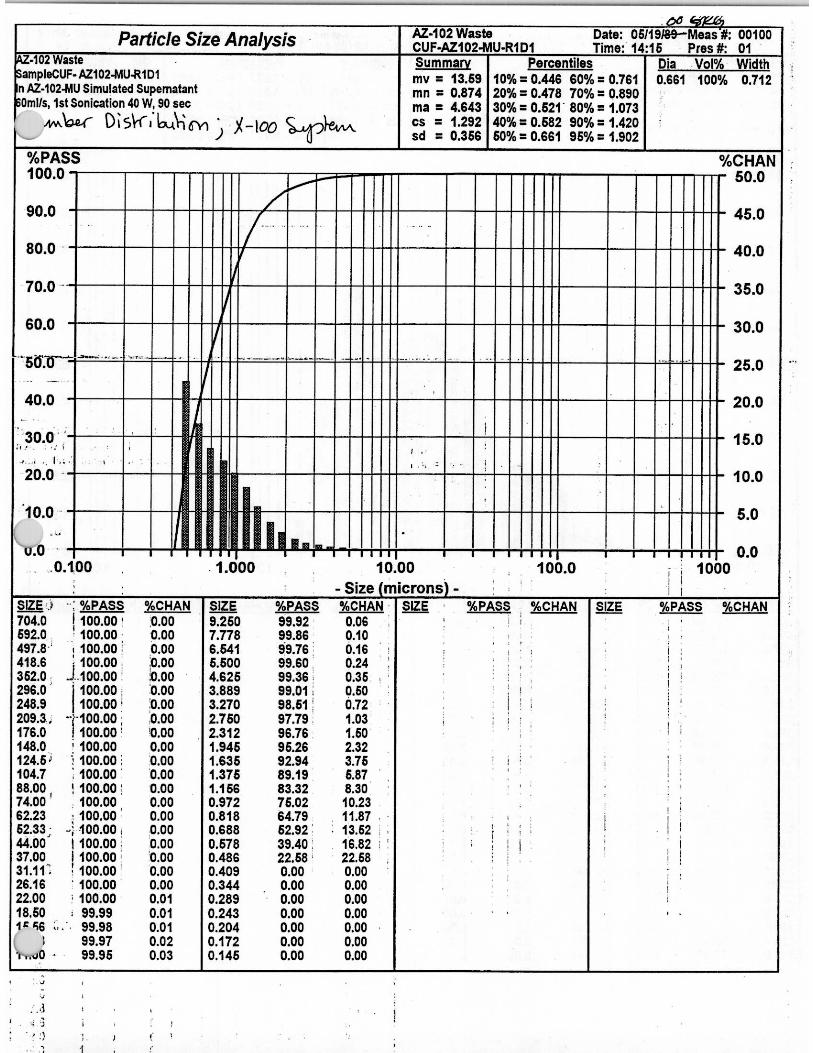
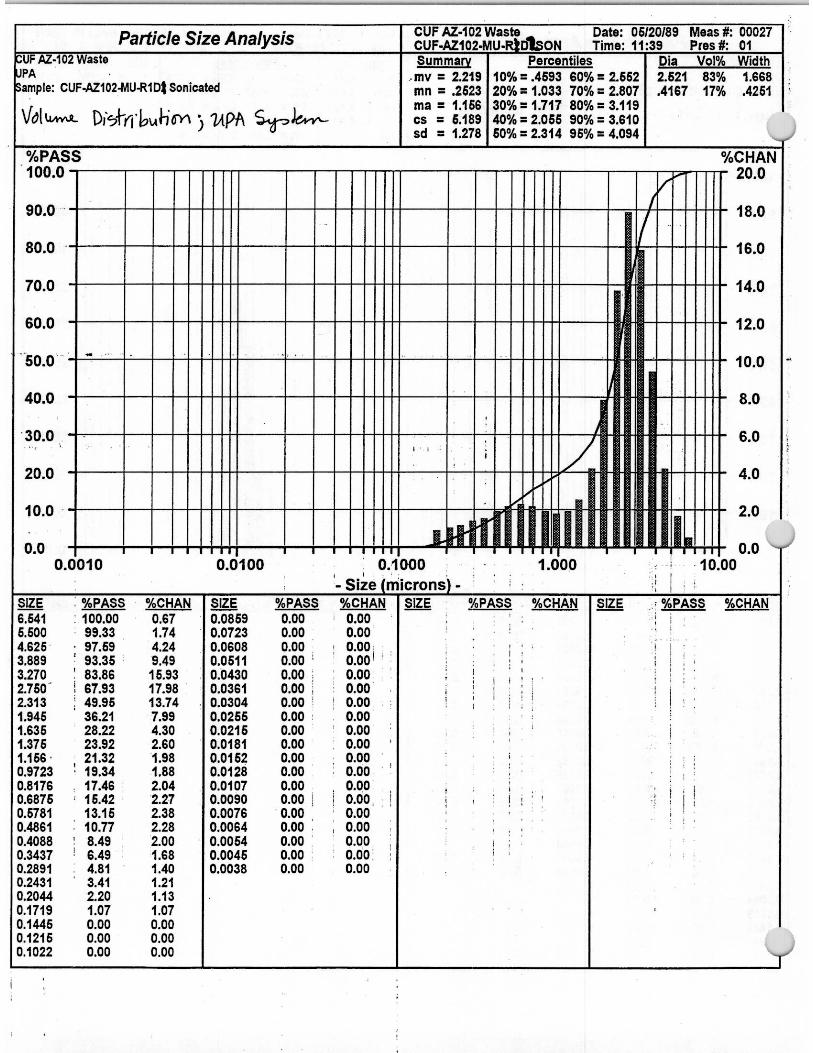
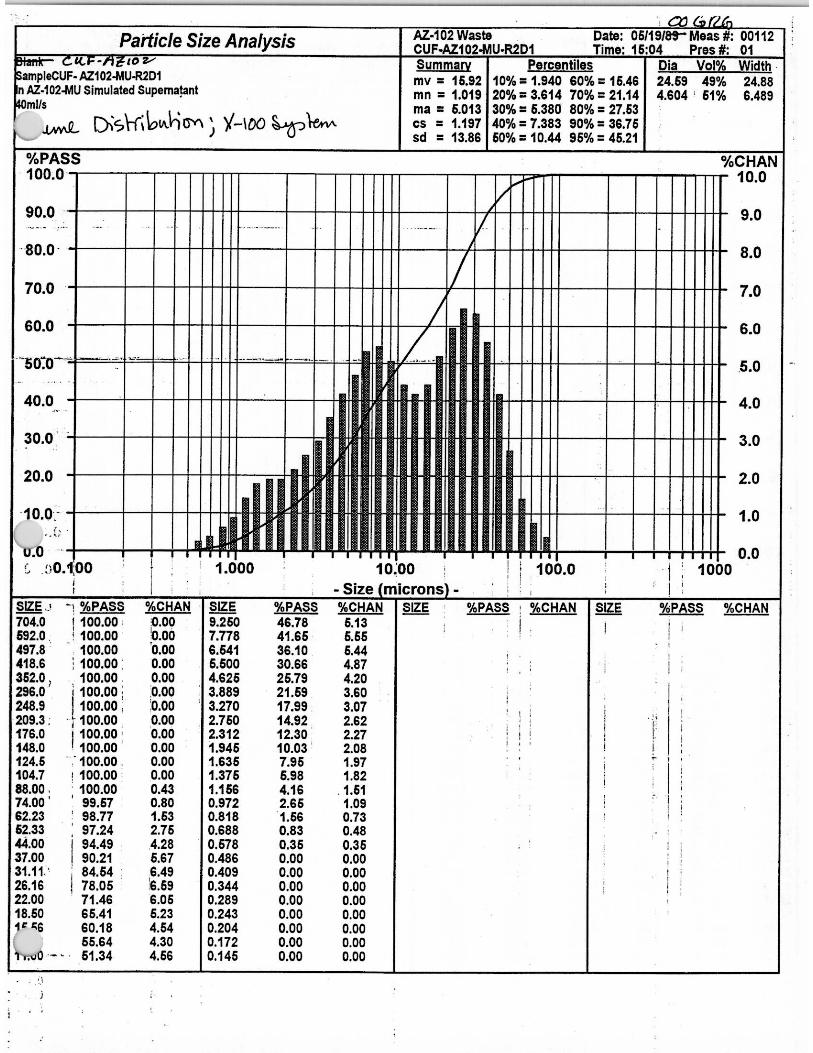
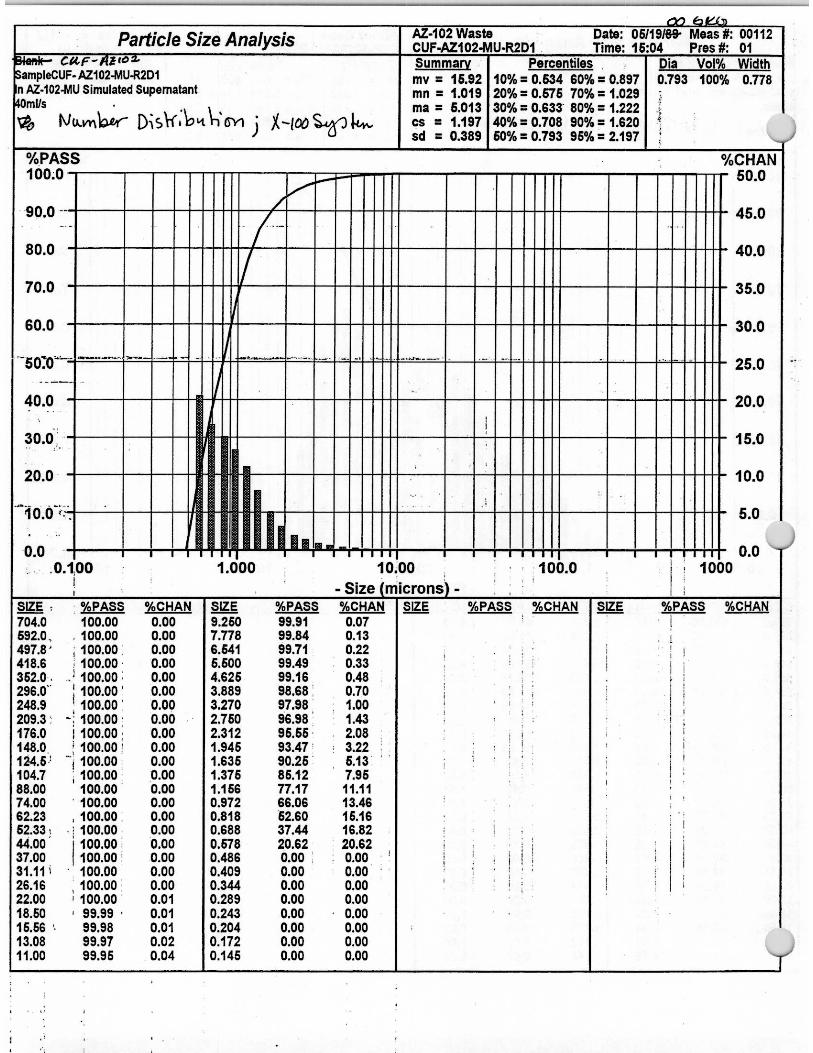
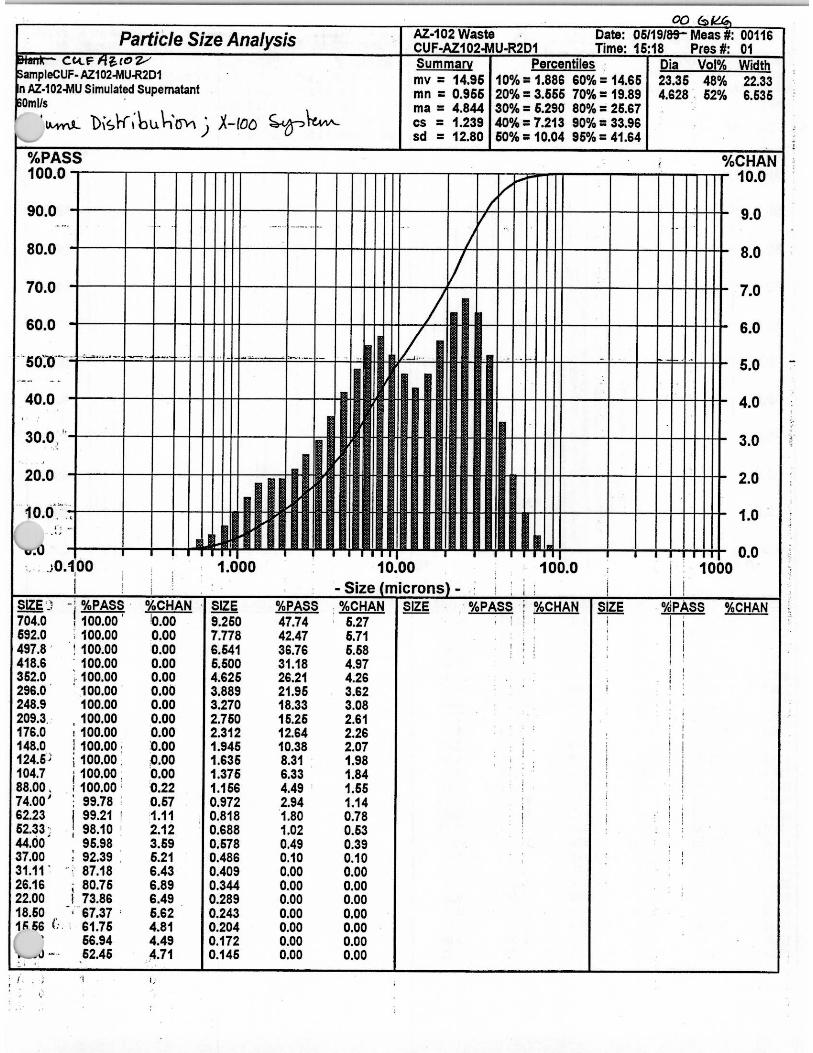
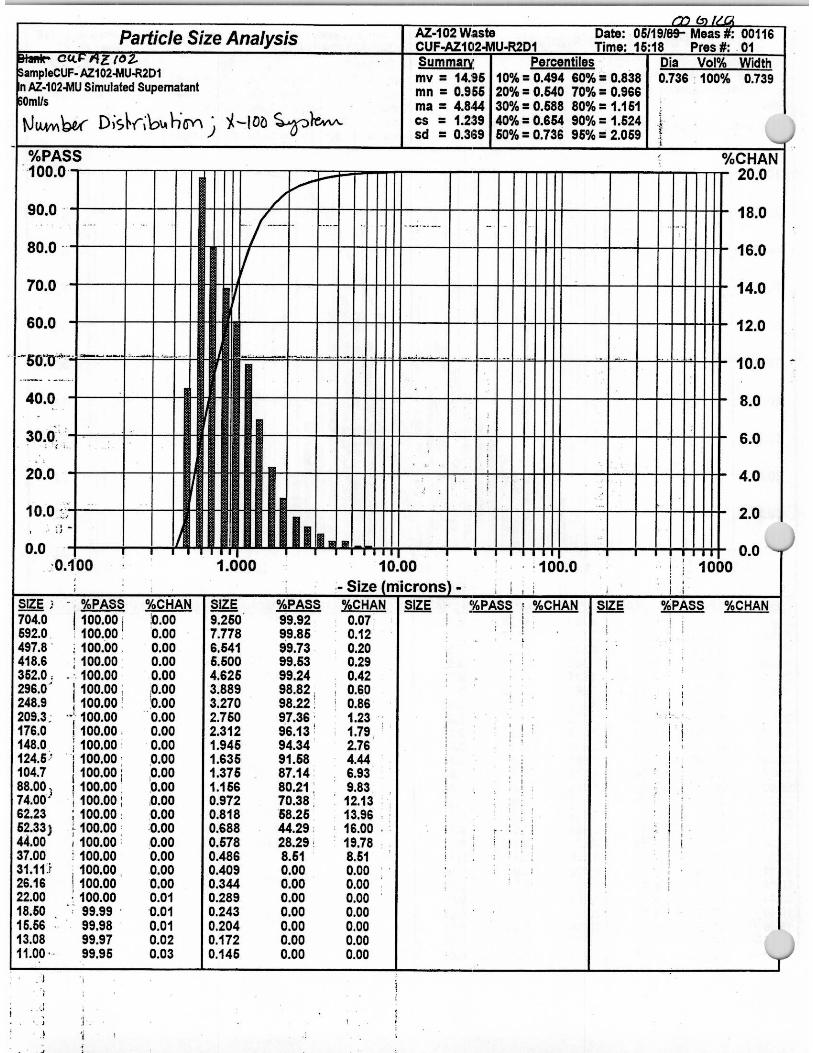
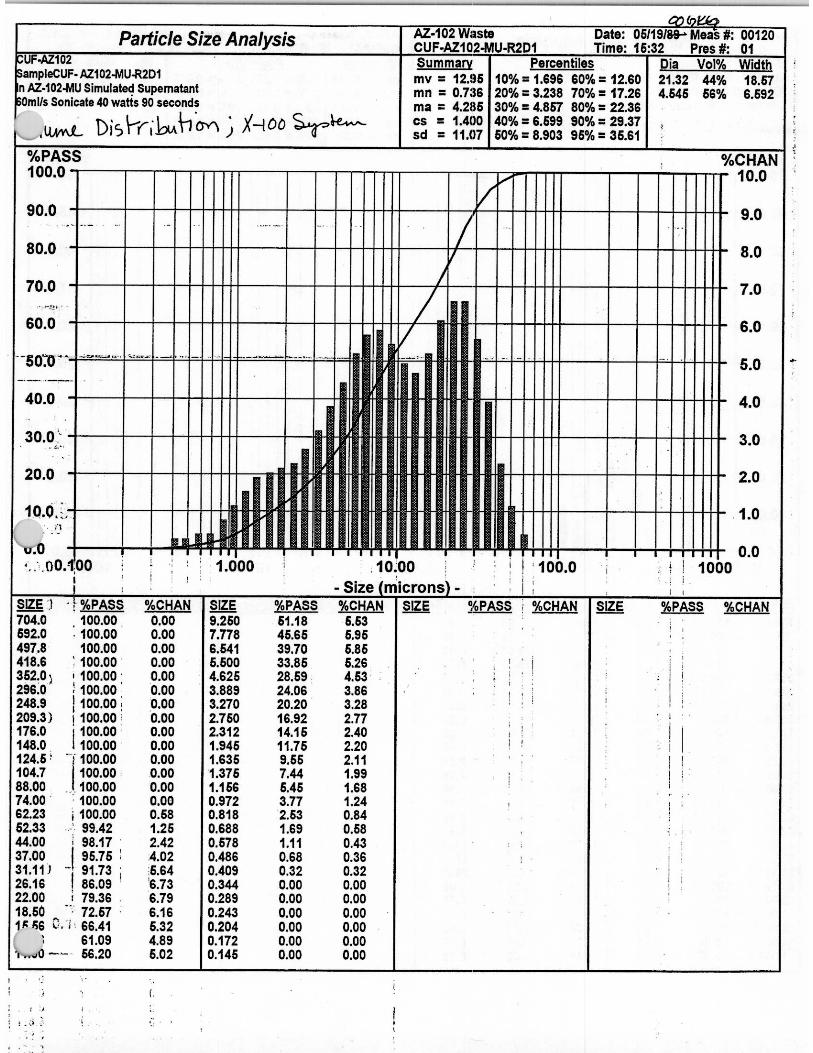
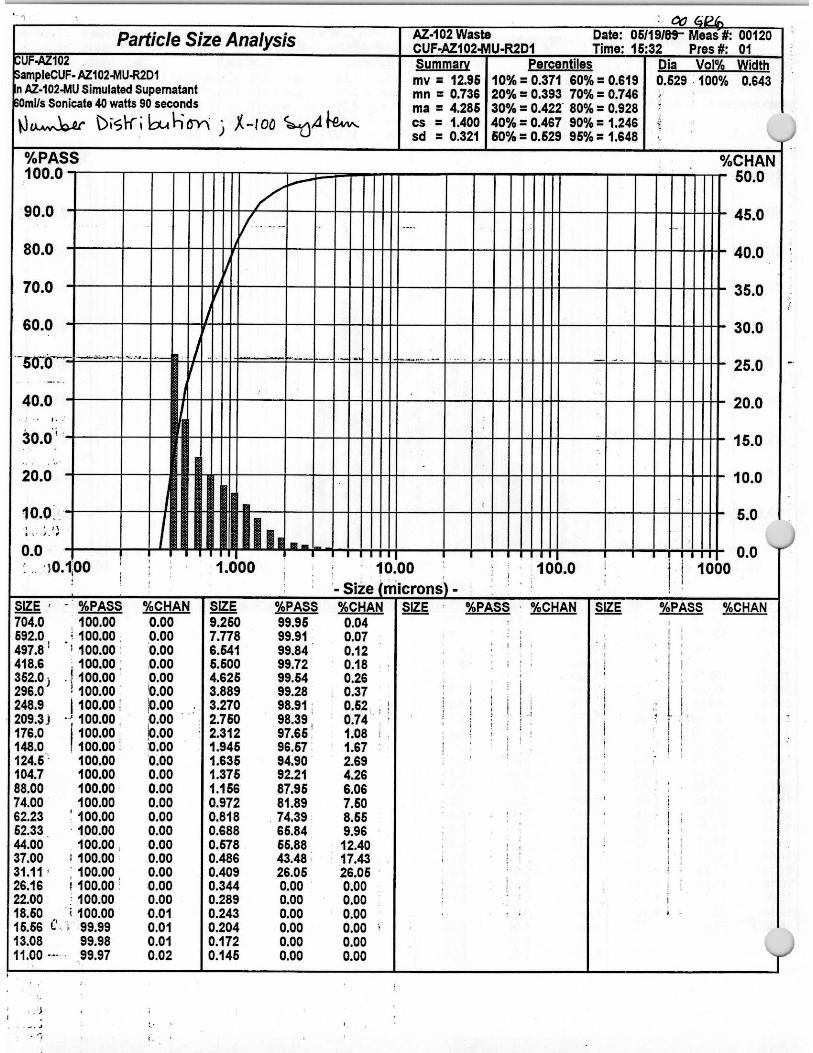
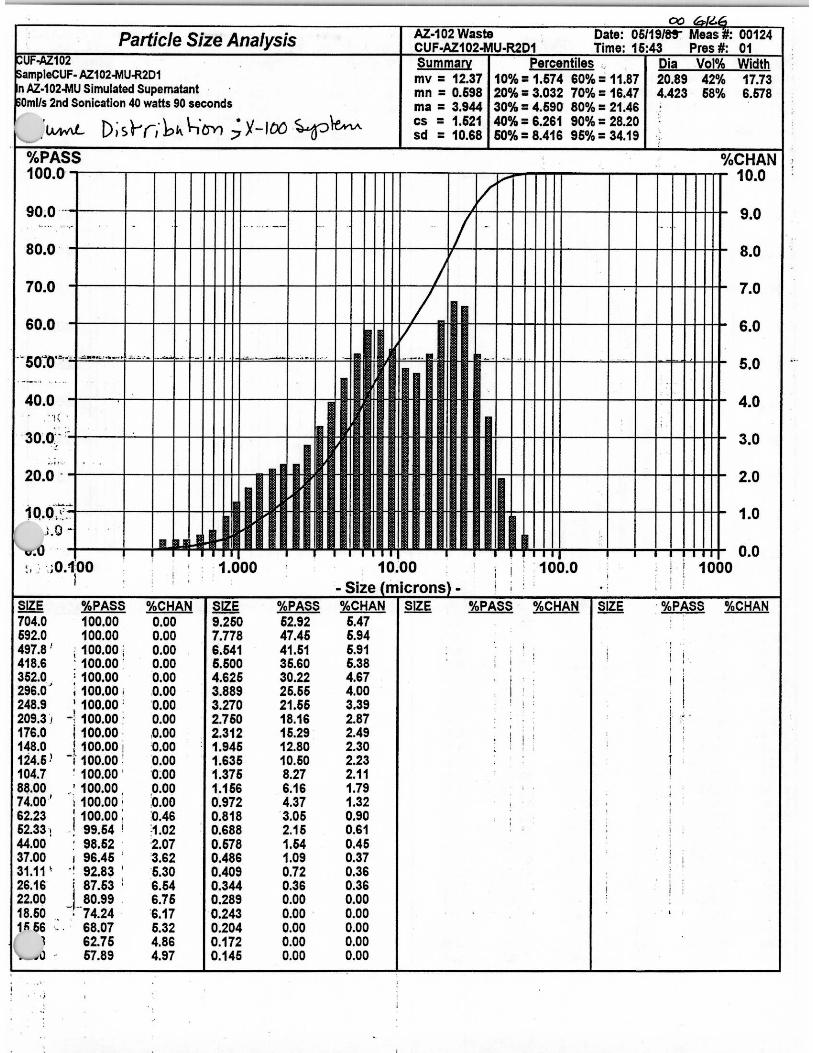
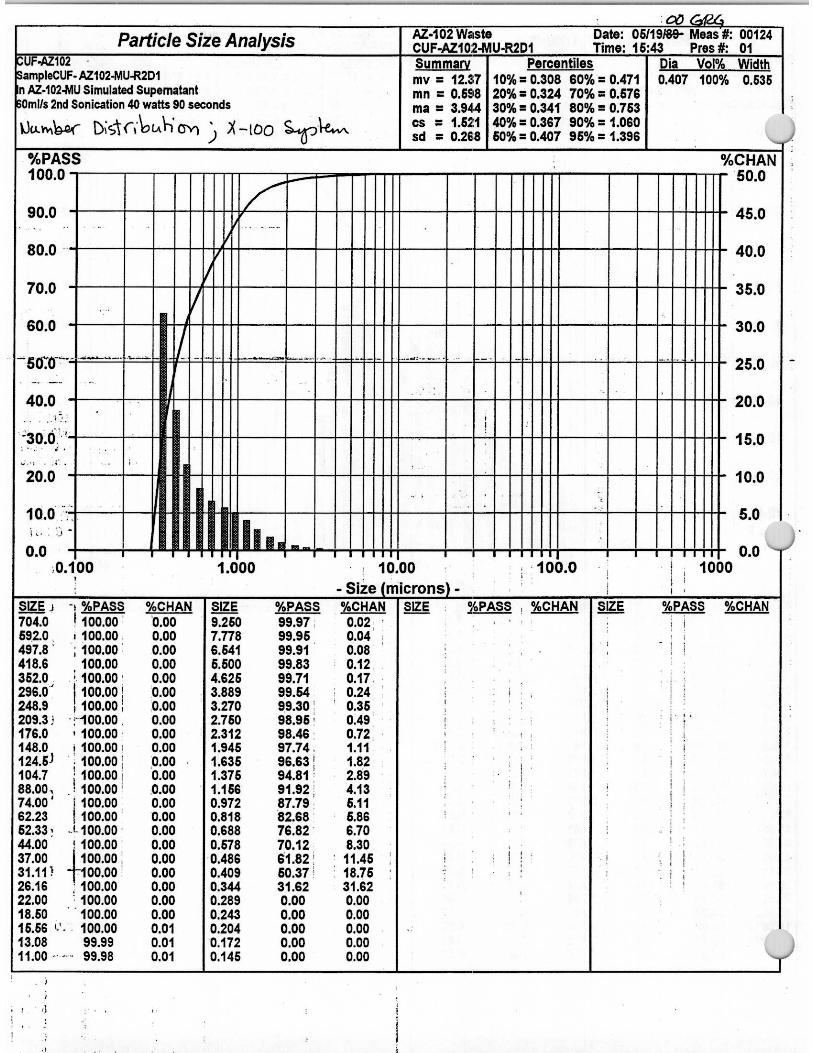
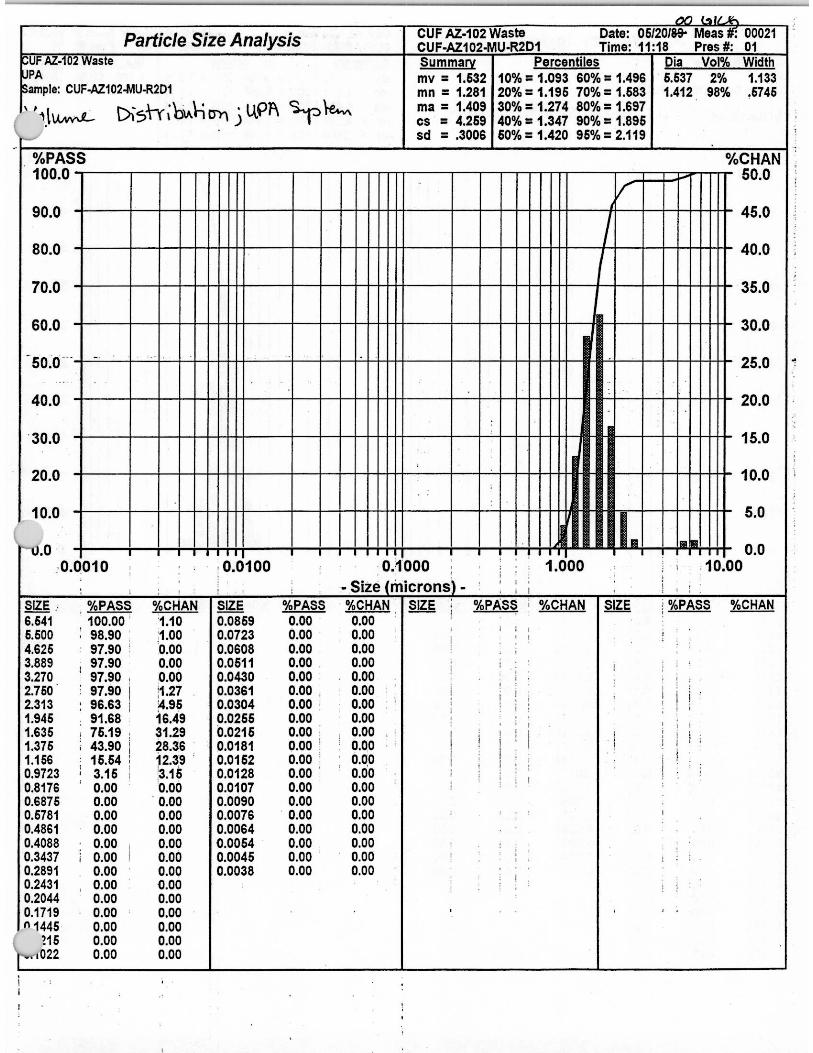
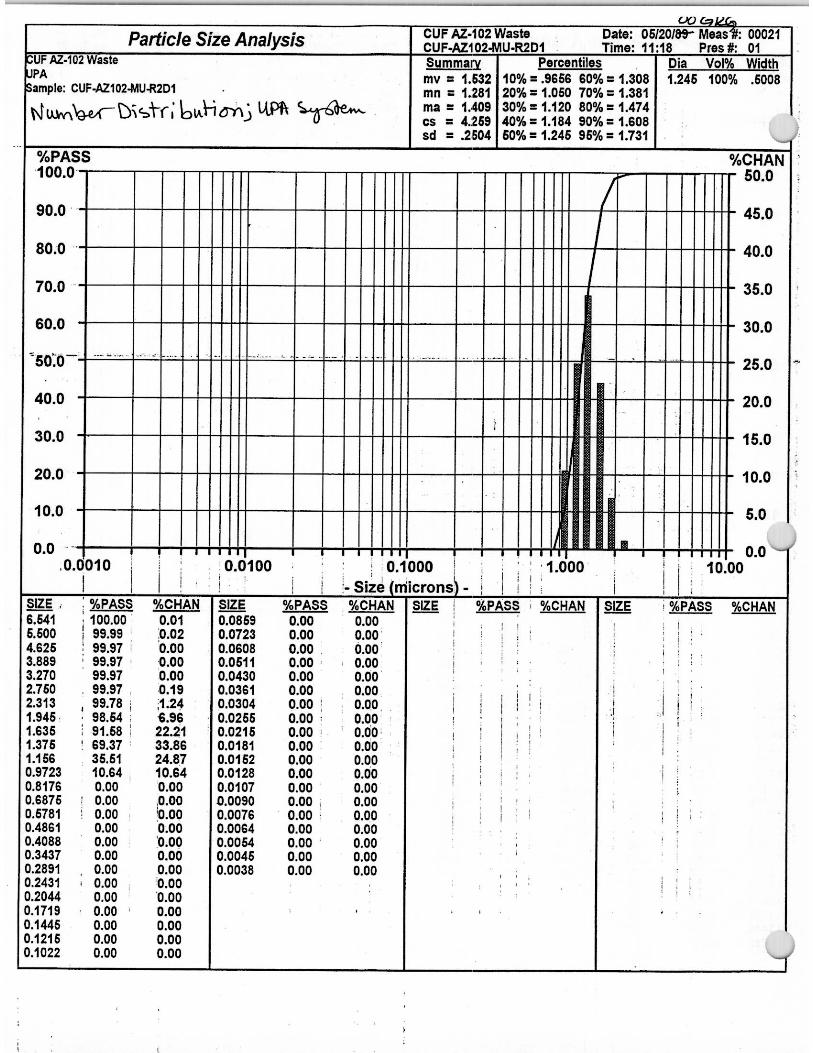
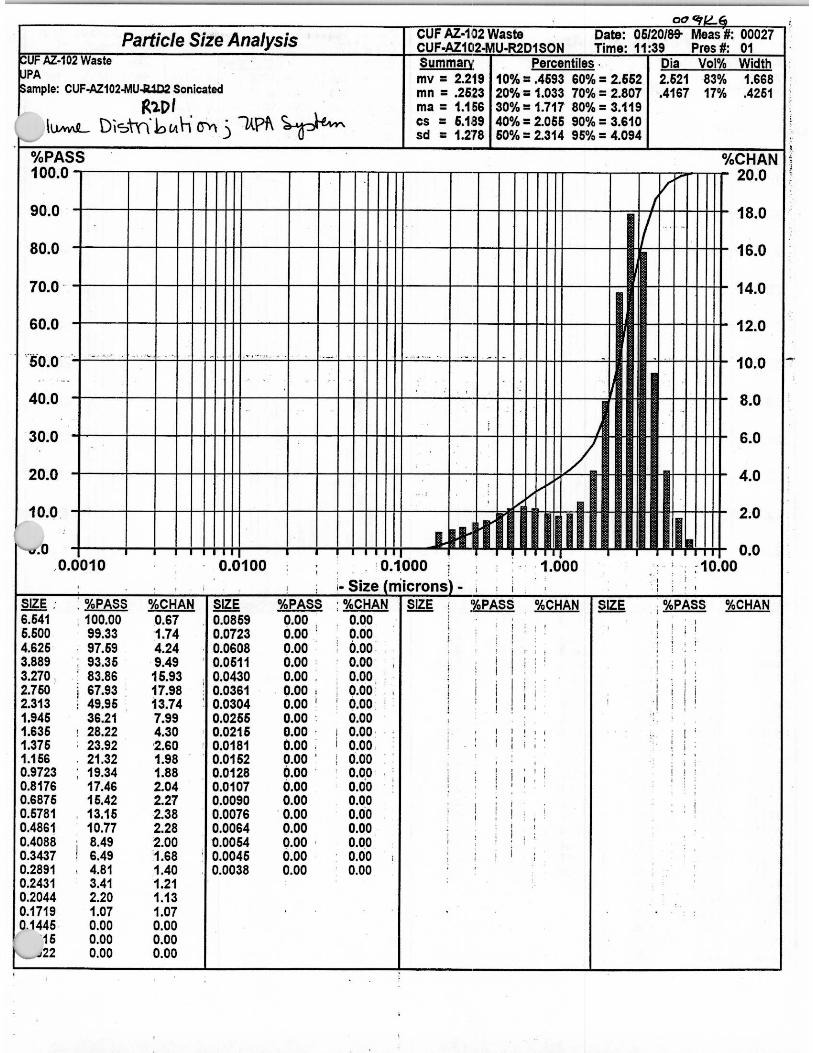
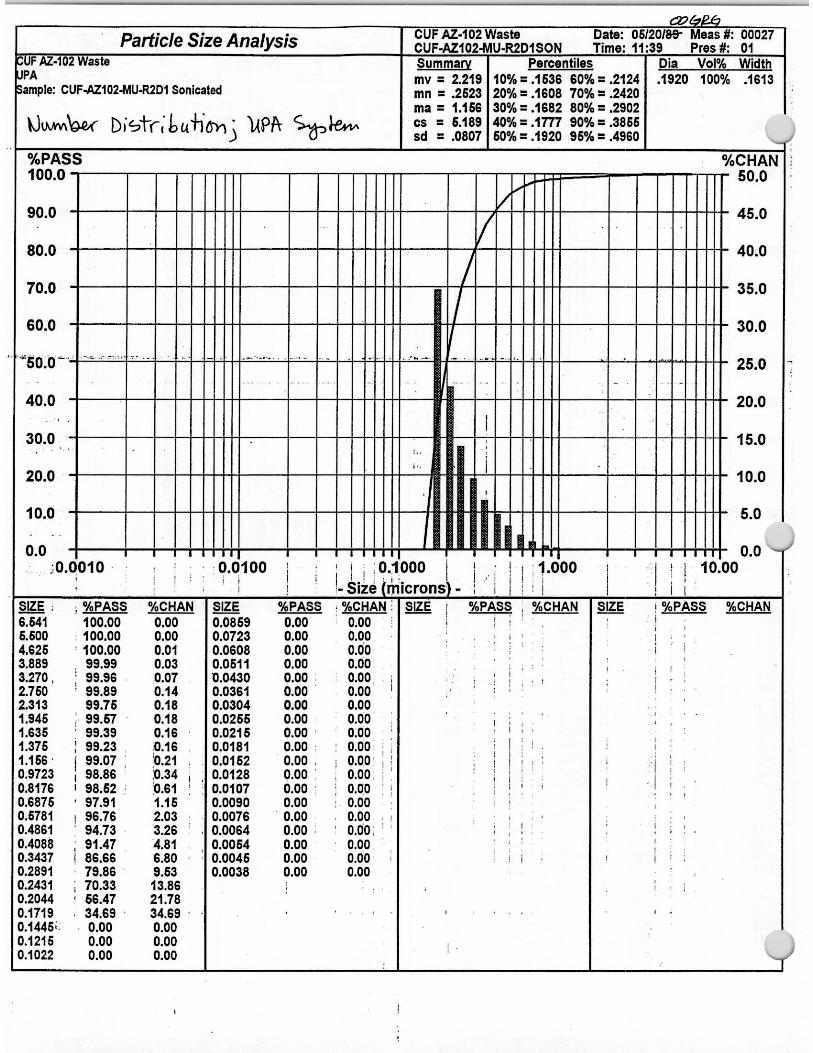
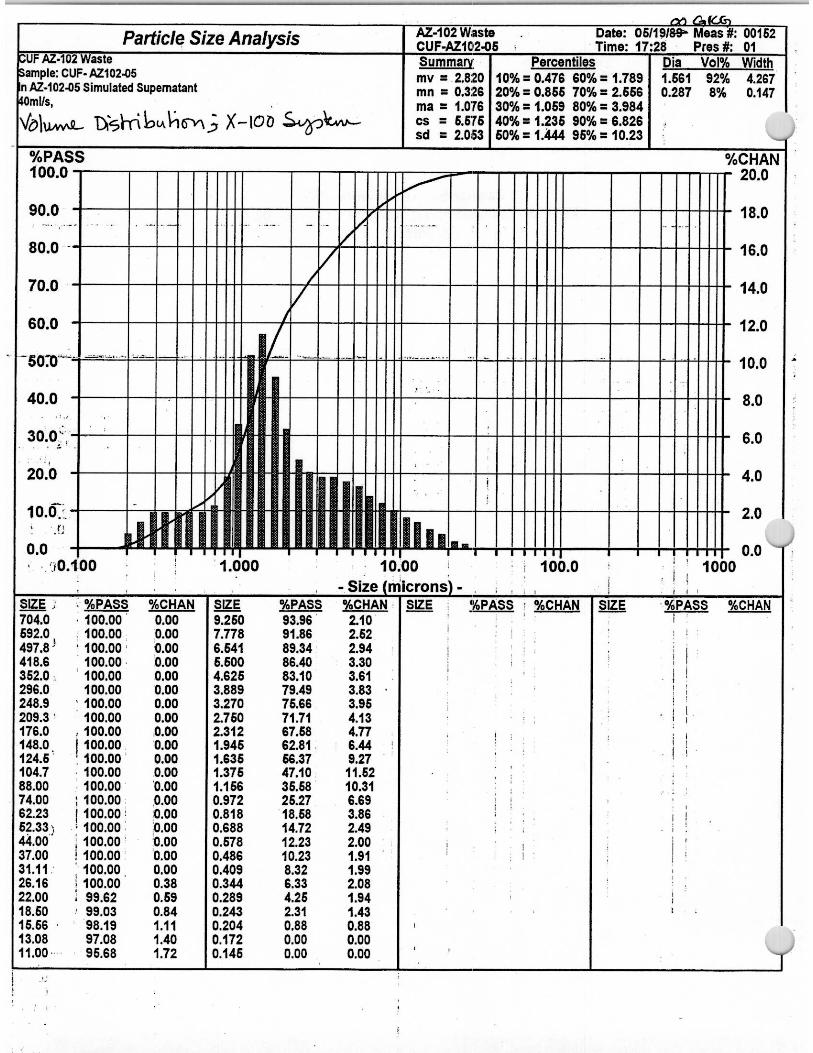
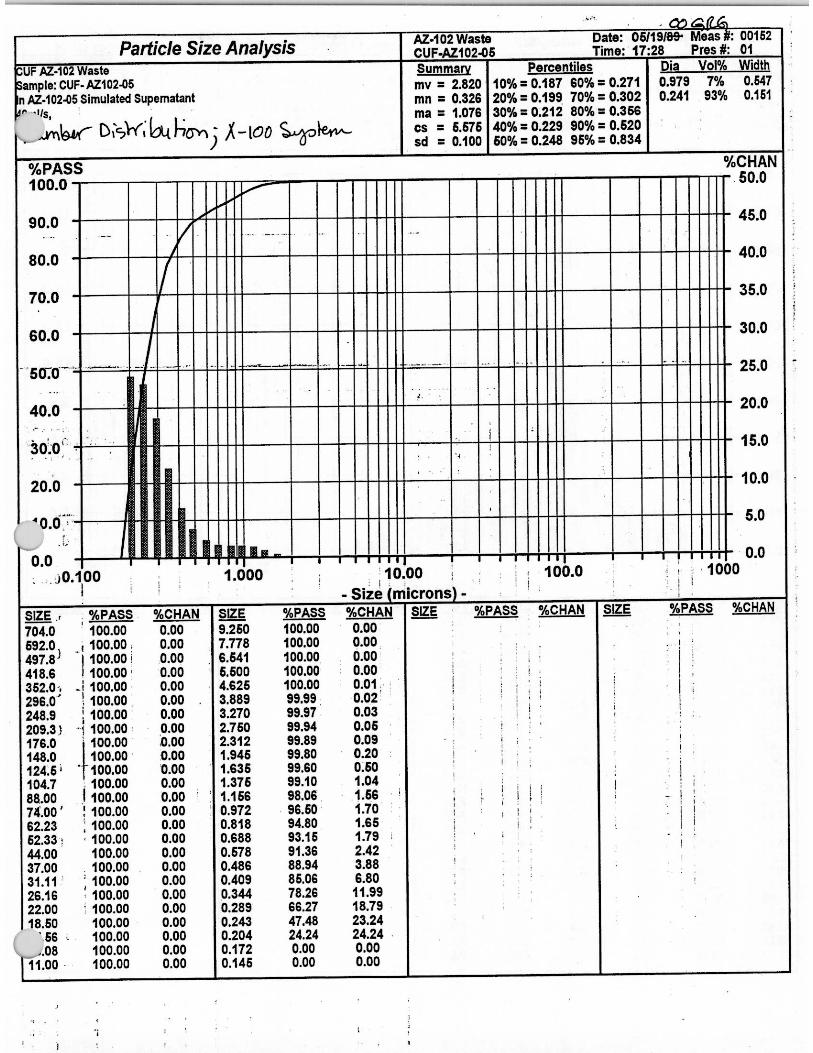
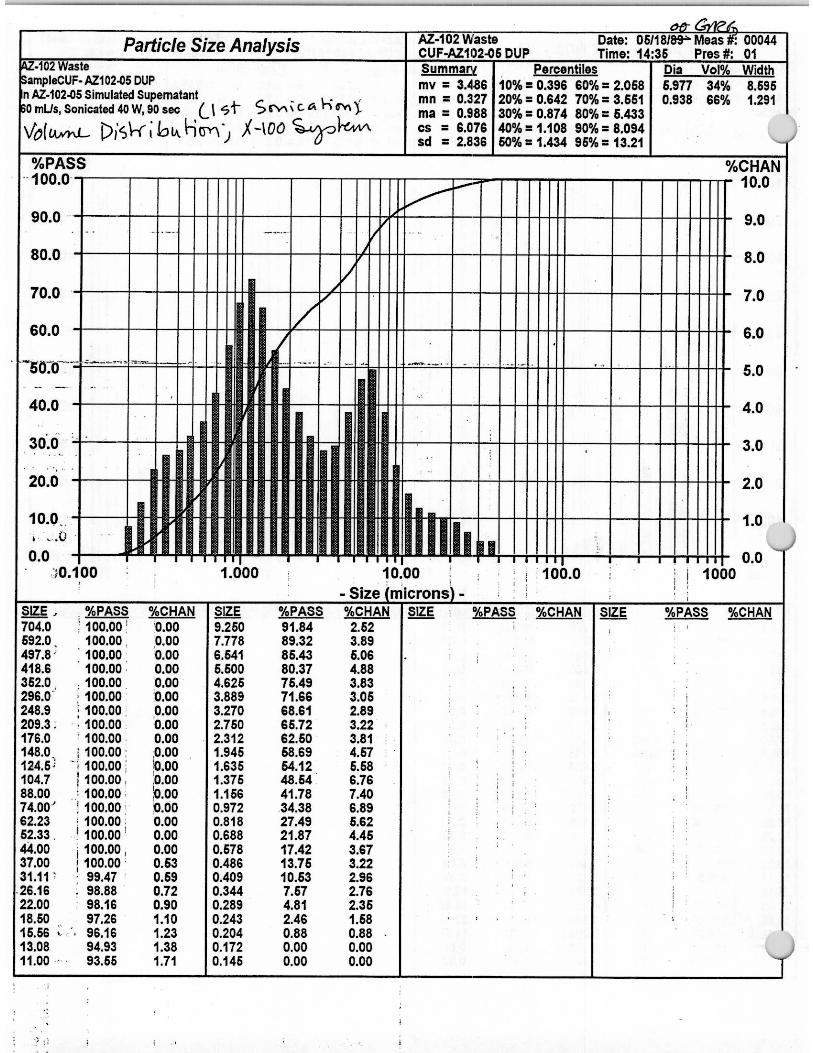
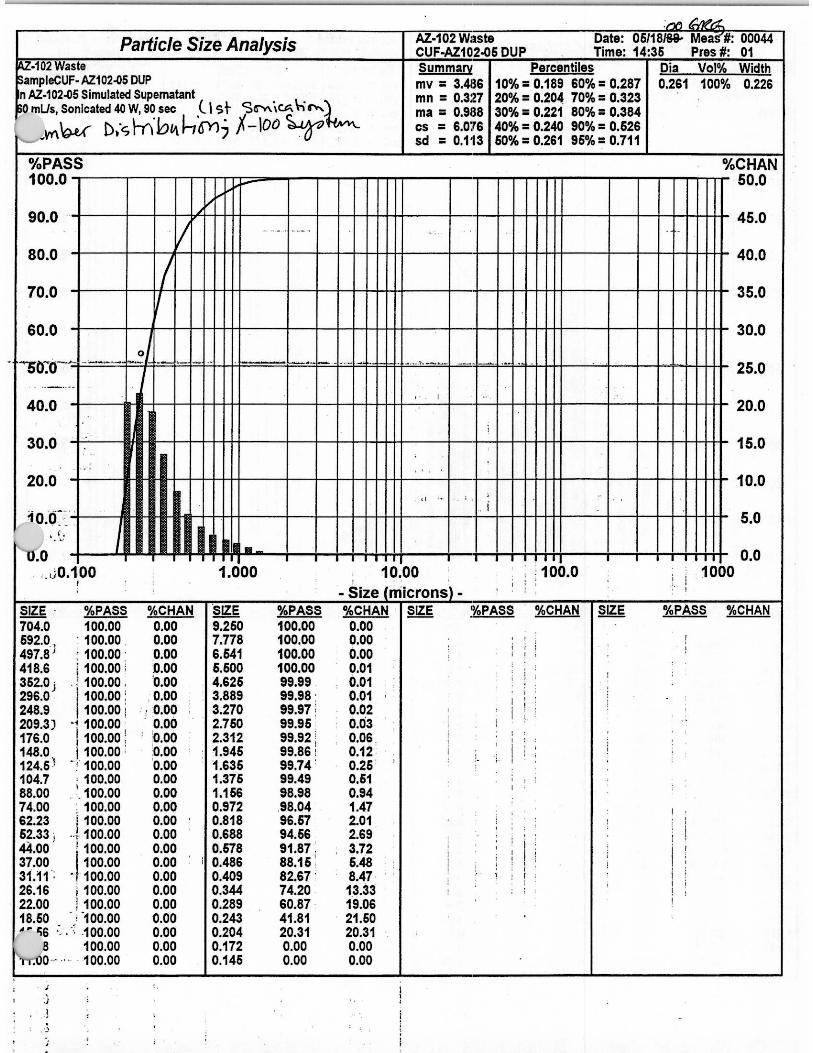
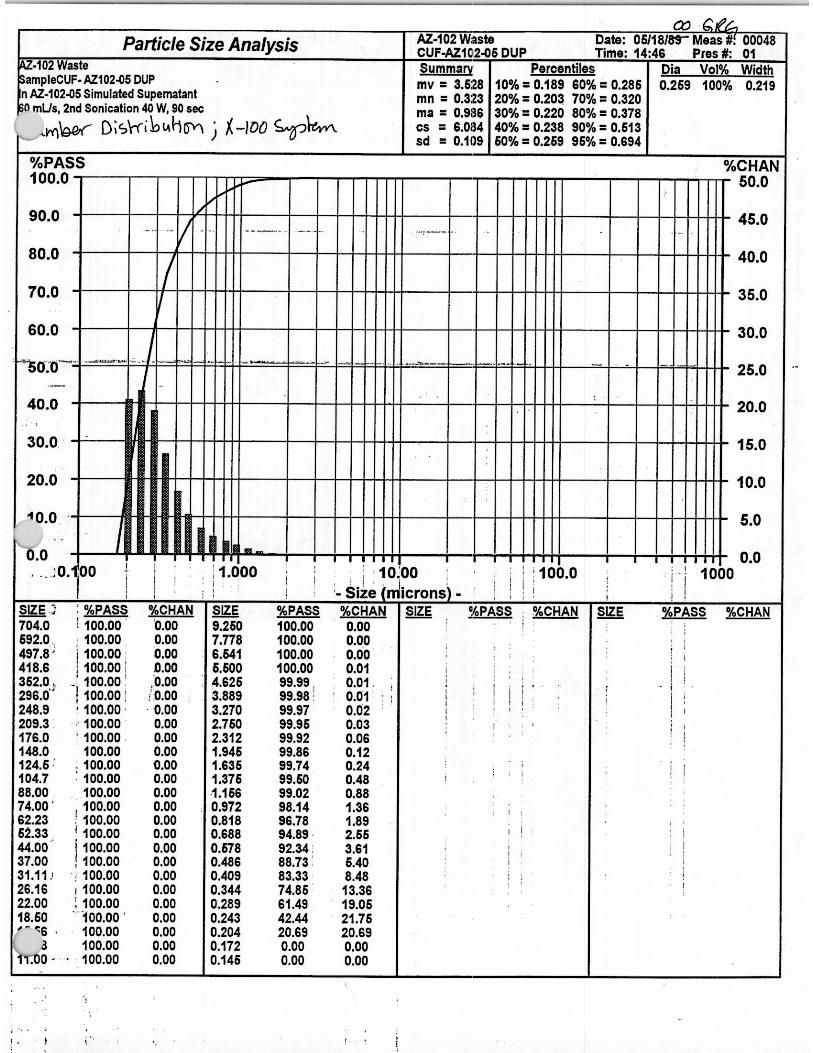
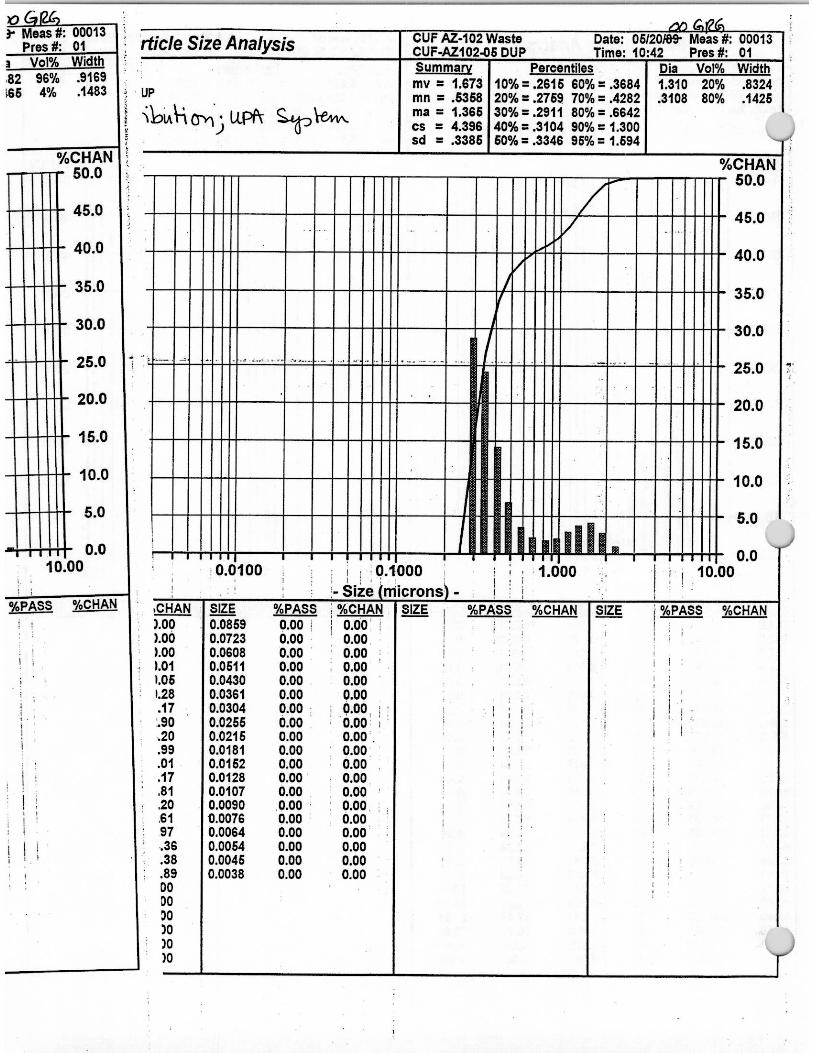
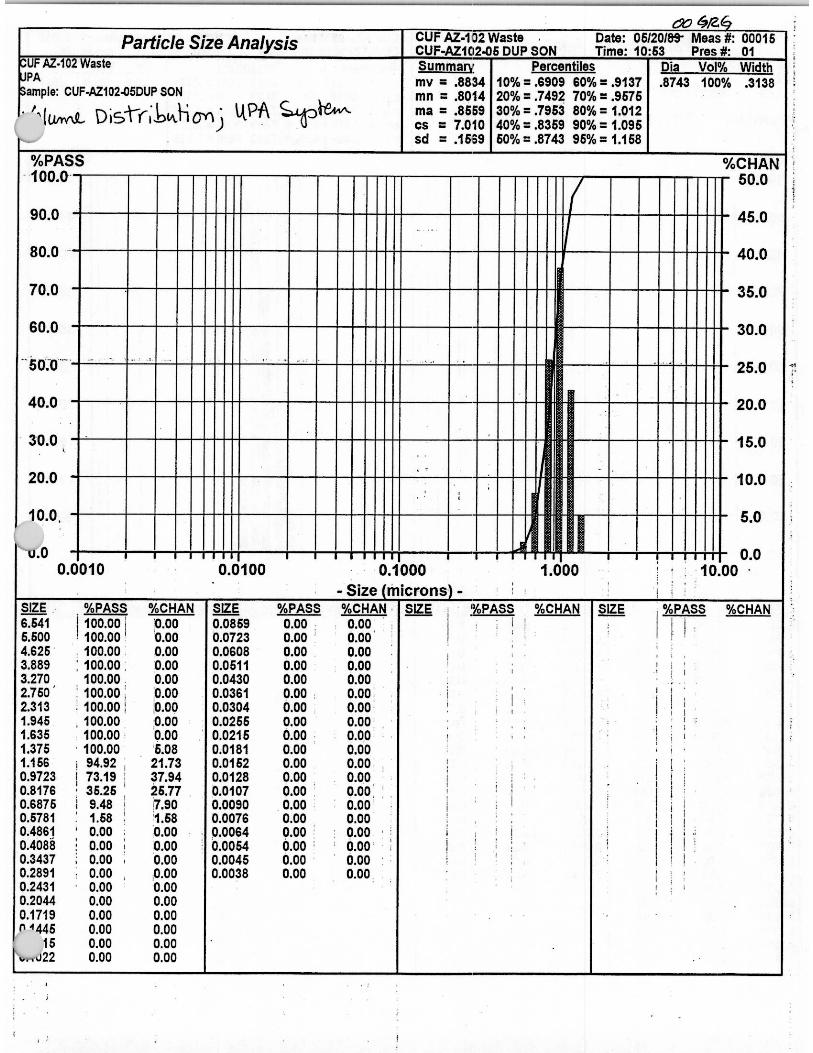
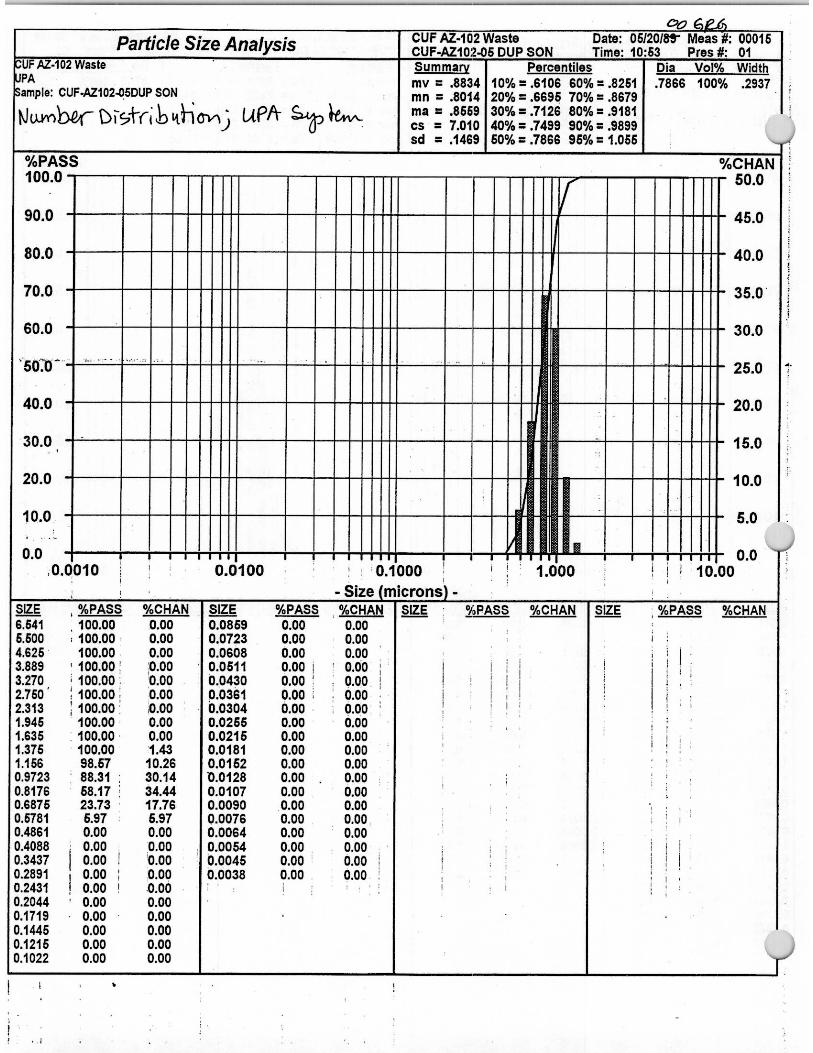
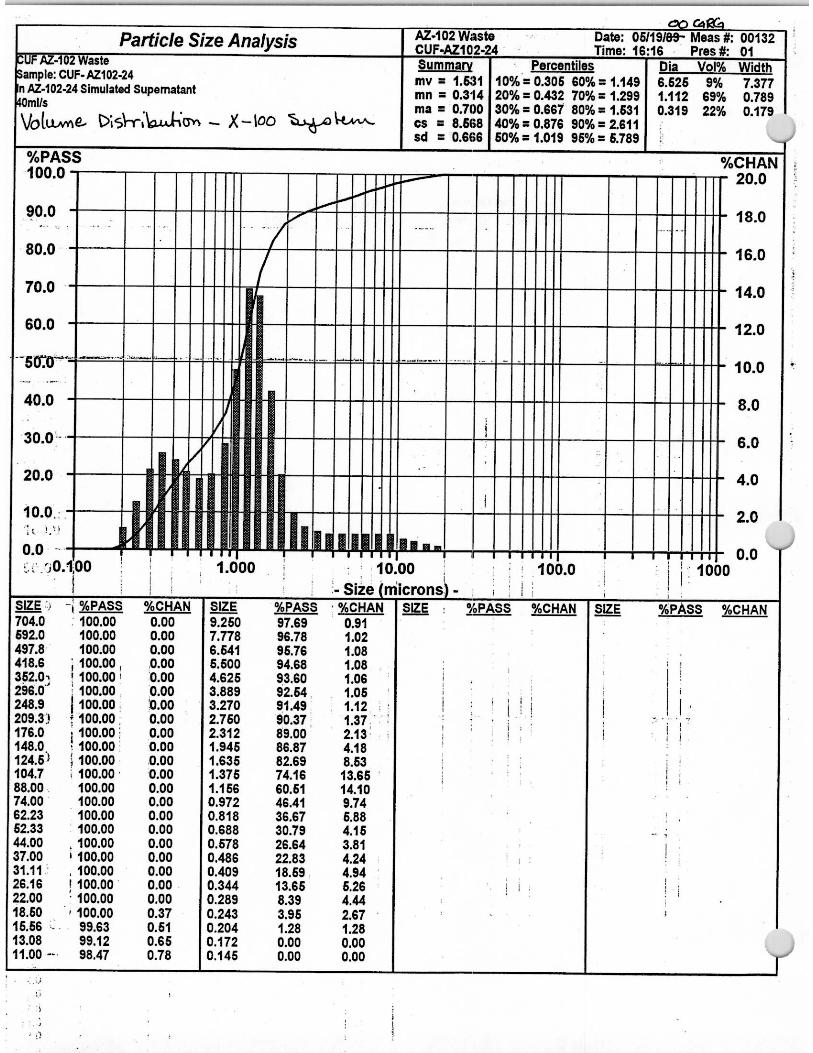
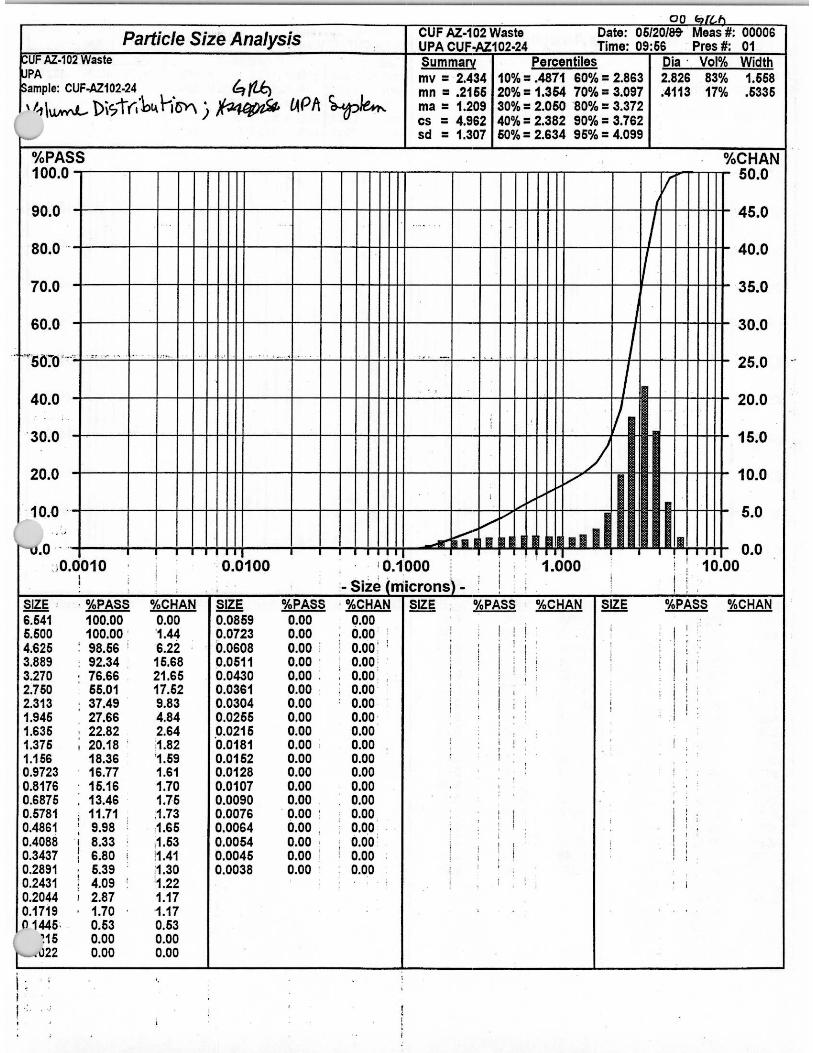
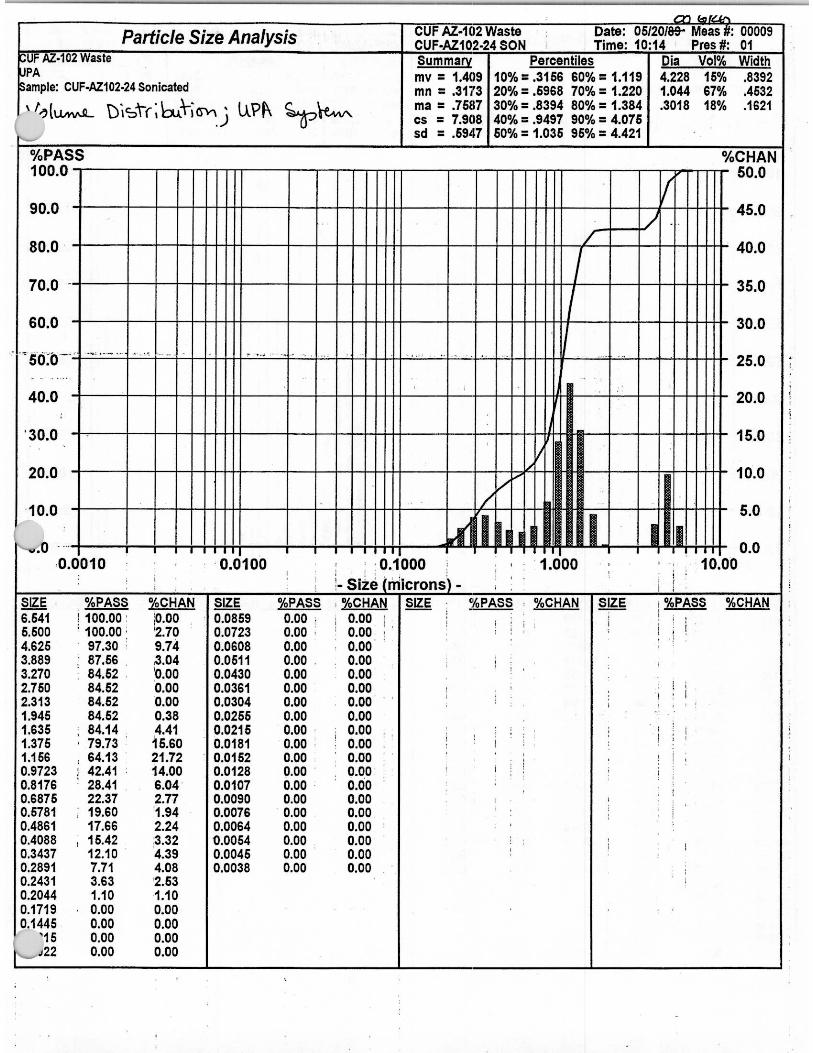
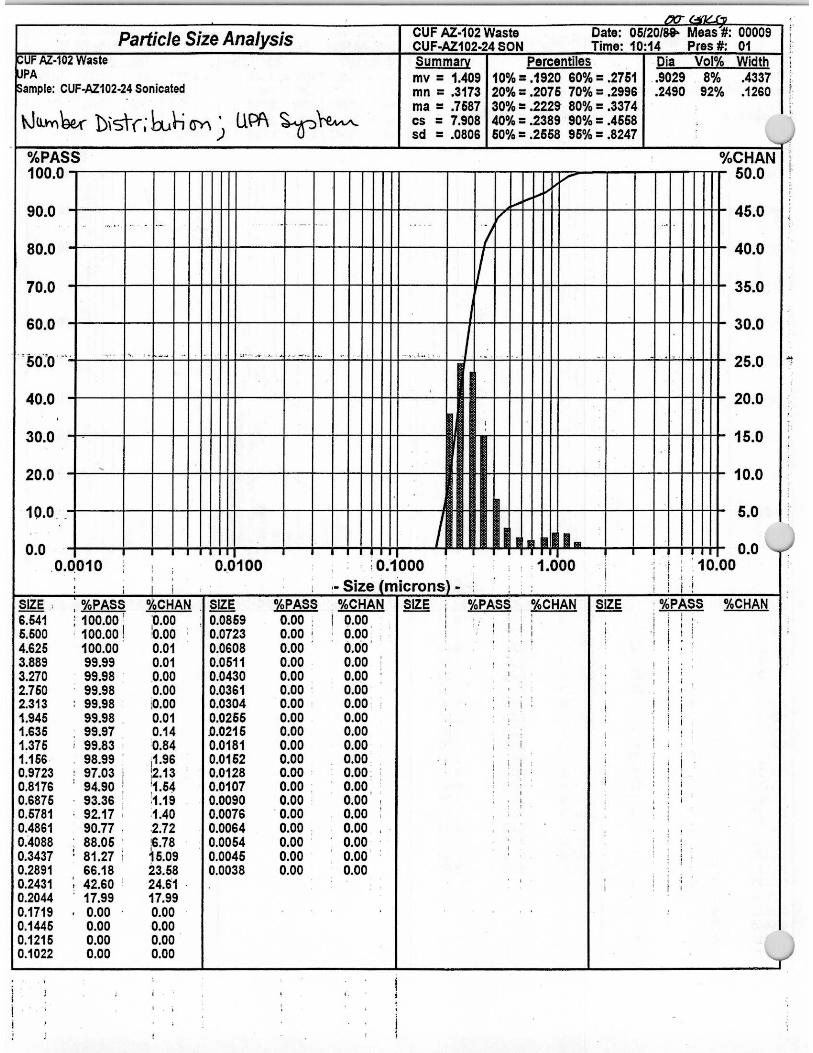
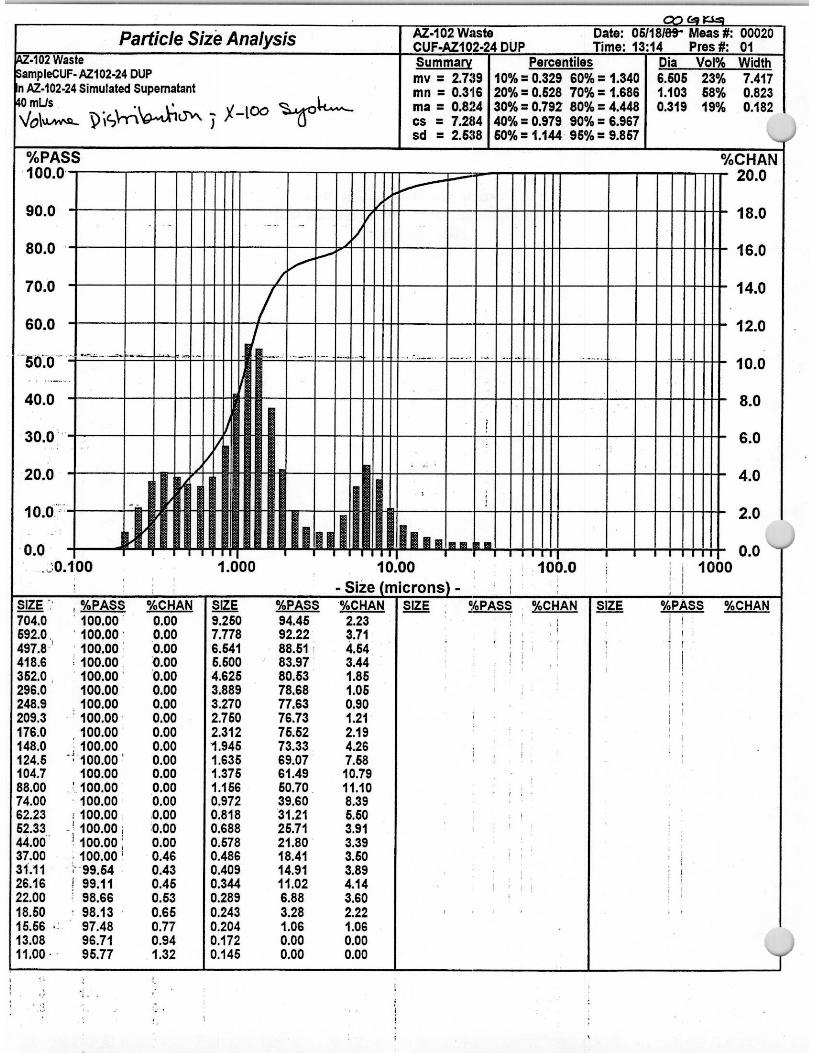
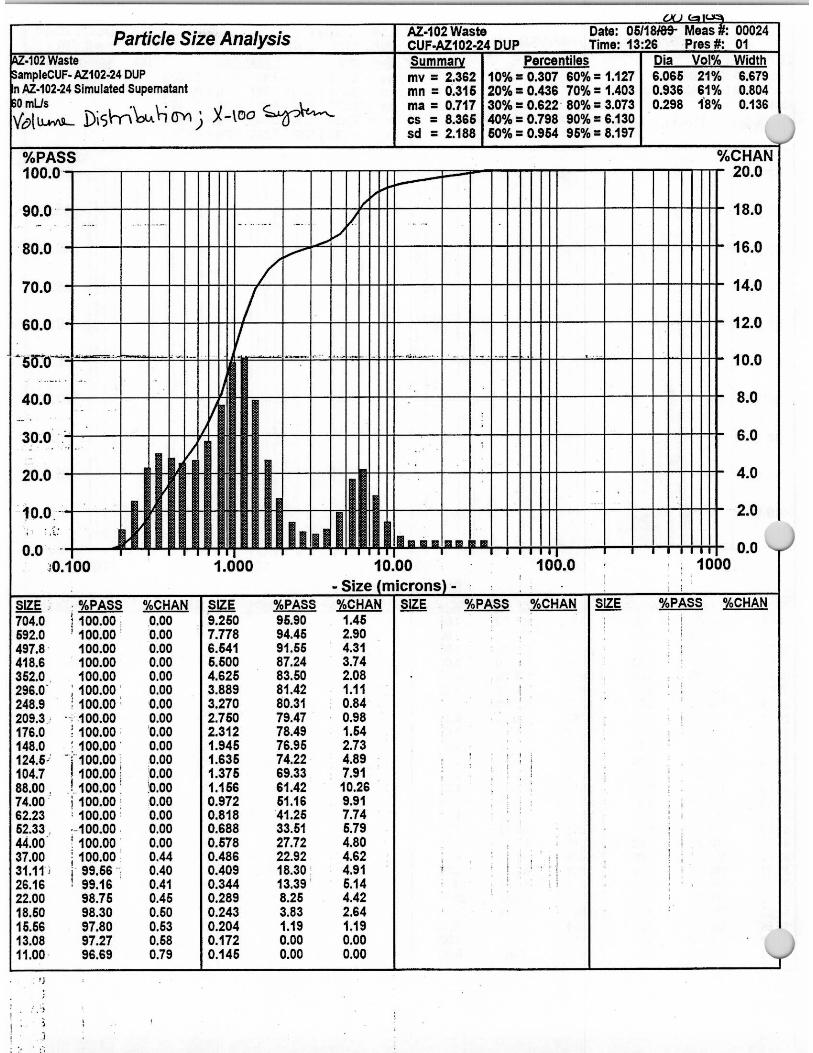
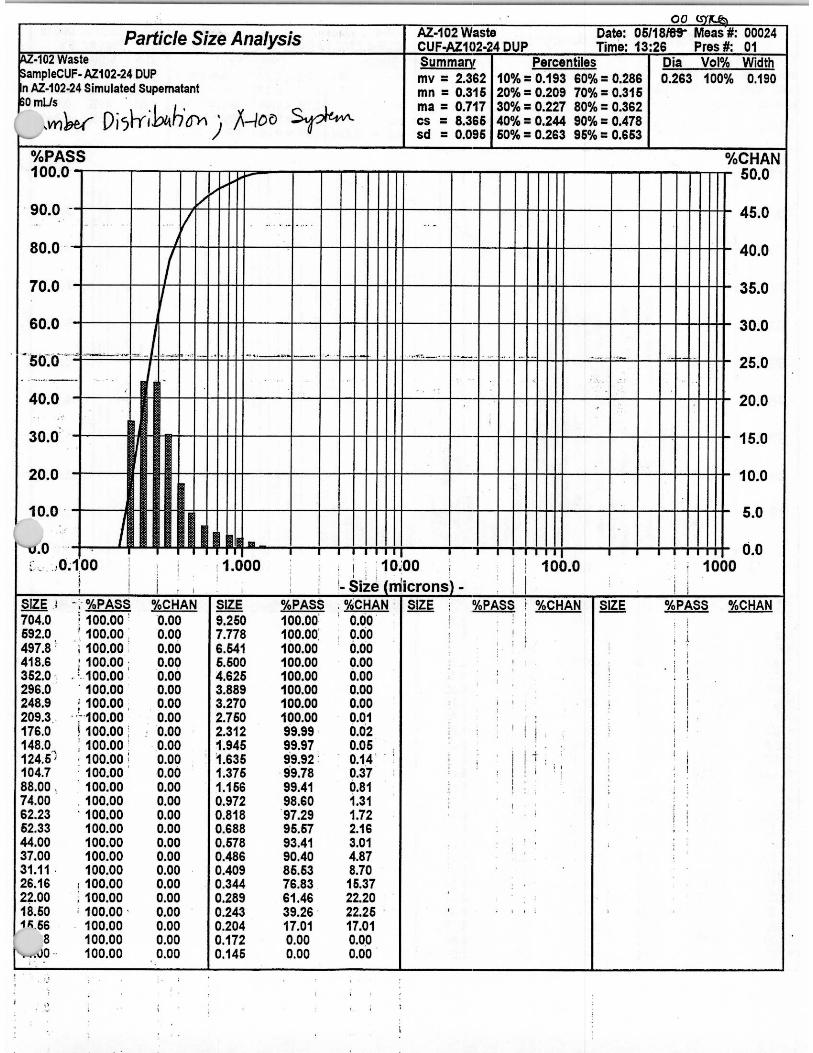
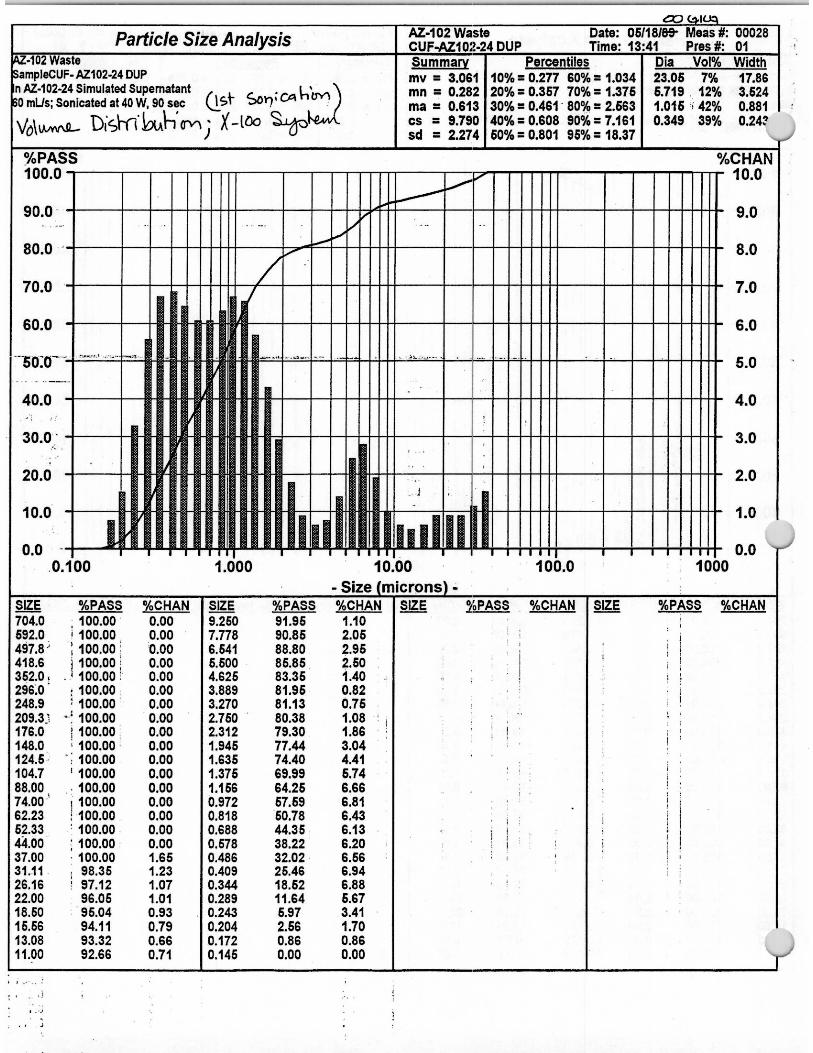
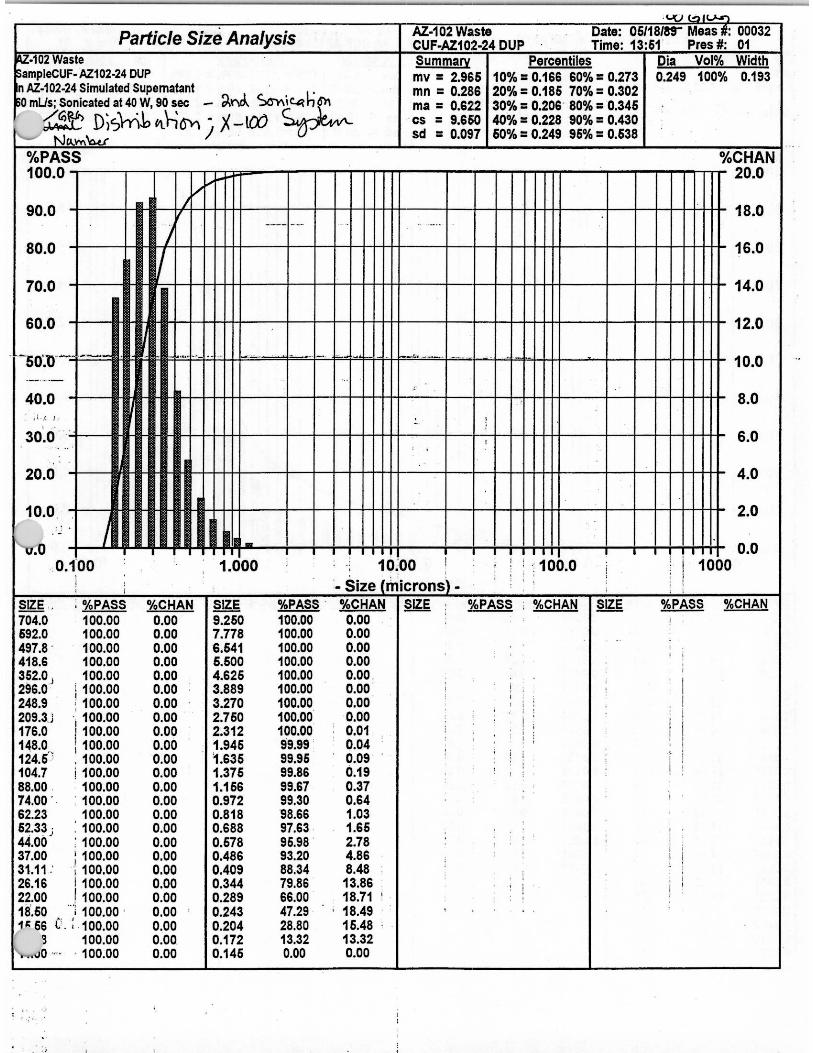
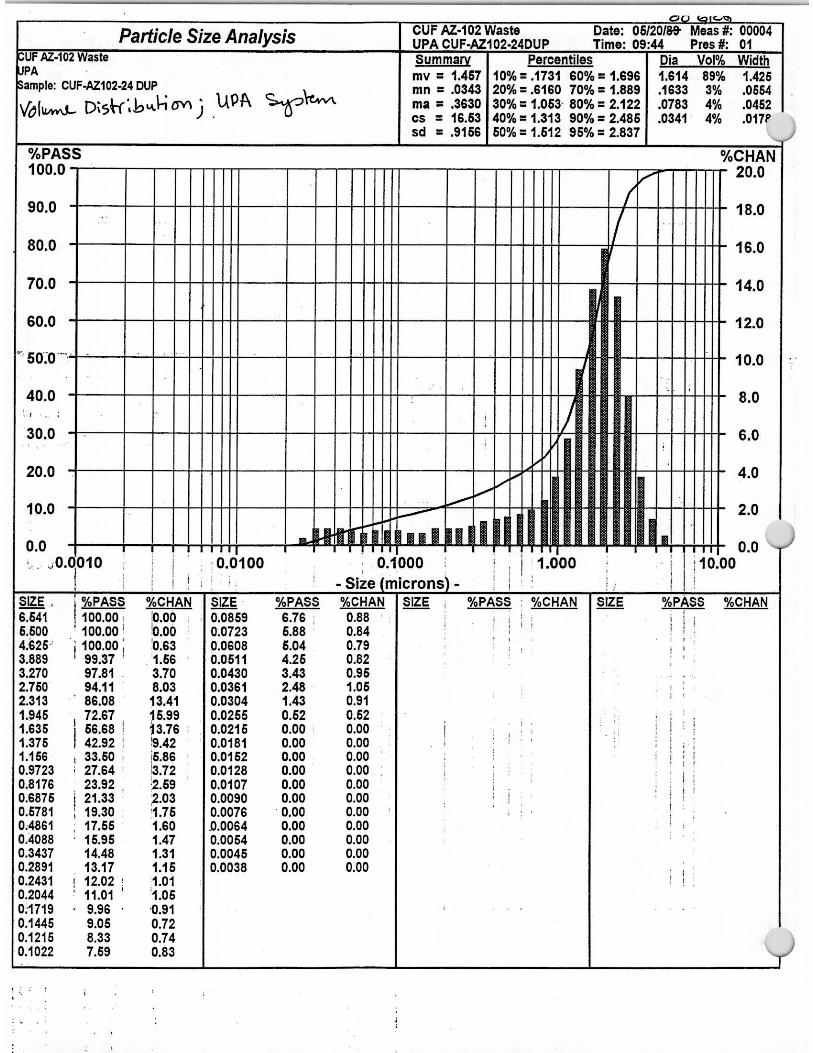
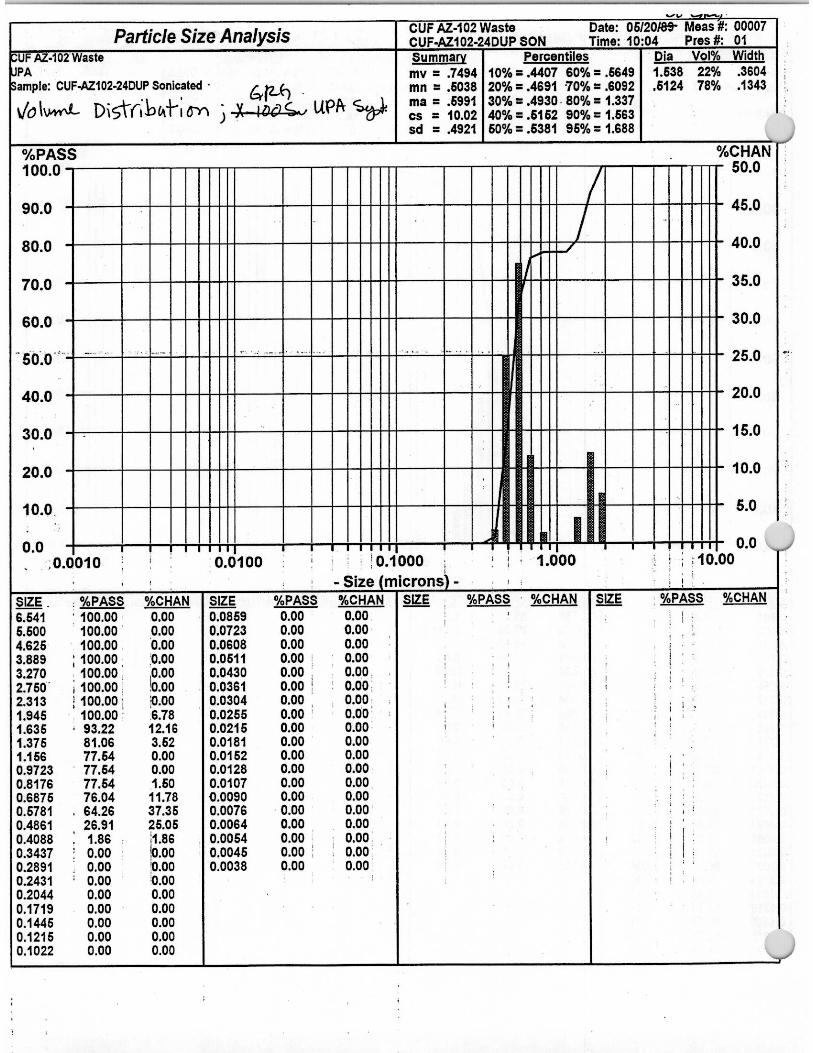
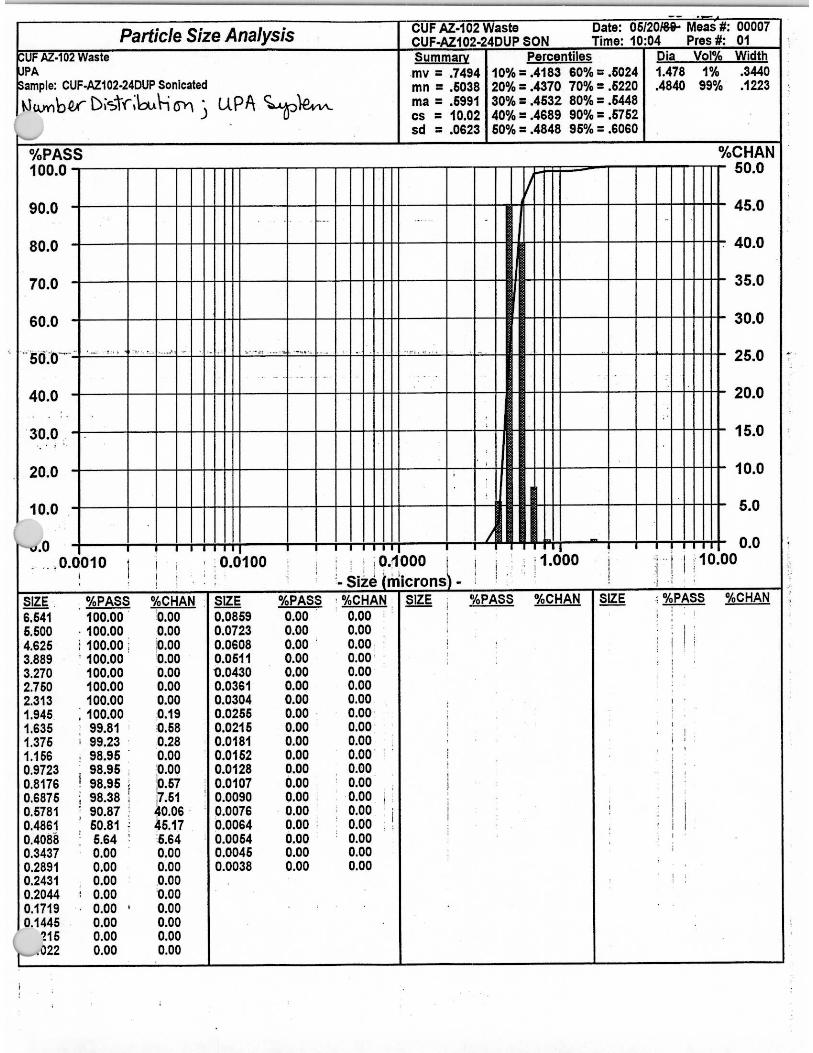
Particle-size distribution was measured on the initial, as-received sludge, on the 13.7 wt% concentrated slurry, and on the final caustic leached slurry. The initial sludge had a significantly larger particle-size distribution than subsequent material. Approximately 50% of the particles (on a volume weighted distribution) had a peak mode of 24 µm as compared to subsequent steps having >60% of the particles with a peak mode of approximately 1 µm. Sonication had a larger effect on the particles of the final caustic leached slurry when compared to the earlier steps. The significant reduction in particle size due to sonication may indicate that the washing and leaching steps weakened the agglomerate strength.
(a) BNFL selected 33 s-1 as the reference point to compare all viscosity measurements.

v
Terms and Abbreviations
AEA alpha energy analysis
BNFL BNFL, Inc; subsidiary of British Nuclear Fuels, Ltd.
CUF cells unit filter
DF decontamination factor
DI deionized water
DOE-RL U.S. Department of Energy-Richland Operations
GEA gamma energy analysis
HLRF High Level Radiochemistry Facility
HLW high-level waste
IC ion chromatography
ICP-AES inductively coupled plasma-atomic emission spectroscopy
ICP-MS inductively coupled plasma-mass spectrometry
LRB laboratory record book
MSE mean squared error
NIST National Institute of Standards and Technology
PID proportional-integral-derivative controller
PMG precious metals group
PSD particle size distribution
RPL Radiochemical Processing Laboratory
RPP-WTP River Protection Project Waste Treatment Plant
TMP transmembrane pressure
TIC total inorganic carbon
TOC total organic carbon
TRU transuranic
UPA Ultrafine Particle Analyzer (Microtac)
vi
Units
°C degrees Celsiusg gram
g/mL gram per milliliterµg/g - µg/mL microgram per gram/microgram per milliliter
µCi/g - µCi/mL microcurie per gram/microcurie per milliliter mL milliliter
nCi/g nanocurie per grampCi/g picocurie per gramVol% volume percentWt% weight percent
M molarity
vii
Contents
1.0 Introduction ................................................................................................................................ 1.1
2.0 Test Conditions ........................................................................................................................... 2.1
2.1 Test Material Preparation ........................................................................................................ 2.1
2.1.1 Observations................................................................................................................ 2.3
2.2 Overview of Testing ............................................................................................................... 2.4
2.3 Testing Apparatus ................................................................................................................... 2.5
2.4 CUF System Verification Testing............................................................................................ 2.8
2.5 Experimental Approach .......................................................................................................... 2.8
2.6 Sample Analyses................................................................................................................... 2.13
3.0 Ultrafiltration and Washing Results............................................................................................. 3.1
3.1 Crossflow Filtration Results .................................................................................................... 3.1
3.1.1 Low Solids Loading Matrix Results ............................................................................. 3.1
3.1.2 De-Watering from Low to High Solids Loading........................................................... 3.3
3.1.3 High-Solids-Loading Matrix Results............................................................................ 3.4
3.1.4 Filtration Results During the Washing and Caustic Leaching Steps .............................. 3.7
3.1.5 Statistical Analysis ...................................................................................................... 3.9
3.2 Sludge-Washing and Caustic-Leaching Results ..................................................................... 3.11
4.0 Physical-Properties and Rheological-Properties Testing............................................................... 4.1
4.1 Physical-Properties Analysis ................................................................................................... 4.1
4.2 Rheological and Flow Properties............................................................................................. 4.4
5.0 Particle Size Distribution............................................................................................................. 5.1
5.1 Experimental .......................................................................................................................... 5.1
5.2 Particle Size Distribution Results ............................................................................................ 5.2
6.0 Conclusions ................................................................................................................................ 6.1
7.0 References .................................................................................................................................. 7.1
Appendix A: CUF Filtration, Washing and Leaching Test Instructions and Laboratory Record Book ... A.1
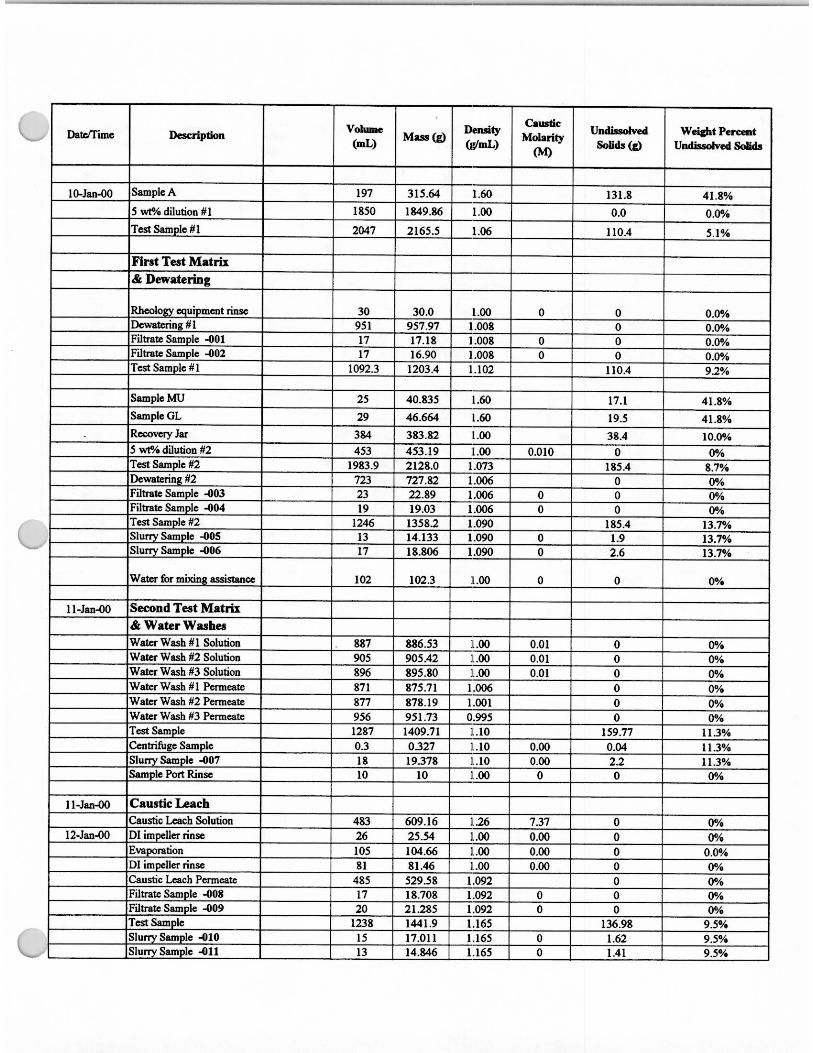
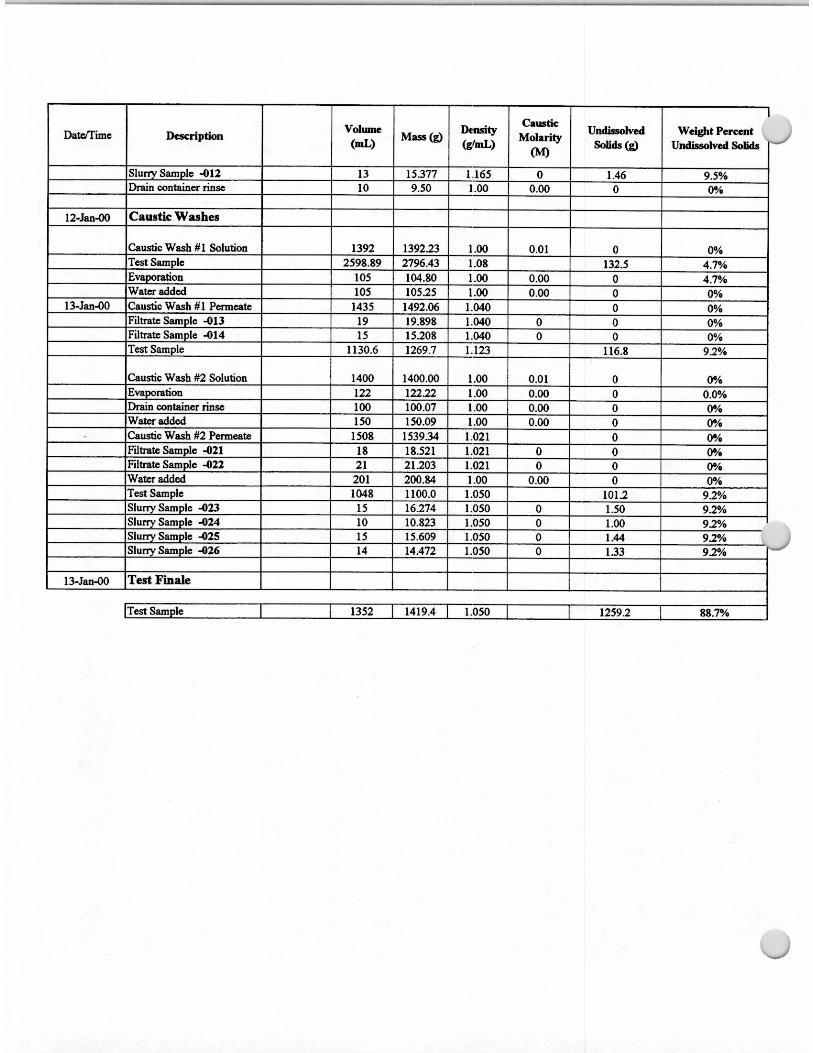
Appendix B: Testing Mass Balance..................................................................................................... B.1
Appendix C: Analytical Results .......................................................................................................... C.1
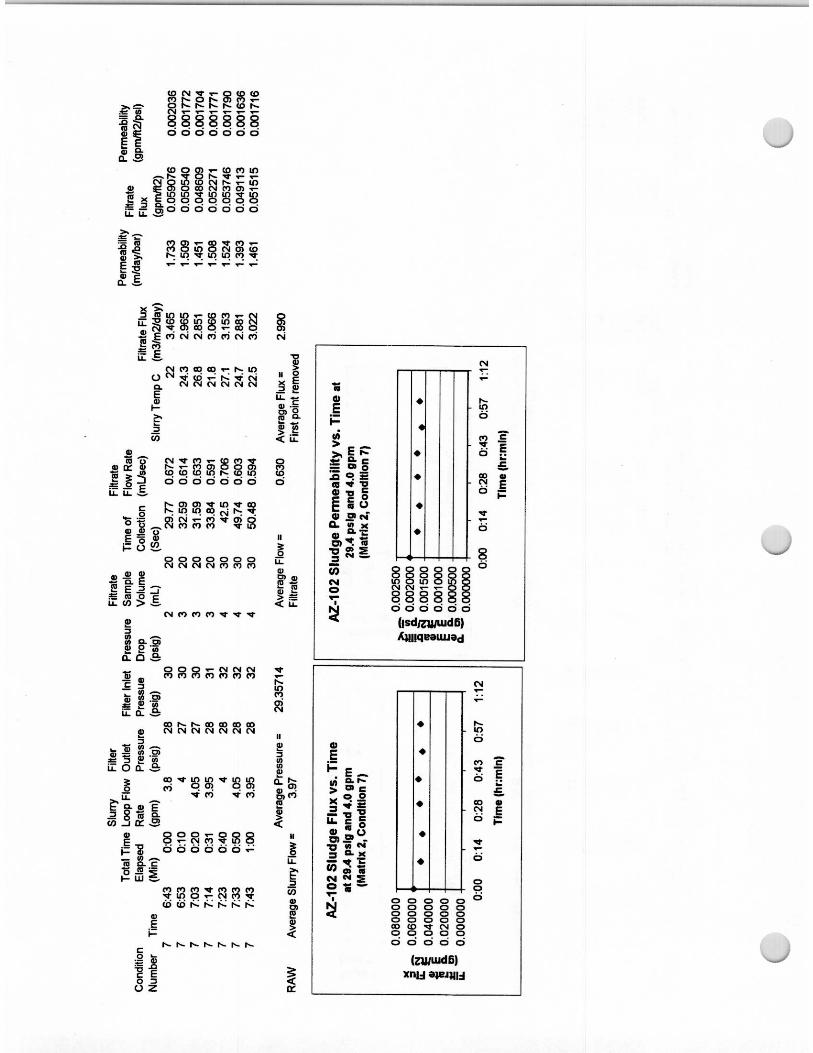
Appendix D: Crossflow Filtration Raw Data ....................................................................................... D.1
Appendix E: Physical Properties Test Instruction .................................................................................E.1
Appendix F: Rheograms for AZ-102 and Standards .............................................................................F.1
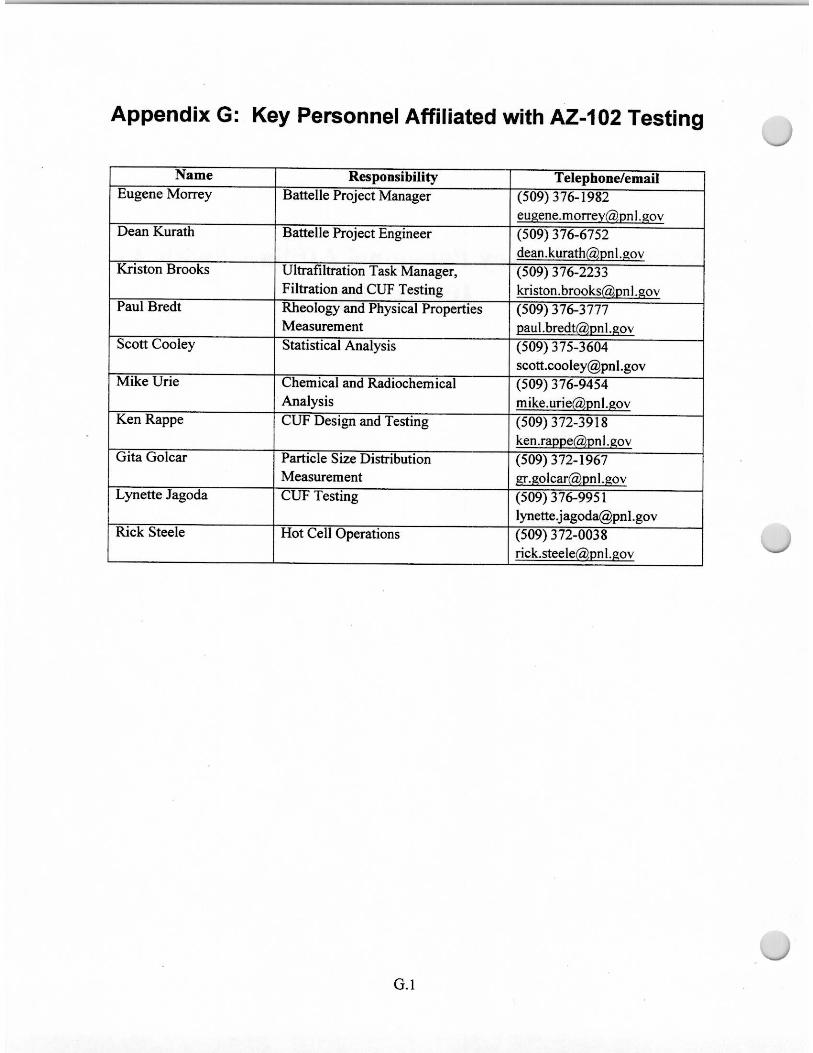
Appendix G: Key Personnel Affiliated with AZ-102 Testing............................................................... G.1
Appendix H: Particle Size Distribution Simulant Recipes and Experimental Raw Data........................ H.1
viii
Figures
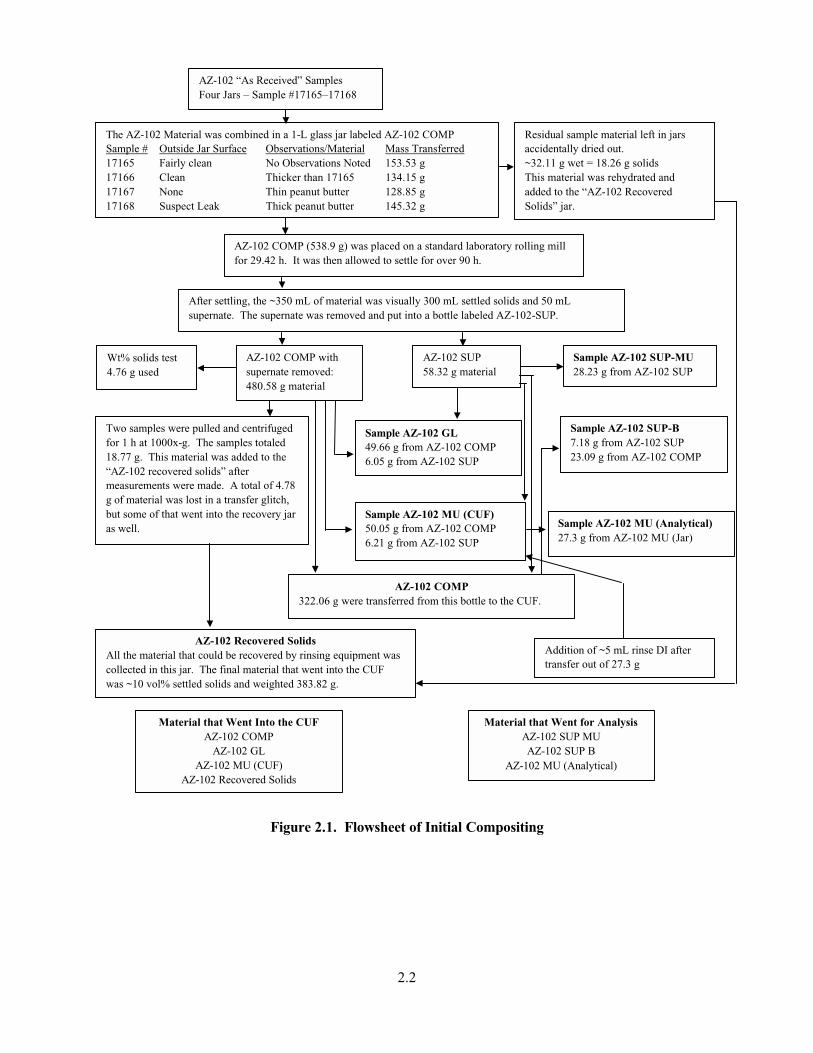
Figure 2.1. Flowsheet of Initial Compositing........................................................................................ 2.2
Figure 2.2. Crossflow Filtration Process Flow Diagram........................................................................ 2.7
Figure 2.3. AZ-102 Crossflow Filtration Test Experimental Steps ........................................................ 2.9
Figure 3.1. Filtrate Flux as a Function of Time for the Low Solids Matrix ............................................ 3.2
Figure 3.2. Initial, Average, and Final Filtrate Flux for Each Condition in the Low Solids Matrix ........ 3.3
Figure 3.3. Filtrate Flux as a Function of Time for the High Solids Matrix ........................................... 3.5
Figure 3.4. Filtrate Flux as a Function of Axial Velocity for the High Solids Matrix at ~30 psid TMP..3.6
Figure 3.5. Initial, Average, and Final Filtrate Flux for Each Condition in the High-Solids Matrix........ 3.7
Figure 3.6. Filtrate Flux Comparison between High and Low Solids Loading Matrices ........................ 3.8
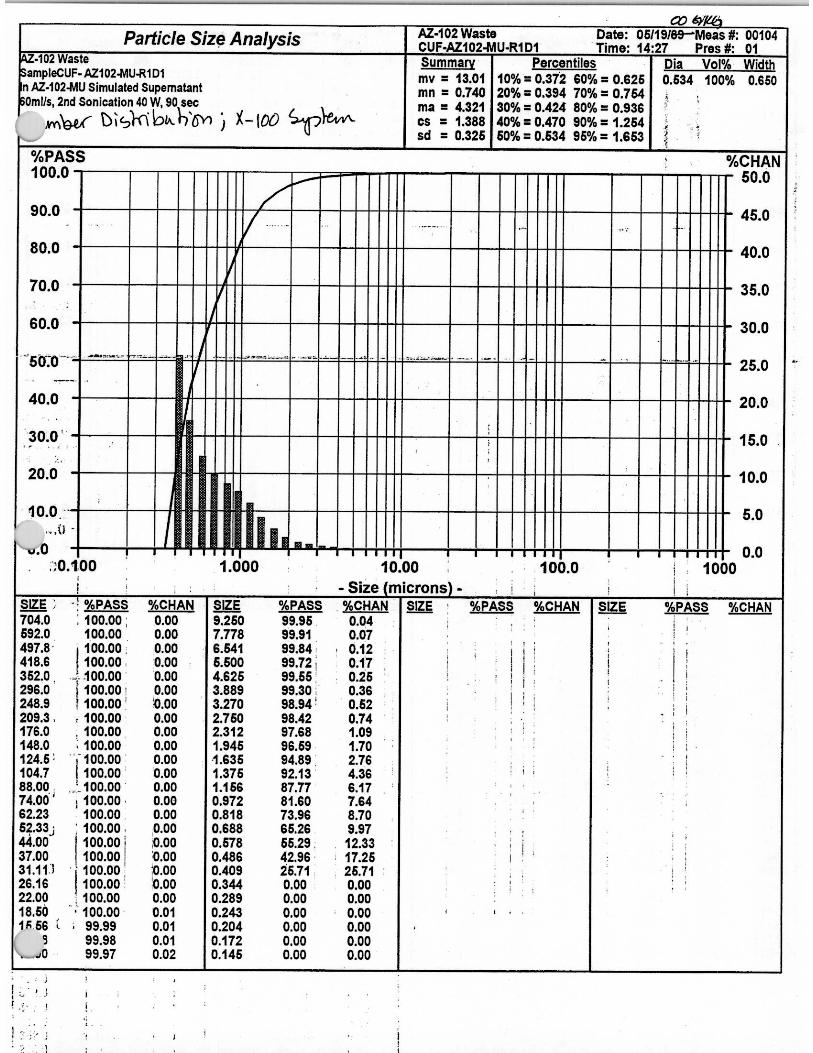
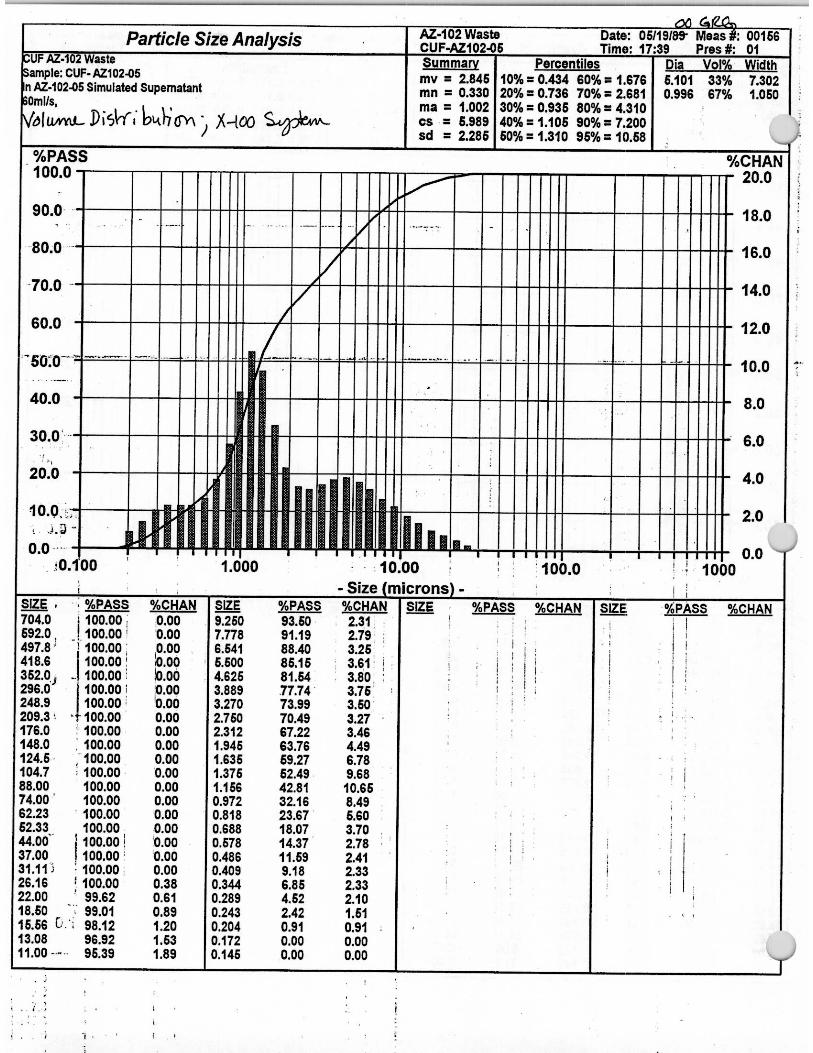
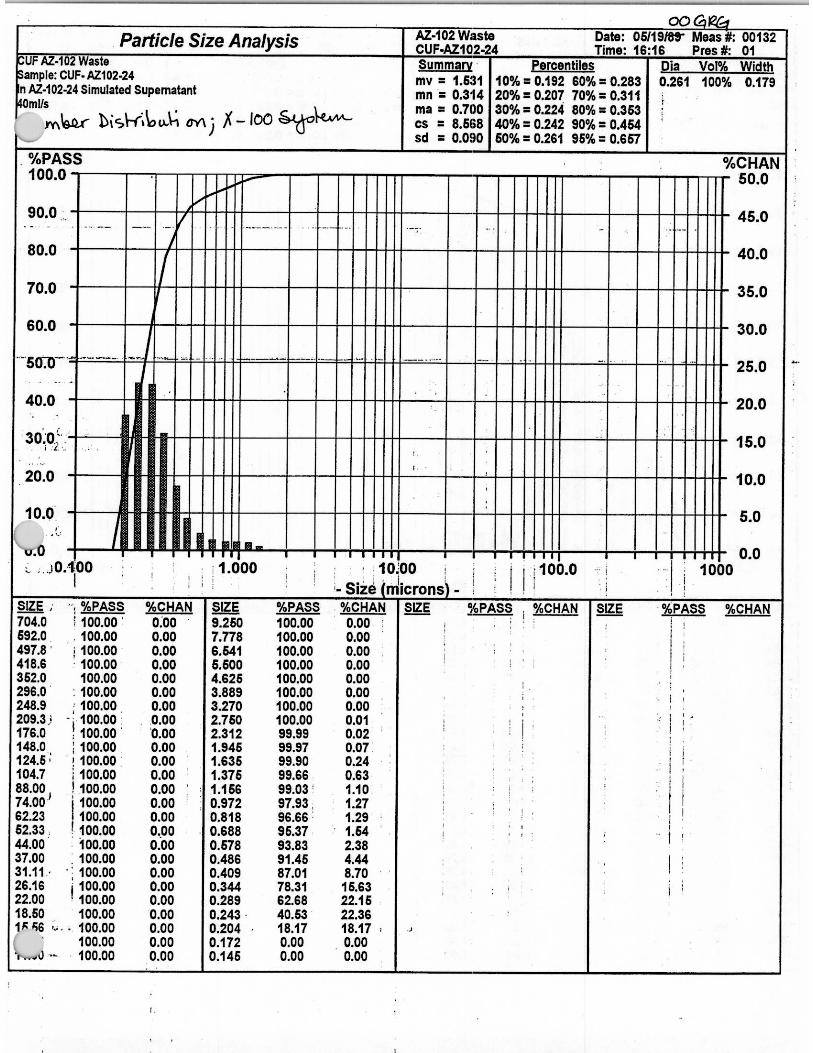
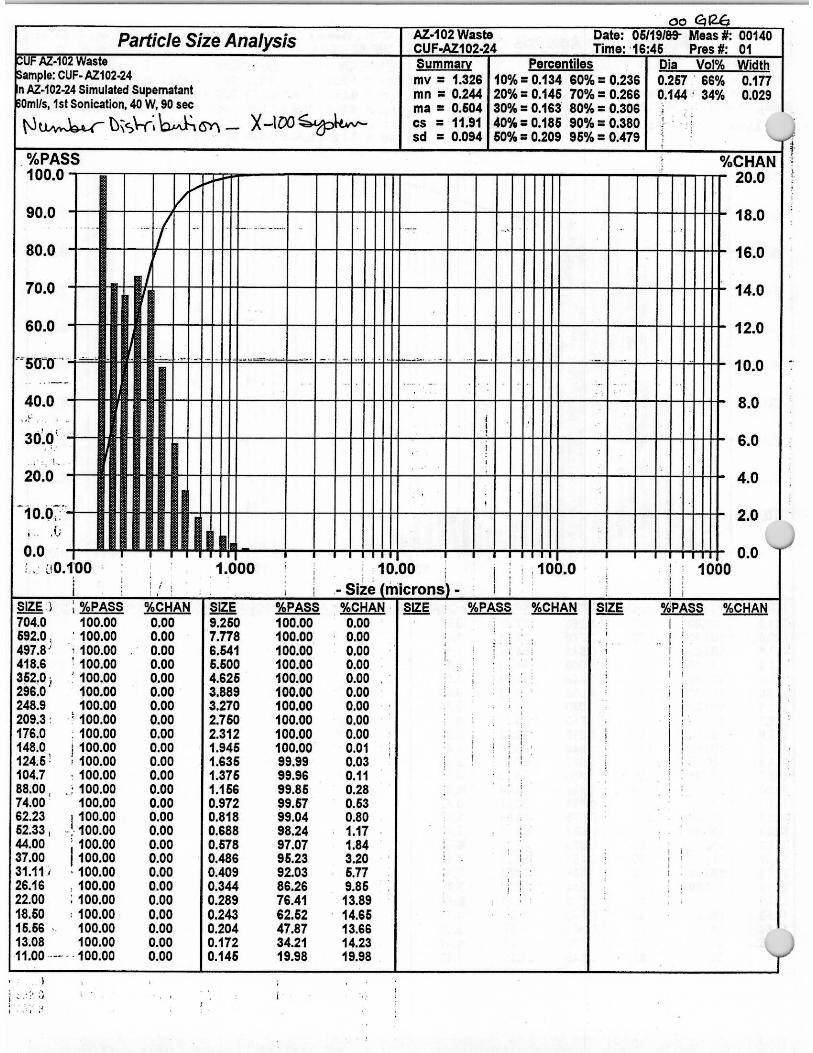
Figure 5.1. Cumulative Under-Size Percentage Distribution for AZ-102 Slurries Using the Microtrac X-100 ................................................................................................................ 5.3
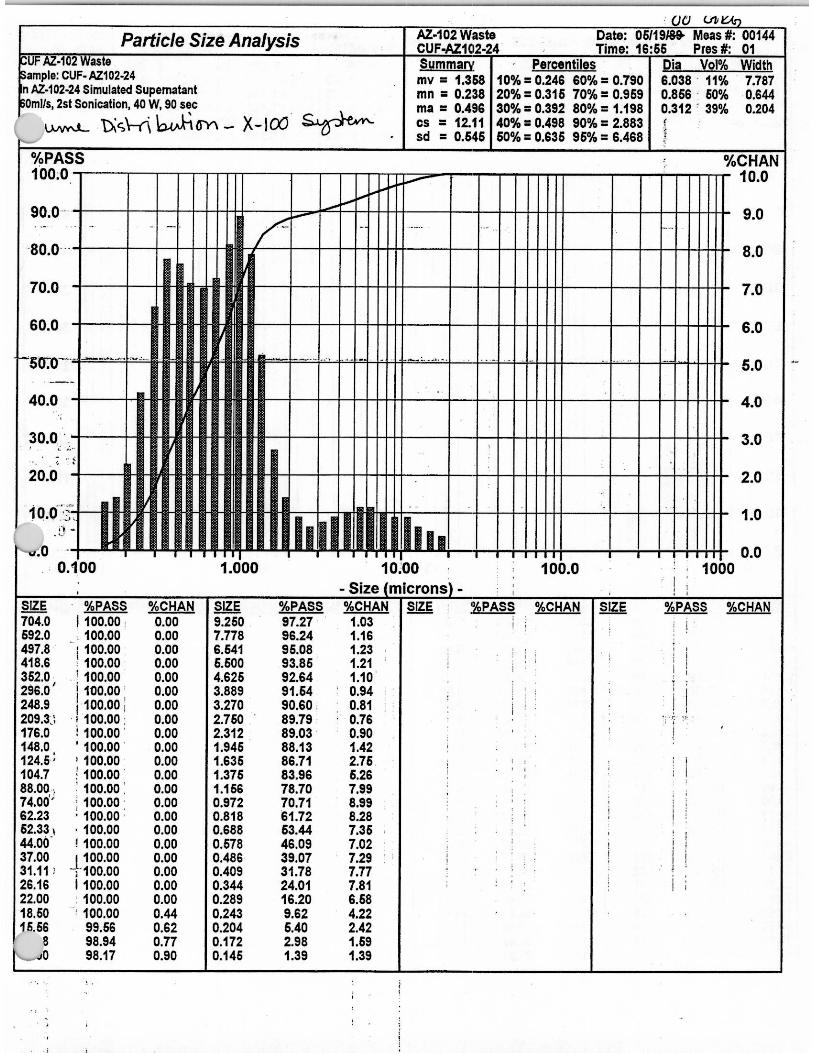
Figure 5.2. Volume-Weighted Distribution for AZ-102 Slurries Using the Microtrac X-100................. 5.4
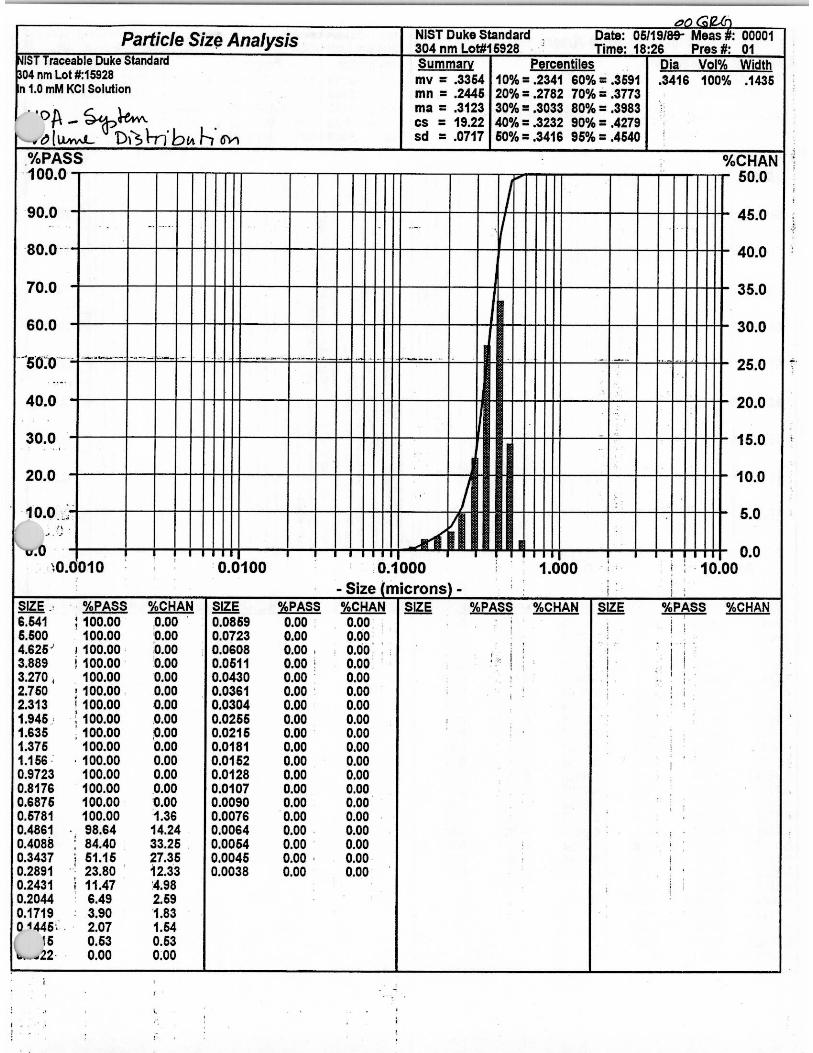
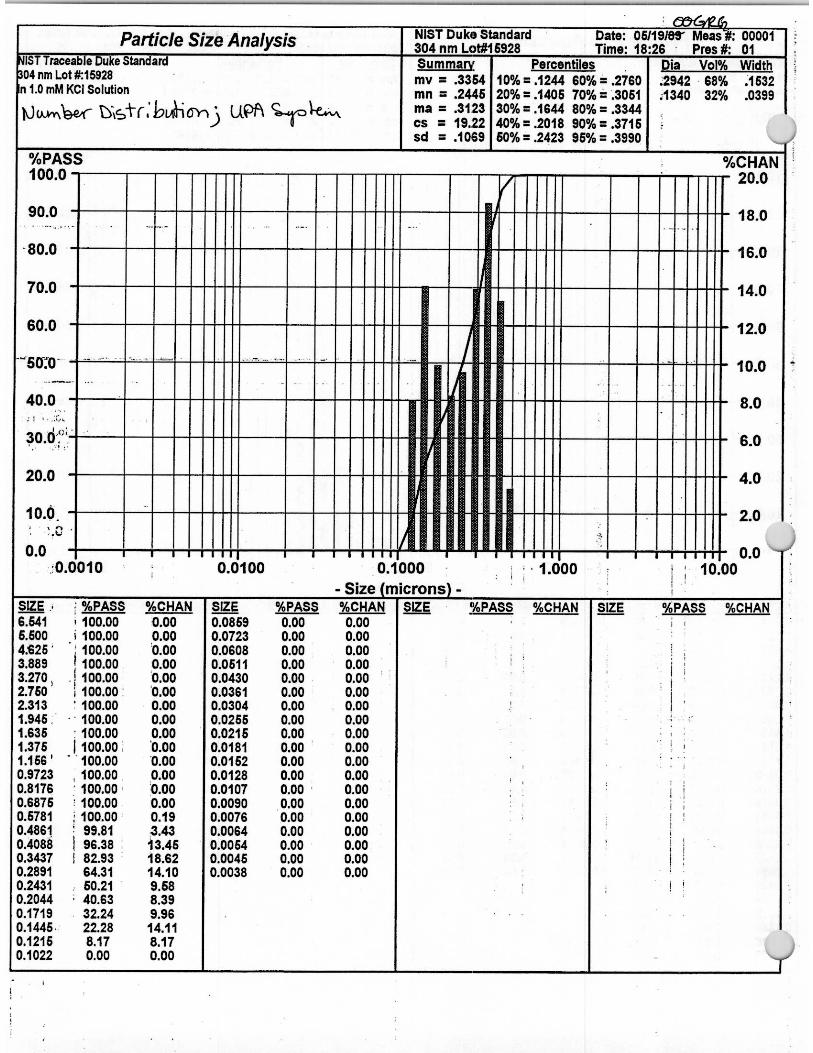
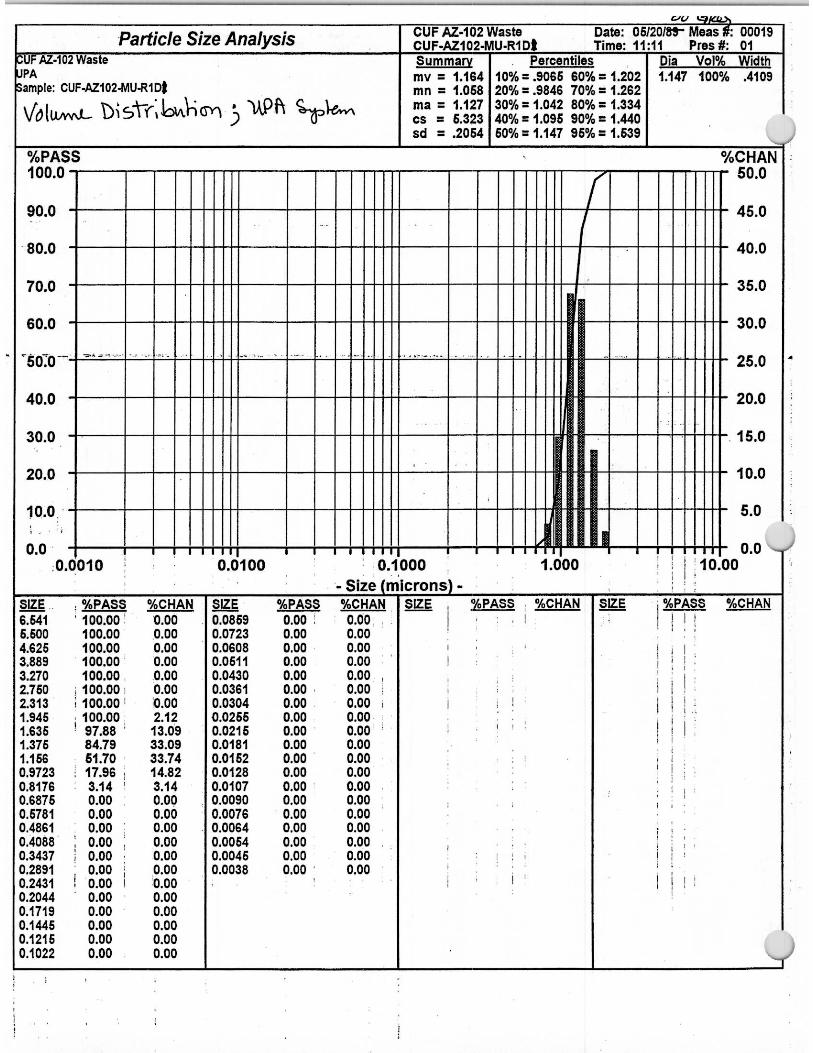
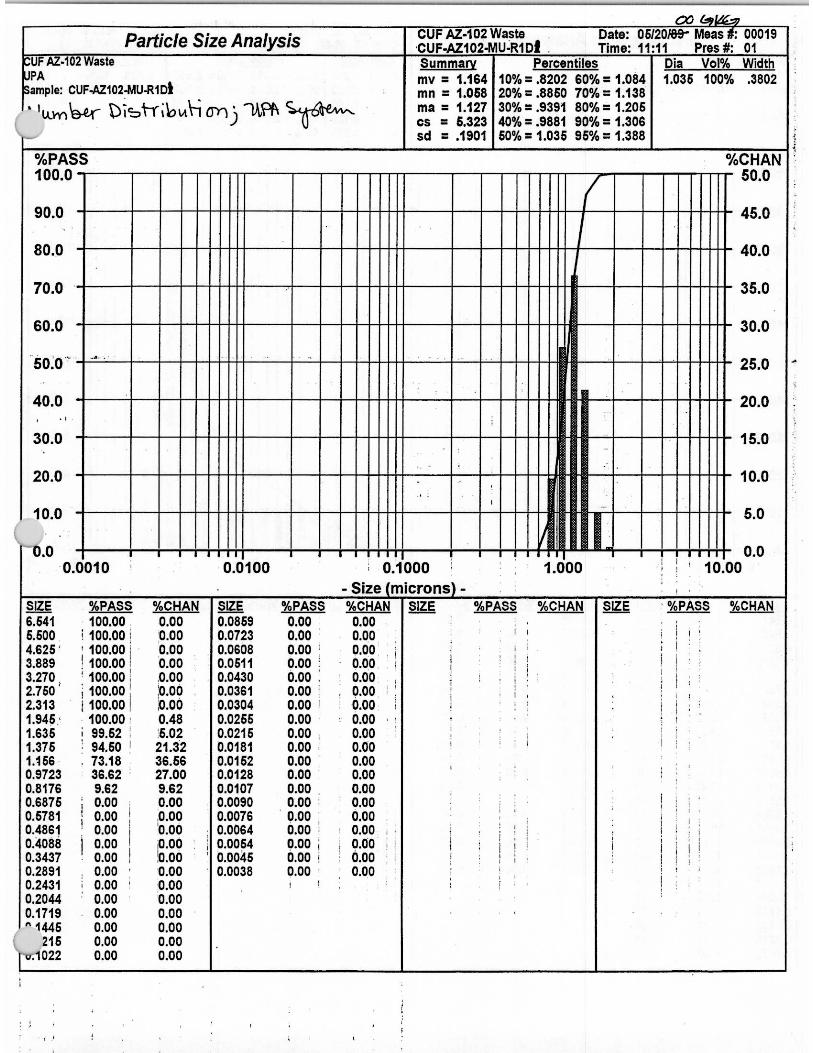
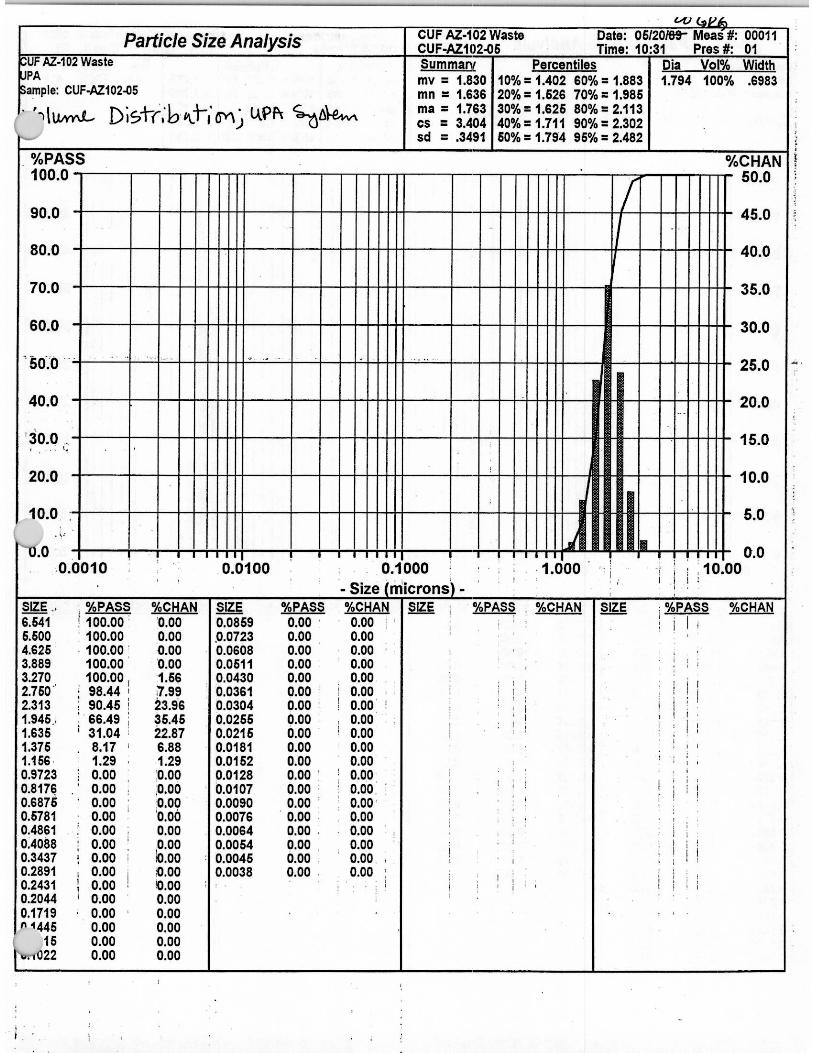
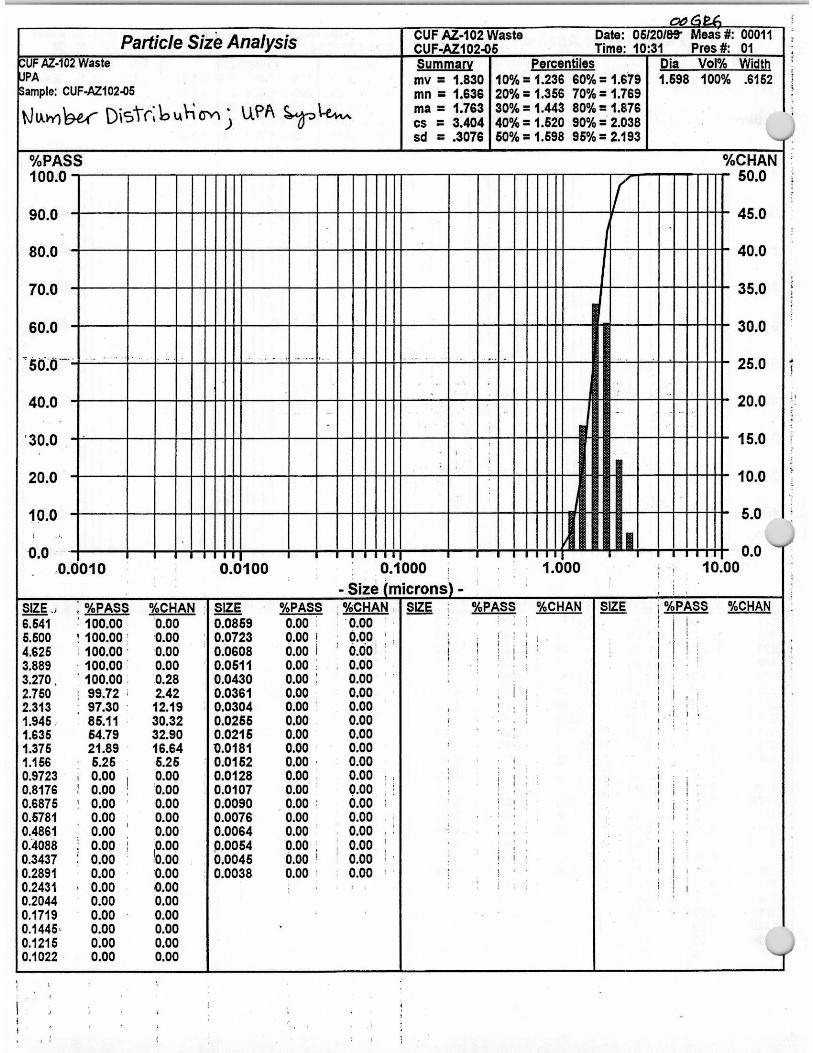
Figure 5.3. Cumulative Under-Size Percentage Distribution for AZ-102 Slurries Using the Microtrac UPA .................................................................................................................. 5.6
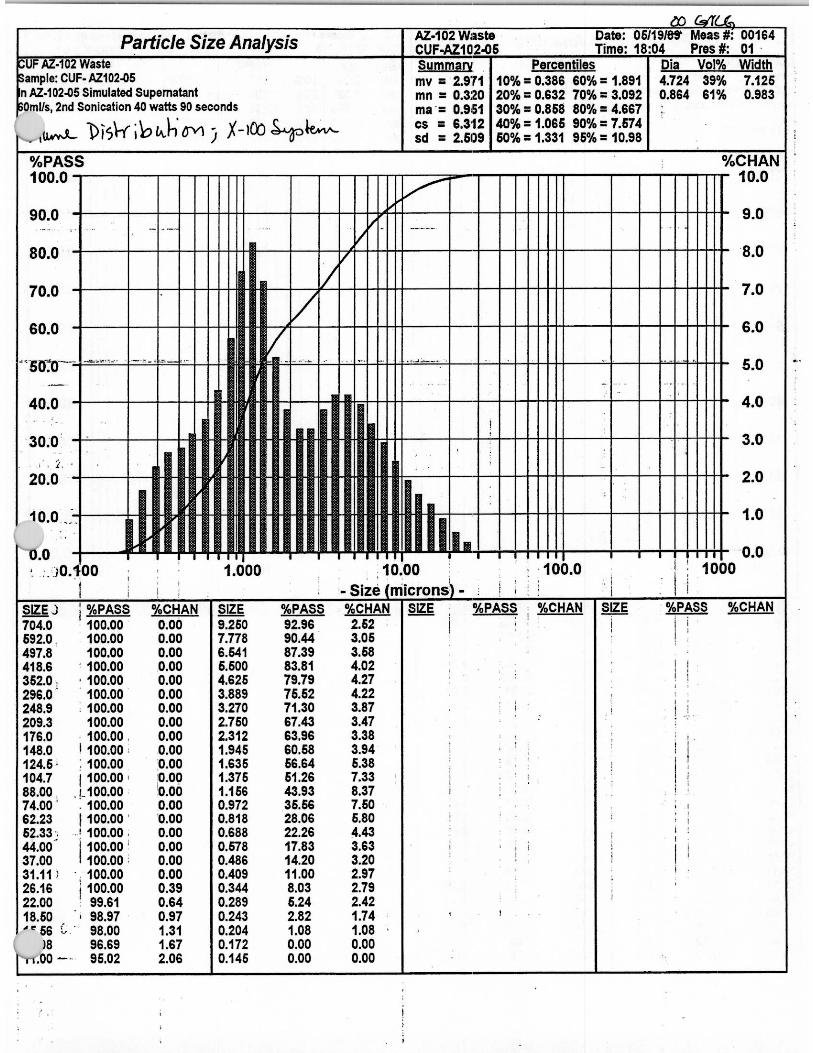
Figure 5.4. Histogram of the Volume- Weighted AZ-102 Slurries Using the Microtrac X-100 at 40 and 60 mL/s Circulation Flow Rate .................................................................................... 5.9
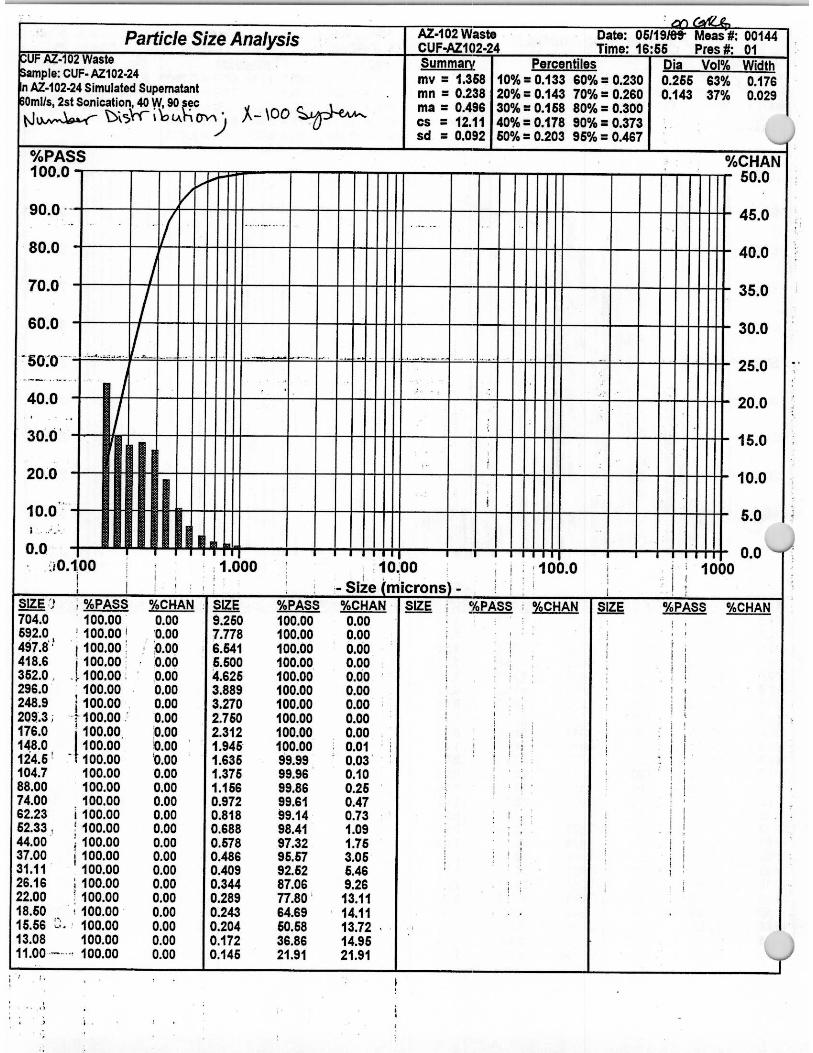
Figure 5.5. Histogram of the Number-Weighted AZ-102 Slurries Using the Microtrac X-100 at 40 and 60 mL/s Circulation Flow Rate .................................................................................. 5.10
Figure 5.6. Histogram of the Volume Weighted AZ-102 Slurries before and after Sonication Using the Microtrac X-100............................................................................................... 5.11
Figure 5.7. Histogram of the Number Weighted AZ-102 Slurries before and after Sonication Using the Microtrac X-100............................................................................................... 5.12
ix
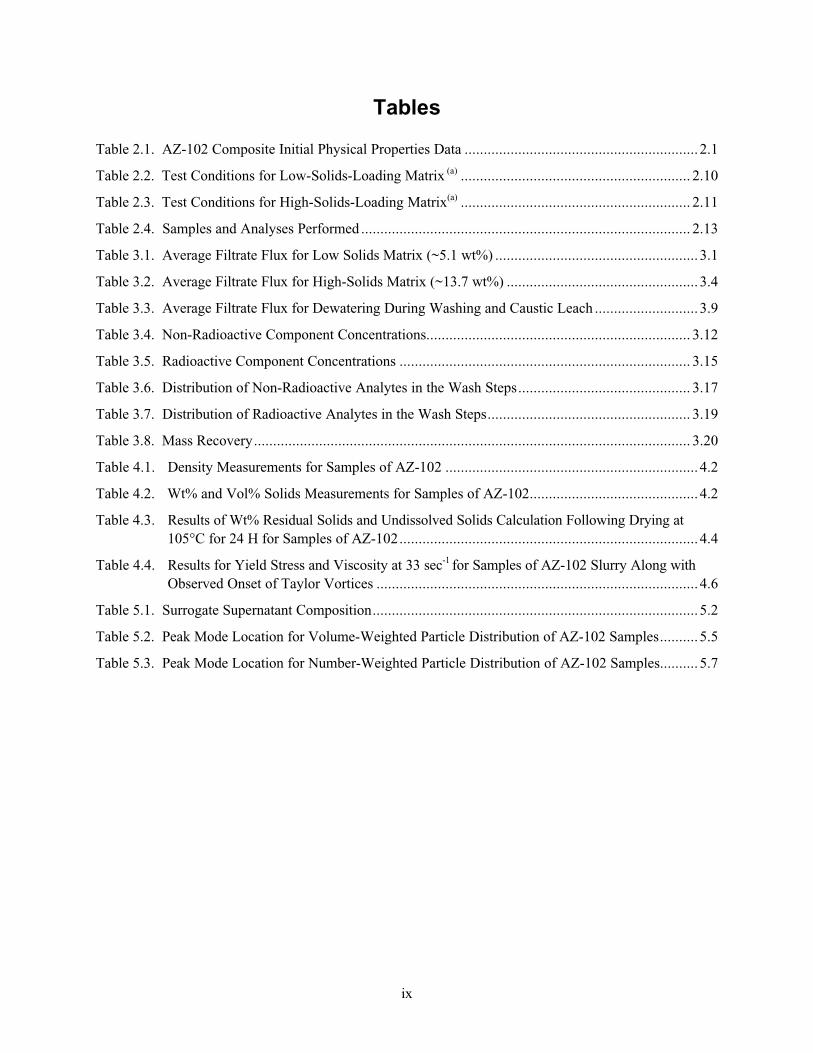
Tables
Table 2.1. AZ-102 Composite Initial Physical Properties Data ............................................................. 2.1
Table 2.2. Test Conditions for Low-Solids-Loading Matrix (a) ............................................................ 2.10
Table 2.3. Test Conditions for High-Solids-Loading Matrix(a) ............................................................ 2.11
Table 2.4. Samples and Analyses Performed ...................................................................................... 2.13
Table 3.1. Average Filtrate Flux for Low Solids Matrix (~5.1 wt%) ..................................................... 3.1
Table 3.2. Average Filtrate Flux for High-Solids Matrix (~13.7 wt%) .................................................. 3.4
Table 3.3. Average Filtrate Flux for Dewatering During Washing and Caustic Leach ........................... 3.9
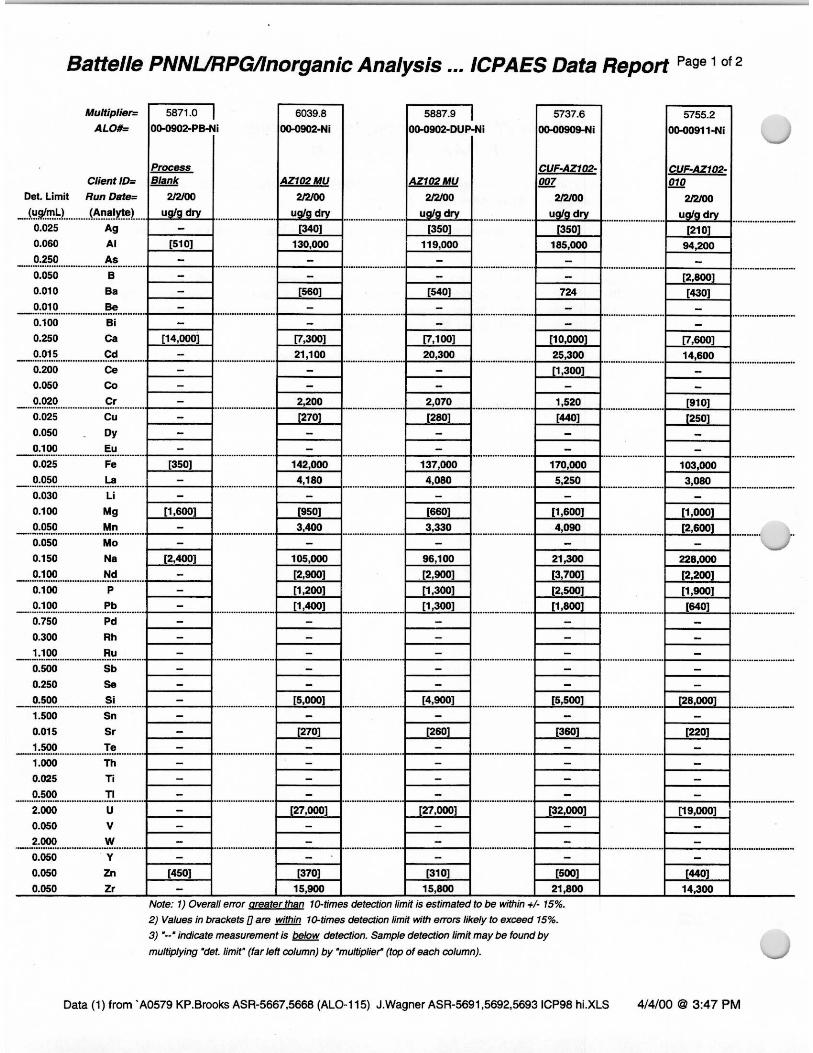
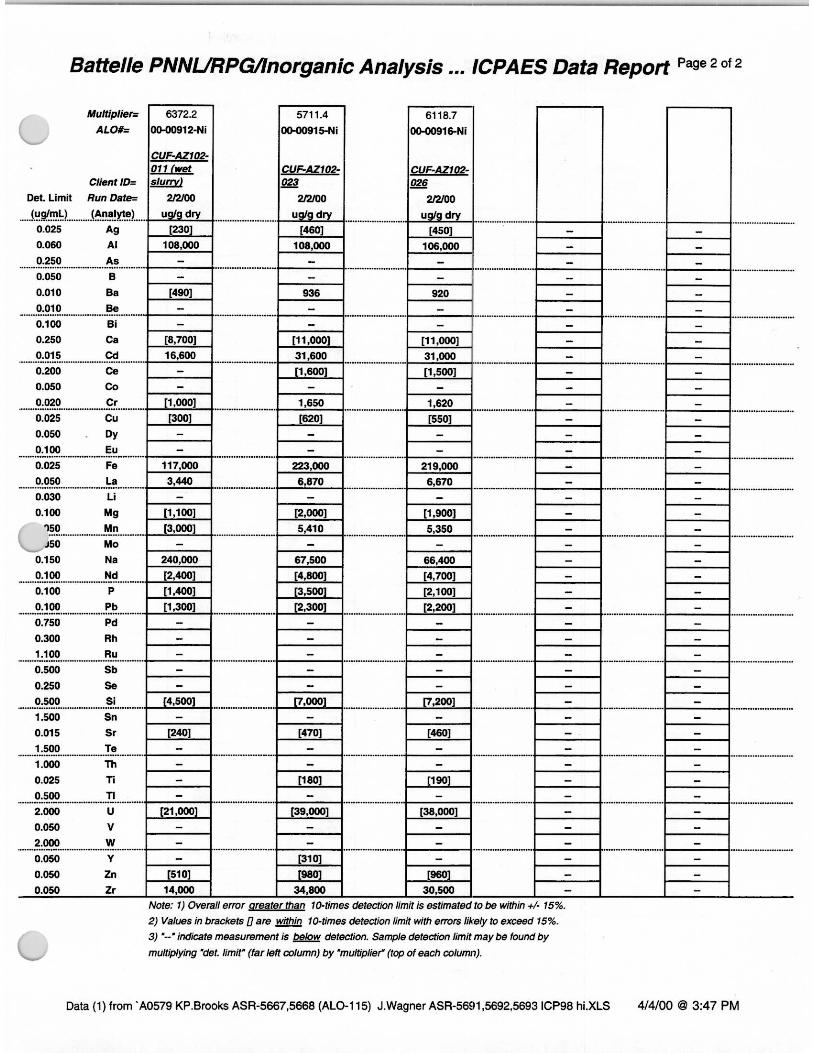
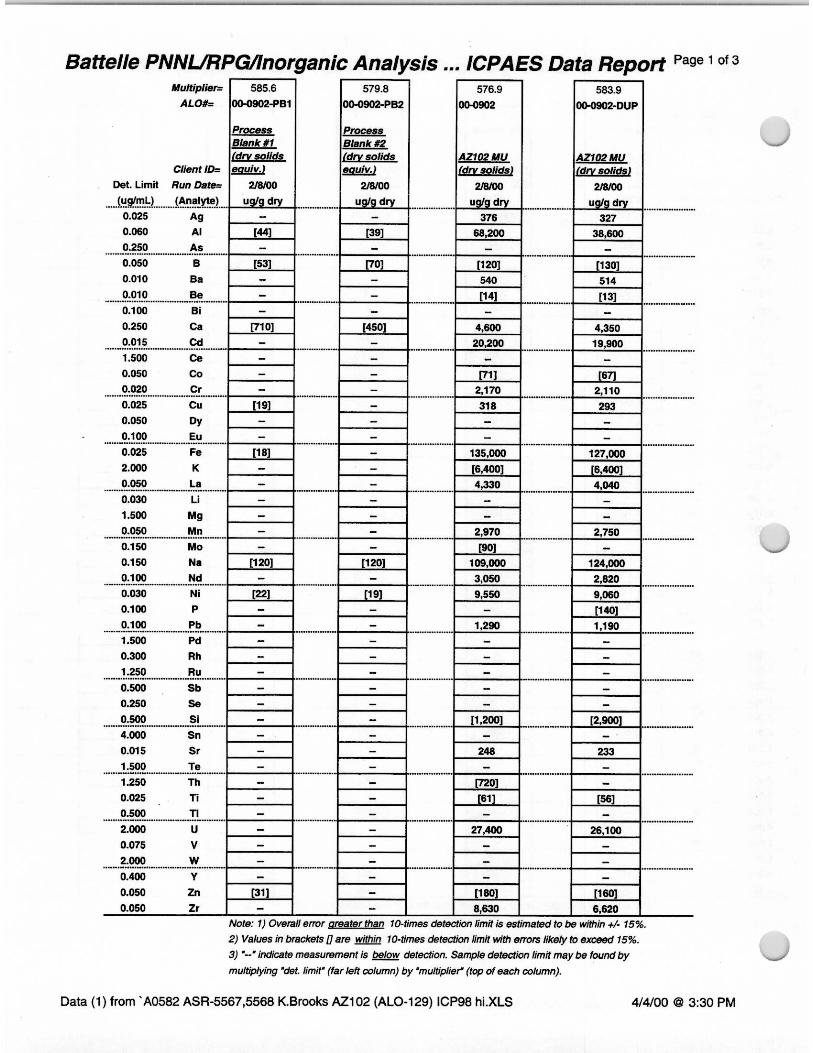
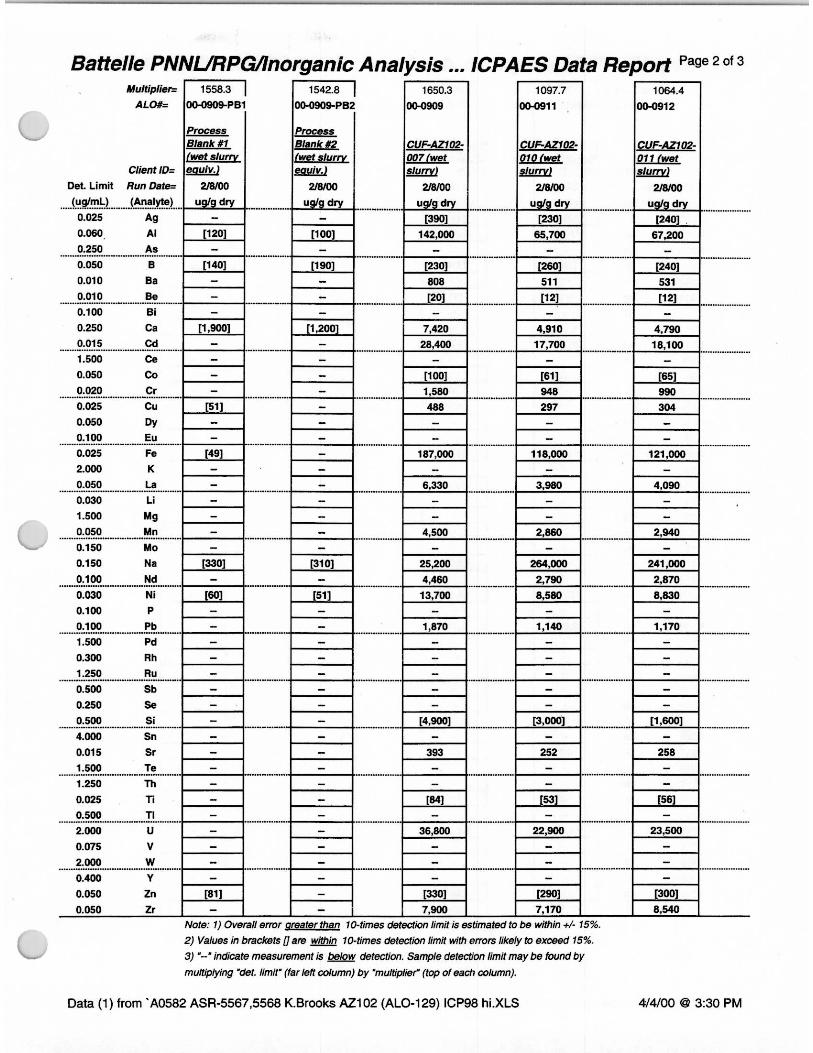
Table 3.4. Non-Radioactive Component Concentrations..................................................................... 3.12
Table 3.5. Radioactive Component Concentrations ............................................................................ 3.15
Table 3.6. Distribution of Non-Radioactive Analytes in the Wash Steps............................................. 3.17
Table 3.7. Distribution of Radioactive Analytes in the Wash Steps..................................................... 3.19
Table 3.8. Mass Recovery.................................................................................................................. 3.20
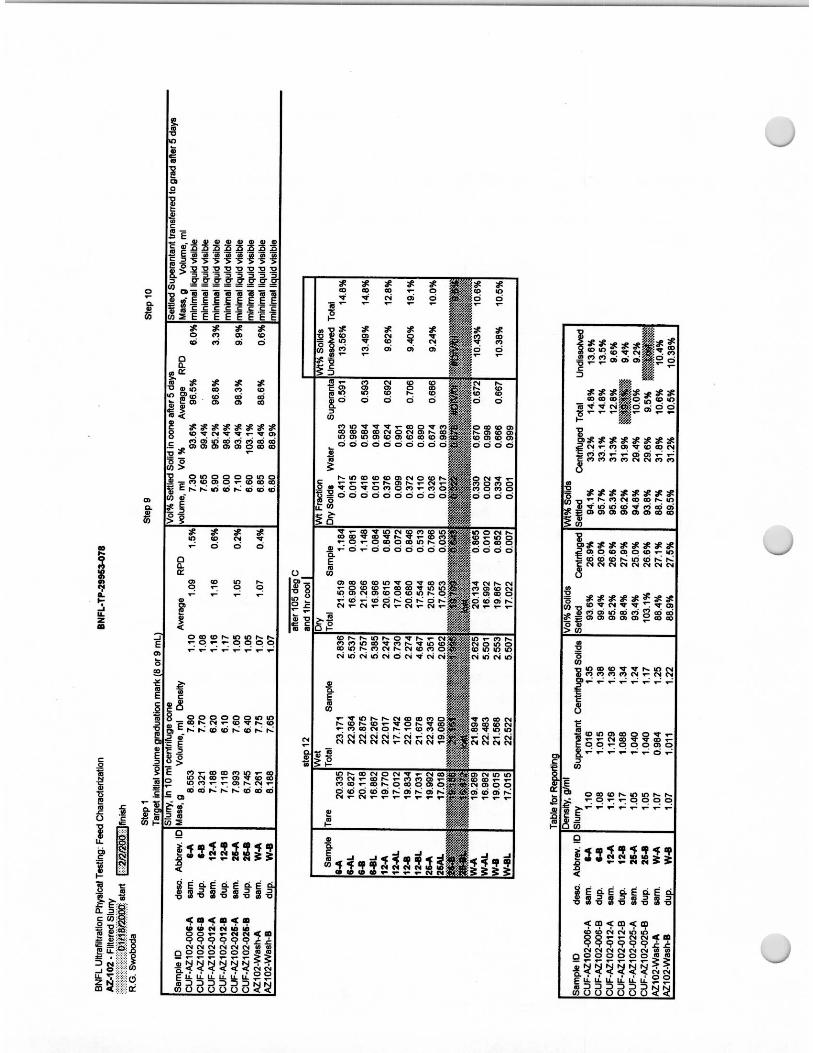
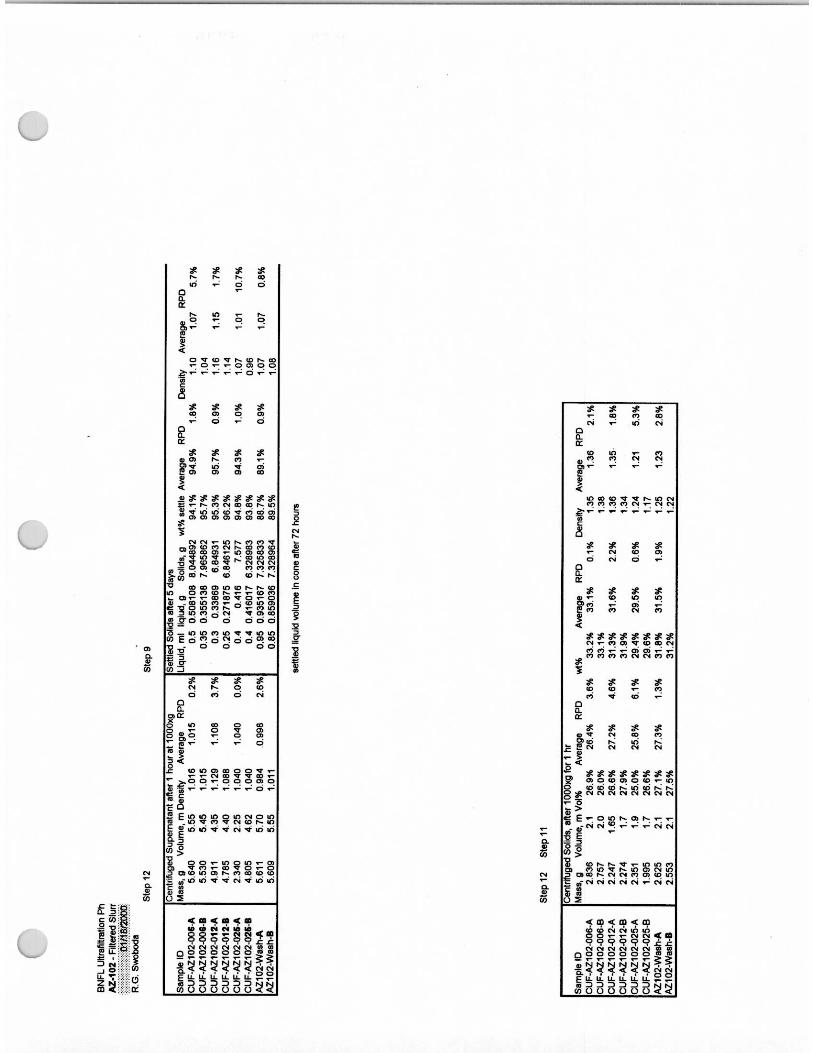
Table 4.1. Density Measurements for Samples of AZ-102 .................................................................. 4.2
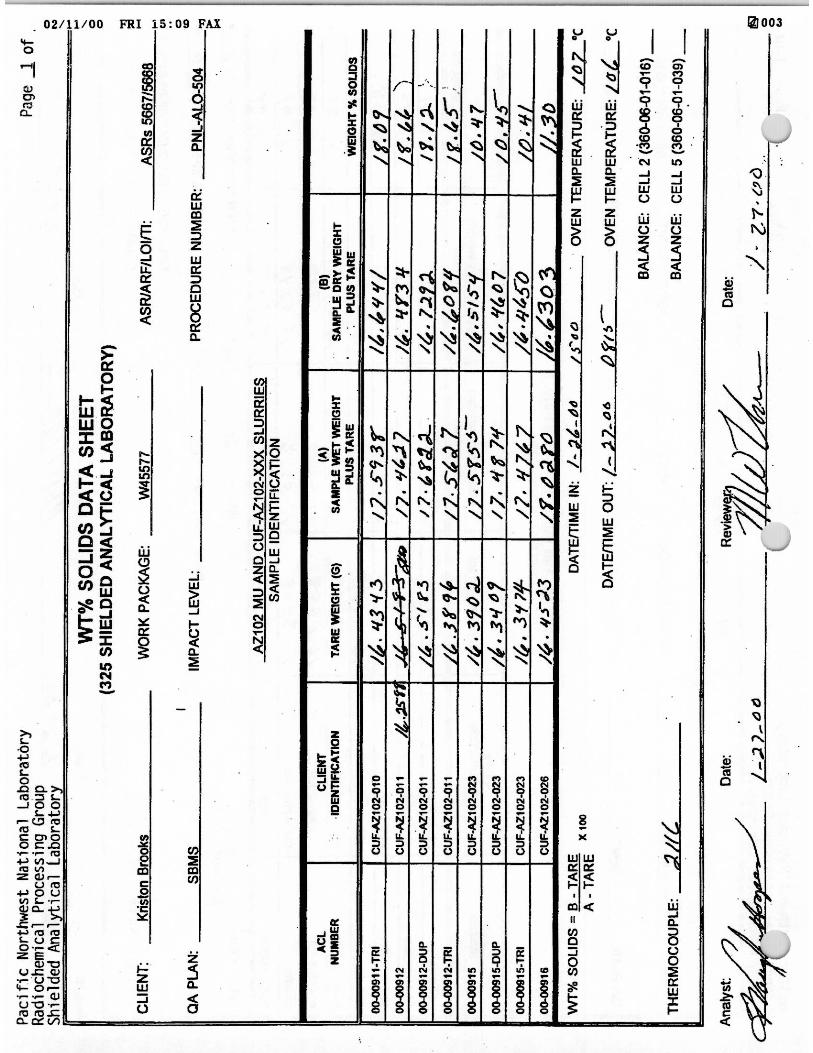
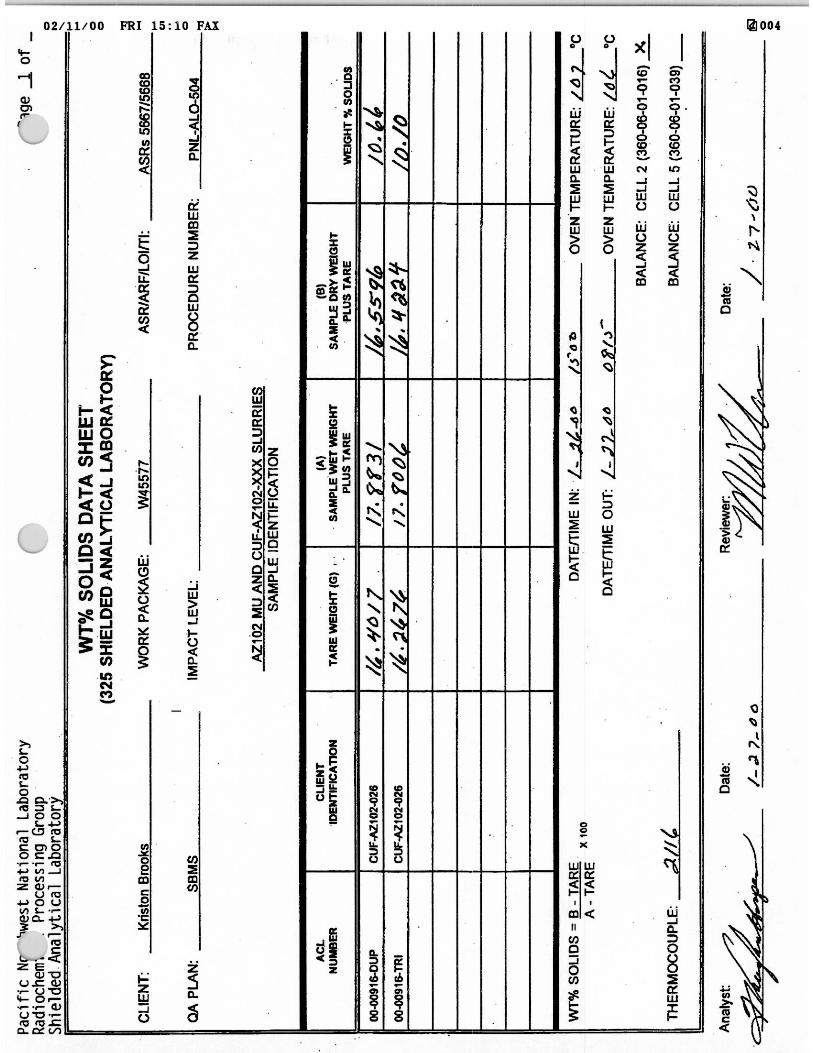
Table 4.2. Wt% and Vol% Solids Measurements for Samples of AZ-102............................................ 4.2
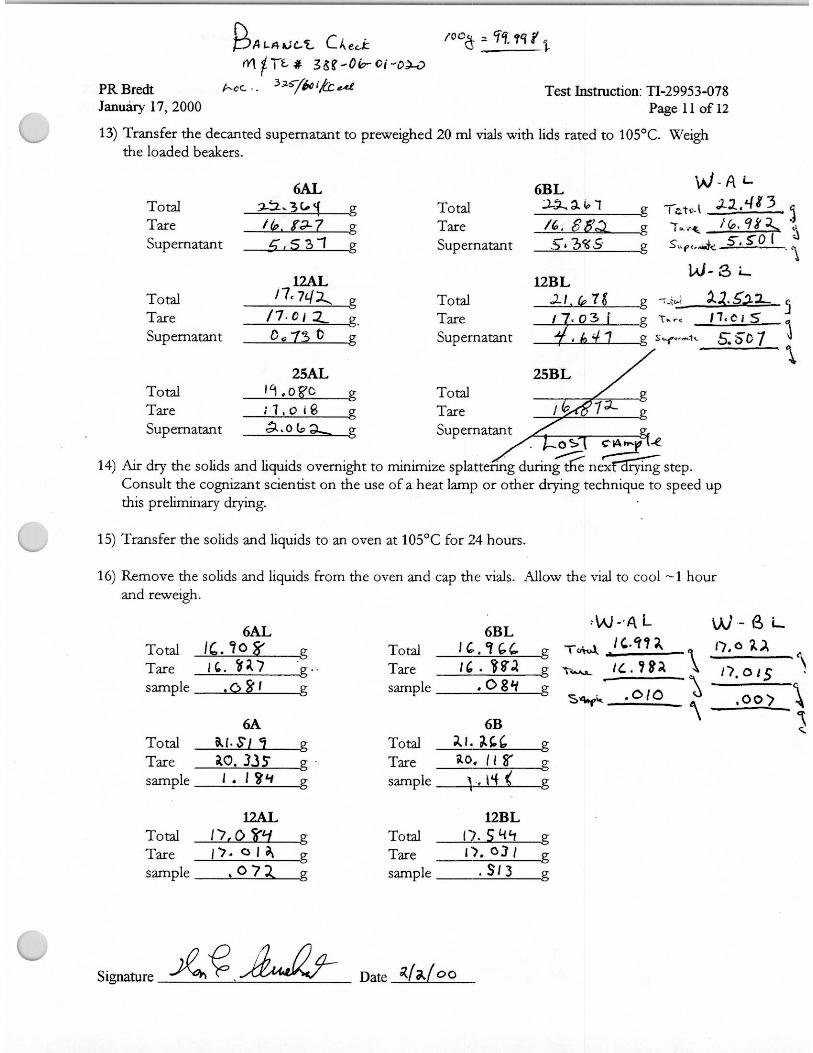
Table 4.3. Results of Wt% Residual Solids and Undissolved Solids Calculation Following Drying at 105°C for 24 H for Samples of AZ-102.............................................................................. 4.4
Table 4.4. Results for Yield Stress and Viscosity at 33 sec-1 for Samples of AZ-102 Slurry Along with Observed Onset of Taylor Vortices .................................................................................... 4.6
Table 5.1. Surrogate Supernatant Composition..................................................................................... 5.2
Table 5.2. Peak Mode Location for Volume-Weighted Particle Distribution of AZ-102 Samples.......... 5.5
Table 5.3. Peak Mode Location for Number-Weighted Particle Distribution of AZ-102 Samples.......... 5.7

x

1.1
1.0 Introduction
British Nuclear Fuels Limited (BNFL) Inc. developed the River Protection Project Waste TreatmentPlant (RPP-WTP) flowsheets, which plan to use caustic leaching and/or water washing to pretreat the Envelope D(a) Hanford sludge before high-level waste (HLW) vitrification (DOE-RL 1996). These pretreatment steps reduce the quantity of HLW generated by removing components such as Al, Cr, Na, and P that are soluble either in water or high-temperature caustic and often limit the waste loading in the glass.
The RPP-WTP flowsheets also use crossflow filtration to separate the leach and wash solutions fromthe solids between each step. Unlike traditional dead-end filtration, which has a declining filtration rate caused by the growth of a filter cake on the surface of the filter medium, in crossflow filtration, the majority of the filter cake is swept away by the fluid flowing across it. This filtration method is especially beneficial when there are very fine particles and when system simplicity is required.
The first objective of this work was to test crossflow filtration using actual Envelope D Hanford tank waste (AZ-102) in a modified cells unit filter (CUF) filtration rig fabricated at Battelle. Similar to the studies done with AW-101, AN-107, and C-104, the permeability of the diluted AZ-102 sludge was evaluated for both high and low solids concentrations as a function of transmembrane pressure (TMP), axial velocity, and time through a single-element 0.1-µm Mott filter (Brooks et al. 1999; Hallen et al. 2000; Brooks et al. 2000). The radioactive tests with the single-element CUF unit will provideinformation for equipment-performance evaluation and a design basis for scaling up of the process.
The second objective of this work was to evaluate washing and leaching characteristics of the AZ-102sludge. The slurried feed was de-watered and then washed multiple times with 0.01 M NaOH to determine the concentration of water-soluble components. It was subsequently leached with 3 M NaOH at elevated temperatures to determine the concentration of caustic-soluble components. The chemical and radiochemical composition of the filtrate and the final leached solids were measured to determine the efficiency of the filtration, leaching, and washing processes.
This report describes the test apparatus, the experimental approach, the results of the tests, and thechemical and radiochemical analysis of the sludge from Tank AZ-102 and filtrates generated during the washing and caustic-leaching steps.(b) This report also provides a means of transmitting to BNFL the completed test instruction and raw filtration and analytical data.
(a) Envelope issues are explained in Specification 7 of Contract No. DE-RP06-96RL13308.(b) The results presented in this report are based on work conducted under Test Plans TP-29953-069 and TP-29953-075, test instruction TP-29953-076, and Procedure TP-29953-020, Rev 1. Some data are recorded in Laboratory Record Book (LRB) #13745. Conditions for conducting these tests were given in the “AZ-102 Dewatering and Caustic Leach Test Specification,” TSP-W375-99-014, Rev 0.
2.1
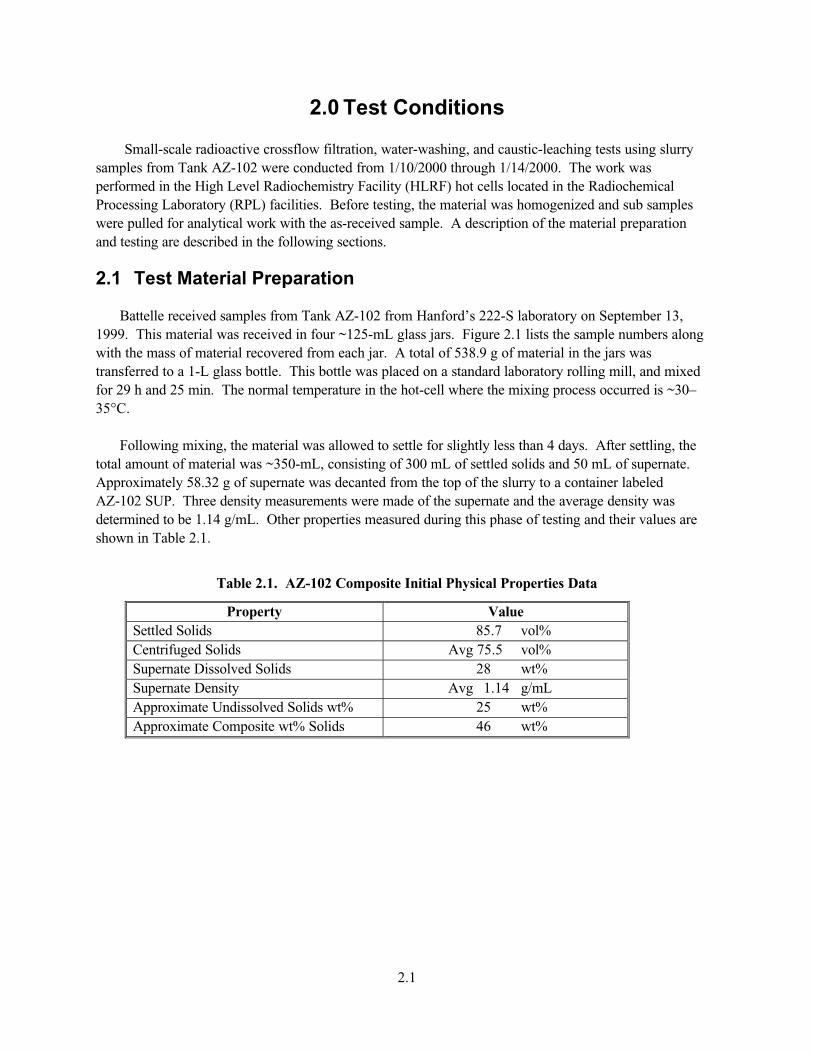
2.0 Test Conditions
Small-scale radioactive crossflow filtration, water-washing, and caustic-leaching tests using slurry samples from Tank AZ-102 were conducted from 1/10/2000 through 1/14/2000. The work was performed in the High Level Radiochemistry Facility (HLRF) hot cells located in the Radiochemical Processing Laboratory (RPL) facilities. Before testing, the material was homogenized and sub samples were pulled for analytical work with the as-received sample. A description of the material preparation and testing are described in the following sections.
2.1 Test Material Preparation
Battelle received samples from Tank AZ-102 from Hanford’s 222-S laboratory on September 13, 1999. This material was received in four ~125-mL glass jars. Figure 2.1 lists the sample numbers along with the mass of material recovered from each jar. A total of 538.9 g of material in the jars was transferred to a 1-L glass bottle. This bottle was placed on a standard laboratory rolling mill, and mixed for 29 h and 25 min. The normal temperature in the hot-cell where the mixing process occurred is ~30–35°C.
Following mixing, the material was allowed to settle for slightly less than 4 days. After settling, the total amount of material was ~350-mL, consisting of 300 mL of settled solids and 50 mL of supernate. Approximately 58.32 g of supernate was decanted from the top of the slurry to a container labeled AZ-102 SUP. Three density measurements were made of the supernate and the average density was determined to be 1.14 g/mL. Other properties measured during this phase of testing and their values are shown in Table 2.1.
Table 2.1. AZ-102 Composite Initial Physical Properties Data
Property ValueSettled Solids 85.7 vol%Centrifuged Solids Avg 75.5 vol%Supernate Dissolved Solids 28 wt%Supernate Density Avg 1.14 g/mLApproximate Undissolved Solids wt% 25 wt%Approximate Composite wt% Solids 46 wt%
2.2
Figure 2.1. Flowsheet of Initial Compositing
AZ-102 “As Received” SamplesFour Jars – Sample #17165–17168
The AZ-102 Material was combined in a 1-L glass jar labeled AZ-102 COMPSample # Outside Jar Surface Observations/Material Mass Transferred17165 Fairly clean No Observations Noted 153.53 g17166 Clean Thicker than 17165 134.15 g17167 None Thin peanut butter 128.85 g17168 Suspect Leak Thick peanut butter 145.32 g
Residual sample material left in jars accidentally dried out.~32.11 g wet = 18.26 g solidsThis material was rehydrated and added to the “AZ-102 Recovered Solids” jar.
AZ-102 COMP (538.9 g) was placed on a standard laboratory rolling mill for 29.42 h. It was then allowed to settle for over 90 h.
After settling, the ~350 mL of material was visually 300 mL settled solids and 50 mL supernate. The supernate was removed and put into a bottle labeled AZ-102-SUP.
Wt% solids test4.76 g used
AZ-102 COMP with supernate removed:480.58 g material
AZ-102 SUP58.32 g material
Sample AZ-102 SUP-MU28.23 g from AZ-102 SUP
Two samples were pulled and centrifuged for 1 h at 1000x-g. The samples totaled 18.77 g. This material was added to the “AZ-102 recovered solids” after measurements were made. A total of 4.78 g of material was lost in a transfer glitch, but some of that went into the recovery jar as well.
Sample AZ-102 GL49.66 g from AZ-102 COMP6.05 g from AZ-102 SUP
Sample AZ-102 SUP-B7.18 g from AZ-102 SUP23.09 g from AZ-102 COMP
Sample AZ-102 MU (CUF)50.05 g from AZ-102 COMP6.21 g from AZ-102 SUP
Sample AZ-102 MU (Analytical)27.3 g from AZ-102 MU (Jar)
AZ-102 COMP322.06 g were transferred from this bottle to the CUF.
AZ-102 Recovered SolidsAll the material that could be recovered by rinsing equipment was collected in this jar. The final material that went into the CUF was ~10 vol% settled solids and weighted 383.82 g.
Addition of ~5 mL rinse DI aftertransfer out of 27.3 g
Material that Went Into the CUFAZ-102 COMP
AZ-102 GLAZ-102 MU (CUF)
AZ-102 Recovered Solids
Material that Went for AnalysisAZ-102 SUP MUAZ-102 SUP B
AZ-102 MU (Analytical)
2.3
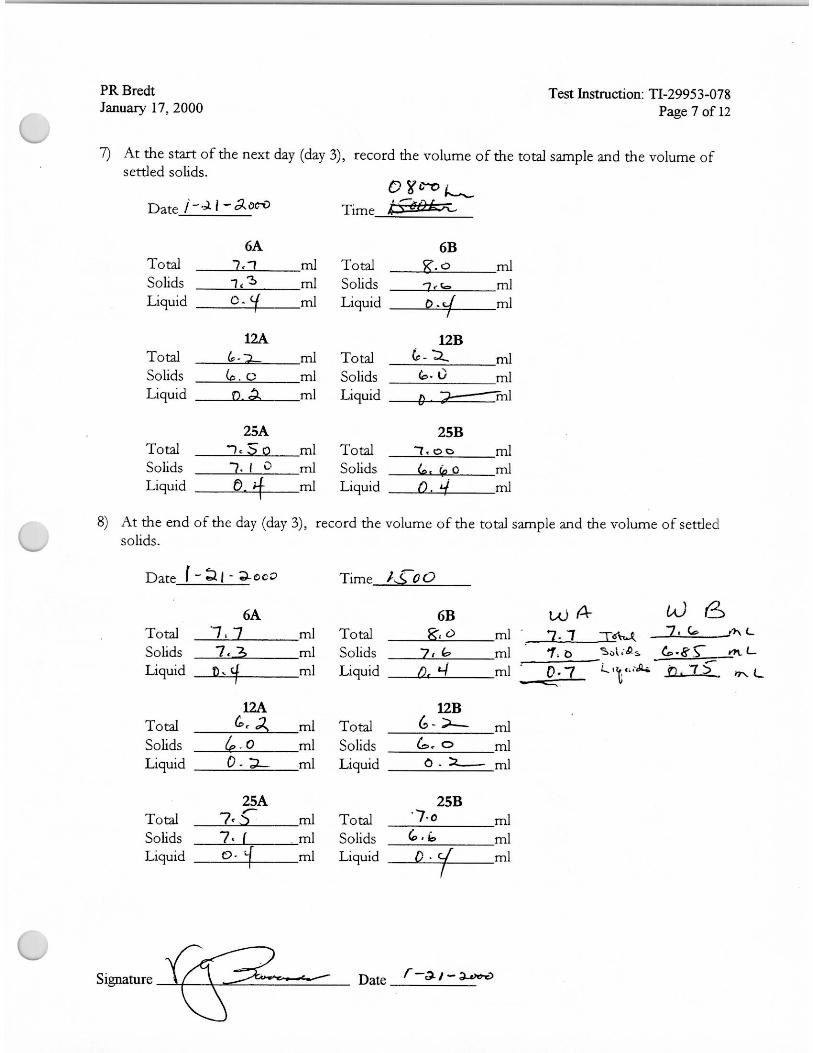
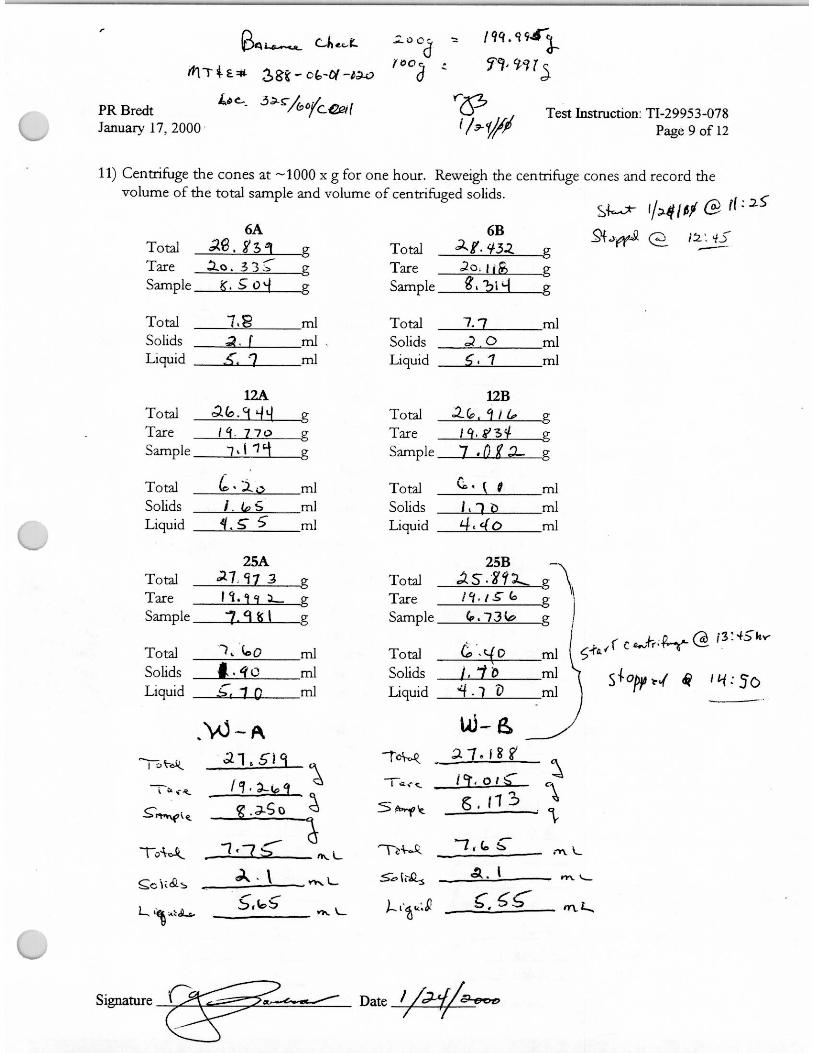
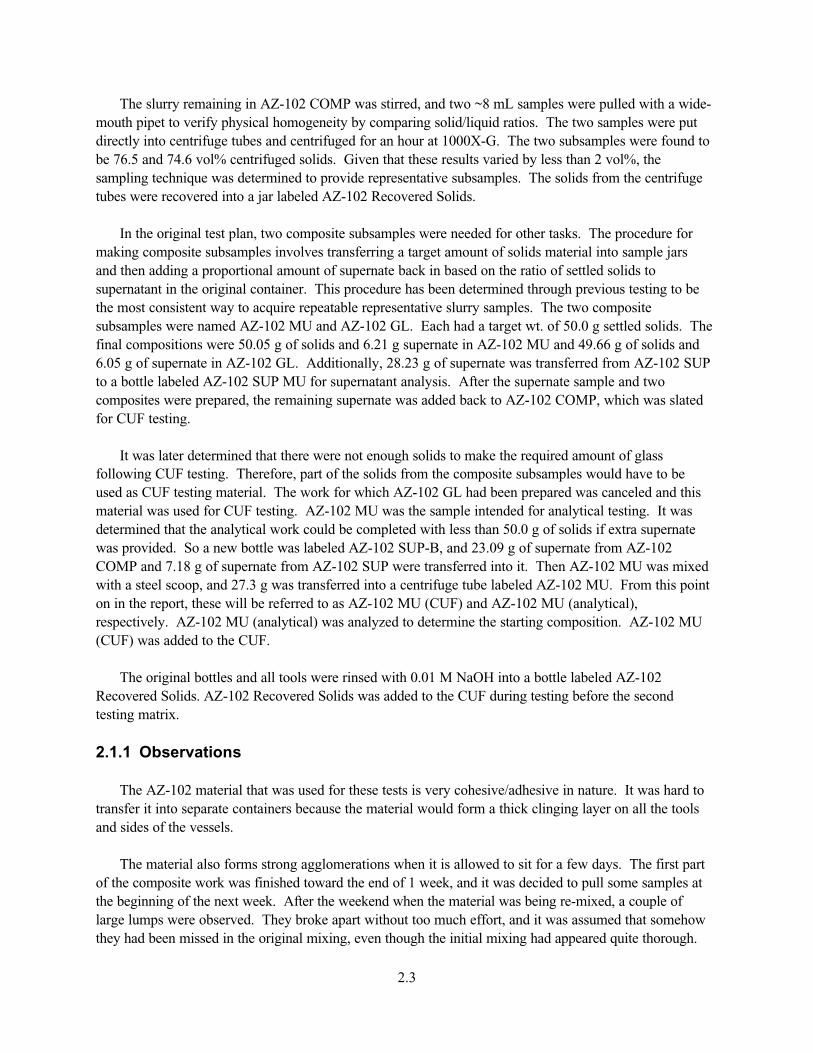
The slurry remaining in AZ-102 COMP was stirred, and two ~8 mL samples were pulled with a wide-mouth pipet to verify physical homogeneity by comparing solid/liquid ratios. The two samples were put directly into centrifuge tubes and centrifuged for an hour at 1000X-G. The two subsamples were found to be 76.5 and 74.6 vol% centrifuged solids. Given that these results varied by less than 2 vol%, the sampling technique was determined to provide representative subsamples. The solids from the centrifuge tubes were recovered into a jar labeled AZ-102 Recovered Solids.
In the original test plan, two composite subsamples were needed for other tasks. The procedure for making composite subsamples involves transferring a target amount of solids material into sample jars and then adding a proportional amount of supernate back in based on the ratio of settled solids to supernatant in the original container. This procedure has been determined through previous testing to be the most consistent way to acquire repeatable representative slurry samples. The two composite subsamples were named AZ-102 MU and AZ-102 GL. Each had a target wt. of 50.0 g settled solids. The final compositions were 50.05 g of solids and 6.21 g supernate in AZ-102 MU and 49.66 g of solids and 6.05 g of supernate in AZ-102 GL. Additionally, 28.23 g of supernate was transferred from AZ-102 SUP to a bottle labeled AZ-102 SUP MU for supernatant analysis. After the supernate sample and two composites were prepared, the remaining supernate was added back to AZ-102 COMP, which was slated for CUF testing.
It was later determined that there were not enough solids to make the required amount of glass following CUF testing. Therefore, part of the solids from the composite subsamples would have to be used as CUF testing material. The work for which AZ-102 GL had been prepared was canceled and this material was used for CUF testing. AZ-102 MU was the sample intended for analytical testing. It was determined that the analytical work could be completed with less than 50.0 g of solids if extra supernate was provided. So a new bottle was labeled AZ-102 SUP-B, and 23.09 g of supernate from AZ-102COMP and 7.18 g of supernate from AZ-102 SUP were transferred into it. Then AZ-102 MU was mixed with a steel scoop, and 27.3 g was transferred into a centrifuge tube labeled AZ-102 MU. From this point on in the report, these will be referred to as AZ-102 MU (CUF) and AZ-102 MU (analytical), respectively. AZ-102 MU (analytical) was analyzed to determine the starting composition. AZ-102 MU (CUF) was added to the CUF.
The original bottles and all tools were rinsed with 0.01 M NaOH into a bottle labeled AZ-102Recovered Solids. AZ-102 Recovered Solids was added to the CUF during testing before the second testing matrix.
2.1.1 Observations
The AZ-102 material that was used for these tests is very cohesive/adhesive in nature. It was hard to transfer it into separate containers because the material would form a thick clinging layer on all the tools and sides of the vessels.
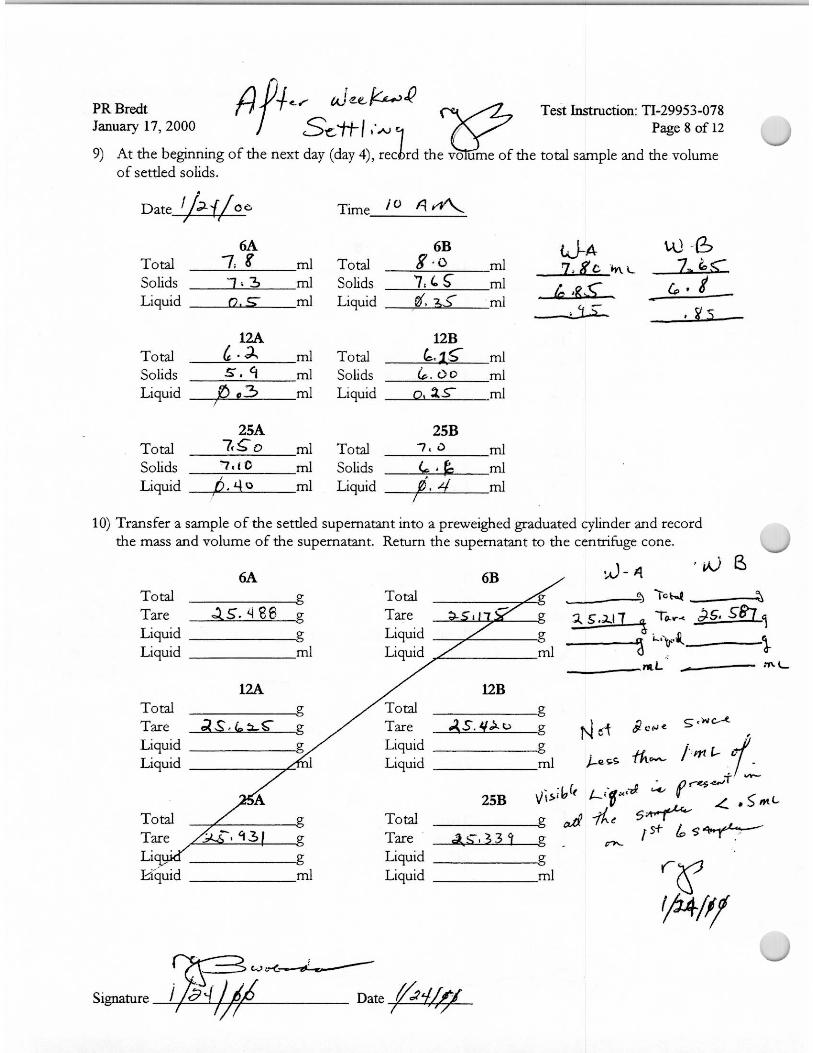
The material also forms strong agglomerations when it is allowed to sit for a few days. The first part of the composite work was finished toward the end of 1 week, and it was decided to pull some samples at the beginning of the next week. After the weekend when the material was being re-mixed, a couple of large lumps were observed. They broke apart without too much effort, and it was assumed that somehow they had been missed in the original mixing, even though the initial mixing had appeared quite thorough.
2.4
However, when AZ-102 MU was split after having sat for a couple of weeks, it was filled with hard grainy agglomerates that had not been present when the sample was pulled. These agglomerates varied in size, some as large as ~1 mm in diameter. These agglomerates were concentrated primarily in the bottom of the container. Attempts were made to break them apart during the re-mixing of the material, including vigorous stirring and compressing them between the jar wall and the steel scoop, with only moderate success.
2.2 Overview of Testing
For the AZ-102 crossflow filtration experiments, measurements of filtrate flux as a function of TMP and crossflow velocity were recorded for both a dilute and a concentrated slurry. The dilute feed was 5.1 wt% solids, and the concentrated feed was 13.7 wt% solidsa. Due to minimum volume constraints in the CUF and the small quantity of AZ-102 sludge available, the high solids concentration target of 20 wt% solids could not be achieved. The filtrate was recycled back into the feed tank to maintain the steady-state solids concentration for testing. Each condition was run for 60 min with data taken at 10-minuteintervals. The system was back-pulsed at least twice between each condition, and not backpulsed at any time during the condition. The slurry temperature was maintained at 25 ± 5°C for all filtrate testing.
The filtration test target conditions presented later in Tables 2.2 and 2.3 were based on an empiricallyderived matrix to determine the optimum de-watering conditions for the feed slurry. A 5-point matrix around the center-point at 50 psid and 12.2 ft/s tested the conditions of TMP (30 psid, 50 psid, 70 psid) and axial velocity (9.1 ft/s, 12.2 ft/s, 15.2 ft/s). However, the air pressure available and pump capability, even with the air booster, was insufficient to achieve the target velocities and pressures with the AZ-102material. Therefore, some of the matrix points are at lower velocities.
It was hypothesized that the subsurface filter fouling (that cannot be removed by simple backpulsing) may have influenced the selection of optimum de-watering conditions as each test was conducted. To incorporate error introduced by the subsurface filter fouling, and to account for such errors in selecting an optimum de-watering condition, the center-point was used for the initial testing conditions and repeated for the final testing conditions.
The initial AZ-102 material exhibited some unexpected physical properties that affected the testing at several stages. The AZ-102 sludge composite was very cohesive and tended to form agglomerates when it settled. This may have caused problems with material transfer and with plugging and flow fluctuations in the CUF. It also could have affected the rheology measurements. After all CUF processing was complete, it was noted that the material entrained air in quantities large enough to increase its volume by almost a third. This entrained air may have been the result of pumping in the CUF. It is possible that part of the reason the target flowrates could not be reached during testing was due to these two unexpected physical properties, although entrained air was only observed at the conclusion of testing.
Following the filtration tests, the slurry was washed with 0.01 M NaOH at 25°C in the CUF system.This was accomplished though consecutive additions of the washing solution to the CUF slurry feed tank,
(a) Solids concentrations presented in this report are reported on an insoluble solids basis unless specifically delineated. Insoluble solids concentration is calculated by subtracting out the dissolved solids from the total solids.
2.5
followed by the removal of an equal amount of liquid as permeate using the crossflow filter. The filtrate from these washes was collected in three separate containers, and each was sampled for analysis.
The slurry was then put though a caustic leaching process. The slurry was transferred from the CUF to a separate leaching container, combined with NaOH to produce a slurry consisting of ~3 M OH-,heated to 85°C, and held with steady mixing for 8 h. The leached slurry was then transferred back into the CUF, and de-watered. Following leaching, two 8-h, 0.01 M NaOH rinse cycles were performed at 85°C to reduce the dissolved solids contained in the interstitial liquid.
The available solids and the minimum operating volume of the CUF (800 to 900 mL) limited the maximum solids concentration that could be attained in the CUF for the second matrix and the final slurry.
All wash solutions and slurry samples from selected process points were analyzed for chemical and radiochemical constituents. Additional samples were obtained to determine rheological properties and toverify the approximate solids loading at specified points. These samples were added back to the system after completion of the procedure when possible.
The final washed sludge was transferred into a storage container for melter feed rheological studiesand HLW vitrification tests.
2.3 Testing Apparatus
Crossflow filtration testing of the feed was conducted on a Battelle-constructed CUF, with the following specifications:
• single tube filter module, 24-in. tube; 3/8-in. ID
• 0.1-µm Mott liquid-service stainless steel filter
• re-circulation flow such that 5 m/s (15 ft/s) maximum linear crossflow velocity could be achieved with water; however, with the AZ-102 slurry, the target velocities (9.1–15.2 ft/s) could not be achieved.
• maximum TMP 80 psid with water.
A process flow diagram of the CUF is shown in Figure 2.2. The slurry feed is introduced into the CUF through the slurry reservoir. An Oberdorfer progressive cavity pump (powered by an air motor) pumped the slurry from the slurry reservoir through the magnetic flow meter and the filter element. Three baffles were installed in the slurry reservoir to prevent vortex formations. The axial velocity and TMP were controlled by the pump speed (which was controlled by the pressure of the air supplied to the air motor) and the throttle valve position. An air booster was added outside of the hot cell to increase the building pressure to the air motor. This was done in an attempt to achieve higher axial velocities during actual slurry testing. During operation, the air booster created a pulsation at an approximate rate of 1 per second and a TMP of 5–10 psig. These pressure fluctuations may have impacted the filtration characteristics, although a test performed during the C-104 filtration compared this effect and indicated that it did not (Brooks et al. 2000).
2.6
Deionized (DI) water and dilute caustic (0.01 M NaOH) additions into the CUF were made by adding pre-weighed volumes in through a chemical addition tank located outside the hot cell. The chemical addition tank was hard piped into the cell where a long piece of flexible tubing was attached that could be gravity drained into the slurry reservoir. Concentrated caustic or acid solutions were added to the CUF using pre-filled polyethylene bottles transferred manually into the cell.
Filtrate that passes through the filter can be either sent to the back-pulse chamber, reconstituted with the slurry in the slurry reservoir, or removed. The filtrate flow rate is measured by means of a graduatedglass-flow monitor that is fill-and-drain operated. Higher filtrate flow rates can be monitored with an in-line rotometer. Filtrate samples are taken at the three-way valve upstream from the slurry reservoir. This is also the point at which filtrate is removed for the de-watering step. Filter back-pulsing was conducted by partially filling the back-pulse chamber with filtrate, pressurizing the back-pulse chamber with air, and forcing the filtrate in the back-pulse chamber back through the filter.
During the majority of the testing with the CUF, the slurry temperature was maintained at 25 ± 5°C by flowing cooling water in jackets around the slurry reservoir and through a jacket surrounding the tube between the magnetic flow meter and the filter. The slurry temperature was measured by a thermocouple installed in the slurry reservoir and controlled by a 1000-watt chiller. When filtering wash solutions at elevated temperatures (85°C), the chiller was turned off and heat tape surrounding the slurry reservoir and pump inlet tubing heated. The temperature was then maintained using a proportional-integral-derivativecontroller (PID) temperature controller.
The elevated-temperature caustic leaches/washes were performed in a large 2-L stainless steel beaker.The slurry in the stainless steel container was heated on a hotplate while being continuously stirred with a mixing blade. A thermocouple, immersed in the slurry, measured temperature and fed the data into the temperature controller. This allowed for automatic temperature control for the 8-h wash cycles. To minimize evaporation loss, a stainless steel lid with a small hole for the mixer shaft was used.

2.7
Figure 2.2. Crossflow Filtration Process Flow Diagram
The critical test measuring equipment included
• a magnetic flow meter to measure slurry re-circulation rate
• two flow meters to measure the filtrate flow rate at high and low levels
• three pressure gauges to measure the filter module inlet, filter module outlet, and filtrate pressures
• two thermocouples to measure the slurry temperature in the CUF and in the leaching beaker.
All measuring equipment was calibrated, and the calibration information was recorded in the test-instruction document.
(CUFS)Cells Unit Filter System
SampleLoop
Pressure Relief
MOTT FilterDischargeThrottle
Overflow
SamplePort
Filtrate FlowMeasurement Unit
Back PulseChamber
Compressed Air
120 VAC60 HZ
Chiller:CHLR-01Cold Fluid Reservoir V18 V19
Supply
V20 V21ReturnMFI
101325 BldgGallery
325 Bldg“A” Cell
V6
Fl102 Pl
203
Pl201
Pl202
MF101
Pl204
Fl103
TE101

2.8
2.4 CUF System Verification Testing
Testing to establish a baseline filtrate flux was conducted with de-mineralized filtered water in the CUF at 20, 10, and 30 psid. The filtrate fluxes for these tests averaged 1.25, 0.55, and 1.54 gpm/ft2,respectively. These fluxes were lower than the fluxes obtained with water before the start of previous testing with a C-104 sample, which averaged 1.59, 0.95, and 2.38 gpm/ft2, respectively. This may indicate that a certain amount of irreversible fouling was occurring in the filter. The water testing showed very little filtrate flux reduction over the 60-min test time for the 20-psid test and 30-min test time for the 10-psid test. However, over the 30-min test at 30 psid, the flux dropped from 1.70 to 1.34. The majority of this drop was seen over the last 10-minute increment. It was decided that the CUF was sufficiently clean to begin testing with the AZ-102 sample since attempting to achieve better fluxes would be costly in both time and budget, and the water fluxes were above the required start values.
2.5 Experimental Approach
A flow sheet of the testing is shown in Figure 2.3. The test instruction for this work is found in Appendix A, and a mass-balance spreadsheet is provided in Appendix B.
The homogenized AZ-102 samples were added to the CUF along with 0.01 M NaOH to create a slurry at 5.1-wt% insoluble solids concentration.
The AZ-102 material plugged the CUF for the first 20 minutes of operation and could not be pumped smoothly. For several hours after the start of testing, the system continued to show large variations in flow and pressure, indicating continued plugging. These problems could be either due to agglomerates in the slurry or just its high solids loading and cohesive nature. Once the flow and pressure readings had stabilized, it was noted that the target flowrate of 12.2 ft/s at 50 psid for the first condition could not be reached even with the help of an air booster. After several attempts to increase the flowrate, testing of the first matrix began with the highest flowrate achievable. During the first three hours of testing, occasional plugging of the CUF throttle valve occurred, resulting in pressure spikes. After that time, steady-statepressures and velocities were more easily achievable.
The first testing matrix to determine the optimum de-watering conditions for dilute slurry conditions was run at five combinations of TMP and crossflow velocity with two conditions being repeated to assess the effect of filter fouling over the course of testing (see Table 2.2). The system was back-pulsed two to four times between each condition. It was not backpulsed during the 1-hour test condition itself. The cognizant engineer determined the required amount of back-pulses required based on the drop in flux during the previous condition and on the amount of recovery achieved with the first two back-pulses. Thefiltrate flux results are found in Section 3.1.

2.9
Figure 2.3. AZ-102 Crossflow Filtration Test Experimental Steps
Filtrate #1
Filtrate #2
Prepare CUF and Run DI Water Tests
Inhibited Water Wash In CUF2697.75g Inhibited Water (0.01M NaOH)
added in 3 batches
Add AZ-102 322.64g Composite SampleAdd 1849.86g 0.01M NaOH
Test Matrix # 1 @ ~ 5 wt% solids
Test Matrix # 2 @ ~ 20 wt% solids
Add AZ-102 Composite Samples (MU = 40.835g and GL = 46.664g)
Add 383.82g of recovered solid soln. (Visually ~ 10 vol% solids)
Add Dilution #2 = 453.19g 0.01M NaOH
4 Filtrate Samples Taken 2 From Each Filtration Step
= 79.995g Total Additional Removed
Rheology (no slurry sample at this point)
Centrifuge Sample (0.3271g lost) and 1 Slurry Sample
=19.378g removed
2 samples pulledfrom each bottle later
for analysisCaustic Leach with 3.0 M NaOH for 8
hours at 85C(In Stainless Steel Vessel) 609.159g of 7.37M NaOH added.
2 Slurry Samples Taken= 34.083g removed
AZ-102 Caustic Leach -Permeate #1 529.58g Soln. Removed
AZ-102 Water Wash - Permeate #1 878.57g Soln. RemovedPermeate #2 880.85g Soln. RemovedPermeate #3 954.07g Soln. Removed
Rheology (no slurry sample at this point)
2 Filtrate Samples Taken = 39.99g Total Additional Removed
AZ-102 Filtrate - Filtrate #1 957.97g Soln. RemovedFiltrate #2 727.82g Soln. Removed
3 Slurry Samples =
47.23gRemoved
AZ-102 Caustic Wash -Permeate #1 1492.06 g Soln. Removed
Remove Caustic Wash Permeate with CUF
2 Filtrate Samples Taken = 35.11g Total Additional Removed
2 Filtrate Samples Taken = 39.72g Total Additional Removed
AZ-102 Caustic Wash -Permeate #2 1539.34 g Soln. Removed
4 Slurry Samples =
57.18gRemoved
104.66gEvaporated --- 107.00g added
104.80gEvaporated --- 105.25g added
122.22gEvaporated ---
100.07g + 150.09 g added
Final Testing, Samples, Rheology, and Transfer of 576.98g Washed Sludge Into
Storage Container
First Dilute Caustic Wash with 1392.23g of 0.01 M NaOH for 8 hours at 85 C (In
Stainless Steel Vessel)
Remove Caustic Wash Permeate with CUF
Second Dilute Caustic Wash with 1400.00g of 0.01 M NaOH for 8 hours at
85 C (In Stainless Steel Vessel)
Remove Caustic Leach Permeate with CUF
2.10
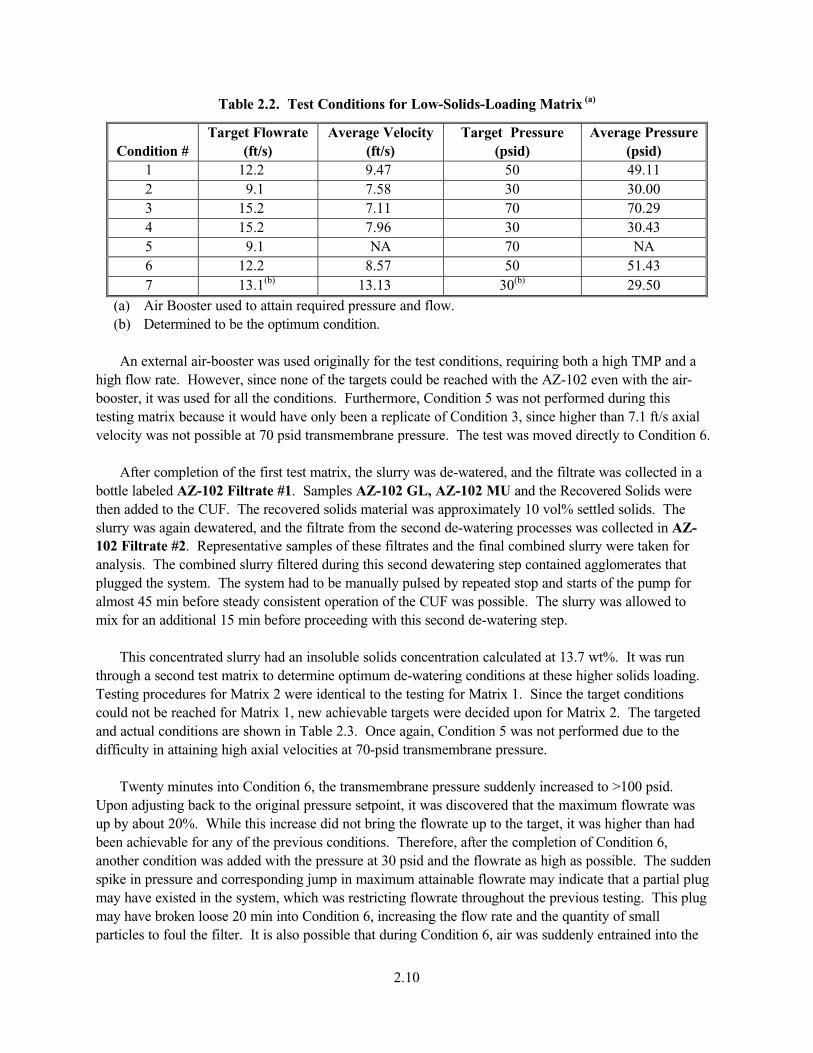
Table 2.2. Test Conditions for Low-Solids-Loading Matrix (a)
Condition #Target Flowrate
(ft/s)Average Velocity
(ft/s)Target Pressure
(psid)Average Pressure
(psid)1 12.2 9.47 50 49.112 9.1 7.58 30 30.003 15.2 7.11 70 70.294 15.2 7.96 30 30.435 9.1 NA 70 NA6 12.2 8.57 50 51.437 13.1(b) 13.13 30(b) 29.50
(a) Air Booster used to attain required pressure and flow.(b) Determined to be the optimum condition.
An external air-booster was used originally for the test conditions, requiring both a high TMP and a high flow rate. However, since none of the targets could be reached with the AZ-102 even with the air-booster, it was used for all the conditions. Furthermore, Condition 5 was not performed during this testing matrix because it would have only been a replicate of Condition 3, since higher than 7.1 ft/s axial velocity was not possible at 70 psid transmembrane pressure. The test was moved directly to Condition 6.
After completion of the first test matrix, the slurry was de-watered, and the filtrate was collected in a bottle labeled AZ-102 Filtrate #1. Samples AZ-102 GL, AZ-102 MU and the Recovered Solids were then added to the CUF. The recovered solids material was approximately 10 vol% settled solids. The slurry was again dewatered, and the filtrate from the second de-watering processes was collected in AZ-102 Filtrate #2. Representative samples of these filtrates and the final combined slurry were taken for analysis. The combined slurry filtered during this second dewatering step contained agglomerates that plugged the system. The system had to be manually pulsed by repeated stop and starts of the pump for almost 45 min before steady consistent operation of the CUF was possible. The slurry was allowed to mix for an additional 15 min before proceeding with this second de-watering step.
This concentrated slurry had an insoluble solids concentration calculated at 13.7 wt%. It was run through a second test matrix to determine optimum de-watering conditions at these higher solids loading.Testing procedures for Matrix 2 were identical to the testing for Matrix 1. Since the target conditions could not be reached for Matrix 1, new achievable targets were decided upon for Matrix 2. The targeted and actual conditions are shown in Table 2.3. Once again, Condition 5 was not performed due to the difficulty in attaining high axial velocities at 70-psid transmembrane pressure.
Twenty minutes into Condition 6, the transmembrane pressure suddenly increased to >100 psid.Upon adjusting back to the original pressure setpoint, it was discovered that the maximum flowrate was up by about 20%. While this increase did not bring the flowrate up to the target, it was higher than had been achievable for any of the previous conditions. Therefore, after the completion of Condition 6, another condition was added with the pressure at 30 psid and the flowrate as high as possible. The sudden spike in pressure and corresponding jump in maximum attainable flowrate may indicate that a partial plug may have existed in the system, which was restricting flowrate throughout the previous testing. This plug may have broken loose 20 min into Condition 6, increasing the flow rate and the quantity of small particles to foul the filter. It is also possible that during Condition 6, air was suddenly entrained into the
2.11
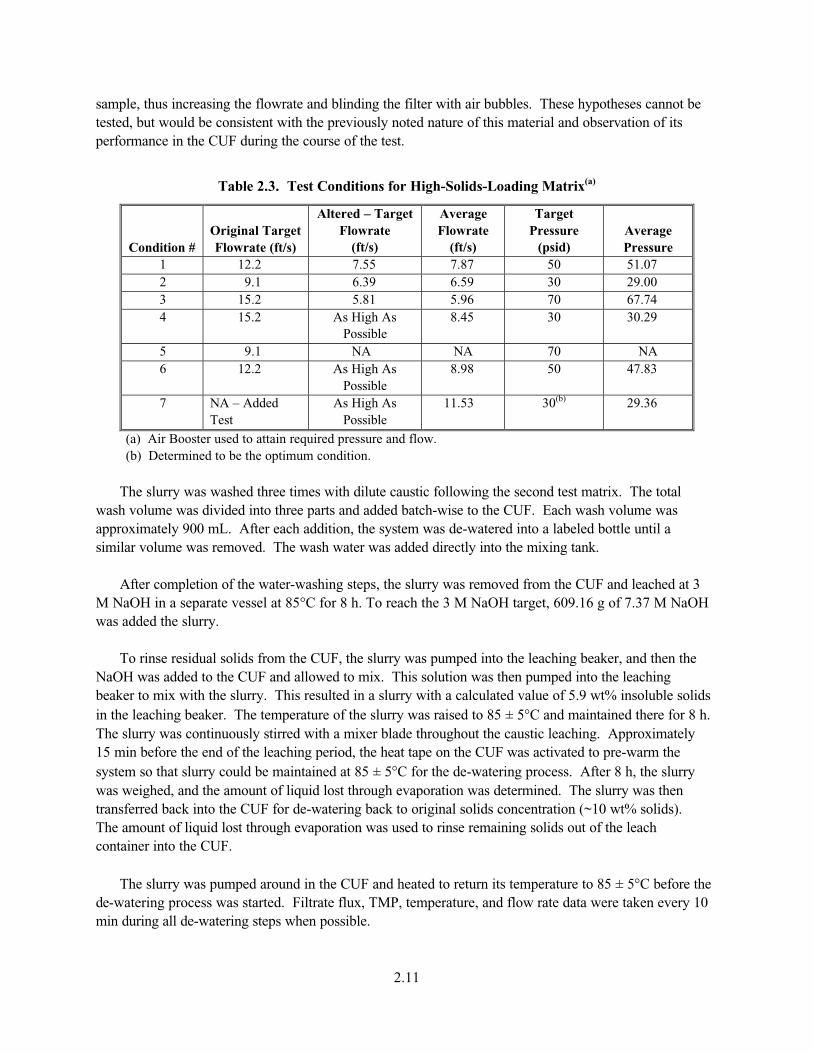
sample, thus increasing the flowrate and blinding the filter with air bubbles. These hypotheses cannot be tested, but would be consistent with the previously noted nature of this material and observation of its performance in the CUF during the course of the test.
Table 2.3. Test Conditions for High-Solids-Loading Matrix(a)
Condition #Original Target Flowrate (ft/s)
Altered – Target Flowrate
(ft/s)
AverageFlowrate
(ft/s)
TargetPressure
(psid)AveragePressure
1 12.2 7.55 7.87 50 51.072 9.1 6.39 6.59 30 29.003 15.2 5.81 5.96 70 67.744 15.2 As High As
Possible8.45 30 30.29
5 9.1 NA NA 70 NA6 12.2 As High As
Possible8.98 50 47.83
7 NA – Added Test
As High As Possible
11.53 30(b) 29.36
(a) Air Booster used to attain required pressure and flow.(b) Determined to be the optimum condition.
The slurry was washed three times with dilute caustic following the second test matrix. The total wash volume was divided into three parts and added batch-wise to the CUF. Each wash volume was approximately 900 mL. After each addition, the system was de-watered into a labeled bottle until a similar volume was removed. The wash water was added directly into the mixing tank.
After completion of the water-washing steps, the slurry was removed from the CUF and leached at 3 M NaOH in a separate vessel at 85°C for 8 h. To reach the 3 M NaOH target, 609.16 g of 7.37 M NaOH was added the slurry.
To rinse residual solids from the CUF, the slurry was pumped into the leaching beaker, and then the NaOH was added to the CUF and allowed to mix. This solution was then pumped into the leaching beaker to mix with the slurry. This resulted in a slurry with a calculated value of 5.9 wt% insoluble solids in the leaching beaker. The temperature of the slurry was raised to 85 ± 5°C and maintained there for 8 h.The slurry was continuously stirred with a mixer blade throughout the caustic leaching. Approximately 15 min before the end of the leaching period, the heat tape on the CUF was activated to pre-warm the system so that slurry could be maintained at 85 ± 5°C for the de-watering process. After 8 h, the slurry was weighed, and the amount of liquid lost through evaporation was determined. The slurry was then transferred back into the CUF for de-watering back to original solids concentration (~10 wt% solids).The amount of liquid lost through evaporation was used to rinse remaining solids out of the leach container into the CUF.
The slurry was pumped around in the CUF and heated to return its temperature to 85 ± 5°C before the de-watering process was started. Filtrate flux, TMP, temperature, and flow rate data were taken every 10 min during all de-watering steps when possible.
2.12
Following the caustic leaching steps, the solids were washed twice with 0.01 M NaOH. Each dilute caustic wash was conducted in the same manner as the caustic leach. Dilute Caustic Wash #1 consisted of 1390 g of 0.01 M NaOH added to the slurry. This produced a calculated solids concentration of ~4 wt% in the leaching beaker. The solution was heated to ~85°C and stirred for a period of 8 h, then de-watered to the pre-wash concentration. Dilute Caustic Wash #2 consisted of 1400.00 g of 0.01 M NaOH added to the slurry. The solution was heated to 85 ± 5°C and held for a period of 8 h, then de-watered at 85 ± 5°C to the pre-wash concentration. For both washes, the amount of liquid lost through evaporation was used to rinse remaining solids out of the leach container into the CUF. After the final wash, an additional ~130 mL of water was added to the system in an attempt to remove all the solids from the leaching vessel. Duplicate sub-samples of each permeate were taken and analyzed for soluble components removed.
Approximately 577 g of final washed and leached AZ-102 sludge was drained from the CUF and collected into a 1-L bottle. The CUF was rinsed once with 500 mL of DI water, and the solids were collected to be settled and recovered. The CUF was then rinsed four more times with 1000 mL of DI water, and the solids from these rinse steps were recovered to the extent possible.
It was noted in both the rheology testing and in the final collection of the material that this sludge has the capacity to retain large amounts of trapped gases (assumed to be air) when mixed in the CUF. The bottle that contained the “Final Washed Sludge” was visually full after transfer from the CUF. After settling overnight, the bottle was a little less than 2/3 full. This indicates that at the time of transfer, the material consisted of approximately 33-vol% entrained air, which was not easily removed in a short period of time.
The CUF was rinsed multiple times with water to remove all of the remaining solids and to recover the initial clean water fluxes. To assist in cleaning the filter, the water was added to the back-pulsechamber and forced backward through the filter. The wash water continued to come out of the CUF brown in color, indicating the presence of fine particles. An external cartridge filter with a 0.05-µmrating was attached to the system. Roughly 2/3 of the flow continued through the CUF, and the remaining 1/3 of the flow was circulated through the cartridge filter in an attempt to remove the remaining solids. This recirculation continued for several hours while intermittently back-pulsing. At the conclusion of this cleaning step, the filtrate flux was measured with clean water. The filtrate flux was significantly below that measured before the AZ-102 test, and it was determined that acid cleaning wouldbe required.
One liter of 1-M HNO3 was added to the CUF (about 600 mL of that was back-pulsed in) and pumped through the system. The nitric acid was then drained from the CUF and found to be very dark and full of solids. A second batch of ~600 mL of 1 M HNO3/.2 M Citric acid was added to the CUF and allowed to re-circulate through the system. This second batch of nitric acid was lighter, but still brown. The system was then rinsed until a neutral pH was obtained. The external cartridge filter with a 0.05-µm rating was reattached and run before attempting to get clean water fluxes.
The clean water flux was measured again at 20, 10, and 30 psid. The resultant fluxes over 20-mintests showed a decrease in flux with time, indicating that the system was not yet free of fines. The fluxes averaged 0.3517, 0.2259, and 0.7352 gpm/ft2, respectively. Comparing these values to the pre-AZ-102water-test values of 1.25, 0.55, and 1.54 gpm/ft2, respectively, it is obvious that pre-test conditions were

2.13
not achieved. Since this was the last test planned for the CUF, it was decided not to attempting further cleaning. However, it is expected that further cleaning would have eventually been able to achieve about an 80% recovery of pre-AZ-102 test flux capacity, based on the C-104 testing. Further cleaning in the full-scale plant may be required to maintain a high clean-water flux. In the CUF system, the acid can damage the pump stator, so less extensive cleaning is possible.
2.6 Sample Analyses
The samples and associated analyses are shown in Table 2.4. For both permeates and slurry samples, analyses included
• total organic carbon (TOC) and total inorganic carbon (TIC)
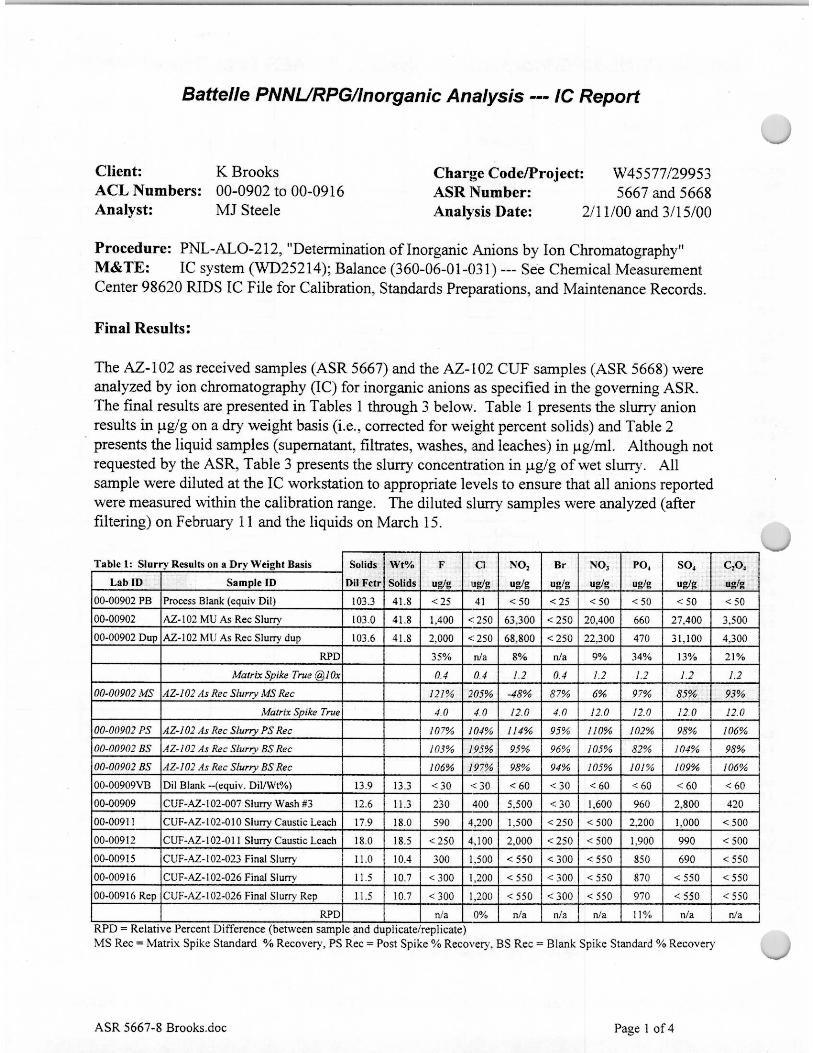
• ion chromatography (IC) (for soluble anions)
• inductively coupled plasma-atomic emission spectroscopy (ICP-AES) (for metals)
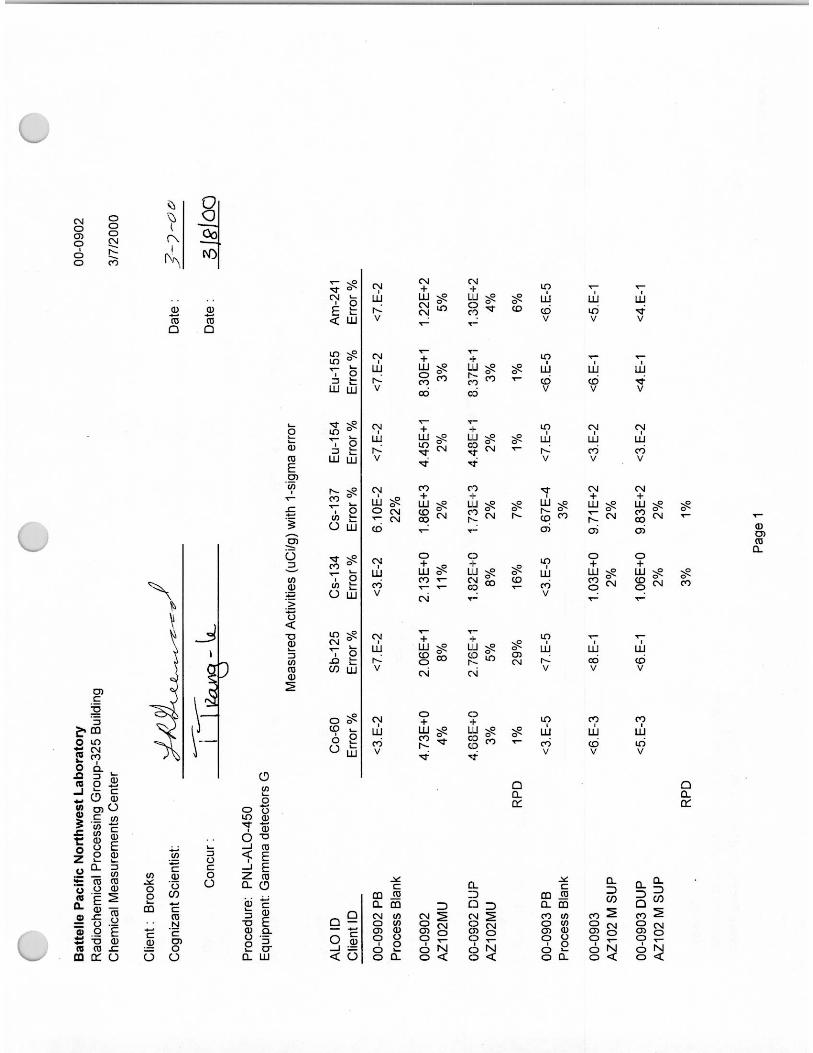
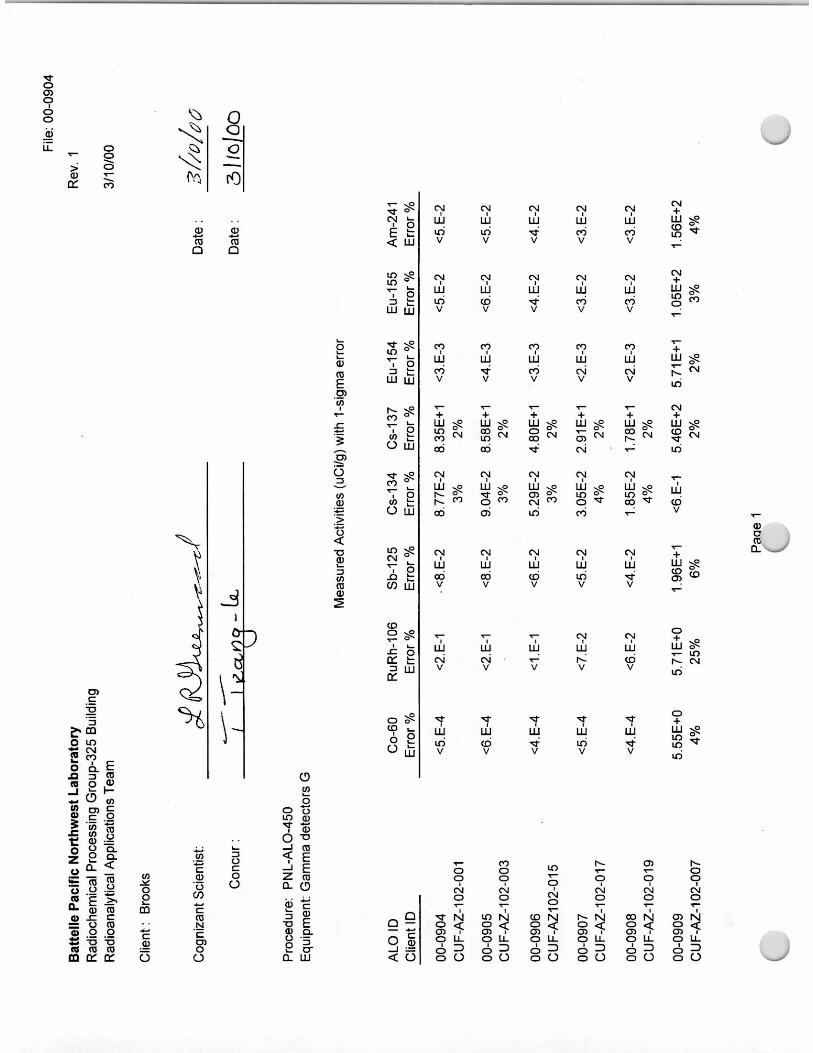
• gamma energy analysis (GEA) (137Cs, 241Am)
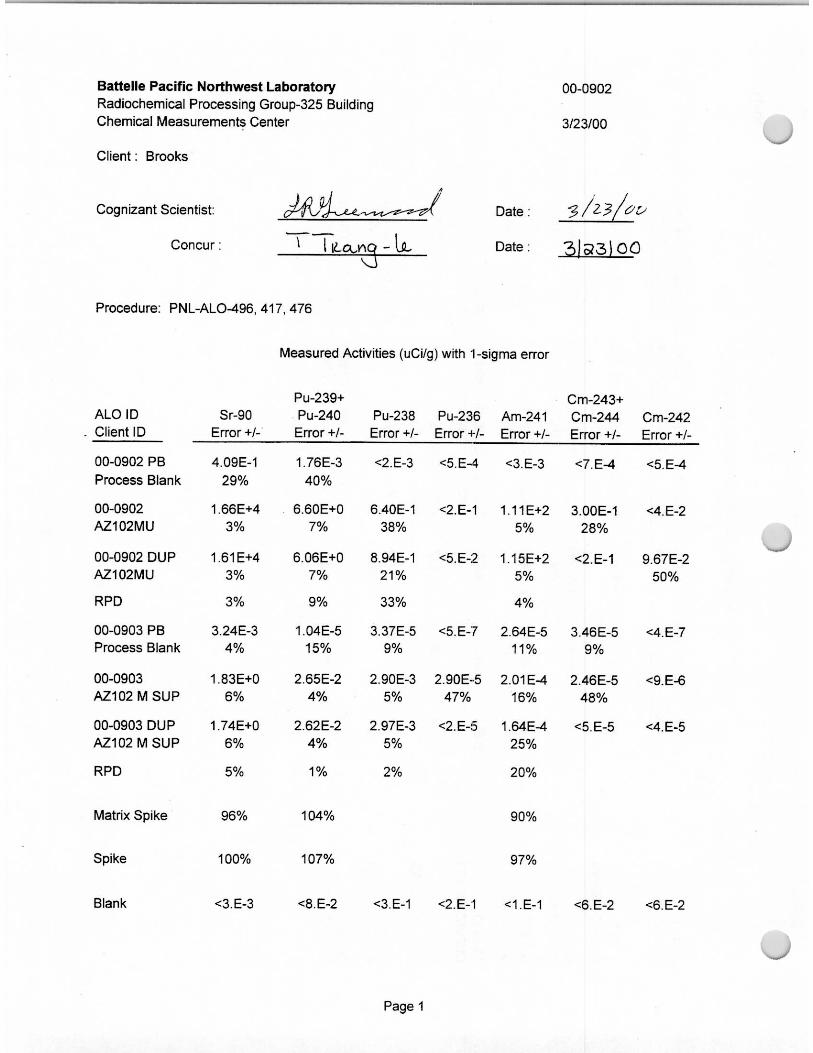
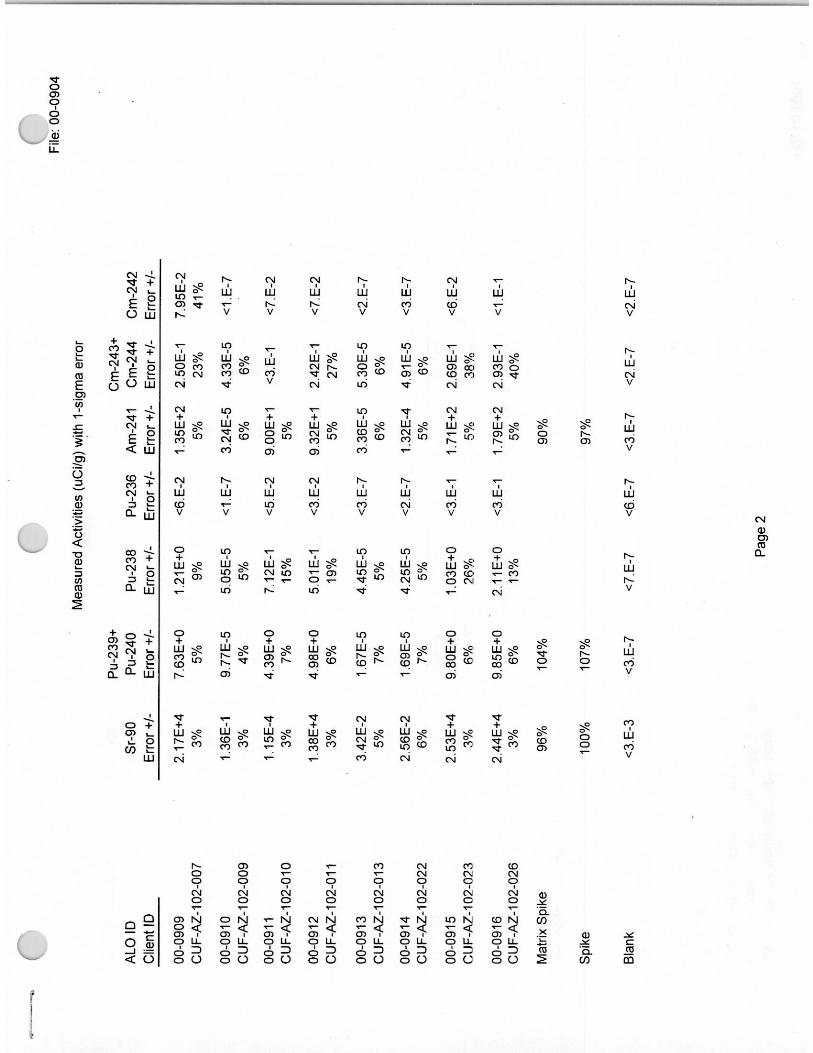
• strontium chemical separation followed by beta counting (90Sr)
• alpha emission analysis (AEA) (for 241Am, 239Pu)
• total cyanide (CN-).
The slurry samples were prepared by both acid digestion and KOH fusion to obtain complete dissolution as well as measure the K and Ni concentration.
Table 2.4. Samples and Analyses Performed
Sampling Step Sampling Number Sample Type AnalysisAZ-102 MU PSDAZ-102 MU Physical Properties
Initial SludgeComposite
AZ-102 MUSludge
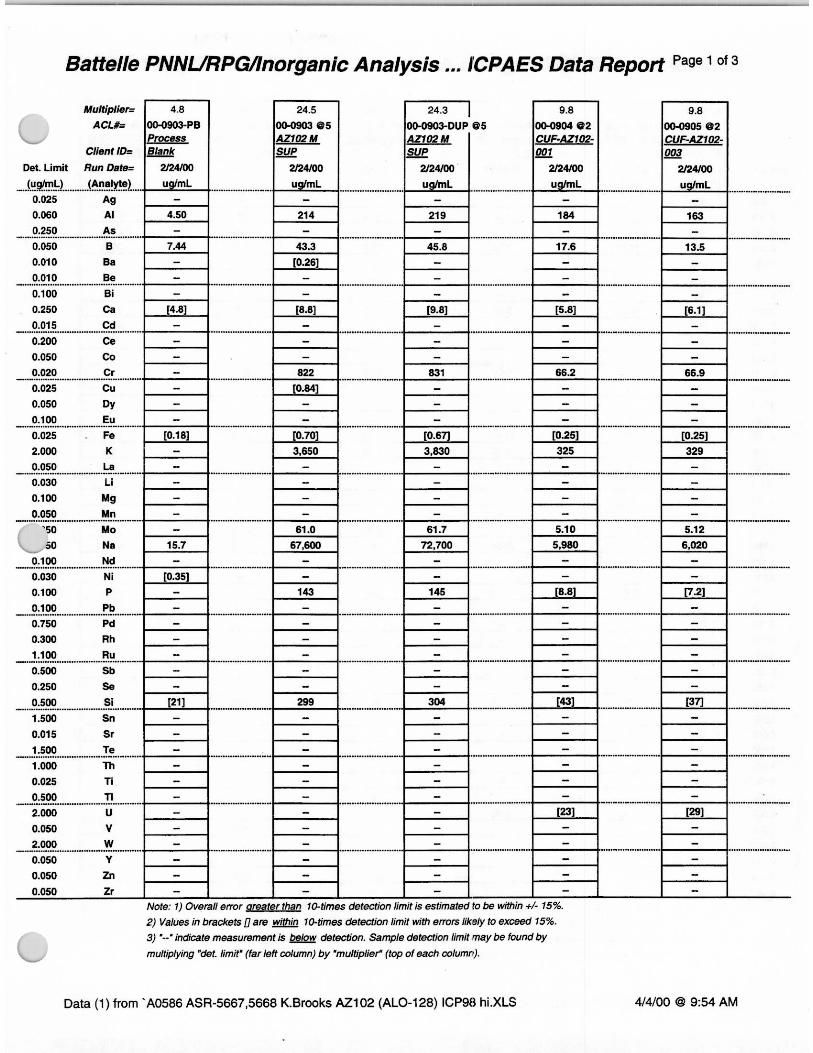
Chemical and RadiochemicalInitial Decanted Supernatant
AZ-102 MU SUP Supernatant Chemical and Radiochemical
First De-WateringAfter Matrix 1
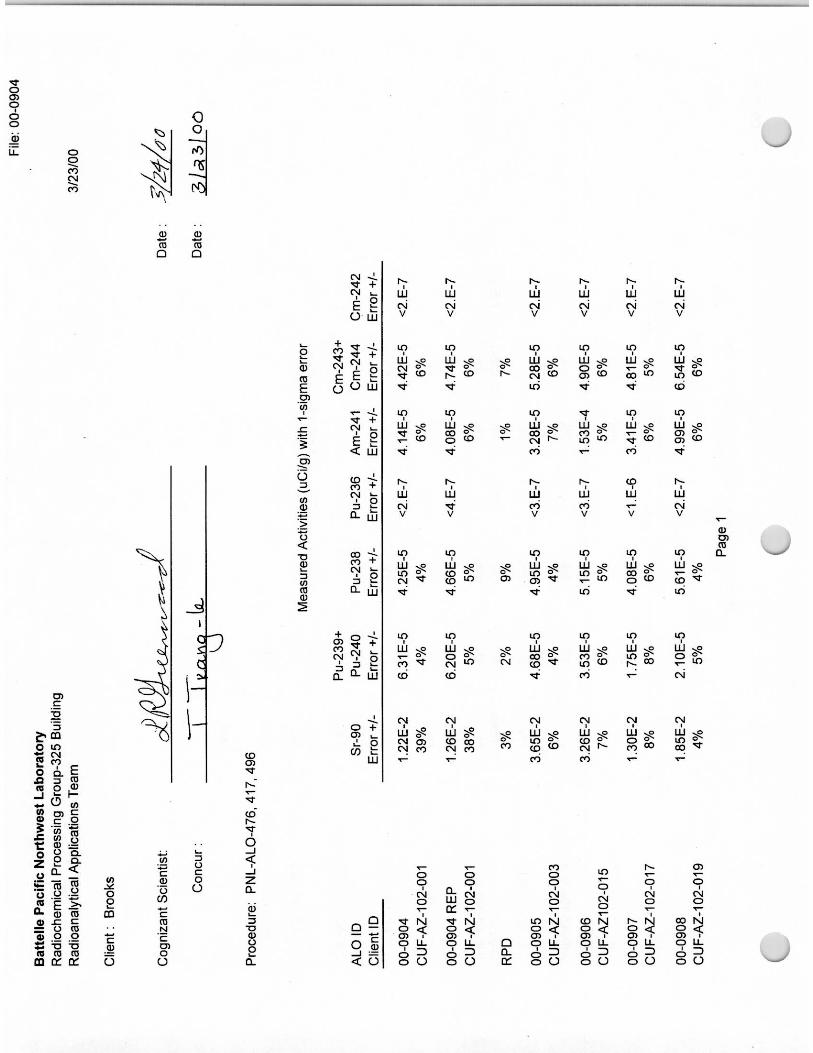
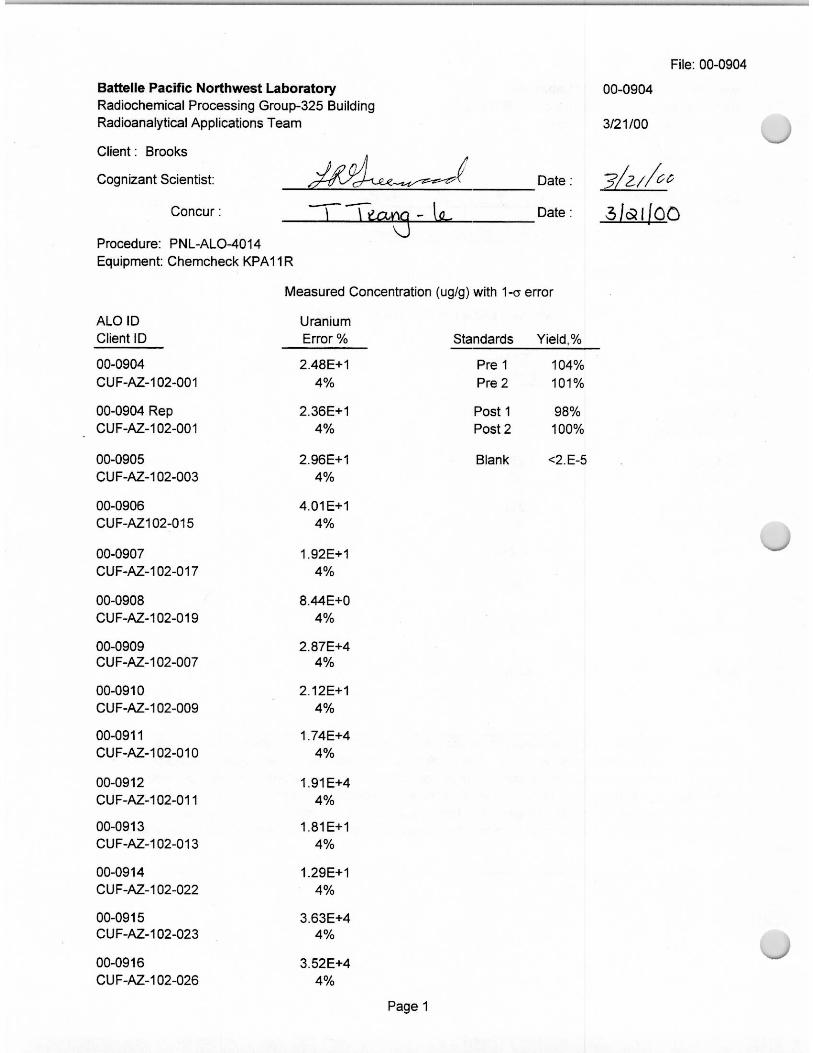
CUF-AZ-102-001 Permeate Chemical and Radiochemical
Second De-WateringAfter Matrix 1
CUF-AZ-102-003 Permeate Chemical and Radiochemical
CUF-AZ-102-005 Physical PropertiesDewatered Slurry (Before Matrix 2) CUF-AZ-102-006
SlurryPSD
Dewatered Slurry(After Matrix 2)
NA Slurry Rheology
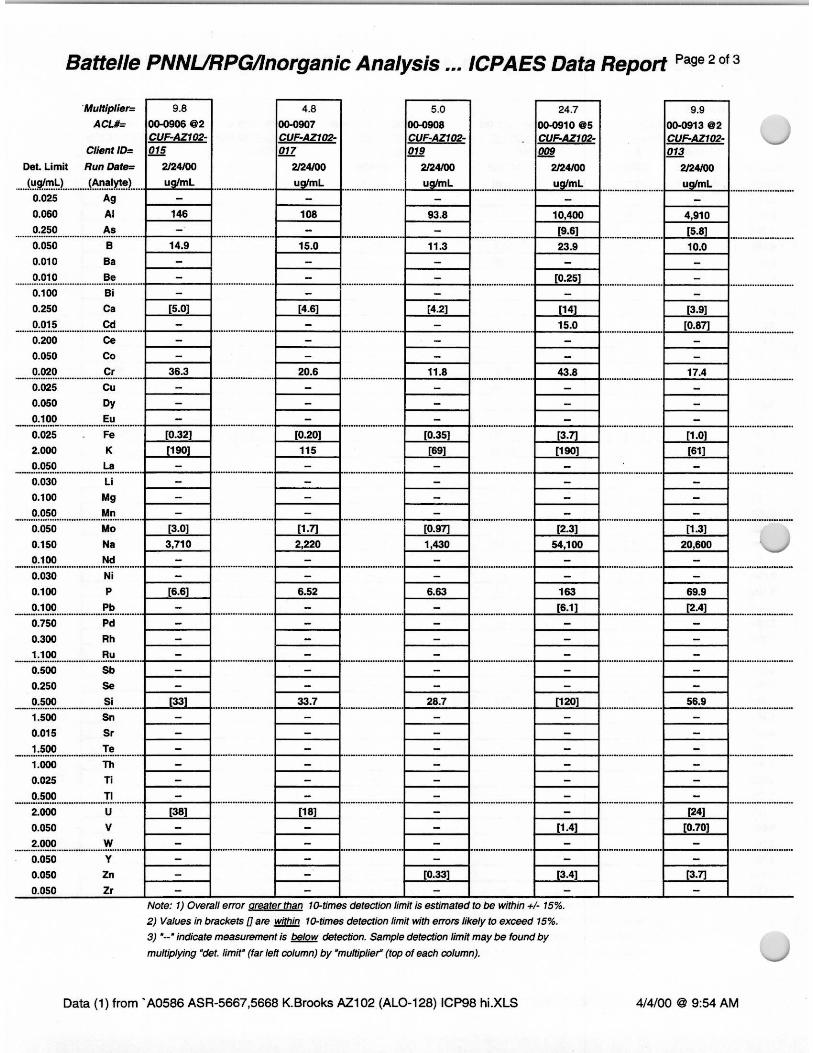
Water Wash 1 CUF- AZ-102-015 Permeate Chemical and RadiochemicalWater Wash 2 CUF- AZ-102-017 Permeate Chemical and RadiochemicalWater Wash 3 CUF- AZ-102-019 Permeate Chemical and RadiochemicalWashed Slurry CUF- AZ-102-007 Slurry Chemical and Radiochemical
2.14
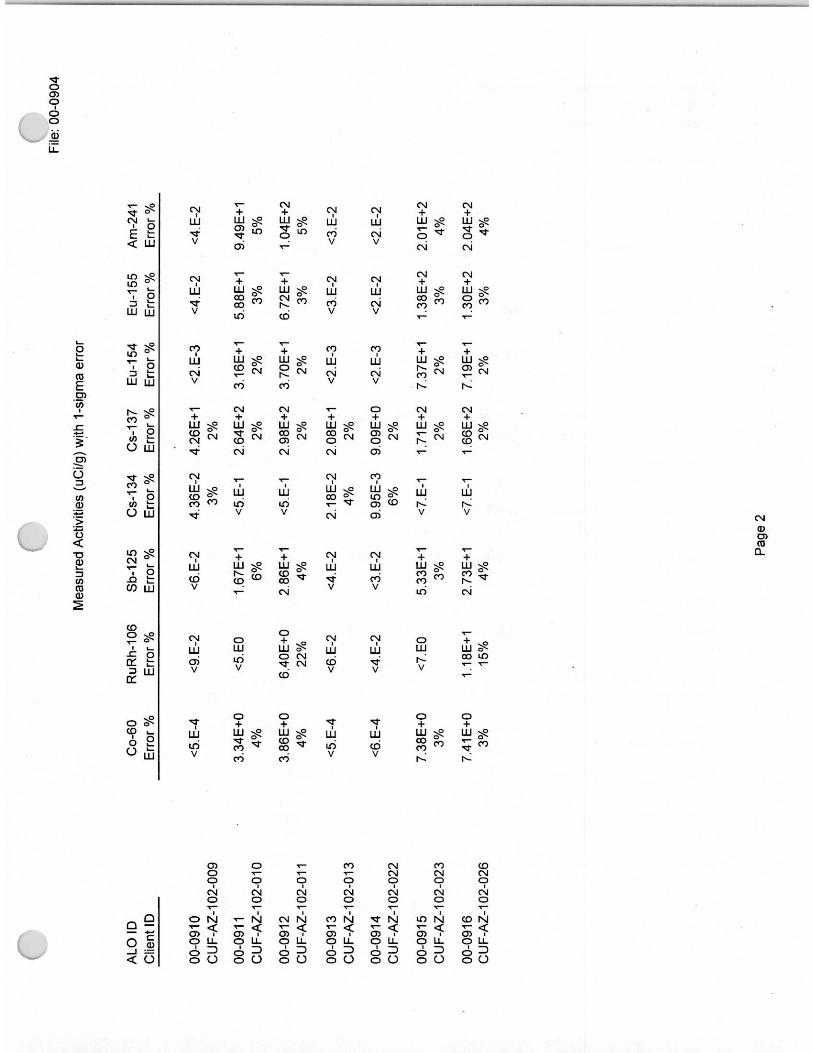
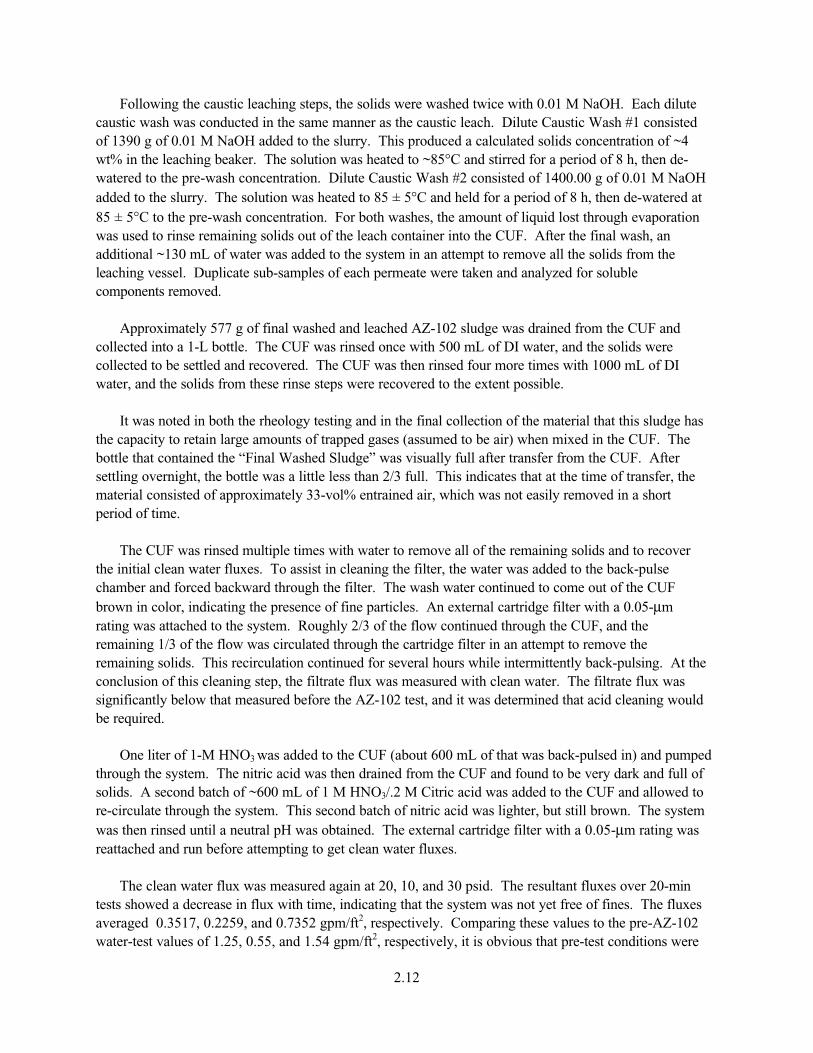
Sampling Step Sampling Number Sample Type AnalysisCaustic Leach CUF- AZ-102-009 Permeate Chemical and Radiochemical
CUF- AZ-102-010CUF- AZ-102-011
Chemical and RadiochemicalAfter Caustic Leach
CUF- AZ-102-012Slurry
Physical Properties
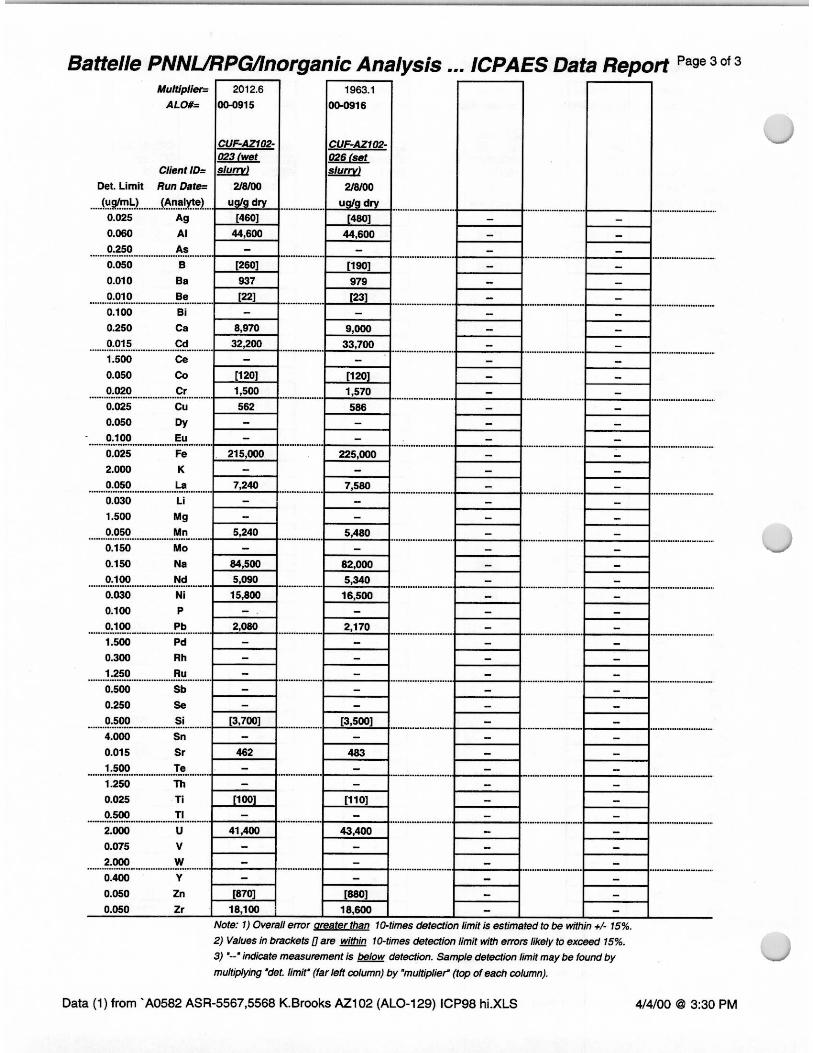
Caustic Wash 1 CUF- AZ-102-013 Permeate Chemical and RadiochemicalCaustic Wash 2 CUF- AZ-102-022 Permeate Chemical and Radiochemical
CUF- AZ-102-024 PSD
CUF- AZ-102-023CUF- AZ-102-026
Chemical and RadiochemicalFinal Slurry
CUF- AZ-102-025and Final Rheology
Slurry
Rheology & Physical Properties
Final DecantedSupernatant
CUF- AZ-102-027 PermeateAcid Digest/ICP-AES (for Na)
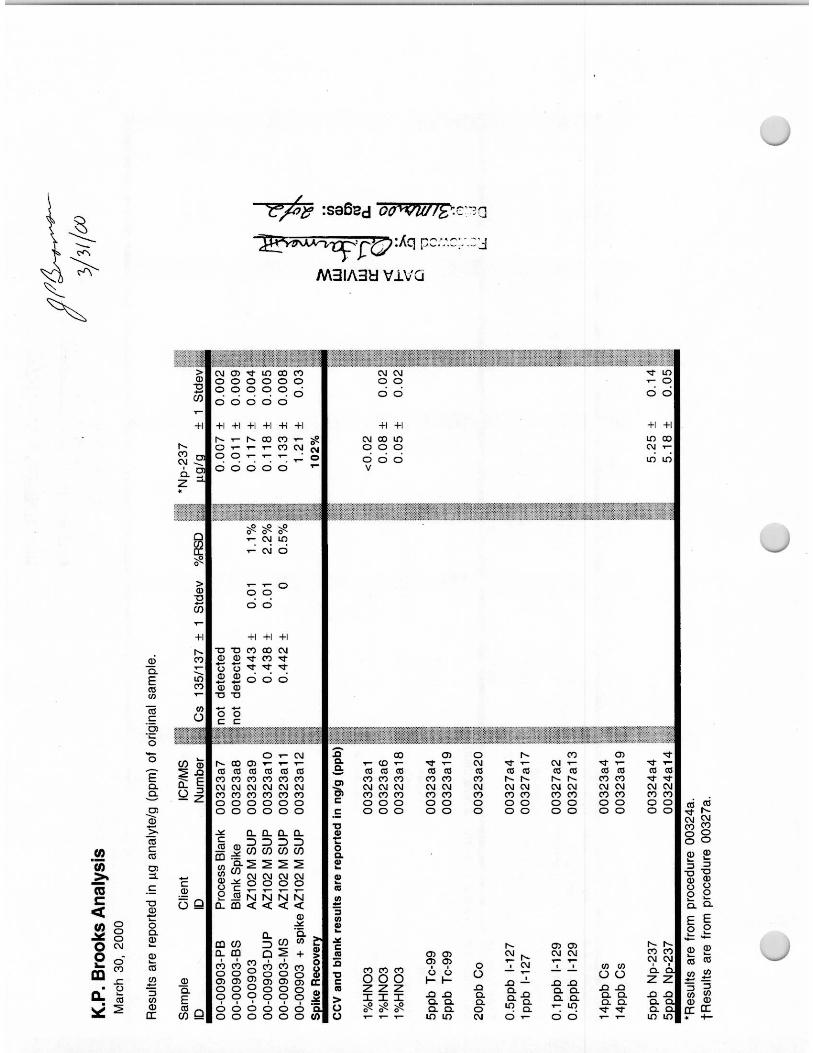
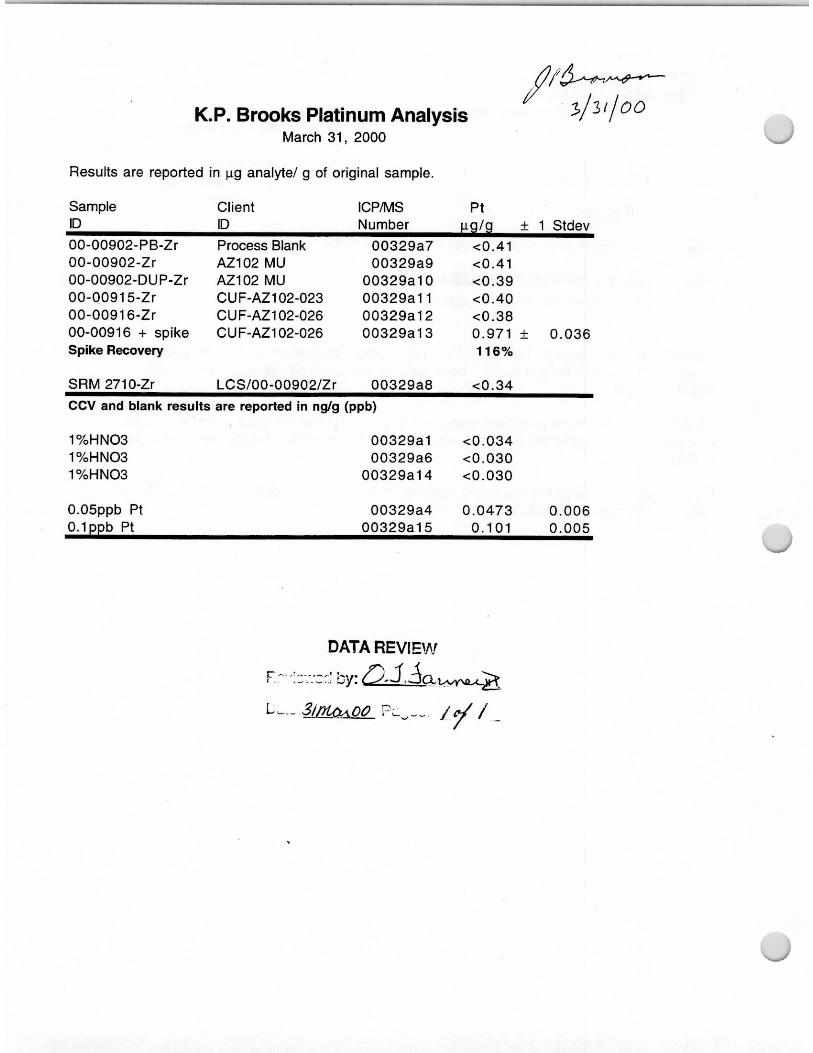
In addition to the above analysis, several additional analyses were performed on the composited initial and final slurry. For these two slurries, a precious metals group (PMG) fusion was also performed to obtain the Pt concentration in the slurry. The additional analysis for these slurry samples included
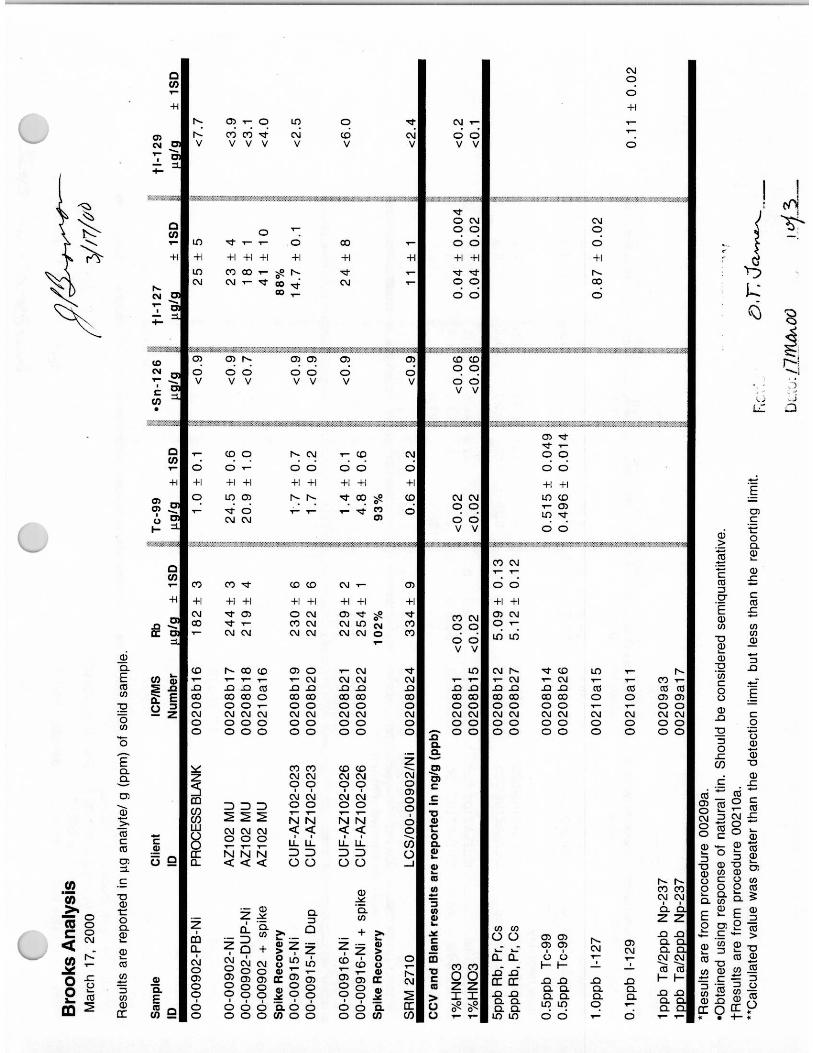
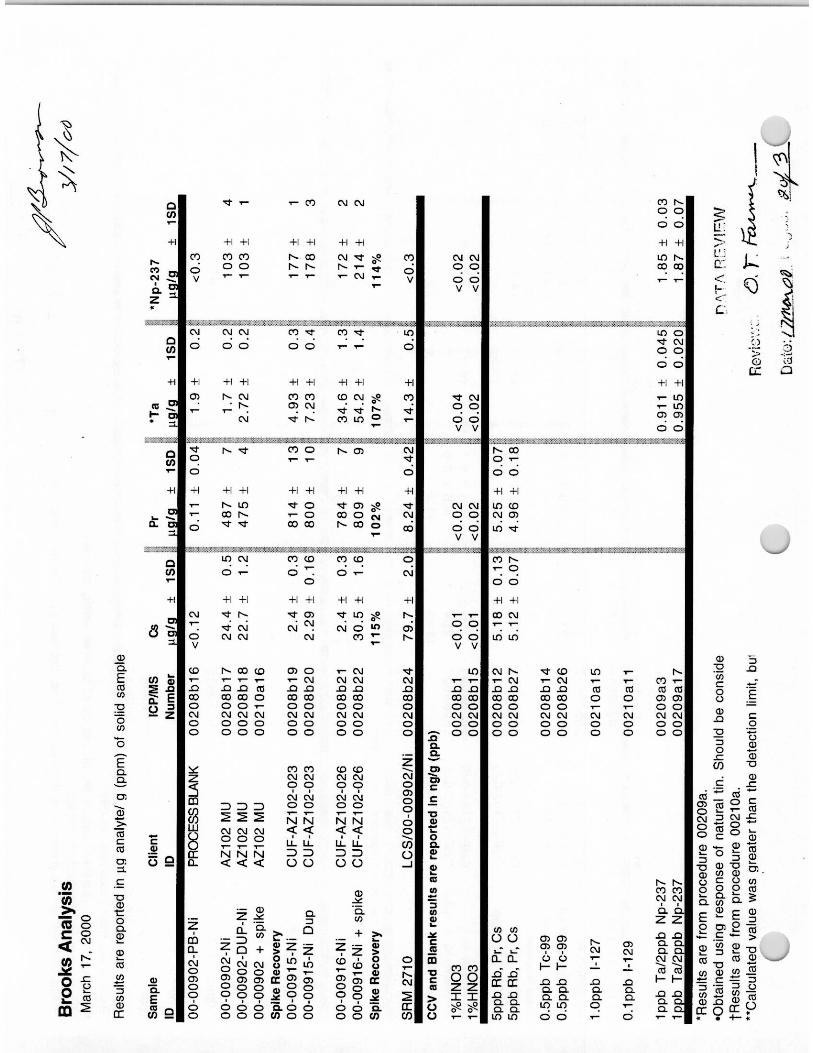
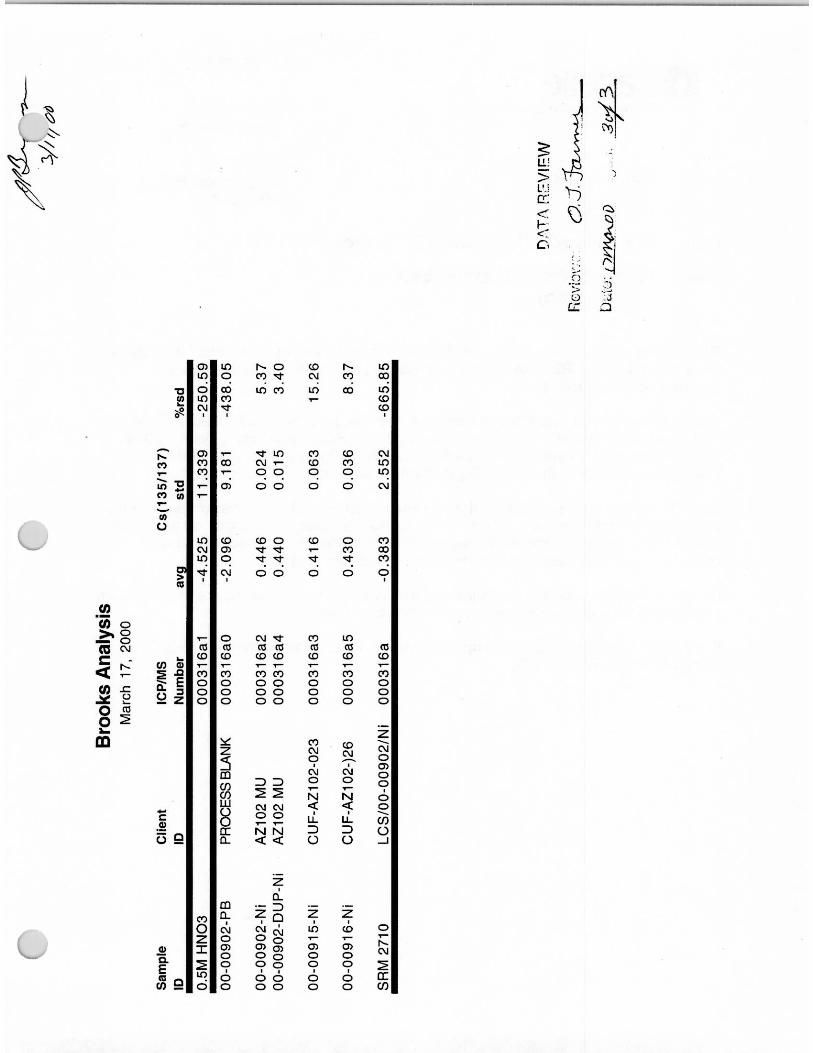
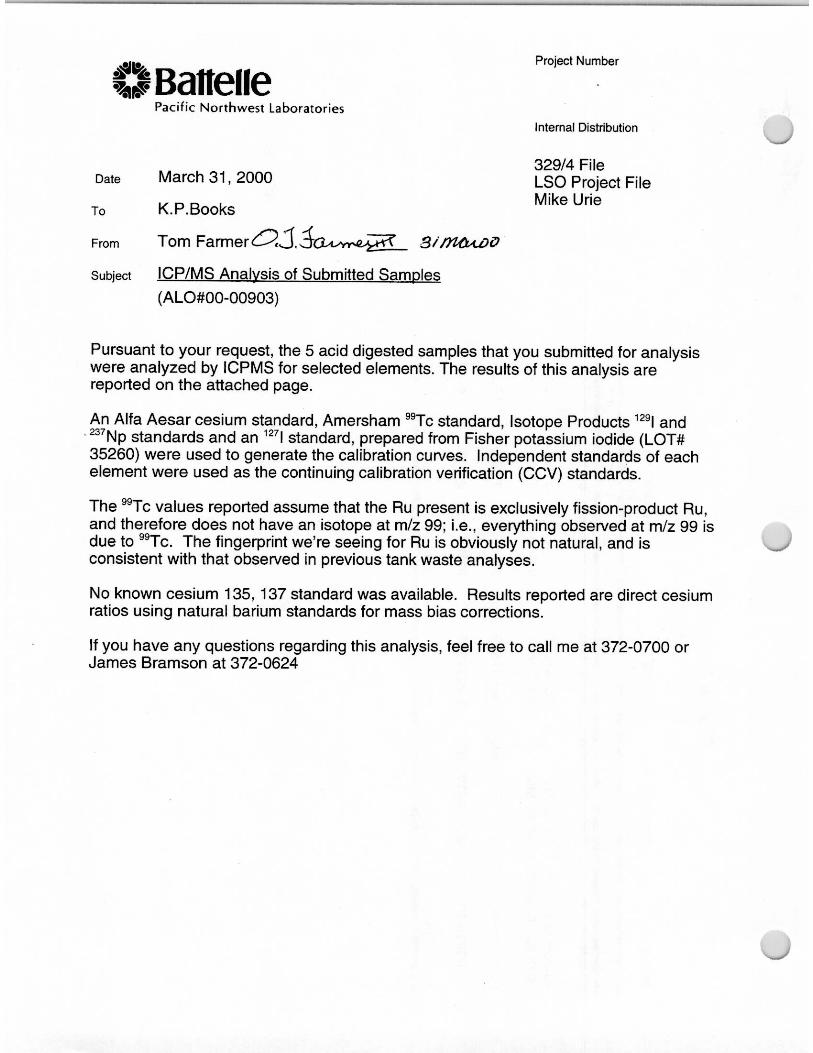
• inductively coupled plasma-mass spectrometry (ICP-MS) (for 237Np, 126Sn, 129I, 99Tc, Pr, Rb, Ta, Pt)
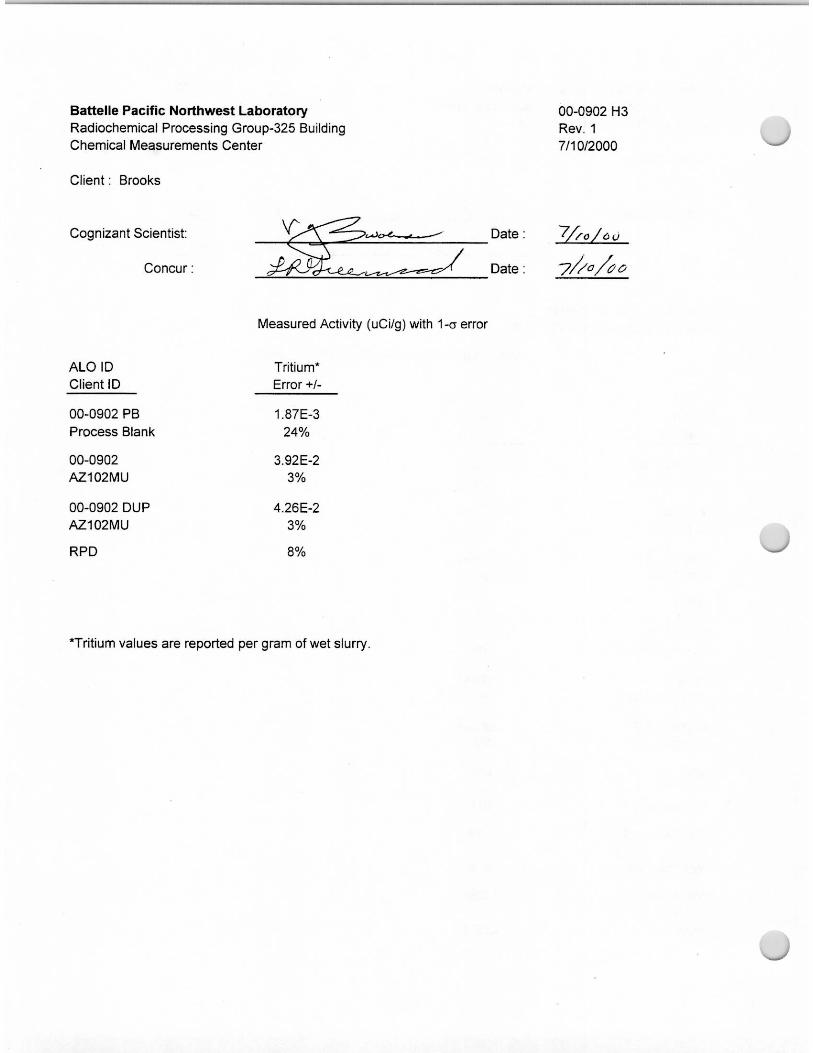
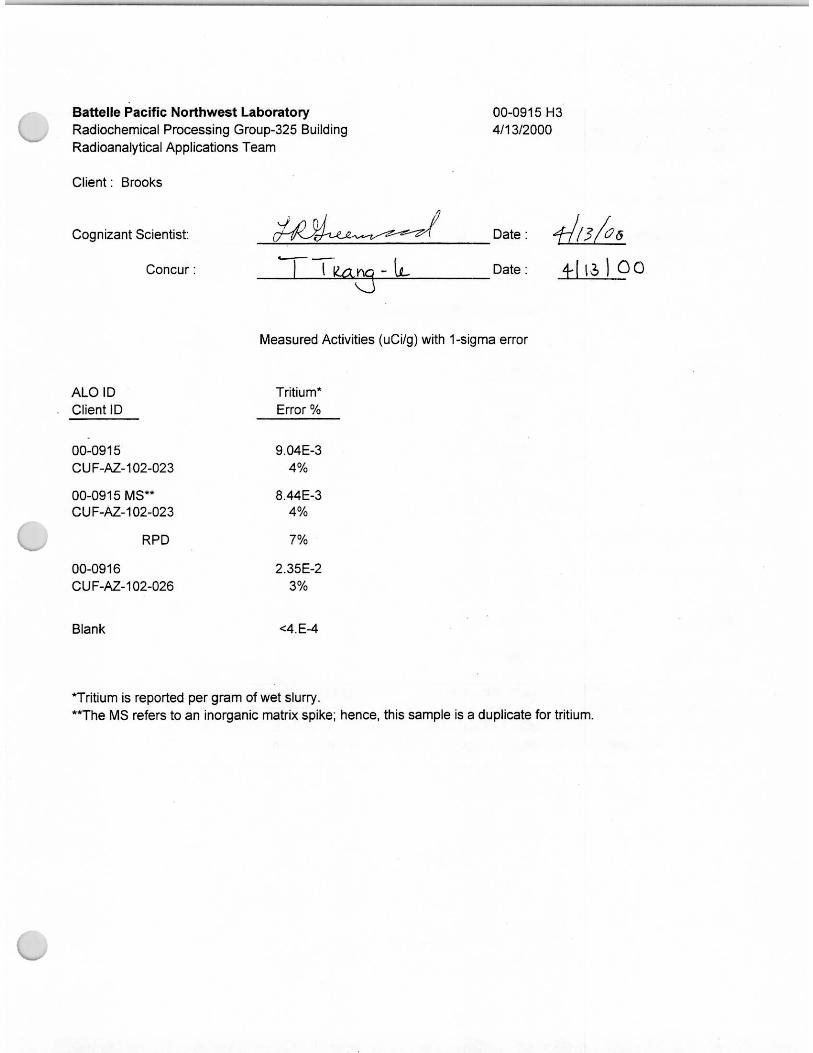
• extraction and Beta Count for 3H
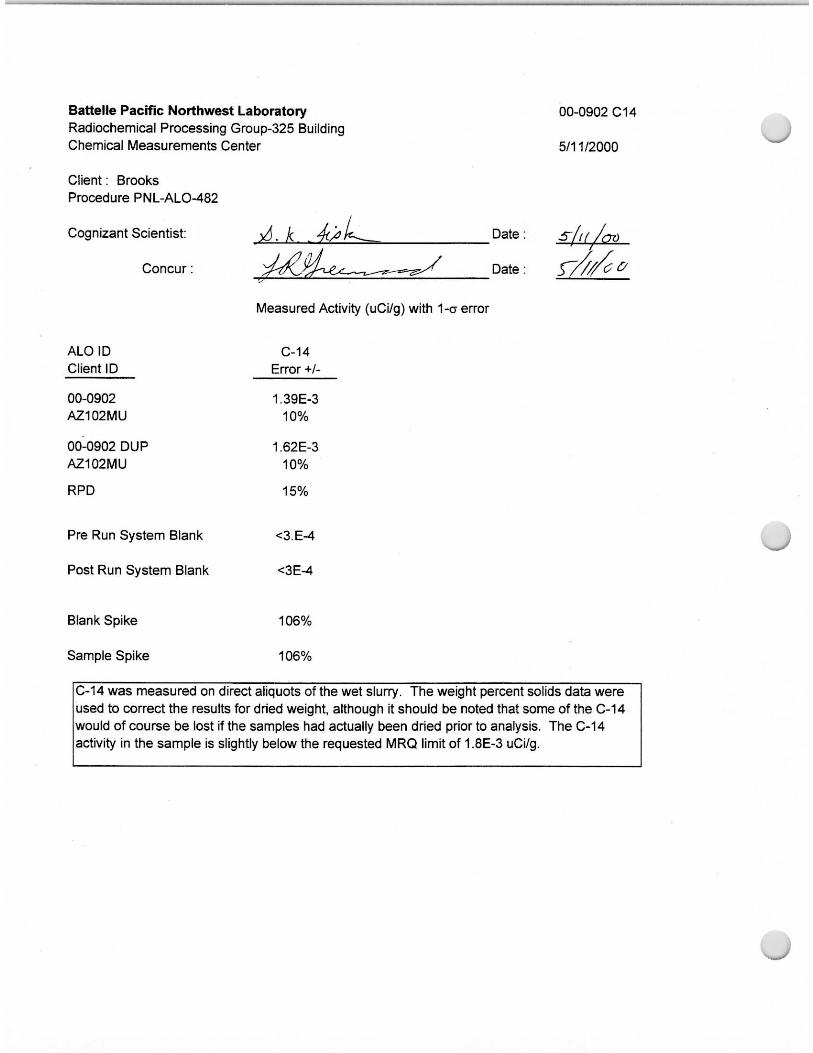
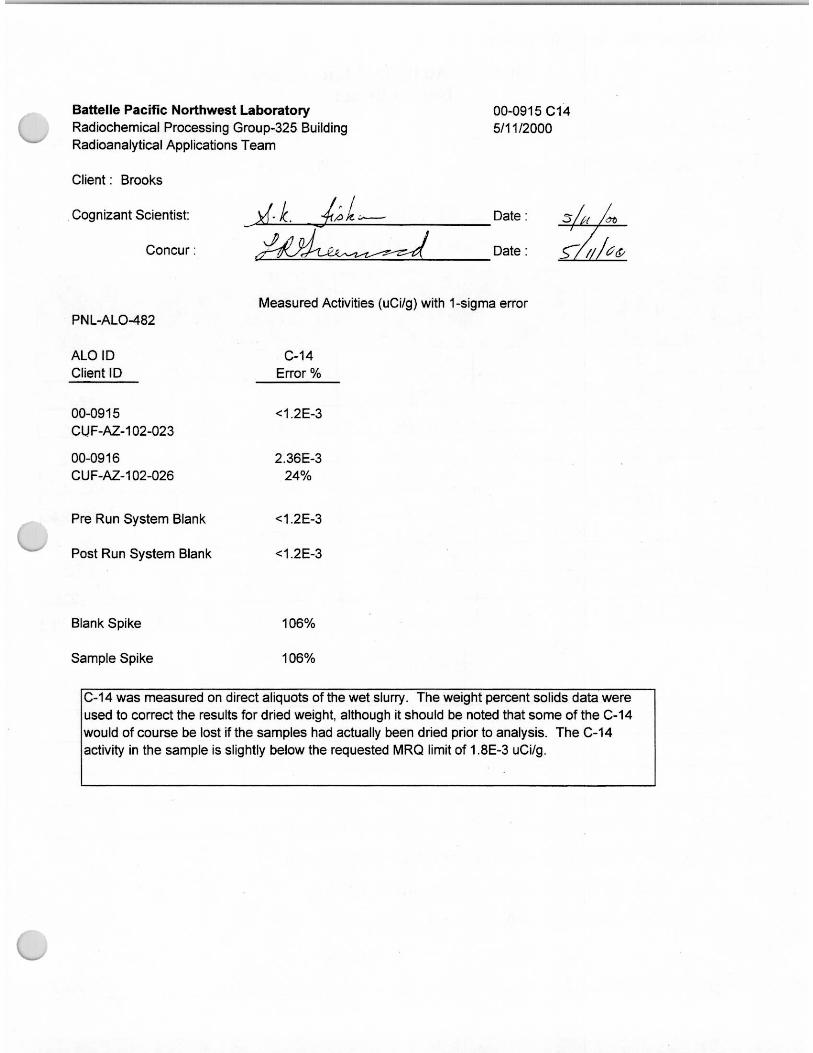
• combustion release and beta count (for 14C)
• cold vapor atomic adsorption spectroscopy (for Hg)
• ammonia concentration.
In addition to the analysis performed with the permeates, the original sample decanted supernatant analysis included the following:
• ICP-MS (for 237Np, 129I, 99Tc)
• cold vapor atomic adsorption spectroscopy (for Hg)
• separations and beta counting for 99Tc
• ammonia concentration.
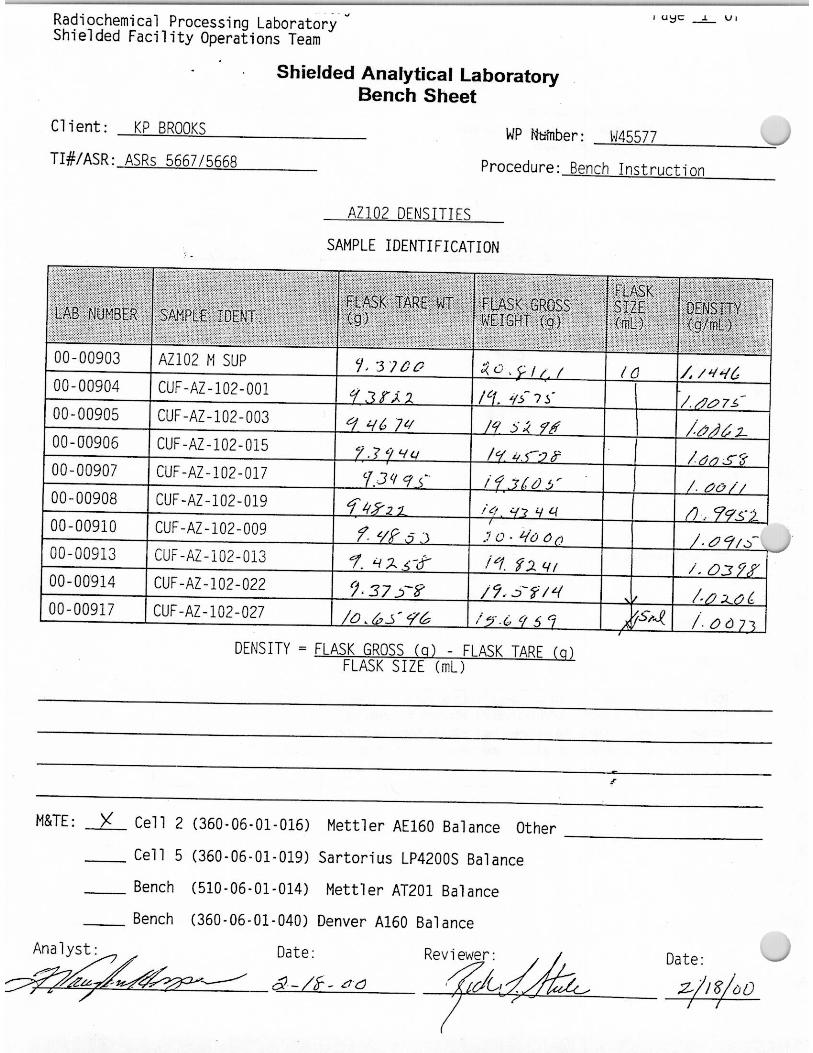
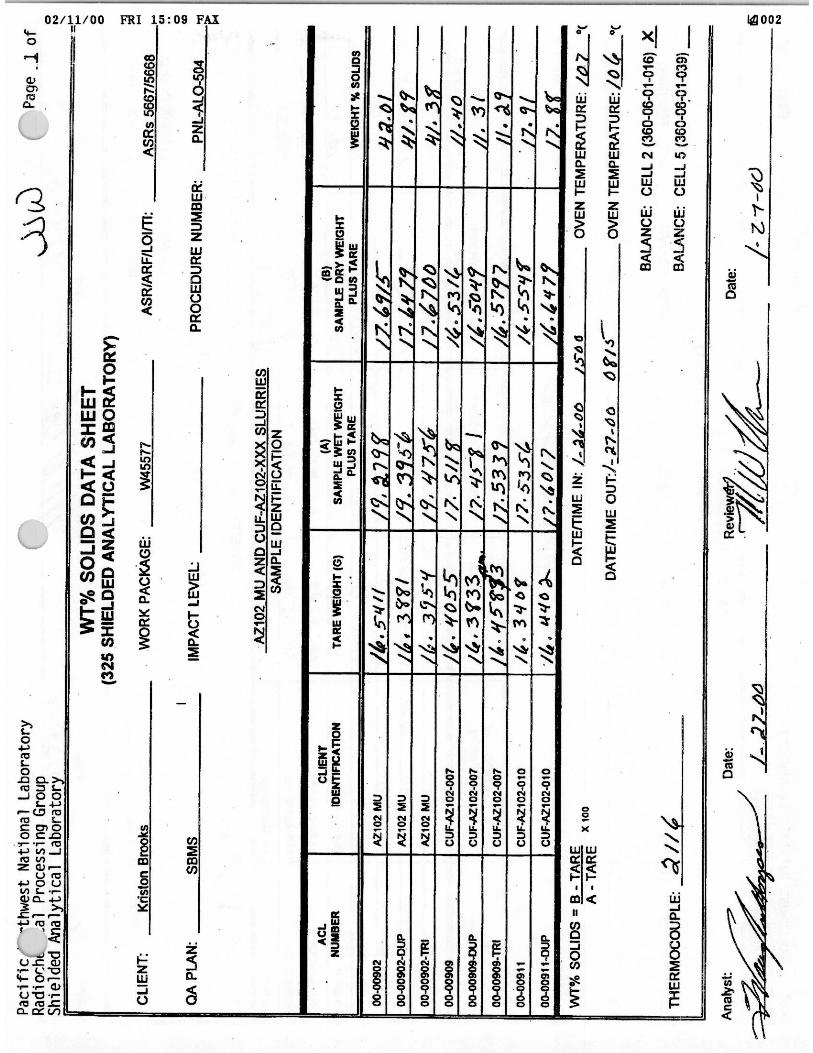
The physical analyses of the slurries included density, weight percent dissolved and total solids, and volume percent settled and centrifuged solids. The results of these analyses, along with a further description of the experimental steps, are provided in Section 4.0. The rheological work measured shear stress as a function of shear rate. The particle size distribution (PSD) measurements were performed for selected samples using Microtrac X-100 and Microtrac UPA particle analyzers. The results of this work along with further description of the experimental steps are provided in Section 5.0.
3.1
3.0 Ultrafiltration and Washing Results
This section is divided into two subsections: crossflow filtration results, and dilute caustic-washingand caustic-leaching results. The physical property and rheological results, and the particle size distribution results are presented in Sections 4.0 and 5.0, respectively
3.1 Crossflow Filtration Results
Two crossflow filtration matrices were conducted at low and high solids loading. During these matricies, filtrate fluxes were measured. Filtrate fluxes were also measured during the washing and leaching steps. These results are presented in the sections below.
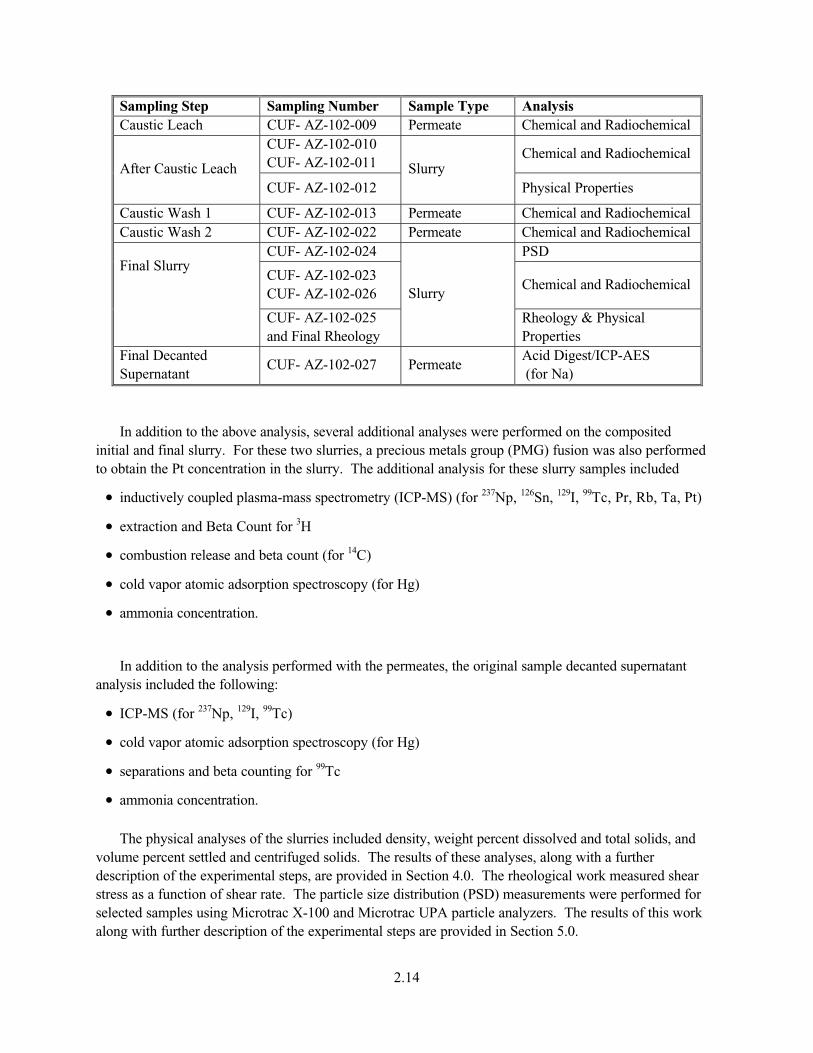
3.1.1 Low Solids Loading Matrix Results
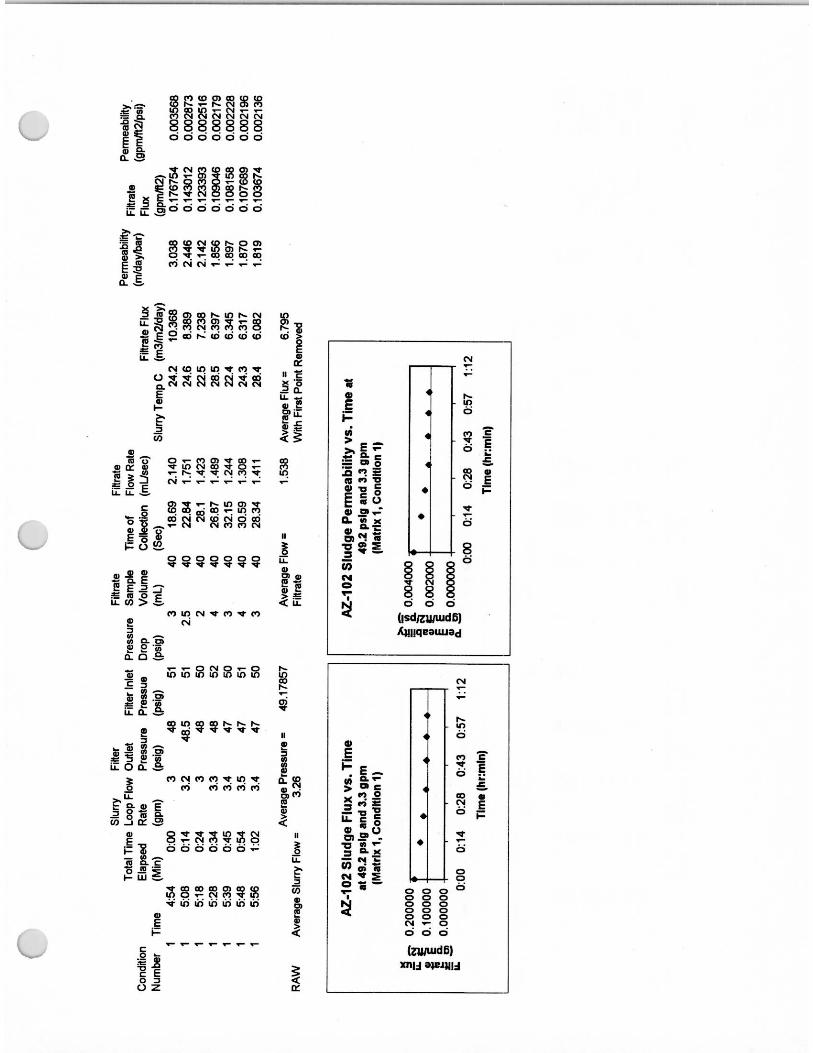
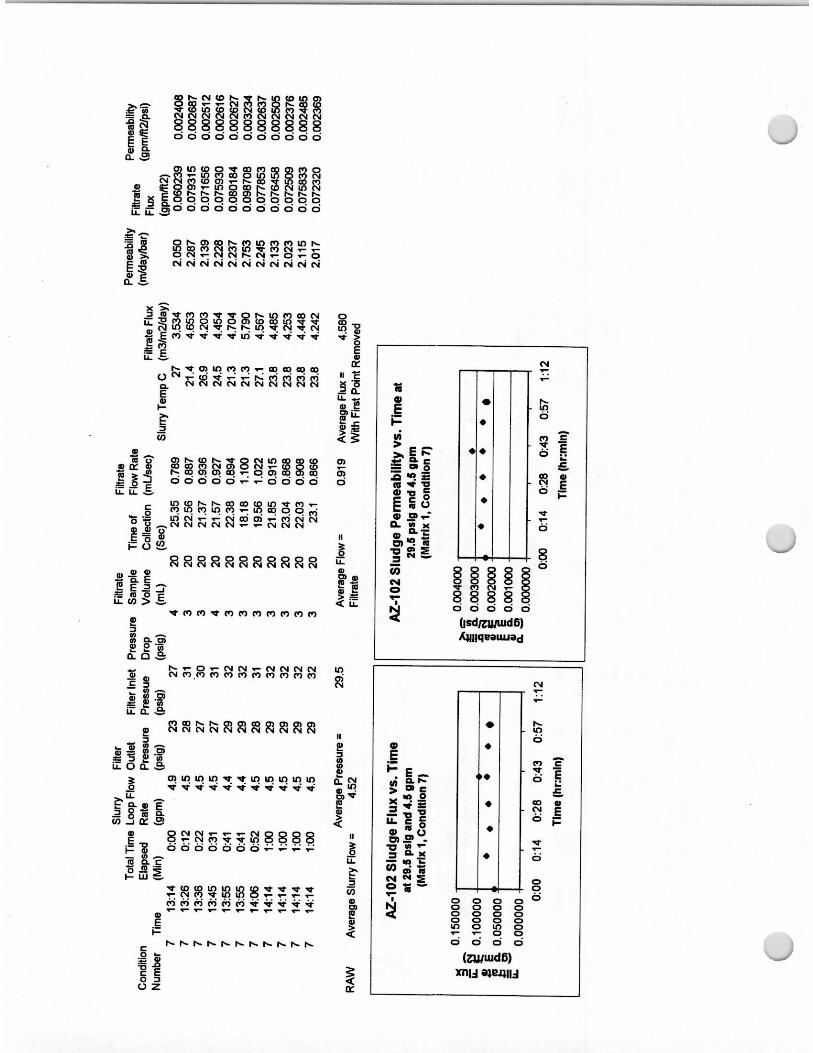
The low solids loading matrix consisted of six conditions. All were performed at 5.1-wt% insoluble solids concentration, and each was 1 hour in duration. The average filtrate fluxes from these conditions are shown in Table 3.1. As mentioned in Section 2.5, Condition 5 was not performed for this matrix. A graph of the filtrate flux as a function of time for all seven conditions is shown in Figure 3.1. The high initial flux rates drop within a few minutes to a lower, more consistent flux rate that slowly decreases over time. For comparison of test conditions, the flux rate was averaged over the 1-h run time, except for the first 10 min of operation. All the flux data presented in this section have been corrected to 25°C using the following formula provided by BNFL to correct for viscosity and surface tension changes:
(3.1)
where Flux25C is the corrected filtrate flux, and T is the temperature (in °C) at the flux measurement (FluxT). All of the raw data for the filtrate flux measurements are included in Appendix D.
Table 3.1. Average Filtrate Flux for Low Solids Matrix (~5.1 wt%)
Condition #Average
Velocity (ft/s)Average Pressure
(psid)Average Filtrate
Flux (gpm/ft2)1 9.5 49.1 0.1262 7.6 30.0 0.0823 7.1 70.3 0.0464 8.0 30.4 0.0555 NA NA NA6 8.6 51.4 0.0717 13.1 29.5 0.078
NA = Not performed
−
+= 298
1
273
12500
25T
TC eFluxFlux
3.2
Figure 3.1. Filtrate Flux as a Function of Time for the Low Solids Matrix
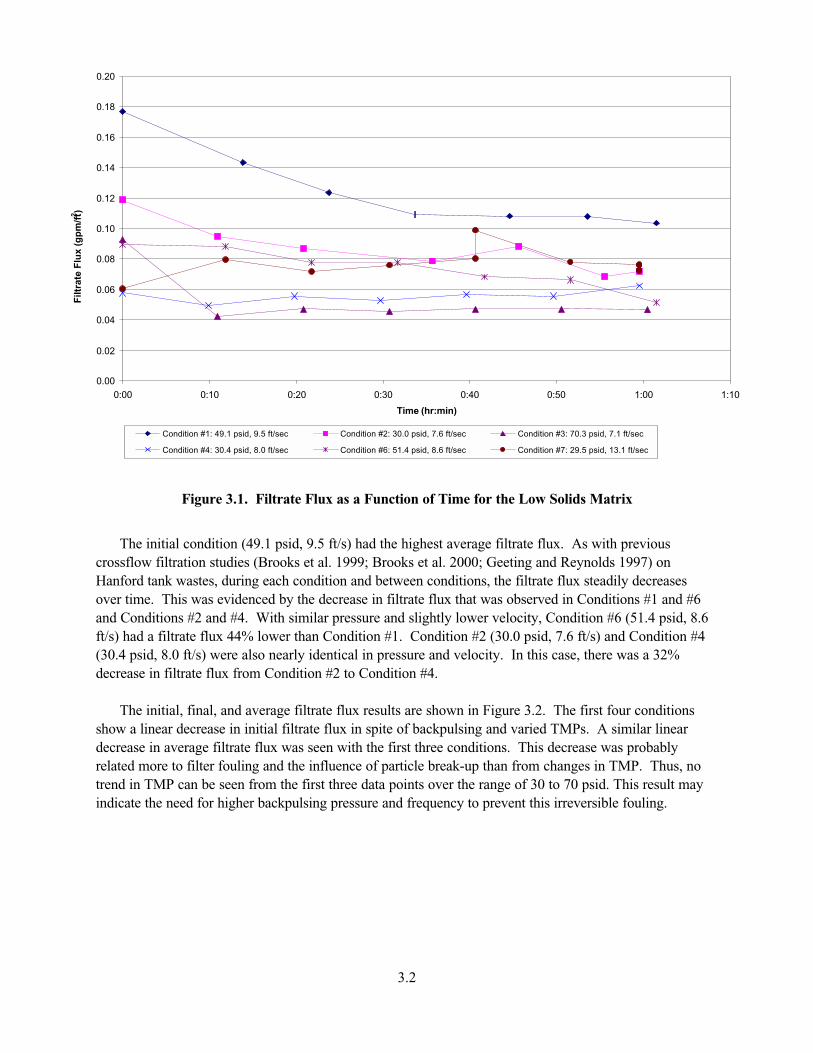
The initial condition (49.1 psid, 9.5 ft/s) had the highest average filtrate flux. As with previous crossflow filtration studies (Brooks et al. 1999; Brooks et al. 2000; Geeting and Reynolds 1997) on Hanford tank wastes, during each condition and between conditions, the filtrate flux steadily decreases over time. This was evidenced by the decrease in filtrate flux that was observed in Conditions #1 and #6 and Conditions #2 and #4. With similar pressure and slightly lower velocity, Condition #6 (51.4 psid, 8.6 ft/s) had a filtrate flux 44% lower than Condition #1. Condition #2 (30.0 psid, 7.6 ft/s) and Condition #4 (30.4 psid, 8.0 ft/s) were also nearly identical in pressure and velocity. In this case, there was a 32% decrease in filtrate flux from Condition #2 to Condition #4.
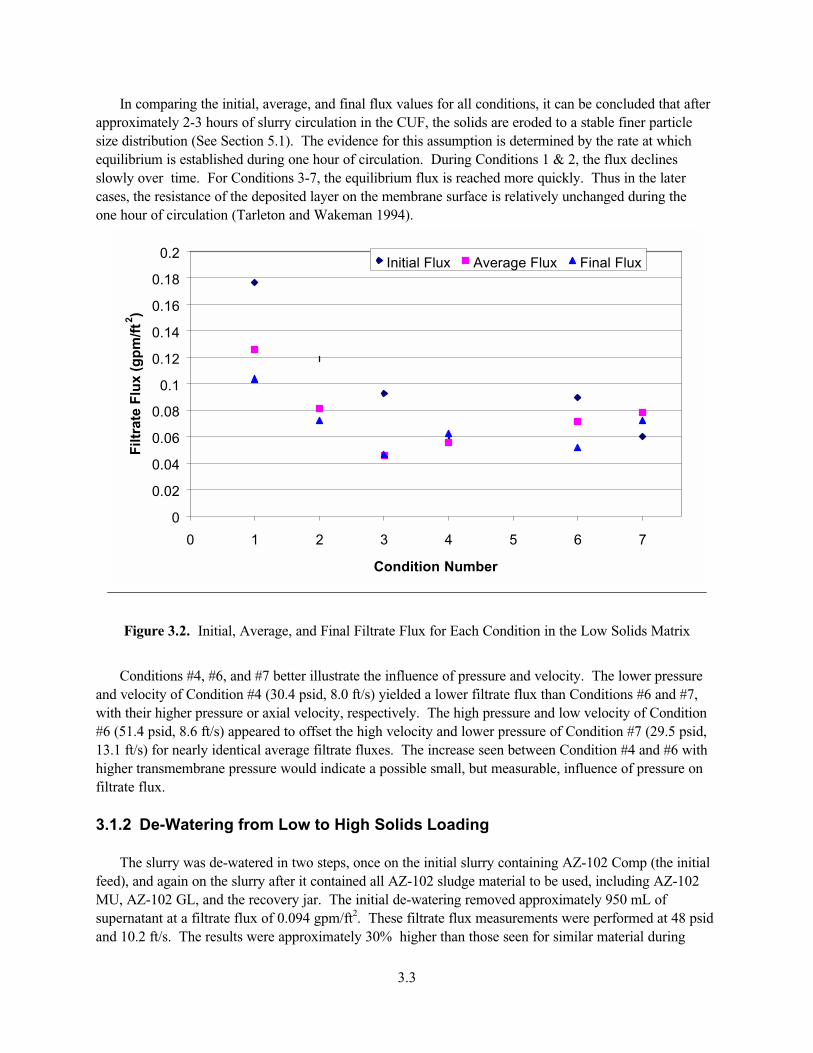
The initial, final, and average filtrate flux results are shown in Figure 3.2. The first four conditions show a linear decrease in initial filtrate flux in spite of backpulsing and varied TMPs. A similar linear decrease in average filtrate flux was seen with the first three conditions. This decrease was probably related more to filter fouling and the influence of particle break-up than from changes in TMP. Thus, no trend in TMP can be seen from the first three data points over the range of 30 to 70 psid. This result may indicate the need for higher backpulsing pressure and frequency to prevent this irreversible fouling.
0.00
0.02
0.04
0.06
0.08
0.10
0.12
0.14
0.16
0.18
0.20
0:00 0:10 0:20 0:30 0:40 0:50 1:00 1:10
Time (hr:min)
Filt
rate
Flu
x (g
pm
/ft2 )
Condition #1: 49.1 psid, 9.5 ft/sec Condition #2: 30.0 psid, 7.6 ft/sec Condition #3: 70.3 psid, 7.1 ft/sec
Condition #4: 30.4 psid, 8.0 ft/sec Condition #6: 51.4 psid, 8.6 ft/sec Condition #7: 29.5 psid, 13.1 ft/sec
3.3
In comparing the initial, average, and final flux values for all conditions, it can be concluded that after approximately 2-3 hours of slurry circulation in the CUF, the solids are eroded to a stable finer particle size distribution (See Section 5.1). The evidence for this assumption is determined by the rate at which equilibrium is established during one hour of circulation. During Conditions 1 & 2, the flux declines slowly over time. For Conditions 3-7, the equilibrium flux is reached more quickly. Thus in the latercases, the resistance of the deposited layer on the membrane surface is relatively unchanged during the one hour of circulation (Tarleton and Wakeman 1994).
0
0.02
0.04
0.06
0.08
0.1
0.12
0.14
0.16
0.18
0.2
0 1 2 3 4 5 6 7
Condition Number
Filt
rate
Flu
x (g
pm
/ft2 )
Initial Flux Average Flux Final Flux
Figure 3.2. Initial, Average, and Final Filtrate Flux for Each Condition in the Low Solids Matrix
Conditions #4, #6, and #7 better illustrate the influence of pressure and velocity. The lower pressure and velocity of Condition #4 (30.4 psid, 8.0 ft/s) yielded a lower filtrate flux than Conditions #6 and #7, with their higher pressure or axial velocity, respectively. The high pressure and low velocity of Condition #6 (51.4 psid, 8.6 ft/s) appeared to offset the high velocity and lower pressure of Condition #7 (29.5 psid, 13.1 ft/s) for nearly identical average filtrate fluxes. The increase seen between Condition #4 and #6 with higher transmembrane pressure would indicate a possible small, but measurable, influence of pressure on filtrate flux.
3.1.2 De-Watering from Low to High Solids Loading
The slurry was de-watered in two steps, once on the initial slurry containing AZ-102 Comp (the initial feed), and again on the slurry after it contained all AZ-102 sludge material to be used, including AZ-102MU, AZ-102 GL, and the recovery jar. The initial de-watering removed approximately 950 mL of supernatant at a filtrate flux of 0.094 gpm/ft2. These filtrate flux measurements were performed at 48 psid and 10.2 ft/s. The results were approximately 30% higher than those seen for similar material during
3.4
Condition #6. The solids concentration varied from 5.1 wt% to approximately 9.2 wt% solids during the dewatering step. This increase in filtrate flux in spite of the higher solids loading may be the result of the higher axial velocity (10.2 ft/s vs. 8.6 ft/s). The second de-watering step removed an additional 730 mL of supernatant. The TMP was very similar to the first dewatering step, but the average axial velocity was much lower (5.7 vs. 10.2 ft/s) and decreased over time (from 7.3 to 4.3 ft/s). The filtrate flux for this step decreased from 0.067 to 0.024 gpm/ft2. During this de-watering, the solids concentration increased from an estimated 8.7- to 13.7-wt% solids.
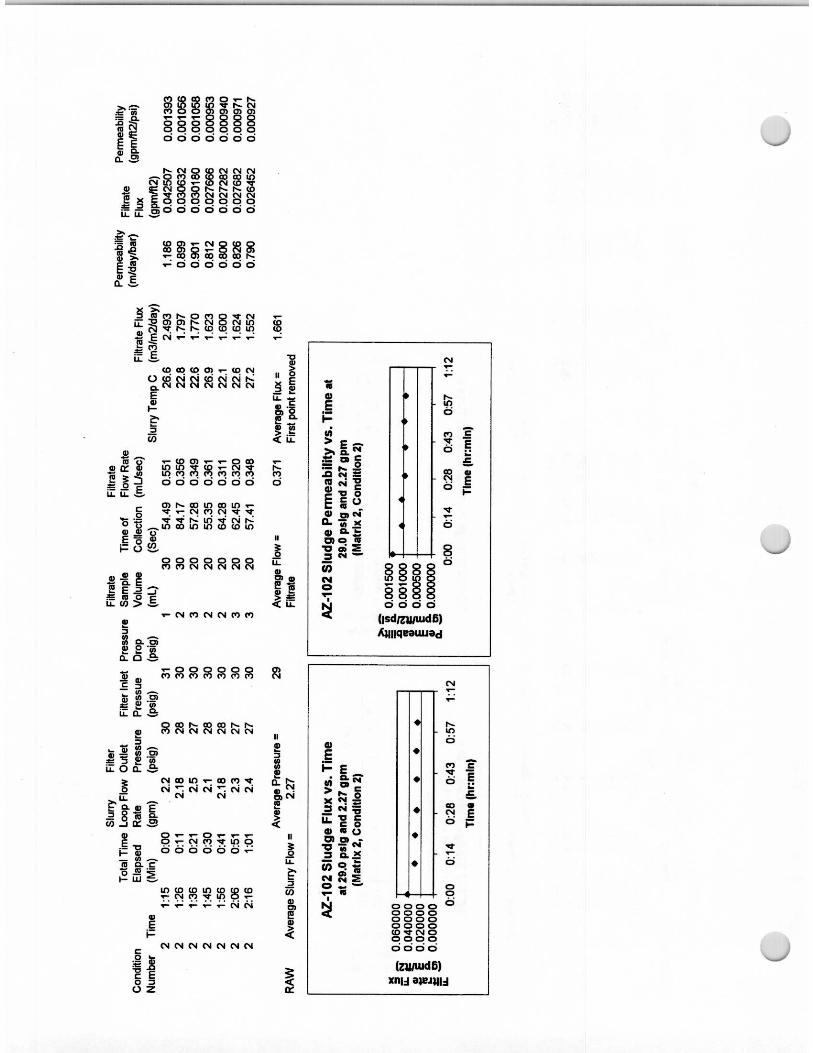
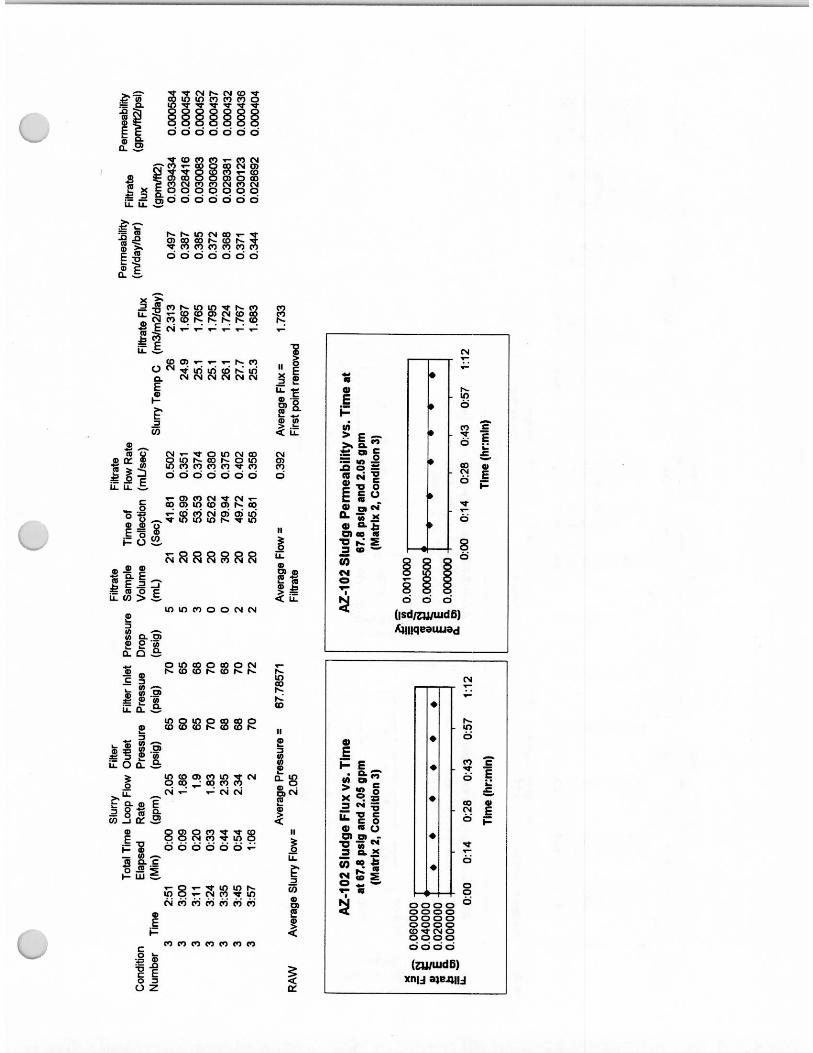
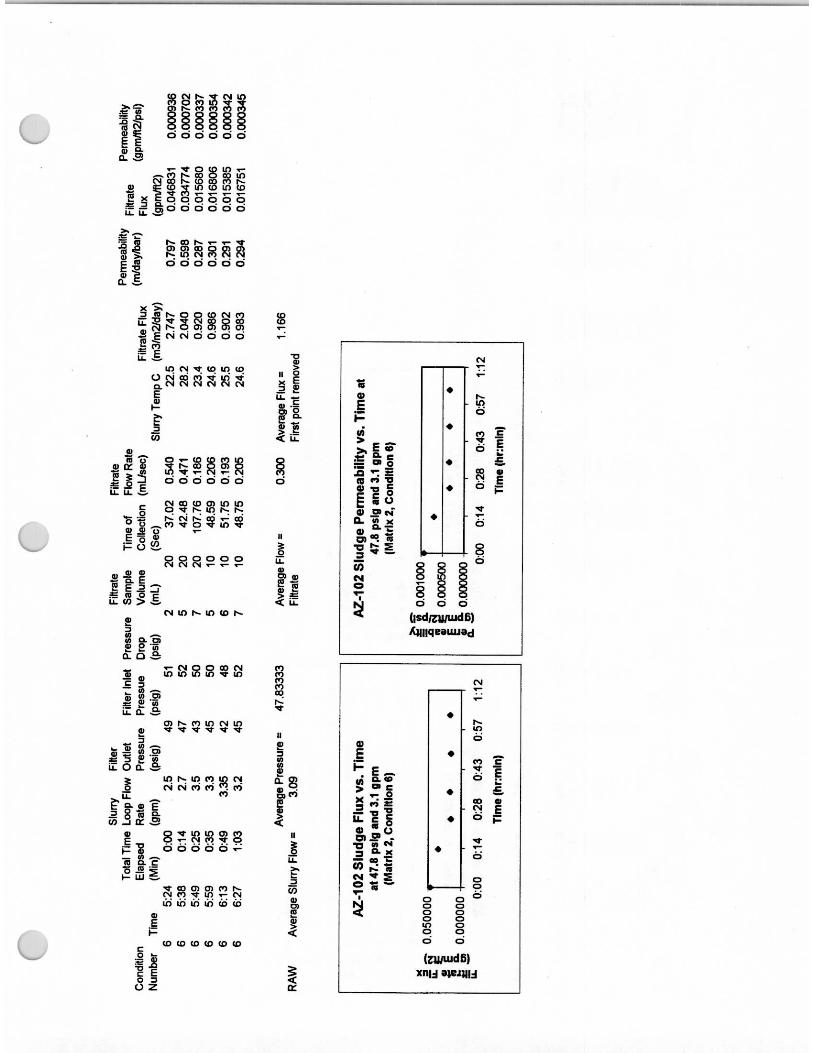
3.1.3 High-Solids-Loading Matrix Results
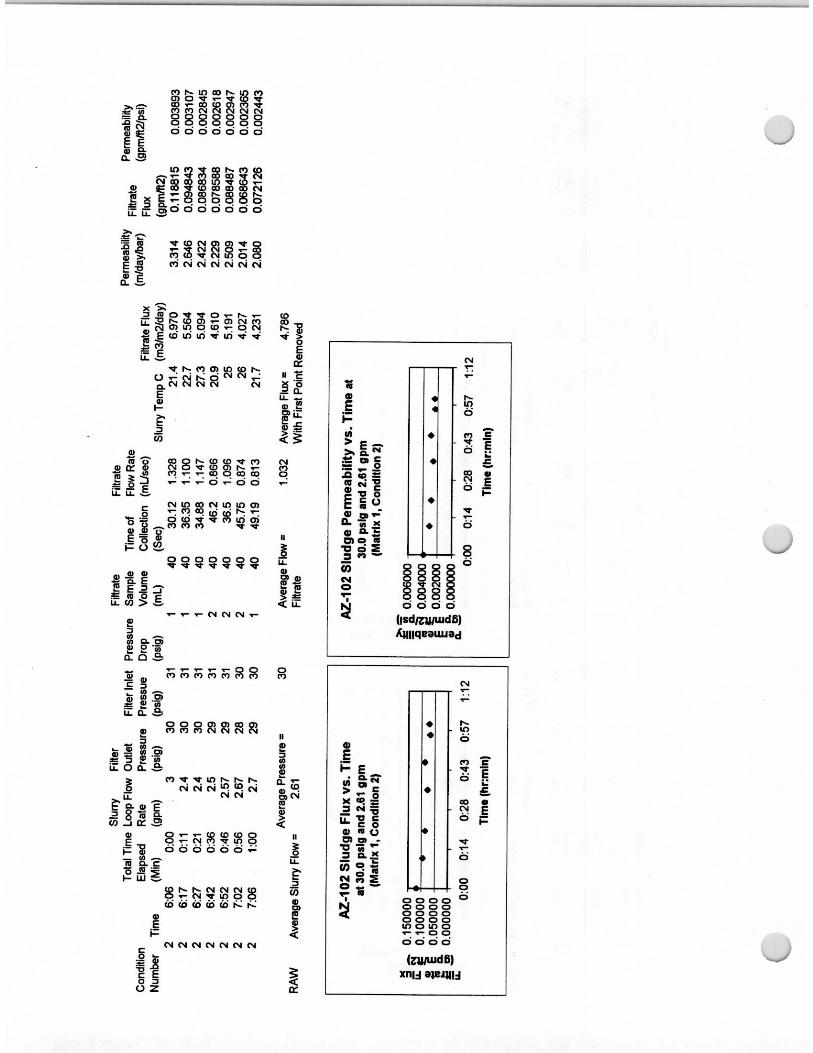
The second filtration matrix was performed after the slurry had been de-watered to a calculated solids concentration of 13.7 wt% solids. This matrix consisted of six conditions. As mentioned in Section 2.5, Condition 5 was not performed for this matrix. The first and sixth conditions were repeated to evaluate filter fouling during the course of the testing. The average filtrate fluxes for this matrix are shown in Table 3.2. The filtrate fluxes as a function of time are shown in Figure 3.3. As done previously, each condition was performed over the course of 1 h with 3 to 4 backpulses between each condition.
Table 3.2. Average Filtrate Flux for High-Solids Matrix (~13.7 wt%)
Condition #Average Velocity
(ft/s)Average Pressure
(psid)Average Filtrate
Flux (gpm/ft2)1 7.9 51.1 0.0322 6.6 29.0 0.0283 6.0 67.7 0.0304 8.4 30.3 0.0386 9.0 47.8 0.0207 11.5 29.4 0.050
Unlike the previous matrix, the highest average flux did not occur at the first condition. Instead, it occurred at the condition of highest axial velocity (Condition 7). Once again, the average filtrate flux appeared to decrease over the entire matrix as evidenced in the decrease in filtrate flux that was observed in Conditions #1 and #6. With nearly identical pressure and increased velocity in Condition #6, there was a 38% decrease between the two conditions. Some of this decrease could be associated with a sudden change that occurred to the testing apparatus 23 min into the Condition. There was a spike in the pressure and then immediately the flow increased from 7.8 ft/s to 10.2 ft/s. The filtrate flux decreased by approximately 50%. It is postulated that build-up of particles somewhere in the system suddenly broke free, allowing an increase in flow and further coating the filter. This in turn resulted in a decrease in filtrate flux. A second postulate is that a sudden increase in entrained air in the slurry blinded the filter, resulting in a decrease in filtrate flux, although entrained air or its effects were noted only at the conclusion of testing.

3.5
0.00
0.01
0.02
0.03
0.04
0.05
0.06
0.07
0.08
0.09
0.10
0:00 0:10 0:20 0:30 0:40 0:50 1:00 1:10
Time (hr:min)
Filt
rate
Flu
x (g
pm
/ft2
)
Condition #1: 51.1 psid, 7.9 ft/sec Condition #2: 29.0 psid, 6.6 ft/sec Condition #3: 67.8 psid, 6.0 ft/sec
Condition #4: 30.3 psid, 8.4 ft/sec Condition #6: 47.8 psid, 9.0 ft/sec Condition #7: 29.4 psid, 11.5 ft/sec
Figure 3.3. Filtrate Flux as a Function of Time for the High Solids Matrix
The first three data points provide some indication as to the effect of TMP at constant axial velocity.The nearly constant filtrate flux seems to indicate that the filtrate flux was not impacted by TMP over the range from 30 to 70 psid.
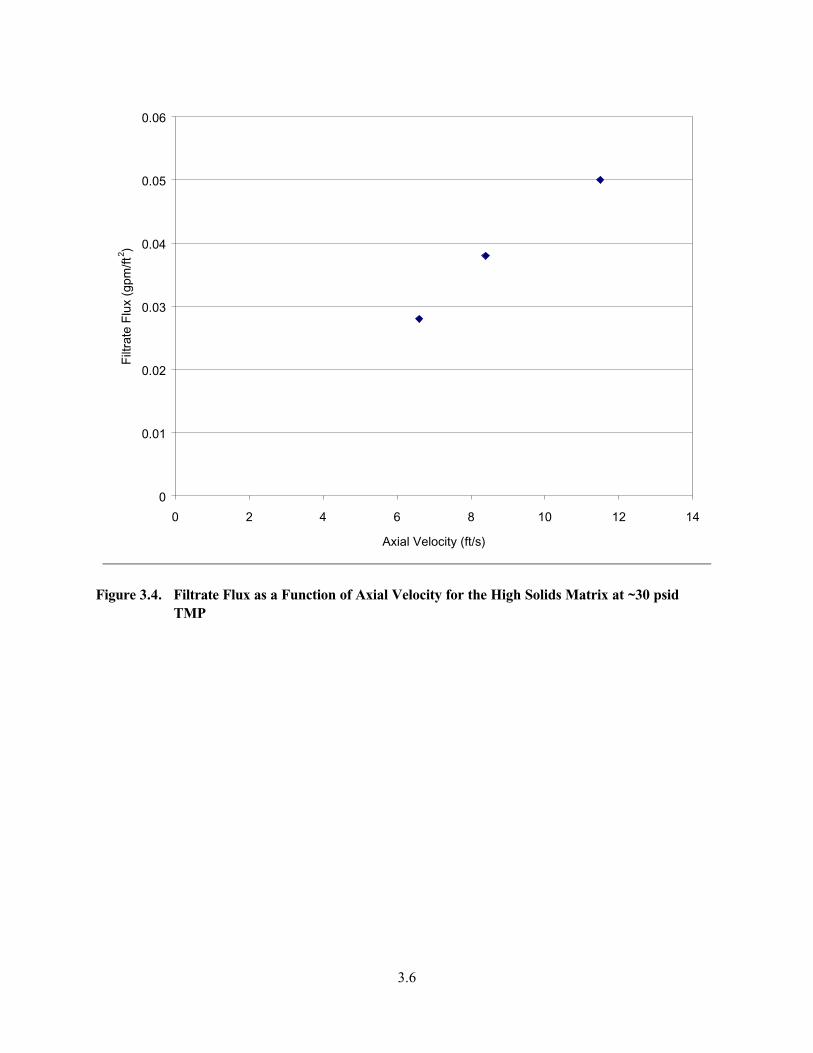
A comparison between Conditions #2, #4, and #7 provides an indication of the effect of axial velocity at nearly constant TMP. With increased axial velocity, there was a significant increase in filtrate flux.This trend can best be seen in Figure 3.4 where filtrate flux was plotted as a function of axial velocity.The resulting graph is nearly linear. Overall, for the high solids matrix, the optimum condition was achieved at low pressures and high axial velocities.
3.6
0
0.01
0.02
0.03
0.04
0.05
0.06
0 2 4 6 8 10 12 14
Axial Velocity (ft/s)
Filt
rate
Flu
x (g
pm/ft
2 )
Figure 3.4. Filtrate Flux as a Function of Axial Velocity for the High Solids Matrix at ~30 psid TMP

3.7
The initial, final, and average filtrate-flux results are shown in Figure 3.5. The initial filtrate flux for the first condition was significantly higher than all subsequent conditions. Condition 7 also has a slightly higher initial filtrate flux, possibly due to the significantly higher axial velocity, which removes more material during backpulsing. The remaining conditions were relatively constant in initial filtrate flux.
0
0.01
0.02
0.03
0.04
0.05
0.06
0.07
0.08
0.09
0.1
0 1 2 3 4 5 6 7 8
Condition Number
Filt
rate
Flu
x (g
pm
/ft2
)
Initial Flux Average Flux Final Flux
Figure 3.5. Initial, Average, and Final Filtrate Flux for Each Condition in the High-Solids Matrix
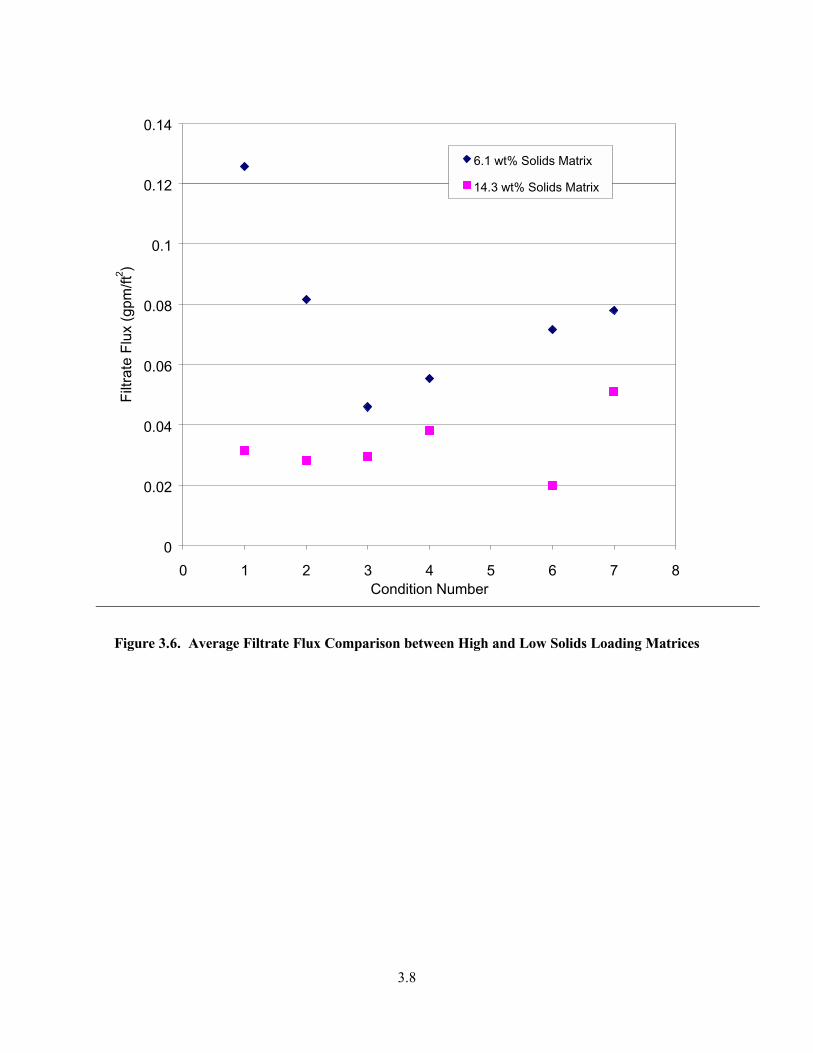
The filtrate fluxes for this high solids loading test matrix were lower than those seen in the previous matrix. With the 2.7-fold increase in solids concentration, the filtration flux decreased by an average of 2.3-fold (see Figure 3.6). In the case of Conditions #1, #2, and #6, the differences were larger.
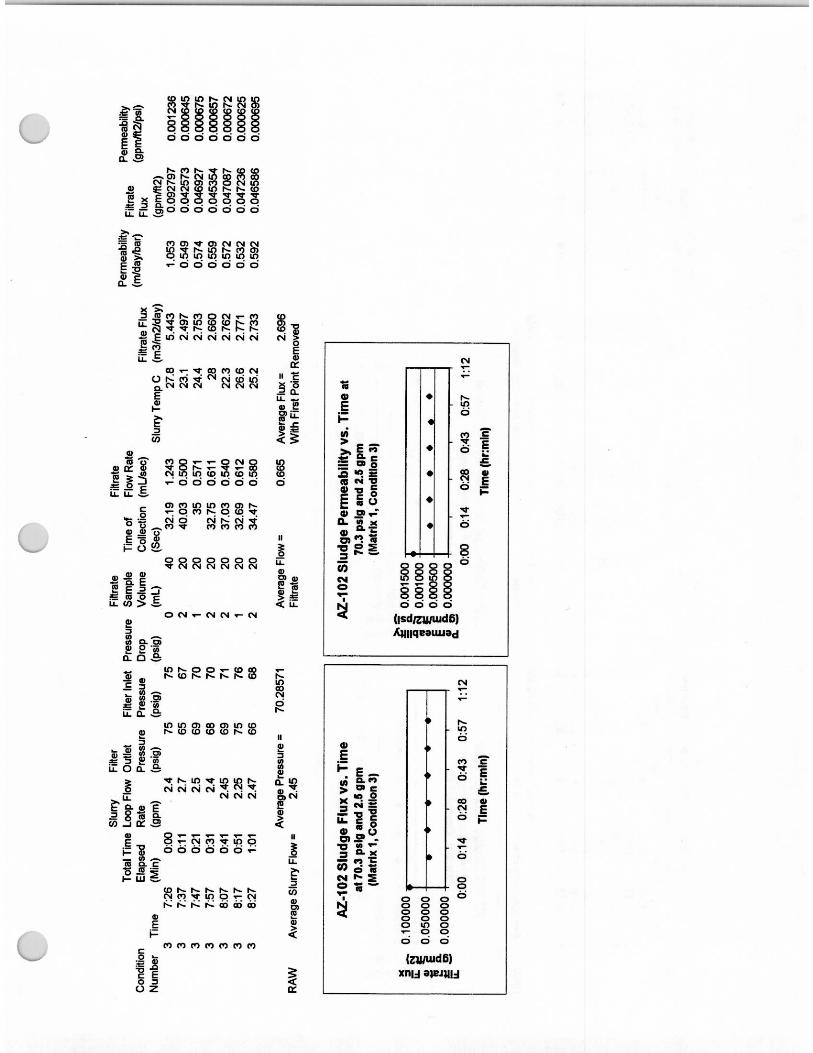
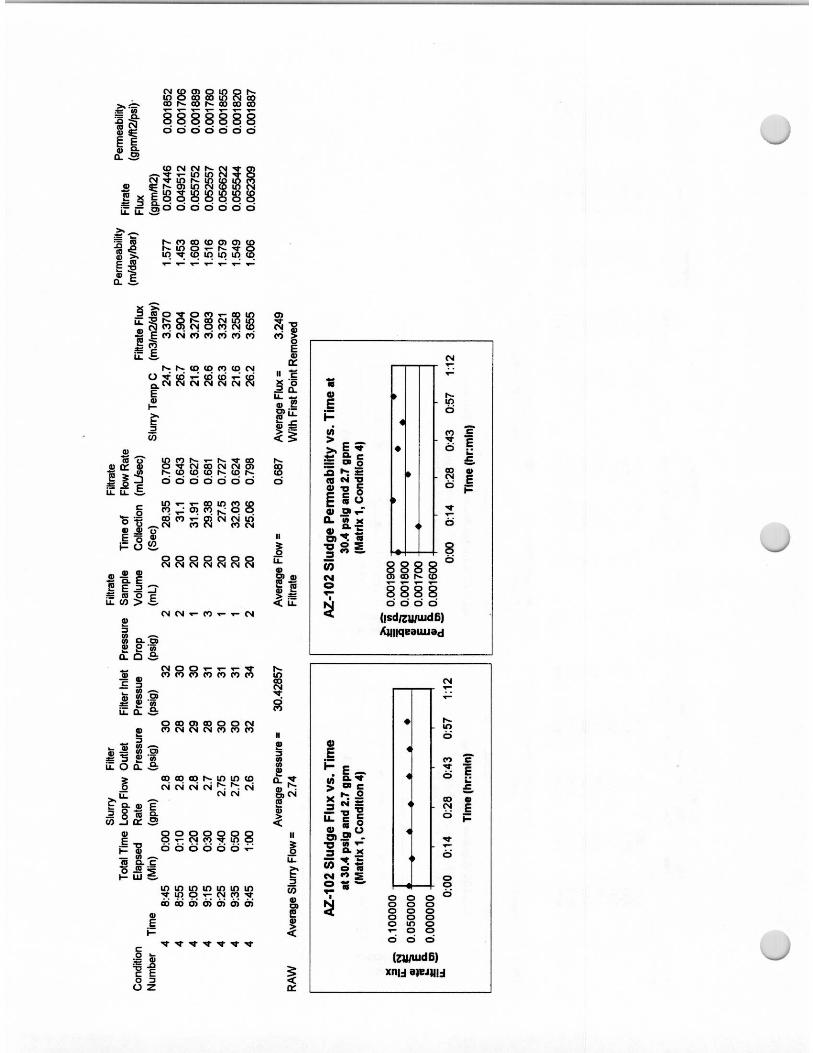
3.1.4 Filtration Results During the Washing and Caustic Leaching Steps
Washing with dilute caustic was performed in three steps. In each step, approximately 900 mL was added to the CUF, and then an equal quantity of filtrate was removed. During each of the steps, the solids concentration should increase from approximately 7% up to 11%, assuming minimal solids dissolution during washing. The average filtrate fluxes for these washing steps are presented in Table 3.3.
3.8
0
0.02
0.04
0.06
0.08
0.1
0.12
0.14
0 1 2 3 4 5 6 7 8Condition Number
Filt
rate
Flu
x (g
pm/ft
2 )
6.1 wt% Solids Matrix
14.3 wt% Solids Matrix
Figure 3.6. Average Filtrate Flux Comparison between High and Low Solids Loading Matrices
3.9
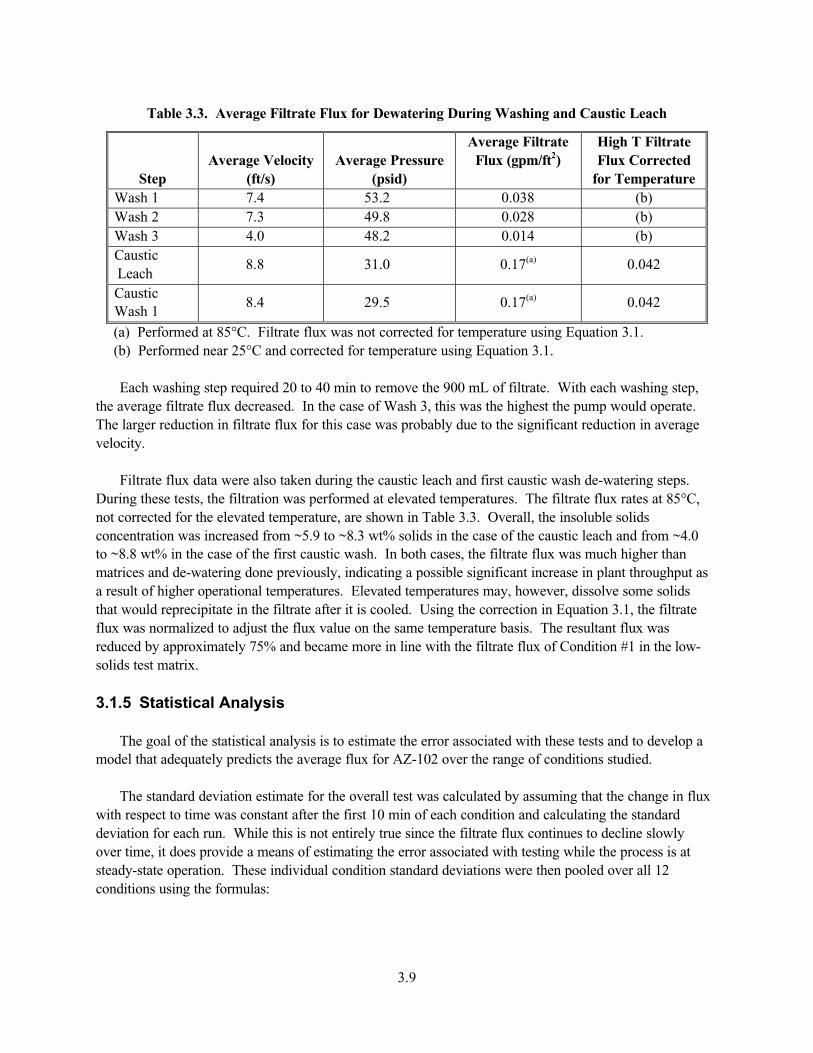
Table 3.3. Average Filtrate Flux for Dewatering During Washing and Caustic Leach
StepAverage Velocity
(ft/s)Average Pressure
(psid)
Average Filtrate Flux (gpm/ft2)
High T Filtrate Flux Corrected
for TemperatureWash 1 7.4 53.2 0.038 (b)Wash 2 7.3 49.8 0.028 (b)Wash 3 4.0 48.2 0.014 (b)CausticLeach
8.8 31.0 0.17(a) 0.042
CausticWash 1
8.4 29.5 0.17(a) 0.042
(a) Performed at 85°C. Filtrate flux was not corrected for temperature using Equation 3.1.(b) Performed near 25°C and corrected for temperature using Equation 3.1.
Each washing step required 20 to 40 min to remove the 900 mL of filtrate. With each washing step, the average filtrate flux decreased. In the case of Wash 3, this was the highest the pump would operate.The larger reduction in filtrate flux for this case was probably due to the significant reduction in average velocity.
Filtrate flux data were also taken during the caustic leach and first caustic wash de-watering steps.During these tests, the filtration was performed at elevated temperatures. The filtrate flux rates at 85°C, not corrected for the elevated temperature, are shown in Table 3.3. Overall, the insoluble solids concentration was increased from ~5.9 to ~8.3 wt% solids in the case of the caustic leach and from ~4.0 to ~8.8 wt% in the case of the first caustic wash. In both cases, the filtrate flux was much higher than matrices and de-watering done previously, indicating a possible significant increase in plant throughput as a result of higher operational temperatures. Elevated temperatures may, however, dissolve some solids that would reprecipitate in the filtrate after it is cooled. Using the correction in Equation 3.1, the filtrate flux was normalized to adjust the flux value on the same temperature basis. The resultant flux was reduced by approximately 75% and became more in line with the filtrate flux of Condition #1 in the low-solids test matrix.
3.1.5 Statistical Analysis
The goal of the statistical analysis is to estimate the error associated with these tests and to develop a model that adequately predicts the average flux for AZ-102 over the range of conditions studied.
The standard deviation estimate for the overall test was calculated by assuming that the change in flux with respect to time was constant after the first 10 min of each condition and calculating the standard deviation for each run. While this is not entirely true since the filtrate flux continues to decline slowly over time, it does provide a means of estimating the error associated with testing while the process is at steady-state operation. These individual condition standard deviations were then pooled over all 12 conditions using the formulas:
3.10
∑
∑∑
=
= =
−
−=
k
jj
k
j
n
iiij
p
n
yy
s
i
1
1 1
2
)1(
)(
or
∑
∑
=
=
−
−=
k
jj
k
jjj
p
n
sn
s
1
1
2
)1(
)1(
(3.1)
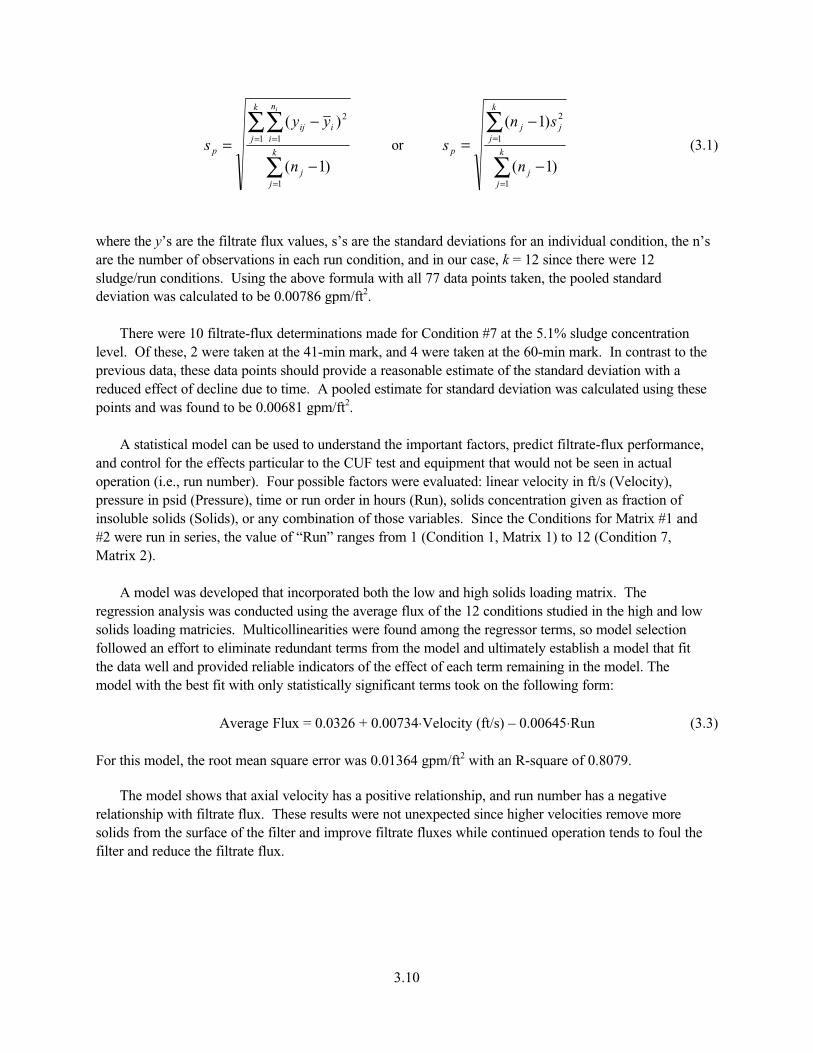
where the y’s are the filtrate flux values, s’s are the standard deviations for an individual condition, the n’s are the number of observations in each run condition, and in our case, k = 12 since there were 12 sludge/run conditions. Using the above formula with all 77 data points taken, the pooled standard deviation was calculated to be 0.00786 gpm/ft2.
There were 10 filtrate-flux determinations made for Condition #7 at the 5.1% sludge concentration level. Of these, 2 were taken at the 41-min mark, and 4 were taken at the 60-min mark. In contrast to the previous data, these data points should provide a reasonable estimate of the standard deviation with a reduced effect of decline due to time. A pooled estimate for standard deviation was calculated using these points and was found to be 0.00681 gpm/ft2.
A statistical model can be used to understand the important factors, predict filtrate-flux performance, and control for the effects particular to the CUF test and equipment that would not be seen in actual operation (i.e., run number). Four possible factors were evaluated: linear velocity in ft/s (Velocity),pressure in psid (Pressure), time or run order in hours (Run), solids concentration given as fraction of insoluble solids (Solids), or any combination of those variables. Since the Conditions for Matrix #1 and #2 were run in series, the value of “Run” ranges from 1 (Condition 1, Matrix 1) to 12 (Condition 7, Matrix 2).
A model was developed that incorporated both the low and high solids loading matrix. The regression analysis was conducted using the average flux of the 12 conditions studied in the high and low solids loading matricies. Multicollinearities were found among the regressor terms, so model selection followed an effort to eliminate redundant terms from the model and ultimately establish a model that fit the data well and provided reliable indicators of the effect of each term remaining in the model. The model with the best fit with only statistically significant terms took on the following form:
Average Flux = 0.0326 + 0.00734⋅Velocity (ft/s) – 0.00645⋅Run (3.3)
For this model, the root mean square error was 0.01364 gpm/ft2 with an R-square of 0.8079.
The model shows that axial velocity has a positive relationship, and run number has a negative relationship with filtrate flux. These results were not unexpected since higher velocities remove more solids from the surface of the filter and improve filtrate fluxes while continued operation tends to foul the filter and reduce the filtrate flux.
3.11
Transmembrane pressure was not included in the model because it was found to be collinear with velocity and did not contribute to the model. Transmembrane pressure may in fact be significant to the filtrate flux. Part of the reason for this may also be that no data were taken at high pressures and high velocities (due to equipment limitations); most of the data were taken either at high pressure and low velocity or low pressure and high velocity. Thus the two parameters were related in this data set.
Similarly, solids concentration was not included in the model because solids concentration and runnumber were also collinear. Since all low solids load data were taken during Runs 1–6 while all high solids loading data were taken during Runs 7–12, these two effects cannot be statistically separated from each other.
One of the purposes of these models was to determine the optimum conditions without the effect of run order for both solids concentrations. In the case of both the low and high solids loading matrix, the optimum filtration condition was the highest axial velocity. Higher solids loading, of course, reduces filtrate flux, although it was not included in the model.
3.2 Sludge-Washing and Caustic-Leaching Results
The chemical and radiochemical analyses obtained from the slurry-washing and caustic-leaching tests are presented in this section. Slurry samples were taken on the initial feed before the material was added to the CUF, following the three water washes, following the caustic leach, and at the conclusion of the tests following the two caustic washes. As discussed in Section 2, a sample of decanted supernatant was taken for analysis before the material was added to the CUF. Liquid samples were taken on all permeates removed throughout the course of the wash/leach steps. The results of these analyses for non-radioactivespecies are shown in Table 3.4. Slurry samples are presented here on a dry basis and permeate samples on a wet basis. When a sample is dried, it is done so by holding the sample at 105oC for 24 hours.
Table 3.4 shows that the primary metals in the initial slurry were, from highest to lowest concentration, iron, aluminum, sodium, uranium, cadmium, zirconium, nickel, and calcium. Significant soluble anions present in the slurry were nitrite, sulfate, and nitrate. Comparing the initial sample and intermediate Sample #1, the initial dewatering steps as well as dilute caustic washing appear to have removed a majority of the sodium, potassium, and the anions.
During the caustic leaching, aluminum, phosphorus, silicon and chromium were removed, as well as additional potassium. The concentration of metals in the final slurry remained roughly in the same order as in the initial slurry (for the top eight components). During the course of washing and leaching, most of the soluble anions measured by IC were washed from the solids, with small amounts of chloride, phosphate, sulfate, and fluoride remaining.
The radioactive component concentrations are shown in Table 3.5. Of the major radioactive isotopes, only 137Cs was significantly removed during leaching and washing. As would be expected, the 90Sr and transuranic (TRU) isotopes remained with the slurry.
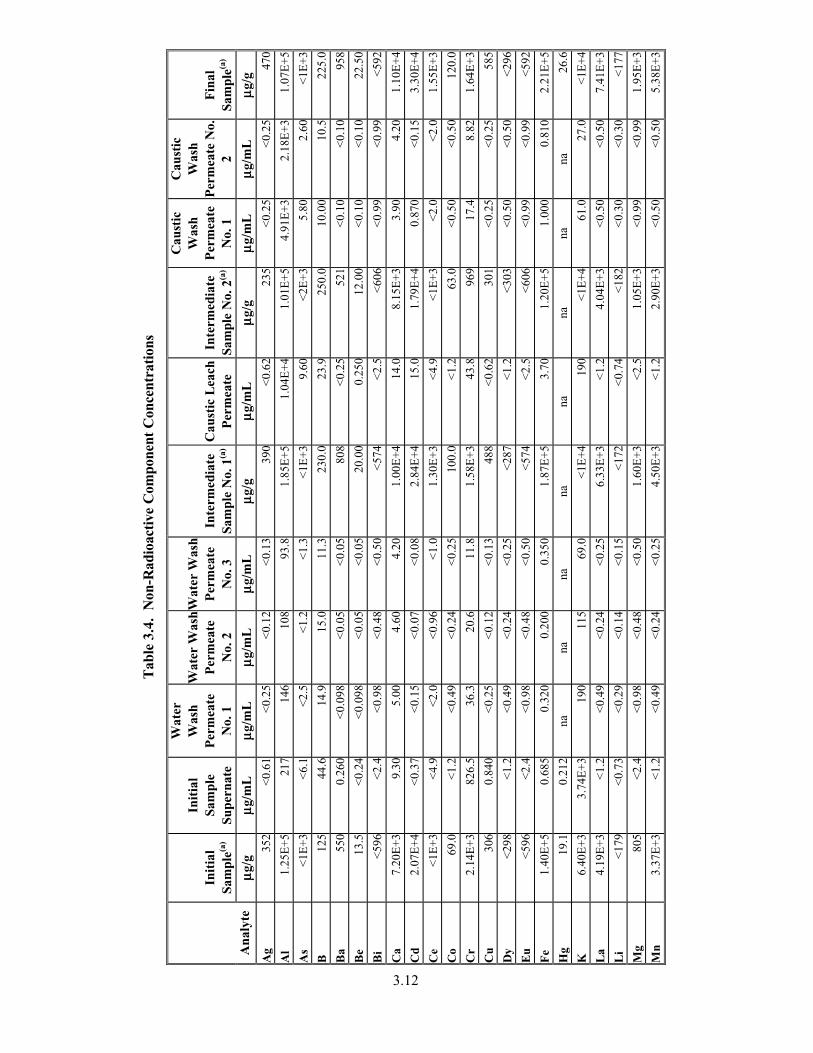
3.12
Tab
le3.
4. N
on-R
adio
acti
ve C
ompo
nent
Con
cent
rati
ons
Init
ial
Sam
ple(a
)
Init
ial
Sam
ple
Supe
rnat
e
Wat
erW
ash
Per
mea
teN
o.1
Wat
er W
ash
Per
mea
teN
o. 2
Wat
er W
ash
Per
mea
teN
o.3
Inte
rmed
iate
Sam
ple
No.
1(a
)C
aust
ic L
each
P
erm
eate
Inte
rmed
iate
Sam
ple
No.
2(a
)
Cau
stic
Was
hP
erm
eate
No.
1
Cau
stic
Was
hP
erm
eate
No.
2
Fin
alSa
mpl
e(a)
Ana
lyte
µµg/g
µµg
/mL
µµg
/mL
µµg
/mL
µµg
/mL
µµg
/g
µµg/m
L
µµg/g
µµg
/mL
µµg
/mL
µµg
/g
Ag
352
<0.
61<
0.25
<0.
12<
0.13
390
<0.
6223
5<
0.25
<0.
2547
0
Al
1.25
E+5
217
146
108
93.8
1.85
E+5
1.04
E+4
1.01
E+5
4.91
E+3
2.18
E+3
1.07
E+5
As
<1E
+3<6
.1<2
.5<1
.2<
1.3
<1E
+39.
60<2
E+3
5.80
2.60
<1E
+3
B12
544
.614
.915
.011
.323
0.0
23.9
250.
010
.00
10.5
225.
0
Ba
550
0.26
0<
0.09
8<
0.05
<0.
0580
8<
0.25
521
<0.
10<
0.10
958
Be
13.5
<0.
24<
0.09
8<
0.05
<0.
0520
.00
0.25
012
.00
<0.
10<
0.10
22.5
0
Bi
<596
<2.4
<0.9
8<0
.48
<0.5
0<5
74<2
.5<6
06<0
.99
<0.9
9<5
92
Ca
7.20
E+
39.
305.
004.
604.
201.
00E
+4
14.0
8.15
E+
33.
904.
201.
10E
+4
Cd
2.07
E+
4<
0.37
<0.
15<
0.07
<0.
082.
84E
+4
15.0
1.79
E+
40.
870
<0.
153.
30E
+4
Ce
<1E
+3<4
.9<2
.0<0
.96
<1.0
1.30
E+3
<4.9
<1E
+3<2
.0<
2.0
1.55
E+3
Co
69.0
<1.
2<
0.49
<0.
24<
0.25
100.
0<
1.2
63.0
<0.
50<
0.50
120.
0
Cr
2.14
E+
382
6.5
36.3
20.6
11.8
1.58
E+
343
.896
917
.48.
821.
64E
+3
Cu
306
0.84
0<
0.25
<0.
12<
0.13
488
<0.
6230
1<
0.25
<0.
2558
5
Dy
<298
<1.2
<0.4
9<0
.24
<0.2
5<2
87<1
.2<3
03<0
.50
<0.5
0<2
96
Eu
<596
<2.4
<0.9
8<0
.48
<0.5
0<5
74<2
.5<6
06<0
.99
<0.9
9<5
92
Fe
1.40
E+
50.
685
0.32
00.
200
0.35
01.
87E
+5
3.70
1.20
E+
51.
000
0.81
02.
21E
+5
Hg
19.1
0.21
2na
nana
nana
nana
na26
.6
K6.
40E
+33.
74E
+319
011
569
.0<1
E+4
190
<1E
+461
.027
.0<1
E+4
La
4.19
E+3
<1.2
<0.4
9<0
.24
<0.2
56.
33E
+3<1
.24.
04E
+3<0
.50
<0.5
07.
41E
+3
Li
<179
<0.7
3<0
.29
<0.1
4<0
.15
<172
<0.7
4<1
82<0
.30
<0.3
0<1
77
Mg
805
<2.4
<0.9
8<0
.48
<0.5
01.
60E
+3<2
.51.
05E
+3<0
.99
<0.9
91.
95E
+3
Mn
3.37
E+3
<1.2
<0.4
9<0
.24
<0.2
54.
50E
+3<1
.22.
90E
+3<0
.50
<0.5
05.
38E
+3
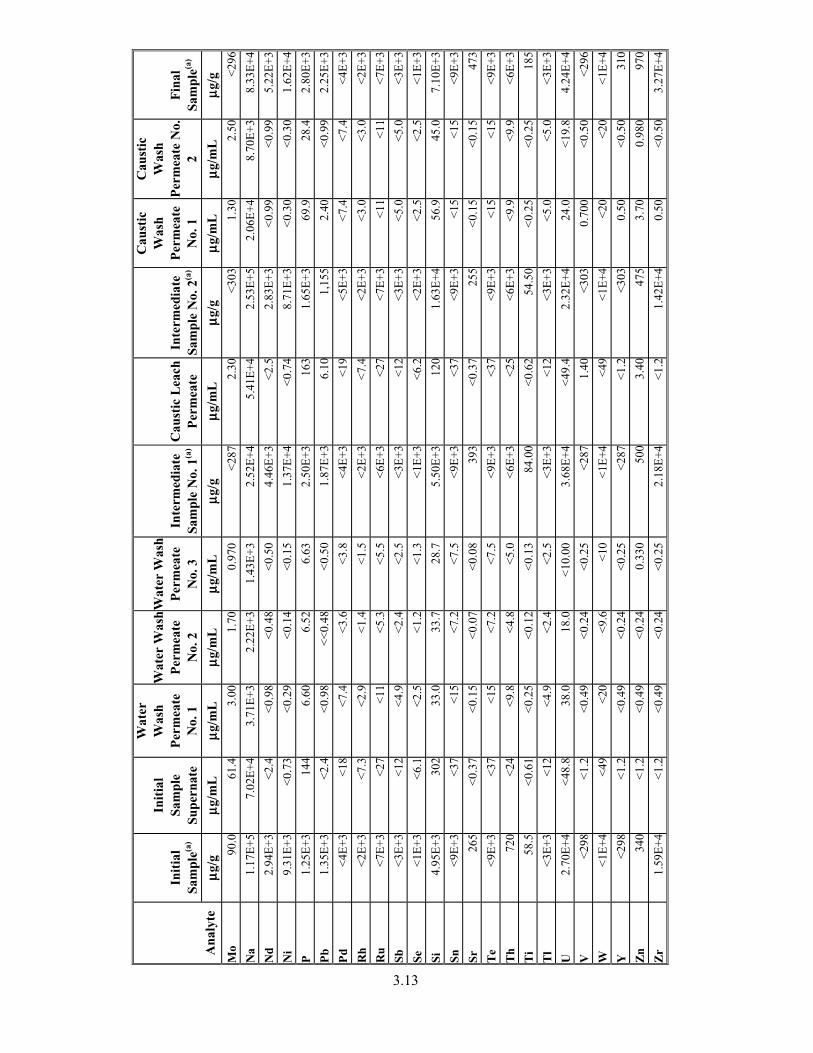
3.13
Init
ial
Sam
ple(a
)
Init
ial
Sam
ple
Supe
rnat
e
Wat
erW
ash
Per
mea
teN
o.1
Wat
er W
ash
Per
mea
teN
o. 2
Wat
er W
ash
Per
mea
teN
o.3
Inte
rmed
iate
Sam
ple
No.
1(a
)C
aust
ic L
each
P
erm
eate
Inte
rmed
iate
Sam
ple
No.
2(a
)
Cau
stic
Was
hP
erm
eate
No.
1
Cau
stic
Was
hP
erm
eate
No.
2
Fin
alSa
mpl
e(a)
Ana
lyte
µµg/g
µµg
/mL
µµg
/mL
µµg
/mL
µµg
/mL
µµg
/g
µµg/m
L
µµg/g
µµg
/mL
µµg
/mL
µµg
/g
Mo
90.0
61.4
3.00
1.70
0.97
0<
287
2.30
<30
31.
302.
50<
296
Na
1.17
E+5
7.02
E+4
3.71
E+3
2.22
E+3
1.43
E+3
2.52
E+4
5.41
E+4
2.53
E+5
2.06
E+4
8.70
E+3
8.33
E+4
Nd
2.94
E+3
<2.4
<0.9
8<0
.48
<0.5
04.
46E
+3<2
.52.
83E
+3<0
.99
<0.9
95.
22E
+3
Ni
9.31
E+3
<0.7
3<0
.29
<0.1
4<0
.15
1.37
E+4
<0.7
48.
71E
+3<0
.30
<0.3
01.
62E
+4
P1.
25E
+3
144
6.60
6.52
6.63
2.50
E+
316
31.
65E
+3
69.9
28.4
2.80
E+
3
Pb
1.35
E+
3<
2.4
<0.
98<
<0.
48<
0.50
1.87
E+
36.
101,
155
2.40
<0.
992.
25E
+3
Pd
<4E
+3<1
8<
7.4
<3.
6<
3.8
<4E
+3<1
9<5
E+3
<7.
4<
7.4
<4E
+3
Rh
<2E
+3<
7.3
<2.
9<
1.4
<1.
5<2
E+3
<7.
4<2
E+3
<3.
0<
3.0
<2E
+3
Ru
<7E
+3<2
7<1
1<
5.3
<5.
5<6
E+3
<27
<7E
+3<1
1<1
1<7
E+3
Sb<3
E+3
<12
<4.
9<
2.4
<2.
5<3
E+3
<12
<3E
+3<
5.0
<5.
0<3
E+3
Se<1
E+3
<6.
1<
2.5
<1.
2<
1.3
<1E
+3<
6.2
<2E
+3<
2.5
<2.
5<1
E+3
Si4.
95E
+3
302
33.0
33.7
28.7
5.50
E+
312
01.
63E
+4
56.9
45.0
7.10
E+
3
Sn<9
E+3
<37
<15
<7.
2<
7.5
<9E
+3<3
7<9
E+3
<15
<15
<9E
+3
Sr26
5<
0.37
<0.
15<
0.07
<0.
0839
3<
0.37
255
<0.
15<
0.15
473
Te
<9E
+3<3
7<1
5<
7.2
<7.
5<9
E+3
<37
<9E
+3<1
5<1
5<9
E+3
Th
720
<24
<9.
8<
4.8
<5.
0<6
E+3
<25
<6E
+3<
9.9
<9.
9<6
E+3
Ti
58.5
<0.
61<
0.25
<0.
12<
0.13
84.0
0<
0.62
54.5
0<
0.25
<0.
2518
5
Tl
<3E
+3<1
2<
4.9
<2.
4<
2.5
<3E
+3<1
2<3
E+3
<5.
0<
5.0
<3E
+3
U2.
70E
+4
<48
.838
.018
.0<
10.0
03.
68E
+4
<49
.42.
32E
+4
24.0
<19
.84.
24E
+4
V<2
98<1
.2<0
.49
<0.2
4<0
.25
<287
1.40
<303
0.70
0<0
.50
<296
W<1
E+4
<49
<20
<9.
6<1
0<1
E+4
<49
<1E
+4<2
0<2
0<1
E+4
Y<2
98<1
.2<0
.49
<0.2
4<0
.25
<287
<1.2
<303
0.50
<0.5
031
0
Zn
340
<1.
2<
0.49
<0.
240.
330
500
3.40
475
3.70
0.98
097
0
Zr
1.59
E+
4<
1.2
<0.
49<
0.24
<0.
252.
18E
+4
<1.
21.
42E
+4
0.50
<0.
503.
27E
+4

3.14
Init
ial
Sam
ple(a
)
Init
ial
Sam
ple
Supe
rnat
e
Wat
erW
ash
Per
mea
teN
o.1
Wat
er W
ash
Per
mea
teN
o. 2
Wat
er W
ash
Per
mea
teN
o.3
Inte
rmed
iate
Sam
ple
No.
1(a
)C
aust
ic L
each
P
erm
eate
Inte
rmed
iate
Sam
ple
No.
2(a
)
Cau
stic
Was
hP
erm
eate
No.
1
Cau
stic
Was
hP
erm
eate
No.
2
Fin
alSa
mpl
e(a)
Ana
lyte
µµg/g
µµg
/mL
µµg
/mL
µµg
/mL
µµg
/mL
µµg
/g
µµg/m
L
µµg/g
µµg
/mL
µµg
/mL
µµg
/g
F1.
70E
+375
050
3020
230
<10
590
<25
<25
300
Cl
<250
<100
<10
<10
<10
400
890
4.15
E+3
370
370
1.35
E+3
NO
26.
61E
+44.
17E
+41.
93E
+31.
12E
+366
05.
50E
+342
01.
75E
+318
018
0<5
30
Br
<250
<100
<10
<10
<10
<27
<10
<250
<25
<25
<260
NO
32.
14E
+41.
38E
+474
038
022
01.
60E
+316
0<4
9010
010
0<5
30
PO
456
943
5<2
0<2
030
960
210
2.05
E+3
160
160
885
SO4
2.93
E+4
2.11
E+4
1.13
E+3
600
350
2.80
E+3
220
995
110
110
690
C2O
43.
90E
+33.
29E
+316
013
080
420
30<4
90<5
0<5
0<5
30
CN
13.5
9.60
3.10
2.40
2.30
8.80
1.70
5.00
1.80
1.00
8.30
TIC
7.99
E+3
8.62
E+3
790
430
425
560
900
1.12
E+4
3.13
E+3
645
2.87
E+3
TO
C76
01.
07E
+350
40<4
061
0<4
01.
79E
+358
060
2.75
E+3
TC
8.75
E+3
9.69
E+3
840
470
425
1.17
E+3
900
1.20
E+4
3.71
E+3
705
5.62
E+3
Not
e: n
a =
No
anal
ysis
per
form
ed.
(a)
Dry
wei
ght b
asis
.
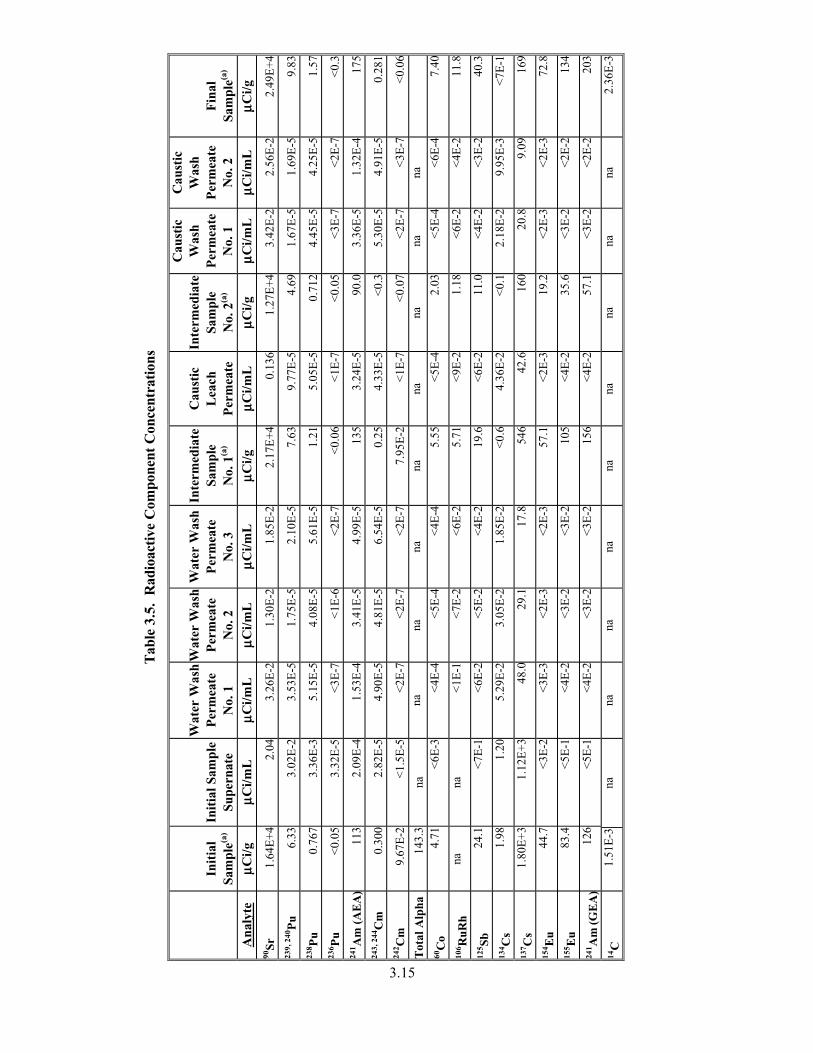
3.15
Tab
le3.
5. R
adio
acti
ve C
ompo
nent
Con
cent
rati
ons
Init
ial
Sam
ple(a
)In
itia
l Sam
ple
Supe
rnat
e
Wat
er W
ash
Per
mea
teN
o. 1
Wat
er W
ash
Per
mea
teN
o. 2
Wat
er W
ash
Per
mea
teN
o. 3
Inte
rmed
iate
Sam
ple
No.
1(a
)
Cau
stic
Lea
chP
erm
eate
Inte
rmed
iate
Sam
ple
No.
2(a
)
Cau
stic
Was
hP
erm
eate
No.
1
Cau
stic
Was
hP
erm
eate
No.
2F
inal
Sam
ple(a
)
Ana
lyte
µµCi/g
µµC
i/mL
µµC
i/mL
µµC
i/mL
µµC
i/mL
µµC
i/g
µµCi/m
L
µµCi/g
µµC
i/mL
µµC
i/mL
µµC
i/g
90Sr
1.64
E+
42.
043.
26E
-21.
30E
-21.
85E
-22.
17E
+4
0.13
61.
27E
+4
3.42
E-2
2.56
E-2
2.49
E+
423
9, 2
40P
u6.
333.
02E
-23.
53E
-51.
75E
-52.
10E
-57.
639.
77E
-54.
691.
67E
-51.
69E
-59.
8323
8 Pu
0.76
73.
36E
-35.
15E
-54.
08E
-55.
61E
-51.
215.
05E
-50.
712
4.45
E-5
4.25
E-5
1.57
236 P
u<0
.05
3.32
E-5
<3E
-7<1
E-6
<2E
-7<0
.06
<1E
-7<0
.05
<3E
-7<2
E-7
<0.
324
1 Am
(A
EA
)11
32.
09E
-41.
53E
-43.
41E
-54.
99E
-513
53.
24E
-590
.03.
36E
-51.
32E
-417
524
3, 2
44C
m0.
300
2.82
E-5
4.90
E-5
4.81
E-5
6.54
E-5
0.25
4.33
E-5
<0.
35.
30E
-54.
91E
-50.
281
242 C
m9.
67E
-2<1
.5E
-5<2
E-7
<2E
-7<2
E-7
7.95
E-2
<1E
-7<0
.07
<2E
-7<3
E-7
<0.0
6
Tot
al A
lpha
143.
3na
nana
nana
nana
nana
60C
o4.
71<6
E-3
<4E
-4<5
E-4
<4E
-45.
55<5
E-4
2.03
<5E
-4<6
E-4
7.40
106 R
uRh
nana
<1E
-1<7
E-2
<6E
-25.
71<9
E-2
1.18
<6E
-2<4
E-2
11.8
125 Sb
24.1
<7E
-1<6
E-2
<5E
-2<4
E-2
19.6
<6E
-211
.0<4
E-2
<3E
-240
.3
134 C
s1.
981.
205.
29E
-23.
05E
-21.
85E
-2<
0.6
4.36
E-2
<0.
12.
18E
-29.
95E
-3<7
E-1
137 C
s1.
80E
+3
1.12
E+
348
.029
.117
.854
642
.6 1
60
20.8
9.09
169
154 E
u44
.7<3
E-2
<3E
-3<2
E-3
<2E
-357
.1<2
E-3
19.2
<2E
-3<2
E-3
72.8
155 E
u83
.4<5
E-1
<4E
-2<3
E-2
<3E
-210
5<4
E-2
35.6
<3E
-2<2
E-2
134
241 A
m (G
EA
)12
6<5
E-1
<4E
-2<3
E-2
<3E
-215
6<4
E-2
57.1
<3E
-2<2
E-2
203
14C
1.51
E-3
nana
nana
nana
nana
na2.
36E
-3
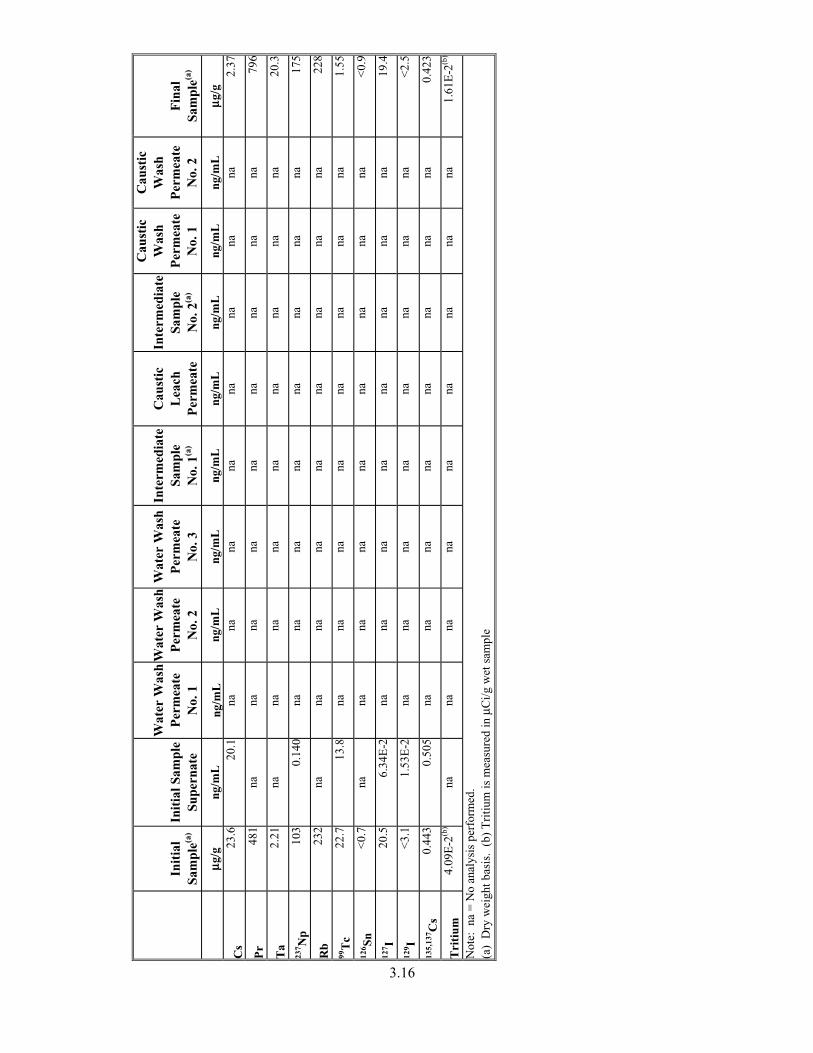
3.16
Init
ial
Sam
ple(a
)In
itia
l Sam
ple
Supe
rnat
e
Wat
er W
ash
Per
mea
teN
o. 1
Wat
er W
ash
Per
mea
teN
o. 2
Wat
er W
ash
Per
mea
teN
o. 3
Inte
rmed
iate
Sam
ple
No.
1(a
)
Cau
stic
Lea
chP
erm
eate
Inte
rmed
iate
Sam
ple
No.
2(a
)
Cau
stic
Was
hP
erm
eate
No.
1
Cau
stic
Was
hP
erm
eate
No.
2F
inal
Sam
ple(a
)
µµg/g
ng/m
Lng
/mL
ng/m
Lng
/mL
ng/m
Lng
/mL
ng/m
Lng
/mL
ng/m
Lµµg
/g
Cs
23.6
20.1
nana
nana
nana
nana
2.37
Pr
481
nana
nana
nana
nana
na79
6
Ta
2.21
nana
nana
nana
nana
na20
.3
237 N
p10
30.
140
nana
nana
nana
nana
175
Rb
232
nana
nana
nana
nana
na22
8
99T
c22
.713
.8na
nana
nana
nana
na1.
55
126 Sn
<0.
7na
nana
nana
nana
nana
<0.
9
127 I
20.5
6.34
E-2
nana
nana
nana
nana
19.4
129 I
<3.
11.
53E
-2na
nana
nana
nana
na<
2.5
135,
137 C
s0.
443
0.50
5na
nana
nana
nana
na0.
423
Tri
tium
4.09
E-2
(b)
nana
nana
nana
nana
na1.
61E
-2(b
)
Not
e: n
a =
No
anal
ysis
per
form
ed.
(a)
Dry
wei
ght b
asis
. (b
) T
ritiu
m is
mea
sure
d in
µC
i/g w
et s
ampl
e
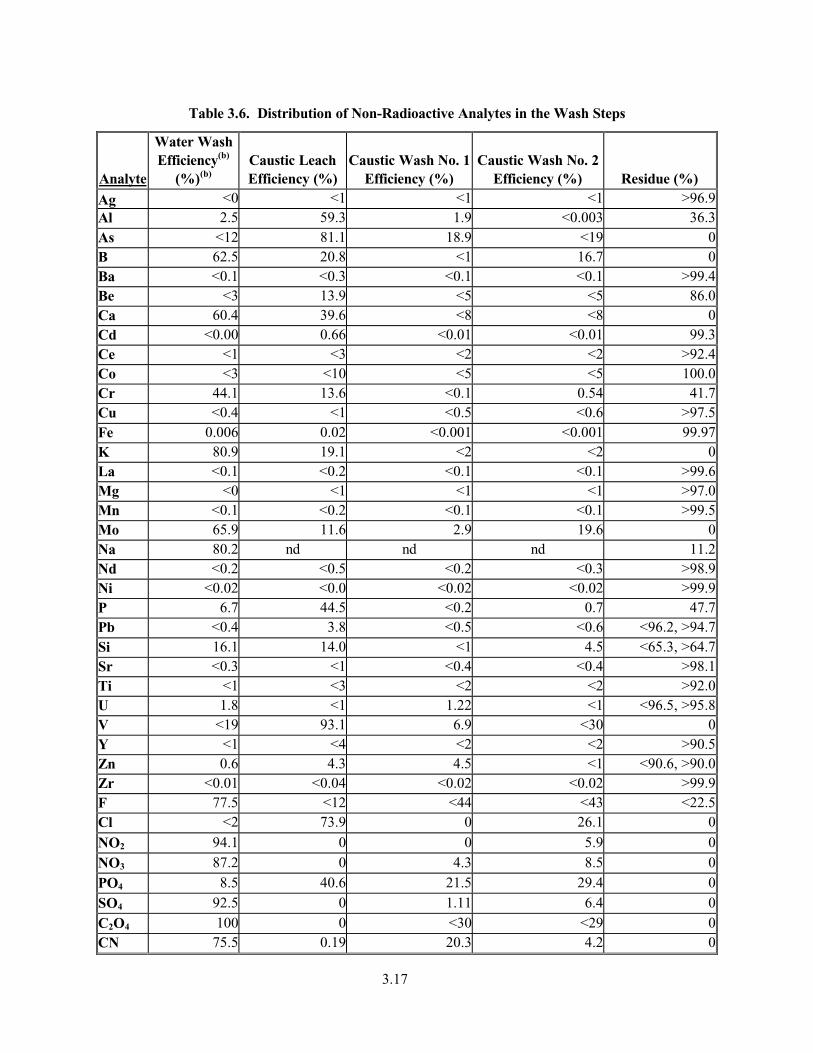
3.17
Table 3.6. Distribution of Non-Radioactive Analytes in the Wash Steps
Analyte
Water Wash Efficiency(b)
(%)(b)Caustic Leach Efficiency (%)
Caustic Wash No. 1 Efficiency (%)
Caustic Wash No. 2 Efficiency (%) Residue (%)
Ag <0 <1 <1 <1 >96.9Al 2.5 59.3 1.9 <0.003 36.3As <12 81.1 18.9 <19 0B 62.5 20.8 <1 16.7 0Ba <0.1 <0.3 <0.1 <0.1 >99.4Be <3 13.9 <5 <5 86.0Ca 60.4 39.6 <8 <8 0Cd <0.00 0.66 <0.01 <0.01 99.3Ce <1 <3 <2 <2 >92.4Co <3 <10 <5 <5 100.0Cr 44.1 13.6 <0.1 0.54 41.7Cu <0.4 <1 <0.5 <0.6 >97.5Fe 0.006 0.02 <0.001 <0.001 99.97K 80.9 19.1 <2 <2 0La <0.1 <0.2 <0.1 <0.1 >99.6Mg <0 <1 <1 <1 >97.0Mn <0.1 <0.2 <0.1 <0.1 >99.5Mo 65.9 11.6 2.9 19.6 0Na 80.2 nd nd nd 11.2Nd <0.2 <0.5 <0.2 <0.3 >98.9Ni <0.02 <0.0 <0.02 <0.02 >99.9P 6.7 44.5 <0.2 0.7 47.7Pb <0.4 3.8 <0.5 <0.6 <96.2, >94.7Si 16.1 14.0 <1 4.5 <65.3, >64.7Sr <0.3 <1 <0.4 <0.4 >98.1Ti <1 <3 <2 <2 >92.0U 1.8 <1 1.22 <1 <96.5, >95.8V <19 93.1 6.9 <30 0Y <1 <4 <2 <2 >90.5Zn 0.6 4.3 4.5 <1 <90.6, >90.0Zr <0.01 <0.04 <0.02 <0.02 >99.9F 77.5 <12 <44 <43 <22.5Cl <2 73.9 0 26.1 0
NO2 94.1 0 0 5.9 0NO3 87.2 0 4.3 8.5 0PO4 8.5 40.6 21.5 29.4 0SO4 92.5 0 1.11 6.4 0C2O4 100 0 <30 <29 0CN 75.5 0.19 20.3 4.2 0

3.18
Analyte
Water Wash Efficiency(b)
(%)(b)Caustic Leach Efficiency (%)
Caustic Wash No. 1 Efficiency (%)
Caustic Wash No. 2 Efficiency (%) Residue (%)
TIC 20.0 9.9 70.1 0 0TOC 4.3 <4 81.5 0 <14.2, >10.4TC 18.0 8.5 73.4 0 0(a) Accounts for carry-over of interstitial liquid.(b) Accounts for material removed in the initial dewatering steps.Note: nd = Not determined due to large amount of sodium added as wash steps.
The removal efficiencies both for the initial dilute washing and the caustic leaching of the non-radioactive and radioactive components are shown in Table 3.6 and Table 3.7. The results indicate that 80.2% of the sodium was removed from the slurry during the water-washing steps. Nearly all of the soluble fluoride, nitrite, nitrate, sulfate, oxalate, and cyanide were removed during the first water washes.Chloride and phosphate were the only exceptions, with phosphate having only 8.5% removal, and no measurable chloride was removed during the water washes. Other non-radioactive components with significant removal efficiencies during the water wash were boron with 63% removal, calcium with 60% removal, chromium with 44% removal, potassium with 81% removal, and molybdenum with 66% removal.
The TIC and TOC concentrations and removal efficiencies are somewhat suspect. The highest concentrations of TIC and TOC were found in the first caustic-wash solution, where 70 and 82% of the total was removed. It would seem unlikely that both TIC and TOC would be removed in this particular step. Analytical error was possibly the culprit.
In terms of radioactive components, 61% of the 137Cs was removed during the initial water-washsteps.
The caustic-leach and subsequent caustic-washing steps were performed at estimated 2.4, 0.9, and 0.38 M NaOH concentrations. The leaching efficiencies of these steps are also shown in Tables 3.6 and 3.7. While only 1.9% of the aluminum was removed during the dilute caustic washing, 59.3% was removed during the caustic-leaching step.
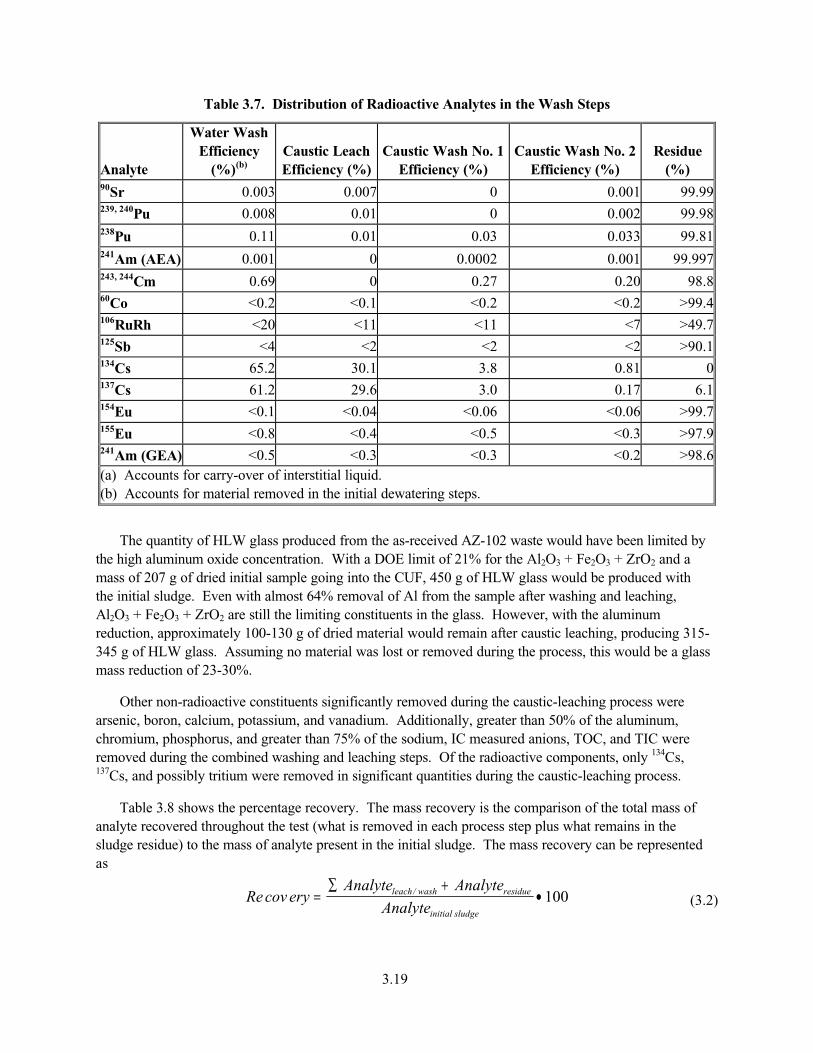
3.19
Recov /eryAnalyte Analyte
Analyteleach wash residue
initial sl
=∑ +
•udge
100
Table 3.7. Distribution of Radioactive Analytes in the Wash Steps
Analyte
Water Wash Efficiency
(%)(b)Caustic Leach Efficiency (%)
Caustic Wash No. 1 Efficiency (%)
Caustic Wash No. 2 Efficiency (%)
Residue(%)
90Sr 0.003 0.007 0 0.001 99.99239, 240Pu 0.008 0.01 0 0.002 99.98238Pu 0.11 0.01 0.03 0.033 99.81241Am (AEA) 0.001 0 0.0002 0.001 99.997243, 244Cm 0.69 0 0.27 0.20 98.860Co <0.2 <0.1 <0.2 <0.2 >99.4106RuRh <20 <11 <11 <7 >49.7125Sb <4 <2 <2 <2 >90.1134Cs 65.2 30.1 3.8 0.81 0137Cs 61.2 29.6 3.0 0.17 6.1154Eu <0.1 <0.04 <0.06 <0.06 >99.7155Eu <0.8 <0.4 <0.5 <0.3 >97.9241Am (GEA) <0.5 <0.3 <0.3 <0.2 >98.6(a) Accounts for carry-over of interstitial liquid.(b) Accounts for material removed in the initial dewatering steps.
The quantity of HLW glass produced from the as-received AZ-102 waste would have been limited by the high aluminum oxide concentration. With a DOE limit of 21% for the Al2O3 + Fe2O3 + ZrO2 and a mass of 207 g of dried initial sample going into the CUF, 450 g of HLW glass would be produced with the initial sludge. Even with almost 64% removal of Al from the sample after washing and leaching, Al2O3 + Fe2O3 + ZrO2 are still the limiting constituents in the glass. However, with the aluminum reduction, approximately 100-130 g of dried material would remain after caustic leaching, producing 315-345 g of HLW glass. Assuming no material was lost or removed during the process, this would be a glass mass reduction of 23-30%.
Other non-radioactive constituents significantly removed during the caustic-leaching process were arsenic, boron, calcium, potassium, and vanadium. Additionally, greater than 50% of the aluminum, chromium, phosphorus, and greater than 75% of the sodium, IC measured anions, TOC, and TIC were removed during the combined washing and leaching steps. Of the radioactive components, only 134Cs,137Cs, and possibly tritium were removed in significant quantities during the caustic-leaching process.
Table 3.8 shows the percentage recovery. The mass recovery is the comparison of the total mass of analyte recovered throughout the test (what is removed in each process step plus what remains in the sludge residue) to the mass of analyte present in the initial sludge. The mass recovery can be represented as
(3.2)
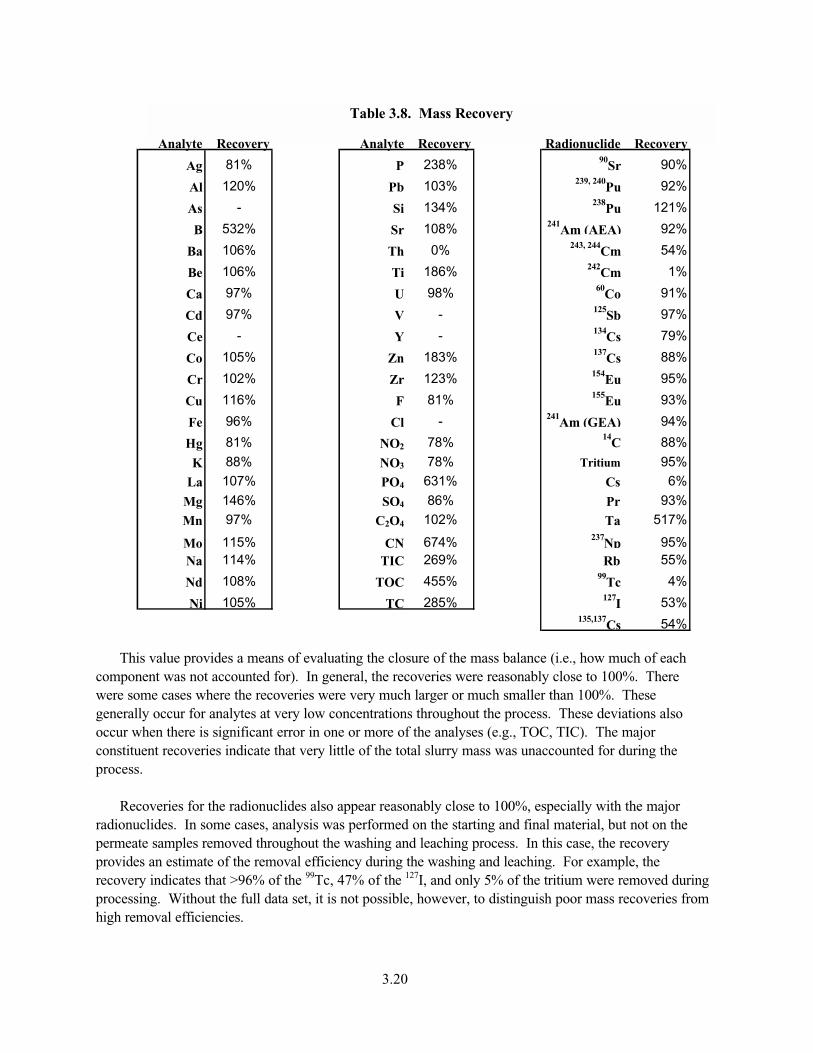
3.20
This value provides a means of evaluating the closure of the mass balance (i.e., how much of each component was not accounted for). In general, the recoveries were reasonably close to 100%. There were some cases where the recoveries were very much larger or much smaller than 100%. Thesegenerally occur for analytes at very low concentrations throughout the process. These deviations also occur when there is significant error in one or more of the analyses (e.g., TOC, TIC). The major constituent recoveries indicate that very little of the total slurry mass was unaccounted for during the process.
Recoveries for the radionuclides also appear reasonably close to 100%, especially with the major radionuclides. In some cases, analysis was performed on the starting and final material, but not on the permeate samples removed throughout the washing and leaching process. In this case, the recovery provides an estimate of the removal efficiency during the washing and leaching. For example, the recovery indicates that >96% of the 99Tc, 47% of the 127I, and only 5% of the tritium were removed during processing. Without the full data set, it is not possible, however, to distinguish poor mass recoveries from high removal efficiencies.
Table 3.8. Mass Recovery
Analyte Recovery Analyte Recovery Radionuclide Recovery
Ag 81% P 238% 90Sr 90%
Al 120% Pb 103% 239, 240Pu 92%
As - Si 134% 238Pu 121%
B 532% Sr 108% 241Am (AEA) 92%
Ba 106% Th 0% 243, 244Cm 54%
Be 106% Ti 186% 242Cm 1%
Ca 97% U 98% 60Co 91%
Cd 97% V - 125Sb 97%
Ce - Y - 134Cs 79%
Co 105% Zn 183% 137Cs 88%
Cr 102% Zr 123% 154Eu 95%
Cu 116% F 81% 155Eu 93%
Fe 96% Cl - 241Am (GEA) 94%
Hg 81% NO2 78% 14C 88%
K 88% NO3 78% Tritium 95%
La 107% PO4 631% Cs 6%
Mg 146% SO4 86% Pr 93%
Mn 97% C2O4 102% Ta 517%
Mo 115% CN 674% 237Np 95%
Na 114% TIC 269% Rb 55%
Nd 108% TOC 455% 99Tc 4%
Ni 105% TC 285% 127I 53%
135,137Cs 54%

3.21
The insoluble radioactive-component concentrations provide a means of measuring the capability of the filter to separate the insoluble solids from the liquids. The isotope 241Am is basically insoluble in caustic solutions and its concentration was measured for all permeates and slurries so it was used to measured filter removal efficiency. This can be done in terms of a decontamination factor (DF) for each step of the process using the following equation:
(3.3)
where CAm,permeate is the 241Am concentration in a given permeate sample, CAm,solids is the 241Amconcentration in the dried slurry taken during that time, and wt% slurry is the weight percent solids in the dried slurry. The 241Am water-wash DFs were between 100,000 and 450,000, and the caustic-leach DFs were 400,000. These high DFs indicate good solid/liquid separations using the Mott 0.1-µm sintered metal filter.
permeateAm
solidssolidsAm
C
wtCDF
,
,
100
%=
4.1
4.0 Physical-Properties and Rheological-Properties Testing
This section describes physical and rheological analyses conducted on samples of AZ-102 slurry.The physical and rheological analyses included density, weight percent (wt%) and volume percent (vol%) solids, and shear stress as a function of shear rate.
Physical measurement samples were taken three times during the course of testing: 1) before the second filtration test matrix but after the material had been dewatered to approximately 13.7 wt% solids (concentrated slurry—CUF-AZ102-006); 2) after the caustic leaching step and the caustic permeate had been removed from the slurry to approximately 9 wt% solids (caustic leached slurry—CUF-AZ102-012);and 3) at the end of testing, after washing and caustic leaching the slurry at approximately 9.2 wt% solids (final slurry--CUF-AZ102-025).
Rheological measurements were taken three times during the course of testing: 1) after the first filtration test matrix at approximately 5.1-wt% solids (initial slurry); 2) after the second filtration test matrix at approximately 13.7 wt% solids (concentrated slurry); and 3) at the end of testing, after washing and caustic leaching the slurry at approximately 9.2 wt% solids (final slurry). Each of these subsamples were taken directly from the ultrafiltration loop and immediately characterized by shear stress versus shear rate. Following rheological measurements, the material was returned to the CUF for continuedtesting, thus no sample number applies for these measurements.
4.1 Physical-Properties Analysis
The above-described AZ-102 physical property samples were analyzed for density of the bulk slurries, settled solids, centrifuged solids, and centrifuged supernatant. The density results are listed in Table 4.1. The weight percent (wt%) and volume percent (vol%) settled solids (on a wet basis), wt% and vol% centrifuged solids (on a wet basis), and wt% total solids (on a dry basis) were measured for these samples as well. The wt% and vol% solids results are listed in Table 4.2.
For this testing, a known mass of each slurry was placed in duplicate in volume-graduated centrifuge cones. The duplicates were then allowed to settle for 3 days. The total mass (MB) and volume (VB) of the slurry after it was allowed to settle were recorded and the density of the bulk slurry was calculated (DB=MB/VB). These results appeared to be biased low and had a high relative percent difference, probably because of entrained gas as well as an inability to clearly measure the total sample volume due to material smeared on the sides of the centrifuge tubes. Therefore, the bulk slurry densities were recalculated later in the work using volumes recorded following centrifugation. Following settling, the volume of the settled solids (Vss) and volume of clarified supernatant (Vsl) were recorded. The vol% settled solids were then calculated (Vol%ss=Vss/VB x 100%). For previous samples in the BNFL project, a portion of the clarified supernatant was then transferred to a graduated cylinder to determine supernatant density. For these samples of AZ-102, there was insufficient liquid to make this determination.
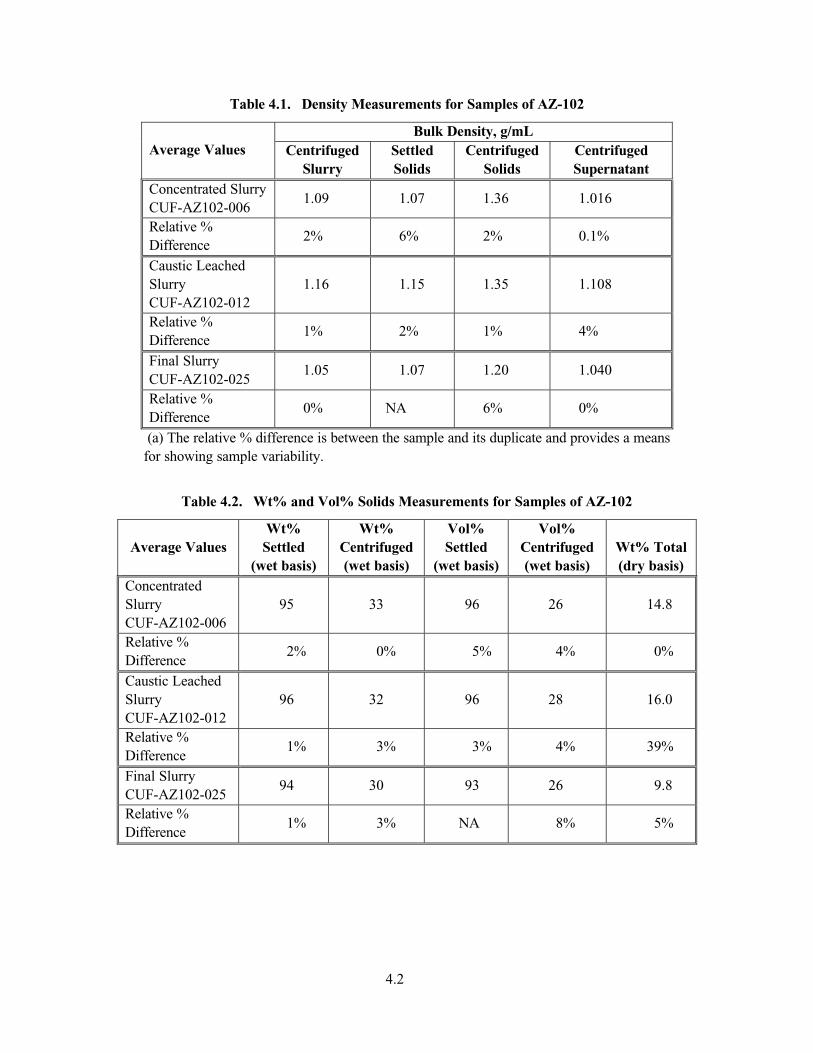
4.2
Table 4.1. Density Measurements for Samples of AZ-102
Bulk Density, g/mLAverage Values Centrifuged
SlurrySettledSolids
CentrifugedSolids
CentrifugedSupernatant
Concentrated Slurry CUF-AZ102-006
1.09 1.07 1.36 1.016
Relative % Difference
2% 6% 2% 0.1%
Caustic Leached SlurryCUF-AZ102-012
1.16 1.15 1.35 1.108
Relative % Difference
1% 2% 1% 4%
Final Slurry CUF-AZ102-025
1.05 1.07 1.20 1.040
Relative % Difference
0% NA 6% 0%
(a) The relative % difference is between the sample and its duplicate and provides a means for showing sample variability.
Table 4.2. Wt% and Vol% Solids Measurements for Samples of AZ-102
Average ValuesWt%
Settled(wet basis)
Wt%Centrifuged(wet basis)
Vol%Settled
(wet basis)
Vol%Centrifuged(wet basis)
Wt% Total(dry basis)
ConcentratedSlurryCUF-AZ102-006
95 33 96 26 14.8
Relative % Difference
2% 0% 5% 4% 0%
Caustic Leached SlurryCUF-AZ102-012
96 32 96 28 16.0
Relative % Difference
1% 3% 3% 4% 39%
Final Slurry CUF-AZ102-025
94 30 93 26 9.8
Relative % Difference
1% 3% NA 8% 5%
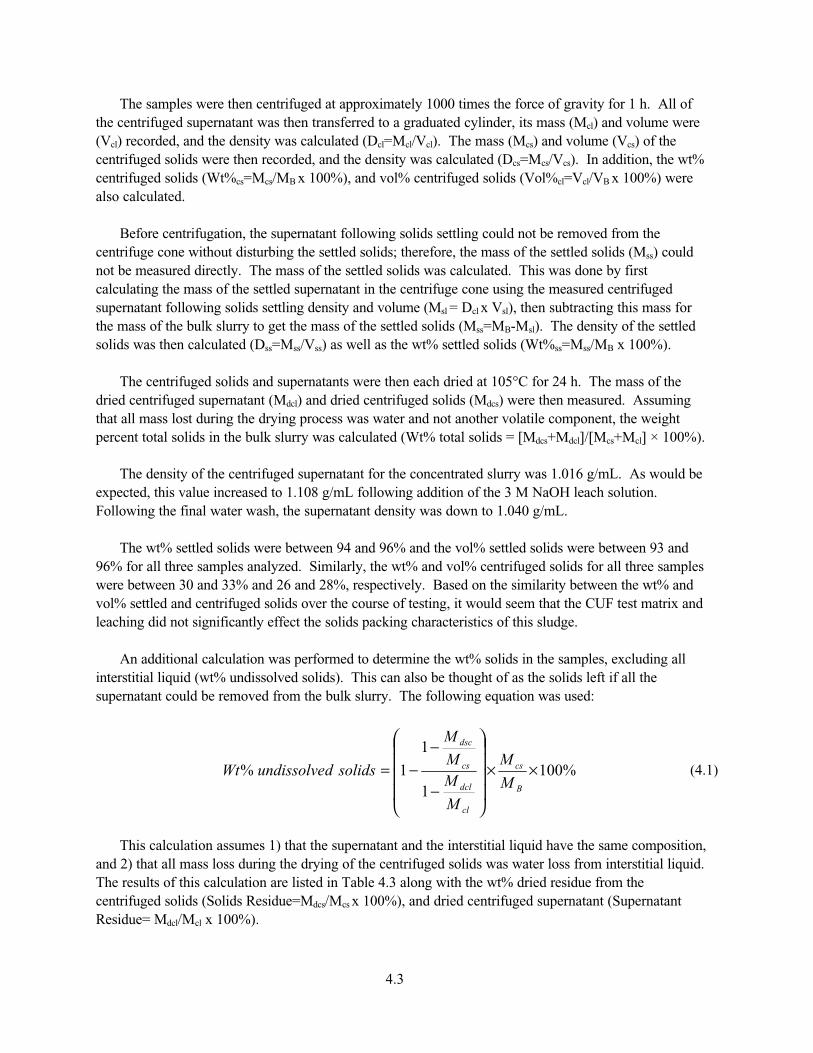
4.3
%1001
1
1% ××
−
−−=
B
cs
cl
dcl
cs
dsc
M
M
M
MM
M
solidsdundissolveWt
The samples were then centrifuged at approximately 1000 times the force of gravity for 1 h. All of the centrifuged supernatant was then transferred to a graduated cylinder, its mass (Mcl) and volume were (Vcl) recorded, and the density was calculated (Dcl=Mcl/Vcl). The mass (Mcs) and volume (Vcs) of the centrifuged solids were then recorded, and the density was calculated (Dcs=Mcs/Vcs). In addition, the wt% centrifuged solids (Wt%cs=Mcs/MB x 100%), and vol% centrifuged solids (Vol%cl=Vcl/VB x 100%) were also calculated.
Before centrifugation, the supernatant following solids settling could not be removed from the centrifuge cone without disturbing the settled solids; therefore, the mass of the settled solids (Mss) could not be measured directly. The mass of the settled solids was calculated. This was done by first calculating the mass of the settled supernatant in the centrifuge cone using the measured centrifuged supernatant following solids settling density and volume (Msl = Dcl x Vsl), then subtracting this mass for the mass of the bulk slurry to get the mass of the settled solids (Mss=MB-Msl). The density of the settled solids was then calculated (Dss=Mss/Vss) as well as the wt% settled solids (Wt%ss=Mss/MB x 100%).
The centrifuged solids and supernatants were then each dried at 105°C for 24 h. The mass of the dried centrifuged supernatant (Mdcl) and dried centrifuged solids (Mdcs) were then measured. Assuming that all mass lost during the drying process was water and not another volatile component, the weight percent total solids in the bulk slurry was calculated (Wt% total solids = [Mdcs+Mdcl]/[Mcs+Mcl] × 100%).
The density of the centrifuged supernatant for the concentrated slurry was 1.016 g/mL. As would be expected, this value increased to 1.108 g/mL following addition of the 3 M NaOH leach solution.Following the final water wash, the supernatant density was down to 1.040 g/mL.
The wt% settled solids were between 94 and 96% and the vol% settled solids were between 93 and 96% for all three samples analyzed. Similarly, the wt% and vol% centrifuged solids for all three samples were between 30 and 33% and 26 and 28%, respectively. Based on the similarity between the wt% and vol% settled and centrifuged solids over the course of testing, it would seem that the CUF test matrix and leaching did not significantly effect the solids packing characteristics of this sludge.
An additional calculation was performed to determine the wt% solids in the samples, excluding all interstitial liquid (wt% undissolved solids). This can also be thought of as the solids left if all the supernatant could be removed from the bulk slurry. The following equation was used:
(4.1)
This calculation assumes 1) that the supernatant and the interstitial liquid have the same composition, and 2) that all mass loss during the drying of the centrifuged solids was water loss from interstitial liquid.The results of this calculation are listed in Table 4.3 along with the wt% dried residue from the centrifuged solids (Solids Residue=Mdcs/Mcs x 100%), and dried centrifuged supernatant (Supernatant Residue= Mdcl/Mcl x 100%).
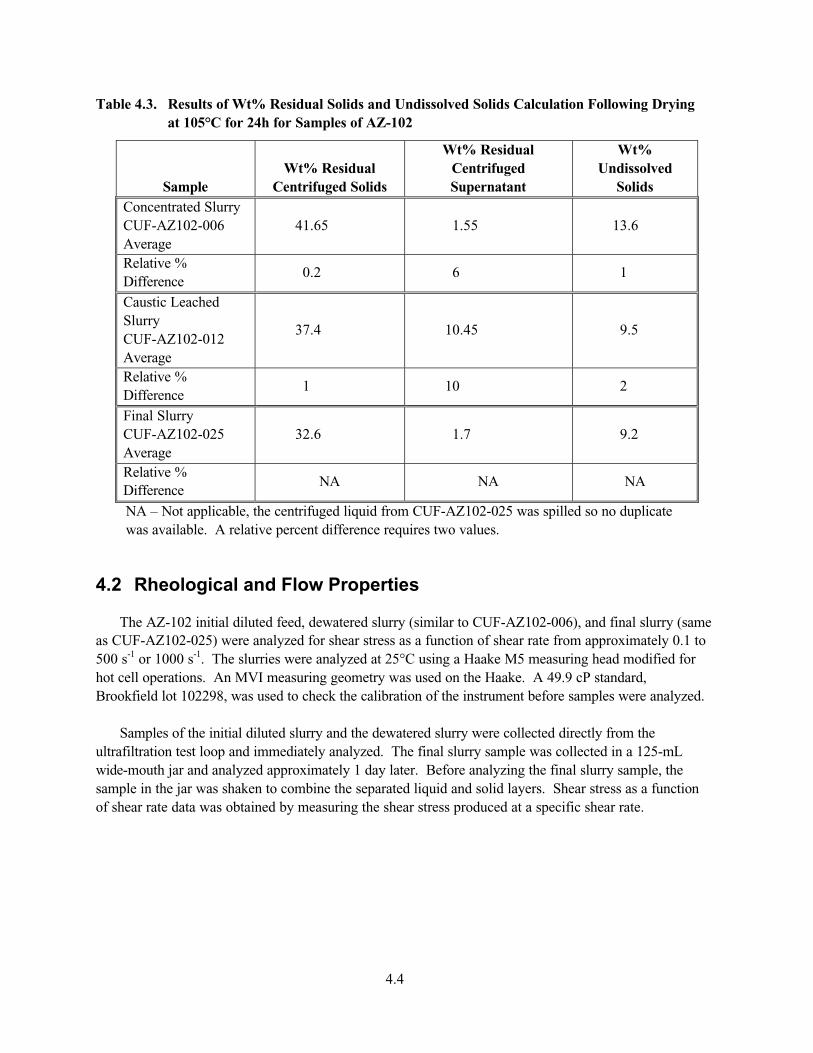
4.4
Table 4.3. Results of Wt% Residual Solids and Undissolved Solids Calculation Following Drying at 105°C for 24h for Samples of AZ-102
SampleWt% Residual
Centrifuged Solids
Wt% Residual CentrifugedSupernatant
Wt%Undissolved
SolidsConcentrated Slurry CUF-AZ102-006Average
41.65 1.55 13.6
Relative % Difference
0.2 6 1
Caustic Leached SlurryCUF-AZ102-012Average
37.4 10.45 9.5
Relative % Difference
1 10 2
Final Slurry CUF-AZ102-025Average
32.6 1.7 9.2
Relative % Difference
NA NA NA
NA – Not applicable, the centrifuged liquid from CUF-AZ102-025 was spilled so no duplicate was available. A relative percent difference requires two values.
4.2 Rheological and Flow Properties
The AZ-102 initial diluted feed, dewatered slurry (similar to CUF-AZ102-006), and final slurry (same as CUF-AZ102-025) were analyzed for shear stress as a function of shear rate from approximately 0.1 to 500 s-1 or 1000 s-1. The slurries were analyzed at 25°C using a Haake M5 measuring head modified for hot cell operations. An MVI measuring geometry was used on the Haake. A 49.9 cP standard,Brookfield lot 102298, was used to check the calibration of the instrument before samples were analyzed.
Samples of the initial diluted slurry and the dewatered slurry were collected directly from the ultrafiltration test loop and immediately analyzed. The final slurry sample was collected in a 125-mLwide-mouth jar and analyzed approximately 1 day later. Before analyzing the final slurry sample, the sample in the jar was shaken to combine the separated liquid and solid layers. Shear stress as a functionof shear rate data was obtained by measuring the shear stress produced at a specific shear rate.

4.5
As requested by the client, samples were allowed to sit in the system for 5 minutes before analysis.The shear rate was then gradually increased from 0 to either 500 s-1 or 1000 s-1, generating the increasing shear rate curve, and then back down to 0 s-1 generating the decreasing curve. For analysis conducted to 1000 s-1, the shear rate was increased to 1000 s-1 over 5 min. The shear rate was then held at 1000 s-1 for 5 min, and then decreased to 0 s-1 over 5 min. In general, analyses of this duration can exhibit solids settling problems. Shorter duration runs from 0 to 500 s-1 over 2 min followed by a decreasing curve from 500 to 0 s-1 over 2 min were used to look for settling behavior. As will be discussed, no evidence of settling in the slurries was observed during these analyses.
Rheograms for the standards, samples, and duplicates are presented in Figures 1 through 15 in Appendix F. The measured viscosity at 33 s-1 for both the increasing and decreasing curve are presented in Table 4.4. The first sample of the initial diluted feed was analyzed from 0 to 1000 s-1 two times without removing the sample from the instrument. The viscosity of the sample was near the lower limit for the instrument, roughly 2 cP. This sample displayed a low viscosity, between 12 and 2.5 cP, between 33 and 430 s-1. A yield point was detected, but below the quantification limit of 1 Pa. A decrease in viscosity with increasing shear rate above a yield point is referred to as yield pseudoplastic behavior. All AZ-102 samples displayed yield pseudoplastic behavior. The initial slurry samples showed a decrease in viscosity between the increasing shear rate curve and the decreasing shear-rate curve as well as between runs. This decrease in viscosity with increasing shear history is referred to as thixotropic behavior.
Above approximately 430 s-1, a sharp rise in shear stress with shear rate was observed for the initial slurry. This represents the onset of Taylor Vortices. Taylor Vortices are the result of a secondary flow that occurs as the inner cylinder of the concentric-cylinder instrument rotates. Taylor Vortices result from analyzing a material at too high a shear rate. All data collected above the onset of Taylor vortices is invalid. Taylor vortices are expected when the following two equations are satisfied:
Re > 41.3[R2/(R2-R1)]1/2
Re = γ(R2-R1)2ρ/µ
Where R1 = Radius of Inner Cylinder (0.02004 m for MVI)R2 = Radius of Outer Cylinder (0.02100 m for MVI)γ = Shear Rate (s-1)ρ = density (g/mL)µ = Apparent viscosity (Pa•s)
For the initial slurry, the density was 1.09 g/mL and the apparent viscosity of the slurry at the onset of Taylor Vortices was approximately 2.5 cP (0.0025 Pa•s). Applying the above equations, Taylor Vortices would be expected at 480 s-1. This value of 480 s-1 is within 12% of the observed value of 430 s-1.Several analyses of the initial slurry were conducted only to 500 s-1 to provide better resolution of the onset. These analyses show an onset of 460 s-1, which is within 4% of the predicted value.
4.6
Table 4.4. Results for Yield Stress and Viscosity at 33 sec-1 for Samples of AZ-102 Slurry Along with Observed Onset of Taylor Vortices
Viscosity (cP)
Sample Analysis
YieldStress(Pa)
UpperShear
Rate (s-1)
Increasing CurveAt 33 s-1
DecreasingCurve
At 33 s-1
TaylorVortices
Onset (s-1)
Initial Slurry Sample 1 Run 1
<1 1000 12 BD 430
Sample 1 Run 2
<1 1000 5 BD 430
Sample 2 Run 1
<1 500 16 6 460
Sample 2 Run 2
<1 500 13 4 460
Sample 2 Run 3
<1 1000 11 5 430
ConcentratedSlurry
Sample 1 Run 1
3 1000 100 29 ND
Sample 1 Run 2
1.2 1000 39 25 940
Sample 2 Run 1
2.6 500 82 47 ND
Sample 2 Run 2
1.8 500 58 40 ND
Sample 2 Run 3
1.5 1000 49 35 940
Sample 2 Run 4
1.3 1000 43 32 890
Final SlurrySample 1 Run 1
8 1000 172 171 NA
Sample 2 Run 1
6.5 1000 167 189 NA
Sample 2 Run 2
8 1000 205 209 NA
ND – Not detected, analysis only conducted to 500s-1.NA – Not applicable, onset of Taylor Vortices above limit of viscometer.BD – Below detection, detection limit for Haake with MVI is approximately 2cP.
4.7
The concentrated slurry displayed yield pseudoplastic and thixotropic behavior. This sample displayed a yield stress of approximately 2.5-3.5 Pa. The initial sample displayed high viscosity on the increasing shear-rate curve along with a bump between 700 and 900 s-1. This behavior was not seen during the decreasing shear rate curve of this sample or any of the duplicate analyses. This behavior was probably the result of large solids or agglomerates that were broken up at the higher shear rates. The onset of Taylor vortices occurred at 940 s-1, and 890 s-1for this sample. Using a density of 1.16 g/mL and a viscosity of approximately 0.045 Pa•s, the expected onset was 815 s-1. The expected value of 815 s-1
was within approximately 15% of the observed values. As with the initial slurry sample, all data collected above the onset of Taylor vortices is invalid.
The final slurry displayed yield pseudoplastic behavior, but no thixotropy was observed. This sample displayed a yield stress of approximately 6 – 8 Pa. This sample was removed from the ultrafiltration unit and stored in a jar for approximately 1 day before the shear-stress versus shear-rate analysis was conducted. This sample was gently agitated in the jar and loaded into the rheometer. The level of material in the rheometer was monitored during the analysis. The level of material was observed to drop during the course of each analysis, ~20 min in duration. This level drop appeared to be the result of gas entrained in the slurry. As the material was sheared, these entrained bubbles were released, decreasing the level of material in the instrument. The level did not drop sufficiently to cause analytical errors in the analyses.
The apparent viscosity of the final slurry decreased from approximately 200 to 12 cP over the range of 33 to 1000 s-1. This appears unexpectedly high compared to the viscosity of the dewatered slurry which decreased from approximately 50 to 6 cP over the range of 33 to 940 s-1. The concentrated slurry had slightly a higher solids content than the final slurry, 9.5 versus 9.2 wt% undissolved solids, and 32 versus 30 wt% centrifuged solids, respectively. Given the slightly higher solids content, one may anticipate that the viscosity of the two slurries would be similar or that the concentrated slurry would be higher. The higher viscosity of the final slurry must be the result of a change in the solids properties beyond just solids content and could be the result of entrained gas bubbles mentioned previously.Entrained gas bubbles generally increase the viscosity of a slurry. As discussed in Section 5.0, the final slurry also contained significantly more fine particles. These finer particles could also be responsible for the increase in viscosity of this sample over the concentrated slurry sample.
5.1
5.0 Particle Size Distribution
The PSD of the initial sludge composite (Sample CUF-AZ-102 MU), the de-watered slurry before Matrix 2 (Sample CUF-AZ-102-005), and the final slurry (Sample CUF-AZ-102-024) is described below.The first sample was the initial composite AZ-102 sludge before it was diluted and fed into the CUF (initial sludge). The second sample was the slurry that was taken after Matrix 1 testing was completed and the slurry was de-watered (concentrated slurry). The third sample was the final slurry, which was caustic leached and was caustic washed twice (final slurry). The sample number associated with the process flowsheet step of crossflow filtration testing is presented in Table 2.3, and the experimental process is described in detail in Section 2.6.
5.1 Experimental
A Microtrac X-100 Particle Analyzer and a Microtrac Ultrafine Particle Analyzer (UPA) were both used to measure the PSD of these samples. The operation of the Mircotrac X-100 and Microtrac UPA analyzers was checked against National Institute of Standards and Technology (NIST)-traceable standards from Duke Scientific Corporation. The PSD results of NIST-traceable standards are documented in Appendix H.
The Microtrac X-100 Particle Analyzer measures particle diameter by scattered light from a laser beam projected through a stream of the sample particles diluted in a suspending medium. The amount and direction of light scattered by the particles is measured by an optical detector array and then analyzed to determine the size distribution of the particles. This measurement is limited to particles with diameters between 0.12 and 700 µm. The Microtrac UPA measures particle diameter by Doppler-shifted scattered light. This method is limited to particles with diameters between 3 nm and 6.5 µm.
The PSD of these three samples and their duplicates was measured on the Microtrac X-100 afterapplying a variety of circulation time, circulation flow rate, and sonication treatments. The treatments in successive order included 1) circulation at 40 mL/s, 2) circulation at 60 mL/s, 3) circulation at 60 mL/s with 40 W sonication for 90 sec, and 4) circulation at 60 mL/s with 40 W sonication for 90 sec for the second time. For each sample replicate, the PSD was measured three times and averaged. The PSD of the averaged data on a volume-weighted basis and on a number-weighted basis is reported. The PSD of these three samples and their duplicates was then repeated using the Microtrac UPA under conditions of Brownian motion. The results on a volume-weighted basis and on a number-weighted basis are reported.
The suspending medium for these analyses was surrogate supernatants based on the ICP-AES and IC data obtained for the applicable AZ-102 supernatant. The composition of these three supernatants is reported in Table 5.1.
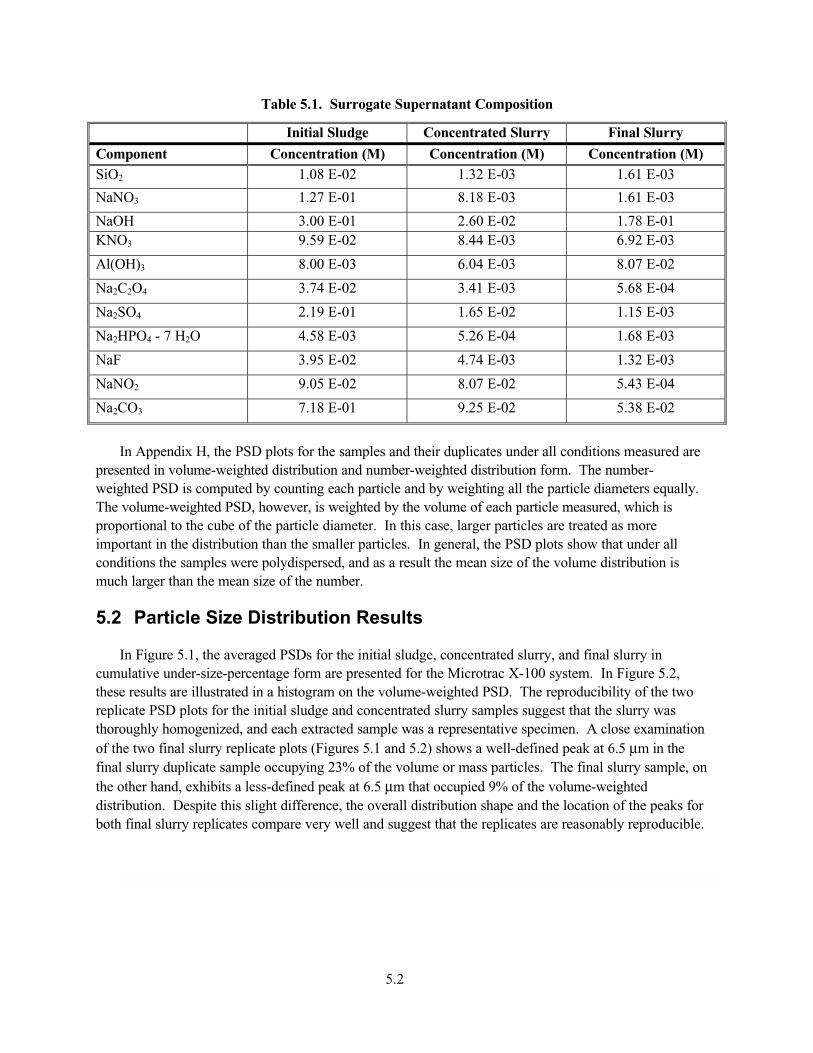
5.2
Table 5.1. Surrogate Supernatant Composition
Initial Sludge Concentrated Slurry Final Slurry
Component Concentration (M) Concentration (M) Concentration (M)SiO2 1.08 E-02 1.32 E-03 1.61 E-03
NaNO3 1.27 E-01 8.18 E-03 1.61 E-03
NaOH 3.00 E-01 2.60 E-02 1.78 E-01KNO3 9.59 E-02 8.44 E-03 6.92 E-03
Al(OH)3 8.00 E-03 6.04 E-03 8.07 E-02
Na2C2O4 3.74 E-02 3.41 E-03 5.68 E-04
Na2SO4 2.19 E-01 1.65 E-02 1.15 E-03
Na2HPO4 - 7 H2O 4.58 E-03 5.26 E-04 1.68 E-03
NaF 3.95 E-02 4.74 E-03 1.32 E-03
NaNO2 9.05 E-02 8.07 E-02 5.43 E-04
Na2CO3 7.18 E-01 9.25 E-02 5.38 E-02
In Appendix H, the PSD plots for the samples and their duplicates under all conditions measured are presented in volume-weighted distribution and number-weighted distribution form. The number-weighted PSD is computed by counting each particle and by weighting all the particle diameters equally.The volume-weighted PSD, however, is weighted by the volume of each particle measured, which is proportional to the cube of the particle diameter. In this case, larger particles are treated as more important in the distribution than the smaller particles. In general, the PSD plots show that under all conditions the samples were polydispersed, and as a result the mean size of the volume distribution is much larger than the mean size of the number.
5.2 Particle Size Distribution Results
In Figure 5.1, the averaged PSDs for the initial sludge, concentrated slurry, and final slurry in cumulative under-size-percentage form are presented for the Microtrac X-100 system. In Figure 5.2,these results are illustrated in a histogram on the volume-weighted PSD. The reproducibility of the two replicate PSD plots for the initial sludge and concentrated slurry samples suggest that the slurry was thoroughly homogenized, and each extracted sample was a representative specimen. A close examination of the two final slurry replicate plots (Figures 5.1 and 5.2) shows a well-defined peak at 6.5 µm in the final slurry duplicate sample occupying 23% of the volume or mass particles. The final slurry sample, on the other hand, exhibits a less-defined peak at 6.5 µm that occupied 9% of the volume-weighteddistribution. Despite this slight difference, the overall distribution shape and the location of the peaks for both final slurry replicates compare very well and suggest that the replicates are reasonably reproducible.
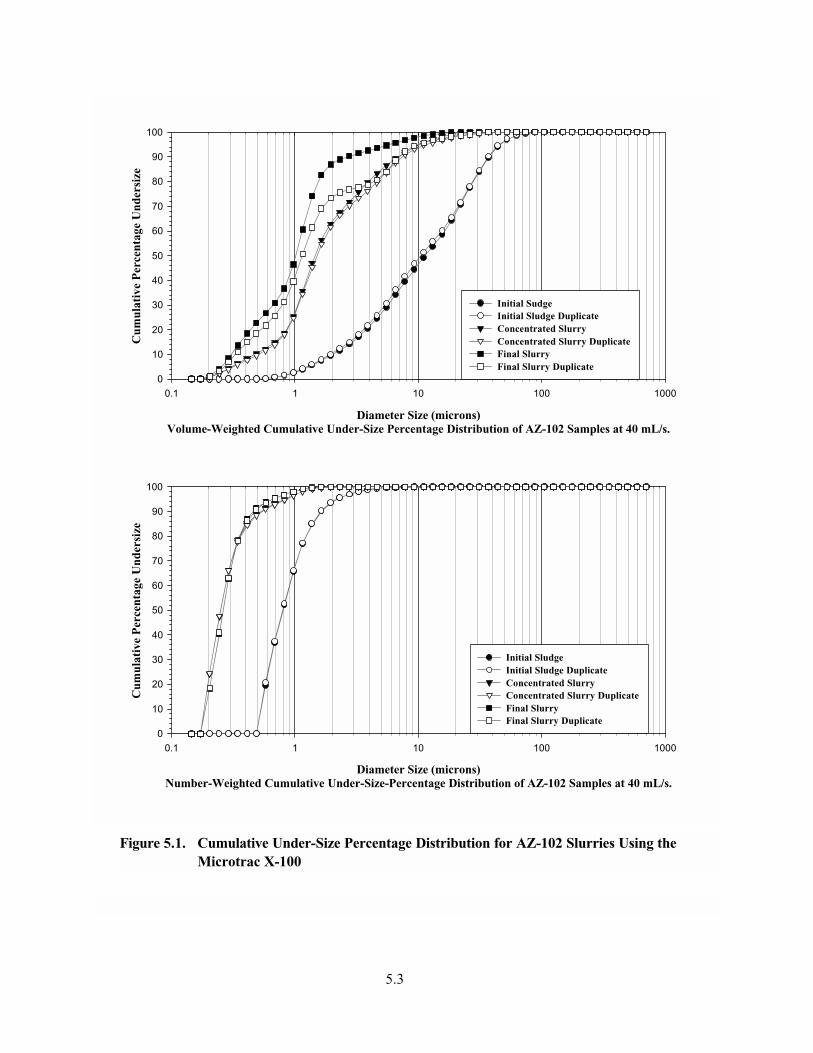
5.3
Figure 5.1. Cumulative Under-Size Percentage Distribution for AZ-102 Slurries Using the Microtrac X-100
Diameter Size (microns)Volume-Weighted Cumulative Under-Size Percentage Distribution of AZ-102 Samples at 40 mL/s.
0.1 1 10 100 1000
Cum
ulat
ive
Per
cent
age
Und
ersi
ze
0
10
20
30
40
50
60
70
80
90
100
Initial SudgeInitial Sludge DuplicateConcentrated Slurry Concentrated Slurry Duplicate Final Slurry Final Slurry Duplicate
Diameter Size (microns)Number-Weighted Cumulative Under-Size-Percentage Distribution of AZ-102 Samples at 40 mL/s.
0.1 1 10 100 1000
Cum
ulat
ive
Per
cent
age
Und
ersi
ze
0
10
20
30
40
50
60
70
80
90
100
Initial SludgeInitial Sludge DuplicateConcentrated Slurry Concentrated Slurry Duplicate Final SlurryFinal Slurry Duplicate
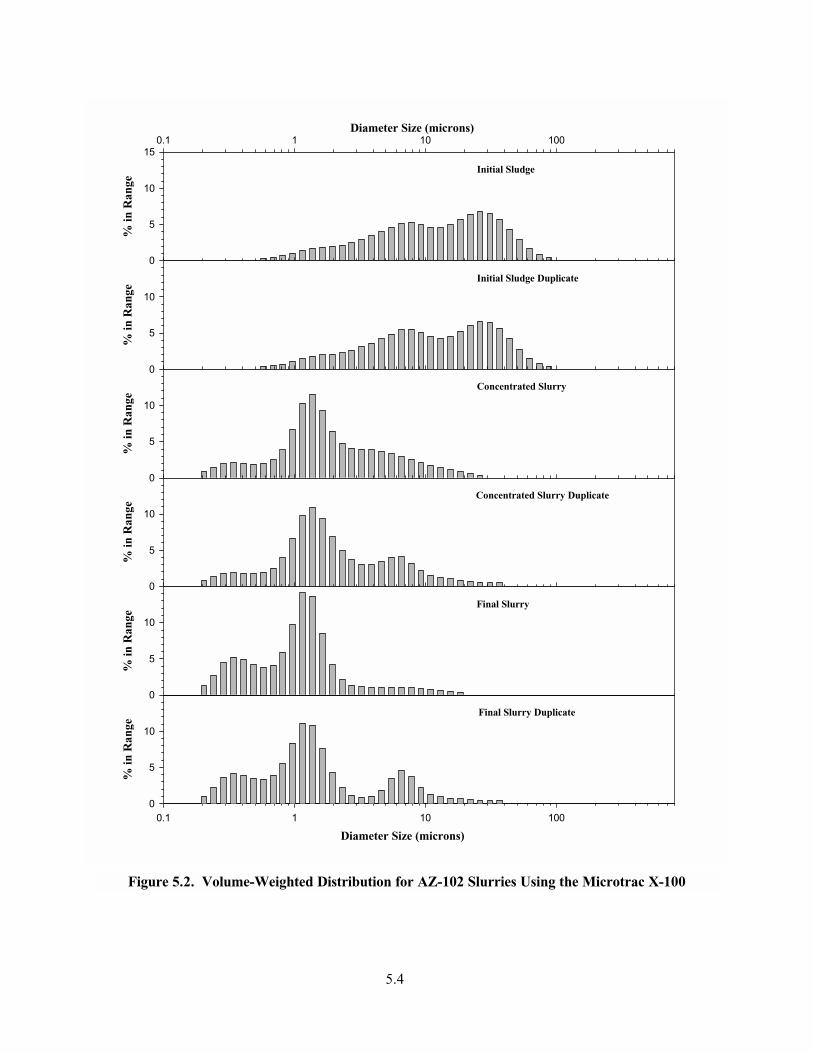
5.4
Figure 5.2. Volume-Weighted Distribution for AZ-102 Slurries Using the Microtrac X-100
Diameter Size (microns)0.1 1 10 100
% in
Ran
ge
0
5
10
15
0.1 1 10 100
% in
Ran
ge
0
5
10
Diameter Size (microns)
Initial Sludge
% in
Ran
ge
0
5
10
% in
Ran
ge
0
5
10
% in
Ran
ge
0
5
10
% in
Ran
ge
0
5
10
Initial Sludge Duplicate
Concentrated Slurry
Concentrated Slurry Duplicate
Final Slurry
Final Slurry Duplicate

5.5
The cumulative under-sized-percentage plots using the UPA system (see Figure 5.3) show the samples and their duplicates. Once again the replicates are reasonably reproducible within experimental error. The PSD analysis (Figures 5.1 and 5.3 combined) of the concentrated slurry and the final slurryindicate that the large majority (>90%) of the volume and number of the particles have diameters greater than 0.03 and less than 10 µm. The PSD of the initial slurry, on the other hand, indicates that 45 % of the volume of particles are greater than 0.1 and less than 10 µm, and 55% of the volume of particles have diameters greater that 10 and less that 75 µm.
The volume-weighted distribution plots (see Figure 5.2) of the initial sludge show a bimodal distribution formed from overlapping two Gaussian distribution peaks while the concentrated slurry and the final slurry distribution plots show a trimodal distribution. The major particle-size peaks along with the relative volume or number percentage that each peak represents are summarized in Tables 5.2 and 5.3.
Table 5.2. Peak Mode Location for Volume-Weighted Particle Distribution of AZ-102 Samples
X-100 (40 mL/sec) UPA (Brownian Motion)
Sample
ModeDiameter
(µµm) Vol %
ModeDiameter
(µµm) Vol %
24.280 51Initial Sludge
(CUF-AZ102 MU) 4.647 491.174 100
24.590 49 5.537 2Initial Sludge Duplicate
(CUF-AZ102 MU DUP) 4.604 51 1.412 98
1.561 92Concentrated Slurry
(CUF-AZ-102-005) 0.287 81.794 100
6.236 27 1.683 96
1.271 66
Concentrated Slurry
Duplicate
(CUF-AZ-102-005 DUP) 0.286 70.346 4
6.525 9 2.826 83
1.112 69Final Slurry
(CUF-C104-024)0.319 22
0.411 17
6.505 23 1.614 89
1.103 58 0.163 3
0.078 4
Final Slurry Duplicate
(CUF-C104-024 DUP)0.319 19
0.034 4
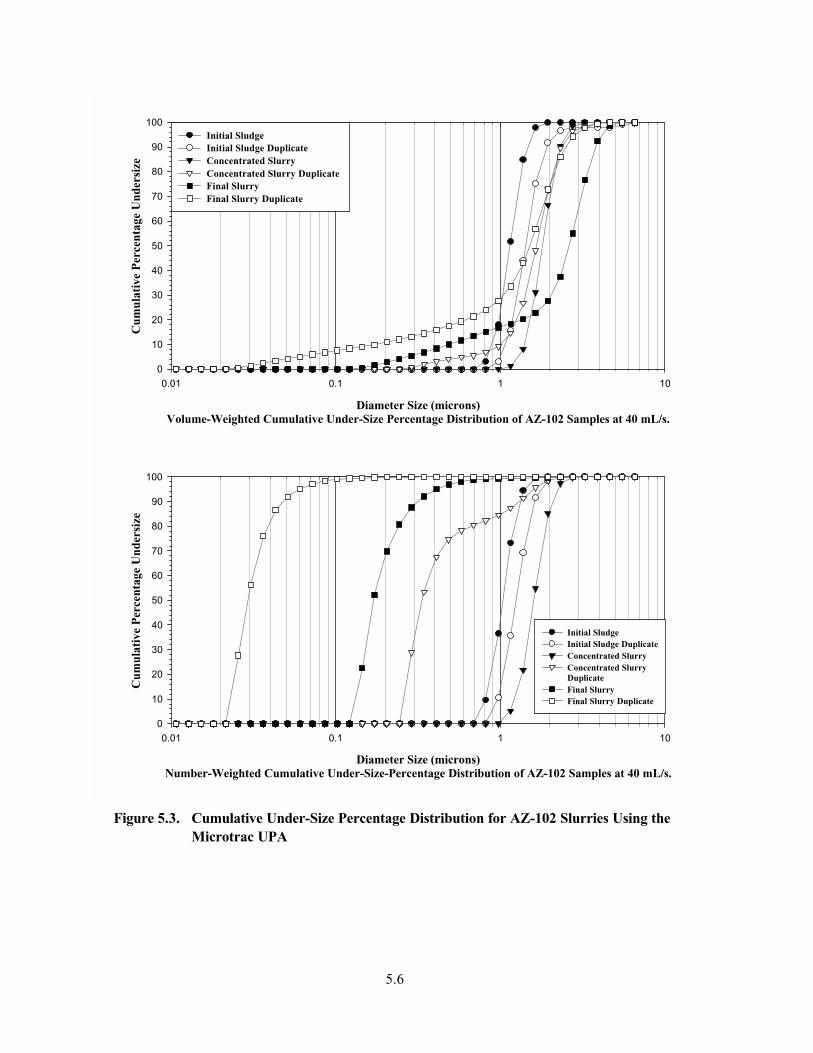
5.6
Figure 5.3. Cumulative Under-Size Percentage Distribution for AZ-102 Slurries Using the Microtrac UPA
Diameter Size (microns)Volume-Weighted Cumulative Under-Size Percentage Distribution of AZ-102 Samples at 40 mL/s.
0.01 0.1 1 10
Cum
ulat
ive
Per
cent
age
Und
ersi
ze
0
10
20
30
40
50
60
70
80
90
100Initial SludgeInitial Sludge DuplicateConcentrated Slurry Concentrated Slurry Duplicate Final Slurry Final Slurry Duplicate
Diameter Size (microns)Number-Weighted Cumulative Under-Size-Percentage Distribution of AZ-102 Samples at 40 mL/s.
0.01 0.1 1 10
Cum
ulat
ive
Per
cent
age
Und
ersi
ze
0
10
20
30
40
50
60
70
80
90
100
Initial SludgeInitial Sludge DuplicateConcentrated Slurry Concentrated SlurryDuplicateFinal SlurryFinal Slurry Duplicate

5.7
Table 5.3. Peak Mode Location for Number-Weighted Particle Distribution of AZ-102 Samples
X-100 (40 mL/sec) UPA (Brownian Motion)
Sample ModeDiameter
(µµm)
Num % ModeDiameter
(µµm)
Num %
Initial Sludge
(CUF-AZ102 MU)0.798 100 1.035 100
Initial Sludge Duplicate
(CUF-AZ102 MU DUP)0.793 100 1.245 100
0.979 7Concentrated Slurry
(CUF-AZ-102-005) 0.241 93
1.598 100
1.310 20Concentrated Slurry
Duplicate
(CUF-AZ-102-005 DUP)0.284 100
0.311 77
Final Slurry
(CUF-C104-024)0.261 100 0.169 100
Final Slurry Duplicate
(CUF-C104-024 DUP)0.260 100 0.029 100
The significant decrease in the volume-weighted distribution histogram from the initial sludge to the concentrated slurry shown in Figure 5.2 represents the extent of solids de-agglomeration after the solids were re-circulated in the CUF line for 6 hours at various crossflow-velocity and TMP conditions described in Table 3.1. The production of finer particles exhibited in the concentrated slurry PSD confirms that particle break-up is a significant factor in reducing filtration flux from Conditions 1 to 7 (see Figure 3.1). A possible explanation for reduction in flux can be described in terms of forming higher resistance “cakes” (deposited layer on the membrane surface) as the solids deposited at or near the membrane surface are enriched progressively with finer particles. In crossflow filtration, a slight decrease in the filtrate flux is caused by the formation of a porous filter cake as the particles are deposited on the membrane surface. However, as small fine particles begin to plug the filter cake, the filtrate flux could decrease very rapidly and necessitate back flushing to regenerate the membrane. Upon each backpulsingand progressive de-agglomeration, the dispersed fine particles are capable of penetrating the pores of the membrane and reducing the filtration flux further.
5.8
Figures 5.4 and 5.5 compare the volume- and number-weighted histograms of the three samples for the Microtrac X-100 at 40 and 60 mL/s circulation flow rate. Figure 5.6 and 5.7 compare the volume-weighted and number-weighted distribution of these samples before and after sonication. It can be seen from these plots (Figures 5.4, 5.5, and 5.6) that after the slurry was caustic leached and caustic washed, the nature of agglomerate compaction was changed. The final slurry solids are more shear sensitive and are easier to de-agglomerated compared to the concentrated slurry (same agglomeration compaction nature as initial slurry) under identical variation in the circulation flowrate and sonication treatments as the concentrated slurry.
Furthermore, the comparison of the volume-weighted distribution plots (see Figure 5.6 and 5.7) of the concentrated slurry and the final slurry before sonication show that the overall distribution shape and the location of the peaks in both samples (concentrated slurry and final slurry) are almost the same and similar, respectively.
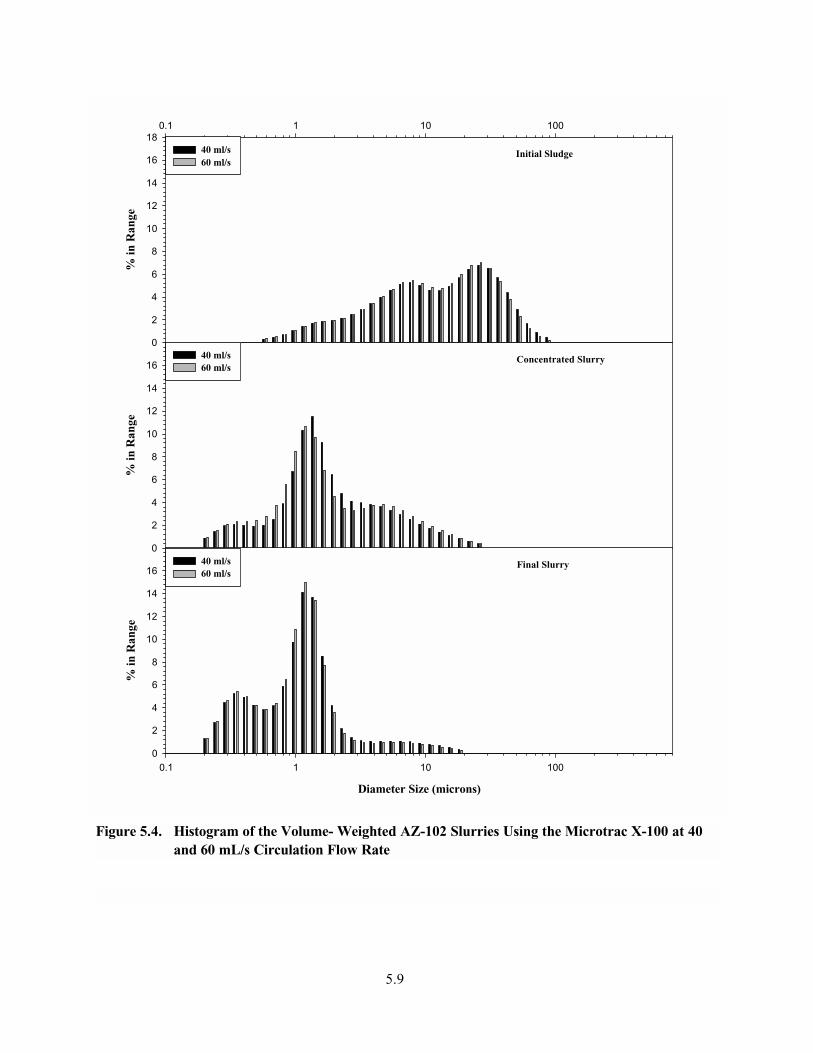
5.9
Figure 5.4. Histogram of the Volume- Weighted AZ-102 Slurries Using the Microtrac X-100 at 40 and 60 mL/s Circulation Flow Rate
0.1 1 10 100%
in R
ange
0
2
4
6
8
10
12
14
16
1840 ml/s60 ml/s
% in
Ran
ge
0
2
4
6
8
10
12
14
1640 ml/s 60 ml/s
Initial Sludge
Diameter Size (microns)
0.1 1 10 100
% in
Ran
ge
0
2
4
6
8
10
12
14
1640 ml/s 60 ml/s
Concentrated Slurry
Final Slurry
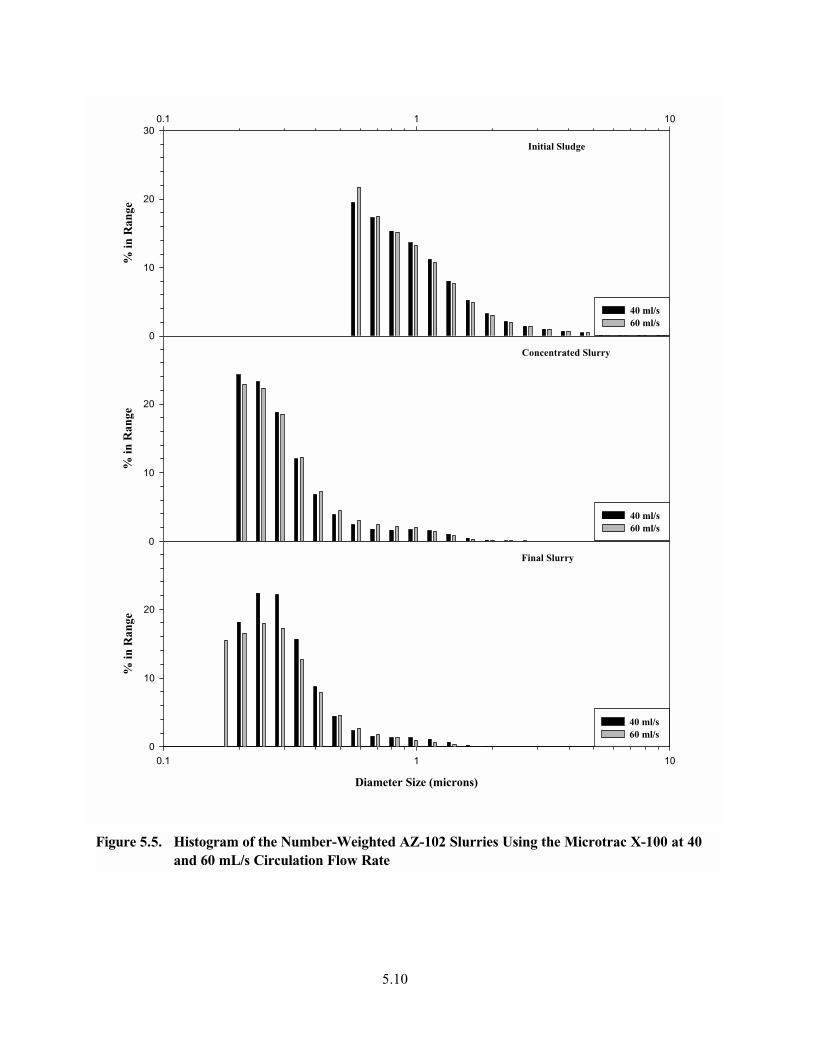
5.10
Figure 5.5. Histogram of the Number-Weighted AZ-102 Slurries Using the Microtrac X-100 at 40 and 60 mL/s Circulation Flow Rate
0.1 1 10%
in R
ange
0
10
20
30
40 ml/s 60 ml/s
% in
Ran
ge
0
10
20
40 ml/s 60 ml/s
Initial Sludge
Diameter Size (microns)
0.1 1 10
% in
Ran
ge
0
10
20
40 ml/s 60 ml/s
Concentrated Slurry
Final Slurry
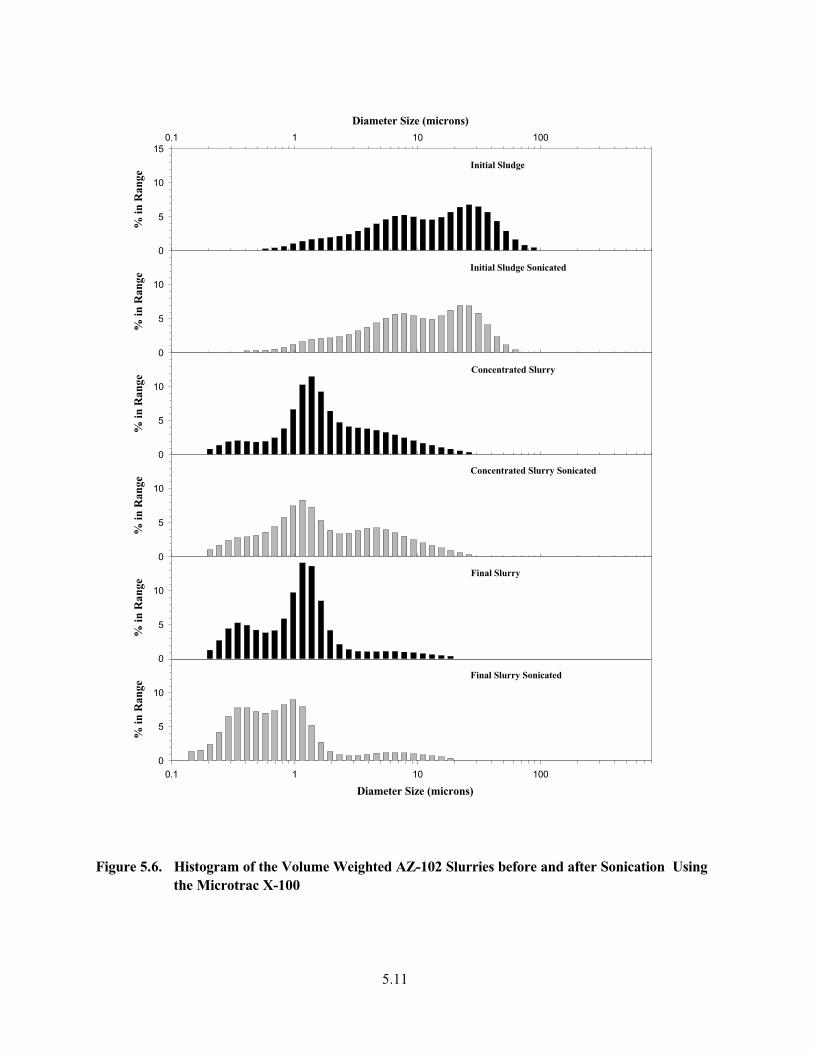
5.11
Figure 5.6. Histogram of the Volume Weighted AZ-102 Slurries before and after Sonication Using the Microtrac X-100
Diameter Size (microns)0.1 1 10 100
% in
Ran
ge
0
5
10
15
0.1 1 10 100
% in
Ran
ge
0
5
10
Diameter Size (microns)
Initial Sludge
% in
Ran
ge
0
5
10
% in
Ran
ge
0
5
10
% in
Ran
ge
0
5
10
% in
Ran
ge
0
5
10
Initial Sludge Sonicated
Concentrated Slurry
Concentrated Slurry Sonicated
Final Slurry
Final Slurry Sonicated
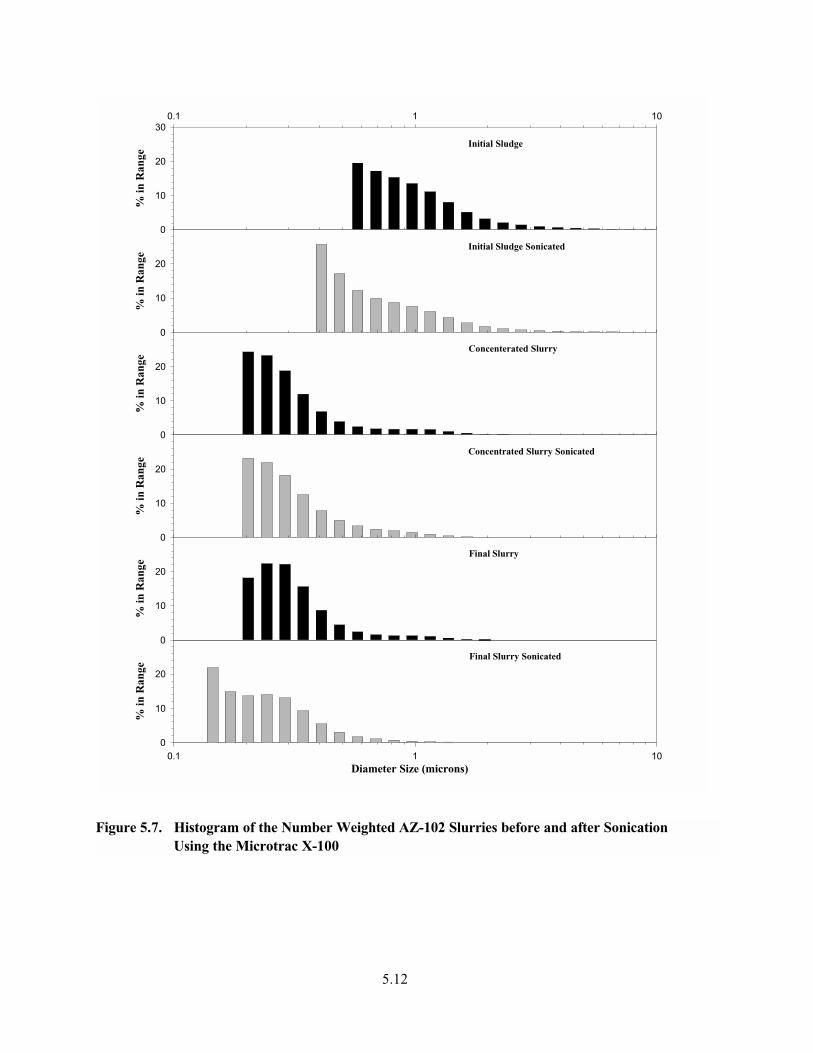
5.12
Figure 5.7. Histogram of the Number Weighted AZ-102 Slurries before and after SonicationUsing the Microtrac X-100
0.1 1 10
% in
Ran
ge
0
10
20
30
0.1 1 10
% in
Ran
ge
0
10
20
Diameter Size (microns)
Initial Sludge%
in R
ange
0
10
20
% in
Ran
ge
0
10
20
% in
Ran
ge
0
10
20
% in
Ran
ge
0
10
20
Initial Sludge Sonicated
Concenterated Slurry
Concentrated Slurry Sonicated
Final Slurry
Final Slurry Sonicated
6.1
6.0 Conclusions
Based on the testing and analysis performed on AZ-102 sludge described in this document, the following conclusions have been obtained. They have been divided into categories for clarity.
AZ-102 Crossflow Filtration
• For a slurry at 5.1 wt% insoluble solids, the average filtrate flux over 50 min of operation ranged from 0.046 to 0.126 gpm/ft2. The dominant variable affecting the filtrate flux data during the first three conditions appears to be operating time. During these conditions, there was a steady decline in filtrate flux. Changes in the TMP appeared to have little effect. For the three subsequent runs, the axial velocity and TMP may have slightly increased the flux rate.
• For a slurry at 13.7 wt% insoluble solids, the average filtrate fluxes ranged from 0.020 to 0.051 gpm/ft2 over 50 min of operation. This filtrate flux is ~2.3 times less than the low solids matrix, and ~2.7 times higher in solids concentration. Over the range of conditions studied, higher axial velocities improve filtrate flux. Once again, TMPs appear to have little effect.
• The filtrate DFs for 241Am (ratio of concentrations in the slurry to the concentration in the filtrate) were between 100,000 and 450,000 for the filtrates collected, indicating excellent solid-liquidseparations.
• A statistical model of filtrate flux was developed and found to be a function of axial velocity and run order. Based on this modeling effort, the optimum condition for both low and high solids loading is to maximize the axial velocity. Due to collinearities between pressure and velocity, and run order and solids concentration in the current data set, from a statistical standpoint, it is not possible to determine the effect of TMP and solids concentration on filtrate flux.
• Even after two cleanings with (1 M) nitric acid, the CUF was not capable of recovering the clean water filtrate flux. In full-scale operation, higher temperatures and longer cleaning times may be required. Acid cleaning at temperatures greater than ambient was not possible in the CUF due to the potential for corrosion of the CUF material.
AZ-102 Wash and Caustic Leach Testing
• Dilute caustic washing removed 80.4% of the sodium and >90% of the soluble anions, including nitrate, nitrite, and sulfate. Significant quantities of fluoride and cyanide were also removed. The only radioactive isotopes significantly removed by washing were 137Cs and possibly 99Tc, and 127I.
• The first caustic leach removed 60% of the aluminum, but only 1.2% was removed during the subsequent caustic wash steps. Caustic leaching also increased the removal of P as well as the water-soluble components, such as K and 137Cs.
• Fe, Al, and Na were the analytes of highest concentration, respectively, in the final composition of the final leached/washed sludge.
• The total mass of solids was reduced by approximately 44% during the course of water washing and caustic leaching, and the mass of HLW glass (assuming Al + Fe + Zr limiting the glass) was reduced by potentially ~27%.
6.2
AZ-102 Physical, Rheological, and Particle Size Properties
• The initial slurry exhibited significant plugging in the CUF during the start of operations. After several hours of operations, the plugging effects were reduced. The final slurry was found to entrain significant quantities of air that remained in the material for hours. This entrained air may have impacted the pumpability and filterability of the material, although entrained air and its effects were only observed on the final slurry.
• The initial dilute slurry, concentrated slurry, and final slurry were found to be yield pseudoplastic and thixotropic.
• There was a significant decrease in particle size from the initial as-received sludge to the concentrated slurry. This decrease is attributed to particle deagglomeration during pumping in the CUF. In contrast, there is less difference in particle size between the concentrated slurry and the final washed and leached material.
• The slurry exhibited increased shear sensitivity after washing and leaching as evidenced by its large reduction in number distribution after sonication.
7.1
7.0 References
Brooks, K. P., P. R. Bredt, G. R. Golcar, S. A. Hartley, M. W. Urie, J. M. Tingey, K. G. Rappe, and L. K. Jagoda. 1999. Ultrafiltration and Characterization of AW-101 Supernatant and Entrained Solids,BNFL-RPT-002 Rev. 0, PNWD-3000, Battelle Northwest, Richland, Washington.
Brooks, K. P., P. R. Bredt, G. R. Golcar, S. A. Hartley, M. W. Urie, K. G. Rappe, L. K. Jagoda, and M. W. Urie. 2000. Characterization, Washing, Leaching and Filtration of C-104 Sludge,BNFL-RPT-030 Rev. 0, PNWD-3024, Battelle Northwest, Richland, Washington.
Geeting, J.G.H., and B. A. Reynolds. 1997. Bench-Scale Crossflow Filtration of Hanford Tank C-106,C-107, B-110, and U-110 Sludge Slurries, PNNL-11652. Pacific Northwest National Laboratory, Richland, Washington.
Hallen, R. T., P. R. Bredt, K. P. Brooks, and L. K. Jagoda. 2000. Combined Entrained Solids and Sr/TRU Removal from AN-107 Diluted Feed, PNWD-3035, Battelle Northwest, Richland, Washington.
Tarleton, E. S. and R. J. Wakeman. 1994. Understanding Flux Decline in Crossflow Microfiltration:Part II—Effects of Process Parameters. Trans IchemE, Vol 72, Part A, May 1994. pp. 431-439.
U.S. Department of Energy, Richland Operations (DOE-RL). 1996. River Protection Project Waste Treatment Plan (RPP-WTP) (formerly TWRS) Privatization Contract, DE-RP06-96RL13308, Richland, Washington.
Appendix A: CUF Filtration, Washing and Leaching Test Instructions and Laboratory
Record Book
A.1
Appendix A: CUF Filtration, Washing and Leaching Test Instructions and Laboratory Record Book
Appendix B: Testing Mass Balance

B.1
Appendix B: Testing Mass Balance
Appendix C: Analytical Results
C.1
Appendix C: Analytical Results
Appendix D: Crossflow Filtration Raw Data
D.1
Appendix D: Crossflow Filtration Raw Data
Appendix E: Physical Properties Test Instruction
E.1
Appendix E: Physical Properties Test Instruction
Appendix F: Rheograms for AZ-102 and Standards

F.1
Appendix F: Rheograms for AZ-102 and Standards
Appendix G: Key Personnel Affiliated with AZ-102 Testing

G.1
Appendix G: Key Personnel Affiliated with AZ-102 Testing
Name Responsibility Telephone/emailEugene Morrey Battelle Project Manager (509) 376-1982
[email protected] Kurath Battelle Project Engineer (509) 376-6752
[email protected] Brooks Ultrafiltration Task Manager,
Filtration and CUF Testing(509) [email protected]
Paul Bredt Rheology and Physical Properties Measurement
(509) [email protected]
Scott Cooley Statistical Analysis (509) [email protected]
Mike Urie Chemical and Radiochemical Analysis
(509) [email protected]
Ken Rappe CUF Design and Testing (509) [email protected]
Gita Golcar Particle Size Distribution Measurement
(509) [email protected]
Lynette Jagoda CUF Testing (509) [email protected]
Rick Steele Hot Cell Operations (509) [email protected]
Appendix H: Particle Size Distribution Experimental Raw Data
H.1
Appendix H: Particle Size Distribution Simulant Recipes and Experimental Raw Data
PNWD-3045BNFL-RPT-038 Rev. 0
Distr.1
Distribution
No. ofCopies
OFFSITE
No. ofCopies
ONSITE
2 DOE/Office of Scientific and Technical Information
5 British Nuclear Fuels, LimitedM. E. Johnson (4) BN-FLE. Higginbotham BN-FL
1 CHGD. J. Washenfelder H6-15
20 Pacific Northwest National LaboratoryP. R. Bredt P7-25K. P. Brooks (5) K6-24G. R. Golcar K6-24R. T. Hallen K2-12S. K. Cooley K5-12L. K. Jagoda K6-24D. E. Kurath (2) P7-28E. V. Morrey P7-28K. G. Rappe K6-28M. W. Urie P7-22Technical Report Files (5) K1-06