Embed Size (px)
Citation preview

ARTICLE
Genome-wide scan identifies a copy number variableregion at 3p21.1 that influences the TLR9 expressionlevels in IgA nephropathy patients
Fabio Sallustio1,2,3,7, Sharon N Cox1,7, Grazia Serino1,2, Claudia Curci2, Francesco Pesce4, Giuseppe De Palma2,Aikaterini Papagianni5, Dimitrios Kirmizis5, Mario Falchi4 and Francesco P Schena*,1,2,6 on behalf of theEuropean IgAN Consortium
Immunoglobulin A nephropathy (IgAN) is a complex multifactorial disease characterized by genetic factors that influence the
pathogenesis of the disease. In this context, an intriguing role could be ascribed to copy number variants (CNVs). We performed
the whole-genome screening of CNVs in familial IgAN patients, their healthy relatives and healthy subjects (HSs). In the initial
screening, we included 217 individuals consisting of 51 biopsy-proven familial IgAN cases and 166 healthy relatives. We
identified 148 IgAN-specific aberrations, specifically 105 loss and 43 gain, using a new statistical approach that allowed us to
identify aberrations that were concordant across multiple samples. Several CNVs overlapped with regions evidenced by previous
genome-wide genetic studies. We focused our attention on a CNV located in chromosome 3, which contains the TLR9 gene and
found that IgAN patients characterized by deteriorated renal function carried low copy number of this CNV. Moreover, the TLR9gene expression was low and significantly correlated with the loss aberration. Conversely, IgAN patients with normal renal
function had no aberration and the TLR9 mRNA was expressed at the same level as in HSs. We confirmed our data in another
cohort of Greek subjects. In conclusion, here we performed the first genome-wide CNV study in IgAN identifying structural
variants that could help the genetic dissection of this complex disease, and pointed out a loss aberration in the chromosome 3,
which is responsible for the downregulation of TLR9 expression that, in turn, could contribute to the deterioration of the renal
function in IgAN patients.
European Journal of Human Genetics advance online publication, 8 October 2014; doi:10.1038/ejhg.2014.208
INTRODUCTION
Immunoglobulin A nephropathy (IgAN) is the most common form ofprimary glomerulonephritis worldwide among patients undergoingrenal biopsy.1,2 The clinical course is extremely variable ranging fromcomplete spontaneous remission to persistent asymptomatic micro-scopic hematuria and to chronic progressive renal failure.3–5 Thepathogenesis of this disease seems to have a strong genetic component,which is demonstrated by familial clustering, striking ethnic variationin prevalence and reports of large pedigrees containing multipleaffected individuals.6
Genome-wide linkage studies (GWLS) and genome-wide associa-tion studies (GWAS) have been performed to identify specific geneticmarkers involved in IgAN. Three GWLS of familial IgAN havereported linkages at 2q36, 4q26–31, 6q22–23 and 17q12–22, but nodisease genes were identified within these areas.7–9 Three GWAS thatallows hypothesis-free examination have been performed for IgAN,leading to the identification of susceptibility alleles in the majorhistocompatibility complex (MHC) region on chromosome 6p10–12
and additional loci on chromosomes 1q32, 22q12, 17p13 and 8p23.So far, no genetic variants or genes underlying these loci have been
identified as causative or affecting the pathology, plausibly because ofthe presence of genetic/environmental and locus heterogeneity and tocontribution from noncoding susceptibility alleles such as pointmutations or structural genomic variants within intronic or promoterregions.13
In this context, an important role could be ascribed to copy numbervariants (CNVs) that have been recognized as an important source ofgenetic variations in humans.14 CNVs have already been shown to beassociated with several complex/common disorders. As rare aberra-tions are abundant in the genome, they could represent an importantsource of variability and could be used to explore the relationshipbetween candidate genes and disease, defining new pathophysiologicpathways.15
CNVs may have an important role also in IgAN, but, to date, theirinvolvement in the disease has not been extensively investigated.Recently, a deletion of the CFHR1 gene residing in the chromosome1q31-32.1 has been identified and it seems implicated in conferringreduced susceptibility to IgAN.11 Here, we carried out a genome-wideCNV study in IgAN patients and identified some structural variantsthat could help to dissect the complex genomic setting of the disease.
1Department of Emergency and Organ Transplantation, University of Bari, Bari, Italy; 2CARSO Consortium, Strada Provinciale Valenzano-Casamassima Km 3, Valenzano, Bari,Italy; 3Dipartimento di Scienze e Tecnologie Biologiche ed Ambientali (DiSTeBA), Università del Salento, Lecce, Italy; 4Department of Genomics of Common Disease, School ofPublic Health, Imperial College London, London, UK; 5Department of Nephrology, Hippokration General Hospital, Aristotle University, Thessaloniki, Greece; 6Schena Foundation,Research Center of Kidney Diseases, Valenzano, Bari, Italy
*Correspondence: Professor FP Schena, Department of Emergency and Organ Transplantation, University of Bari, Policlinico, Piazza G. Cesare no. 11, 70124 Bari, Italy.Tel: +39 80 5478869 4602121; Fax: +39 80 4602121; E-mail: [email protected]
7These authors contributed equally to this work.
Received 23 October 2013; revised 1 August 2014; accepted 29 August 2014
European Journal of Human Genetics (2014), 1–9& 2014 Macmillan Publishers Limited All rights reserved 1018-4813/14www.nature.com/ejhg

Moreover, we identified a CNV spanning the TLR9 gene that couldcontribute to the progression of renal damage in IgAN patients.
MATERIALS AND METHODS
Sample donorsA total of 51 biopsy-proven familial IgAN patients and 166 healthy relatives(HRs) from 25 family trees, 27 biopsy-proven IgAN patients and 77 unrelatedhealthy subjects (HSs) were included in the whole study on Italian subjects(Table 1 and Supplementary Figures 1 and 2). The IgAN cohort withdeteriorated renal function (DRF) was constituted by 15 subjects, unrelatedwith subjects of the initial screening cohort, characterized by moderate andsevere renal damage, according to a classification system recently reported,16
high levels of serum creatinine and proteinuria, low estimated glomerularfiltration rate (eGFR) and by kidney failure events for more than 25% ofpatients at the follow-up. The cohort of IgAN patients with normal renalfunction (NRF) was constituted by 12 subjects, without severe renal damage orkidney failure events at the time of follow-up. All patients had a minimumfollow-up of 5 years. HRs and HSs were negative for microscopic hematuria inthe urine. For validation purposes, we included in this study a Greek cohortthat was composed of 57 IgAN patients (39 DRF and 18 NRF), 28 HRs and20 HSs. The main demographic and clinical features of patients and controls,included in the Italian and Greek cohorts, are summarized in Tables 1 and 2,respectively, and refer to the time of the follow-up. Histologic classificationsrefer to the time of biopsy-proven diagnosis. In addition, subjects sufferingfrom diabetes, chronic lung disease, cardiovascular diseases, neoplasm orinflammatory diseases and IgAN patients receiving corticosteroids and immuno-suppressive agents were excluded from the study. Furthermore, patients sufferingfrom an acute viral or bacterial upper respiratory tract infection were alsoexcluded before hand. All patients gave their informed consent for the study.DNA was isolated from whole blood of IgAN patients and HSs by QiagenQIAamp DNA Blood Midi Kit (Qiagen Srl, Milan, Italy).
Genotyping, CNV detection and annotationGenome-wide genotyping for CNV analysis was performed with HiScanSQIllumina platform (Illumina Inc, San Diego, CA, USA) on HumanCytoSNP-12allowing the study of ~ 300 000 selected tag SNPs and providing nearly thesame genomic coverage in the Caucasian European (CEU) population as acompeting 924 000 marker array. The median marker spacing of this Illuminaplatform was of 6.2 kb.SNPs with genotype call rateso95% and samples with call rateso95% were
eliminated from the analysis. To minimize potential intensity batch effects forCNV analysis, we generated a cluster file made of the 217 samples internal tothe project (ie, mostly HRs) that was used to normalize and recluster all
samples of the project for better CNV calling. Moreover, we tested experiments
for batch and plate effects by graphing individual plate membership against two
significant principal components of genotype data (Supplementary Figure 3).
We detected no batch or plate effects and no evidence of clustered or individual
outliers. Genotypes with Mendelian and non-Mendelian inconsistencies were
o1% and were removed from the analysis. The genotype data of controls
unrelated with IgAN subjects were from the Illumina Genotype Control
Database and consisted of 89 validated samples from Caucasian HSs genotyped
on Illumina HumanCytoSNP-12 (Illumina HapMap CEU, HumanCytoSNP-
-12v2, gene expression ominbus (GEO) accession number: GSE17123). CNV
analysis was performed with multiple sample analysis (MSA) algorithm17 by
GenePattern genomic analysis platform.18 To assess the significance of
concordant aberration from a set of samples given single sample aberration
calls, MSA uses a nonparametric approach based on the significance testing for
aberrant copy number algorithm,19,20 which provides permutation-based
concordance P-values for each location. Six SNP probes for each circular
binary segmentation were used by MSA to identify each CNV. Data were
obtained using tests with 1000 permutations. MSA directly controls the family-
wise type 1 error rate (FWER) for multiple locations of the overall procedure.
The false discovery rate (FDR) and FWER are controlled for all noise levels, and
the specificity remains high for reasonable FDR (FDRo0.05). The detection
power of MSA, calculated as the rate of successfully detecting aberrations across
100 different data sets, each of 50 samples, was of 87% true positives for o5%
FDR.17 We selected CNVs with FDRo0.05 and frequency40.35 (present only
in IgAN patients but absent both in HRs and in HSs or present in IgAN
patients with a difference in frequency 40.35 between IgAN subjects and HRs
or HSs). Frequency statistic measures the percent of samples with a given
aberration at a given position. Systematic and integrative analysis of identified
CNVs was performed by DAVID bioinformatics resources (human reference
genome hg18).21,22 CNV analyses were also carried out with PennCNV and
with the PBAT module, which has been developed as a generalization of family-
based association tests to identify CNVs at the genome-wide level, as
implemented in SVS 7.5 software (Golden Helix, Bozeman, MT, USA). Data
were corrected for multiple testing (number of permutations= 1000). This
allows us to determine CNV contribution to complex diseases in a family-based
setting.23 We used Fisher’s exact test for testing differences in distributions of
CNVs in patients and HSs. Microarray data of the IgAN patients and HR
genotyped on Illumina HumanCytoSNP-12 are available under accession
number GSE44974 at the GEO (http://www.ncbi.nlm.nih.gov/geo/). Data
obtained with this study are available under the accession number nstd91 in
the database of genomic structural variation (http://www.ncbi.nlm.nih.gov/
dbvar/). CNV regions are described following the recommendations of the
human genome variation society for variant nomenclature.
Table 1 Clinical and demographic features of IgAN patients, healthy relatives and HSs included in the studya
IgANb Healthy relativesb IgAN with DRF IgAN with NRF HSs
Number 51 166 15 12 77
Male/female 36/15 65/101 9/6 12/0 59/18
Age (years) 30±18 ND 49±11 32±7 47±2
sCr (mg/dl) 2.1±0.6 ND 3.3±0.6 1.0±0.1 0.87±0.1
eGFR (ml/min per 1.73m2) 71.6±7.5 ND 49.8±11.0 111.0±6.3 118.4±6.2
Proteinuria (g/24 h) 1.12±0.90 ND 0.99±0.24 0.38±0.07 ND
Hypertension (%) 22 (43%) ND 8 (53%) 3 (25%) 0 (0%)
Histologic classification G1 (21/51) 41%
G2 (12/51) 24%
G3 (18/51) 35%
ND G1 (3/15) 20.0%
G2 (6/15) 40.0%
G3 (6/15) 40.0%
G1 (7/12) 58%
G2 (5/12) 42%
G3 (0/10) 0%
ND
Follow-up (months) 61±17 ND 59±11 60±12 ND
Kidney failure events (%) 20 (39%) 0 (0%) 4 (27%) 0 (0%) 0 (0%)
Abbreviations: eGFR, estimated glomerular filtration rate calculated with the Cockcroft–Gault formula (ml/min per 1.73m2); G1, grade 1 mild; G2, grade 2 moderate; G3, grade 3 severe; HSs,healthy subjects; ND, not determined; sCr, serum creatinine. About 60% of IgAN subjects were DRF.aData refer to the time of the follow-up. Histologic classifications refer to the time of biopsy-proven diagnosis. Values are expressed as mean±SEM.bSubjects genotyped on Illumina HumanCytoSNP-12.
CNVs in IgA nephropathyF Sallustio et al
2
European Journal of Human Genetics
CNV validation assaysIndividual CNV assays were performed by duplex Taqman real-time PCRassays to confirm findings on new candidates from the genome-wide analysis.Chr3.hg18:g.(?_52 031 010)_(52 260 722_?)del, chr2.hg18:g.(?_154 859 630)_(154 940 624_?)dup and chr6.hg18:g.(?_33 229 433)_(33 246 998_?)del CNVassays were supplied from Applied Biosystems (Life Technologies Italia,Monza, Italy) (Assay ID, respectively: Hs00478359_cn, chr3: 52 185 057;Hs04686033_cn, chr2: 155 171 899; Hs02834168_cn, chr6: 33 133 960). RNaseP(TaqMan copy number reference assay, part no. 4403328) was used as areference gene. All primers and probes were supplied from Applied Biosystems,and duplex real-time PCR assays were performed according to the TaqMancopy number assay protocol and tested in quadruplicate (Applied Biosystems).All data were further analyzed using the CopyCaller software version 2.0(Applied Biosystems). The software generates raw copy values (RCVs) thatrepresent a non-integer number of copy calculated, whereas predicted copynumber (PCN) is defined as an integer number of copy determined by thealgorithm (0, 1, 2 or 3+). Copy number gain is defined as PCN 42, whereascopy number loss is defined as PCNo2. In both the Italian and Greek cohorts,the TLR9 copy number was in Hardy–Weinberg equilibrium (Po0.75).
qRT-PCRTotal RNA, including small RNA fractions, was isolated from peripheral bloodmononuclear cells of IgAN patients and HSs and reverse transcribed withmiScript Reverse Transcription Kit (Qiagen Srl) following the manufacturer’sinstructions. For TLR9 expression analysis, total RNA was reverse transcribedwith QuantiTect Reverse Transcription Kit (Qiagen Srl) following themanufacturer’s instructions. qRT-PCR amplification reactions were performedin triplicate in 25 μl final volumes using SYBR Green chemistry on an iCycler(Bio-Rad Laboratories S.r.l., Segrate, Milan, Italy). qRT-PCR was performedusing the QuantiTect Primer Assay and the QuantiFast SYBR Green PCR mix(Qiagen Srl). Genes were amplified according to the manufacturer’s directions.The β-actin gene amplification was used as a reference standard to normalizethe target signal.
RESULTS
Identification of concordant aberrations in IgAN patientsWe performed a whole-genome screening of CNVs in 51 biopsy-proven IgAN patients and their HRs from 25 families living inSouthern Italy. A total of 217 individuals consisting of 51 IgAN casesand 166 HRs were included in the initial screening (Table 1 and
Supplementary Figure 2). A further group of 89 unrelated HSs fromthe Illumina HapMap CEU (HumanCytoSNP-12v2, GEO accessionnumber: GSE17123) was included in the analysis as additional control.The initial association analysis of structural genetic variations wasperformed by MSA algorithm, which is capable of finding concordantaberrations across classes of samples.17 MSA was applied to each classof samples: IgAN patients, HRs and unrelated HSs. MSA providedpermutation-based concordance P-values for each location. Thisapproach allowed us to leverage multiple samples, simultaneouslyincreasing the power of the analysis and the resolution, even workingon quite little sample size.17,19,24–26 Moreover, MSA algorithm enabledus to identify aberrations that could be concordant across multiplesamples but have lower amplitudes or small widths, which singlesample methods could not detect. We obtained, for each analyzedchromosome and for each sample class, a list of gain and lossconcordant aberrations scored with FDR and with frequency ofaberrations across the multiple samples for each location.Then, we filtered the CNVs that were present in IgAN patients with
FDR o0.05 and frequency40.35 to study aberrations occurring mostfrequently in patients. We identified 148 aberrations, of which 105were loss and 43 were gain (Supplementary Table 1). These CNVswere not uniformly distributed among the 22 autosomal chromo-somes, but were present mainly in chromosomes 2 (9.51%),7 (9.38%), 17 (9.31%), 19 (8.66%) and 22 (9.37%) (SupplementaryFigure 4A). The size of CNV ranged from 6.6 to 428 kb but most werein the 10–50 kb range (Supplementary Figure 4B and C).Then, we performed the annotation of all the concordant CNVs
found in IgAN patients (Supplementary Table 2). A number of CNVswere found within or in close proximity to regions identified in otherGWLS and GWAS (Table 3). In particular, the aberration chr6.hg18:g.(?_30 040 321)_(30 051 930_?)del contained the MHC class I antigenand HLA complex group 9 genes, and, most importantly, this areacontained the SNP rs2523946 associated with IgAN identified in arecent Chinese GWAS12 that surpassed the genome-wide significance.The aberrations chr6.hg18:g.(?_31 525 641)_(31 551 542_?)del andthe chr6.hg18:g.(?_33 229 433)_(33 246 998_?)del, containing theCOL11A2 (collagen, type XI, alpha 2 isoform 1), were found in veryclose proximity to SNPs that gave multiple associations in the MHCclass I region and HLA complex group genes identified by threeindependent GWAS.10–12 Moreover, the loss chr6.hg18:g.(?_134 801-335)_(134 848 458_?)del overlapped with the region named IGAN1identified in a GWLS.7 The aberrations chr17.hg18:g.(?_49 461 854)_(49 645 340_?)dup, chr17.hg18:g.(?_46 910 906)_(46 938 930_?)dup andchr17.hg18:g.(?_51 702 512)_(51 779 366_?)dup, containing ankyrin-repeat and fibronectin type III domain gene, overlapped with theregion found in linkage in our previous GWLS.8
We also performed the CNV analysis in a family-based setting usingthe PBAT algorithm.23 Only significant markers with a P-value o0.05in familial IgAN patients were further considered for the analysis;these were annotated and matched with CNVs identified with MSA.We found 48 markers from PBAT that intersected 43 CNVsindentified by MSA within a distance of 500 kb (SupplementaryTable 3). In particular, we confirmed again the involvement of theregion on chromosome 17q12–22 identified in our GWLS8 by chr17.hg18:g.(?_51 702 512)_(51 779 366_?)dup and chr17.hg18:g.(?_49 461-854)_(49 645 340_?)dup CNVs (Supplementary Table 4). Moreover,we performed a CNV analysis using the PennCNV model27 and found36 regions that overlap with the aberrations identified by MSA withina distance of 600 kb (Supplementary Table 4).
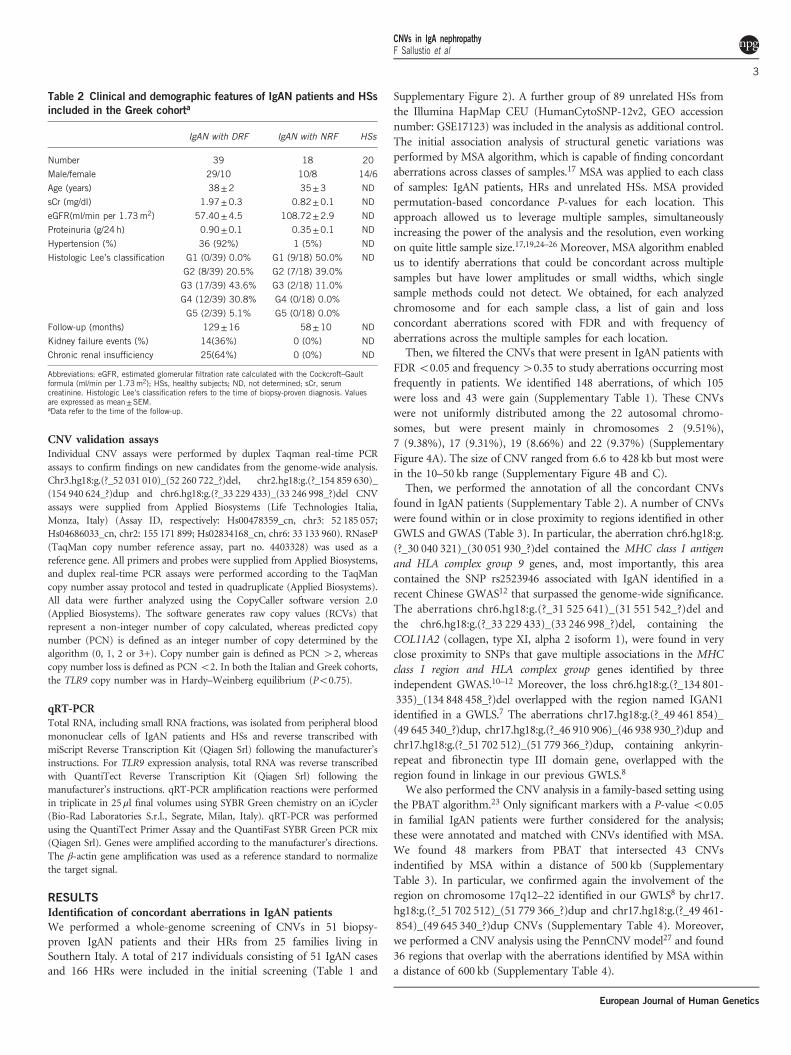
Table 2 Clinical and demographic features of IgAN patients and HSs
included in the Greek cohorta
IgAN with DRF IgAN with NRF HSs
Number 39 18 20
Male/female 29/10 10/8 14/6
Age (years) 38±2 35±3 ND
sCr (mg/dl) 1.97±0.3 0.82±0.1 ND
eGFR(ml/min per 1.73m2) 57.40±4.5 108.72±2.9 ND
Proteinuria (g/24 h) 0.90±0.1 0.35±0.1 ND
Hypertension (%) 36 (92%) 1 (5%) ND
Histologic Lee’s classification G1 (0/39) 0.0%
G2 (8/39) 20.5%
G3 (17/39) 43.6%
G4 (12/39) 30.8%
G5 (2/39) 5.1%
G1 (9/18) 50.0%
G2 (7/18) 39.0%
G3 (2/18) 11.0%
G4 (0/18) 0.0%
G5 (0/18) 0.0%
ND
Follow-up (months) 129±16 58±10 ND
Kidney failure events (%) 14(36%) 0 (0%) ND
Chronic renal insufficiency 25(64%) 0 (0%) ND
Abbreviations: eGFR, estimated glomerular filtration rate calculated with the Cockcroft–Gaultformula (ml/min per 1.73m2); HSs, healthy subjects; ND, not determined; sCr, serumcreatinine. Histologic Lee’s classification refers to the time of biopsy-proven diagnosis. Valuesare expressed as mean±SEM.aData refer to the time of the follow-up.
CNVs in IgA nephropathyF Sallustio et al
3
European Journal of Human Genetics

Validation of CNVs concordant in IgAN patientsWe further analyzed and validated some CNVs identified with MSA,as this algorithm has a better capacity in identifying tightest multiplesample concordance for single regions through footprint statistics.We validated some regions with low FDR values and high-frequencyscore and those containing genes that could be putatively implicated inthe disease: the gain chr2.hg18:g.(?_154 859 630)_(154 940 624_?)dupcontaining GALNT13 gene, the loss chr3.hg18:g.(?_52 031 010)_(52260 722_?)del containing, among others, the TLR9 gene, the loss chr6.hg18:g.(?_33 229 433)_(33 246 998_?)del containing the COL11A2gene that is found in close proximity to SNPs that reached genome-wide significance of association for IgAN in three independent GWASin the MHC class I locus.10–12 We performed individual CNV assaysby Taqman real-time PCR on these specific regions in 15 IgANpatients and 15 HRs randomly selected from the cohort of subjectsused for the whole-genome screening. High copy numbers (CN42)of the GALNT13 gene were detected more frequently in IgAN patientscompared with HRs (Figure 1a and b; P= 0.0018). Also, a significantassociation of COL11A2 and TLR9 CNVs, with respect to lossaberrations (CNo2), was evident in the replication experiment withreal-time PCR assays (Figures 1c–f; Po0.0001). We validated thesedata also by further Taqman CNV assays designed in other CNV areas(Supplementary Figure 5). Differences between the Taqman CNVassays were present. This variance ranged from 1 to 20%, stillmaintaining the significant differences between patients and HRs.Moreover, we performed an enrichment analysis of cytogenic
location of aberrations found in IgAN patients and obtained asignificant enrichment of cytobands of chromosomes 2 and 7, andoverall of chromosome 3 region, containing the TLR9 CNV(Supplementary Table 5).
TLR9 CNV validation in different cohorts of IgAN patientsAmong the most significant enriched cytobands, we found the 3p21.3containing the TLR9 gene. This receptor has also been found to beinvolved in IgAN;4,28,29 thus, we decided to focus our attention on thechr3.hg18:g.(?_52 031 010)_(52 260 722_?)del CNV enclosing, amongothers, the TLR9 gene.We therefore extended the validation of the TLR9 CNV by TaqMan
Copy Number Assays to 51 IgAN cases, 106 HRs and 77 HSs notrelated with IgAN families (Figure 2a–c), and on a geographicallydistinct cohort of 39 IgAN patients with DRF, 28 HRs and 20 HSs ofGreek ethnicity (Figures 2d–f). In both the populations, we confirmedthe differences in frequencies between the IgAN patients with DRFand HRs or HSs. The TLR9 loss frequency gap between the twopopulations for IgAN patients was 11%.At this point, to evaluate the relationship between the loss
aberration and TLR9 gene expression, we selected 12 Italian IgANpatients with DRF and 12 HRs included in the genome-wide CNVscreening whose RNA was available. The differences in CNVsfor TLR9 were still significant in patients with respect to HRs(Figure 3a and b; Po0.001) and the TLR9 expression in IgANpatients was significantly lower compared with HRs (Figure 3c;Po0.0001) and strictly correlated with the CNV values, so that higherthe CNV, higher was the TLR9 gene expression (Figure 3d; Pearson'sr= 0.57, P= 0.0068).Then, we validated our data in an additional independent cohort of
15 IgAN patients with DRF and 15 HSs, not included in the initialscreening, whose RNA was available. We confirmed again the TLR9CNV loss in IgAN patients (Figure 3e and f; Po0.001), the lowerexpression of this receptor with respect to HSs (Figure 3g; Po0.0001)T
able
3IgAN-specificCNVsthatwere
within
ornearregionsidentifiedbyIgAN
genome-widegeneticstudiesa
CNV
bFD
RFreq
Gen
ewith
inregion
Gen
ena
me
Distanc
efro
mloci
(kb)
Authors
Chr2.hg1
8:g.(?_23
3,014,440
)_(233,052,032
_?)del
0.0106
0.4186
ALPI
Alkalin
eph
osph
atase,
intestinal
3614
Patersonet
al9
Chr2.hg1
8:g.(?_21
8,898,584
)_(218,999,558
_?)del
0.0106
0.4419
PNKD
Myofibrillogen
esis
regu
lator1isoform
12201
Patersonet
al9
0.0106
0.4419
C2orf62
Hypothe
tical
proteinLO
C375
307
0.0106
0.4419
NRAM
P1So
lute
carrierfamily
11,mem
ber1varia
nt0.0106
0.4419
SLC1
1A1
Natural
resistan
ce-associatedmacroph
ageprotein
0.0106
0.4419
CTDSP
1CT
Dsm
allp
hospha
tase
10.0106
0.4419
VIL1
Villin1
0.0106
0.4419
hsa-mir-26
b—
Chr2.hg1
8:g.(?_23
3,209,497
)_(233,248,874
_?)del
0.0319
0.3721
EFHD1
EF-han
ddo
mainfamily
D1
3809
Patersonet
al9
Chr6.hg1
8:g.(?_30
,040,321)_(30
,051,930_?)del
0.0213
0.3721
HLA
-AMHCclassIan
tigen
(fragm
ent)
2275,0
Feeh
ally
etal,10Yu
etal
12
0.0213
0.3721
HCG
9HLA
complex
grou
p9
Chr6.hg1
8:g.(?_31
,525,641)_(31
,551,542_?)del
0.0213
0.3721
HCP
5HLA
complex
P5174,0
Feeh
ally
etal,10Yu
etal
12
0.0213
0.3721
HCG
26Hom
osapien
sMHCclassImRNAfragmen
t
Chr6.hg1
8:g.(?_33
,229,433)_(33
,246,998_?)del
0.0213
0.3721
COL1
1A2
Colla
gen,
type
XI,alph
a2isoform
1901,
24,450
Feeh
ally
etal,10Gha
ravi
etal,11Yu
etal
12
Chr17.hg1
8:g.(?_4
9,461,854
)_(49,645,340_
?)du
p0.0106
0.4186
——
0Bisceglia
etal
8
Chr17.hg1
8:g.(?_4
6,910,906
)_(46,938,930_
?)du
p0.0070
0.4651
——
0Bisceglia
etal
8
Chr17.hg1
8:g.(?_5
1,702,512
)_(51,779,366_
?)du
p0.0349
0.4186
ANKFN
1An
kyrin
-rep
eatan
dfibron
ectin
type
IIIdo
main
0Bisceglia
etal
8
Chr22.hg1
8:g.(?_2
9,028,358
)_(29,062,712_
?)de
l0.0349
0.4186
TBC1
D10
ATB
C1do
mainfamily,mem
ber10
A169,275
Gha
ravi
etal,11Yu
etal12
a Fishe
r'sexacttest
Po2.2
−16foralloverlapp
ingregion
s.b H
uman
referenc
egeno
meNCB
I36/hg
18.
CNVs in IgA nephropathyF Sallustio et al
4
European Journal of Human Genetics

and the correlation between the copy number of the gene and itsexpression levels (Figure 3h; Pearson's r= 0.69, Po0.0001).
The TLR9 copy number correlates with the severity of the renaldamageWe studied whether the loss of TLR9 CNV in IgAN patients wasspecific to patients with DRF or if it was present also in IgAN patientswith NRF. Therefore, we checked the TLR9 CNV in a furtherindependent cohort of 12 IgAN patients with NRF. We found thatthe frequency distribution of the CNV was equivalent between patientsand HSs and no significant loss aberration was found (Figures 4a and b).This diversity in the TLR9 loss between DRF and NRF IgAN patientswas confirmed also in the Greek cohort (Figure 2g–i). Moreover, thedifference in TLR9 gene expression between IgAN patients with NRFand HSs was no longer present and the TLR9 mRNA levels werecomparable to those of HSs (Figure 4c). However, the CNV valuesagain correlated with the TLR9 gene expression (Figure 4d; r= 0.43,P= 0.039), confirming the relationship between the copy number andthe gene expression of the TLR9. In addition, we found a significant
direct correlation between the TLR9 copy number and the eGFR in theanalyzed IgAN patients (Supplementary Figure 6; Pearson's r= 0.43;P= 0.004).
DISCUSSION
IgAN is a complex multifactorial disease whose genetic bases remainunknown. Many LGWS and GWAS in both familial and sporadicIgAN suggest that there is a strong genetic component in thedisease.7–12 However, most studies have not evaluated the contributionto this complex disorder of other forms of genetic variation, such asstructural variations, mainly in the form of CNVs.15 Indeed, CNVshave recently been shown to have an important role in complexdisease phenotypes as psoriasis,30 rheumatoid arthritis31 and systemiclupus erythematosus.32 Similarly, a copy number polymorphismincluding FCGR3 leads to a predisposition to glomerulonephritis inrats and humans.33
We report a genome-wide study searching for CNVs as a source ofgenetic susceptibility in IgAN. We used a methodology that allowed usto identify CNVs that were concordant across multiple samples and
Figure 1 Validation of CNVs identified by MSA. (a, c and e) Copy number frequencies, assessed through CNV real-time PCR assays, in 15 IgAN patients and15 HRs indentified by whole-genome screening of CNVs for GALNT13, COL11A2 and TLR9. (b, d and f) Differences of CNV, between patients and HRs forGALNT13, COL11A2 and TLR9. CNVs are shown as gain (42 copy number) and loss (o2 copy number). P-values were calculated by Fisher’s exact test.**P=0.0018 and ***Po0.0001.
CNVs in IgA nephropathyF Sallustio et al
5
European Journal of Human Genetics

had lower amplitudes or small widths, which single sample methodscould not detect.17 This approach, alternative to the classical CNV-level testing methods, consists in carrying out association testing first,between phenotype and raw intensities from the SNP array at the levelof the individual marker, and then aggregate neighboring test results toidentify CNVs associated with the phenotype. It has been demon-strated that this approach is capable of offering a marked increase inpower (412-fold) in conducting association studies of structuralvariation.34 We found 148 aberrations exclusively present in IgANpatients. Noteworthy, several CNVs overlapped with regions evidencedby GWAS (Table 3). In particular, we found two CNVs on thechromosome 6p, the loss chr6.hg18:g.(?_30 040 321_30 051 930_?)deland chr6.hg18:g.(?_31 525 641_31 551 542_?)del. The first encom-passes the MHC class I antigen (HLA-A) and the HLA complexgroup 9 (HCG9), and the second one encloses the HLA complex P5(HCP5) and the MHC class I mRNA fragment (HCG26). This is inaccordance with two recent GWAS, one in UK patients and the otherin a Chinese Han population that identified loci on chromosome 6pwithin the region coding for the MHC.10,11 Mutations in MHC genes
have been associated with several autoimmune conditions, consistentlywith the predisposition to develop IgA1 hinge region autoantibodies,at least in some cases.35 Moreover, again in chromosome 6, we alsofound a CNV, the loss chr6.hg18:g.(?_33 229 433)_(33 246 998_?)del,in very close proximity to regions identified by three independentGWAS10–12 and containing the gene COL11A2. Interestingly, severalstudies identified loci in linkage with IgAN containing other genesencoding for collagen subunits, such as COL4A3 and COL4A49 as well.This aberration is also close to an another CNV, encompassing theMHC-II area, that was identified in the only other CNV analysisreported on IgAN.11 In addition, we found a CNV on the chromo-some 2, the gain chr2.hg18:g.(?_89 746 279)_(89 866 834_?)dup, thatspans a region codifying for the Human Gene abParts (uc010fhl.1),including Human Gene IgA (uc010fhm.1, Igκ chain V–II regionGM607 precursor; UCSC Genome Browser, NCBI36/hg18). It shouldbe taken into account that, as we used the IlluminaHumanCytoSNP-12 array of 300 000 tag SNPs, we could have notdetected some CNVs in IgAN patients, whereas the use of more dense
Figure 2 (a) TLR9 copy number frequencies, assessed through CNV real-time PCR assays, in a cohort of 51 IgAN patients and 106 HRs included in thegenome-wide scan and 77 HSs not related with IgAN families. (b) Differences of TLR9 CNVs, between 51 patients and 106 HRs from the genome-widescan, shown as loss (o2 copy number). (c) Differences of TLR9 CNVs, between 51 patients and 50 HSs, shown as loss (o2 copy number). (d) TLR9 copynumber frequencies, assessed through CNV real-time PCR assays, in a cohort of Greek ethnicity of 39 IgAN patients with DRF, 28 HRs and 20 HSs.(e) Differences of TLR9 CNVs, between 39 IgAN patients with DRF and 28 HRs of Greek ethnicity, shown as loss (o2 copy number). (f) Differences ofTLR9 CNVs, between 39 IgAN patients with DRF and 20 HSs, shown as loss (o2 copy number). (g) TLR9 copy number frequencies, assessed through CNVreal-time PCR assays, in a cohort of Greek ethnicity of 18 IgAN patients with NRF, 28 HRs and 20 HSs. (h) Differences of TLR9 CNVs, between 18 IgANpatients with NRF and 28 HRs of Greek ethnicity, shown as loss (o2 copy number). (i) Differences of TLR9 CNVs, between 18 IgAN patients with NRF and20 HSs, shown as loss (o2 copy number). P-values for differences of CNV were calculated by Fisher’s exact test. The histograms represent the mean±SEM.**Po0.001 and ***Po0.0001.
CNVs in IgA nephropathyF Sallustio et al
6
European Journal of Human Genetics

Figure 3 (a) TLR9 copy number frequencies, assessed through CNV real-time PCR assays, in a second cohort of 12 IgAN patients and 12 HRs analyzed inthe genome-wide scan. (b) Differences of TLR9 CNVs between patients and HRs of the second cohort from the genome-wide scan shown as loss (o2 copynumber). (c) TLR9 gene expression levels evaluated by real-time PCR in 12 patients with IgAN and 12 HRs analyzed in the genome-wide scan. TLR9expression levels were significantly lower in patients with IgAN than in HRs. TLR9 expression levels were normalized on the housekeeping gene b-actin.(d) Linear correlation between the expression and the copy numbers of TLR9 in 12 patients with IgAN and 12 HRs, analyzed in the genome-wide scan, onthe basis of RCVs. Gene expression levels directly correlated with copy numbers (r=0.57; P=0.0068). (e) TLR9 copy number frequencies assessed throughCNV real-time PCR assays, in an additional independent cohort of 15 IgAN patients with DRF and 15 HSs. (f) Difference of TLR9 CNVs between IgANpatients with DRF and HSs of the independent cohort shown as loss (o2 copy number). (g) TLR9 gene expression levels evaluated by real-time PCR in 15IgAN patients with DRF and 15 HSs. TLR9 expression levels were significantly lower in patients with IgAN than in HSs. TLR9 expression levels werenormalized on the housekeeping gene b-actin. (h) Linear correlation between the expression and the copy numbers of TLR9, on the basis of RCVs, in theindependent cohort of 15 IgAN patients with DRF and 15 HSs. Gene expression levels directly correlated with copy numbers (r=0.69; Po0.0001). P-valuesfor differences of CNV between IgAN patients and healthy controls were calculated by Fisher’s exact test. The histograms represent the mean±SEM. Circlesrepresent IgAN patients and triangles represent HRs/HSs. **Po0.001 and ***Po0.0001.
Figure 4 (a) TLR9 copy number frequencies assessed through CNV real-time PCR assays, in a cohort of 12 IgAN patients with NRF and 12 HSs.(b) Differences of TLR9 CNV between IgAN patients with NRF and HSs shown as loss (o2 copy number). No significant differences were found. (c) TLR9gene expression levels evaluated by real-time PCR in the cohort of 12 IgAN patients with NRF and 12 HSs. TLR9 expression levels were not differentbetween patients and controls. TLR9 expression levels were normalized on the housekeeping gene b-actin. (d) Linear correlation between the expression andthe copy numbers of TLR9, on the basis of RCVs, in the cohort of 12 IgAN patients with NRF and 12 HSs. Gene expression levels directly correlated withcopy numbers (r=0.43, P=0.039). P-values for differences of CNVs between IgAN patients and healthy controls were calculated by Fisher’s exact test.The histograms represent the mean±SEM.
CNVs in IgA nephropathyF Sallustio et al
7
European Journal of Human Genetics

arrays could give more accurate determination of copy numbers,especially for CNVs o10 kb.Among other CNVs, we focused on an aberration containing a gene
encoding for the TLR9 that was found involved in the IgAN28,29 andthat could also have a role in the T-cell-independent IgA secretion.35,36
This suggests that mucosal pathogens may specifically stimulate IgA1synthesis and modulate the glycosylation process of IgA. We con-firmed, on two different cohorts from Italian and Greek populations,that IgAN patients with DRF carried low copy number of the variantcontaining the TLR9 gene and found that the TLR9 expressionsignificantly correlated with the loss aberration in patients. Moreover,we showed that the gene expression was considerably lower inperipheral blood mononuclear cells of patients with DRF comparedwith HSs, in accordance with low TLR9 copies. Conversely, we foundthat IgAN patients with NRF were not carriers of the chr3.hg18:g.(?_52 031 010)_(52 260 722_?)del and that in these patients the TLR9mRNA was expressed at the same level as in HSs still maintaining astrong correlation with the CNVs. These data denote a strongrelationship between the TLR9 CNV values and mRNA levels.Moreover, as results from the database of genomic variants (http://dgv.tcag.ca/dgv/app/home), a frequency of only 0.15% was reportedfor the TLR9 CNV in a study conducted on 2026 HSs (65.2%Caucasians and 34.2% African Americans).37 However, we found ahigher frequency of the TLR9 CNV in HSs. This could be because ofthe different sensitivity of the real-time quantitative PCR assays withrespect to the methodologies based on microarrays. This differencecould be due either to a different sensitivity or to low accuracy of copynumber calculations using Taqman assays.Our data suggest that the TLR9 could have a role in IgAN
progression, as patients with a worse clinical course showed lowerexpression of this receptor. This result is in accordance with otherstudies, carried out on Japanese IgAN patients, showing that insubjects with IgAN a variability of the tonsillar TLR9 mRNAexpression is present: patients with relatively high expression ofTLR9 had an earlier and more complete clinical remission than thosewith a lower expression.28 In addition, we found a significant directcorrelation between the TLR9 copy number and the eGFR, confirmingthat this aberration could influence the IgAN progression. Never-theless, how TLR9 could influence the progression of IgAN is at themoment still unknown. TLR9 is expressed in dendritic and B cells andbinds unmethylated CpG dinucleotides (CpG DNA) released bybacteria and viruses.38 Moreover, it has been shown that in humannaive B cells, TLR9 is expressed at low to undetectable levels, but itsexpression is rapidly induced following B-cell-receptor triggering in aT-cell-independent manner. In contrast, memory B cells express theTLR9 at constitutively high levels. Human memory B cells proliferateand differentiate to Ig-secreting cells in response to CpG, whereasnaive B cell do so only if simultaneously triggered through the BCR.The constitutive expression of TLRs in memory B cells provides amechanism to generate continuously the antibody of all memoryspecificities, thus sustaining serologic memory.39,40
CpG DNA motifs have a role in the mechanism by which B cellsswitch from IgM to IgA.36,41,42 Coupling of antigen to CpG may besufficient to create a strong immunogen capable of eliciting highlyspecific T-cell-independent antibody responses. The TLR9 CNV lossmay lead to the failure of CpG to induce proliferation of memory Bcells, because of the lower expression levels of TLR9, thus exacerbatingIgA class switching in naive B cells via BCR. Moreover, a recent studysuggests that CpG DNA potentiates the B-cell adaptive immuneresponse by enhancing terminal differentiation.43 Indeed, in IgANthere is a reduced mucosal response to neoantigens, with greater
response to mucosal and systemic antigenic challenge.38 This mayresult in impaired elimination of mucosal antigens, prolonged antigenexposure to B cells and an increase in immunologic memory leadingto deal with continuous antigenic challenge that triggers the produc-tion of nephritogenic IgA1.35
In conclusion, we performed the first genome-wide CNV study inIgAN identifying some structural variants specific of IgAN patients andproviding a collection of new candidate genes and loci that can help todissect the complex genomic setting of the disease. Moreover, weidentified a specific CNV, spanning the TLR9 gene, that could explainthe disease severity in some IgAN patients. Further CNV-orientedreplication studies in different populations will be necessary toimprove our understanding of the pathogenetic mechanisms involvedin IgAN.
CONFLICT OF INTEREST
The authors declare no conflict of interest.
ACKNOWLEDGEMENTS
We are grateful to the patients with IgAN and healthy blood donor participantsfor their cooperation in this study. This work was supported by grants fromEuropean Framework Programme (QLG1-CT-2000-00464); MiUR (PON-RECONEV 134/2011; FIRB RBAP11B2SX) and Regione Puglia (BISIMANE project,H31D08000030007). MF is supported by MRC grant (MR/K01353X/1). We aregrateful to Schena Foundation for scientific and financial support.
1 Schena F, Coppo R: IgA Nephropathies, 3rd edn. Oxford Textbook of ClinicalNephrology: Oxford, UK: Oxford University Press, 2005.
2 Manno C, Torres DD, Rossini M, Pesce F, Schena FP: Randomized controlled clinicaltrial of corticosteroids plus ACE-inhibitors with long-term follow-up in proteinuric IgAnephropathy. Nephrol Dial Transplant 2009; 24: 3694–3701.
3 Pesce F, Schena FP: Worldwide distribution of glomerular diseases: the role of renalbiopsy registries. Nephrol Dial Transplant 2010; 25: 334–336.
4 Coppo R, Amore A, Peruzzi L, Vergano L, Camilla R: Innate immunity and IgAnephropathy. J Nephrol 2010; 23: 626–632.
5 Sharmin S, Shimizu Y, Hagiwara M, Hirayama K, Koyama A: Staphylococcus aureusantigens induce IgA-type glomerulonephritis in Balb/c mice. J Nephrol 2004; 17:504–511.
6 Hsu SI: Racial and genetic factors in IgA nephropathy. Semin Nephrol 2008; 28:48–57.
7 Gharavi AG, Yan Y, Scolari F, et al: IgA nephropathy, the most common cause ofglomerulonephritis, is linked to 6q22–23. Nat Genet 2000; 26: 354–357.
8 Bisceglia L, Cerullo G, Forabosco P, et al: Genetic heterogeneity in Italian families withIgA nephropathy: suggestive linkage for two novel IgA nephropathy loci. Am J HumGenet 2006; 79: 1130–1134.
9 Paterson AD, Liu XQ, Wang K, et al: Genome-wide linkage scan of a large family withIgA nephropathy localizes a novel susceptibility locus to chromosome 2q36. J Am SocNephrol 2007; 18: 2408–2415.
10 Feehally J, Farrall M, Boland A, et al: HLA has strongest associationwith IgA nephropathy in genome-wide analysis. J Am Soc Nephrol 2010; 21:1791–1797.
11 Gharavi AG, Kiryluk K, Choi M, et al: Genome-wide association study identifiessusceptibility loci for IgA nephropathy. Nat Genet 2011; 43: 321–327.
12 Yu XQ, Li M, Zhang H, et al: A genome-wide association study in Han Chineseidentifies multiple susceptibility loci for IgA nephropathy. Nat Genet 2012; 44:178–182.
13 Kiryluk K, Julian BA, Wyatt RJ, et al: Genetic studies of IgA nephropathy: past, present,and future. Pediatr Nephrol 2010; 25: 2257–2268.
14 McCarroll SA, Altshuler DM: Copy-number variation and association studies of humandisease. Nat Genet 2007; 39: S37–S42.
15 Estivill X, Armengol L: Copy number variants and common disorders: filling the gapsand exploring complexity in genome-wide association studies. PLoS Genet 2007; 3:1787–1799.
16 Manno C, Strippoli GF, D’Altri C, Torres D, Rossini M, Schena FP: A novel simplerhistological classification for renal survival in IgA nephropathy: a retrospective study.Am J Kidney Dis 2007; 49: 763–775.
17 Guttman M, Mies C, Dudycz-Sulicz K, et al: Assessing the significance of conservedgenomic aberrations using high resolution genomic microarrays. PLoS Genet 2007;3: e143.
18 Reich M, Liefeld T, Gould J, Lerner J, Tamayo P, Mesirov JP: GenePattern 2.0. NatGenet 2006; 38: 500–501.
CNVs in IgA nephropathyF Sallustio et al
8
European Journal of Human Genetics

19 Diskin SJ, Eck T, Greshock J, et al: STAC: a method for testing the significance of DNAcopy number aberrations across multiple array-CGH experiments. Genome Res 2006;16: 1149–1158.
20 Grant GR, Manduchi E, Cheung VG, Ewens WJ: Significance testing for direct identity-by-descent mapping. Ann Hum Genet 1999; 63: 441–454.
21 Huang da W, Sherman BT, Lempicki RA. Systematic and integrative analysis of largegene lists using DAVID bioinformatics resources. Nat Protoc 2009; 4: 44–57.
22 Huang da W, Sherman BT, Lempicki RA: Bioinformatics enrichment tools: paths towardthe comprehensive functional analysis of large gene lists. Nucleic Acids Res 2009; 37:1–13.
23 Ionita-Laza I, Perry GH, Raby BA, et al: On the analysis of copy-number variations ingenome-wide association studies: a translation of the family-based association test.Genet Epidemiol 2008; 32: 273–284.
24 Lipson D, Aumann Y, Ben-Dor A, Linial N, Yakhini Z: Efficient calculation of intervalscores for DNA copy number data analysis. J Comput Biol 2006; 13: 215–228.
25 Rouveirol C, Stransky N, Hupé P, et al: Computation of recurrent minimal genomicalterations from array-CGH data. Bioinformatics 2006; 22: 849–856.
26 Wang P, Kim Y, Pollack J, Narasimhan B, Tibshirani R: A method for calling gains andlosses in array CGH data. Biostatistics 2005; 6: 45–58.
27 Wang K, Li M, Hadley D, et al: PennCNV: an integrated hidden Markov model designedfor high-resolution copy number variation detection in whole-genome SNPgenotyping data. Genome Res 2007; 17: 1665–1674.
28 Sato D, Suzuki Y, Kano T, et al: Tonsillar TLR9 expression and efficacy of tonsillectomywith steroid pulse therapy in IgA nephropathy patients. Nephrol Dial Transplant 2012;27: 1090–1097.
29 Suzuki H, Suzuki Y, Narita I, et al: Toll-like receptor 9 affects severity of IgAnephropathy. J Am Soc Nephrol 2008; 19: 2384–2395.
30 de Cid R, Riveira-Munoz E, Zeeuwen PL, et al: Deletion of the late cornified envelopeLCE3B and LCE3C genes as a susceptibility factor for psoriasis. Nat Genet 2009; 41:211–215.
31 McKinney C, Fanciulli M, Merriman ME, et al: Association of variation in Fcgammareceptor 3B gene copy number with rheumatoid arthritis in Caucasian samples. AnnRheum Dis 2010; 69: 1711–1716.
32 Fanciulli M, Norsworthy PJ, Petretto E, et al: FCGR3B copy number variation isassociated with susceptibility to systemic, but not organ-specific, autoimmunity. NatGenet 2007; 39: 721–723.
33 Aitman TJ, Dong R, Vyse TJ, et al: Copy number polymorphism in Fcgr3 predisposes toglomerulonephritis in rats and humans. Nature 2006; 439: 851–855.
34 Breheny P, Chalise P, Batzler A, Wang L, Fridley BL: Genetic association studies ofcopy-number variation: should assignment of copy number states precede testing?.PLoS One 2012; 7: e34262.
35 Boyd JK, Cheung CK, Molyneux K, Feehally J, Barratt J: An update on the pathogenesisand treatment of IgA nephropathy. Kidney Int 2012; 81: 833–843.
36 Blaas SH, Stieber-Gunckel M, Falk W, Obermeier F, Rogler G: CpG-oligodeoxy-nucleotides stimulate immunoglobulin A secretion in intestinal mucosal B cells. ClinExp Immunol 2009; 155: 534–540.
37 Shaikh TH, Gai X, Perin JC, et al: High-resolution mapping and analysis of copy numbervariations in the human genome: a data resource for clinical and research applications.Genome Res 2009; 19: 1682–1690.
38 Gesualdo L, Lamm ME, Emancipator SN: Defective oral tolerance promotes nephrito-genesis in experimental IgA nephropathy induced by oral immunization. J Immunol1990; 145: 3684–3691.
39 Bernasconi NL, Onai N, Lanzavecchia A: A role for Toll-like receptors in acquiredimmunity: up-regulation of TLR9 by BCR triggering in naive B cells and constitutiveexpression in memory B cells. Blood 2003; 101: 4500–4504.
40 Bernasconi NL, Traggiai E, Lanzavecchia A: Maintenance of serological memoryby polyclonal activation of human memory B cells. Science 2002; 298:2199–2202.
41 He B, Qiao X, Cerutti A: CpG DNA induces IgG class switch DNA recombination byactivating human B cells through an innate pathway that requires TLR9 and cooperateswith IL-10. J Immunol 2004; 173: 4479–4491.
42 He B, Xu W, Santini PA, et al: Intestinal bacteria trigger T cell-independentimmunoglobulin A(2) class switching by inducing epithelial-cell secretion of thecytokine APRIL. Immunity 2007; 26: 812–826.
43 Jung J, Yi AK, Zhang X, Choe J, Li L, Choi YS: Distinct response of human B cellsubpopulations in recognition of an innate immune signal, CpG DNA. J Immunol 2002;169: 2368–2373.
Supplementary Information accompanies this paper on European Journal of Human Genetics website (http://www.nature.com/ejhg)
CNVs in IgA nephropathyF Sallustio et al
9
European Journal of Human Genetics