Embed Size (px)
Citation preview
DELAWARE RIVER MAIN CHANNEL DEEPENING PROJECT
GENERAL CONFORMITY ANALYSIS AND MITIGATION REPORT
FINAL
FEBRUARY 2004
PREPARED FOR:
U.S. ARMY CORPS OF ENGINEERS PHILADELPHIA DISTRICT
100 PENN SQUARE EAST PHILADELPHIA, PA 19107-3390
PREPARED BY:
MOFFATT & NICHOL 2001 NORTH MAIN STREET, SUITE 360
WALNUT CREEK, CA 94596
DELAWARE RIVER MAIN CHANNEL DEEPENING PROJECT
GENERAL CONFORMITY ANALYSIS AND MITIGATION REPORT
i
MOFFATT & NICHOL
TABLE OF CONTENTS
PAGE EXECUTIVE SUMMARY ES-1 1 INTRODUCTION 1 1.1 Background 1 1.2 Purpose 2 1.3 Scope of Work 2 2 METHODOLOGY FOR DETERMINING GENERAL CONFORMITY 3 2.1 Study Area 3 2.2 Construction Cost Estimates 4 2.3 Emission Types and Sources 5 2.3.1 Pollutant Types 5 2.3.2 Emission Sources 6 2.4 Air Emission Models 6 2.4.1 Control of Emissions from Marine Diesel Engines 7 2.4.2 National NONROAD Emissions Model 7 2.4.3 Mobile Source Emissions Modeling 8 2.5 General Conformity Analysis 8 2.5.1 Federal Channel Deepening Project Emissions 9 2.5.2 Berth Deepening Project Emissions 13 3 GENERAL CONFORMITY RESULTS 14 3.1 Federal Channel Deepening Emissions Results 14 3.2 Berth Deepening Emissions Results 15 3.3 Emissions Summary 15 3.4 Comparison to “de minimis” Levels 15 4 APPROACHES TO EMISSION REDUCTION 17 4.1 On-Site Emission Reduction 17 4.2 Off-Site Emission Reduction 18 4.3 Emission Credits 18 5 EVALUATION OF METHODS 19 5.1 Proven Technology 19 5.2 Practicability 20 5.3 Cost per Ton of Pollutant Avoided 20
DELAWARE RIVER MAIN CHANNEL DEEPENING PROJECT
GENERAL CONFORMITY ANALYSIS AND MITIGATION REPORT
ii
MOFFATT & NICHOL
6 ON-SITE MITIGATION OPPORTUNITIES 20 6.1 Large Marine Engines 21 6.1.1 Electrification (EL) 21 6.1.2 Engine Replacement (ER) 22 6.1.3 Engine Replacement with Direct Water Injection (ER
w/DWI) 22
6.1.4 Selective Catalytic Reduction (SCR) 22 6.2 Small Marine Engines 23 6.2.1 Diesel Particulate Filters (DPF) 23 6.2.2 Engine Replacement (ER) 23 6.3 Non-Road Engines 24 6.3.1 Diesel Particulate Filters (DPF) 24 7 OFF-SITE MITIGATION OPPORTUNITIES 24 7.1 O&M Dredging Electrification 25 7.2 Engine Replacement 25 7.2.1 Corps’ Dredge McFarland 27 7.2.1.1 Engine Data Survey 27 7.2.1.2 Annual Hours of Operation 28 7.2.1.3 Emission Reduction Potential 30 7.2.2 Local/Regional Ferries 31 7.2.3 Local/Regional Tugboats 32 8 COST METHODOLOGY 32 8.1 On-Site SCR 32 8.2 Off-Site O&M Electrification 33 8.3 Engine Replacement 34 9 EMISSION REDUCTION ALTERNATIVES 34 9.1 Plan #1 – On-Site, O&M and McFarland Reductions 35 9.2 Plan #2 - On-Site, O&M and Ferry Reductions 35 9.3 Plan #3 – On-Site, O&M and Tugboat Reductions 35 10 SELECTION OF FINAL EMISSION MITIGATION PLAN 36 10.1 On-Site SCR 36 10.2 Off-Site O&M Electrification 36 10.3 Off-Site Vessel Engine Replacement 37
DELAWARE RIVER MAIN CHANNEL DEEPENING PROJECT
GENERAL CONFORMITY ANALYSIS AND MITIGATION REPORT
iii
MOFFATT & NICHOL
11 MITIGATION SCHEDULE 37 11.1 On-Site SCR 38 11.2 Off-Site O&M Electrification 38 11.3 Off-Site Corps’ Dredge McFarland 39 12 CONCLUSION 39 13 REFERENCES 41 TABLES FIGURES APPENDIX 1 Correspondence from Engine Manufacturers
DELAWARE RIVER MAIN CHANNEL DEEPENING PROJECT
GENERAL CONFORMITY ANALYSIS AND MITIGATION REPORT
iv
MOFFATT & NICHOL
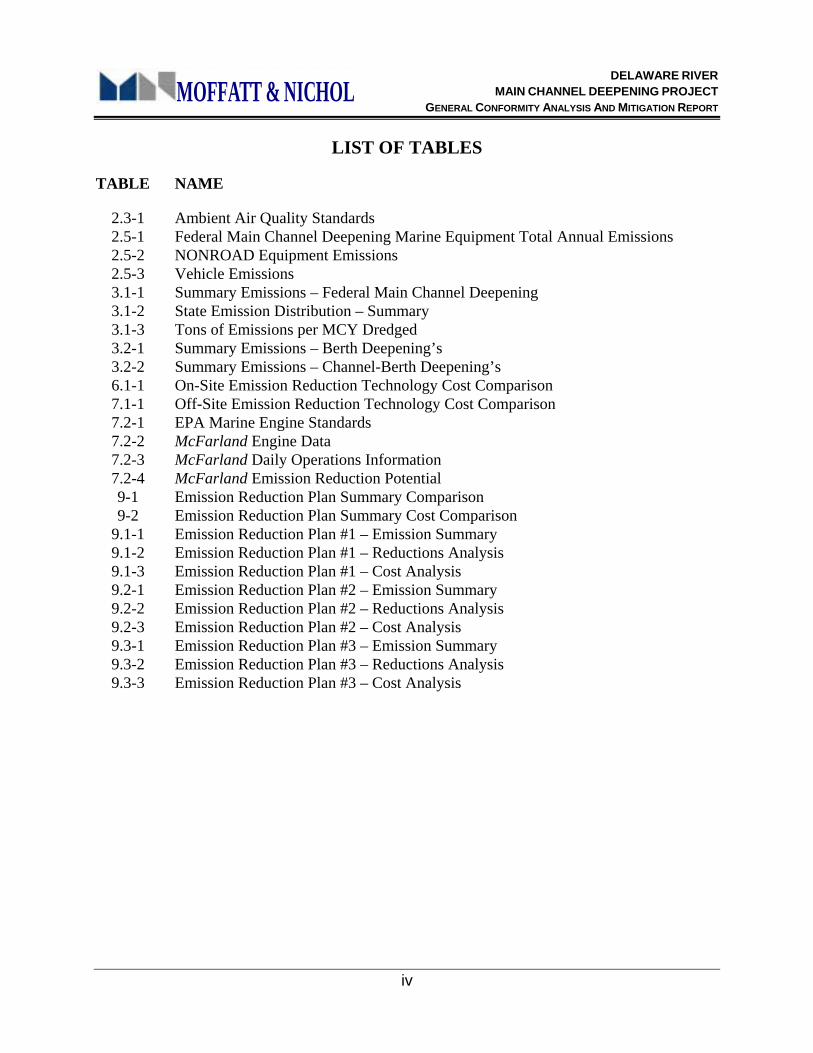
LIST OF TABLES
TABLE NAME
2.3-1 Ambient Air Quality Standards 2.5-1 Federal Main Channel Deepening Marine Equipment Total Annual Emissions 2.5-2 NONROAD Equipment Emissions 2.5-3 Vehicle Emissions 3.1-1 Summary Emissions – Federal Main Channel Deepening 3.1-2 State Emission Distribution – Summary 3.1-3 Tons of Emissions per MCY Dredged 3.2-1 Summary Emissions – Berth Deepening’s 3.2-2 Summary Emissions – Channel-Berth Deepening’s 6.1-1 On-Site Emission Reduction Technology Cost Comparison 7.1-1 Off-Site Emission Reduction Technology Cost Comparison 7.2-1 EPA Marine Engine Standards 7.2-2 McFarland Engine Data 7.2-3 McFarland Daily Operations Information 7.2-4 McFarland Emission Reduction Potential 9-1 Emission Reduction Plan Summary Comparison 9-2 Emission Reduction Plan Summary Cost Comparison
9.1-1 Emission Reduction Plan #1 – Emission Summary 9.1-2 Emission Reduction Plan #1 – Reductions Analysis 9.1-3 Emission Reduction Plan #1 – Cost Analysis 9.2-1 Emission Reduction Plan #2 – Emission Summary 9.2-2 Emission Reduction Plan #2 – Reductions Analysis 9.2-3 Emission Reduction Plan #2 – Cost Analysis 9.3-1 Emission Reduction Plan #3 – Emission Summary 9.3-2 Emission Reduction Plan #3 – Reductions Analysis 9.3-3 Emission Reduction Plan #3 – Cost Analysis
DELAWARE RIVER MAIN CHANNEL DEEPENING PROJECT
GENERAL CONFORMITY ANALYSIS AND MITIGATION REPORT
v
MOFFATT & NICHOL
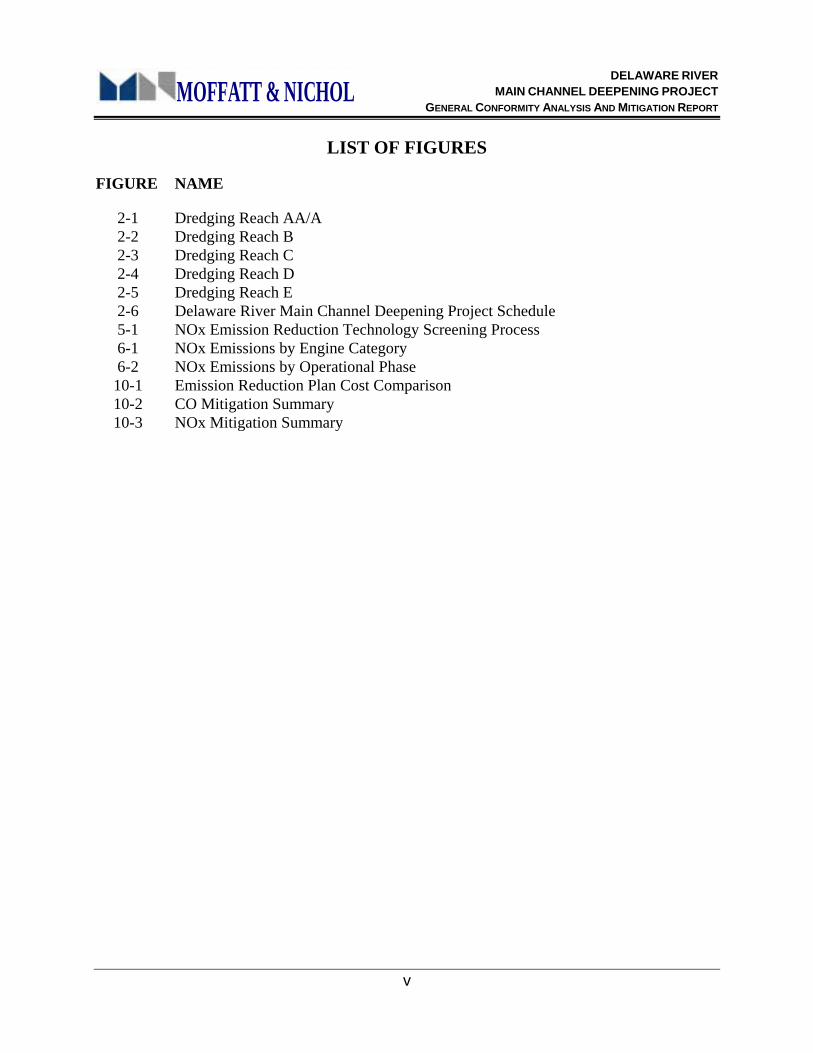
LIST OF FIGURES
FIGURE NAME
2-1 Dredging Reach AA/A 2-2 Dredging Reach B 2-3 Dredging Reach C 2-4 Dredging Reach D 2-5 Dredging Reach E 2-6 Delaware River Main Channel Deepening Project Schedule 5-1 NOx Emission Reduction Technology Screening Process 6-1 NOx Emissions by Engine Category 6-2 NOx Emissions by Operational Phase 10-1 Emission Reduction Plan Cost Comparison 10-2 CO Mitigation Summary 10-3 NOx Mitigation Summary
DELAWARE RIVER MAIN CHANNEL DEEPENING PROJECT
GENERAL CONFORMITY ANALYSIS AND MITIGATION REPORT
vi
MOFFATT & NICHOL
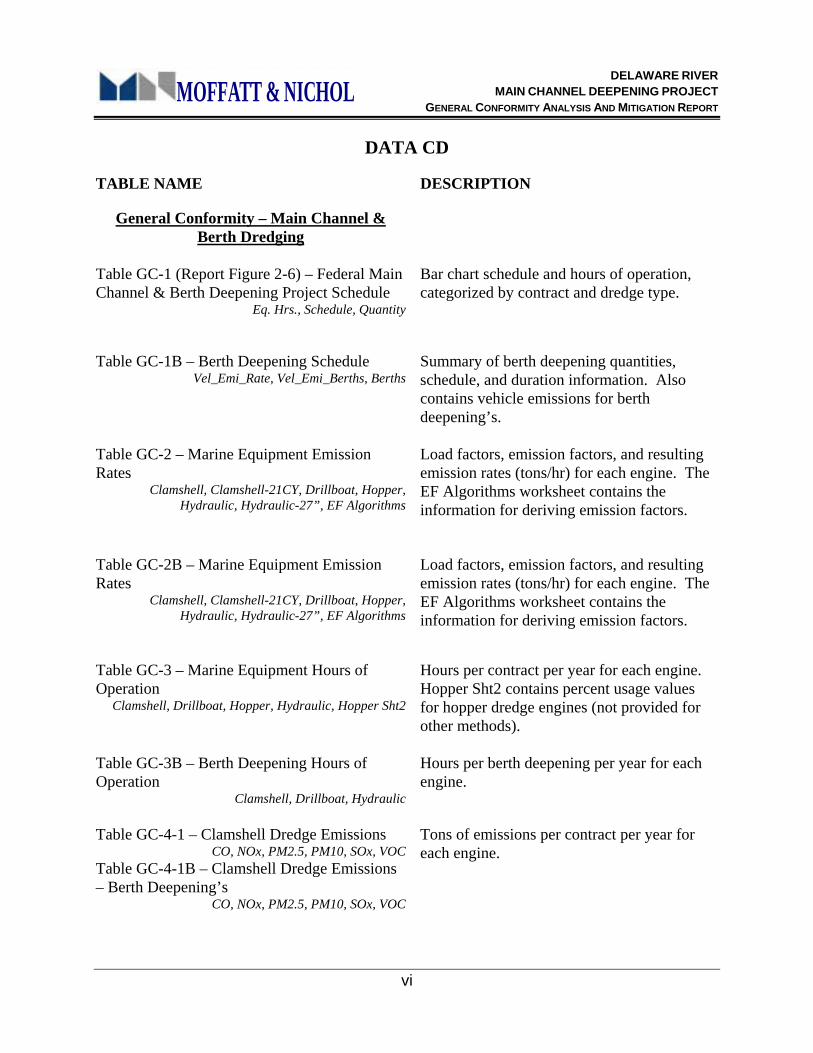
DATA CD
TABLE NAME DESCRIPTION
General Conformity – Main Channel & Berth Dredging
Table GC-1 (Report Figure 2-6) – Federal Main Channel & Berth Deepening Project Schedule
Eq. Hrs., Schedule, Quantity
Bar chart schedule and hours of operation, categorized by contract and dredge type.
Table GC-1B – Berth Deepening Schedule
Vel_Emi_Rate, Vel_Emi_Berths, Berths Summary of berth deepening quantities, schedule, and duration information. Also contains vehicle emissions for berth deepening’s.
Table GC-2 – Marine Equipment Emission Rates
Clamshell, Clamshell-21CY, Drillboat, Hopper, Hydraulic, Hydraulic-27”, EF Algorithms
Load factors, emission factors, and resulting emission rates (tons/hr) for each engine. The EF Algorithms worksheet contains the information for deriving emission factors.
Table GC-2B – Marine Equipment Emission Rates
Clamshell, Clamshell-21CY, Drillboat, Hopper, Hydraulic, Hydraulic-27”, EF Algorithms
Load factors, emission factors, and resulting emission rates (tons/hr) for each engine. The EF Algorithms worksheet contains the information for deriving emission factors.
Table GC-3 – Marine Equipment Hours of Operation
Clamshell, Drillboat, Hopper, Hydraulic, Hopper Sht2
Hours per contract per year for each engine. Hopper Sht2 contains percent usage values for hopper dredge engines (not provided for other methods).
Table GC-3B – Berth Deepening Hours of Operation
Clamshell, Drillboat, Hydraulic
Hours per berth deepening per year for each engine.
Table GC-4-1 – Clamshell Dredge Emissions
CO, NOx, PM2.5, PM10, SOx, VOCTable GC-4-1B – Clamshell Dredge Emissions – Berth Deepening’s
CO, NOx, PM2.5, PM10, SOx, VOC
Tons of emissions per contract per year for each engine.
DELAWARE RIVER MAIN CHANNEL DEEPENING PROJECT
GENERAL CONFORMITY ANALYSIS AND MITIGATION REPORT
vii
MOFFATT & NICHOL
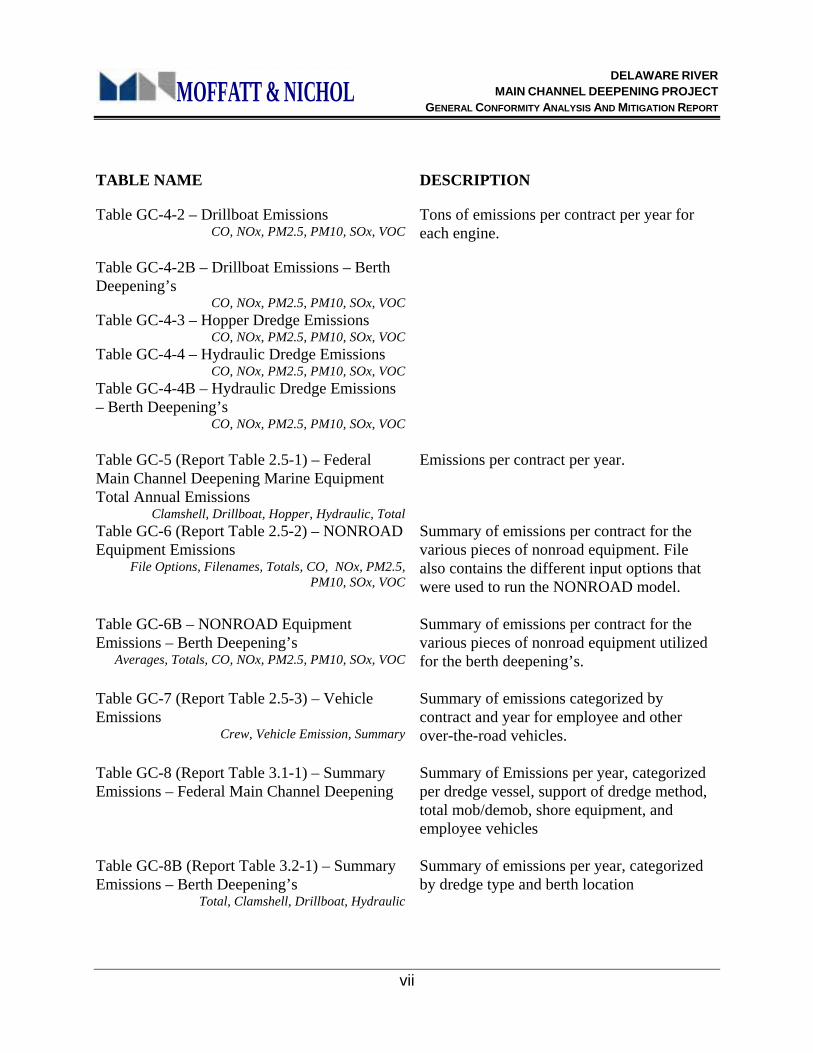
TABLE NAME DESCRIPTION
Table GC-4-2 – Drillboat Emissions CO, NOx, PM2.5, PM10, SOx, VOC
Table GC-4-2B – Drillboat Emissions – Berth Deepening’s
CO, NOx, PM2.5, PM10, SOx, VOCTable GC-4-3 – Hopper Dredge Emissions
CO, NOx, PM2.5, PM10, SOx, VOCTable GC-4-4 – Hydraulic Dredge Emissions
CO, NOx, PM2.5, PM10, SOx, VOC
Tons of emissions per contract per year for each engine.
Table GC-4-4B – Hydraulic Dredge Emissions – Berth Deepening’s
CO, NOx, PM2.5, PM10, SOx, VOC
Table GC-5 (Report Table 2.5-1) – Federal Main Channel Deepening Marine Equipment Total Annual Emissions
Clamshell, Drillboat, Hopper, Hydraulic, Total
Emissions per contract per year.
Table GC-6 (Report Table 2.5-2) – NONROAD Equipment Emissions
File Options, Filenames, Totals, CO, NOx, PM2.5, PM10, SOx, VOC
Summary of emissions per contract for the various pieces of nonroad equipment. File also contains the different input options that were used to run the NONROAD model.
Table GC-6B – NONROAD Equipment Emissions – Berth Deepening’s
Averages, Totals, CO, NOx, PM2.5, PM10, SOx, VOC
Summary of emissions per contract for the various pieces of nonroad equipment utilized for the berth deepening’s.
Table GC-7 (Report Table 2.5-3) – Vehicle Emissions
Crew, Vehicle Emission, Summary
Summary of emissions categorized by contract and year for employee and other over-the-road vehicles.
Table GC-8 (Report Table 3.1-1) – Summary Emissions – Federal Main Channel Deepening
Summary of Emissions per year, categorized per dredge vessel, support of dredge method, total mob/demob, shore equipment, and employee vehicles
Table GC-8B (Report Table 3.2-1) – Summary Emissions – Berth Deepening’s
Total, Clamshell, Drillboat, Hydraulic
Summary of emissions per year, categorized by dredge type and berth location
DELAWARE RIVER MAIN CHANNEL DEEPENING PROJECT
GENERAL CONFORMITY ANALYSIS AND MITIGATION REPORT
viii
MOFFATT & NICHOL
TABLE NAME DESCRIPTION
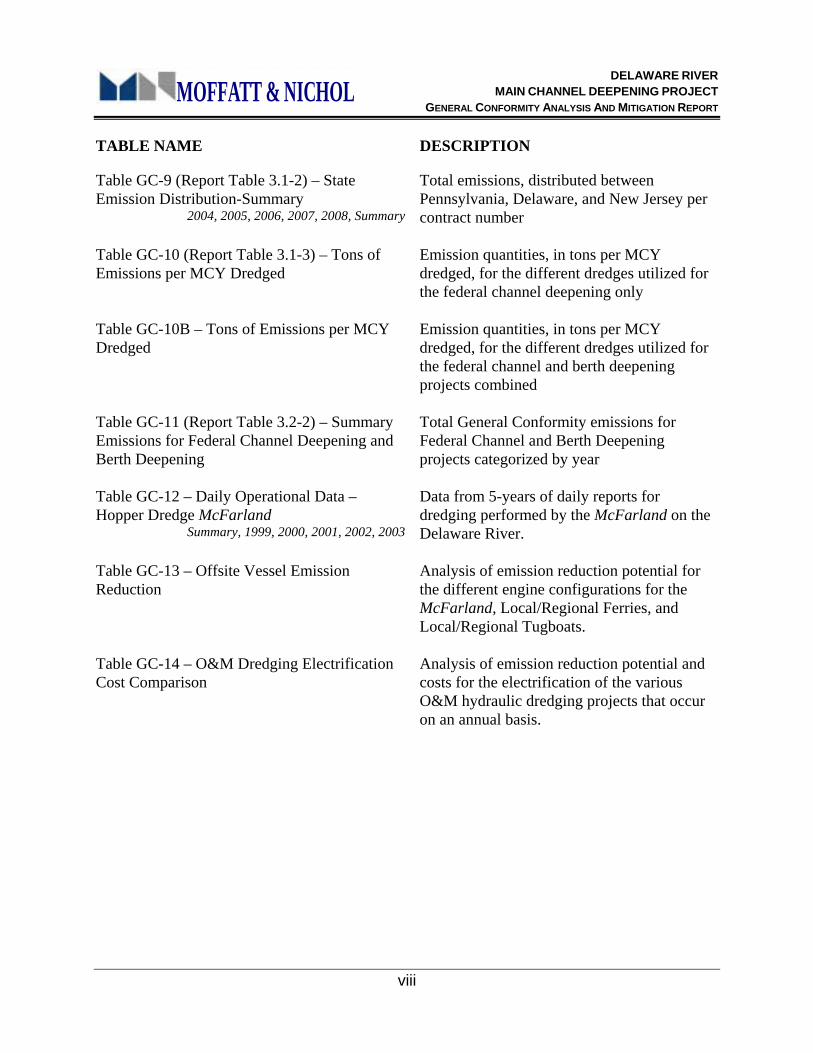
Table GC-9 (Report Table 3.1-2) – State Emission Distribution-Summary
2004, 2005, 2006, 2007, 2008, Summary
Total emissions, distributed between Pennsylvania, Delaware, and New Jersey per contract number
Table GC-10 (Report Table 3.1-3) – Tons of Emissions per MCY Dredged
Emission quantities, in tons per MCY dredged, for the different dredges utilized for the federal channel deepening only
Table GC-10B – Tons of Emissions per MCY Dredged
Emission quantities, in tons per MCY dredged, for the different dredges utilized for the federal channel and berth deepening projects combined
Table GC-11 (Report Table 3.2-2) – Summary Emissions for Federal Channel Deepening and Berth Deepening
Total General Conformity emissions for Federal Channel and Berth Deepening projects categorized by year
Table GC-12 – Daily Operational Data – Hopper Dredge McFarland
Summary, 1999, 2000, 2001, 2002, 2003
Data from 5-years of daily reports for dredging performed by the McFarland on the Delaware River.
Table GC-13 – Offsite Vessel Emission Reduction
Analysis of emission reduction potential for the different engine configurations for the McFarland, Local/Regional Ferries, and Local/Regional Tugboats.
Table GC-14 – O&M Dredging Electrification Cost Comparison
Analysis of emission reduction potential and costs for the electrification of the various O&M hydraulic dredging projects that occur on an annual basis.
DELAWARE RIVER MAIN CHANNEL DEEPENING PROJECT
GENERAL CONFORMITY ANALYSIS AND MITIGATION REPORT
ES-1
MOFFATT & NICHOL
EXECUTIVE SUMMARY
Introduction
The Delaware River Main Channel Deepening Project (Project) proposes to deepen the main channel from –40 feet to –45 feet mean low water (MLW). The proposed Project extends from the Ports of Camden, New Jersey and Philadelphia, Pennsylvania to the mouth of Delaware Bay, and follows the alignment of the existing federally authorized channel. In addition to the channel deepening, several berths at the various oil refineries and port facilities along the Delaware River will also be deepened as part of the federal project. The costs of the berth deepening’s will be borne by the facility owners and are not part of the Federal Project costs. However, based on the recommendation from the Environmental Protection Agency (EPA) the emissions from the berth deepening’s have been included as part of the General Conformity analysis. A majority of the oil refinery berths and port terminals are located in the upstream reaches of the river near the Philadelphia/Camden area.
Purpose
The purpose of this study was to determine the air emissions for the different types of equipment that will be used to construct the Project, in order to address the requirements of General Conformity (GC) of the Clean Air Act. Based on the results of the air emissions analysis, an emission mitigation plan was developed that demonstrates compliance with the Clean Air Act requirements.
Federal Clean Air Act
The Environmental Protection Agency’s Office of Air Quality Planning and Standards has set National Ambient Air Quality Standards (NAAQS) for six principal pollutants, called "criteria" pollutants. They are carbon monoxide (CO), nitrogen dioxide (NOx), ozone (VOC), lead (Pb), particulates (PM2.5 and PM10), and sulfur dioxide (SOx). The 1990 Federal Clean Air Act Amendments directed EPA to develop two federal conformity rules. Those rules (promulgated as 40 CFR Parts 51 and 93) are designed to ensure that federal actions do not cause or contribute to air quality violations in areas that do not meet the NAAQS.
Local Setting
Construction equipment associated with the Delaware River Main Channel Deepening Project would contribute criteria pollutants within ten counties in three states (Delaware, Pennsylvania, and New Jersey). All ten counties within the Project limits are in “non-attainment” status for both VOC and NOx, and two counties in maintenance status for CO.
The Delaware River Main Channel Deepening Project would trigger a conformity analysis if its emissions exceeded the respective “de minimis” limits in any of the counties, or 10 percent of the “non-attainment” area’s total emissions for that pollutant.
DELAWARE RIVER MAIN CHANNEL DEEPENING PROJECT
GENERAL CONFORMITY ANALYSIS AND MITIGATION REPORT
ES-2
MOFFATT & NICHOL
There are more than one non-attainment areas in the Project area. After discussion with EPA it was determined that the Project emissions could be characterized as taking place in a single, combined non-attainment area. This area would take on the most severe classification for each pollutant of concern (e.g. 100-tons for CO; 25-tons for NOx and 25-tons for VOC).
Emission Sources
The emission sources for the Delaware River Main Channel Deepening Project consist of marine and land-based mobile sources that will be utilized during the six-year project construction (five year for the federal project and one year for the berthing areas). The marine emission sources include the various types of dredges (clamshell, hydraulic, and hopper) as well as all support equipment. The land-based emission sources include both off-road and on-road equipment. The off-road equipment consists of the heavy equipment utilized to construct and maintain the disposal sites. The on-road equipment is made up of employee vehicles and any on-road trucks utilized for the Project. The marine emission sources and off-road equipment consist primarily of diesel-powered engines. The on-road vehicles are a combination of gas and diesel-powered vehicles.
Emission Estimates
Operational information for the various engines was obtained from the Project cost estimates. Engine load factors and emission factors were determined using EPA guidelines.
The air emissions were determined on an annual basis for each piece of equipment. The emissions were then totaled on an annual basis for all equipment (regardless of where the construction was taking place). The annual emissions for the Project were then compared to the “de minimis” threshold level for the combined non-attainment area, where applicable.
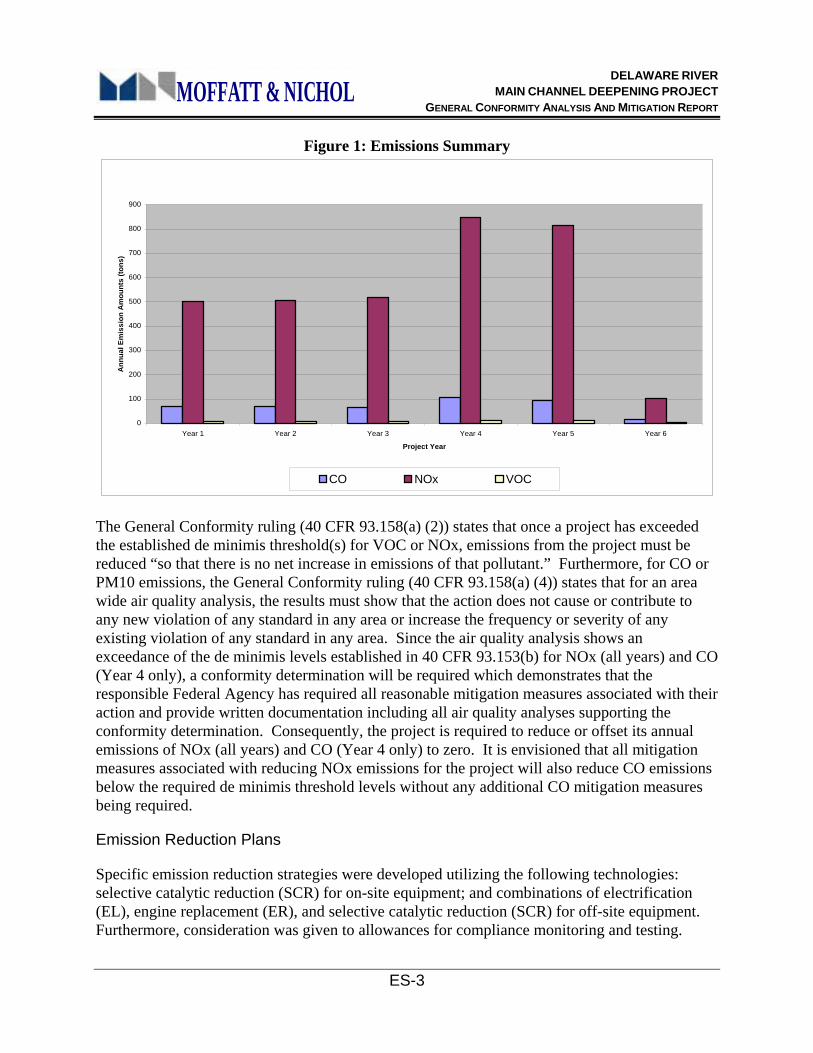
Figure 1 displays the annual emissions estimated for the Project. It was found that the NOx emissions exceed the “de minimis” threshold limits in every year of the Project. The NOx emissions from the Project varied from 102 tons per year to 849 tons per year. In addition, the CO emissions were 106 tons in Year 4, which also exceeds the “de minimis” limits. The VOC emissions were under the “de minimis” limits for all years of the Project.
DELAWARE RIVER MAIN CHANNEL DEEPENING PROJECT
GENERAL CONFORMITY ANALYSIS AND MITIGATION REPORT
ES-3
MOFFATT & NICHOL
Figure 1: Emissions Summary
0
100
200
300
400
500
600
700
800
900
Year 1 Year 2 Year 3 Year 4 Year 5 Year 6
Project Year
Ann
ual E
mis
sion
Am
ount
s (to
ns)
CO NOx VOC
The General Conformity ruling (40 CFR 93.158(a) (2)) states that once a project has exceeded the established de minimis threshold(s) for VOC or NOx, emissions from the project must be reduced “so that there is no net increase in emissions of that pollutant.” Furthermore, for CO or PM10 emissions, the General Conformity ruling (40 CFR 93.158(a) (4)) states that for an area wide air quality analysis, the results must show that the action does not cause or contribute to any new violation of any standard in any area or increase the frequency or severity of any existing violation of any standard in any area. Since the air quality analysis shows an exceedance of the de minimis levels established in 40 CFR 93.153(b) for NOx (all years) and CO (Year 4 only), a conformity determination will be required which demonstrates that the responsible Federal Agency has required all reasonable mitigation measures associated with their action and provide written documentation including all air quality analyses supporting the conformity determination. Consequently, the project is required to reduce or offset its annual emissions of NOx (all years) and CO (Year 4 only) to zero. It is envisioned that all mitigation measures associated with reducing NOx emissions for the project will also reduce CO emissions below the required de minimis threshold levels without any additional CO mitigation measures being required.
Emission Reduction Plans
Specific emission reduction strategies were developed utilizing the following technologies: selective catalytic reduction (SCR) for on-site equipment; and combinations of electrification (EL), engine replacement (ER), and selective catalytic reduction (SCR) for off-site equipment. Furthermore, consideration was given to allowances for compliance monitoring and testing.
DELAWARE RIVER MAIN CHANNEL DEEPENING PROJECT
GENERAL CONFORMITY ANALYSIS AND MITIGATION REPORT
ES-4
MOFFATT & NICHOL
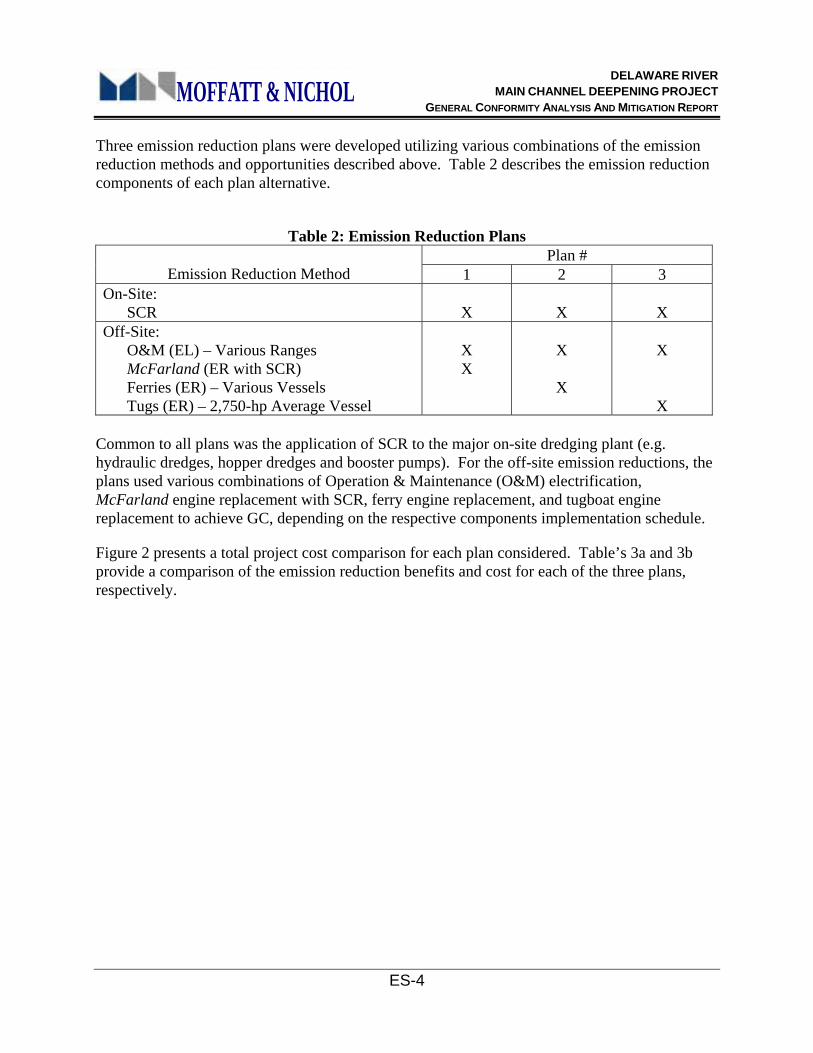
Three emission reduction plans were developed utilizing various combinations of the emission reduction methods and opportunities described above. Table 2 describes the emission reduction components of each plan alternative.
Table 2: Emission Reduction Plans
Plan # Emission Reduction Method 1 2 3
On-Site: SCR
X
X
X
Off-Site: O&M (EL) – Various Ranges McFarland (ER with SCR) Ferries (ER) – Various Vessels Tugs (ER) – 2,750-hp Average Vessel
X X
X
X
X
X Common to all plans was the application of SCR to the major on-site dredging plant (e.g. hydraulic dredges, hopper dredges and booster pumps). For the off-site emission reductions, the plans used various combinations of Operation & Maintenance (O&M) electrification, McFarland engine replacement with SCR, ferry engine replacement, and tugboat engine replacement to achieve GC, depending on the respective components implementation schedule.
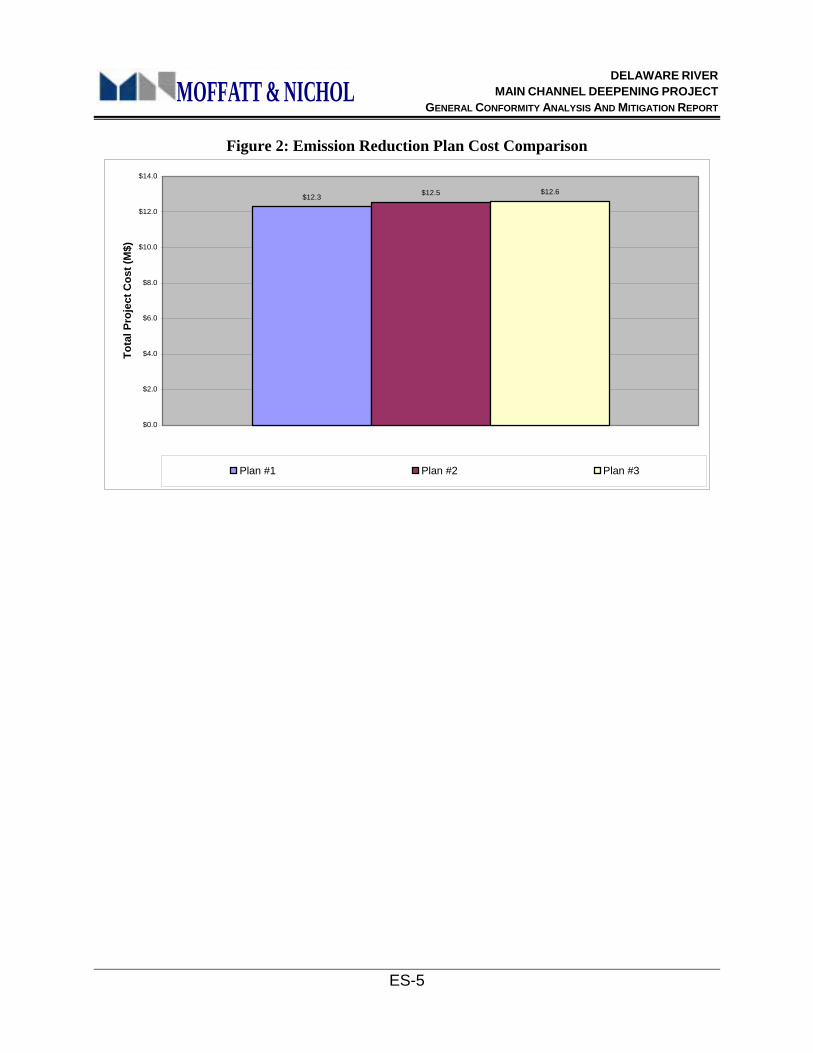
Figure 2 presents a total project cost comparison for each plan considered. Table’s 3a and 3b provide a comparison of the emission reduction benefits and cost for each of the three plans, respectively.
DELAWARE RIVER MAIN CHANNEL DEEPENING PROJECT
GENERAL CONFORMITY ANALYSIS AND MITIGATION REPORT
ES-5
MOFFATT & NICHOL
Figure 2: Emission Reduction Plan Cost Comparison
$12.3 $12.5 $12.6
$0.0
$2.0
$4.0
$6.0
$8.0
$10.0
$12.0
$14.0
Tota
l Pro
ject
Cos
t (M
$)
Plan #1 Plan #2 Plan #3
DELAWARE RIVER MAIN CHANNEL DEEPENING PROJECT
GENERAL CONFORMITY ANALYSIS AND MITIGATION REPORT
ES-6
MOFFATT & NICHOL
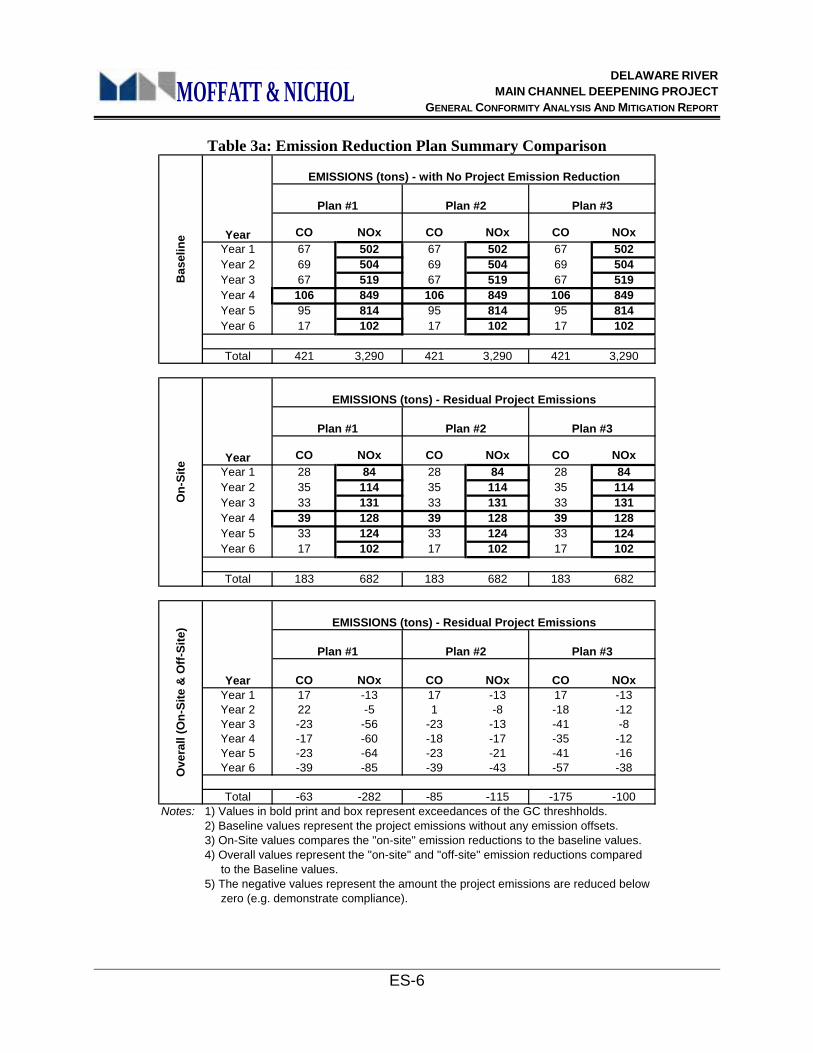
Table 3a: Emission Reduction Plan Summary Comparison
CO NOx CO NOx CO NOxYear 1 67 502 67 502 67 502Year 2 69 504 69 504 69 504Year 3 67 519 67 519 67 519Year 4 106 849 106 849 106 849Year 5 95 814 95 814 95 814Year 6 17 102 17 102 17 102
Total 421 3,290 421 3,290 421 3,290
CO NOx CO NOx CO NOxYear 1 28 84 28 84 28 84Year 2 35 114 35 114 35 114Year 3 33 131 33 131 33 131Year 4 39 128 39 128 39 128Year 5 33 124 33 124 33 124Year 6 17 102 17 102 17 102
Total 183 682 183 682 183 682
CO NOx CO NOx CO NOxYear 1 17 -13 17 -13 17 -13Year 2 22 -5 1 -8 -18 -12Year 3 -23 -56 -23 -13 -41 -8Year 4 -17 -60 -18 -17 -35 -12Year 5 -23 -64 -23 -21 -41 -16Year 6 -39 -85 -39 -43 -57 -38
Total -63 -282 -85 -115 -175 -100Notes: 1) Values in bold print and box represent exceedances of the GC threshholds.
2) Baseline values represent the project emissions without any emission offsets.3) On-Site values compares the "on-site" emission reductions to the baseline values.4) Overall values represent the "on-site" and "off-site" emission reductions compared to the Baseline values.5) The negative values represent the amount the project emissions are reduced below zero (e.g. demonstrate compliance).
Year
Year
Year
Bas
elin
eO
n-Si
te
Ove
rall
(On-
Site
& O
ff-Si
te)
Plan #2 Plan #3
EMISSIONS (tons) - with No Project Emission Reduction
Plan #1
EMISSIONS (tons) - Residual Project Emissions
Plan #1 Plan #2 Plan #3
EMISSIONS (tons) - Residual Project Emissions
Plan #1 Plan #2 Plan #3
DELAWARE RIVER MAIN CHANNEL DEEPENING PROJECT
GENERAL CONFORMITY ANALYSIS AND MITIGATION REPORT
ES-7
MOFFATT & NICHOL
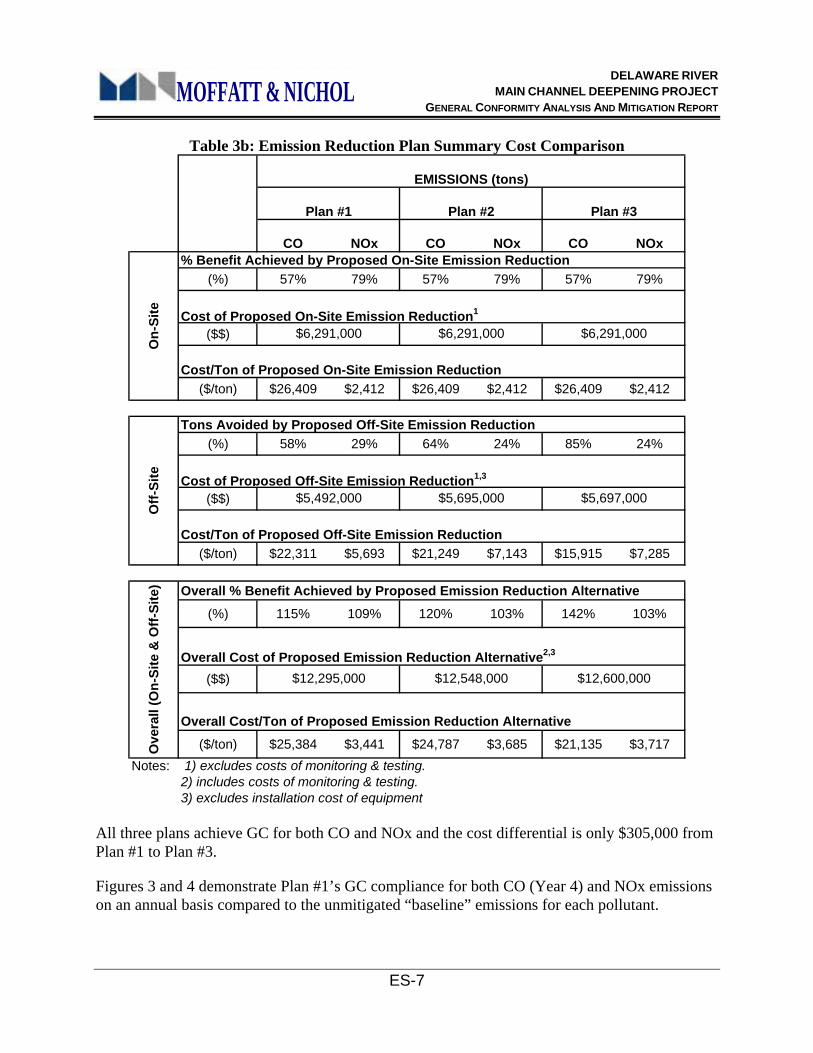
Table 3b: Emission Reduction Plan Summary Cost Comparison
CO NOx CO NOx CO NOx% Benefit Achieved by Proposed On-Site Emission Reduction
(%) 57% 79% 57% 79% 57% 79%
Cost of Proposed On-Site Emission Reduction1
($$)
Cost/Ton of Proposed On-Site Emission Reduction($/ton) $26,409 $2,412 $26,409 $2,412 $26,409 $2,412
Tons Avoided by Proposed Off-Site Emission Reduction(%) 58% 29% 64% 24% 85% 24%
Cost of Proposed Off-Site Emission Reduction1,3
($$)
Cost/Ton of Proposed Off-Site Emission Reduction($/ton) $22,311 $5,693 $21,249 $7,143 $15,915 $7,285
Overall % Benefit Achieved by Proposed Emission Reduction Alternative(%) 115% 109% 120% 103% 142% 103%
Overall Cost of Proposed Emission Reduction Alternative2,3
($$)
Overall Cost/Ton of Proposed Emission Reduction Alternative($/ton) $25,384 $3,441 $24,787 $3,685 $21,135 $3,717
Notes: 1) excludes costs of monitoring & testing.2) includes costs of monitoring & testing.3) excludes installation cost of equipment
$12,295,000 $12,548,000 $12,600,000
Plan #2 Plan #3
$5,492,000 $5,695,000 $5,697,000
Off-
Site
Ove
rall
(On-
Site
& O
ff-Si
te)
EMISSIONS (tons)
Plan #1
On-
Site
$6,291,000 $6,291,000 $6,291,000
All three plans achieve GC for both CO and NOx and the cost differential is only $305,000 from Plan #1 to Plan #3.
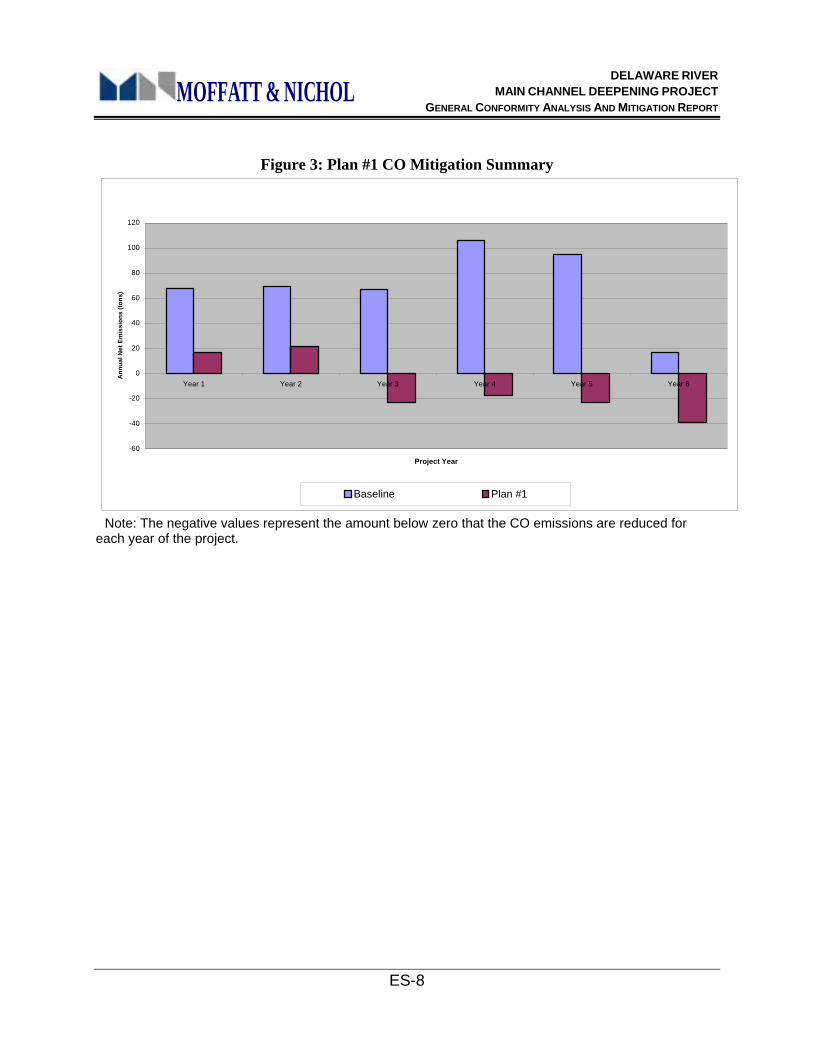
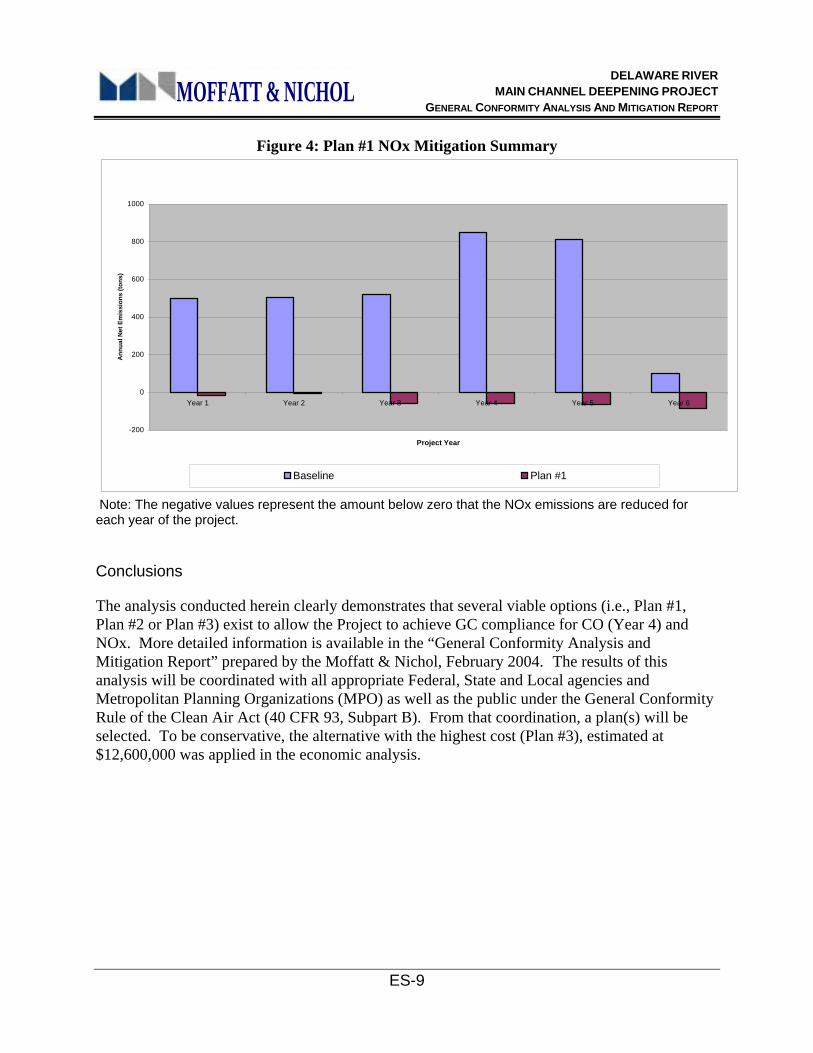
Figures 3 and 4 demonstrate Plan #1’s GC compliance for both CO (Year 4) and NOx emissions on an annual basis compared to the unmitigated “baseline” emissions for each pollutant.
DELAWARE RIVER MAIN CHANNEL DEEPENING PROJECT
GENERAL CONFORMITY ANALYSIS AND MITIGATION REPORT
ES-8
MOFFATT & NICHOL
Figure 3: Plan #1 CO Mitigation Summary
-60
-40
-20
0
20
40
60
80
100
120
Year 1 Year 2 Year 3 Year 4 Year 5 Year 6
Project Year
Ann
ual N
et E
mis
sion
s (to
ns)
Baseline Plan #1
Note: The negative values represent the amount below zero that the CO emissions are reduced for each year of the project.
DELAWARE RIVER MAIN CHANNEL DEEPENING PROJECT
GENERAL CONFORMITY ANALYSIS AND MITIGATION REPORT
ES-9
MOFFATT & NICHOL
Figure 4: Plan #1 NOx Mitigation Summary
-200
0
200
400
600
800
1000
Year 1 Year 2 Year 3 Year 4 Year 5 Year 6
Project Year
Ann
ual N
et E
mis
sion
s (to
ns)
Baseline Plan #1
Note: The negative values represent the amount below zero that the NOx emissions are reduced for each year of the project.
Conclusions
The analysis conducted herein clearly demonstrates that several viable options (i.e., Plan #1, Plan #2 or Plan #3) exist to allow the Project to achieve GC compliance for CO (Year 4) and NOx. More detailed information is available in the “General Conformity Analysis and Mitigation Report” prepared by the Moffatt & Nichol, February 2004. The results of this analysis will be coordinated with all appropriate Federal, State and Local agencies and Metropolitan Planning Organizations (MPO) as well as the public under the General Conformity Rule of the Clean Air Act (40 CFR 93, Subpart B). From that coordination, a plan(s) will be selected. To be conservative, the alternative with the highest cost (Plan #3), estimated at $12,600,000 was applied in the economic analysis.
DELAWARE RIVER MAIN CHANNEL DEEPENING PROJECT
GENERAL CONFORMITY ANALYSIS AND MITIGATION REPORT
1
MOFFATT & NICHOL
1 INTRODUCTION
1.1 Background
This report presents a comprehensive analysis of the air quality impacts due to construction of the proposed Federal Delaware River Main Channel Deepening Project including the associated berth modification for the benefiting terminals, and the development and selection of a mitigation plan to bring the project into compliance with General Conformity (GC) standards of the Clean Air Act. The analysis incorporated the potential impacts from the associated deepening of the benefiting berthing areas as recommended by the Environmental Protection Agency.
The report is sub-divided into three distinct phases. The first phase presents an analysis of the marine and land-based mobile source emissions for construction of the proposed Delaware River Main Channel Deepening Project to address the requirements of General Conformity of the Clean Air Act. The second phase of the report presents analyses and recommendations for an emission reduction strategy based on the findings of the GC analysis. The third phase of the report presents the resulting emission reduction (mitigation) plan and calculations for mitigating the air quality impacts caused by construction of the Delaware River Main Federal shipping channel and berthing areas for the benefiting terminals
This report is part of the U.S. Army Corps of Engineers, Philadelphia District (Philadelphia District) Delaware River Main Channel Deepening Project studies, which proposes to deepen the current main channel alignment from –40 feet to –45 feet mean low water (MLW). The project encompasses the Delaware River system from the mouth of Delaware Bay to the port facilities at Philadelphia, Pennsylvania and Camden, New Jersey. The analysis contained in this report is based upon work performed in previous studies for the Delaware River Main Channel Deepening Project, construction cost estimates, Environmental Protection Agency (EPA) reports and models on engine emissions, research from informational databases on ship engine performance, and personal telephone conversations with the Pilots’ Association for Delaware Bay and River Delaware, vessel owners, and engine manufacturers.
The Environmental Protection Agency’s Office of Air Quality Planning and Standards has set National Ambient Air Quality Standards (NAAQS) for six principal pollutants, called "criteria" pollutants. They are carbon monoxide (CO), nitrogen dioxide (NOx), ozone (VOC), lead (Pb), particulates (PM2.5 and PM10), and sulfur dioxide (SOx). The 1990 Federal Clean Air Act Amendments directed EPA to develop two federal conformity rules. Those rules (promulgated as 40 CFR Parts 51 and 93) are designed to ensure that federal actions do not cause or contribute to air quality violations in areas that do not meet the NAAQS. The rules include transportation conformity, which applies to transportation plans, programs, and projects; and general conformity, which applies to all other projects, which would include the proposed Delaware River Main Channel Deepening Project.
DELAWARE RIVER MAIN CHANNEL DEEPENING PROJECT
GENERAL CONFORMITY ANALYSIS AND MITIGATION REPORT
2
MOFFATT & NICHOL
Under EPA rules, each state may promulgate its own conformity regulations. State conformity regulations must be consistent with EPA’s regulations for state programs (40 CFR 51, Subpart W), but can be more stringent than federal regulations, provided the more stringent requirements apply equally to Federal and non-Federal entities (40 CFR 51.851(b)). Delaware, Pennsylvania, and New Jersey do not have more stringent regulations than the federal requirements.
Conformity determination is a two-step process: (1) applicability analysis and (2) conformity analysis. Applicability analysis is achieved by comparing the project’s annual emissions to “de minimis” pollutant thresholds outlined in the conformity rule. The more severe the “nonattainment” status of a region, the smaller the corresponding “de minimis” thresholds are set. Federal actions are assumed to conform to the most recent federally approved State Implementation Plan (SIP) if total direct and indirect emissions caused by the federal action are less than the “de minimis” thresholds. The definitions of total direct and indirect emissions for conformity determination distinguish emissions by timing and location rather than the type of emission source.
Direct emissions occur at the same time and place as the federal action. Indirect emissions include those that may occur later in time or at a distance from the federal action. In addition, the conformity rule limits the scope of indirect emissions to those that can be quantified and are reasonably foreseeable by the federal agency and those, which the federal agency can practicably control through its continuing program responsibility. If emissions from a proposed federal action exceed a “de minimis” threshold, a formal conformity analysis is required as the next step in the conformity determination process.
1.2 Purpose
The purpose of this report was to develop air emission estimates for the different types of equipment that will be used to construct the Delaware River Main Channel Deepening Project and the berthing areas of the benefiting terminals. The air emission estimates for the berth deepening’s are included as part of the Federal channel air emissions. The project’s construction emissions were calculated to address the requirements of GC of the Clean Air Act. Under the GC regulations, an emissions analysis is required to determine the total direct and indirect emissions for each criteria pollutant within the project limits. Based on the results of the air emissions analysis, an emission reduction strategy was developed to allow the project to comply with the General Conformity requirements of the Clean Air Act.
1.3 Scope of Work
The scope of work involved the following tasks:
1) Determine the emission quantities for each year of construction of the proposed Delaware River Main Channel Deepening Project and berthing areas for the marine and land-based sources.
DELAWARE RIVER MAIN CHANNEL DEEPENING PROJECT
GENERAL CONFORMITY ANALYSIS AND MITIGATION REPORT
3
MOFFATT & NICHOL
2) Present estimated emissions for each pollutant by the applicable non-attainment and maintenance area.
3) Develop preliminary recommendations of various emission reduction alternatives that will enable the Project to comply with the requirements for GC.
4) Prepare preliminary calculations quantifying the approximate benefits to be gained by the implementation of the emission reduction alternatives.
5) Estimate project implementation costs for each emission reduction alternative recommended and cost per ton of pollutant avoided.
6) Compare the mitigated emissions estimates by the applicable non-attainment or maintenance area to the de minimis levels listed in 40 CFR 93.153(b) to determine if the emissions are at or above the specified levels.
7) Identify a preferred mitigation alternative that demonstrates compliance with the General Conformity requirements of the Clean Air Act.
This report contains tables and figures that will delineate summary information for all tasks of work. In addition, a CD has been included with the report that contains the backup data files used to calculate the required emissions and perform the emission reduction benefits of the proposed mitigation plan. Throughout the report, the tables included in the report are referred to as Report Tables, while the backup data tables are referred to as Data CD Tables.
2 METHODOLOGY FOR DETERMINING GENERAL CONFORMITY
2.1 Study Area
The proposed project encompasses the Delaware River system from the Ports of Camden and Philadelphia, to the mouth of Delaware Bay. The Delaware River Main Channel Deepening Project would extend over approximately 100 river miles, following the alignment of the existing 40-foot Federally maintained channel. The proposed project borders the states of New Jersey, Pennsylvania, and Delaware. Maps of the different contracts (provided by the Philadelphia District) involved in the Delaware River Main Channel Deepening Project are shown in Report Figures 2-1 through 2-5.1 The maps outline the different main channel reaches and also show the upland disposal sites to be used for the proposed project.
In addition to the Federal channel deepening, berths at the various oil refineries and port terminals along the Delaware River will also need to be deepened by their owners. The berths to be deepened are as follows:
• Sun Oil Company - Marcus Hook, Pa
DELAWARE RIVER MAIN CHANNEL DEEPENING PROJECT
GENERAL CONFORMITY ANALYSIS AND MITIGATION REPORT
4
MOFFATT & NICHOL
• Phillips 66 (Tosco) - Marcus Hook, Pa
• Valero – Paulsboro, NJ
• Sun Oil Company – Fort Mifflin, Pa
• Coastal Eagle Point – Westville, NJ
• Packer Ave. Terminal – Philadelphia, Pa
• Beckett St. Terminal – Camden, NJ
A majority of the oil refinery berths and port terminals are located in the upstream reaches of the project area near the Philadelphia/Camden area.
2.2 Construction Cost Estimates
The Philadelphia District provided the background information and necessary data related to the dredging and construction requirements for completion of the deepening project as well as deepening of the berthing areas. The data consisted of cost estimates for each year of the Federal channel deepening project including disposal site costs, cost estimates for the non-Federal (berthing areas) deepening projects, and maps detailing the dredging and disposal areas.
The Philadelphia District provided cost estimates for each component of the deepening project. The estimates were provided in the Corps of Engineers Dredge Estimating Program (CEDEP) format.2 The Federal channel portion of the Delaware River Main Channel Deepening Project currently consists of nine separate dredging and construction contracts distributed over a 5-year period. Utilizing CEDEP, the Philadelphia District performed production-based dredging cost estimates for each of the nine different contracts. The estimates provided detailed information with regard to the type and size of equipment required for each contract, type of material dredged, dredging and disposal location, end use for dredged material, hours of operation, and labor requirements. Information regarding work performed at the various disposal sites was detailed in additional estimates and spreadsheets. The estimates and spreadsheets contained information on equipment types and the corresponding production rates utilized to construct the disposal sites, build dikes, construct sluice boxes, and place groins and geotextile tubes.
The Philadelphia District also provided detailed construction cost estimates for the various berth deepening’s and modification that will occur at each of the benefiting oil refineries and port terminals.2 The estimates were in the same format as the channel deepening estimates and included similar detailed information. Berth deepening modification estimates were provided for the following locations: Sun Oil Company – Marcus Hook, Phillips 66 (Tosco) – Marcus Hook, Valero – Paulsboro, Sun Oil Company – Ft. Mifflin, Coastal Eagle Point – Westville, Packer Avenue Terminal – Philadelphia, and Beckett Street Terminal – Camden. Since the majority of the facilities are located near the upstream end of the project, it is assumed the berths will not be deepened until the Federal shipping channel deepening is completed.
DELAWARE RIVER MAIN CHANNEL DEEPENING PROJECT
GENERAL CONFORMITY ANALYSIS AND MITIGATION REPORT
5
MOFFATT & NICHOL
The information contained in the Federal channel and berth deepening project estimates was utilized to perform the air emission calculations for the GC compliance requirements.
2.3 Emission Types and Sources
As stated earlier, a conformity determination is required where a Federal action causes the total of direct and indirect emissions, to equal or exceed the prescribed air quality standards. The quantity of pollutants present in exhaust emissions from all mobile sources involved in the construction of the project must be determined. The following sections will discuss the criteria pollutants and potential emission sources involved in the proposed Delaware River Main Channel Deepening Project.
2.3.1 Pollutant Types
The Code of Federal Regulations Title 40, Part 50 (40 CFR 50) establishes the overall regulations that specify the allowable concentrations of certain key constituents in the atmosphere. These standards are known as the National Ambient Air Quality Standards (NAAQS).3 Report Table 2.3-1 shows the Federal ambient air quality standards plus the states of Pennsylvania, New Jersey, and Delaware.
Each state is required to achieve compliance with the air quality standards through a State Implementation Plan (SIP). The SIP provides specific goals and requirements for the state and different regions within the state for meeting the air quality standards. The degree to which the regions meet the air quality standards is referred to as “attainment”. Regions that do not meet the air quality standards are referred to as “nonattainment” or “maintenance” areas. The Code of Federal Regulations Title 40, Part 93, Section 153, (40 CFR 93.153) establishes threshold limits (“de minimis” levels in tons/year) for the regulated pollutants in “nonattainment” and “maintenance” areas.4
A federal action, such as the proposed Delaware River Main Channel Deepening Project, requires a conformity determination to establish whether the project causes the criteria pollutants to exceed the air quality standards. An emissions analysis is required to determine the total direct and indirect emissions for each pollutant in the applicable “nonattainment” and “maintenance” areas.4 There are “nonattainment” and “maintenance” areas within the proposed Delaware River Main Channel Deepening Project limits for the following regulated pollutants: Volatile Organic Compounds (VOC’s; regulated as a Hydrocarbon, HC, by EPA), Nitrogen Oxides (NOx), and Carbon Monoxide (CO). In addition, the following federally regulated pollutants will also be included in the emission estimates: Particulate Matter, and Sulfur Oxides (SOx). Particulate Matter emissions were calculated for PM10 (particulates with an aerodynamic diameter of less than 10 microns, also called coarse particles) and PM2.5 (particulates with an aerodynamic diameter of less than 2.5 microns, also called fine particles). Emission estimates were performed for the above 6 pollutants and the results compared to the applicable “de minimis" levels, where applicable.
DELAWARE RIVER MAIN CHANNEL DEEPENING PROJECT
GENERAL CONFORMITY ANALYSIS AND MITIGATION REPORT
6
MOFFATT & NICHOL
In addition to the above listed regulated pollutants, Lead (Pb) is also one of the listed pollutants in 40 CFR 93.153. Airborne Lead in urban areas is primarily emitted by vehicles using leaded fuels. Lead emissions were thought to be a concern in past years, however with the increasing use of unleaded gasoline, lead standards are not expected to be violated in any aspect of the project and need not be addressed. The EPA model utilized to calculate vehicle emissions (discussed in Section 2.4.3) assumes that all post-1975 model year vehicles that were not tampered with and all calendar years subsequent to 1991 are free from lead emissions.5
2.3.2 Emission Sources
The emission sources for the Delaware River Main Channel Deepening Project consist of marine and land-based mobile sources that will be utilized during the six-year project construction (five years for Federal project construction and one year for berthing areas after the Federal project is completed).
The marine sources include the various types of dredges (clamshell, hydraulic, and hopper) utilized to dredge material from the main channel as well as all support equipment (tugboat, crew boat, derrick barge, anchor scow, booster pump, dump scow, and drill boat). The land-based emission sources will include both off-road and on-road equipment. The off-road equipment consists of the heavy equipment utilized to construct and maintain the disposal sites (dozers, loaders, cranes, excavators, off-road trucks, welders, pile hammers, and pumps). The on-road equipment is made up of employee vehicles and any on-road trucks utilized for the project.
The marine emission sources consist primarily of diesel-powered engines. The off-road equipment is all diesel-powered equipment, and the on-road vehicles are a combination of gas and diesel-powered vehicles.
2.4 Air Emission Models
In order to determine the air emission quantities, background information (engine horsepower, hours of operation, and fuel source) on the different equipment types needed to be established. Once this information was developed, then the different engine load factors and emission factors were determined. Depending on the different emission sources, marine, land-based off-road equipment, or on-road vehicles, the EPA has guidelines that determine the appropriate engine load factors and emission factors. The EPA guidelines and models are discussed below for the various emission sources.
DELAWARE RIVER MAIN CHANNEL DEEPENING PROJECT
GENERAL CONFORMITY ANALYSIS AND MITIGATION REPORT
7
MOFFATT & NICHOL
2.4.1 Control of Emissions from Marine Diesel Engines
The marine emission sources are comprised of the different types of dredges along with the associated support equipment. The EPA currently has an extensive compilation of air emission factors for various types of equipment (Compilation of Air Emission Factors, AP-42). There have been recent updates to EPA’s methodology for developing emission factors as newer engines are being developed, operated, and tested. The latest EPA technical report for developing load factors and emission factors for large compression-ignition marine diesel engines is prescribed in “Analysis of Commercial Marine Vessels Emissions and Fuel Consumption Data”, EPA420-R-00-002, February 2000.6 The technical report is a compilation of engine and fuel usage test data from various types of marine vessels including, bulk carriers, container ships, dredges, tankers, and tugboats.
This report was utilized to determine the load factors and emission factors for the various pieces of marine equipment that will be employed during construction of the project. The load factors for the marine equipment shown in Table 5-2 of the EPA technical report “Analysis of Commercial Marine Vessels Emissions and Fuel Consumption Data”6 are based on the suggested operating mode of the vessel. The load factors are given for the corresponding operating mode (cruise, slow cruise, maneuvering, and hoteling) for the different types of vessels.
Detailed emission factors were determined through a regression analysis of the representative test data. Emission factor algorithms were determined for the different pollutants and also for fuel consumption, which is used to determine the SOx emission factor. The sulfur content for the fuel consumption regression for SOx was set to 3300 parts per million (ppm), which is the national average for nonroad diesel. The marine engine emission factor and fuel consumption algorithms are presented in Table 5-1 of the EPA technical report “Analysis of Commercial Marine Vessels Emissions and Fuel Consumption Data”.6 The emission factor and fuel consumption rate algorithms are applicable to all engine sizes since the emissions data showed no statistically significant difference across engine sizes. All of the equipment required for dredging, transport and placement of the dredged material is accounted for in the emissions modeling.
2.4.2 National NONROAD Emissions Model
The off-road land-based emissions were calculated using an EPA computer model. The EPA has developed a draft national nonroad emissions model to assist states and regulatory agencies to more accurately predict nonroad emission inventories. The model, called NONROAD7, calculates emissions for many nonroad equipment types, categorizing them by horsepower rating and fuel type. The NONROAD model will estimate emissions for six different exhaust pollutants: HC, NOx, CO, CO2, SOx, and PM. HC can be reported as total hydrocarbons (THC), total organic gases (TOG), non-methane organic gases (NMOG), non-methane hydrocarbons (NMHC), or volatile organic compounds (VOC).
DELAWARE RIVER MAIN CHANNEL DEEPENING PROJECT
GENERAL CONFORMITY ANALYSIS AND MITIGATION REPORT
8
MOFFATT & NICHOL
The NONROAD model contains several different sets of data files that are used to specify the options for a model run. These data files provide the necessary information to calculate and allocate the emissions estimates. The data files contain information on load factors, emission factors, equipment population, activity, average lifetime hours, growth estimates, equipment scrappage function, geographic location, and temporal allocation. The user specifies options on physical characteristics of the fuel type, temperature ranges, emission calculations period (annual, monthly, and seasonal), region, and equipment sources. The data files can be modified to reflect the project conditions relative to equipment population, annual hours of use, region of use, fuel source, equipment growth or lack thereof, and the phase-in of higher tier emission factors.
The NONROAD Core Model Version 2.1, along with the updated Graphical User Interface Version 2.2.0, was utilized for this project. This release updates the input data files to match what is being used in the air quality modeling for the 2007 Heavy Duty Highway Vehicle rulemaking.8 The input options utilized to run the model are discussed in the analysis section of this report. Information on the latest draft of the NONROAD model is available at EPA’s website (http://www.epa.gov/otaq/nonrdmdl.htm).
2.4.3 Mobile Source Emission Factor Model
The remaining source of emissions for the deepening project will come from employee vehicles and other over-the-road vehicles utilized during the construction process. EPA has developed a mobile source emissions model, MOBILE6.29, to calculate emissions from different vehicle types. MOBILE6.2 is an emission factor model that calculates emissions, in grams per mile, for different vehicle types under various operating conditions. Similar to the NONROAD model, the user specifies various input options on vehicle types, quantity, and operating conditions. The model will then calculate the emission quantities for HC, CO, NOx, CO2, PM, and toxics for each type of vehicle. The emission quantities are then multiplied by the number of miles traveled to determine the final quantities. The input options utilized to run the model are discussed in the analysis section of this report. Information on the MOBILE6.2 emissions model is available at EPA’s website (http://www.epa.gov/otaq/m6.htm).
2.5 General Conformity Analysis
The analysis of the project air emissions was performed as two separate tasks. The first task involved the determination of emission quantities for only the Federal channel portion of the deepening project. The second task involved the determination of emission quantities for the berth deepening at the various oil refineries and port facilities. The following sections discuss the analysis performed for the two separate tasks.
DELAWARE RIVER MAIN CHANNEL DEEPENING PROJECT
GENERAL CONFORMITY ANALYSIS AND MITIGATION REPORT
9
MOFFATT & NICHOL
2.5.1 Federal Channel Deepening Project Emissions
The first step in determining the emission quantities was to develop a list of all the marine (dredging and support) equipment that would be utilized on the Federal channel deepening project and the engine operating characteristics (horsepower and fuel type). This information was retrieved from the detailed cost estimates provided by the Philadelphia District.2 The dredging operations were divided into four categories: clamshell dredge, drill boat, hopper dredge, and hydraulic dredge. Although the drill boat and clamshell dredge work in conjunction, they are analyzed individually as they require their own support vessels and mob/demob operations. Each of these dredge types was then broken down by vessels used for each operation, then by engine type per vessel (i.e. propulsion, secondary, auxiliary, etc.). The breakdown of the different dredge types, engine type and size, support vessels, and mob/demob operations are detailed in Data CD Table GC-2.
Emission rates (tons/hour) for each engine were calculated for each of the required pollutants: CO, NOx, PM2.5, PM10, SOx, and VOC’s. The emission rates were derived from the formula:
Emission Rate (tons/hr) = Engine Horsepower * Engine Load Factor * Emission Factor (Hp) * (grams/hp-hr) * 0.0022046 lbs/1 gram * 1 ton/2000 lbs
The units and conversion factors shown under the text in the above Emission Rate formula apply to the Engine Load Factor and are utilized to convert the load factor from grams per hour to tons per hour.
As stated in Section 2.4.1, the EPA technical report “Analysis of Commercial Marine Vessels Emissions and Fuel Consumption Data” was utilized to determine the appropriate load factors and emission factors to be used for the marine equipment.6 Emission rates for the different dredge types are presented in Data CD Table GC-2.
Load factors and emission factors for the different marine equipment were determined, and a current project schedule was used to determine the annual hours of operation for the equipment. The current project schedule calls for nine different contracts to complete construction, excluding berth deepening’s. The schedule is based on the detailed cost estimates and supporting production spreadsheets that were supplied by the Philadelphia District.2 The different ranges (channel reaches) of the river were broken into separate contracts based on dredge type and disposal location. The contracts were distributed over a 5-year period and take into account the required environmental windows. The project schedule is displayed in Report Figure 2-6.
Utilizing the schedule and corresponding estimates, the annual hours of operation were determined for each piece of marine equipment over the five years of construction. The equipment hours, categorized by channel reach and equipment type, are found in Data CD Table GC-3.
DELAWARE RIVER MAIN CHANNEL DEEPENING PROJECT
GENERAL CONFORMITY ANALYSIS AND MITIGATION REPORT
10
MOFFATT & NICHOL
Due to the fact that the hopper dredge is a self-propelled dredge, different engines are operational at different times throughout the dredging and disposal process. A percent usage amount was applied to the different hopper dredge engine hours and support equipment engine hours, based on the cycle-time information provided in the estimates. For all other dredge types (clamshell, hydraulic, and drill boat), no breakdown of engine hours was provided since the dredges are not self-propelled.
Emission amounts for each of the six pollutants were then calculated based on the following formula:
Emission Amount (tons/year) = Emission Rate (tons/hr) * Working Hours (hrs/year)
The results are found on Data CD Tables GC-4-1 through GC-4-4.
Report Table 2.5-1 presents the total for each emission constituent on an annual basis, categorized by river/channel reach.
The emission quantities for the off-road land-based equipment were determined utilizing EPA’s NONROAD model. The equipment type, engine parameters, hours of operation, and geographic location were derived from the detailed estimates. The land-based equipment was categorized by contract along with the corresponding engine horsepower, quantity in use, and contract duration. Based on the estimates and project schedule, the hours were then distributed to the corresponding years to determine annual operating amounts.
The NONROAD model requires certain information regarding fuel type and physical properties, period of operation, region, equipment source, and equipment population. The NONROAD model was intended to assist states in the creation of accurate nonroad emission inventories. The data files contain information regarding equipment populations and average operating periods for each of the states. In order to use NONROAD for determining emission amounts the default data files needed to be modified. Following is an outline of the assumptions and input options utilized for the NONROAD model runs.
• Options Fuel RVP for gas 6.5 Min temp (F): 25
Oxygen wt. % 0 Max temp (F): 86 Gas sulfur % 0.034 Avg. temp (F): 55 Diesel sulfur % 0.3000 Stage II Control: 0 CNG/LPG sulfur % 0.003
RVP – Reid Vapor Pressure CNG – Compressed Natural Gas LPG – Liquefied Petroleum Gas
• Period Determine the annual emissions (period total) for each year of the individual contracts where the land-based equipment is operating. Land based equipment typically operates 8 hours per day, 6 days per week.
DELAWARE RIVER MAIN CHANNEL DEEPENING PROJECT
GENERAL CONFORMITY ANALYSIS AND MITIGATION REPORT
11
MOFFATT & NICHOL
• Region MIDAT Mid-Atlantic 10000 Delaware MIDAT Mid-Atlantic 34000 New Jersey MW Great Lakes/Midwest 42000 Pennsylvania
• Sources 2270002066 Diesel - Tractors/Loader/Backhoes
2270002069 Diesel - Crawler Tractor/Dozers 2270002045 Diesel - Cranes 2270002051 Diesel - Off-highway Trucks 2270002060 Diesel – Rubber Tire Loaders 2270002036 Diesel – Excavator 2270002081 Diesel – Other Construction Equipment 2270006010 Diesel – Light Commercial Pumps 2270006025 Diesel – Light Commercial Welders
• Geographic Allocation Emissions are being determined for the different pieces of equipment for each contract and then allocated to each state based on the percentages of work being performed in each state.
• Temporal Allocation Use revised season file that shows equal activity over each month.
• Growth Use revised growth file that shows no equipment growth over the life of each contract.
• Equipment Population Use revised equipment population files that show only the equipment being used at the construction site for the different contracts.
• Phase-In Use revised tech file to show only Tier 1 EPA engine standards. The assumption is that all land-based equipment currently meets EPA Tier 1 nonroad engine standards. The modeling for all years (Years 1-5) assumes no equipment turnover or newer engine standards.
• Emission Factors Use default emission factor files.
• Deterioration Factors Use default deterioration factor files.
• Activity Use revised activity file to show only the annual operating hours for the different pieces of equipment for each individual contract.
DELAWARE RIVER MAIN CHANNEL DEEPENING PROJECT
GENERAL CONFORMITY ANALYSIS AND MITIGATION REPORT
12
MOFFATT & NICHOL
Once the appropriate data files had been modified, the model was run for the different contracts on an annual basis. The emission quantity results are presented in Report Table 2.5-2 for the different emission constituents. The above data input files along with the NONROAD output files have been included on the CD.
During the initial stages of the NONROAD model emission quantity calculations, a need was identified to assess the temperature range inputs. As a result, a comparison model run was performed to test the effect of temperature differences on diesel engines. An upland disposal contract was used as the base case for running the comparison since this represents a typical range of equipment that will be used to support the dredging contracts. The equipment utilized was a diesel crane and a diesel dozer. The model runs were performed for the month of January and the month of July to represent the extreme ends of the temperature range. The net effect of the temperature ranges used in the options data input for the model did not affect diesel equipment (i.e. emission amounts were identical). The effects of temperature and fuel volatility on evaporative emissions are directed towards gasoline-fueled engines. Evaporative emissions from diesel-fueled engines are considered negligible due to the extremely low volatility of diesel fuel and are not included in the NONROAD model.10 All of the nonroad land-based equipment being utilized for the project is diesel powered.
The final source of emissions for the deepening project was the mobile source emissions from employee vehicles and other on-road vehicles utilized during the construction of the project. Mobile source emissions were calculated utilizing EPA’s Mobile Source Emission Factor Model, MOBILE6.2. Crew sizes were determined based on the estimates provided by the Philadelphia District. From this, the number of vehicles was determined for each contract, based on the crew size. Each vehicle was assumed to have an occupancy rate of 1.2 passengers. An average of 75% light duty gas vehicles and 25% light duty gas trucks was utilized as the makeup of employee vehicles. An average commute of 25 miles each way at an average speed of 20 miles per hour was assumed for each vehicle. The number of miles per trip was then multiplied by the total number of days for each contract times the number of vehicles to determine the total number of miles traveled. Additional vehicles were added in for transportation of the hopper dredge crew to the airport on a weekly basis and also for a larger truck utilized on one of the upland site contracts.
Similar to the NONROAD model, an options file is created for the MOBILE6.2 model runs. Other assumptions utilized for the options input include a reformulated gas criterion. Reformulated gasoline (RFG) is an EPA rule that affects the properties (sulfur, oxygen, and fuel volatility) of gasoline fuels in regions where RFG is required beginning with the 1995 calendar year.5 The counties surrounding the project area are within the Federal Reformulated Gasoline Program areas. The temperature inputs for the MOBILE6.2 model were based on the average monthly temperatures for the Philadelphia area. The information was derived from the website, http://www.weather.com, and utilizes a 30-year record to determine the monthly average temperatures. Once the options file inputs were created, the model was run for the different contracts and the total emissions were determined. The results for the different emission quantities from the MOBILE6.2 model runs were multiplied
DELAWARE RIVER MAIN CHANNEL DEEPENING PROJECT
GENERAL CONFORMITY ANALYSIS AND MITIGATION REPORT
13
MOFFATT & NICHOL
by the number of vehicles for each contract times the number of miles driven per day times the total number of days for each contract to determine the total amount of emissions for each contract during each calendar year. A summary of the mobile source emission quantities is presented in Report Table 2.5-3 for each emission constituent on an annual basis. The MOBILE6.2 model input and output files are also included on the CD.
2.5.2 Berth Deepening Project Emissions
In addition to the determination of emission quantities for the Federal channel portion of the deepening project, a similar determination was made for the various berth deepening’s that are proposed to occur as part of the project. The berth deepening represents the total emission quantities from the construction of the berths at the benefiting oil refineries/terminals to 45 feet.
The format for determining emission quantities for the berth deepening construction was similar to the methods used for the Federal channel deepening construction emissions. The Philadelphia District provided detailed estimates for the different berths that were being deepened. The estimates were used to create a schedule and determine hours of operation on an annual basis. The schedule for the berth deepening’s are included as part of the Federal channel schedule, shown on Report Figure 2-6. As can be seen on the schedule, two of the berths are dredged in the last year (Year 5) of the Federal channel portion of the project, with the remainder of the berth dredging occurring the following year (Year 6) after completion of the Federal channel.
The marine emissions were calculated in the same manner as the Federal channel construction emissions (as discussed in section 2.5.1) for each of the berth deepening projects. Data CD Tables GC-2B, GC-3B, and GC-4-1B through GC-4-4B present the emission rates for the marine equipment, hours of operation, and emission quantities for the different dredge types utilized for the berth dredging. A summary of the total marine emissions for the berth deepening’s are detailed in Data CD Table GC-8B.
The nonroad and mobile source emissions were determined based on the average daily emissions (tons/day) that were calculated for the Federal channel construction emissions. Based on the schedule, hours of operation, and average daily emissions, the annual emission quantities were calculated for the nonroad and mobile equipment. The mobile source emissions for the berth deepening are included as part of Data CD Table GC-1B. The nonroad emissions are presented in Data CD Table GC-6B for each emission constituent on an annual basis.
DELAWARE RIVER MAIN CHANNEL DEEPENING PROJECT
GENERAL CONFORMITY ANALYSIS AND MITIGATION REPORT
14
MOFFATT & NICHOL
3 GENERAL CONFORMITY RESULTS
3.1 Federal Channel Deepening Emissions Results
The project construction emissions represent the estimated total of direct and indirect emissions that occur during the proposed deepening of the Delaware River Main Channel Deepening Project to 45-feet. The analysis of these emissions is to address the requirements of General Conformity of the Clean Air Act, which includes the Federal channel and berth deepening’s. The emissions for the marine and land-based equipment were determined as discussed in Section 2.5. The calculated emissions were then totaled on an annual basis for all equipment involved in the proposed deepening project. Furthermore, the emissions were distributed to the applicable state where the construction was taking place. The annual emissions for each state were then compared to the “de minimis” threshold levels for the project areas.
Report Table 3.1-1 presents a summary of each emissions categorized by dredge vessel, supporting equipment, and mobilization/demobilization (mob/demob) operations, in addition to total shore equipment and employee vehicle emissions. The emissions for each dredge type are the pollutants for the dredging vessel only. The support equipment includes emissions from all vessels required to assist the dredge during deepening operations (i.e. crew/survey boat, work tug, etc.). The mob/demob emissions are the combined total mobilization and demobilization emissions for all dredging and support equipment. The shore equipment emissions are based on calculations of the National NONROAD Emissions Model (Section 2.4.2) for the upland construction work, and the Employee Vehicles are based on calculations from the Mobile Source Emission Factor Model (Section 2.4.3).
Report Table 3.1-2 presents the total annual emissions for each pollutant that are attributed to each state (Delaware, Pennsylvania, and New Jersey) based on where the construction takes place. The Federal Conformity limits that correspond to the applicable “nonattainment” and “maintenance” areas are compared to the annual totals for each state. As can be seen on Report Table 3.1-2, NOx emissions exceed the Federal Conformity limits (bold print and box) in every year of the project for each state, with the exception of Years 1 and 2 in Pennsylvania and Year 6 in Delaware as very little work is performed in those states during those years. Also, the CO emissions exceed the Federal Conformity limits in Year 4. The other 4 pollutants (PM2.5, PM10, SOx, and VOC’s) are under Federal Conformity limits in all years of the project. Therefore, after discussion with EPA it was determined that the Project emissions could be characterized as taking place in a single, combined non-attainment area. This area would take on the most severe classification for each pollutant of concern (e.g. 100-tons for CO; 25-tons for NOx and 25-tons for VOC).
Further analysis of the emission totals is presented in Report Table 3.1-3, which calculates each pollutant as tons of emissions generated per million cubic yards of material dredged. The quantities are categorized as Clamshell Dredge/Drillboat, Hopper Dredge, or Hydraulic Dredge. Because the shore equipment and employee vehicles are used throughout the entire project and are associated with all of the dredging methods, the amount of material dredged for these
DELAWARE RIVER MAIN CHANNEL DEEPENING PROJECT
GENERAL CONFORMITY ANALYSIS AND MITIGATION REPORT
15
MOFFATT & NICHOL
categories is the sum of all material dredged. The values contained in Report Table 3.1-3 are for the Federal channel deepening only. Data CD Table GC-10B presents the tons of emissions per million cubic yards dredged for the Federal channel and berth deepening projects combined.
3.2 Berth Deepening Emissions Results
The emissions for the marine and land-based equipment for the berth deepening’s were calculated as discussed in Section 2.5.2. The resultant berth deepening emissions were also totaled on an annual basis for all equipment involved in the proposed project. The emissions were then distributed to the applicable state and then compared to the “de minimis” threshold levels for the project areas.
Report Table 3.2-1 presents a summary of each emission categorized by dredge vessel, supporting equipment, and mobilization/demobilization (mob/demob) operations, in addition to total shore equipment and employee vehicle emissions (similar to Federal channel emissions).
Report Table 3.1-2 presents the total annual emissions (including both the Federal project and berth deepening) for each pollutant that are attributed to each state (Delaware, Pennsylvania, and New Jersey) based on where the construction takes place. The berth deepening’s occur during Years 5 and 6, with a majority of the berths being dredged in Year 6. The Federal Conformity limits that correspond to the applicable “nonattainment” and “maintenance” areas are compared to the annual totals for each state.
Report Table 3.2-2 shows the breakout for the berth deepening emission quantities for each project year. As shown on Report Table 3.2-2, the NOx emissions for the berth deepening’s only, exceed the Federal Conformity limits (bold print and box) only in Year 6.
3.3 Emissions Summary
Based on the results detailed in Report Table 3.1-2, the NOx and CO (in Year 4 only) emissions are over the Federal Conformity limits for all years during construction of the proposed project. Due to the NOx and CO emissions exceeding the Federal Conformity limits, the proposed Delaware River Main Channel Deepening Project, according to the General Conformity ruling (40 CFR 93.158 (a)(2) and (a)(4)), will be required to mitigate or offset the NOx emissions to zero and the CO emissions to below the Federal Conformity limits for all construction activities involved in the Federal channel and berth deepening operations.
3.4 Comparison to “de minimis” Levels
The general conformity regulation requires that federal agencies sponsoring non transportation-related activities show that the emissions associated with those activities conform to State Implementation Plans and that their emissions meet specific criteria. First, the emissions must not occur in areas designated as “nonattainment” areas for one or more of the federal ambient air quality standards. Second, those emissions must not exceed certain “de minimis” threshold levels.
DELAWARE RIVER MAIN CHANNEL DEEPENING PROJECT
GENERAL CONFORMITY ANALYSIS AND MITIGATION REPORT
16
MOFFATT & NICHOL
Activities associated with the Delaware River Main Channel Deepening Project would occur within the states of Delaware, New Jersey, and Pennsylvania. The following table summarizes the severity of the “nonattainment” status for each of the criteria pollutants that are not in conformity.
“De Minimis”” Threshold Levels for General Conformity Applicability Analysis
Delaware VOC NOx CO Kent Severe (25 tons/yr) Severe (25 tons/yr)
New Castle Severe (25 tons/yr) Severe (25 tons/yr) Sussex Marginal (50 tons/yr) Marginal (100 tons/yr)
New Jersey
Camden Severe (25 tons/yr) Severe (25 tons/yr) Maintenance (100 tons/yr)
Cape May Moderate (50 tons/yr) Moderate (100 tons/yr) Cumberland Severe (25 tons/yr) Severe (25 tons/yr)
Gloucester Severe (25 tons/yr) Severe (25 tons/yr) Salem Severe (25 tons/yr) Severe (25 tons/yr)
Pennsylvania Delaware Severe (25 tons/yr) Severe (25 tons/yr)
Philadelphia Severe (25 tons/yr) Severe (25 tons/yr) Maintenance (100 tons/yr)
Federal Conformity Limits: (Source: 40 CFR 93.153)
VOCs Severe – 25 tons/year Marginal – 50 tons/year Moderate – 50 tons/year
NOx Severe - 25 tons/year Marginal – 100 tons/year Moderate – 100 tons/year
CO Maintenance – 100 tons/year
The project area is currently designated as a severe “nonattainment” area for VOC’s and NOx in Kent and New Castle Counties (Delaware); Camden, Cumberland, Gloucester, and Salem Counties (New Jersey); and Delaware and Philadelphia Counties (Pennsylvania). As such, the “de minimis” thresholds for these areas are 25 tons per year. Sussex (Delaware) and Cape May (New Jersey) Counties are designated as marginal and moderate respectively for both VOC’s and NOx; both have a corresponding “de minimis” threshold of 50 tons per year for VOC’s and 100 tons per year for NOx. Camden County (New Jersey) and Philadelphia County (Pennsylvania)
DELAWARE RIVER MAIN CHANNEL DEEPENING PROJECT
GENERAL CONFORMITY ANALYSIS AND MITIGATION REPORT
17
MOFFATT & NICHOL
are both designated as “maintenance” areas for Carbon monoxide (CO) with a corresponding threshold of 100 tons per year.
The project would trigger a conformity analysis if its emissions exceeded the following:
1) 25-tons per year of VOC’s or NOx in the severe “nonattainment” counties,
2) 50-tons per year of VOC’s or 100-tons per year of NOx in the moderate and marginal counties,
3) 100-tons per year of CO in the “maintenance” counties, or
4) 10 percent of the “nonattainment” area's total emissions for that parameter.
4 APPROACHES TO EMISSION REDUCTION
Based on the results of the emission quantity calculations and noted Federal conformity exceedances, a preliminary emission reduction strategy needed to be determined. The emission reduction strategy plans focused on NOx reduction due to the large exceedances. Based on the types of emission reduction being employed, it was determined that the emission reduction strategy plans for NOx would also address the CO exceedances. For any project required to comply with GC there are three basic opportunities. These are discussed below.
4.1 On-Site Emission Reduction
The first goal of any emission reduction strategy should be to attempt to mitigate the project’s emissions “on-site” by modifying construction methods, increasing construction duration, applying emission reduction technologies, or combinations of all three. In most cases, application of any of these approaches can have significant effects on the project cost. Therefore, a cost-benefit analysis should be conducted as part of any on-site emission reduction analysis. A more detailed discussion of this analysis is contained in Section 5 of this report.
For this project consideration has been given to all three of the aforementioned approaches. Analyses of various construction methods have been performed and it was determined that their associated cost increases were unacceptable to the Project.
Likewise, based on the findings of the emissions analysis, it was concluded that increasing the construction duration to achieve conformity is unrealistic due to the magnitude of GC NOx exceedance. The Federal Channel deepening NOx emissions are 3,173.56 tons for the 5-year project duration. At 25 tons per year allowance, that would lead to approximately 127 years of construction. Consequently, the only viable alternative for on-site emission reduction is the application of emission reduction control technologies.
A detailed discussion of the various on-site emission reduction control technologies considered for the Project is provided in Section 6 of this report.
DELAWARE RIVER MAIN CHANNEL DEEPENING PROJECT
GENERAL CONFORMITY ANALYSIS AND MITIGATION REPORT
18
MOFFATT & NICHOL
4.2 Off-Site Emission Reduction
Off-site emission reduction can be implemented in many different ways. In the following context, “off-site” refers to methods that are not directly involved in construction of the Project; however, all methods evaluated will take place in the Project non-attainment area (i.e. Delaware River/Bay from Philadelphia to the Sea) where the emissions are generated. For this Project, off-site emission reduction opportunities were identified as follows:
1) Electrification of existing diesel-powered hydraulic dredges and booster pumps performing annual maintenance dredging within the Project air shed.
2) Either replacing the engines or installing emission control devices on the Corps’ hopper dredge McFarland that performs annual maintenance dredging within the Project air shed.
3) Either replacing the engines or installing emission control devices on various local ferries currently operating on the Delaware River within the Project air shed.
4) Either replacing the engines or installing emission control devices on various local tugboats currently operating on the Delaware River within the Project air shed.
An initial analysis was performed on the above alternatives in order to allow the Corps to make preliminary judgments as to which alternatives appear to offer the most effective opportunity for the proposed project to comply with GC for NOx and CO.
After the preferred strategy for emission reduction was identified, preliminary assumptions were investigated in detail and the estimates of emission reduction re-calculated to confirm compliance with GC for NOx and CO has been attained. A more detailed discussion of each of these alternatives is contained in Section 7 of this report.
4.3 Emission Credits
Another opportunity to reduce the emission impacts from the Project is to purchase emission reduction credits in order to offset the emissions produced by the Project. In most areas of the country that do not conform to the national ambient air quality standards set by EPA, programs have been established that allow emitters to trade on the open market “credits” obtained for reducing emissions from their facilities beyond the emission limits set in their operating permits. This enables other emitters to purchase these “credits” in order to offset their emissions if it is deemed to be the most cost-effective solution compared to other emission reduction alternatives they are considering.
The first priority for this Project is to analyze to what extent emissions could be reduced by either on-site or off-site methods. Consequently, the concept of emission credits has not been investigated in detail. It can be stated that historically, throughout the country, emission credits can range in cost from $1,000 per credit (tons per year) to as much as $20,000 per credit.
DELAWARE RIVER MAIN CHANNEL DEEPENING PROJECT
GENERAL CONFORMITY ANALYSIS AND MITIGATION REPORT
19
MOFFATT & NICHOL
However, since these credits are traded on the open market, their availability and price can fluctuate greatly over time. Therefore, it is difficult to assess the viability of this option due to the volatility associated with their availability and price.
5 EVALUATION OF METHODS
Potential emission reduction control technologies have been screened in three ways. The methods used in evaluating potential emission reduction technologies are discussed below. A summary of the methods considered, the screening process used, and the resulting output of the screening process is provided in Report Figure 5-1.
5.1 Proven Technology
Numerous emission reduction technologies exist on the market today. The manufacturers of the technology will claim “significant” reductions for certain regulated constituents. However, getting the manufacturers to provide documentation supporting their “claim” is often quite difficult or impossible. In most cases, any supporting documentation that is provided only considers one, two or three pollutants. Furthermore, manufacturers do not always take into consideration the fact that some emission reduction technologies, while having a positive impact (decreases emissions) on one or more pollutants may have a negative impact (increases emissions) on one or more other pollutants (e.g. delayed injection timing reduces NOx emissions but increases fuel consumption which in turn increases hydrocarbon (HC) and particulate matter (PM) emissions). This explains why very few emission reduction technologies have been certified under a federal or state program (i.e. their emission reduction technology has been verified by a regulatory agency). Consequently, in the screening process “proven” technologies, where it was believed the technology had the potential to increase other emissions, have been eliminated.
The mitigation strategy focused on those emission reduction technologies that have been developed to a stage wherein they provide the highest degree of certainty possible that they will be able to achieve the emission reduction benefits that have been estimated. For this Project, the initial screening of emission reduction technology is based primarily on the work performed by Moffatt & Nichol, in joint venture with Fugro West, Inc., (known as Airfield Development Engineering Consultant (ADEC)) for the proposed San Francisco International Airport Airfield Development Program (SFO)). For the SFO project, ADEC performed studies to address the construction-related air quality impacts associated with the proposed construction of new runway platforms. Part of this study involved analyzing the state of emission reduction technologies. The results of this study have been compiled in “Preliminary Report No. 7, Construction Air Emissions Analysis and Mitigation Study” 11, prepared by ADEC in October 2000.
The analysis performed for the SFO project considered an array of emission reduction technologies. The technologies considered are believed to represent the full range of emission reduction technologies available as of the year 2000. Comparison of the findings made in the SFO report to the draft “Initial Findings Report Emission Reduction Strategies for the New
DELAWARE RIVER MAIN CHANNEL DEEPENING PROJECT
GENERAL CONFORMITY ANALYSIS AND MITIGATION REPORT
20
MOFFATT & NICHOL
York/New Jersey Harbor Navigation Project”12, prepared by Starcrest Consulting Group, LLC and Allee King Rosen & Fleming, Inc. (Starcrest) for the New York District in January 2003, found no significant changes to the emission reduction technologies considered in the SFO report. Nor were there any previously unconsidered emission reduction technologies presented in the Starcrest study.
5.2 Practicability
A philosophy similar to “proven technology” has been applied to “practicability”. While many different emissions reduction technologies exist, careful attention has been given to their “practicability” for application. The approach used was to identify methods of reducing emissions to the maximum extent practicable while 1) minimizing the amount of add-on equipment and the corresponding degree of difficulty (i.e. preserving the operability of the equipment), 2) maximizing the potential that the control technology will be used throughout its intended duration and not bypassed, and 3) minimizing the overall cost of implementation.
5.3 Cost per Ton of Pollutant Avoided
Once a certain technology was vetted as a “proven technology” and was deemed “practicable” for use on a certain type of equipment, the best metric to evaluate comparative technologies is to calculate and compare the cost per ton of pollutant avoided. This provides an effective means of comparing on-site and off-site emission reduction opportunities as well as emission credits to each other to ascertain the most cost effective solution to addressing emission impacts.
6 ON-SITE MITIGATION OPPORTUNITIES
For this analysis the emissions have been divided into four categories: 1) large marine engines (>1,000-hp); 2) small marine engines (<1,000-hp); 3) non-road engines; and 4) on-road engines (employee vehicles). However, due to the minor percentage of the overall NOx emissions the on-road category makes up (<0.1%, see Report Figure 6-1), coupled with the heavily-regulated state of on-road vehicles and the fact that the majority of vehicles are privately owned, this category does not warrant further consideration for emission reduction.
The NOx emissions have been estimated for two different operational phases: 1) working and 2) mobilization/demobilization. The NOx emissions related to both of these operational phases is presented in Report Figure 6-2 and shows that the Mobilization/Demobilization phase does not represent a significant portion (1%) of the Project emissions. Considering this, it was determined that no mitigation opportunities would be applied to the Mobilization/Demobilization phase. This is believed to be a prudent choice since for equipment engaged in mobilization and demobilization, the various emission reduction opportunities may not be easily implemented or verified as the equipment is moving on and off the Project site.
As mentioned in Section 5 of this report, many different emission reduction technologies exist. However, when focusing solely on NOx (without negative effects to other pollutants) the list of
DELAWARE RIVER MAIN CHANNEL DEEPENING PROJECT
GENERAL CONFORMITY ANALYSIS AND MITIGATION REPORT
21
MOFFATT & NICHOL
potential technologies is reduced significantly. Screening for “proven technology” further reduces the list. Considering “practicability” does not make any further reductions in the list, however, there is a need to begin to limit the technology to specific pieces of equipment where “practicable”. Report Figure 5-1 illustrates this screening process.
6.1 Large Marine Engines
Large marine engines are resident on the dredges (i.e. clamshell, hopper, hydraulic), drillboat, booster pumps, and towing vessels (tugboats) expected to be utilized on the Project. These pieces of equipment combined represent approximately 12% (see Report Figure 6-1) of the overall number of construction equipment pieces. However, the NOx emissions from this category of equipment comprise approximately 94% of the overall NOx emissions for the Project. Consequently, this category of equipment represents the single best opportunity for affecting overall Project compliance for GC for NOx.
Report Table 6.1-1 illustrates the emission reduction benefit (NOx tons reduced) as well as the cost per ton calculation for each of the emission reduction technologies applied to the various large marine engines. The various technologies considered are explained below.
6.1.1 Electrification (EL)
Electrification entails powering the piece of equipment electrically as opposed to using diesel engines. This requires providing electrical power to the vessel(s) from a shore side power supply using a submerged electrical cable. Electrification is the most effective emission control technology available since it simultaneously eliminates emission of all pollutants on the Project site (emissions do remain at the power plant generating the electricity, however, these are accounted for in the power plant’s operating permit). However, the cost effectiveness (cost/ton) of this method is highly dependent on the availability and proximity of a suitable power supply. If a suitable power supply is not available within reasonable proximity to the Project site, the costs for supplying the required electricity can be significant. For this analysis (for clamshell and hydraulic dredges only), it was assumed a power supply is located within reasonable proximity to the Project site and that the contractor will only be required to provide up to 15,000-feet of power cable, a shore side step-down transformer, and pay the utility company to provide and connect the power supply. Furthermore, an analysis of the domestic hydraulic dredge fleet13 indicates that it is reasonable to assume that dredges would have to be modified from an existing configuration of diesel-electric powered to electric-powered. This would entail the addition of electrical switchgear.
Another limitation of this technology is that, due to the transitory nature of hopper dredges and towing vessels, neither of these vessels can be electrified. This technology has therefore been restricted to relatively stationary vessels like clamshell and hydraulic dredges, drillboat, and booster pumps.
DELAWARE RIVER MAIN CHANNEL DEEPENING PROJECT
GENERAL CONFORMITY ANALYSIS AND MITIGATION REPORT
22
MOFFATT & NICHOL
6.1.2 Engine Replacement (ER)
The concept of engine replacement is most effective if the engine proposed for replacement was manufactured prior to 1987 because these engines were not regulated for emissions. For this report it was assumed these engines could be replaced with engines manufactured to the Tier 2 marine engine standards currently being implemented by EPA. However, based on discussions with various engine manufacturers (e.g. Caterpillar14, EMD15, Fairbanks Morse16, and Wartsila17) only one (Wartsila) is capable of supplying today an engine that meets (actually exceeds) the Tier 2 standards without additional engine adjustments such as retarding timing which causes an increase in fuel consumption. Consequently, for this report the engine replacement option considers the use of replacement engines manufactured by Wartsila. It should be noted that under the engine replacement scenario, the engines would not be upgraded in terms of horsepower, but rather replaced with newer engines that provide the same (or less) horsepower but are certified to stricter emission standards.
6.1.3 Engine Replacement with Direct Water Injection (ER w/DWI)
Direct Water Injection has been developed for large diesel engines for the primary purpose of reducing NOx emissions. The technology consists of simultaneously injecting water and fuel into the combustion chamber under high pressure so as to reduce the combustion process temperature and improve the atomization of fuel, both of which help to reduce NOx emissions. This technology is typically included as an option on new engines and as such, has demonstrated an approximate reduction of 40% - 65% for NOx (ADEC report pages 29-33 through 29-34 and Table 29.7-1).11 These engines are currently available from Wartsila. The cost of these engines has been initially estimated at $218 per horsepower. Additional information on the DWI system manufactured by Wartsila is included in the Appendix.
Additional reductions to PM of approximately 24% to 30% are possible for a retrofit technology being offered by M.A. Turbo/Engine Design.11 However, for this technology the associated NOx reductions were reduced to half that of the new engine system. Consequently, it was assumed that implementation of this technology would be based on engine replacement with DWI-equipped new engines as manufactured by Wartsila.
6.1.4 Selective Catalytic Reduction (SCR)
SCR systems were originally developed for power plants and have only recently been applied to various large marine diesel applications. The technology consists of injecting either urea or ammonia into the exhaust stream wherein the NOx is reduced to elemental nitrogen. The critical factor affecting success is that the exhaust stream temperature must be between 600o and 750 o Fahrenheit for the system to be effective. An ancillary benefit of SCR is that it also reduces PM (26%) and HC (81%) concurrently with NOx.11 NOx emission reductions have been demonstrated repeatedly at greater than 90% (ADEC report pages 29-39 through 29-40 and Table 29.7-1).11
DELAWARE RIVER MAIN CHANNEL DEEPENING PROJECT
GENERAL CONFORMITY ANALYSIS AND MITIGATION REPORT
23
MOFFATT & NICHOL
In the U.S., one large hydraulic dredge (Manson Construction Company’s dredge H.R. Morris) currently operates with an SCR system in place. Based on discussions with the manufacturer of that system, Kaparta AG18, a system was conceptually designed and priced for this Project. This system would consist of a two-stage process wherein the first stage reduces the NOx (90%) and the second stage reduces CO (80%) and HC (80%). Based on information received from Kaparta AG, the cost of installing SCR has been estimated at $144 per horsepower. Additional information on SCR systems manufactured by Kaparta AG and Wartsila are included in the Appendix.
6.2 Small Marine Engines
Small marine engines are the various vessels that support the operations of the dredges and drillboat. Engines on these pieces of equipment range in horsepower from 10 to 500. These pieces of equipment combined represent approximately 25% (see Report Figure 6-1) of the overall number of construction equipment pieces. The NOx emissions from this category of equipment comprise only 3% of the overall NOx emissions for the Project (see Report Figure 6-1). Consequently, this category of equipment is relatively limited in its ability to affect overall project GC compliance for NOx.
Report Table 6.1-1 illustrates the emission reduction benefit (NOx tons reduced) as well as the cost per ton calculation for each of the two emission reduction technologies applied to the various small marine engines. The various technologies considered are explained below.
6.2.1 Diesel Particulate Filters (DPF)
DPF are primarily utilized for reducing PM emissions on smaller and medium sized engines. However, they have been shown to reduce CO (70%) and HC (63%) (ADEC report pages 29-37 through 29-39 and Table 29.7-1).11 The technology consists of filters placed within the exhaust stream that filters particulate matter and subsequently oxidizes the filtered particulate. A limiting factor in their use is the sulfur level in the fuel. DPF are very sensitive to the sulfur level in the fuel. Consequently, this technology can only be used in conjunction with ultra-low sulfur fuel. The increased cost for ultra-low sulfur diesel is not included in the estimated costs shown in Report Table 6.1-1.
6.2.2 Engine Replacement (ER)
Similar to large marine engines, the concept of engine replacement is most effective if the engine proposed for replacement was manufactured prior to 1987 because these engines were not regulated for emissions. For this report it was assumed the engine replacement option considers the use of replacement engines manufactured by Wartsila. It should be noted that under the engine replacement scenario, the engines would not be upgraded in terms of horsepower, but rather replaced with newer engines that provide the same (or less) horsepower but are certified to stricter emission standards.
DELAWARE RIVER MAIN CHANNEL DEEPENING PROJECT
GENERAL CONFORMITY ANALYSIS AND MITIGATION REPORT
24
MOFFATT & NICHOL
6.3 Non-Road Engines
Non-road engines are comprised of the land-based equipment utilized for construction of the shore-based dredge material disposal facilities as well as being utilized during placement of dredged material at these sites. Engines on these pieces of equipment range in horsepower from 13 to 700. These pieces of equipment combined represent 26% (see Report Figure 6-1) of the overall number of construction pieces. However, the NOx emissions from this category of equipment comprise only 3% of the overall NOx emissions for the Project. Unlike marine diesel engines, EPA has regulated this category of engines since 1996. Therefore, engine replacement is not a viable emission reduction opportunity since the engines are currently regulated to a strict standard. Consequently, this category of equipment is also relatively limited in its ability to affect overall project GC compliance for NOx.
Report Table 6.1-1 illustrates the emission reduction benefit (NOx tons reduced) as well as the cost per ton calculation for the emission reduction technology applied to the various non-road engines. The technology considered is explained below.
6.3.1 Diesel Particulate Filters (DPF)
Similar to small marine engines, DPF are primarily utilized for reducing PM emissions on smaller and medium sized engines. However, they have been shown to reduce CO (70%) and HC (63%) (ADEC report pages 29-37 through 29-39 and Table 29.7-1).11 The technology consists of filters placed within the exhaust stream that filters particulate matter and subsequently oxidizes the filtered particulate. A limiting factor in their use is the sulfur level in the fuel. DPF are very sensitive to the sulfur level in the fuel. Consequently, this technology can only be used in conjunction with ultra-low sulfur fuel. The increased cost for ultra-low sulfur diesel is not included in the estimated costs shown in Report Table 6.1-1.
7 OFF-SITE MITIGATION OPPORTUNITIES
One offsite mitigation opportunity for this Project considers existing Operation & Maintenance (O&M) dredging conducted within the Project air shed. Currently, this work is performed by diesel-powered hydraulic dredges (non-hopper work). This opportunity analyzed the potential feasibility of converting some or all of this work from diesel-powered operation to electric-powered operation.
Another opportunity considered the potential feasibility of an engine replacement program for local/regional ferries and tugboats. The Corps’ of Engineers hopper dredge McFarland was also included as part of the engine replacement program as the dredge performs maintenance dredging work on the Delaware River Main Channel on an annual basis.
In the following context, “off-site” refers to methods that are not directly involved in construction of the Project; however, all methods evaluated will take place in the Project non-attainment area where the emissions are generated.
DELAWARE RIVER MAIN CHANNEL DEEPENING PROJECT
GENERAL CONFORMITY ANALYSIS AND MITIGATION REPORT
25
MOFFATT & NICHOL
The goals of the off-site emission reduction feasibility analysis were to achieve a first cut at the emission reduction strategies. An order of magnitude emission reduction amount was determined and the potential costs were assessed. The analysis consisted of gathering the available information on the different O&M projects and vessels operating in the Delaware River system and calculating the estimated annual average emissions. The cost per ton of NOx avoided was then determined.
7.1 O&M Dredging Electrification
For the O&M projects, various dredging reaches along the Delaware River within the Project air shed were considered. The Philadelphia District provided technical data relating to each of the reaches in order to enable an analysis to be performed.
Historically, 30-inch diameter hydraulic dredges have performed O&M dredging conducted within the Project air shed. The domestic fleet consists of thirteen dredges13 in this class. Of the thirteen 30-inch or greater hydraulic dredges currently in the domestic fleet, three are powered entirely by electric motors. Two are powered entirely by diesel engines driving generators (i.e. diesel-electric). The remaining eight possess split systems wherein the main pump is driven by direct-drive diesel engines and the balance of the power demand (e.g. cutter head, ladder pump, swing motors, ship’s service) is provided diesel-electric. Consequently, five of the thirteen (or 38%) vessels either are electrically powered or would be relatively easy to convert. For booster pumps it was assumed that a similar situation exists, however, the costs of retrofit are probably less since most booster pumps have significantly less horsepower than a comparable dredge. Since a significant percentage (38%) of the fleet can be easily retrofitted to electric power, it is reasonable to assume that conversion requirements for both hydraulic dredges and booster pumps would entail conversion from diesel-electric power to electrical power. A more detailed discussion of specific cost factors used in this report is provided in Section 8. Since it is difficult to clearly identify and ensure that specific vessels would be used for this work, due to the public bid process used in contracting this work, the same procedure as described in Section 2.4.1 was used to conservatively estimate the current emission amounts. To determine the emission reduction benefits after conversion to electrical power, a one hundred percent reduction from the current emission amounts was assumed. This reduction was then utilized to determine the cost per ton of benefit obtained. The results for the O&M electrification opportunity are detailed in Report Table 7.1-1. Additional detailed backup for the O&M dredging emissions, reductions, and electrification costs are shown in Data Table GC-14.
7.2 Engine Replacement
The engine replacement program would be developed to offer vessel owners an incentive for reductions of NOx and CO emissions. The selection of final engine replacement alternative will be based on total emission reduction (does the new engine allow the project to meet conformity)
DELAWARE RIVER MAIN CHANNEL DEEPENING PROJECT
GENERAL CONFORMITY ANALYSIS AND MITIGATION REPORT
26
MOFFATT & NICHOL
and the cost effectiveness of the engine. The cost effectiveness will be based on the capital cost of the new engine only and will not include any other retrofit work.
EPA is currently adopting emission standards for new marine diesel engines that will be installed in vessels flagged or registered in the United States. The Tier 1 standards in the new rule are equivalent to the internationally negotiated NOx limits adopted by the International Maritime Organization (IMO) in MARPOL Annex VI. The Tier 1 standards will apply to marine diesel engines manufactured January 1, 2004 or later. NOx limits under IMO standards were adopted in 1997 and have been in effect since 2000, therefore most manufacturers are already certifying their engines to the equivalent international standards.19
The EPA Tier 1 NOx standard varies from 9.8 grams per kilowatt-hour (g/kW-hr) to 17.0 g/kW-hr, depending on the rated operating speed of the engine.19 Report Table 7.2-1 lists the Tier 1 standards for marine diesel engines.
EPA is also adopting a second tier of emission standards, for all criteria pollutants, for category 1 and 2 marine diesel engines. The Tier 2 standards will most likely involve the advanced technologies such as water emulsification and selective catalytic reduction. Engine manufacturers are already developing ways to apply these technologies to marine diesel engines. The Tier 2 standards for category 2 engines (cylinder displacement greater than 5 liters) will take effect in 2007.20 Report Table 7.2-1 lists the Tier 2 emission standards and compliance dates.
As part of the engine replacement plan, several engine manufacturers (Caterpillar, EMD, Fairbanks Morse, and Wartsila) were contacted regarding engine specifications, costs, and emission data. Each of the manufacturers surveyed were asked about emission certification for their particular engine. All of the manufacturers contacted currently produce IMO certified engines. However, only 1 of the manufacturers, Wartsila, currently produces engines that will meet (actually exceed) EPA Tier 2 standards. Two additional companies, EMD and Fairbanks Morse, can manufacture engines to meet EPA Tier 2 standards, however, modifications such as retarding timing (increases fuel consumption) would need to be made in order to meet the Tier 2 requirements. Caterpillar expects to meet the required date of 2007 for production of Tier 2 standard engines.
When estimating the current emission amounts, a California Air Resources Board (CARB) document21, which lists emission factors for pre-1988, or uncontrolled emission rates for large compression-ignition diesel engines, was utilized. This was based on the overall age of vessel or the age of the engines if the data was available. As some of the vessels and engines are over 15 years old, this is a fairly conservative assumption since the actual NOx emissions of the older engines would possibly be quite higher. To determine the emission amounts after engine replacement, testing data provided by Wartsila for the different engine sizes was utilized. A percent reduction in the NOx emissions was then calculated and utilized to determine the cost of engine replacement for each vessel based on a unit cost per horsepower of engine size. The results for the engine replacement mitigation strategy are detailed in Report Table 7.1-1.
DELAWARE RIVER MAIN CHANNEL DEEPENING PROJECT
GENERAL CONFORMITY ANALYSIS AND MITIGATION REPORT
27
MOFFATT & NICHOL
In addition to engine replacement, it is possible to reduce emissions through the use of emission control devices. However, installation of such devices requires the vessel owner to operate and maintain the device, thereby increasing the vessels operation and maintenance costs. Since engine replacement can be considered an overall “upgrade” to the vessel it is believed that engine replacement would be a more appealing alternative to the vessel owners.
Each of the vessels surveyed for the offsite emission reduction strategy and their associated method of analysis are discussed in detail below.
7.2.1 Corps’ Dredge McFarland
The McFarland is one of four oceangoing hopper dredges operated by the U.S. Army Corps of Engineers. The McFarland is currently stationed in Philadelphia and performs annual maintenance dredging on the Delaware River. The Philadelphia District was contacted to provide information on the operating parameters of the current engines and daily operating data from the previous 5-years of dredging operations on the Delaware River for the McFarland.
The engine retrofit analysis for the Corps’ hopper dredge McFarland consists of the following steps:
• Gather detailed engine information for the current engines on the McFarland.
• Gather detailed operating information for the McFarland to determine a typical dredging cycle.
• Calculate the estimated average annual emissions for the various engines on the McFarland based on the typical dredging cycle.
• Identify suitable new replacement engines based on the McFarland’s power requirements.
• Determine the cost per ton of NOx avoided for each new engine configuration.
The current engine information, operational data, and replacement engine details for the McFarland are discussed in the following sections.
7.2.1.1 Engine Data Survey
The Corps’ of Engineers hopper dredge McFarland is a twin-screw ocean going hopper dredge with 14,600 shipboard HP for the various operating systems. The propulsion system is powered by 4 each American Locomotive Company (ALCO) 12-cylinder diesel engines, which account for 6,000 HP. The dredge pumps are powered by 3 each ALCO 16-cylinder diesel engines, which account for 5,600 HP. The shipboard services
DELAWARE RIVER MAIN CHANNEL DEEPENING PROJECT
GENERAL CONFORMITY ANALYSIS AND MITIGATION REPORT
28
MOFFATT & NICHOL
(generators and auxiliary engines) are powered by 3 each ALCO 12-cylinder diesel engines, which account for 3,000 HP.
The detailed engine information for the McFarland is shown in Report Table 7.2-2, with the exception of the original emission factors. As can be seen, the information details the different engine make and models, horsepower, cylinder displacement, rated engine speed, engine age, and other information. Due to the age of the engines (36-years old, with the exception of one propulsion engine which was replaced in 1982), the original emission factors could not be determined. Two of the engine service companies who currently repair or rebuild the ALCO engines were contacted, but were unable to locate the emission factors for the original engines. As stated earlier, the emission factors were instead determined from a California Air Resources Board (CARB) document, which lists emission factors for pre-1988, or uncontrolled emission rates for large compression-ignition diesel engines.21 An emission factor of 14.0 grams/horsepower-hour (g/hp-hr; 18.77 g/kW-hr) was used for NOx and an emission factor of 4.2 g/hp-hr was used for CO. The newer (1982) propulsion engine uses a NOx emission factor of 12.0 g/hp-hr and a CO emission factor of 4.2 g/hp-hr. The NOx emission factors seems to be in the range with emission factors reported from test data performed on post-1988 category 2 engines as outlined in Table 3-3 of the EPA document “Final Regulatory Impact Analysis: Control of Emissions from Marine Diesel Engines”, November 1999.20
7.2.1.2 Annual Hours of Operation
In order to evaluate the operating cycle for the McFarland, the Philadelphia District provided the Daily Report of Operations for the past five years of work performed in the Delaware River/Bay region. The Daily Report of Operations is a log of work performed that is filled out by the Master on the vessel for each 24-hour period of operation. The log distributes the time spent dredging, traveling to and from the disposal site, disposal time (pump-off or bottom dump), and any non-effective time due to mechanical breakdowns, vessel traffic, or other miscellaneous activities for the 24-hour period. The log also includes information such as the location of work, quantity of material dredged, disposal site, number of crew, and the amount of fuel consumed each day.
Upon receipt of the daily reports, the distribution of time for the different dredging activities were entered into a spreadsheet, along with the dredging and disposal locations, dredge quantities, disposal method, and daily fuel consumption. These quantities were then averaged over the five-year period to determine an average daily operating cycle for the McFarland. The summary results are shown in Report Table 7.2-3. The daily operating times for the various activities were combined depending on the dredging activity being performed and the particular engine being utilized. The different dredging activities and corresponding engine power usage are as follows:
1) Propulsion Only – The propulsion horsepower for the existing engines (6,400 hp) is based on the engine data provided by the Philadelphia District and shown in
DELAWARE RIVER MAIN CHANNEL DEEPENING PROJECT
GENERAL CONFORMITY ANALYSIS AND MITIGATION REPORT
29
MOFFATT & NICHOL
Report Table 7.2-2. The propulsion horsepower for the new engine is based on the original propulsion horsepower of 6,400 plus the 2,000 horsepower utilized for the ship service generators. The assumption is that the dredge will not need any more horsepower capacity than it currently uses for the propulsion system.
2) Dredging - During current dredging operations the dredge is traveling at a slower rate of speed than normal and is utilizing approximately 50% or less of its available propulsion power. In addition, the dredge is utilizing only 2 of the dredge pumps engines, (4,320 hp) plus the ship’s service generators (2,000 hp). The total horsepower demand for dredging operations for the new engine is based on the combination of the dredge pump horsepower (4,320) plus the ship’s service horsepower (2,000), with all remaining horsepower available for propulsion.
3) Dumping - The current horsepower utilized for dumping the hopper at the open-water disposal site is based on the approximately forty percent or less of its available horsepower plus the ship service horsepower (2,000). The reason for this is that when the dredge is at the disposal site it has slowed to a much lower rate of speed in order to open the dump doors, so the propulsion engines are approximately 50% utilized. The total horsepower demand for dumping operations with the new engine configuration is similar to the current operation.
4) Pumping off - When the dredge is pumping off to an upland disposal site, it is typically tied off to a mooring barge. Consequently, the horsepower for pumping off is the combination of all the dredge pumps (6,480) plus the ship service power (2,000). The total horsepower demand for pump-off operations for the new engine configuration will continue to be the same demand.
5) Generator Power only – When the dredge is tied up to the dock, typically only the ship service generators (2,000 hp) are necessary to provide electrical power. The assumption has been used for the current conditions that the ship’s service generators were running continually while the dredge was in operation. For the new engine configuration, the power for the ship service generators has been added in to each of the dredge operating phases described above. Therefore, the annual hours of operation for generator power only is the difference between the total annual hours of operation and the sum of the operating phases.
The detailed daily information collected for the five-year period is shown in Data CD Table GC-12. In order to obtain a conservative evaluation of the operating cycle, only those days where the McFarland was dredging within the limits of the Project non-attainment area were included in the analysis. The emissions benefits received from an engine replacement program for the McFarland could then be used to directly offset the emissions created from construction of the proposed deepening project.
There are several reasons for utilizing five years worth of operating data to determine an average daily operating cycle for the dredge. First, there are quite a few reaches in the
DELAWARE RIVER MAIN CHANNEL DEEPENING PROJECT
GENERAL CONFORMITY ANALYSIS AND MITIGATION REPORT
30
MOFFATT & NICHOL
Delaware River that are dredged on a 2, 3, or 5-year cycle, thus requiring the inclusion of at least 5-years’ worth of operating data to get a reasonable average dredging cycle. Secondly, a five-year average will incorporate any seasonal fluctuations that occur in the operating schedule.
7.2.1.3 Emission Reduction Potential
In addition to obtaining information on the current engines in the McFarland, a suitable modern engine needed to be identified. The Philadelphia District provided information regarding the potential size of the new engines and configuration that is envisioned for re-powering the McFarland.
It is anticipated that the McFarland will be re-powered with two main engines of between 5,000 and 6,000 HP each. The two main engines will drive the propellers and will also drive generators, which will provide electric power for the dredge pumps as well as for ship service. The current variable pitch propellers will allow for power to be split between the propulsion and dredging systems during actual dredging operations. This system will also provide all necessary electrical power when the main engines are running. For periods when the main engines are not on line, an additional ship service generator will be provided for electrical power. With this approach, the total number of engines will drop from ten to three.22
The next step of the analysis was to calculate the average annual emissions for the different engines on the McFarland. The annual hours of operation for the different dredging cycles (propulsion only, dredging, dumping, pump off, and generator power only) were distributed to the engines that currently power the different systems (propulsion, dredge pumps, and ship service) on the McFarland. The annual operating hours for each of the engines were then multiplied by the emission amount (tons/hr) to determine the annual tons of pollutants produced. The annual tons of pollutant (NOx and CO) emitted, were then multiplied by six years to account for the construction schedule of the proposed Delaware River Main Channel Deepening Project (including proposed berth deepening). The results of the emission quantity analysis for the current engines on the McFarland are detailed in Data CD Table GC-13.
Once suitable replacement engines were identified, the engine operating information, along with base engine costs and emission factors were compiled based on information received from the engine manufacturers. That information was then compared to the current operating characteristics of the engines on the McFarland, to determine the emission benefits that can be achieved by replacing the engines. The same emission quantity calculations were performed utilizing the new engine emission factors. Emission quantities for the replacement engines were calculated assuming that the McFarland would have the same annual operating hours regardless of the engines in service. The emission amounts were then compared to each other to determine the total amount of emission reduction benefits available from the new engine. The NOx
DELAWARE RIVER MAIN CHANNEL DEEPENING PROJECT
GENERAL CONFORMITY ANALYSIS AND MITIGATION REPORT
31
MOFFATT & NICHOL
reduction results for the different replacement engines are shown in Data CD Table GC-13. The emission reduction benefits for the different replacement engines for the McFarland are shown with and without emission reduction technologies, such as SCR.
The final step in the engine retrofit analysis was to calculate the cost per ton of pollutant (NOx and CO) avoided by replacement of the engines. The mitigation costs for the new engines is based on the dollars per ton of pollutant (NOx and CO) avoided. Report Table 7.2-4 outlines the different engine replacement opportunities for the McFarland along with the NOx and CO reduction benefits and costs. Further details are also shown in Data CD Table GC-13. Based on the cost comparison, the Wartsila engine (or engine with similar emission reduction capacities) with SCR is recommended as the replacement engines for the McFarland. The Wartsila engine with SCR offers the lowest cost per ton of NOx avoided ($2,321/ton) of all the engines. In addition, the Wartsila engine, in combination with the other on-site and off-site mitigation opportunities, allows the emission reduction plans developed in this report to meet the requirements of General Conformity.
The replacement engine costs and emission factors are based on information provided by the engine manufacturers. All communication with regard to engine information or cost that has been included in the Reference’s is attached in the Appendix of this report.
7.2.2 Local/Regional Ferries
There are several organizations that operate ferries within the Delaware River/Bay system as regularly scheduled services. When determining the annual hours of operation, the different published service schedules were utilized. The ferries were all assumed to operate on an equal basis if they traveled the same routes. Annual hours of operation are based on travel time only and do not include any engine idling time, startup, or shutdown.
Where available, the engine data for the local ferries was retrieved from the ABS23 and Navigation Data Center24 databases. No emissions from secondary engines, such as auxiliary generators, were used for calculating annual emissions. Only those emissions generated from the main propulsion engines were utilized.
Due to the lower cost, increased NOx reduction benefits, and the ability to allow the emission reductions plans to meet General Conformity, the Wartsila engine was used as the engine replacement option for all of the ferries considered in the emission reduction plans detailed in this report. As stated previously, the current annual NOx emissions were calculated utilizing CARB pre-1988 emission factors. Emission amounts after engine replacement were calculated using emission factors based on testing data provided by Wartsila. As shown on Report Table 7.1-1, the NOx emissions were reduced by approximately 31% for all of the local/regional ferries utilized in the emission reduction plans. Additional detailed information on the emission reduction calculations for the various ferries is shown in Data CD Table GC-13.
DELAWARE RIVER MAIN CHANNEL DEEPENING PROJECT
GENERAL CONFORMITY ANALYSIS AND MITIGATION REPORT
32
MOFFATT & NICHOL
7.2.3 Local/Regional Tugboats
The U.S. Army Corps of Engineers has established and continues to maintain a variety of water transportation information systems. These include databases and statistics pertaining to waterborne commodity, vessel movements, vessel characteristics, port facilities, and other waterways information. Vessel owners and operators are required to furnish information relative to the operation of the vessels to the Corps of Engineers. The information is then compiled into the different databases and can be accessed at the Corps of Engineers Navigation Data Center website.24
Based on the analysis of the cited databases, more than 50 tugboats are based in the Delaware River system. Utilizing these databases for tugboats, an average engine horsepower for the various tugboats operating in the Delaware River system was determined. In order to calculate the annual NOx emission quantity it was assumed that each tugboat worked at least 2,216 hours per year. Based on operating details for the tugboats involved with the lightering and vessel assist work contained in the “Corps Comprehensive Economic Reanalysis Report”, December 2002 that was performed for the proposed project.25
For the tugboats identified, age and engine information was retrieved from the ABS database23 and the Navigation Data Center database.24 It was assumed that the average engine ages for all tugboats predated the 1987 standards and were therefore CARB pre-1988 emission factors. The annual NOx emissions were then calculated for the current conditions and also with Wartsila engine replacements that meet EPA Tier 1 Marine Engine standards. As shown on Report Table 7.1-1, the NOx quantities for the tugboats were reduced by approximately 35% after engine replacement.
8 COST METHODOLOGY
For each of the emission reduction opportunities and plans discussed throughout this report, specific assumptions were made. Although most of the sources of these assumptions have been referenced in Section 13, certain cost methodologies must be discussed in more detail.
8.1 On-Site SCR
For the on-site SCR modifications the estimated cost of implementation is based on conversations with Kaparta AG18. The Philadelphia District currently envisions four separate bid contracts for the hopper dredge work and three for the hydraulic dredge work performed for the deepening Project. The question arises as to how many of these contracts, if any, would incur some or all of the retrofit costs associated with installation of the SCR equipment as a project cost. Alternatively, contractors may elect to “capitalize” these costs into the value of the equipment. Contractors will attempt to recover as much of a retrofit cost as a job charge as possible. However, the nature of the competitive bid process used by the Corps of Engineers constrains this ability. For
DELAWARE RIVER MAIN CHANNEL DEEPENING PROJECT
GENERAL CONFORMITY ANALYSIS AND MITIGATION REPORT
33
MOFFATT & NICHOL
example, a contractor that attempts to recover 100% of this cost would potentially be at a competitive disadvantage against another competitor who only attempts to recover a portion of the cost. Furthermore, the successful contractor on the first contract has a competitive advantage on subsequent contracts since they have already converted their equipment.
The on-site SCR envisioned for this project is not a system that is likely to be required for use on the majority of other projects contractors pursue. Consequently, installation of this equipment cannot be considered a long-term capital improvement. It is likely the contractor would consider its removal at the completion of the project. However, the previously discussed effects of the competitive bid process affect the means by which a contractor can handle these costs. Therefore, it is assumed that the Project will see a one-time charge (i.e. for the first contract bid) of 100% of the estimated costs. The competitive advantage gained by this contractor should prohibit future job charges on subsequent contracts bid for this project.
8.2 Off-Site O&M Electrification
Conversion of O&M dredging from diesel power to electric power requires both conversion of the dredging equipment as well as procurement of suitable power supply and distribution facilities on shore. The elements of cost include: 1) high voltage power drop; 2) shoreside substation; 3) submarine power cable; 4) dredge/booster pump modifications; and 5) allowance for any change in the dredging cost resulting from differences between the cost of diesel versus electricity. These costs can be characterized as either fixed (i.e. one-time) or recurring costs. Provision of the high voltage power drop will occur once for each site considered. After the power drop has been established, this cost will not recur unless the power drop location is moved. Provision of the shoreside substation and power cable can be considered once because these items can be transferred between projects and utilized repeatedly. Dredge/booster pump modifications are also a one-time charge and are discussed in more detail below. Increases or decreases in dredging cost associated with conversion to electric power are job-specific and recurring in nature. Conversion of dredging plant to electric power can be considered a long-term capital improvement in the equipment. However, recognizing that contractors may attempt to recover some of these costs as a project charge, some allowance for this cost should be allowed. The previously discussed effects of the competitive bid process will limit such recovery. Therefore, it is assumed that the Project will see a one-time charge (i.e. for the first contract bid) of 50% of the estimated costs for shoreside substation, submarine power cable and dredge/booster pump modifications. The balance of those costs will be capitalized into the value of the equipment. Furthermore, the competitive advantage gained by this contractor should prohibit future job charges on subsequent contracts bid for this project. The costs associated with high voltage power drop and changes to the cost of dredging will be borne by the Project 100%. Specific details pertaining to the above are provided in Report Tables 9.1-3, 9.2-3 and 9.3-3.
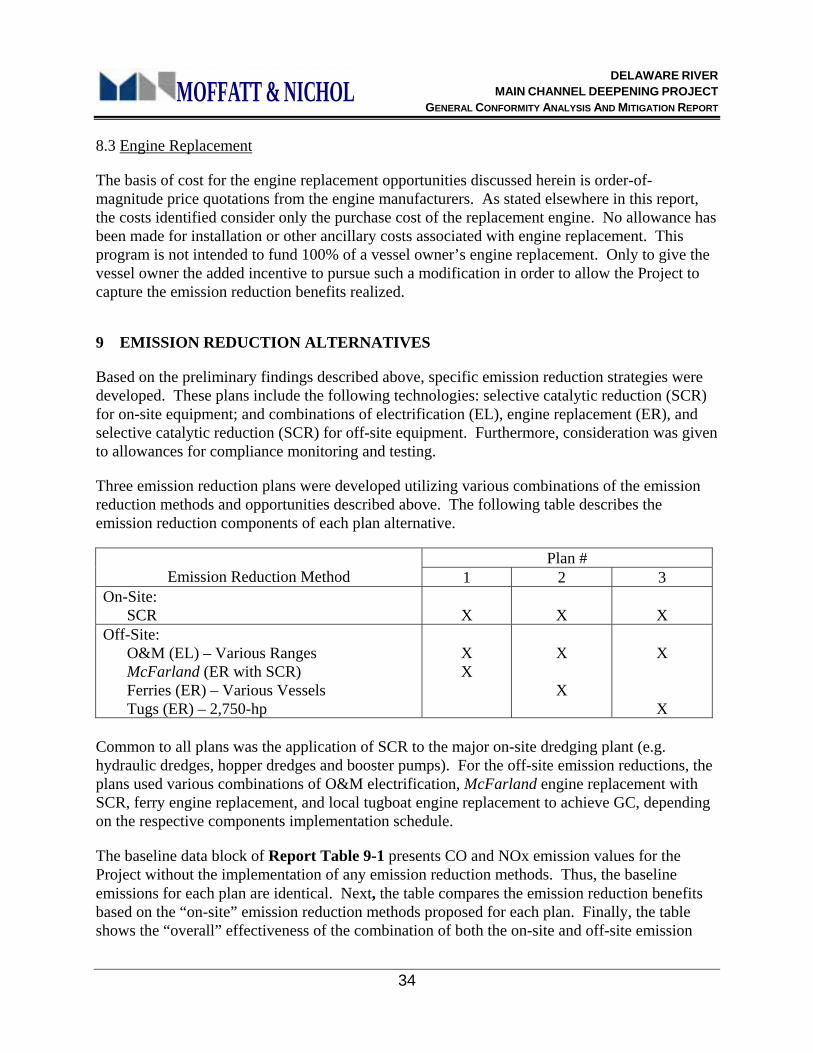
DELAWARE RIVER MAIN CHANNEL DEEPENING PROJECT
GENERAL CONFORMITY ANALYSIS AND MITIGATION REPORT
34
MOFFATT & NICHOL
8.3 Engine Replacement
The basis of cost for the engine replacement opportunities discussed herein is order-of-magnitude price quotations from the engine manufacturers. As stated elsewhere in this report, the costs identified consider only the purchase cost of the replacement engine. No allowance has been made for installation or other ancillary costs associated with engine replacement. This program is not intended to fund 100% of a vessel owner’s engine replacement. Only to give the vessel owner the added incentive to pursue such a modification in order to allow the Project to capture the emission reduction benefits realized.
9 EMISSION REDUCTION ALTERNATIVES
Based on the preliminary findings described above, specific emission reduction strategies were developed. These plans include the following technologies: selective catalytic reduction (SCR) for on-site equipment; and combinations of electrification (EL), engine replacement (ER), and selective catalytic reduction (SCR) for off-site equipment. Furthermore, consideration was given to allowances for compliance monitoring and testing.
Three emission reduction plans were developed utilizing various combinations of the emission reduction methods and opportunities described above. The following table describes the emission reduction components of each plan alternative.
Plan # Emission Reduction Method 1 2 3
On-Site: SCR
X
X
X
Off-Site: O&M (EL) – Various Ranges McFarland (ER with SCR) Ferries (ER) – Various Vessels Tugs (ER) – 2,750-hp
X X
X
X
X
X Common to all plans was the application of SCR to the major on-site dredging plant (e.g. hydraulic dredges, hopper dredges and booster pumps). For the off-site emission reductions, the plans used various combinations of O&M electrification, McFarland engine replacement with SCR, ferry engine replacement, and local tugboat engine replacement to achieve GC, depending on the respective components implementation schedule.
The baseline data block of Report Table 9-1 presents CO and NOx emission values for the Project without the implementation of any emission reduction methods. Thus, the baseline emissions for each plan are identical. Next, the table compares the emission reduction benefits based on the “on-site” emission reduction methods proposed for each plan. Finally, the table shows the “overall” effectiveness of the combination of both the on-site and off-site emission
DELAWARE RIVER MAIN CHANNEL DEEPENING PROJECT
GENERAL CONFORMITY ANALYSIS AND MITIGATION REPORT
35
MOFFATT & NICHOL
reduction methods proposed for each plan. The “total” value shown in the overall data block demonstrates the overall project emissions reduction benefit achieved for each plan. The negative values demonstrate GC compliance wherein the overall project construction emissions are reduced below zero for a given year.
Report Table 9-2 compares the three plans for their respective effects on CO and NOx emission reduction by calculating percent emission reduction benefit achieved, and total cost and cost per ton avoided of the emission reduction plans for the on-site, off-site, and overall emission reduction efforts.
9.1 Plan #1 – On-Site, O&M and McFarland Reductions
The first plan uses a combination of on-site reductions (via SCR) and off-site reductions (via O&M electrification and McFarland engine replacement with SCR) in order to achieve project compliance for GC (see Report Tables 9.1-1, 9.1-2 and 9.1-3). As can be seen from Report Table 9.1-1, GC compliance is not attained by the implementation of on-site emission reduction methods alone. GC compliance is achieved by supplementing the on-site emission reductions with emission reductions achieved from initially (Years 1 and 2) O&M electrification and then in the remaining years (Years 3-6) O&M electrification is replaced by the McFarland’s annual emission reduction benefits. The emission reduction benefits from the O&M electrification are no longer utilized after Year 2 because the McFarland’s emission reduction benefits come on line in Year 3. Per Report Table 9.1-3, the associated total cost is estimated at $12.3-million and the cost per ton is estimated at $25,384 for CO and $3,441 for NOx.
9.2 Plan #2 – On-Site, O&M and Ferry Reductions
The second plan uses a combination of on-site reductions (via SCR) and off-site reductions (via O&M electrification and ferry engine replacement) in order to achieve project compliance for GC (see Report Tables 9.2-1, 9.2-2 and 9.2-3). As can be seen from Report Table 9.2-1, GC compliance is not attained by the implementation of on-site emission reduction methods alone. GC compliance is achieved by supplementing the on-site emission reductions with emission reductions achieved from initially (Year 1) O&M electrification and then in the remaining years (Years 2-6) O&M electrification further supplemented by applying the ferry annual emission reduction benefits. In total, it is estimated two ferries would require engine replacement. Per Report Table 9.2-3, the associated total cost is estimated at $12.5-million and the cost per ton is estimated at $24,787 for CO and $3,685 for NOx.
9.3 Plan #3 – On-Site, O&M and Tugboat Reductions
The third plan uses a combination of on-site reductions (via SCR) and off-site reductions (via O&M electrification and tugboat engine replacement) in order to achieve project compliance for GC (see Report Tables 9.3-1, 9.3-2 and 9.3-3). As can be seen from Report Table 9.3-1, GC compliance is not attained by the implementation of on-site emission reduction methods alone. GC compliance is achieved by supplementing the on-site emission reductions with emission reductions achieved from initially (Year 1) O&M electrification and then in the remaining years
DELAWARE RIVER MAIN CHANNEL DEEPENING PROJECT
GENERAL CONFORMITY ANALYSIS AND MITIGATION REPORT
36
MOFFATT & NICHOL
(Years 2-6) O&M electrification further supplemented by applying the tugboat annual emission reduction benefits. In total, it is estimated three tugboats would require engine replacement. Per Report Table 9.3-3, the associated total cost is estimated at $12.6-million and the cost per ton is estimated at $21,135 for CO and $3,717 for NOx.
10 SELECTION OF FINAL EMISSION MITIGATION PLAN
The preliminary emission reduction strategy identified three plans for mitigating emissions for the proposed Delaware River Main Channel Deepening Project and associated deepening of the berthing areas. Report Figure 10-1 presents a total project cost comparison for each plan considered. All three plans achieve GC for both CO and NOx. Plan #1 was slightly (~2%) cheaper in cost compared to the next highest cost plan (Plan #2). Also, Plan #1 affords the District the greatest control since implementation of both on-site and off-site plan elements involves equipment that is either owned by the Corp or whose services are contracted by the Philadelphia District. Plans #2 and #3 rely partially on emission reduction opportunities provided by vessels that are not under the control of the Philadelphia District. Consequently, these plans possess an inherently higher degree of risk for implementation. In addition, Plans #2 and #3 would require public and/or private entities to incur costs for engine replacements. Therefore, Plan #1 was selected as the preferred plan for mitigating the Project’s air quality impacts.
Report Figures 10-2 and 10-3 demonstrate Plan #1’s GC compliance for both CO (Year 4) and NOx emissions on an annual basis compared to the unmitigated “baseline” emissions for each pollutant.
10.1 On-Site SCR
As shown in Report Tables 6.1-1 and 9-2, the most cost-effective on-site emission reduction opportunities entail installation of SCR devices on the hopper dredges, hydraulic dredges and booster pumps used in the deepening project. Although GC cannot be achieved through on-site emission reductions alone, on-site opportunities provide over half the emission reduction benefits required and do so at the lowest cost per ton (for NOx).
10.2 Off-Site O&M Electrification
The Philadelphia District currently performs hydraulic maintenance dredging of twelve sites within the Project air shed. Of these, only six sites are dredged on an annual basis. Consequently, these six sites (Marcus Hook Range; Cherry Island Range; Deepwater Point Range; New Castle Range; Liston Range; and the Port of Wilmington) provide an annual opportunity for developing emission reductions to be used to offset Project emissions. Preliminary analyses of the potential emission reduction benefits and cost per ton for these six sites indicated that off-site O&M electrification was not the preferred method to achieving GC based on cost per ton. However, since the on-site opportunities are constrained in their ability to
DELAWARE RIVER MAIN CHANNEL DEEPENING PROJECT
GENERAL CONFORMITY ANALYSIS AND MITIGATION REPORT
37
MOFFATT & NICHOL
achieve GC on their own and due to the implementation schedules of the off-site opportunities not providing benefits until Year 3, some utilization of off-site O&M electrification is necessary. Consequently, the Marcus Hook and New Castle Ranges along with the Port of Wilmington were identified as the most practicable sites from the off-site O&M opportunities considered. The remaining sites were deemed impracticable due to logistical constraints. Results of the emission reduction benefits and cost per ton analyses for the six O&M dredging sites are detailed in Data CD Table GC-14.
10.3 Off-Site Vessel Engine Replacement
The purpose of the engine retrofit analysis for the off-site vessels (Corps’ dredge McFarland, local/regional ferries, and local/regional tugboats) is to determine the total magnitude of emission reductions that can be achieved with an engine replacement program, assess the potential costs to the Project associated with an engine replacement, and determine which engines would yield the most cost-effective emission reductions.
Once the emission benefits and costs were evaluated for the potential replacement engines for the McFarland, they were compared to determine which engine provided the greatest NOx and CO reduction benefits for the lowest cost. Due to the lower cost, increased NOx reduction benefits, and the ability to allow the emission reductions plans to meet General Conformity, the Wartsila engine was used as the engine replacement option for all of the offsite vessels (McFarland, local/regional ferries, and local/regional tugboats) considered in the emission reduction plans detailed in this report.
11 MITIGATION SCHEDULE
The general conformity regulation of the 1990 Federal Clean Air Act requires federal agencies sponsoring non transportation-related projects to show that the resulting emissions associated with those projects do not cause or contribute to air quality violations in areas that do not meet the national ambient air quality standards. After completion of the air emission calculations for the Federal channel and berth deepening construction activities associated with the proposed Delaware River Main Channel Deepening Project, it was found that the project was in non-compliance for NOx emissions in all years (1 through 6) and for CO emissions in Year 4. A preliminary analysis was performed to evaluate various emission reduction methods available to the Project. Based on the results of this analysis, three mitigation plans were developed, analyzed, and the most viable plan (Plan #1) was chosen.
The implementation of the chosen mitigation plan will become part of the Deepening Project specifications by including the required emission levels and testing requirements that the dredges must meet in order to perform work on the project. The emission reduction system employed by the contractor(s) will require certification prior to start of work on the contract. The emission reductions will occur contemporaneously with the project emissions such that there is no net increase in emissions as required by 40 CFR 93.153(b)(2).
DELAWARE RIVER MAIN CHANNEL DEEPENING PROJECT
GENERAL CONFORMITY ANALYSIS AND MITIGATION REPORT
38
MOFFATT & NICHOL
The following sections discuss the schedule requirements for the proposed mitigation plan. For scheduling purposes, it is currently assumed the project start date will be 2005 (Year 1).
11.1 On-Site SCR
Construction contracts advertised for the Project will require the installation of Selective Catalytic Reduction (SCR) equipment on all hopper dredges, hydraulic dredges and booster pumps used in connection with the Project. Alternatively, the contractor should be afforded the opportunity to achieve the emission reduction benefits required by the Project through other means such as electrification of equipment, engine replacement, or other emission control methods so long as the net result of these methods meets or exceeds the reductions specified in the selected emission reduction plan.
Based on conversations with Kaparta AG, the manufacturer of the SCR system that is currently installed on Manson Construction Company’s dredge H.R. Morris, the lead time necessary to engineer, manufacture and install an SCR system on a hydraulic or hopper dredge is approximately six months. Therefore, the Philadelphia District would need to allow approximately six months time between award of contract and start of construction to allow the SCR system to be installed and operational for the first dredging contract.
11.2 Off-Site O&M Electrification
The Philadelphia District will need to pursue the conversion to electric power for the specified O&M dredging sites as detailed in Report Tables 9.1-1 through 9.1-3. Developing this alternative will entail contacting the local utilities that distribute electric power within the Project area to identify appropriate locations for power distribution system capabilities to meet the expected energy demand. Engineering should be performed to develop preliminary plans for development of the required shoreside electrical infrastructure. The Philadelphia District, in advance of the O&M dredging contracts advertisement, should complete major infrastructure improvements necessary to develop this alternative. Remaining infrastructure improvements can be either completed by the Philadelphia District or incorporated into the O&M dredging contracts for implementation by the dredging contractor, assuming adequate time is allocated to the contractor to perform such work.
Based on previous projects that have utilized electric power for dredging projects the Philadelphia District would need to begin the engineering and infrastructure work approximately six months in advance of the intended O&M contract bid date. This would allow for the potential power drop locations to be identified and the shoreside infrastructure developed. An additional two months would be necessary for the contractors to convert their equipment. Therefore, in order for the emission reduction benefits to be utilized in Year 1 of the Deepening Project, the O&M electrification work would need to begin approximately eight months prior to the start of the Deepening Project.
DELAWARE RIVER MAIN CHANNEL DEEPENING PROJECT
GENERAL CONFORMITY ANALYSIS AND MITIGATION REPORT
39
MOFFATT & NICHOL
11.3 Off-Site Corps’ Dredge McFarland
In order for the McFarland to be utilized as part of the mitigation plan, the vessel would need to be retrofitted and ready to work a minimum of 87 days (2,076 hours) during Year’s 3 (2007) through 6 (2010) of construction of the proposed Delaware River Main Channel Deepening Project. The Corps of Engineers would need enough lead-time to perform the following work:
• Perform engine testing (as required) on the existing engines in order to refine/verify emission estimates.
• Determine an engine selection based on the results of the final mitigation plan.
• Perform the engineering involved with the engine replacements.
• Send out for proposal from the various shipyard facilities that perform this type of work.
• Perform the retrofit work at the shipyard.
• Return to the Delaware River area and perform a minimum of 87 days (2,076 hours) of work during Year’s 3 (2007) through 6 (2010) of the proposed deepening project.
Based on conversations with the Marine Design Center of the U.S. Army Corps of Engineers, it would take approximately three years to complete replacement of the engines on the McFarland after funding for the engine retrofit project has been approved. Therefore, in order for the emission reduction benefits to be utilized in Year 3 of the Deepening Project, the engine replacement program for the McFarland would need to be funded and retrofit work started one year prior to the commencement of the Deepening Project.
12 CONCLUSION
The results for the GC determination are shown in Report Table 3.1-2 for all pollutants. Detailed modeling of the emissions resulting from the Delaware River Main Channel Deepening Project predict that releases of VOC’s would be below the “de minimis” thresholds for each of the states and all of the counties. However, engine pollutant releases during construction of the Delaware River Main Channel Deepening Project would result in an exceedance of the “de minimis” levels for NOx (during all years of construction) and CO (Year 4). Mitigation of the NOx and CO emissions will be necessary for the Federal action to meet the GC requirements.
A preliminary analysis identified the available on-site and off-site emission reduction opportunities for the project that were capable of achieving GC for NOx and CO. The analysis evaluated the effectiveness and related cost impacts of both on-site and off-site emission reduction opportunities. From the preliminary analysis three emission reduction plans were developed that achieve GC and a preferred plan (Plan #1) selected.
DELAWARE RIVER MAIN CHANNEL DEEPENING PROJECT
GENERAL CONFORMITY ANALYSIS AND MITIGATION REPORT
40
MOFFATT & NICHOL
A detailed analysis was performed for the preferred plan. Plan #1 is estimated to reduce NOx emissions by 115% and carbon monoxide (CO) emissions by 109% (see Report Table 9-2). Report Table 9-2 shows the total project cost for Plan #1 as well as the cost per ton of CO and NOx avoided at $25,384 and $3,441, respectively.
Furthermore, the off-site mitigation opportunities contained within the preferred plan offer additional environmental benefit beyond that captured by this project. Since the standard engine life for large marine diesel engines is 20 to 25-years, replacing the engines on the McFarland will provide air quality benefits for at least 14-years beyond the project construction period. Although these ancillary benefits have not been taken into consideration in the analysis, these far-reaching benefits should not be overlooked.
DELAWARE RIVER MAIN CHANNEL DEEPENING PROJECT
GENERAL CONFORMITY ANALYSIS AND MITIGATION REPORT
41
MOFFATT & NICHOL
13 REFERENCES
1) Delaware River Main Channel Deepening Project, Dredging Reach Figures 2-1 through 2-5, U.S. Army Corps of Engineers, Philadelphia District.
2) U.S. Army Corps of Engineers Dredge Estimating Program (CEDEP) - 89 dredge estimates and production worksheets, U.S. Army Corps of Engineers, Philadelphia District.
3) United States Environmental Protection Agency Code of Federal Regulations Title 40, Part 50 (40 CFR 50) – National Primary And Secondary Ambient Air Quality Standards; revised July 1, 2002. http://www.access.gpo.gov/nara/cfr/waisidx_02/40cfrv2_02.html
4) United States Environmental Protection Agency Code of Federal Regulations Title 40, Part 93 (40 CFR 93) – Determining Conformity of Federal Actions to State or Federal Implementation Plans; revised July 1, 2002. http://www.access.gpo.gov/nara/cfr/waisidx_02/40cfrv17_02.html
5) “User’s Guide to MOBILE6.1 and MOBILE6.2: Mobile Source Emission Factor Model”, EPA420-R-02-028, United States Environmental Protection Agency, October 2002.
6) “Analysis of Commercial Marine Vessels Emissions and Fuel Consumption Data”, EPA420-R-00-002, United States Environmental Protection Agency, February 2000.
7) United States Environmental Protection Agency - June 2000 Draft NONROAD Model for 2007 HD Highway Rulemaking. http://www.epa.gov/otaq/nonrdmdl.htm
8) “User’s Guide For The National Nonroad Emissions Model Draft Version”, Prepared by Environ International Corporation, June 1998.
9) United States Environmental Protection Agency – Mobile6 Vehicle Emission Modeling Software. http://www.epa.gov/otaq/m6.htm
10) “Temperature and RVP Effects on Diurnal Emissions for Nonroad Engine Modeling”, Report No. NR-001, Craig Harvey, U.S. EPA Office of Mobile Sources, Assessment and Modeling Division, November 12, 1997.
11) San Francisco International Airport Airfield Development Program, “Preliminary Report No. 7, Construction Air Emissions Analysis and Mitigation Study”, prepared by ADEC for the San Francisco International Airport in October 2000.
12) New York/New Jersey Harbor Navigation Project, draft “Initial Findings Report Emission Reduction Strategies for the New York/New Jersey Harbor Navigation Project”, prepared by Starcrest Consulting Group, LLC and Allee King Rosen & Fleming, Inc. for the New York District in January 2003.
DELAWARE RIVER MAIN CHANNEL DEEPENING PROJECT
GENERAL CONFORMITY ANALYSIS AND MITIGATION REPORT
42
MOFFATT & NICHOL
13) Personal communication (phone call) with a representative from Baltimore Dredges, LLC on December 8, 2003.
14) Personal communication (e-mails and phone calls) with representatives of Caterpillar, Inc., October 23 through November 12, 2003.
15) Personal communication (phone calls) with Marine Systems, Inc., October 24 through November 18, 2003.
16) Personal communication (e-mails and phone calls) with a representative of Fairbanks Morse, October 27 through November 7, 2003.
17) Personal communication (e-mails and phone calls) with a representative of Wartsila, October 24, 2003 through January 5, 2004.
18) Personal communication (e-mails) with a representative from Kaparta AG, October 23 –24, 2003.
19) United States Environmental Protection Agency Regulatory Announcement “Emission Standards Adopted for New Marine Diesel Engines”, EPA420-F-03-001, January 2003.
20) United States Environmental Protection Agency “Final Regulatory Impact Analysis: Control of Emissions from Marine Diesel Engines”, EPA420-R-99-026, November 1999.
21) California Air Resources Board Mobile Source Mailouts “MSC 99-32”, January 2000.
22) U.S. Army Corps of Engineers Marine Design Center, “Dredge McFarland 2005 General Design Memorandum”, August 2002.
23) American Bureau of Shipping (ABS) Vessel Information database. http://www.eagle.org
24) U.S. Army Corps of Engineers, Navigation Data Center database. http://www.iwr.usace.army.mi/ndc/
25) Delaware River Main Channel Deepening Project (Pennsylvania, New Jersey, and Delaware), “Comprehensive Economic Reanalysis Report”, Philadelphia District, North Atlantic Division, December 2002.

DELAWARE RIVER MAIN CHANNEL DEEPENING PROJECT
GENERAL CONFORMITY ANALYSIS AND MITIGATION REPORT
43
MOFFATT & NICHOL
TABLES
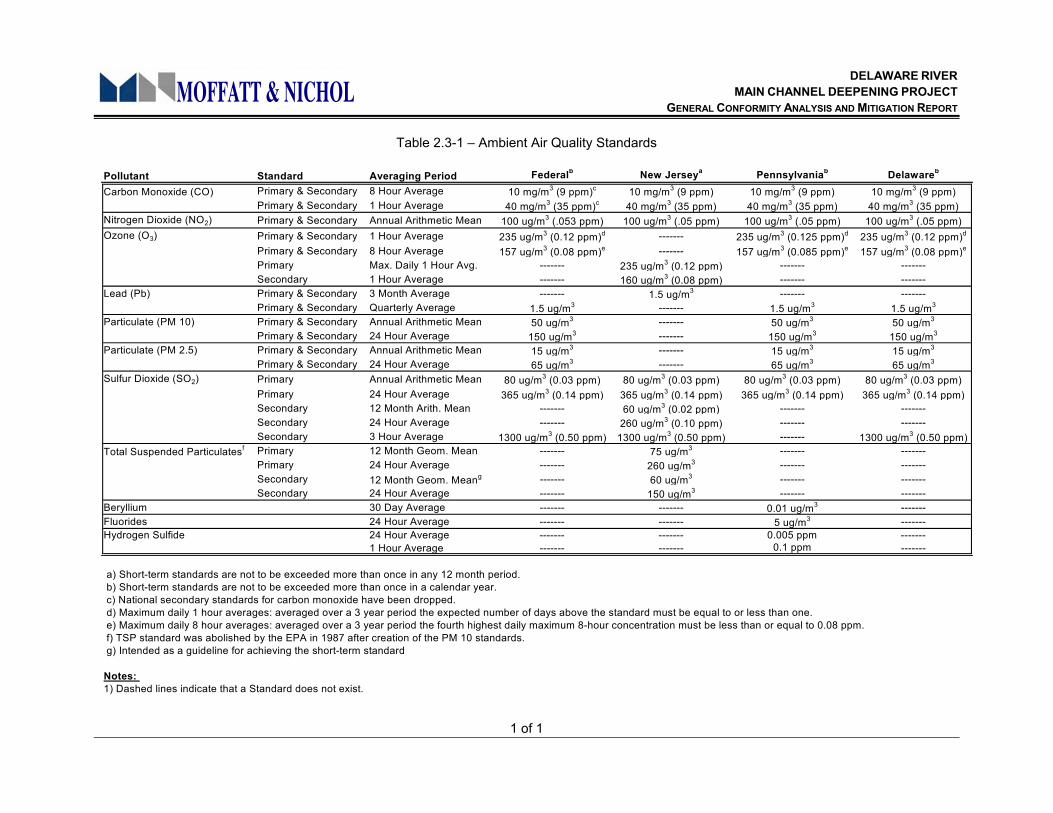
DELAWARE RIVER MAIN CHANNEL DEEPENING PROJECT
GENERAL CONFORMITY ANALYSIS AND MITIGATION REPORT
1 of 1
MOFFATT & NICHOL
Table 2.3-1 – Ambient Air Quality Standards
Pollutant Standard Averaging Period Federalb New Jerseya Pennsylvaniab Delawareb
Carbon Monoxide (CO) Primary & Secondary 8 Hour Average 10 mg/m3 (9 ppm)c 10 mg/m3 (9 ppm) 10 mg/m3 (9 ppm) 10 mg/m3 (9 ppm)Primary & Secondary 1 Hour Average 40 mg/m3 (35 ppm)c 40 mg/m3 (35 ppm) 40 mg/m3 (35 ppm) 40 mg/m3 (35 ppm)
Nitrogen Dioxide (NO2) Primary & Secondary Annual Arithmetic Mean 100 ug/m3 (.053 ppm) 100 ug/m3 (.05 ppm) 100 ug/m3 (.05 ppm) 100 ug/m3 (.05 ppm)Ozone (O3) Primary & Secondary 1 Hour Average 235 ug/m3 (0.12 ppm)d ------- 235 ug/m3 (0.125 ppm)d 235 ug/m3 (0.12 ppm)d
Primary & Secondary 8 Hour Average 157 ug/m3 (0.08 ppm)e ------- 157 ug/m3 (0.085 ppm)e 157 ug/m3 (0.08 ppm)e
Primary Max. Daily 1 Hour Avg. ------- 235 ug/m3 (0.12 ppm) ------- -------Secondary 1 Hour Average ------- 160 ug/m3 (0.08 ppm) ------- -------
Lead (Pb) Primary & Secondary 3 Month Average ------- 1.5 ug/m3 ------- -------Primary & Secondary Quarterly Average 1.5 ug/m3 ------- 1.5 ug/m3 1.5 ug/m3
Particulate (PM 10) Primary & Secondary Annual Arithmetic Mean 50 ug/m3 ------- 50 ug/m3 50 ug/m3
Primary & Secondary 24 Hour Average 150 ug/m3 ------- 150 ug/m3 150 ug/m3
Particulate (PM 2.5) Primary & Secondary Annual Arithmetic Mean 15 ug/m3 ------- 15 ug/m3 15 ug/m3
Primary & Secondary 24 Hour Average 65 ug/m3 ------- 65 ug/m3 65 ug/m3
Sulfur Dioxide (SO2) Primary Annual Arithmetic Mean 80 ug/m3 (0.03 ppm) 80 ug/m3 (0.03 ppm) 80 ug/m3 (0.03 ppm) 80 ug/m3 (0.03 ppm)Primary 24 Hour Average 365 ug/m3 (0.14 ppm) 365 ug/m3 (0.14 ppm) 365 ug/m3 (0.14 ppm) 365 ug/m3 (0.14 ppm)Secondary 12 Month Arith. Mean ------- 60 ug/m3 (0.02 ppm) ------- -------Secondary 24 Hour Average ------- 260 ug/m3 (0.10 ppm) ------- -------Secondary 3 Hour Average 1300 ug/m3 (0.50 ppm) 1300 ug/m3 (0.50 ppm) ------- 1300 ug/m3 (0.50 ppm)
Total Suspended Particulatesf Primary 12 Month Geom. Mean ------- 75 ug/m3 ------- -------Primary 24 Hour Average ------- 260 ug/m3 ------- -------Secondary 12 Month Geom. Meang ------- 60 ug/m3 ------- -------Secondary 24 Hour Average ------- 150 ug/m3 ------- -------
Beryllium 30 Day Average ------- ------- 0.01 ug/m3 -------Fluorides 24 Hour Average ------- ------- 5 ug/m3 -------Hydrogen Sulfide 24 Hour Average ------- ------- 0.005 ppm -------
1 Hour Average ------- ------- 0.1 ppm -------
a) Short-term standards are not to be exceeded more than once in any 12 month period. b) Short-term standards are not to be exceeded more than once in a calendar year. c) National secondary standards for carbon monoxide have been dropped. d) Maximum daily 1 hour averages: averaged over a 3 year period the expected number of days above the standard must be equal to or less than one. e) Maximum daily 8 hour averages: averaged over a 3 year period the fourth highest daily maximum 8-hour concentration must be less than or equal to 0.08 ppm. f) TSP standard was abolished by the EPA in 1987 after creation of the PM 10 standards. g) Intended as a guideline for achieving the short-term standard
Notes: 1) Dashed lines indicate that a Standard does not exist.
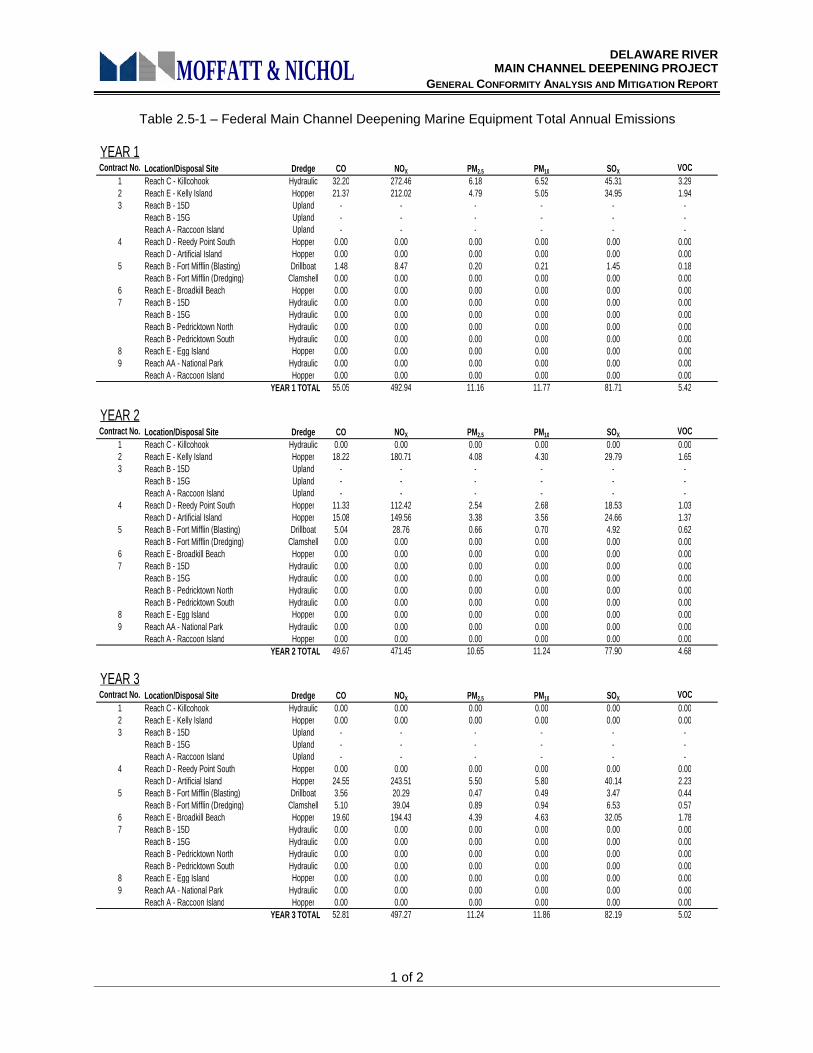
DELAWARE RIVER MAIN CHANNEL DEEPENING PROJECT
GENERAL CONFORMITY ANALYSIS AND MITIGATION REPORT
1 of 2
MOFFATT & NICHOL
Table 2.5-1 – Federal Main Channel Deepening Marine Equipment Total Annual Emissions
YEAR 1Contract No. Location/Disposal Site Dredge CO NOX PM2.5 PM10 SOX VOC
1 Reach C - Killcohook Hydraulic 32.20 272.46 6.18 6.52 45.31 3.292 Reach E - Kelly Island Hopper 21.37 212.02 4.79 5.05 34.95 1.943 Reach B - 15D Upland - - - - - -
Reach B - 15G Upland - - - - - -Reach A - Raccoon Island Upland - - - - - -
4 Reach D - Reedy Point South Hopper 0.00 0.00 0.00 0.00 0.00 0.00Reach D - Artificial Island Hopper 0.00 0.00 0.00 0.00 0.00 0.00
5 Reach B - Fort Mifflin (Blasting) Drillboat 1.48 8.47 0.20 0.21 1.45 0.18Reach B - Fort Mifflin (Dredging) Clamshell 0.00 0.00 0.00 0.00 0.00 0.00
6 Reach E - Broadkill Beach Hopper 0.00 0.00 0.00 0.00 0.00 0.007 Reach B - 15D Hydraulic 0.00 0.00 0.00 0.00 0.00 0.00
Reach B - 15G Hydraulic 0.00 0.00 0.00 0.00 0.00 0.00Reach B - Pedricktown North Hydraulic 0.00 0.00 0.00 0.00 0.00 0.00Reach B - Pedricktown South Hydraulic 0.00 0.00 0.00 0.00 0.00 0.00
8 Reach E - Egg Island Hopper 0.00 0.00 0.00 0.00 0.00 0.009 Reach AA - National Park Hydraulic 0.00 0.00 0.00 0.00 0.00 0.00
Reach A - Raccoon Island Hopper 0.00 0.00 0.00 0.00 0.00 0.00YEAR 1 TOTAL 55.05 492.94 11.16 11.77 81.71 5.42
YEAR 2Contract No. Location/Disposal Site Dredge CO NOX PM2.5 PM10 SOX VOC
1 Reach C - Killcohook Hydraulic 0.00 0.00 0.00 0.00 0.00 0.002 Reach E - Kelly Island Hopper 18.22 180.71 4.08 4.30 29.79 1.653 Reach B - 15D Upland - - - - - -
Reach B - 15G Upland - - - - - -Reach A - Raccoon Island Upland - - - - - -
4 Reach D - Reedy Point South Hopper 11.33 112.42 2.54 2.68 18.53 1.03Reach D - Artificial Island Hopper 15.08 149.56 3.38 3.56 24.66 1.37
5 Reach B - Fort Mifflin (Blasting) Drillboat 5.04 28.76 0.66 0.70 4.92 0.62Reach B - Fort Mifflin (Dredging) Clamshell 0.00 0.00 0.00 0.00 0.00 0.00
6 Reach E - Broadkill Beach Hopper 0.00 0.00 0.00 0.00 0.00 0.007 Reach B - 15D Hydraulic 0.00 0.00 0.00 0.00 0.00 0.00
Reach B - 15G Hydraulic 0.00 0.00 0.00 0.00 0.00 0.00Reach B - Pedricktown North Hydraulic 0.00 0.00 0.00 0.00 0.00 0.00Reach B - Pedricktown South Hydraulic 0.00 0.00 0.00 0.00 0.00 0.00
8 Reach E - Egg Island Hopper 0.00 0.00 0.00 0.00 0.00 0.009 Reach AA - National Park Hydraulic 0.00 0.00 0.00 0.00 0.00 0.00
Reach A - Raccoon Island Hopper 0.00 0.00 0.00 0.00 0.00 0.00YEAR 2 TOTAL 49.67 471.45 10.65 11.24 77.90 4.68
YEAR 3Contract No. Location/Disposal Site Dredge CO NOX PM2.5 PM10 SOX VOC
1 Reach C - Killcohook Hydraulic 0.00 0.00 0.00 0.00 0.00 0.002 Reach E - Kelly Island Hopper 0.00 0.00 0.00 0.00 0.00 0.003 Reach B - 15D Upland - - - - - -
Reach B - 15G Upland - - - - - -Reach A - Raccoon Island Upland - - - - - -
4 Reach D - Reedy Point South Hopper 0.00 0.00 0.00 0.00 0.00 0.00Reach D - Artificial Island Hopper 24.55 243.51 5.50 5.80 40.14 2.23
5 Reach B - Fort Mifflin (Blasting) Drillboat 3.56 20.29 0.47 0.49 3.47 0.44Reach B - Fort Mifflin (Dredging) Clamshell 5.10 39.04 0.89 0.94 6.53 0.57
6 Reach E - Broadkill Beach Hopper 19.60 194.43 4.39 4.63 32.05 1.787 Reach B - 15D Hydraulic 0.00 0.00 0.00 0.00 0.00 0.00
Reach B - 15G Hydraulic 0.00 0.00 0.00 0.00 0.00 0.00Reach B - Pedricktown North Hydraulic 0.00 0.00 0.00 0.00 0.00 0.00Reach B - Pedricktown South Hydraulic 0.00 0.00 0.00 0.00 0.00 0.00
8 Reach E - Egg Island Hopper 0.00 0.00 0.00 0.00 0.00 0.009 Reach AA - National Park Hydraulic 0.00 0.00 0.00 0.00 0.00 0.00
Reach A - Raccoon Island Hopper 0.00 0.00 0.00 0.00 0.00 0.00YEAR 3 TOTAL 52.81 497.27 11.24 11.86 82.19 5.02
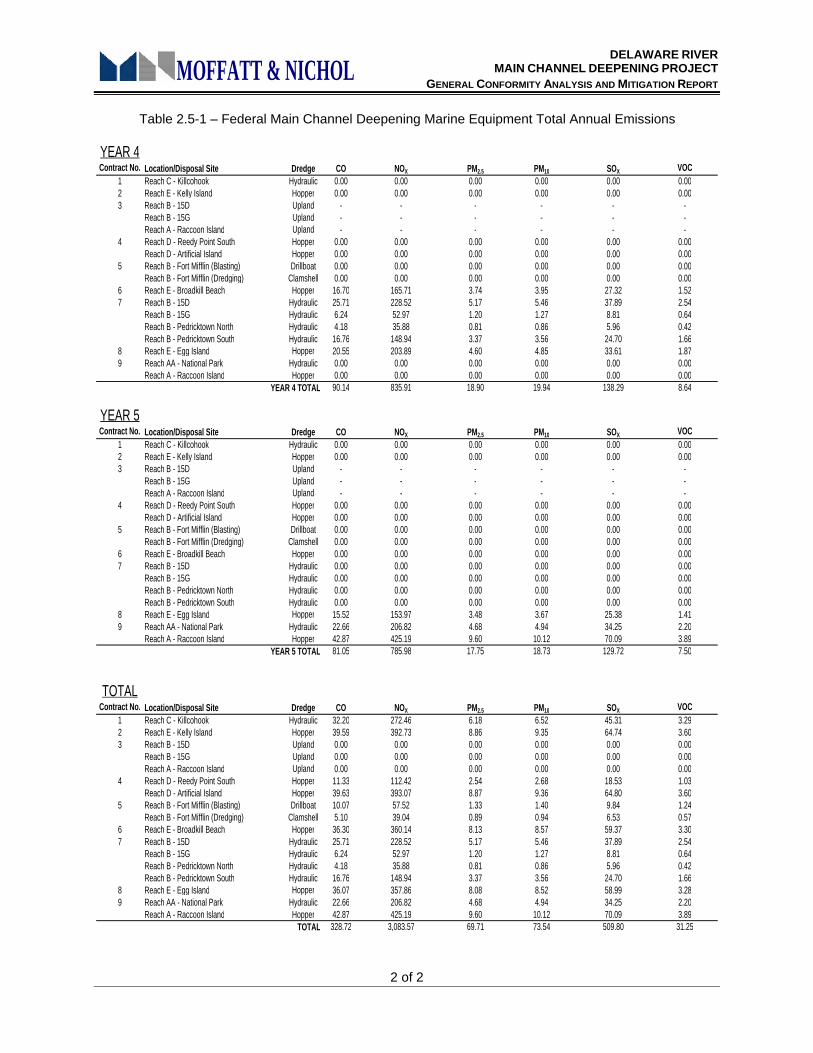
DELAWARE RIVER MAIN CHANNEL DEEPENING PROJECT
GENERAL CONFORMITY ANALYSIS AND MITIGATION REPORT
2 of 2
MOFFATT & NICHOL
Table 2.5-1 – Federal Main Channel Deepening Marine Equipment Total Annual Emissions
YEAR 4Contract No. Location/Disposal Site Dredge CO NOX PM2.5 PM10 SOX VOC
1 Reach C - Killcohook Hydraulic 0.00 0.00 0.00 0.00 0.00 0.002 Reach E - Kelly Island Hopper 0.00 0.00 0.00 0.00 0.00 0.003 Reach B - 15D Upland - - - - - -
Reach B - 15G Upland - - - - - -Reach A - Raccoon Island Upland - - - - - -
4 Reach D - Reedy Point South Hopper 0.00 0.00 0.00 0.00 0.00 0.00Reach D - Artificial Island Hopper 0.00 0.00 0.00 0.00 0.00 0.00
5 Reach B - Fort Mifflin (Blasting) Drillboat 0.00 0.00 0.00 0.00 0.00 0.00Reach B - Fort Mifflin (Dredging) Clamshell 0.00 0.00 0.00 0.00 0.00 0.00
6 Reach E - Broadkill Beach Hopper 16.70 165.71 3.74 3.95 27.32 1.527 Reach B - 15D Hydraulic 25.71 228.52 5.17 5.46 37.89 2.54
Reach B - 15G Hydraulic 6.24 52.97 1.20 1.27 8.81 0.64Reach B - Pedricktown North Hydraulic 4.18 35.88 0.81 0.86 5.96 0.42Reach B - Pedricktown South Hydraulic 16.76 148.94 3.37 3.56 24.70 1.66
8 Reach E - Egg Island Hopper 20.55 203.89 4.60 4.85 33.61 1.879 Reach AA - National Park Hydraulic 0.00 0.00 0.00 0.00 0.00 0.00
Reach A - Raccoon Island Hopper 0.00 0.00 0.00 0.00 0.00 0.00YEAR 4 TOTAL 90.14 835.91 18.90 19.94 138.29 8.64
YEAR 5Contract No. Location/Disposal Site Dredge CO NOX PM2.5 PM10 SOX VOC
1 Reach C - Killcohook Hydraulic 0.00 0.00 0.00 0.00 0.00 0.002 Reach E - Kelly Island Hopper 0.00 0.00 0.00 0.00 0.00 0.003 Reach B - 15D Upland - - - - - -
Reach B - 15G Upland - - - - - -Reach A - Raccoon Island Upland - - - - - -
4 Reach D - Reedy Point South Hopper 0.00 0.00 0.00 0.00 0.00 0.00Reach D - Artificial Island Hopper 0.00 0.00 0.00 0.00 0.00 0.00
5 Reach B - Fort Mifflin (Blasting) Drillboat 0.00 0.00 0.00 0.00 0.00 0.00Reach B - Fort Mifflin (Dredging) Clamshell 0.00 0.00 0.00 0.00 0.00 0.00
6 Reach E - Broadkill Beach Hopper 0.00 0.00 0.00 0.00 0.00 0.007 Reach B - 15D Hydraulic 0.00 0.00 0.00 0.00 0.00 0.00
Reach B - 15G Hydraulic 0.00 0.00 0.00 0.00 0.00 0.00Reach B - Pedricktown North Hydraulic 0.00 0.00 0.00 0.00 0.00 0.00Reach B - Pedricktown South Hydraulic 0.00 0.00 0.00 0.00 0.00 0.00
8 Reach E - Egg Island Hopper 15.52 153.97 3.48 3.67 25.38 1.419 Reach AA - National Park Hydraulic 22.66 206.82 4.68 4.94 34.25 2.20
Reach A - Raccoon Island Hopper 42.87 425.19 9.60 10.12 70.09 3.89YEAR 5 TOTAL 81.05 785.98 17.75 18.73 129.72 7.50
TOTALContract No. Location/Disposal Site Dredge CO NOX PM2.5 PM10 SOX VOC
1 Reach C - Killcohook Hydraulic 32.20 272.46 6.18 6.52 45.31 3.292 Reach E - Kelly Island Hopper 39.59 392.73 8.86 9.35 64.74 3.603 Reach B - 15D Upland 0.00 0.00 0.00 0.00 0.00 0.00
Reach B - 15G Upland 0.00 0.00 0.00 0.00 0.00 0.00Reach A - Raccoon Island Upland 0.00 0.00 0.00 0.00 0.00 0.00
4 Reach D - Reedy Point South Hopper 11.33 112.42 2.54 2.68 18.53 1.03Reach D - Artificial Island Hopper 39.63 393.07 8.87 9.36 64.80 3.60
5 Reach B - Fort Mifflin (Blasting) Drillboat 10.07 57.52 1.33 1.40 9.84 1.24Reach B - Fort Mifflin (Dredging) Clamshell 5.10 39.04 0.89 0.94 6.53 0.57
6 Reach E - Broadkill Beach Hopper 36.30 360.14 8.13 8.57 59.37 3.307 Reach B - 15D Hydraulic 25.71 228.52 5.17 5.46 37.89 2.54
Reach B - 15G Hydraulic 6.24 52.97 1.20 1.27 8.81 0.64Reach B - Pedricktown North Hydraulic 4.18 35.88 0.81 0.86 5.96 0.42Reach B - Pedricktown South Hydraulic 16.76 148.94 3.37 3.56 24.70 1.66
8 Reach E - Egg Island Hopper 36.07 357.86 8.08 8.52 58.99 3.289 Reach AA - National Park Hydraulic 22.66 206.82 4.68 4.94 34.25 2.20
Reach A - Raccoon Island Hopper 42.87 425.19 9.60 10.12 70.09 3.89TOTAL 328.72 3,083.57 69.71 73.54 509.80 31.25
DELAWARE RIVER MAIN CHANNEL DEEPENING PROJECT
GENERAL CONFORMITY ANALYSIS AND MITIGATION REPORT
1 of 1
MOFFATT & NICHOL
Table 2.5-2 – NONROAD Equipment Emissions
Pollutant Year 1 Year 2 Year 3 Year 4 Year 5 TOTAL TONSCO 4.46 14.51 8.47 6.95 6.76 41.15NOx 8.28 31.93 21.77 12.65 13.19 87.82PM2.5 0.82 2.19 1.50 1.27 1.20 6.98PM10 0.89 2.38 1.63 1.38 1.30 7.59SOx 2.54 9.15 6.45 3.80 3.74 25.68VOC 0.91 2.84 2.03 1.43 1.53 8.73
TOTALS 17.90 63.01 41.85 27.48 27.72 177.95
CONSTRUCTION PERIOD(TONS OF EMISSIONS)
DELAWARE RIVER MAIN CHANNEL DEEPENING PROJECT
GENERAL CONFORMITY ANALYSIS AND MITIGATION REPORT
1 of 1
MOFFATT & NICHOL
Table 2.5-3 - Vehicle Emissions
Pollutant Year 1 Year 2 Year 3 Year 4 Year 5 Total TonsVOC 0.64874 0.32738 0.38832 0.66977 0.33046 2.36468NOx 0.55799 0.39654 0.35159 0.56401 0.29685 2.16697CO 7.93399 5.12585 5.57719 8.70248 4.43705 31.77656PM10 0.01381 0.01075 0.00986 0.01784 0.01001 0.06227PM2.5 0.01312 0.01021 0.00937 0.01695 0.00951 0.05915SOx 0.01461 0.00974 0.00291 0.00506 0.00283 0.03515
9.18227 5.88047 6.33924 9.97612 5.08670 36.46479
CONSTRUCTION PERIOD(TONS OF EMISSIONS)
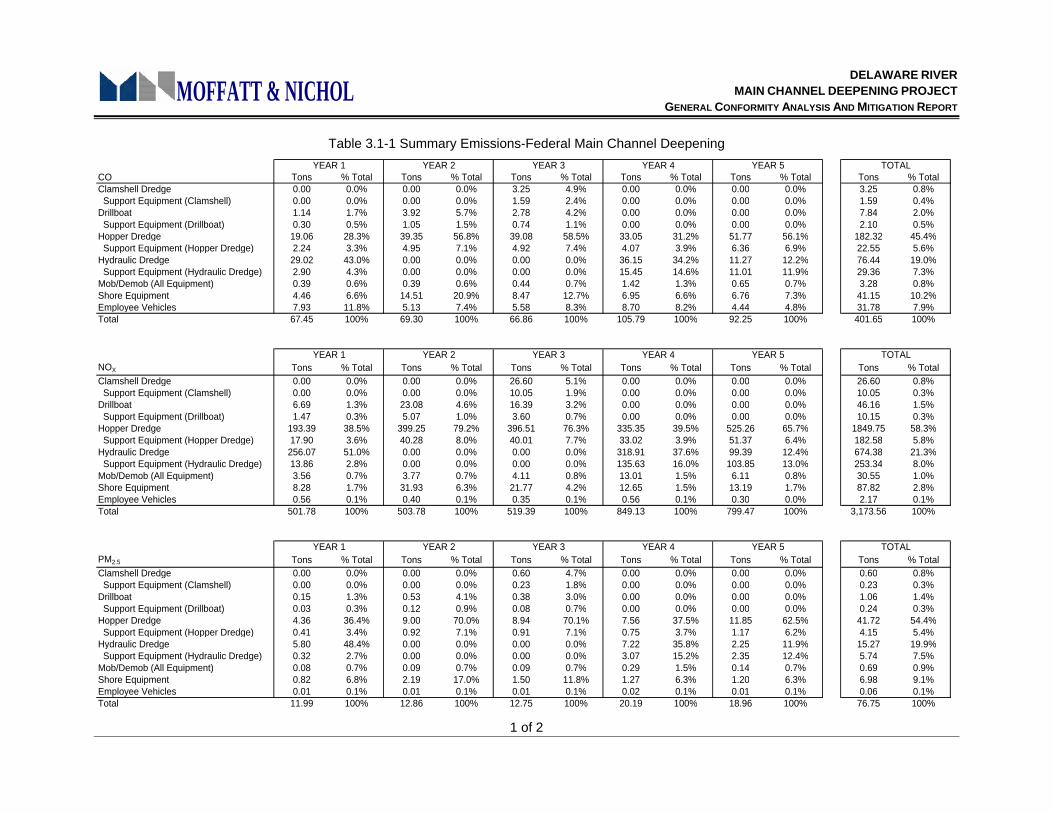
DELAWARE RIVER MAIN CHANNEL DEEPENING PROJECT
GENERAL CONFORMITY ANALYSIS AND MITIGATION REPORT
1 of 2
MOFFATT & NICHOL
Table 3.1-1 Summary Emissions-Federal Main Channel Deepening
CO Tons % Total Tons % Total Tons % Total Tons % Total Tons % Total Tons % TotalClamshell Dredge 0.00 0.0% 0.00 0.0% 3.25 4.9% 0.00 0.0% 0.00 0.0% 3.25 0.8% Support Equipment (Clamshell) 0.00 0.0% 0.00 0.0% 1.59 2.4% 0.00 0.0% 0.00 0.0% 1.59 0.4%Drillboat 1.14 1.7% 3.92 5.7% 2.78 4.2% 0.00 0.0% 0.00 0.0% 7.84 2.0% Support Equipment (Drillboat) 0.30 0.5% 1.05 1.5% 0.74 1.1% 0.00 0.0% 0.00 0.0% 2.10 0.5%Hopper Dredge 19.06 28.3% 39.35 56.8% 39.08 58.5% 33.05 31.2% 51.77 56.1% 182.32 45.4% Support Equipment (Hopper Dredge) 2.24 3.3% 4.95 7.1% 4.92 7.4% 4.07 3.9% 6.36 6.9% 22.55 5.6%Hydraulic Dredge 29.02 43.0% 0.00 0.0% 0.00 0.0% 36.15 34.2% 11.27 12.2% 76.44 19.0% Support Equipment (Hydraulic Dredge) 2.90 4.3% 0.00 0.0% 0.00 0.0% 15.45 14.6% 11.01 11.9% 29.36 7.3%Mob/Demob (All Equipment) 0.39 0.6% 0.39 0.6% 0.44 0.7% 1.42 1.3% 0.65 0.7% 3.28 0.8%Shore Equipment 4.46 6.6% 14.51 20.9% 8.47 12.7% 6.95 6.6% 6.76 7.3% 41.15 10.2%Employee Vehicles 7.93 11.8% 5.13 7.4% 5.58 8.3% 8.70 8.2% 4.44 4.8% 31.78 7.9%Total 67.45 100% 69.30 100% 66.86 100% 105.79 100% 92.25 100% 401.65 100%
NOX Tons % Total Tons % Total Tons % Total Tons % Total Tons % Total Tons % TotalClamshell Dredge 0.00 0.0% 0.00 0.0% 26.60 5.1% 0.00 0.0% 0.00 0.0% 26.60 0.8% Support Equipment (Clamshell) 0.00 0.0% 0.00 0.0% 10.05 1.9% 0.00 0.0% 0.00 0.0% 10.05 0.3%Drillboat 6.69 1.3% 23.08 4.6% 16.39 3.2% 0.00 0.0% 0.00 0.0% 46.16 1.5% Support Equipment (Drillboat) 1.47 0.3% 5.07 1.0% 3.60 0.7% 0.00 0.0% 0.00 0.0% 10.15 0.3%Hopper Dredge 193.39 38.5% 399.25 79.2% 396.51 76.3% 335.35 39.5% 525.26 65.7% 1849.75 58.3% Support Equipment (Hopper Dredge) 17.90 3.6% 40.28 8.0% 40.01 7.7% 33.02 3.9% 51.37 6.4% 182.58 5.8%Hydraulic Dredge 256.07 51.0% 0.00 0.0% 0.00 0.0% 318.91 37.6% 99.39 12.4% 674.38 21.3% Support Equipment (Hydraulic Dredge) 13.86 2.8% 0.00 0.0% 0.00 0.0% 135.63 16.0% 103.85 13.0% 253.34 8.0%Mob/Demob (All Equipment) 3.56 0.7% 3.77 0.7% 4.11 0.8% 13.01 1.5% 6.11 0.8% 30.55 1.0%Shore Equipment 8.28 1.7% 31.93 6.3% 21.77 4.2% 12.65 1.5% 13.19 1.7% 87.82 2.8%Employee Vehicles 0.56 0.1% 0.40 0.1% 0.35 0.1% 0.56 0.1% 0.30 0.0% 2.17 0.1%Total 501.78 100% 503.78 100% 519.39 100% 849.13 100% 799.47 100% 3,173.56 100%
PM2.5 Tons % Total Tons % Total Tons % Total Tons % Total Tons % Total Tons % TotalClamshell Dredge 0.00 0.0% 0.00 0.0% 0.60 4.7% 0.00 0.0% 0.00 0.0% 0.60 0.8% Support Equipment (Clamshell) 0.00 0.0% 0.00 0.0% 0.23 1.8% 0.00 0.0% 0.00 0.0% 0.23 0.3%Drillboat 0.15 1.3% 0.53 4.1% 0.38 3.0% 0.00 0.0% 0.00 0.0% 1.06 1.4% Support Equipment (Drillboat) 0.03 0.3% 0.12 0.9% 0.08 0.7% 0.00 0.0% 0.00 0.0% 0.24 0.3%Hopper Dredge 4.36 36.4% 9.00 70.0% 8.94 70.1% 7.56 37.5% 11.85 62.5% 41.72 54.4% Support Equipment (Hopper Dredge) 0.41 3.4% 0.92 7.1% 0.91 7.1% 0.75 3.7% 1.17 6.2% 4.15 5.4%Hydraulic Dredge 5.80 48.4% 0.00 0.0% 0.00 0.0% 7.22 35.8% 2.25 11.9% 15.27 19.9% Support Equipment (Hydraulic Dredge) 0.32 2.7% 0.00 0.0% 0.00 0.0% 3.07 15.2% 2.35 12.4% 5.74 7.5%Mob/Demob (All Equipment) 0.08 0.7% 0.09 0.7% 0.09 0.7% 0.29 1.5% 0.14 0.7% 0.69 0.9%Shore Equipment 0.82 6.8% 2.19 17.0% 1.50 11.8% 1.27 6.3% 1.20 6.3% 6.98 9.1%Employee Vehicles 0.01 0.1% 0.01 0.1% 0.01 0.1% 0.02 0.1% 0.01 0.1% 0.06 0.1%Total 11.99 100% 12.86 100% 12.75 100% 20.19 100% 18.96 100% 76.75 100%
YEAR 1 YEAR 5YEAR 4YEAR 3YEAR 2
YEAR 5YEAR 1 YEAR 2 YEAR 3 YEAR 4
YEAR 1 YEAR 2 YEAR 3 YEAR 4 YEAR 5
TOTAL
TOTAL
TOTAL
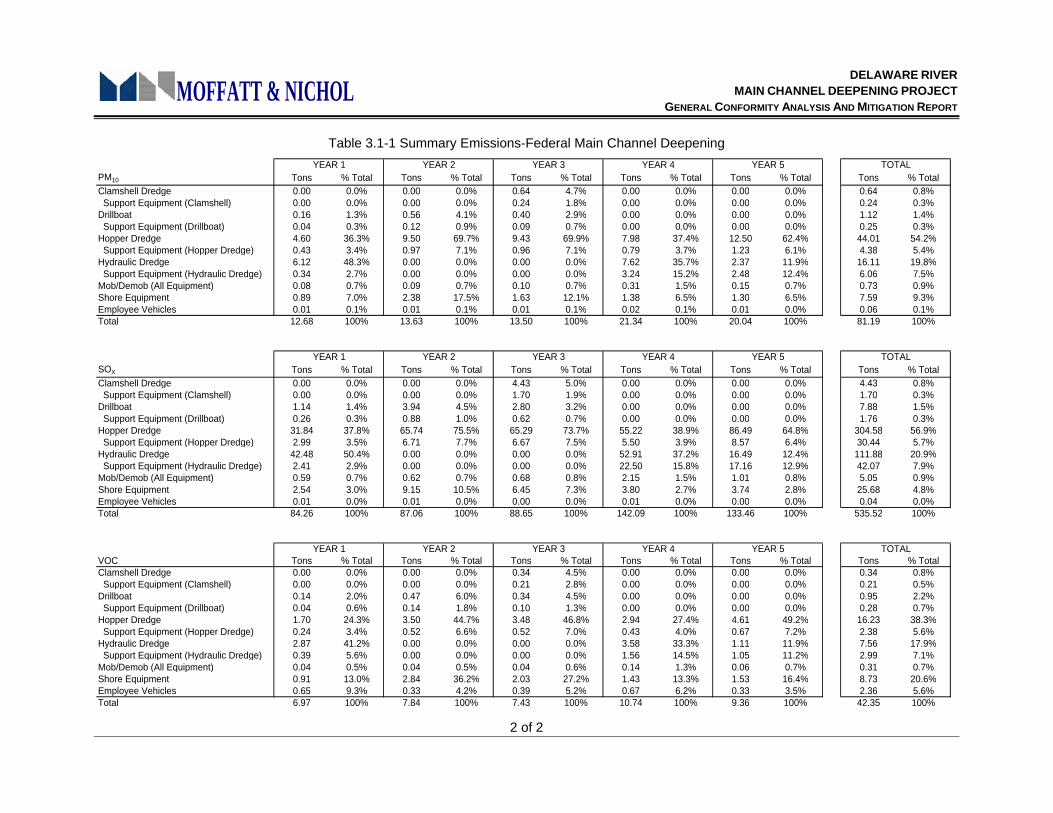
DELAWARE RIVER MAIN CHANNEL DEEPENING PROJECT
GENERAL CONFORMITY ANALYSIS AND MITIGATION REPORT
2 of 2
MOFFATT & NICHOL
Table 3.1-1 Summary Emissions-Federal Main Channel Deepening
PM10 Tons % Total Tons % Total Tons % Total Tons % Total Tons % Total Tons % TotalClamshell Dredge 0.00 0.0% 0.00 0.0% 0.64 4.7% 0.00 0.0% 0.00 0.0% 0.64 0.8% Support Equipment (Clamshell) 0.00 0.0% 0.00 0.0% 0.24 1.8% 0.00 0.0% 0.00 0.0% 0.24 0.3%Drillboat 0.16 1.3% 0.56 4.1% 0.40 2.9% 0.00 0.0% 0.00 0.0% 1.12 1.4% Support Equipment (Drillboat) 0.04 0.3% 0.12 0.9% 0.09 0.7% 0.00 0.0% 0.00 0.0% 0.25 0.3%Hopper Dredge 4.60 36.3% 9.50 69.7% 9.43 69.9% 7.98 37.4% 12.50 62.4% 44.01 54.2% Support Equipment (Hopper Dredge) 0.43 3.4% 0.97 7.1% 0.96 7.1% 0.79 3.7% 1.23 6.1% 4.38 5.4%Hydraulic Dredge 6.12 48.3% 0.00 0.0% 0.00 0.0% 7.62 35.7% 2.37 11.9% 16.11 19.8% Support Equipment (Hydraulic Dredge) 0.34 2.7% 0.00 0.0% 0.00 0.0% 3.24 15.2% 2.48 12.4% 6.06 7.5%Mob/Demob (All Equipment) 0.08 0.7% 0.09 0.7% 0.10 0.7% 0.31 1.5% 0.15 0.7% 0.73 0.9%Shore Equipment 0.89 7.0% 2.38 17.5% 1.63 12.1% 1.38 6.5% 1.30 6.5% 7.59 9.3%Employee Vehicles 0.01 0.1% 0.01 0.1% 0.01 0.1% 0.02 0.1% 0.01 0.0% 0.06 0.1%Total 12.68 100% 13.63 100% 13.50 100% 21.34 100% 20.04 100% 81.19 100%
SOX Tons % Total Tons % Total Tons % Total Tons % Total Tons % Total Tons % TotalClamshell Dredge 0.00 0.0% 0.00 0.0% 4.43 5.0% 0.00 0.0% 0.00 0.0% 4.43 0.8% Support Equipment (Clamshell) 0.00 0.0% 0.00 0.0% 1.70 1.9% 0.00 0.0% 0.00 0.0% 1.70 0.3%Drillboat 1.14 1.4% 3.94 4.5% 2.80 3.2% 0.00 0.0% 0.00 0.0% 7.88 1.5% Support Equipment (Drillboat) 0.26 0.3% 0.88 1.0% 0.62 0.7% 0.00 0.0% 0.00 0.0% 1.76 0.3%Hopper Dredge 31.84 37.8% 65.74 75.5% 65.29 73.7% 55.22 38.9% 86.49 64.8% 304.58 56.9% Support Equipment (Hopper Dredge) 2.99 3.5% 6.71 7.7% 6.67 7.5% 5.50 3.9% 8.57 6.4% 30.44 5.7%Hydraulic Dredge 42.48 50.4% 0.00 0.0% 0.00 0.0% 52.91 37.2% 16.49 12.4% 111.88 20.9% Support Equipment (Hydraulic Dredge) 2.41 2.9% 0.00 0.0% 0.00 0.0% 22.50 15.8% 17.16 12.9% 42.07 7.9%Mob/Demob (All Equipment) 0.59 0.7% 0.62 0.7% 0.68 0.8% 2.15 1.5% 1.01 0.8% 5.05 0.9%Shore Equipment 2.54 3.0% 9.15 10.5% 6.45 7.3% 3.80 2.7% 3.74 2.8% 25.68 4.8%Employee Vehicles 0.01 0.0% 0.01 0.0% 0.00 0.0% 0.01 0.0% 0.00 0.0% 0.04 0.0%Total 84.26 100% 87.06 100% 88.65 100% 142.09 100% 133.46 100% 535.52 100%
VOC Tons % Total Tons % Total Tons % Total Tons % Total Tons % Total Tons % TotalClamshell Dredge 0.00 0.0% 0.00 0.0% 0.34 4.5% 0.00 0.0% 0.00 0.0% 0.34 0.8% Support Equipment (Clamshell) 0.00 0.0% 0.00 0.0% 0.21 2.8% 0.00 0.0% 0.00 0.0% 0.21 0.5%Drillboat 0.14 2.0% 0.47 6.0% 0.34 4.5% 0.00 0.0% 0.00 0.0% 0.95 2.2% Support Equipment (Drillboat) 0.04 0.6% 0.14 1.8% 0.10 1.3% 0.00 0.0% 0.00 0.0% 0.28 0.7%Hopper Dredge 1.70 24.3% 3.50 44.7% 3.48 46.8% 2.94 27.4% 4.61 49.2% 16.23 38.3% Support Equipment (Hopper Dredge) 0.24 3.4% 0.52 6.6% 0.52 7.0% 0.43 4.0% 0.67 7.2% 2.38 5.6%Hydraulic Dredge 2.87 41.2% 0.00 0.0% 0.00 0.0% 3.58 33.3% 1.11 11.9% 7.56 17.9% Support Equipment (Hydraulic Dredge) 0.39 5.6% 0.00 0.0% 0.00 0.0% 1.56 14.5% 1.05 11.2% 2.99 7.1%Mob/Demob (All Equipment) 0.04 0.5% 0.04 0.5% 0.04 0.6% 0.14 1.3% 0.06 0.7% 0.31 0.7%Shore Equipment 0.91 13.0% 2.84 36.2% 2.03 27.2% 1.43 13.3% 1.53 16.4% 8.73 20.6%Employee Vehicles 0.65 9.3% 0.33 4.2% 0.39 5.2% 0.67 6.2% 0.33 3.5% 2.36 5.6%Total 6.97 100% 7.84 100% 7.43 100% 10.74 100% 9.36 100% 42.35 100%
TOTAL
TOTAL
TOTALYEAR 5YEAR 1 YEAR 2 YEAR 3 YEAR 4
YEAR 5
YEAR 1 YEAR 2 YEAR 3 YEAR 4 YEAR 5
YEAR 1 YEAR 2 YEAR 3 YEAR 4
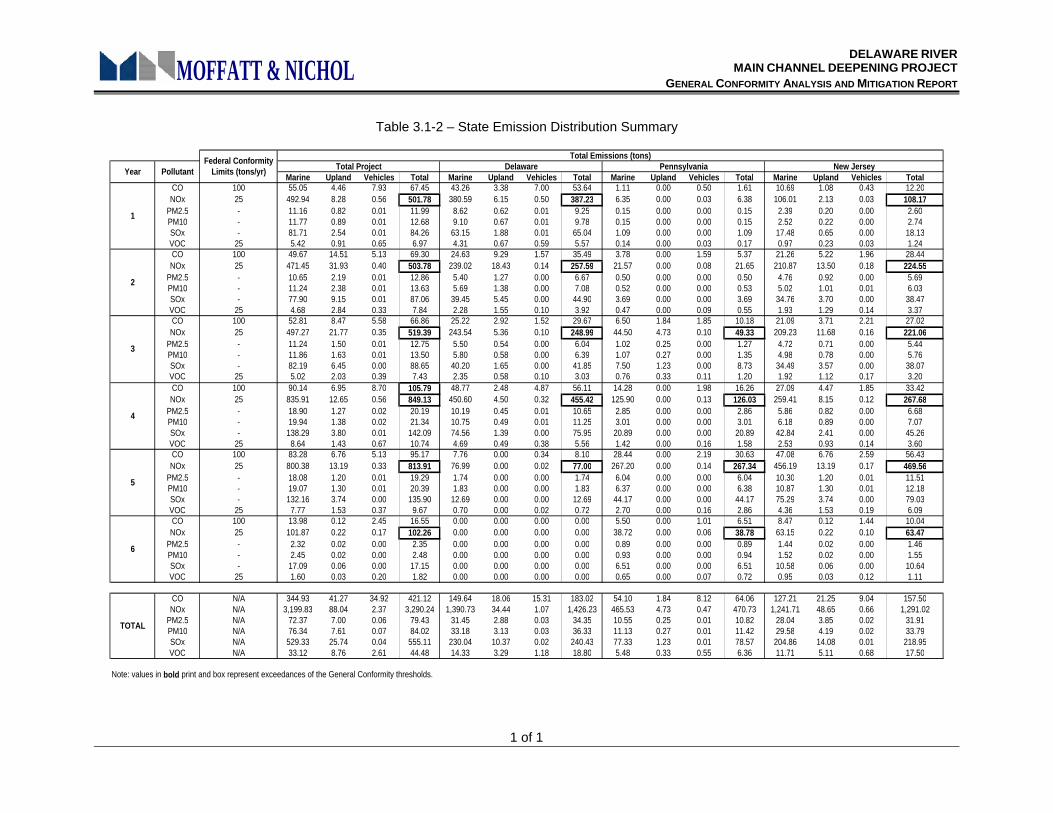
DELAWARE RIVER MAIN CHANNEL DEEPENING PROJECT
GENERAL CONFORMITY ANALYSIS AND MITIGATION REPORT
1 of 1
MOFFATT & NICHOL
Table 3.1-2 – State Emission Distribution Summary
Marine Upland Vehicles Total Marine Upland Vehicles Total Marine Upland Vehicles Total Marine Upland Vehicles TotalCO 100 55.05 4.46 7.93 67.45 43.26 3.38 7.00 53.64 1.11 0.00 0.50 1.61 10.69 1.08 0.43 12.20NOx 25 492.94 8.28 0.56 501.78 380.59 6.15 0.50 387.23 6.35 0.00 0.03 6.38 106.01 2.13 0.03 108.17
PM2.5 - 11.16 0.82 0.01 11.99 8.62 0.62 0.01 9.25 0.15 0.00 0.00 0.15 2.39 0.20 0.00 2.60PM10 - 11.77 0.89 0.01 12.68 9.10 0.67 0.01 9.78 0.15 0.00 0.00 0.15 2.52 0.22 0.00 2.74SOx - 81.71 2.54 0.01 84.26 63.15 1.88 0.01 65.04 1.09 0.00 0.00 1.09 17.48 0.65 0.00 18.13VOC 25 5.42 0.91 0.65 6.97 4.31 0.67 0.59 5.57 0.14 0.00 0.03 0.17 0.97 0.23 0.03 1.24CO 100 49.67 14.51 5.13 69.30 24.63 9.29 1.57 35.49 3.78 0.00 1.59 5.37 21.26 5.22 1.96 28.44NOx 25 471.45 31.93 0.40 503.78 239.02 18.43 0.14 257.59 21.57 0.00 0.08 21.65 210.87 13.50 0.18 224.55
PM2.5 - 10.65 2.19 0.01 12.86 5.40 1.27 0.00 6.67 0.50 0.00 0.00 0.50 4.76 0.92 0.00 5.69PM10 - 11.24 2.38 0.01 13.63 5.69 1.38 0.00 7.08 0.52 0.00 0.00 0.53 5.02 1.01 0.01 6.03SOx - 77.90 9.15 0.01 87.06 39.45 5.45 0.00 44.90 3.69 0.00 0.00 3.69 34.76 3.70 0.00 38.47VOC 25 4.68 2.84 0.33 7.84 2.28 1.55 0.10 3.92 0.47 0.00 0.09 0.55 1.93 1.29 0.14 3.37CO 100 52.81 8.47 5.58 66.86 25.22 2.92 1.52 29.67 6.50 1.84 1.85 10.18 21.09 3.71 2.21 27.02NOx 25 497.27 21.77 0.35 519.39 243.54 5.36 0.10 248.99 44.50 4.73 0.10 49.33 209.23 11.68 0.16 221.06
PM2.5 - 11.24 1.50 0.01 12.75 5.50 0.54 0.00 6.04 1.02 0.25 0.00 1.27 4.72 0.71 0.00 5.44PM10 - 11.86 1.63 0.01 13.50 5.80 0.58 0.00 6.39 1.07 0.27 0.00 1.35 4.98 0.78 0.00 5.76SOx - 82.19 6.45 0.00 88.65 40.20 1.65 0.00 41.85 7.50 1.23 0.00 8.73 34.49 3.57 0.00 38.07VOC 25 5.02 2.03 0.39 7.43 2.35 0.58 0.10 3.03 0.76 0.33 0.11 1.20 1.92 1.12 0.17 3.20CO 100 90.14 6.95 8.70 105.79 48.77 2.48 4.87 56.11 14.28 0.00 1.98 16.26 27.09 4.47 1.85 33.42NOx 25 835.91 12.65 0.56 849.13 450.60 4.50 0.32 455.42 125.90 0.00 0.13 126.03 259.41 8.15 0.12 267.68
PM2.5 - 18.90 1.27 0.02 20.19 10.19 0.45 0.01 10.65 2.85 0.00 0.00 2.86 5.86 0.82 0.00 6.68PM10 - 19.94 1.38 0.02 21.34 10.75 0.49 0.01 11.25 3.01 0.00 0.00 3.01 6.18 0.89 0.00 7.07SOx - 138.29 3.80 0.01 142.09 74.56 1.39 0.00 75.95 20.89 0.00 0.00 20.89 42.84 2.41 0.00 45.26VOC 25 8.64 1.43 0.67 10.74 4.69 0.49 0.38 5.56 1.42 0.00 0.16 1.58 2.53 0.93 0.14 3.60CO 100 83.28 6.76 5.13 95.17 7.76 0.00 0.34 8.10 28.44 0.00 2.19 30.63 47.08 6.76 2.59 56.43NOx 25 800.38 13.19 0.33 813.91 76.99 0.00 0.02 77.00 267.20 0.00 0.14 267.34 456.19 13.19 0.17 469.56
PM2.5 - 18.08 1.20 0.01 19.29 1.74 0.00 0.00 1.74 6.04 0.00 0.00 6.04 10.30 1.20 0.01 11.51PM10 - 19.07 1.30 0.01 20.39 1.83 0.00 0.00 1.83 6.37 0.00 0.00 6.38 10.87 1.30 0.01 12.18SOx - 132.16 3.74 0.00 135.90 12.69 0.00 0.00 12.69 44.17 0.00 0.00 44.17 75.29 3.74 0.00 79.03VOC 25 7.77 1.53 0.37 9.67 0.70 0.00 0.02 0.72 2.70 0.00 0.16 2.86 4.36 1.53 0.19 6.09CO 100 13.98 0.12 2.45 16.55 0.00 0.00 0.00 0.00 5.50 0.00 1.01 6.51 8.47 0.12 1.44 10.04NOx 25 101.87 0.22 0.17 102.26 0.00 0.00 0.00 0.00 38.72 0.00 0.06 38.78 63.15 0.22 0.10 63.47
PM2.5 - 2.32 0.02 0.00 2.35 0.00 0.00 0.00 0.00 0.89 0.00 0.00 0.89 1.44 0.02 0.00 1.46PM10 - 2.45 0.02 0.00 2.48 0.00 0.00 0.00 0.00 0.93 0.00 0.00 0.94 1.52 0.02 0.00 1.55SOx - 17.09 0.06 0.00 17.15 0.00 0.00 0.00 0.00 6.51 0.00 0.00 6.51 10.58 0.06 0.00 10.64VOC 25 1.60 0.03 0.20 1.82 0.00 0.00 0.00 0.00 0.65 0.00 0.07 0.72 0.95 0.03 0.12 1.11
CO N/A 344.93 41.27 34.92 421.12 149.64 18.06 15.31 183.02 54.10 1.84 8.12 64.06 127.21 21.25 9.04 157.50NOx N/A 3,199.83 88.04 2.37 3,290.24 1,390.73 34.44 1.07 1,426.23 465.53 4.73 0.47 470.73 1,241.71 48.65 0.66 1,291.02
PM2.5 N/A 72.37 7.00 0.06 79.43 31.45 2.88 0.03 34.35 10.55 0.25 0.01 10.82 28.04 3.85 0.02 31.91PM10 N/A 76.34 7.61 0.07 84.02 33.18 3.13 0.03 36.33 11.13 0.27 0.01 11.42 29.58 4.19 0.02 33.79SOx N/A 529.33 25.74 0.04 555.11 230.04 10.37 0.02 240.43 77.33 1.23 0.01 78.57 204.86 14.08 0.01 218.95VOC N/A 33.12 8.76 2.61 44.48 14.33 3.29 1.18 18.80 5.48 0.33 0.55 6.36 11.71 5.11 0.68 17.50
Note: values in bold print and box represent exceedances of the General Conformity thresholds.
TOTAL
5
1
2
3
4
6
Total Emissions (tons)Federal Conformity Limits (tons/yr)Year Pollutant New JerseyPennsylvaniaDelawareTotal Project
DELAWARE RIVER MAIN CHANNEL DEEPENING PROJECT
GENERAL CONFORMITY ANALYSIS AND MITIGATION REPORT
1 of 1
MOFFATT & NICHOL
Total Amount Dredged (CY) CO NOX PM2.5 PM10 SOX VOC
Clamshell Dredge/Drillboat 77,000 197.09 1,254.04 28.77 30.35 212.55 23.56
Hopper Dredge 14,461,561 14.23 141.16 3.19 3.36 23.27 1.29
Hydraulic Dredge 11,550,403 9.33 81.87 1.85 1.96 13.59 0.93
Shore Equipment 26,088,964 1.58 3.37 0.27 0.29 0.98 0.33
Employee Vehicles 26,088,964 1.22 0.08 0.00 0.00 0.00 0.09
*Values for each dredge includes dredge, support equipment, mob/demob towing, and mob/demob setup.
Tons of Emission / Million Cubic Yards Dredged*
Table 3.1-3 – Tons of Emissions per MCY Dredge
DELAWARE RIVER MAIN CHANNEL DEEPENING PROJECT
GENERAL CONFORMITY ANALYSIS AND MITIGATION REPORT
1 of 2
MOFFATT & NICHOL
Table 3.2-1 – Summary Emissions – Berth Deepening’s
YEAR 1Reach Dredging Range Disposal Site Dredge CO NOX PM2.5 PM10 SOX VOC
Beckett St. Terminal Whites Basin Clamshell 0.00 0.00 0.00 0.00 0.00 0.00Packer Ave. Terminal Whites Basin Clamshell 0.00 0.00 0.00 0.00 0.00 0.00Coastal Eagle Point Whites Basin Clamshell 0.00 0.00 0.00 0.00 0.00 0.00Sun Oil Co. - Fort Mifflin Whites Basin Clamshell 0.00 0.00 0.00 0.00 0.00 0.00Valero - Paulsboro Whites Basin Clamshell 0.00 0.00 0.00 0.00 0.00 0.00Phillips 66 (Tosco) - Marcus Hook Whites Basin Clamshell 0.00 0.00 0.00 0.00 0.00 0.00Sun Oil Co. - Marcus Hook (Rock) - Drillboat 0.00 0.00 0.00 0.00 0.00 0.00Sun Oil Co. - Marcus Hook (Rock Dredging) Whites Basin Clamshell 0.00 0.00 0.00 0.00 0.00 0.00Sun Oil Co. - Marcus Hook (Dredging) Whites Basin Clamshell 0.00 0.00 0.00 0.00 0.00 0.00Whites Basin Upland Hydraulic 0.00 0.00 0.00 0.00 0.00 0.00
TOTAL 0.00 0.00 0.00 0.00 0.00 0.00
YEAR 2Reach Dredging Range Disposal Site Dredge CO NOX PM2.5 PM10 SOX VOC
Beckett St. Terminal Whites Basin Clamshell 0.00 0.00 0.00 0.00 0.00 0.00Packer Ave. Terminal Whites Basin Clamshell 0.00 0.00 0.00 0.00 0.00 0.00Coastal Eagle Point Whites Basin Clamshell 0.00 0.00 0.00 0.00 0.00 0.00Sun Oil Co. - Fort Mifflin Whites Basin Clamshell 0.00 0.00 0.00 0.00 0.00 0.00Valero - Paulsboro Whites Basin Clamshell 0.00 0.00 0.00 0.00 0.00 0.00Phillips 66 (Tosco) - Marcus Hook Whites Basin Clamshell 0.00 0.00 0.00 0.00 0.00 0.00Sun Oil Co. - Marcus Hook (Rock) - Drillboat 0.00 0.00 0.00 0.00 0.00 0.00Sun Oil Co. - Marcus Hook (Rock Dredging) Whites Basin Clamshell 0.00 0.00 0.00 0.00 0.00 0.00Sun Oil Co. - Marcus Hook (Dredging) Whites Basin Clamshell 0.00 0.00 0.00 0.00 0.00 0.00Whites Basin Upland Hydraulic 0.00 0.00 0.00 0.00 0.00 0.00
TOTAL 0.00 0.00 0.00 0.00 0.00 0.00
YEAR 3Reach Dredging Range Disposal Site Dredge CO NOX PM2.5 PM10 SOX VOC
Beckett St. Terminal Whites Basin Clamshell 0.00 0.00 0.00 0.00 0.00 0.00Packer Ave. Terminal Whites Basin Clamshell 0.00 0.00 0.00 0.00 0.00 0.00Coastal Eagle Point Whites Basin Clamshell 0.00 0.00 0.00 0.00 0.00 0.00Sun Oil Co. - Fort Mifflin Whites Basin Clamshell 0.00 0.00 0.00 0.00 0.00 0.00Valero - Paulsboro Whites Basin Clamshell 0.00 0.00 0.00 0.00 0.00 0.00Phillips 66 (Tosco) - Marcus Hook Whites Basin Clamshell 0.00 0.00 0.00 0.00 0.00 0.00Sun Oil Co. - Marcus Hook (Rock) - Drillboat 0.00 0.00 0.00 0.00 0.00 0.00Sun Oil Co. - Marcus Hook (Rock Dredging) Whites Basin Clamshell 0.00 0.00 0.00 0.00 0.00 0.00Sun Oil Co. - Marcus Hook (Dredging) Whites Basin Clamshell 0.00 0.00 0.00 0.00 0.00 0.00Whites Basin Upland Hydraulic 0.00 0.00 0.00 0.00 0.00 0.00
TOTAL 0.00 0.00 0.00 0.00 0.00 0.00
YEAR 4Reach Dredging Range Disposal Site Dredge CO NOX PM2.5 PM10 SOX VOC
Beckett St. Terminal Whites Basin Clamshell 0.00 0.00 0.00 0.00 0.00 0.00Packer Ave. Terminal Whites Basin Clamshell 0.00 0.00 0.00 0.00 0.00 0.00Coastal Eagle Point Whites Basin Clamshell 0.00 0.00 0.00 0.00 0.00 0.00Sun Oil Co. - Fort Mifflin Whites Basin Clamshell 0.00 0.00 0.00 0.00 0.00 0.00Valero - Paulsboro Whites Basin Clamshell 0.00 0.00 0.00 0.00 0.00 0.00Phillips 66 (Tosco) - Marcus Hook Whites Basin Clamshell 0.00 0.00 0.00 0.00 0.00 0.00Sun Oil Co. - Marcus Hook (Rock) - Drillboat 0.00 0.00 0.00 0.00 0.00 0.00Sun Oil Co. - Marcus Hook (Rock Dredging) Whites Basin Clamshell 0.00 0.00 0.00 0.00 0.00 0.00Sun Oil Co. - Marcus Hook (Dredging) Whites Basin Clamshell 0.00 0.00 0.00 0.00 0.00 0.00Whites Basin Upland Hydraulic 0.00 0.00 0.00 0.00 0.00 0.00
TOTAL 0.00 0.00 0.00 0.00 0.00 0.00
YEAR 5Reach Dredging Range Disposal Site Dredge CO NOX PM2.5 PM10 SOX VOC
Beckett St. Terminal Whites Basin Clamshell 0.00 0.00 0.00 0.00 0.00 0.00Packer Ave. Terminal Whites Basin Clamshell 0.00 0.00 0.00 0.00 0.00 0.00Coastal Eagle Point Whites Basin Clamshell 0.00 0.00 0.00 0.00 0.00 0.00Sun Oil Co. - Fort Mifflin Whites Basin Clamshell 0.00 0.00 0.00 0.00 0.00 0.00Valero - Paulsboro Whites Basin Clamshell 0.00 0.00 0.00 0.00 0.00 0.00Phillips 66 (Tosco) - Marcus Hook Whites Basin Clamshell X 0.94 6.96 0.16 0.17 1.17 0.11Sun Oil Co. - Marcus Hook (Rock) - Drillboat X 1.28 7.43 0.17 0.18 1.27 0.16Sun Oil Co. - Marcus Hook (Rock Dredging) Whites Basin Clamshell 0.00 0.00 0.00 0.00 0.00 0.00Sun Oil Co. - Marcus Hook (Dredging) Whites Basin Clamshell 0.00 0.00 0.00 0.00 0.00 0.00Whites Basin Upland Hydraulic 0.00 0.00 0.00 0.00 0.00 0.00
TOTAL 2.23 14.40 0.33 0.35 2.44 0.27
Berth Deepening
DELAWARE RIVER MAIN CHANNEL DEEPENING PROJECT
GENERAL CONFORMITY ANALYSIS AND MITIGATION REPORT
2 of 2
MOFFATT & NICHOL
Table 3.2-1 – Summary Emissions – Berth Deepening’s
YEAR 6Reach Dredging Range Disposal Site Dredge CO NOX PM2.5 PM10 SOX VOC
Beckett St. Terminal Whites Basin Clamshell X 0.79 5.34 0.12 0.13 0.90 0.10Packer Ave. Terminal Whites Basin Clamshell X 0.98 7.33 0.17 0.18 1.23 0.12Coastal Eagle Point Whites Basin Clamshell X 0.51 3.72 0.08 0.09 0.62 0.06Sun Oil Co. - Fort Mifflin Whites Basin Clamshell X 0.53 4.00 0.09 0.10 0.67 0.06Valero - Paulsboro Whites Basin Clamshell X 2.18 15.27 0.35 0.37 2.57 0.26Phillips 66 (Tosco) - Marcus Hook Whites Basin Clamshell 0.00 0.00 0.00 0.00 0.00 0.00Sun Oil Co. - Marcus Hook (Rock) - Drillboat X 1.28 7.43 0.17 0.18 1.27 0.16Sun Oil Co. - Marcus Hook (Rock Dredging) Whites Basin Clamshell X 1.88 13.87 0.32 0.33 2.32 0.22Sun Oil Co. - Marcus Hook (Dredging) Whites Basin Clamshell X 0.83 6.09 0.14 0.15 1.02 0.10Whites Basin Upland Hydraulic X 5.00 38.83 0.88 0.93 6.49 0.54
TOTAL 13.98 101.87 2.32 2.45 17.09 1.60
TOTALReach Dredging Range Disposal Site Dredge CO NOX PM2.5 PM10 SOX VOC
Beckett St. Terminal Whites Basin Clamshell 0.79 5.34 0.12 0.13 0.90 0.10Packer Ave. Terminal Whites Basin Clamshell 0.98 7.33 0.17 0.18 1.23 0.12Coastal Eagle Point Whites Basin Clamshell 0.51 3.72 0.08 0.09 0.62 0.06Sun Oil Co. - Fort Mifflin Whites Basin Clamshell 0.53 4.00 0.09 0.10 0.67 0.06Valero - Paulsboro Whites Basin Clamshell 2.18 15.27 0.35 0.37 2.57 0.26Phillips 66 (Tosco) - Marcus Hook Whites Basin Clamshell 0.94 6.96 0.16 0.17 1.17 0.11Sun Oil Co. - Marcus Hook (Rock) - Drillboat 2.56 14.87 0.34 0.36 2.54 0.31Sun Oil Co. - Marcus Hook (Rock Dredging) Whites Basin Clamshell 1.88 13.87 0.32 0.33 2.32 0.22Sun Oil Co. - Marcus Hook (Dredging) Whites Basin Clamshell 0.83 6.09 0.14 0.15 1.02 0.10Whites Basin Upland Hydraulic 5.00 38.83 0.88 0.93 6.49 0.54
TOTAL 16.20 116.27 2.66 2.80 19.53 1.86
DELAWARE RIVER MAIN CHANNEL DEEPENING PROJECT
GENERAL CONFORMITY ANALYSIS AND MITIGATION REPORT
1 of 1
MOFFATT & NICHOL
Table 3.2–2 – Summary Emissions- Channel-Berth Deepening’s
Marine Upland Vehicles Total Marine Upland Vehicles TotalCO 100 55.05 4.46 7.93 67.45 0.00 0.00 0.00 0.00 67.45
NOx 25 492.94 8.28 0.56 501.78 0.00 0.00 0.00 0.00 501.78PM2.5 - 11.16 0.82 0.01 11.99 0.00 0.00 0.00 0.00 11.99PM10 - 11.77 0.89 0.01 12.68 0.00 0.00 0.00 0.00 12.68SOx - 81.71 2.54 0.01 84.26 0.00 0.00 0.00 0.00 84.26VOC 25 5.42 0.91 0.65 6.97 0.00 0.00 0.00 0.00 6.97CO 100 49.67 14.51 5.13 69.30 0.00 0.00 0.00 0.00 69.30
NOx 25 471.45 31.93 0.40 503.78 0.00 0.00 0.00 0.00 503.78PM2.5 - 10.65 2.19 0.01 12.86 0.00 0.00 0.00 0.00 12.86PM10 - 11.24 2.38 0.01 13.63 0.00 0.00 0.00 0.00 13.63SOx - 77.90 9.15 0.01 87.06 0.00 0.00 0.00 0.00 87.06VOC 25 4.68 2.84 0.33 7.84 0.00 0.00 0.00 0.00 7.84CO 100 52.81 8.47 5.58 66.86 0.00 0.00 0.00 0.00 66.86
NOx 25 497.27 21.77 0.35 519.39 0.00 0.00 0.00 0.00 519.39PM2.5 - 11.24 1.50 0.01 12.75 0.00 0.00 0.00 0.00 12.75PM10 - 11.86 1.63 0.01 13.50 0.00 0.00 0.00 0.00 13.50SOx - 82.19 6.45 0.00 88.65 0.00 0.00 0.00 0.00 88.65VOC 25 5.02 2.03 0.39 7.43 0.00 0.00 0.00 0.00 7.43
CO 100 90.14 6.95 8.70 105.79 0.00 0.00 0.00 0.00 105.79NOx 25 835.91 12.65 0.56 849.13 0.00 0.00 0.00 0.00 849.13
PM2.5 - 18.90 1.27 0.02 20.19 0.00 0.00 0.00 0.00 20.19PM10 - 19.94 1.38 0.02 21.34 0.00 0.00 0.00 0.00 21.34SOx - 138.29 3.80 0.01 142.09 0.00 0.00 0.00 0.00 142.09VOC 25 8.64 1.43 0.67 10.74 0.00 0.00 0.00 0.00 10.74CO 100 81.05 6.76 4.44 92.25 2.23 0.00 0.72 2.94 95.19
NOx 25 785.98 13.19 0.30 799.47 14.40 0.00 0.04 14.43 813.91PM2.5 - 17.75 1.20 0.01 18.96 0.33 0.00 0.00 0.33 19.29PM10 - 18.73 1.30 0.01 20.04 0.35 0.00 0.00 0.35 20.39SOx - 129.72 3.74 0.00 133.46 2.44 0.00 0.00 2.44 135.90VOC 25 7.50 1.53 0.33 9.36 0.27 0.00 0.04 0.31 9.67CO 100 0.00 0.00 0.00 0.00 13.98 0.12 2.43 16.53 16.53
NOx 25 0.00 0.00 0.00 0.00 101.87 0.22 0.17 102.26 102.26PM2.5 - 0.00 0.00 0.00 0.00 2.32 0.02 0.00 2.35 2.35PM10 - 0.00 0.00 0.00 0.00 2.45 0.02 0.00 2.48 2.48SOx - 0.00 0.00 0.00 0.00 17.09 0.06 0.00 17.15 17.15VOC 25 0.00 0.00 0.00 0.00 1.60 0.03 0.20 1.82 1.82
CO N/A 328.72 41.15 31.78 401.65 16.20 0.12 3.15 19.47 421.12NOx N/A 3,083.57 87.82 2.17 3,173.56 116.27 0.22 0.20 116.69 3,290.24
PM2.5 N/A 69.71 6.98 0.06 76.75 2.66 0.02 0.01 2.68 79.43PM10 N/A 73.54 7.59 0.06 81.19 2.80 0.02 0.01 2.83 84.02SOx N/A 509.80 25.68 0.04 535.52 19.53 0.06 0.00 19.59 555.11VOC N/A 31.25 8.73 2.36 42.35 1.86 0.03 0.24 2.13 44.48
Pollutant
1
TOTAL
Federal Channel Deepening Total Project
Berth Deepening
6
2
3
4
5
Federal Conformity
Limits (tons/yr)Year
Note: Values in bold print and box represent exceedances of the General Conformity threshold.
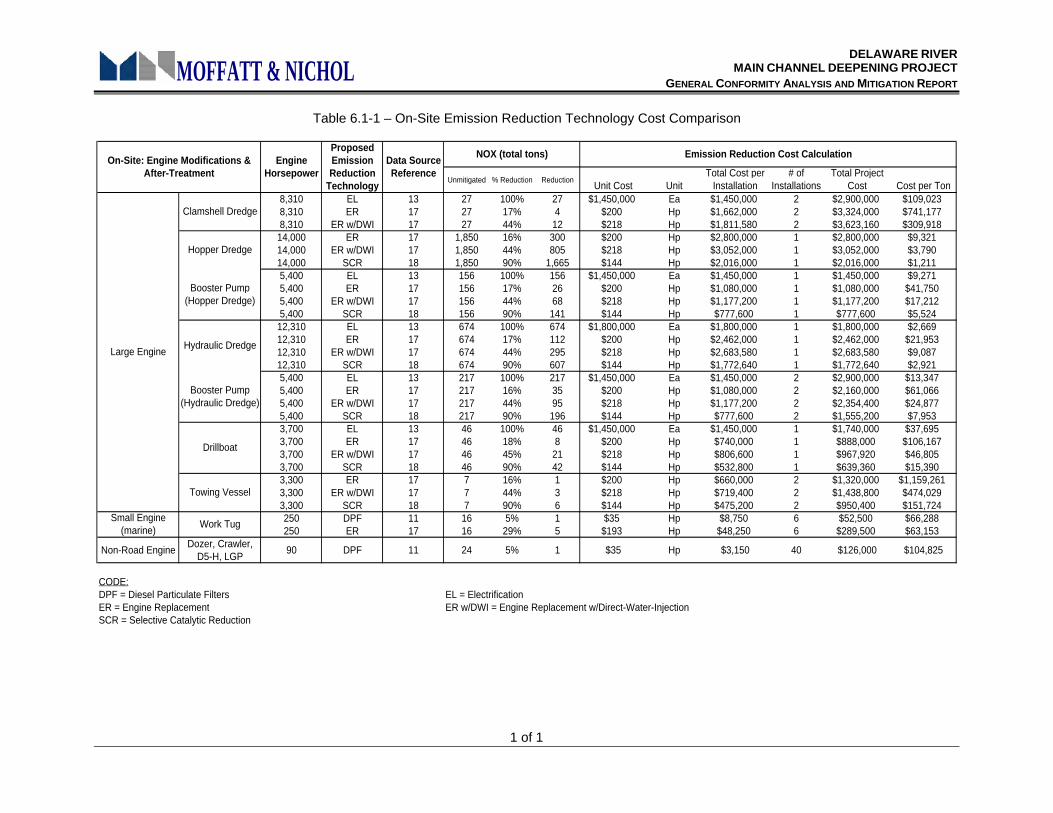
DELAWARE RIVER MAIN CHANNEL DEEPENING PROJECT
GENERAL CONFORMITY ANALYSIS AND MITIGATION REPORT
1 of 1
MOFFATT & NICHOL
Table 6.1-1 – On-Site Emission Reduction Technology Cost Comparison
Unmitigated % Reduction ReductionUnit Cost Unit
Total Cost per Installation
# of Installations
Total Project Cost Cost per Ton
8,310 EL 13 27 100% 27 $1,450,000 Ea $1,450,000 2 $2,900,000 $109,0238,310 ER 17 27 17% 4 $200 Hp $1,662,000 2 $3,324,000 $741,1778,310 ER w/DWI 17 27 44% 12 $218 Hp $1,811,580 2 $3,623,160 $309,918
14,000 ER 17 1,850 16% 300 $200 Hp $2,800,000 1 $2,800,000 $9,32114,000 ER w/DWI 17 1,850 44% 805 $218 Hp $3,052,000 1 $3,052,000 $3,79014,000 SCR 18 1,850 90% 1,665 $144 Hp $2,016,000 1 $2,016,000 $1,2115,400 EL 13 156 100% 156 $1,450,000 Ea $1,450,000 1 $1,450,000 $9,2715,400 ER 17 156 17% 26 $200 Hp $1,080,000 1 $1,080,000 $41,7505,400 ER w/DWI 17 156 44% 68 $218 Hp $1,177,200 1 $1,177,200 $17,2125,400 SCR 18 156 90% 141 $144 Hp $777,600 1 $777,600 $5,524
12,310 EL 13 674 100% 674 $1,800,000 Ea $1,800,000 1 $1,800,000 $2,66912,310 ER 17 674 17% 112 $200 Hp $2,462,000 1 $2,462,000 $21,95312,310 ER w/DWI 17 674 44% 295 $218 Hp $2,683,580 1 $2,683,580 $9,08712,310 SCR 18 674 90% 607 $144 Hp $1,772,640 1 $1,772,640 $2,9215,400 EL 13 217 100% 217 $1,450,000 Ea $1,450,000 2 $2,900,000 $13,3475,400 ER 17 217 16% 35 $200 Hp $1,080,000 2 $2,160,000 $61,0665,400 ER w/DWI 17 217 44% 95 $218 Hp $1,177,200 2 $2,354,400 $24,8775,400 SCR 18 217 90% 196 $144 Hp $777,600 2 $1,555,200 $7,9533,700 EL 13 46 100% 46 $1,450,000 Ea $1,450,000 1 $1,740,000 $37,6953,700 ER 17 46 18% 8 $200 Hp $740,000 1 $888,000 $106,1673,700 ER w/DWI 17 46 45% 21 $218 Hp $806,600 1 $967,920 $46,8053,700 SCR 18 46 90% 42 $144 Hp $532,800 1 $639,360 $15,3903,300 ER 17 7 16% 1 $200 Hp $660,000 2 $1,320,000 $1,159,2613,300 ER w/DWI 17 7 44% 3 $218 Hp $719,400 2 $1,438,800 $474,0293,300 SCR 18 7 90% 6 $144 Hp $475,200 2 $950,400 $151,724250 DPF 11 16 5% 1 $35 Hp $8,750 6 $52,500 $66,288250 ER 17 16 29% 5 $193 Hp $48,250 6 $289,500 $63,153
Non-Road EngineDozer, Crawler,
D5-H, LGP90 DPF 11 24 5% 1 $35 Hp $3,150 40 $126,000 $104,825
CODE:DPF = Diesel Particulate Filters EL = ElectrificationER = Engine Replacement ER w/DWI = Engine Replacement w/Direct-Water-InjectionSCR = Selective Catalytic Reduction
On-Site: Engine Modifications & After-Treatment
Data Source Reference
Emission Reduction Cost CalculationNOX (total tons)Proposed Emission Reduction
Technology
Engine Horsepower
Work Tug
Towing Vessel
Small Engine (marine)
Large Engine
Clamshell Dredge
Hopper Dredge
Drillboat
Hydraulic Dredge
Booster Pump (Hopper Dredge)
Booster Pump (Hydraulic Dredge)
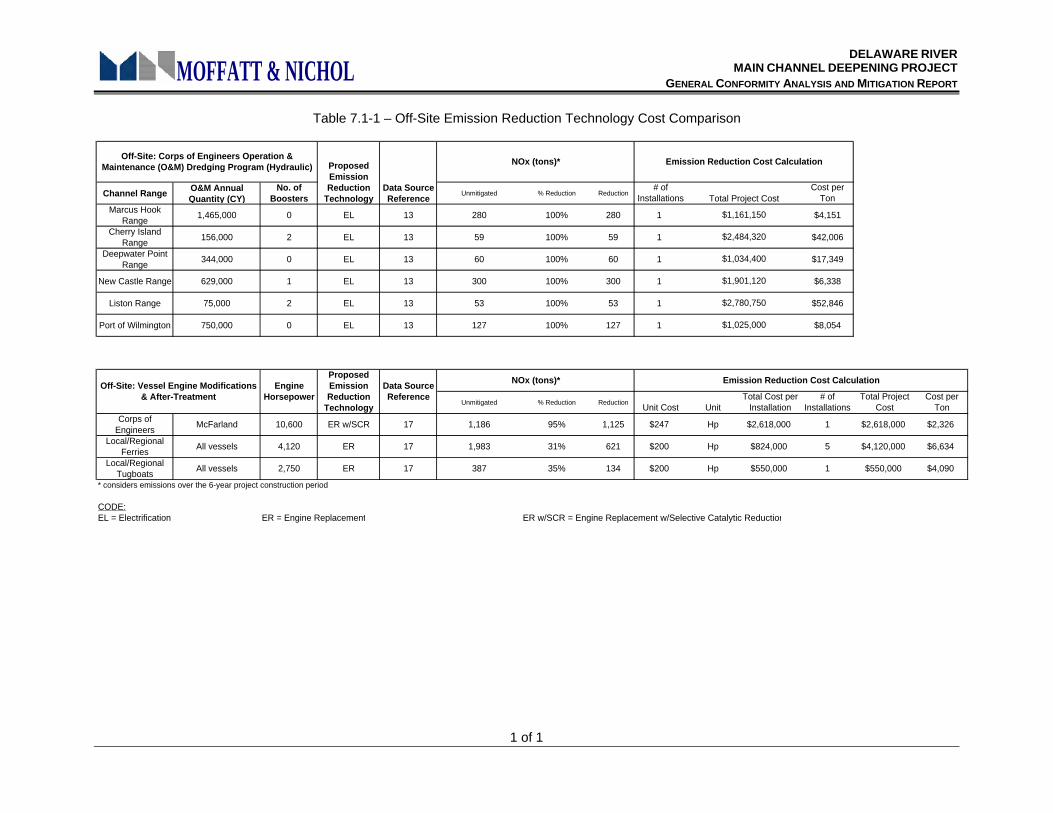
DELAWARE RIVER MAIN CHANNEL DEEPENING PROJECT
GENERAL CONFORMITY ANALYSIS AND MITIGATION REPORT
1 of 1
MOFFATT & NICHOL
Table 7.1-1 – Off-Site Emission Reduction Technology Cost Comparison
Channel RangeO&M Annual Quantity (CY)
No. of Boosters
Unmitigated % Reduction Reduction# of
InstallationsCost per
TonMarcus Hook
Range1,465,000 0 EL 13 280 100% 280 1 $4,151
Cherry Island Range
156,000 2 EL 13 59 100% 59 1 $42,006
Deepwater Point Range
344,000 0 EL 13 60 100% 60 1 $17,349
New Castle Range 629,000 1 EL 13 300 100% 300 1 $6,338
Liston Range 75,000 2 EL 13 53 100% 53 1 $52,846
Port of Wilmington 750,000 0 EL 13 127 100% 127 1 $8,054
Unmitigated % Reduction ReductionUnit Cost Unit
Total Cost per Installation
# of Installations
Total Project Cost
Cost per Ton
Corps of Engineers
McFarland 10,600 ER w/SCR 17 1,186 95% 1,125 $247 Hp $2,618,000 1 $2,618,000 $2,326
Local/Regional Ferries
All vessels 4,120 ER 17 1,983 31% 621 $200 Hp $824,000 5 $4,120,000 $6,634
Local/Regional Tugboats
All vessels 2,750 ER 17 387 35% 134 $200 Hp $550,000 1 $550,000 $4,090
* considers emissions over the 6-year project construction period
CODE:EL = Electrification ER = Engine Replacement ER w/SCR = Engine Replacement w/Selective Catalytic Reduction
Emission Reduction Cost Calculation
Data Source Reference
NOx (tons)*
Total Project Cost
$2,780,750
$1,025,000
Emission Reduction Cost Calculation
$1,901,120
Off-Site: Vessel Engine Modifications & After-Treatment
Engine Horsepower
Proposed Emission Reduction
Technology
NOx (tons)*Data Source Reference
Off-Site: Corps of Engineers Operation & Maintenance (O&M) Dredging Program (Hydraulic)
$1,161,150
$2,484,320
$1,034,400
Proposed Emission Reduction
Technology
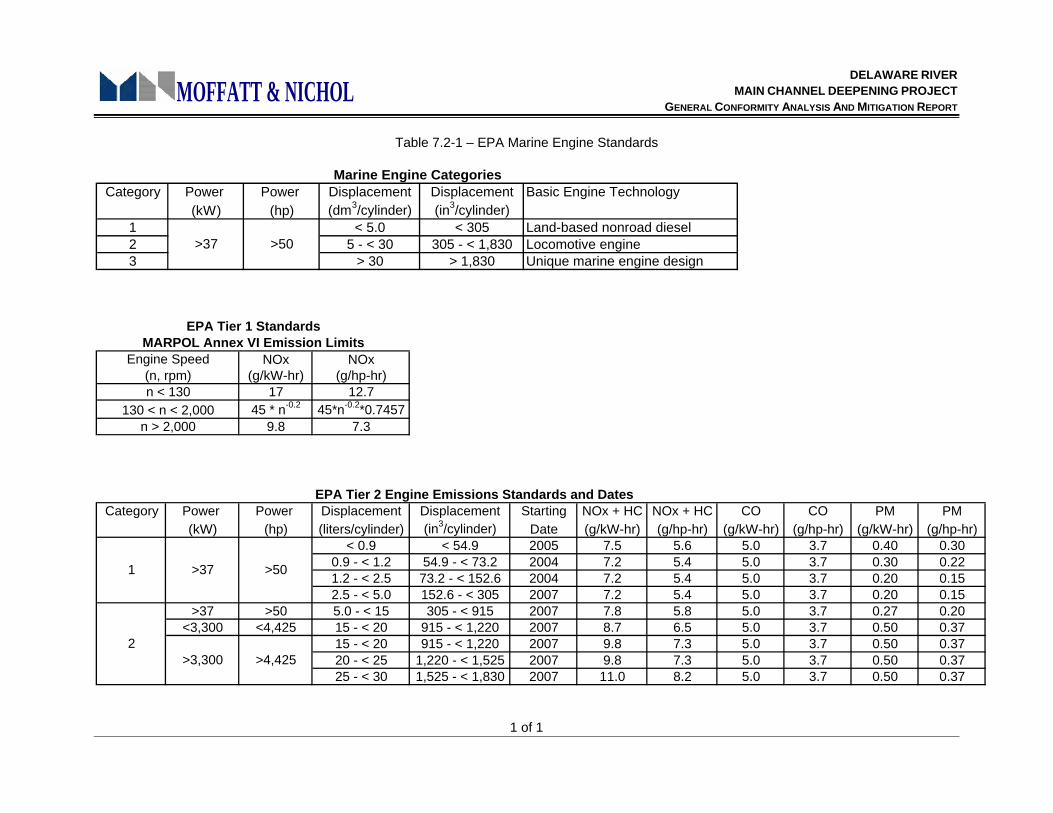
DELAWARE RIVER MAIN CHANNEL DEEPENING PROJECT
GENERAL CONFORMITY ANALYSIS AND MITIGATION REPORT
1 of 1
MOFFATT & NICHOL
Table 7.2-1 – EPA Marine Engine Standards
Category Power Power Displacement Displacement Basic Engine Technology(kW) (hp) (dm3/cylinder) (in3/cylinder)
1 < 5.0 < 305 Land-based nonroad diesel2 5 - < 30 305 - < 1,830 Locomotive engine3 > 30 > 1,830 Unique marine engine design
Marine Engine Categories
>37 >50
NOx NOx(g/kW-hr) (g/hp-hr)
17 12.745 * n-0.2 45*n-0.2*0.7457
9.8 7.3
n < 130130 < n < 2,000
n > 2,000
EPA Tier 1 StandardsMARPOL Annex VI Emission Limits
Engine Speed(n, rpm)
Category Power Power Displacement Displacement Starting NOx + HC NOx + HC CO CO PM PM(kW) (hp) (liters/cylinder) (in3/cylinder) Date (g/kW-hr) (g/hp-hr) (g/kW-hr) (g/hp-hr) (g/kW-hr) (g/hp-hr)
< 0.9 < 54.9 2005 7.5 5.6 5.0 3.7 0.40 0.300.9 - < 1.2 54.9 - < 73.2 2004 7.2 5.4 5.0 3.7 0.30 0.221.2 - < 2.5 73.2 - < 152.6 2004 7.2 5.4 5.0 3.7 0.20 0.152.5 - < 5.0 152.6 - < 305 2007 7.2 5.4 5.0 3.7 0.20 0.15
>37 >50 5.0 - < 15 305 - < 915 2007 7.8 5.8 5.0 3.7 0.27 0.20<3,300 <4,425 15 - < 20 915 - < 1,220 2007 8.7 6.5 5.0 3.7 0.50 0.37
15 - < 20 915 - < 1,220 2007 9.8 7.3 5.0 3.7 0.50 0.3720 - < 25 1,220 - < 1,525 2007 9.8 7.3 5.0 3.7 0.50 0.3725 - < 30 1,525 - < 1,830 2007 11.0 8.2 5.0 3.7 0.50 0.37
>3,300 >4,4252
EPA Tier 2 Engine Emissions Standards and Dates
1 >37 >50
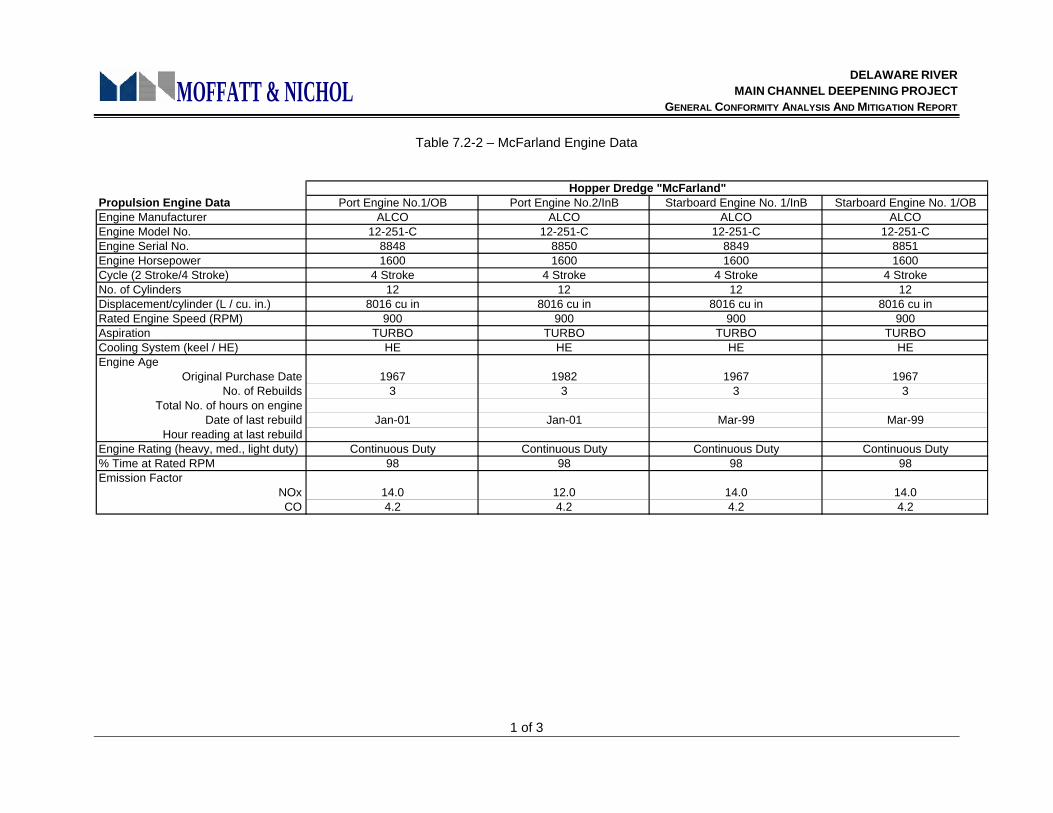
DELAWARE RIVER MAIN CHANNEL DEEPENING PROJECT
GENERAL CONFORMITY ANALYSIS AND MITIGATION REPORT
1 of 3
MOFFATT & NICHOL
Table 7.2-2 – McFarland Engine Data
Propulsion Engine Data Port Engine No.1/OB Port Engine No.2/InB Starboard Engine No. 1/InB Starboard Engine No. 1/OBEngine Manufacturer ALCO ALCO ALCO ALCOEngine Model No. 12-251-C 12-251-C 12-251-C 12-251-CEngine Serial No. 8848 8850 8849 8851Engine Horsepower 1600 1600 1600 1600Cycle (2 Stroke/4 Stroke) 4 Stroke 4 Stroke 4 Stroke 4 StrokeNo. of Cylinders 12 12 12 12Displacement/cylinder (L / cu. in.) 8016 cu in 8016 cu in 8016 cu in 8016 cu inRated Engine Speed (RPM) 900 900 900 900Aspiration TURBO TURBO TURBO TURBOCooling System (keel / HE) HE HE HE HEEngine Age
Original Purchase Date 1967 1982 1967 1967No. of Rebuilds 3 3 3 3
Total No. of hours on engineDate of last rebuild Jan-01 Jan-01 Mar-99 Mar-99
Hour reading at last rebuildEngine Rating (heavy, med., light duty) Continuous Duty Continuous Duty Continuous Duty Continuous Duty% Time at Rated RPM 98 98 98 98Emission Factor
NOx 14.0 12.0 14.0 14.0CO 4.2 4.2 4.2 4.2
Hopper Dredge "McFarland"
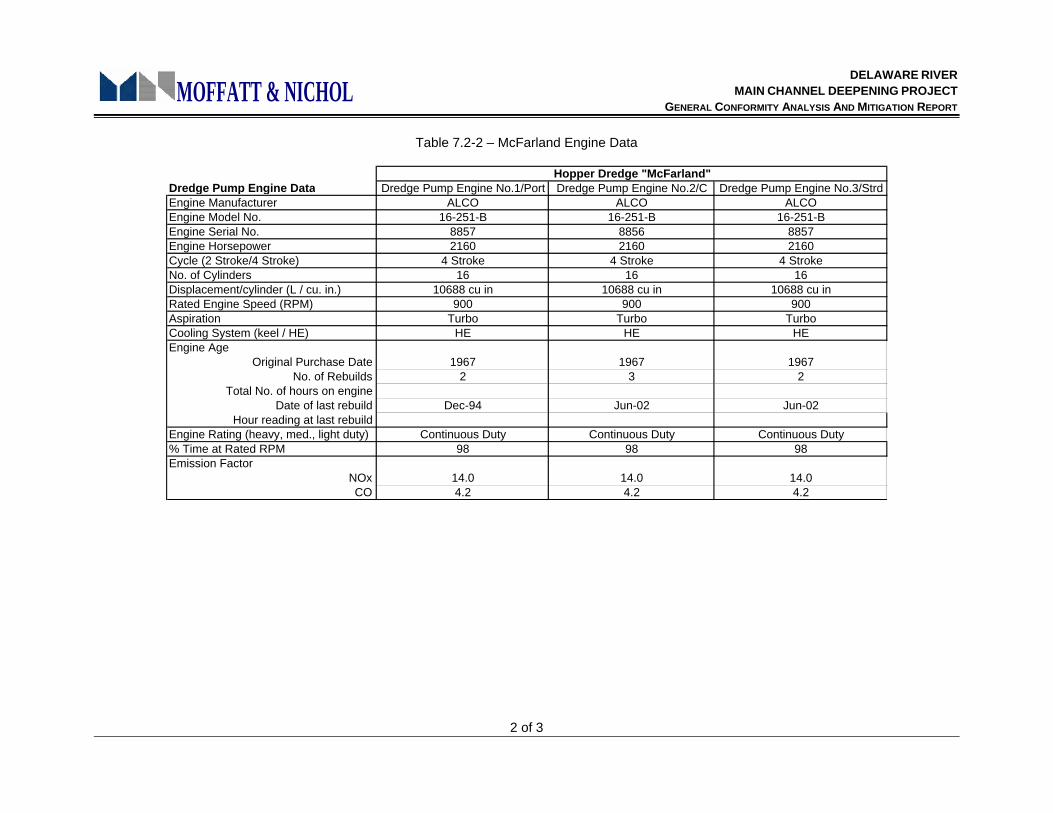
DELAWARE RIVER MAIN CHANNEL DEEPENING PROJECT
GENERAL CONFORMITY ANALYSIS AND MITIGATION REPORT
2 of 3
MOFFATT & NICHOL
Table 7.2-2 – McFarland Engine Data
Dredge Pump Engine Data Dredge Pump Engine No.1/Port Dredge Pump Engine No.2/C Dredge Pump Engine No.3/StrdEngine Manufacturer ALCO ALCO ALCOEngine Model No. 16-251-B 16-251-B 16-251-BEngine Serial No. 8857 8856 8857Engine Horsepower 2160 2160 2160Cycle (2 Stroke/4 Stroke) 4 Stroke 4 Stroke 4 StrokeNo. of Cylinders 16 16 16Displacement/cylinder (L / cu. in.) 10688 cu in 10688 cu in 10688 cu inRated Engine Speed (RPM) 900 900 900Aspiration Turbo Turbo TurboCooling System (keel / HE) HE HE HEEngine Age
Original Purchase Date 1967 1967 1967No. of Rebuilds 2 3 2
Total No. of hours on engineDate of last rebuild Dec-94 Jun-02 Jun-02
Hour reading at last rebuildEngine Rating (heavy, med., light duty) Continuous Duty Continuous Duty Continuous Duty% Time at Rated RPM 98 98 98Emission Factor
NOx 14.0 14.0 14.0CO 4.2 4.2 4.2
Hopper Dredge "McFarland"
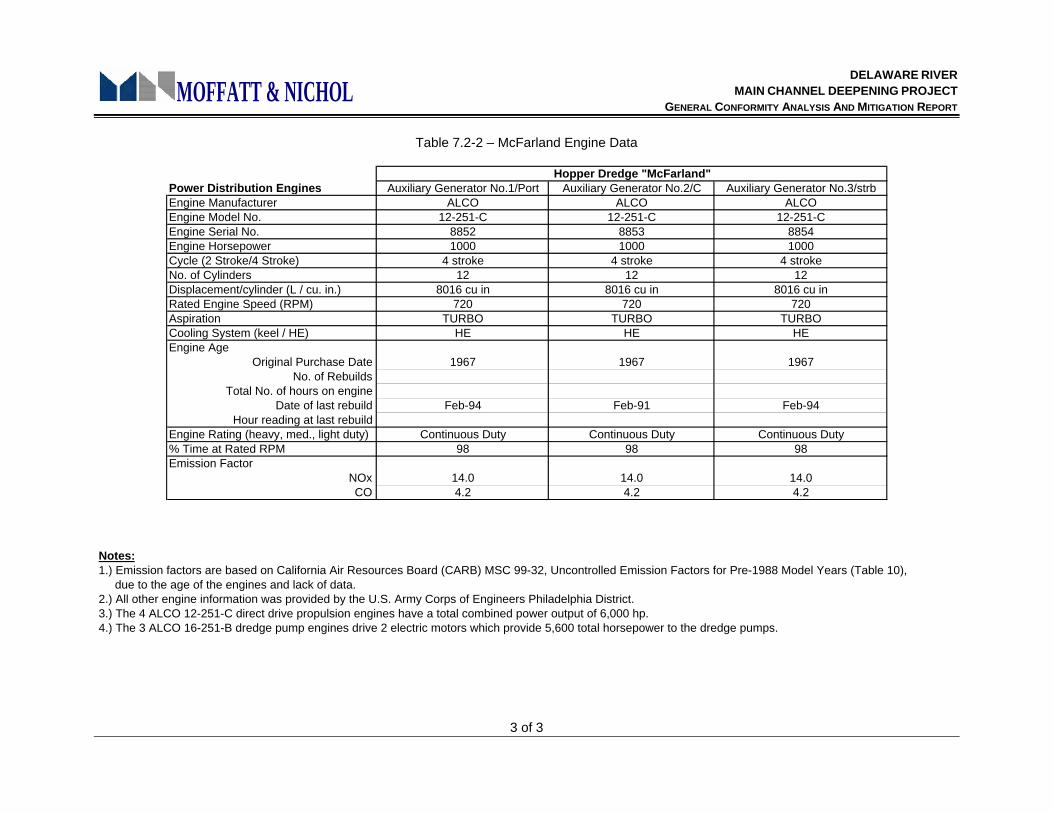
DELAWARE RIVER MAIN CHANNEL DEEPENING PROJECT
GENERAL CONFORMITY ANALYSIS AND MITIGATION REPORT
3 of 3
MOFFATT & NICHOL
Table 7.2-2 – McFarland Engine Data
Power Distribution Engines Auxiliary Generator No.1/Port Auxiliary Generator No.2/C Auxiliary Generator No.3/strbEngine Manufacturer ALCO ALCO ALCOEngine Model No. 12-251-C 12-251-C 12-251-CEngine Serial No. 8852 8853 8854Engine Horsepower 1000 1000 1000Cycle (2 Stroke/4 Stroke) 4 stroke 4 stroke 4 strokeNo. of Cylinders 12 12 12Displacement/cylinder (L / cu. in.) 8016 cu in 8016 cu in 8016 cu inRated Engine Speed (RPM) 720 720 720Aspiration TURBO TURBO TURBOCooling System (keel / HE) HE HE HEEngine Age
Original Purchase Date 1967 1967 1967No. of Rebuilds
Total No. of hours on engineDate of last rebuild Feb-94 Feb-91 Feb-94
Hour reading at last rebuildEngine Rating (heavy, med., light duty) Continuous Duty Continuous Duty Continuous Duty% Time at Rated RPM 98 98 98Emission Factor
NOx 14.0 14.0 14.0CO 4.2 4.2 4.2
Hopper Dredge "McFarland"
Notes:1.) Emission factors are based on California Air Resources Board (CARB) MSC 99-32, Uncontrolled Emission Factors for Pre-1988 Model Years (Table 10), due to the age of the engines and lack of data.2.) All other engine information was provided by the U.S. Army Corps of Engineers Philadelphia District.3.) The 4 ALCO 12-251-C direct drive propulsion engines have a total combined power output of 6,000 hp.4.) The 3 ALCO 16-251-B dredge pump engines drive 2 electric motors which provide 5,600 total horsepower to the dredge pumps.
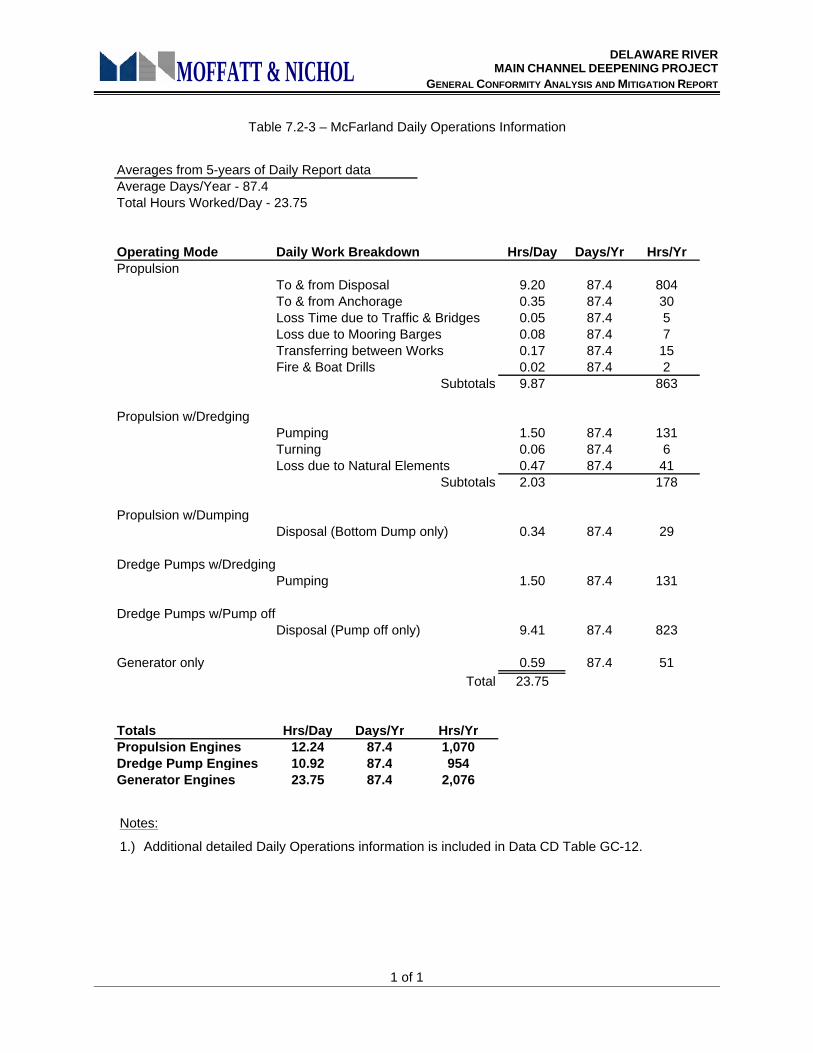
DELAWARE RIVER MAIN CHANNEL DEEPENING PROJECT
GENERAL CONFORMITY ANALYSIS AND MITIGATION REPORT
1 of 1
MOFFATT & NICHOL
Table 7.2-3 – McFarland Daily Operations Information
Averages from 5-years of Daily Report dataAverage Days/Year - 87.4Total Hours Worked/Day - 23.75
Operating Mode Daily Work Breakdown Hrs/Day Days/Yr Hrs/YrPropulsion
To & from Disposal 9.20 87.4 804To & from Anchorage 0.35 87.4 30Loss Time due to Traffic & Bridges 0.05 87.4 5Loss due to Mooring Barges 0.08 87.4 7Transferring between Works 0.17 87.4 15Fire & Boat Drills 0.02 87.4 2
Subtotals 9.87 863
Propulsion w/DredgingPumping 1.50 87.4 131Turning 0.06 87.4 6Loss due to Natural Elements 0.47 87.4 41
Subtotals 2.03 178
Propulsion w/DumpingDisposal (Bottom Dump only) 0.34 87.4 29
Dredge Pumps w/DredgingPumping 1.50 87.4 131
Dredge Pumps w/Pump offDisposal (Pump off only) 9.41 87.4 823
Generator only 0.59 87.4 51Total 23.75
Totals Hrs/Day Days/Yr Hrs/YrPropulsion Engines 12.24 87.4 1,070Dredge Pump Engines 10.92 87.4 954Generator Engines 23.75 87.4 2,076
Notes:
1.) Additional detailed Daily Operations information is included in Data CD Table GC-12.
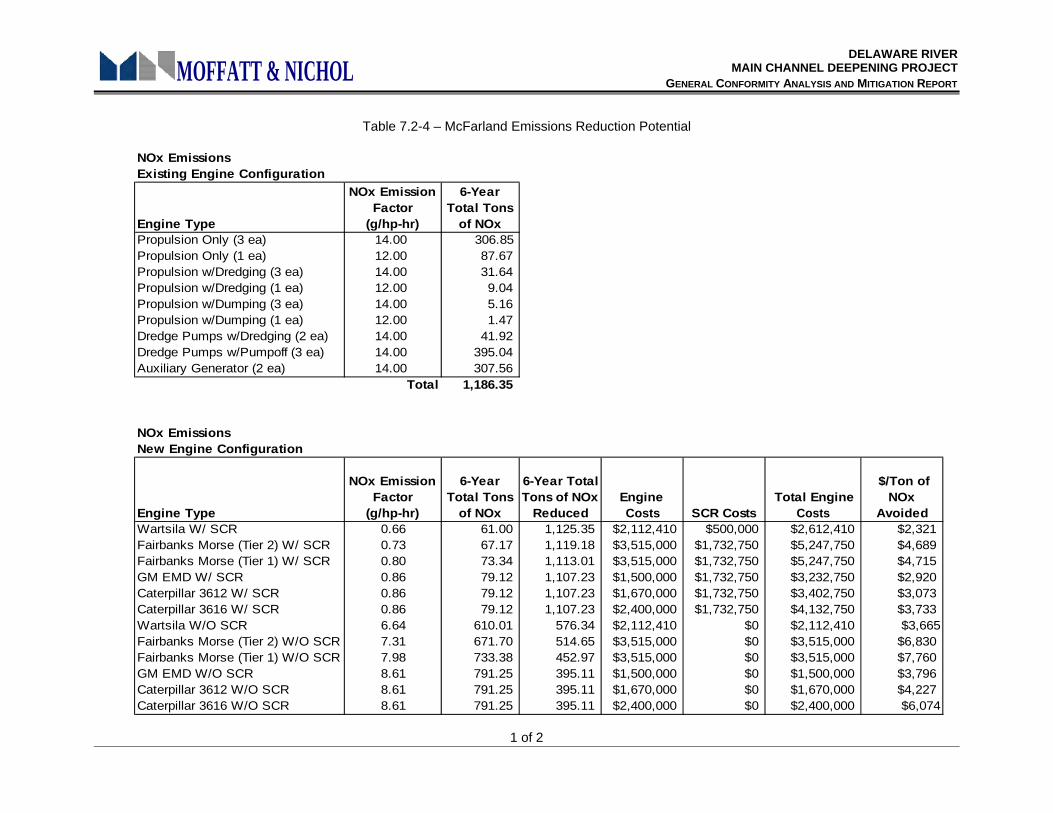
DELAWARE RIVER MAIN CHANNEL DEEPENING PROJECT
GENERAL CONFORMITY ANALYSIS AND MITIGATION REPORT
1 of 2
MOFFATT & NICHOL
Table 7.2-4 – McFarland Emissions Reduction Potential
NOx EmissionsExisting Engine Configuration
Engine Type
NOx Emission Factor
(g/hp-hr)
6-Year Total Tons
of NOxPropulsion Only (3 ea) 14.00 306.85 Propulsion Only (1 ea) 12.00 87.67 Propulsion w/Dredging (3 ea) 14.00 31.64 Propulsion w/Dredging (1 ea) 12.00 9.04 Propulsion w/Dumping (3 ea) 14.00 5.16 Propulsion w/Dumping (1 ea) 12.00 1.47 Dredge Pumps w/Dredging (2 ea) 14.00 41.92 Dredge Pumps w/Pumpoff (3 ea) 14.00 395.04 Auxiliary Generator (2 ea) 14.00 307.56
Total 1,186.35
NOx EmissionsNew Engine Configuration
Engine Type
NOx Emission Factor
(g/hp-hr)
6-Year Total Tons
of NOx
6-Year Total Tons of NOx
ReducedEngine Costs SCR Costs
Total Engine Costs
$/Ton of NOx
Avoided Wartsila W/ SCR 0.66 61.00 1,125.35 $2,112,410 $500,000 $2,612,410 $2,321Fairbanks Morse (Tier 2) W/ SCR 0.73 67.17 1,119.18 $3,515,000 $1,732,750 $5,247,750 $4,689Fairbanks Morse (Tier 1) W/ SCR 0.80 73.34 1,113.01 $3,515,000 $1,732,750 $5,247,750 $4,715GM EMD W/ SCR 0.86 79.12 1,107.23 $1,500,000 $1,732,750 $3,232,750 $2,920Caterpillar 3612 W/ SCR 0.86 79.12 1,107.23 $1,670,000 $1,732,750 $3,402,750 $3,073Caterpillar 3616 W/ SCR 0.86 79.12 1,107.23 $2,400,000 $1,732,750 $4,132,750 $3,733Wartsila W/O SCR 6.64 610.01 576.34 $2,112,410 $0 $2,112,410 $3,665Fairbanks Morse (Tier 2) W/O SCR 7.31 671.70 514.65 $3,515,000 $0 $3,515,000 $6,830Fairbanks Morse (Tier 1) W/O SCR 7.98 733.38 452.97 $3,515,000 $0 $3,515,000 $7,760GM EMD W/O SCR 8.61 791.25 395.11 $1,500,000 $0 $1,500,000 $3,796Caterpillar 3612 W/O SCR 8.61 791.25 395.11 $1,670,000 $0 $1,670,000 $4,227Caterpillar 3616 W/O SCR 8.61 791.25 395.11 $2,400,000 $0 $2,400,000 $6,074
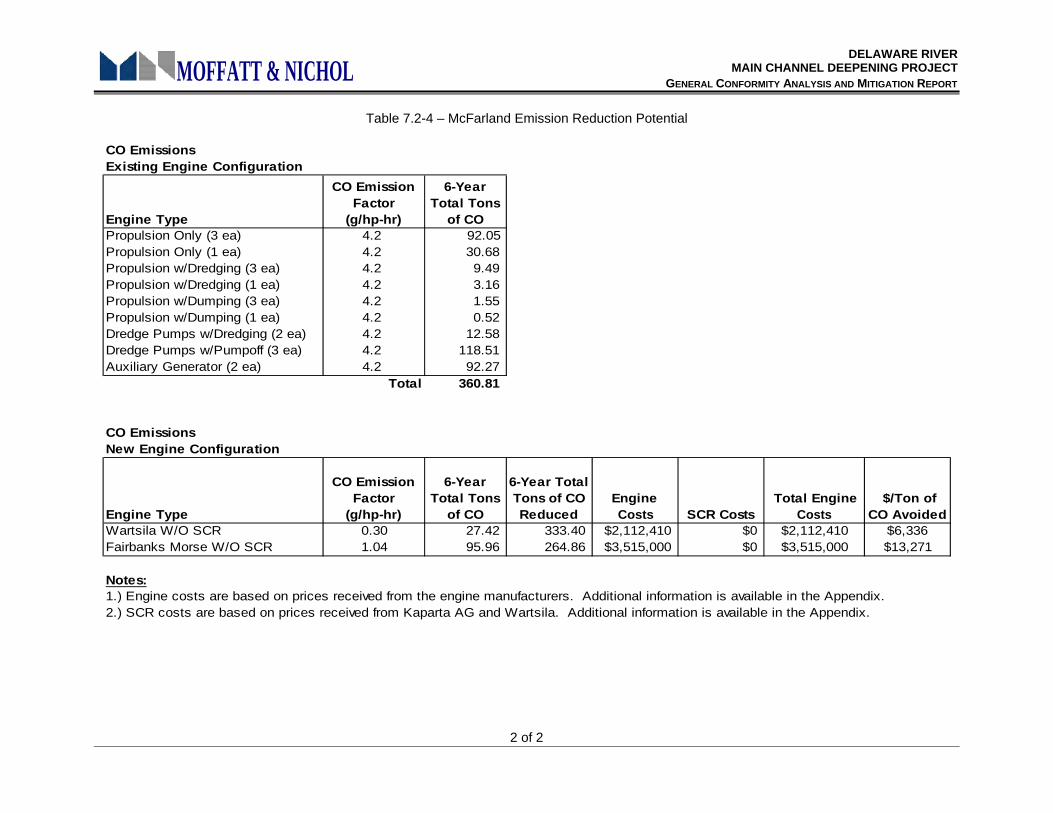
DELAWARE RIVER MAIN CHANNEL DEEPENING PROJECT
GENERAL CONFORMITY ANALYSIS AND MITIGATION REPORT
2 of 2
MOFFATT & NICHOL
Table 7.2-4 – McFarland Emission Reduction Potential
CO EmissionsExisting Engine Configuration
Engine Type
CO Emission Factor
(g/hp-hr)
6-Year Total Tons
of COPropulsion Only (3 ea) 4.2 92.05 Propulsion Only (1 ea) 4.2 30.68 Propulsion w/Dredging (3 ea) 4.2 9.49 Propulsion w/Dredging (1 ea) 4.2 3.16 Propulsion w/Dumping (3 ea) 4.2 1.55 Propulsion w/Dumping (1 ea) 4.2 0.52 Dredge Pumps w/Dredging (2 ea) 4.2 12.58 Dredge Pumps w/Pumpoff (3 ea) 4.2 118.51 Auxiliary Generator (2 ea) 4.2 92.27
Total 360.81
CO EmissionsNew Engine Configuration
Engine Type
CO Emission Factor
(g/hp-hr)
6-Year Total Tons
of CO
6-Year Total Tons of CO Reduced
Engine Costs SCR Costs
Total Engine Costs
$/Ton of CO Avoided
Wartsila W/O SCR 0.30 27.42 333.40 $2,112,410 $0 $2,112,410 $6,336Fairbanks Morse W/O SCR 1.04 95.96 264.86 $3,515,000 $0 $3,515,000 $13,271
Notes:1.) Engine costs are based on prices received from the engine manufacturers. Additional information is available in the Appendix.2.) SCR costs are based on prices received from Kaparta AG and Wartsila. Additional information is available in the Appendix.
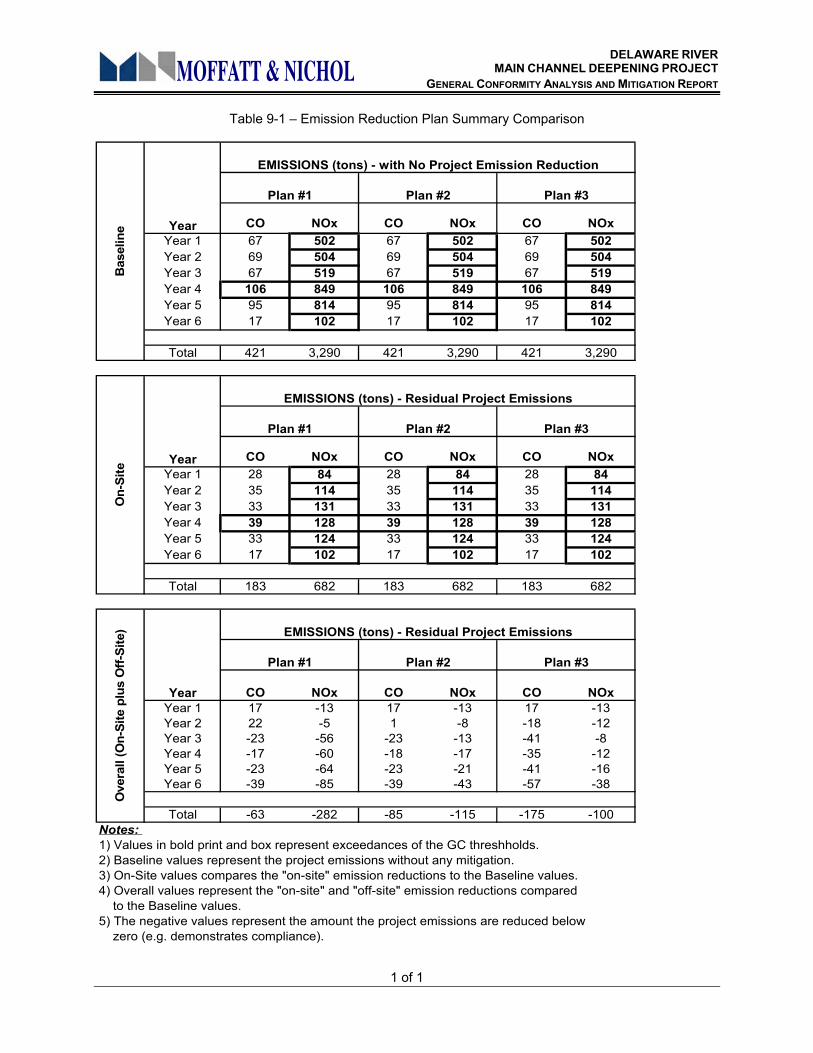
DELAWARE RIVER MAIN CHANNEL DEEPENING PROJECT
GENERAL CONFORMITY ANALYSIS AND MITIGATION REPORT
1 of 1
MOFFATT & NICHOL Table 9-1 – Emission Reduction Plan Summary Comparison
CO NOx CO NOx CO NOxYear 1 67 502 67 502 67 502Year 2 69 504 69 504 69 504Year 3 67 519 67 519 67 519Year 4 106 849 106 849 106 849Year 5 95 814 95 814 95 814Year 6 17 102 17 102 17 102
Total 421 3,290 421 3,290 421 3,290
CO NOx CO NOx CO NOxYear 1 28 84 28 84 28 84Year 2 35 114 35 114 35 114Year 3 33 131 33 131 33 131Year 4 39 128 39 128 39 128Year 5 33 124 33 124 33 124Year 6 17 102 17 102 17 102
Total 183 682 183 682 183 682
CO NOx CO NOx CO NOxYear 1 17 -13 17 -13 17 -13Year 2 22 -5 1 -8 -18 -12Year 3 -23 -56 -23 -13 -41 -8Year 4 -17 -60 -18 -17 -35 -12Year 5 -23 -64 -23 -21 -41 -16Year 6 -39 -85 -39 -43 -57 -38
Total -63 -282 -85 -115 -175 -100Notes: 1) Values in bold print and box represent exceedances of the GC threshholds.2) Baseline values represent the project emissions without any mitigation.3) On-Site values compares the "on-site" emission reductions to the Baseline values.4) Overall values represent the "on-site" and "off-site" emission reductions compared to the Baseline values.5) The negative values represent the amount the project emissions are reduced below zero (e.g. demonstrates compliance).
Year
Year
Year
Bas
elin
eO
n-Si
te
Ove
rall
(On-
Site
plu
s O
ff-Si
te)
Plan #2 Plan #3
EMISSIONS (tons) - with No Project Emission Reduction
Plan #1
EMISSIONS (tons) - Residual Project Emissions
Plan #1 Plan #2 Plan #3
EMISSIONS (tons) - Residual Project Emissions
Plan #1 Plan #2 Plan #3
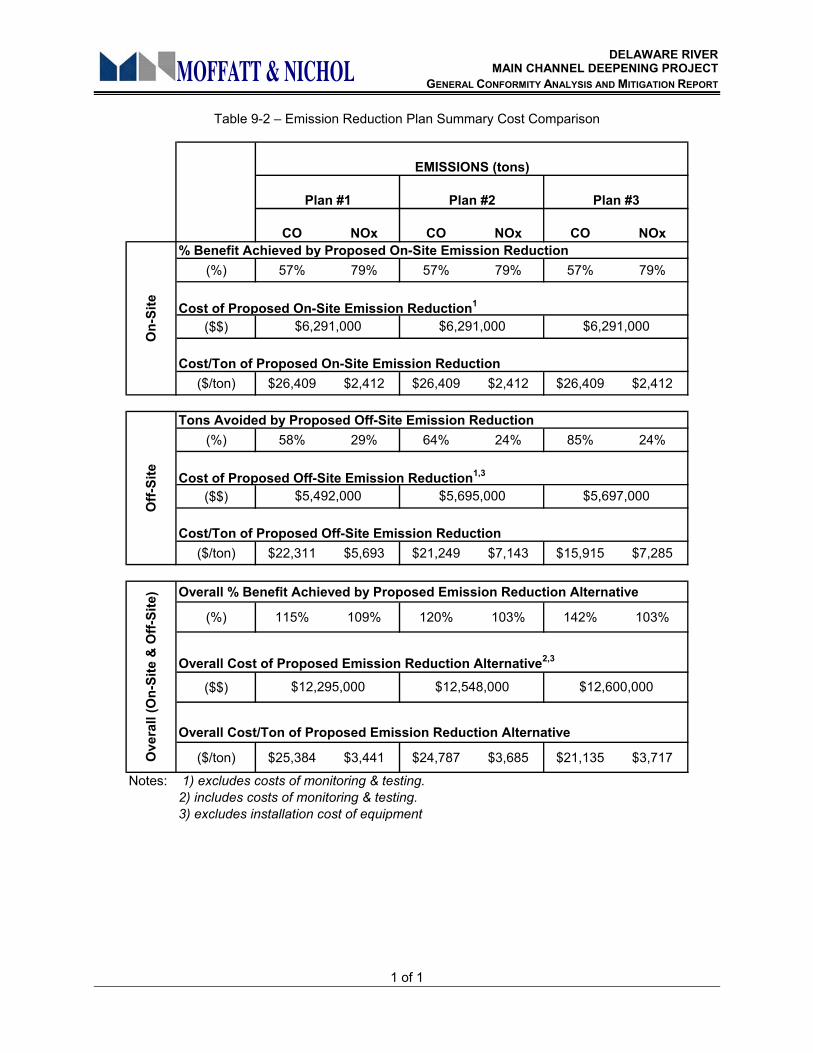
DELAWARE RIVER MAIN CHANNEL DEEPENING PROJECT
GENERAL CONFORMITY ANALYSIS AND MITIGATION REPORT
1 of 1
MOFFATT & NICHOL Table 9-2 – Emission Reduction Plan Summary Cost Comparison
CO NOx CO NOx CO NOx% Benefit Achieved by Proposed On-Site Emission Reduction
(%) 57% 79% 57% 79% 57% 79%
Cost of Proposed On-Site Emission Reduction1
($$)
Cost/Ton of Proposed On-Site Emission Reduction($/ton) $26,409 $2,412 $26,409 $2,412 $26,409 $2,412
Tons Avoided by Proposed Off-Site Emission Reduction(%) 58% 29% 64% 24% 85% 24%
Cost of Proposed Off-Site Emission Reduction1,3
($$)
Cost/Ton of Proposed Off-Site Emission Reduction($/ton) $22,311 $5,693 $21,249 $7,143 $15,915 $7,285
Overall % Benefit Achieved by Proposed Emission Reduction Alternative
(%) 115% 109% 120% 103% 142% 103%
Overall Cost of Proposed Emission Reduction Alternative2,3
($$)
Overall Cost/Ton of Proposed Emission Reduction Alternative
($/ton) $25,384 $3,441 $24,787 $3,685 $21,135 $3,717
Notes: 1) excludes costs of monitoring & testing.2) includes costs of monitoring & testing.3) excludes installation cost of equipment
Off-
Site
Ove
rall
(On-
Site
& O
ff-Si
te)
EMISSIONS (tons)
Plan #1
On-
Site
$6,291,000 $6,291,000 $6,291,000
$12,295,000 $12,548,000 $12,600,000
Plan #2 Plan #3
$5,492,000 $5,695,000 $5,697,000
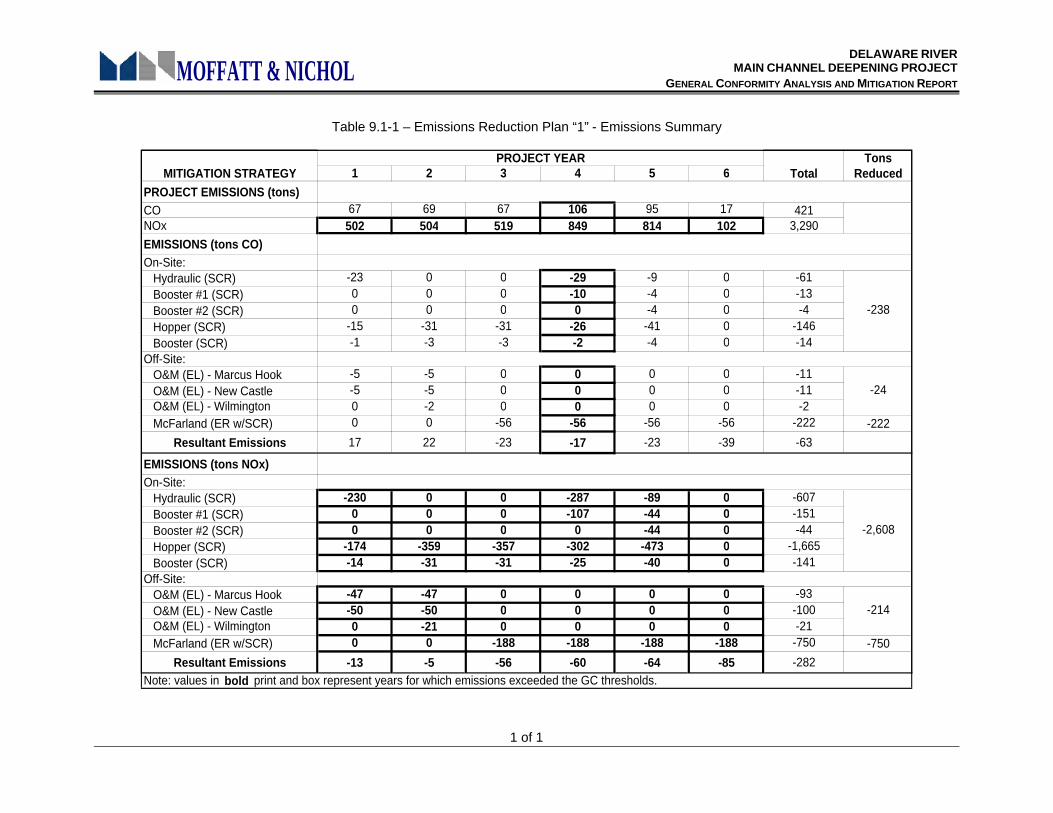
DELAWARE RIVER MAIN CHANNEL DEEPENING PROJECT
GENERAL CONFORMITY ANALYSIS AND MITIGATION REPORT
1 of 1
MOFFATT & NICHOL
Table 9.1-1 – Emissions Reduction Plan “1” - Emissions Summary
1 2 3 4 5 6
PROJECT EMISSIONS (tons)CO 67 69 67 106 95 17 421NOx 502 504 519 849 814 102 3,290
EMISSIONS (tons CO)On-Site:
Hydraulic (SCR) -23 0 0 -29 -9 0 -61Booster #1 (SCR) 0 0 0 -10 -4 0 -13Booster #2 (SCR) 0 0 0 0 -4 0 -4Hopper (SCR) -15 -31 -31 -26 -41 0 -146Booster (SCR) -1 -3 -3 -2 -4 0 -14
Off-Site:O&M (EL) - Marcus Hook -5 -5 0 0 0 0 -11O&M (EL) - New Castle -5 -5 0 0 0 0 -11O&M (EL) - Wilmington 0 -2 0 0 0 0 -2McFarland (ER w/SCR) 0 0 -56 -56 -56 -56 -222 -222
Resultant Emissions 17 22 -23 -17 -23 -39 -63
EMISSIONS (tons NOx)On-Site:
Hydraulic (SCR) -230 0 0 -287 -89 0 -607Booster #1 (SCR) 0 0 0 -107 -44 0 -151Booster #2 (SCR) 0 0 0 0 -44 0 -44Hopper (SCR) -174 -359 -357 -302 -473 0 -1,665Booster (SCR) -14 -31 -31 -25 -40 0 -141
Off-Site:O&M (EL) - Marcus Hook -47 -47 0 0 0 0 -93O&M (EL) - New Castle -50 -50 0 0 0 0 -100O&M (EL) - Wilmington 0 -21 0 0 0 0 -21McFarland (ER w/SCR) 0 0 -188 -188 -188 -188 -750 -750
Resultant Emissions -13 -5 -56 -60 -64 -85 -282
MITIGATION STRATEGYPROJECT YEAR
Total
-24
Note: values in bold print and box represent years for which emissions exceeded the GC thresholds.
-214
-2,608
-238
Tons Reduced
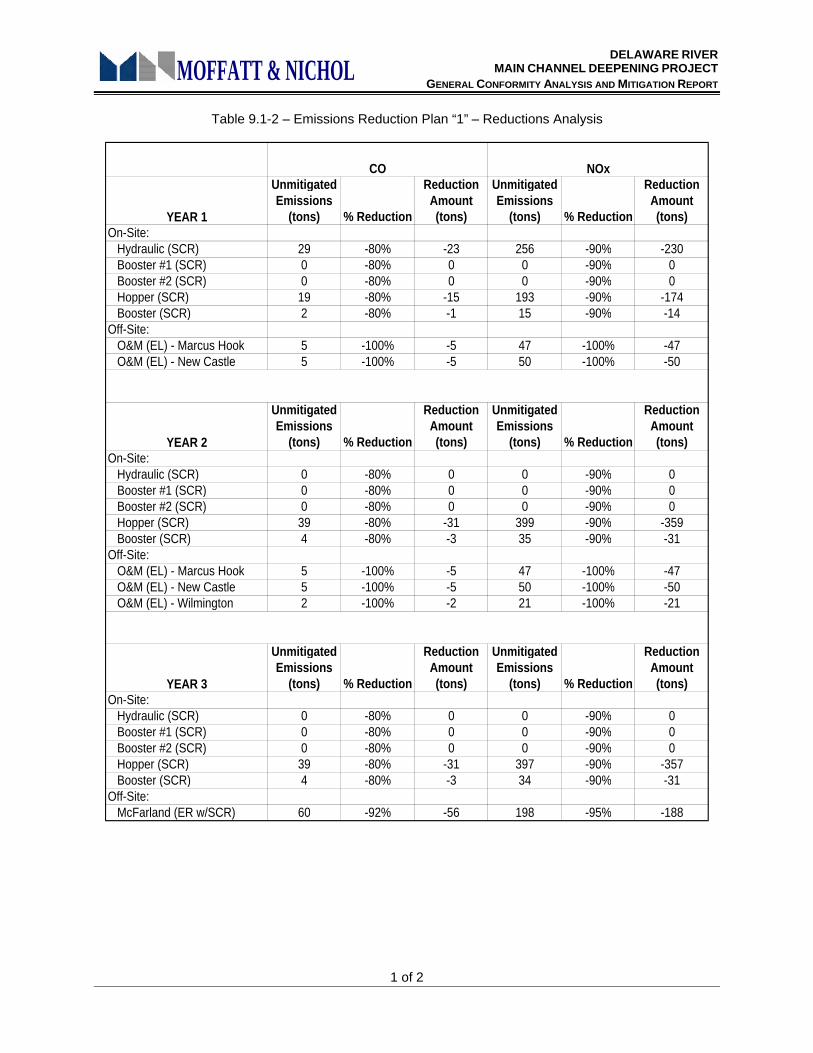
DELAWARE RIVER MAIN CHANNEL DEEPENING PROJECT
GENERAL CONFORMITY ANALYSIS AND MITIGATION REPORT
1 of 2
MOFFATT & NICHOL
Table 9.1-2 – Emissions Reduction Plan “1” – Reductions Analysis
YEAR 1
Unmitigated Emissions
(tons) % Reduction
Reduction Amount (tons)
Unmitigated Emissions
(tons) % Reduction
Reduction Amount (tons)
On-Site:Hydraulic (SCR) 29 -80% -23 256 -90% -230Booster #1 (SCR) 0 -80% 0 0 -90% 0Booster #2 (SCR) 0 -80% 0 0 -90% 0Hopper (SCR) 19 -80% -15 193 -90% -174Booster (SCR) 2 -80% -1 15 -90% -14
Off-Site:O&M (EL) - Marcus Hook 5 -100% -5 47 -100% -47O&M (EL) - New Castle 5 -100% -5 50 -100% -50
YEAR 2
Unmitigated Emissions
(tons) % Reduction
Reduction Amount (tons)
Unmitigated Emissions
(tons) % Reduction
Reduction Amount (tons)
On-Site:Hydraulic (SCR) 0 -80% 0 0 -90% 0Booster #1 (SCR) 0 -80% 0 0 -90% 0Booster #2 (SCR) 0 -80% 0 0 -90% 0Hopper (SCR) 39 -80% -31 399 -90% -359Booster (SCR) 4 -80% -3 35 -90% -31
Off-Site:O&M (EL) - Marcus Hook 5 -100% -5 47 -100% -47O&M (EL) - New Castle 5 -100% -5 50 -100% -50O&M (EL) - Wilmington 2 -100% -2 21 -100% -21
YEAR 3
Unmitigated Emissions
(tons) % Reduction
Reduction Amount (tons)
Unmitigated Emissions
(tons) % Reduction
Reduction Amount (tons)
On-Site:Hydraulic (SCR) 0 -80% 0 0 -90% 0Booster #1 (SCR) 0 -80% 0 0 -90% 0Booster #2 (SCR) 0 -80% 0 0 -90% 0Hopper (SCR) 39 -80% -31 397 -90% -357Booster (SCR) 4 -80% -3 34 -90% -31
Off-Site:McFarland (ER w/SCR) 60 -92% -56 198 -95% -188
NOxCO
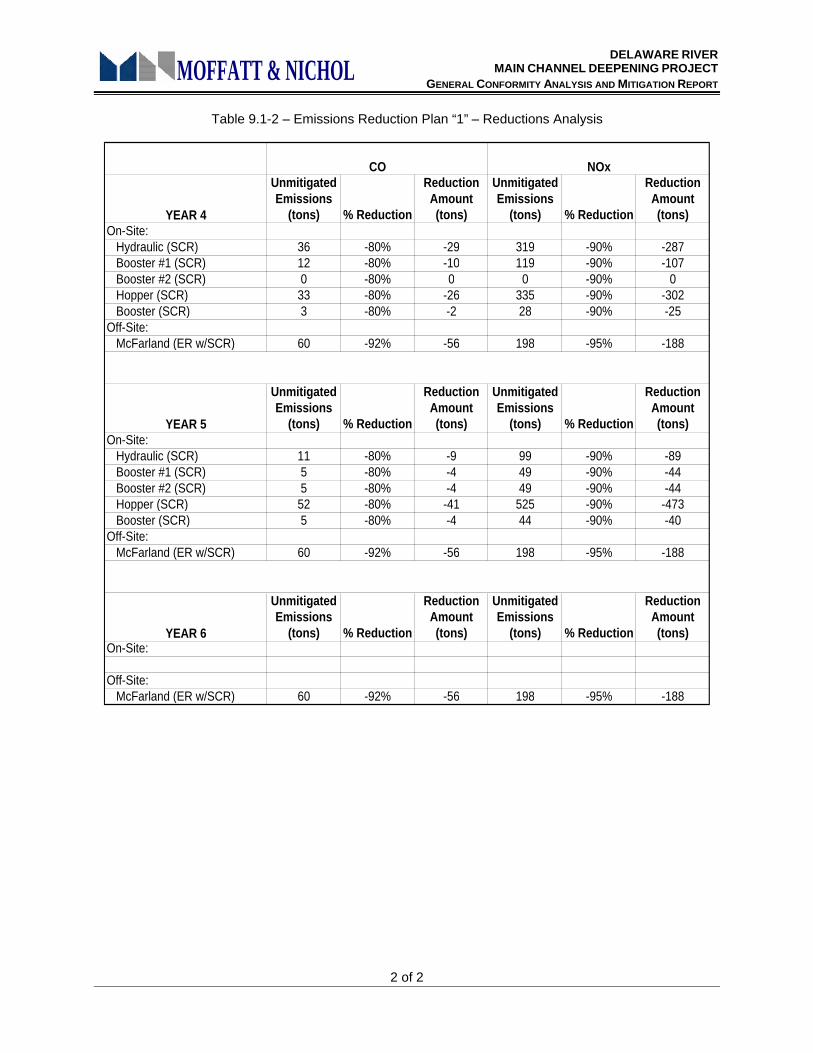
DELAWARE RIVER MAIN CHANNEL DEEPENING PROJECT
GENERAL CONFORMITY ANALYSIS AND MITIGATION REPORT
2 of 2
MOFFATT & NICHOL
Table 9.1-2 – Emissions Reduction Plan “1” – Reductions Analysis
YEAR 4
Unmitigated Emissions
(tons) % Reduction
Reduction Amount (tons)
Unmitigated Emissions
(tons) % Reduction
Reduction Amount (tons)
On-Site:Hydraulic (SCR) 36 -80% -29 319 -90% -287Booster #1 (SCR) 12 -80% -10 119 -90% -107Booster #2 (SCR) 0 -80% 0 0 -90% 0Hopper (SCR) 33 -80% -26 335 -90% -302Booster (SCR) 3 -80% -2 28 -90% -25
Off-Site:McFarland (ER w/SCR) 60 -92% -56 198 -95% -188
YEAR 5
Unmitigated Emissions
(tons) % Reduction
Reduction Amount (tons)
Unmitigated Emissions
(tons) % Reduction
Reduction Amount (tons)
On-Site:Hydraulic (SCR) 11 -80% -9 99 -90% -89Booster #1 (SCR) 5 -80% -4 49 -90% -44Booster #2 (SCR) 5 -80% -4 49 -90% -44Hopper (SCR) 52 -80% -41 525 -90% -473Booster (SCR) 5 -80% -4 44 -90% -40
Off-Site:McFarland (ER w/SCR) 60 -92% -56 198 -95% -188
YEAR 6
Unmitigated Emissions
(tons) % Reduction
Reduction Amount (tons)
Unmitigated Emissions
(tons) % Reduction
Reduction Amount (tons)
On-Site:
Off-Site:McFarland (ER w/SCR) 60 -92% -56 198 -95% -188
CO NOx
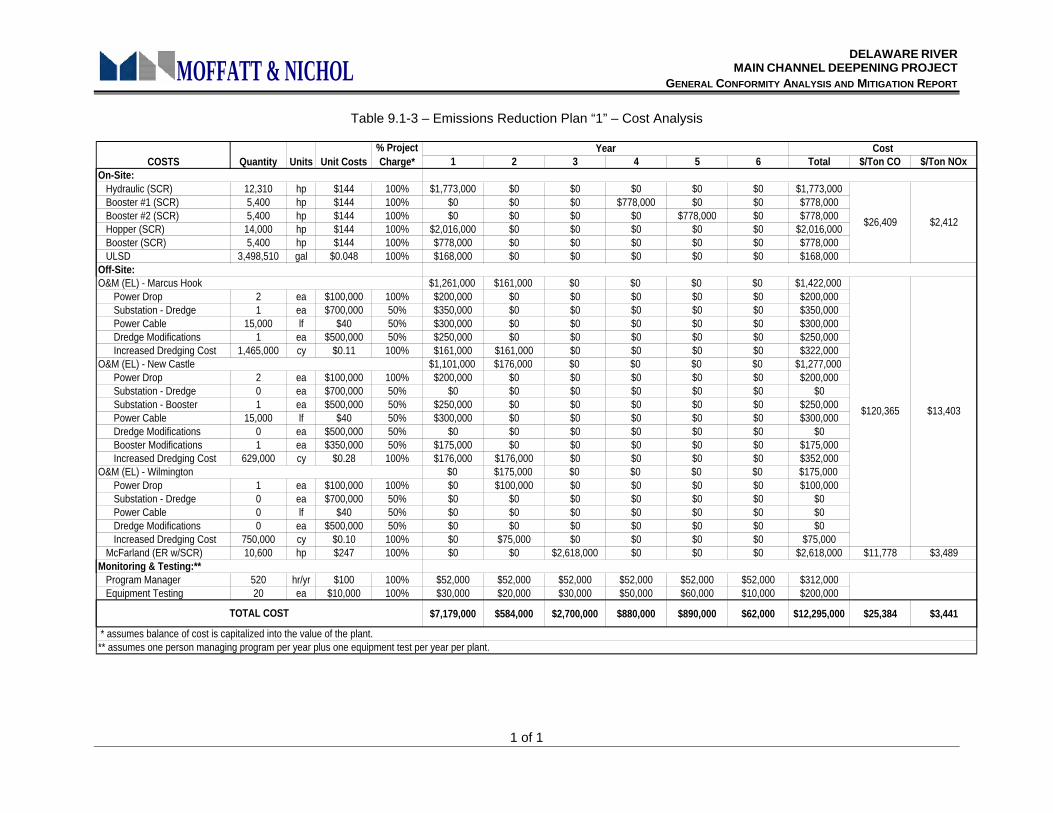
DELAWARE RIVER MAIN CHANNEL DEEPENING PROJECT
GENERAL CONFORMITY ANALYSIS AND MITIGATION REPORT
1 of 1
MOFFATT & NICHOL
Table 9.1-3 – Emissions Reduction Plan “1” – Cost Analysis
1 2 3 4 5 6 Total $/Ton CO $/Ton NOx
Hydraulic (SCR) 12,310 hp $144 100% $1,773,000 $0 $0 $0 $0 $0 $1,773,000Booster #1 (SCR) 5,400 hp $144 100% $0 $0 $0 $778,000 $0 $0 $778,000Booster #2 (SCR) 5,400 hp $144 100% $0 $0 $0 $0 $778,000 $0 $778,000Hopper (SCR) 14,000 hp $144 100% $2,016,000 $0 $0 $0 $0 $0 $2,016,000Booster (SCR) 5,400 hp $144 100% $778,000 $0 $0 $0 $0 $0 $778,000ULSD 3,498,510 gal $0.048 100% $168,000 $0 $0 $0 $0 $0 $168,000
$1,261,000 $161,000 $0 $0 $0 $0 $1,422,000Power Drop 2 ea $100,000 100% $200,000 $0 $0 $0 $0 $0 $200,000Substation - Dredge 1 ea $700,000 50% $350,000 $0 $0 $0 $0 $0 $350,000Power Cable 15,000 lf $40 50% $300,000 $0 $0 $0 $0 $0 $300,000Dredge Modifications 1 ea $500,000 50% $250,000 $0 $0 $0 $0 $0 $250,000Increased Dredging Cost 1,465,000 cy $0.11 100% $161,000 $161,000 $0 $0 $0 $0 $322,000
$1,101,000 $176,000 $0 $0 $0 $0 $1,277,000Power Drop 2 ea $100,000 100% $200,000 $0 $0 $0 $0 $0 $200,000Substation - Dredge 0 ea $700,000 50% $0 $0 $0 $0 $0 $0 $0Substation - Booster 1 ea $500,000 50% $250,000 $0 $0 $0 $0 $0 $250,000Power Cable 15,000 lf $40 50% $300,000 $0 $0 $0 $0 $0 $300,000Dredge Modifications 0 ea $500,000 50% $0 $0 $0 $0 $0 $0 $0Booster Modifications 1 ea $350,000 50% $175,000 $0 $0 $0 $0 $0 $175,000Increased Dredging Cost 629,000 cy $0.28 100% $176,000 $176,000 $0 $0 $0 $0 $352,000
$0 $175,000 $0 $0 $0 $0 $175,000Power Drop 1 ea $100,000 100% $0 $100,000 $0 $0 $0 $0 $100,000Substation - Dredge 0 ea $700,000 50% $0 $0 $0 $0 $0 $0 $0Power Cable 0 lf $40 50% $0 $0 $0 $0 $0 $0 $0Dredge Modifications 0 ea $500,000 50% $0 $0 $0 $0 $0 $0 $0Increased Dredging Cost 750,000 cy $0.10 100% $0 $75,000 $0 $0 $0 $0 $75,000
McFarland (ER w/SCR) 10,600 hp $247 100% $0 $0 $2,618,000 $0 $0 $0 $2,618,000 $11,778 $3,489
Program Manager 520 hr/yr $100 100% $52,000 $52,000 $52,000 $52,000 $52,000 $52,000 $312,000Equipment Testing 20 ea $10,000 100% $30,000 $20,000 $30,000 $50,000 $60,000 $10,000 $200,000
$7,179,000 $584,000 $2,700,000 $880,000 $890,000 $62,000 $12,295,000 $25,384 $3,441
On-Site:
O&M (EL) - Marcus HookOff-Site:
$26,409 $2,412
Monitoring & Testing:**
O&M (EL) - Wilmington
O&M (EL) - New Castle
$120,365 $13,403
** assumes one person managing program per year plus one equipment test per year per plant. * assumes balance of cost is capitalized into the value of the plant.
TOTAL COST
COSTS Quantity Units Unit Costs% Project Charge*
Year Cost
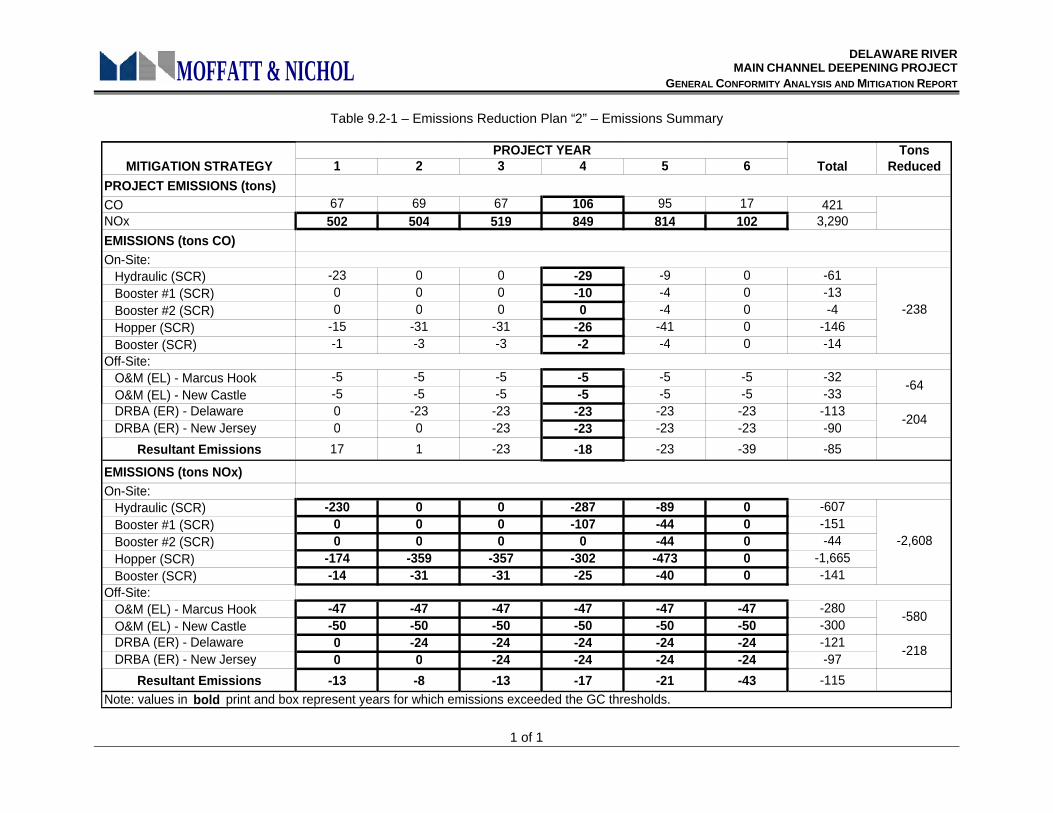
DELAWARE RIVER MAIN CHANNEL DEEPENING PROJECT
GENERAL CONFORMITY ANALYSIS AND MITIGATION REPORT
1 of 1
MOFFATT & NICHOL
Table 9.2-1 – Emissions Reduction Plan “2” – Emissions Summary
1 2 3 4 5 6
PROJECT EMISSIONS (tons)CO 67 69 67 106 95 17 421NOx 502 504 519 849 814 102 3,290
EMISSIONS (tons CO)On-Site:
Hydraulic (SCR) -23 0 0 -29 -9 0 -61Booster #1 (SCR) 0 0 0 -10 -4 0 -13Booster #2 (SCR) 0 0 0 0 -4 0 -4Hopper (SCR) -15 -31 -31 -26 -41 0 -146Booster (SCR) -1 -3 -3 -2 -4 0 -14
Off-Site:O&M (EL) - Marcus Hook -5 -5 -5 -5 -5 -5 -32O&M (EL) - New Castle -5 -5 -5 -5 -5 -5 -33DRBA (ER) - Delaware 0 -23 -23 -23 -23 -23 -113DRBA (ER) - New Jersey 0 0 -23 -23 -23 -23 -90
Resultant Emissions 17 1 -23 -18 -23 -39 -85
EMISSIONS (tons NOx)On-Site:
Hydraulic (SCR) -230 0 0 -287 -89 0 -607Booster #1 (SCR) 0 0 0 -107 -44 0 -151Booster #2 (SCR) 0 0 0 0 -44 0 -44Hopper (SCR) -174 -359 -357 -302 -473 0 -1,665Booster (SCR) -14 -31 -31 -25 -40 0 -141
Off-Site:O&M (EL) - Marcus Hook -47 -47 -47 -47 -47 -47 -280O&M (EL) - New Castle -50 -50 -50 -50 -50 -50 -300DRBA (ER) - Delaware 0 -24 -24 -24 -24 -24 -121DRBA (ER) - New Jersey 0 0 -24 -24 -24 -24 -97
Resultant Emissions -13 -8 -13 -17 -21 -43 -115
MITIGATION STRATEGYPROJECT YEAR
Total
Note: values in bold print and box represent years for which emissions exceeded the GC thresholds.
-2,608
-238
-580
-218
-64
-204
Tons Reduced
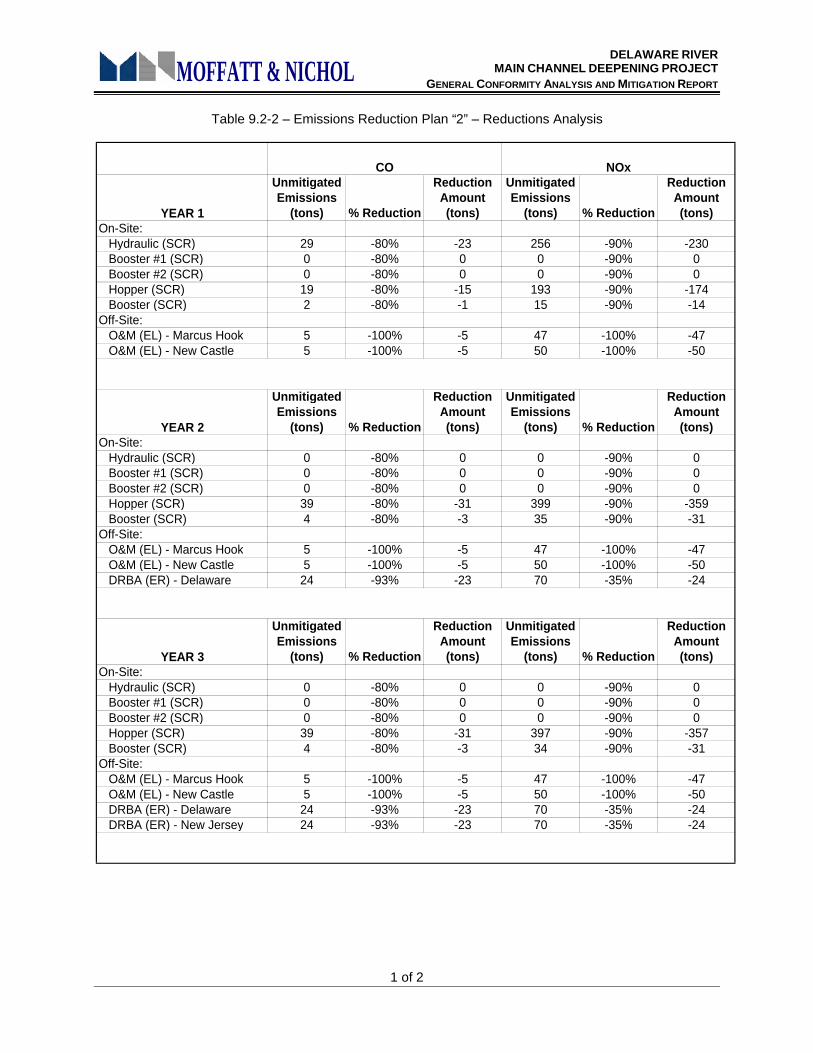
DELAWARE RIVER MAIN CHANNEL DEEPENING PROJECT
GENERAL CONFORMITY ANALYSIS AND MITIGATION REPORT
1 of 2
MOFFATT & NICHOL
Table 9.2-2 – Emissions Reduction Plan “2” – Reductions Analysis
YEAR 1
Unmitigated Emissions
(tons) % Reduction
Reduction Amount (tons)
Unmitigated Emissions
(tons) % Reduction
Reduction Amount (tons)
On-Site:Hydraulic (SCR) 29 -80% -23 256 -90% -230Booster #1 (SCR) 0 -80% 0 0 -90% 0Booster #2 (SCR) 0 -80% 0 0 -90% 0Hopper (SCR) 19 -80% -15 193 -90% -174Booster (SCR) 2 -80% -1 15 -90% -14
Off-Site:O&M (EL) - Marcus Hook 5 -100% -5 47 -100% -47O&M (EL) - New Castle 5 -100% -5 50 -100% -50
YEAR 2
Unmitigated Emissions
(tons) % Reduction
Reduction Amount (tons)
Unmitigated Emissions
(tons) % Reduction
Reduction Amount (tons)
On-Site:Hydraulic (SCR) 0 -80% 0 0 -90% 0Booster #1 (SCR) 0 -80% 0 0 -90% 0Booster #2 (SCR) 0 -80% 0 0 -90% 0Hopper (SCR) 39 -80% -31 399 -90% -359Booster (SCR) 4 -80% -3 35 -90% -31
Off-Site:O&M (EL) - Marcus Hook 5 -100% -5 47 -100% -47O&M (EL) - New Castle 5 -100% -5 50 -100% -50DRBA (ER) - Delaware 24 -93% -23 70 -35% -24
YEAR 3
Unmitigated Emissions
(tons) % Reduction
Reduction Amount (tons)
Unmitigated Emissions
(tons) % Reduction
Reduction Amount (tons)
On-Site:Hydraulic (SCR) 0 -80% 0 0 -90% 0Booster #1 (SCR) 0 -80% 0 0 -90% 0Booster #2 (SCR) 0 -80% 0 0 -90% 0Hopper (SCR) 39 -80% -31 397 -90% -357Booster (SCR) 4 -80% -3 34 -90% -31
Off-Site:O&M (EL) - Marcus Hook 5 -100% -5 47 -100% -47O&M (EL) - New Castle 5 -100% -5 50 -100% -50DRBA (ER) - Delaware 24 -93% -23 70 -35% -24DRBA (ER) - New Jersey 24 -93% -23 70 -35% -24
NOxCO
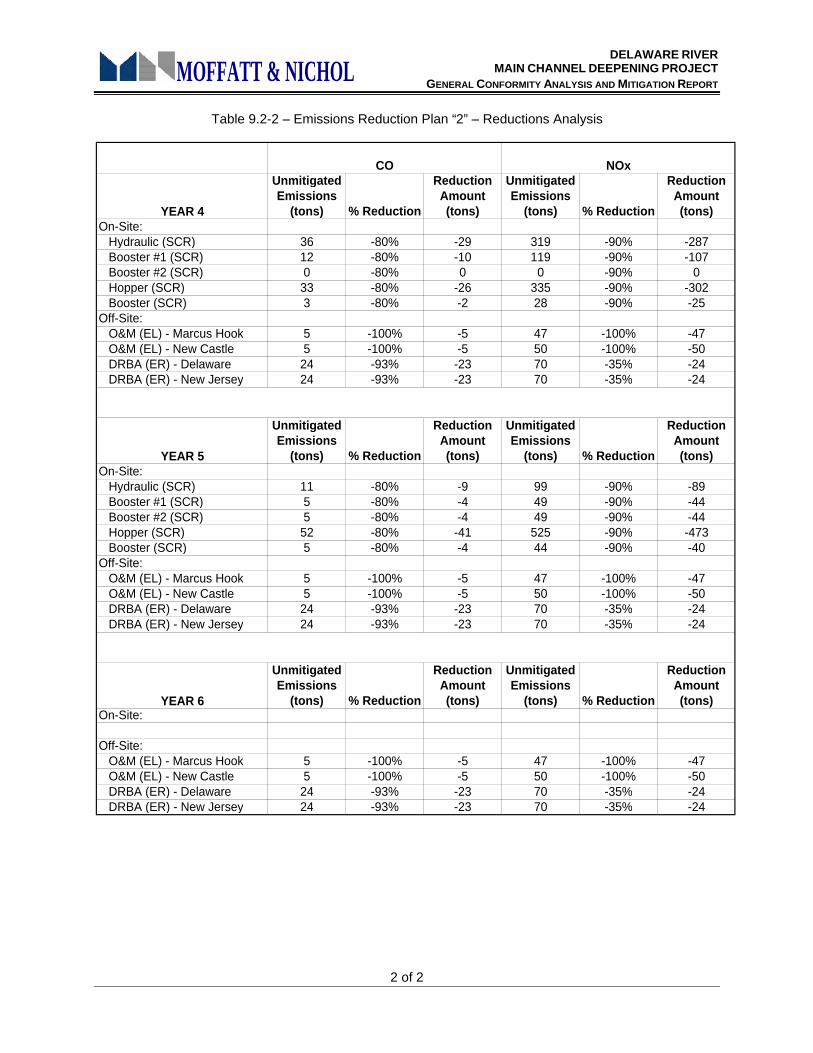
DELAWARE RIVER MAIN CHANNEL DEEPENING PROJECT
GENERAL CONFORMITY ANALYSIS AND MITIGATION REPORT
2 of 2
MOFFATT & NICHOL
Table 9.2-2 – Emissions Reduction Plan “2” – Reductions Analysis
YEAR 4
Unmitigated Emissions
(tons) % Reduction
Reduction Amount (tons)
Unmitigated Emissions
(tons) % Reduction
Reduction Amount (tons)
On-Site:Hydraulic (SCR) 36 -80% -29 319 -90% -287Booster #1 (SCR) 12 -80% -10 119 -90% -107Booster #2 (SCR) 0 -80% 0 0 -90% 0Hopper (SCR) 33 -80% -26 335 -90% -302Booster (SCR) 3 -80% -2 28 -90% -25
Off-Site:O&M (EL) - Marcus Hook 5 -100% -5 47 -100% -47O&M (EL) - New Castle 5 -100% -5 50 -100% -50DRBA (ER) - Delaware 24 -93% -23 70 -35% -24DRBA (ER) - New Jersey 24 -93% -23 70 -35% -24
YEAR 5
Unmitigated Emissions
(tons) % Reduction
Reduction Amount (tons)
Unmitigated Emissions
(tons) % Reduction
Reduction Amount (tons)
On-Site:Hydraulic (SCR) 11 -80% -9 99 -90% -89Booster #1 (SCR) 5 -80% -4 49 -90% -44Booster #2 (SCR) 5 -80% -4 49 -90% -44Hopper (SCR) 52 -80% -41 525 -90% -473Booster (SCR) 5 -80% -4 44 -90% -40
Off-Site:O&M (EL) - Marcus Hook 5 -100% -5 47 -100% -47O&M (EL) - New Castle 5 -100% -5 50 -100% -50DRBA (ER) - Delaware 24 -93% -23 70 -35% -24DRBA (ER) - New Jersey 24 -93% -23 70 -35% -24
YEAR 6
Unmitigated Emissions
(tons) % Reduction
Reduction Amount (tons)
Unmitigated Emissions
(tons) % Reduction
Reduction Amount (tons)
On-Site:
Off-Site:O&M (EL) - Marcus Hook 5 -100% -5 47 -100% -47O&M (EL) - New Castle 5 -100% -5 50 -100% -50DRBA (ER) - Delaware 24 -93% -23 70 -35% -24DRBA (ER) - New Jersey 24 -93% -23 70 -35% -24
CO NOx
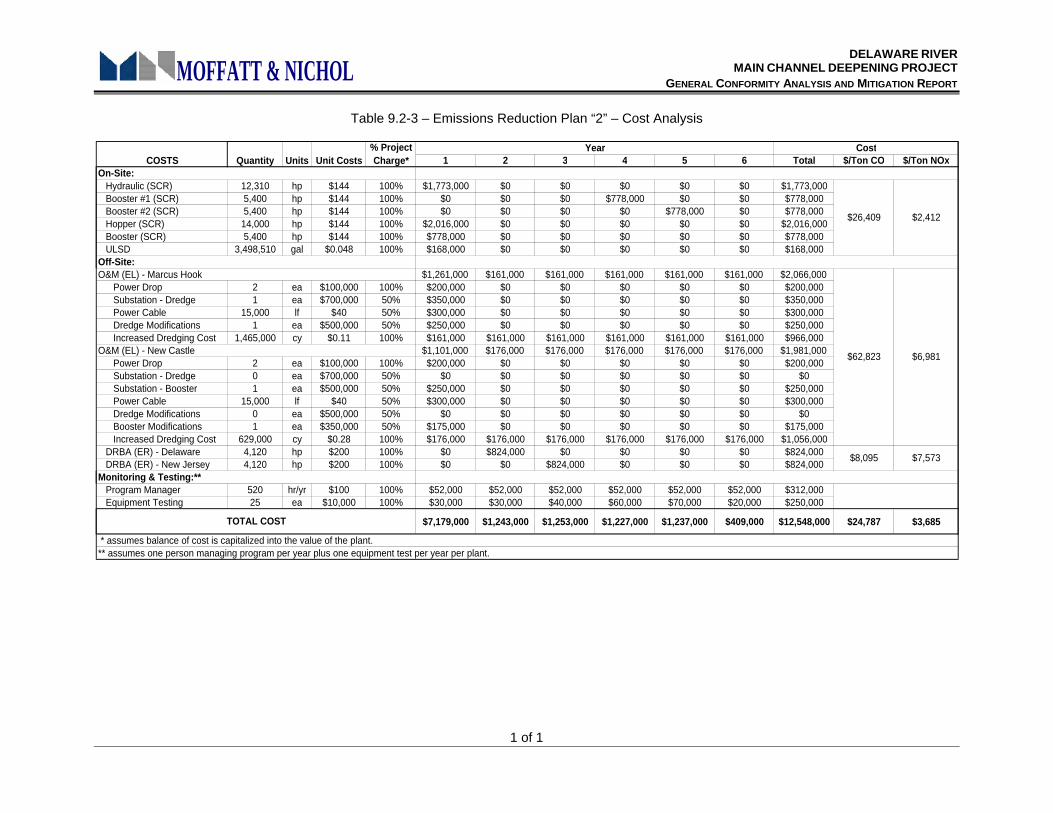
DELAWARE RIVER MAIN CHANNEL DEEPENING PROJECT
GENERAL CONFORMITY ANALYSIS AND MITIGATION REPORT
1 of 1
MOFFATT & NICHOL
Table 9.2-3 – Emissions Reduction Plan “2” – Cost Analysis
1 2 3 4 5 6 Total $/Ton CO $/Ton NOx
Hydraulic (SCR) 12,310 hp $144 100% $1,773,000 $0 $0 $0 $0 $0 $1,773,000Booster #1 (SCR) 5,400 hp $144 100% $0 $0 $0 $778,000 $0 $0 $778,000Booster #2 (SCR) 5,400 hp $144 100% $0 $0 $0 $0 $778,000 $0 $778,000Hopper (SCR) 14,000 hp $144 100% $2,016,000 $0 $0 $0 $0 $0 $2,016,000Booster (SCR) 5,400 hp $144 100% $778,000 $0 $0 $0 $0 $0 $778,000ULSD 3,498,510 gal $0.048 100% $168,000 $0 $0 $0 $0 $0 $168,000
$1,261,000 $161,000 $161,000 $161,000 $161,000 $161,000 $2,066,000Power Drop 2 ea $100,000 100% $200,000 $0 $0 $0 $0 $0 $200,000Substation - Dredge 1 ea $700,000 50% $350,000 $0 $0 $0 $0 $0 $350,000Power Cable 15,000 lf $40 50% $300,000 $0 $0 $0 $0 $0 $300,000Dredge Modifications 1 ea $500,000 50% $250,000 $0 $0 $0 $0 $0 $250,000Increased Dredging Cost 1,465,000 cy $0.11 100% $161,000 $161,000 $161,000 $161,000 $161,000 $161,000 $966,000
$1,101,000 $176,000 $176,000 $176,000 $176,000 $176,000 $1,981,000Power Drop 2 ea $100,000 100% $200,000 $0 $0 $0 $0 $0 $200,000Substation - Dredge 0 ea $700,000 50% $0 $0 $0 $0 $0 $0 $0Substation - Booster 1 ea $500,000 50% $250,000 $0 $0 $0 $0 $0 $250,000Power Cable 15,000 lf $40 50% $300,000 $0 $0 $0 $0 $0 $300,000Dredge Modifications 0 ea $500,000 50% $0 $0 $0 $0 $0 $0 $0Booster Modifications 1 ea $350,000 50% $175,000 $0 $0 $0 $0 $0 $175,000Increased Dredging Cost 629,000 cy $0.28 100% $176,000 $176,000 $176,000 $176,000 $176,000 $176,000 $1,056,000
DRBA (ER) - Delaware 4,120 hp $200 100% $0 $824,000 $0 $0 $0 $0 $824,000DRBA (ER) - New Jersey 4,120 hp $200 100% $0 $0 $824,000 $0 $0 $0 $824,000
Program Manager 520 hr/yr $100 100% $52,000 $52,000 $52,000 $52,000 $52,000 $52,000 $312,000Equipment Testing 25 ea $10,000 100% $30,000 $30,000 $40,000 $60,000 $70,000 $20,000 $250,000
$7,179,000 $1,243,000 $1,253,000 $1,227,000 $1,237,000 $409,000 $12,548,000 $24,787 $3,685
** assumes one person managing program per year plus one equipment test per year per plant. * assumes balance of cost is capitalized into the value of the plant.
TOTAL COST
COSTS Quantity Units Unit Costs% Project Charge*
Year Cost
Monitoring & Testing:**
O&M (EL) - New Castle$62,823 $6,981
On-Site:
$8,095 $7,573
O&M (EL) - Marcus HookOff-Site:
$26,409 $2,412
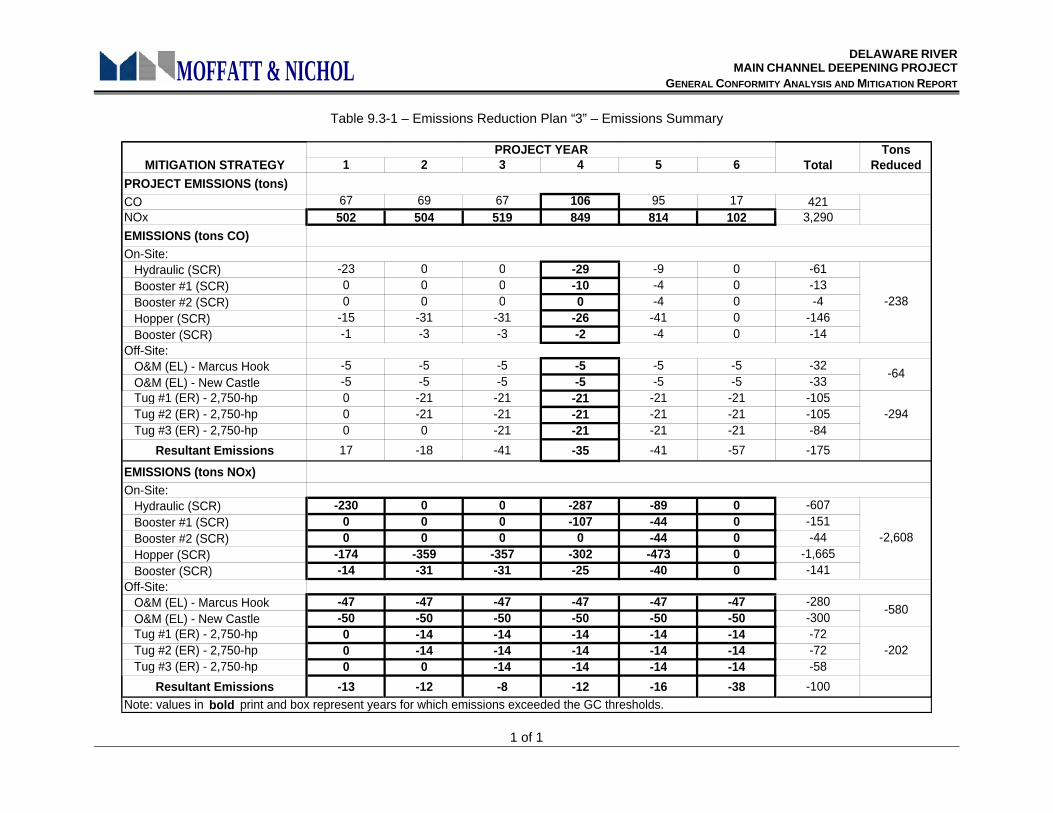
DELAWARE RIVER MAIN CHANNEL DEEPENING PROJECT
GENERAL CONFORMITY ANALYSIS AND MITIGATION REPORT
1 of 1
MOFFATT & NICHOL
Table 9.3-1 – Emissions Reduction Plan “3” – Emissions Summary
1 2 3 4 5 6
PROJECT EMISSIONS (tons)CO 67 69 67 106 95 17 421NOx 502 504 519 849 814 102 3,290
EMISSIONS (tons CO)On-Site:
Hydraulic (SCR) -23 0 0 -29 -9 0 -61Booster #1 (SCR) 0 0 0 -10 -4 0 -13Booster #2 (SCR) 0 0 0 0 -4 0 -4Hopper (SCR) -15 -31 -31 -26 -41 0 -146Booster (SCR) -1 -3 -3 -2 -4 0 -14
Off-Site:O&M (EL) - Marcus Hook -5 -5 -5 -5 -5 -5 -32O&M (EL) - New Castle -5 -5 -5 -5 -5 -5 -33Tug #1 (ER) - 2,750-hp 0 -21 -21 -21 -21 -21 -105Tug #2 (ER) - 2,750-hp 0 -21 -21 -21 -21 -21 -105Tug #3 (ER) - 2,750-hp 0 0 -21 -21 -21 -21 -84
Resultant Emissions 17 -18 -41 -35 -41 -57 -175
EMISSIONS (tons NOx)On-Site:
Hydraulic (SCR) -230 0 0 -287 -89 0 -607Booster #1 (SCR) 0 0 0 -107 -44 0 -151Booster #2 (SCR) 0 0 0 0 -44 0 -44Hopper (SCR) -174 -359 -357 -302 -473 0 -1,665Booster (SCR) -14 -31 -31 -25 -40 0 -141
Off-Site:O&M (EL) - Marcus Hook -47 -47 -47 -47 -47 -47 -280O&M (EL) - New Castle -50 -50 -50 -50 -50 -50 -300Tug #1 (ER) - 2,750-hp 0 -14 -14 -14 -14 -14 -72Tug #2 (ER) - 2,750-hp 0 -14 -14 -14 -14 -14 -72Tug #3 (ER) - 2,750-hp 0 0 -14 -14 -14 -14 -58
Resultant Emissions -13 -12 -8 -12 -16 -38 -100
MITIGATION STRATEGYPROJECT YEAR
Total
Note: values in bold print and box represent years for which emissions exceeded the GC thresholds.
-2,608
-238
-580
-202
-64
-294
Tons Reduced
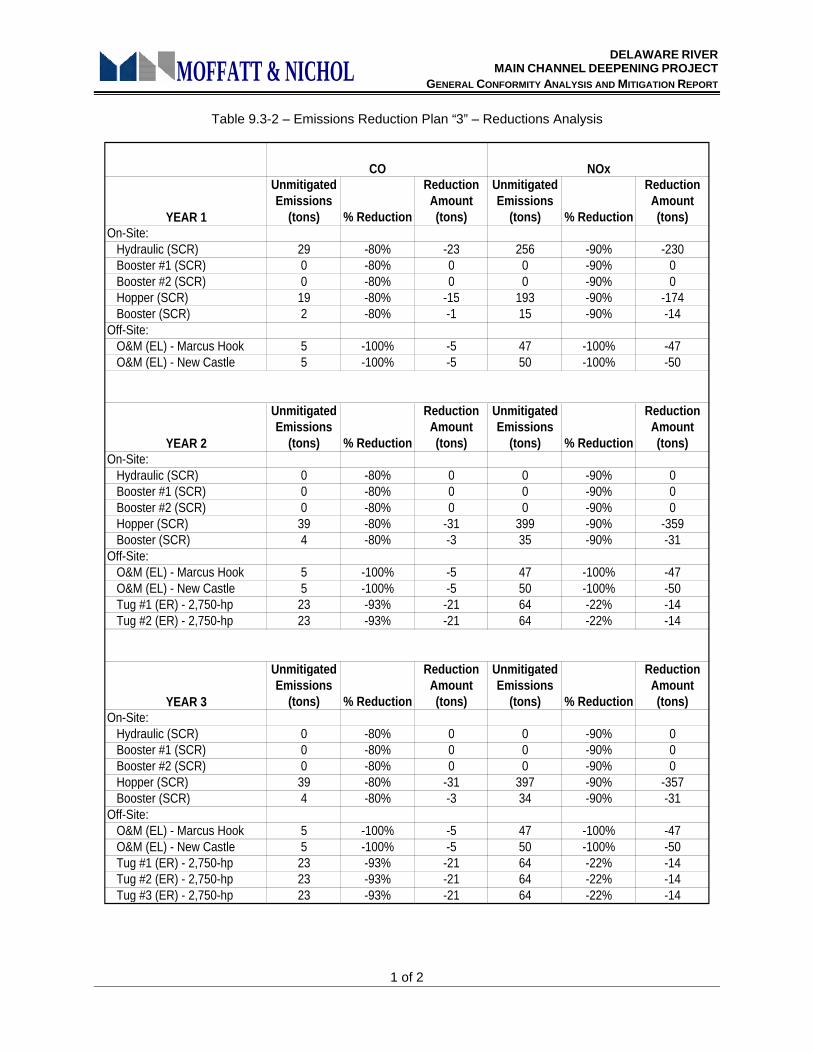
DELAWARE RIVER MAIN CHANNEL DEEPENING PROJECT
GENERAL CONFORMITY ANALYSIS AND MITIGATION REPORT
1 of 2
MOFFATT & NICHOL
Table 9.3-2 – Emissions Reduction Plan “3” – Reductions Analysis
YEAR 1
Unmitigated Emissions
(tons) % Reduction
Reduction Amount (tons)
Unmitigated Emissions
(tons) % Reduction
Reduction Amount (tons)
On-Site:Hydraulic (SCR) 29 -80% -23 256 -90% -230Booster #1 (SCR) 0 -80% 0 0 -90% 0Booster #2 (SCR) 0 -80% 0 0 -90% 0Hopper (SCR) 19 -80% -15 193 -90% -174Booster (SCR) 2 -80% -1 15 -90% -14
Off-Site:O&M (EL) - Marcus Hook 5 -100% -5 47 -100% -47O&M (EL) - New Castle 5 -100% -5 50 -100% -50
YEAR 2
Unmitigated Emissions
(tons) % Reduction
Reduction Amount (tons)
Unmitigated Emissions
(tons) % Reduction
Reduction Amount (tons)
On-Site:Hydraulic (SCR) 0 -80% 0 0 -90% 0Booster #1 (SCR) 0 -80% 0 0 -90% 0Booster #2 (SCR) 0 -80% 0 0 -90% 0Hopper (SCR) 39 -80% -31 399 -90% -359Booster (SCR) 4 -80% -3 35 -90% -31
Off-Site:O&M (EL) - Marcus Hook 5 -100% -5 47 -100% -47O&M (EL) - New Castle 5 -100% -5 50 -100% -50Tug #1 (ER) - 2,750-hp 23 -93% -21 64 -22% -14Tug #2 (ER) - 2,750-hp 23 -93% -21 64 -22% -14
YEAR 3
Unmitigated Emissions
(tons) % Reduction
Reduction Amount (tons)
Unmitigated Emissions
(tons) % Reduction
Reduction Amount (tons)
On-Site:Hydraulic (SCR) 0 -80% 0 0 -90% 0Booster #1 (SCR) 0 -80% 0 0 -90% 0Booster #2 (SCR) 0 -80% 0 0 -90% 0Hopper (SCR) 39 -80% -31 397 -90% -357Booster (SCR) 4 -80% -3 34 -90% -31
Off-Site:O&M (EL) - Marcus Hook 5 -100% -5 47 -100% -47O&M (EL) - New Castle 5 -100% -5 50 -100% -50Tug #1 (ER) - 2,750-hp 23 -93% -21 64 -22% -14Tug #2 (ER) - 2,750-hp 23 -93% -21 64 -22% -14Tug #3 (ER) - 2,750-hp 23 -93% -21 64 -22% -14
NOxCO
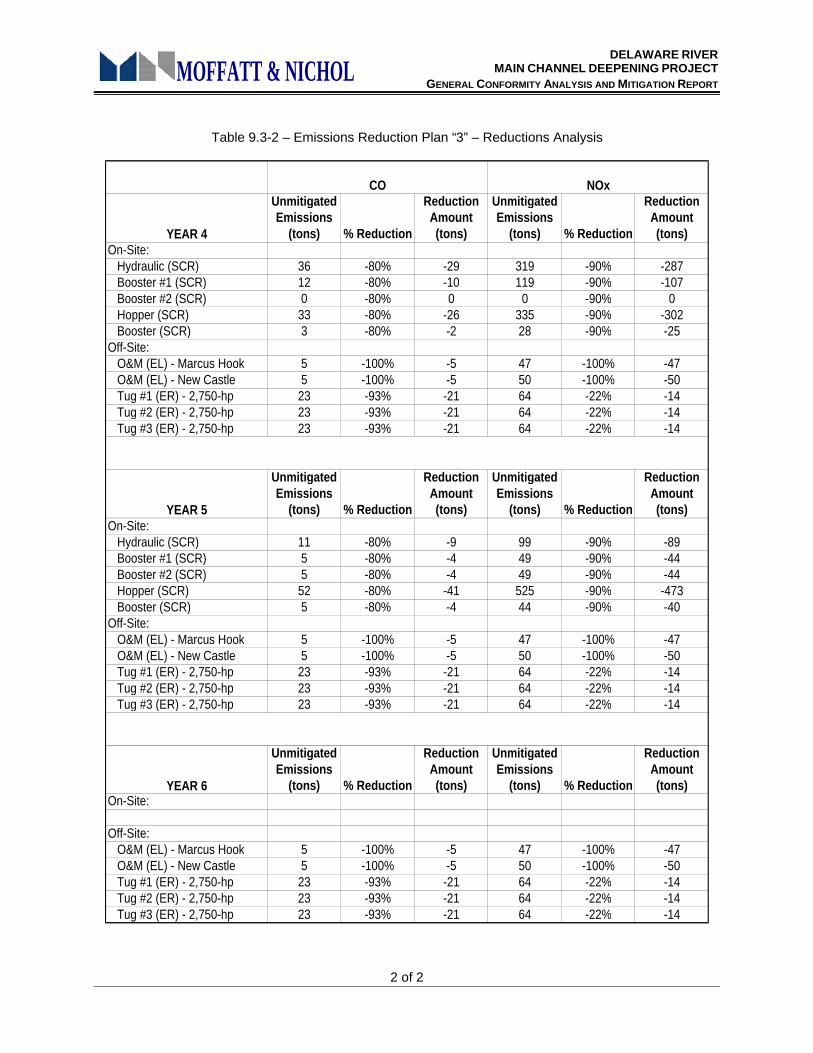
DELAWARE RIVER MAIN CHANNEL DEEPENING PROJECT
GENERAL CONFORMITY ANALYSIS AND MITIGATION REPORT
2 of 2
MOFFATT & NICHOL
Table 9.3-2 – Emissions Reduction Plan “3” – Reductions Analysis
YEAR 4
Unmitigated Emissions
(tons) % Reduction
Reduction Amount (tons)
Unmitigated Emissions
(tons) % Reduction
Reduction Amount (tons)
On-Site:Hydraulic (SCR) 36 -80% -29 319 -90% -287Booster #1 (SCR) 12 -80% -10 119 -90% -107Booster #2 (SCR) 0 -80% 0 0 -90% 0Hopper (SCR) 33 -80% -26 335 -90% -302Booster (SCR) 3 -80% -2 28 -90% -25
Off-Site:O&M (EL) - Marcus Hook 5 -100% -5 47 -100% -47O&M (EL) - New Castle 5 -100% -5 50 -100% -50Tug #1 (ER) - 2,750-hp 23 -93% -21 64 -22% -14Tug #2 (ER) - 2,750-hp 23 -93% -21 64 -22% -14Tug #3 (ER) - 2,750-hp 23 -93% -21 64 -22% -14
YEAR 5
Unmitigated Emissions
(tons) % Reduction
Reduction Amount (tons)
Unmitigated Emissions
(tons) % Reduction
Reduction Amount (tons)
On-Site:Hydraulic (SCR) 11 -80% -9 99 -90% -89Booster #1 (SCR) 5 -80% -4 49 -90% -44Booster #2 (SCR) 5 -80% -4 49 -90% -44Hopper (SCR) 52 -80% -41 525 -90% -473Booster (SCR) 5 -80% -4 44 -90% -40
Off-Site:O&M (EL) - Marcus Hook 5 -100% -5 47 -100% -47O&M (EL) - New Castle 5 -100% -5 50 -100% -50Tug #1 (ER) - 2,750-hp 23 -93% -21 64 -22% -14Tug #2 (ER) - 2,750-hp 23 -93% -21 64 -22% -14Tug #3 (ER) - 2,750-hp 23 -93% -21 64 -22% -14
YEAR 6
Unmitigated Emissions
(tons) % Reduction
Reduction Amount (tons)
Unmitigated Emissions
(tons) % Reduction
Reduction Amount (tons)
On-Site:
Off-Site:O&M (EL) - Marcus Hook 5 -100% -5 47 -100% -47O&M (EL) - New Castle 5 -100% -5 50 -100% -50Tug #1 (ER) - 2,750-hp 23 -93% -21 64 -22% -14Tug #2 (ER) - 2,750-hp 23 -93% -21 64 -22% -14Tug #3 (ER) - 2,750-hp 23 -93% -21 64 -22% -14
CO NOx
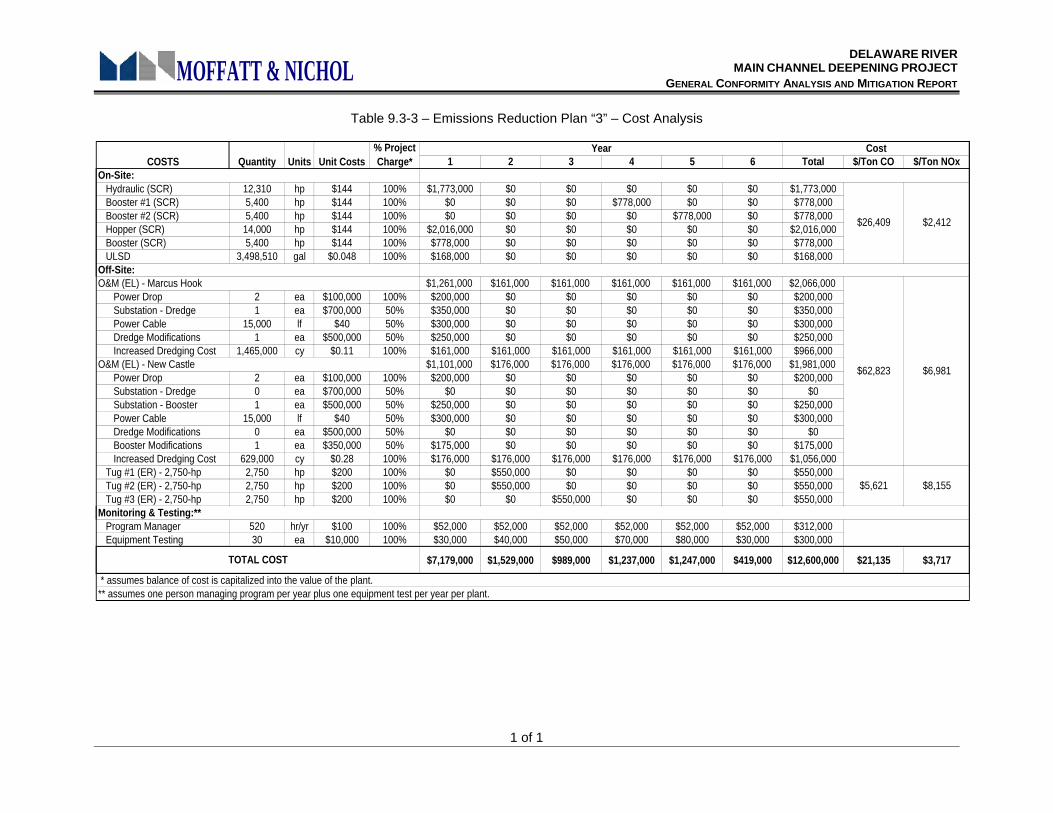
DELAWARE RIVER MAIN CHANNEL DEEPENING PROJECT
GENERAL CONFORMITY ANALYSIS AND MITIGATION REPORT
1 of 1
MOFFATT & NICHOL
Table 9.3-3 – Emissions Reduction Plan “3” – Cost Analysis
1 2 3 4 5 6 Total $/Ton CO $/Ton NOx
Hydraulic (SCR) 12,310 hp $144 100% $1,773,000 $0 $0 $0 $0 $0 $1,773,000Booster #1 (SCR) 5,400 hp $144 100% $0 $0 $0 $778,000 $0 $0 $778,000Booster #2 (SCR) 5,400 hp $144 100% $0 $0 $0 $0 $778,000 $0 $778,000Hopper (SCR) 14,000 hp $144 100% $2,016,000 $0 $0 $0 $0 $0 $2,016,000Booster (SCR) 5,400 hp $144 100% $778,000 $0 $0 $0 $0 $0 $778,000ULSD 3,498,510 gal $0.048 100% $168,000 $0 $0 $0 $0 $0 $168,000
$1,261,000 $161,000 $161,000 $161,000 $161,000 $161,000 $2,066,000Power Drop 2 ea $100,000 100% $200,000 $0 $0 $0 $0 $0 $200,000Substation - Dredge 1 ea $700,000 50% $350,000 $0 $0 $0 $0 $0 $350,000Power Cable 15,000 lf $40 50% $300,000 $0 $0 $0 $0 $0 $300,000Dredge Modifications 1 ea $500,000 50% $250,000 $0 $0 $0 $0 $0 $250,000Increased Dredging Cost 1,465,000 cy $0.11 100% $161,000 $161,000 $161,000 $161,000 $161,000 $161,000 $966,000
$1,101,000 $176,000 $176,000 $176,000 $176,000 $176,000 $1,981,000Power Drop 2 ea $100,000 100% $200,000 $0 $0 $0 $0 $0 $200,000Substation - Dredge 0 ea $700,000 50% $0 $0 $0 $0 $0 $0 $0Substation - Booster 1 ea $500,000 50% $250,000 $0 $0 $0 $0 $0 $250,000Power Cable 15,000 lf $40 50% $300,000 $0 $0 $0 $0 $0 $300,000Dredge Modifications 0 ea $500,000 50% $0 $0 $0 $0 $0 $0 $0Booster Modifications 1 ea $350,000 50% $175,000 $0 $0 $0 $0 $0 $175,000Increased Dredging Cost 629,000 cy $0.28 100% $176,000 $176,000 $176,000 $176,000 $176,000 $176,000 $1,056,000
Tug #1 (ER) - 2,750-hp 2,750 hp $200 100% $0 $550,000 $0 $0 $0 $0 $550,000Tug #2 (ER) - 2,750-hp 2,750 hp $200 100% $0 $550,000 $0 $0 $0 $0 $550,000Tug #3 (ER) - 2,750-hp 2,750 hp $200 100% $0 $0 $550,000 $0 $0 $0 $550,000
Program Manager 520 hr/yr $100 100% $52,000 $52,000 $52,000 $52,000 $52,000 $52,000 $312,000Equipment Testing 30 ea $10,000 100% $30,000 $40,000 $50,000 $70,000 $80,000 $30,000 $300,000
$7,179,000 $1,529,000 $989,000 $1,237,000 $1,247,000 $419,000 $12,600,000 $21,135 $3,717
** assumes one person managing program per year plus one equipment test per year per plant. * assumes balance of cost is capitalized into the value of the plant.
TOTAL COST
COSTS Quantity Units Unit Costs% Project Charge*
Year Cost
Monitoring & Testing:**
O&M (EL) - New Castle$62,823 $6,981
On-Site:
$5,621 $8,155
O&M (EL) - Marcus HookOff-Site:
$26,409 $2,412
DELAWARE RIVER MAIN CHANNEL DEEPENING PROJECT
GENERAL CONFORMITY ANALYSIS AND MITIGATION REPORT
44
MOFFATT & NICHOL
FIGURES
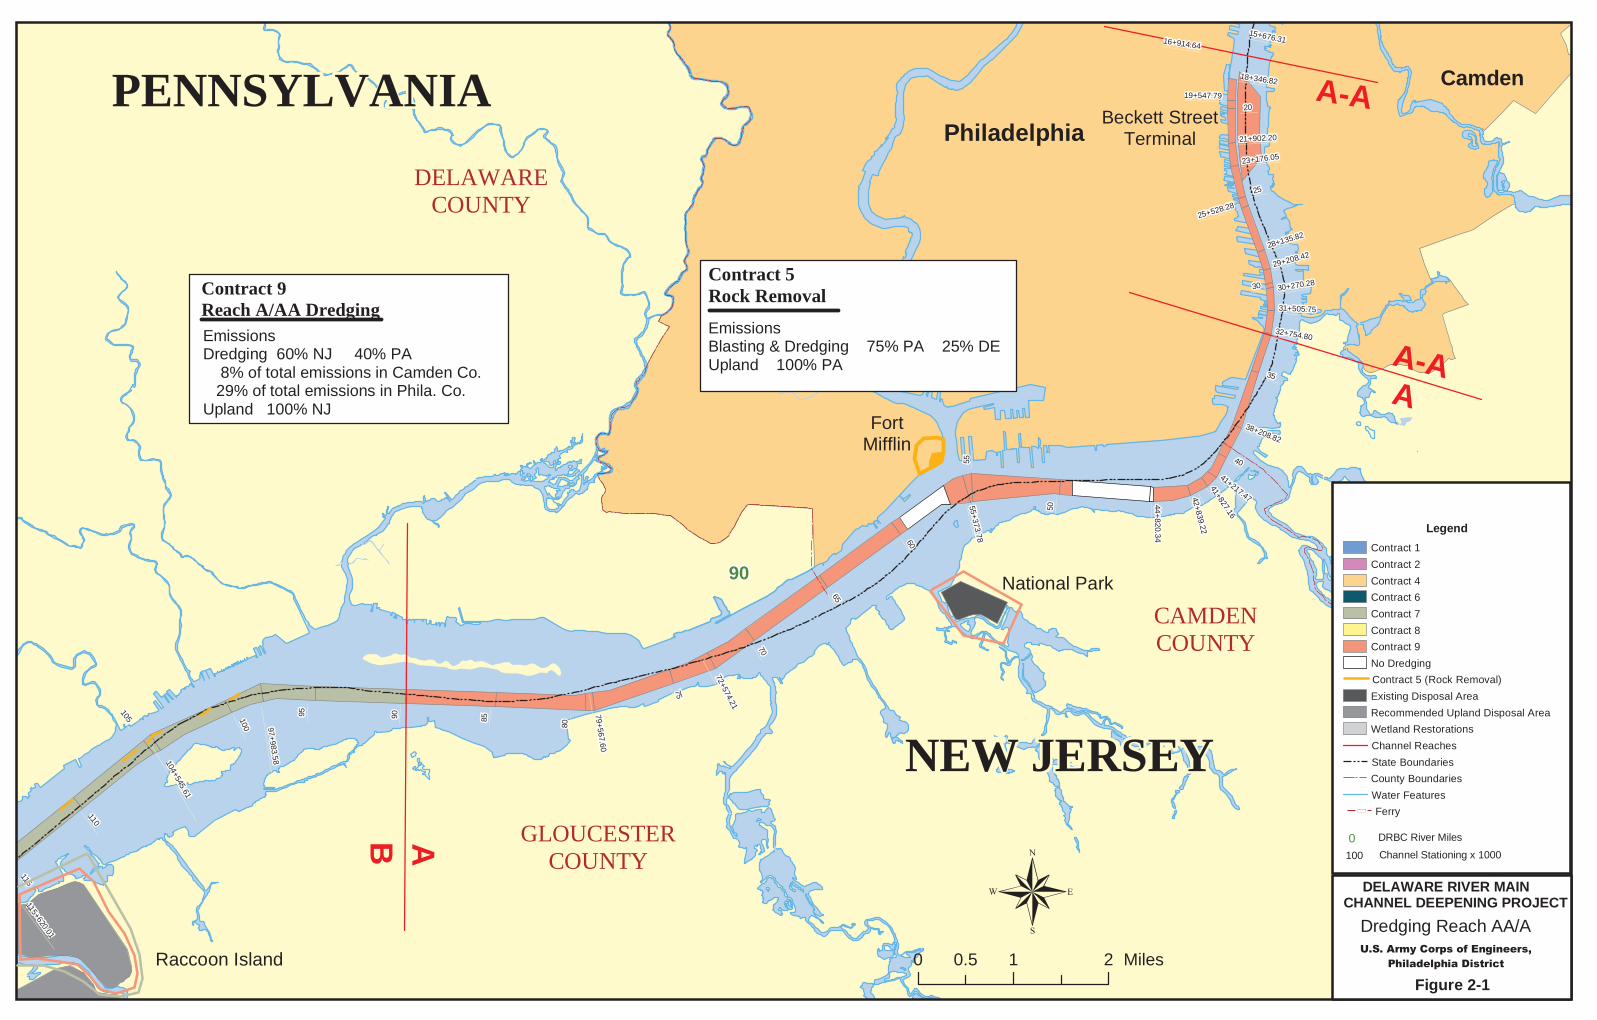
104+545.61
104+545.61
72+574.21
72+574.21
79+567.60
79+567.60
97+983.58
97+983.58
110110
100100
105105
4040
2525
6060
6565
5555
7575
8080
7070
90909595
8585
3030
2020
5050
3535
115+620.01
115+620.01
115115
28+135.8228+135.82
21+902.2021+902.20
44+820.34
44+820.34
55+373.78
55+373.78
23+176.0523+176.05
25+528.2825+528.28
31+505.7531+505.75
29+208.4229+208.42
30+270.2830+270.28
41+217.47
41+217.47
32+754.8032+754.80
38+208.82
38+208.82
15+676.3115+676.31
41+827.16
41+827.16
42+839.22
42+839.22
19+547.7919+547.79
18+346.8218+346.82
16+914.6416+914.64
9090
PENNSYLVANIAPENNSYLVANIA
NEW JERSEYNEW JERSEY
Philadelphia
Camden
DELAWARECOUNTY
CAMDENCOUNTY
GLOUCESTERCOUNTY
0 1 20.5 Miles
�
Beckett StreetTerminal
FortMifflin
National Park
Raccoon Island
A-A
A-AA
DELAWARE RIVER MAINCHANNEL DEEPENING PROJECT
Dredging Reach AA/A�������������� �����������
���������������������
Figure 2-1
AB
EmissionsDredging 60% NJ 40% PA 8% of total emissions in Camden Co. 29% of total emissions in Phila. Co.Upland 100% NJ
Contract 9Reach A/AA Dredging
Legend
Contract 1
Contract 2
Contract 4
Contract 6
Contract 7
Contract 8
Contract 9
No Dredging
Contract 5 (Rock Removal)
Existing Disposal Area
Recommended Upland Disposal Area
Wetland Restorations
Channel Reaches
State Boundaries
County Boundaries
Water Features� Ferry
0 DRBC River Miles
Channel Stationing x 1000100
EmissionsBlasting & Dredging 75% PA 25% DEUpland 100% PA
Contract 5Rock Removal
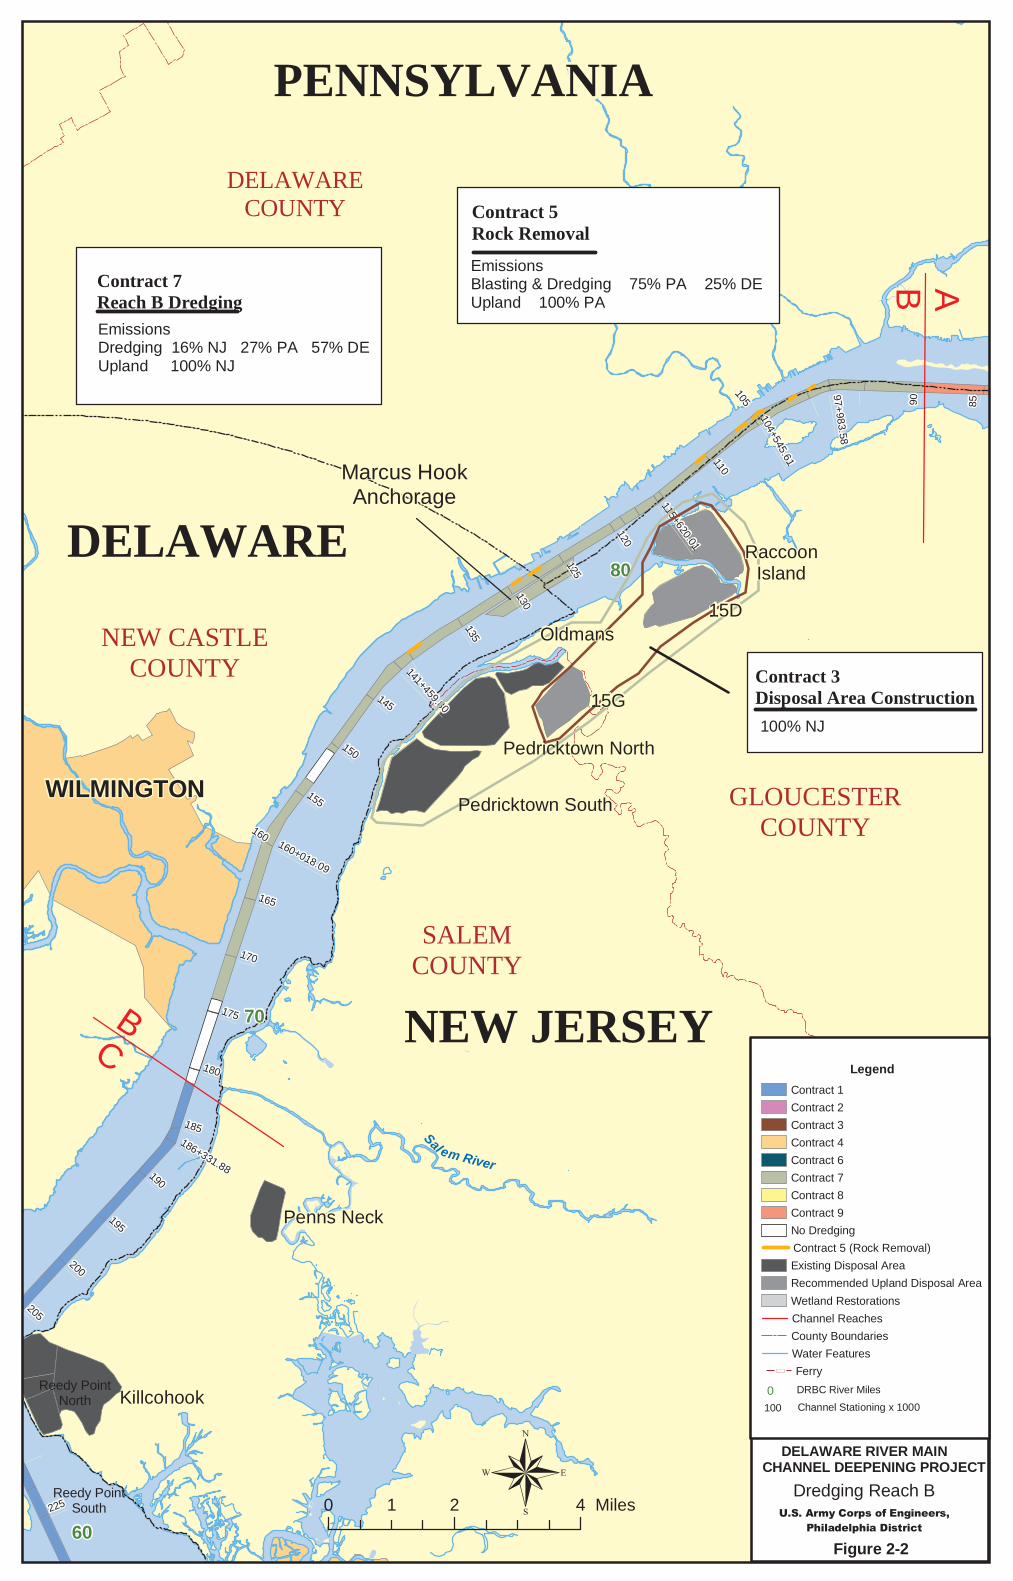
97+983.58
97+983.58
104+545.61
104+545.61
186+331.88
186+331.88
160+018.09
160+018.09
141+459.80
141+459.80
115+620.01
115+620.01
170170
225225
205205
200200
195195
190190
185185
180180
175175
150150
165165
160160
155155
125125
145145
135135
130130
120120
105105
110110
85859090
6060
7070
8080
PENNSYLVANIAPENNSYLVANIA
NEW JERSEYNEW JERSEY
DELAWARECOUNTY
GLOUCESTERCOUNTY
SALEMCOUNTY
DELAWAREDELAWARE
WILMINGTONWILMINGTON
NEW CASTLECOUNTY
�0 2 41 Miles
BC
Penns NeckPenns Neck
KillcohookReedy Point
North
Reedy PointSouth
DELAWARE RIVER MAINCHANNEL DEEPENING PROJECT
�������������� ��������������������������������
Figure 2-2
Dredging Reach B
Sal em River
AB
Marcus HookAnchorage
Marcus HookAnchorage
Pedricktown North
Pedricktown South
RaccoonIsland
RaccoonIsland
15D15DOldmansOldmans
15G15G
Legend
Contract 1
Contract 2
Contract 3
Contract 4
Contract 6
Contract 7
Contract 8
Contract 9
No Dredging
Contract 5 (Rock Removal)
Existing Disposal Area
Recommended Upland Disposal Area
Wetland Restorations
Channel Reaches
County Boundaries
Water Features� Ferry
100
0 DRBC River Miles
Channel Stationing x 1000
100% NJ
Contract 3Disposal Area Construction
EmissionsDredging 16% NJ 27% PA 57% DEUpland 100% NJ
Contract 7Reach B Dredging
Contract 5Rock Removal
EmissionsBlasting & Dredging 75% PA 25% DEUpland 100% PA
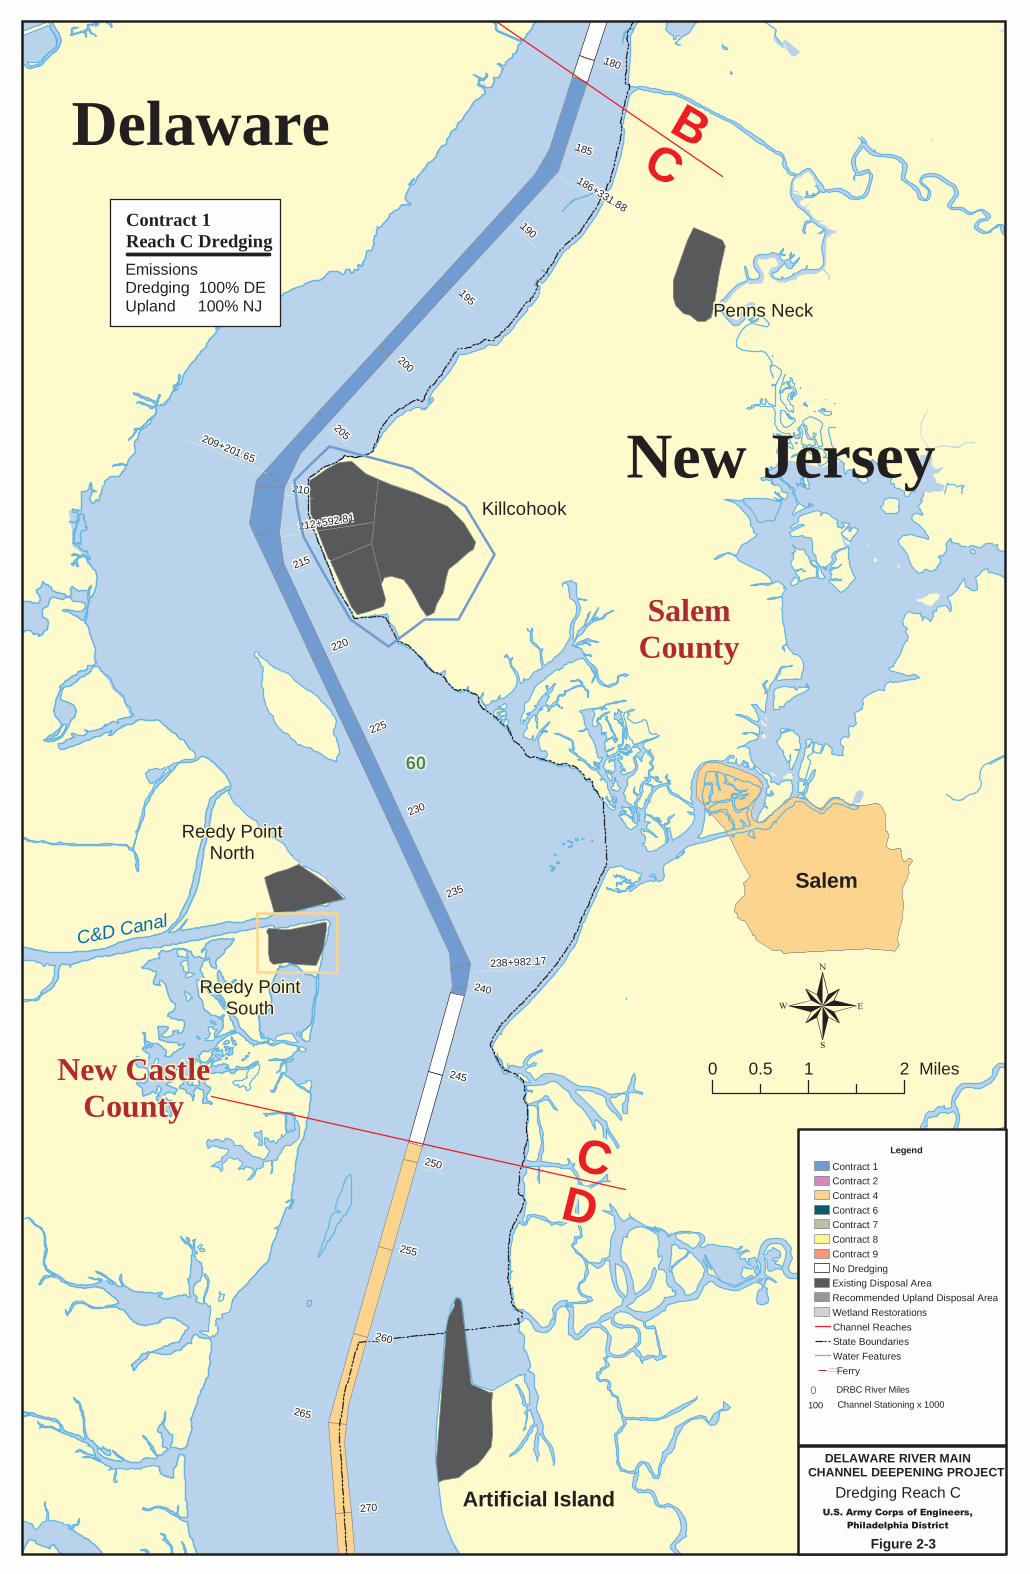
186+331.88
186+331.88
238+982.17238+982.17
212+592.81212+592.81
209+201.65
209+201.65
270270
265265
260260
255255
250250
245245
240240
180180
230230
225225
220220
215215
210210
205205
200200
195195
190190
185185
235235
6060
C&D Canal
Artificial Island
KillcohookKillcohook
Penns NeckPenns Neck
Salem
Reedy PointNorth
Reedy PointNorth
Reedy PointSouth
Reedy PointSouth
SalemCounty
New CastleCounty
New CastleCounty
New Jersey
Delaware BC
CCDD
0 1 20.5 Miles
�
DELAWARE RIVER MAINCHANNEL DEEPENING PROJECT
Dredging Reach C�������������� �����������
���������������������
Figure 2-3
Legend
Contract 1
Contract 2
Contract 4
Contract 6
Contract 7
Contract 8
Contract 9
No Dredging
Existing Disposal Area
Recommended Upland Disposal Area
Wetland Restorations
Channel Reaches
State Boundaries
Water Features�Ferry
100
0 DRBC River Miles
Channel Stationing x 1000
EmissionsDredging 100% DEUpland 100% NJ
Contract 1Reach C Dredging
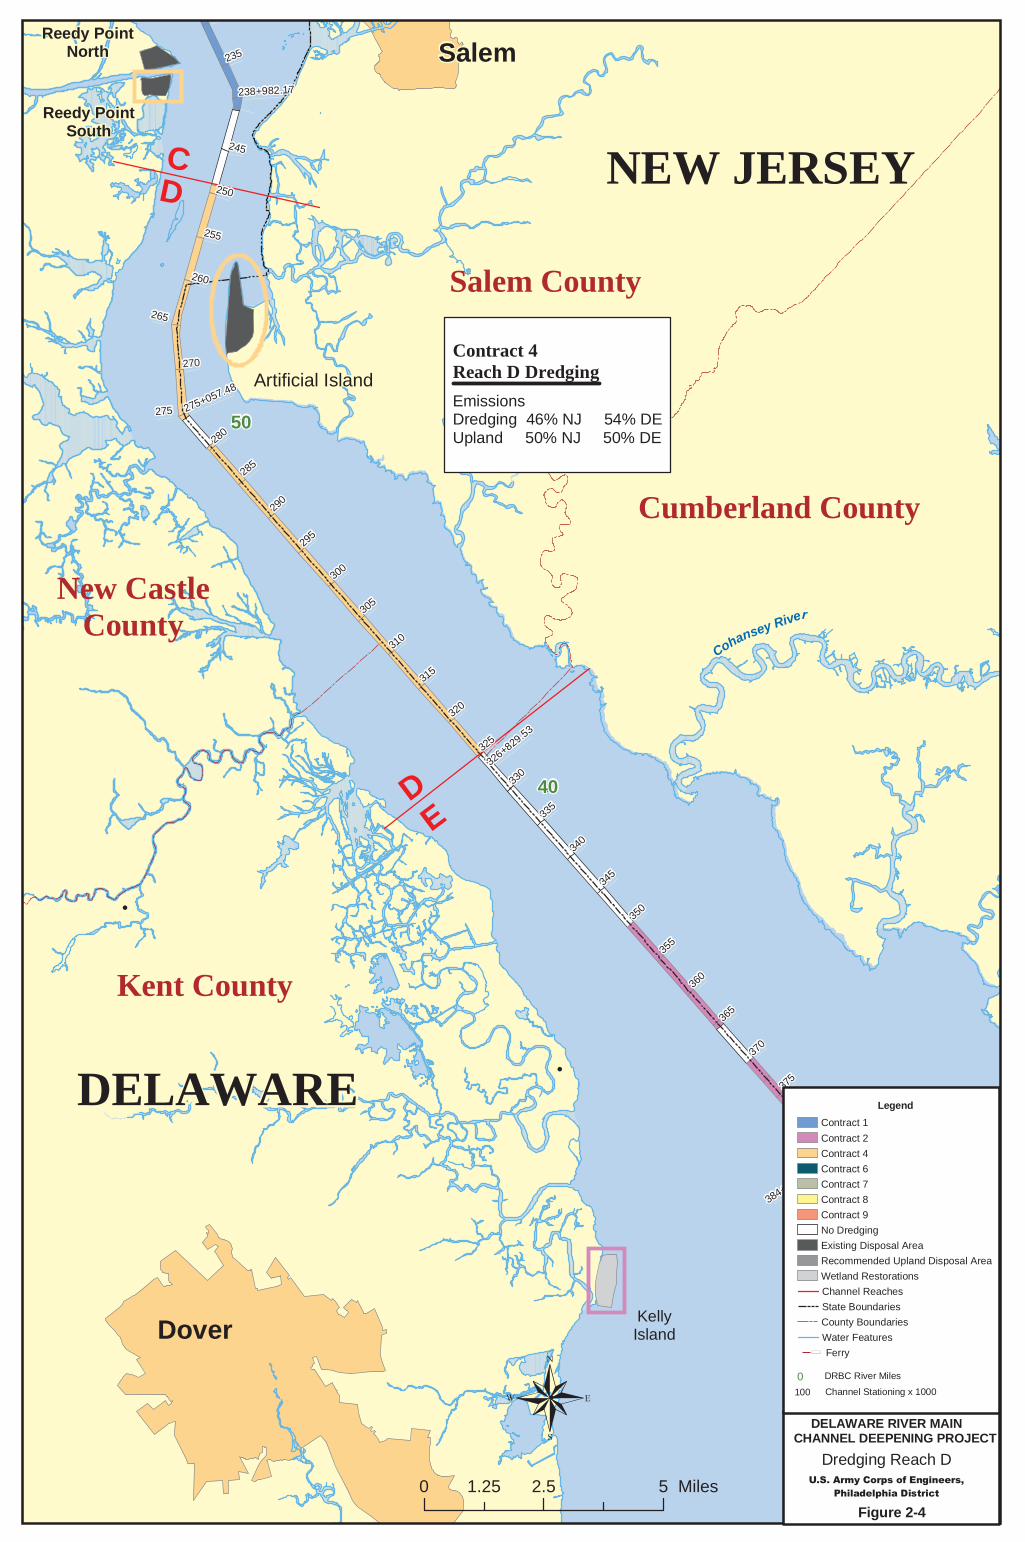
�
�
�
238+982.17238+982.17
275+057.48
275+057.48
384+451.39
384+451.39
326+829.53
326+829.53
405+043.11
405+043.11
340
340
415415
325325
405405
400400
395395
390390
385385
380
380
375
375
370
370
365
365
360
360
355
355
350
350
345
345
320320
335
335
330
330
285285
275275
315315
310310
305305
300300
295
295
290
290
245245
235235
270270
265265
260260
255255
250250
280280
410410
4040
5050
3030
NEW JERSEYNEW JERSEY
DELAWAREDELAWARE
Cumberland County
Salem County
Kent County
New CastleCounty
0 2.5 51.25 Miles
�Dover
SalemSalemReedy Point
NorthReedy Point
North
Reedy PointSouth
Reedy PointSouth
Artificial IslandArtificial Island
CD
DE
KellyIsland
DELAWARE RIVER MAINCHANNEL DEEPENING PROJECT
Dredging Reach D�������������� �����������
���������������������
Figure 2-4
Cohansey River
Legend
Contract 1
Contract 2
Contract 4
Contract 6
Contract 7
Contract 8
Contract 9
No Dredging
Existing Disposal Area
Recommended Upland Disposal Area
Wetland Restorations
Channel Reaches
State Boundaries
County Boundaries
Water Features� Ferry
100
0 DRBC River Miles
Channel Stationing x 1000
EmissionsDredging 46% NJ 54% DEUpland 50% NJ 50% DE
Contract 4Reach D Dredging
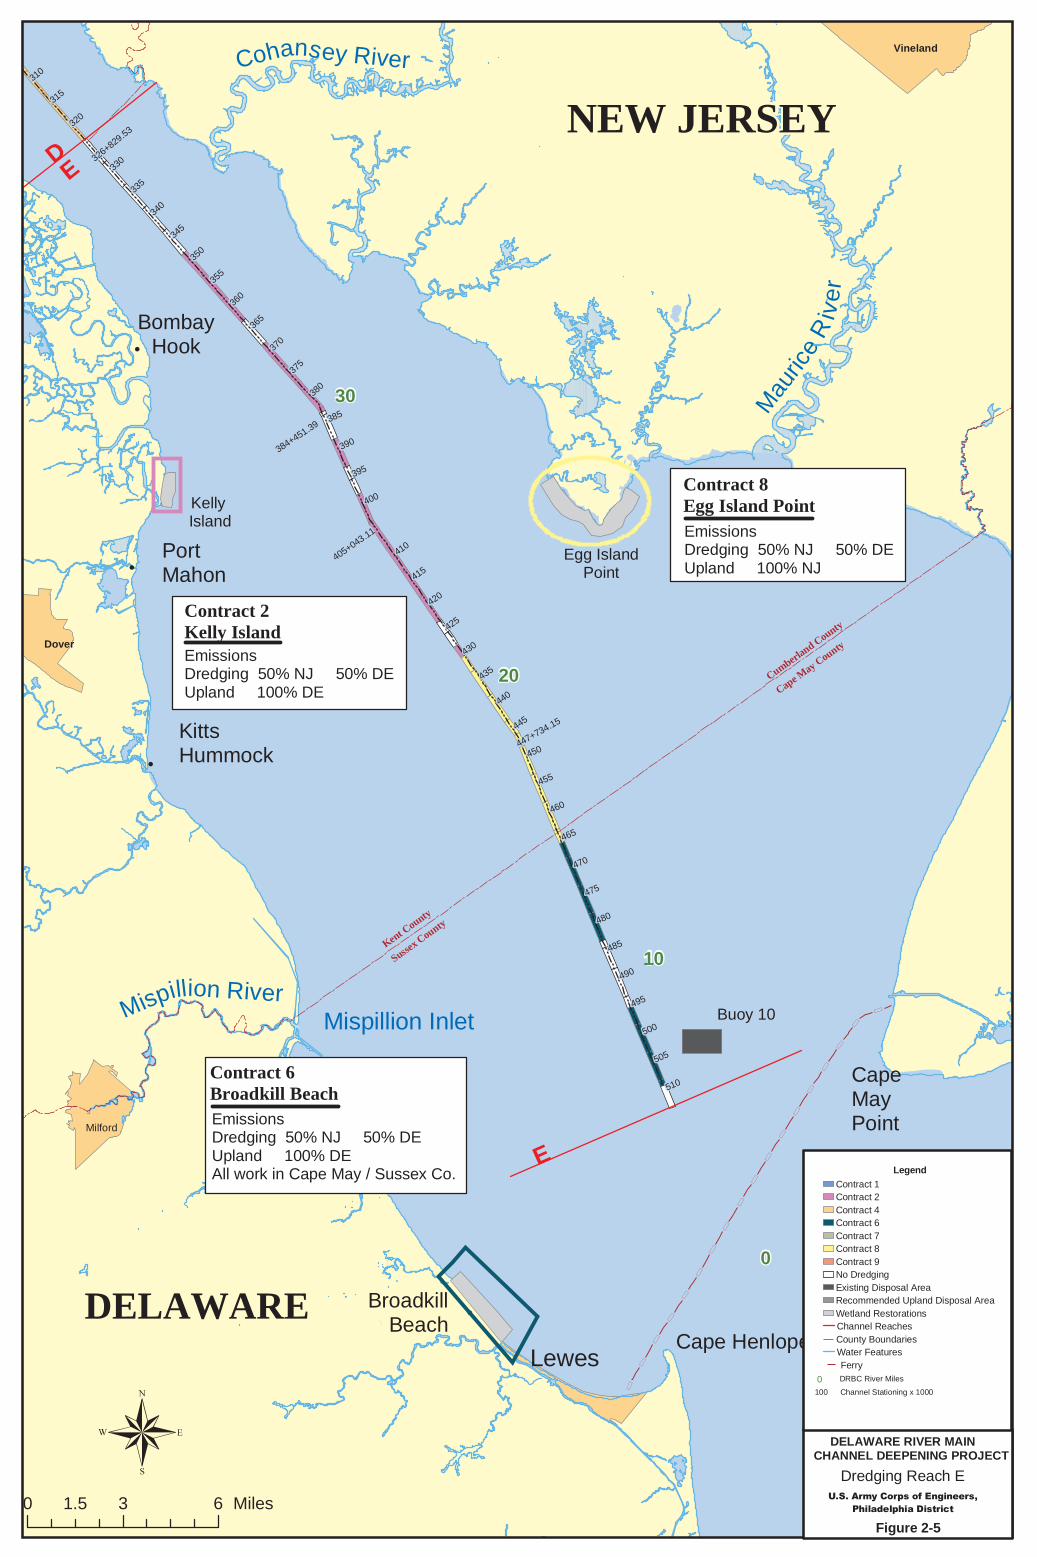
�
��
��
��
��
��
��
��
��
�
�
�
�
�
�
CapeMayPoint
BroadkillBeach
BombayHook
KittsHummock
PortMahon
Cape HenlopenLewes
Mispillion Inlet
Cohansey River
Mau
rice
Riv
er
Mispillion River
326+829.53
326+829.53
447+734.15
447+734.15
384+451.39
384+451.39
405+043.11
405+043.11
470470
510510
505505
495495
490490
485485
480480
475475
500500
465465
460460
455455
450450
445445
440440
435435
430430
425425
310310
415415
420420
400400
395395
390390
385385
380
380
375
375
370
370
365
365
360
360
355
355
350
350
345
345
340
340
335
335
315315
330
330
320320
410410
00
1010
2020
3030
NEW JERSEYNEW JERSEY
DELAWAREDELAWARE
0 3 61.5 Miles
�
Vineland
Dover
Milford
DE
E
Egg IslandPoint
Kelly Island
Buoy 10
DELAWARE RIVER MAINCHANNEL DEEPENING PROJECT
Dredging Reach E�������������� �����������
���������������������
Figure 2-5
Kent County
Sussex County
Cumberland County
Cape May County
LegendContract 1Contract 2Contract 4Contract 6Contract 7Contract 8Contract 9No DredgingExisting Disposal AreaRecommended Upland Disposal AreaWetland RestorationsChannel ReachesCounty BoundariesWater FeaturesFerry
100
0 DRBC River Miles
Channel Stationing x 1000
Contract 2Kelly IslandEmissionsDredging 50% NJ 50% DEUpland 100% DE
EmissionsDredging 50% NJ 50% DEUpland 100% NJ
Contract 8Egg Island Point
EmissionsDredging 50% NJ 50% DEUpland 100% DEAll work in Cape May / Sussex Co.
Contract 6Broadkill Beach
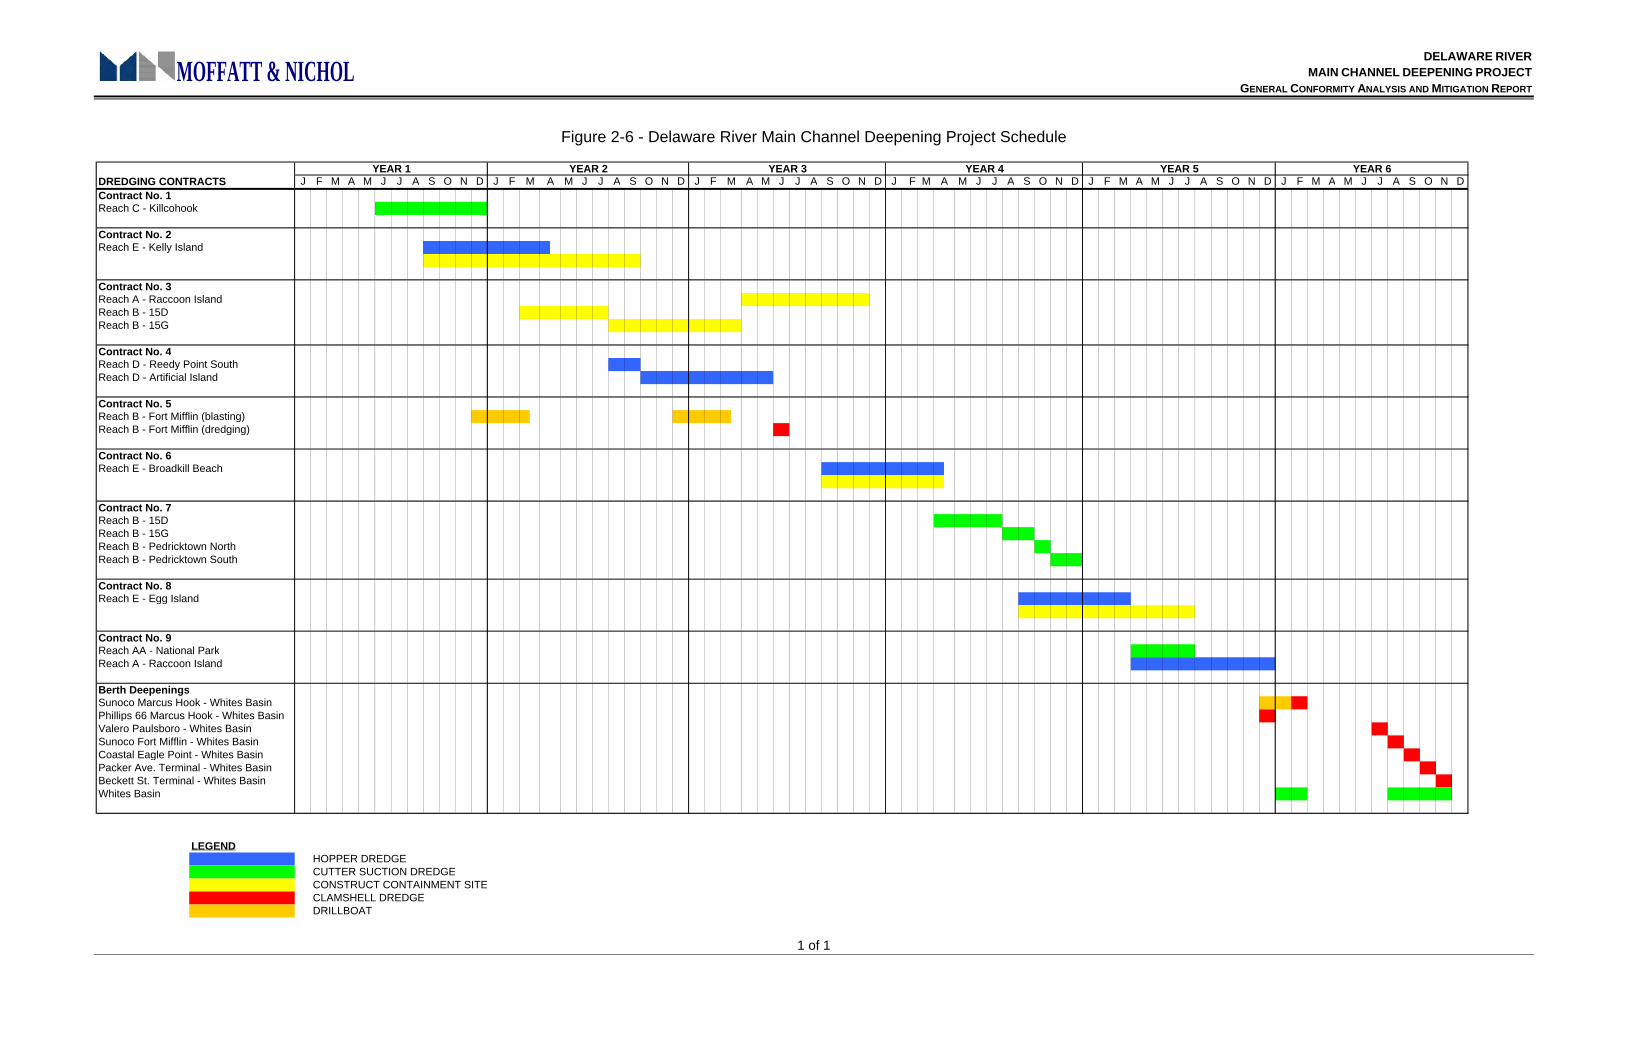
DELAWARE RIVER MAIN CHANNEL DEEPENING PROJECT
GENERAL CONFORMITY ANALYSIS AND MITIGATION REPORT
1 of 1
MOFFATT & NICHOL
Figure 2-6 - Delaware River Main Channel Deepening Project Schedule
DREDGING CONTRACTS J F M A M J J A S O N D J F M J J A S O N D J F A M J J A S O N D J F M M J J A S O N D J F M A M J J A S O N D J F M A M J J A S O N DContract No. 1Reach C - Killcohook
Contract No. 2Reach E - Kelly Island
Contract No. 3Reach A - Raccoon Island Reach B - 15DReach B - 15G
Contract No. 4Reach D - Reedy Point SouthReach D - Artificial Island
Contract No. 5Reach B - Fort Mifflin (blasting)Reach B - Fort Mifflin (dredging)
Contract No. 6Reach E - Broadkill Beach
Contract No. 7Reach B - 15DReach B - 15G Reach B - Pedricktown NorthReach B - Pedricktown South
Contract No. 8Reach E - Egg Island
Contract No. 9Reach AA - National ParkReach A - Raccoon Island
Berth DeepeningsSunoco Marcus Hook - Whites BasinPhillips 66 Marcus Hook - Whites BasinValero Paulsboro - Whites BasinSunoco Fort Mifflin - Whites BasinCoastal Eagle Point - Whites BasinPacker Ave. Terminal - Whites BasinBeckett St. Terminal - Whites BasinWhites Basin
LEGENDHOPPER DREDGECUTTER SUCTION DREDGECONSTRUCT CONTAINMENT SITECLAMSHELL DREDGEDRILLBOAT
YEAR 6YEAR 1 YEAR 2 YEAR 3 YEAR 4 YEAR 5AM MA
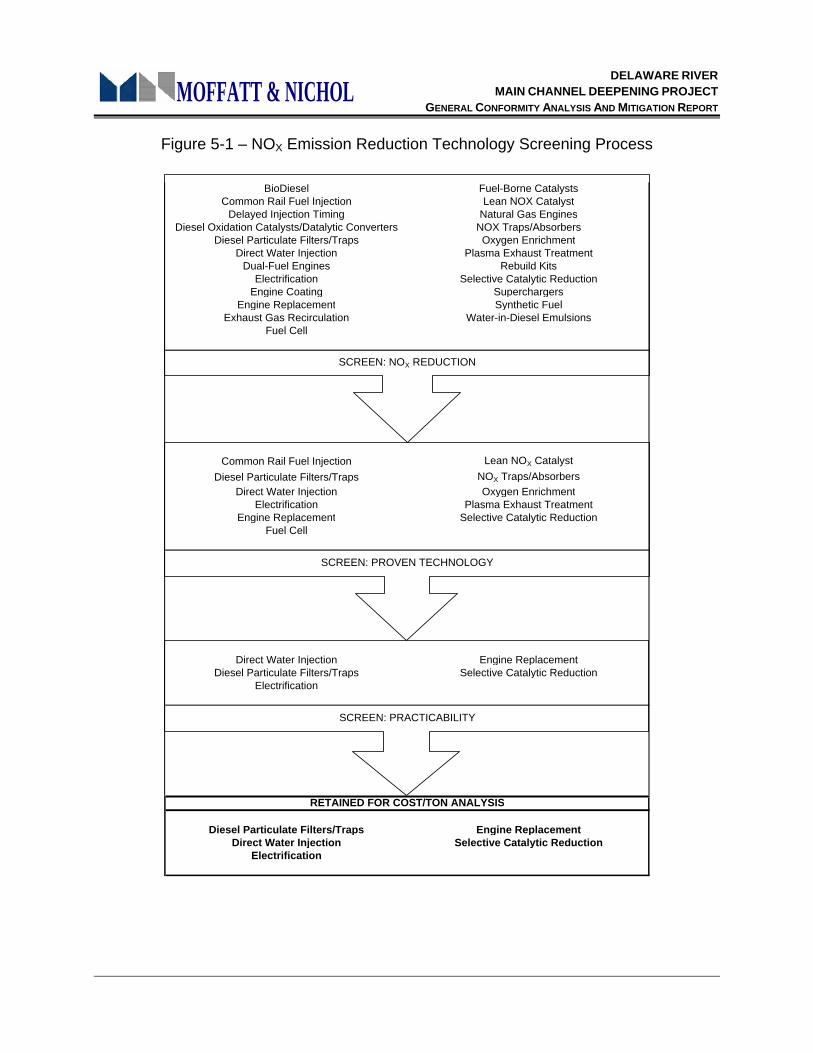
DELAWARE RIVER MAIN CHANNEL DEEPENING PROJECT
GENERAL CONFORMITY ANALYSIS AND MITIGATION REPORT
MOFFATT & NICHOL
Figure 5-1 – NOX Emission Reduction Technology Screening Process
BioDiesel Fuel-Borne CatalystsCommon Rail Fuel Injection Lean NOX Catalyst
Delayed Injection Timing Natural Gas EnginesDiesel Oxidation Catalysts/Datalytic Converters NOX Traps/Absorbers
Diesel Particulate Filters/Traps Oxygen EnrichmentDirect Water Injection Plasma Exhaust Treatment
Dual-Fuel Engines Rebuild KitsElectrification Selective Catalytic Reduction
Engine Coating SuperchargersEngine Replacement Synthetic Fuel
Exhaust Gas Recirculation Water-in-Diesel EmulsionsFuel Cell
Common Rail Fuel Injection Lean NOX Catalyst
Diesel Particulate Filters/Traps NOX Traps/AbsorbersDirect Water Injection Oxygen Enrichment
Electrification Plasma Exhaust TreatmentEngine Replacement Selective Catalytic Reduction
Fuel Cell
Direct Water Injection Engine ReplacementDiesel Particulate Filters/Traps Selective Catalytic Reduction
Electrification
Diesel Particulate Filters/Traps Engine ReplacementDirect Water Injection Selective Catalytic Reduction
Electrification
SCREEN: PRACTICABILITY
RETAINED FOR COST/TON ANALYSIS
SCREEN: PROVEN TECHNOLOGY
SCREEN: NOX REDUCTION
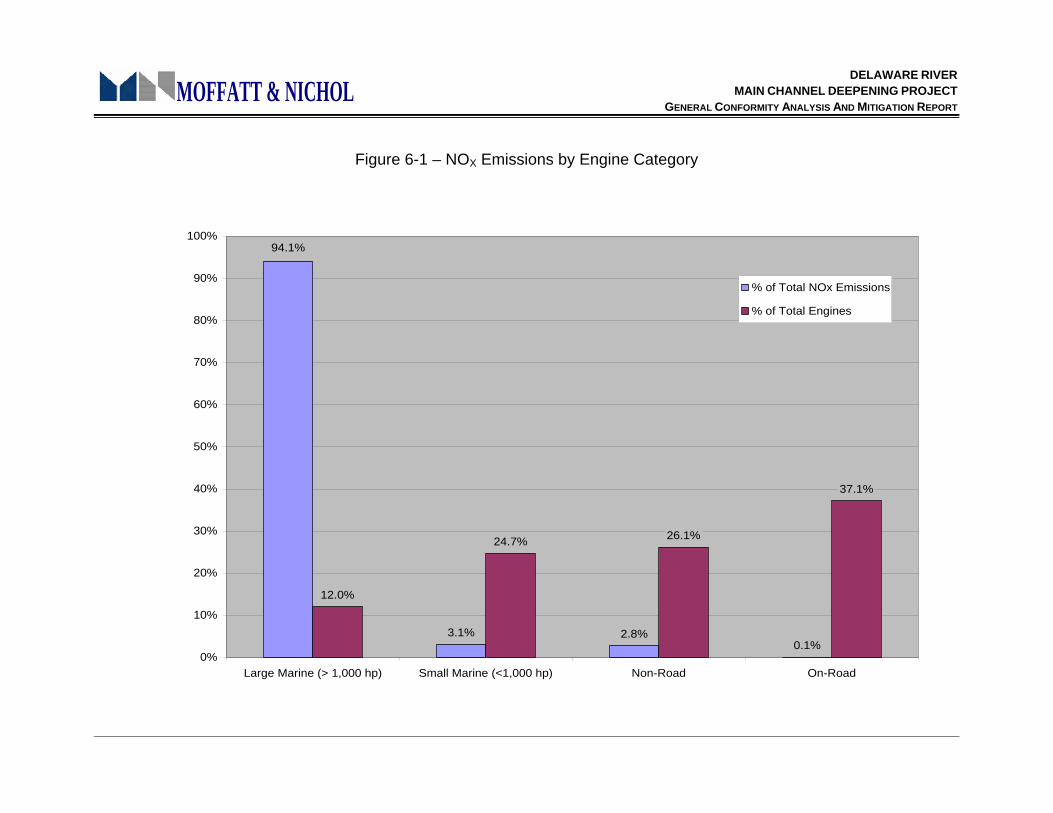
DELAWARE RIVER MAIN CHANNEL DEEPENING PROJECT
GENERAL CONFORMITY ANALYSIS AND MITIGATION REPORT
MOFFATT & NICHOL
Figure 6-1 – NOX Emissions by Engine Category
3.1% 2.8%0.1%
12.0%
24.7%
94.1%
26.1%
37.1%
0%
10%
20%
30%
40%
50%
60%
70%
80%
90%
100%
Large Marine (> 1,000 hp) Small Marine (<1,000 hp) Non-Road On-Road
% of Total NOx Emissions
% of Total Engines
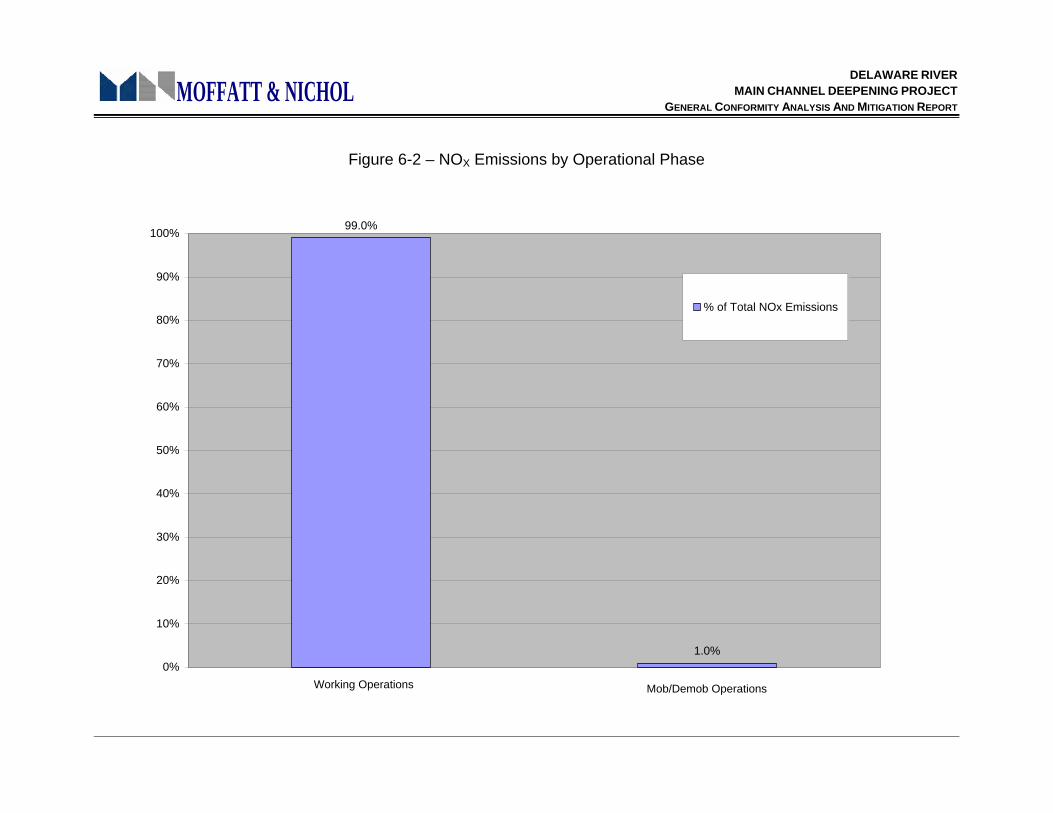
DELAWARE RIVER MAIN CHANNEL DEEPENING PROJECT
GENERAL CONFORMITY ANALYSIS AND MITIGATION REPORT
MOFFATT & NICHOL
Figure 6-2 – NOX Emissions by Operational Phase
99.0%
1.0%0%
10%
20%
30%
40%
50%
60%
70%
80%
90%
100%
% of Total NOx Emissions
Working Operations Mob/Demob Operations
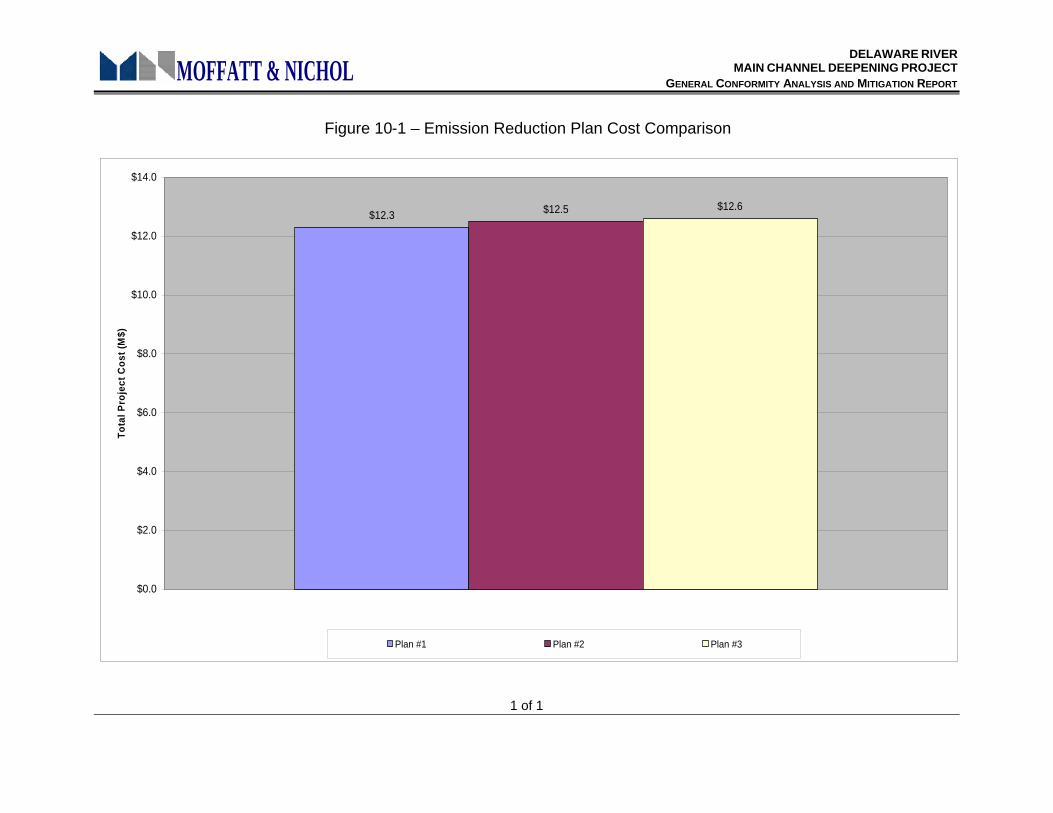
DELAWARE RIVER MAIN CHANNEL DEEPENING PROJECT
GENERAL CONFORMITY ANALYSIS AND MITIGATION REPORT
1 of 1
MOFFATT & NICHOL
Figure 10-1 – Emission Reduction Plan Cost Comparison
$12.3 $12.5 $12.6
$0.0
$2.0
$4.0
$6.0
$8.0
$10.0
$12.0
$14.0
To
tal P
roje
ct C
ost
(M
$)
Plan #1 Plan #2 Plan #3
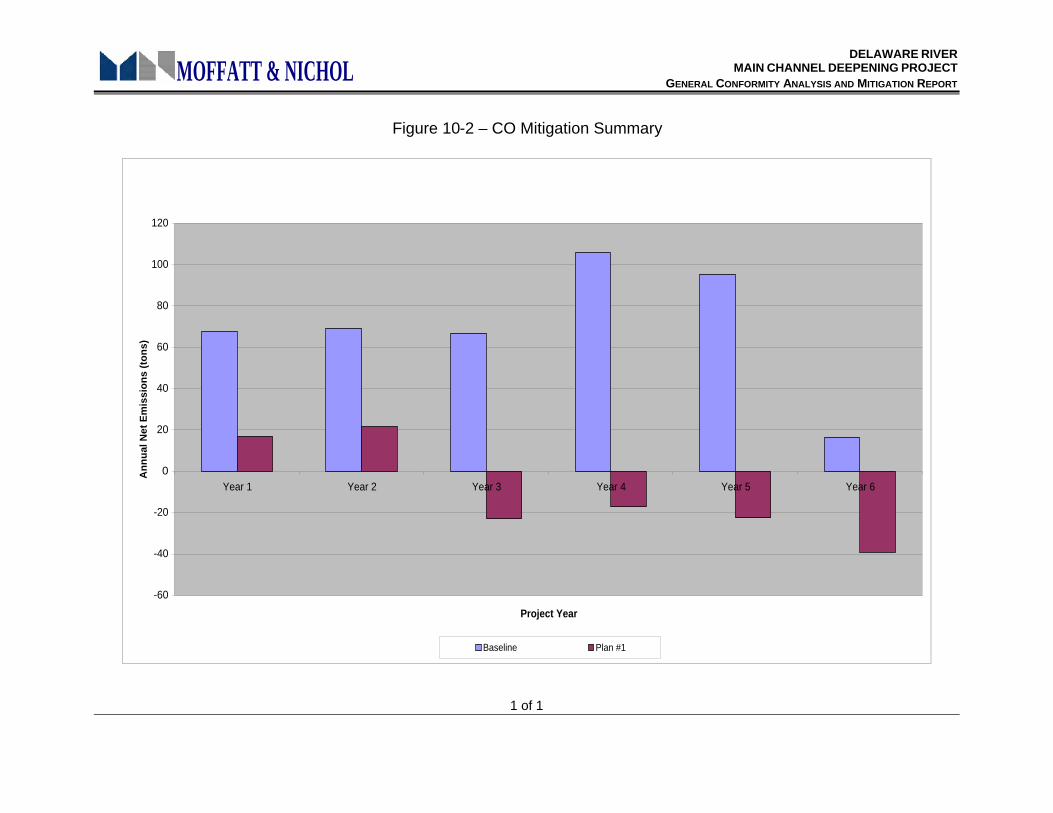
DELAWARE RIVER MAIN CHANNEL DEEPENING PROJECT
GENERAL CONFORMITY ANALYSIS AND MITIGATION REPORT
1 of 1
MOFFATT & NICHOL
Figure 10-2 – CO Mitigation Summary
-60
-40
-20
0
20
40
60
80
100
120
Year 1 Year 2 Year 3 Year 4 Year 5 Year 6
Project Year
An
nu
al N
et E
mis
sio
ns
(to
ns)
Baseline Plan #1
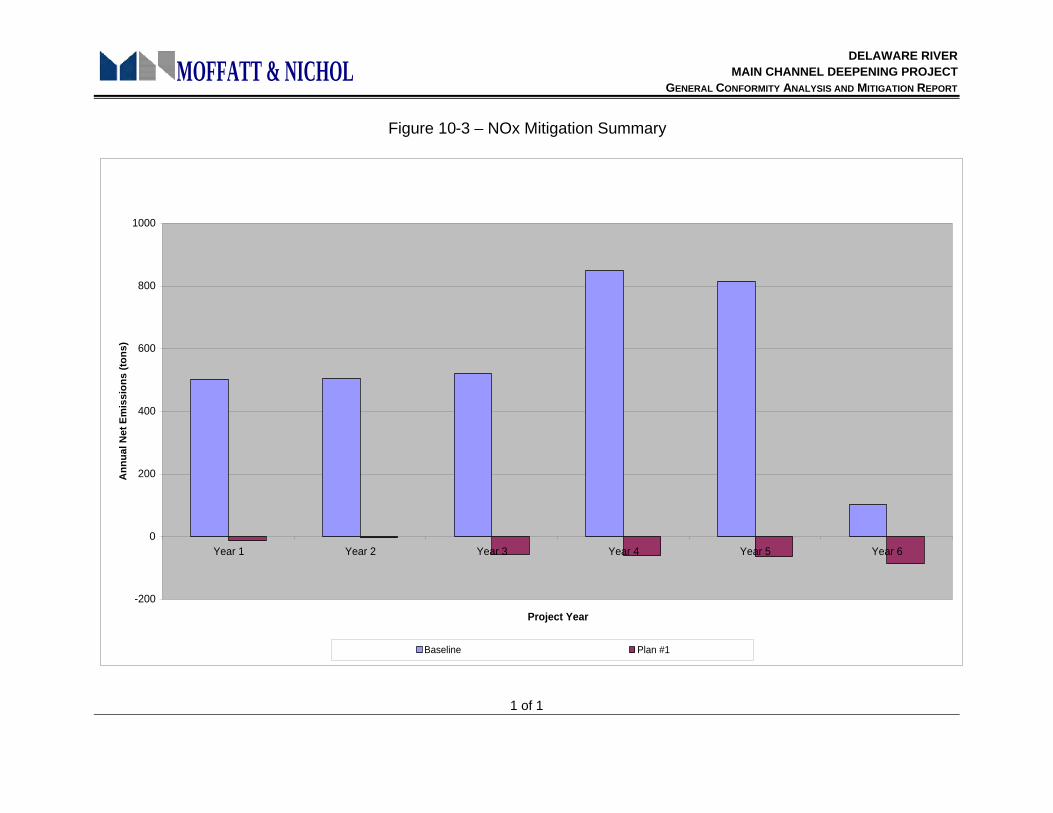
DELAWARE RIVER MAIN CHANNEL DEEPENING PROJECT
GENERAL CONFORMITY ANALYSIS AND MITIGATION REPORT
1 of 1
MOFFATT & NICHOL
Figure 10-3 – NOx Mitigation Summary
-200
0
200
400
600
800
1000
Year 1 Year 2 Year 3 Year 4 Year 5 Year 6
Project Year
An
nu
al N
et E
mis
sio
ns
(to
ns)
Baseline Plan #1
DELAWARE RIVER MAIN CHANNEL DEEPENING PROJECT
GENERAL CONFORMITY ANALYSIS AND MITIGATION REPORT
45
MOFFATT & NICHOL
APPENDIX
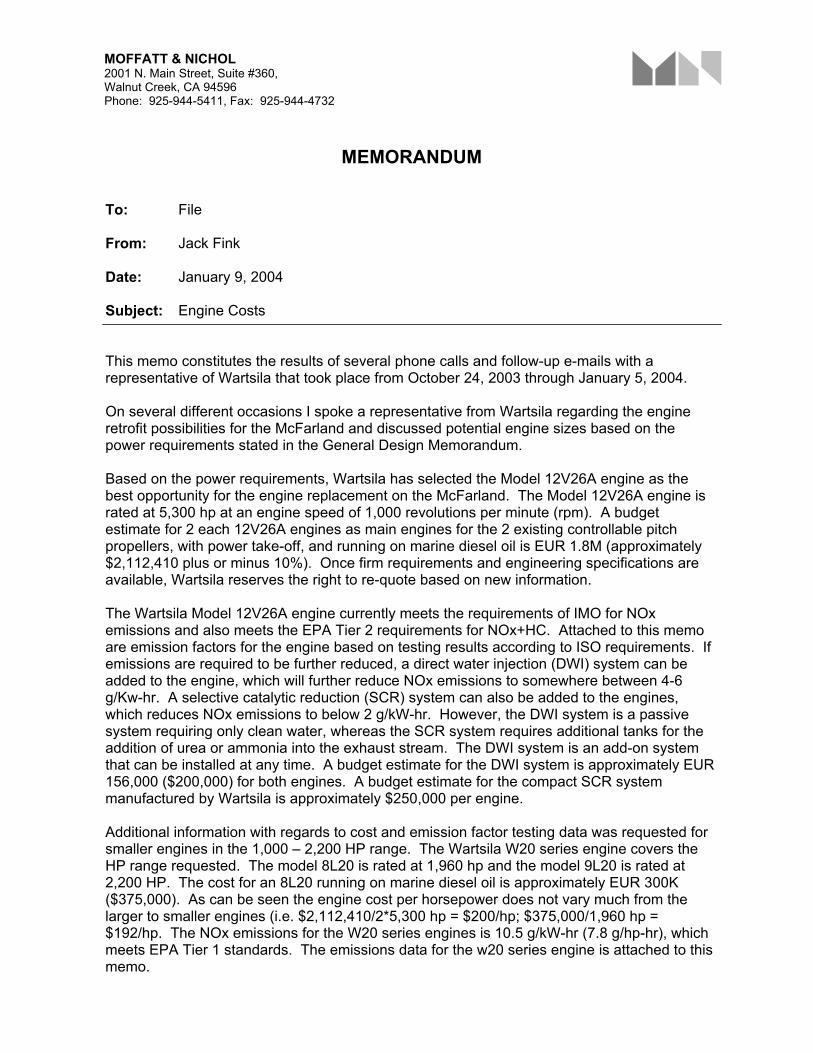
MOFFATT & NICHOL 2001 N. Main Street, Suite #360, Walnut Creek, CA 94596 Phone: 925-944-5411, Fax: 925-944-4732
MEMORANDUM To: File From: Jack Fink Date: January 9, 2004 Subject: Engine Costs This memo constitutes the results of several phone calls and follow-up e-mails with a representative of Wartsila that took place from October 24, 2003 through January 5, 2004. On several different occasions I spoke a representative from Wartsila regarding the engine retrofit possibilities for the McFarland and discussed potential engine sizes based on the power requirements stated in the General Design Memorandum. Based on the power requirements, Wartsila has selected the Model 12V26A engine as the best opportunity for the engine replacement on the McFarland. The Model 12V26A engine is rated at 5,300 hp at an engine speed of 1,000 revolutions per minute (rpm). A budget estimate for 2 each 12V26A engines as main engines for the 2 existing controllable pitch propellers, with power take-off, and running on marine diesel oil is EUR 1.8M (approximately $2,112,410 plus or minus 10%). Once firm requirements and engineering specifications are available, Wartsila reserves the right to re-quote based on new information. The Wartsila Model 12V26A engine currently meets the requirements of IMO for NOx emissions and also meets the EPA Tier 2 requirements for NOx+HC. Attached to this memo are emission factors for the engine based on testing results according to ISO requirements. If emissions are required to be further reduced, a direct water injection (DWI) system can be added to the engine, which will further reduce NOx emissions to somewhere between 4-6 g/Kw-hr. A selective catalytic reduction (SCR) system can also be added to the engines, which reduces NOx emissions to below 2 g/kW-hr. However, the DWI system is a passive system requiring only clean water, whereas the SCR system requires additional tanks for the addition of urea or ammonia into the exhaust stream. The DWI system is an add-on system that can be installed at any time. A budget estimate for the DWI system is approximately EUR 156,000 ($200,000) for both engines. A budget estimate for the compact SCR system manufactured by Wartsila is approximately $250,000 per engine. Additional information with regards to cost and emission factor testing data was requested for smaller engines in the 1,000 – 2,200 HP range. The Wartsila W20 series engine covers the HP range requested. The model 8L20 is rated at 1,960 hp and the model 9L20 is rated at 2,200 HP. The cost for an 8L20 running on marine diesel oil is approximately EUR 300K ($375,000). As can be seen the engine cost per horsepower does not vary much from the larger to smaller engines (i.e. $2,112,410/2*5,300 hp = $200/hp; $375,000/1,960 hp = $192/hp. The NOx emissions for the W20 series engines is 10.5 g/kW-hr (7.8 g/hp-hr), which meets EPA Tier 1 standards. The emissions data for the w20 series engine is attached to this memo.
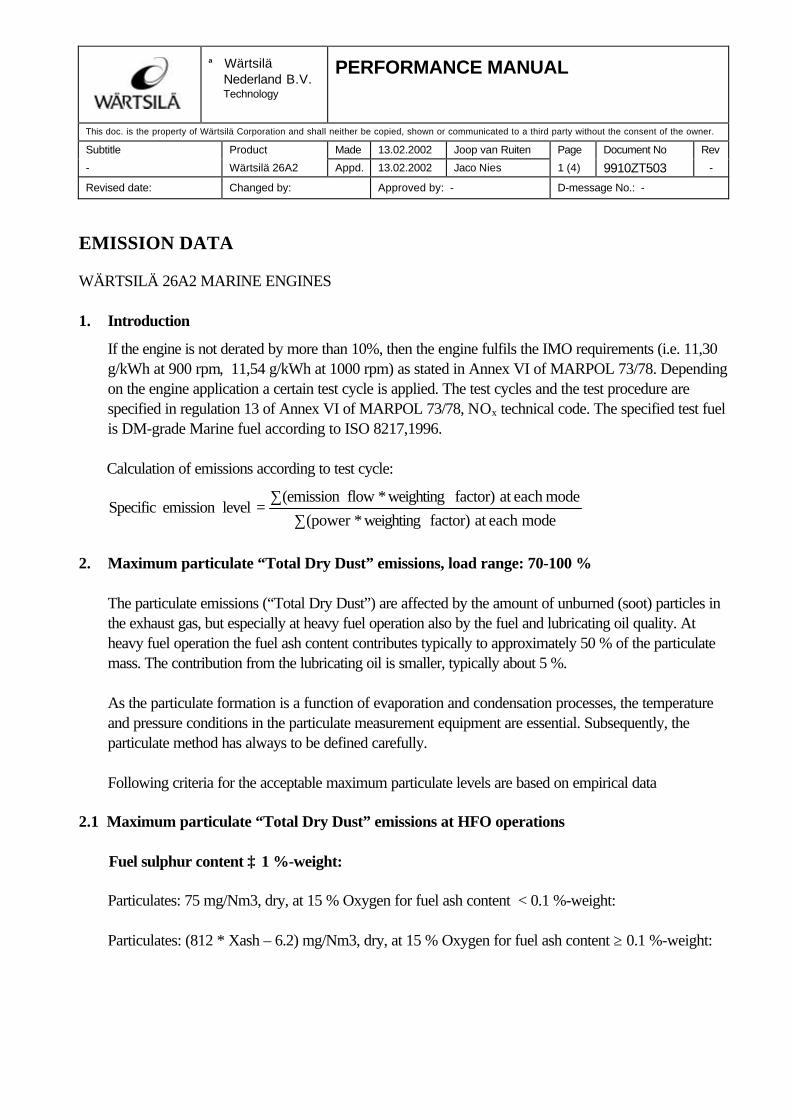
Wärtsilä Nederland B.V. Technology
PERFORMANCE MANUAL
This doc. is the property of Wärtsilä Corporation and shall neither be copied, shown or communicated to a third party without the consent of the owner.
Subtitle Product Made 13.02.2002 Joop van Ruiten Page Document No Rev- Wärtsilä 26A2 Appd. 13.02.2002 Jaco Nies 1 (4) 9910ZT503 -
Revised date: Changed by: Approved by: - D-message No.: -
EMISSION DATA
WÄRTSILÄ 26A2 MARINE ENGINES
1. Introduction
If the engine is not derated by more than 10%, then the engine fulfils the IMO requirements (i.e. 11,30g/kWh at 900 rpm, 11,54 g/kWh at 1000 rpm) as stated in Annex VI of MARPOL 73/78. Dependingon the engine application a certain test cycle is applied. The test cycles and the test procedure arespecified in regulation 13 of Annex VI of MARPOL 73/78, NOx technical code. The specified test fuelis DM-grade Marine fuel according to ISO 8217,1996.
Calculation of emissions according to test cycle:
modeeachatfactor)weighting(powermodeeachatfactor)weightingflow(emission
levelemissionSpecific∗∑
∗∑=
2. Maximum particulate “Total Dry Dust” emissions, load range: 70-100 %
The particulate emissions (“Total Dry Dust”) are affected by the amount of unburned (soot) particles inthe exhaust gas, but especially at heavy fuel operation also by the fuel and lubricating oil quality. Atheavy fuel operation the fuel ash content contributes typically to approximately 50 % of the particulatemass. The contribution from the lubricating oil is smaller, typically about 5 %.
As the particulate formation is a function of evaporation and condensation processes, the temperatureand pressure conditions in the particulate measurement equipment are essential. Subsequently, theparticulate method has always to be defined carefully.
Following criteria for the acceptable maximum particulate levels are based on empirical data
2.1 Maximum particulate “Total Dry Dust” emissions at HFO operations
Fuel sulphur content ≥ 1 %-weight:
Particulates: 75 mg/Nm3, dry, at 15 % Oxygen for fuel ash content < 0.1 %-weight:
Particulates: (812 * Xash – 6.2) mg/Nm3, dry, at 15 % Oxygen for fuel ash content ≥ 0.1 %-weight:
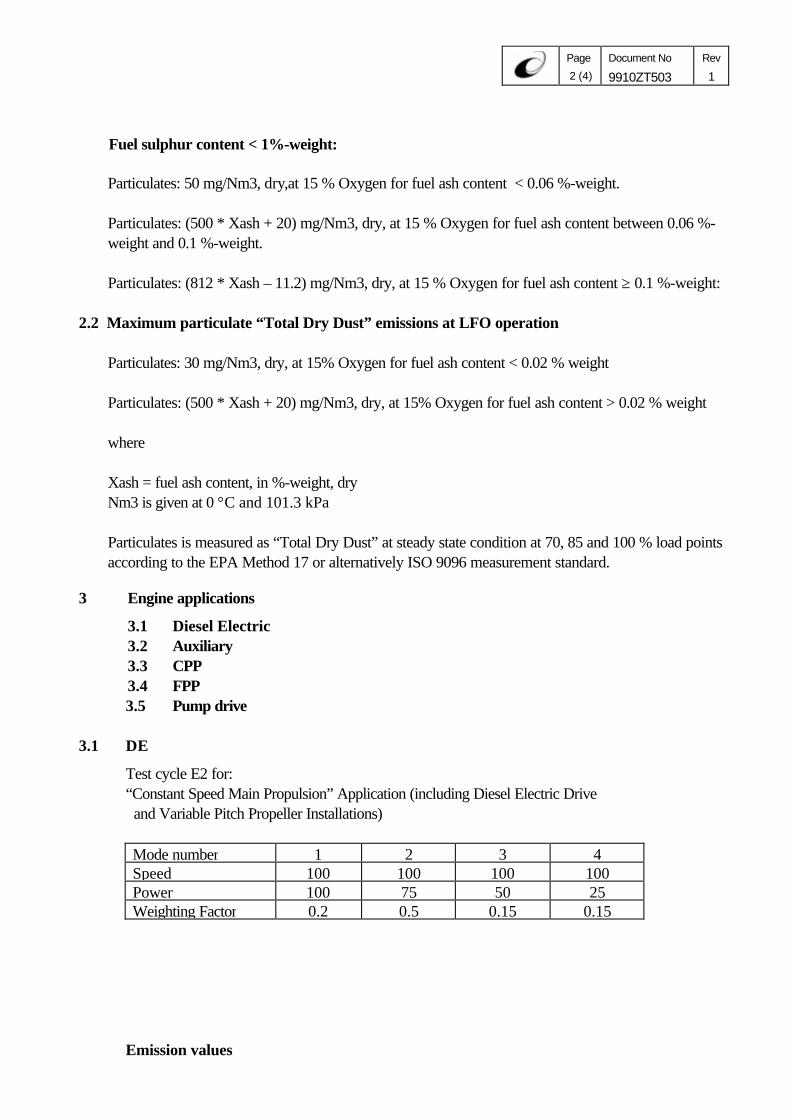
Page 2 (4)
Document No
9910ZT503Rev
1
Fuel sulphur content < 1%-weight:
Particulates: 50 mg/Nm3, dry,at 15 % Oxygen for fuel ash content < 0.06 %-weight.
Particulates: (500 * Xash + 20) mg/Nm3, dry, at 15 % Oxygen for fuel ash content between 0.06 %-weight and 0.1 %-weight.
Particulates: (812 * Xash – 11.2) mg/Nm3, dry, at 15 % Oxygen for fuel ash content ≥ 0.1 %-weight:
2.2 Maximum particulate “Total Dry Dust” emissions at LFO operation
Particulates: 30 mg/Nm3, dry, at 15% Oxygen for fuel ash content < 0.02 % weight
Particulates: (500 * Xash + 20) mg/Nm3, dry, at 15% Oxygen for fuel ash content > 0.02 % weight
where
Xash = fuel ash content, in %-weight, dryNm3 is given at 0 °C and 101.3 kPa
Particulates is measured as “Total Dry Dust” at steady state condition at 70, 85 and 100 % load pointsaccording to the EPA Method 17 or alternatively ISO 9096 measurement standard.
3 Engine applications
3.1 Diesel Electric3.2 Auxiliary3.3 CPP3.4 FPP3.5 Pump drive
3.1 DE
Test cycle E2 for:“Constant Speed Main Propulsion” Application (including Diesel Electric Drive and Variable Pitch Propeller Installations)
Mode number 1 2 3 4Speed 100 100 100 100Power 100 75 50 25Weighting Factor 0.2 0.5 0.15 0.15
Emission values
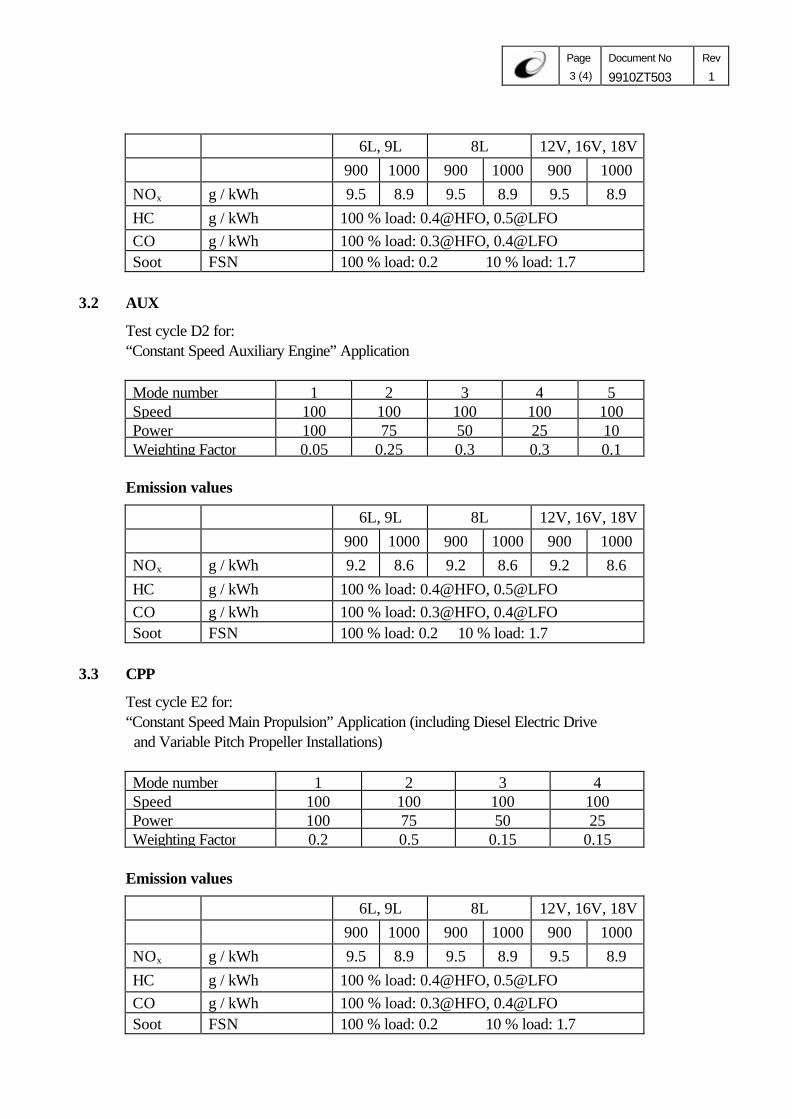
Page 3 (4)
Document No
9910ZT503Rev
1
6L, 9L 8L 12V, 16V, 18V900 1000 900 1000 900 1000
NOx g / kWh 9.5 8.9 9.5 8.9 9.5 8.9HC g / kWh 100 % load: 0.4@HFO, 0.5@LFOCO g / kWh 100 % load: 0.3@HFO, 0.4@LFOSoot FSN 100 % load: 0.2 10 % load: 1.7
3.2 AUX
Test cycle D2 for:“Constant Speed Auxiliary Engine” Application
Mode number 1 2 3 4 5Speed 100 100 100 100 100Power 100 75 50 25 10Weighting Factor 0.05 0.25 0.3 0.3 0.1
Emission values
6L, 9L 8L 12V, 16V, 18V900 1000 900 1000 900 1000
NOx g / kWh 9.2 8.6 9.2 8.6 9.2 8.6HC g / kWh 100 % load: 0.4@HFO, 0.5@LFOCO g / kWh 100 % load: 0.3@HFO, 0.4@LFOSoot FSN 100 % load: 0.2 10 % load: 1.7
3.3 CPP
Test cycle E2 for:“Constant Speed Main Propulsion” Application (including Diesel Electric Drive and Variable Pitch Propeller Installations)
Mode number 1 2 3 4Speed 100 100 100 100Power 100 75 50 25Weighting Factor 0.2 0.5 0.15 0.15
Emission values
6L, 9L 8L 12V, 16V, 18V900 1000 900 1000 900 1000
NOx g / kWh 9.5 8.9 9.5 8.9 9.5 8.9HC g / kWh 100 % load: 0.4@HFO, 0.5@LFOCO g / kWh 100 % load: 0.3@HFO, 0.4@LFOSoot FSN 100 % load: 0.2 10 % load: 1.7
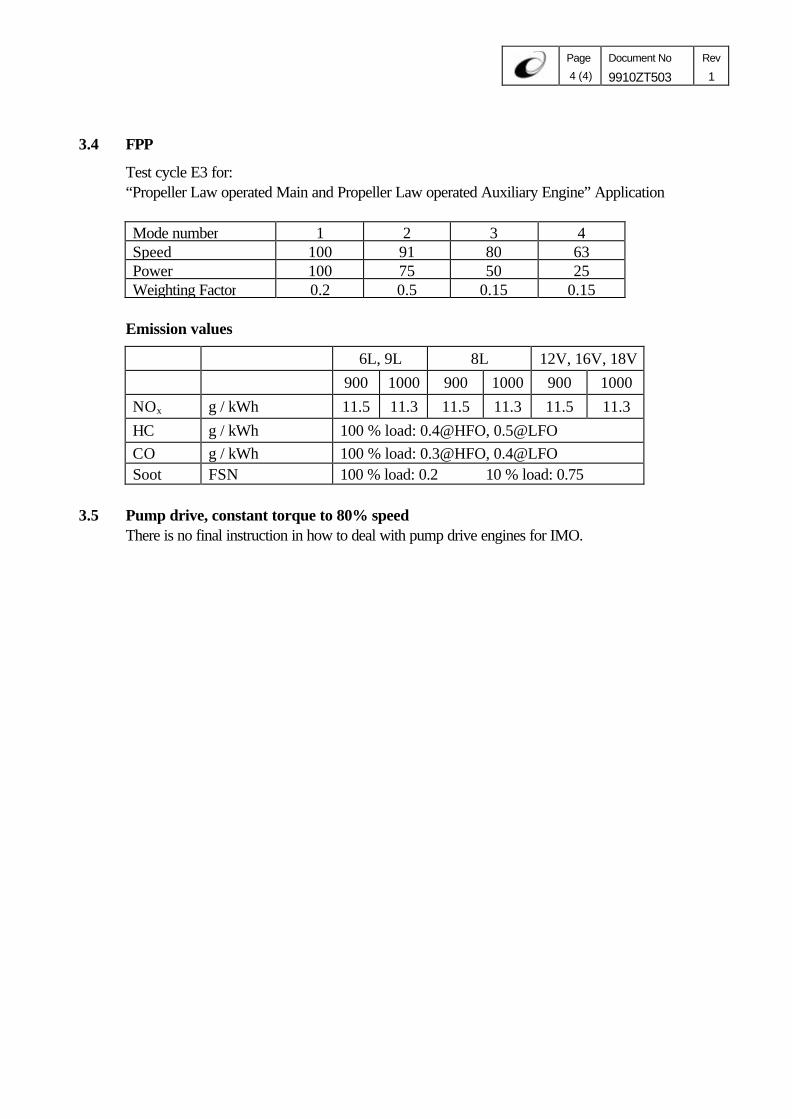
Page 4 (4)
Document No
9910ZT503Rev
1
3.4 FPP
Test cycle E3 for:“Propeller Law operated Main and Propeller Law operated Auxiliary Engine” Application
Mode number 1 2 3 4Speed 100 91 80 63Power 100 75 50 25Weighting Factor 0.2 0.5 0.15 0.15
Emission values
6L, 9L 8L 12V, 16V, 18V900 1000 900 1000 900 1000
NOx g / kWh 11.5 11.3 11.5 11.3 11.5 11.3HC g / kWh 100 % load: 0.4@HFO, 0.5@LFOCO g / kWh 100 % load: 0.3@HFO, 0.4@LFOSoot FSN 100 % load: 0.2 10 % load: 0.75
3.5 Pump drive, constant torque to 80% speedThere is no final instruction in how to deal with pump drive engines for IMO.
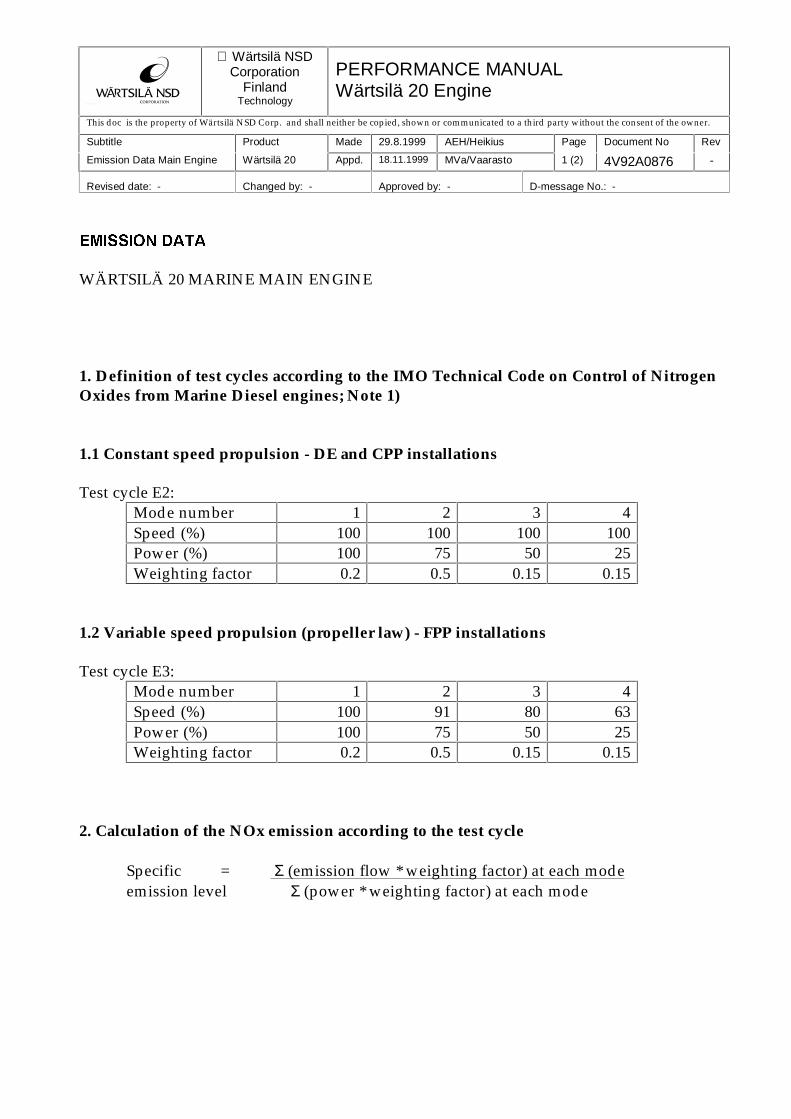
����
�Wärtsilä NSDCorporation
FinlandTechnology
PERFORMANCE MANUALWärtsilä 20 Engine
This doc is the property of Wärtsilä NSD Corp. and shall neither be copied, shown or communicated to a third party without the consent of the owner.
Subtitle Product Made 29.8.1999 AEH/Heikius Page Document No Rev
Emission Data Main Engine Wärtsilä 20 Appd. 18.11.1999 MVa/Vaarasto 1 (2) 4V92A0876 -
Revised date: - Changed by: - Approved by: - D-message No.: -
(0,66,21�'$7$
WÄRTSILÄ 20 MARINE MAIN ENGINE
1. Definition of test cycles according to the IMO Technical Code on Control of NitrogenOxides from Marine Diesel engines; Note 1)
1.1 Constant speed propulsion - DE and CPP installations
Test cycle E2:Mode number 1 2 3 4Speed (%) 100 100 100 100Power (%) 100 75 50 25Weighting factor 0.2 0.5 0.15 0.15
1.2 Variable speed propulsion (propeller law) - FPP installations
Test cycle E3:Mode number 1 2 3 4Speed (%) 100 91 80 63Power (%) 100 75 50 25Weighting factor 0.2 0.5 0.15 0.15
2. Calculation of the NOx emission according to the test cycle
Specific = Σ (emission flow * weighting factor) at each modeemission level Σ (power * weighting factor) at each mode
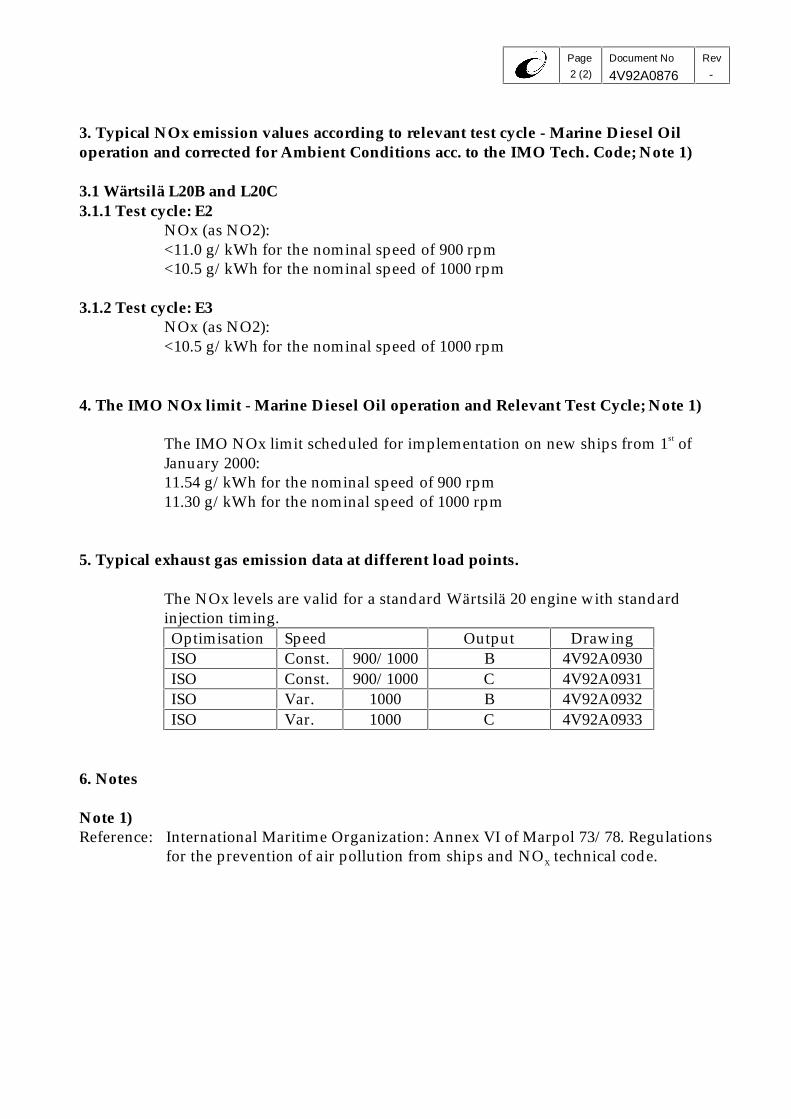
Page
2 (2)
Document No
4V92A0876Rev
-
3. Typical NOx emission values according to relevant test cycle - Marine Diesel Oiloperation and corrected for Ambient Conditions acc. to the IMO Tech. Code; Note 1)
3.1 Wärtsilä L20B and L20C3.1.1 Test cycle: E2
NOx (as NO2):<11.0 g/kWh for the nominal speed of 900 rpm<10.5 g/kWh for the nominal speed of 1000 rpm
3.1.2 Test cycle: E3NOx (as NO2):<10.5 g/kWh for the nominal speed of 1000 rpm
4. The IMO NOx limit - Marine Diesel Oil operation and Relevant Test Cycle; Note 1)
The IMO NOx limit scheduled for implementation on new ships from 1st ofJanuary 2000:11.54 g/kWh for the nominal speed of 900 rpm11.30 g/kWh for the nominal speed of 1000 rpm
5. Typical exhaust gas emission data at different load points.
The NOx levels are valid for a standard Wärtsilä 20 engine with standardinjection timing.Optimisation Speed Output DrawingISO Const. 900/1000 B 4V92A0930ISO Const. 900/1000 C 4V92A0931ISO Var. 1000 B 4V92A0932ISO Var. 1000 C 4V92A0933
6. Notes
Note 1)Reference: International Maritime Organization: Annex VI of Marpol 73/78. Regulations
for the prevention of air pollution from ships and NOX technical code.
Compact Selective Catalytic Reduction (Compact SCR)
Emission control

Compact Selective Catalytic ReductionWärtsilä has taken the lead in catalyst technology by developing the
Compact SCR solution for Wärtsilä engines. Compact SCR is a combined silencer
and SCR unit – hardly any bigger than an ordinary silencer.
Typically, over 99% of the emissions generated by a diesel
engine consist of the same elements as air: nitrogen, oxygen,
carbon dioxide and water. The sulphur dioxide component
can be reduced effectively by choosing the right engine fuel.
The emissions of carbon monoxide (CO), carbon dioxide
(CO ), hydrocarbons (THC) and particulates, are low due
to the superior thermal efficiency of the diesel process.
Minimizing NO , SO and CO emissions is central in
the effort to protect marine environments.
NO formation in a diesel engine is primarily caused by
locally high combustion temperatures in the combustion space.
Nitrogen oxides (NO ) contribute to acid rain, destroy
the ozone layer and produce photochemical smog. The Selective
2
X 2 2
X
X
The chemistry of SCRThe reducing agent is urea (40wt-% solution), which is aharmless substance used in the agricultural sector. Theurea solution is injected into the exhaust gas directly afterthe turbocharger. Urea decays immediately to ammoniumand carbon dioxide according to the following formula:
(NH ) CO + H O + heat 2 NH + CO2 2 2 3 2®
The mixture is passed through the catalyst, where NO isX
converted to nitrogen and water:
4 NO + 4 NH + O 4 N + 6 H O3 2 2 2®
6 NO + 8 NH 7 N + 12 H O2 3 2 2®
20
18
16
14
12
10100 500 1000 1500 2000N
O em
issi
ons,
wei
ghte
d (
g/kW
h)
X
Rated engine speed (rpm)
IMO global marine NO legislationX
Typical Wärtsilä engine NO emissionsX
NO emissions with Compact SCRX
Reference fuel: marine diesel oil
MARPOL Annex VI: Regulations for the preventionof air pollution from ships.
Concerns engines installed in new ships constructed from1.1.2000, and engines in existing ships undergoing a majorconversion. The engine has to fulfil the NO -limits set by
the curve below.X
To show compliance, the engine has to be certifiedaccording to the NO Technical Code, and delivered with
an EIAPP (Engine International Air Pollution Prevention)Letter of compliance.
X
The certification process includes NO measurement for the
engine type in concern, stamping of components that areaffecting NO formation and a Technical File that is delivered
with the engine.
X
X
Annex VI will enter into force 12 months after the date onwhich not less than 15 states, together constituting not lessthan 50 % of the gross tonnage of the world's merchantshipping, have become parties to it.
The standard Wärtsilä engines today fulfil IMO regulations.
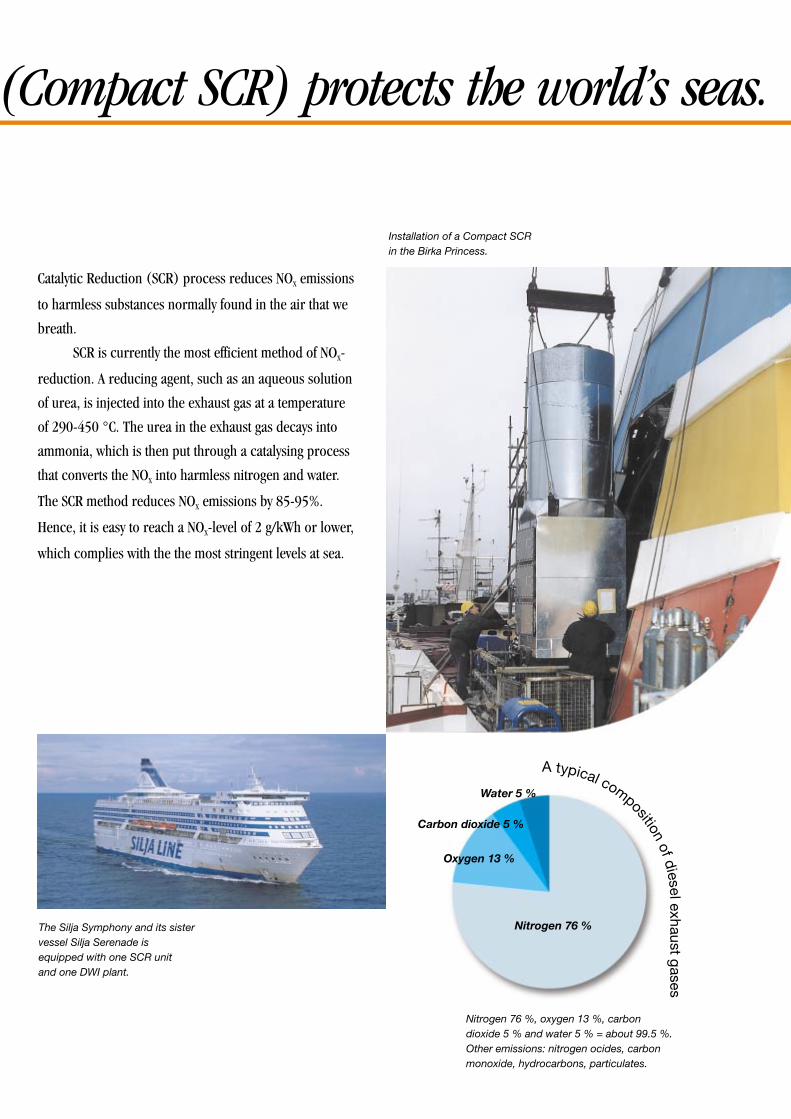
A typical compositionof dieselex hau st
g ase s
Water 5 %
Carbon dioxide 5 %
Oxygen 13 %
Nitrogen 76 %The Silja Symphony and its sistervessel Silja Serenade isequipped with one SCR unitand one DWI plant.
(Compact SCR) protects the world’s seas.
Catalytic Reduction (SCR) process reduces NO emissions
to harmless substances normally found in the air that we
breath.
SCR is currently the most efficient method of NO -
reduction. A reducing agent, such as an aqueous solution
of urea, is injected into the exhaust gas at a temperature
of 290-450 °C. The urea in the exhaust gas decays into
ammonia, which is then put through a catalysing process
that converts the NO into harmless nitrogen and water.
The SCR method reduces NO emissions by 85-95%.
Hence, it is easy to reach a NO -level of 2 g/kWh or lower,
which complies with the the most stringent levels at sea.
X
X
X
X
X
Installation of a Compact SCRin the Birka Princess.
Nitrogen 76 %, oxygen 13 %, carbondioxide 5 % and water 5 % = about 99.5 %.Other emissions: nitrogen ocides, carbonmonoxide, hydrocarbons, particulates.
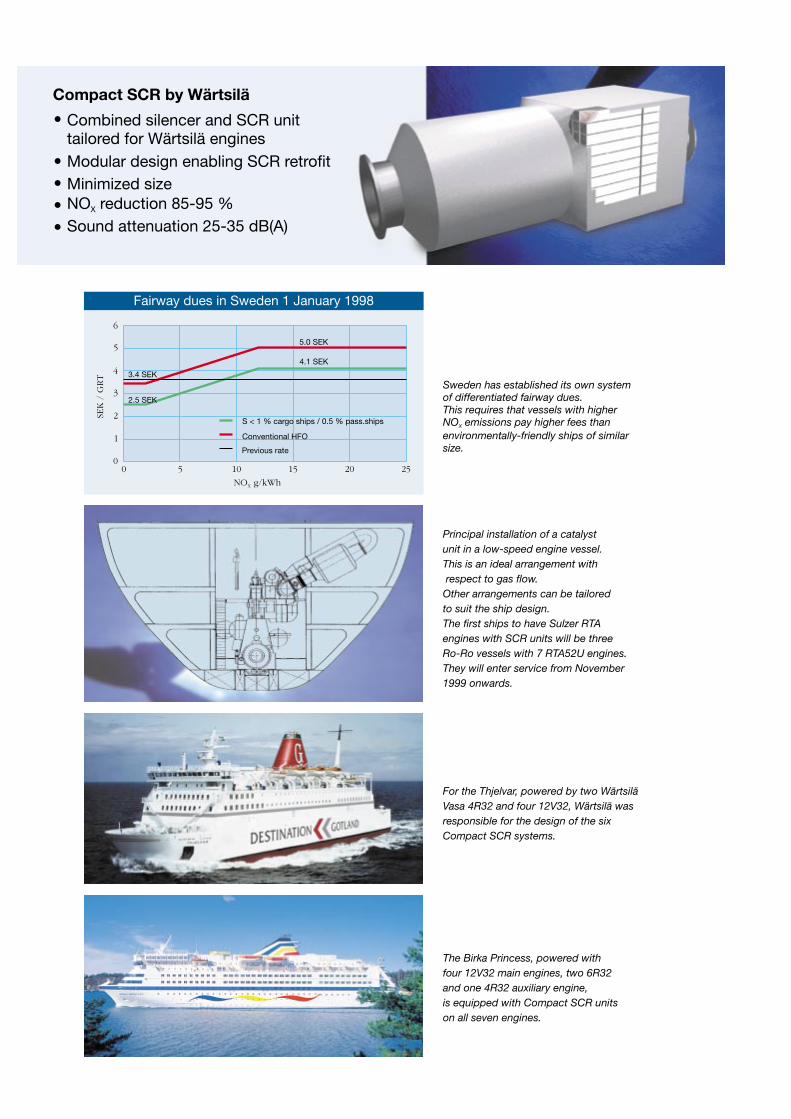
Compact SCR by Wärtsilä
Combined silencer and SCR unittailored for Wärtsilä enginesModular design enabling SCR retrofitMinimized sizeNO reduction 85-95 %X
Sound attenuation 25-35 dB(A)
0
1
2
3
4
5
6
0 5 10 15 20 25
NO g/kWhX
SEK
/ G
RT
Fairway dues in Sweden 1 January 1998
S < 1 % cargo ships / 0.5 % pass.ships
Conventional HFO
Previous rate
5.0 SEK
4.1 SEK
3.4 SEK
2.5 SEK
The Birka Princess, powered withfour 12V32 main engines, two 6R32and one 4R32 auxiliary engine,is equipped with Compact SCR unitson all seven engines.
For the Thjelvar, powered by two WärtsiläVasa 4R32 and four 12V32, Wärtsilä wasresponsible for the design of the sixCompact SCR systems.
Principal installation of a catalystunit in a low-speed engine vessel.This is an ideal arrangement withrespect to gas flow.Other arrangements can be tailoredto suit the ship design.The first ships to have Sulzer RTAengines with SCR units will be threeRo-Ro vessels with 7 RTA52U engines.They will enter service from November1999 onwards.
Sweden has established its own systemof differentiated fairway dues.This requires that vessels with higherNO emissions pay higher fees thanenvironmentally-friendly ships of similarsize.
X
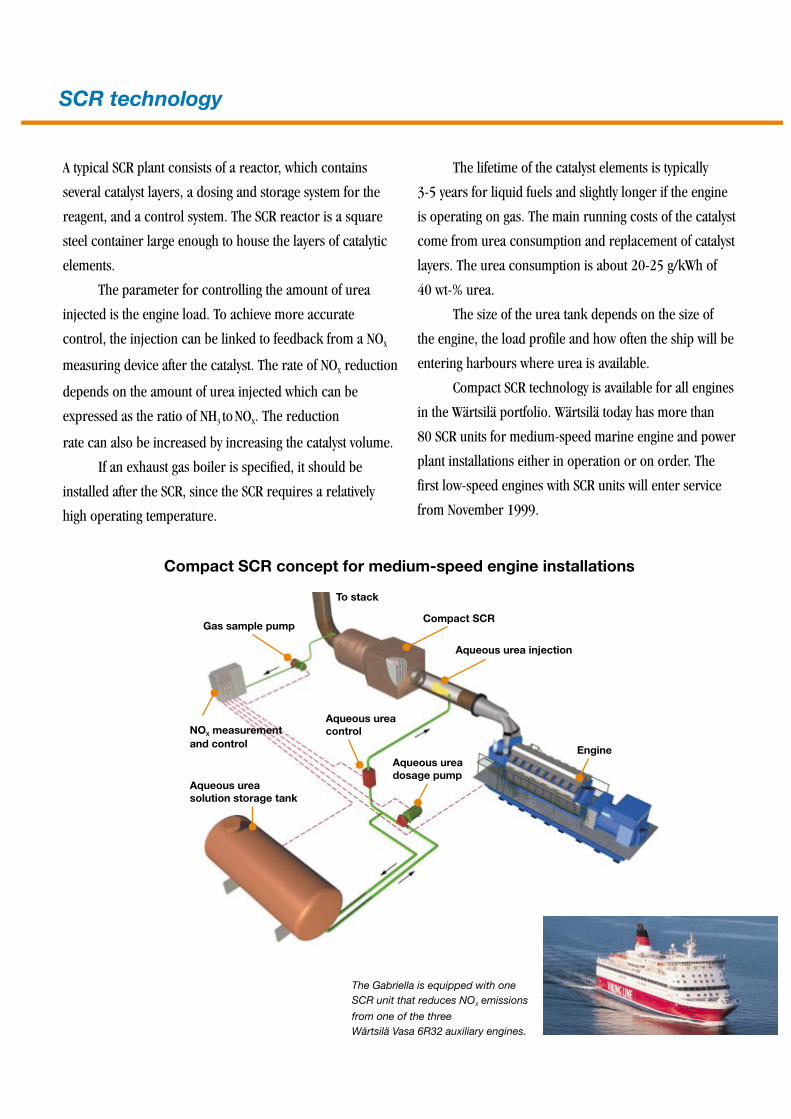
To stack
Compact SCR
Aqueous urea injection
Engine
NO measurementand control
X
Gas sample pump
Aqueous ureacontrol
Aqueous ureadosage pump
Aqueous ureasolution storage tank
The Gabriella is equipped with oneSCR unit that reduces NO emissions
from one of the threeWärtsilä Vasa 6R32 auxiliary engines.
X
A typical SCR plant consists of a reactor, which contains
several catalyst layers, a dosing and storage system for the
reagent, and a control system. The SCR reactor is a square
steel container large enough to house the layers of catalytic
elements.
The parameter for controlling the amount of urea
injected is the engine load. To achieve more accurate
control, the injection can be linked to feedback from a NO
measuring device after the catalyst. The rate of NO reduction
depends on the amount of urea injected which can be
expressed as the ratio of NH toNO . The reduction
rate can also be increased by increasing the catalyst volume.
If an exhaust gas boiler is specified, it should be
installed after the SCR, since the SCR requires a relatively
high operating temperature.
X
X
3 X
The lifetime of the catalyst elements is typically
3-5 years for liquid fuels and slightly longer if the engine
is operating on gas. The main running costs of the catalyst
come from urea consumption and replacement of catalyst
layers. The urea consumption is about 20-25 g/kWh of
40 wt-% urea.
The size of the urea tank depends on the size of
the engine, the load profile and how often the ship will be
entering harbours where urea is available.
Compact SCR technology is available for all engines
in the Wärtsilä portfolio. Wärtsilä today has more than
80 SCR units for medium-speed marine engine and power
plant installations either in operation or on order. The
first low-speed engines with SCR units will enter service
from November 1999.
SCR technology
Compact SCR concept for medium-speed engine installations
W00
10E
/ B
ock´
s O
ffice
/
For more information please visit:www.wartsila.com
Wärtsilä Finland OyP.O.Box 252, FIN-65101 Vaasa, FinlandTelephone +358 10 709 00 00Telecopier +358-6-356 7188
Wärtsilä Corporation is the leading global ship power supplier and a
major provider of solutions for decentralized power generation and
of supporting services. In addition Wärtsilä operates a Nordic
engineering steel company and manages substantial share holdings
to support the development of its core business.
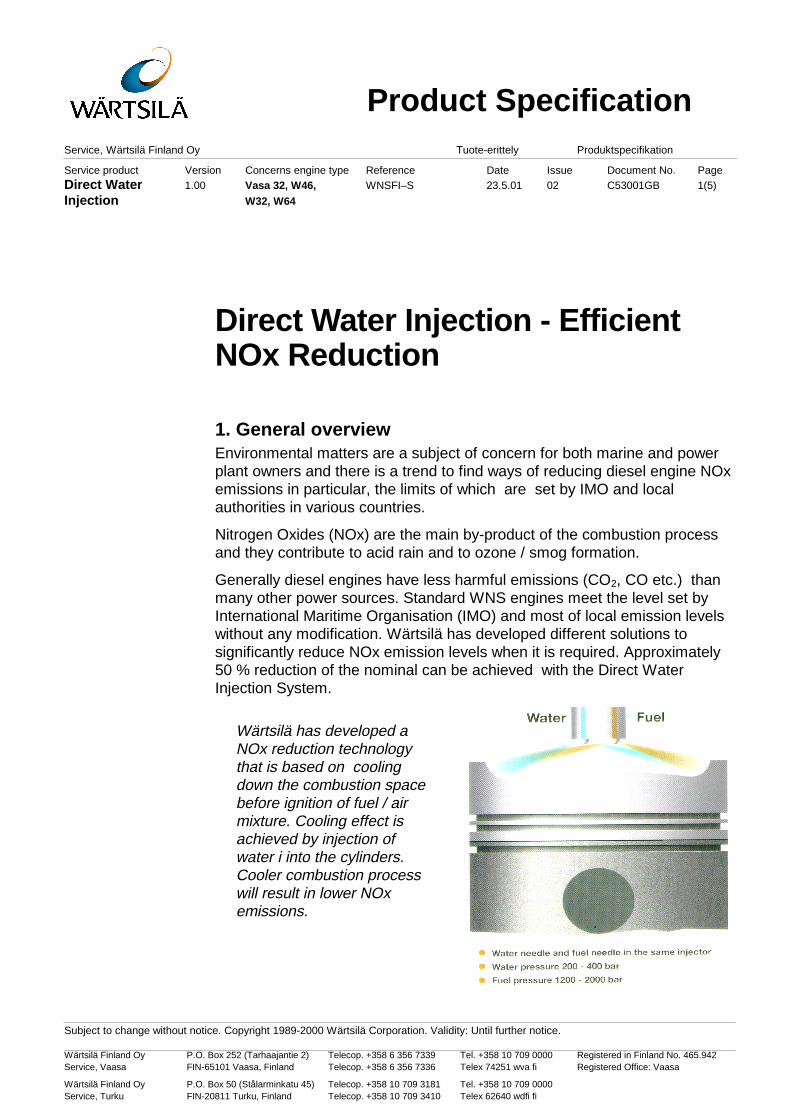
Service, Wärtsilä Finland Oy Tuote-erittely Produktspecifikation
Service product Version Concerns engine type Reference Date Issue Document No. PageDirect Water 1.00 Vasa 32, W46, WNSFI–S 23.5.01 02 C53001GB 1(5)
Injection W32, W64
Subject to change without notice. Copyright 1989-2000 Wärtsilä Corporation. Validity: Until further notice.
Wärtsilä Finland Oy P.O. Box 252 (Tarhaajantie 2) Telecop. +358 6 356 7339 Tel. +358 10 709 0000 Registered in Finland No. 465.942Service, Vaasa FIN-65101 Vaasa, Finland Telecop. +358 6 356 7336 Telex 74251 wva fi Registered Office: Vaasa
Wärtsilä Finland Oy P.O. Box 50 (Stålarminkatu 45) Telecop. +358 10 709 3181 Tel. +358 10 709 0000Service, Turku FIN-20811 Turku, Finland Telecop. +358 10 709 3410 Telex 62640 wdfi fi
Direct Water Injection - EfficientNOx Reduction
1. General overviewEnvironmental matters are a subject of concern for both marine and powerplant owners and there is a trend to find ways of reducing diesel engine NOxemissions in particular, the limits of which are set by IMO and localauthorities in various countries.
Nitrogen Oxides (NOx) are the main by-product of the combustion processand they contribute to acid rain and to ozone / smog formation.
Generally diesel engines have less harmful emissions (CO2, CO etc.) thanmany other power sources. Standard WNS engines meet the level set byInternational Maritime Organisation (IMO) and most of local emission levelswithout any modification. Wärtsilä has developed different solutions tosignificantly reduce NOx emission levels when it is required. Approximately50 % reduction of the nominal can be achieved with the Direct WaterInjection System.
Product Specification
Wärtsilä has developed aNOx reduction technologythat is based on coolingdown the combustion spacebefore ignition of fuel / airmixture. Cooling effect isachieved by injection ofwater i into the cylinders.Cooler combustion processwill result in lower NOxemissions.
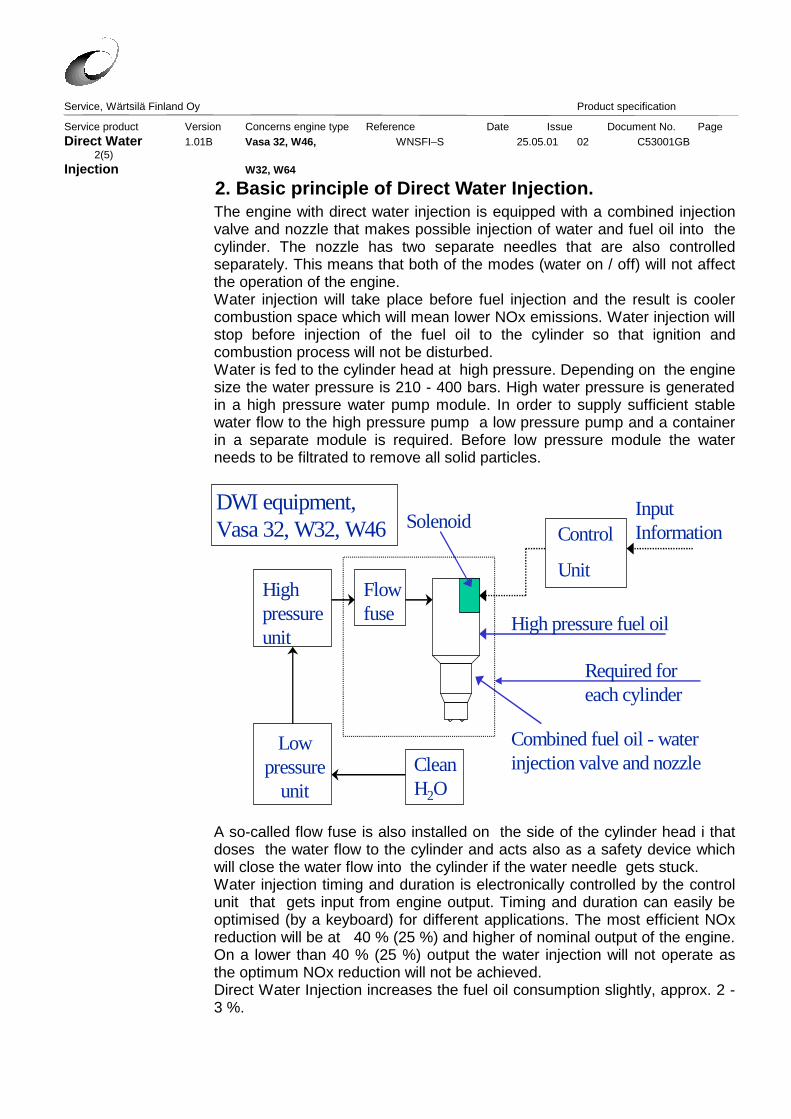
Service, Wärtsilä Finland Oy Product specification
Service product Version Concerns engine type Reference Date Issue Document No. PageDirect Water 1.01B Vasa 32, W46, WNSFI–S 25.05.01 02 C53001GB
2(5)Injection W32, W64
2. Basic principle of Direct Water Injection.The engine with direct water injection is equipped with a combined injectionvalve and nozzle that makes possible injection of water and fuel oil into thecylinder. The nozzle has two separate needles that are also controlledseparately. This means that both of the modes (water on / off) will not affectthe operation of the engine.Water injection will take place before fuel injection and the result is coolercombustion space which will mean lower NOx emissions. Water injection willstop before injection of the fuel oil to the cylinder so that ignition andcombustion process will not be disturbed.Water is fed to the cylinder head at high pressure. Depending on the enginesize the water pressure is 210 - 400 bars. High water pressure is generatedin a high pressure water pump module. In order to supply sufficient stablewater flow to the high pressure pump a low pressure pump and a containerin a separate module is required. Before low pressure module the waterneeds to be filtrated to remove all solid particles.
A so-called flow fuse is also installed on the side of the cylinder head i thatdoses the water flow to the cylinder and acts also as a safety device whichwill close the water flow into the cylinder if the water needle gets stuck.Water injection timing and duration is electronically controlled by the controlunit that gets input from engine output. Timing and duration can easily beoptimised (by a keyboard) for different applications. The most efficient NOxreduction will be at 40 % (25 %) and higher of nominal output of the engine.On a lower than 40 % (25 %) output the water injection will not operate asthe optimum NOx reduction will not be achieved.Direct Water Injection increases the fuel oil consumption slightly, approx. 2 -3 %.
Control
Unit
CleanH2O
Lowpressure
unit
Highpressureunit
Flowfuse High pressure fuel oil
InputInformation
Solenoid
Combined fuel oil - waterinjection valve and nozzle
DWI equipment,Vasa 32, W32, W46
Required foreach cylinder
Service, Wärtsilä Finland Oy Product specification
Service product Version Concerns engine type Reference Date Issue Document No. PageDirect Water 1.01B Vasa 32, W46, WNSFI–S 25.05.01 02 C53001GB
3(5)Injection W32, W64
3. The benefits of Direct Water InjectionDirect Water Injection is an environmentally friendly way of reducing NOxemissions significantly. The system requires only clean water and a fewadditional pieces of equipment and the engine will meet emission limits setby the local environmental authorities.
- NOx emissions are reduced by 50 - 60 %.- NOx in marine diesel oil (MDO) typically 4-6 g/kWh. In HFO
operation the NOx typically 6-7 g/kWh- No negative influence on engine components- Engine can be operated also without water injection if
required- Engine can be transferred to "non-water" operational mode
at any load.- In alarm situation transfer to "non-water" mode is automatic
and instant.- Space requirements for the equipment are minimal and
therefore the system can be installed in all installations.- Investment and operational costs are low- Injected water / injected fuel ratio typically 0.4 - 0.7
4. Scope of supplyDirect Water Injection package offered by Wärtsilä includes following:
- Low Pressure Module (size 1000 x 1000 x 1700) to supply3.5 bar water pressure into the High Pressure Module. Themodule includes water container 400 litre's (fresh water +return water from the engine), electric driven pump (3000l/min) and 10 µm filter units (1 in operation / 1 on stand-by). One Low Pressure Module can supply more than oneengine if required. However limitations need to be checkedbased on the number of engines.
- Alternatively a Dual Filter Unit can be supplied if theinstallation has a suitable water flow, pressure and acontainer for feeding the high pressure module
- High Pressure Module (size 1000 x 1000 x 1700) to supply200 - 400 bar water to the cylinder heads. The moduleincludes electric-driven high pressure water pump. Thecapacity of the pump is controlled by adjusting the pumprpm by frequency controller (included in the module). Pulsedamper, required safety valves and additional 10 µm filterare in the module.
- Flow fuse for each cylinder. Flow fuses are fixed on theside of the cylinder heads and will dose the water flow tothe cylinder and also act as a safety device for excessivewater flow. Operation is controlled automatically by the highpressure module.
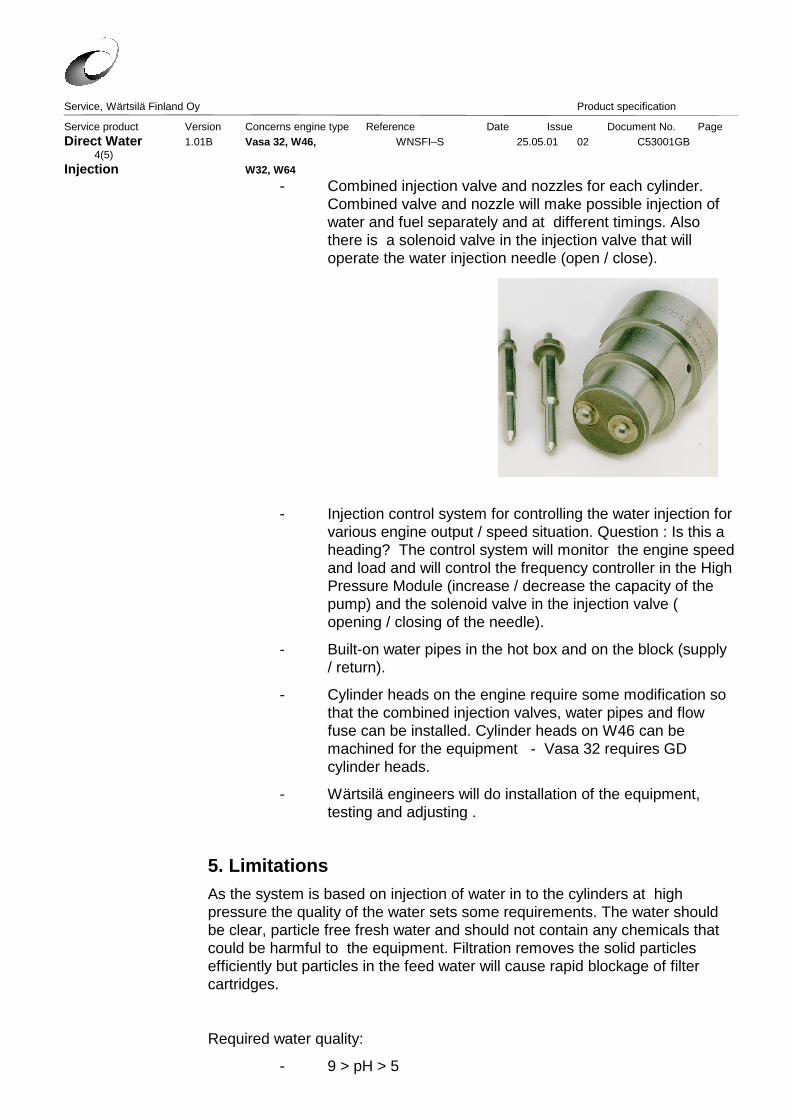
Service, Wärtsilä Finland Oy Product specification
Service product Version Concerns engine type Reference Date Issue Document No. PageDirect Water 1.01B Vasa 32, W46, WNSFI–S 25.05.01 02 C53001GB
4(5)Injection W32, W64
- Combined injection valve and nozzles for each cylinder.Combined valve and nozzle will make possible injection ofwater and fuel separately and at different timings. Alsothere is a solenoid valve in the injection valve that willoperate the water injection needle (open / close).
- Injection control system for controlling the water injection forvarious engine output / speed situation. Question : Is this aheading? The control system will monitor the engine speedand load and will control the frequency controller in the HighPressure Module (increase / decrease the capacity of thepump) and the solenoid valve in the injection valve (opening / closing of the needle).
- Built-on water pipes in the hot box and on the block (supply/ return).
- Cylinder heads on the engine require some modification sothat the combined injection valves, water pipes and flowfuse can be installed. Cylinder heads on W46 can bemachined for the equipment - Vasa 32 requires GDcylinder heads.
- Wärtsilä engineers will do installation of the equipment,testing and adjusting .
5. LimitationsAs the system is based on injection of water in to the cylinders at highpressure the quality of the water sets some requirements. The water shouldbe clear, particle free fresh water and should not contain any chemicals thatcould be harmful to the equipment. Filtration removes the solid particlesefficiently but particles in the feed water will cause rapid blockage of filtercartridges.
Required water quality:
- 9 > pH > 5
Service, Wärtsilä Finland Oy Product specification
Service product Version Concerns engine type Reference Date Issue Document No. PageDirect Water 1.01B Vasa 32, W46, WNSFI–S 25.05.01 02 C53001GB
5(5)Injection W32, W64
- Hardness max. 10 d H
- Chlorides < 80 mg /l
- Particles < 50 mg/l, SiO2< 50 mg/l
- Fresh water to be used, not contaminated by oil, grease,surfactants or similar impurities. If the water quality issuspect then a thorough analysis should be conducted priorto using the Direct Water Injection system for the first time .
The installation needs to have a steady supply of fresh water. Waterconsumption varies according to size of the engine. Water consumption is~100 - 130 g/kWh
6. ContactFor the inquiries on the Direct Water Injection please contact your localWärtsilä office or Wärtsilä Finland Oy.
MOFFATT & NICHOL 2001 N. Main Street, Suite #360, Walnut Creek, CA 94596 Phone: 925-944-5411, Fax: 925-944-4732
MEMORANDUM
To: File
From: Jack Fink
Date: December 8, 2003
Subject:
Electrification of Hydraulic Dredges
This memo constitutes the results of a phone call with a representative from Baltimore Dredges, LLC regarding the potential electrification of hydraulic dredges as part of the emission reduction plans for the Delaware River Main Channel Deepening Project.
A survey of private industry hydraulic dredges (30-inch diameter and larger) was reviewed to determine which dredges are electrically powered, which dredges are diesel-electric, and which dredges are direct-drive diesel. There are currently thirteen 30-inch or greater hydraulic dredges in the domestic fleet. Three of the dredges are entirely electrically powered, two are powered by generators that are driven by diesel engines, and the remaining eight dredges are powered by a split system (the main pump is powered by a direct-drive diesel engine and the remaining systems are powered by diesel-electric motors).
The requirements to convert the dredges from their current conditions to a fully electric operation was discussed along with order of magnitude costs to perform the retrofit work.
MOFFATT & NICHOL 2001 N. Main Street, Suite #360, Walnut Creek, CA 94596 Phone: 925-944-5411, Fax: 925-944-4732
MEMORANDUM
To: File
From: Jack Fink
Date: November 18, 2003
Subject:
Engine Costs
This memo constitutes the results of several phone calls with a representative from Marine Systems, Inc., whom represent General Motors EMD engine line. The phone conversations took place from October 24 through November 18, 2003.
On several different occasions I spoke with a representative from Marine Systems, Inc. regarding the engine retrofit possibilities for the Corps of Engineers Hopper Dredge McFarland and information on emission factors for original ALCO engines (Marine Systems, Inc. has performed repair work on the engines previously). Discussed potential engine sizes based on the power requirements stated in the General Design Memorandum.
As a result of the discussions, Marine Systems, Inc. has offered the EMD Model ME16V265H engine as the best opportunity for the engine replacement on the McFarland. The EMD Model ME16V265H is rated at 6000 hp at an engine speed of 900 revolutions per minute (rpm). The EMD Model ME16V265H engine currently meets the requirements of IMO NOx emissions. In addition, the EMD Model ME16V265H engine can be manufactured to meet EPA Tier 2 emissions requirements for NOx+HC. However, in order to achieve these future values there will be a slight increase in fuel consumption.
A Rough Order of Magnitude (ROM) cost for the base engine is $750,000 per each, with 2 engines being required. ROM cost does not include any auxiliary equipment necessary to support the engine. Once firm requirements and engineering specifications are available, Marine Systems, Inc. reserves the right to re-quote based on new information.
With regard to the emission factors for the current ALCO engines on the McFarland, emission factor information is not available due to the age of the engines.
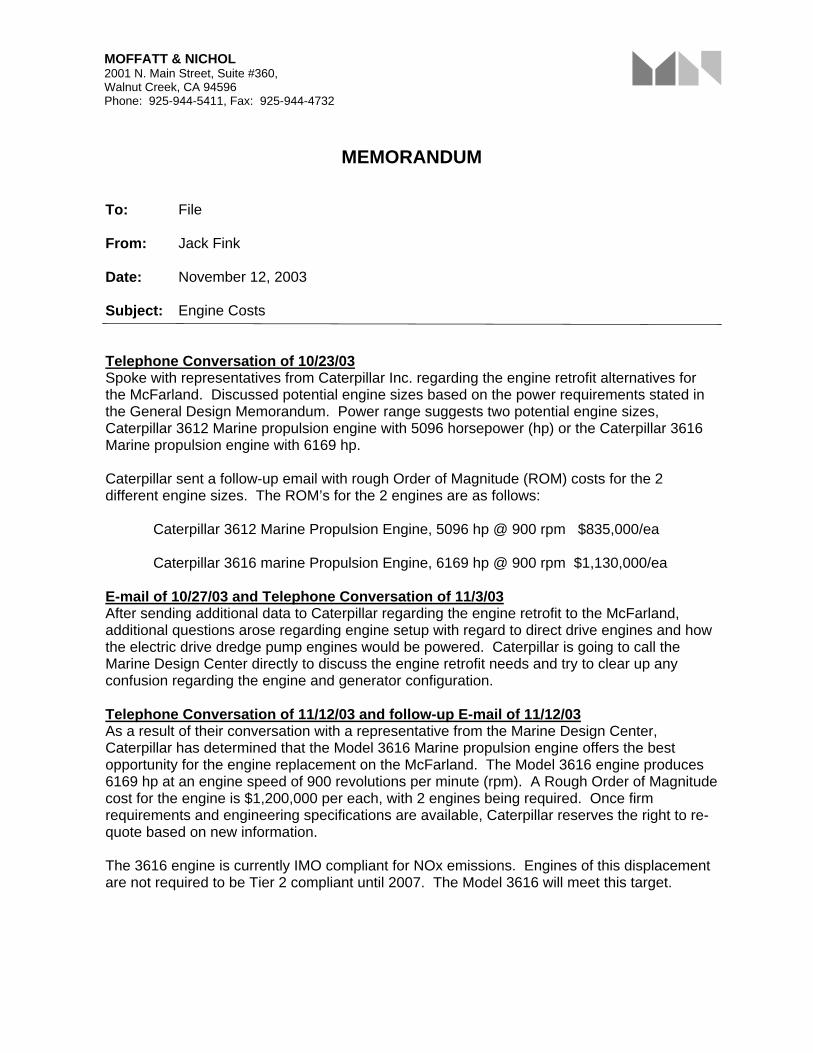
MOFFATT & NICHOL 2001 N. Main Street, Suite #360, Walnut Creek, CA 94596 Phone: 925-944-5411, Fax: 925-944-4732
MEMORANDUM
To: File
From: Jack Fink
Date: November 12, 2003
Subject:
Engine Costs
Telephone Conversation of 10/23/03
Spoke with representatives from Caterpillar Inc. regarding the engine retrofit alternatives for the McFarland. Discussed potential engine sizes based on the power requirements stated in the General Design Memorandum. Power range suggests two potential engine sizes, Caterpillar 3612 Marine propulsion engine with 5096 horsepower (hp) or the Caterpillar 3616 Marine propulsion engine with 6169 hp.
Caterpillar sent a follow-up email with rough Order of Magnitude (ROM) costs for the 2 different engine sizes. The ROM’s for the 2 engines are as follows:
Caterpillar 3612 Marine Propulsion Engine, 5096 hp @ 900 rpm $835,000/ea
Caterpillar 3616 marine Propulsion Engine, 6169 hp @ 900 rpm $1,130,000/ea
E-mail of 10/27/03 and Telephone Conversation of 11/3/03
After sending additional data to Caterpillar regarding the engine retrofit to the McFarland, additional questions arose regarding engine setup with regard to direct drive engines and how the electric drive dredge pump engines would be powered. Caterpillar is going to call the Marine Design Center directly to discuss the engine retrofit needs and try to clear up any confusion regarding the engine and generator configuration.
Telephone Conversation of 11/12/03 and follow-up E-mail of 11/12/03
As a result of their conversation with a representative from the Marine Design Center, Caterpillar has determined that the Model 3616 Marine propulsion engine offers the best opportunity for the engine replacement on the McFarland. The Model 3616 engine produces 6169 hp at an engine speed of 900 revolutions per minute (rpm). A Rough Order of Magnitude cost for the engine is $1,200,000 per each, with 2 engines being required. Once firm requirements and engineering specifications are available, Caterpillar reserves the right to re-quote based on new information.
The 3616 engine is currently IMO compliant for NOx emissions. Engines of this displacement are not required to be Tier 2 compliant until 2007. The Model 3616 will meet this target.
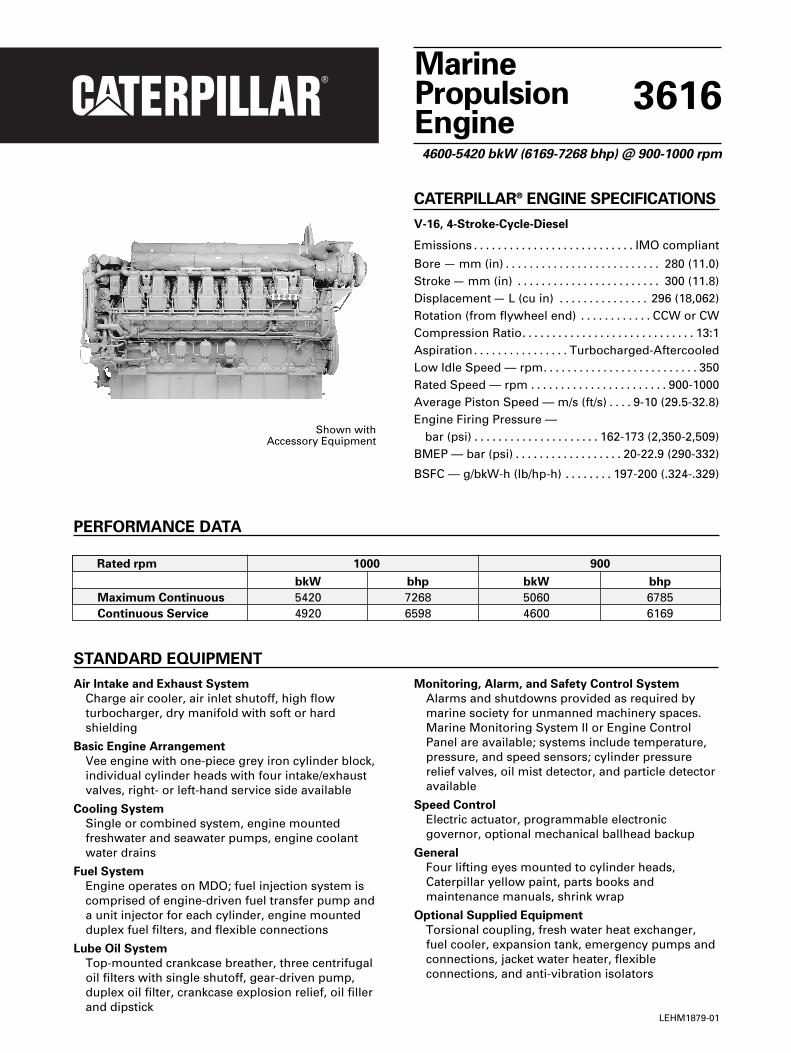
CATERPILLAR® ENGINE SPECIFICATIONS
V-16, 4-Stroke-Cycle-Diesel
Emissions . . . . . . . . . . . . . . . . . . . . . . . . . . . IMO compliant
Bore — mm (in) . . . . . . . . . . . . . . . . . . . . . . . . . . 280 (11.0)Stroke — mm (in) . . . . . . . . . . . . . . . . . . . . . . . . 300 (11.8)Displacement — L (cu in) . . . . . . . . . . . . . . . 296 (18,062)Rotation (from flywheel end) . . . . . . . . . . . . CCW or CWCompression Ratio. . . . . . . . . . . . . . . . . . . . . . . . . . . . . 13:1Aspiration. . . . . . . . . . . . . . . . Turbocharged-AftercooledLow Idle Speed — rpm. . . . . . . . . . . . . . . . . . . . . . . . . . 350Rated Speed — rpm . . . . . . . . . . . . . . . . . . . . . . . 900-1000Average Piston Speed — m/s (ft/s) . . . . 9-10 (29.5-32.8)Engine Firing Pressure —
bar (psi) . . . . . . . . . . . . . . . . . . . . . 162-173 (2,350-2,509)BMEP — bar (psi) . . . . . . . . . . . . . . . . . . 20-22.9 (290-332)
BSFC — g/bkW-h (lb/hp-h) . . . . . . . . 197-200 (.324-.329)
MarinePropulsionEngine
3616
4600-5420 bkW (6169-7268 bhp) @ 900-1000 rpm
PERFORMANCE DATA
Shown withAccessory Equipment
Rated rpm 1000 900
bkW bhp bkW bhp
Maximum Continuous 5420 7268 5060 6785Continuous Service 4920 6598 4600 6169
STANDARD EQUIPMENT
Air Intake and Exhaust System
Charge air cooler, air inlet shutoff, high flowturbocharger, dry manifold with soft or hardshielding
Basic Engine Arrangement
Vee engine with one-piece grey iron cylinder block,individual cylinder heads with four intake/exhaustvalves, right- or left-hand service side available
Cooling System
Single or combined system, engine mountedfreshwater and seawater pumps, engine coolantwater drains
Fuel System
Engine operates on MDO; fuel injection system iscomprised of engine-driven fuel transfer pump anda unit injector for each cylinder, engine mountedduplex fuel filters, and flexible connections
Lube Oil System
Top-mounted crankcase breather, three centrifugaloil filters with single shutoff, gear-driven pump,duplex oil filter, crankcase explosion relief, oil fillerand dipstick
Monitoring, Alarm, and Safety Control System
Alarms and shutdowns provided as required bymarine society for unmanned machinery spaces.Marine Monitoring System II or Engine ControlPanel are available; systems include temperature,pressure, and speed sensors; cylinder pressurerelief valves, oil mist detector, and particle detectoravailable
Speed Control
Electric actuator, programmable electronicgovernor, optional mechanical ballhead backup
General
Four lifting eyes mounted to cylinder heads,Caterpillar yellow paint, parts books andmaintenance manuals, shrink wrap
Optional Supplied Equipment
Torsional coupling, fresh water heat exchanger,fuel cooler, expansion tank, emergency pumps andconnections, jacket water heater, flexibleconnections, and anti-vibration isolators
LEHM1879-01
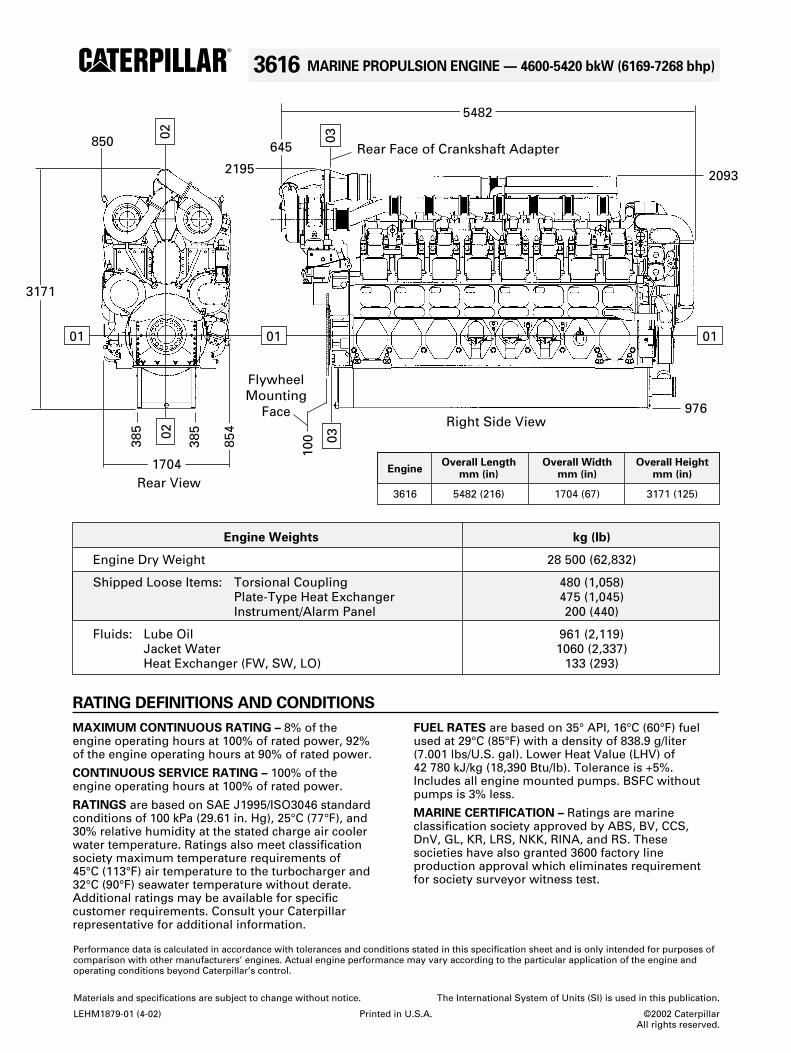
Materials and specifications are subject to change without notice. The International System of Units (SI) is used in this publication.
LEHM1879-01 (4-02) Printed in U.S.A. ©2002 CaterpillarAll rights reserved.
Performance data is calculated in accordance with tolerances and conditions stated in this specification sheet and is only intended for purposes ofcomparison with other manufacturers’ engines. Actual engine performance may vary according to the particular application of the engine andoperating conditions beyond Caterpillar’s control.
3616 MARINE PROPULSION ENGINE — 4600-5420 bkW (6169-7268 bhp)
MAXIMUM CONTINUOUS RATING – 8% of theengine operating hours at 100% of rated power, 92%of the engine operating hours at 90% of rated power.
CONTINUOUS SERVICE RATING – 100% of theengine operating hours at 100% of rated power.
RATINGS are based on SAE J1995/ISO3046 standardconditions of 100 kPa (29.61 in. Hg), 25°C (77°F), and30% relative humidity at the stated charge air coolerwater temperature. Ratings also meet classificationsociety maximum temperature requirements of 45°C (113°F) air temperature to the turbocharger and32°C (90°F) seawater temperature without derate.Additional ratings may be available for specificcustomer requirements. Consult your Caterpillarrepresentative for additional information.
FUEL RATES are based on 35° API, 16°C (60°F) fuelused at 29°C (85°F) with a density of 838.9 g/liter(7.001 lbs/U.S. gal). Lower Heat Value (LHV) of 42 780 kJ/kg (18,390 Btu/lb). Tolerance is +5%.Includes all engine mounted pumps. BSFC withoutpumps is 3% less.
MARINE CERTIFICATION – Ratings are marineclassification society approved by ABS, BV, CCS,DnV, GL, KR, LRS, NKK, RINA, and RS. Thesesocieties have also granted 3600 factory lineproduction approval which eliminates requirementfor society surveyor witness test.
RATING DEFINITIONS AND CONDITIONS
Engine Weights kg (lb)
Engine Dry Weight 28 500 (62,832)
Shipped Loose Items: Torsional Coupling 480 (1,058)Plate-Type Heat Exchanger 475 (1,045)Instrument/Alarm Panel 200 (440)
Fluids: Lube Oil 961 (2,119)Jacket Water 1060 (2,337)Heat Exchanger (FW, SW, LO) 133 (293)
Rear Face of Crankshaft Adapter
20932195
01
0202
385
850
385
FlywheelMounting
Face
03
Right Side View
Rear ViewEngine
Overall Length Overall Width Overall Heightmm (in) mm (in) mm (in)
3616 5482 (216) 1704 (67) 3171 (125)
976
0103
645
5482
100
3171
01
1704
854
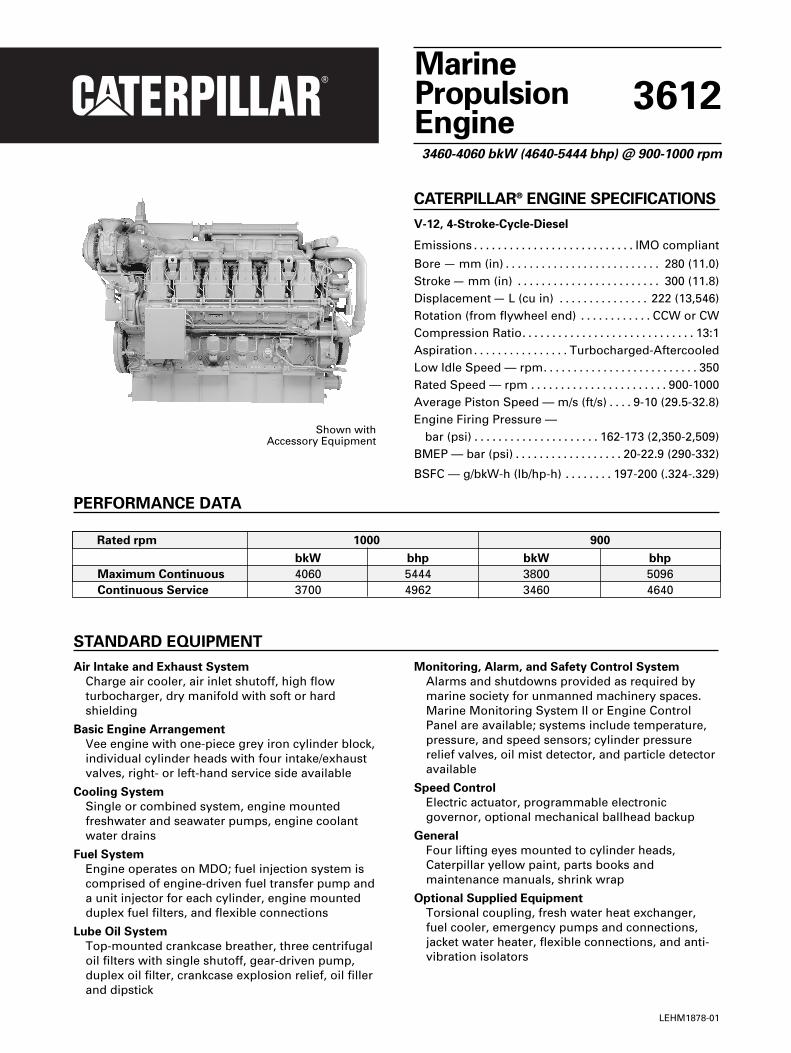
CATERPILLAR® ENGINE SPECIFICATIONS
V-12, 4-Stroke-Cycle-Diesel
Emissions . . . . . . . . . . . . . . . . . . . . . . . . . . . IMO compliant
Bore — mm (in) . . . . . . . . . . . . . . . . . . . . . . . . . . 280 (11.0)Stroke — mm (in) . . . . . . . . . . . . . . . . . . . . . . . . 300 (11.8)Displacement — L (cu in) . . . . . . . . . . . . . . . 222 (13,546)Rotation (from flywheel end) . . . . . . . . . . . . CCW or CWCompression Ratio. . . . . . . . . . . . . . . . . . . . . . . . . . . . . 13:1Aspiration. . . . . . . . . . . . . . . . Turbocharged-AftercooledLow Idle Speed — rpm. . . . . . . . . . . . . . . . . . . . . . . . . . 350Rated Speed — rpm . . . . . . . . . . . . . . . . . . . . . . . 900-1000Average Piston Speed — m/s (ft/s) . . . . 9-10 (29.5-32.8)Engine Firing Pressure —
bar (psi) . . . . . . . . . . . . . . . . . . . . . 162-173 (2,350-2,509)BMEP — bar (psi) . . . . . . . . . . . . . . . . . . 20-22.9 (290-332)
BSFC — g/bkW-h (lb/hp-h) . . . . . . . . 197-200 (.324-.329)
MarinePropulsionEngine
3612
3460-4060 bkW (4640-5444 bhp) @ 900-1000 rpm
Shown withAccessory Equipment
STANDARD EQUIPMENT
Air Intake and Exhaust System
Charge air cooler, air inlet shutoff, high flowturbocharger, dry manifold with soft or hardshielding
Basic Engine Arrangement
Vee engine with one-piece grey iron cylinder block,individual cylinder heads with four intake/exhaustvalves, right- or left-hand service side available
Cooling System
Single or combined system, engine mountedfreshwater and seawater pumps, engine coolantwater drains
Fuel System
Engine operates on MDO; fuel injection system iscomprised of engine-driven fuel transfer pump anda unit injector for each cylinder, engine mountedduplex fuel filters, and flexible connections
Lube Oil System
Top-mounted crankcase breather, three centrifugaloil filters with single shutoff, gear-driven pump,duplex oil filter, crankcase explosion relief, oil fillerand dipstick
Monitoring, Alarm, and Safety Control System
Alarms and shutdowns provided as required bymarine society for unmanned machinery spaces.Marine Monitoring System II or Engine ControlPanel are available; systems include temperature,pressure, and speed sensors; cylinder pressurerelief valves, oil mist detector, and particle detectoravailable
Speed Control
Electric actuator, programmable electronicgovernor, optional mechanical ballhead backup
General
Four lifting eyes mounted to cylinder heads,Caterpillar yellow paint, parts books andmaintenance manuals, shrink wrap
Optional Supplied Equipment
Torsional coupling, fresh water heat exchanger,fuel cooler, emergency pumps and connections,jacket water heater, flexible connections, and anti-vibration isolators
PERFORMANCE DATA
Rated rpm 1000 900
bkW bhp bkW bhp
Maximum Continuous 4060 5444 3800 5096Continuous Service 3700 4962 3460 4640
LEHM1878-01
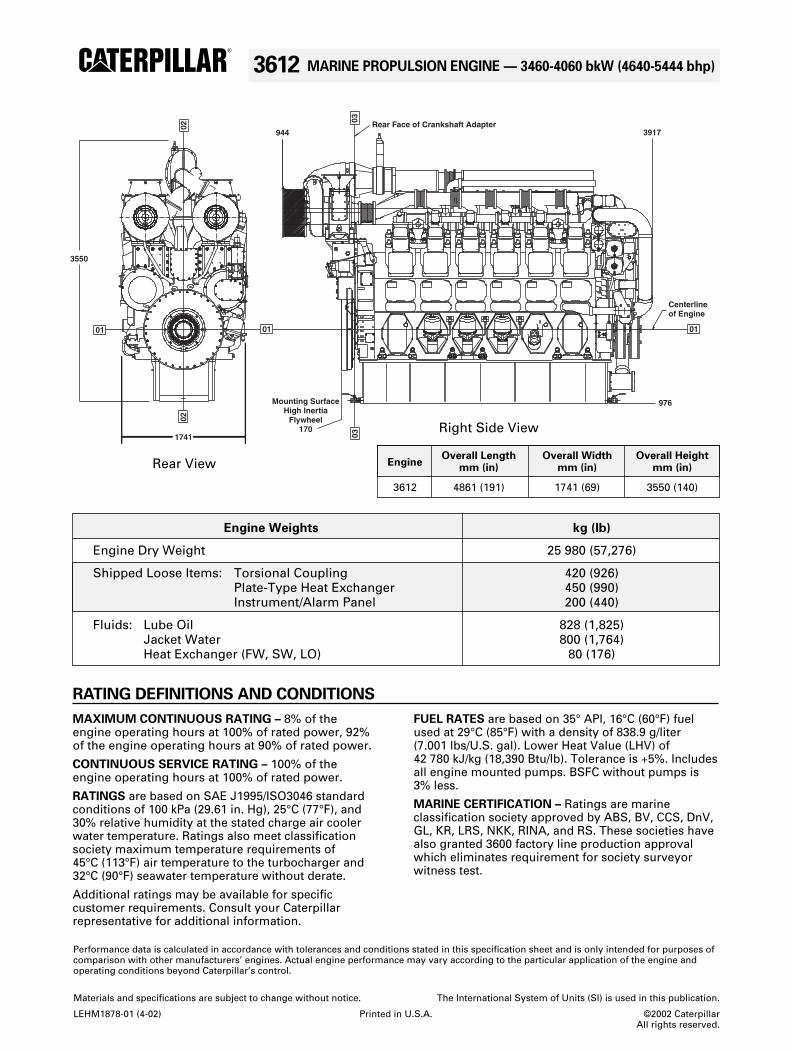
Materials and specifications are subject to change without notice. The International System of Units (SI) is used in this publication.
LEHM1878-01 (4-02) Printed in U.S.A. ©2002 CaterpillarAll rights reserved.
Performance data is calculated in accordance with tolerances and conditions stated in this specification sheet and is only intended for purposes ofcomparison with other manufacturers’ engines. Actual engine performance may vary according to the particular application of the engine andoperating conditions beyond Caterpillar’s control.
3612 MARINE PROPULSION ENGINE — 3460-4060 bkW (4640-5444 bhp)
MAXIMUM CONTINUOUS RATING – 8% of theengine operating hours at 100% of rated power, 92%of the engine operating hours at 90% of rated power.
CONTINUOUS SERVICE RATING – 100% of theengine operating hours at 100% of rated power.
RATINGS are based on SAE J1995/ISO3046 standardconditions of 100 kPa (29.61 in. Hg), 25°C (77°F), and30% relative humidity at the stated charge air coolerwater temperature. Ratings also meet classificationsociety maximum temperature requirements of 45°C (113°F) air temperature to the turbocharger and32°C (90°F) seawater temperature without derate.
Additional ratings may be available for specificcustomer requirements. Consult your Caterpillarrepresentative for additional information.
FUEL RATES are based on 35° API, 16°C (60°F) fuelused at 29°C (85°F) with a density of 838.9 g/liter (7.001 lbs/U.S. gal). Lower Heat Value (LHV) of 42 780 kJ/kg (18,390 Btu/lb). Tolerance is +5%. Includesall engine mounted pumps. BSFC without pumps is3% less.
MARINE CERTIFICATION – Ratings are marineclassification society approved by ABS, BV, CCS, DnV,GL, KR, LRS, NKK, RINA, and RS. These societies havealso granted 3600 factory line production approvalwhich eliminates requirement for society surveyorwitness test.
RATING DEFINITIONS AND CONDITIONS
Engine Weights kg (lb)
Engine Dry Weight 25 980 (57,276)
Shipped Loose Items: Torsional Coupling 420 (926)Plate-Type Heat Exchanger 450 (990)Instrument/Alarm Panel 200 (440)
Fluids: Lube Oil 828 (1,825)Jacket Water 800 (1,764)Heat Exchanger (FW, SW, LO) 80 (176)
EngineOverall Length Overall Width Overall Height
mm (in) mm (in) mm (in)
3612 4861 (191) 1741 (69) 3550 (140)
976
Centerlineof Engine
01
3917 Rear Face of Crankshaft Adapter03
944
01
Mounting SurfaceHigh Inertia
Flywheel170
03
01
0202
3550
1741
Rear View
Right Side View
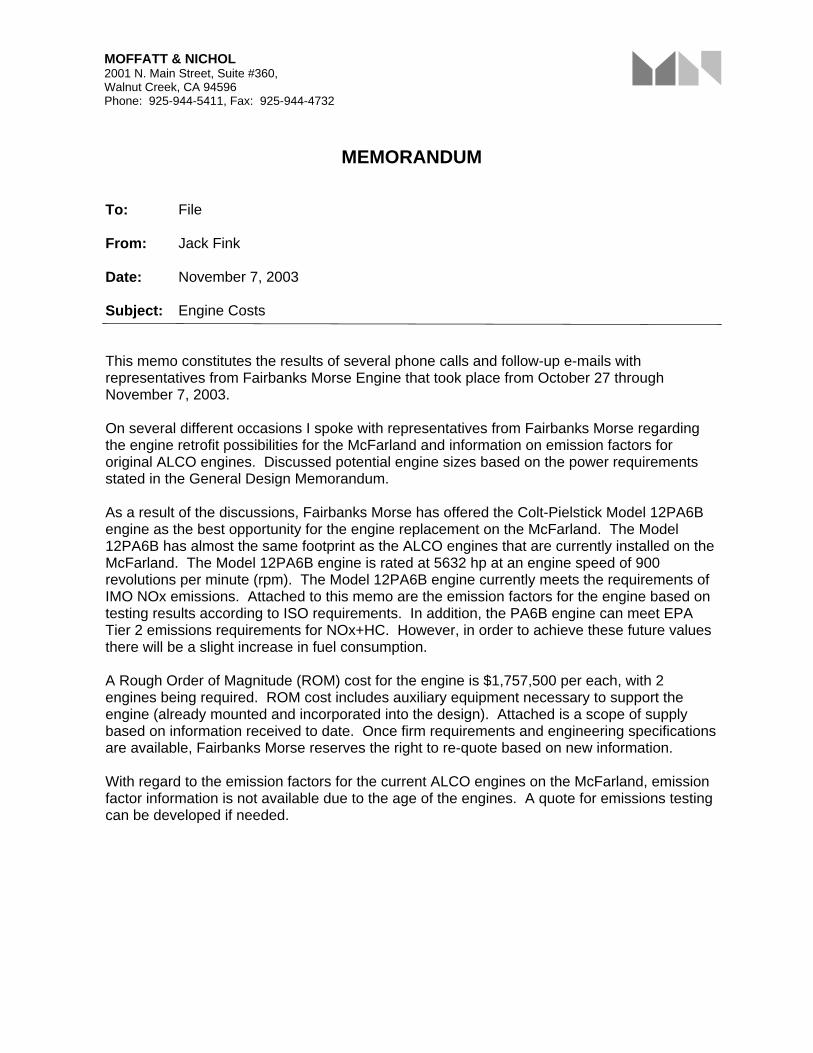
MOFFATT & NICHOL 2001 N. Main Street, Suite #360, Walnut Creek, CA 94596 Phone: 925-944-5411, Fax: 925-944-4732
MEMORANDUM
To: File
From: Jack Fink
Date: November 7, 2003
Subject:
Engine Costs
This memo constitutes the results of several phone calls and follow-up e-mails with representatives from Fairbanks Morse Engine that took place from October 27 through November 7, 2003.
On several different occasions I spoke with representatives from Fairbanks Morse regarding the engine retrofit possibilities for the McFarland and information on emission factors for original ALCO engines. Discussed potential engine sizes based on the power requirements stated in the General Design Memorandum.
As a result of the discussions, Fairbanks Morse has offered the Colt-Pielstick Model 12PA6B engine as the best opportunity for the engine replacement on the McFarland. The Model 12PA6B has almost the same footprint as the ALCO engines that are currently installed on the McFarland. The Model 12PA6B engine is rated at 5632 hp at an engine speed of 900 revolutions per minute (rpm). The Model 12PA6B engine currently meets the requirements of IMO NOx emissions. Attached to this memo are the emission factors for the engine based on testing results according to ISO requirements. In addition, the PA6B engine can meet EPA Tier 2 emissions requirements for NOx+HC. However, in order to achieve these future values there will be a slight increase in fuel consumption.
A Rough Order of Magnitude (ROM) cost for the engine is $1,757,500 per each, with 2 engines being required. ROM cost includes auxiliary equipment necessary to support the engine (already mounted and incorporated into the design). Attached is a scope of supply based on information received to date. Once firm requirements and engineering specifications are available, Fairbanks Morse reserves the right to re-quote based on new information.
With regard to the emission factors for the current ALCO engines on the McFarland, emission factor information is not available due to the age of the engines. A quote for emissions testing can be developed if needed.
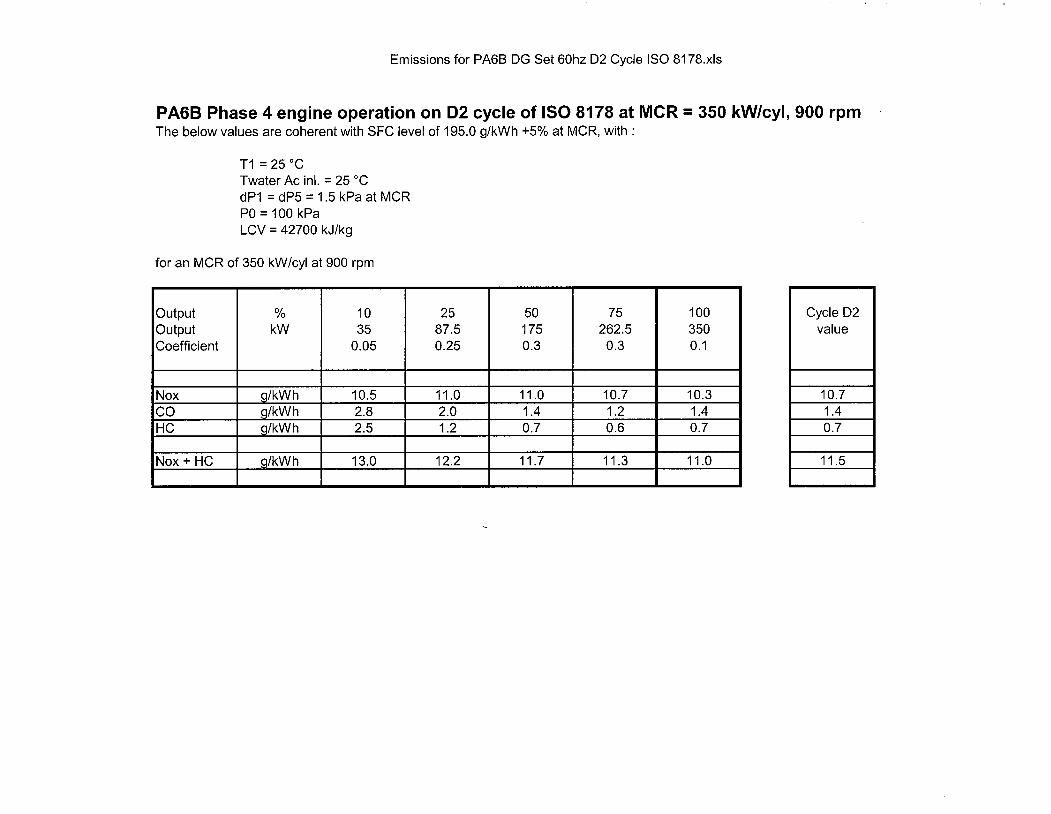
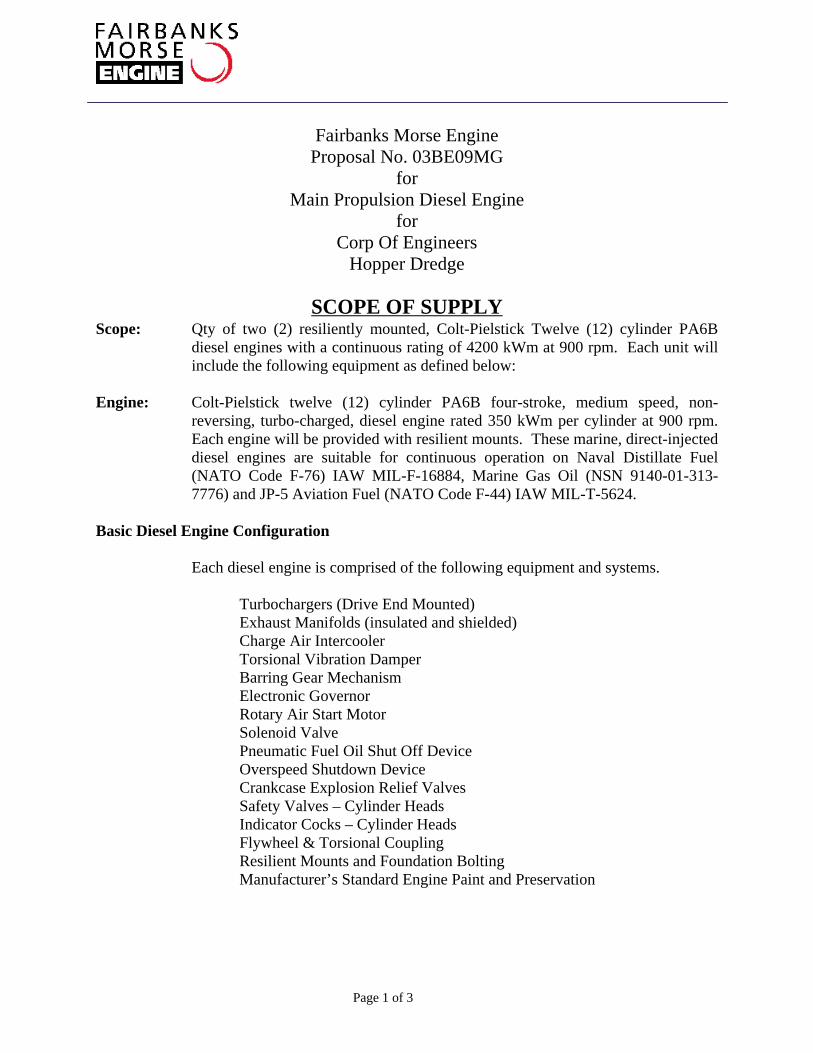
Page 1 of 3
Fairbanks Morse Engine Proposal No. 03BE09MG
for Main Propulsion Diesel Engine
for Corp Of Engineers
Hopper Dredge
SCOPE OF SUPPLY
Scope: Qty of two (2) resiliently mounted, Colt-Pielstick Twelve (12) cylinder PA6B diesel engines with a continuous rating of 4200 kWm at 900 rpm. Each unit will include the following equipment as defined below:
Engine: Colt-Pielstick twelve (12) cylinder PA6B four-stroke, medium speed, non-reversing, turbo-charged, diesel engine rated 350 kWm per cylinder at 900 rpm. Each engine will be provided with resilient mounts. These marine, direct-injected diesel engines are suitable for continuous operation on Naval Distillate Fuel (NATO Code F-76) IAW MIL-F-16884, Marine Gas Oil (NSN 9140-01-313-7776) and JP-5 Aviation Fuel (NATO Code F-44) IAW MIL-T-5624.
Basic Diesel Engine Configuration
Each diesel engine is comprised of the following equipment and systems.
Turbochargers (Drive End Mounted) Exhaust Manifolds (insulated and shielded) Charge Air Intercooler Torsional Vibration Damper Barring Gear Mechanism Electronic Governor Rotary Air Start Motor Solenoid Valve Pneumatic Fuel Oil Shut Off Device Overspeed Shutdown Device Crankcase Explosion Relief Valves Safety Valves – Cylinder Heads Indicator Cocks – Cylinder Heads Flywheel & Torsional Coupling Resilient Mounts and Foundation Bolting Manufacturer’s Standard Engine Paint and Preservation
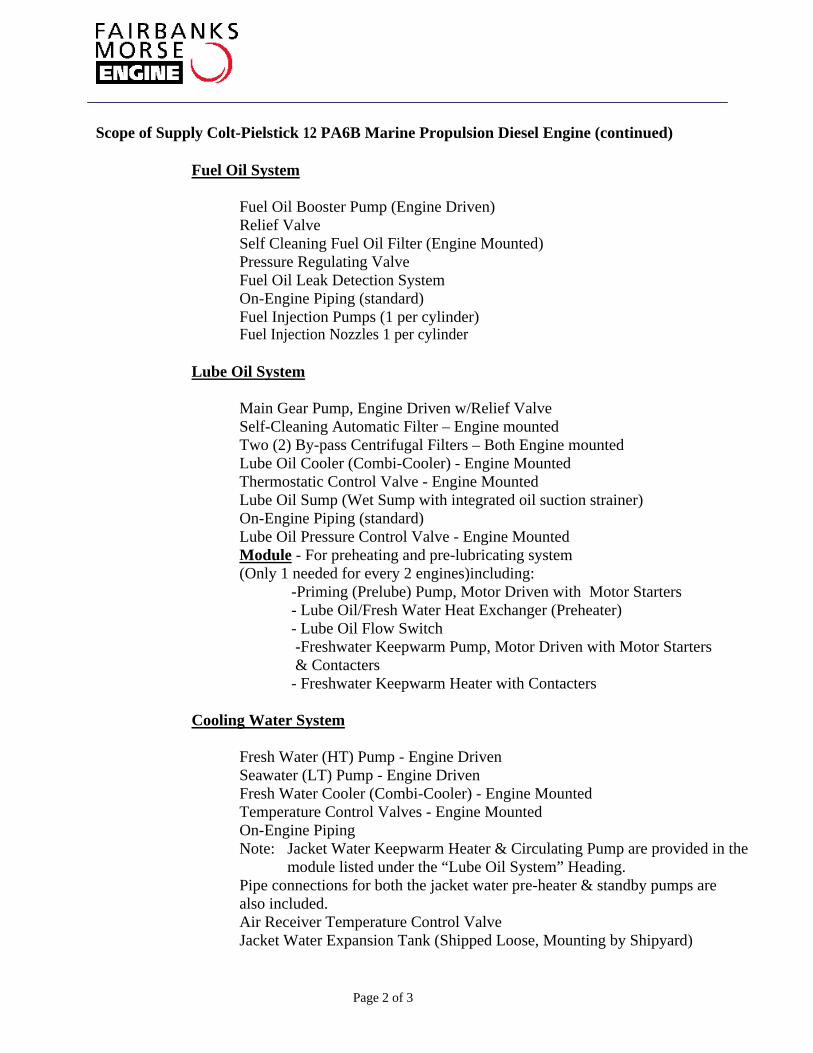
Page 2 of 3
Scope of Supply Colt-Pielstick 12 PA6B Marine Propulsion Diesel Engine (continued)
Fuel Oil System
Fuel Oil Booster Pump (Engine Driven) Relief Valve Self Cleaning Fuel Oil Filter (Engine Mounted) Pressure Regulating Valve Fuel Oil Leak Detection System On-Engine Piping (standard) Fuel Injection Pumps (1 per cylinder) Fuel Injection Nozzles 1 per cylinder
Lube Oil System
Main Gear Pump, Engine Driven w/Relief Valve Self-Cleaning Automatic Filter – Engine mounted Two (2) By-pass Centrifugal Filters – Both Engine mounted Lube Oil Cooler (Combi-Cooler) - Engine Mounted Thermostatic Control Valve - Engine Mounted Lube Oil Sump (Wet Sump with integrated oil suction strainer) On-Engine Piping (standard) Lube Oil Pressure Control Valve - Engine Mounted Module
- For preheating and pre-lubricating system (Only 1 needed for every 2 engines)including:
-Priming (Prelube) Pump, Motor Driven with Motor Starters - Lube Oil/Fresh Water Heat Exchanger (Preheater) - Lube Oil Flow Switch -Freshwater Keepwarm Pump, Motor Driven with Motor Starters
& Contacters - Freshwater Keepwarm Heater with Contacters
Cooling Water System
Fresh Water (HT) Pump - Engine Driven Seawater (LT) Pump - Engine Driven Fresh Water Cooler (Combi-Cooler) - Engine Mounted Temperature Control Valves - Engine Mounted On-Engine Piping Note: Jacket Water Keepwarm Heater & Circulating Pump are provided in the
module listed under the “Lube Oil System” Heading. Pipe connections for both the jacket water pre-heater & standby pumps are also included. Air Receiver Temperature Control Valve Jacket Water Expansion Tank (Shipped Loose, Mounting by Shipyard)
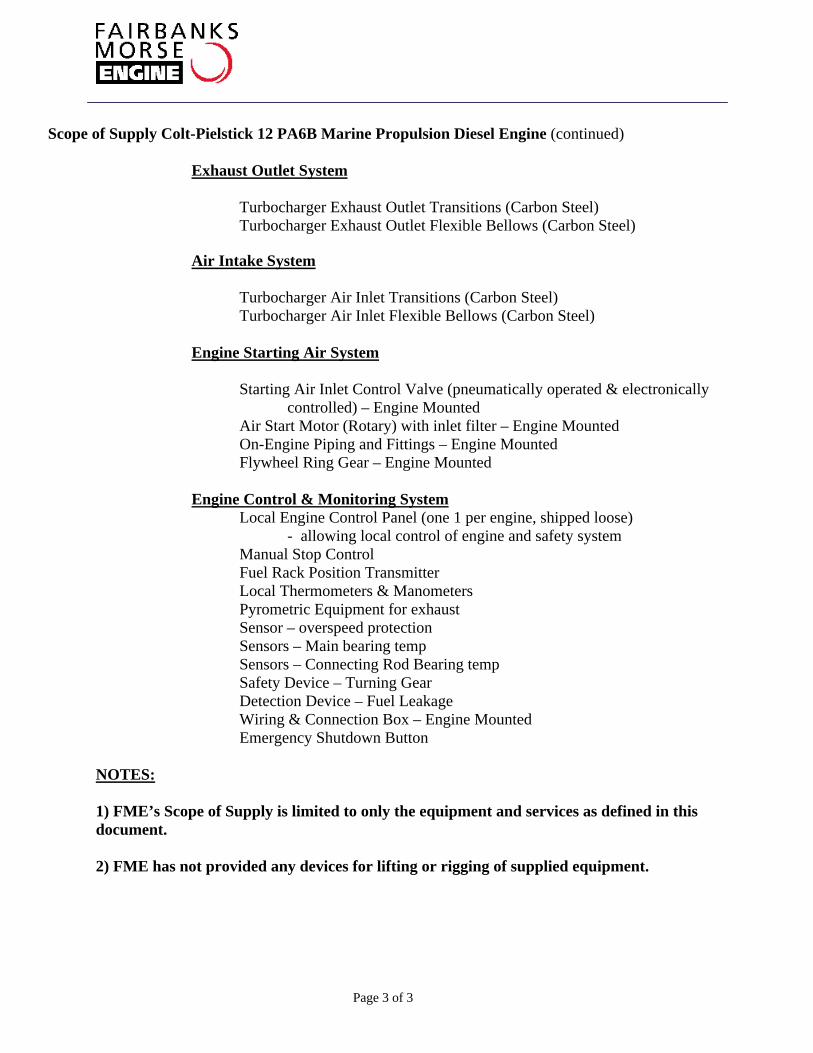
Page 3 of 3
Scope of Supply Colt-Pielstick 12 PA6B Marine Propulsion Diesel Engine (continued)
Exhaust Outlet System
Turbocharger Exhaust Outlet Transitions (Carbon Steel) Turbocharger Exhaust Outlet Flexible Bellows (Carbon Steel)
Air Intake System
Turbocharger Air Inlet Transitions (Carbon Steel) Turbocharger Air Inlet Flexible Bellows (Carbon Steel)
Engine Starting Air System
Starting Air Inlet Control Valve (pneumatically operated & electronically controlled) – Engine Mounted
Air Start Motor (Rotary) with inlet filter – Engine Mounted On-Engine Piping and Fittings – Engine Mounted
Flywheel Ring Gear – Engine Mounted
Engine Control & Monitoring System
Local Engine Control Panel (one 1 per engine, shipped loose) - allowing local control of engine and safety system
Manual Stop Control Fuel Rack Position Transmitter Local Thermometers & Manometers Pyrometric Equipment for exhaust Sensor – overspeed protection Sensors – Main bearing temp Sensors – Connecting Rod Bearing temp Safety Device – Turning Gear Detection Device – Fuel Leakage Wiring & Connection Box – Engine Mounted Emergency Shutdown Button
NOTES:
1) FME’s Scope of Supply is limited to only the equipment and services as defined in this document.
2) FME has not provided any devices for lifting or rigging of supplied equipment.
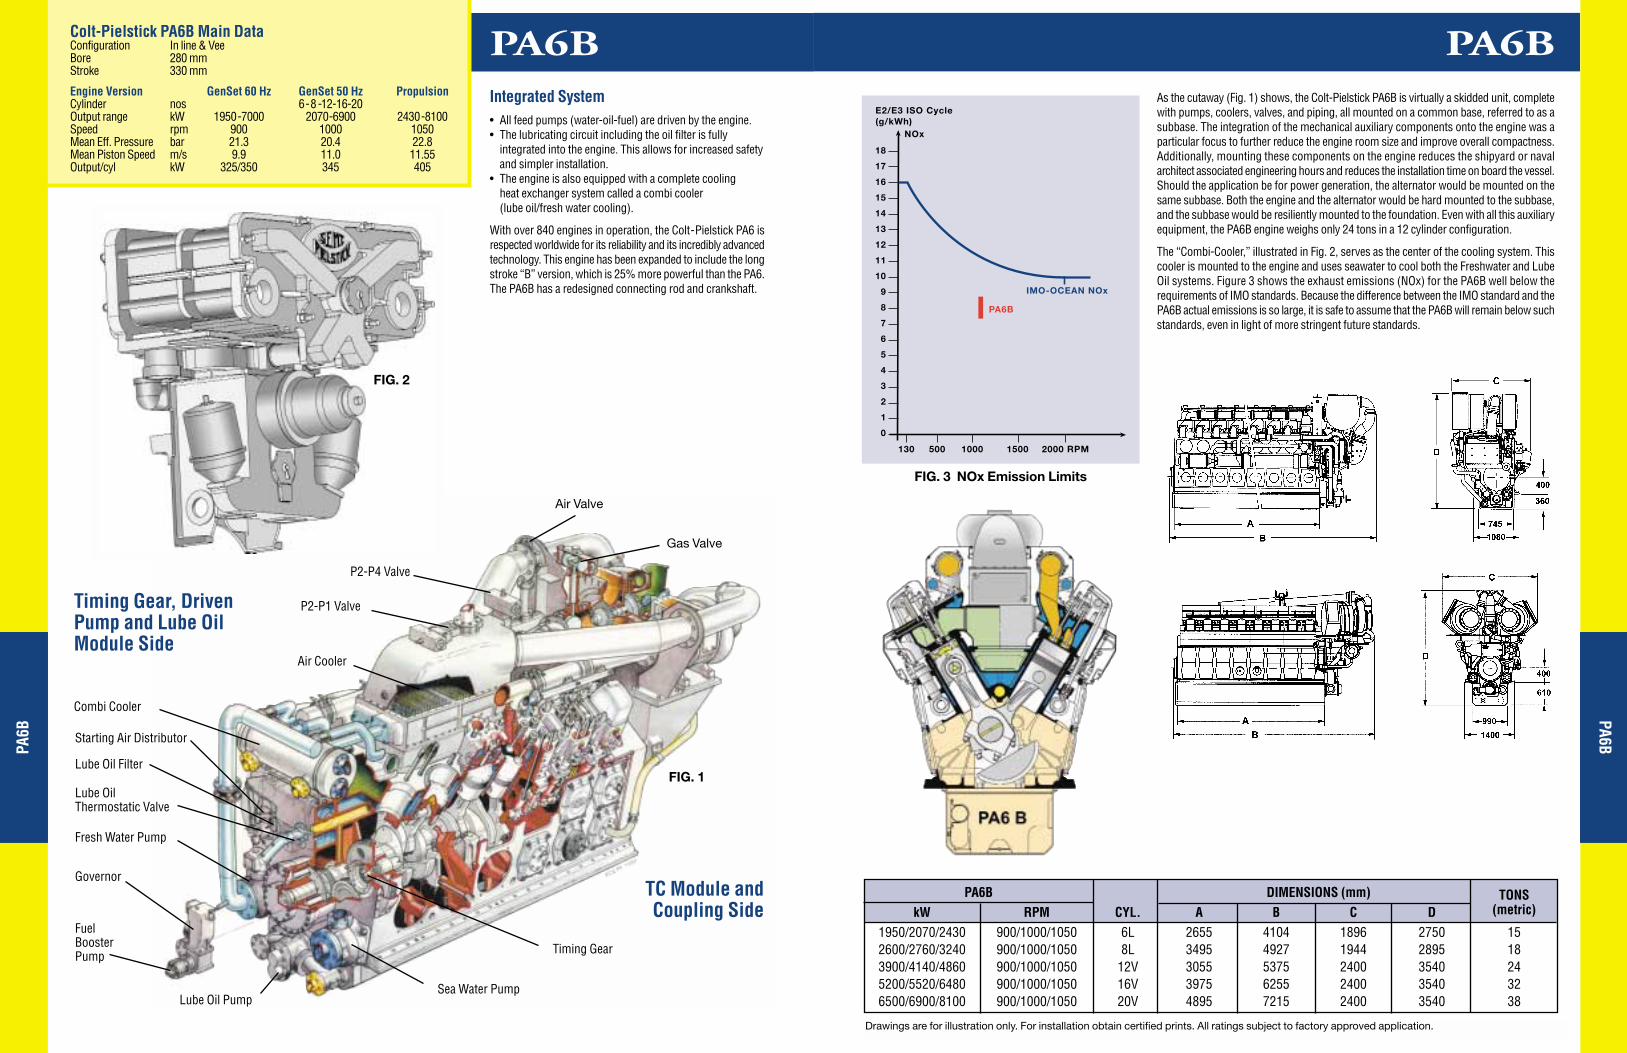
PA6BPA6BColt-Pielstick PA6B Main DataConfiguration In line & VeeBore 280 mmStroke 330 mm
Engine Version GenSet 60 Hz GenSet 50 Hz PropulsionCylinder nos 6-8 -12-16-20Output range kW 1950-7000 2070-6900 2430-8100Speed rpm 900 1000 1050Mean Eff. Pressure bar 21.3 20.4 22.8Mean Piston Speed m/s 9.9 11.0 11.55Output/cyl kW 325/350 345 405
P2-P4 Valve
P2-P1 Valve
Air Cooler
Combi Cooler
Starting Air Distributor
Lube Oil Filter
Lube Oil Thermostatic Valve
Fresh Water Pump
Governor
FuelBoosterPump
Lube Oil PumpSea Water Pump
Timing Gear
Air Valve
Gas Valve
Timing Gear, DrivenPump and Lube OilModule Side
TC Module and Coupling Side
Integrated System• All feed pumps (water-oil-fuel) are driven by the engine.• The lubricating circuit including the oil filter is fully
integrated into the engine. This allows for increased safetyand simpler installation.
• The engine is also equipped with a complete cooling heat exchanger system called a combi cooler (lube oil/fresh water cooling).
With over 840 engines in operation, the Colt-Pielstick PA6 isrespected worldwide for its reliability and its incredibly advancedtechnology. This engine has been expanded to include the longstroke “B” version, which is 25% more powerful than the PA6.The PA6B has a redesigned connecting rod and crankshaft.
As the cutaway (Fig. 1) shows, the Colt-Pielstick PA6B is virtually a skidded unit, completewith pumps, coolers, valves, and piping, all mounted on a common base, referred to as asubbase. The integration of the mechanical auxiliary components onto the engine was aparticular focus to further reduce the engine room size and improve overall compactness.Additionally, mounting these components on the engine reduces the shipyard or navalarchitect associated engineering hours and reduces the installation time on board the vessel.Should the application be for power generation, the alternator would be mounted on thesame subbase. Both the engine and the alternator would be hard mounted to the subbase,and the subbase would be resiliently mounted to the foundation. Even with all this auxiliaryequipment, the PA6B engine weighs only 24 tons in a 12 cylinder configuration.
The “Combi-Cooler,” illustrated in Fig. 2, serves as the center of the cooling system. Thiscooler is mounted to the engine and uses seawater to cool both the Freshwater and LubeOil systems. Figure 3 shows the exhaust emissions (NOx) for the PA6B well below therequirements of IMO standards. Because the difference between the IMO standard and thePA6B actual emissions is so large, it is safe to assume that the PA6B will remain below suchstandards, even in light of more stringent future standards.
FIG. 3 NOx Emission Limits
PA6B DIMENSIONS (mm) TONSkW RPM CYL. A B C D (metric)
1950/2070/2430 900/1000/1050 6L 2655 4104 1896 2750 152600/2760/3240 900/1000/1050 8L 3495 4927 1944 2895 183900/4140/4860 900/1000/1050 12V 3055 5375 2400 3540 245200/5520/6480 900/1000/1050 16V 3975 6255 2400 3540 326500/6900/8100 900/1000/1050 20V 4895 7215 2400 3540 38
PA6B
PA6B
Drawings are for illustration only. For installation obtain certified prints. All ratings subject to factory approved application.
FIG. 2
FIG. 1
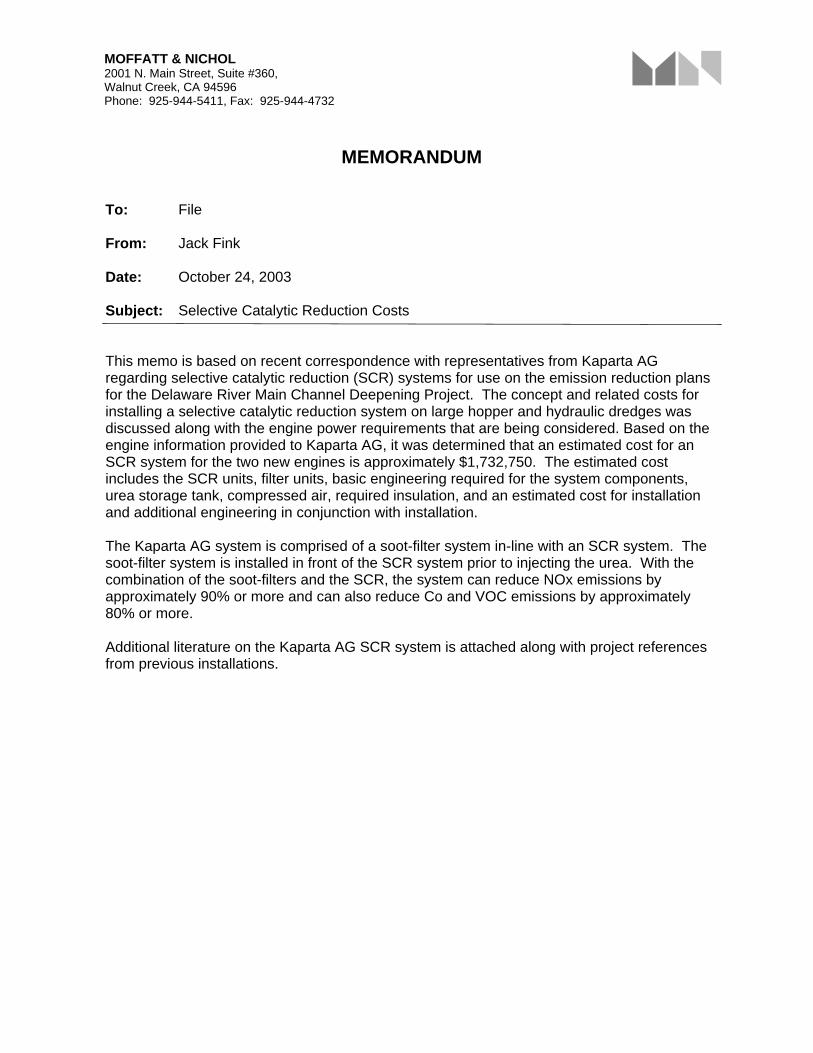
MOFFATT & NICHOL 2001 N. Main Street, Suite #360, Walnut Creek, CA 94596 Phone: 925-944-5411, Fax: 925-944-4732
MEMORANDUM
To: File
From: Jack Fink
Date: October 24, 2003
Subject:
Selective Catalytic Reduction Costs
This memo is based on recent correspondence with representatives from Kaparta AG regarding selective catalytic reduction (SCR) systems for use on the emission reduction plans for the Delaware River Main Channel Deepening Project. The concept and related costs for installing a selective catalytic reduction system on large hopper and hydraulic dredges was discussed along with the engine power requirements that are being considered. Based on the engine information provided to Kaparta AG, it was determined that an estimated cost for an SCR system for the two new engines is approximately $1,732,750. The estimated cost includes the SCR units, filter units, basic engineering required for the system components, urea storage tank, compressed air, required insulation, and an estimated cost for installation and additional engineering in conjunction with installation.
The Kaparta AG system is comprised of a soot-filter system in-line with an SCR system. The soot-filter system is installed in front of the SCR system prior to injecting the urea. With the combination of the soot-filters and the SCR, the system can reduce NOx emissions by approximately 90% or more and can also reduce Co and VOC emissions by approximately 80% or more.
Additional literature on the Kaparta AG SCR system is attached along with project references from previous installations.

KAPARTA AG
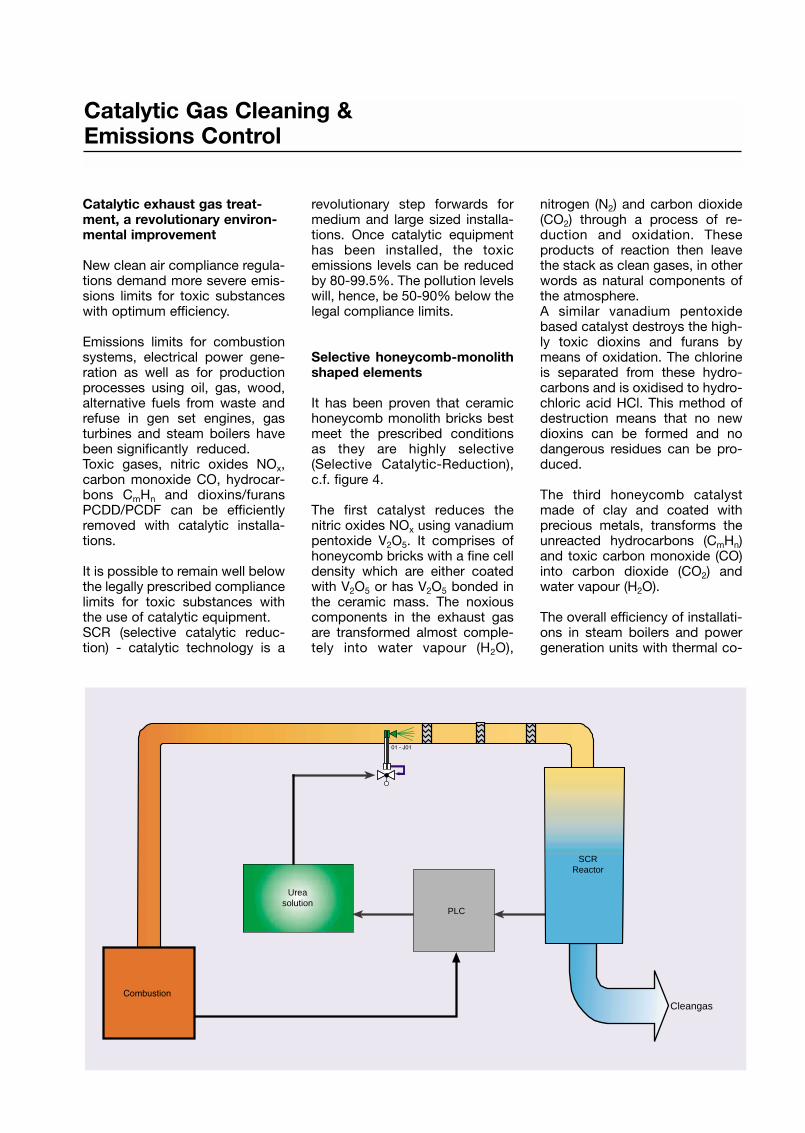
Catalytic exhaust gas treat-ment, a revolutionary environ-mental improvement
New clean air compliance regula-tions demand more severe emis-sions limits for toxic substanceswith optimum efficiency.
Emissions limits for combustionsystems, electrical power gene-ration as well as for productionprocesses using oil, gas, wood,alternative fuels from waste andrefuse in gen set engines, gasturbines and steam boilers havebeen significantly reduced.Toxic gases, nitric oxides NOx,carbon monoxide CO, hydrocar-bons CmHn and dioxins/furansPCDD/PCDF can be efficientlyremoved with catalytic installa-tions.
It is possible to remain well belowthe legally prescribed compliancelimits for toxic substances withthe use of catalytic equipment.SCR (selective catalytic reduc-tion) - catalytic technology is a
revolutionary step forwards formedium and large sized installa-tions. Once catalytic equipmenthas been installed, the toxicemissions levels can be reducedby 80-99.5%. The pollution levelswill, hence, be 50-90% below thelegal compliance limits.
Selective honeycomb-monolithshaped elements
It has been proven that ceramichoneycomb monolith bricks bestmeet the prescribed conditionsas they are highly selective(Selective Catalytic-Reduction),c.f. figure 4.
The first catalyst reduces thenitric oxides NOx using vanadiumpentoxide V2O5. It comprises ofhoneycomb bricks with a fine celldensity which are either coatedwith V2O5 or has V2O5 bonded inthe ceramic mass. The noxiouscomponents in the exhaust gasare transformed almost comple-tely into water vapour (H2O),
nitrogen (N2) and carbon dioxide(CO2) through a process of re-duction and oxidation. Theseproducts of reaction then leavethe stack as clean gases, in otherwords as natural components ofthe atmosphere. A similar vanadium pentoxidebased catalyst destroys the high-ly toxic dioxins and furans bymeans of oxidation. The chlorineis separated from these hydro-carbons and is oxidised to hydro-chloric acid HCl. This method ofdestruction means that no newdioxins can be formed and nodangerous residues can be pro-duced.
The third honeycomb catalystmade of clay and coated withprecious metals, transforms theunreacted hydrocarbons (CmHn)and toxic carbon monoxide (CO)into carbon dioxide (CO2) andwater vapour (H2O).
The overall efficiency of installati-ons in steam boilers and powergeneration units with thermal co-
Catalytic Gas Cleaning & Emissions Control
Cleangas
Ureasolution
PLC
SCRReactor
dimensions of 15 x 15 x 30 cm.Their weight is ca. 5 kg and arevery easy and flexible to use inindustrial applications. The parti-cular type of catalyst we use hasbeen rigorously tested overseveral years on real industrialexhaust gas applications resul-ting in a reliable and industrialproven design concept. We arecontinuously perfecting and opti-mising our designs to producethe following set of economicallyoptimised system elements forour installations.
Urea, an environmentallyneutral, user-friendly, andcost-effective reagent
Urea, in contrast to hazardousammonia, allows complete troub-le - free storage. It represents nohazard to the operator. The injec-tion of water dissolved ureasolution with our units is free ofany problems. Urea is inexpensi-ve, environmentally friendly, anddissolves easily in water. It issupplied in the form of 2 mm(1/16”) Ø white granulate materi-al. Urea is mainly used in industryas fertiliser, animal feed additiveand also as a deicing agent atairports.
Reliability of components
The instrumentation and controlrequirements of the SCR processis fully supervised and controlledby an onboard PLC (programm-able logic control) unit. PLC tech-nology has been developed andtested over the years such that itis sufficient to control the rate ofurea injection using a fuel supplymodulation signal or another sui-table control parameter from pro-cess.Without further interventionin the process, this method ofcontrol gives excellent results inNOx reduction. This simple con-trol loop philosophy minimisesthe unit’s susceptibility to failure.
Proven and custom-made withguarantee for success
generation cycles, can be consi-derably improved using heatexchangers downstream of thecatalytic reactors to extract resi-dual waste heat from the cleangas stream.
Proven and custom-builtinstallations with a guaranteeof success
The SCR catalytic process ofKaparta AG operates accordingto an incredibly simple principle.An exact quantity of urea dissol-ved in water is sprayed into thecombustion gases which are at atemperature of ca. 400 °C. Theurea solution and hot gases arethen homogeneously mixed ininline static mixers before beingfed to the catalytic reactor hou-sing. Here, the toxic gases arealmost completely transformed inthe catalyst bed.
Catalytic reactor housing andequipment parts as standardcomponents
Our reactor housings are builtusing standardized sizes andparts depending on the contami-nants to be treated. All units aredelivered, complete with automa-tic urea spray nozzle system,tank for reagent solution prepara-tion and storage, electrical con-trol unit, urea metering pumpcontrol system, and the catalyticreactor housing shop fitted withcatalyst. Our compact units fitinto even the smallest of spaces(minimum foot print design).
Industry-suitable dimensionsof the catalyst honeycombbricks
In power stations, catalytsts havevery large dimensions, are extre-mely heavy and made up of largeelements. Our honeycombs aresingle elements with typical
Customer-optimised designsand manufacture
All unit designs are prepared byour design office. After the fabri-cation of the individual systemcomponents is complete, workstests are carried out. Our designdepartment is equipped withmodern CAD systems, enablingus to quickly address our custo-mers’ needs. The stainless steelreactors, mixers and miscella-neous system components arewelded and pre-assembled in ourown fabrication shops.
Kaparta AG designs and produ-ces turnkey exhaust gas andexhaust air treatment systems forfurnaces and production applica-tions. Kaparta AG is also able totest different catalyst formula-tions in real exhaust gas streamsas well as using synthetic gasmixtures to verify the catalystssuitability for an application. Weleave nothing to chance and testall our components before ship-ping.
No waste disposal problems of unwanted residue, no special waste
The catalytic transformation ofraw exhaust gases into cleanexhaust leaves no environmen-tally hazardous waste residuebehind requiring disposal asspecial waste. Spent catalyst ele-ments can be returned to themanufacturing company wherethey are ground, filtered andreused as raw material for newcatalysts.
Very low retro fit costs andshutdown times for existinginstallations
The SCR catalytic technology isbest suited to treat existing pro-duction processes. There is noneed to exchange the burners or
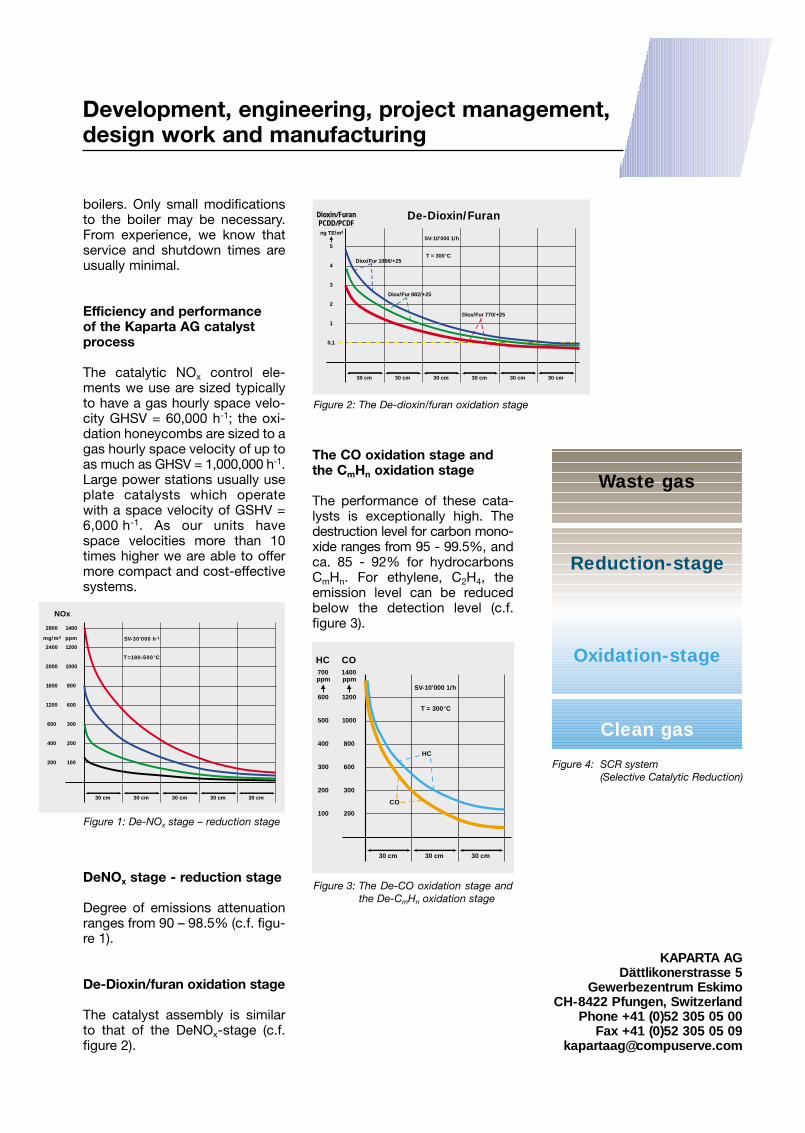
boilers. Only small modificationsto the boiler may be necessary.From experience, we know thatservice and shutdown times areusually minimal.
Efficiency and performance of the Kaparta AG catalystprocess
The catalytic NOx control ele-ments we use are sized typicallyto have a gas hourly space velo-city GHSV = 60,000 h-1; the oxi-dation honeycombs are sized to agas hourly space velocity of up toas much as GHSV = 1,000,000 h-1.Large power stations usually useplate catalysts which operatewith a space velocity of GSHV =6,000 h-1. As our units havespace velocities more than 10times higher we are able to offermore compact and cost-effectivesystems.
DeNOx stage - reduction stage
Degree of emissions attenuationranges from 90 – 98.5% (c.f. figu-re 1).
De-Dioxin/furan oxidation stage
The catalyst assembly is similarto that of the DeNOx-stage (c.f.figure 2).
The CO oxidation stage andthe CmHn oxidation stage
The performance of these cata-lysts is exceptionally high. Thedestruction level for carbon mono-xide ranges from 95 - 99.5%, andca. 85 - 92% for hydrocarbonsCmHn. For ethylene, C2H4, theemission level can be reducedbelow the detection level (c.f.figure 3).
Development, engineering, project management,design work and manufacturing
5
4
3
2
1
0,1
ng TE/m3
Dioxin/FuranPCDD/PCDF
Diox/Fur 1066/+25
Diox/Fur 882/+25
Diox/Fur 770/+25
T = 300°C
SV-10’000 1/h
De-Dioxin/Furan
30 cm 30 cm 30 cm 30 cm 30 cm 30 cm
1400
1200
1000
800
600
300
200
100
ppm
2800
2400
2000
1600
1200
600
400
200
mg/m3
NOx
T=180-500°C
SV-30’000 h-1
30 cm 30 cm 30 cm 30 cm 30 cm
1200
1000
800
600
300
200
ppm1400
CO
HC
T = 300°C
SV-10’000 1/h
30 cm 30 cm 30 cm
600
500
400
300
200
100
ppm700
HC
CO
Figure 4: SCR system(Selective Catalytic Reduction)
Figure 1: De-NOx stage – reduction stage
Figure 2: The De-dioxin/furan oxidation stage
Figure 3: The De-CO oxidation stage andthe De-CmHn oxidation stage
KAPARTA AGDättlikonerstrasse 5
Gewerbezentrum EskimoCH-8422 Pfungen, Switzerland
Phone +41 (0)52 305 05 00Fax +41 (0)52 305 05 09
Waste gas
Clean gas
Reduction-stage
Oxidation-stage
Perfonnance Page 1 of 2
I Home I up I Reactor picture I Cabinet picture
"Standard" performance data
matches any environmental regulations requirements ...
design can be adapted (like in units for greenhouse fertilization), so that exhaust gashas almost breathable air quality
MAIN CHARACTERISTICS
-$ matching environmental regulations requirements is not an issue (better
10/23/2003http :1 Iwww .kaparta.com/W eb- Dateien/E- performance.htm
I Flo\NSheet
Page 2 of 2Perfonnance
performance than what is required is our Credo)-$ the clean exhaust gas is rich in CO2; it can therefore be used for greenhouse
fertilization-$ NOx, CO and hydrocarbons are removed from the exhaust gas with highest
efficiency
For comments. suggestions, general info. please contact: infQ@kgpgrtg-,CQm
http :1 Iwww .kaparta.corn/W eb- Dateien/E- performance.htm 10/23/2003