Embed Size (px)
Citation preview
Commission on Government Forecasting and Accountability
COMMISSION CO-CHAIRS
Senator Heather Steans Representative C.D. Davidsmeyer
SENATE HOUSE
David Koehler Kelly Burke Chapin Rose Steven Reick
Elgie Sims Al Riley Dave Syverson Barbara Wheeler
Jil Tracy Vacant
EXECUTIVE DIRECTOR Clayton Klenke
DEPUTY DIRECTOR
Laurie L. Eby
REVENUE MANAGER Jim Muschinske
AUTHORS OF REPORT
Eric Noggle Benjamin L. Varner
EXECUTIVE SECRETARY
Briana Jackson

TABLE OF CONTENTS
WAGERING IN ILLINOIS: 2018 UPDATE October 2018
PAGE
EXECUTIVE SUMMARY i OVERVIEW 1 Overview Tables: 1 State Gaming Revenue History by Source 2 2 The Status of Illinois Gaming, Based on Revenue, Gaming Hold, & Per Capita
Spending 5 Overview Charts: 1 Source of Gaming-Related Revenues in Illinois 1 RIVERBOAT GAMBLING 7 Riverboat Gambling Related Tables: 3 Illinois Riverboat Adjusted Gross Receipts (FY 2013 – FY 2018) 11 4 Illinois Riverboat Admissions (FY 2013 – FY 2018) 11 5 State Revenue Generated from Illinois Riverboats (FY 2013 – FY 2018) 12 6 Local Revenue Generated from Illinois Riverboats (FY 2013 – FY 2018) 12 7 Total Revenue Generated from Illinois Riverboats (FY 2013 – FY 2018) 12 8 Rates of Change of Illinois Riverboats 14 9 Annual Percent Change of Riverboat State Revenues 15 10 Operating Tax Rates for Illinois Riverboats (FY 2013 – FY 2018) 15 11 Statistical Summary of the Midwestern Gaming States 17 12 AGR from Commercial Casino Gaming – Other Prominent Gaming States 22 13 Statistical Summary of the Top 25 Revenue Generating Casinos 24 14 FY 2016 - FY 2018 AGR Statistics at Selected Racetrack Casinos 27 Riverboat Gambling Related Charts: 2 Illinois Riverboat Adjusted Gross Receipts and Admissions 13 3 Adjusted Gross Receipts of Casinos for Illinois and Bordering States 18 4 AGR Composition for Illinois and Bordering States 19 5 Annual Percent Change of AGR by State 19 6 AGR per Table Game and per Electronic Gaming Device per Day 25 7 Number of Gaming Positions Used per Riverboat in the Chicago Region 26 VIDEO GAMING 31 Video Gaming Related Tables: 15 Illinois Video Gaming Statistics by Fiscal Year 36 16 Video Gaming Statistics by Illinois County 37 17 Video Gaming Statistics per County Population 38 18 Video Gaming Statistics by County Ranking 39
19 Top Municipalities with Video Gaming 40 20 Highest Populated Cities without Video Gaming 42 Video Gaming Related Charts: 8 Video Gaming Terminals in Operation in Illinois 35 9 Tax Revenue Collected from Video Gaming Terminals 36 10 AGR of Illinois Riverboats vs NTI of Illinois Video Gaming Machines 43 11 AGR of IL and IN Riverboats vs NTI of Terminals in Chicago Area 45 12 AGR of IL and IN Riverboats vs NTI of Terminals in Chicago Area (Stacked) 45 13 Tax Revenue from Riverboats and Video Gaming in Illinois 47 LOTTERY 49 Lottery Related Tables: 21 Lottery Sales by Game 52 22 Lottery Distributions 55 23 Lottery Transfers 57 24 Multi-State Lottery Participants 59 25 Multi-State Game Results 60 26 Lottery Rankings (FY 2017) 62 Lottery Related Charts: 14 Makeup of Lottery Sales 53 15 FY 2018 Lottery Sales by Game 53 16 FY 2017 Lottery Distributions 54 17 Illinois Lottery Sales per Capita 63 18 People per Lottery Retailer 63 HORSE RACING 67 Horse Racing Related Tables: 27 Sources and Allocation of Horse Racing Revenue for CY 2017 69 28 Horse Racing Revenues and Associated Allocations by Calendar Year 70 29 Illinois Racing Statistics for CY 2017 72 30 Illinois Horse Racing Tracks and Associated OTBs 73 Horse Racing Related Charts: 19 Illinois Horse Racing Handle (Composition by Amount Wagered) 70 20 Illinois Horse Racing Handle (Composition by Percentage) 71 MISCELLANEOUS STATE GAMING 78 Miscellaneous Gaming Related Charts: 21 Miscellaneous Gaming Revenue in Illinois 78 POTENTIAL NEW GAMING FORMATS 79 CONCLUSION 80

i
EXECUTIVE SUMMARY
This report is the Commission’s 2018 edition of Wagering in Illinois. This edition marks the 26th anniversary of the Commission’s first report, which was completed in 1992 in accordance with Senate Resolution 875 (87th General Assembly). That report examined the legally-sanctioned forms of wagering as a means of determining their economic impact as well as the potential for further expansion of the gaming industry. The 2018 edition updates previous releases and provides further analysis of State gaming with the focus on riverboat gambling, video gaming, the Lottery, and horse racing. The highlights of these topics are shown below. • In FY 2018, the State’s share of tax revenues from wagering in Illinois reached
$1.356 billion, a 3.5% increase from FY 2017 levels. The continued growth of video gaming tax revenues paid into the Capital Projects Fund ($51 million increase in FY 2018 to $347 million) was more than enough to offset the relatively stagnant performances from lottery transfers (down $6 million to $732 million), riverboat gaming transfers (up $2 million to $272 million) and from State-related horse racing revenues (held flat at $6 million).
• Lottery transfers (and other State-related lottery revenues) comprised 53.9% of total gaming revenues in FY 2018, whereas riverboat transfers comprised 20.0%, and horse racing comprised 0.4%. Video gaming’s growth in Illinois’ gaming market continued in FY 2018, comprising 25.6% of gaming revenues in FY 2018, up significantly from its FY 2014 value of 9.1%.
• Statewide adjusted gross receipts (AGR) for Illinois riverboats in FY 2018 were down 1.3% from FY 2017 levels, while admissions declined 6.4%. Modest increases in AGR at the casinos in Joliet (Hollywood) and Des Plaines (Rivers) were offset by AGR declines at the other eight Illinois casinos. State revenues generated from riverboat gambling totaled $388.8 million in FY 2018, a 1.1% decline from FY 2017 levels. Increased competition from video gaming continues to be a major contributing factor for these declines.
• Before the addition of Des Plaines, in FY 2011, Illinois had the lowest amount of casino gaming revenue (in terms of AGR) of the casino-operating states in the Midwest. The addition of the casino in Des Plaines allowed Illinois to rise ahead of Iowa between FY 2012 and FY 2015. However, six consecutive years of declining revenues has Illinois ($1.387 billion in FY 2018) again trailing Iowa ($1.464 billion), in addition to Missouri ($1.746 billion) and Indiana ($2.153 billion).
ii
• In July 2009, Public Act 96-0034 became law, legalizing video gaming in Illinois.
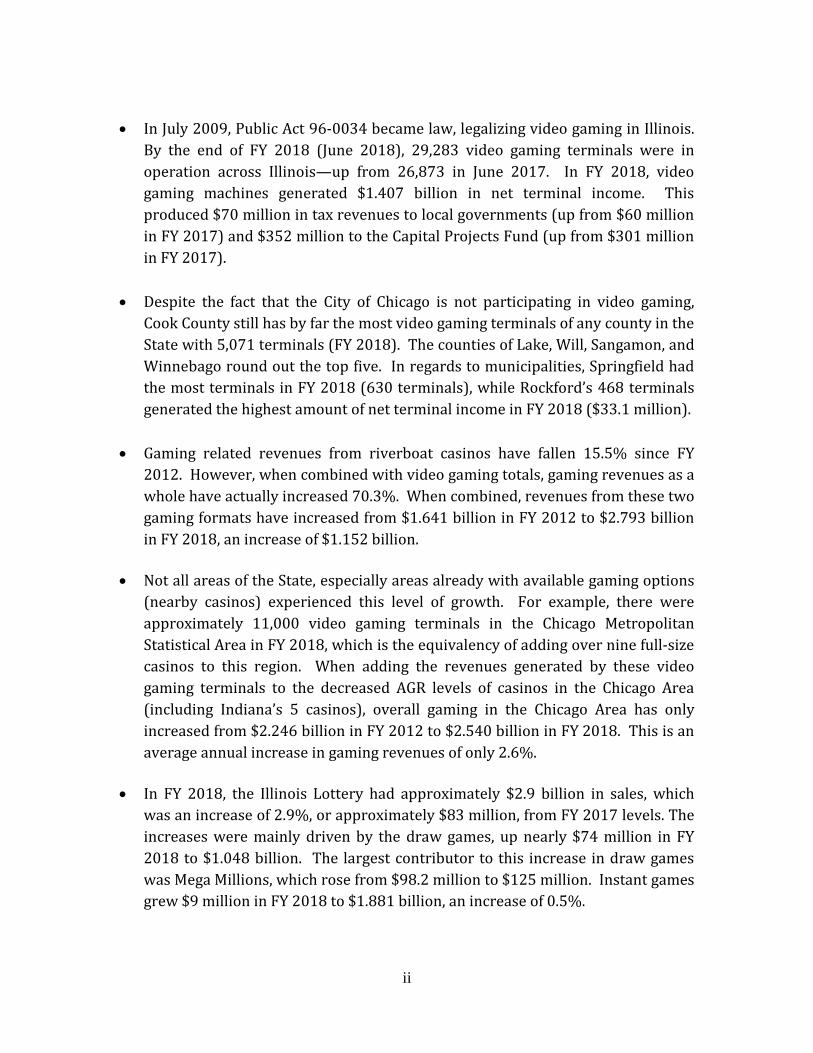
By the end of FY 2018 (June 2018), 29,283 video gaming terminals were in operation across Illinois—up from 26,873 in June 2017. In FY 2018, video gaming machines generated $1.407 billion in net terminal income. This produced $70 million in tax revenues to local governments (up from $60 million in FY 2017) and $352 million to the Capital Projects Fund (up from $301 million in FY 2017).
• Despite the fact that the City of Chicago is not participating in video gaming, Cook County still has by far the most video gaming terminals of any county in the State with 5,071 terminals (FY 2018). The counties of Lake, Will, Sangamon, and Winnebago round out the top five. In regards to municipalities, Springfield had the most terminals in FY 2018 (630 terminals), while Rockford’s 468 terminals generated the highest amount of net terminal income in FY 2018 ($33.1 million).
• Gaming related revenues from riverboat casinos have fallen 15.5% since FY 2012. However, when combined with video gaming totals, gaming revenues as a whole have actually increased 70.3%. When combined, revenues from these two gaming formats have increased from $1.641 billion in FY 2012 to $2.793 billion in FY 2018, an increase of $1.152 billion.
• Not all areas of the State, especially areas already with available gaming options
(nearby casinos) experienced this level of growth. For example, there were approximately 11,000 video gaming terminals in the Chicago Metropolitan Statistical Area in FY 2018, which is the equivalency of adding over nine full-size casinos to this region. When adding the revenues generated by these video gaming terminals to the decreased AGR levels of casinos in the Chicago Area (including Indiana’s 5 casinos), overall gaming in the Chicago Area has only increased from $2.246 billion in FY 2012 to $2.540 billion in FY 2018. This is an average annual increase in gaming revenues of only 2.6%.
• In FY 2018, the Illinois Lottery had approximately $2.9 billion in sales, which
was an increase of 2.9%, or approximately $83 million, from FY 2017 levels. The increases were mainly driven by the draw games, up nearly $74 million in FY 2018 to $1.048 billion. The largest contributor to this increase in draw games was Mega Millions, which rose from $98.2 million to $125 million. Instant games grew $9 million in FY 2018 to $1.881 billion, an increase of 0.5%.
iii
• Lottery transfers to the Common School Fund totaled $718.8 million in FY 2018, a slight decline of 0.2% from FY 2017 levels. Transfers to special causes increased almost 23% in FY 2018 to $3.6 million. The amount transferred to the Capital Projects Fund (CPF) was $9.3 million, which is well below the $145 million transferred in FY 2014.
• Due to disappointing sales, in September 2015, the State and the Northstar
Lottery Group entered into a termination agreement that would begin the process to hire a new private lottery manager. After a lengthy transition process, in January 2018, the State entered into a new private management agreement with Camelot Illinois. Because of the newness of this change, the impact of this transition as it pertains to lottery sales and revenues is not yet known.
• Illinois’ total horse racing handle amount increased from $571 million in
CY 2016 to $587 million in CY 2017, an increase of 2.9%. The increase is primarily due to a 14.6% increase in advance deposit wagering (ADW). While the ADW handle increased $24 million in 2017, the handle from on-track and intertrack wagering both fell nearly $6 million apiece (-6.4% and -8.9%, respectively). Off-track wagering increased a modest $3 million (+1.2%). Despite the overall increase, 2017 levels are 36.8% below levels from just ten years ago and were the second lowest handle total in recent history.
• The horse racing industry is finding it difficult to compete not only with
racetracks in other states that are able to offer higher purses, but also with the proliferation of other gambling opportunities that now exist in the State. Currently, only three Illinois horse tracks remain in operation: Arlington Racecourse in Cook County, Hawthorne Race Course in Cook County, and Fairmount Park in Madison County.
• Options for new gaming in Illinois continue to be discussed. This includes
adding new casinos, allowing slot machines and/or table games at horse tracks, or simply expanding the position and terminal limits currently imposed at casinos and video gaming establishments. Other gaming options that are gaining attention include fantasy sports wagering, sports betting, Internet gambling, and historical horse racing.


1
OVERVIEW OF GAMING IN ILLINOIS
Up until six years ago, tax revenues from wagering in Illinois came from three primary sources: riverboat gambling, the lottery, and horse racing. But in September 2012, a new form of wagering entered the scene as the first legalized video gaming machines were put into operation. This new revenue source continues to thrive in Illinois as net terminal income from video gaming surpassed $1.4 billion in FY 2018, an increase of nearly 75% from just three years ago. While video gaming in Illinois has continued to grow, the revenue performance of Illinois’ other gaming formats has been mixed. The majority of gaming-related State designated tax revenue continues to come from the lottery ($732 million in FY 2018). While its revenues are down slightly from FY 2017 levels (-0.9%), it remains a relatively stable source of income for the State. Tax revenues from riverboat casinos continue to disappoint, generating $272 million in FY 2018. This is down from a high of nearly $700 million a little over a decade ago. The struggles of the horse racing industry continued in FY 2018, generating a mere $6 million. Despite the lack of growth in these revenue sources, State designated tax revenues from overall gaming in Illinois grew 3.5% in FY 2018 to $1.356 billion, an increase of $46 million. This is the highest combined tax revenue total for these wagering sources since $1.374 billion was receipted in FY 2006 and the second highest on record. Video gaming’s growth is a major reason for this overall increase as this form of gaming has more than offset the lack of growth from the other gaming formats. A table displaying a history of State-related revenues from the gaming industry is shown on the following page. Chart 1, below, displays the historical performance of gaming-related revenues in Illinois since 1975.
$0
$200
$400
$600
$800
$1,000
$1,200
$1,400
1975 1977 1979 1981 1983 1985 1987 1989 1991 1993 1995 1997 1999 2001 2003 2005 2007 2009 2011 2013 2015 2017
CHART 1: SOURCE OF GAMING-RELATED "STATE" REVENUES IN ILLINOIS(FY 1975 - FY 2018)
$ in millions
LOTTERY HORSE RACING RIVERBOAT VIDEO GAMING

2
FISCAL HORSE VIDEO PRIOR YEARYEAR LOTTERY(1) RACING(2) RIVERBOAT(3) GAMING(4) TOTAL % CHANGE
1975 $55 $63 $0 $0 $118 N/A1976 $76 $75 $0 $0 $151 28.0%1977 $44 $75 $0 $0 $119 -21.2%1978 $34 $74 $0 $0 $108 -9.2%1979 $33 $79 $0 $0 $112 3.7%1980 $33 $70 $0 $0 $103 -8.0%1981 $90 $73 $0 $0 $163 58.3%1982 $139 $68 $0 $0 $207 27.0%1983 $216 $66 $0 $0 $282 36.2%1984 $365 $65 $0 $0 $430 52.5%1985 $503 $61 $0 $0 $564 31.2%1986 $552 $51 $0 $0 $603 6.9%1987 $553 $57 $0 $0 $610 1.2%1988 $524 $46 $0 $0 $570 -6.6%1989 $586 $43 $0 $0 $629 10.4%1990 $594 $46 $0 $0 $640 1.7%1991 $580 $46 $0 $0 $626 -2.2%1992 $611 $45 $8 $0 $664 6.1%1993 $588 $48 $54 $0 $690 3.9%1994 $552 $47 $118 $0 $717 3.9%1995 $588 $45 $171 $0 $804 12.1%1996 $594 $46 $205 $0 $845 5.1%1997 $590 $45 $185 $0 $820 -3.0%1998 $560 $42 $170 $0 $772 -5.9%1999 $540 $42 $240 $0 $822 6.5%2000 $515 $13 $330 $0 $858 4.4%2001 $501 $13 $460 $0 $974 13.5%2002 $555 $13 $470 $0 $1,038 6.6%2003 $540 $13 $554 $0 $1,107 6.6%2004 $570 $13 $661 $0 $1,244 12.4%2005 $614 $12 $699 $0 $1,325 6.5%2006 $674 $11 $689 $0 $1,374 3.7%2007 $627 $9 $685 $0 $1,321 -3.9%2008 $662 $9 $564 $0 $1,235 -6.5%2009 $630 $7 $430 $0 $1,067 -13.6%2010 $629 $7 $383 $0 $1,019 -4.5%2011 $723 $7 $324 $0 $1,054 3.4%2012 $708 $8 $340 $0 $1,056 0.2%2013 $794 $7 $345 $24 $1,170 10.8%2014 $815 $7 $321 $114 $1,258 7.5%2015 $690 $7 $292 $196 $1,184 -5.8%2016 $680 $6 $277 $252 $1,215 2.6%2017 $738 $6 $270 $296 $1,310 7.9%2018 $732 $6 $272 $347 $1,356 3.5%
(2) Figures equal State revenue generated, not allocated.
TABLE 1: STATE GAMING REVENUE ($ in Millions)
Sources: Comptroller's Office, Illinois Department of Revenue, Illinois Gaming Board, and Illinois Racing Board.
(1) Figures represent all Lottery Transfers with the vast majority going into the Common School Fund. Also included are revenues from "special causes" games and revenues transferred into the Capital Projects Fund. The FY 2017 figure includes $14.7M in revenues collected in FY 2016, but officially receipted in FY 2017.
(3) Figures represent appropriations (FY 1992-FY 1995) and transfers (FY 1996-FY 2018) into the Education Assistance Fund and revenues deposited into the Common School Fund. It does not include revenues distributed to local governments or statutory distributions of revenues from the Des Plaines Casino.(4) Figures include revenues paid into the Capital Projects Fund (5/6 of the 30% tax). It does not include the portion paid to local governments (1/6 of the 30% tax). This figure does not match the Gaming Board's fiscal year totals due to an approximate one-month lag between reported activity and receipts.

3
As the previous charts show, in the early years of wagering, horse racing was the primary source of gambling in Illinois. But in the 1980s, the lottery emerged as the top revenue producer of wagering revenues. During the 1990s and into the 2000s, riverboat revenues as a percentage of total gaming revenues increased dramatically. After years of the lottery being the top producer of gaming revenues, FY 2003 was the first of five consecutive years that riverboat revenues topped lottery as the largest source of gaming-related revenues. However, declines in riverboat transfers, coupled with modest lottery growth, again placed lottery as the largest contributor of gaming revenues in Illinois. In FY 2018, lottery transfers (and other State-related lottery revenues) remained the largest generator of gaming revenues, comprising 53.9% of the revenue total. However, this percentage has declined from a recent high-mark of 67.8% in FY 2013. Riverboat transfers, which comprised over 50% of gaming related revenues just a decade ago, fell to 20.0% in FY 2018. In just its sixth year of generating tax revenues, video gaming’s composition has now surpassed that of riverboat casinos in this metric, growing to its FY 2018 composition value of 25.6%. This percentage will likely continue to increase over the next few years as video gaming approaches full-implementation. Horse racing revenues continued to comprise a relatively miniscule 0.4%. The overall decline in the composition of riverboat casino receipts occurred as a result of disappointing revenue performances from casinos throughout the State. The adjusted gross receipts (AGR) of the ten operating casinos fell a combined -1.3% in FY 2018, marking the sixth consecutive fiscal year of declining revenues. The Rivers Casino in Des Plaines continues to be, by far, the largest revenue producing casino in Illinois, generating $439 million in AGR in FY 2018. While this casino is up 3.9% over the last five years, all of the other nine casinos have experienced double-digit losses during this time span. Competition from the newer Des Plaines casino and the rapid development of video gaming in Illinois are viewed as the primary reasons for these overall downward trends. The growth of video gaming and the popularity of the Des Plaines’ casino have not only impacted other Illinois casinos, but have also impacted nearby casinos from bordering states. The Riverboat Gambling section includes a detailed look at the revenue performance of Illinois’ casinos, as well as the revenue returns of other casinos throughout the Midwest, and discusses how these results compare. The 2018 Spring Legislative Session again involved numerous discussions of expanding gambling in Illinois as a method of increasing revenues and jobs for the State. Like past years, these efforts have yet to materialize in enough support for passage. Because these discussions continue, the Commission has again included in this report an analysis of the major parts of gaming expansion that are often proposed in gaming legislation. They include adding additional positions, allowing slot machines at horse tracks, and adding additional casinos across Illinois.

4
Some would argue that significant gaming expansion has already taken place with the rapid growth of video gaming in Illinois. By the end of FY 2018, the number of video gaming terminals in operation across Illinois had risen to 29,283, the equivalent of over 24 full-size (1,200 positions) Illinois riverboat casinos. Although, the number of new terminals being introduced per month has slowed, current trends would indicate that this monthly total could reach 30,000 by the end of FY 2019. This figure is without the City of Chicago and numerous other communities in Illinois participating in video gaming due to local government bans on this form of gambling. The Video Gaming section provides a breakdown of the location and performance of the gaming terminals currently established across the State, along with a discussion of how the riverboat casino industry has been impacted by the emergence of video gaming. The largest amount of revenues from gaming-related sources continues to come from the State’s lottery program. While total lottery sales were up 2.9% for FY 2018, sales have been relatively stagnant since FY 2013 – increasing only 3.1% over this five-year period. Lottery-related transfers fell $6 million to $732 million in FY 2018, notably below the roughly $800 million in transfers processed in FY 2013 and FY 2014. This falloff is primarily because the amount transferred to the Capital Projects Fund has dropped from a high of $145 million in FY 2014 to its FY 2018 value of $9 million. The lack of significant growth in lottery sales is considered disappointing as higher totals were hoped for under the private management company, Northstar, which was selected to manage the Illinois lottery in 2010. Due to this poor performance, the State and Northstar entered into a letter of termination related to the private management agreement in September 2015. A 2016 request for proposal for a new private manager, however, resulted in only one bid, Camelot. In October 2017, the State came to agreement with Camelot. On January 2, 2018, a new firm called Camelot Illinois took over day-to-day management of the lottery. A discussion on this private management agreement, along with other statistics surrounding the lottery is included in the Lottery section of this report. As the popularity of video gaming grows in Illinois, the polar opposite seems to be the case for the horse racing industry. The amount wagered on Illinois horse racing (the handle) in 2017 was at $587 million, which is 36.8% below levels seen just a decade ago. To make matters worse, two of Illinois’ five major racetracks, Maywood Park and Balmoral Park, closed at the end of 2015. Because of the ongoing struggles of the horse racing industry, proponents continue to lobby for slot machines at their tracks as a way to augment revenues. Details regarding the impact of slot machines at other racetracks across the country, as well as other pertinent information relating to horse racing, are provided in the Horse Racing section.
5
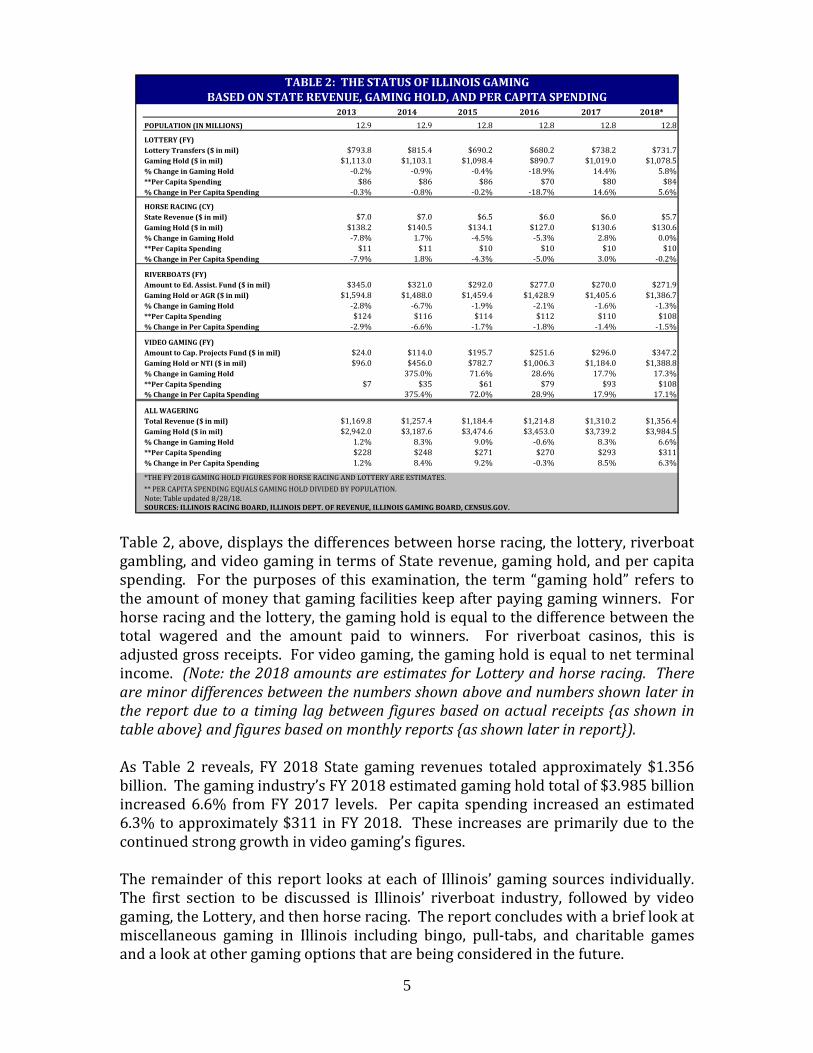
Table 2, above, displays the differences between horse racing, the lottery, riverboat gambling, and video gaming in terms of State revenue, gaming hold, and per capita spending. For the purposes of this examination, the term “gaming hold” refers to the amount of money that gaming facilities keep after paying gaming winners. For horse racing and the lottery, the gaming hold is equal to the difference between the total wagered and the amount paid to winners. For riverboat casinos, this is adjusted gross receipts. For video gaming, the gaming hold is equal to net terminal income. (Note: the 2018 amounts are estimates for Lottery and horse racing. There are minor differences between the numbers shown above and numbers shown later in the report due to a timing lag between figures based on actual receipts {as shown in table above} and figures based on monthly reports {as shown later in report}). As Table 2 reveals, FY 2018 State gaming revenues totaled approximately $1.356 billion. The gaming industry’s FY 2018 estimated gaming hold total of $3.985 billion increased 6.6% from FY 2017 levels. Per capita spending increased an estimated 6.3% to approximately $311 in FY 2018. These increases are primarily due to the continued strong growth in video gaming’s figures. The remainder of this report looks at each of Illinois’ gaming sources individually. The first section to be discussed is Illinois’ riverboat industry, followed by video gaming, the Lottery, and then horse racing. The report concludes with a brief look at miscellaneous gaming in Illinois including bingo, pull-tabs, and charitable games and a look at other gaming options that are being considered in the future.
2013 2014 2015 2016 2017 2018*POPULATION (IN MILLIONS) 12.9 12.9 12.8 12.8 12.8 12.8
LOTTERY (FY)Lottery Transfers ($ in mil) $793.8 $815.4 $690.2 $680.2 $738.2 $731.7Gaming Hold ($ in mil) $1,113.0 $1,103.1 $1,098.4 $890.7 $1,019.0 $1,078.5% Change in Gaming Hold -0.2% -0.9% -0.4% -18.9% 14.4% 5.8%**Per Capita Spending $86 $86 $86 $70 $80 $84% Change in Per Capita Spending -0.3% -0.8% -0.2% -18.7% 14.6% 5.6%
HORSE RACING (CY)State Revenue ($ in mil) $7.0 $7.0 $6.5 $6.0 $6.0 $5.7Gaming Hold ($ in mil) $138.2 $140.5 $134.1 $127.0 $130.6 $130.6% Change in Gaming Hold -7.8% 1.7% -4.5% -5.3% 2.8% 0.0%**Per Capita Spending $11 $11 $10 $10 $10 $10% Change in Per Capita Spending -7.9% 1.8% -4.3% -5.0% 3.0% -0.2%
RIVERBOATS (FY)Amount to Ed. Assist. Fund ($ in mil) $345.0 $321.0 $292.0 $277.0 $270.0 $271.9Gaming Hold or AGR ($ in mil) $1,594.8 $1,488.0 $1,459.4 $1,428.9 $1,405.6 $1,386.7% Change in Gaming Hold -2.8% -6.7% -1.9% -2.1% -1.6% -1.3%**Per Capita Spending $124 $116 $114 $112 $110 $108% Change in Per Capita Spending -2.9% -6.6% -1.7% -1.8% -1.4% -1.5%
VIDEO GAMING (FY)Amount to Cap. Projects Fund ($ in mil) $24.0 $114.0 $195.7 $251.6 $296.0 $347.2Gaming Hold or NTI ($ in mil) $96.0 $456.0 $782.7 $1,006.3 $1,184.0 $1,388.8% Change in Gaming Hold 375.0% 71.6% 28.6% 17.7% 17.3%**Per Capita Spending $7 $35 $61 $79 $93 $108% Change in Per Capita Spending 375.4% 72.0% 28.9% 17.9% 17.1%
ALL WAGERINGTotal Revenue ($ in mil) $1,169.8 $1,257.4 $1,184.4 $1,214.8 $1,310.2 $1,356.4Gaming Hold ($ in mil) $2,942.0 $3,187.6 $3,474.6 $3,453.0 $3,739.2 $3,984.5% Change in Gaming Hold 1.2% 8.3% 9.0% -0.6% 8.3% 6.6%**Per Capita Spending $228 $248 $271 $270 $293 $311% Change in Per Capita Spending 1.2% 8.4% 9.2% -0.3% 8.5% 6.3%
*THE FY 2018 GAMING HOLD FIGURES FOR HORSE RACING AND LOTTERY ARE ESTIMATES.** PER CAPITA SPENDING EQUALS GAMING HOLD DIVIDED BY POPULATION.Note: Table updated 8/28/18.
TABLE 2: THE STATUS OF ILLINOIS GAMINGBASED ON STATE REVENUE, GAMING HOLD, AND PER CAPITA SPENDING
SOURCES: ILLINOIS RACING BOARD, ILLINOIS DEPT. OF REVENUE, ILLINOIS GAMING BOARD, CENSUS.GOV.

6

7
RIVERBOAT GAMBLING

8
9
RIVERBOAT GAMBLING
Illinois became the second state to legalize riverboat casinos in February 1990 with the passage of the Riverboat Gambling Act (Public Act 86-1029). The State receives revenue from licensed riverboat gambling through license fees, wagering taxes, and admission taxes. The wagering tax is based on the adjusted gross receipts (AGR) of a riverboat, while the admission tax is based on the number of patrons visiting the facility. Because of this tax structure, adjusted gross receipts and admissions figures are the principal components that determine the amount of tax revenue collected by the State each year. While the State receives the majority of the revenue from riverboat gaming, a portion of the wagering tax and the admissions tax is distributed to the county and municipality where the casino is located. The Riverboat Gambling Act set the original wagering tax at an amount equal to 20 percent of a licensee’s annual adjusted gross receipts. At that time, it authorized ten riverboat casino licenses, and specified that each licensee may operate two riverboat casinos at a single-specified location. Since the State’s first riverboat casino – the Alton Belle – was launched on September 11, 1991, Illinois has experienced several major changes in the riverboat industry. Past changes include: the closure of the Silver Eagle in 1997; the creation of the graduated tax structure in 1998; the approval of dockside gambling in 1999; multiple changes to the wagering and admission tax rate structure, the hold harmless provision in FY 2006 and FY 2007, and impact fees paid to the horse racing industry. Since many of these topics were covered in earlier Commission reports, this section will focus on topics affecting FY 2018 and beyond. It opens by providing a basic summary of Illinois’ riverboat tax structure, as well as a synopsis of FY 2018 riverboat casino statistics and how these numbers compare to past years. It includes a discussion on factors that are currently impacting Illinois casinos and others that could impact the industry in the future, such as increased video gaming competition and gaming expansion. During the Spring 2017 and 2018 legislative sessions, debate regarding gaming expansion revolved around SB 0007. This piece of legislation would create a large Chicago casino, six additional riverboat casinos, racetrack casinos, and would allow additional gaming positions at current locations. In May 2017, SB 0007 passed the Senate. However, at the time of this report, the bill remains in the House despite the addition of several amendments used to seek advancement. While gaming expansion bills like SB 0007 have so far failed to receive support for legislative approval, this section analyzes this type of gaming proposal and discusses factors that could affect how much revenue could be generated if this type of legislation were enacted.
10
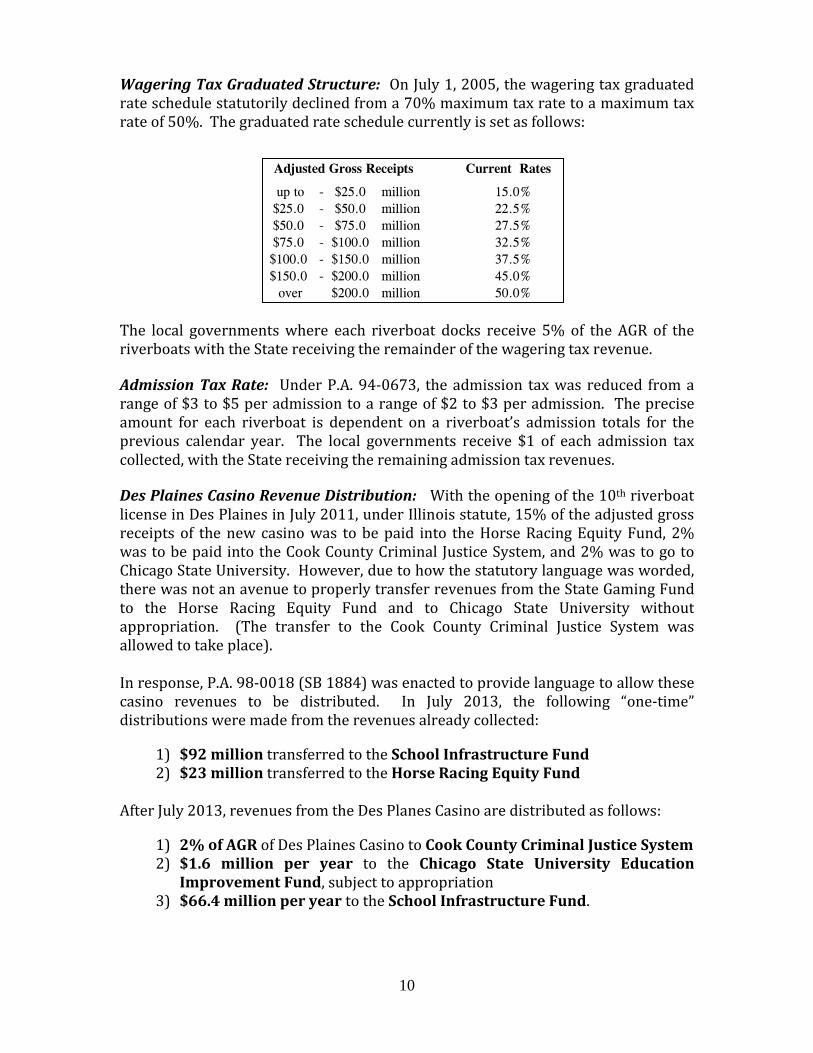
Wagering Tax Graduated Structure: On July 1, 2005, the wagering tax graduated rate schedule statutorily declined from a 70% maximum tax rate to a maximum tax rate of 50%. The graduated rate schedule currently is set as follows:
The local governments where each riverboat docks receive 5% of the AGR of the riverboats with the State receiving the remainder of the wagering tax revenue. Admission Tax Rate: Under P.A. 94-0673, the admission tax was reduced from a range of $3 to $5 per admission to a range of $2 to $3 per admission. The precise amount for each riverboat is dependent on a riverboat’s admission totals for the previous calendar year. The local governments receive $1 of each admission tax collected, with the State receiving the remaining admission tax revenues. Des Plaines Casino Revenue Distribution: With the opening of the 10th riverboat license in Des Plaines in July 2011, under Illinois statute, 15% of the adjusted gross receipts of the new casino was to be paid into the Horse Racing Equity Fund, 2% was to be paid into the Cook County Criminal Justice System, and 2% was to go to Chicago State University. However, due to how the statutory language was worded, there was not an avenue to properly transfer revenues from the State Gaming Fund to the Horse Racing Equity Fund and to Chicago State University without appropriation. (The transfer to the Cook County Criminal Justice System was allowed to take place). In response, P.A. 98-0018 (SB 1884) was enacted to provide language to allow these casino revenues to be distributed. In July 2013, the following “one-time” distributions were made from the revenues already collected:
1) $92 million transferred to the School Infrastructure Fund 2) $23 million transferred to the Horse Racing Equity Fund
After July 2013, revenues from the Des Planes Casino are distributed as follows:
1) 2% of AGR of Des Plaines Casino to Cook County Criminal Justice System 2) $1.6 million per year to the Chicago State University Education
Improvement Fund, subject to appropriation 3) $66.4 million per year to the School Infrastructure Fund.
Current Rates
up to - $25.0 million 15.0%$25.0 - $50.0 million 22.5%$50.0 - $75.0 million 27.5%$75.0 - $100.0 million 32.5%$100.0 - $150.0 million 37.5%$150.0 - $200.0 million 45.0%
over $200.0 million 50.0%
Adjusted Gross Receipts

11
Data Analysis The tables below and on the following page provide a summary of the performance of each of the State’s ten active riverboat licenses during fiscal years 2013 thru 2018 based on adjusted gross receipts, admissions, and State, local, and total revenue generated. The information comes from the Illinois Gaming Board’s Monthly Riverboat Casino Report(s).
FY 2013 FY 2014 FY 2015 FY 2016 FY 2017 FY 2018Des Plaines $410.1 $421.5 $428.2 $424.7 $429.3 $438.5Joliet Harrah's $206.5 $196.2 $195.8 $185.8 $182.6 $179.1Elgin $201.4 $180.2 $168.8 $170.0 $166.4 $162.9Joliet Hollywood $141.0 $123.6 $123.9 $125.2 $120.0 $120.7Aurora $149.2 $131.8 $125.1 $119.7 $121.2 $117.6East St. Louis $128.7 $116.2 $106.8 $108.1 $107.0 $99.1Metropolis $91.8 $80.6 $83.6 $82.4 $79.7 $73.6East Peoria $112.0 $100.1 $93.2 $86.0 $78.9 $77.7Rock Island $85.5 $77.6 $77.3 $76.7 $72.1 $70.0Alton $68.5 $59.8 $56.6 $50.4 $48.3 $47.4TOTAL $1,594.8 $1,487.6 $1,459.4 $1,428.9 $1,405.6 $1,386.7% INCREASE -2.8% -6.7% -1.9% -2.1% -1.6% -1.3%
SOURCE: ILLINOIS GAMING BOARD, MONTHLY RIVERBOAT CASINO REPORT
FY 2013 FY 2014 FY 2015 FY 2016 FY 2017 FY 2018Des Plaines 3,846,084 3,633,523 3,463,309 3,346,849 3,187,953 3,035,086 Joliet Harrah's 1,721,408 1,606,567 1,594,741 1,530,609 1,429,434 1,332,463 Elgin 1,634,974 1,470,024 1,341,104 1,366,731 1,320,807 1,237,674 Joliet Hollywood 1,326,579 1,143,896 1,084,189 1,101,637 1,047,889 1,001,302 Aurora 1,338,499 1,140,285 1,072,737 1,018,597 1,000,218 945,109 East St. Louis 1,791,770 1,542,603 1,311,198 1,226,581 1,142,751 1,000,640 Metropolis 718,985 628,458 702,039 655,981 563,224 484,155 East Peoria 1,154,330 1,037,744 997,589 920,257 808,396 746,844 Rock Island 1,260,803 1,108,979 1,073,840 1,026,313 973,516 942,041 Alton 818,856 701,461 625,566 532,252 509,339 490,469
TOTAL 15,612,288 14,013,540 13,266,312 12,725,807 11,983,527 11,215,783 % INCREASE -4.6% -10.2% -5.3% -4.1% -5.8% -6.4%
SOURCE: ILLINOIS GAMING BOARD, MONTHLY RIVERBOAT CASINO REPORT
TABLE 3: ILLINOIS RIVERBOAT ADJUSTED GROSS RECEIPTS (FY 2013 - FY 2018)
($ in millions)
TABLE 4: ILLINOIS RIVERBOAT ADMISSIONS (FY 2013 - FY 2018)

12
FY 2013 FY 2014 FY 2015 FY 2016 FY 2017 FY 2018Des Plaines* $157.9 $162.6 $165.3 $163.4 $165.2 $169.0Joliet Harrah's $62.7 $58.1 $57.5 $53.0 $51.7 $50.4Elgin $60.9 $52.3 $46.2 $46.6 $44.5 $44.0Joliet Hollywood $35.4 $30.1 $29.2 $29.8 $28.1 $28.4Aurora $38.4 $33.0 $29.9 $28.0 $28.2 $27.3East St. Louis $32.5 $28.6 $24.6 $24.2 $24.2 $21.4Metropolis $19.1 $15.8 $16.1 $15.9 $15.0 $14.9East Peoria $26.0 $22.3 $19.6 $17.8 $15.6 $13.7Rock Island $16.9 $14.7 $14.1 $14.0 $13.0 $12.3Alton $12.8 $10.7 $9.6 $8.2 $7.7 $7.4TOTAL $462.6 $428.1 $412.1 $400.8 $393.0 $388.8% INCREASE 2.8% -7.5% -3.7% -2.7% -1.9% -1.1%Des Plaines Distributions*: ($77.9) ($76.7) ($76.8) ($76.8) ($76.8) ($77.0)Total after Distributions: $384.7 $351.4 $335.3 $324.0 $316.2 $311.8% INCREASE 2.6% -8.6% -4.6% -3.3% -2.4% -1.4%
FY 2013 FY 2014 FY 2015 FY 2016 FY 2017 FY 2018Des Plaines $24.4 $24.7 $24.9 $24.6 $24.7 $25.0Joliet Harrah's $12.0 $11.4 $11.4 $10.8 $10.6 $10.3Elgin $11.7 $10.5 $9.8 $9.9 $9.6 $9.4Joliet Hollywood $8.4 $7.3 $7.3 $7.4 $7.0 $7.0Aurora $8.8 $7.7 $7.3 $7.0 $7.1 $6.8East St. Louis $8.2 $7.4 $6.7 $6.6 $6.5 $6.0Metropolis $5.3 $4.7 $4.9 $4.8 $4.5 $4.6East Peoria $6.8 $6.0 $5.7 $5.2 $4.8 $4.2Rock Island $5.5 $5.0 $4.9 $4.9 $4.6 $4.4Alton $4.2 $3.7 $3.5 $3.1 $2.9 $2.9
TOTAL $95.4 $88.4 $86.2 $84.2 $82.3 $80.5% INCREASE -3.1% -7.3% -2.4% -2.4% -2.3% -2.1%
SOURCE: ILLINOIS GAMING BOARD, MONTHLY RIVERBOAT CASINO REPORT
FY 2013 FY 2014 FY 2015 FY 2016 FY 2017 FY 2018Des Plaines $182.2 $187.3 $190.1 $188.0 $189.9 $194.0Joliet Harrah's $74.7 $69.5 $68.9 $63.9 $62.2 $60.7Elgin $72.6 $62.8 $56.0 $56.4 $54.1 $53.4Joliet Hollywood $43.8 $37.4 $36.5 $37.1 $35.1 $35.4Aurora $47.2 $40.7 $37.2 $35.0 $35.3 $34.1East St. Louis $40.8 $35.9 $31.2 $30.8 $30.6 $27.3Metropolis $24.4 $20.4 $21.0 $20.7 $19.5 $19.5East Peoria $32.8 $28.3 $25.2 $23.0 $20.3 $17.8Rock Island $22.4 $19.7 $19.1 $18.9 $17.6 $16.8Alton $17.1 $14.4 $13.1 $11.3 $10.6 $10.3
TOTAL $557.9 $516.5 $498.3 $485.0 $475.3 $469.4% INCREASE 1.8% -7.4% -3.5% -2.7% -2.0% -1.2%
SOURCE: ILLINOIS GAMING BOARD, MONTHLY RIVERBOAT CASINO REPORT
TABLE 5: STATE REVENUE GENERATED FROM ILLINOIS RIVERBOATS (FY 2013 - FY 2018)
($ in millions)
* Of the State revenues generated by Des Plaines in FY 2012 and FY 2013, a portion ($75M in FY 2012 and $78M in FY 2013) was statutorily set aside to be paid into other funds, including the Horse Racing Equity Fund, the Cook County Criminal Justice System, and Chicago St. University. P.A. 98-0018 altered the distribution language to provide that the Horse Racing Equity Fund will receive only $23M (one-time in July 2013) and will receive no additional transfers in the future. Chicago St. will receive $1.6M per year, but received no one-time transfers in July 2013. The School Infrastructure Fund received a one-time payment of $92M in July 2013 and will annually receive $66.4M per year from this revenue source. The Cook County Criminal Justice System continues to receive 2% of Des Plaines' AGR.
TABLE 6: LOCAL REVENUE GENERATED FROM ILLINOIS RIVERBOATS (FY 2013 - FY 2018)
($ in millions)
TABLE 7: TOTAL REVENUE GENERATED FROM ILLINOIS RIVERBOATS (FY 2013 - FY 2018)
($ in millions)
SOURCE: ILLINOIS GAMING BOARD, MONTHLY RIVERBOAT CASINO REPORT
13
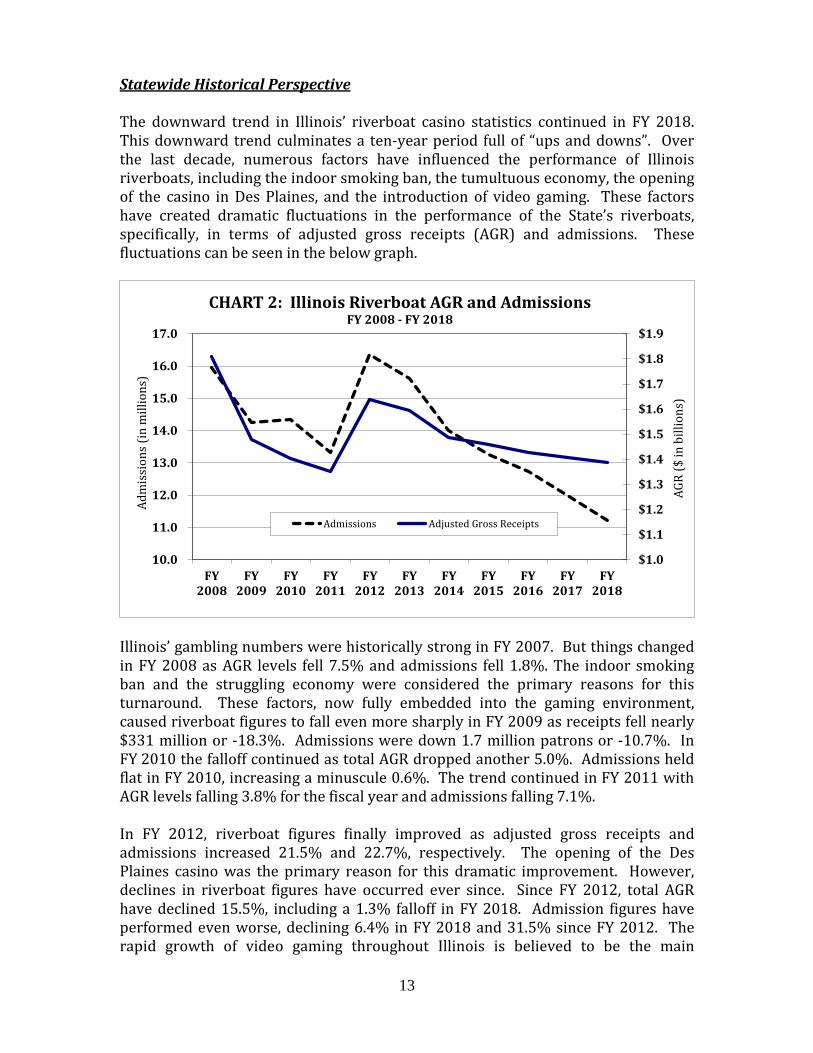
Statewide Historical Perspective
The downward trend in Illinois’ riverboat casino statistics continued in FY 2018. This downward trend culminates a ten-year period full of “ups and downs”. Over the last decade, numerous factors have influenced the performance of Illinois riverboats, including the indoor smoking ban, the tumultuous economy, the opening of the casino in Des Plaines, and the introduction of video gaming. These factors have created dramatic fluctuations in the performance of the State’s riverboats, specifically, in terms of adjusted gross receipts (AGR) and admissions. These fluctuations can be seen in the below graph.
Illinois’ gambling numbers were historically strong in FY 2007. But things changed in FY 2008 as AGR levels fell 7.5% and admissions fell 1.8%. The indoor smoking ban and the struggling economy were considered the primary reasons for this turnaround. These factors, now fully embedded into the gaming environment, caused riverboat figures to fall even more sharply in FY 2009 as receipts fell nearly $331 million or -18.3%. Admissions were down 1.7 million patrons or -10.7%. In FY 2010 the falloff continued as total AGR dropped another 5.0%. Admissions held flat in FY 2010, increasing a minuscule 0.6%. The trend continued in FY 2011 with AGR levels falling 3.8% for the fiscal year and admissions falling 7.1%. In FY 2012, riverboat figures finally improved as adjusted gross receipts and admissions increased 21.5% and 22.7%, respectively. The opening of the Des Plaines casino was the primary reason for this dramatic improvement. However, declines in riverboat figures have occurred ever since. Since FY 2012, total AGR have declined 15.5%, including a 1.3% falloff in FY 2018. Admission figures have performed even worse, declining 6.4% in FY 2018 and 31.5% since FY 2012. The rapid growth of video gaming throughout Illinois is believed to be the main
$1.0
$1.1
$1.2
$1.3
$1.4
$1.5
$1.6
$1.7
$1.8
$1.9
10.0
11.0
12.0
13.0
14.0
15.0
16.0
17.0
FY2008
FY2009
FY2010
FY2011
FY2012
FY2013
FY2014
FY2015
FY2016
FY2017
FY2018
AGR
($ in
bill
ions
)
Adm
issi
ons (
in m
illio
ns)
CHART 2: Illinois Riverboat AGR and AdmissionsFY 2008 - FY 2018
Admissions Adjusted Gross Receipts
14
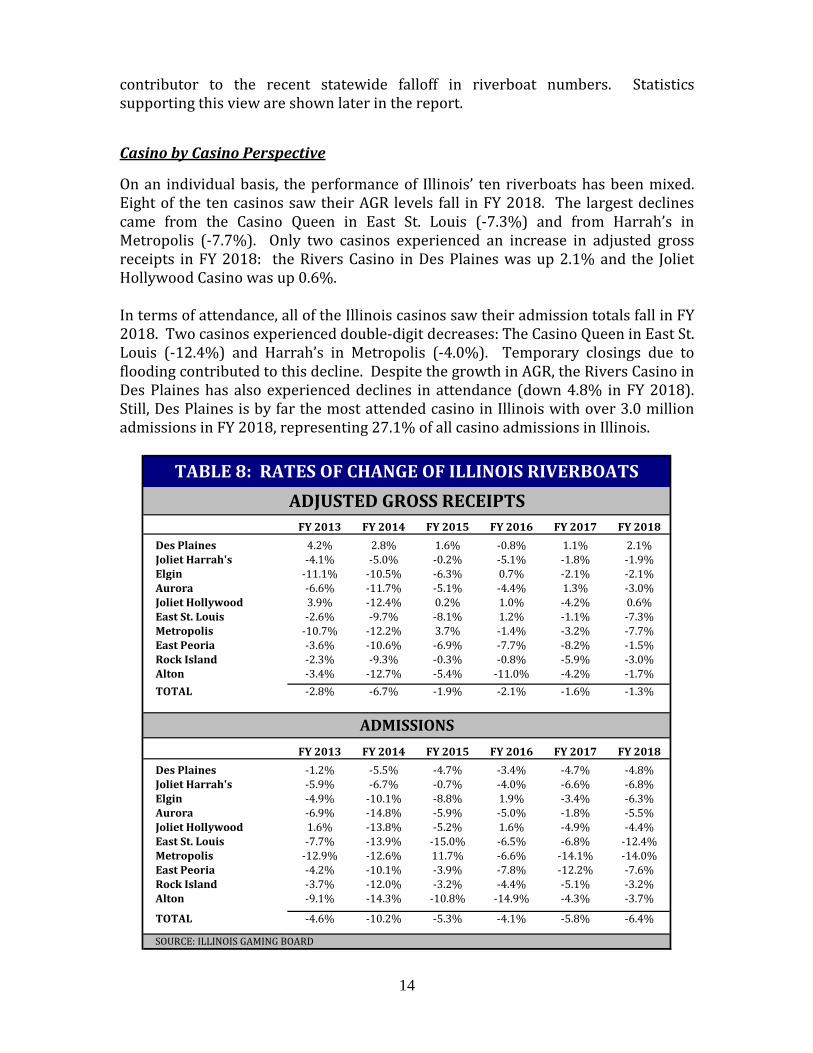
contributor to the recent statewide falloff in riverboat numbers. Statistics supporting this view are shown later in the report. Casino by Casino Perspective On an individual basis, the performance of Illinois’ ten riverboats has been mixed. Eight of the ten casinos saw their AGR levels fall in FY 2018. The largest declines came from the Casino Queen in East St. Louis (-7.3%) and from Harrah’s in Metropolis (-7.7%). Only two casinos experienced an increase in adjusted gross receipts in FY 2018: the Rivers Casino in Des Plaines was up 2.1% and the Joliet Hollywood Casino was up 0.6%. In terms of attendance, all of the Illinois casinos saw their admission totals fall in FY 2018. Two casinos experienced double-digit decreases: The Casino Queen in East St. Louis (-12.4%) and Harrah’s in Metropolis (-4.0%). Temporary closings due to flooding contributed to this decline. Despite the growth in AGR, the Rivers Casino in Des Plaines has also experienced declines in attendance (down 4.8% in FY 2018). Still, Des Plaines is by far the most attended casino in Illinois with over 3.0 million admissions in FY 2018, representing 27.1% of all casino admissions in Illinois.
FY 2013 FY 2014 FY 2015 FY 2016 FY 2017 FY 2018Des Plaines 4.2% 2.8% 1.6% -0.8% 1.1% 2.1%Joliet Harrah's -4.1% -5.0% -0.2% -5.1% -1.8% -1.9%Elgin -11.1% -10.5% -6.3% 0.7% -2.1% -2.1%Aurora -6.6% -11.7% -5.1% -4.4% 1.3% -3.0%Joliet Hollywood 3.9% -12.4% 0.2% 1.0% -4.2% 0.6%East St. Louis -2.6% -9.7% -8.1% 1.2% -1.1% -7.3%Metropolis -10.7% -12.2% 3.7% -1.4% -3.2% -7.7%East Peoria -3.6% -10.6% -6.9% -7.7% -8.2% -1.5%Rock Island -2.3% -9.3% -0.3% -0.8% -5.9% -3.0%Alton -3.4% -12.7% -5.4% -11.0% -4.2% -1.7%TOTAL -2.8% -6.7% -1.9% -2.1% -1.6% -1.3%
FY 2013 FY 2014 FY 2015 FY 2016 FY 2017 FY 2018Des Plaines -1.2% -5.5% -4.7% -3.4% -4.7% -4.8%Joliet Harrah's -5.9% -6.7% -0.7% -4.0% -6.6% -6.8%Elgin -4.9% -10.1% -8.8% 1.9% -3.4% -6.3%Aurora -6.9% -14.8% -5.9% -5.0% -1.8% -5.5%Joliet Hollywood 1.6% -13.8% -5.2% 1.6% -4.9% -4.4%East St. Louis -7.7% -13.9% -15.0% -6.5% -6.8% -12.4%Metropolis -12.9% -12.6% 11.7% -6.6% -14.1% -14.0%East Peoria -4.2% -10.1% -3.9% -7.8% -12.2% -7.6%Rock Island -3.7% -12.0% -3.2% -4.4% -5.1% -3.2%Alton -9.1% -14.3% -10.8% -14.9% -4.3% -3.7%
TOTAL -4.6% -10.2% -5.3% -4.1% -5.8% -6.4%
SOURCE: ILLINOIS GAMING BOARD
TABLE 8: RATES OF CHANGE OF ILLINOIS RIVERBOATSADJUSTED GROSS RECEIPTS
ADMISSIONS
15
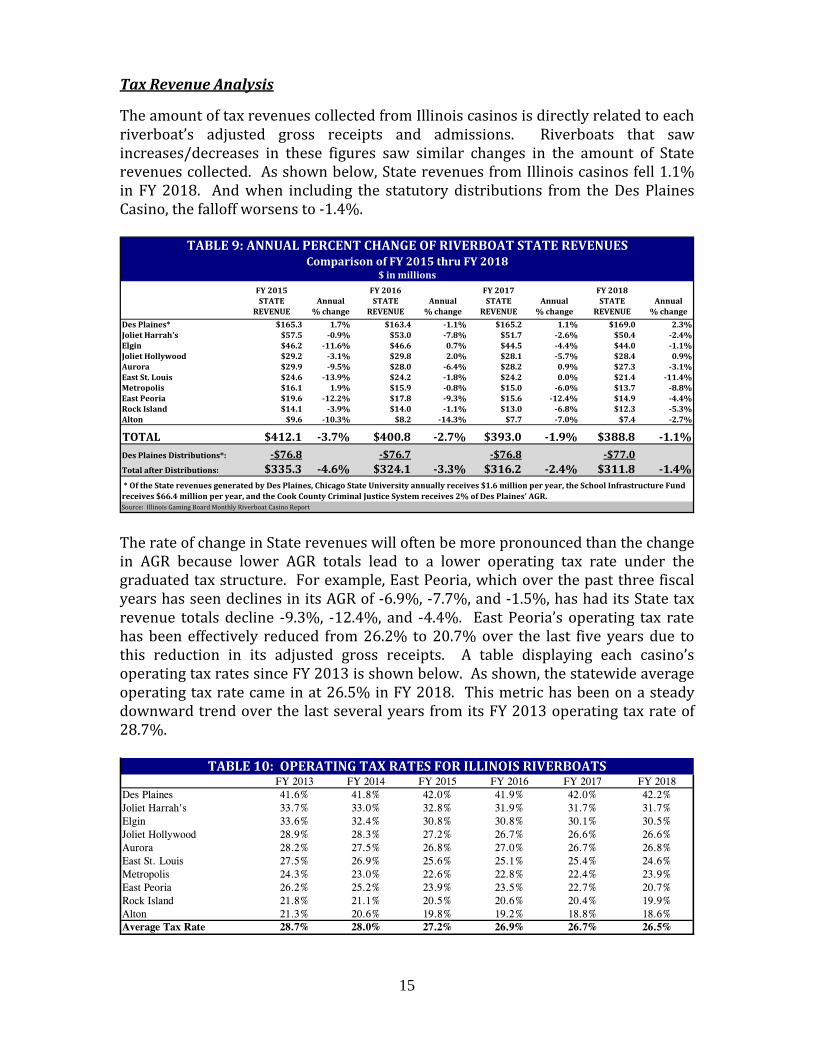
Tax Revenue Analysis The amount of tax revenues collected from Illinois casinos is directly related to each riverboat’s adjusted gross receipts and admissions. Riverboats that saw increases/decreases in these figures saw similar changes in the amount of State revenues collected. As shown below, State revenues from Illinois casinos fell 1.1% in FY 2018. And when including the statutory distributions from the Des Plaines Casino, the falloff worsens to -1.4%.
The rate of change in State revenues will often be more pronounced than the change in AGR because lower AGR totals lead to a lower operating tax rate under the graduated tax structure. For example, East Peoria, which over the past three fiscal years has seen declines in its AGR of -6.9%, -7.7%, and -1.5%, has had its State tax revenue totals decline -9.3%, -12.4%, and -4.4%. East Peoria’s operating tax rate has been effectively reduced from 26.2% to 20.7% over the last five years due to this reduction in its adjusted gross receipts. A table displaying each casino’s operating tax rates since FY 2013 is shown below. As shown, the statewide average operating tax rate came in at 26.5% in FY 2018. This metric has been on a steady downward trend over the last several years from its FY 2013 operating tax rate of 28.7%.
FY 2015 FY 2016 FY 2017 FY 2018STATE Annual STATE Annual STATE Annual STATE Annual
REVENUE % change REVENUE % change REVENUE % change REVENUE % changeDes Plaines* $165.3 1.7% $163.4 -1.1% $165.2 1.1% $169.0 2.3%Joliet Harrah's $57.5 -0.9% $53.0 -7.8% $51.7 -2.6% $50.4 -2.4%Elgin $46.2 -11.6% $46.6 0.7% $44.5 -4.4% $44.0 -1.1%Joliet Hollywood $29.2 -3.1% $29.8 2.0% $28.1 -5.7% $28.4 0.9%Aurora $29.9 -9.5% $28.0 -6.4% $28.2 0.9% $27.3 -3.1%East St. Louis $24.6 -13.9% $24.2 -1.8% $24.2 0.0% $21.4 -11.4%Metropolis $16.1 1.9% $15.9 -0.8% $15.0 -6.0% $13.7 -8.8%East Peoria $19.6 -12.2% $17.8 -9.3% $15.6 -12.4% $14.9 -4.4%Rock Island $14.1 -3.9% $14.0 -1.1% $13.0 -6.8% $12.3 -5.3%Alton $9.6 -10.3% $8.2 -14.3% $7.7 -7.0% $7.4 -2.7%
TOTAL $412.1 -3.7% $400.8 -2.7% $393.0 -1.9% $388.8 -1.1%Des Plaines Distributions*: -$76.8 -$76.7 -$76.8 -$77.0Total after Distributions: $335.3 -4.6% $324.1 -3.3% $316.2 -2.4% $311.8 -1.4%
Source: Illinois Gaming Board Monthly Riverboat Casino Report
* Of the State revenues generated by Des Plaines, Chicago State University annually receives $1.6 million per year, the School Infrastructure Fund receives $66.4 million per year, and the Cook County Criminal Justice System receives 2% of Des Plaines' AGR.
TABLE 9: ANNUAL PERCENT CHANGE OF RIVERBOAT STATE REVENUESComparison of FY 2015 thru FY 2018
$ in millions
FY 2013 FY 2014 FY 2015 FY 2016 FY 2017 FY 2018Des Plaines 41.6% 41.8% 42.0% 41.9% 42.0% 42.2%Joliet Harrah's 33.7% 33.0% 32.8% 31.9% 31.7% 31.7%Elgin 33.6% 32.4% 30.8% 30.8% 30.1% 30.5%Joliet Hollywood 28.9% 28.3% 27.2% 26.7% 26.6% 26.6%Aurora 28.2% 27.5% 26.8% 27.0% 26.7% 26.8%East St. Louis 27.5% 26.9% 25.6% 25.1% 25.4% 24.6%Metropolis 24.3% 23.0% 22.6% 22.8% 22.4% 23.9%East Peoria 26.2% 25.2% 23.9% 23.5% 22.7% 20.7%Rock Island 21.8% 21.1% 20.5% 20.6% 20.4% 19.9%Alton 21.3% 20.6% 19.8% 19.2% 18.8% 18.6%Average Tax Rate 28.7% 28.0% 27.2% 26.9% 26.7% 26.5%
TABLE 10: OPERATING TAX RATES FOR ILLINOIS RIVERBOATS
16
Reasons for the Recent Declines In FY 2007, Illinois’ nine casinos (before Des Plaines) reached an adjusted gross receipts total of near $2.0 billion. In FY 2018, the AGR total was a little under $1.4 billion, a decline of 29.2% from this peak period. In the initial years after this peak, the declines were speculated to be the results of the struggling economy, as well as the indoor smoking ban. While State totals improved significantly in FY 2012 (reaching $1.6 billion) due to the addition of the new casino in Des Plaines, all other casinos have seen their adjusted gross receipts fall. In fact, since FY 2007, eight of the nine “older” casinos have seen their AGR levels fall more than 40% with the sharpest decline coming from Elgin’s casino at -62.7%. The only exception is Rock Island which has benefitted from a newer casino. As has been highlighted extensively in past editions of this report, the July 2011 opening of the Des Plaines casino had an obvious cannibalization effect on nearby casinos. When looking at the four “older” casinos in the Chicago area since Des Plaines’ opening, comparing FY 2011 totals to FY 2015 levels, their combined AGR fell $235 million, or -27.7%. Although Des Plaines generated $428 million in adjusted gross receipts in FY 2015 - when accounting for the $235 million loss from the other four casinos - adjusted gross receipts were only up a net $193 million, compared to FY 2011. Still, even with these losses, adjusted gross receipts grew 22.8% over these fiscal years in the Chicago metro area. Not only has the Des Plaines casino impacted Illinois existing riverboats, it also has had an impact on several of the area casinos in Indiana as well. In FY 2018, the AGR of the five Indiana casinos near the Chicago metropolitan area totaled $894 million, which is $282 million or 24.0% below their FY 2011 levels. This includes a 25.4% decline at the Horseshoe Casino in Hammond, which is arguably the biggest competitor to Illinois casinos. It is likely that a significant portion of the $282 million that Indiana’s Chicago area casinos have lost over the past several years has found its way into Illinois. However, if Indiana money has found its way into Illinois’ coffers, it appears not all of it has come via casino revenues. When combining the AGR levels for all casinos in the Chicago Metropolitan Area (including the five Indiana casinos), casino revenues are down a combined $111.7 million or -5.5% in FY 2018 compared to FY 2011. So despite the creation of the Des Plaines casino, adjusted gross receipts of the casinos in the Chicago Metropolitan Area are actually lower now ($1.913 billion in FY 2018) than they were before the Des Plaines casino opened ($2.025 billion in FY 2011). It can be summarized that while the casino in Des Plaines has negatively impacted the nearby casinos, the numbers indicate that another factor is driving the overall declines of the casino gaming market in this area in recent years. This factor is widely believed to be the emergence of video gaming machines in Illinois. This is discussed in detail on page 43 in the Video Gaming section.

17
$ IN MILLIONSCasino Type Region
FY 2013 AGR
FY 2014 AGR
FY 2015 AGR
FY 2016 AGR
FY 2017 AGR
FY 2018 AGR
1-Yr. Change
2-Yr. Change
5-Yr. Change
June 2018 Positions
2018 AGR/ Pos/Day
ALTON ARGOSY - Alton Casino St. Louis $68.5 $59.8 $56.6 $50.4 $48.3 $47.4 -1.7% -5.8% -30.8% 727 $179PAR-A-DICE - E. Peoria Casino Central IL $112.0 $100.1 $93.2 $86.0 $78.9 $77.7 -1.5% -9.6% -30.6% 951 $224JUMER'S - Rock Island Casino Quad City $85.5 $77.6 $77.3 $76.7 $72.1 $70.0 -3.0% -8.7% -18.1% 1,039 $185HOLLYWOOD CASINO - Joliet Casino Chicago $141.0 $123.6 $123.9 $125.2 $120.0 $120.7 0.6% -3.6% -14.4% 1,080 $306HARRAH'S - Metropolis Casino S. Illinois $91.8 $80.6 $83.6 $82.4 $79.7 $73.6 -7.7% -10.7% -19.8% 893 $226HARRAH'S - Joliet Casino Chicago $206.5 $196.2 $195.8 $185.8 $182.6 $179.1 -1.9% -3.6% -13.3% 1,193 $411HOLLYWOOD CASINO - Aurora Casino Chicago $149.2 $131.8 $125.1 $119.7 $121.2 $117.6 -3.0% -1.7% -21.2% 1,120 $288CASINO QUEEN - E. St. Louis Casino St. Louis $128.7 $116.2 $106.8 $108.1 $107.0 $99.1 -7.3% -8.3% -23.0% 1,096 $248GRAND VICTORIA - Elgin Casino Chicago $201.4 $180.2 $168.8 $170.0 $166.4 $162.9 -2.1% -4.2% -19.1% 1,200 $372RIVERS CASINO - Des Plaines Casino Chicago $410.1 $421.5 $428.2 $424.7 $429.3 $438.5 2.1% 3.3% 6.9% 1,200 $1,001TOTALS $1,594.8 $1,487.6 $1,459.4 $1,428.9 $1,405.6 $1,386.7 -1.3% -3.0% -13.1% 10,498 $362CHICAGO REGION TOTALS $1,108.3 $1,053.3 $1,041.9 $1,025.4 $1,019.5 $1,018.8 -0.1% -0.6% -8.1% 5,792 $482CHICAGO REGION W/O DES PLAINES $698.2 $631.8 $613.7 $600.7 $590.2 $580.3 -1.7% -3.4% -16.9% 4,592 $346ST. LOUIS REGION TOTALS $197.2 $176.1 $163.4 $158.5 $155.3 $146.6 -5.6% -7.5% -25.7% 1,823 $220
$ IN MILLIONSCasino Type
Region(*near IL)
FY 2013 AGR
FY 2014 AGR
FY 2015 AGR
FY 2016 AGR
FY 2017 AGR
FY 2018 AGR
1-Yr. Change
2-Yr. Change
5-Yr. Change
June 2018 Positions
2018 AGR/ Pos/Day
AMERISTAR - East Chicago Casino NW Indiana* $231.5 $208.7 $221.2 $222.8 $204.1 $208.5 2.1% -6.4% -10.0% 1,738 $329HOLLYWOOD - Lawrenceburg Casino SE Indiana $339.0 $214.5 $179.2 $168.4 $162.9 $167.7 3.0% -0.4% -50.5% 1,666 $276BELTERRA - Switzerland County Casino SE Indiana $140.4 $113.2 $110.1 $103.2 $111.2 $109.2 -1.8% 5.8% -22.2% 1,299 $230BLUE CHIP - Michigan City Casino NW Indiana* $166.4 $149.7 $152.5 $155.1 $152.6 $146.4 -4.1% -5.6% -12.1% 1,771 $226TROPICANA - Evansville Casino S. Indiana $114.8 $111.4 $115.6 $119.4 $120.7 $142.3 17.9% 19.1% 23.9% 1,243 $314FRENCH LICK - French Lick Casino S. Indiana $82.6 $68.4 $71.0 $77.5 $85.4 $86.3 1.0% 11.3% 4.5% 1,033 $229RISING STAR - Rising Sun Casino SE Indiana $78.0 $54.7 $43.7 $45.0 $45.8 $44.9 -2.0% -0.1% -42.4% 1,015 $121HOOSIER PARK - Anderson Racino Central IN $188.9 $201.6 $198.4 $204.1 $209.5 $208.8 -0.3% 2.3% 10.5% 1,644 $348HORSESHOE - Hammond Casino NW Indiana* $489.0 $455.8 $427.5 $412.0 $399.3 $401.4 0.5% -2.6% -17.9% 2,870 $383HORSESHOE - Harrison County Casino S. Indiana $269.9 $257.8 $247.6 $244.0 $242.1 $238.0 -1.7% -2.4% -11.8% 1,969 $331INDIANA GRAND - Shelbyville Racino Central IN $208.8 $236.2 $239.3 $245.3 $256.1 $261.1 2.0% 6.5% 25.1% 1,982 $361MAJESTIC STAR - Gary Casino NW Indiana* $102.8 $93.5 $87.4 $83.8 $86.2 $84.3 -2.3% 0.6% -18.1% 1,028 $225MAJESTIC STAR II - Gary Casino NW Indiana* $83.6 $67.6 $63.2 $60.1 $54.5 $53.7 -1.4% -10.6% -35.7% 850 $173TOTALS $2,495.8 $2,232.9 $2,156.7 $2,140.5 $2,130.4 $2,152.6 1.0% 0.6% -13.7% 20,108 $293CHICAGO REGION AREA TOTALS $1,073.4 $975.2 $951.8 $933.7 $896.7 $894.3 -0.3% -4.2% -16.7% 8,257 $297Composition of Chicago Region: 49.2% 48.1% 47.7% 47.7% 46.8% 46.7%TOTAL CASINOS $2,098.1 $1,795.1 $1,719.0 $1,691.1 $1,664.8 $1,682.7 1.1% -0.5% -19.8% 16,482 $280TOTAL RACINOS $397.7 $437.8 $437.7 $449.4 $465.5 $470.0 0.9% 4.6% 18.2% 3,626 $355
$ IN MILLIONSCasino Type
Region(*near IL)
FY 2013 AGR
FY 2014 AGR
FY 2015 AGR
FY 2016 AGR
FY 2017 AGR
FY 2018 AGR
1-Yr. Change
2-Yr. Change
5-Yr. Change
June 2018 Positions
2018 AGR/ Pos/Day
ARGOSY - Riverside Casino Kansas City $152.8 $142.9 $141.8 $151.2 $155.6 $165.6 6.5% 9.6% 8.4% 1,539 $295ISLE OF CAPRI - Boonville Casino Central MO $82.1 $78.0 $81.6 $81.6 $81.5 $80.2 -1.6% -1.7% -2.3% 910 $242LADY LUCK - Caruthersville Casino SE Missouri $33.2 $31.1 $34.2 $37.1 $36.9 $37.3 1.0% 0.4% 12.3% 512 $200HOLLYWOOD - Maryland Hts Casino St. Louis* $243.0 $223.4 $218.9 $228.5 $239.1 $236.1 -1.2% 3.3% -2.8% 2,229 $290HARRAH'S - North Kansas City Casino Kansas City $179.9 $175.1 $174.6 $172.9 $169.6 $174.2 2.7% 0.8% -3.2% 1,493 $320ISLE OF CAPRI - Kansas City Casino Kansas City $79.9 $75.6 $77.7 $77.4 $75.0 $70.2 -6.4% -9.4% -12.1% 945 $204LUMIERE PLACE - St. Louis Casino St. Louis* $160.3 $145.0 $136.0 $138.1 $140.5 $159.9 13.8% 15.8% -0.2% 1,665 $263AMERISTAR - Kansas City Casino Kansas City $213.2 $197.6 $196.2 $199.9 $194.3 $191.5 -1.4% -4.2% -10.2% 2,303 $228RIVER CITY - St. Louis Casino St. Louis* $205.8 $207.6 $216.0 $223.7 $224.9 $224.4 -0.2% 0.3% 9.0% 2,014 $305MARK TWAIN - LaGrange Casino E. Missouri* $38.4 $36.6 $36.1 $36.1 $34.3 $33.6 -2.0% -6.9% -12.6% 461 $200AMERISTAR - St. Charles Casino St. Louis* $270.0 $254.4 $266.0 $262.2 $261.3 $264.6 1.3% 0.9% -2.0% 2,523 $287FRONTIER - St. Joseph Casino NW Missouri $40.4 $37.9 $40.0 $39.6 $40.1 $43.0 7.1% 8.3% 6.4% 457 $258ISLE OF CAPRI - Cape Girardeau Casino E. Missouri* $45.7 $57.3 $63.0 $64.8 $65.9 $65.0 -1.3% 0.4% 42.2% 908 $196TOTALS $1,744.8 $1,662.5 $1,682.1 $1,713.1 $1,718.9 $1,745.6 1.6% 1.9% 0.1% 17,958 $266ST LOUIS REGION TOTALS $879.1 $830.4 $836.8 $852.5 $865.8 $885.1 2.2% 3.8% 0.7% 8,431 $288Composition of St. Louis Region: 81.7% 82.5% 83.7% 84.3% 84.8% 85.8%
$ IN MILLIONSCasino Type
Region(*near IL)
FY 2013 AGR
FY 2014 AGR
FY 2015 AGR
FY 2016 AGR
FY 2017 AGR
FY 2018 AGR
1-Yr. Change
2-Yr. Change
5-Yr. Change
June 2018 Positions
2018 AGR/ Pos/Day
AMERISTAR - Council Bluffs Casino W. Iowa $167.8 $163.7 $168.6 $169.0 $171.4 $170.1 -0.8% 0.6% 1.4% 1,556 $299ARGOSY - Sioux City Casino NW Iowa $56.1 $48.0 $3.1 $0.0 $0.0 $0.0 N/A N/A N/A - N/ACASINO QUEEN - Marquette Casino NE Iowa $29.8 $26.7 $28.6 $27.1 $26.4 $23.8 -9.9% -12.4% -20.3% 504 $129CATFISH BEND - Burlington Casino E. Iowa* $38.8 $38.3 $42.0 $43.8 $41.7 $39.3 -5.7% -10.3% 1.5% 681 $158DIAMOND JO - Dubuque Casino E. Iowa* $66.5 $63.6 $63.9 $67.6 $66.9 $69.1 3.4% 2.3% 3.9% 937 $202DIAMOND JO - Northwood Casino N. Iowa $88.6 $84.2 $84.3 $86.5 $85.2 $84.8 -0.4% -2.0% -4.3% 989 $235GRAND FALLS - Larchwood Casino NW Iowa $58.2 $59.2 $58.2 $55.7 $54.8 $56.2 2.6% 0.8% -3.4% 889 $173HARD ROCK CASINO - Sioux City Casino W. Iowa $0.0 $0.0 $70.1 $83.2 $77.0 $80.9 5.0% -2.7% N/A 962 $230HARRAH'S - Council Bluffs Casino W. Iowa $67.4 $73.9 $74.1 $70.6 $71.3 $73.1 2.5% 3.5% 8.5% 603 $332HORSESHOE CASINO - Council Bluffs Racino W. Iowa $200.3 $192.8 $183.5 $175.6 $172.1 $176.9 2.8% 0.7% -11.7% 1,629 $298ISLE OF CAPRI - Bettendorf Casino Quad City* $74.5 $70.2 $68.5 $69.7 $77.5 $69.8 -9.9% 0.1% -6.3% 988 $194ISLE CASINO - Waterloo Casino Central IA $86.0 $85.1 $88.9 $89.6 $87.0 $85.3 -2.0% -4.8% -0.9% 1,005 $233LAKESIDE - Osceola Casino Central IA $53.5 $49.3 $51.7 $49.4 $48.1 $46.1 -4.2% -6.7% -13.7% 631 $200PRAIRIE MEADOWS - Altoona Racino Central IA $195.0 $181.0 $186.1 $182.5 $190.2 $201.2 5.8% 10.2% 3.2% 1,777 $310Q CASINO - Dubuque Racino E. Iowa* $57.6 $51.1 $50.8 $48.8 $47.6 $47.8 0.4% -2.0% -17.0% 856 $153RHYTHM CITY - Davenport Casino Quad City* $48.3 $44.4 $43.1 $43.9 $61.9 $67.0 8.1% 52.5% 38.6% 880 $208RIVERSIDE CASINO - Riverside Casino Central IA $88.7 $87.7 $86.7 $85.2 $85.7 $85.8 0.1% 0.7% -3.3% 877 $268WILD ROSE - Clinton Casino E. Iowa* $37.6 $32.8 $32.9 $32.9 $31.4 $30.2 -3.8% -8.4% -19.7% 561 $147WILD ROSE - Emmetsburg Casino N. Iowa $32.2 $31.0 $30.5 $29.0 $28.4 $28.3 -0.4% -2.4% -12.2% 493 $157WILD ROSE - Jefferson Casino Central IA $0.0 $0.0 $0.0 $26.9 $28.2 $28.2 -0.2% 4.9% N/A 535 $144TOTALS $1,446.8 $1,383.0 $1,415.5 $1,437.1 $1,452.9 $1,463.8 0.8% 1.9% 1.2% 17,353 $231QUAD CITY REGION TOTALS $122.8 $114.7 $111.6 $113.6 $139.4 $136.7 -1.9% 20.3% 11.4% 1,868 $201OTHER CASINOS BORDERING ILLINOIS $200.5 $185.8 $189.6 $193.1 $187.6 $186.5 -0.6% -3.5% -7.0% 3,036 $168AGR Composition of Casinos on IA/IL Border: 79.1% 79.5% 79.6% 80.0% 81.9% 82.2%TOTAL CASINOS $993.9 $958.1 $995.2 $1,030.2 $1,042.9 $1,037.9 -0.5% 0.7% 4.4% 15,797 $180TOTAL RACINOS $452.9 $424.9 $420.3 $407.0 $410.0 $426.0 3.9% 4.7% -6.0% 4,262 $274
ILLINOIS CASINOS
INDIANA CASINOS
MISSOURI CASINOS
IOWA CASINOS
Table 11: Statistical Summary of the Midwestern Gaming States$ in millions
18
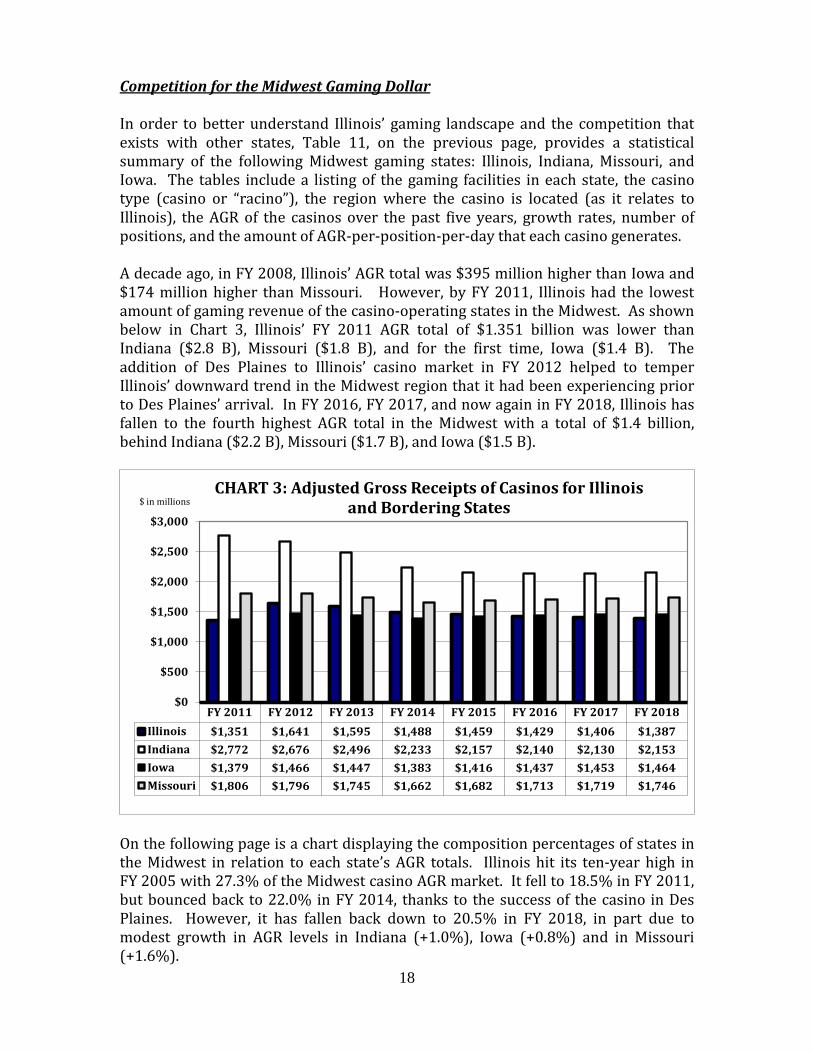
Competition for the Midwest Gaming Dollar In order to better understand Illinois’ gaming landscape and the competition that exists with other states, Table 11, on the previous page, provides a statistical summary of the following Midwest gaming states: Illinois, Indiana, Missouri, and Iowa. The tables include a listing of the gaming facilities in each state, the casino type (casino or “racino”), the region where the casino is located (as it relates to Illinois), the AGR of the casinos over the past five years, growth rates, number of positions, and the amount of AGR-per-position-per-day that each casino generates. A decade ago, in FY 2008, Illinois’ AGR total was $395 million higher than Iowa and $174 million higher than Missouri. However, by FY 2011, Illinois had the lowest amount of gaming revenue of the casino-operating states in the Midwest. As shown below in Chart 3, Illinois’ FY 2011 AGR total of $1.351 billion was lower than Indiana ($2.8 B), Missouri ($1.8 B), and for the first time, Iowa ($1.4 B). The addition of Des Plaines to Illinois’ casino market in FY 2012 helped to temper Illinois’ downward trend in the Midwest region that it had been experiencing prior to Des Plaines’ arrival. In FY 2016, FY 2017, and now again in FY 2018, Illinois has fallen to the fourth highest AGR total in the Midwest with a total of $1.4 billion, behind Indiana ($2.2 B), Missouri ($1.7 B), and Iowa ($1.5 B).
On the following page is a chart displaying the composition percentages of states in the Midwest in relation to each state’s AGR totals. Illinois hit its ten-year high in FY 2005 with 27.3% of the Midwest casino AGR market. It fell to 18.5% in FY 2011, but bounced back to 22.0% in FY 2014, thanks to the success of the casino in Des Plaines. However, it has fallen back down to 20.5% in FY 2018, in part due to modest growth in AGR levels in Indiana (+1.0%), Iowa (+0.8%) and in Missouri (+1.6%).
FY 2011 FY 2012 FY 2013 FY 2014 FY 2015 FY 2016 FY 2017 FY 2018Illinois $1,351 $1,641 $1,595 $1,488 $1,459 $1,429 $1,406 $1,387Indiana $2,772 $2,676 $2,496 $2,233 $2,157 $2,140 $2,130 $2,153Iowa $1,379 $1,466 $1,447 $1,383 $1,416 $1,437 $1,453 $1,464Missouri $1,806 $1,796 $1,745 $1,662 $1,682 $1,713 $1,719 $1,746
$0
$500
$1,000
$1,500
$2,000
$2,500
$3,000
CHART 3: Adjusted Gross Receipts of Casinos for Illinois and Bordering States$ in millions

19
A chart indicating the annual percent changes of AGR of the Midwest region states since FY 2012 is shown below. The addition of the Des Plaines casino allowed Illinois to claim the state with the biggest improvement in AGR in FY 2012. As shown, all of the Midwestern states experienced declines in their AGR in FY 2013 and in FY 2014. It is no coincidence that these are the same fiscal years that video gaming began to ramp up in Illinois. Since experiencing these years of declining revenues, Iowa and Missouri have seen their AGR levels improve in each of the last four fiscal years. After eight consecutive years of declining revenues, Indiana’s AGR increased in FY 2018, albeit at a miniscule +1.0%. Illinois, on the other hand, experienced their sixth consecutive fiscal year of declining revenues in FY 2018.
24.4% 20.0% 19.2% 18.5% 21.7% 21.9% 22.0% 21.7% 21.3% 21.0% 20.5%
34.6% 37.9% 38.1% 37.9% 35.3% 34.3% 33.0% 32.1% 31.8% 31.8% 31.9%
19.0% 19.1% 18.7% 18.9% 19.3% 19.9% 20.4% 21.1% 21.4% 21.7% 21.7%
22.0% 23.0% 23.9% 24.7% 23.7% 24.0% 24.6% 25.1% 25.5% 25.6% 25.9%
0%10%20%30%40%50%60%70%80%90%
100%
FY 2008 FY 2009 FY 2010 FY 2011 FY 2012 FY 2013 FY 2014 FY 2015 FY 2016 FY 2017 FY 2018
CHART 4: AGR Composition for Illinois and Bordering States
Illinois Indiana Iowa Missouri
-15.0%
-10.0%
-5.0%
0.0%
5.0%
10.0%
15.0%
20.0%
25.0%
FY 2012 FY 2013 FY 2014 FY 2015 FY 2016 FY 2017 FY 2018
CHART 5: Annual Percent Change of Adjusted Gross Receipts by State
FY 2012 - FY 2018
Illinois Indiana Iowa Missouri
Gambling at Des Plaines Casino
Begins

20
The following section offers a brief discussion of the competition that exists between Illinois and other states in the Midwestern Region. Indiana • Despite having a population of about half the size of Illinois, Indiana’s AGR totals
of its casinos continue to be higher than Illinois. In FY 2018, Indiana’s total was $2.153 billion compared to Illinois’ total of $1.387 billion.
• Adjusted Gross Receipts from Indiana casinos grew 1.0% in FY 2018. However, their FY 2018 total of $2.153 billion is significantly below (-13.7%) their FY 2013 total of near $2.5 billion. In fact, their AGR levels have been as high as $2.8 billion as recent as FY 2009.
• The five Chicago Area casinos in Indiana remained relatively stagnant in FY 2018
(-0.3%). However, their combined total of $0.9 billion in FY 2018 is 16.7% below levels seen just five years ago.
• Indiana has experienced increased competition on the eastern side of the state
as Ohio has entered into the gaming industry with four new casinos, including one in Cincinnati. This new casino has had a significant impact on the nearby Hollywood Casino in Lawrenceburg (5-year decline of -50.5%) and the Rising Star Casino in Rising Sun (5-year decline of -42.4%).
Missouri • Adjusted Gross Receipts from Missouri casinos were up 1.6% over the last fiscal
year and have been relatively stagnant (+0.1%) over the past five fiscal years.
• The four St. Louis area casinos near the Illinois border have increased 2.2% over the past fiscal year, but have only increased a mere 0.7% over the past five fiscal years. Increased competition from video gaming in Illinois may be contributing to this stagnant growth.
• In FY 2018, $885.1 billion in AGR was reported by the four St. Louis area casinos
in Missouri. The two Illinois casinos near St. Louis brought in $146.6 million. Therefore, nearly 86% of the AGR revenues in this area are collected in Missouri.
• It is believed that the increased competition from video gaming terminals in
Illinois is limiting the casino growth in this region. The four Illinois counties closest to St. Louis (Jersey, Madison, Monroe, and St. Clair) had 2,015 video gaming terminals in FY 2018 with net terminal income totaling nearly $82 million. This additional number of terminals is the equivalent of adding two casinos the size of E. St. Louis’ Casino Queen to the area.

21
Iowa • Despite a smaller population, the FY 2018 AGR totals were again higher in Iowa
($1.464 billion) than Illinois ($1.387 billion). Iowa casinos are up a modest 1.2% since FY 2013.
• On an individual basis, Illinois’ Rock Island Casino ($70.0M) barely outperformed the two nearby Iowa Casinos (Bettendorf: $69.8M; Davenport: $67.0M) in FY 2018. But with two casinos compared to one, Iowa brings in the majority of revenues in this area.
• An additional $187 million in AGR was brought in by other Iowa casinos near the
Illinois border. The AGR of these casinos are down a combined -7.0% since FY 2013. Increased competition from Illinois video gaming terminals is likely contributing to this falloff.
Wisconsin • While Wisconsin does not have public casinos, it does have a number of tribal
gaming facilities throughout its state. The closest Wisconsin casinos to Illinois’ border currently reside in Milwaukee and Madison. However, there is a proposal to bring a casino to the city of Beloit (just north of Rockford) which could potentially be approved in the near future. If approved, the construction of this facility would reportedly start in 2020.
• Another proposal for the city of Kenosha, a few miles north of Waukegan, was rejected by Wisconsin Governor Scott Walker in 2015.
Nationwide Perspective From a national perspective, revenues from gaming (including racetrack casinos, riverboat casinos, and video gaming) have seen very little growth over the last several years. Looking at the top gaming states in the country as a whole, revenues have only grown from $30.9 billion in CY 2012 to approximately $31.9 billion in CY 2017 – an average annual growth rate of only 0.6%. With that being said, gaming revenues did increase 2.3% in CY 2017, marking the largest increase in this metric for this decade. Nevada remains, by far, the largest gaming state in the country ($11.6 billion in CY 2017), followed by Pennsylvania ($3.2 billion), Louisiana ($3.1 billion, when including video gaming), and Illinois ($2.7 billion, when including video gaming). Tables displaying a recent history of gaming dollars for the Midwest and other prominent gaming states on a calendar year basis are shown in the table on the following page.

22
CY Illinois* Indiana Iowa Michigan Missouri Ohio2010 $1.374 $2.794 $1.368 $1.378 $1.788 $0.0002011 $1.477 $2.721 $1.424 $1.424 $1.805 $0.0002012 $1.651 $2.636 $1.467 $1.417 $1.769 $0.3512013 $1.853 $2.332 $1.420 $1.350 $1.707 $0.8212014 $2.125 $2.157 $1.391 $1.333 $1.660 $0.8092015 $2.352 $2.142 $1.424 $1.376 $1.702 $0.8122016 $2.523 $2.125 $1.446 $1.386 $1.714 $0.7982017 $2.711 $2.153 $1.463 $1.401 $1.738 $0.819
CY Illinois* Indiana Iowa Michigan Missouri Ohio2010 -3.8% -0.2% -0.9% 2.9% 3.3% N/A2011 7.5% -2.6% 4.1% 3.4% 1.0% N/A2012 11.8% -3.1% 3.0% -0.5% -2.0% N/A2013 12.2% -11.5% -3.2% -4.7% -3.5% 134.3%2014 14.7% -7.5% -2.0% -1.2% -2.7% -1.5%2015 10.7% -0.7% 2.4% 3.3% 2.5% 0.4%2016 7.2% -0.8% 1.5% 0.7% 0.7% -1.8%2017 7.5% 1.4% 1.1% 1.1% 1.4% 2.6%
* Includes Video Gaming Revenues
CY Nevada Louisiana* Pennsylvania New Jersey Mississippi Total**2010 $10.405 $2.984 $2.486 $3.261 $2.389 $30.2282011 $10.701 $2.981 $3.025 $2.951 $2.239 $30.7472012 $10.861 $3.014 $3.158 $2.707 $2.251 $30.9312013 $11.143 $3.042 $3.114 $2.860 $2.137 $30.9562014 $11.019 $3.064 $3.069 $2.616 $2.068 $30.5022015 $11.114 $3.242 $3.174 $2.414 $2.097 $31.0382016 $11.257 $3.115 $3.213 $2.280 $2.122 $31.1812017 $11.571 $3.136 $3.227 $2.413 $2.080 $31.893
CY Nevada Louisiana* Pennsylvania New Jersey Mississippi Total**2010 0.1% -3.4% 26.6% -17.3% -3.1% -1.0%2011 2.8% -0.1% 21.7% -9.5% -6.3% 1.7%2012 1.5% 1.1% 4.4% -8.2% 0.5% 0.6%2013 2.6% 0.9% -1.4% 5.6% -5.1% 0.1%2014 -1.1% 0.7% -1.4% -8.5% -3.2% -1.5%2015 0.9% 5.8% 3.4% -7.7% 1.4% 1.8%2016 1.3% -3.9% 1.2% -5.6% 1.2% 0.5%2017 2.8% 0.7% 0.4% 5.9% -2.0% 2.3%
Average Overall Growth in Last Five Years: 0.6%* Includes Video Gaming Revenues**Total includes these "Prominent Gaming States" and the "Midwest States"
Table 12: AGR from Commercial Casino Gaming
$ in billions(Midwest States)
Annual % Change
AGR from Commercial Casino Gaming(Other Prominent Gaming States)
$ in billions
Annual % Change

23
An Analysis of Expanding Gambling in Illinois As budgetary pressures continue in the State of Illinois, so too does the desire for new revenue sources. One idea that is repeatedly discussed is expanding gambling in Illinois. Few would argue that additional revenues would be welcomed, but determining whether gambling is the route to be taken to obtain these desired revenues has been a contentious policy debate for Illinois lawmakers. Over the past decade, there have been numerous legislative proposals advocating gaming expansion, but none have received enough support for enactment. A few in previous general assemblies have come close (SB 0744 HA 1-7 and SB 1849 HA 2, 3), but both of these were vetoed by former Governor Quinn. Another earnest attempt at gaming expansion came in the 2017 and 2018 Spring Legislative Sessions in the form of SB 0007. Similar to other versions before it, SB 0007 would create a large Chicago Casino, along with five to six other new casinos (depending on amendment), and allow slot machines at horse tracks. This piece of legislation passed the Senate in May 2017, but, at the time of this report, has yet to garner enough support for passage in the House. The Commission is often asked about how much revenue could be generated if a gaming expansion bill were to be signed into law. This is a difficult question to answer because there are numerous variables that would affect the amount of revenue collected. This includes the location of the new casinos; the existing gaming competition that exists in each of these areas; the taxing structure imposed on the casinos; the cannibalization that would occur that would negatively impact the existing facilities; and, the economic conditions impacting the spending habits of the would-be gamblers. With these factors in mind, the following paragraphs offer a brief analysis of the principal components of expansion and the potential revenue that could be generated with the latest legislative versions of gaming expansion as a basis to this discussion. Add New Riverboats and Casinos Under current law, Illinois has ten licenses available for riverboat gambling operations. When the discussion of gaming expansion arises, inevitably these talks include increasing the number of gaming licenses to add more casinos. The latest expansion bills would place a large land-based casino in the City of Chicago. Other locations that have been targeted for future homes to casinos include the Waukegan area, the South Suburbs, the Rockford area, Danville, and southern Illinois. New casinos, especially a land-based casino in Chicago, would no doubt generate millions of dollars to the State and local governments, but how much revenue could these new casinos realistically generate? The amount of revenue generated from the smaller proposed Illinois locations would likely be very similar to the other 1,200-position casinos across the State. Most expect that a new casino strategically located near an untapped population area of Chicago would easily exceed Illinois’
24
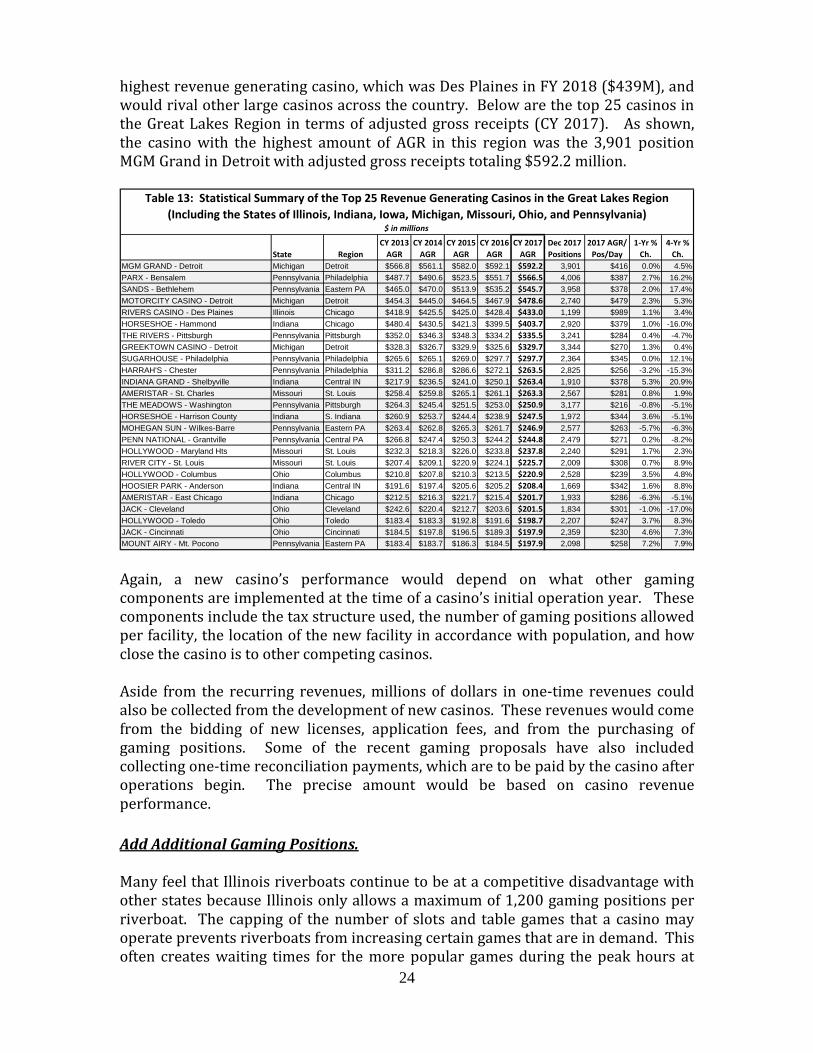
highest revenue generating casino, which was Des Plaines in FY 2018 ($439M), and would rival other large casinos across the country. Below are the top 25 casinos in the Great Lakes Region in terms of adjusted gross receipts (CY 2017). As shown, the casino with the highest amount of AGR in this region was the 3,901 position MGM Grand in Detroit with adjusted gross receipts totaling $592.2 million.
Again, a new casino’s performance would depend on what other gaming components are implemented at the time of a casino’s initial operation year. These components include the tax structure used, the number of gaming positions allowed per facility, the location of the new facility in accordance with population, and how close the casino is to other competing casinos. Aside from the recurring revenues, millions of dollars in one-time revenues could also be collected from the development of new casinos. These revenues would come from the bidding of new licenses, application fees, and from the purchasing of gaming positions. Some of the recent gaming proposals have also included collecting one-time reconciliation payments, which are to be paid by the casino after operations begin. The precise amount would be based on casino revenue performance. Add Additional Gaming Positions. Many feel that Illinois riverboats continue to be at a competitive disadvantage with other states because Illinois only allows a maximum of 1,200 gaming positions per riverboat. The capping of the number of slots and table games that a casino may operate prevents riverboats from increasing certain games that are in demand. This often creates waiting times for the more popular games during the peak hours at
State RegionCY 2013
AGRCY 2014
AGRCY 2015
AGRCY 2016
AGRCY 2017
AGRDec 2017 Positions
2017 AGR/ Pos/Day
1-Yr % Ch.
4-Yr % Ch.
MGM GRAND - Detroit Michigan Detroit $566.8 $561.1 $582.0 $592.1 $592.2 3,901 $416 0.0% 4.5%PARX - Bensalem Pennsylvania Philadelphia $487.7 $490.6 $523.5 $551.7 $566.5 4,006 $387 2.7% 16.2%SANDS - Bethlehem Pennsylvania Eastern PA $465.0 $470.0 $513.9 $535.2 $545.7 3,958 $378 2.0% 17.4%MOTORCITY CASINO - Detroit Michigan Detroit $454.3 $445.0 $464.5 $467.9 $478.6 2,740 $479 2.3% 5.3%RIVERS CASINO - Des Plaines Illinois Chicago $418.9 $425.5 $425.0 $428.4 $433.0 1,199 $989 1.1% 3.4%HORSESHOE - Hammond Indiana Chicago $480.4 $430.5 $421.3 $399.5 $403.7 2,920 $379 1.0% -16.0%THE RIVERS - Pittsburgh Pennsylvania Pittsburgh $352.0 $346.3 $348.3 $334.2 $335.5 3,241 $284 0.4% -4.7%GREEKTOWN CASINO - Detroit Michigan Detroit $328.3 $326.7 $329.9 $325.6 $329.7 3,344 $270 1.3% 0.4%SUGARHOUSE - Philadelphia Pennsylvania Philadelphia $265.6 $265.1 $269.0 $297.7 $297.7 2,364 $345 0.0% 12.1%HARRAH'S - Chester Pennsylvania Philadelphia $311.2 $286.8 $286.6 $272.1 $263.5 2,825 $256 -3.2% -15.3%INDIANA GRAND - Shelbyville Indiana Central IN $217.9 $236.5 $241.0 $250.1 $263.4 1,910 $378 5.3% 20.9%AMERISTAR - St. Charles Missouri St. Louis $258.4 $259.8 $265.1 $261.1 $263.3 2,567 $281 0.8% 1.9%THE MEADOWS - Washington Pennsylvania Pittsburgh $264.3 $245.4 $251.5 $253.0 $250.9 3,177 $216 -0.8% -5.1%HORSESHOE - Harrison County Indiana S. Indiana $260.9 $253.7 $244.4 $238.9 $247.5 1,972 $344 3.6% -5.1%MOHEGAN SUN - Wilkes-Barre Pennsylvania Eastern PA $263.4 $262.8 $265.3 $261.7 $246.9 2,577 $263 -5.7% -6.3%PENN NATIONAL - Grantville Pennsylvania Central PA $266.8 $247.4 $250.3 $244.2 $244.8 2,479 $271 0.2% -8.2%HOLLYWOOD - Maryland Hts Missouri St. Louis $232.3 $218.3 $226.0 $233.8 $237.8 2,240 $291 1.7% 2.3%RIVER CITY - St. Louis Missouri St. Louis $207.4 $209.1 $220.9 $224.1 $225.7 2,009 $308 0.7% 8.9%HOLLYWOOD - Columbus Ohio Columbus $210.8 $207.8 $210.3 $213.5 $220.9 2,528 $239 3.5% 4.8%HOOSIER PARK - Anderson Indiana Central IN $191.6 $197.4 $205.6 $205.2 $208.4 1,669 $342 1.6% 8.8%AMERISTAR - East Chicago Indiana Chicago $212.5 $216.3 $221.7 $215.4 $201.7 1,933 $286 -6.3% -5.1%JACK - Cleveland Ohio Cleveland $242.6 $220.4 $212.7 $203.6 $201.5 1,834 $301 -1.0% -17.0%HOLLYWOOD - Toledo Ohio Toledo $183.4 $183.3 $192.8 $191.6 $198.7 2,207 $247 3.7% 8.3%JACK - Cincinnati Ohio Cincinnati $184.5 $197.8 $196.5 $189.3 $197.9 2,359 $230 4.6% 7.3%MOUNT AIRY - Mt. Pocono Pennsylvania Eastern PA $183.4 $183.7 $186.3 $184.5 $197.9 2,098 $258 7.2% 7.9%
Table 13: Statistical Summary of the Top 25 Revenue Generating Casinos in the Great Lakes Region(Including the States of Illinois, Indiana, Iowa, Michigan, Missouri, Ohio, and Pennsylvania)
$ in millions

25
many of the locations and creates a disincentive for the riverboat patron, which some would argue causes them to go to locations with no position limit.
To illustrate this point, the following graph displays the AGR per Table Game (per day) and the AGR per EGD (per day) for each of the Midwestern riverboat states for June 2018 (EGD stands for electronic gaming device, i.e. slot machines). Illinois’ AGR per Table Game and AGR per EGD are significantly higher than the other neighboring states. For example, Illinois’ AGR per Table Game average was $2,687 compared to Indiana’s value of $1,369, Iowa’s value of $842, and Missouri’s value of $1,253.
Of course, simply adding more slots machines or table games will not guarantee more revenues if the demand is not there. However, despite the recent decline in casino revenues, the numbers suggest that, at least for the higher attended casinos, the allowance of additional gaming positions could lead to additional revenues. For example, Des Plaines, which is maxed out at 1,200 gaming positions, had an “AGR/table game/day” average of $7,375 and an “AGR/EGD/day” value of $817. These values are significantly higher than Indiana’s largest revenue producer, Hammond Horseshoe, whose 2,870 gaming positions in June 2018 yielded comparative values of $1,875 and $341, respectively. Despite the large discrepancy in gaming positions, Des Plaines generated a higher AGR amount in FY 2018 ($439M) than Hammond ($401M). Proponents would contend that Des Plaines’ AGR totals would have surpassed Hammond by an even greater margin if they were allowed to set their own gaming position limit to maximize revenues. How many additional gaming positions would be necessary to put Illinois on an equal footing with the riverboats of other states? Since states like Indiana do not have a gaming position limit, the number of positions that they utilize should
$2,687
$1,369
$842
$1,253
$310 $289 $224 $254
$0
$500
$1,000
$1,500
$2,000
$2,500
$3,000
Illinois Indiana Iowa Missouri
CHART 6: Adjusted Gross Receipts per Table Game and per Electronic Gaming Device per day
(June 2018 Actuals)
AGR per Table Game AGR per EGD
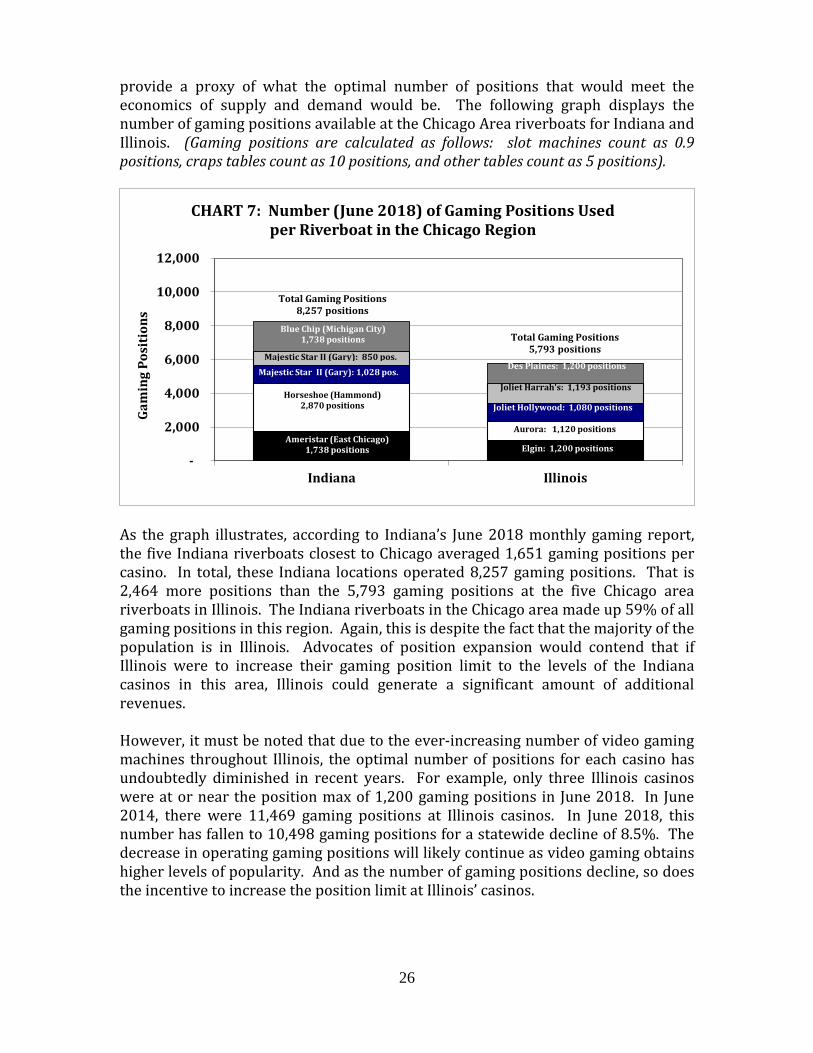
26
provide a proxy of what the optimal number of positions that would meet the economics of supply and demand would be. The following graph displays the number of gaming positions available at the Chicago Area riverboats for Indiana and Illinois. (Gaming positions are calculated as follows: slot machines count as 0.9 positions, craps tables count as 10 positions, and other tables count as 5 positions).
As the graph illustrates, according to Indiana’s June 2018 monthly gaming report, the five Indiana riverboats closest to Chicago averaged 1,651 gaming positions per casino. In total, these Indiana locations operated 8,257 gaming positions. That is 2,464 more positions than the 5,793 gaming positions at the five Chicago area riverboats in Illinois. The Indiana riverboats in the Chicago area made up 59% of all gaming positions in this region. Again, this is despite the fact that the majority of the population is in Illinois. Advocates of position expansion would contend that if Illinois were to increase their gaming position limit to the levels of the Indiana casinos in this area, Illinois could generate a significant amount of additional revenues. However, it must be noted that due to the ever-increasing number of video gaming machines throughout Illinois, the optimal number of positions for each casino has undoubtedly diminished in recent years. For example, only three Illinois casinos were at or near the position max of 1,200 gaming positions in June 2018. In June 2014, there were 11,469 gaming positions at Illinois casinos. In June 2018, this number has fallen to 10,498 gaming positions for a statewide decline of 8.5%. The decrease in operating gaming positions will likely continue as video gaming obtains higher levels of popularity. And as the number of gaming positions decline, so does the incentive to increase the position limit at Illinois’ casinos.
-
2,000
4,000
6,000
8,000
10,000
12,000
Indiana Illinois
Gam
ing
Posi
tion
s
CHART 7: Number (June 2018) of Gaming Positions Used per Riverboat in the Chicago Region
Ameristar (East Chicago)1,738 positions
Horseshoe (Hammond)2,870 positions
Majestic Star II (Gary): 1,028 pos.
Majestic Star II (Gary): 850 pos.
Joliet Harrah's: 1,193 positions
Joliet Hollywood: 1,080 positions
Aurora: 1,120 positions
Elgin: 1,200 positions
Total Gaming Positions8,257 positions
Total Gaming Positions5,793 positions
Blue Chip (Michigan City)1,738 positions
Des Plaines: 1,200 positions

27
Add Slot Machines at Racetracks A growing area of gaming throughout the country is the development of casinos at racetracks. The latest “State of the States” report by the American Gaming Association stated that fourteen states have racetrack casinos. Four of these states (Delaware, Maryland, New York, and Ohio) have gaming in the form of video lottery terminals. The remaining states (Florida, Indiana, Iowa, Louisiana, Maine, Massachusetts, New Mexico, Oklahoma, Pennsylvania, and West Virginia) operate their gaming facilities similar to traditional casinos. Fiscal Year 2009 was the first full fiscal year of racetrack casinos at Indiana’s two locations, Hoosier Park in Anderson and Indiana Live near Shelbyville. In FY 2018, a combined $470 million was generated from these casinos. When Indiana entered into the racetrack casino market, it joined Iowa as the only states in the Midwest Region to offer this form of gambling. In FY 2018, Iowa generated a combined $426 million in adjusted gross receipts from their three locations in Council Bluffs, Altoona, and Dubuque. Many in Illinois’ horse racing industry are hoping that Illinois follows suit and allows casinos at its horse tracks. Proponents contend that not only would video gaming terminals at the horse tracks help bring additional revenues to the State, but it would also assist in revitalizing the horse racing industry in Illinois. As noted throughout this report, Illinois’ horse racing industry is on a decidedly downward trend. Illinois’ total handle amount of $587 million in CY 2017 is 36.8% lower than it was a decade ago. It is no coincidence that Illinois’ declining revenues over the last several years came at the same time that the numbers of racetrack casinos have increased in other states throughout the nation. As attendance at racetracks increase, so does their revenue, which allows them to offer larger purses. These larger purses at other tracks are enticing enough to persuade participants to forgo Illinois’ races and attend races in other states.
Racino Location
FY 2016 AGR
(in mil.)
FY 2017 AGR
(in mil.)
FY 2018 AGR
(in mil.)
Gaming Positions (June '18)
AGR/Slot/Day
Prairie Meadows Altoona, IA $182.5 $190.2 $201.2 1,777 $310Horseshoe Casino Council Bluffs, IA $175.6 $172.1 $176.9 1,629 $298Mystique Casino Dubuque, IA $48.8 $47.6 $47.8 856 $153Hoosier Park Anderson, IN $204.1 $209.5 $208.8 1,644 $348Indiana Grand Shelbyville, IN $245.3 $256.1 $261.1 1,982 $361Harrah's Chester Casino Chester, PA $282.9 $266.0 $264.0 2,835 $255Presque Isle Downs Casino Erie, PA $132.4 $127.1 $128.3 1,644 $214The Meadows Racetrack & Casino Washington, PA $258.0 $250.0 $248.7 3,185 $214Mohegan Sun at Pocono Downs Wilkes-Barre, PA $267.4 $252.0 $243.6 2,578 $259Parx Casino Bensalem, PA $543.4 $556.7 $586.7 3,978 $404Hollywood Casino at Penn National Grantville, PA $247.5 $245.8 $242.8 2,354 $283
TABLE 14: FY 2016 - FY 2018 AGR Statistics at Selected Racetrack Casinos
Note: Indiana racinos only have slot machines. Pennsylvania and Iowa locations have both slots and table games.
28
How much revenue could Illinois realize by allowing slot machines at its racetracks? One way to get a feel for the revenue potential of a horse track casino is to look at revenue data from other states. The previous table displays the latest racino figures from Iowa, Indiana, and Pennsylvania. The Pennsylvania market is included because of its metropolitan similarities to Illinois. As shown, the revenue amounts range from $47.8 million to $586.7 million in adjusted gross receipts per year with AGR/slot/day values ranging between $153 and $404 per day. The sizes of the racinos vary, with the largest at 3,978 positions. For the horse tracks still in operation in Illinois, if slots at tracks were to become a reality, it is estimated that Illinois’ AGR/Slot/Day would probably be at the high end of values seen in other states – likely near $300 per slot machine per day for those racinos in the Chicago area and likely less for the downstate locations. Estimating Illinois’ racetrack casino revenue potential is difficult because it depends on the gaming environment at the time of its operation, the number of gaming positions it is allowed to have, its location, and how much other gambling competition, such as video gaming terminals, exists in proximity to these racinos. Most expansion proposals include a casino in Chicago and other suburban casinos to go along with these racinos. As more competition exists, the less revenue that will be able to be generated from these locations. Estimating the Potential Tax Revenue Impact of Gaming Expansion How much tax revenue could be generated by enacting gaming expansion legislation in Illinois? The answer to this question is extremely difficult to predict due to the numerous variables that have an impact on these projections, such as the tax rate structure used; the location of the new facilities; the cannibalization impact on neighboring casinos; and the associated negative effect that increased competition has on tax revenues due to the graduated tax structure. (For a more detailed look at understanding these variables, please see the 2013 Wagering Report). The increased popularity of video gaming throughout Illinois adds another variable to any tax revenue projection. As highlighted throughout this section, casino gambling throughout the Midwest has been on a downward trend, in large part, due to this increased competition from video gaming. Because of this, the most recent revenue projections are lower than past projections to account for this shift of the gaming industry. The Commission estimates that SB 0007, as engrossed, (Chicago Casino, 5 new riverboats, 3 racinos, additional positions) could increase AGR totals in Illinois by roughly $1 billion per year. While this overall growth in receipts is notably lower than has been estimated prior to the emergence of video gaming, the projected increase of $1 billion still represents a significant increase in new gaming dollars. However, because this proposed expansion would coincide with a reduced tax structure, the Commission’s projection would only increase recurring tax revenue
29
totals from approximately $466 million (under current law) to an estimated $541 million under full implementation – an increase in tax revenues of only $75 million. Some expansion advocates argue that the Commission’s estimates are too conservative and that the projections undervalue the revenue potential of gaming expansion in Illinois, especially with the inclusion of a new mega-casino in downtown Chicago. In its latest projection, the Commission estimated that the Chicago casino would generate approximately $500 million annually, which would make it the fourth largest revenue-generating casino in the Great Lakes Region (using CY 2017 AGR figures behind only the MGM Grand in Detroit: $592M; Parx in Bensalem, PA: $567M, and Sands in Bethlehem, PA; $546M). The argument by advocates is that Chicago’s gaming market remains untapped and is far from saturation. They contend that a casino in the City would easily surpass the figures of large casinos in other similar markets. While that possibility exists, even if the Commission were to increase its AGR estimate for the Chicago casino by $200 million to a total of $700 million per year, (thereby making it the largest revenue-generating casino in this region, by far, despite the plethora of gaming competition that already exists in the Chicago metro area), tax revenues would only increase by an additional $40 million under this proposal. This is because, under SB 0007, as engrossed, AGR between $350 million and $800 million is taxed at 20% instead of 50%, as it is under the current law tax structure. In other words, given the proposed tax rates under SB 0007, as engrossed, even if the Commission were to adopt a more aggressive total AGR projection, it would not translate into a significant tax revenue increase. Outside of this discussion of tax revenues, advocates of expansion point out that regardless of the tax amounts projected, what cannot be dismissed is the fact that these new facilities would be providing a significant amount of one-time revenues (from fees and bidding), creating new jobs, and potentially regaining/gaining gaming dollars from out-of-state gamers. In the case of a City-operated casino in the middle of Chicago, the after-tax revenues realized from the reduced tax structure would go a long way in alleviating some of the budgetary pressures that currently exist in the City of Chicago.

30
What Will the Future Hold for Illinois Riverboats? Riding the success of the new Des Plaines casino, Illinois’ total adjusted gross receipts increased 18.1% from FY 2011 to FY 2013. However, despite the steady performance of the Rivers Casino in Des Plaines, the combined AGR of the State’s ten casinos have fallen 13.1% since FY 2013. The lack of growth can be attributed to numerous factors, but the primary reason for the recent declines is undoubtedly due to the increased competition from video gaming. The bottom line from a revenue perspective is this: given the status quo, the casino industry will likely struggle to improve in the years ahead, especially at the older casinos. The Des Plaines casino has been a stable revenue producer, but the riverboats that are struggling will likely continue to do so until they can find ways to compete with the abundance of gaming opportunities that now exist surrounding them. Discussions of further expansion of Illinois’ casino market continue to press on. The absence of casinos in certain areas of Illinois, especially in Chicago, creates a hope that gaming expansion could fix many of the financial woes that the State and local governments are enduring. The Commission cautions, however, that the revenue potential of new casinos in Illinois is not near what it used to be. Nearly 30,000 video gaming machines have been put into operation across Illinois over the past several years. Compare that to the roughly 10,500 gaming positions existing at the State’s ten casinos, and gaming opportunities have more than tripled in Illinois since FY 2013. Because of this, the value of a new casino in Illinois has no doubt weakened. Still, many believe that there are areas of the state that remain untapped and that there are opportunities for new revenues. For gaming expansion to be a meaningful tax revenue generator for the State, the casino industry would have to build up new gambling interest; be attractive to tourists that visit Illinois; and be able to attract gamblers that have left to return to Illinois casinos. If dramatic increases in new gaming dollars were not to occur, the potential exists that, even with gaming expansion, when accounting for the cannibalization impact on other casinos and its corresponding lowering of effective tax rates (under the current graduated tax structure), the State could have a large expansion of gambling, but yet have little new tax revenues to show for it.

31
VIDEO GAMING

32

33
VIDEO GAMING IN ILLINOIS
Video Gaming was first legalized in July 2009 thru P.A. 96-0034. The first video gaming machines became operational in September 2012. The following section provides an overview of the legislation legalizing video gaming in Illinois, graphs depicting the rapid growth of video gaming throughout the State, a summary of video gaming statistics thru FY 2018, and a detailed discussion on the apparent impact that video gaming is having on the riverboat casino industry. Public Act 96-0034 – The Capital Bill In July 2009, Governor Quinn signed into law Public Act 96-0034, which became the first comprehensive capital bill in many years. As a way of paying for new capital projects across the State, new revenue streams were needed, which were established by the public act to come from the following sources: expansion of the Sales and Use Tax; privatization of the lottery/online lottery program; increasing the liquor tax; increasing motor vehicle fees; and the legalization of video gaming machines in Illinois. Legal issues and interruptions in the implementation of many of these sources caused significant delays in receiving these capital-earmarked revenues. (Details regarding these delays are provided in past Wagering Reports). For video gaming, various factors, including limited staffing available to oversee the new program, as well as extensive time-consuming background checks on operation applicants, delayed the progress of starting this new gaming format. In August 2010, one major portion of the development of video gaming was thought to be completed as the Gaming Board entered into a contract with Scientific Games to run the Central Communications System. However, due to “miscalculations” in evaluating the price portion of the proposals of the contract, the bidding process had to restart. Finally, in December 2011, the Gaming Board announced that Scientific Games, after completing the competitive selection process, was awarded a six-year contract. With this contract finalized, the process of designing and implementing the Central Communications System took place. On July 19, 2012, the Gaming Board announced that the Central Communications System was deemed functional. This system was created to provide real-time communication and control between every licensed video gaming terminal in Illinois and the Gaming Board. With the Central Communications System in place, video gaming finally began operations in Illinois in September 2012.

34
Overview of Illinois’ Video Gaming Arrangement Each qualified establishment is allowed to operate up to 5 video gaming terminals on its premises at any time. Revenues, after payouts, are taxed at a flat 30% tax rate with 5/6 of the revenues going to the Capital Project Fund and the remaining 1/6 distributed to all participating local governments. Since a municipality (or county) may prohibit video gaming, the moneys deposited into the Local Government Video Gaming Distributive Fund are only allocated to all municipalities (and counties) that have not prohibited video gaming. Public Act 96-0034 provides that the amount of funds allocable to each eligible municipality and county shall be in proportion to the tax revenue generated from video gaming within the eligible municipality or county compared to the tax revenue generated from video gaming statewide. (While video gaming is one of the major revenue sources for the Capital Projects Fund, it should be noted that there is no provision restricting local governments from receiving projects from the Capital Projects Fund, even if that governmental body bans video gaming in their area). A non-refundable application fee shall be paid at the time an application for a license is filed with the Gaming Board in the following amounts: 1) Manufacturing: $5,000 4) Supplier: $2,500 2) Distributor: $5,000 5) Technician: $100 3) Operator: $5,000 6) Terminal Handler: $50 In addition, the Gaming Board shall establish an annual fee for each license not to exceed the following: 1) Manufacturer: $10,000 5) Technician: $100 2) Distributor: $10,000 6) Establishments: $100 3) Operator: $5,000 7) Video Gaming Terminal: $100 4) Supplier: $2,000 8) Terminal Handler: $50 All fees collected shall be deposited into the State Gaming Fund. Of these fees, 25% shall be paid, subject to appropriation, to the Department of Human Services for administration of programs for the treatment of compulsive gambling and 75% shall be used for the administration of the Video Gaming Act. Of the after-tax profits from a video gaming terminal, 50% shall be paid to the terminal operator and 50% shall be paid to the establishment conducting video gaming.
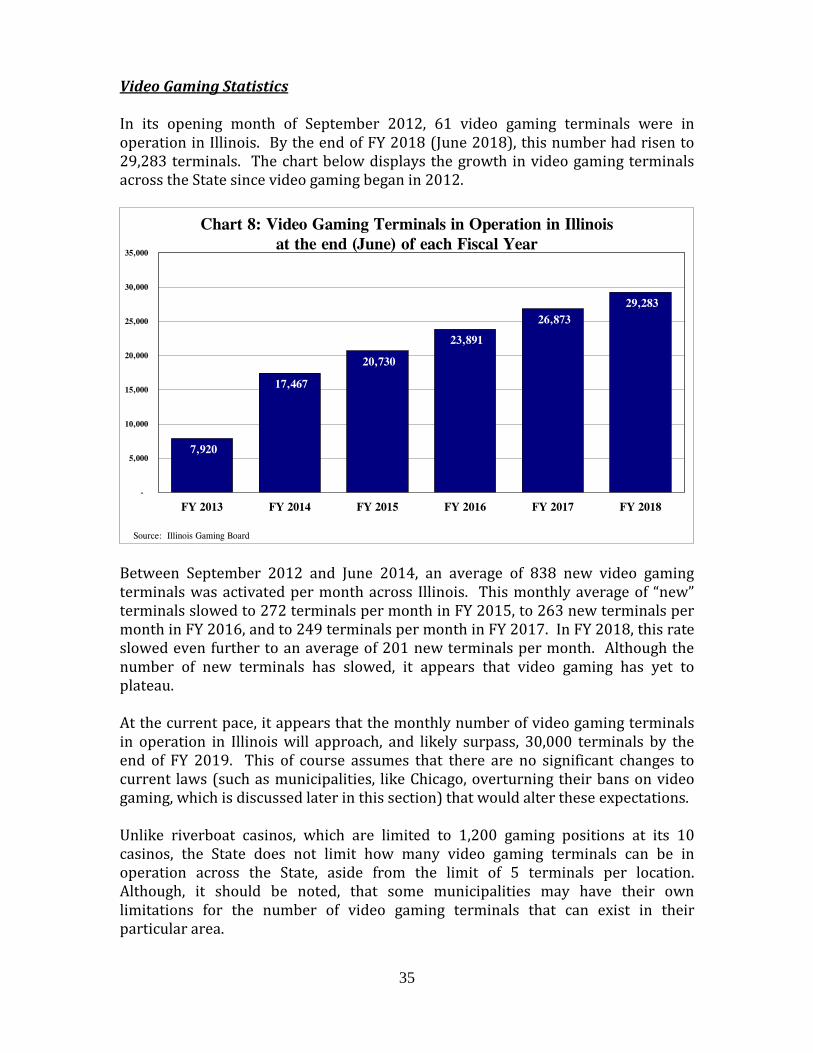
35
Video Gaming Statistics In its opening month of September 2012, 61 video gaming terminals were in operation in Illinois. By the end of FY 2018 (June 2018), this number had risen to 29,283 terminals. The chart below displays the growth in video gaming terminals across the State since video gaming began in 2012.
Between September 2012 and June 2014, an average of 838 new video gaming terminals was activated per month across Illinois. This monthly average of “new” terminals slowed to 272 terminals per month in FY 2015, to 263 new terminals per month in FY 2016, and to 249 terminals per month in FY 2017. In FY 2018, this rate slowed even further to an average of 201 new terminals per month. Although the number of new terminals has slowed, it appears that video gaming has yet to plateau. At the current pace, it appears that the monthly number of video gaming terminals in operation in Illinois will approach, and likely surpass, 30,000 terminals by the end of FY 2019. This of course assumes that there are no significant changes to current laws (such as municipalities, like Chicago, overturning their bans on video gaming, which is discussed later in this section) that would alter these expectations. Unlike riverboat casinos, which are limited to 1,200 gaming positions at its 10 casinos, the State does not limit how many video gaming terminals can be in operation across the State, aside from the limit of 5 terminals per location. Although, it should be noted, that some municipalities may have their own limitations for the number of video gaming terminals that can exist in their particular area.
7,920
17,467
20,730
23,891
26,873 29,283
-
5,000
10,000
15,000
20,000
25,000
30,000
35,000
FY 2013 FY 2014 FY 2015 FY 2016 FY 2017 FY 2018
Chart 8: Video Gaming Terminals in Operation in Illinoisat the end (June) of each Fiscal Year
Source: Illinois Gaming Board

36
As the terminals have increased, so have the amounts of revenue (net terminal income) and tax dollars generated by these machines. In FY 2018, a total of $1.4 billion in net terminal income (taxable base) generated nearly $422 million in State and local tax dollars. A table showing a history of video gaming figures (by fiscal year) since its inception in FY 2013 is shown below. This table also lists how the net terminal income per terminal per day values has continued to rise over the years to its FY 2018 value of $131.59.
The graph below displays the breakout of tax revenues collected from video gaming by fiscal year that is shown in the table above. Since its inception, the tax on video gaming has been equal to 30% of net terminal income. From this amount, 5/6 goes to the Capital Projects Fund. The remaining 1/6 of the tax revenues go to the local governments where the video gaming machines are located.
Fiscal Year
Terminalsin Operationat end of FY
Net Terminal Income
($ in mil)
NTIper
Terminal per Day
Tax Revenue30% Tax($ in mil)
State Share5/6 of Total($ in mil)
Local Share1/6 of Total($ in mil)
FY 2013 7,920 $121.1 $41.88 $36.3 $30.3 $6.1
FY 2014 17,467 $485.4 $76.14 $145.6 $121.4 $24.3
FY 2015 20,730 $804.8 $106.36 $241.4 $201.2 $40.2
FY 2016 23,891 $1,020.8 $117.06 $306.2 $255.2 $51.0
FY 2017 26,873 $1,202.0 $122.55 $360.6 $300.5 $60.1FY 2018 29,283 $1,406.5 $131.59 $421.9 $351.6 $70.3
Table 15: Illinois Video Gaming Statistics by Fiscal Year
$30.3
$121.4
$201.2$255.2
$300.5$351.6
$6.1
$24.3
$40.2
$51.0
$60.1
$70.3
$0.0
$50.0
$100.0
$150.0
$200.0
$250.0
$300.0
$350.0
$400.0
$450.0
FY 2013 FY 2014 FY 2015 FY 2016 FY 2017 FY 2018
Chart 9: Tax Revenue Collected from Video Gaming Terminals$ in millions
Amount to Capital Projects Fund Amount to Local Governments
Source: Illinois Gaming Board. Note: These amounts may not match Comptroller reported amounts due to timing of collections vs receipts.

37
Table 16 below displays the FY 2018 figures on a county by county basis. Here, the terminal total for FY 2018 is listed as 31,057. This is higher than the amount shown in Table 15 because this figure would include terminals that have since been removed from operation. In other words, the fiscal year ended with 29,283 terminals, but 31,057 terminals were used at some point during the fiscal year. [Note: The Gaming Board’s online data only displays the municipality of each terminal location (and not the address and/or county). For the purpose of categorizing the data by county, cities that lie in multiple counties were assigned by the Commission the county making up the highest population of that city, which may or may not be accurate. Because of this, these totals should be seen as approximate.]
County Busin-esses
Term-inals
Net Terminal Income
Tax Revenue State Portion Local Portion County Busin-esses
Term-inals
Net Terminal Income
Tax Revenue State Portion Local Portion
State Totals:
7,026 31,057 $1,406,474,942 $421,942,802 $351,619,097 $70,323,705State
Totals: 7,026 31,057 $1,406,474,942 $421,942,802 $351,619,097 $70,323,705
Adams 81 248 $9,093,438 $2,728,052 $2,273,377 $454,675 Lee 57 246 $8,825,212 $2,647,588 $2,206,324 $441,264Alexander 11 47 $1,689,410 $506,828 $422,357 $84,471 Livingston 59 256 $7,827,818 $2,348,371 $1,956,976 $391,394Bond 19 77 $2,452,914 $735,881 $613,235 $122,647 Logan 38 175 $7,095,750 $2,128,741 $1,773,952 $354,790Boone 41 187 $9,551,640 $2,865,509 $2,387,925 $477,584 McDonough 21 72 $1,725,209 $517,467 $431,222 $86,244Brown 4 11 $127,817 $38,213 $31,844 $6,369 McHenry 250 1,116 $48,558,377 $14,567,630 $12,139,696 $2,427,935Bureau 64 249 $6,512,929 $1,953,834 $1,628,196 $325,639 McLean 108 478 $26,062,209 $7,818,712 $6,515,595 $1,303,117Calhoun 10 37 $637,006 $191,106 $159,255 $31,851 Macon 112 535 $32,743,417 $9,823,084 $8,185,905 $1,637,179Carroll 31 117 $2,671,144 $801,353 $667,795 $133,559 Macoupin 67 282 $7,362,419 $2,208,752 $1,840,628 $368,125Cass 22 92 $2,959,754 $887,936 $739,947 $147,989 Madison 218 947 $39,549,610 $11,864,974 $9,887,481 $1,977,493Champaign 148 661 $32,439,147 $9,731,813 $8,109,846 $1,621,967 Marion 55 255 $10,504,483 $3,151,371 $2,626,143 $525,228Christian 55 248 $8,394,061 $2,518,243 $2,098,537 $419,706 Marshall 23 96 $2,021,080 $606,333 $505,278 $101,055Clark 13 60 $3,933,073 $1,179,928 $983,273 $196,654 Mason 30 118 $2,828,433 $848,541 $707,118 $141,423Clay 11 48 $2,036,037 $610,816 $509,013 $101,802 Massac 10 44 $2,804,247 $841,278 $701,065 $140,213Clinton 50 200 $6,557,703 $1,967,329 $1,639,441 $327,888 Menard 16 66 $2,064,221 $619,274 $516,062 $103,212Coles 57 258 $10,338,045 $3,101,435 $2,584,530 $516,905 Mercer 15 51 $1,229,402 $368,825 $307,354 $61,471Cook 1,086 5,071 $298,568,818 $89,571,158 $74,642,647 $14,928,511 Monroe 26 104 $3,960,220 $1,188,075 $990,062 $198,012Crawford 15 65 $1,714,883 $514,471 $428,726 $85,745 Montgomery 55 219 $6,814,486 $2,044,365 $1,703,638 $340,727Cumberland 16 65 $2,185,923 $655,783 $546,486 $109,297 Morgan 51 223 $9,334,454 $2,800,358 $2,333,632 $466,726DeKalb 68 302 $11,558,392 $3,467,546 $2,889,623 $577,923 Moultrie 17 75 $2,303,380 $691,022 $575,852 $115,170DeWitt 23 108 $4,029,496 $1,208,859 $1,007,383 $201,476 Ogle 64 294 $10,528,626 $3,158,617 $2,632,181 $526,435Douglas 31 138 $3,831,340 $1,149,415 $957,846 $191,569 Peoria 172 709 $27,334,340 $8,200,371 $6,833,644 $1,366,726DuPage 154 717 $49,507,215 $14,851,998 $12,376,667 $2,475,331 Perry 29 132 $3,701,135 $1,110,126 $925,106 $185,021Edgar 16 73 $2,762,276 $828,688 $690,574 $138,115 Piatt 17 72 $2,425,701 $727,718 $606,432 $121,286Edwards 11 48 $1,717,158 $515,150 $429,292 $85,858 Pike 23 86 $2,060,371 $618,117 $515,098 $103,019Effingham 69 300 $12,825,243 $3,847,598 $3,206,333 $641,265 Pope 3 12 $256,784 $77,036 $64,197 $12,839Fayette 25 114 $4,572,323 $1,371,520 $1,142,934 $228,586 Pulaski 6 24 $599,412 $179,826 $149,855 $29,971Ford 19 81 $1,780,057 $534,024 $445,021 $89,004 Putnam 9 34 $739,047 $221,717 $184,765 $36,953Franklin 53 239 $7,926,883 $2,378,086 $1,981,739 $396,347 Randolph 50 218 $7,308,430 $2,192,549 $1,827,125 $365,424Fulton 48 175 $5,282,849 $1,584,566 $1,320,473 $264,094 Richland 12 47 $2,253,922 $676,181 $563,485 $112,697Gallatin 5 22 $576,781 $173,036 $144,197 $28,839 Rock Island 127 533 $19,230,918 $5,769,327 $4,807,774 $961,553Greene 19 82 $2,368,385 $710,524 $592,104 $118,420 St. Clair 196 866 $35,753,284 $10,726,069 $8,938,394 $1,787,675Grundy 65 276 $10,895,986 $3,268,821 $2,724,018 $544,803 Saline 31 148 $4,764,564 $1,429,382 $1,191,152 $238,230Hamilton 5 24 $899,303 $269,794 $224,829 $44,966 Sangamon 271 1,213 $57,023,186 $17,107,076 $14,255,900 $2,851,176Hancock 18 68 $1,698,014 $509,411 $424,509 $84,902 Schuyler 7 22 $526,756 $158,029 $131,691 $26,338Hardin 4 15 $147,157 $44,148 $36,790 $7,358 Scott 10 42 $1,016,617 $304,988 $254,157 $50,831Henderson 9 37 $805,409 $241,626 $201,355 $40,271 Shelby 25 100 $2,574,292 $772,227 $643,523 $128,704Henry 49 204 $6,268,567 $1,880,588 $1,567,158 $313,431 Stark 8 25 $526,631 $157,992 $131,660 $26,332Iroquois 52 203 $5,667,380 $1,700,234 $1,416,863 $283,372 Stephenson 47 207 $9,786,348 $2,935,926 $2,446,606 $489,320Jackson 45 193 $6,683,988 $2,005,215 $1,671,013 $334,202 Tazewell 125 531 $19,056,499 $5,716,136 $4,763,448 $952,688Jasper 12 44 $1,040,526 $312,161 $260,135 $52,027 Union 19 85 $2,143,133 $642,947 $535,789 $107,158Jefferson 34 159 $8,673,132 $2,601,954 $2,168,296 $433,659 Vermilion 94 412 $17,467,518 $5,240,295 $4,366,913 $873,381Jersey 25 98 $2,504,807 $751,452 $626,210 $125,242 Wabash 10 42 $1,376,288 $412,890 $344,075 $68,815JoDaviess 47 196 $5,874,434 $1,761,936 $1,468,280 $293,655 Warren 19 71 $1,694,175 $508,259 $423,550 $84,710Johnson 8 36 $881,087 $264,330 $220,275 $44,055 Washington 34 154 $4,986,981 $1,496,109 $1,246,758 $249,351Kane 218 982 $46,880,483 $14,064,242 $11,720,205 $2,344,037 Wayne 9 42 $1,220,568 $366,174 $305,145 $61,029Kankakee 121 536 $20,711,900 $6,213,626 $5,178,023 $1,035,603 White 11 45 $1,484,645 $445,396 $371,164 $74,233Kendall 47 212 $8,802,901 $2,640,892 $2,200,744 $440,148 Whiteside 78 365 $13,182,202 $3,954,589 $3,295,492 $659,097Knox 54 235 $10,094,675 $3,028,426 $2,523,689 $504,737 Will 286 1,276 $59,715,237 $17,914,697 $14,928,918 $2,985,779Lake 326 1,520 $92,080,188 $27,624,215 $23,020,184 $4,604,031 Williamson 78 344 $12,460,644 $3,738,225 $3,115,188 $623,037LaSalle 238 1,018 $33,112,181 $9,933,751 $8,278,129 $1,655,622 Winnebago 240 1,157 $78,828,000 $23,648,513 $19,707,098 $3,941,415Lawrence 22 91 $3,648,276 $1,094,492 $912,077 $182,415 Woodford 26 104 $2,861,730 $858,529 $715,441 $143,088
Chi Area* 2,500 11,472 $626,567,597 $187,971,197 $156,642,700 $31,328,497% in Chi Area*: 35.6% 36.9% 44.5% 44.5% 44.5% 44.5%
Source: http://www.igb.illinois.gov/VideoReports.aspx. County compilations by CGFA.
Table 16: Video Gaming Statistics by Illinois CountyFY 2018 Totals
*The Chicago Metropolitan Statistical Area is defined by the Census Bureau to include the Illinois Counties of Cook, DeKalb, DuPage, Grundy, Kane, Kendall, McHenry, Will, and Lake.

38
Table 17, below, displays the video gaming statistics shown in Table 16 on a per-capita basis. Statewide, the average terminal-per-capita value was 0.24%. The net terminal income-per-capita value was $109.62. The rankings of the counties’ values in these areas are also displayed in the below table. These figures are displayed by their rankings in each category on the following page.
County TerminalsTerminal
per Capita
Terminal per Capita
Rank
NTI per
Capita
NTI per Capita Rank County
Terminals Terminal
per Capita
Terminal per Capita
Rank
NTI per
Capita
NTI per Capita Rank
Stat
State Totals: 31,057 0.24% $109.62 State Totals: 31,057 0.24% $109.62Adams 248 0.37% 68 $135.51 63 Lee 246 0.68% 16 $244.93 11
Alexander 47 0.57% 33 $205.08 26 Livingston 256 0.66% 18 $200.97 27
Bond 77 0.43% 55 $138.05 62 Logan 175 0.58% 31 $234.14 15
Boone 187 0.35% 77 $176.34 42 McDonough 72 0.22% 95 $52.90 100
Brown 11 0.16% 100 $18.43 102 McHenry 1,116 0.36% 70 $157.27 50
Bureau 249 0.71% 13 $186.20 39 McLean 478 0.28% 91 $153.69 53
Calhoun 37 0.73% 10 $125.17 69 Macon 535 0.48% 46 $295.60 3
Carroll 117 0.76% 7 $173.60 44 Macoupin 282 0.59% 29 $154.14 52
Cass 92 0.67% 17 $216.96 21 Madison 947 0.35% 73 $146.87 56
Champaign 661 0.33% 78 $161.32 48 Marion 255 0.65% 21 $266.36 7
Christian 248 0.71% 12 $241.21 13 Marshall 96 0.76% 8 $159.90 49
Clark 60 0.37% 69 $240.78 14 Mason 118 0.80% 5 $192.86 31
Clay 48 0.35% 75 $147.38 55 Massac 44 0.29% 89 $181.75 41
Clinton 200 0.53% 38 $173.66 43 Menard 66 0.52% 40 $162.47 47
Coles 258 0.48% 47 $191.90 32 Mercer 51 0.31% 83 $74.81 92
Cook 5,071 0.10% 101 $57.48 97 Monroe 104 0.32% 82 $120.16 73
Crawford 65 0.33% 79 $86.54 90 Montgomery 219 0.73% 9 $226.36 16
Cumberland 65 0.59% 30 $197.86 29 Morgan 223 0.63% 22 $262.59 8
DeKalb 302 0.29% 87 $109.91 77 Moultrie 75 0.51% 43 $155.15 51
DeWitt 108 0.65% 19 $243.31 12 Ogle 294 0.55% 36 $196.81 30
Douglas 138 0.69% 14 $191.76 33 Peoria 709 0.38% 67 $146.57 57
DuPage 717 0.08% 102 $53.99 99 Perry 132 0.59% 27 $165.60 46
Edgar 73 0.39% 63 $148.70 54 Piatt 72 0.43% 56 $145.00 58
Edwards 48 0.71% 11 $255.49 10 Pike 86 0.52% 39 $125.40 68
Effingham 300 0.88% 3 $374.55 1 Pope 12 0.27% 93 $57.45 98
Fayette 114 0.51% 42 $206.52 24 Pulaski 24 0.39% 66 $97.29 84
Ford 81 0.58% 32 $126.42 67 Putnam 34 0.57% 34 $123.05 71
Franklin 239 0.60% 25 $200.37 28 Randolph 218 0.65% 20 $218.32 19
Fulton 175 0.47% 50 $142.51 59 Richland 47 0.29% 86 $138.85 61
Gallatin 22 0.39% 62 $103.20 82 Rock Island 533 0.36% 71 $130.34 66
Greene 82 0.59% 28 $170.56 45 St. Clair 866 0.32% 80 $132.39 64
Grundy 276 0.55% 35 $217.65 20 Saline 148 0.59% 26 $191.25 34
Hamilton 24 0.28% 90 $106.34 81 Sangamon 1,213 0.61% 24 $288.78 5
Hancock 68 0.36% 72 $88.88 87 Schuyler 22 0.29% 85 $69.82 96
Hardin 15 0.35% 76 $34.06 101 Scott 42 0.78% 6 $189.84 37
Henderson 37 0.50% 45 $109.86 78 Shelby 100 0.45% 52 $115.11 75
Henry 204 0.40% 60 $124.16 70 Stark 25 0.42% 58 $87.86 89
Iroquois 203 0.68% 15 $190.71 36 Stephenson 207 0.43% 54 $205.12 25
Jackson 193 0.32% 81 $111.00 76 Tazewell 531 0.39% 64 $140.75 60
Jasper 44 0.45% 51 $107.29 80 Union 85 0.48% 48 $120.35 72
Jefferson 159 0.41% 59 $223.38 18 Vermilion 412 0.50% 44 $214.00 23
Jersey 98 0.43% 57 $108.98 79 Wabash 42 0.35% 74 $115.20 74
JoDaviess 196 0.86% 4 $259.04 9 Warren 71 0.40% 61 $95.68 85
Johnson 36 0.29% 88 $70.03 95 Washington 154 1.05% 1 $338.88 2
Kane 982 0.19% 97 $90.98 86 Wayne 42 0.25% 94 $72.83 94
Kankakee 536 0.47% 49 $182.57 40 White 45 0.31% 84 $101.24 83
Kendall 212 0.18% 99 $76.72 91 Whiteside 365 0.62% 23 $225.34 17
Knox 235 0.44% 53 $190.76 35 Will 1,276 0.19% 98 $88.13 88
Lake 1,520 0.22% 96 $130.90 65 Williamson 344 0.52% 41 $187.78 38
LaSalle 1,018 0.89% 2 $290.65 4 Winnebago 1,157 0.39% 65 $266.97 6 Lawrence 91 0.54% 37 $216.73 22 Woodford 104 0.27% 92 $74.02 93
Metro Area* 11,472 0.14% $78.35 % in Chi Area*: 36.9%
Source: http://www.igb.illinois.gov/VideoReports.aspx. County compilations by CGFA.
Table 17: Video Gaming Statistics per County PopulationFY 2018 Totals
*The Chicago Metropolitan Statistical Area is defined by the Census Bureau to include the Illinois Counties of Cook, DeKalb, DuPage, Grundy, Kane, Kendall, McHenry, Will, and Lake.
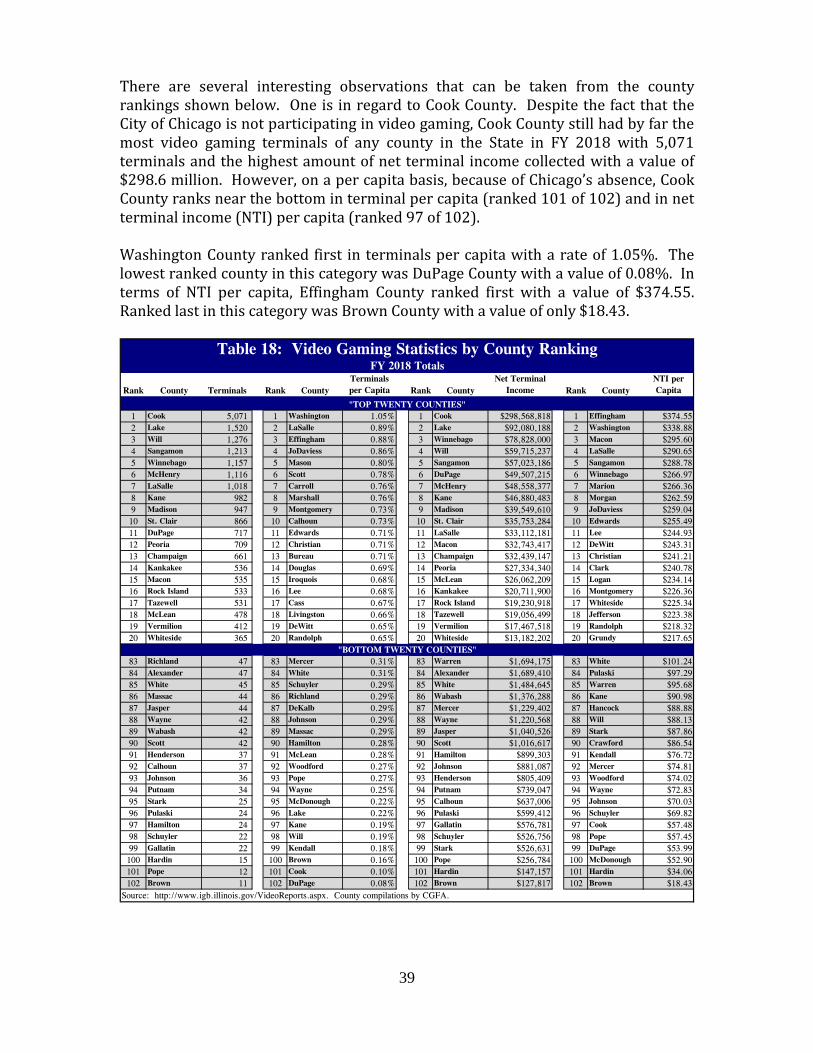
39
There are several interesting observations that can be taken from the county rankings shown below. One is in regard to Cook County. Despite the fact that the City of Chicago is not participating in video gaming, Cook County still had by far the most video gaming terminals of any county in the State in FY 2018 with 5,071 terminals and the highest amount of net terminal income collected with a value of $298.6 million. However, on a per capita basis, because of Chicago’s absence, Cook County ranks near the bottom in terminal per capita (ranked 101 of 102) and in net terminal income (NTI) per capita (ranked 97 of 102). Washington County ranked first in terminals per capita with a rate of 1.05%. The lowest ranked county in this category was DuPage County with a value of 0.08%. In terms of NTI per capita, Effingham County ranked first with a value of $374.55. Ranked last in this category was Brown County with a value of only $18.43.
Rank County Terminals Rank CountyTerminals per Capita Rank County
Net Terminal Income Rank County
NTI per Capita
1 Cook 5,071 1 Washington 1.05% 1 Cook $298,568,818 1 Effingham $374.552 Lake 1,520 2 LaSalle 0.89% 2 Lake $92,080,188 2 Washington $338.883 Will 1,276 3 Effingham 0.88% 3 Winnebago $78,828,000 3 Macon $295.604 Sangamon 1,213 4 JoDaviess 0.86% 4 Will $59,715,237 4 LaSalle $290.655 Winnebago 1,157 5 Mason 0.80% 5 Sangamon $57,023,186 5 Sangamon $288.786 McHenry 1,116 6 Scott 0.78% 6 DuPage $49,507,215 6 Winnebago $266.977 LaSalle 1,018 7 Carroll 0.76% 7 McHenry $48,558,377 7 Marion $266.368 Kane 982 8 Marshall 0.76% 8 Kane $46,880,483 8 Morgan $262.599 Madison 947 9 Montgomery 0.73% 9 Madison $39,549,610 9 JoDaviess $259.0410 St. Clair 866 10 Calhoun 0.73% 10 St. Clair $35,753,284 10 Edwards $255.4911 DuPage 717 11 Edwards 0.71% 11 LaSalle $33,112,181 11 Lee $244.9312 Peoria 709 12 Christian 0.71% 12 Macon $32,743,417 12 DeWitt $243.3113 Champaign 661 13 Bureau 0.71% 13 Champaign $32,439,147 13 Christian $241.2114 Kankakee 536 14 Douglas 0.69% 14 Peoria $27,334,340 14 Clark $240.7815 Macon 535 15 Iroquois 0.68% 15 McLean $26,062,209 15 Logan $234.1416 Rock Island 533 16 Lee 0.68% 16 Kankakee $20,711,900 16 Montgomery $226.3617 Tazewell 531 17 Cass 0.67% 17 Rock Island $19,230,918 17 Whiteside $225.3418 McLean 478 18 Livingston 0.66% 18 Tazewell $19,056,499 18 Jefferson $223.3819 Vermilion 412 19 DeWitt 0.65% 19 Vermilion $17,467,518 19 Randolph $218.3220 Whiteside 365 20 Randolph 0.65% 20 Whiteside $13,182,202 20 Grundy $217.65
83 Richland 47 83 Mercer 0.31% 83 Warren $1,694,175 83 White $101.2484 Alexander 47 84 White 0.31% 84 Alexander $1,689,410 84 Pulaski $97.2985 White 45 85 Schuyler 0.29% 85 White $1,484,645 85 Warren $95.6886 Massac 44 86 Richland 0.29% 86 Wabash $1,376,288 86 Kane $90.9887 Jasper 44 87 DeKalb 0.29% 87 Mercer $1,229,402 87 Hancock $88.8888 Wayne 42 88 Johnson 0.29% 88 Wayne $1,220,568 88 Will $88.1389 Wabash 42 89 Massac 0.29% 89 Jasper $1,040,526 89 Stark $87.8690 Scott 42 90 Hamilton 0.28% 90 Scott $1,016,617 90 Crawford $86.5491 Henderson 37 91 McLean 0.28% 91 Hamilton $899,303 91 Kendall $76.7292 Calhoun 37 92 Woodford 0.27% 92 Johnson $881,087 92 Mercer $74.8193 Johnson 36 93 Pope 0.27% 93 Henderson $805,409 93 Woodford $74.0294 Putnam 34 94 Wayne 0.25% 94 Putnam $739,047 94 Wayne $72.8395 Stark 25 95 McDonough 0.22% 95 Calhoun $637,006 95 Johnson $70.0396 Pulaski 24 96 Lake 0.22% 96 Pulaski $599,412 96 Schuyler $69.8297 Hamilton 24 97 Kane 0.19% 97 Gallatin $576,781 97 Cook $57.4898 Schuyler 22 98 Will 0.19% 98 Schuyler $526,756 98 Pope $57.4599 Gallatin 22 99 Kendall 0.18% 99 Stark $526,631 99 DuPage $53.99100 Hardin 15 100 Brown 0.16% 100 Pope $256,784 100 McDonough $52.90101 Pope 12 101 Cook 0.10% 101 Hardin $147,157 101 Hardin $34.06102 Brown 11 102 DuPage 0.08% 102 Brown $127,817 102 Brown $18.43
Source: http://www.igb.illinois.gov/VideoReports.aspx. County compilations by CGFA.
Table 18: Video Gaming Statistics by County RankingFY 2018 Totals
"TOP TWENTY COUNTIES"
"BOTTOM TWENTY COUNTIES"
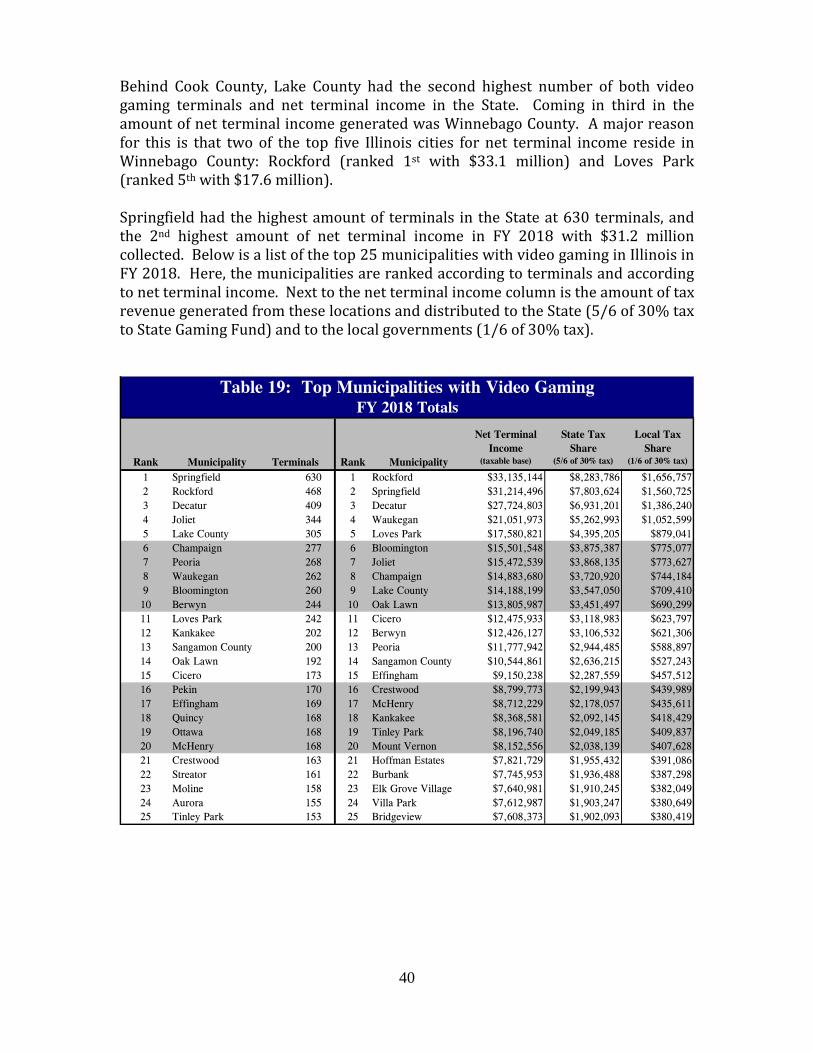
40
Behind Cook County, Lake County had the second highest number of both video gaming terminals and net terminal income in the State. Coming in third in the amount of net terminal income generated was Winnebago County. A major reason for this is that two of the top five Illinois cities for net terminal income reside in Winnebago County: Rockford (ranked 1st with $33.1 million) and Loves Park (ranked 5th with $17.6 million). Springfield had the highest amount of terminals in the State at 630 terminals, and the 2nd highest amount of net terminal income in FY 2018 with $31.2 million collected. Below is a list of the top 25 municipalities with video gaming in Illinois in FY 2018. Here, the municipalities are ranked according to terminals and according to net terminal income. Next to the net terminal income column is the amount of tax revenue generated from these locations and distributed to the State (5/6 of 30% tax to State Gaming Fund) and to the local governments (1/6 of 30% tax).
Rank Municipality Terminals Rank Municipality
Net Terminal Income
(taxable base)
State Tax Share
(5/6 of 30% tax)
Local Tax Share
(1/6 of 30% tax)
1 Springfield 630 1 Rockford $33,135,144 $8,283,786 $1,656,7572 Rockford 468 2 Springfield $31,214,496 $7,803,624 $1,560,7253 Decatur 409 3 Decatur $27,724,803 $6,931,201 $1,386,2404 Joliet 344 4 Waukegan $21,051,973 $5,262,993 $1,052,5995 Lake County 305 5 Loves Park $17,580,821 $4,395,205 $879,0416 Champaign 277 6 Bloomington $15,501,548 $3,875,387 $775,0777 Peoria 268 7 Joliet $15,472,539 $3,868,135 $773,6278 Waukegan 262 8 Champaign $14,883,680 $3,720,920 $744,1849 Bloomington 260 9 Lake County $14,188,199 $3,547,050 $709,41010 Berwyn 244 10 Oak Lawn $13,805,987 $3,451,497 $690,29911 Loves Park 242 11 Cicero $12,475,933 $3,118,983 $623,79712 Kankakee 202 12 Berwyn $12,426,127 $3,106,532 $621,30613 Sangamon County 200 13 Peoria $11,777,942 $2,944,485 $588,89714 Oak Lawn 192 14 Sangamon County $10,544,861 $2,636,215 $527,24315 Cicero 173 15 Effingham $9,150,238 $2,287,559 $457,51216 Pekin 170 16 Crestwood $8,799,773 $2,199,943 $439,98917 Effingham 169 17 McHenry $8,712,229 $2,178,057 $435,61118 Quincy 168 18 Kankakee $8,368,581 $2,092,145 $418,42919 Ottawa 168 19 Tinley Park $8,196,740 $2,049,185 $409,83720 McHenry 168 20 Mount Vernon $8,152,556 $2,038,139 $407,62821 Crestwood 163 21 Hoffman Estates $7,821,729 $1,955,432 $391,08622 Streator 161 22 Burbank $7,745,953 $1,936,488 $387,29823 Moline 158 23 Elk Grove Village $7,640,981 $1,910,245 $382,04924 Aurora 155 24 Villa Park $7,612,987 $1,903,247 $380,64925 Tinley Park 153 25 Bridgeview $7,608,373 $1,902,093 $380,419
Table 19: Top Municipalities with Video GamingFY 2018 Totals
41
Local Governments Banning Video Gaming While the Video Gaming Act allows video gaming terminals to be located throughout Illinois, it does state, however, that a municipality may pass an ordinance prohibiting video gaming within the corporate limits of the municipality. Similarly, a county board may, for the unincorporated area of the county, pass an ordinance prohibiting video gaming within the unincorporated area of the county. During the four years before video gaming came to fruition, the number of municipalities/counties that had laws banning video gaming grew. Some made the decision to ban video gaming in their communities following the enactment of video gaming, while some discovered that a ban on gambling in their jurisdiction was already “on the books”. In these cases, local governments would have to vote to “opt in” to allow video gambling, which can often be a political challenge. The City of Chicago is one of those communities that already had on its books a provision that outlaws video gaming in its city. Because of this, the City of Chicago must “opt-in” to allow video gaming in their area. At the present time, there has been no public indication that the City plans on changing the law to allow Chicago establishments the opportunity to offer video gaming in their locations. Since Chicago makes up approximately 21.0% of the State’s population, this has a huge impact on potential video gaming revenues. On its website, the Illinois Gaming Board has established a page which identifies the municipalities across Illinois and their status of whether or not they allow video gaming in their area. This site can be accessed at:
www.igb.illinois.gov/VideoProhibit.aspx. A list of the highest populated cities in Illinois without video gaming is shown on the following page. In 2013, the Commission calculated that the percentage of the State’s population that lived in an area banning video gaming was at 63.3%. The FY 2018 data shows that the percentage of Illinois communities without video gaming has fallen to 37.3%. As the budgets of local governments struggle to stay out of the red, many communities are turning to video gaming for a new revenue source. Again, those communities that offer video gaming are set to receive 1/6 of total tax revenues collected. As the need for additional local revenues elevates, so does the pressure to overturn the ban. For example, there were four municipalities that were in the aforementioned table two years ago (Buffalo Grove, Crystal Lake, St. Charles, and Niles), but are no longer included because they now allow video gaming. Another municipality on this list, Orland Park, overturned their ban in August 2018 and will not be shown on the FY 2019 list. In addition, another location, Mt. Prospect, is reportedly close to allowing video gaming in the near future.

42
Rank Municipality2010 Census Population
% of State Population
1 Chicago 2,695,598 21.0%2 Naperville 141,853 1.1%3 Arlington Heights 75,101 0.6%4 Evanston 74,486 0.6%5 Schaumburg 74,227 0.6%6 Bolingbrook 73,366 0.6%7 Palatine 68,557 0.5%8 Skokie 64,784 0.5%9 Des Plaines 58,364 0.5%10 Orland Park* 56,767 0.4%11 Mount Prospect** 54,167 0.4%12 Wheaton 52,894 0.4%13 Oak Park 51,878 0.4%14 Downers Grove 47,833 0.4%15 Glenview 44,692 0.3%16 Elmhurst 44,121 0.3%17 Lombard 43,395 0.3%18 Plainfield 39,581 0.3%19 Park Ridge 37,480 0.3%20 Northbrook 33,170 0.3%21 Gurnee 31,295 0.2%22 Highland Park 29,763 0.2%23 Glen Ellyn 27,450 0.2%24 Wilmette 27,087 0.2%25 West Chicago 27,086 0.2%
* According to IGB's website, video gaming is allowed in Orland Park as of 8/7/18.
** Multiple sources state that Mount Prospect is strongly considering video gaming in FY19.
Table 20: Highest Populated Cities w/o Video GamingFY 2018 Totals

43
Video Gaming and Its Impact on Casinos As Illinois’ video gaming numbers continue to increase, the opposite has been the case for Illinois’ riverboats. Since video gaming began in FY 2013, the total AGR of Illinois’ ten casinos have fallen in every subsequent fiscal year: -2.8% in FY 2013; -6.7% in FY 2014; -1.9% in FY 2015; -2.1% in FY 2016; -1.6% in FY 2017; and -1.3% in FY 2018. Overall, casino receipts have fallen a combined -15.5% since FY 2012. Only one casino, Rivers Casino in Des Plaines, has experienced an increase in AGR during this six-year period (+11.4%). Excluding Des Plaines, the other nine casinos have fallen a combined 24.0% with all experiencing double-digit losses. While there are an abundance of factors causing the decline in casino numbers, undoubtedly, a major contributing factor to this falloff is the increased competition resulting from the growth of video gaming. When looking at gambling forms separately, the previous statistics show a downward trend in riverboat gambling. However, as shown in the following graph, when combined with video gaming totals, gambling as a whole has actually increased statewide.
In FY 2012, gaming revenues totaled $1.641 billion with all of the dollars coming from Illinois riverboats. In FY 2013, riverboat casino revenues fell $46 million, but when combined with the $121 million in video gaming revenues, total gaming revenues actually increased +4.6% in FY 2013. Similarly, in FY 2014, casino revenues fell $107 million, but were offset by the $364 million increase in video gaming net terminal income. This offsetting trend has continued ever since.
$1,640.6 $1,594.8 $1,487.6 $1,459.4 $1,428.9 $1,405.6 $1,386.7
$121.1 $485.4 $804.8 $1,020.8 $1,202.0
$1,406.5
$0.0
$500.0
$1,000.0
$1,500.0
$2,000.0
$2,500.0
$3,000.0
FY 2012 FY 2013 FY 2014 FY 2015 FY 2016 FY 2017 FY 2018
Chart 10: Adjusted Gross Receipts (AGR) of Illinois Riverboats vsNet Terminal Income (NTI) of Illinois Video Gaming Machines
$ in millions
AGR from Riverboats NTI from Video Gaming
Total: $1.641 B Total: $1.716 B
Total: $1.973 B
FY 2018 % Change over FY 2012Casino AGR: -15.5%AGR+NTI: +70.3%
FY 2017% Change over FY 2012casino AGR:
Total: $2.264 B
Total: $2.450 BTotal: $2.608 B
Total: $2.793 B
44
In FY 2018, video gaming revenue increased $204 million over FY 2017 levels, offsetting the $19 million decline in casino revenues for a net increase of $185 million. As stated earlier, when comparing FY 2018 numbers with FY 2012, the combined AGR of riverboats have fallen a combined 15.5%. However, when including video gaming receipts, overall gaming revenues went from $1.641 billion to $3.793 billion, an increase of 70.3%. Video gaming in certain regions of the State have obviously impacted the riverboat industry more than others. For the communities that lie several hours away from the nearest riverboat casino, the impact of these communities offering video gaming has probably had very little consequence on the casino industry – except for the small number of patrons that would travel the distance to gamble at a casino, but now elect to gamble at the video gaming machines near their home. It is these communities that appear to have brought in much of the “new” gaming dollars to State and local coffers creating the overall 70.3% increase in total gaming revenues over the past five years. On the other hand, for the communities that reside in close distance to existing casinos, the numbers would suggest that this increased competition is having a negative impact on the casino industry. An example of video gaming’s impact on the riverboat casino industry is seen by looking at the Chicago region. As shown at the bottom of the county-by-county video gaming table on page 37, there were an estimated 2,500 businesses in the Chicago Metropolitan Statistical Area (which is defined by the Census Bureau to include the Illinois counties of Cook, DeKalb, DuPage, Grundy, Kane, Kendall, McHenry, Will, and Lake) in FY 2018 that offered video gaming. These locations were home to 11,472 video gaming terminals during the calendar year. It is estimated that approximately $626.6 million in video gaming net terminal income came from communities in the Chicago Area in FY 2018. Under current law, Illinois casinos can have a maximum of 1,200 gaming positions at their locations. This means that video gaming has added the equivalent of over 9 full-size casinos to the Chicago metropolitan region. These 11,472 terminals were added to an area that already had in its region five riverboat casinos in four Illinois communities: Joliet, Aurora, Elgin, and Des Plaines. Despite AGR increases at the Des Plaines casino, combined, these five casinos have seen their FY 2018 AGR totals decline 9.9% since FY 2012. Without the newer Des Plaines casino, these Illinois based casinos have fallen 21.3% over the last six fiscal years. Obviously, the popular Des Plaines casino is part of the reason for the declines at the other riverboat casinos, but video gaming has no doubt been a significant contributor to this falloff as well. In addition, there are five Indiana casinos within a short drive of the Chicago Area in the communities of East Chicago, Gary (2), Hammond, and Michigan City. As seen in the following chart, these five Indiana casinos have seen their AGR totals fall from $1.1 billion in FY 2012 to $894 million in FY 2018, a six-year decline of 19.8%. Again, the new casino in Des Plaines has contributed to this falloff, but the numbers would suggest that video gaming has also contributed to this decline.
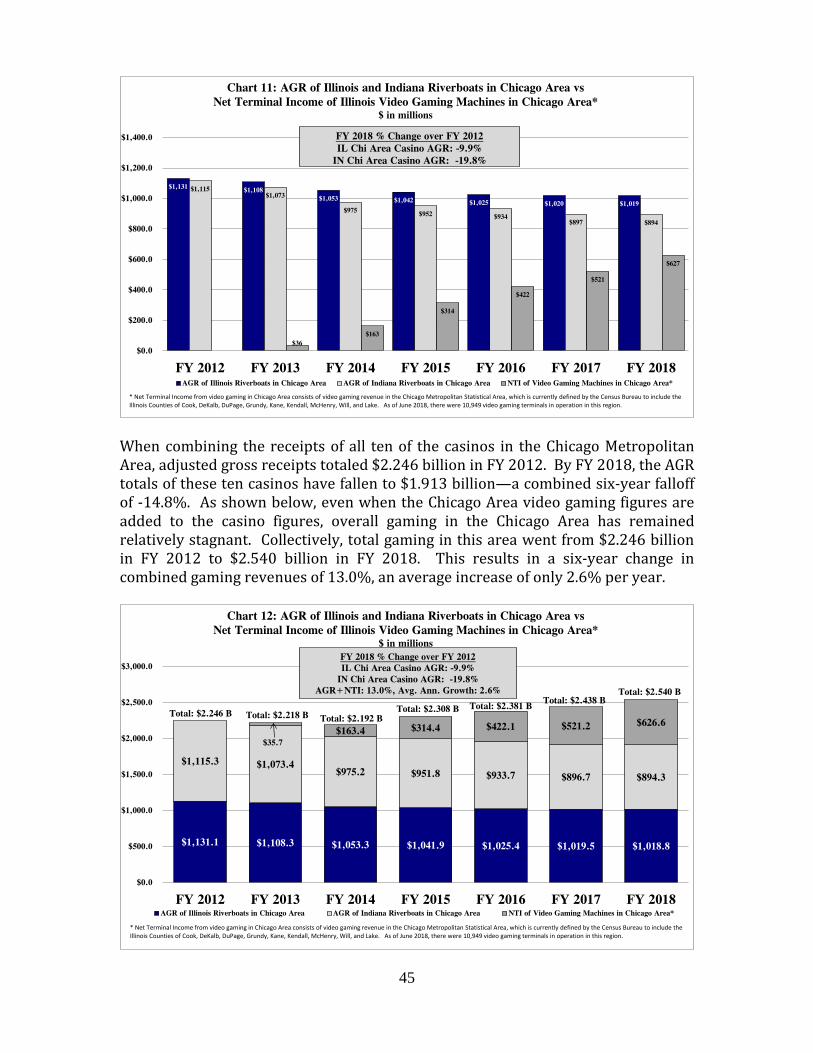
45
When combining the receipts of all ten of the casinos in the Chicago Metropolitan Area, adjusted gross receipts totaled $2.246 billion in FY 2012. By FY 2018, the AGR totals of these ten casinos have fallen to $1.913 billion—a combined six-year falloff of -14.8%. As shown below, even when the Chicago Area video gaming figures are added to the casino figures, overall gaming in the Chicago Area has remained relatively stagnant. Collectively, total gaming in this area went from $2.246 billion in FY 2012 to $2.540 billion in FY 2018. This results in a six-year change in combined gaming revenues of 13.0%, an average increase of only 2.6% per year.
$1,131 $1,108$1,053 $1,042 $1,025 $1,020 $1,019
$1,115$1,073
$975 $952 $934$897 $894
$36$163
$314
$422
$521
$627
$0.0
$200.0
$400.0
$600.0
$800.0
$1,000.0
$1,200.0
$1,400.0
FY 2012 FY 2013 FY 2014 FY 2015 FY 2016 FY 2017 FY 2018
Chart 11: AGR of Illinois and Indiana Riverboats in Chicago Area vs Net Terminal Income of Illinois Video Gaming Machines in Chicago Area*
$ in millions
AGR of Illinois Riverboats in Chicago Area AGR of Indiana Riverboats in Chicago Area NTI of Video Gaming Machines in Chicago Area*
* Net Terminal Income from video gaming in Chicago Area consists of video gaming revenue in the Chicago Metropolitan Statistical Area, which is currently defined by the Census Bureau to include the Illinois Counties of Cook, DeKalb, DuPage, Grundy, Kane, Kendall, McHenry, Will, and Lake. As of June 2018, there were 10,949 video gaming terminals in operation in this region.
FY 2018 % Change over FY 2012IL Chi Area Casino AGR: -9.9%
IN Chi Area Casino AGR: -19.8%
$1,131.1 $1,108.3 $1,053.3 $1,041.9 $1,025.4 $1,019.5 $1,018.8
$1,115.3 $1,073.4 $975.2 $951.8 $933.7 $896.7 $894.3
$35.7$163.4 $314.4 $422.1 $521.2 $626.6
$0.0
$500.0
$1,000.0
$1,500.0
$2,000.0
$2,500.0
$3,000.0
FY 2012 FY 2013 FY 2014 FY 2015 FY 2016 FY 2017 FY 2018
Chart 12: AGR of Illinois and Indiana Riverboats in Chicago Area vs Net Terminal Income of Illinois Video Gaming Machines in Chicago Area*
$ in millions
AGR of Illinois Riverboats in Chicago Area AGR of Indiana Riverboats in Chicago Area NTI of Video Gaming Machines in Chicago Area*
* Net Terminal Income from video gaming in Chicago Area consists of video gaming revenue in the Chicago Metropolitan Statistical Area, which is currently defined by the Census Bureau to include the Illinois Counties of Cook, DeKalb, DuPage, Grundy, Kane, Kendall, McHenry, Will, and Lake. As of June 2018, there were 10,949 video gaming terminals in operation in this region.
Total: $2.246 B Total: $2.218 B Total: $2.192 B Total: $2.308 B
FY 2018 % Change over FY 2012IL Chi Area Casino AGR: -9.9%
IN Chi Area Casino AGR: -19.8%AGR+NTI: 13.0%, Avg. Ann. Growth: 2.6%
Total: $2.381 B Total: $2.438 B
Total: $2.540 B
46
The numbers in the previous graph indicate that the inclusion of video gaming in the Chicago Area has only slightly increased the amount of gaming dollars in this region. With an average annual growth in gaming of only 2.6% per year, thus far, it appears that video gaming has simply “reshuffled the deck chairs” by redistributing casino gaming revenues to the numerous gaming venues that now exist in this region. Why have the combined gaming totals remained relatively stagnant in the Chicago Area if the statewide totals have increased 70.3% since FY 2012? An explanation for this is simply because of the amount of gaming options that already existed in this area even before video gaming began. The Chicago Area, which already had its choice of 10 casinos, was the home to over 15,000 gaming positions. Adding 11,472 additional video gaming terminals to the region gave gamers more choices, but it appears that it has not brought in much in the way of new gaming revenues. Most downstate communities, however, did not have close gaming options available to them. Video gaming gave these areas a “nearby” option, allowing gaming revenues to thrive in areas outside of the Chicago Metropolitan Area. This is a plausible explanation for why the net increase in overall gaming revenues has occurred outside of the Chicago Area. Many gambling proponents argue that because Chicago has yet to enter into the gaming market, there remains a large untapped amount of gaming dollars. There is likely a lot of truth to this, especially when considering the potential revenues from tourists that typically would not venture outside of the downtown area to visit other gaming facilities. But from the standpoint of the outer regions of Chicago, the previous graph would indicate these areas may have already neared a saturation point. Even though overall gaming revenues have been stagnant in the Chicago Area as a whole, Illinois appears to be taking advantage of Indiana’s revenue losses. It has always been widely believed that a significant portion of Indiana’s riverboat revenues have come from Illinois residents crossing the border to gamble at Indiana’s facilities. Indiana’s recent decline in their AGR numbers suggests that Illinois’ recent increase in its gaming options, whether from the Des Plaines Casino or the new video gaming terminals, has resulted in the retention of more gaming dollars in Illinois, increasing Illinois’ coffers while reducing Indiana’s. What kind of impact has video gaming had on the tax revenues from all gaming sources? In FY 2012, the taxes imposed on the Illinois riverboats (admission tax and the graduated tax on adjusted gross receipts) generated $548 million. Due to the recent declines in admissions and AGR totals, this tax amount fell to $469 million in FY 2018, a six-year decline of 14.4%. However, these declines have been more than offset by the additional tax revenue generated from video gaming. In FY 2013, $36 million in tax revenues were generated from video gaming. As video gaming revved up, this total rose to $146 million in FY 2014, to $241 million in FY 2015, to $306 million in FY 2016, to $361 million in FY 2017, and to $422

47
million in FY 2018. When combining these video gaming tax revenues with casino tax revenues, overall tax revenues grew from $548 million in FY 2012 to $891 million in FY 2018, an increase of 62.6%. These figures are displayed in the following chart.
While higher tax revenues are welcomed, there are aspects of this growth that may be concerning to some. The first pertains to the tax rate imposed on these gaming sources. Video gaming revenues are taxed at a flat 30% tax rate. Casino revenues, on the other hand, are taxed on a graduated basis – meaning the more revenues that are collected, the higher the tax. In FY 2018, the effective tax rate for the 10 casinos was 33.8% (includes both state and local wagering and admission taxes). As gaming dollars move from the casinos to the video gaming terminals, these dollars are then taxed at a lower rate, thereby reducing overall tax collections. The other aspect that may be troubling to some is the destination of these gaming tax dollars. The majority of tax revenues from casinos are eventually transferred to the Education Assistance Fund. The majority of tax revenues from video gaming are deposited into the Capital Projects Fund. Therefore, if video gaming causes a reduction in revenues from riverboats, tax dollars are effectively being shifted from the Education Assistance Fund to the Capital Projects Fund. Furthermore, money set aside for administration costs pertaining to both riverboat casinos and video gaming comes from riverboat casino taxes deposited into the State Gaming Fund. In other words, as video gaming administration expenses increase, this results in less revenue in the State Gaming Fund to be transferred into the Education Assistance Fund. Whether this funding shift is desired is, of course, open to policy debate.
$548.3 $557.9 $516.5 $498.3 $485.0 $475.3 $469.4
$36.3 $145.6 $241.4 $306.2 $360.6 $421.9
$0.0
$100.0
$200.0
$300.0
$400.0
$500.0
$600.0
$700.0
$800.0
$900.0
$1,000.0
FY 2012 FY 2013 FY 2014 FY 2015 FY 2016 FY 2017 FY 2018
Chart 13: Tax Revenue from Riverboats and Video Gaming in Illinois$ in millions
Tax Revenues from Riverboats Tax Revenues from Video Gaming
Total: $548 MTotal: $594 M
Total: $662 M
FY 2018 % Change over FY 2012Tax Revenue from Riverboats: -14.4%
Tax Revenue from Riverboats and Video Gaming: +62.6%
Effective Tax Rates in FY 2018Riverboats: 33.8%, Video Gaming: 30%, Combined: 31.9%
Total: $740 MTotal: $791 M
Total: $836 MTotal: $891 M
48
Video Gaming’s Future How much revenue will be generated from video gaming in the future? Several years ago, insiders estimated that the State would plateau at around 20,000 video gaming terminals, but the popularity of video gaming has spurred enough interest that the State has sailed past this mark (FY 2018 ended with 29,283 terminals). Although the number of new terminals being added each month has slowed, it now appears that the statewide total for terminals in operation in one month will approach or surpass 30,000 terminals by the end of FY 2019. In FY 2018, the net terminal income per position per day average was $136. Assuming similar results in the upcoming fiscal year, the Commission estimates that net terminal income in Illinois will approach $1.5 billion in FY 2019. This would equate to tax revenues totaling around $450 million for the fiscal year. These numbers, of course, assume that the strong performance of the current establishments will continue. This is expected because video gaming’s recent successes will likely lure other businesses to look into video gaming to reap the potential financial benefits of hosting these machines. In addition, the tax revenue potential of video gaming could sway communities currently banning video gaming to decide to overturn this ban. If this occurs, the number of businesses seeking video gaming machines would increase significantly, as would the revenues generated from video gaming in Illinois. There are factors, however, that could limit video gaming’s growth in the future. One factor is simply due to potential saturation of the market. As more and more terminals are placed into operation, the increase in competition will undoubtedly negatively impact certain locations. This could lead some establishments to reduce their number of terminals or drop them altogether. While the number of establishments falling into this category is not anticipated to be enough to offset the upward trend in video gaming as a whole, it is something to keep an eye on. Another factor that could arise is the competition from “sweepstakes” machines. These unregulated devices look and work similarly to video gaming terminals but are not subject to State and local taxation. Although the Illinois Gaming Board has suggested that the machines are illegal, enough ambiguity in the law exists that these machines remain in operation. These machines can be played for free, which reportedly provides a legal “loophole” that these are “not gambling devices”. If the popularity of these devices grows and more businesses choose these machines over video gaming terminals, the State’s video gaming numbers could be negatively affected. Finally, if gaming expansion discussions were to lead to new casinos and/or racinos in Illinois, there would undoubtedly be a detrimental impact on the video gaming industry. While this impact would be localized to the areas near the new gaming facilities, any increase in competition could adversely affect the overall performance of the video gaming market. The question that many in the industry have is which form of gaming will have a greater cannibalization effect on the other: video gaming or the casino industry.

49
LOTTERY

50

51
LOTTERY
The Illinois State Lottery was authorized in 1974 and began operation in 1975. The State’s lottery system generates revenue via ticket sales, agent fees, and interest-earning accounts. Following the payment of prizes, agent commissions, and administrative costs, net lottery receipts are transferred into the Common School Fund, the Capital Projects Fund, or Special Cause Funds. Since its inception, lottery sales have totaled over $67 billion and the Lottery has transferred almost $22 billion back to the State. Table 21 presents a brief history of the Illinois State Lottery highlighting sales by game, total sales, and the percentage change from the previous fiscal year. Lottery Revenue Sources Total sales by the Illinois Lottery were $2.928 billion in FY 2018. This was $82.5 million more than in FY 2017. This equaled growth of 2.9%. This was the first year with any significant growth since FY 2013. The previous four years results bounced between -1.4% and 1.4% per year. The majority of the growth in total sales was from increases in the draw games. Instant ticket sales were $1.881 billion in FY 2018 which amounts to over 64% of total sales. This was up only $8.6 million, or 0.5%, from FY 2017’s results. Draw games, which account for the remaining 35.8% of total sales, were up $73.9 million to $1.048 billion. That increase calculates to growth of 7.6%. Looking at the individual draw games, the largest increase was seen in the Mega Millions game. Mega Millions rose from $98.2 million in FY 2017 to $125.0 million in FY 2018. This increase of $26.8 million in sales was equal to growth of 27.3%. Other areas of significant growth were the Pick 3 and Pick 4 games. The Pick 3 increased by $15.7 million to $278.1 million, while the Pick 4 game grew $19.6 million to $248.8 million. The Powerball game grew by 6.4% to $161.2 million which was growth of over $9.6 million. Similarly, the Lotto game grew by 6.9%, or $6.1 million, to $93.9 million. Two lottery games had sales that declined by small amounts in FY 2018. The Lucky Day Lotto was down $2.7 million, or -2.0%, to $134.5 million. Raffle game sales declined by over -16% in FY 2018. Though this decline was large in percentage terms, this was only a decline of $1.3 million as total Raffle receipts were only $7.8 million in FY 2017. Chart 14 highlights the rise of Instant Games sales in comparison to Draw Games over the past 30 years, while Chart 15 breaks down FY 2018’s sales by game.

52
Fisc
alYe
arSa
les
% C
hang
eSa
les
% C
hang
eSa
les
% C
hang
eSa
les
% C
hang
eSa
les
% C
hang
eSa
les
% C
hang
eSa
les
% C
hang
eSa
les
% C
hang
eSa
les
% C
hang
e$
% C
hang
e19
75-
$
n/
a-
$
n/a
-$
n/a
-$
n/a
-$
n/a
-$
n/a
-$
n/a
-$
n/a
129.
3$
n/
a12
9.3
$
n/
a19
7656
.6$
n/
a-
$
n/a
-$
n/a
-$
n/a
-$
n/a
-$
n/a
-$
n/a
-$
n/a
107.
3$
-1
7.0%
163.
9$
26.8
%19
7762
.9$
11
.1%
-$
n/
a-
$
n/
a-
$
n/
a-
$
n/
a-
$
n/
a-
$
n/
a-
$
n/
a50
.0$
-53.
4%11
2.9
$
-3
1.1%
1978
57.5
$
-8.6
%-
$
n/a
-$
n/a
-$
n/a
-$
n/a
-$
n/a
-$
n/a
-$
n/a
31.6
$
-3
6.8%
89.1
$
-21.
1%19
7956
.3$
-2
.1%
-$
n/
a-
$
n/
a-
$
n/
a-
$
n/
a-
$
n/
a-
$
n/
a-
$
n/
a20
.4$
-35.
4%76
.7$
-1
3.9%
1980
41.4
$
-26.
5%42
.4$
n/a
-$
n/a
-$
n/a
-$
n/a
-$
n/a
-$
n/a
-$
n/a
13.7
$
-3
2.8%
97.5
$
27.1
%19
8143
.0$
3.
9%16
4.2
$
28
7.3%
-$
n/a
-$
n/a
-$
n/a
-$
n/a
-$
n/a
-$
n/a
7.5
$
-45.
3%21
4.7
$
12
0.2%
1982
78.2
$
81.9
%24
8.2
$
51
.2%
-$
n/a
17.7
$
n/
a-
$
n/
a-
$
n/
a-
$
n/
a-
$
n/
a0.
0$
-9
9.5%
344.
1$
60.3
%19
8315
8.1
$
10
2.2%
283.
8$
14.3
%-
$
n/
a46
.0$
n/a
26.9
$
n/
a-
$
n/
a-
$
n/
a-
$
n/
a-
$
-1
00.0
%51
4.8
$
49
.6%
1984
196.
6$
24.4
%36
7.4
$
29
.5%
-$
n/a
49.4
$
7.
4%29
8.8
$
1010
.8%
-$
n/a
-$
n/a
-$
n/a
-$
n/a
912.
2$
77.2
%19
8523
3.7
$
18
.9%
356.
2$
-3.0
%-
$
n/
a75
.5$
52.8
%56
7.4
$
89.9
%2.
8$
n/a
-$
n/a
-$
n/a
-$
n/a
1,23
5.6
$
35.5
%19
8623
7.6
$
1.
7%34
7.6
$
-2
.4%
-$
n/a
88.1
$
16
.7%
642.
3$
13
.2%
-$
-100
.0%
-$
n/a
-$
n/a
-$
n/a
1,31
5.6
$
6.5%
1987
227.
3$
-4.3
%33
5.1
$
-3
.6%
-$
n/a
93.0
$
5.
6%67
8.5
$
5.6%
-$
n/a
-$
n/a
-$
n/a
-$
n/a
1,33
3.9
$
1.4%
1988
260.
1$
14.4
%35
2.6
$
5.
2%-
$
n/
a10
5.9
$
13.9
%60
0.6
$
-11.
5%16
.3$
n/a
-$
n/a
-$
n/a
-$
n/a
1,33
5.5
$
0.1%
1989
321.
9$
23.8
%36
9.6
$
4.
8%-
$
n/
a10
8.6
$
2.5%
607.
1$
1.
1%16
4.1
$
906.
7%-
$
n/
a-
$
n/
a-
$
n/
a1,
571.
3$
17
.7%
1990
341.
2$
6.0%
382.
5$
3.5%
-$
n/a
114.
1$
5.
1%58
8.7
$
-3.0
%14
3.7
$
-12.
4%-
$
n/
a-
$
n/
a-
$
n/
a1,
570.
2$
-0
.1%
1991
364.
6$
6.9%
368.
5$
-3.7
%-
$
n/
a10
9.0
$
-4.5
%60
1.0
$
2.1%
123.
4$
-1
4.1%
-$
n/a
-$
n/a
-$
n/a
1,56
6.5
$
-0.2
%19
9240
6.0
$
11
.4%
362.
0$
-1.8
%-
$
n/
a11
2.3
$
3.0%
633.
5$
5.
4%12
3.1
$
-0.2
%-
$
n/
a-
$
n/
a-
$
n/
a1,
636.
9$
4.
5%19
9349
3.2
$
21
.5%
350.
5$
-3.2
%-
$
n/
a11
2.3
$
0.0%
489.
9$
-2
2.7%
129.
9$
5.
5%-
$
n/
a-
$
n/
a0.
1$
n/
a1,
575.
9$
-3
.7%
1994
548.
7$
11.3
%34
4.5
$
-1
.7%
-$
n/a
109.
7$
-2
.3%
403.
0$
-1
7.7%
122.
7$
-5
.5%
-$
n/a
-$
n/a
-$
-100
.0%
1,52
8.6
$
-3.0
%19
9563
0.7
$
14
.9%
358.
4$
4.0%
-$
n/a
123.
7$
12
.8%
386.
6$
-4
.1%
130.
1$
6.
0%-
$
n/
a-
$
n/
a-
$
n/
a1,
629.
5$
6.
6%19
9664
6.7
$
2.
5%35
7.5
$
-0
.3%
-$
n/a
140.
3$
13
.4%
363.
4$
-6
.0%
129.
4$
-0
.5%
-$
n/a
-$
n/a
-$
n/a
1,63
7.3
$
0.5%
1997
636.
2$
-1.6
%34
0.7
$
-4
.7%
-$
n/a
139.
8$
-0
.4%
295.
3$
-1
8.7%
118.
8$
-8
.2%
-$
n/a
-$
n/a
92.4
$
n/
a1,
623.
2$
-0
.9%
1998
618.
3$
-2.8
%34
4.7
$
1.
2%-
$
n/
a14
5.3
$
3.9%
263.
0$
-1
0.9%
111.
8$
-5
.9%
-$
n/a
-$
n/a
93.8
$
1.
5%1,
576.
9$
-2
.9%
1999
570.
1$
-7.8
%33
5.3
$
-2
.7%
-$
n/a
144.
5$
-0
.6%
168.
8$
-3
5.8%
113.
7$
1.
7%-
$
n/
a-
$
n/
a19
3.5
$
106.
3%1,
525.
9$
-3
.2%
2000
541.
5$
-5.0
%34
1.4
$
1.
8%-
$
n/
a15
4.4
$
6.9%
146.
3$
-1
3.4%
101.
0$
-1
1.2%
-$
n/a
-$
n/a
219.
3$
13
.3%
1,50
3.9
$
-1.4
%20
0158
6.1
$
8.
2%32
6.6
$
-4
.3%
-$
n/a
151.
3$
-2
.0%
143.
5$
-1
.9%
88.3
$
-1
2.5%
-$
n/a
-$
n/a
153.
9$
-2
9.8%
1,44
9.8
$
-3.6
%20
0264
3.8
$
9.
8%32
7.9
$
0.
4%-
$
n/
a15
8.0
$
4.4%
134.
9$
-6
.0%
81.7
$
-7
.5%
-$
n/a
-$
n/a
243.
8$
58
.4%
1,59
0.0
$
9.7%
2003
697.
9$
8.4%
314.
1$
-4.2
%-
$
n/
a16
1.9
$
2.5%
121.
2$
-1
0.2%
78.0
$
-4
.5%
199.
7$
n/
a-
$
n/
a12
.9$
-94.
7%1,
585.
8$
-0
.3%
2004
780.
5$
11.8
%30
8.9
$
-1
.7%
-$
n/a
167.
2$
3.
2%11
7.4
$
-3.1
%99
.7$
27.8
%22
6.5
$
13.4
%-
$
n/
a9.
0$
-3
0.2%
1,70
9.2
$
7.8%
2005
907.
1$
16.2
%30
7.4
$
-0
.5%
-$
n/a
168.
4$
0.
7%13
1.6
$
12.1
%13
1.8
$
32.2
%19
2.6
$
-15.
0%-
$
n/
a4.
0$
-5
5.5%
1,84
2.9
$
7.8%
2006
976.
7$
7.7%
309.
2$
0.6%
-$
n/a
170.
1$
1.
0%12
5.3
$
-4.8
%12
6.2
$
-4.2
%24
3.8
$
26.6
%-
$
n/
a13
.4$
234.
7%1,
964.
8$
6.
6%20
071,
041.
6$
6.6%
308.
7$
-0.2
%14
.1$
n/a
170.
2$
0.
1%11
2.1
$
-10.
6%12
7.9
$
1.3%
195.
9$
-1
9.6%
-$
n/a
30.8
$
12
9.5%
2,00
1.3
$
1.9%
2008
1,09
4.0
$
5.
0%29
9.0
$
-3
.1%
15.9
$
12
.8%
167.
8$
-1
.4%
112.
9$
0.
7%12
8.4
$
0.4%
221.
1$
12
.9%
-$
n/a
18.4
$
-4
0.3%
2,05
7.5
$
2.8%
2009
1,12
1.1
$
2.
5%29
7.7
$
-0
.4%
18.9
$
18
.9%
176.
9$
5.
4%12
2.7
$
8.7%
129.
0$
0.
4%20
4.6
$
-7.5
%-
$
n/
a7.
7$
-5
8.2%
2,07
8.6
$
1.0%
2010
1,17
3.9
$
4.
7%30
1.4
$
1.
3%20
.0$
5.8%
191.
0$
8.
0%11
3.5
$
-7.5
%12
0.7
$
-6.5
%22
3.8
$
9.4%
51.7
$
n/
a1.
5$
-7
9.9%
2,19
7.5
$
5.7%
2011
1,26
4.7
$
7.
7%29
0.6
$
-3
.6%
20.0
$
0.
0%19
1.0
$
0.0%
107.
6$
-5
.1%
119.
5$
-0
.9%
172.
0$
-2
3.1%
97.4
$
88
.3%
-$
n/a
2,26
2.9
$
3.0%
2012
1,62
2.6
$
28
.3%
277.
7$
-4.4
%10
.0$
-50.
0%19
3.6
$
1.4%
105.
3$
-2
.1%
131.
2$
9.
8%18
9.6
$
10.2
%14
6.3
$
50.2
%-
$
n/
a2,
676.
3$
18
.3%
2013
1,76
8.4
$
9.
0%26
1.5
$
-5
.9%
26.5
$
16
5.4%
198.
7$
2.
6%96
.6$
-8.3
%13
4.7
$
2.6%
109.
1$
-4
2.5%
237.
8$
62
.6%
8.2
$
n/a
2,84
1.3
$
6.2%
2014
1,75
7.4
$
-0
.6%
250.
6$
-4.2
%16
.5$
-37.
8%20
2.2
$
1.7%
114.
3$
18
.4%
134.
7$
0.
0%14
5.0
$
33.0
%16
3.3
$
-31.
3%18
.7$
n/a
2,80
2.7
$
-1.4
%20
151,
821.
6$
3.7%
263.
1$
5.0%
13.2
$
-1
9.9%
223.
9$
10
.7%
108.
8$
-4
.8%
151.
6$
12
.5%
120.
3$
-1
7.1%
133.
5$
-1
8.3%
5.5
$
n/a
2,84
1.4
$
1.4%
2016
1,81
1.8
$
-0
.5%
269.
2$
2.3%
5.4
$
-5
9.5%
219.
1$
-2
.1%
109.
7$
0.
8%13
7.3
$
-9.4
%99
.4$
-17.
4%20
8.0
$
55.8
%-
$
n/
a2,
859.
8$
0.
6%20
171,
871.
9$
3.3%
262.
3$
-2.5
%7.
8$
45.5
%22
9.1
$
4.5%
87.8
$
-1
9.9%
137.
3$
0.
0%98
.2$
-1.1
%15
1.6
$
-27.
1%-
$
n/
a2,
845.
9$
-0
.5%
2018
**1,
880.
5$
0.5%
278.
1$
6.0%
6.5
$
-1
6.8%
248.
8$
8.
6%93
.9$
6.9%
134.
5$
-2
.0%
125.
0$
27
.3%
161.
2$
6.
4%-
$
n/
a2,
928.
4$
2.
9%T
OT
AL
S30
,650
.1$
12
,007
.1$
17
4.8
$
5,37
8.8
$
9,82
0.1
$
3,72
3.4
$
2,
766.
6$
1,
350.
7$
1,48
6.7
$
67,3
58.1
$
*Tot
als
incl
ude
add
on g
ame
reve
nues
suc
h as
Fir
ebal
l, E
Z M
atch
, M
egap
lier,
and
Pow
er P
lay
** P
relim
inar
y, u
naud
ited
dat
aSO
UR
CE
: IL
LIN
OIS
LO
TT
ER
Y
TABL
E 21
: LO
TTER
Y SA
LES
BY G
AME
FY
1975
- FY
201
8($
Mill
ions
)In
stan
t Gam
esPi
ck 3
*Ra
ffles
Pick
4*
Lott
oLu
cky
Day
Lot
to
Meg
a M
illio
ns*
Pow
erba
ll*O
ther
Gam
esTo
tal S
ales
PRIV
ATE
MAN
AGER
TAK
ES O
VER
CON
TRO
L O
F LO
TTER
Y O
PERA
TIO
NS
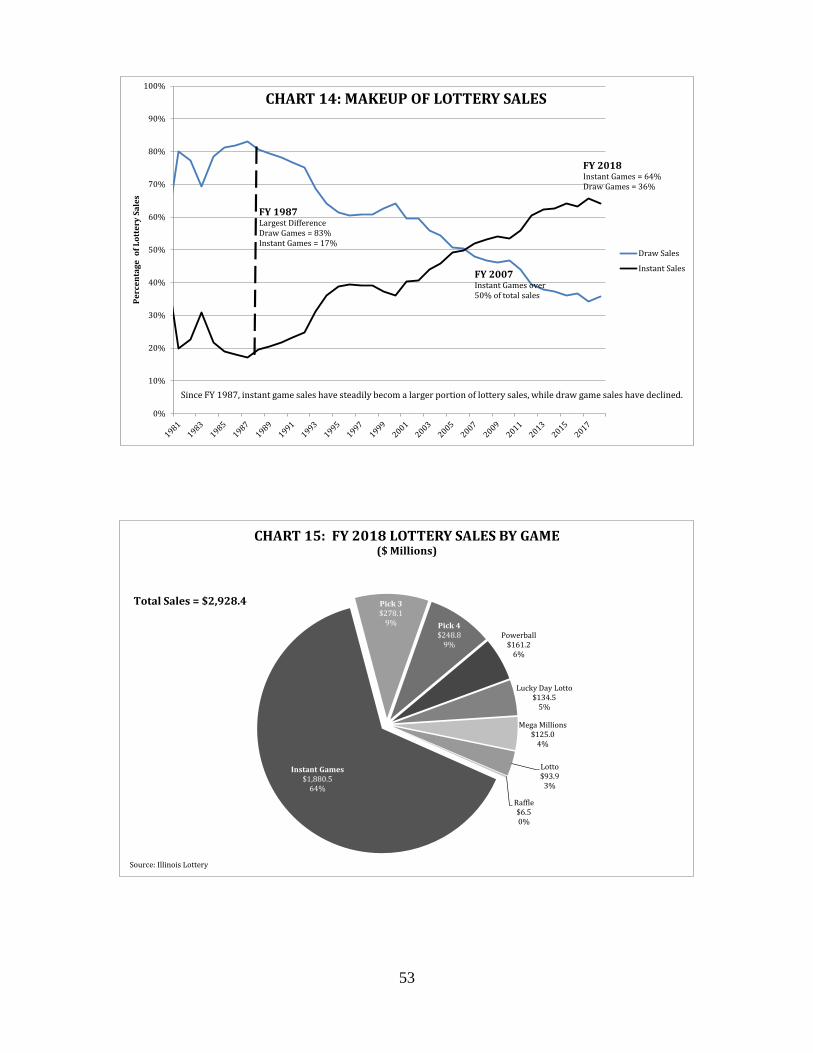
53
0%
10%
20%
30%
40%
50%
60%
70%
80%
90%
100%
Perc
enta
ge o
f Lot
tery
Sal
es
CHART 14: MAKEUP OF LOTTERY SALES
Draw Sales
Instant Sales
FY 1987Largest DifferenceDraw Games = 83%Instant Games = 17%
FY 2007Instant Games over 50% of total sales
FY 2018Instant Games = 64%Draw Games = 36%
Since FY 1987, instant game sales have steadily becom a larger portion of lottery sales, while draw game sales have declined.
Instant Games$1,880.5
64%
Pick 3$278.1
9% Pick 4$248.8
9%Powerball
$161.26%
Lucky Day Lotto$134.5
5%
Mega Millions$125.0
4%
Lotto$93.9
3%
Raffle$6.50%
CHART 15: FY 2018 LOTTERY SALES BY GAME ($ Millions)
Total Sales = $2,928.4
Source: Illinois Lottery

54
Lottery Revenue Distribution Due to the time necessary to prepare financial statements, analyzing how the lottery distributes the cash flow from its operating activities must be done based on the previous year’s financial statements. In FY 2017, an amount of $2.97 billion was distributed out for operating expenses and fund transfers. The fund transfers are basically the net proceeds or profits of the lottery after operating expenses are paid. Cash payments for lottery operating expenses accounted for $2.23 billion of the distributions. This largest cash payment for operating expenses went to Prizes Awarded to Winners which totaled $1.83 billion. General and Administrative expenses were $243.4 million. General and Administrative expenses were much higher than in previous years as this fiscal year’s expenses included a $97.5 million payment to the Northstar Group for reimbursement of previous operating expenses. Commissions and Bonuses rounded out the operating expenses at $160.0 million in FY 2017. Cash transfers out to other funds are responsible for the remaining $738.2 million in distributions. The Common School Fund received the lion’s share of these transfers at $720.3 million. Transfers to the Capital Projects Fund totaled $15 million after receiving no money in FY 2016. The remaining $3.3 million went to funds that support special causes. Chart 16 illustrates the cash distributions for FY 2017. Table 22, on the next page, shows how the Lottery’s distributions have changed in recent years.
Prizes Awarded to Winners$1,826.9
62%
Transfers to Common School Fund
$720.3 24%
General and Administrative Expenses
$243.4 8%
Commissions and Bonuses$160.0
5%
Transfers to Capital Projects Fund, $15.0 , 1%
Transfers to Special Funds, $2.9 , 0%
CHART 16: FY 2017 LOTTERY DISTRIBUTIONS($ Millions)
SOURCE: Illinois Auditor General
Total Distributions = $2,968.5

55
Lottery Transfers As mentioned previously and shown in Table 22, the Illinois Lottery transfers its proceeds or profits to three destinations. The first fund that receives lottery proceeds is the Common School Fund. The Common School Fund provides the majority of funding for elementary and secondary education including payment for General State Aid, contributions to Teacher’s Retirement Systems, and salaries of regional superintendents and assistants. Due to Public Act 96-0034, transfers to the Common School Fund from the lottery were capped at the rate of inflation as measured by the Consumer Price Index (CPI). Transfers to the Common School Fund were basically flat in FY 2018. In FY 2018, $718.8 million was transferred into the Common School Fund. This was down $1.5 million, or -0.2%. This is somewhat misleading though, as $14.5 million of FY 2016 money slipped into FY 2017 due to the time necessary to process the transfer from the Lottery to the Office of the Comptroller during the last weekly transfer in FY 2016. Accounting for the additional $14.5 million in FY 2017, FY 2018’s results would have been up 1.8% which would have been in line with recent growth of the CPI. The second destination for Lottery profits are a set of five special cause funds. Special cause lottery sales grew to $3.6 million in FY 2018. This was an increase of almost 23% over FY 2017’s results of $2.9 million. Special cause sales peaked in FY 2009 when they totaled $5.2 million. As part of PA 94-0120, the Ticket for the Cure special instant scratch-off game was created. The proceeds from this game are sent to the Ticket for the Cure Fund which is for cancer research grants. FY 2018 sales for this game were up almost 20% to $0.6 million. While FY 2018 was a good year, transfers to the Ticket for the Cure Fund have declined nine of the last twelve years.
Fiscal Year
$$
Change%
Change $ $ Change%
Change $$
Change%
Change $$
Change%
Change $ $ Change%
Change $$
Change%
Change $$
Change%
Change2007 1,108.3$ n/a n/a 622.6$ n/a n/a 140.9$ n/a n/a -$ n/a n/a 59.5$ n/a n/a 4.1$ n/a n/a 1,935.3$ n/a2008 1,166.0$ 57.7$ 5.2% 657.0$ 34.4$ 5.5% 145.0$ 4.1$ 2.9% -$ -$ n/a 57.4$ (2.1)$ -3.5% 4.6$ 0.5$ 12.2% 2,030.0$ 94.7$ 4.9%2009 1,225.9$ 59.9$ 5.1% 625.0$ (32.0)$ -4.9% 152.6$ 7.6$ 5.2% -$ -$ n/a 65.3$ 7.8$ 13.6% 5.2$ 0.6$ 12.4% 2,073.9$ 43.9$ 2.2%2010 1,271.5$ 45.6$ 3.7% 625.0$ -$ 0.0% 149.3$ (3.3)$ -2.1% -$ -$ n/a 66.3$ 1.0$ 1.6% 4.2$ (0.9)$ -17.8% 2,116.3$ 42.5$ 2.0%2011 1,298.9$ 27.4$ 2.2% 631.9$ 6.9$ 1.1% 153.0$ 3.7$ 2.5% 87.0$ * 87.0$ n/a 74.7$ 8.4$ 12.6% 4.1$ (0.1)$ -3.4% 2,249.6$ 133.3$ 6.3%
2012 1,561.2$ 262.3$ 20.2% 639.9$ 8.0$ 1.3% 151.5$ (1.6)$ -1.0% 65.2$ (21.8)$ -25.1% 123.5$ 48.9$ 65.4% 3.2$ (0.9)$ -21.9% 2,544.5$ 294.8$ 13.1%2013 1,728.3$ 167.1$ 10.7% 655.6$ 15.7$ 2.5% 164.0$ 12.5$ 8.3% 135.0$ 69.8$ 107.1% 149.6$ 26.1$ 21.1% 2.9$ (0.3)$ -8.7% 2,835.4$ 291.0$ 11.4%2014 1,699.6$ (28.7)$ -1.7% 668.1$ 12.5$ 1.9% 159.1$ (4.9)$ -3.0% 145.0$ 10.0$ 7.4% 148.5$ (1.1)$ -0.7% 2.3$ (0.7)$ -22.8% 2,822.6$ (12.8)$ -0.5%2015 1,743.0$ 43.3$ 2.6% 678.6$ 10.4$ 1.6% 161.6$ 2.5$ 1.6% 8.0$ (137.0)$ -94.5% 109.7$ (38.8)$ -26.1% 3.6$ 1.3$ 58.0% 2,704.4$ (118.2)$ -4.2%2016 1,969.1$ 226.1$ 13.0% 676.9$ (1.6)$ -0.2% 160.9$ (0.7)$ -0.4% -$ (8.0)$ -100.0% 101.4$ (8.3)$ -7.6% 3.3$ (0.3)$ -8.0% 2,911.6$ 207.2$ 7.7%2017 1,826.9$ (142.2)$ -7.2% 720.3$ **** 43.4$ 6.4% 160.0$ (0.9)$ -0.5% 15.0$ 15.0$ n/a 243.4$ 142.0$ 140.1% 2.9$ (0.4)$ -10.9% 2,968.5$ 57.0$ 2.0%
2018** n/a n/a n/a 718.8$ 41.9$ 6.2% n/a n/a n/a 9.3$ 9.3$ -37.8% n/a n/a n/a 3.6$ 0.3$ 9.4% n/a n/a n/a
SOURCE: ILLINOIS LOTTERY
*** $14.5 million that was from operations in FY 2016 was recorded in FY 2017 due to the time necessary to transfer the funds from the Lottery to the Comptroller's office.
Prizes Awarded to Winners Transfers to Common School Fund Commissions and Bonuses
Transfers to Capital Projects Fund
General and Administrative Expenses
Transfers to Special Causes Total
* $32.9 million that was supposed to be transferred to the Capital Projects Fund in FY 2010 was not actually transferred until the beginning of FY 2011 due to issues with the transfer legislation.
PRIVATE MANAGER TAKES OVER CONTROL OF LOTTERY OPERATIONS
** Complete financial data for FY 2018 is not available at the time of printing of this report
Current special cause game proceeds go to cancer research, vetaran's related issues, multiple sclerosis research, special olympics, and HIV prevention and education.
TABLE 22: LOTTERY DISTRIBUTIONS FY 2007 - FY 2018
($ Millions)
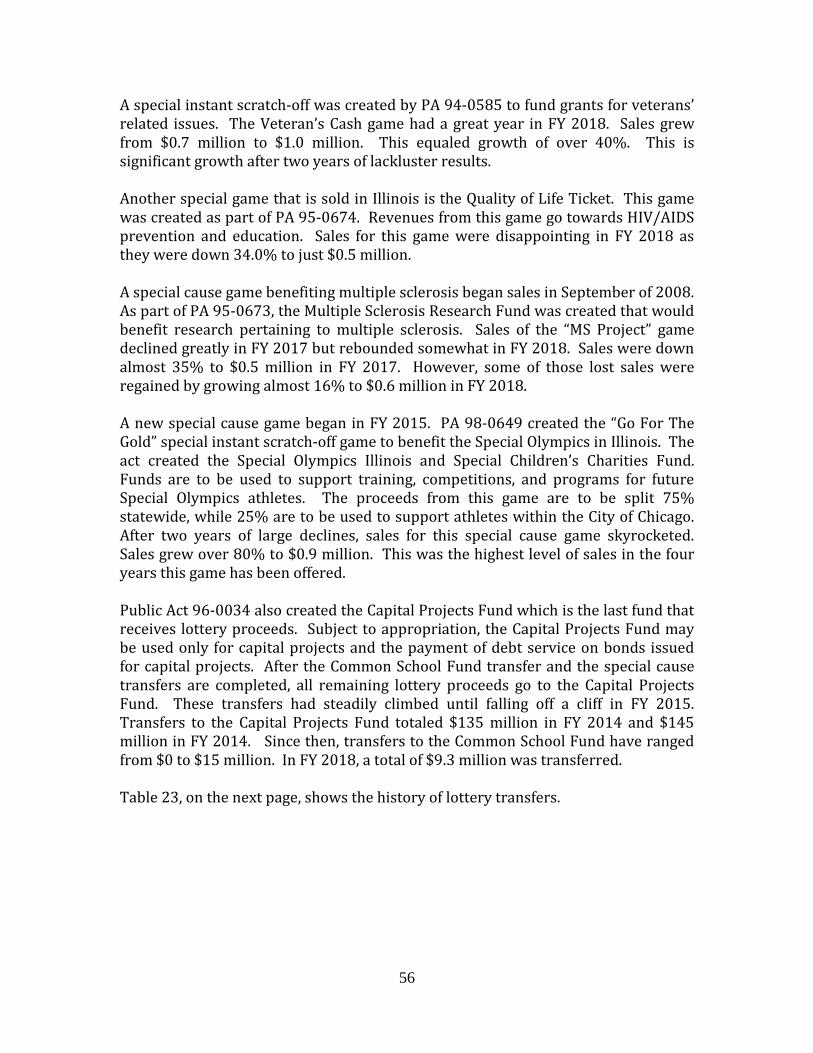
56
A special instant scratch-off was created by PA 94-0585 to fund grants for veterans’ related issues. The Veteran’s Cash game had a great year in FY 2018. Sales grew from $0.7 million to $1.0 million. This equaled growth of over 40%. This is significant growth after two years of lackluster results. Another special game that is sold in Illinois is the Quality of Life Ticket. This game was created as part of PA 95-0674. Revenues from this game go towards HIV/AIDS prevention and education. Sales for this game were disappointing in FY 2018 as they were down 34.0% to just $0.5 million. A special cause game benefiting multiple sclerosis began sales in September of 2008. As part of PA 95-0673, the Multiple Sclerosis Research Fund was created that would benefit research pertaining to multiple sclerosis. Sales of the “MS Project” game declined greatly in FY 2017 but rebounded somewhat in FY 2018. Sales were down almost 35% to $0.5 million in FY 2017. However, some of those lost sales were regained by growing almost 16% to $0.6 million in FY 2018. A new special cause game began in FY 2015. PA 98-0649 created the “Go For The Gold” special instant scratch-off game to benefit the Special Olympics in Illinois. The act created the Special Olympics Illinois and Special Children’s Charities Fund. Funds are to be used to support training, competitions, and programs for future Special Olympics athletes. The proceeds from this game are to be split 75% statewide, while 25% are to be used to support athletes within the City of Chicago. After two years of large declines, sales for this special cause game skyrocketed. Sales grew over 80% to $0.9 million. This was the highest level of sales in the four years this game has been offered. Public Act 96-0034 also created the Capital Projects Fund which is the last fund that receives lottery proceeds. Subject to appropriation, the Capital Projects Fund may be used only for capital projects and the payment of debt service on bonds issued for capital projects. After the Common School Fund transfer and the special cause transfers are completed, all remaining lottery proceeds go to the Capital Projects Fund. These transfers had steadily climbed until falling off a cliff in FY 2015. Transfers to the Capital Projects Fund totaled $135 million in FY 2014 and $145 million in FY 2014. Since then, transfers to the Common School Fund have ranged from $0 to $15 million. In FY 2018, a total of $9.3 million was transferred. Table 23, on the next page, shows the history of lottery transfers.

57
Fiscal Year Total Sales
Transfers to General Revenue Fund
Transfers to Common School Fund
Transfers to Capital Projects Fund
Transfers to Special Causes
Transfer to Other Funds
Total Transfers
Transfers as a % of Total Sales
1975 129.3$ 54.5$ -$ -$ -$ -$ 54.5$ 42.1%1976 163.9$ 78.5$ -$ -$ -$ -$ 78.5$ 47.9%1977 112.9$ 47.1$ -$ -$ -$ -$ 47.1$ 41.8%1978 89.1$ 32.7$ -$ -$ -$ -$ 32.7$ 36.6%1979 76.7$ 32.6$ -$ -$ -$ -$ 32.6$ 42.4%1980 97.5$ 32.2$ -$ -$ -$ -$ 32.2$ 33.0%1981 214.7$ 68.8$ -$ -$ -$ 20.0$ 88.8$ 41.4%1982 344.1$ 137.6$ -$ -$ -$ -$ 137.6$ 40.0%1983 514.8$ 215.0$ -$ -$ -$ 0.8$ 215.8$ 41.9%1984 912.2$ 358.1$ -$ -$ -$ 0.3$ 358.4$ 39.3%1985 1,235.6$ 506.2$ -$ -$ -$ -$ 506.2$ 41.0%1986 1,315.6$ 86.8$ 465.0$ -$ -$ -$ 551.8$ 41.9%1987 1,333.9$ -$ 553.1$ -$ -$ -$ 553.1$ 41.5%1988 1,335.5$ -$ 524.4$ -$ -$ -$ 524.4$ 39.3%1989 1,571.3$ -$ 586.1$ -$ -$ -$ 586.1$ 37.3%1990 1,570.2$ -$ 594.0$ -$ -$ -$ 594.0$ 37.8%1991 1,566.5$ -$ 580.0$ -$ -$ -$ 580.0$ 37.0%1992 1,636.9$ -$ 610.0$ -$ -$ -$ 610.0$ 37.3%1993 1,575.9$ -$ 587.4$ -$ -$ -$ 587.4$ 37.3%1994 1,528.6$ -$ 552.1$ -$ -$ -$ 552.1$ 36.1%1995 1,629.5$ -$ 588.3$ -$ -$ -$ 588.3$ 36.1%1996 1,637.3$ -$ 594.1$ -$ -$ -$ 594.1$ 36.3%1997 1,623.2$ -$ 590.2$ -$ -$ -$ 590.2$ 36.4%1998 1,576.9$ -$ 560.0$ -$ -$ -$ 560.0$ 35.5%1999 1,525.9$ -$ 540.0$ -$ -$ -$ 540.0$ 35.4%2000 1,503.9$ -$ 515.3$ -$ -$ -$ 515.3$ 34.3%2001 1,449.8$ -$ 501.0$ -$ -$ -$ 501.0$ 34.6%2002 1,590.0$ -$ 555.1$ -$ -$ -$ 555.1$ 34.9%2003 1,585.8$ -$ 540.3$ -$ -$ -$ 540.3$ 34.1%2004 1,709.2$ -$ 570.1$ -$ -$ -$ 570.1$ 33.4%2005 1,842.9$ -$ 614.0$ -$ -$ -$ 614.0$ 33.3%2006 1,964.8$ -$ 670.5$ -$ 3.7$ -$ 674.2$ 34.3%2007 2,001.3$ -$ 622.4$ -$ 4.1$ -$ 626.5$ 31.3%2008 2,057.5$ -$ 657.0$ -$ 4.6$ -$ 661.6$ 32.2%2009 2,078.6$ -$ 625.0$ -$ 5.2$ -$ 630.2$ 30.3%2010 2,197.5$ -$ 625.0$ -$ 4.2$ -$ 629.2$ 28.6%2011 2,262.9$ -$ 631.9$ 87.0$ 4.1$ -$ 723.0$ 31.9%
2012 2,676.3$ -$ 639.9$ 65.2$ 3.2$ -$ 708.3$ 26.5%2013 2,841.3$ -$ 655.6$ 135.0$ 2.9$ -$ 793.5$ 27.9%2014 2,802.7$ -$ 668.1$ 145.0$ 2.3$ -$ 815.4$ 29.1%2015 2,859.8$ -$ 678.6$ 8.0$ 3.6$ -$ 690.1$ 24.1%2016 2,859.8$ -$ 676.9$ -$ 3.3$ 680.2$ 23.8%2017 2,845.9$ -$ 720.3$ 15.0$ 2.9$ -$ 738.2$ 25.9%2018* 2,928.4$ -$ 718.8$ 9.3$ 3.6$ -$ 731.7$ 25.0%
TOTALS 67,376.4$ 1,649.8$ 19,810.4$ 464.5$ 47.6$ 21.2$ 21,993.5$ 32.6%* Preliminary, unaudited data
SOURCE: ILLINOIS LOTTERY, OFFICE OF THE COMPTROLLER
PRIVATE MANAGER TAKES OVER CONTROL OF LOTTERY OPERATIONS
Due to the timing of the last weekly lottery transfer to the Common School Fund in FY 2016, $14.5 million was actually received by the Comptroller in FY 2017. A similar situation occurred with $32.9 million in transfers to the Capital Projects Fund in FY 2010. We will record these transfers as they were received by the Comptroller but note the larger amounts in the year receiving the transfers are due to transfer timing and not to underlying activity.
TABLE 23: LOTTERY TRANSFERS FY 1975 - FY 2018
($ Millions)

58
Multi-State Games While most of the games issued by the lottery are just for players purchasing a ticket in Illinois, the Mega Millions and Powerball games are multi-state games that offer jackpots starting at $40 million. In May of 2002, Illinois, along with the other Big Game states (Georgia, Maryland, Massachusetts, Michigan, New Jersey, and Virginia), joined the States of New York and Ohio to create the Mega Millions game. Washington (September 2002), Texas (December 2003), California (June 2005), and Louisiana (November 2011) joined Mega Millions in the following years. In October of 2009, an agreement was reached between states offering Mega Millions and states offering Powerball to allow for sales of both games within a state. The hope was, with more states joining the program, more and more people will be playing, allowing jackpots to roll to even higher levels at a faster rate. Illinois began offering Powerball on January 31, 2010. As of August 2018, forty-four states plus the District of Columbia and the U.S. Virgin Islands offer Mega Millions tickets. Powerball tickets are sold in the same locales plus Puerto Rico. Table 24 lists the States participating in each of the multi-state lotteries and the years they began offering each of the games. Mega Millions has drawings on Tuesdays and Fridays. Powerball conducts their drawings on Wednesdays and Saturdays. Mega Millions and Powerball each cost $2 per ticket. Mega Millions had been $1 per ticket but beginning in October 2017, the price rose to $2 to match the Powerball. In addition to the change in price, the beginning jackpot for Mega Millions rose to $40 million from $15 million and the odds of winning the jackpot increased. Results for FY 2018 started out with a headwind against them. Due to the lack of a budget, the State was excluded from the first drawings of each game to start the fiscal year. The Lottery estimated lost sales of approximately $1.5 million for Mega Millions and $2.4 million for Powerball. Despite this initial setback, both games grew in FY 2018. Mega Millions had its best sales since FY 2014. Mega Millions was up over 27% to $125 million, Powerball was up 6.4% to $161.2 million. Together the multi-state games were up $36.4 million which was 14.6% growth. Table 25 on page 60 shows the growth in sales, along with the growth in higher jackpots. In FY 2018, the two games had record levels of high-level jackpots. The two games saw 126 drawings over $100 million and 64 drawings over $200 million. The growth in high-level jackpots is likely due to the higher odds of winning the jackpot with the introduction of new game rules which causes more rollovers. In recent years both games (Powerball 2015, Mega Millions 2017) changed their rules which lowered the chances of winning the jackpot but increased the chances of winning lesser prizes.

59
State MEGA MILLIONS POWERBALLARIZONA 2010 1994ARKANSAS 2010 2009CALIFORNIA 2005 2013COLORADO 2010 2001CONNECTICUT 2010 1995DELAWARE 2010 1991DISTRICT OF COLUMBIA 2010 1988FLORIDA 2013 2009GEORGIA 1996 2010IDAHO 2010 1990ILLINOIS 1996 2010INDIANA 2010 1990IOWA 2010 1988KANSAS 2010 1988KENTUCKY 2010 1991LOUISIANA 2011 1995MAINE 2010 2004MARYLAND 1996 2010MASSACHUSETTES 1996 2010MICHIGAN 1996 2010MINNESOTA 2010 1990MISSOURI 2010 1988MONTANA 2010 1989NEBRASKA 2010 1994NEW HAMPSHIRE 2010 1995NEW JERSEY 1999 2010NEW MEXICO 2010 1996NEW YORK 2002 2010NORTH CAROLINA 2010 2006NORTH DAKOTA 2010 2004OHIO 2002 2010OKLAHOMA 2010 2006OREGON 2010 1988PENNSYLVANIA 2010 2002PUERTO RICO N/A 2014RHODE ISLAND 2010 1988SOUTH CAROLINA 2010 2002SOUTH DAKOTA 2010 1990TENNESSEE 2010 2004TEXAS 2003 2010U.S. VIRGIN ISLANDS 2010 2002VERMONT 2010 2003VIRGINIA 1996 2010WASHINGTON 2002 2010WEST VIRGINIA 2010 1988WISCONSIN 2010 1989Wyoming 2014 2014
SOURCES: POWERBALL, MEGA MILLIONS
TABLE 24: MULTI-STATE LOTTERY PARTICIPANTS

60
FY 2
009
FY 2
010
FY 2
011
FY 2
012
FY 2
013
FY 2
014
FY 2
015
FY 2
016
FY 2
017
FY 2
018
Aver
age
Jack
pot D
raw
ing
$57.
7$7
3.5
$64.
8$8
0.2
$51.
3$9
8.0
$93.
8$1
01.7
$77.
7$1
46.6
Draw
ings
ove
r $10
0 M
1930
2019
935
4042
2855
Draw
ings
ove
r $20
0 M
36
66
013
1212
330
Meg
a M
illio
ns S
ales
$204
.6$2
22.6
$172
.0$1
89.6
$109
.1$1
45.0
$120
.3$9
9.4
$98.
2$1
25.0
% C
hang
e-7
.5%
8.8%
-22.
7%10
.2%
-42.
5%33
.0%
-17.
1%-1
7.4%
-1.1
%27
.3%
FY 2
009
FY 2
010
FY 2
011
FY 2
012
FY 2
013
FY 2
014
FY 2
015
FY 2
016
FY 2
017
FY 2
018
Aver
age
Jack
pot D
raw
ing
$67.
8$8
2.3
$62.
4$8
5.2
$120
.0$1
17.3
$105
.2$1
59.6
$165
.7$1
75.7
Draw
ings
ove
r $10
0 M
2332
1733
4844
4162
6571
Draw
ings
ove
r $20
0 M
27
28
1615
925
3434
Pow
erba
ll Sa
les
$0.0
$51.
7*$9
7.4
$146
.3**
$237
.8$1
63.3
$133
.5$2
08.0
$151
.6$1
61.2
% C
hang
en/
an/
a88
.3%
$0.5
062
.6%
-31.
3%-1
8.3%
55.8
%-2
7.1%
6.4%
FY 2
009
FY 2
010
FY 2
011
FY 2
012
FY 2
013
FY 2
014
FY 2
015
FY 2
016
FY 2
017
FY 2
018
Aver
age
Jack
pot D
raw
ing
$62.
8$7
7.9
$63.
6$8
2.7
$85.
6$1
07.6
$99.
5$1
30.7
$121
.7$1
61.2
Draw
ings
ove
r $10
0 M
4262
3752
5779
8110
493
126
Draw
ings
ove
r $20
0 M
513
814
1628
2137
3764
Tota
l Mul
ti S
tate
Gam
e Sa
les
$204
.6$2
74.3
$269
.4$3
35.9
$346
.8$3
08.3
$253
.7$3
07.4
$249
.8$2
86.2
% C
hang
e-7
.5%
34.1
%-1
.8%
24.7
%3.
3%-1
1.1%
-17.
7%21
.1%
-18.
7%14
.6%
SOUR
CE: w
ww
.lott
orep
ort.c
om
($ M
illio
n)
** P
ower
ball
pric
e in
crea
ses f
rom
$1
to $
2 pe
r tic
ket a
nd b
egin
ning
jack
pot r
ises
to $
40 m
illio
n in
Janu
ary
of 2
012
POW
ERBA
LL
MEG
A M
ILLI
ON
S
* 5 m
onth
s of s
ales
MEG
A M
ILLI
ON
S AN
D P
OW
ERBA
LL
TABL
E 25
: MU
LTI S
TATE
GAM
E RE
SULT
S

61
U.S. Lottery Results Based on data from the North American Association of State and Provincial Lotteries, in FY 2017, Illinois had the 11th largest lottery in the U.S. based on total traditional lottery sales. Traditional lottery sales include instant and draw games but exclude electric gaming machines and table games. While Illinois has electric gaming machines and table games, they are under the purview of the Illinois Gaming Board, and as such, will not be included in this analysis of the Lottery. As one would expect the bigger states tended to have the largest amount of lottery sales. New York had the most sales at $7.7 billion, while California was second at $6.2 billion. Massachusetts surprisingly came in fourth at $5.1 billion; however, this can be explained by the offering of Keno. Massachusetts is one of just sixteen lotteries that allows for Keno. In FY 2017, they had sales of $915 million in Keno alone. In FY 2017, Illinois had sales per capita of $222 which was ranked 20th of the 45 lotteries studied. Massachusetts had the highest levels of lottery sales at $741 per person. This was followed by Georgia at $434 and New York at $387. In FY 2018, Illinois’ sales per capita increased to $228. This equaled growth of 2.9%. As can be seen in Chart 17, Illinois lottery sales on a per person basis have been just over $220 per person per year since FY 2013. Officials are hopeful that FY 2018’s results are an indicator of growth in this area. Analyzing last year’s lottery sales on a percentage of per-capita personal income basis placed Illinois near the middle of U.S. lotteries. Illinois residents averaged spending approximately 0.42% of their personal income on the lottery. This level of spending ranked Illinois 20th. These spending levels are somewhat down compared to past years. In FY 2015, people in Illinois spent approximately 0.45% of their personal income on lottery and this level fell to 0.42% in FY 2016. The highest levels of spending on lottery sales based on personal income are seen in Massachusetts (1.12%), Georgia (1.00%), and South Carolina (0.81%). One other way to compare the various lotteries in the U.S. is the number of people in the State compared to the number of lottery sales locations. Chart 18 shows these results for FY 2016 which is the latest data available. Illinois had 1,669 people per lottery retailer during FY 2016. This ranked 39th out of the 45 U.S. lotteries analyzed. Rhode Island and Massachusetts had the least amount of people per retailer at 814 and 869. The U.S. average was 1,412 people per lottery retailer. This was down from 1,420 people in FY 2015. Lottery games are currently available at 7,384 retail locations in Illinois. This is down from 7,542 retailers at this time last year and 7,705 retail locations in August of 2016. To equal the 2016 U.S. average, Illinois would have to get to 9,066 retailers which would be an increase of 1,682 retailers. This would mean an increase of almost 23% in total retailers over the current level.
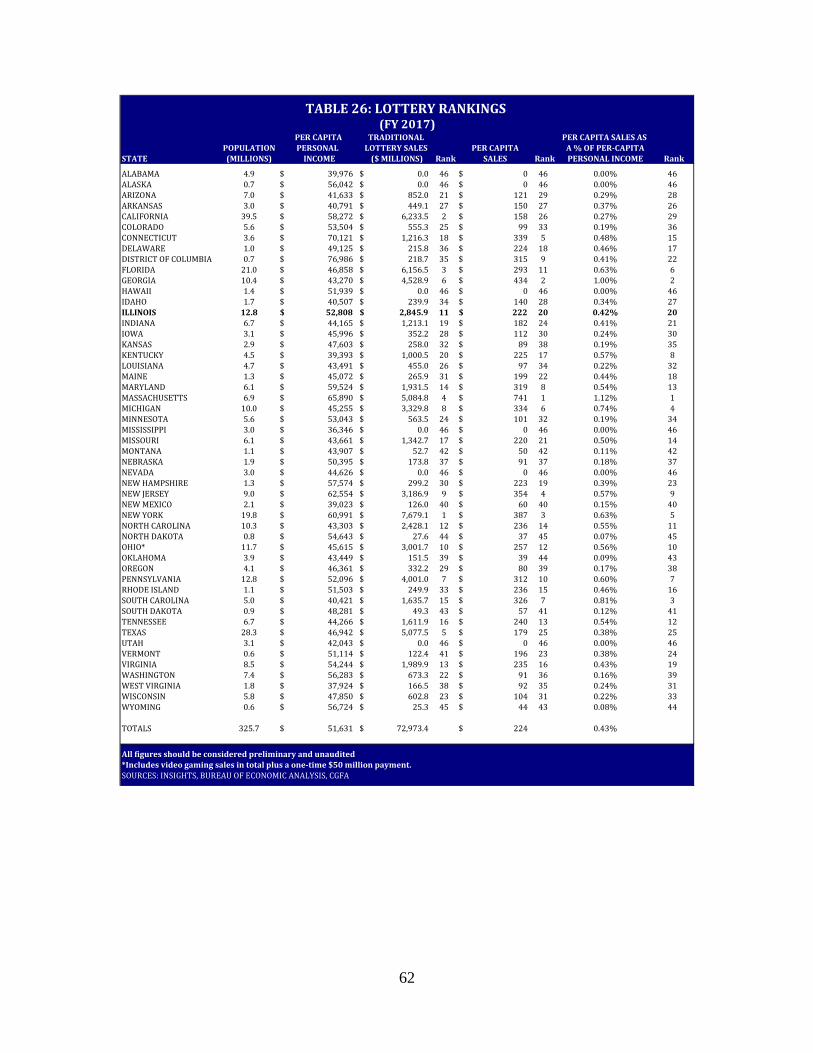
62
PER CAPITA SALES AS POPULATION A % OF PER-CAPITA
STATE (MILLIONS) Rank Rank PERSONAL INCOME Rank
ALABAMA 4.9 $ 39,976 $ 0.0 46 $ 0 46 0.00% 46ALASKA 0.7 $ 56,042 $ 0.0 46 $ 0 46 0.00% 46ARIZONA 7.0 $ 41,633 $ 852.0 21 $ 121 29 0.29% 28ARKANSAS 3.0 $ 40,791 $ 449.1 27 $ 150 27 0.37% 26CALIFORNIA 39.5 $ 58,272 $ 6,233.5 2 $ 158 26 0.27% 29COLORADO 5.6 $ 53,504 $ 555.3 25 $ 99 33 0.19% 36CONNECTICUT 3.6 $ 70,121 $ 1,216.3 18 $ 339 5 0.48% 15DELAWARE 1.0 $ 49,125 $ 215.8 36 $ 224 18 0.46% 17DISTRICT OF COLUMBIA 0.7 $ 76,986 $ 218.7 35 $ 315 9 0.41% 22FLORIDA 21.0 $ 46,858 $ 6,156.5 3 $ 293 11 0.63% 6GEORGIA 10.4 $ 43,270 $ 4,528.9 6 $ 434 2 1.00% 2HAWAII 1.4 $ 51,939 $ 0.0 46 $ 0 46 0.00% 46IDAHO 1.7 $ 40,507 $ 239.9 34 $ 140 28 0.34% 27ILLINOIS 12.8 $ 52,808 $ 2,845.9 11 $ 222 20 0.42% 20INDIANA 6.7 $ 44,165 $ 1,213.1 19 $ 182 24 0.41% 21IOWA 3.1 $ 45,996 $ 352.2 28 $ 112 30 0.24% 30KANSAS 2.9 $ 47,603 $ 258.0 32 $ 89 38 0.19% 35KENTUCKY 4.5 $ 39,393 $ 1,000.5 20 $ 225 17 0.57% 8LOUISIANA 4.7 $ 43,491 $ 455.0 26 $ 97 34 0.22% 32MAINE 1.3 $ 45,072 $ 265.9 31 $ 199 22 0.44% 18MARYLAND 6.1 $ 59,524 $ 1,931.5 14 $ 319 8 0.54% 13MASSACHUSETTS 6.9 $ 65,890 $ 5,084.8 4 $ 741 1 1.12% 1MICHIGAN 10.0 $ 45,255 $ 3,329.8 8 $ 334 6 0.74% 4MINNESOTA 5.6 $ 53,043 $ 563.5 24 $ 101 32 0.19% 34MISSISSIPPI 3.0 $ 36,346 $ 0.0 46 $ 0 46 0.00% 46MISSOURI 6.1 $ 43,661 $ 1,342.7 17 $ 220 21 0.50% 14MONTANA 1.1 $ 43,907 $ 52.7 42 $ 50 42 0.11% 42NEBRASKA 1.9 $ 50,395 $ 173.8 37 $ 91 37 0.18% 37NEVADA 3.0 $ 44,626 $ 0.0 46 $ 0 46 0.00% 46NEW HAMPSHIRE 1.3 $ 57,574 $ 299.2 30 $ 223 19 0.39% 23NEW JERSEY 9.0 $ 62,554 $ 3,186.9 9 $ 354 4 0.57% 9NEW MEXICO 2.1 $ 39,023 $ 126.0 40 $ 60 40 0.15% 40NEW YORK 19.8 $ 60,991 $ 7,679.1 1 $ 387 3 0.63% 5NORTH CAROLINA 10.3 $ 43,303 $ 2,428.1 12 $ 236 14 0.55% 11NORTH DAKOTA 0.8 $ 54,643 $ 27.6 44 $ 37 45 0.07% 45OHIO* 11.7 $ 45,615 $ 3,001.7 10 $ 257 12 0.56% 10OKLAHOMA 3.9 $ 43,449 $ 151.5 39 $ 39 44 0.09% 43OREGON 4.1 $ 46,361 $ 332.2 29 $ 80 39 0.17% 38PENNSYLVANIA 12.8 $ 52,096 $ 4,001.0 7 $ 312 10 0.60% 7RHODE ISLAND 1.1 $ 51,503 $ 249.9 33 $ 236 15 0.46% 16SOUTH CAROLINA 5.0 $ 40,421 $ 1,635.7 15 $ 326 7 0.81% 3SOUTH DAKOTA 0.9 $ 48,281 $ 49.3 43 $ 57 41 0.12% 41TENNESSEE 6.7 $ 44,266 $ 1,611.9 16 $ 240 13 0.54% 12TEXAS 28.3 $ 46,942 $ 5,077.5 5 $ 179 25 0.38% 25UTAH 3.1 $ 42,043 $ 0.0 46 $ 0 46 0.00% 46VERMONT 0.6 $ 51,114 $ 122.4 41 $ 196 23 0.38% 24VIRGINIA 8.5 $ 54,244 $ 1,989.9 13 $ 235 16 0.43% 19WASHINGTON 7.4 $ 56,283 $ 673.3 22 $ 91 36 0.16% 39WEST VIRGINIA 1.8 $ 37,924 $ 166.5 38 $ 92 35 0.24% 31WISCONSIN 5.8 $ 47,850 $ 602.8 23 $ 104 31 0.22% 33WYOMING 0.6 $ 56,724 $ 25.3 45 $ 44 43 0.08% 44
TOTALS 325.7 $ 51,631 $ 72,973.4 $ 224 0.43%
All figures should be considered preliminary and unaudited*Includes video gaming sales in total plus a one-time $50 million payment.SOURCES: INSIGHTS, BUREAU OF ECONOMIC ANALYSIS, CGFA
TABLE 26: LOTTERY RANKINGS
PER CAPITAPERSONAL
INCOME
TRADITIONALLOTTERY SALES
($ MILLIONS)PER CAPITA
SALES
(FY 2017)
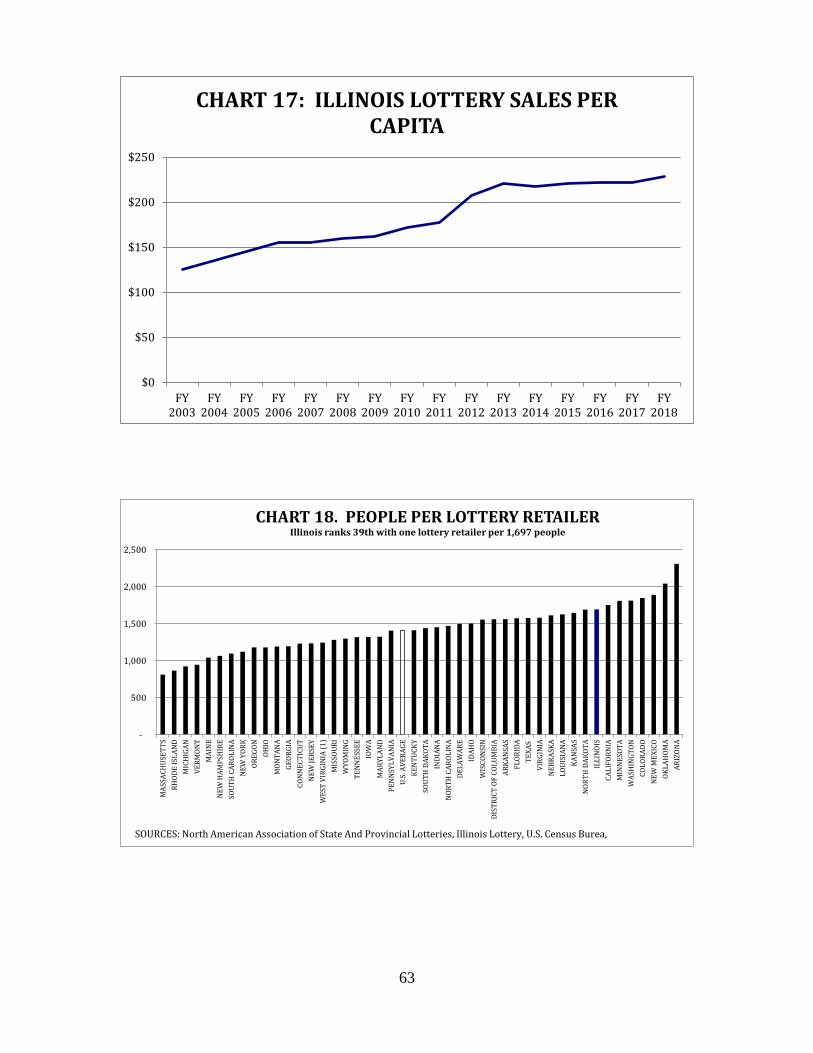
63
$0
$50
$100
$150
$200
$250
FY2003
FY2004
FY2005
FY2006
FY2007
FY2008
FY2009
FY2010
FY2011
FY2012
FY2013
FY2014
FY2015
FY2016
FY2017
FY2018
CHART 17: ILLINOIS LOTTERY SALES PER CAPITA
-
500
1,000
1,500
2,000
2,500
MAS
SACH
USET
TSRH
ODE
ISLA
ND
MIC
HIG
ANVE
RMON
TM
AIN
EN
EW H
AMPS
HIR
ESO
UTH
CAR
OLIN
AN
EW Y
ORK
OREG
ONOH
IOM
ONTA
NA
GEOR
GIA
CON
NEC
TICU
TN
EW JE
RSEY
WES
T VI
RGIN
IA (1
)M
ISSO
URI
WYO
MIN
GTE
NN
ESSE
EIO
WA
MAR
YLAN
DPE
NN
SYLV
ANIA
U.S.
AVE
RAGE
KEN
TUCK
YSO
UTH
DAK
OTA
INDI
ANA
NOR
TH C
AROL
INA
DELA
WAR
EID
AHO
WIS
CON
SIN
DIST
RICT
OF
COLU
MBI
AAR
KAN
SAS
FLOR
IDA
TEXA
SVI
RGIN
IAN
EBRA
SKA
LOUI
SIAN
AKA
NSA
SN
ORTH
DAK
OTA
ILLI
NOI
SCA
LIFO
RNIA
MIN
NES
OTA
WAS
HIN
GTON
COLO
RADO
NEW
MEX
ICO
OKLA
HOM
AAR
IZON
A
CHART 18. PEOPLE PER LOTTERY RETAILERIllinois ranks 39th with one lottery retailer per 1,697 people
SOURCES: North American Association of State And Provincial Lotteries, Illinois Lottery, U.S. Census Burea,

64
Private Manager On September 15, 2010, the State selected the Northstar Lottery Group to manage the Illinois lottery. As part of Public Act 96-0034, the Illinois lottery was to be operated with the assistance of a private manager. After an initial increase in sales and transfers, the results of the lottery under the management have disappointed in recent years. The State and the Northstar Lottery Group had a rocky relationship from the beginning of the private management agreement. The two had to go to arbitration several times to resolve numerous issues which were noted in detail in previous versions of this report. With this as the background, on August 15, 2014, the Office of the Governor announced that the State would seek to dissolve the private management agreement with the Northstar Group. During the fall of 2014 it was reported that the Office of the Governor and the Northstar Group had come to a settlement. The management agreement would be dissolved with the owners of the Northstar Lottery Group, GTECH and Scientific Games, being allowed to keep their vendor contracts under new private managers through 2018 in addition to an amount of $12.7 million for out-of-pocket costs but would drop all litigation with the State regarding accounting disputes. In January of 2015, Attorney General Lisa Madigan sent a letter to the Illinois Lottery formally disapproving the proposed termination agreement with Northstar. The Attorney General claimed standing to void the termination agreement due to representing the lottery in ongoing legal matters with Northstar. The letter identified eight reasons that she was voiding the agreement. Included among those reasons were that her office was not involved in the negotiation of the agreement, the proposed settlement could cost the State more fees and expenses, and the settlement indemnifies Northstar in excess of the Lottery’s statutory authority. The State and Northstar continued to work towards the dissolution of the private management agreement and on September 18, 2015, the State executed a Letter Agreement of Termination, which resolved certain outstanding disputes between Northstar and the Department of the Lottery. The Letter Agreement contained provisions regarding Northstar paying the Department for not meeting net income goals pursuant to the private management agreement, a retroactive supply agreement reduction, and Northstar’ s reimbursement of legal fees related disputes. Northstar also agreed to remain in charge of day-to-day operations of the lottery until a new private manager was hired based on optional 3-month to 6-month contracts. Based on the termination agreement being negotiated at the time, the Lottery recorded a receivable from Northstar on June 30, 2015, in the amount of $32.6 million. Of this amount, $10.0 million represented shortfall payments for not meeting net income goals. The remaining $22.6 million was comprised of $19.1 million for excess advances for expense reimbursements, $3.3 million for the retroactive supply agreement reduction, and $0.2 million for reimbursement of legal fees.
65
Another aspect of the termination agreement concerned the use of GTECH as its systems provider. Per the terms of the Letter Agreement of Termination, should the replacement private manager choose not to retain GTECH as its systems provider either as a sole provider or as part of a consortium, the State will be liable for compensating GTECH for the residual value of the remainder of the original supply agreement. Assuming the supply agreement was terminated by the replacement private manager on July 1, 2017, the amount payable would have been $55 million. This amount was to be prorated in the event the supply agreement is terminated on a different date. On July 28, 2016, the Department of the Lottery sent out a request for proposals (RFP) related to the hiring of a new private manager of the Lottery. The due date for these proposals was September 28, 2016. The expectation was that the new private manager would take over the day-to-day management of the lottery on January 1, 2017. Only one firm, Camelot, submitted a bid under the RFP. Camelot is known for running the U.K. National Lottery and was the second place bidder during the original lottery management process. The State was able to come to agreement with Camelot in October of 2017. A new firm called Camelot Illinois took over day-to-day management of the lottery on January 2, 2018. The new private management agreement with Camelot Illinois has several new features. The agreement is reported to include higher base fees, incentive pay at lower levels of sales, and no penalties for underperformance. Based on the new private management agreement, Camelot Illinois’ base management fees are set at 0.876% of the actual Operating Revenues for FY 2019 and a rate of 0.896% for the remaining fiscal years of the contract. The incentive pay is based on a schedule of minimum net income, middle net income, and upper net income targets. Camelot Illinois will receive 17% of any revenue above the minimum net income target, 22% of any net income above the middle target, and 27% of any net income above the upper target. For FY 2019, the minimum net income target is $731.3 million, the middle net income target is $750.0 million, and the upper net income target is $780.0 million. Incentive pay is capped at 5% of Net Income. The previous private management agreement had penalties for underperformance. This agreement does not appear to have these penalties, though Camelot Illinois is responsible for any cost overruns. For more information on the private management agreement, see http://www.illinoislottery.com/content/dam/ill/documents/Camelot_2017_Private_Management_Agreement.pdf.

66

67
HORSE RACING

68
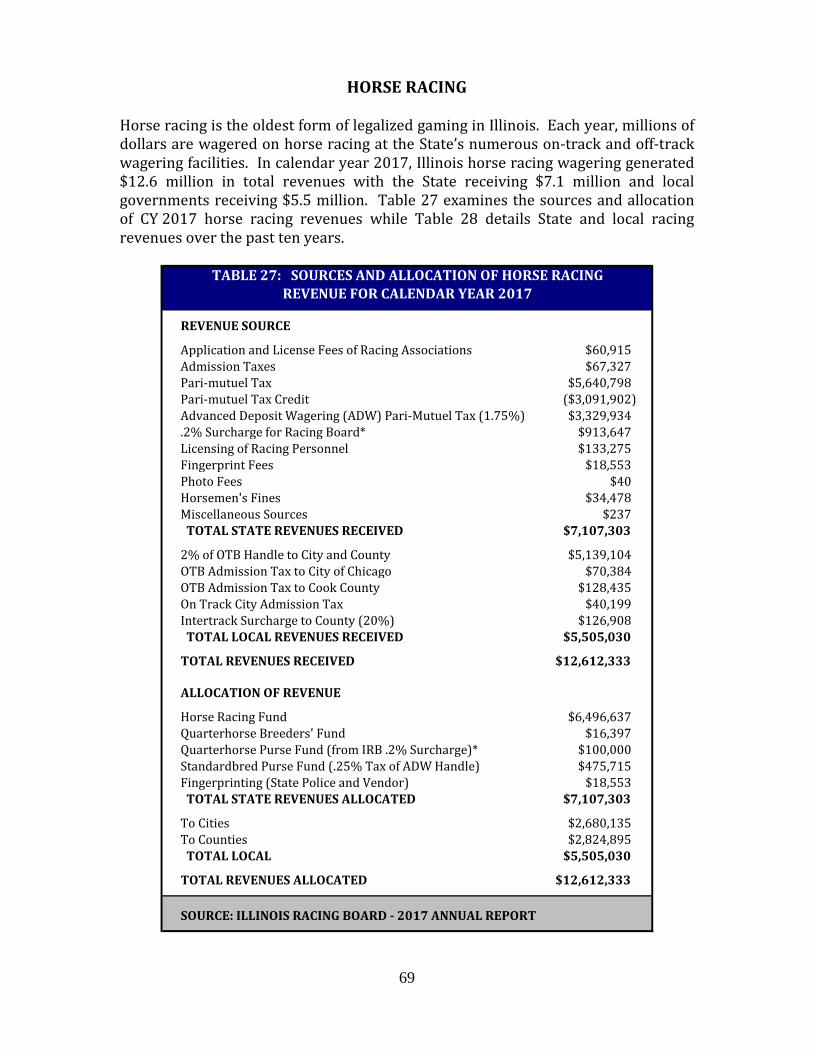
69
HORSE RACING
Horse racing is the oldest form of legalized gaming in Illinois. Each year, millions of dollars are wagered on horse racing at the State’s numerous on-track and off-track wagering facilities. In calendar year 2017, Illinois horse racing wagering generated $12.6 million in total revenues with the State receiving $7.1 million and local governments receiving $5.5 million. Table 27 examines the sources and allocation of CY 2017 horse racing revenues while Table 28 details State and local racing revenues over the past ten years.
REVENUE SOURCE
Application and License Fees of Racing Associations $60,915Admission Taxes $67,327Pari-mutuel Tax $5,640,798Pari-mutuel Tax Credit ($3,091,902)Advanced Deposit Wagering (ADW) Pari-Mutuel Tax (1.75%) $3,329,934.2% Surcharge for Racing Board* $913,647Licensing of Racing Personnel $133,275Fingerprint Fees $18,553Photo Fees $40Horsemen's Fines $34,478Miscellaneous Sources $237 TOTAL STATE REVENUES RECEIVED $7,107,303
2% of OTB Handle to City and County $5,139,104OTB Admission Tax to City of Chicago $70,384OTB Admission Tax to Cook County $128,435On Track City Admission Tax $40,199Intertrack Surcharge to County (20%) $126,908 TOTAL LOCAL REVENUES RECEIVED $5,505,030
TOTAL REVENUES RECEIVED $12,612,333
ALLOCATION OF REVENUE
Horse Racing Fund $6,496,637Quarterhorse Breeders' Fund $16,397Quarterhorse Purse Fund (from IRB .2% Surcharge)* $100,000Standardbred Purse Fund (.25% Tax of ADW Handle) $475,715Fingerprinting (State Police and Vendor) $18,553 TOTAL STATE REVENUES ALLOCATED $7,107,303
To Cities $2,680,135To Counties $2,824,895 TOTAL LOCAL $5,505,030
TOTAL REVENUES ALLOCATED $12,612,333
SOURCE: ILLINOIS RACING BOARD - 2017 ANNUAL REPORT
TABLE 27: SOURCES AND ALLOCATION OF HORSE RACINGREVENUE FOR CALENDAR YEAR 2017

70
In its 2017 Annual Report, the Racing Board reported that 257 race programs were conducted during CY 2017. This is notably lower than the 290 that were conducted during CY 2016 and significantly lower than the 518 race programs that were conducted as recent as CY 2013. The recent falloff reflects the declining trend of the horse racing industry, as well as the recent closings of the Balmoral and Maywood racetracks. In CY 2017, a total handle amount of $587 million resulted. This was actually a 2.9% increase over CY 2016 levels. Still, the CY 2017 amount is the second lowest total in recent history. These historical horse racing handle figures are displayed below.
The overall 2.9% increase in the racing handle is primarily due to a 14.6% increase in advance deposit wagering (ADW). While the ADW handle increased $24 million in 2017, the handle from on-track and intertrack wagering both fell nearly $6 million apiece (-6.4% and -8.9%, respectively). Off-track wagering increased a modest $3 million (+1.2%). Despite the overall increase in the horse racing handle figures, 2017 levels are 36.8% below levels from just ten years ago.
2007 2008 2009 2010 2011 2012 2013 2014 2015 2016 2017
TOTAL STATE REVENUE $8.9 $8.0 $7.1 $7.4 $7.8 $7.5 $6.4 $7.5 $6.8 $6.8 $7.1 TOTAL LOCAL REVENUE $11.6 $10.6 $9.1 $7.8 $7.2 $6.8 $6.7 $6.2 $5.8 $5.5 $5.5
* TOTAL REVENUES RECEIVED $20.6 $18.5 $16.2 $15.3 $15.0 $14.2 $13.1 $13.7 $12.7 $12.3 $12.6
TOTAL STATE ALLOCATIONS $8.9 $8.0 $7.1 $7.4 $7.8 $7.5 $6.4 $7.5 $6.8 $6.8 $7.1 TOTAL LOCAL ALLOCATIONS $11.6 $10.6 $9.1 $7.8 $7.2 $6.8 $6.7 $6.2 $5.8 $5.5 $5.5 TO CITIES $5.5 $4.9 $4.3 $3.7 $3.4 $3.2 $3.2 $2.9 $2.8 $2.7 $2.7 TO COUNTIES $6.1 $5.6 $4.8 $4.1 $3.8 $3.6 $3.6 $3.3 $3.1 $2.8 $2.8
*TOTAL REVENUES ALLOCATED $20.6 $18.5 $16.2 $15.3 $15.0 $14.2 $13.1 $13.7 $12.7 $12.3 $12.6
SOURCE: ILLINOIS RACING BOARD ANNUAL REPORTS
TABLE 28: HORSE RACING REVENUES AND ASSOCIATED ALLOCATIONSBY CALENDAR YEAR (IN MILLIONS)
* On January 29, 2014, advance deposit wagering was re-authorized for three years and included an additional .2% surcharge on winning wagers to help fund the Racing Board.
$0
$200
$400
$600
$800
$1,000
$1,200
$1,400
1980 1982 1984 1986 1988 1990 1992 1994 1996 1998 2000 2002 2004 2006 2008 2010 2012 2014 2016
On Track Intertrack Off Track Advance Deposit Wagering
ILLINOIS HORSE RACING HANDLECOMPOSITION BY AMOUNT WAGERED (CALENDAR YEAR)
$ IN MILLIONS
CHART 19
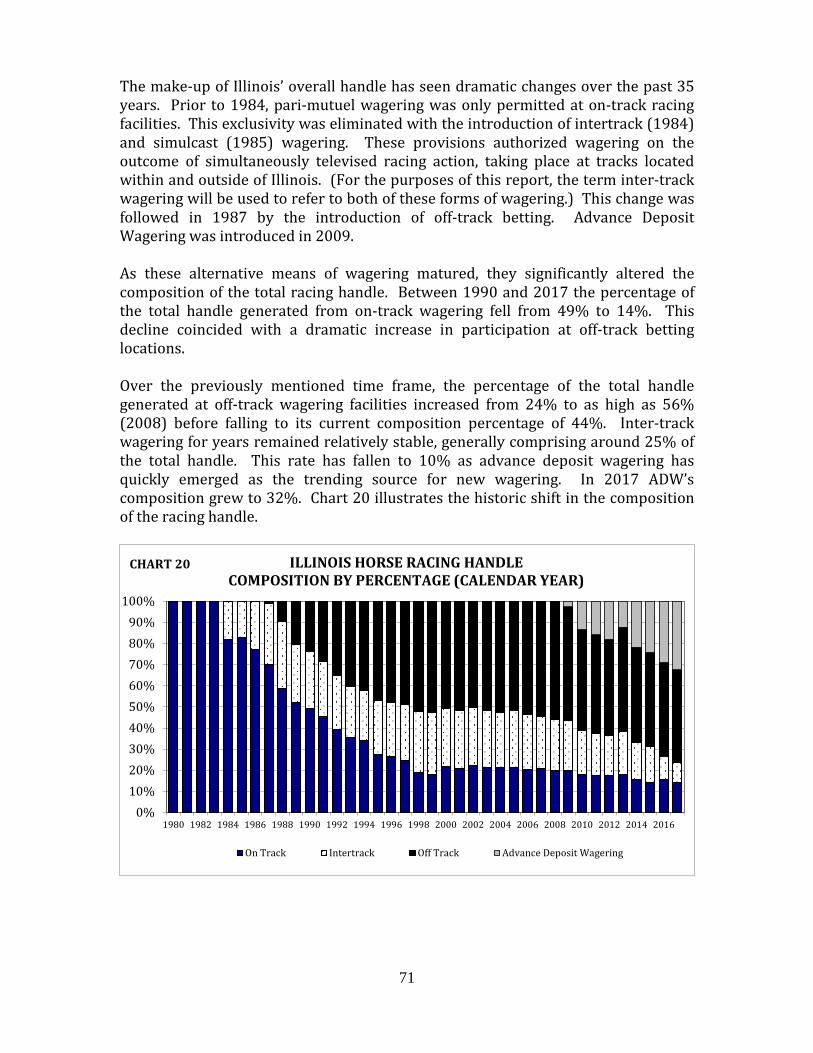
71
The make-up of Illinois’ overall handle has seen dramatic changes over the past 35 years. Prior to 1984, pari-mutuel wagering was only permitted at on-track racing facilities. This exclusivity was eliminated with the introduction of intertrack (1984) and simulcast (1985) wagering. These provisions authorized wagering on the outcome of simultaneously televised racing action, taking place at tracks located within and outside of Illinois. (For the purposes of this report, the term inter-track wagering will be used to refer to both of these forms of wagering.) This change was followed in 1987 by the introduction of off-track betting. Advance Deposit Wagering was introduced in 2009. As these alternative means of wagering matured, they significantly altered the composition of the total racing handle. Between 1990 and 2017 the percentage of the total handle generated from on-track wagering fell from 49% to 14%. This decline coincided with a dramatic increase in participation at off-track betting locations. Over the previously mentioned time frame, the percentage of the total handle generated at off-track wagering facilities increased from 24% to as high as 56% (2008) before falling to its current composition percentage of 44%. Inter-track wagering for years remained relatively stable, generally comprising around 25% of the total handle. This rate has fallen to 10% as advance deposit wagering has quickly emerged as the trending source for new wagering. In 2017 ADW’s composition grew to 32%. Chart 20 illustrates the historic shift in the composition of the racing handle.
0%10%20%30%40%50%60%70%80%90%
100%
1980 1982 1984 1986 1988 1990 1992 1994 1996 1998 2000 2002 2004 2006 2008 2010 2012 2014 2016
On Track Intertrack Off Track Advance Deposit Wagering
ILLINOIS HORSE RACING HANDLECOMPOSITION BY PERCENTAGE (CALENDAR YEAR)
CHART 20

72
2017 Racing Statistics
2016 Handle 2017 Handle % ChangeThoroughbred $310.9 $310.3 -0.2%Standardbred $93.6 $86.1 -8.0%
ADW $166.0 $190.3 14.6%Total Illinois
Handle $570.5 $586.7 2.8%
Amount Composition
$66.1 11.3%$520.6 88.7%$586.7 100%
Arlington $38.0Hawthorne $22.3Balmoral (closed) $0.0Maywood (closed) $0.0Fairmount $5.5State/County Fairs $0.4
Gulfstream $59.0Belmont $29.4Santa Anita $27.6Churchill $26.8Woodbine $21.5
Source: Illinois Racing Board Annual Report
Total
The largest handle at Illinois tracks came from:
The largest (top five) handles from out-of-state tracks came from:
TABLE 29: Illinois Racing Statistics for 2017$ in millions
Of the $586.7 million total handle in 2017….
Location of Race
Wagered on Illinois RacesWagered on Out-of State Tracks
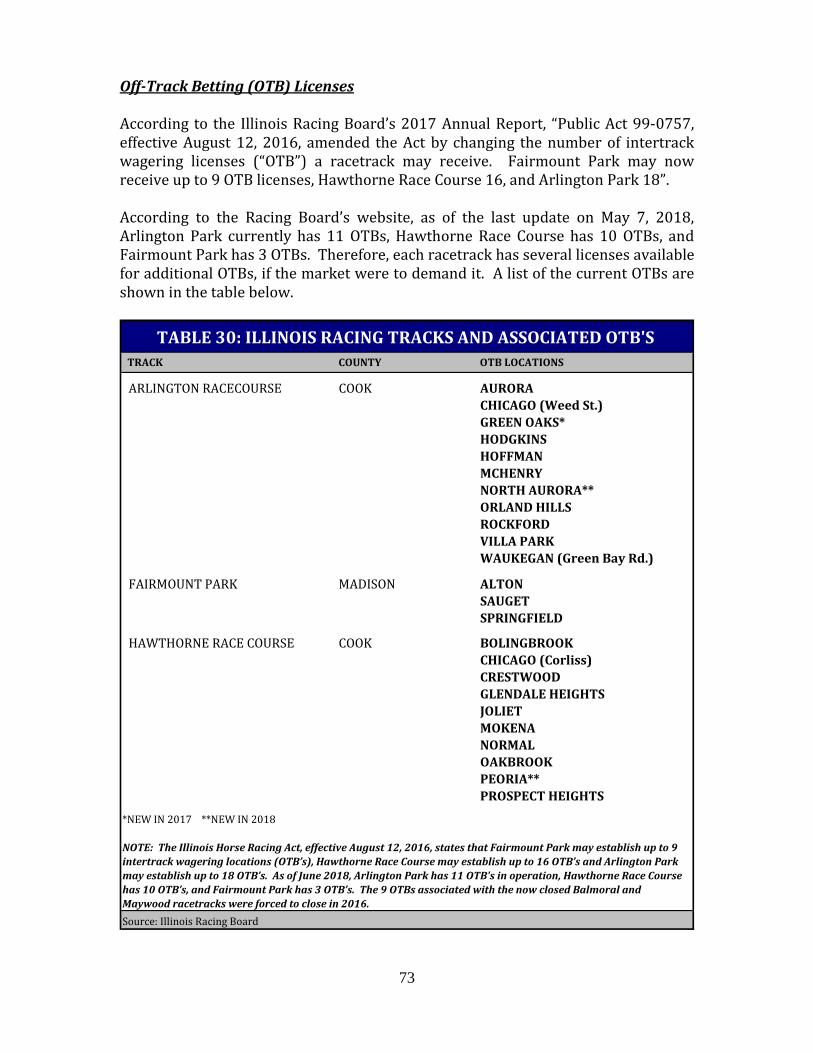
73
Off-Track Betting (OTB) Licenses According to the Illinois Racing Board’s 2017 Annual Report, “Public Act 99-0757, effective August 12, 2016, amended the Act by changing the number of intertrack wagering licenses (“OTB”) a racetrack may receive. Fairmount Park may now receive up to 9 OTB licenses, Hawthorne Race Course 16, and Arlington Park 18”. According to the Racing Board’s website, as of the last update on May 7, 2018, Arlington Park currently has 11 OTBs, Hawthorne Race Course has 10 OTBs, and Fairmount Park has 3 OTBs. Therefore, each racetrack has several licenses available for additional OTBs, if the market were to demand it. A list of the current OTBs are shown in the table below.
TRACK COUNTY OTB LOCATIONS
ARLINGTON RACECOURSE COOK AURORACHICAGO (Weed St.)GREEN OAKS*HODGKINSHOFFMANMCHENRYNORTH AURORA**ORLAND HILLSROCKFORDVILLA PARKWAUKEGAN (Green Bay Rd.)
FAIRMOUNT PARK MADISON ALTONSAUGETSPRINGFIELD
HAWTHORNE RACE COURSE COOK BOLINGBROOKCHICAGO (Corliss)CRESTWOODGLENDALE HEIGHTSJOLIETMOKENANORMALOAKBROOKPEORIA**PROSPECT HEIGHTS
*NEW IN 2017 **NEW IN 2018
Source: Illinois Racing Board
TABLE 30: ILLINOIS RACING TRACKS AND ASSOCIATED OTB'S
NOTE: The Illinois Horse Racing Act, effective August 12, 2016, states that Fairmount Park may establish up to 9 intertrack wagering locations (OTB’s), Hawthorne Race Course may establish up to 16 OTB’s and Arlington Park may establish up to 18 OTB’s. As of June 2018, Arlington Park has 11 OTB's in operation, Hawthorne Race Course has 10 OTB’s, and Fairmount Park has 3 OTB’s. The 9 OTBs associated with the now closed Balmoral and Maywood racetracks were forced to close in 2016.

74
Advance Deposit Wagering During the Spring 2009 legislative session, Public Act 96-0762 (SB 1298) was signed into law which allowed advance deposit wagering in Illinois. Advance Deposit Wagering officially began in Illinois in October 2009. Under P.A. 96-0762, an individual is allowed to establish an account, deposit money into the account, and use the account balance to pay for pari-mutuel wagering. An advance deposit wager may be placed in person at a wagering facility or from any other location via a telephone-type device or any other electronic means. The State receives additional revenue from advance deposit wagering through a flat pari-mutuel tax at the rate of 1.5% of the daily pari-mutuel handle on advance deposit wagering from a location other than a wagering facility. In addition to this tax, a pari-mutuel tax at the rate of 0.25% is imposed on advance deposit wagering. Until August 25, 2012, this additional tax was deposited into the Quarter Horse Purse Fund. Beginning on August 26, 2012, this additional tax is deposited into the Standardbred Purse Fund. Since advance deposit wagering became operational in 2009, $1.3 million in advance deposit wagering taxes was collected in FY 2010 (from 8 months of operational receipts). This equated to an 8-month handle total of $73.3 million. In FY 2011, advance deposit wagering taxes totaled $1.7 million, which equated to an annual total handle of $95.8 million. In FY 2012, these taxes totaled nearly $2.0 million, which equated to a total handle amount of $113.6 million. In FY 2013, the future of advance deposit wagering was in flux. Under the original language, advance deposit wagering was established in statute to expire on January 1, 2013. Once this day hit, ADW in Illinois was supposed to cease. However, data shows that some companies continued to collect from advance deposit wagering for a time after this date of expiration. On July 7, 2013, P.A. 98-0018 was signed into law, which, among other items, allowed advance deposit wagering to continue until January 31, 2014. The public act also provided that any licensee who conducted advance deposit wagering after January 1, 2013 and prior to the effective date is this Act (July 7, 2013) are “hereby validated, provided payment of all applicable pari-mutuel taxes are paid to the Board”. Because of this brief period of inactivity, only $1.3 million in advance deposit wagering taxes were collected in FY 2013, which equated to a total handle amount of $73.2 million. P.A. 98-0018 also provided that the additional tax of 0.25% on advance deposit wagering shall be deposited into the Standardbred Purse Fund for grants to the standardbred organization licensees for payment of purses for standardbred horse races conducted by the organization licensee. Under previous law the additional tax was deposited equally into the standardbred purse accounts of organization licensees conducting standardbred racing.
75
On January 29, 2014, P.A. 98-0624 was signed into law. This public act extended the authorization for advance deposit wagering to February 1, 2017. The Act also provided an additional 0.2% surcharge on winning wagers and winnings from wagers. From the revenue generated from this surcharge, $100,000 shall be annually deposited into the Quarter Horse Purse Fund. All remaining amounts are to be deposited into the Horse Racing Fund. Public Act 98-0624 also stated that each wagering licensee may impose an additional surcharge of up to 0.5% on winning wagers and winnings from wagers. The revenues from this surcharge shall be evenly distributed to the organization licensee and the purse account of the organization licensee with which the licensee is affiliated. Public Act 99-0756, effective August 12, 2016, extended advance deposit wagering through December 31, 2018. Public Act 100-0627, effective July 20, 2018, further extended advance deposit wagering through December 31, 2022. The extension of advance deposit wagering (now until the end of 2022) has made ADW revenues more reliable. In FY 2014, with nearly a full-year of revenues, $2.3 million in ADW tax revenues were collected. In FY 2015, this figure grew to $2.4 million in tax revenues. This equates to a handle amount of approximately $137 million. In FY 2016, $2.7 million in tax revenues were collected, equating to a handle amount of approximately $156 million. In FY 2017, tax revenues from ADW grew to $3.1 million, equating to a handle amount of approximately $175 million. The numbers grew even further in FY 2018 with ADW tax revenues totaling $3.5 million, which equates to a handle amount of approximately $200 million. Before advance deposit wagering became operational, the Illinois Racing Board had stated that insiders had estimated that as much as $100 million could annually be collected from advance deposit wagering. The results have shown that the ADW figures have surpassed the insider’s expectations. However, the Racing Board also projected that there could be a cannibalization effect on other wagering methods due to a predicted popularity of advance deposit wagering. The concern was that if advance deposit wagering was preferred, this would lower revenue totals from other forms of wagering. This cannibalization concern appears to be plausible. While the ADW handle surpassed $190 million in CY 2017, all other categories of wagering (on-track, inter-track, off-track) fell a combined $8 million in 2017 and have fallen a combined $320 million since 2009, the year that advance deposit wagering commenced. The fact remains, however, that these other methods of wagering were on a steady downward trend anyway. So, it appears that while advance deposit wagering has not caused horse racing handle numbers to turn around to its higher levels of the past, it has brought in enough interest to at least slow the declines of an industry that had been falling at a drastic pace.

76
What Will the Future Hold for Illinois Horse Racing? The horse racing industry in Illinois continues to struggle. Despite a small uptick in the racing handle in 2017, the handle amount remains 36.8% below levels from a decade ago. The 2015 closings of Maywood Park and Balmoral Park mean that there are only three operating race tracks in Illinois. Without significant changes to the industry, a dramatic turnaround is not likely. While many ideas have been discussed over the past decade to turn Illinois’ horse racing industry around, so far little progress has been made. In an attempt to help the horse racing community, in August 2011, lawmakers provided $141.8 million in financial subsidies by way of an impact fee on riverboats. Despite receiving this money, little, if any, improvement in the form of handle and revenues were seen. Additional subsidies were set to come from the Rivers Casino in Des Plaines. State law originally provided that 15% of the adjusted gross receipts of the Des Plaines casino was to be transferred into the Horse Racing Equity Trust Fund, but invalid distribution language prevented the transfer of these revenues to the Horse Racing Equity Trust Fund. In June 2013, P.A. 98-0018 changed statutory language to allow these dormant casino revenues to be distributed. However, the amount that was originally intended for the horse racing industry was dramatically reduced. The revised law provided that the Horse Racing Equity Fund receive only $23 million of the $120.5 million combined total that they were expecting to receive from the Des Plaines casino in FY 2012 and FY 2013 and they would receive no additional transfers from this revenue source in the future. The School Infrastructure Fund became the primary beneficiary of these funds. Since the subsidies were not enough to turn things around, the racing industry continues to look for other ways of spurring their business. One change that is being explored is the idea of “historical horse racing” or “instant racing”. In this wagering format, gamblers bet on random past races based on betting statistics without knowing the names of the horses or the name/date of the race. This concept has been used in other states and allows for a much quicker betting experience with instant results. The Racing Board is in the process of exploring whether to proceed with this new format, but questions remain on whether legislative approval would be required for implementation. Some feel that the only remaining hope may be to allow slot machines at the horse tracks throughout Illinois. However, this proposal remains in doubt as gaming expansion legislation containing this provision has, thus far, failed to receive enough support for enactment. If a gaming expansion bill with the addition of slot machines at Illinois racetracks were to eventually be signed into law, Illinois would join Indiana, Iowa, and numerous other states that have allowed slot machines to be operated at their facilities. The promoted idea is this: the addition of slot machines allows tracks to
77
offer higher purses, which leads to increased interest, both from horsemen and the fans of horse racing. Therefore, many proponents have argued that having slots at tracks would not only increase slot machine revenues for the State, but it would also increase the amount of money wagered on horse racing. However, it should be pointed out that this has not been the case for states across the country. For example, Indiana has seen its ‘in-state” handle decrease over 50% - from $190 million in 2005 to near $80 million in 2016 - despite the opening of two racinos in 2008. (The 2017 numbers have not been released at the time of this report). On the other hand, these two locations annually generate over $400 million in adjusted gross receipts at their racetrack casinos each year (including $470 million in FY 2018). A portion of the tax revenues imposed on the AGR of these casinos is kept by the track, allowing these racinos to offer higher purses, thus, helping it to “survive”. In cases like this, the revenue benefits from having “racinos” have come from the casinos themselves and not from developing new interest by way of pari-mutuel handle increases. The State of Pennsylvania is one of the more prominent “racino” states in the country. Over $1.7 million in adjusted gross receipts were reported by the six Pennsylvania racinos in FY 2018. While the AGR from these racetrack casinos have stayed consistent over the past five years (5-year change of -1.6%), the State’s horse racing numbers have faltered. Between CY 2013 and CY 2017, the taxable handle in Pennsylvania has decreased from $481 million to $346 million – a decline of 28%. In its 2017 Racetrack Casino Benchmark Report, the Pennsylvania Gaming Control Board writes:
Taxable dollars wagered on any race held throughout the country continues to decline due to a decrease in demand for wagering on out-of-state races by Pennsylvania residents. This is a national trend and is not unique to Pennsylvania racing. In addition, more than half of Pennsylvania’s off-track wagering facilities have closed due to a decrease in simulcast wagering.
Even if pari-mutuel handles are not necessarily increasing in other states like Indiana and Pennsylvania, their ability to offer higher purses with the help of another revenue source is having a direct detrimental impact on Illinois. With higher prize values in other states, more and more in the horse racing industry are leaving Illinois for “greener pastures”. Without the ability to offer higher purses, a bad situation may soon become worse for Illinois tracks. The horse racing community continues to argue that allowing slot machines at their tracks would act as a life preserver to this industry. Although, data suggests that the horse racing handle will not necessarily increase as a result of having slot machines at tracks, having this other source of revenue would give Illinois horse tracks a secondary source of income needed to offer competitive purses, which should help sustain horse racing in Illinois. Without this additional source of revenue, the horse racing industry will likely see its declining trend continue into the foreseeable future.

78
MISCELLANEOUS STATE GAMING
Although the Commission has traditionally focused its examinations of Illinois gaming on horse racing, lottery, riverboat gambling, and video gaming, the State receives additional tax and license revenue via bingo, charitable games, and pull-tabs and jar games.
• Illinois receives two forms of revenue from bingo games: license fees and the bingo game receipt tax. In FY 2018, the State generated $119,253 in bingo license fees and $1.4 million in bingo taxes. Total bingo receipts were down 5.8% from FY 2017 levels.
• Illinois receives two forms of revenue from charitable games: license fees and the charitable games receipts tax. In FY 2018, the State received $87,025 in license fees and $282,441 from the charitable games tax. Total charitable games receipts were up 0.8% from FY 2017 levels.
• Illinois receives two forms of revenue from pull-tabs and jar games: license fees and the pull-tab and jar games receipts tax. In FY 2018, the State received $323,250 in license fees and $2.5 million from the pull tabs and jar games tax. Total pull-tabs and jar games receipts were down 6.7% from FY 2017 levels.
In total, these miscellaneous gaming revenue sources generated approximately $4.7 million in FY 2018. This figure is 5.8% below the FY 2017 total of $5.0 million. The chart below illustrates a history of miscellaneous gaming revenue over the past decade.
$0.0$1.0$2.0$3.0$4.0$5.0$6.0$7.0$8.0$9.0
2009 2010 2011 2012 2013 2014 2015 2016 2017 2018
Fiscal Year
CHART 21: Miscellaneous Gaming Revenue in Illinois$ in millions
Bingo Taxes and Fees Pull Tabs Taxes and Fees Charitable Games Tax and Fees

79
POTENTIAL NEW GAMING FORMATS
For years, the idea of expanding gambling in the State has centered on the development of new casinos, whether it be from a new mega casino in Chicago, the creation of racetrack casinos, or the addition of new “riverboat” casinos throughout the State. Video gaming has shown that new gaming dollars can be generated in Illinois by introducing gaming formats that are slightly different than the typical gaming experience. Below is a quick synopsis of three potential new gaming formats for the State currently being discussed. While it is difficult to predict the revenue potential of these gaming ideas without knowing the final product and its tax structure, each of these formats would create a new revenue source for the State. Of course, with each new format brings more competition for all of the gaming methods to compete for the limited gaming dollar. How each of these proposals would affect each other’s bottom line and gaming totals as a whole remains to be seen. This impact, of course, would be monitored and analyzed when/if these ideas were to be enacted. Fantasy Sports Legislation has been introduced that would provide regulatory oversight over interactive fantasy sports and would establish certain requirements for policies and procedures for the operation of fantasy contests. Revenues would be generated from the establishment of license fees, renewal fees, and a privilege tax imposed on the income generated from fantasy sports. The vast majority of the revenues from fantasy sports reportedly currently come from two companies, Draft Kings and Fan Duel. Sports Wagering In May 2018, the State of New Jersey, in a legal case before the Supreme Court of the United States (Christie vs NCAA) had the Professional and Amateur Sports Protection Act (PASPA) overturned, thereby allowing state-sponsored sports betting throughout the United States. Since this ruling, several pieces of legislation have been introduced to set the ground work for sports wagering in Illinois. However, there are several issues of debate that will need to be addressed, including where the sports betting locations will be located (at casinos, horse tracks, OTBs, etc.), whether this can be done over the Internet, and what kind of tax structure will be imposed on this gaming format. Internet Gaming Legislation has been introduced which would authorize use of the Internet to place, receive, or otherwise knowingly transmit a bet or wager where Internet wagering complies with the federal Unlawful Internet Gambling Enforcement Act (UIGEA) of 2016. If allowed, proceeds would come via license fees, application fees, and a tax on gross gaming revenues stemming from these Internet wagers.

80
CONCLUSION
With the continued expansion of video gaming throughout the State, Illinois has more gambling options than it has ever had before. The growth in video gaming was the impetus behind the 3.5% increase in State revenues from gaming-related sources in FY 2018. While video gaming has flourished, the “older” gaming sources in Illinois have remained relatively stagnant. The 1.3% decline in adjusted gross receipts from Illinois’ ten casinos in FY 2018 is a continuation of its recent downward trend. Transfers to the Education Assistance Fund coming from Illinois’ casinos in FY 2018 ($272 million) are well below the near $700 million that were transferred a little over a decade ago. The declining trend in transfers is because every casino in Illinois, aside from Des Plaines, has experienced a double-digit decline in its adjusted gross receipts over the past five fiscal years. At first, these declines were due to new competition from the opening of the Des Plaines casino, especially for the four suburban casinos. In recent years, however, the declines appear to be due to the increased competition from video gaming throughout Illinois. Video gaming in Illinois continues to flourish since its inception in September 2012. The 29,283 video gaming terminals in operation at the end of FY 2018 is the equivalent of adding over 24 full-size casinos to the State. These machines generated over $1.4 billion in net terminal income for the fiscal year, resulting in approximately $422 million in tax revenues. The emergence of video gaming has created more competition for the riverboat casino industry, thereby causing a falloff in the casino’s attendance and revenue figures. However, it should be emphasized that, when combining Illinois’ riverboat and video gaming numbers, the amount of dollars spent on these gaming formats increased 7.1% in FY 2018 and have increased every year since video gaming commenced in Illinois. A closer look shows that the overall increase in gaming revenues has been, for the most part, experienced downstate where limited gaming opportunities had previously existed. The numbers suggest that adding video gaming to the Chicago areas has merely redistributed the revenues to the numerous gaming venues that now exist in that area. In FY 2012, before video gaming’s arrival, riverboat revenues from the Chicago area casinos in Illinois and Indiana generated $2.246 billion. In FY 2018, even with the addition of approximately 11,000 video gaming machines in this area, the Commission estimates that gaming revenue totals in the Chicago area have only increased to $2.540 billion - an average year-over-year growth in gaming dollars of 2.6%. Video gaming revenues would be significantly higher if the City of Chicago were to “opt-in” to allowing video gaming in Illinois. The Commission estimates that Chicago is among roughly 37% of the State’s population which continues to ban video gaming in their communities. But even without these cities, the Commission estimates that the monthly number of video gaming terminals in the State will likely surpass 30,000 gaming terminals statewide by the end of FY 2019.

81
Despite the rapid increase of video gaming in recent years, the largest contributor of State gaming revenues continues to come from the Illinois Lottery. Lottery sales were up $82.5 million in FY 2018, an increase of 2.9%. While this latest increase is encouraging, lottery sales have remained relatively stagnant over the past five years – increasing only 3.1% during this time period. The lack of significant growth in lottery sales has been disappointing because larger increases were hoped for under a private management company. Due to the poor performance of the first private management company, Northstar, a new firm called Camelot Illinois took over the day-to-day management of the lottery on January 2, 2018. The Lottery continues to be an important provider to the State’s general funds, contributing a total of $732 million in Lottery-related transfers in FY 2018. It remains to be seen if the new private manager will be able to return the amount of transfers to the near $800 million that were achieved in FY 2013 and FY 2014. The horse racing industry in Illinois continues to struggle. The amount wagered on horse racing in Illinois did see slight growth in 2017, thanks to a 14.6% growth in advance deposit wagering, but the overall handle total of $587 million in 2017 remains 36.8% below its levels of a decade ago. The handle from thoroughbred racing dropped 0.2% in CY 2017, while the handle from standardbred racing dropped 8.0%. With the 2015 closing of Balmoral Park and Maywood Park, there leaves only three racetracks in Illinois still offering live racing (Arlington, Fairmount, and Hawthorne). Absent some change agent, horse racing is expected to continue to struggle in the foreseeable future. The racing community continues to lobby for slot machines at their racetracks as a way to improve their attendance and revenues. While statistics from other states have shown that casinos at racetracks do not necessarily increase the racing handle, it would provide a secondary source of revenue to support the struggling horse racing industry. Even with all of the recent changes in gaming, especially as it pertains to the expansion of video gaming in Illinois, there continues to be discussions of expanding gambling in Illinois even further. There have been numerous versions of gaming expansion legislation over the past several years. The most prominent versions would allow additional positions at all of the casinos, allow a Chicago casino along with four or five additional riverboats, and allow horse tracks to have slot machines at their facilities. However, so far, these ideas have failed to garner enough support for enactment. Other ideas for gaming expansion may come from other means such as fantasy sports, sports wagering, or Internet gaming. However, questions remain on how these formats would be regulated and implemented, how tax revenues from these gaming formats would be collected, and what kind of fiscal impact these gaming formats would have on current forms.
82
Along with the questions on gaming expansion, a number of other uncertainties remain. Will video gaming in Illinois continue to grow in its seventh year of existence? Will the expansion of video gaming continue to negatively impact riverboat casinos? What will be the impact of State’s new lottery manager? Without slots at tracks, will horse racing be able to build on the success of advance deposit wagering or will another component, such as historical horse racing be implemented to help fill the revenue gap? All of these questions, and likely others, will set the framework for gaming in the years to come. As always, the Commission will continue to closely monitor legislation and discussions dealing with these potential changes and will provide updates to this report whenever necessary.
BACKGROUND
The Commission on Government Forecasting and Accountability (CGFA), a bipartisan, joint legislative commission, provides the General Assembly with information relevant to the Illinois economy, taxes and other sources of revenue and debt obligations of the State. The Commission's specific responsibilities include:
1) Preparation of annual revenue estimates with periodic updates;
2) Analysis of the fiscal impact of revenue bills;
3) Preparation of State debt impact notes on legislation which would appropriate bond funds or increase bond authorization;
4) Periodic assessment of capital facility plans;
5) Annual estimates of public pension funding requirements and preparation of pension impact notes;
6) Annual estimates of the liabilities of the State's group health insurance program and approval of contract renewals promulgated by the Department of Central Management Services;
7) Administration of the State Facility Closure Act. The Commission also has a mandate to report to the General Assembly ". . . on economic trends in relation to long-range planning and budgeting; and to study and make such recommendations as it deems appropriate on local and regional economic and fiscal policies and on federal fiscal policy as it may affect Illinois. . . ." This results in several reports on various economic issues throughout the year. The Commission publishes several reports each year. In addition to a “Monthly Briefing”, the Commission publishes the "Revenue Estimate and Economic Outlook" which describes and projects economic conditions and their impact on State revenues. The “Legislative Capital Plan Analysis” examines the State's capital appropriations plan and debt position. “The Financial Conditions of the Illinois Public Retirement Systems” provides an overview of the funding condition of the State’s retirement systems. Also published are an Annual Fiscal Year “Budget Summary”; “Report on the Liabilities of the State Employees’ Group Insurance Program”; and “Report of the Cost and Savings of the State Employees’ Early Retirement Incentive Program”. The Commission also publishes each year special topic reports that have or could have an impact on the economic well-being of Illinois. All reports are available on the Commission’s website. These reports are available from: Commission on Government Forecasting and Accountability 703 Stratton Office Building Springfield, Illinois 62706 (217) 782-5320 (217) 782-3513 (FAX)
http://cgfa.ilga.gov


