Embed Size (px)
Citation preview
This document has a restricted distribution and may be used by recipients only in the performance of their official duties. Its contents may not otherwise be disclosed without World Bank Group authorization.
OFFICIAL USE ONLY
SecM2017-0197
July 5, 2017
For meeting of Board: Thursday, July 27, 2017
FROM: Vice President and Corporate Secretary
World Development Report 2018 - Learning to Realize Education’s Promise
1. Attached is a Memorandum of the President and accompanying report entitled “WorldDevelopment Report 2018 - Learning to Realize Education’s Promise", dated June 27, 2017. Thereport will be discussed in a meeting of Executive Directors to be held on Thursday, July 27,2017.
2. As in previous years, final revisions will be made following the Board discussion, afterwhich the report will be published.
3. Questions on this document should be referred to Mr. Halsey Rogers (ext. 36292), Mr.Deon Filmer (ext. 31303) or Mr. Shantayanan Devarajan (ext. 37691).
Distribution: Executive Directors and Alternates President Bank Group Senior Management Vice Presidents, Bank, IFC and MIGA Directors and Department Heads, Bank, IFC and MIGA

Document of the World Bank
This document has a restricted distribution and may be used by recipients only in the performance of their official duties. Its contents may not otherwise be disclosed without World Bank authorization.
Report N
o. 115721- GLB
World D
evelopment R
eport 2018Learning to R
ealize Education’sProm
ise
Report No. 115721- GLB
World Development Report 2018
Learning to Realize Education’s Promise
June 27, 2017
FOR OFFICIAL USE ONLY
DISCUSSION PROOF—scheduled for discussion
with Executive Directors, July 27, 2017

Jim Yong Kim President
June 22, 2017
MEMORANDUM TO THE EXECUTIVE DIRECTORS
World Development Report 2018: LEARNING to Realize Education’s Promise
1. Schooling is not the same as learning. In Kenya, Tanzania, and Uganda, three-quarters of students in grade 3 who were asked to read a sentence such as “The name of the dog is Puppy” could not understand what it said. In rural India three-quarters of students in grade 3 could not solve a two-digit subtraction such as “52 – 14”—and by grade 5, half still could not do so. Although the skills of Brazilian 15-year-olds have improved, at their current rate of improvement they won’t reach the rich-country average score in math for 75 years. In reading, it will take 263 years. Within countries, learning outcomes are almost always much worse for the disadvantaged. In Uruguay, poor children in grade 6 are assessed as “not competent” in math at 5 times the rate of wealthy children. Moreover, such data are for children and youth lucky enough to be in school. Some 260 million aren’t even enrolled in primary or secondary school.
2. This learning crisis is more than a growth and development problem; it is also a moral issue. Delivered well, education cures a host of societal ills. For individuals, it promotes employment, earnings, health, and poverty reduction. For societies, it drives long-term economic growth, spurs innovation, strengthens institutions, and fosters social cohesion. But these benefits depend largely on learning: mounting evidence shows that the skills acquired are what drives growth and equips individuals for work and life. Without learning, education fails to deliver fully on its promise as a central driver of poverty elimination and shared prosperity. Schooling without learning is a wasted opportunity. More than that, it is a great injustice: the children whom society is failing most are the ones who most need a good education to succeed in life.
3. When improving learning becomes a priority, great progress is possible. Starting in the early 1950s as a war-torn society with very low literacy rates, the Republic of Korea by 1995 had achieved universal enrollment in high-quality education through secondary school—so that its young people performed at the highest levels on international learning assessments. Vietnam surprised the world when the 2012 results from PISA showed that its 15-year-olds performed at the same level as those in Germany—even though Vietnam was a lower-middle-income country. Between 2009 and 2015, Peru achieved some of the fastest growth in overall learning outcomes—an improvement attributable to concerted policy action. In several countries (such as Liberia, Papua New Guinea, and Tonga) early grade reading improved substantially within a very short time, thanks to focused efforts based on evidence.
- ii -
4. Any country can do better, if it acts as if learning really matters. That may sound obvious; after all, what else is education for? Yet even as learning goals are receiving increased rhetorical support, in practice many features of education systems conspire against learning. This Report argues that achieving learning for all—a commitment of the global community under the SDGs—will require three complementary strategies: assess learning, act to make schools work for learners, and align actors:
5. First, assess learning, so it can become a serious goal.
• Only half of all countries have metrics to measure learning at the end of primary and lower secondary school—indicators required to monitor progress toward SDG4. Fewer still the ability to track learning over time.
• Countries need to put in place a range of well-designed student assessments to help teachers guide students, improve system management, and focus society’s attention on learning. Learning measures should spotlight hidden exclusions, inform policy choices, and track progress.
6. Second, act to make schools work for learners.
• Great schools are those that build strong teaching-learning relationships in the classroom. As educators have innovated around the world and as brain science has advanced in recent decades, knowledge of how students learn most effectively has exploded. But what countries do in their schools often differs greatly from what evidence identifies as the most promising approaches.
• Countries can use the evidence to innovate locally in ways that make schools work better. The best place to start is these four key areas:
i. o Prepared learners: Reduce stunting and promote brain development through early
nutrition and stimulation (as in Chile) so children can learn. Support disadvantaged children with grants to keep them in school.
o Skilled, motivated teachers: Attract great people into teaching (as in Finland). Use repeated, specific teacher training reinforced by mentors (as in some African settings) instead of the ineffective one-off methods that are more common.
o Inputs and management focused on teaching and learning: Deploy technologies that help teachers teach to the level of the student (as in Delhi, India). Strengthen the capacity and powers of school management (as in Indonesia), including principals.
o Flexible, responsive job training: Reorient job training toward relevant skills by involving employers in program design and giving students opportunities for workplace learning.
7. Third, align actors, to make the whole system work for learning:
• All this innovation in classrooms is unlikely to have much impact if system-level technical and political barriers prevent a focus on learning. Many interventions have failed because countries are stuck in low-learning traps: key actors are focused on non-
- iii -
learning goals (such as political or personal gain), and they lack implementation capacity even when they do target learning. These traps lead to the poor service delivery—absent teachers, missing or inappropriate textbooks, ineffective technologies—that drive low learning.
• Countries can escape these low-learning traps by acting on three fronts as they implement reforms:
o Deploy information and metrics to make learning politically salient (as the NGO-
led ASER and Uwezo programs have done in India and East Africa) o Build coalitions to shift political incentives toward learning for all (as Chile did
early in its decades-long education reforms, and as Malaysia and Tanzania did recently with collaborative society-wide ‘labs’ to design reform programs)
o Use innovative and adaptive approaches to find out which approaches work best in their context (as Burundi did when it strategically iterated and adjusted its approach while rebuilding its education sector after conflict).
8. Taking on this challenge is especially important in an era of rapid technological change. New technologies are leading to major shifts in the nature of work and the skills demanded, leading some to declare this a new era—the Fourth Industrial Revolution. But no matter how the demand for skills changes, people will continue to require a solid foundation of basic skills and knowledge. If anything, rapid change—whether the Green Revolution in the 1960s, or ICT-driven change today—places a premium on learning how to learn. This requires foundational skills that allow individuals to size up new situations, adapt their thinking, and know where to go for information and how to make sense of it. Individuals and societies that lack these skills will fall further behind—whereas those equipped with skills can approach the future with anticipation rather than trepidation. Countries that build a solid foundation of skills can be confident that technological change will bring them widely shared growth.
9. Countries have already made a great start by getting so many children and youth into school. Now it’s time to realize education’s promise by accelerating learning. The right investments can pay off. Real education that promotes learning will benefit many: children and families whose positive schooling experience contributes to their faith in government and society; youth who have skills that employers are demanding; teachers who can respond to their professional calling, rather than to political demands; adult workers who have learned how to learn, preparing them for unforeseeable economic and social changes; and citizens who have the values and reasoning abilities to contribute to civic life and social cohesion.
ii. Consultations and in-country engagement
10. Throughout the preparation of the Report, the WDR team has carried out extensive consultations with WBG colleagues, offices of the Executive Directors, government policymakers, staff from other international organizations, civil society organizations, development partners, and research institutions. Representatives from these groups participated in WDR consultation events held in 20 countries (Bolivia, Brazil, Canada, China, Côte d'Ivoire, Finland, France, India, Indonesia, Japan, Kenya, Malaysia, Mexico, Senegal, South Africa, Tanzania, Thailand, Turkey,
- iv -
United Kingdom, United States). Other groups and individuals participated in a month-long e-consultation organized by the team. The team also benefited from a high-level Advisory Panel of senior policymakers, academics, and civil society organization representatives.
11. In addition to the above, staff from the following bilateral development partners were consulted: Canada, Finland, Japan, the Republic of Korea, Norway, and Sweden, and with AFD (France), BMZ and GIZ (Germany), DFAT (Australia), DFID (UK), JICA (Japan), USAID (United States), and the members of the Knowledge for Change Program advisory board. The team also consulted with staff from the following international organizations and initiatives: The Association for the Development of Education in Africa (ADEA), the Global Development Network (GDN), the Global Partnership for Education, the International Commission on Financing Global Education Opportunity, the IMF, the OECD, UNICEF, and UNESCO.
12. The team drew on the analysis, research, and literature reviews of researchers from around the world. In addition, leading academics provided comments bilaterally, in specially convened consultation meetings, as well as through sessions at various events, including: the 2016 RISE Conference at Oxford University, the 2017 ASSA Meetings, the 2017 meetings of the Society for Research on Education Effectiveness, the Mexico Conference on Political Economy of Education, and the 2017 meeting of the SABER Advisory Panel.
13. The team gratefully acknowledges generous financial support from the Knowledge for Change Program (a multi-donor Trust Fund), and especially from the governments and development agencies of the following KCP donor countries: Finland, France, and Norway. Background research for the WDR 2018 has also received generous support from the Bill and Melinda Gates Foundation, the Early Learning Partnership Trust Fund, and the Nordic Trust Fund. The team also thanks the following partners for convening consultation events: the German Federal Ministry for Economic Cooperation and Development (BMZ) and its convening authority, the Deutsche Gesellschaft für Internationale Zusammenarbeit (GIZ), in Berlin; the Japan International Cooperation Agency in Tokyo; the Brookings Institution Center for Universal Education in Washington, DC; and the Columbia School for International and Public Affairs and Cornell University in New York.
iii. Audience, operational implications, and dissemination
14. The primary audience for the Report includes policymakers, development practitioners, and academics, as well as their partners in bilateral and multilateral development agencies. More generally, the team hopes to reach anyone interested in education and development and to attract coverage in general media; it has tried to write the Report in a style that will make it accessible to these audiences.
15. Within the WBG, discussions are already underway on how to incorporate key messages of the report into operational work, both within the Education Global Practice and beyond it. So far, these discussions have explored the following four questions:
• First, how to develop more useful measures of learning and its determinants—for example, through developing a comparable measure of quality-adjusted years of schooling,
- v -
deploying standardized learning modules in household surveys (to complement school-based learning assessments), or scaling up data collection on the quality of service delivery.
• Second, how to use evidence to guide operational practice to improve learning at thestudent and school level, in areas such as early-years interventions, teacher training, andeducational technology.
• Third, how to develop tools to integrate political economy analysis more effectively intoproject analysis, SCDs, and other Bank engagements at the country level.
• Finally, how to increase the use of operational approaches that explicitly allow for greaterinnovation and agility—for example, through results-based financing.
16. The WDR 2018 will be launched around the time of the IMF/World Bank Annual Meetings in October 2017. The launch will be followed by a series of country and regional dissemination events, spanning all the World Bank regions, that will last through 2018.
Sincerely,
Jim Yong Kim

- i -
The team
The WDR team was led by Deon Filmer and Halsey Rogers. The core team comprised Samer Al-Samarrai, Magdalena Bendini, Tara Béteille, David Evans, Märt Kivine, Shwetlena Sabarwal, and Alexandria Valerio, with Malek Abu-Jawdeh, Bradley Larson, Unika Shrestha, and Fei Yuan serving as research analysts. Rafael de Hoyos and Sophie Naudeau were members of the extended WDR team. Stephen Commins provided consultations support. Mary Breeding, Ji Liu, Christian Ponce de Leon, Carla Cristina Solis Uehara, Alies Van Geldermalsen, and Paula Villaseñor served as consultants. The production and logistics team for the Report consisted of Brónagh Murphy and Jason Victor.
Paul Holtz was the principal editor of the Report. Bruce Ross-Larson provided editorial guidance. Alejandra Bustamante and Surekha Mohan provided resource management support for the team.
The Report is sponsored by the Development Economics Vice-Presidency. Paul Romer, Senior Vice President and Chief Economist, and Ana Revenga, Deputy Chief Economist, have overseen the Report. Kaushik Basu, the former Chief Economist and Senior VP, and Indermit Gill, former Director for Development Policy, provided guidance in the early months of the Report’s preparation. The Education Global Practice and the Human Development GP Group have provided consistent support for the Report team.

- i -
Table of Contents
Overview: Learning for all? All for learning
Part 1: Education’s Promise
Chapter 1: Schooling, learning, and the promise of education
Part 2: The Learning Crisis
Chapter 2: The great schooling expansion—and those it has left behind
Spotlight: The biology of learning
Chapter 3: The many faces of the learning crisis
Spotlight: Poverty hinders biological development and undermines learning
Chapter 4: To take learning seriously, start by measuring it
Spotlight: The multidimensionality of skills
Part 3: Innovations and Evidence for Learning
Spotlight: Learning about learning
Chapter 5: There is no learning without prepared, motivated learners
Chapter 6: Teacher skills and motivation matter, yet many education systems act like they don’t
Chapter 7: Everything else should strengthen the teacher-learner interaction
Chapter 8: Teach job skills by linking training to jobs
Spotlight: Technology is changing the world of work. What does that mean for learning?
Part 4: Making the System Work for Learning at Scale
Chapter 9: Education systems are misaligned with learning
Spotlight: Spending more or spending better—or both?
Chapter 10: Unhealthy politics drives misalignments
Chapter 11: How to escape low-learning traps

- O.1 -
World Development Report 2018
LEARNING to realize education’s promise
Overview
Contents
Learning for all? ............................................................................................................................................ 3
The learning crisis: low levels, high inequality, slow progress ................................................................ 3
How schools are failing learners ............................................................................................................. 10
How systems are failing schools ............................................................................................................. 14
Still, there are reasons for hope ............................................................................................................... 19
All for learning: How to realize education’s promise ................................................................................. 19
Assess learning ........................................................................................................................................ 20
Act to make schools work for learners .................................................................................................... 25
Align actors ............................................................................................................................................. 31
Why should countries take up this challenge? ............................................................................................ 36
What does it take to equip all individuals with the learning and skills that will enable them to thrive?
1. Schooling is not the same as learning. In Kenya, Tanzania, and Uganda, three-quarters of students in grade 3 who were asked to read a sentence such as “The name of the dog is Puppy” could not understand what it said. In rural India three-quarters of students in grade 3 could not solve a two-digit subtraction such as “52 – 14”—and by grade 5, half still could not do so. Although the skills of Brazilian 15-year-olds have improved, at their current rate of improvement they won’t reach the rich-country average score in math for 75 years. In reading, it will take 263 years. Within countries, learning outcomes are almost always much worse for the disadvantaged. In Uruguay, poor children in grade 6 are assessed as “not competent” in math at 5 times the rate of wealthy children. Moreover, such data are for children and youth lucky enough to be in school. Some 260 million aren’t even enrolled in primary or secondary school.
2. Hundreds of millions of children reach young adulthood without even the most basic life skills. Even if they attend school, many leave without the skills for calculating the correct change from a transaction, reading a doctor’s instructions, or interpreting a campaign promise—let alone building a fulfilling career or educating their children.
3. This learning crisis is a moral crisis. When delivered well, education cures a host of societal ills. For individuals, it promotes employment, earnings, health, and poverty reduction. For
- O.2 -
societies, it spurs innovation, strengthens institutions, and fosters social cohesion. But these benefits depend largely on learning. Schooling without learning is a wasted opportunity. More than that, it is a great injustice: the children whom society is failing most are the ones who most need a good education to succeed in life.
4. But any country can do better, if it acts as if learning really matters. That may sound obvious; after all, what else is education for? Yet even as learning goals are receiving increased rhetorical support, in practice many features of education systems conspire against learning. This Report argues that countries can improve by advancing on three fronts:
• Assess learning, so it can become a serious goal. This means using well-designed student assessments to gauge the health of education systems, not primarily as tools for rewards and punishments as has been done in some countries. It also means using the resulting learning measures to spotlight hidden exclusions, make choices, and evaluate progress.
• Act to make schools work for learners. Evidence on how people learn has exploded in recent decades, along with an increase in educational innovation. Countries can make much better use of this evidence to set priorities for their own practice and innovations.
• Align actors, to make the whole system work for learning. Countries must recognize that all the classroom innovation in the world is unlikely to have much impact if, because of technical and political barriers, the system as a whole does not support learning. By taking into account these real-world barriers to learning, countries can support innovative educators on the front lines.
5. When improving learning becomes a priority, great progress is possible. Starting in the early 1950s as a war-torn society held back by very low literacy levels, the Republic of Korea by 1995 had achieved universal enrollment in high-quality education through secondary school—so that today its young people perform at the highest levels on international learning assessments. Vietnam surprised the world when the 2012 results from PISA showed that its 15-year-olds performed at the same level as those in Germany—even though Vietnam was a lower-middle-income country. Between 2009 and 2015, Peru achieved some of the fastest growth in overall learning outcomes—an improvement attributable to concerted policy action. In several countries (such as Liberia, Papua New Guinea, and Tonga) early grade reading improved substantially within a very short time, thanks to focused efforts based on evidence. And recently, Malaysia and Tanzania have launched promising society-wide collaborative approaches to systematically improve learning.
6. Progress like this requires a clear-eyed diagnosis, followed by concerted action. Before showing what can be done to fulfill education’s promise, this Overview first shines a light on the learning crisis: how and why many countries are not yet achieving “learning for all.” This makes for bracing reading, but it should not be interpreted as saying that all is lost—only that too many young people are not getting the education they need. The rest of the Overview shows how change is possible, if systems commit to “all for learning,” drawing on examples of families, educators, communities, and systems that have made real progress.
- O.3 -
Learning for all?
7. Education should equip students with the skills they need to lead healthy, productive, meaningful lives. Different countries will define skills differently, but all share some core aspirations, embodied in their curriculums. Students everywhere must learn how to interpret many types of written passages—from medication labels to job offers, from bank statements to great literature. They have to understand how numbers work so that they can make transactions in markets, set family budgets, interpret loan agreements, or write engineering software. They require the higher-order reasoning and creativity that builds on these foundational skills. And they need the socioemotional skills—like perseverance and the ability to work on teams—that help them acquire and apply these and other skills.
8. Many countries are not yet achieving these goals. First, the learning that one would expect to happen in schools—whether expectations are based on formal curriculums, needs of employers, or just common sense—is often not occurring. Of even greater concern, many countries are failing to provide learning for all. Individuals already disadvantaged in society—whether because of poverty, location, ethnicity, gender, or disability—learn the least. Thus, education systems are widening social gaps instead of narrowing them. What drives the learning shortfalls is becoming clearer thanks to new analyses spotlighting both the immediate cause—poor service delivery that amplifies the effects of poverty—and the deeper system-level problems, both technical and political, that allow poor-quality schooling to persist.
The learning crisis: low levels, high inequality, slow progress
9. The recent expansion in education is impressive by historical standards. In many developing countries over the past few decades, net enrollment in education has greatly outpaced the historic performance of the today’s industrial countries. It took the United States 40 years—from 1870 to 1910—to increase girls’ enrollments from 57 percent to 88 percent. By contrast, Morocco achieved a similar increase in just 10 years.1 The number of years of schooling completed by the average adult in the developing world more than tripled from 1950 to 2010, from 2.0 to 7.2 years.2 By 2010 the average worker in Bangladesh had completed more years of schooling than the typical worker in France in 1975.3 This progress means that most enrollment gaps in basic education are closing between high- and low-income countries. By 2008 the average low-income country was enrolling students in primary school at nearly the same rate as the average high-income country.
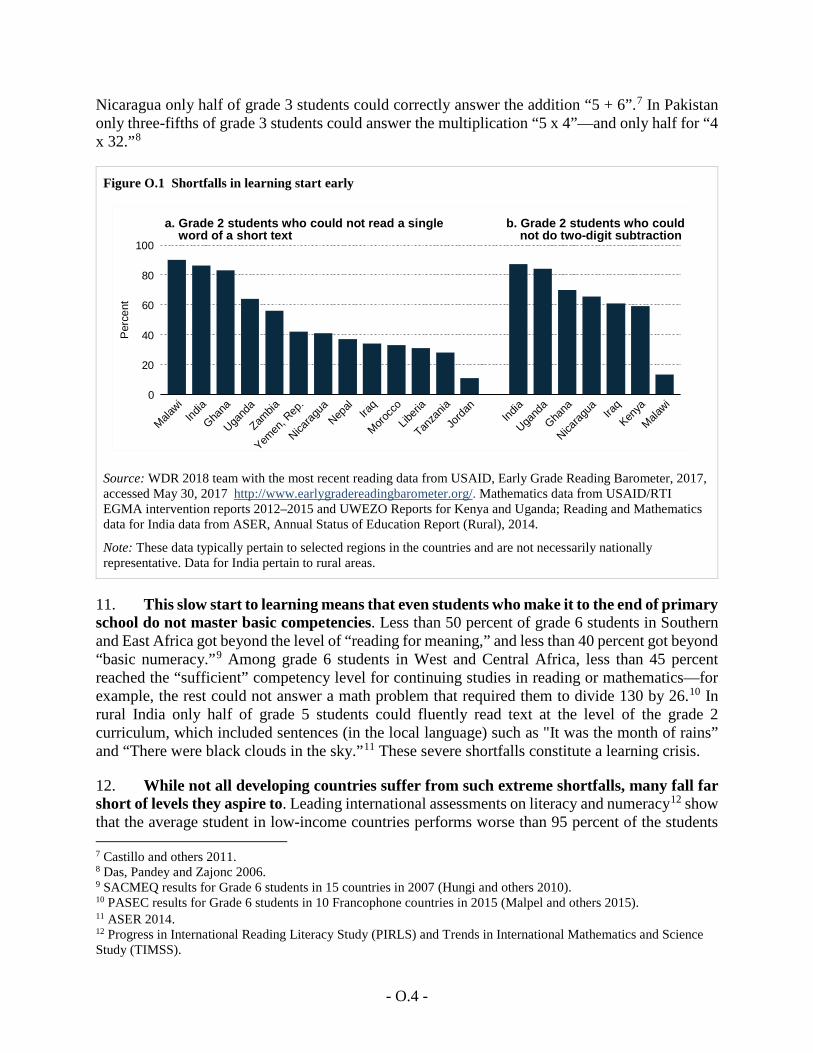
10. But schooling is not the same as learning.4 Children learn very little in many education systems around the world: even after several years in school, millions of students lack basic literacy and numeracy skills. In Malawi and Zambia more than four-fifths of students at the end of grade 2 were unable to read a single familiar word such as “the” or “cat” (figure O.1).5 Even in Peru, a middle-income country, that share was only half before the recent reforms.6 In
1 World Bank 2012. 2 Barro and Lee 2013. 3 Pritchett 2013. 4 Pritchett 2013. 5 Gove and Cvelich 2011. 6 Crouch 2006.
- O.4 -
Nicaragua only half of grade 3 students could correctly answer the addition “5 + 6”.7 In Pakistan only three-fifths of grade 3 students could answer the multiplication “5 x 4”—and only half for “4 x 32.”8
Figure O.1 Shortfalls in learning start early
Source: WDR 2018 team with the most recent reading data from USAID, Early Grade Reading Barometer, 2017, accessed May 30, 2017 http://www.earlygradereadingbarometer.org/. Mathematics data from USAID/RTI EGMA intervention reports 2012–2015 and UWEZO Reports for Kenya and Uganda; Reading and Mathematics data for India data from ASER, Annual Status of Education Report (Rural), 2014.
Note: These data typically pertain to selected regions in the countries and are not necessarily nationally representative. Data for India pertain to rural areas.
11. This slow start to learning means that even students who make it to the end of primary school do not master basic competencies. Less than 50 percent of grade 6 students in Southern and East Africa got beyond the level of “reading for meaning,” and less than 40 percent got beyond “basic numeracy.”9 Among grade 6 students in West and Central Africa, less than 45 percent reached the “sufficient” competency level for continuing studies in reading or mathematics—for example, the rest could not answer a math problem that required them to divide 130 by 26.10 In rural India only half of grade 5 students could fluently read text at the level of the grade 2 curriculum, which included sentences (in the local language) such as "It was the month of rains” and “There were black clouds in the sky.”11 These severe shortfalls constitute a learning crisis.
12. While not all developing countries suffer from such extreme shortfalls, many fall far short of levels they aspire to. Leading international assessments on literacy and numeracy12 show that the average student in low-income countries performs worse than 95 percent of the students 7 Castillo and others 2011. 8 Das, Pandey and Zajonc 2006. 9 SACMEQ results for Grade 6 students in 15 countries in 2007 (Hungi and others 2010). 10 PASEC results for Grade 6 students in 10 Francophone countries in 2015 (Malpel and others 2015). 11 ASER 2014. 12 Progress in International Reading Literacy Study (PIRLS) and Trends in International Mathematics and Science Study (TIMSS).
Malawi
India
Ghana
Ugand
a
Zambia
Yemen
, Rep
.
Nicarag
uaNep
al Iraq
Morocc
o
Liberi
a
Tanza
nia
Jorda
nInd
ia
Ugand
aGha
na
Nicarag
ua Iraq
Kenya
Malawi
b. Grade 2 students who could not do two-digit subtraction
a. Grade 2 students who could not read a single word of a short text
0
20
40
60
80
100
Perc
ent
- O.5 -
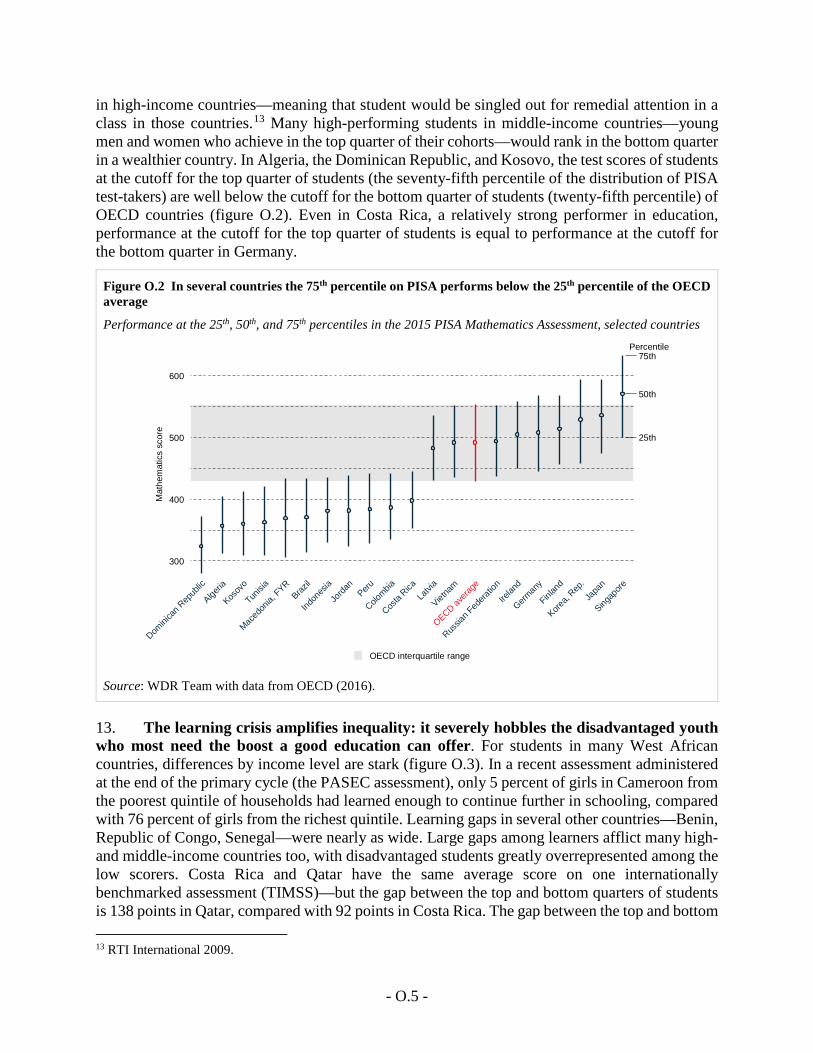
in high-income countries—meaning that student would be singled out for remedial attention in a class in those countries.13 Many high-performing students in middle-income countries—young men and women who achieve in the top quarter of their cohorts—would rank in the bottom quarter in a wealthier country. In Algeria, the Dominican Republic, and Kosovo, the test scores of students at the cutoff for the top quarter of students (the seventy-fifth percentile of the distribution of PISA test-takers) are well below the cutoff for the bottom quarter of students (twenty-fifth percentile) of OECD countries (figure O.2). Even in Costa Rica, a relatively strong performer in education, performance at the cutoff for the top quarter of students is equal to performance at the cutoff for the bottom quarter in Germany.
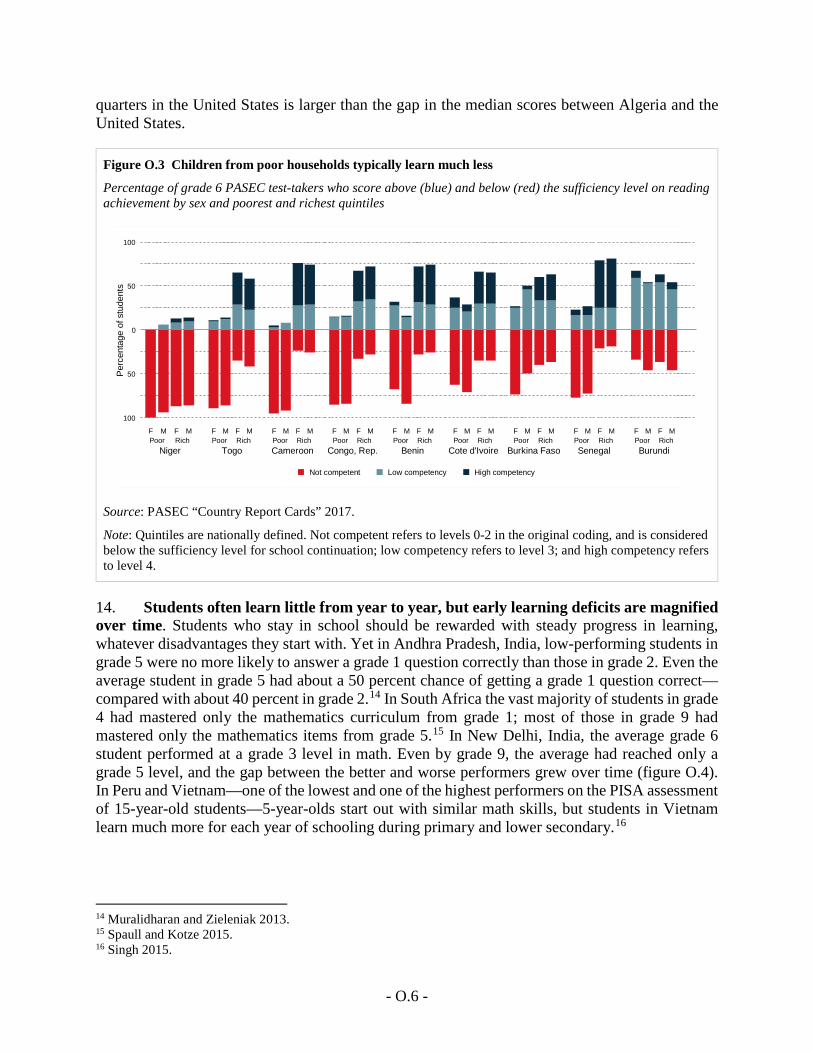
13. The learning crisis amplifies inequality: it severely hobbles the disadvantaged youth who most need the boost a good education can offer. For students in many West African countries, differences by income level are stark (figure O.3). In a recent assessment administered at the end of the primary cycle (the PASEC assessment), only 5 percent of girls in Cameroon from the poorest quintile of households had learned enough to continue further in schooling, compared with 76 percent of girls from the richest quintile. Learning gaps in several other countries—Benin, Republic of Congo, Senegal—were nearly as wide. Large gaps among learners afflict many high- and middle-income countries too, with disadvantaged students greatly overrepresented among the low scorers. Costa Rica and Qatar have the same average score on one internationally benchmarked assessment (TIMSS)—but the gap between the top and bottom quarters of students is 138 points in Qatar, compared with 92 points in Costa Rica. The gap between the top and bottom 13 RTI International 2009.
Figure O.2 In several countries the 75th percentile on PISA performs below the 25th percentile of the OECD average
Performance at the 25th, 50th, and 75th percentiles in the 2015 PISA Mathematics Assessment, selected countries
Source: WDR Team with data from OECD (2016).
Algeria
Brazil
Colombia
Costa
Rica
Domini
can R
epub
lic
Finlan
d
German
y
Indon
esia
Irelan
dJa
pan
Jorda
n
Korea,
Rep.
Kosov
oLa
tvia
Maced
onia,
FYR
OECD avera
gePeru
Russia
n Fed
eratio
n
Singap
ore
Tunisia
Vietna
m
Percentile
25th
50th
75th
300
400
500
600
Mat
hem
atic
s sc
ore
OECD interquartile range
- O.6 -
quarters in the United States is larger than the gap in the median scores between Algeria and the United States.
Figure O.3 Children from poor households typically learn much less
Percentage of grade 6 PASEC test-takers who score above (blue) and below (red) the sufficiency level on reading achievement by sex and poorest and richest quintiles
Source: PASEC “Country Report Cards” 2017.
Note: Quintiles are nationally defined. Not competent refers to levels 0-2 in the original coding, and is considered below the sufficiency level for school continuation; low competency refers to level 3; and high competency refers to level 4.
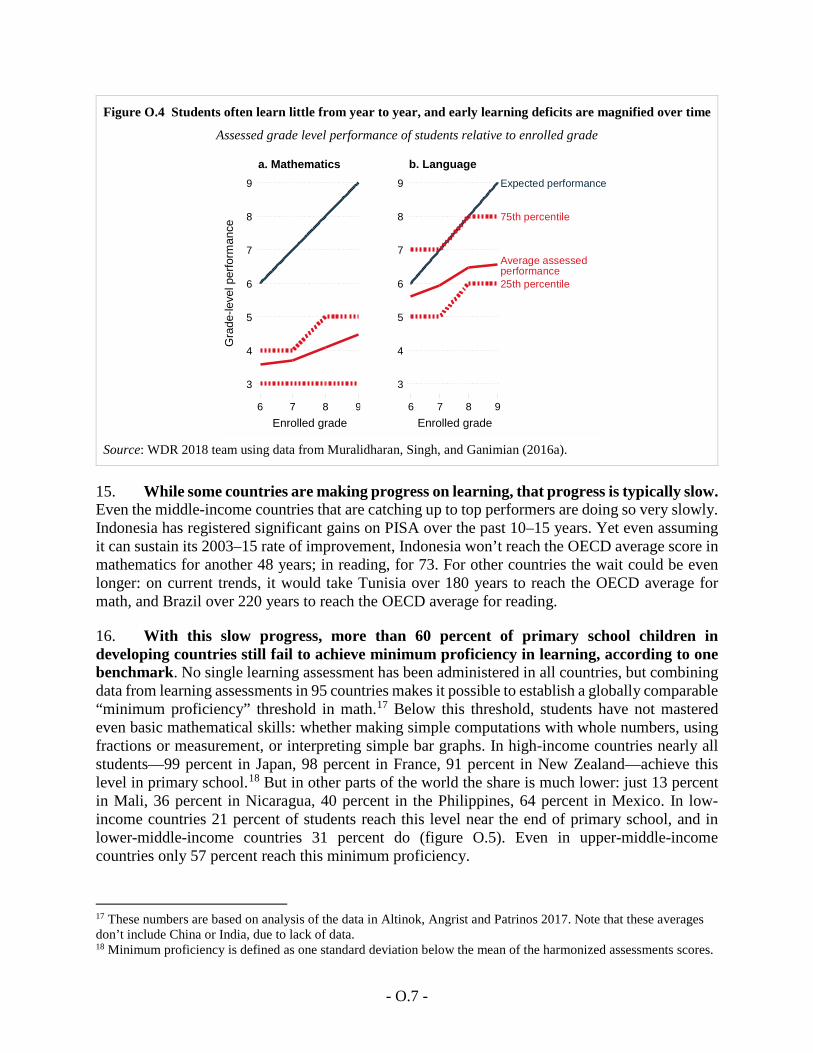
14. Students often learn little from year to year, but early learning deficits are magnified over time. Students who stay in school should be rewarded with steady progress in learning, whatever disadvantages they start with. Yet in Andhra Pradesh, India, low-performing students in grade 5 were no more likely to answer a grade 1 question correctly than those in grade 2. Even the average student in grade 5 had about a 50 percent chance of getting a grade 1 question correct—compared with about 40 percent in grade 2.14 In South Africa the vast majority of students in grade 4 had mastered only the mathematics curriculum from grade 1; most of those in grade 9 had mastered only the mathematics items from grade 5.15 In New Delhi, India, the average grade 6 student performed at a grade 3 level in math. Even by grade 9, the average had reached only a grade 5 level, and the gap between the better and worse performers grew over time (figure O.4). In Peru and Vietnam—one of the lowest and one of the highest performers on the PISA assessment of 15-year-old students—5-year-olds start out with similar math skills, but students in Vietnam learn much more for each year of schooling during primary and lower secondary.16
14 Muralidharan and Zieleniak 2013. 15 Spaull and Kotze 2015. 16 Singh 2015.
100
50
0
50
100
Perc
enta
ge o
f stu
dent
s
Poor RichF M F M
NigerPoor RichF M F M
TogoPoor RichF M F M
CameroonPoor RichF M F M
Congo, Rep.Poor RichF M F M
BeninPoor RichF M F M
Cote d'IvoirePoor RichF M F M
Burkina FasoPoor RichF M F M
SenegalPoor RichF M F M
Burundi
Not competent Low competency High competency
- O.7 -
Figure O.4 Students often learn little from year to year, and early learning deficits are magnified over time
Assessed grade level performance of students relative to enrolled grade
Source: WDR 2018 team using data from Muralidharan, Singh, and Ganimian (2016a).
15. While some countries are making progress on learning, that progress is typically slow. Even the middle-income countries that are catching up to top performers are doing so very slowly. Indonesia has registered significant gains on PISA over the past 10–15 years. Yet even assuming it can sustain its 2003–15 rate of improvement, Indonesia won’t reach the OECD average score in mathematics for another 48 years; in reading, for 73. For other countries the wait could be even longer: on current trends, it would take Tunisia over 180 years to reach the OECD average for math, and Brazil over 220 years to reach the OECD average for reading.
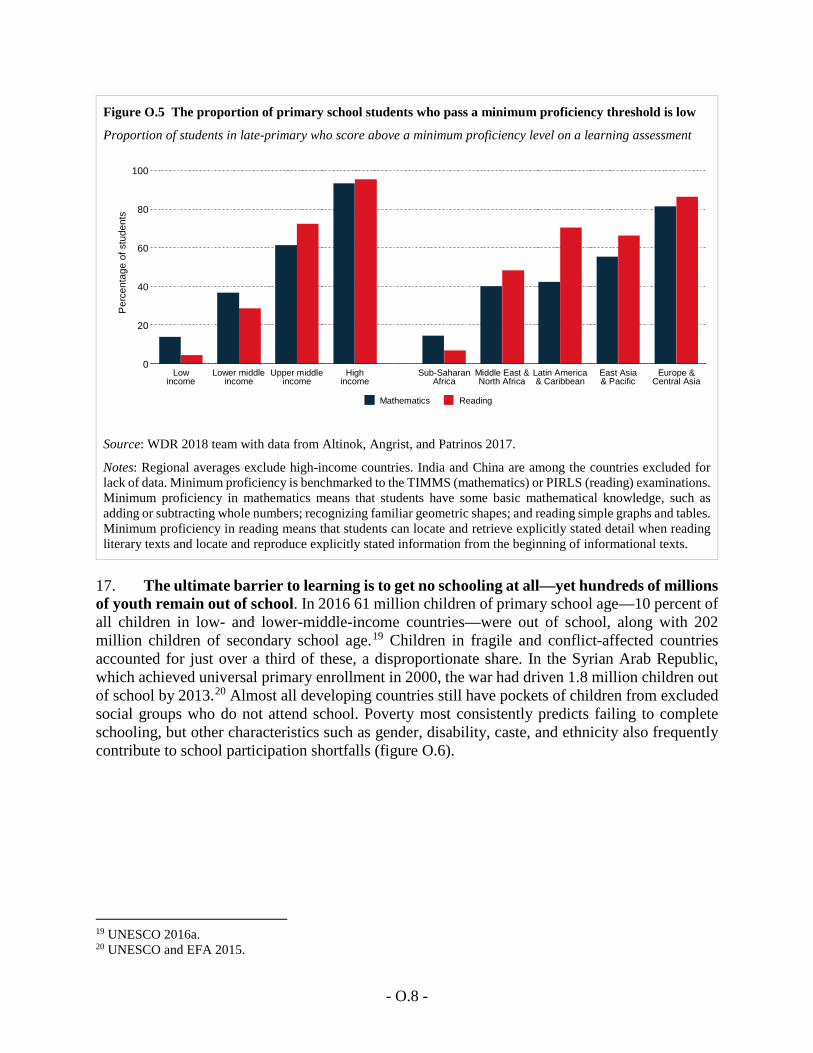
16. With this slow progress, more than 60 percent of primary school children in developing countries still fail to achieve minimum proficiency in learning, according to one benchmark. No single learning assessment has been administered in all countries, but combining data from learning assessments in 95 countries makes it possible to establish a globally comparable “minimum proficiency” threshold in math.17 Below this threshold, students have not mastered even basic mathematical skills: whether making simple computations with whole numbers, using fractions or measurement, or interpreting simple bar graphs. In high-income countries nearly all students—99 percent in Japan, 98 percent in France, 91 percent in New Zealand—achieve this level in primary school.18 But in other parts of the world the share is much lower: just 13 percent in Mali, 36 percent in Nicaragua, 40 percent in the Philippines, 64 percent in Mexico. In low-income countries 21 percent of students reach this level near the end of primary school, and in lower-middle-income countries 31 percent do (figure O.5). Even in upper-middle-income countries only 57 percent reach this minimum proficiency.
17 These numbers are based on analysis of the data in Altinok, Angrist and Patrinos 2017. Note that these averages don’t include China or India, due to lack of data. 18 Minimum proficiency is defined as one standard deviation below the mean of the harmonized assessments scores.
3
4
5
6
7
8
9
Gra
de-le
vel p
erfo
rman
ce
6 7 8 9Enrolled grade
a. MathematicsExpected performance
75th percentile
Average assessedperformance25th percentile
3
4
5
6
7
8
9
6 7 8 9Enrolled grade
b. Language
- O.8 -
Figure O.5 The proportion of primary school students who pass a minimum proficiency threshold is low
Proportion of students in late-primary who score above a minimum proficiency level on a learning assessment
Source: WDR 2018 team with data from Altinok, Angrist, and Patrinos 2017.
Notes: Regional averages exclude high-income countries. India and China are among the countries excluded for lack of data. Minimum proficiency is benchmarked to the TIMMS (mathematics) or PIRLS (reading) examinations. Minimum proficiency in mathematics means that students have some basic mathematical knowledge, such as adding or subtracting whole numbers; recognizing familiar geometric shapes; and reading simple graphs and tables. Minimum proficiency in reading means that students can locate and retrieve explicitly stated detail when reading literary texts and locate and reproduce explicitly stated information from the beginning of informational texts.
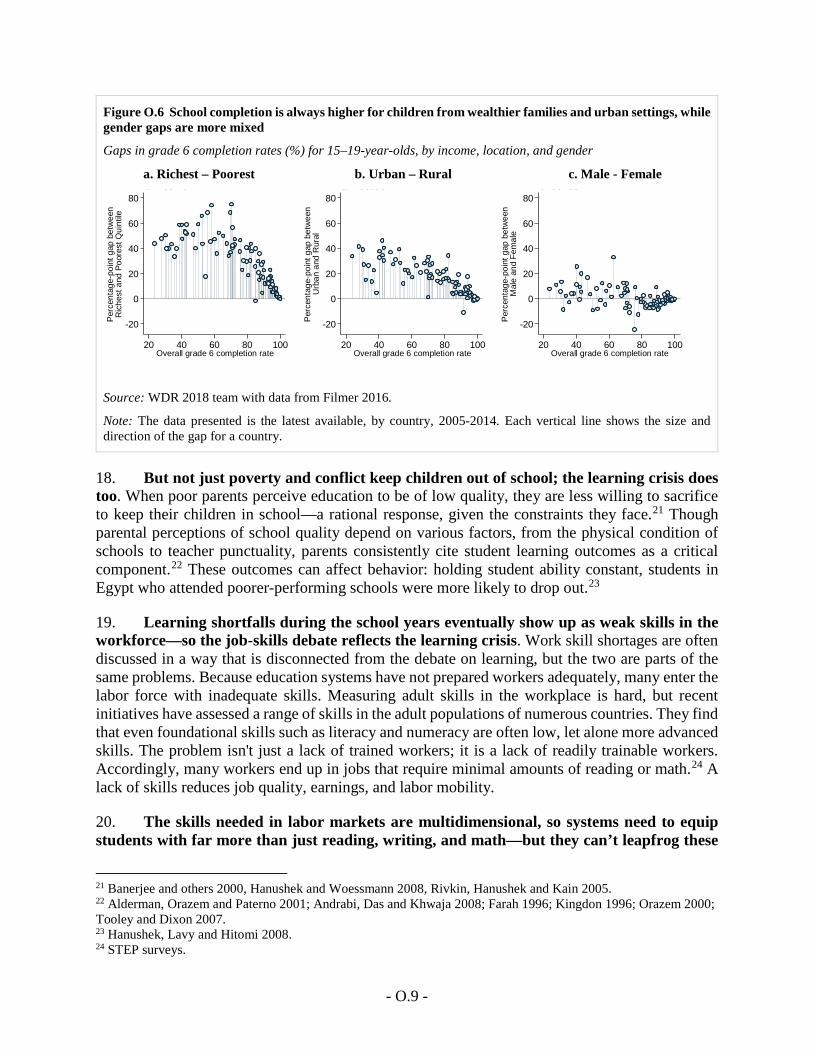
17. The ultimate barrier to learning is to get no schooling at all—yet hundreds of millions of youth remain out of school. In 2016 61 million children of primary school age—10 percent of all children in low- and lower-middle-income countries—were out of school, along with 202 million children of secondary school age.19 Children in fragile and conflict-affected countries accounted for just over a third of these, a disproportionate share. In the Syrian Arab Republic, which achieved universal primary enrollment in 2000, the war had driven 1.8 million children out of school by 2013.20 Almost all developing countries still have pockets of children from excluded social groups who do not attend school. Poverty most consistently predicts failing to complete schooling, but other characteristics such as gender, disability, caste, and ethnicity also frequently contribute to school participation shortfalls (figure O.6).
19 UNESCO 2016a. 20 UNESCO and EFA 2015.
0
20
40
60
80
100
Per
cent
age
of s
tude
nts
Lowincome
Lower middleincome
Upper middleincome
Highincome
Sub-SaharanAfrica
Middle East &North Africa
Latin America& Caribbean
East Asia& Pacific
Europe &Central Asia
Mathematics Reading
- O.9 -
Figure O.6 School completion is always higher for children from wealthier families and urban settings, while gender gaps are more mixed
Gaps in grade 6 completion rates (%) for 15–19-year-olds, by income, location, and gender
a. Richest – Poorest b. Urban – Rural c. Male - Female
Source: WDR 2018 team with data from Filmer 2016.
Note: The data presented is the latest available, by country, 2005-2014. Each vertical line shows the size and direction of the gap for a country.
18. But not just poverty and conflict keep children out of school; the learning crisis does too. When poor parents perceive education to be of low quality, they are less willing to sacrifice to keep their children in school—a rational response, given the constraints they face.21 Though parental perceptions of school quality depend on various factors, from the physical condition of schools to teacher punctuality, parents consistently cite student learning outcomes as a critical component.22 These outcomes can affect behavior: holding student ability constant, students in Egypt who attended poorer-performing schools were more likely to drop out.23
19. Learning shortfalls during the school years eventually show up as weak skills in the workforce—so the job-skills debate reflects the learning crisis. Work skill shortages are often discussed in a way that is disconnected from the debate on learning, but the two are parts of the same problems. Because education systems have not prepared workers adequately, many enter the labor force with inadequate skills. Measuring adult skills in the workplace is hard, but recent initiatives have assessed a range of skills in the adult populations of numerous countries. They find that even foundational skills such as literacy and numeracy are often low, let alone more advanced skills. The problem isn't just a lack of trained workers; it is a lack of readily trainable workers. Accordingly, many workers end up in jobs that require minimal amounts of reading or math.24 A lack of skills reduces job quality, earnings, and labor mobility.
20. The skills needed in labor markets are multidimensional, so systems need to equip students with far more than just reading, writing, and math—but they can’t leapfrog these
21 Banerjee and others 2000, Hanushek and Woessmann 2008, Rivkin, Hanushek and Kain 2005. 22 Alderman, Orazem and Paterno 2001; Andrabi, Das and Khwaja 2008; Farah 1996; Kingdon 1996; Orazem 2000; Tooley and Dixon 2007. 23 Hanushek, Lavy and Hitomi 2008. 24 STEP surveys.
-20
0
20
40
60
80
Perc
enta
ge-p
oint
gap
bet
wee
nR
iche
st a
nd P
oore
st Q
uint
ile
20 40 60 80 100Overall grade 6 completion rate
a co e
-20
0
20
40
60
80
Perc
enta
ge-p
oint
gap
bet
wee
nU
rban
and
Rur
al
20 40 60 80 100Overall grade 6 completion rate
b ocat o
-20
0
20
40
60
80
Perc
enta
ge-p
oint
gap
bet
wee
nM
ale
and
Fem
ale
20 40 60 80 100Overall grade 6 completion rate
c Ge de
- O.10 -
foundational skills. Whether as workers or members of society, people also need higher-order cognitive skills such as problem-solving. In addition, they need socioemotional skills—sometimes called soft or noncognitive skills—such as conscientiousness. Finally, they need technical skills to perform a specific job. But the foundational cognitive skills are essential, and systems cannot bypass the challenges of developing them as they target higher-order skills.25
21. Tackling the learning crisis and skills gaps requires diagnosing their causes—both their immediate causes at the school level and their deeper systemic drivers. Given all the investments that countries have made in education, shortfalls in learning are discouraging. But one reason for them is that learning has not always received the focus it should have. As a result, stakeholders lack actionable information about what is going wrong in their schools and in the broader society, and so cannot craft context-appropriate responses to improve learning. Before turning to the responses, we need first to examine how schools are failing learners, and how systems are failing schools.
How schools are failing learners
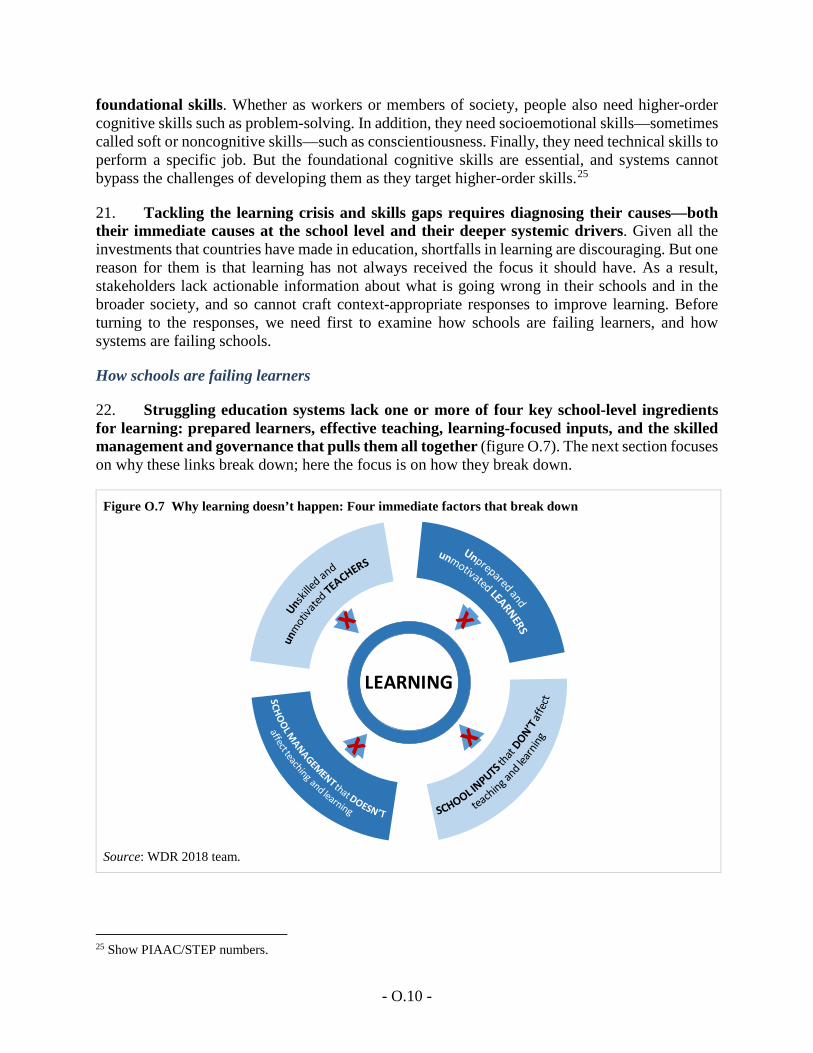
22. Struggling education systems lack one or more of four key school-level ingredients for learning: prepared learners, effective teaching, learning-focused inputs, and the skilled management and governance that pulls them all together (figure O.7). The next section focuses on why these links break down; here the focus is on how they break down.
Figure O.7 Why learning doesn’t happen: Four immediate factors that break down
Source: WDR 2018 team.
25 Show PIAAC/STEP numbers.
LEARNING
- O.11 -
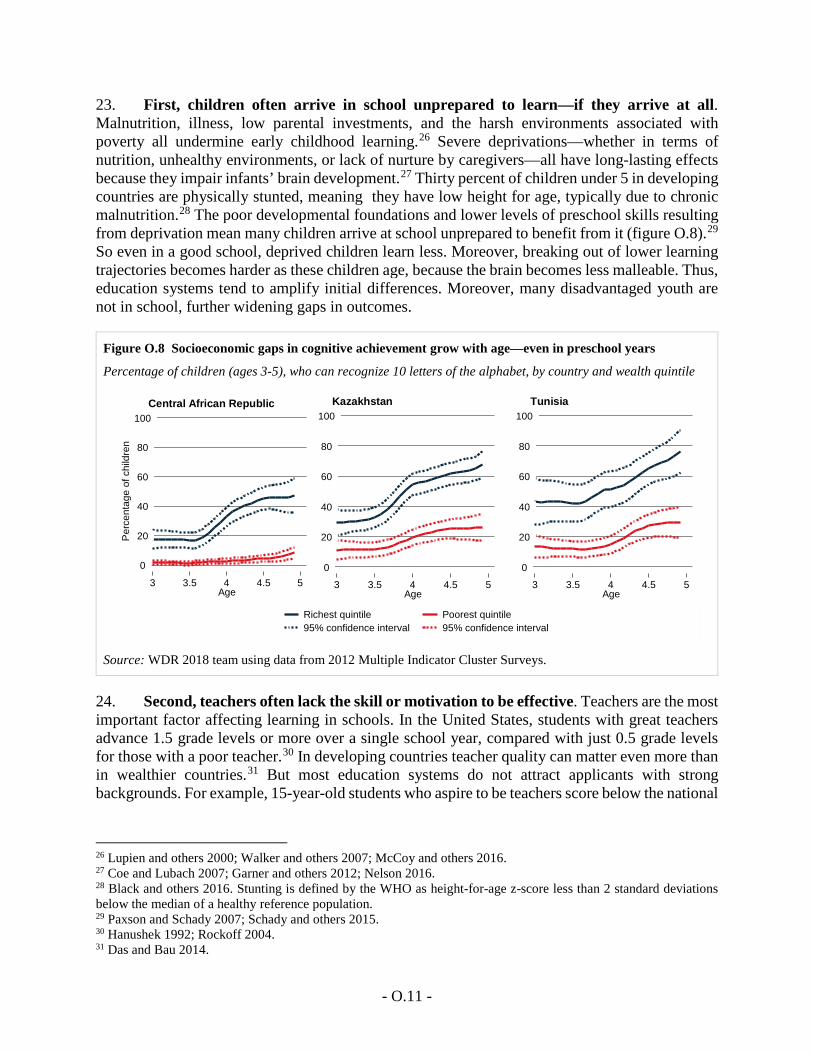
23. First, children often arrive in school unprepared to learn—if they arrive at all. Malnutrition, illness, low parental investments, and the harsh environments associated with poverty all undermine early childhood learning.26 Severe deprivations—whether in terms of nutrition, unhealthy environments, or lack of nurture by caregivers—all have long-lasting effects because they impair infants’ brain development.27 Thirty percent of children under 5 in developing countries are physically stunted, meaning they have low height for age, typically due to chronic malnutrition.28 The poor developmental foundations and lower levels of preschool skills resulting from deprivation mean many children arrive at school unprepared to benefit from it (figure O.8).29 So even in a good school, deprived children learn less. Moreover, breaking out of lower learning trajectories becomes harder as these children age, because the brain becomes less malleable. Thus, education systems tend to amplify initial differences. Moreover, many disadvantaged youth are not in school, further widening gaps in outcomes.
Figure O.8 Socioeconomic gaps in cognitive achievement grow with age—even in preschool years
Percentage of children (ages 3-5), who can recognize 10 letters of the alphabet, by country and wealth quintile
Source: WDR 2018 team using data from 2012 Multiple Indicator Cluster Surveys.
24. Second, teachers often lack the skill or motivation to be effective. Teachers are the most important factor affecting learning in schools. In the United States, students with great teachers advance 1.5 grade levels or more over a single school year, compared with just 0.5 grade levels for those with a poor teacher.30 In developing countries teacher quality can matter even more than in wealthier countries.31 But most education systems do not attract applicants with strong backgrounds. For example, 15-year-old students who aspire to be teachers score below the national
26 Lupien and others 2000; Walker and others 2007; McCoy and others 2016. 27 Coe and Lubach 2007; Garner and others 2012; Nelson 2016. 28 Black and others 2016. Stunting is defined by the WHO as height-for-age z-score less than 2 standard deviations below the median of a healthy reference population. 29 Paxson and Schady 2007; Schady and others 2015. 30 Hanushek 1992; Rockoff 2004. 31 Das and Bau 2014.
0
20
40
60
80
100
Per
cent
age
of c
hild
ren
3 3.5 4 4.5 5Age
Central African Republic
0
20
40
60
80
100
3 3.5 4 4.5 5Age
Kazakhstan
0
20
40
60
80
100
3 3.5 4 4.5 5Age
Tunisia
Richest quintile Poorest quintile95% confidence interval 95% confidence interval
- O.12 -
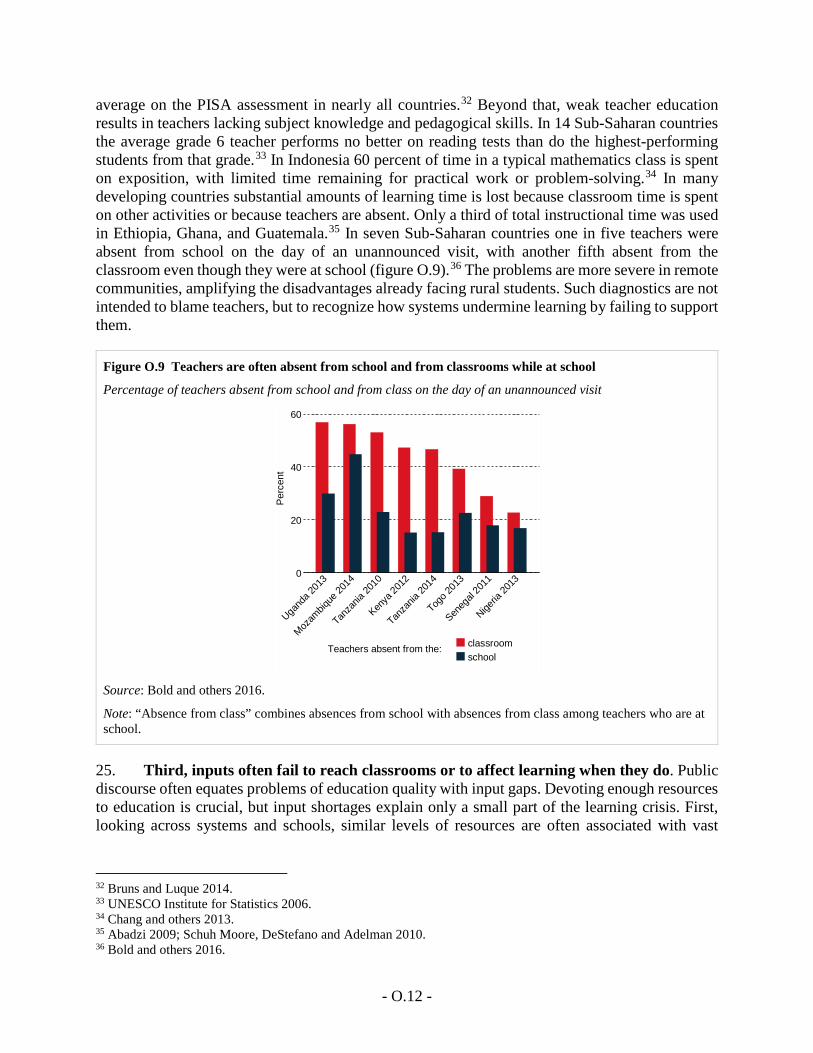
average on the PISA assessment in nearly all countries.32 Beyond that, weak teacher education results in teachers lacking subject knowledge and pedagogical skills. In 14 Sub-Saharan countries the average grade 6 teacher performs no better on reading tests than do the highest-performing students from that grade.33 In Indonesia 60 percent of time in a typical mathematics class is spent on exposition, with limited time remaining for practical work or problem-solving.34 In many developing countries substantial amounts of learning time is lost because classroom time is spent on other activities or because teachers are absent. Only a third of total instructional time was used in Ethiopia, Ghana, and Guatemala.35 In seven Sub-Saharan countries one in five teachers were absent from school on the day of an unannounced visit, with another fifth absent from the classroom even though they were at school (figure O.9).36 The problems are more severe in remote communities, amplifying the disadvantages already facing rural students. Such diagnostics are not intended to blame teachers, but to recognize how systems undermine learning by failing to support them.
Figure O.9 Teachers are often absent from school and from classrooms while at school
Percentage of teachers absent from school and from class on the day of an unannounced visit
Source: Bold and others 2016.
Note: “Absence from class” combines absences from school with absences from class among teachers who are at school.
25. Third, inputs often fail to reach classrooms or to affect learning when they do. Public discourse often equates problems of education quality with input gaps. Devoting enough resources to education is crucial, but input shortages explain only a small part of the learning crisis. First, looking across systems and schools, similar levels of resources are often associated with vast
32 Bruns and Luque 2014. 33 UNESCO Institute for Statistics 2006. 34 Chang and others 2013. 35 Abadzi 2009; Schuh Moore, DeStefano and Adelman 2010. 36 Bold and others 2016.
0
20
40
60
Perc
ent
Ugand
a 201
3
Mozam
bique
2014
Tanza
nia 20
10
Kenya
2012
Tanza
nia 20
14
Togo 2
013
Seneg
al 20
11
Nigeria
2013
classroomschool
Teachers absent from the:
- O.13 -
differences in learning outcomes.37 Second, increasing inputs in a given setting often has small effects on learning outcomes.38 Part of the reason is that inputs often fail to make it to the frontlines. In Sierra Leone textbooks were distributed to schools—but follow-up inspections found most of them locked up in cupboards, unused.39 Similarly, many technological interventions fail before they reach classrooms, and even when they do make it to classrooms, they often do not enhance teaching or learning. In Brazil a One Laptop per Child initiative in several states faced years of delays. Even a year after the laptops finally made it to classrooms, more than 40 percent of teachers reported having never or rarely used them in classroom activities.40
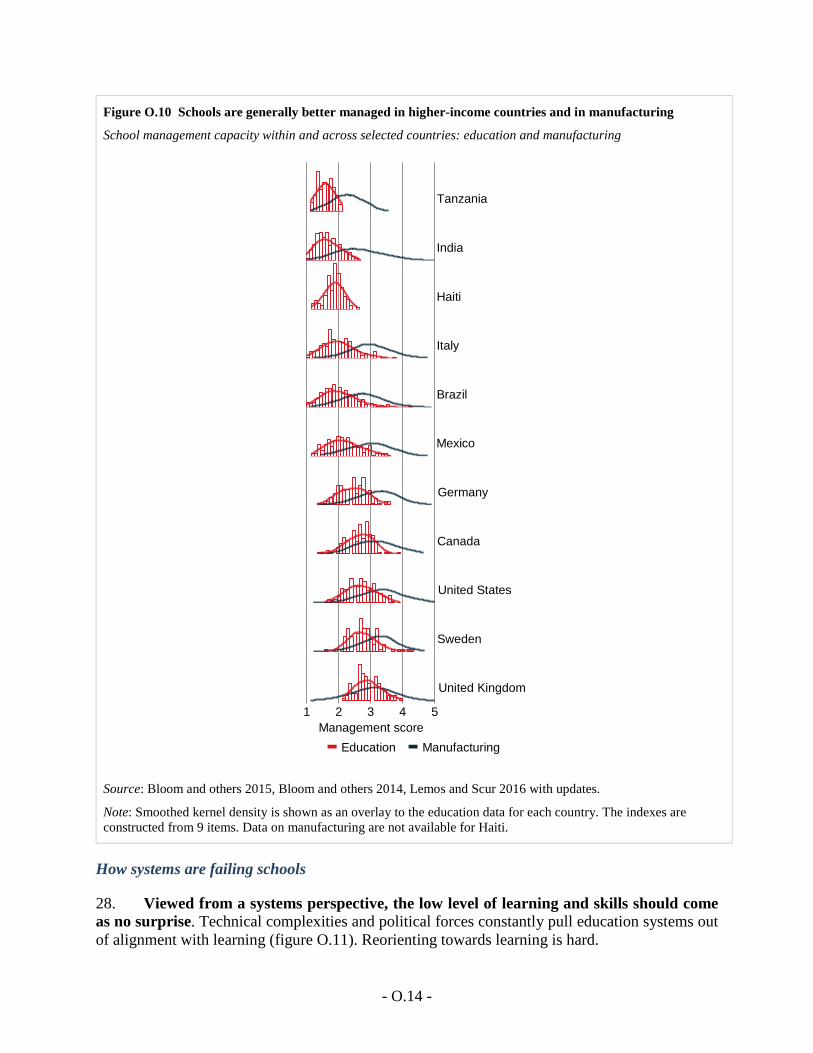
26. Fourth, poor management and governance often undermine schooling quality. Though effective school leadership doesn’t raise student learning directly, it does so indirectly by improving teaching quality and ensuring effective use of resources.41 Across eight countries a 1 standard deviation increase in an index of management capacity—based on the adoption of 20 management practices—is associated with a 0.23–0.43 standard deviation increase in student outcomes. But school management capacity tends to be lowest in the countries studied with the lowest income levels, and management capacity is substantially lower in schools than in manufacturing (figure O.10).42 Ineffective school leadership means school principals who are not actively involved in helping teachers solve problems, do not provide instructional advice, and do not set goals that prioritize learning. School governance—particularly the decision-making autonomy schools have, along with the extent of oversight provided by parents and communities—provides the framework for seeking local solutions and being accountable for them. In many settings schools lack any meaningful autonomy, and community engagement fails to affect what happens in classrooms.43
27. Because these quality problems are concentrated among disadvantaged children, they amplify social inequalities. In low-income countries, on average, stunting rates among children under 5 are almost three times higher in the poorest quintile than the richest.44 In schools, problems with teacher absenteeism, lack of inputs, and weak management are typically most severe in communities that serve the poorest students. It’s not just that spending patterns typically disadvantage marginalized communities, but also that resources are used less effectively there, exacerbating the problem. Public policy thus has the effect of widening social gaps, rather than offering all children an opportunity to learn.
37 Hanushek 1995; Tan and Mingat 1992; Mingat and Tan 1998; Wolf 2004. 38 Hanushek 1986; Glewwe and others 2011; Kremer 1995. 39 Sabarwal, Evans and Marshak 2014. 40 Lavinas and Veiga 2013. 41 Robinson, Lloyd and Rowe 2008; Waters, Marzano and McNulty 2003. 42 Bloom and others 2015. Management areas include operations, monitoring, target setting, and people management. 43 World Bank 2003; Orazem, Glewwe and Patrinos 2007; Bruns, Filmer and Patrinos 2011. 44 Data extracted from DHS StatCompiler.
- O.14 -
Figure O.10 Schools are generally better managed in higher-income countries and in manufacturing
School management capacity within and across selected countries: education and manufacturing
Source: Bloom and others 2015, Bloom and others 2014, Lemos and Scur 2016 with updates.
Note: Smoothed kernel density is shown as an overlay to the education data for each country. The indexes are constructed from 9 items. Data on manufacturing are not available for Haiti.
How systems are failing schools
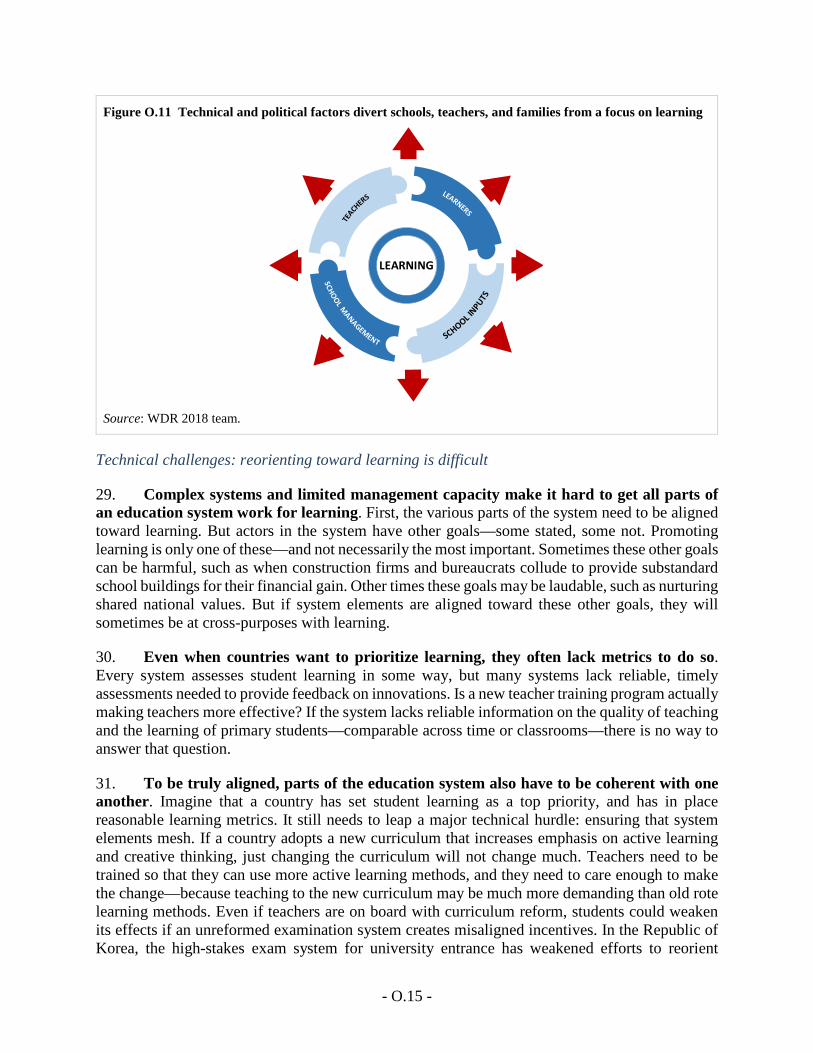
28. Viewed from a systems perspective, the low level of learning and skills should come as no surprise. Technical complexities and political forces constantly pull education systems out of alignment with learning (figure O.11). Reorienting towards learning is hard.
Tanzania
India
Haiti
Italy
Brazil
Mexico
Germany
Canada
United States
Sweden
United Kingdom
1 2 3 4 5Management score
Education Manufacturing
- O.15 -
Figure O.11 Technical and political factors divert schools, teachers, and families from a focus on learning
Source: WDR 2018 team.
Technical challenges: reorienting toward learning is difficult
29. Complex systems and limited management capacity make it hard to get all parts of an education system work for learning. First, the various parts of the system need to be aligned toward learning. But actors in the system have other goals—some stated, some not. Promoting learning is only one of these—and not necessarily the most important. Sometimes these other goals can be harmful, such as when construction firms and bureaucrats collude to provide substandard school buildings for their financial gain. Other times these goals may be laudable, such as nurturing shared national values. But if system elements are aligned toward these other goals, they will sometimes be at cross-purposes with learning.
30. Even when countries want to prioritize learning, they often lack metrics to do so. Every system assesses student learning in some way, but many systems lack reliable, timely assessments needed to provide feedback on innovations. Is a new teacher training program actually making teachers more effective? If the system lacks reliable information on the quality of teaching and the learning of primary students—comparable across time or classrooms—there is no way to answer that question.
31. To be truly aligned, parts of the education system also have to be coherent with one another. Imagine that a country has set student learning as a top priority, and has in place reasonable learning metrics. It still needs to leap a major technical hurdle: ensuring that system elements mesh. If a country adopts a new curriculum that increases emphasis on active learning and creative thinking, just changing the curriculum will not change much. Teachers need to be trained so that they can use more active learning methods, and they need to care enough to make the change—because teaching to the new curriculum may be much more demanding than old rote learning methods. Even if teachers are on board with curriculum reform, students could weaken its effects if an unreformed examination system creates misaligned incentives. In the Republic of Korea, the high-stakes exam system for university entrance has weakened efforts to reorient
LEARNING
- O.16 -
secondary school learning. The curriculum has changed to build students’ creativity and socioemotional skills, but many parents still send their children to private “cram schools” for test preparation.45
32. The need for coherence makes it risky to borrow system elements from other countries. Education policymakers and other experts often scrutinize systems with better learning outcomes to identify what they could borrow. Indeed, in the 2000s the search for the secret behind Finland’s admirable record of learning with equity led to a swarm of visiting delegations in what the Finns have dubbed “PISA tourism.” Finland’s system gives considerable autonomy to its well-educated teachers, who can tailor their teaching to the needs of their students. But lower-performing systems that import Finland’s teacher autonomy into their own contexts are likely to be disappointed: if teachers are poorly educated, unmotivated, and loosely managed, then giving them even more autonomy will likely make matters worse. South Africa discovered this in the 1990s and 2000s, when it adopted a curriculum approach that set goals but left implementation up to teachers.46 The approach failed because it proved to be a poor fit for the capacity of teachers and the resources at their disposal.47 Home-grown, context-specific solutions are important.
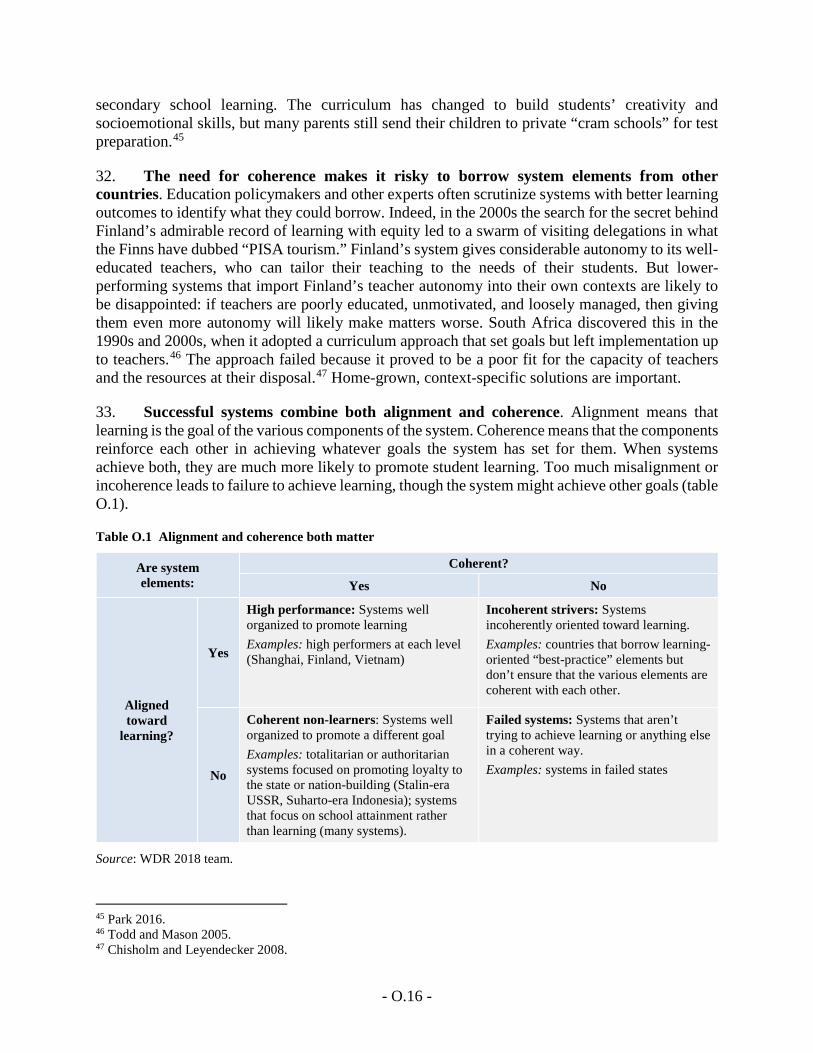
33. Successful systems combine both alignment and coherence. Alignment means that learning is the goal of the various components of the system. Coherence means that the components reinforce each other in achieving whatever goals the system has set for them. When systems achieve both, they are much more likely to promote student learning. Too much misalignment or incoherence leads to failure to achieve learning, though the system might achieve other goals (table O.1).
Table O.1 Alignment and coherence both matter
Are system elements:
Coherent?
Yes No
Aligned toward
learning?
Yes
High performance: Systems well organized to promote learning Examples: high performers at each level (Shanghai, Finland, Vietnam)
Incoherent strivers: Systems incoherently oriented toward learning. Examples: countries that borrow learning-oriented “best-practice” elements but don’t ensure that the various elements are coherent with each other.
No
Coherent non-learners: Systems well organized to promote a different goal Examples: totalitarian or authoritarian systems focused on promoting loyalty to the state or nation-building (Stalin-era USSR, Suharto-era Indonesia); systems that focus on school attainment rather than learning (many systems).
Failed systems: Systems that aren’t trying to achieve learning or anything else in a coherent way. Examples: systems in failed states
Source: WDR 2018 team.
45 Park 2016. 46 Todd and Mason 2005. 47 Chisholm and Leyendecker 2008.
- O.17 -
Political challenges: key players don’t always want to prioritize student learning
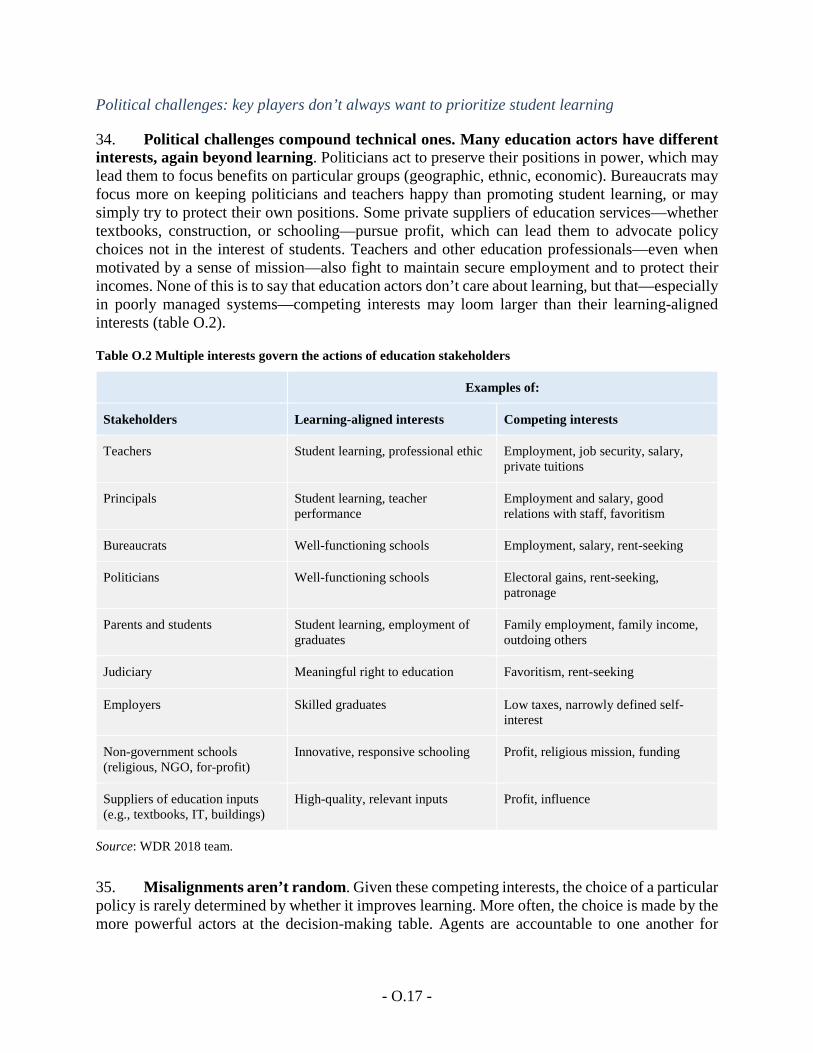
34. Political challenges compound technical ones. Many education actors have different interests, again beyond learning. Politicians act to preserve their positions in power, which may lead them to focus benefits on particular groups (geographic, ethnic, economic). Bureaucrats may focus more on keeping politicians and teachers happy than promoting student learning, or may simply try to protect their own positions. Some private suppliers of education services—whether textbooks, construction, or schooling—pursue profit, which can lead them to advocate policy choices not in the interest of students. Teachers and other education professionals—even when motivated by a sense of mission—also fight to maintain secure employment and to protect their incomes. None of this is to say that education actors don’t care about learning, but that—especially in poorly managed systems—competing interests may loom larger than their learning-aligned interests (table O.2).
Table O.2 Multiple interests govern the actions of education stakeholders
Examples of:
Stakeholders Learning-aligned interests Competing interests
Teachers Student learning, professional ethic Employment, job security, salary, private tuitions
Principals Student learning, teacher performance
Employment and salary, good relations with staff, favoritism
Bureaucrats Well-functioning schools Employment, salary, rent-seeking
Politicians Well-functioning schools Electoral gains, rent-seeking, patronage
Parents and students Student learning, employment of graduates
Family employment, family income, outdoing others
Judiciary Meaningful right to education Favoritism, rent-seeking
Employers Skilled graduates Low taxes, narrowly defined self-interest
Non-government schools (religious, NGO, for-profit)
Innovative, responsive schooling Profit, religious mission, funding
Suppliers of education inputs (e.g., textbooks, IT, buildings)
High-quality, relevant inputs Profit, influence
Source: WDR 2018 team.
35. Misalignments aren’t random. Given these competing interests, the choice of a particular policy is rarely determined by whether it improves learning. More often, the choice is made by the more powerful actors at the decision-making table. Agents are accountable to one another for
- O.18 -
different reasons, not just learning. Given these interests, it should come as no surprise that little learning often results.
36. One problem is that activities to promote learning are difficult to manage. Teaching and learning in the classroom involve significant discretion by teachers, as well as regular and repeated interactions between students and teachers.48 These characteristics, coupled with a dearth of reliable information on learning, make managing learning more difficult than pursuing other goals.49 For example, improvements in access can be monitored by looking at simple, easily collected enrollment data. Similarly, school construction, cash transfer, teacher hiring, and school grant programs intended to expand access are all highly visible, easily monitored investments.
37. Potential beneficiaries of learning—such as students, parents, and employers—are often too poorly organized, uninformed, or short-sighted to push for better learning. Parents are usually not organized to participate in debates at the system level, and they may lack knowledge of the potential gains from different policies to improve learning.50 They may also worry about the potential ramifications on their children or themselves of opposing interests such as teachers, bureaucrats, and politicians. Students have even less power—except sometimes in higher education, where they can threaten demonstrations—and, like parents, may be unaware of how little they are learning until they start looking for work. Finally, the business community, even if it suffers from a shortage of skilled graduates to hire, often fails to advocate for quality education, instead lobbying for lower taxes and spending. By contrast to these potential beneficiaries of reform, potential losers tend to be more aware of what is at stake for them and, in many cases, better organized to act collectively.
38. As a result, many systems are stuck in low-learning traps, characterized by low accountability and high inequality. These traps bind together key stakeholders through informal contracts that prioritize other goals such as civil service employment, corporate profits, or reelection—perpetuating the low-accountability equilibrium. In better-run systems, actors such as bureaucrats and teachers can devote much of their energy to improving outcomes for students. But in low-learning traps those same actors lack either the incentives or the support needed to focus on learning. Instead they are constantly pressured to deliver other services for more powerful players. As actors juggle multiple objectives, relying on each other in an environment of uncertainty, low social trust, and risk aversion, it is often in the interest of each individual to maintain the status quo—even if society, and many of these individuals, would be better off if they could shift to a higher-quality equilibrium.
39. This diagnosis has focused on the shortfalls in foundational learning, as will the priorities for action discussed next. This focus should not be interpreted as a statement that other areas are unimportant. Education systems and their enabling environment are broader and more complex than this Report can cover, so our priority is to highlight what can be done most immediately to strengthen the foundations of learning on which all successful systems are built. But both the diagnosis and the priorities for action are relevant for other parts of the system, such
48 World Bank 2003. 49 Andrews, Pritchett and Woolcock 2017. 50 Grindle 2004.
- O.19 -
as higher education or lifelong learning. In these areas too, many countries suffer from a lack of focus on outcomes, wide gaps in opportunity, and systemic barriers to resolving these problems.
Still, there are reasons for hope
40. Even in countries that seem stuck in low-learning traps, some teachers and schoolsmanage to strengthen learning. These examples may not be sustainable, and they are not likelyto spread systemwide without efforts to reorient the system toward learning. But systems willingto learn from these outliers can benefit. On a larger scale, some regions within countries are moresuccessful in promoting learning, as are some countries at each income level. These examplesshow that higher-level system equilibriums exist. But is it possible for a whole system to escapethe low-learning trap—moving to a better one?
41. There are at least two reasons for optimism. First, as countries innovate to improvelearning, they can draw on more systematic knowledge about what can work at the microlevel—the level of learners, classrooms, and schools—than ever before. A number ofinterventions, innovations, and approaches have resulted in substantial increases in learning. Thesepromising approaches come in many flavors—new pedagogical methods, ways to ensure thatstudents and teachers are motivated, approaches to school management, technologies to enhanceteaching learning—and may not pay off in all contexts. But the fact that it is possible to improvelearning outcomes should provide hope. These interventions can provide substantial improvementsin learning: almost one or two grade-equivalents for some students.51 Though successfulinterventions cannot be imported wholesale into new contexts, countries can use them as startingpoints for their own innovations.
42. Second, some countries have implemented reforms that have led to sustained system-wide improvements in learning. Finland’s major education reform in the 1970s famouslyimproved the equity of outcomes while also increasing quality, so that by the time of the first PISAin 2000, Finland topped the assessment. More recently, Chile, Peru, Poland, and the UnitedKingdom have made serious, sustained commitments to reforming the quality of their educationsystems. In all these countries learning has improved over time—not always steadily, but enoughto show that system-level reforms can pay off. Shanghai, China and Vietnam today—and Koreadecades ago—show that it is possible to perform far better than income levels would predict,thanks to a sustained focus on learning with equity. Brazil and Indonesia have made considerableprogress despite the challenges of reforming large, decentralized systems.
All for learning: How to realize education’s promise
43. Learning outcomes won’t change unless education systems take learning seriouslyand use learning as a guide and metric. This idea can be summarized as “all for learning.”52
As this section explains, a commitment to all for learning—and thus to learning for all—impliesthree complementary strategies:
• Assess learning: Measure and track learning better, so systems can make it a serious goal
51 Evans and Yuan 2017. 52 The team thanks Professor Kai-Ming Cheng for suggesting this formulation.
- O.20 -
• Act to make schools work for learners: Use evidence to guide innovation and practice
• Align actors: Make the whole system work for learning, by tackling technical and political barriers
44. These three strategies depend on one another. Adopting a learning metric without any credible way to achieve learning goals will simply lead to frustration. School-level innovations without a learning metric could lead schools off course, and without the system-level support they could prove ephemeral. And system-level commitment to learning without school-level innovation, and without learning measures to guide the reforms, is unlikely to amount to more than aspirational rhetoric. But together, the three strategies can create change for the better.
45. The potential payoff is huge. When children have a growth mindset, meaning that they understand their own great learning potential, they learn much more than when they believe they are constrained by a fixed intelligence.53 Societies have this same opportunity. By adopting a social growth mindset—recognizing the barriers to learning, but also the very real opportunities to break them down—they can make progress on learning. One overarching priority should be to end the hidden exclusion of low learning. This is not just the right thing to do; it is also the surest way to improve average learning levels and reap education’s full rewards for society as a whole.
Assess learning
“What gets measured gets managed.”
“Just weighing the pig doesn’t make it fatter.”
46. There is some truth in both of these sayings. Lack of measurement makes it hard to know where things are, where they are going, and what actions are making any difference. Knowing these things can draw focus and stimulate action. But measurement that is too removed from action can lead nowhere. The challenge is striking a balance—finding the right measures, for the right purposes, and implementing them within an appropriate accountability framework.
Using measurement to shine a light on learning
47. The first step to improving system-wide learning is to put in place good metrics for monitoring whether programs and policies are delivering learning. Credible, reliable information can shape the incentives facing politicians. Most notably, information on student learning and school performance—if presented in a way that makes it salient and acceptable—fosters healthier political engagement and better service delivery. Information also helps policymakers manage a complex system.
48. Measuring learning can improve equity by revealing hidden exclusions. As the first part of this overview emphasized, the learning crisis is not just a problem for the society and economy overall; it’s also a fundamental source of inequities and widening gaps in opportunity. But because reliable information on learning is so spotty in many education systems, especially in primary and lower secondary school, the way the system is failing disadvantaged children is a 53 Dweck 2008.
- O.21 -
hidden exclusion.54 Unlike exclusion from school, a lack of learning is often invisible, making it impossible to families and communities of their right to quality education.
49. These measures of learning will never be the only guide of educational progress, nor should they be. Education systems should have ways of tracking progress toward any goal they set for themselves and their students—not just learning. But learning metrics are an essential starting point for improvement in lagging systems.
There is too little measurement of learning, not too much
50. The recommendation to start tackling the learning crisis with more and better measurement of learning may seem jarring. Many education debates focus on overtesting or overemphasis on tests. In the United States two decades of high-stakes testing have led to patterns consistent with these concerns.55 Teachers have been found to focus on test-specific skills instead of untested subjects, and schools have engaged in strategic behavior to ensure that only better-performing students are tested, such as assigning students to special education that excuses them from testing.56 In the extreme, problems have expanded to convictions for systemic cheating at the level of a school district.57 At the same time, media reports in many low- and middle-income countries (and some high-income ones) are often focused on high-stakes national examinations that screen candidates for tertiary education
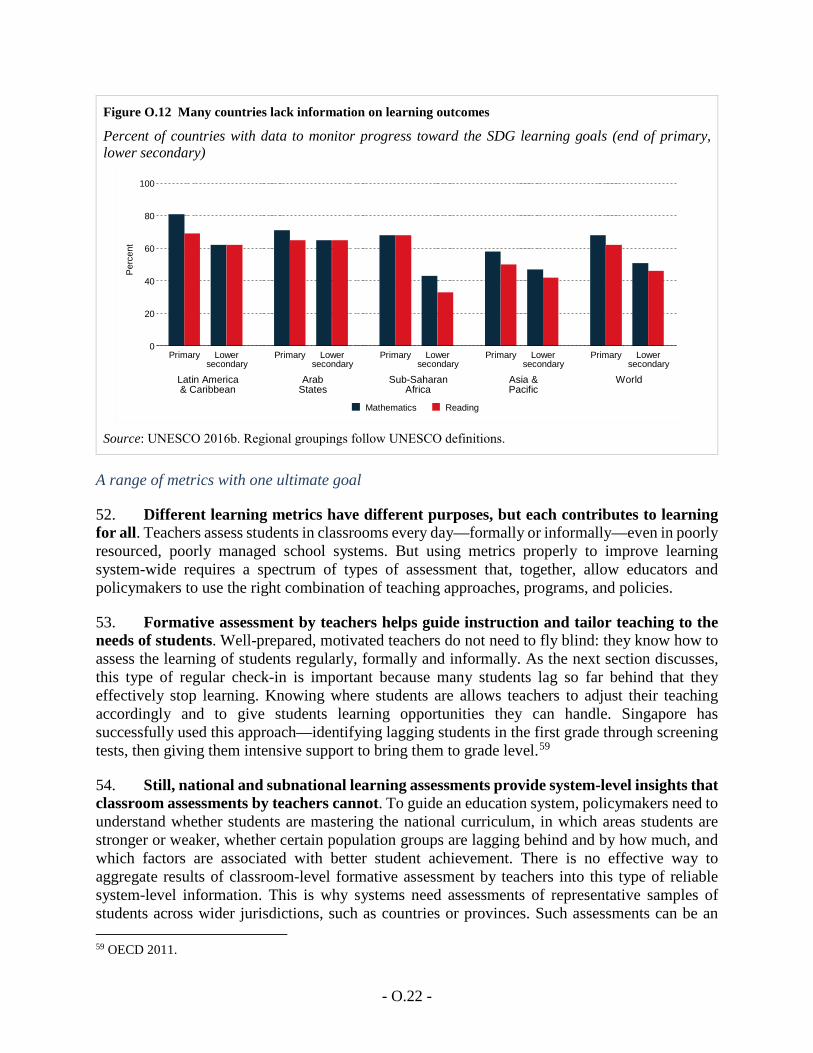
51. But in many systems the problem is too little focus on learning—not too much. Many countries lack information on even basic reading and math competencies. An assessment of capacity to monitor progress toward the Sustainable Development Goals found that in 121 countries studied, a third lack the data required to report on levels of reading and mathematics proficiency of children at the end of primary school.58 Even more lack it for the end of lower secondary (figure O.12). Even when countries have these data, they are often from one-off assessments that don’t allow systematic tracking over time. A lack of good measurement means that education systems are often flying blind—and without even agreement on the destination.
54 Save the Children's Education Global Initiative 2013. 55 Guilfoyle 2006. 56 Jacob 2005. 57 Fausset 2014. 58 UNESCO Institute for Statistics 2016.
- O.22 -
Figure O.12 Many countries lack information on learning outcomes
Percent of countries with data to monitor progress toward the SDG learning goals (end of primary, lower secondary)
Source: UNESCO 2016b. Regional groupings follow UNESCO definitions.
A range of metrics with one ultimate goal
52. Different learning metrics have different purposes, but each contributes to learningfor all. Teachers assess students in classrooms every day—formally or informally—even in poorlyresourced, poorly managed school systems. But using metrics properly to improve learningsystem-wide requires a spectrum of types of assessment that, together, allow educators andpolicymakers to use the right combination of teaching approaches, programs, and policies.
53. Formative assessment by teachers helps guide instruction and tailor teaching to theneeds of students. Well-prepared, motivated teachers do not need to fly blind: they know how toassess the learning of students regularly, formally and informally. As the next section discusses,this type of regular check-in is important because many students lag so far behind that theyeffectively stop learning. Knowing where students are allows teachers to adjust their teachingaccordingly and to give students learning opportunities they can handle. Singapore hassuccessfully used this approach—identifying lagging students in the first grade through screeningtests, then giving them intensive support to bring them to grade level.59
54. Still, national and subnational learning assessments provide system-level insights thatclassroom assessments by teachers cannot. To guide an education system, policymakers need tounderstand whether students are mastering the national curriculum, in which areas students arestronger or weaker, whether certain population groups are lagging behind and by how much, andwhich factors are associated with better student achievement. There is no effective way toaggregate results of classroom-level formative assessment by teachers into this type of reliablesystem-level information. This is why systems need assessments of representative samples ofstudents across wider jurisdictions, such as countries or provinces. Such assessments can be an
59 OECD 2011.
0
20
40
60
80
100
Perc
ent
Latin America & Caribbean
Arab States
Sub-Saharan Africa
Asia & Pacific
World
Primary Lowersecondary
Primary Lowersecondary
Primary Lowersecondary
Primary Lowersecondary
Primary Lowersecondary
Mathematics Reading
- O.23 -
especially important part of tracking system-wide progress, as they are anchored in a system’s own expectations for itself. And national assessments can provide a check on the quality of subnational assessments, by flagging cases in which trends or levels of student achievement diverge across the two. In the United States the National Assessment of Educational Progress has played this role.60
55. International assessments also provide information that helps improve systems. Globally benchmarked student assessments like PISA, TIMSS, and PIRLS, as well as regionally benchmarked ones like PASEC in West and Central Africa and LLECE in Latin America, provide an additional perspective on how well students are learning. They allow assessment of country performance in a way that is comparable across countries, and they provide a check on the information that emerges from national assessments. And international assessments can be powerful tools politically: because country leaders are concerned with national productivity and competitiveness, international benchmarking can raise awareness of how a country is falling short of its peers in building human capital.
56. Two other types of learning metrics measured in nonschool settings can be used to strengthen the quality and equity focus of assessment systems. Grassroots accountability movements—led by civil society organizations like ASER in India and UWEZO in East Africa—have deployed citizen-led assessments, which recruit volunteers to measure the foundational learning of young children in their communities. These organizations then use their learning data to advocate for education reform. Some multipurpose household surveys also collect learning data, enabling researchers to analyze how learning outcomes correlate with income and community variables. Both types of assessments are administered in people’s homes, not schools. As a result, they don’t suffer from a key weakness of school-based assessments: when marginal students drop out, it can improve average scores on school assessments, creating a perverse incentive for school leaders. But household-based assessments yield learning metrics that reward systems for improving both access and quality. This is crucial to ensure that no child is written off. Even for students who are in schools, household-based assessments provide an alternative source of learning data, which can be important in settings where official assessments are of questionable quality.
Avoiding the pitfalls in learning measurement
57. Why isn’t there more and better measurement of learning? As with system barriers to learning, barriers to better measurement are both technical and political. From a technical perspective, conducting good assessments is not easy. At the classroom level, teachers lack the training to assess learning effectively, especially when assessments try to capture higher-order skills—through project-based assessment, say—rather than rote learning. And at the system level, education ministries lack the capacity to design valid assessments and implement them in a sample of schools. But political factors also intrude. To paraphrase an old saying, policymakers may decide that it is better to avoid testing and be assumed ineffective than to test students and remove all doubt. And even when they do participate in assessments, governments sometimes decline to release learning results to the public, as happened with the 1995 TIMSS in Mexico.61 Finally, if assessments are poorly designed or inappropriately made into high-stakes tests, administrators or
60 Jacob 2007. 61 Solano-Flores, Contreras-Niño and Backhoff-Escudero 2005.
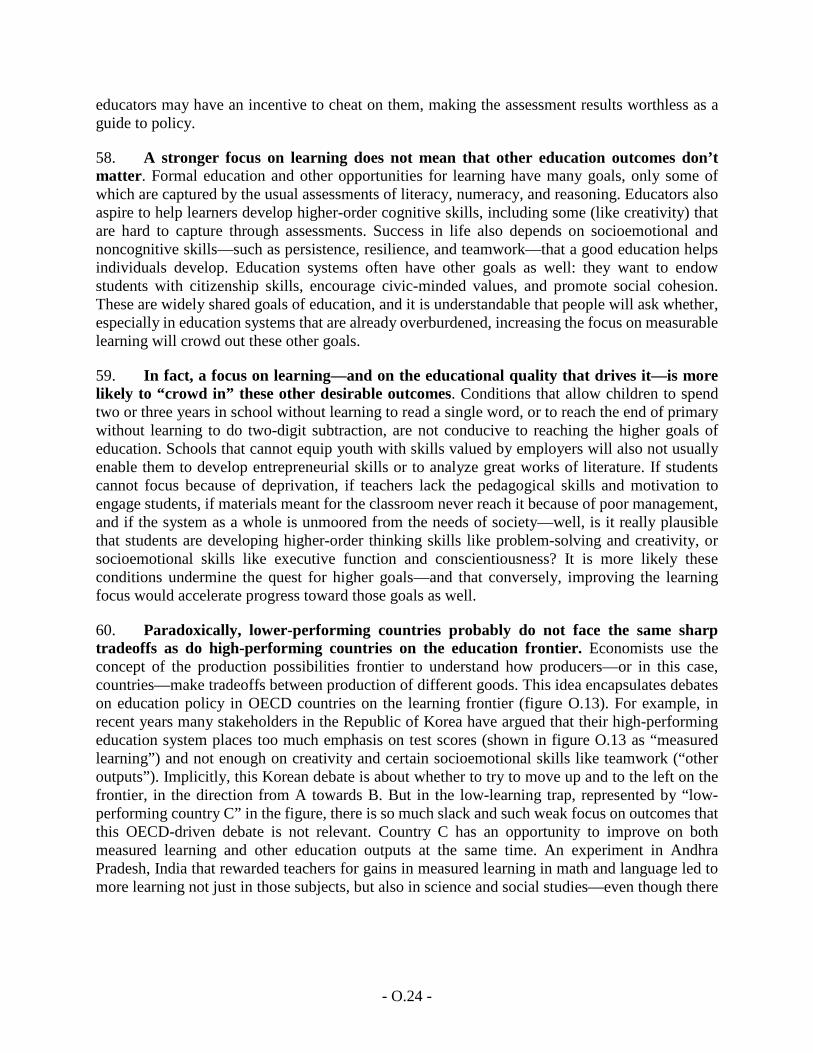
- O.24 -
educators may have an incentive to cheat on them, making the assessment results worthless as a guide to policy.
58. A stronger focus on learning does not mean that other education outcomes don’t matter. Formal education and other opportunities for learning have many goals, only some of which are captured by the usual assessments of literacy, numeracy, and reasoning. Educators also aspire to help learners develop higher-order cognitive skills, including some (like creativity) that are hard to capture through assessments. Success in life also depends on socioemotional and noncognitive skills—such as persistence, resilience, and teamwork—that a good education helps individuals develop. Education systems often have other goals as well: they want to endow students with citizenship skills, encourage civic-minded values, and promote social cohesion. These are widely shared goals of education, and it is understandable that people will ask whether, especially in education systems that are already overburdened, increasing the focus on measurable learning will crowd out these other goals.
59. In fact, a focus on learning—and on the educational quality that drives it—is more likely to “crowd in” these other desirable outcomes. Conditions that allow children to spend two or three years in school without learning to read a single word, or to reach the end of primary without learning to do two-digit subtraction, are not conducive to reaching the higher goals of education. Schools that cannot equip youth with skills valued by employers will also not usually enable them to develop entrepreneurial skills or to analyze great works of literature. If students cannot focus because of deprivation, if teachers lack the pedagogical skills and motivation to engage students, if materials meant for the classroom never reach it because of poor management, and if the system as a whole is unmoored from the needs of society—well, is it really plausible that students are developing higher-order thinking skills like problem-solving and creativity, or socioemotional skills like executive function and conscientiousness? It is more likely these conditions undermine the quest for higher goals—and that conversely, improving the learning focus would accelerate progress toward those goals as well.
60. Paradoxically, lower-performing countries probably do not face the same sharp tradeoffs as do high-performing countries on the education frontier. Economists use the concept of the production possibilities frontier to understand how producers—or in this case, countries—make tradeoffs between production of different goods. This idea encapsulates debates on education policy in OECD countries on the learning frontier (figure O.13). For example, in recent years many stakeholders in the Republic of Korea have argued that their high-performing education system places too much emphasis on test scores (shown in figure O.13 as “measured learning”) and not enough on creativity and certain socioemotional skills like teamwork (“other outputs”). Implicitly, this Korean debate is about whether to try to move up and to the left on the frontier, in the direction from A towards B. But in the low-learning trap, represented by “low-performing country C” in the figure, there is so much slack and such weak focus on outcomes that this OECD-driven debate is not relevant. Country C has an opportunity to improve on both measured learning and other education outputs at the same time. An experiment in Andhra Pradesh, India that rewarded teachers for gains in measured learning in math and language led to more learning not just in those subjects, but also in science and social studies—even though there
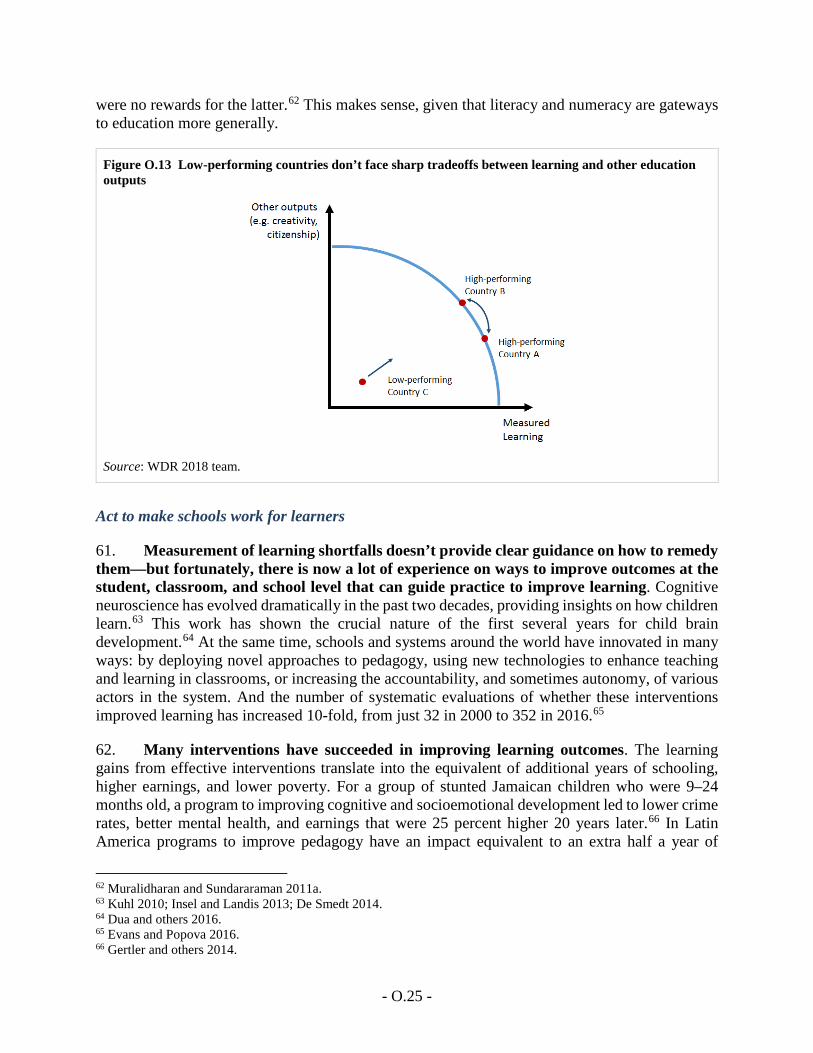
- O.25 -
were no rewards for the latter.62 This makes sense, given that literacy and numeracy are gateways to education more generally.
Figure O.13 Low-performing countries don’t face sharp tradeoffs between learning and other education outputs
Source: WDR 2018 team.
Act to make schools work for learners
61. Measurement of learning shortfalls doesn’t provide clear guidance on how to remedy them—but fortunately, there is now a lot of experience on ways to improve outcomes at the student, classroom, and school level that can guide practice to improve learning. Cognitive neuroscience has evolved dramatically in the past two decades, providing insights on how children learn.63 This work has shown the crucial nature of the first several years for child brain development.64 At the same time, schools and systems around the world have innovated in many ways: by deploying novel approaches to pedagogy, using new technologies to enhance teaching and learning in classrooms, or increasing the accountability, and sometimes autonomy, of various actors in the system. And the number of systematic evaluations of whether these interventions improved learning has increased 10-fold, from just 32 in 2000 to 352 in 2016.65
62. Many interventions have succeeded in improving learning outcomes. The learning gains from effective interventions translate into the equivalent of additional years of schooling, higher earnings, and lower poverty. For a group of stunted Jamaican children who were 9–24 months old, a program to improving cognitive and socioemotional development led to lower crime rates, better mental health, and earnings that were 25 percent higher 20 years later.66 In Latin America programs to improve pedagogy have an impact equivalent to an extra half a year of
62 Muralidharan and Sundararaman 2011a. 63 Kuhl 2010; Insel and Landis 2013; De Smedt 2014. 64 Dua and others 2016. 65 Evans and Popova 2016. 66 Gertler and others 2014.
- O.26 -
business-as-usual schooling and a 3 percent increase in lifetime earnings.67 So while tackling the learning crisis is hard, the fact that there are interventions that improve learning suggests ways forward.
63. This evidence base does not allow us to identify what works in all contexts, because there are no global solutions in education. Improving learning in a particular setting will never be as simple as taking a successful program from one country or region and implementing it elsewhere. Randomized control trials and other approaches to evaluate impact place a premium on carefully isolating the causal impact of an intervention. But these may ignore important interactions with underlying factors that affect whether or not an intervention makes a difference—factors that may not be at play when replicating the intervention in a new context. For example, increasing class size by 10 students reduced test scores by four times as much in Israel as it did in Kenya—and has had no impact in some contexts.68 In the words of two commentators on this literature: “Knowing ‘what works’ in the sense of the treatment effect on the trial population is of limited value without understanding the political and institutional environment in which it is set.”69 The next section tackles the question of that broader environment, but in the meantime we first address how to most effectively use this evidence. There are four main considerations.
64. First, rather than focusing on individual results from individual studies, what’s important are the principles of how and why programs work. In economic terms, “principles” correspond to models of behavior that can then help guide broader sets of approaches to address problems. Three types of models prove especially insightful: straightforward models in which actors maximize their welfare subject to the constraints they face, principal-agent models that incorporate multiple actors with different goals and perhaps different information, and behavioral models that factor in mental models and social norms.
65. Second, a gap between what the evidence suggests may be effective and what is done in practice points to a potential entry point for action. Understanding why gaps open up helps guide how to address them. For example, when different actors face different information, or some actors lack information, this suggests drawing from approaches that show how information can be better disseminated and used. Gaps point to which types of principles should drive context-specific innovation.
66. Third, evidence tends to accumulate where it is easiest to generate, not necessarily where action would make the most difference—so policies focused only on that evidence might be misguided.70 Though the scope of the accumulated evidence in education is broad, just because an approach hasn’t been evaluated doesn’t mean it doesn’t have potential. Context-specific innovation might mean trying things that have not been tried elsewhere.
67. Fourth, a focus on the principles of why certain interventions matter highlights that the problem is not a technocratic one of simply increasing the quantity, or even the quality, of each element of the system. Many of the inputs into learning are the result of choices made by the various actors—choices made in reaction to the actual and anticipated choices of other actors. 67 Calculations carried out for WDR 2018. See Evans and Yuan 2017. 68 Pritchett and Sandefur 2013. 69 Deaton and Cartwright 2016. 70 Romer 2015.
- O.27 -
For example, teachers respond to incentives to attend school and to improve student outcomes, even though the nature of the response varies across contexts.71 Students and parents likewise make choices responding to other decisions: in India and Zambia government grants to schools led parents to reduce their own investments in their children’s schooling.72 As a result a more complete characterization of the learning framework might be closer to the one illustrated in figure O.14: learning how to improve outcomes by intervening at the student, classroom, and school levels involves illuminating the various arrows.
68. Putting all this together sheds light on three sets of promising entry points: prepared learners, effective teaching, and school-level interventions that actually affect the teaching and learning process. Each of these priority areas is founded on evidence from multiple contexts showing that it can make a real difference for learning.
Preparing children and youth for learning
69. Getting learners to school ready and motivated to learn is a first step; without it, other policies and programs will have minimal effect. There are three key entry points to addressing learner preparation.
71 Duflo, Hanna and Ryan 2012; Muralidharan and Sundararaman 2011b. 72 Das and others 2013.
Figure O.14 It’s more complicated than it looks: People act in reaction to the choices of others throughout the system
Source: WDR 2018 team.
LEARNING
- O.28 -
• Set children on high-development trajectories through early child nutrition, stimulation, and care. Three approaches stand out from successful experiences. First, target mothers and their babies with health and nutrition interventions during the first 1,000 days to reduce malnutrition and foster physiological development. Second, increase the frequency and quality of stimulation and opportunities for learning at home (starting from birth) to improve language and motor development, as well as the cultivation of early cognitive and socioemotional skills. Third, daycare centers for very young children and preschool programs for children 3 to 6 years old—along with caregiver programs that enhance children’s nurturing and protection—improve cognitive and socioemotional skills in the short run, as well as education and labor market outcomes later in life.73 Program quality matters a lot: center-based programs with poor process quality (even with relatively good infrastructure, caregiver training, and caregiver-children ratios) can actually worsen developmental outcomes.74
• Lower school costs to get children into school, but then use other tools to boost motivation and effort—because cost-reducing interventions don’t usually lead to learning on their own.75 To improve learning, demand-side programs need to increase student effort or capacity to learn. School feeding, for example, has resulted in positive effects on access—and also on learning in places where children have limited access to food at home.76 Targeted cash transfers have led to more learning when they incentivized performance itself77 or were marketed in a way that induces more effort, as in Cambodia.78 So too have some information interventions that have motivated effort.79
• To make up for the fact that so many youth leave basic education lacking skills, provide remediation before further education and training.80 Remediation in school is a first best approach. After school, the more successful programs share two main features. First, they provide bridging courses in real-life settings, which allows learners with very low foundational skills to build these in the workplace.81 Second, accelerated, flexible pathways—not sequential courses over multiple semesters—are associated with greater student retention and ultimate certification.82
Making teaching more effective
70. Effective teaching depends on teacher skills and motivation—yet many systems do not take them seriously. Teacher salaries are the largest single budget item in education systems,
73 The evidence comes from a number of countries ranging from the U.S. to Argentina, Bangladesh, China, and Uganda, among others (Berlinski, Galiani and Gertler 2008; Engle and others 2011). 74 Bernal and others 2016; Grantham‐McGregor and others 2014; Berlinski and Schady 2016. 75 Morgan, Petrosino and Fronius 2012; Fiszbein, Schady and Ferreira 2009; Baird and others 2014. 76 Snilstveit and others 2016. 77 Blimpo 2014; Kremer, Miguel and Thornton 2009. Direct financial incentives have been less successful in high-income countries (Fryer 2011), although alternate designs that deliver incentives immediately after the test have worked (Levitt and others 2016). 78 Barrera-Osorio and Filmer 2013. 79 Nguyen 2008; Avitabile and De Hoyos Navarro 2015. 80 Elder and Rosas 2015. 81 Bragg 2014. 82 Calcagno and Long 2008; Martorell and McFarlin Jr 2011; Scott-Clayton and Rodriguez 2014.
- O.29 -
taking up three-quarters of the budget at the primary level in developing countries. Yet many systems struggle to attract strong candidates into teaching and to provide a solid foundation of subject or pedagogical knowledge before they start teaching. As a result, new teachers often find themselves in classrooms with little mastery of the content they are to teach.83 Once teachers are in place, the professional development they receive is often inconsistent and overly theoretical. In some countries the cost of this training is enormous, reaching $2.5 billion a year in the United States.84 Moreover, education systems often have few effective mechanisms in place to mentor, support, and motivate teachers—even though teachers’ skills do nothing for learning unless teachers choose to apply them in the classroom.85 Fortunately, teacher skills and motivation can be strengthened, leading to increased effort and increased learning—with three main promising principles emerging:
• To be effective, design teacher training to be individually targeted and repeated, with follow-up coaching—often around a specific pedagogical technique. This is in stark contrast to much teacher professional development as it is today across a range of countries. In the United States a team of teacher training experts characterized professional development there as “episodic, myopic, and often meaningless.”86 In Sub-Saharan Africa teacher training is often too short to be effective and too low-quality to make a difference.87 But programs in Africa and South Asia that provided long-term coaching led to sizable learning gains.88
• To keep learners from falling behind to the point where they can’t catch up, target teaching to the level of the student. Over the course of several grades, often only a fraction of learners progress at grade level, with most falling behind and some learning almost nothing. This is partly because teachers teach to the most advanced students in the class, as documented from Australia to Sweden to the United States,89 or because the curriculum is too ambitious but teachers are required to teach it.90 Effective strategies to target teaching to the level of the student include using community teachers to provide remedial lessons to the lowest performers,91 reorganizing classes by ability,92 or using technology to adapt lessons to individual student needs.93
• Use pecuniary and nonpecuniary incentives to improve teacher motivation, ensuring that the incentivized actions are within teachers’ capacity. Education systems typically neither reward teachers for performing well nor penalize them for performing poorly. Incentives are most likely to be effective at improving outcomes when there are straightforward actions that teachers can take to improve learning—such as increasing attendance when absenteeism is the constraint. But incentives do not need to be high-powered (or financial)
83 World Bank 2013; Tandon and Fukao 2015; Al-Samarrai 2016. 84 Layton 2015. 85 Bruns and Luque 2015; Mulkeen 2010. 86 Darling-Hammond and others 2009. 87 Lauwerier and Akkari 2015. 88 Banerjee and others 2007a; Conn 2017. 89 Ciaccio 2004; Abadzi and Llambiri 2011; Leder 1987. 90 Pritchett and Beatty 2015; Banerjee and others 2016. 91 Banerjee and others 2007b; Kiessel and Duflo 2014. 92 Banerjee and others 2016; Duflo, Dupas and Kremer 2011. 93 Muralidharan, Singh and Ganimian 2016b.
- O.30 -
to affect behavior. Simply providing diagnostic information to parents and schools about the schools’ relative performance improved learning outcomes in Punjab (Pakistan)94 and Mexico.95
Focusing everything else—such as inputs and governance—on improving teaching and learning
71. School inputs and governance need to affect the learner-teacher relationship if they are to improve learning—but many do not. Many debates on improving education outcomes focus on increasing the inputs available in classrooms or the infrastructure of schools. But too often the question of why these might actually improve learning is overlooked. The evidence on successful use of inputs and management suggests three main principles:
• Provide additional inputs, including new technologies, in ways that complement rather than substitute for teachers.96 A computer-assisted learning program in Gujarat, India improved learning when it added to teaching and learning time—especially for the poorest-performing students.97 A Kenyan program that provided tablets to public-school teachers to support instruction increased reading performance of their students.98 But simply providing desktop computers to classrooms in Colombia—where they were not well integrated with the curriculum—had no impact on learning.99 Even more traditional inputs—such as books—often fail to affect teaching and learning when they aren’t actually deployed in classrooms,100 or if the content is too advanced for the students.101
• Ensure that new information and communication technology is really implementable in current systems. Interventions that incorporate information and communication technology have some of the biggest impacts on learning.102 But for every highly effective program—such as a dynamic computer-assisted learning program for secondary school students in Delhi, India that increased math and language scores more than the vast majority of other learning interventions tested in India or elsewhere103—there are also completely ineffective programs like the one laptop per child programs in Peru and Uruguay, which had no impact on student reading or math ability.104 Technologies ill-adapted to their settings often fail to reach the classroom or to be used if they reach it.105
• Focus school management and governance reforms on improving teacher-learner interaction. For example, involving communities, parents, and school actors in ways that promote local oversight and accountability for service delivery can improve outcomes.106
94 Andrabi, Das and Khwaja 2015. 95 De Hoyos Navarro, Garcia Moreno and Patrinos 2015. 96 Snilstveit and others 2016. 97 Linden 2008. 98 Piper and others 2015. 99 Barrera-Osorio and Linden 2009. 100 Sabarwal, Evans and Marshak 2014. 101 Glewwe, Kremer and Moulin 2009. 102 McEwan 2015. 103 Muralidharan, Singh and Ganimian 2016b. 104 Cristia and others 2012; De Melo, Machado and Miranda 2014. 105 Lavinas and Veiga 2013. 106 Bruns, Filmer and Patrinos 2011.
- O.31 -
But community monitoring tends to be have more impact when it covers things that parents can easily observe (such as teacher absenteeism, when it is high), and when a range of stakeholders (not just parents) are brought together in ways that lead to action. In Indonesia school grants improved learning when links between the school and the village council—a center of local authority—were strengthened.107
72. The most effective systems—in terms of learning—are those that have narrowed gaps between evidence and practice. On learner preparation, for example, East Asian countries such as the Republic of Korea and Singapore have achieved high levels of children ready to learn—with low stunting rates among preschool-age children, and children motivated and supported by their families. To promote effective teaching, Finland and Singapore attract some of the most highly skilled graduates from tertiary education into teaching, and provide them with effective professional development opportunities and sustained support.
Align actors
73. Working at scale is not just “scaling up.” The concept of “scaling up” in education implies taking interventions that have been shown to be effective at a pilot or experimental scale and replicating them across hundreds or thousands of schools. This approach often fails because the key actors are human beings, operating with human aspirations and limitations in a politically charged arena. Real-world complications can undermine well-designed programs, especially when new system-wide forces come into play. When the Cambodian government tried to scale up early child development centers and preschools—programs that had worked in some parts of the country when implemented by nongovernmental organizations (NGOs)—low demand from parents and low-quality services led to no impacts on child development, and even slowed it for some.108 When the Kenyan government tried to lower student-teacher ratios by hiring contract teachers—an intervention that had improved student outcomes when implemented by an NGO—the results were negligible because of both implementation constraints and political economy factors.109 When the Indonesian government tried to increase teacher capacity by nearly doubling the salaries of certified teachers, political pressures watered down the certification process and left only the pay increase in place. The result: much larger budget outlays on salaries, but no increase in teacher skills or student learning.110
74. So better interventions at the school and student levels will sustainably improve learning only if countries take on the stubborn system-level technical and political barriers to change. Technical barriers include the complexity of the system, the large number of actors, the interdependence of reforms, and education systems’ slowness to change. Political barriers include the competing interests of different players and the difficulty of moving out of a low-quality equilibrium, especially in low-trust environments where risks predominate. All of these pull actors away from learning, as discussed above. Systems that surmount these barriers and align actors toward learning can achieve remarkable learning outcomes. Shanghai, China showed when
107 Pradhan and others 2014. 108 Bouguen and others 2013. 109 Bold and others 2013. 110 Chang and others 2013; De Ree and others 2015.
- O.32 -
it topped the 2012 PISA rankings, partly thanks to policies that ensured every classroom had a prepared, supported, motivated teacher.111
75. To shift the system toward learning, technically and politically, reformers can use three sets of tools:
• Information and metrics. Better information and metrics can promote learning in two ways: by catalyzing reforms and by serving as an indicator of whether reforms are working to improve learning with equity. Thus they can improve both the political and technical alignment of the system.
• Coalitions and incentives. Good information will have a payoff only if there is enough support for prioritizing learning. Politics is often the problem, and politics must be part of the solution. This requires forming coalitions to advocate for broadly based learning and skills and rebalance the political incentives.
• Innovation and agility. Schools and societies have achieved high levels of equitable learning in a variety of ways, and figuring out what approaches will work in a given context requires innovation and adaptation. This means using evidence to identify where to start, then using metrics to iterate with feedback loops.
Information and metrics
76. Better information and measurement—starting with learning metrics—are critical for creating political space for innovation, and using that space to achieve continuous improvement. As emphasized, the absence of good information on learning prevents stakeholders from judging system performance, designing appropriate policies, and holding politicians and bureaucrats to account. So improving learning metrics is crucial for drawing attention to problems and building the will for action. In Germany the “PISA shock” created by mediocre scores and large achievement gaps on the first PISA assessment in 2000 led to reforms, resulting in a turnaround over the ensuing decade that improved both equity and average learning levels.
77. This agenda needs to go beyond just measuring learning to track its determinants as well. Understanding these determinants can lead to grappling with the deeper causes, if there is a system-wide commitment to improving learning. Take the issue of learner preparedness. When indicators reveal that poorer children already lag far behind by the time they start primary school, this finding can build political will not only to expand preschool in low-income areas, but also to combat stunting and educate parents about early stimulation of children. When indicators show that many teachers lack a strong command of what their students are meant to learn, this can spark efforts to improve the quality of teacher education—especially if continuous monitoring shows that just ramping up current training doesn’t improve teaching.112
111 Liang, Kidwai and Zhang 2016. 112 For example, in Mozambique, after the Service Delivery Indicators results revealed very low levels of teacher knowledge and very high levels of absenteeism, results that were picked up in the local media, the government launched a program—ultimately supported through a loan from the World Bank—to address these issues.
- O.33 -
78. Of course, information and metrics can also be misleading, irrelevant, or politically unsustainable, so they need to be designed and used wisely. The risks of learning metrics also apply to other types of measures of progress. Another risk is if a metric fail to capture important dimensions of the outcomes the system is trying to promote. For example, the Millennium Development Goal of universal primary completion by 2015 embodied a crucial goal—equitable access—but did not represent what many assumed it did: universal acquisition of foundational literacy and numeracy, let alone other life skills. Another risk is of distorting good metrics by putting high stakes on them, if potential beneficiaries can game the indicators. Thus systems will need different measures for different purposes.113 Even if technically sound, metrics may prove politically unsustainable if they highlight too many problems and do not provide any reason for hope. One way to address this problem is to focus not on levels of learning, which may be very low, but on progress over time.
Coalitions and incentives
79. Mobilizing everyone who has a stake in learning has been an important strategy in efforts to improve learning. Many countries have used wide-ranging consultations that have tried to bring in all interest groups to build support for proposed changes in education policy. Malaysia used a “lab” model to bring together coalitions of stakeholders and involve them in all stages of reform, from design to implementation.114 Mobilizing citizens through regular information and communication campaigns can also be an important strategy. In Peru reformers in the government used information on poor learning outcomes and performance of the education system to mobilize public support for reforms to strengthen teacher accountability. That information also catalyzed action by the business community, which funded a campaign highlighting the importance of quality education for economic growth. In parts of Peru, parents used this entry point to protest teacher strikes that had disrupted schooling.115 Another tool for building coalitions is to bundle reforms, so that each actor achieves a top priority of theirs. For example, a commitment to modernize vocational training—a reform that could help employers immediately—could buy their support for broader education reforms.
80. Where feasible, a negotiated and gradual approach to reform can provide a more promising alternative to direct confrontation. Where coalitions can be built between system actors that foster collaboration and trust around shared goals, the chances of successful reform are likely to be higher. In Chile successive negotiations between the government and teacher union built broad support for a series of reforms that adjusted the working conditions of teachers to improve their overall welfare, while at the same time linking pay and career development more closely to performance.116 One approach that has been used by several countries has been to compensate actors who might lose out from reforms. In other cases, dual-track reforms have been introduced to phase in changes in a way that protects incumbent actors from their effects; in Peru and Washington, D.C. pay-for-performance schemes were initially voluntary.117
113 Neal 2013. 114 World Bank 2016 115 Bruns and Luque 2014. 116 Mizala and Schneider 2014; Wales and others 2014. 117 Birnbaum 2012; Bruns and Luque 2014.
- O.34 -
81. Building strong partnerships between schools and their communities is also important for sustaining reforms. In cases where political and bureaucratic incentives for reform are weak, action at the local level can act as a substitute. In South Africa the political and economic context constrains efforts to improve education performance. Yet progress was made in improving outcomes at the local level through strong partnerships between parents and schools.118 Even where broader incentives exist to improve learning, community engagement at the local level is important and can complement national or subnational change efforts.119
Innovation and agility
82. To turn these efforts into effective learning approaches that fit their contexts, education systems need to encourage innovation and adaptation. In many education systems, schools and other education institutions regularly adapt to changing circumstances. Through these adaptations, innovative solutions to education challenges often emerge. Exploring well-performing parts of any education system can reveal technically and politically feasible approaches to the problems systems face in improving learning. In Misiones Province in Argentina, high student dropout rates were widespread, but some schools seemed to buck the trend. Looking more closely at these “positive deviants” revealed very different relationships between teachers and parents. When other schools adopted the more constructive approach to parent-teacher relations, dropouts fell significantly.120 As Burundi recovered from civil war, it used an adaptive approach to find the right way to get textbooks to schools, reducing delivery times from over a year to sixty days—and then replicated that approach in other areas.121
83. Incentives are important in determining whether systems innovate and adopt emerging solutions at scale. Systems that are closed, limit the autonomy of teachers and schools, and judge performance by the extent of compliance with rules over resource use often provide little room for innovation. By contrast, more open systems that have a greater focus on overall outcomes and reward progress in raising outcomes are more likely to see greater innovation and diffusion of new approaches across the education system.122
84. To make a difference at system level, such innovations needs to be packaged with good metrics and with system-level coalitions for learning. Without metrics and coalitions for learning, any improvements from innovation are likely to prove short-lived or limited to local areas. But with such support, a virtuous cycle becomes possible, as systems follow these steps:
• Set learning as a clearly articulated goal and measure it.
• Build a coalition for learning that gives the political space for innovation and experimentation.
118 Levy and others 2016. 119 Mansuri and Rao 2012. 120 Green 2016; Pascale, Sternin and Sternin 2010. 121 Campos, Randrianarivelo and Winning 2015. 122 Andrews, Pritchett and Woolcock 2013.
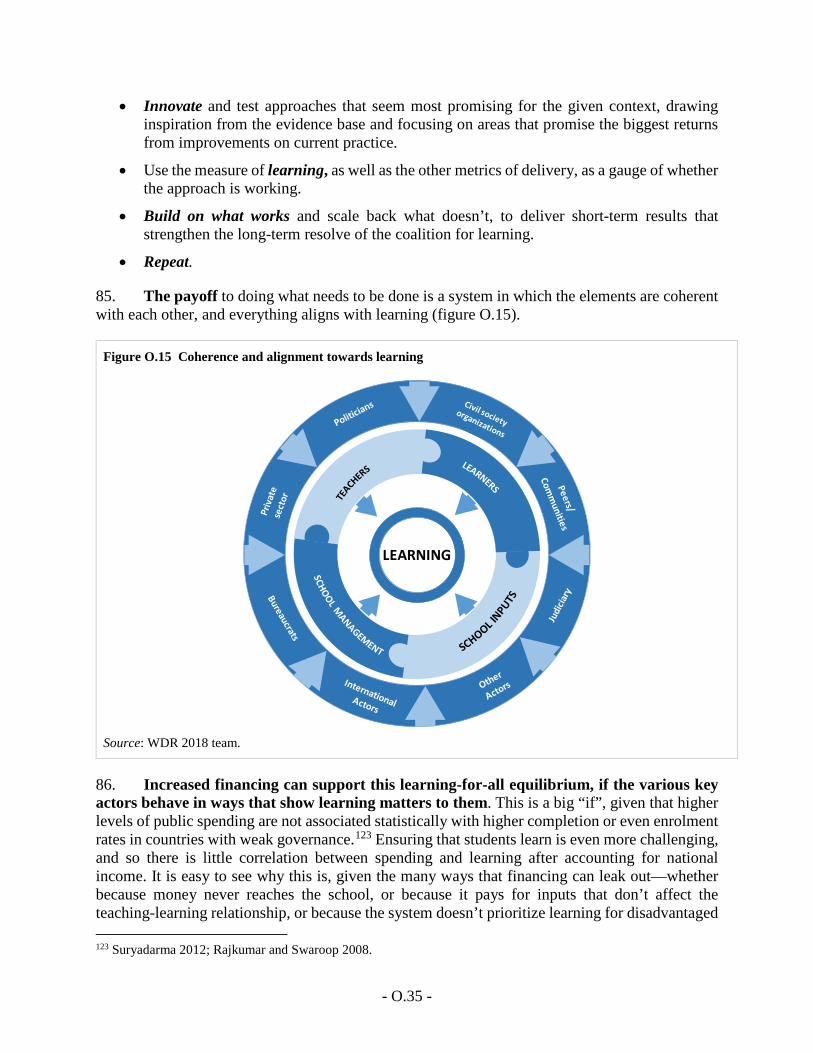
- O.35 -
• Innovate and test approaches that seem most promising for the given context, drawing inspiration from the evidence base and focusing on areas that promise the biggest returns from improvements on current practice.
• Use the measure of learning, as well as the other metrics of delivery, as a gauge of whether the approach is working.
• Build on what works and scale back what doesn’t, to deliver short-term results that strengthen the long-term resolve of the coalition for learning.
• Repeat.
85. The payoff to doing what needs to be done is a system in which the elements are coherent with each other, and everything aligns with learning (figure O.15).
86. Increased financing can support this learning-for-all equilibrium, if the various key actors behave in ways that show learning matters to them. This is a big “if”, given that higher levels of public spending are not associated statistically with higher completion or even enrolment rates in countries with weak governance.123 Ensuring that students learn is even more challenging, and so there is little correlation between spending and learning after accounting for national income. It is easy to see why this is, given the many ways that financing can leak out—whether because money never reaches the school, or because it pays for inputs that don’t affect the teaching-learning relationship, or because the system doesn’t prioritize learning for disadvantaged 123 Suryadarma 2012; Rajkumar and Swaroop 2008.
Figure O.15 Coherence and alignment towards learning
Source: WDR 2018 team.
LEARNING
- O.36 -
children and youth. More financing for business as usual will therefore just lead to the usual outcomes. But where countries seriously tackle the barriers to learning for all, spending on education is a critical investment for development. More children staying in school longer and learning while there will undoubtedly require more public financing for education. An injection of financing—either from domestic or international sources—can help countries escape the low-learning trap, if they are willing to take the other necessary steps laid out here.
Implications for external actors
87. External actors can reinforce these strategies for opening the political and technical space for learning. In the realm of information and metrics, for example, international actors can fund participation in regional learning assessments (like PASEC in West Africa or LLECE in Latin America) or global learning assessments (like PISA or TIMSS) to spotlight challenges and catalyze domestic efforts for reform. External actors can also develop tools for tracking the proximate determinants of learning, to aid in feedback loops. Given that domestic financing usually makes up the bulk of education financing, promoting better information can be a high-leverage way for international financing to improve the system as a whole. In the realm of innovation and experimentation, external funders like the World Bank can provide results-based financing that gives countries more room to innovate and iterate their way to achieving better outcomes.
Why should countries take up this challenge?
88. By showing that learning really matters to them, countries can realize education’s full promise. Beyond being a basic human right, education—done right—improves social outcomes in many spheres of life. For individuals and families, education boosts human capital, improves economic opportunities, promotes health, and expands the ability to make effective choices. For societies, education expands economic opportunities, promotes social mobility, and makes institutions function more effectively. In measuring these benefits, research has only recently focused on the distinction between schooling and learning. But the evidence confirms the intuition that these benefits often depend on the skills that students acquire, not just the number of years in the classroom. Economies with higher skills grow faster than those with schooling but mediocre skills; higher literacy predicts better financial knowledge and health of individuals, beyond the effects of schooling; and poor children are more likely to rise in the income distribution when they grow up in communities with better learning outcomes.
89. Taking learning seriously won’t be easy. It’s hard enough to work through the technical challenges of figuring out what will promote learning at the level of the student and school in any context, let alone to tackle the political and technical challenges of working at scale. Many countries struggling with the learning crisis may be tempted to continue with business as usual. After all, they may reason, development will eventually improve learning outcomes: as households escape poverty and schools take advantage of better facilities, more materials, and better-trained teachers, better learning outcomes should follow.
90. But waiting out the learning crisis isn’t a winning strategy. Even though income and learning are somewhat correlated at lower levels of development, higher incomes do not invariably lead to better learning outcomes. And to the extent that development does bring better learning and skills, it is partly because development has been accompanied by a willingness to tackle the
- O.37 -
political impasses and governance challenges that hamper learning—so those challenges ultimately aren’t avoidable. Furthermore, there’s no need to wait for learning. At every level of income, there are countries that not only score better on international assessments than others, but also—and more important—show from the quality of education and their policy-making that they are committed to learning.
91. The future of work will not make learning obsolete. Rapid technological change led to major shifts in the nature of work, leading some to declare this a new era—the Second Machine Age, or the Fourth Industrial Revolution. In the extreme versions of this vision, all but a few jobs could disappear, decreasing the value of skills for most people. But the forecast seismic changes have yet to permeate high-income countries, let alone low- and middle-income ones. More important, no matter how the demand for skills changes in the future, people will require a solid foundation of basic skills and knowledge. If anything, rapid change will place a premium on learning how to learn—which requires foundational skills that allow individuals to size up new situations, adapt their thinking, and know where to go for information and how to make sense of it.
* * *
92. Countries have already made a tremendous start by getting so many children and youth into school. Now it’s time to realize education’s promise by accelerating learning. A real education—one that encourages learning—is a tool for promoting both shared prosperity and poverty elimination. That type of education will benefit many: children and families whose positive schooling experience restores their faith in government and society, rather than corroding it; youth who have skills employers are looking for; teachers who can respond to their professional calling, rather than to political demands; adult workers who have learned how to learn, preparing them for unforeseeable economic and social changes; and citizens who have the values and reasoning abilities to contribute to civic life and social cohesion.
- O.38 -
References
Abadzi, Helen. 2009. "Instructional Time Loss in Developing Countries: Concepts, Measurement, and Implications." World Bank Research Observer 24 2: 267-90.
Abadzi, Helen, and Stavri Llambiri. 2011. "Selective Teacher Attention in Lower-Income Countries: A Phenomenon Linked to Dropout and Illiteracy?" Prospects 41(4): 491-506.
Al-Samarrai, Samer. 2016. "Assessing Basic Education Service Delivery in the Philippines : Public Education Expenditure Tracking and Quantitative Service Delivery Study." Washington, DC: World Bank Group. .
Alderman, Harold, Peter F Orazem, and Elizabeth M Paterno. 2001. "School Quality, School Cost, and the Public/Private School Choices of Low-Income Households in Pakistan." Journal of Human Resources 36(Spring): 304-26.
Altinok, Nadir , Noam Angrist, and Harry Anthony Patrinos. 2017. "Database on Learning around the World."
Andrabi, Tahi, Jishnu Das, and Asim Ijaz Khwaja. 2015. "Report Cards: The Impact of Providing School and Child Test Scores on Educational Markets." Policy Research Working Paper. World Bank. https://www.povertyactionlab.org/sites/default/files/publications/399_511%20Report%20Cards%20Mar2015_0.pdf.
Andrabi, Tahir, Jishnu Das, and Asim Ijaz Khwaja. 2008. "A Dime a Day: The Possibilities and Limits of Private Schooling in Pakistan." Comparative Education Review 52(3): 329-55.
Andrews, Matt, Lant Pritchett, and Michael Woolcock. 2013. "Escaping Capability Traps through Problem Driven Iterative Adaptation (Pdia)." World Development 51: 234-44.
———. 2017. Building State Capability: Evidence, Analysis, Action. Oxford, UK: Oxford University Press.
ASER. 2014. "Annual Status of Education Report (Rural)." New Delhi: ASER Center.
Avitabile, Ciro, and Rafael E. De Hoyos Navarro. 2015. "The Heterogeneous Effect of Information on Student Performance : Evidence from a Randomized Control Trial in Mexico." Policy Research Working Paper. World Bank. http://documents.worldbank.org/curated/en/467311468189270141/The-Heterogeneous-effect-of-information-on-student-performance-evidence-from-a-randomized-control-trial-in-Mexico.
Baird, Sarah, Francisco HG Ferreira, Berk Özler, and Michael Woolcock. 2014. "Conditional, Unconditional and Everything in Between: A Systematic Review of the Effects of Cash Transfer Programmes on Schooling Outcomes." Journal of Development Effectiveness 6(1): 1-43.
Banerjee, Abhijit, Rukmini Banerji, James Berry, Esther Duflo, Harini Kannan, Shobhini Mukerji, Marc Shotland, and Michael Walton. 2016. "Mainstreaming an Effective Intervention: Evidence Form Randomized Evaluations of "Teaching at the Right Level" in India."
Banerjee, Abhijit, Suraj Jacob, Michael Kremer, Jenny Lanjouw, and Peter Lanjouw. 2000. "Promoting School Participation in Rural Rajasthan: Results from Some Prospective Trials." Unpublished manuscript, Massachusetts Institute of Technology.
Banerjee, Abhijit V., Shawn Cole, Esther Duflo, and Leigh Linden. 2007a. "Remedying Education: Evidence from Two Randomized Experiments in India." Quarterly Journal of Economics 122 3: 1235-64.
———. 2007b. "Remedying Education: Evidence from Two Randomized Experiments in India." The Quarterly Journal of Economics 122(3): 1235-64.
Barrera-Osorio, Felipe, and Deon Filmer. 2013. "Incentivizing Schooling for Learning: Evidence on the Impact of Alternative Targeting Approaches." World Bank Policy Research Working Paper (6541).
Barrera-Osorio, Felipe, and Leigh L Linden. 2009. "The Use and Misuse of Computers in Education: Evidence from a Randomized Experiment in Colombia." World Bank Policy Research Working Paper Series 4836.
Barro, Robert J, and Jong Wha Lee. 2013. "A New Data Set of Educational Attainment in the World, 1950–2010." Journal of development economics 104: 184-98.
Berlinski, Samuel, Sebastian Galiani, and Paul Gertler. 2008. "The Effect of Preprimary Education on Primary School Performance." Journal of Public Economics 93(1): 219-34.
Berlinski, Samuel, and Norbert Schady. 2016. The Early Years: Child Well-Being and the Role of Public Policy. Springer.
Bernal, Raquel, Orazio P. Attanasio, X. Pena, and M. Vera-Hernandez. 2016. "The Effects of the Transition from Home-Based Community Nurseries to Childcare Centers on Children in Colombia." mimeo.
Birnbaum, Michael. 2012. "D.C. Schools Unveil Teacher-Pay Bonus Plan." The Washington Post. 9/12/2010. http://www.washingtonpost.com/wp-dyn/content/article/2010/09/10/AR2010091006604.html.
- O.39 -
Black, Maureen M, Susan P Walker, Lia CH Fernald, Christopher T Andersen, Ann M DiGirolamo, Chunling Lu, Dana C McCoy, Günther Fink, Yusra R Shawar, and Jeremy Shiffman. 2016. "Early Childhood Development Coming of Age: Science through the Life Course." The Lancet.
Blimpo, Moussa P. 2014. "Team Incentives for Education in Developing Countries: A Randomized Field Experiment in Benin." American Economic Journal: Applied Economics 6(4): 90-109.
Bloom, Nicholas, Renata Lemos, Raffaella Sadun, Daniela Scur, and John Reenen. 2014. "Jeea‐Fbbva Lecture 2013: The New Empirical Economics of Management." Journal of the European Economic Association 12(4): 835-76.
Bloom, Nicholas, Renata Lemos, Raffaella Sadun, and John Van Reenen. 2015. "Does Management Matter in Schools?" The Economic Journal 125(584): 647-74.
Bold, T., D. Filmer, G. Martin, E. Molina, B. Stacy, C. Rockmore, J. Svensson, and W. Wane. 2016. "Getting inside the Black-Box of Schooling: What Do Teachers Know and Do? A Report Card from African Primary Schools." Working Paper, The World Bank.
Bold, Tessa, Mwangi Kimenyi, Germano Mwabu, Alice Ng'ang'a, and Justin Sandefur. 2013. "Scaling up What Works: Experimental Evidence on External Validity in Kenyan Education." Center for Global Development Working Paper (321).
Bouguen, Adrien, Deon Filmer, Karen Macours, and Sophie Naudeau. 2013. "Impact Evaluation of Three Types of Early Childhood Development Interventions in Cambodia." World Bank Policy Research Working Paper (6540).
Bragg, D. 2014. "Career Pathways in Disparate Industry Sectors to Serve Underserved Populations." Symposium presentation for the American Educational Research Association conference, Philadelphia, PA.
Bruns, B, D. Filmer, and H A Patrinos. 2011. Making Schools Work: New Evidence on Accountability Reforms. Washington D.C.: The World Bank.
Bruns, Barbara, and Javier Luque. 2014. Great Teachers: How to Raise Student Learning in Latin America and the Caribbean. World Bank Publications.
———. 2015. Great Teachers : How to Raise Student Learning in Latin America and the Caribbean. Washington DC: The World Bank.
Calcagno, Juan Carlos, and Bridget Terry Long. 2008. "The Impact of Postsecondary Remediation Using a Regression Discontinuity Approach: Addressing
Endogenous Sorting and Noncompliance." National Bureau of Economic Research.
Campos, Jose Edgardo, Benjamina Randrianarivelo, and Kay Winning. 2015. "Escaping the “Capability Trap”: Turning “Small” Development into “Big” Development." International Public Management Review 16(1): 99-131.
Castillo, Melba, Vanesa Castro, José Ramón Laguna, and Josefina Vijil. 2011. "Informe De Resultados: Egms Nicaragua." CIASES and RTI International. https://shared.rti.org/content/informe-de-resultados-egma-nicaragua.
Chang, M-C, S Shaeffer, S Al-Samarrai, A Ragatz, J. De Ree, and R Stevenson. 2013. Teacher Reform in Indonesia: The Role of Politics and Evidence in Policy Making.
Chisholm, Linda, and Ramon Leyendecker. 2008. "Curriculum Reform in Post-1990s Sub-Saharan Africa." International Journal of Educational Development 28(2): 195-205.
Ciaccio, Joseph. 2004. Totally Positive Teaching. Association for Supervision and Curriculum Development (ASCD).
Coe, Christopher L., and Gabrielle R. Lubach. 2007. Mother-Infant Interactions and the Development of Immunity from Conception through Weaning. Burlington, MA: Elsevier Academic Press.
Conn, Katharine M. 2017. "Identifying Effective Education Interventions in Sub-Saharan Africa: A Meta-Analysis of Impact Evaluations." Review of Educational Research 0(0): 0034654317712025.
Cristia, Julian, Pablo Ibarrarán, Santiago Cueto, Ana Santiago, and Eugenio Severín. 2012. "Technology and Child Development: Evidence from the One Laptop Per Child Program." IZA Discussion Paper Series No. 6401.
Crouch, Luis. 2006. "Education Sector: Standards, Accountability, and Support." A New Social Contract for Peru: An Agenda for Improving Education, Health Care, and the Social Safety Net: 71-106.
Darling-Hammond, Linda, Ruth Chung Wei, Alethea Andree, Nikole Richardson, and Stelios Orphanos. 2009. "Professional Learning in the Learning Profession: A Status Report on Teacher Development in the United States and Abroad." National Staff Development Council
Das, Jishnu, and Natalie Bau. 2014. "The Misallocation of Pay and Productivity in the Public Sector: Evidence from the Labor Market for Teachers." Working Paper.
Das, Jishnu, Stefan Dercon, James Habyarimana, Pramila Krishnan, Karthik Muralidharan, and Venkatesh Sundararaman. 2013. "School Inputs, Household
- O.40 -
Substitution, and Test Scores." American Economic Journal: Applied Economics 5(2): 29-57.
Das, Jishnu, Priyanka Pandey, and Tristan Zajonc. 2006. "Learning Levels and Gaps in Pakistan." World Bank Policy Research Working Paper (4067).
De Hoyos Navarro, Rafael E., Vicente A. Garcia Moreno, and Harry Anthony Patrinos. 2015. "The Impact of an Accountability Intervention with Diagnostic Feedback: Evidence from Mexico." by Policy Research Working Paper. World Bank. http://documents.worldbank.org/curated/en/297561468188928817/The-impact-of-an-accountability-intervention-with-diagnostic-feedback-evidence-from-Mexico.
De Melo, Gioia, Alina Machado, and Alfonso Miranda. 2014. "The Impact of a One Laptop Per Child Program on Learning: Evidence from Uruguay." IZA Discussion Paper Series No. 8489.
De Ree, Joppe, Karthik Muralidharan, Menno Pradhan, and Halsey Rogers. 2015. "Double for Nothing? Experimental Evidence on the Impact of an Unconditional Teacher Salary Increase on Student Performance in Indonesia." National Bureau of Economic Research.
De Smedt, Bert. 2014. "Advances in the Use of Neuroscience Methods in Research on Learning and Instruction " Frontline Learning research 2(4): 7-14.
Deaton, Angus, and Nancy Cartwright. 2016. "Understanding and Misunderstanding Randomized Controlled Trials." National Bureau of Economic Research.
Dua, Tarun, Mark Tomlinson, Elizabeth Tablante, Pia Britto, Aisha Yousfzai, Bernadette Daelmans, and Gary L. Darmstadt. 2016. "Global Research Priorities to Accelerate Early Child Development in the Sustainable Development Era." The Lancet Global Health.
Duflo, Esther, Pascaline Dupas, and Michael Kremer. 2011. "Peer Effects, Teacher Incentives, and the Impact of Tracking: Evidence from a Randomized Evaluation in Kenya." American Economic Review 101(5): 1739-74.
Duflo, Esther, Rema Hanna, and Stephen P. Ryan. 2012. "Incentives Work: Getting Teachers to Come to School " American Economic Review 102(4): 1241-78.
Dweck, Carol S. 2008. Mindset: The New Psychology of Success. Random House Digital, Inc.
Elder, Sarah, and Gianni Rosas. 2015. "Global Employment Trends for Youth 2015: Scaling up Investments in Decent Jobs for Youth." International Labor Organization.
Engle, Patrice L, Lia CH Fernald, Harold Alderman, Jere Behrman, Chloe O'Gara, Aisha Yousafzai, Meena Cabral de Mello, Melissa Hidrobo, Nurper Ulkuer, and Ilgi Ertem. 2011. "Strategies for Reducing Inequalities and Improving Developmental Outcomes for Young Children in Low-Income and Middle-Income Countries." The Lancet 378(9799): 1339-53.
Evans, David K., and Anna Popova. 2016. "What Really Works to Improve Learning in Developing Countries? An Analysis of Divergent Findings in Systematic Reviews." World Bank Research Observer forthcoming.
Evans, David K., and Fei Yuan. 2017. Economic Returns to Interventions That Increase Learning. WDR 2018 Background Paper. Washington, DC. The World Bank.
Farah, I., Mehmood, T., Amna., Jaffar, R., Ashams, F., Iqbal, P., Khanam, S., Shah, Z. and Gul-Mastoi, N. . 1996. "Road to Success: Self-Sustaining Primary School Change in Rural Pakistan." Karachi: AKU-IED: World Bank.
Fausset, Richard. 2014. "Trial Opens in Atlanta School Cheating Scandal." The New York Times. 9/29/2014. https://www.nytimes.com/2014/09/30/us/racketeering-trial-opens-in-altanta-schools-cheating-scandal.html?_r=1.
Filmer, Deon. 2016. "Education Attainment and Enrollment around the World: An International Database."
Fiszbein, Ariel, Norbert Rüdiger Schady, and Francisco HG Ferreira. 2009. Conditional Cash Transfers: Reducing Present and Future Poverty. World Bank Publications.
Fryer, Roland G. 2011. "Financial Incentives and Student Achievement: Evidence from Randomized Trials." The Quarterly Journal of Economics 126(4): 1755-98.
Garner, Andrew S., Jack P. Shonkoff, Benjamin S. Siegel, Mary I. Dobbins, Marian F. Earls, Laura McGuinn, John Pascoe, and David L. Wood. 2012. "Early Childhood Adversity, Toxic Stress, and the Role of the Pediatrician: Translating Developmental Science into Lifelong Health." Pediatrics 129(1): e224-e31.
Gertler, Paul, James J. Heckman, Rodrigo Pinto, Arianna Zanolini, Christel Vermeersch, Susan Walker, Susan M. Chang, and Sally M. Grantham-McGregor. 2014. "Labor Market Returns to an Early Childhood Stimulation Intervention in Jamaica." Science 344(6187): 998-1001.
Glewwe, Paul, Michael Kremer, and Sylvie Moulin. 2009. "Many Children Left Behind? Textbooks and Test Scores in Kenya." American Economic Journal: Applied Economics 1(1): 112-35.
- O.41 -
Glewwe, Paul W, Eric A Hanushek, Sarah D Humpage, and Renato Ravina. 2011. "School Resources and Educational Outcomes in Developing Countries: A Review of the Literature from 1990 to 2010." National Bureau of Economic Research.
Gove, Amber, and Peter Cvelich. 2011. "Early Reading: Igniting Education for All. A Report by the Early Grade Learning Community of Practice." RTI International.
Grantham‐McGregor, Sally M, Lia CH Fernald, Rose Kagawa, and Susan Walker. 2014. "Effects of Integrated Child Development and Nutrition Interventions on Child Development and Nutritional Status." Annals of the New York Academy of Sciences 1308(1): 11-32.
Green, Duncan. 2016. How Change Happens. Oxford: Oxford University Press.
Grindle, Merilee Serrill. 2004. Despite the Odds: The Contentious Politics of Education Reform. Princeton University Press.
Guilfoyle, Christy. 2006. "Nclb: Is There Life Beyond Testing?" Educational Leadership 64(3): 8.
Hanushek, Eric A. 1986. "The Economics of Schooling: Production and Efficiency in Public Schools." Journal of economic literature 24(3): 1141-77.
———. 1992. "The Trade-Off between Child Quantity and Quality." Journal of political economy 100(1): 84-117.
———. 1995. "Interpreting Recent Research on Schooling in Developing Countries." World Bank Research Observer 10(2): 227-46.
Hanushek, Eric A, Victor Lavy, and Kohtaro Hitomi. 2008. "Do Students Care About School Quality? Determinants of Dropout Behavior in Developing Countries." Journal of Human Capital 2(1): 69-105.
Hanushek, Eric A, and Ludger Woessmann. 2008. "The Role of Cognitive Skills in Economic Development." Journal of Economic Literature 46(3): 607-68.
Hungi, Njora, Demus Makuwa, Kenneth Norman Ross, Mioko Saito, Stéphanie Dolata, Frank Van Cappelle, Laura Paviot, and Jacqueline Vellien. 2010. "Sacmeq Iii Project Results: Pupil Achievement Levels in Reading and Mathematics." SACMEQ.
Insel, Thomas R, and Story C Landis. 2013. "Twenty-Five Years of Progress: The View from Nimh and Ninds." Neuron 80(3): 561-67.
Jacob, Brian A. 2005. "Accountability, Incentives and Behavior: The Impact of High-Stakes Testing in the Chicago Public Schools." Journal of public Economics 89(5): 761-96.
———. 2007. "Test-Based Accountability and Student Achievement: An Investigation of Differential Performance on Naep and State Assessments." National Bureau of Economic Research.
Kiessel, Jessica, and Annie Duflo. 2014. "Teacher Community Assistant Initiative Cost Effectiveness Report " Innovation for Poverty Action (IPA) brief.
Kingdon, Geeta. 1996. "The Quality and Efficiency of Private and Public Education: A Case‐Study of Urban India." Oxford Bulletin of Economics and Statistics 58(1): 57-82.
Kremer, Michael, Edward Miguel, and Rebecca Thornton. 2009. "Incentives to Learn." The Review of Economics and Statistics 91(3): 437-56.
Kremer, Michael R. 1995. "Research on Schooling: What We Know and What We Don't a Comment on Hanushek." The World Bank Research Observer: 247-54.
Kuhl, Patricia K. 2010. "Brain Mechanisms in Early Language Acquisition." Neuron 67(5): 713-27.
Lauwerier, Thibaut, and Abdeljalil Akkari. 2015. "Teachers and the Quality of Basic Education in Sub-Saharan Africa." Education Research and Foresight: Working Papers Series, 2015, no.11.
Lavinas, Lena, and Alinne Veiga. 2013. "Brazil's One Laptop Per Child Program: Impact Evaluation and Implementation Assessment." Cadernos de Pesquisa 43(149).
Layton, Lyndsey. 2015. "Study: Billions of Dollars in Annual Teacher Training Is Largely a Waste " The Washington Post https://www.washingtonpost.com/local/education/study-billions-of-dollars-in-annual-teacher-training-is-largely-a-waste/2015/08/03/c4e1f322-39ff-11e5-9c2d-ed991d848c48_story.html.
Leder, Gilah C. 1987. "Teacher Student Interaction: A Case Study." Educational Studies in Mathematics 18(3): 255-71.
Lemos, Renata, and Daniela Scur. 2016. "Developing Management: An Expanded Evaluation Tool for Developing Countries." RISE Working Paper 16/007.
Levitt, Steven D, John A List, Susanne Neckermann, and Sally Sadoff. 2016. "The Behavioralist Goes to School: Leveraging Behavioral Economics to Improve Educational Performance." American Economic Journal: Economic Policy 8(4): 183-219.
Levy, B, Robert Cameron, U Hoadley, and Vinothan Naidoo. 2016. "The Politics of Governance and Basic Education: A Tale of Two South African Provinces."
- O.42 -
Liang, Xiaoyan, Huma Kidwai, and Minxuan Zhang. 2016. How Shanghai Does It : Insights and Lessons from the Highest-Ranking Education System in the World. Washington, DC: World Bank.
Linden, Leigh L. 2008. Complement or Substitute?: The Effect of Technology on Student Achievement in India. InfoDev.
Lupien, Sonia J, Suzanne King, Michael J Meaney, and Bruce S McEwen. 2000. "Child’s Stress Hormone Levels Correlate with Mother’s Socioeconomic Status and Depressive State." Biological Psychiatry 48(10): 976-80.
Malpel, J, and others. 2015. Pasec 2014. Education System Performance in Francophone Africa: Competencies and Learning Factors in Primary Education. Dakar, Senegal.
Mansuri, Ghazala, and Vijayendra Rao. 2012. Localizing Development: Does Participation Work? : World Bank Publications.
Martorell, Paco, and Isaac McFarlin Jr. 2011. "Help or Hindrance? The Effects of College Remediation on Academic and Labor Market Outcomes." The Review of Economics and Statistics 93(2): 436-54.
McCoy, Dana Charles, Evan D Peet, Majid Ezzati, Goodarz Danaei, Maureen M Black, Christopher R Sudfeld, Wafaie Fawzi, and Günther Fink. 2016. "Early Childhood Developmental Status in Low-and Middle-Income Countries: National, Regional, and Global Prevalence Estimates Using Predictive Modeling." PLoS Med 13(6): e1002034.
McEwan, Patrick J. 2015. "Improving Learning in Primary Schools of Developing Countries: A Meta-Analysis of Randomized Experiments " Review of Educational Research 85(3): 353-94.
Mingat, Alain, and Jee-Peng Tan. 1998. The Mechanics of Progress in Education: Evidence from Cross-Country Data. World Bank Publications.
Mizala, Alejandra, and Ben Ross Schneider. 2014. "Negotiating Education Reform: Teacher Evaluations and Incentives in Chile (1990–2010)." Governance 27(1): 87-109.
Morgan, Claire, Anthony Petrosino, and Trevor Fronius. 2012. "A Systematic Review of the Evidence of the Impact of Eliminating School User Fees in Low-Income Developing Countries " WestEd.
Mulkeen, Aidan. 2010. Teachers in Anglophone Africa: Issues in Teacher Supply, Training, and Management. World Bank Publications.
Muralidharan, Karthik, Abhijeet Singh, and Alejandro J. Ganimian. 2016a. "Disrupting Education?
Experimental Evidence on Technology-Aided Instruction in India ".
Muralidharan, Karthik, Abhijeet Singh, and Alejandro Ganimian. 2016b. "Disrupting Education? Experimental Evidence on Technology-Aided Instruction in India." UC San Diego. http://econweb.ucsd.edu/~kamurali/papers/Working%20Papers/Disrupting%20Education%20(Current%20WP).pdf.
Muralidharan, Karthik, and Venkatesh Sundararaman. 2011a. "Teacher Performance Pay: Experimental Evidence from India." Journal of Political Economy 119(1): 39-77.
———. 2011b. "Teacher Performance Pay: Experimental Evidence from India." The Journal of Political Economy 119(1): 39-77.
Muralidharan, Karthik, and Yendrick Zieleniak. 2013. "Measuring Learning Trajectories in Developing Countries with Longitudinal Data and Item Response Theory." UC San Diego.
Neal, Derek. 2013. "The Consequences of Using One Assessment System to Pursue Two Objectives." The Journal of Economic Education 44(4): 339-52.
Nelson, Charles A. 2016. Brain Imaging as a Measure of Future Cognitive Outcomes.
Nguyen, Trang. 2008. "Information, Role Models and Perceived Returns to Education: Experimental Evidence from Madagascar." Economics Department. Massachusetts Institute of Technology.
OECD. 2011. "Strong Performers and Successful Reformers in Education: Lessons from Pisa for the United States." OECD.
———. 2016. "Pisa 2015 Results (Volume 1): Excellence and Equity in Education." Paris: PISA.
Orazem, Peter F. 2000. "The Urban and Rural Fellowship School Experiments in Pakistan: Design, Evaluation, and Sustainability." Economics of Education Review 22(3) 265-74.
Orazem, Peter, Paul Glewwe, and Harry Patrinos. 2007. "The Benefits and Costs of Alternative Strategies to Improve Educational Outcomes." Iowa State University, Department of Economics Working Paper Series (07028).
Park, Rufina Kyung Eun. 2016. "Preparing Students for South Korea's Creative Economy: The Successes and Challenges of Educational Reform." Asia Pacific Foundation of Canada.
Pascale, Richard T, Jerry Sternin, and Monique Sternin. 2010. The Power of Positive Deviance: How Unlikely
- O.43 -
Innovators Solve the World's Toughest Problems. Harvard Business Press.
Paxson, Christina, and Norbert Schady. 2007. "Cognitive Development among Young Children in Ecuador the Roles of Wealth, Health, and Parenting." Journal of Human Resources 42(1): 49-84.
Piper, Benjamin, Evelyn Jepkemei, Dunston Kwayumba, and Kennedy Kibukho. 2015. "Kenya’s Ict Policy in Practice: The Effectiveness of Tablets and E-Readers in Improving Student Outcomes." FIRE: Forum for International Research in Education.
Pradhan, Menno, Daniel Suryadarma, Amanda Beatty, Maisy Wong, Arya Gaduh, Armida Alisjahbana, and Rima Prama Artha. 2014. "Improving Educational Quality through Enhancing Community Participation: Results from a Randomized Field Experiment in Indonesia." American Economic Journal. Applied Economics 6(2): 105.
Pritchett, Lant. 2013. The Rebirth of Education: Schooling Ain't Learning. Washington, DC: Center for Global Development.
Pritchett, Lant, and Amanda Beatty. 2015. "Slow Down, You're Going Too Fast: Matching Curricula to Student Skill Levels." International Journal of Educational Development 40: 276-88.
Pritchett, Lant, and Justin Sandefur. 2013. "Context Matters for Size: Why External Validity Claims and Development Practice Do Not Mix." Journal of Globalization and Development 4(2): 161-98.
Rajkumar, A.S, and V Swaroop. 2008. "Public Spending and Outcomes: Does Governance Matter?" Journal of Development Economics 86: 96-111.
Rivkin, Steven G, Eric A Hanushek, and John F Kain. 2005. "Teachers, Schools, and Academic Achievement." Econometrica 73(2): 417-58.
Robinson, Viviane MJ, Claire A Lloyd, and Kenneth J Rowe. 2008. "The Impact of Leadership on Student Outcomes: An Analysis of the Differential Effects of Leadership Types." Educational administration quarterly.
Rockoff, Jonah E. 2004. "The Impact of Individual Teachers on Student Achievement: Evidence from Panel Data." The American Economic Review 94(2): 247-52.
Romer, Paul 2015. "Botox for Development ".
RTI International. 2009. "Early Grade Reading Sassessment Toolkit." Research Triangle Park, NC: RTI.
Sabarwal, Shwetlena, David K Evans, and Anastasia Marshak. 2014. "The Permanent Input Hypothesis: The Case of Textbooks and (No) Student Learning in Sierra
Leone." World Bank Policy Research Working Paper (7021).
Save the Children's Education Global Initiative. 2013. "Ending the Hidden Exclusion: Learning and Equity in Education Post-2015." London: Save the Children International.
Schady, Norbert, Jere Behrman, Maria Caridad Araujo, Rodrigo Azuero, Raquel Bernal, David Bravo, Florencia Lopez-Boo, Karen Macours, Daniela Marshall, and Christina Paxson. 2015. "Wealth Gradients in Early Childhood Cognitive Development in Five Latin American Countries." Journal of Human Resources 50(2): 446-63.
Schuh Moore, A, J DeStefano, and E Adelman. 2010. "Opportunity to Learn and Early Grade Reading Fluency to Measure School Effectiveness in Ethiopia, Guatemala, Honduras, and Nepal." prepared for USAID/EQUIP2 Project. Washington: US Government Printing Office.
Scott-Clayton, Judith, and Olga Rodriguez. 2014. "Development, Discouragement, or Diversion? New Evidence on the Effects of College Remediation Policy." Education Finance and Policy.
Singh, Abhijeet. 2015. "Learning More with Every Year: School Year Productivity and International Learning Divergence." University of Oxford, Mimeo [ http://www. cesifogroup. de/de/ifoHome/events/Archive/conferences/2015/09/2015-09-11-ee15-Hanushek/Programme. html].
Snilstveit, Birte, Jennifer Stevenson, Radhika Menon, Daniel Phillips, Emma Gallagher, Maisie Geleen, Hannah Jobse, Tanja Schmidt, and Emmanuel Jimenez. 2016. "The Impact of Education Programmes on Learning and School Participation in Low- and Middle-Income Countries: A Systematic Review Summary Report." Systematic Review Summaries. New Delhi: International Initiative for Impact Evaluation (3ie). http://www.3ieimpact.org/media/filer_public/2016/09/20/srs7-education-report.pdf.
Solano-Flores, G, LA Contreras-Niño, and E Backhoff-Escudero. 2005. "The Mexican Translation of Timss-95: Test Translation Lessons from a Post-Mortem Study." Annual Meeting of the National Council on Measurement in Education. Montreal, Québec, Canada.
Spaull, Nicholas, and Janeli Kotze. 2015. "Starting Behind and Staying Behind in South Africa: The Case of Insurmountable Learning Deficits in Mathematics." International Journal of Educational Development 41: 13-24.
Suryadarma, D. 2012. "How Corruption Diminishes the Effectiveness of Public Spending on Education in
- O.44 -
Indonesia." Bulletin of Indonesian Economic Studies 48(1): 85-100.
Tan, Jee-Peng, and Alain Mingat. 1992. Education in Asia: A Comparative Study of Cost and Financing. World Bank Publications.
Tandon, Prateek, and Tsuyoshi Fukao. 2015. Educating the Next Generation: Improving Teacher Quality in Cambodia. World Bank Publications.
Todd, Alexa, and Mark Mason. 2005. "Enhancing Learning in South African Schools: Strategies Beyond Outcomes-Based Education." International journal of educational development 25(3): 221-35.
Tooley, James, and Pauline Dixon. 2007. "Private Education for Low-Income Families: Results from a Global Research Project." In Private Schooling in Less Economically Developed Countries: Asian and African Perspectives, 15-39. Oxford, London: Cambridge University Press.
UNESCO. 2016a. "Education for People and Planet: Creating Sustainable Futures for All." Paris: UNESCO Publishing.
———. 2016b. "Laying the Foundation to Measure Sustainable Development Goal 4." Montreal: UNESCO and UNESCO Institute for Statistics.
UNESCO, and EFA. 2015. "A Growing Number of Children and Adolescents Are out of School as Aid Fails to Meet the Mark."
UNESCO Institute for Statistics. 2006. Teachers and Educational Quality: Monitoring Global Needs for 2015. Montreal: UNESCO Institute for Statistics.
———. 2016. "Laying the Foundation to Measure Sustainable Development Goal 4." Sustainable Development Data Digest. Montreal: UNESCO Institute for Statistics.
Wales, J, A Ali, Susan Nicolai, F Morales, and D Contreras. 2014. "Improvements in the Quality of Basic Education: Chile's Experience." London: Overseas Development Institute.
Walker, Susan P, Theodore D Wachs, Julie Meeks Gardner, Betsy Lozoff, Gail A Wasserman, Ernesto Pollitt, Julie A Carter, and International Child Development Steering Group. 2007. "Child Development: Risk Factors for Adverse Outcomes in Developing Countries." Lancet 369(9556): 145-57.
Waters, Tim, Robert J Marzano, and Brian McNulty. 2003. "Balanced Leadership: What 30 Years of Research Tells Us About the Effect of Leadership on Student Achievement. A Working Paper."
Wolf, Alison. 2004. "Education and Economic Performance: Simplistic Theories and Their Policy Consequences." Oxford Review of Economic Policy 20(2): 315-33.
World Bank. 2003. World Development Report 2004: Making Services Work for Poor People. Washington, DC: Oxford University Press for the World Bank.
———. 2012. "World Development Report 2012: Gender Equality and Development." Washington, DC: World Bank.
———. 2013. "Service Delivery Indicators ".
———. 2016. "Driving Performance from the Center: Malaysia's Experience with Pemandu." Washington, DC: World Bank.
Part I
Education’s Promise

- 1.1 -
Chapter 1 Schooling, learning, and the promise of education
Contents
Education as freedom .................................................................................................................................... 1
Education improves individual freedoms ..................................................................................................... 2
Education improves economic opportunities ............................................................................................ 2
Education leads to longer lives and enables better life choices ................................................................ 4
The benefits of education are long-lasting ................................................................................................ 6
Education benefits all of society ................................................................................................................... 7
Education promotes economic growth ...................................................................................................... 7
Education creates the building blocks for inclusive institutions ............................................................... 8
Learning and the promise of education ....................................................................................................... 10
“No one has yet realized the wealth of sympathy, the kindness and generosity hidden in the soul of a child. The effort of every true education should be to unlock that treasure.”
—Emma Goldman
“In the long run, the best way to reduce inequalities with respect to labor as well as to increase the average productivity of the labor force and the overall growth of the economy is surely to
invest in education.”
—Thomas Piketty1
Education is a basic human right and central to unlocking human capabilities. It also holds tremendous instrumental value. Education raises human capital, productivity, incomes, employability, and economic growth. But the benefits of education go far beyond these monetary gains: education also makes people healthier and gives them more control over their lives. And it generates trust, boosts social capital, and creates institutions that promote inclusion and shared prosperity.
Education as freedom
1.1 Since 1948 education has been recognized as a basic human right, highlighting its role as a safeguard for human dignity and foundation for freedom, justice, and peace.2 In the framework of Amartya Sen’s capability approach, education increases both an individual’s assets and his or her ability to transform them into wellbeing—or what has been called the individual’s 1 Piketty 2014. 2 UNESCO 2007. Article 26 of the Universal Declaration of Human Rights (1948) states: “Everybody has the right to education … Education shall be directed to the full development of the human personality and to the strengthening of respect for human rights and fundamental freedoms. It shall promote understanding, tolerance and friendship among all nations, racial or religious groups, and shall further the activities for the maintenance of peace.”
- 1.2 -
“beings and doings” and “capabilities.”3 Education can have corresponding salutary effects on communities and societies.
1.2 Education expands freedom through many channels, both expanding aspirations and increasing the potential to reach them. These benefits are both monetary and nonmonetary (table 1.1). For individuals and families, education boosts human capital, improves economic opportunities, promotes health, and expands the ability to make effective choices. For societies, education expands economic opportunities, promotes social mobility, and makes institutions function more effectively.4
Table 1.1 Examples of education’s benefits
Individual/Family Community/Societal
Monetary Higher probability of employment Greater productivity Higher earnings Reduced poverty
Higher productivity More rapid economic growth Poverty reduction Long-run development
Nonmonetary Better health Improved education and health of children /family Greater resilience and adaptability More engaged citizenship Better choices Greater life satisfaction
Increased social mobility Better-functioning institutions/service delivery Higher levels of civic engagement Greater social cohesion Reduced negative externalities
Source: WDR 2018 team.
1.3 This chapter does not try to review all the evidence on the benefits of education. Most people—whether policymakers or parents—already recognize the great value of education.5 Families around the world make great sacrifices to keep their children in good schools, and political and opinion leaders consistently rank education among their top development priorities. But before launching into the main theme of this Report—the learning crisis and what to do about it—it is worth briefly surveying the many ways that education can contribute to progress—highlighting that many of these benefits depend on learning, not just schooling.6
Education improves individual freedoms
Education improves economic opportunities
1.4 Education is a powerful tool for raising incomes. Education makes workers more productive: schooling enables individuals to acquire skills that allow them to increase the output
3 Sen 1985; Sen 1999; Sen 2004. 4 Allen 2016. 5 For example, see the comprehensive discussion of the role of education for the Sustainable Development Goals in UNESCO 2016. 6 Heckman and others 2014.
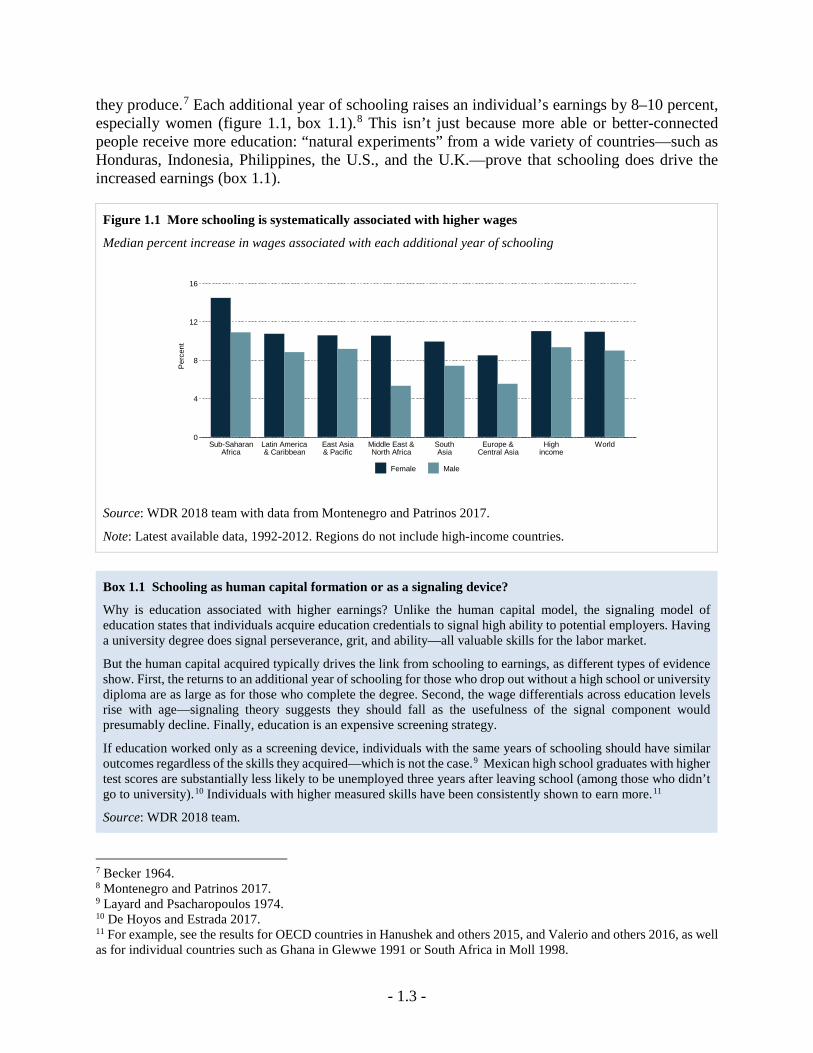
- 1.3 -
they produce.7 Each additional year of schooling raises an individual’s earnings by 8–10 percent, especially women (figure 1.1, box 1.1).8 This isn’t just because more able or better-connected people receive more education: “natural experiments” from a wide variety of countries—such as Honduras, Indonesia, Philippines, the U.S., and the U.K.—prove that schooling does drive the increased earnings (box 1.1).
Figure 1.1 More schooling is systematically associated with higher wages
Median percent increase in wages associated with each additional year of schooling
Source: WDR 2018 team with data from Montenegro and Patrinos 2017.
Note: Latest available data, 1992-2012. Regions do not include high-income countries.
Box 1.1 Schooling as human capital formation or as a signaling device?
Why is education associated with higher earnings? Unlike the human capital model, the signaling model of education states that individuals acquire education credentials to signal high ability to potential employers. Having a university degree does signal perseverance, grit, and ability—all valuable skills for the labor market.
But the human capital acquired typically drives the link from schooling to earnings, as different types of evidence show. First, the returns to an additional year of schooling for those who drop out without a high school or university diploma are as large as for those who complete the degree. Second, the wage differentials across education levels rise with age—signaling theory suggests they should fall as the usefulness of the signal component would presumably decline. Finally, education is an expensive screening strategy.
If education worked only as a screening device, individuals with the same years of schooling should have similar outcomes regardless of the skills they acquired—which is not the case.9 Mexican high school graduates with higher test scores are substantially less likely to be unemployed three years after leaving school (among those who didn’t go to university).10 Individuals with higher measured skills have been consistently shown to earn more.11
Source: WDR 2018 team.
7 Becker 1964. 8 Montenegro and Patrinos 2017. 9 Layard and Psacharopoulos 1974. 10 De Hoyos and Estrada 2017. 11 For example, see the results for OECD countries in Hanushek and others 2015, and Valerio and others 2016, as well as for individual countries such as Ghana in Glewwe 1991 or South Africa in Moll 1998.
0
4
8
12
16
Perc
ent
Sub-SaharanAfrica
Latin America& Caribbean
East Asia& Pacific
Middle East &North Africa
SouthAsia
Europe &Central Asia
Highincome
World
Female Male
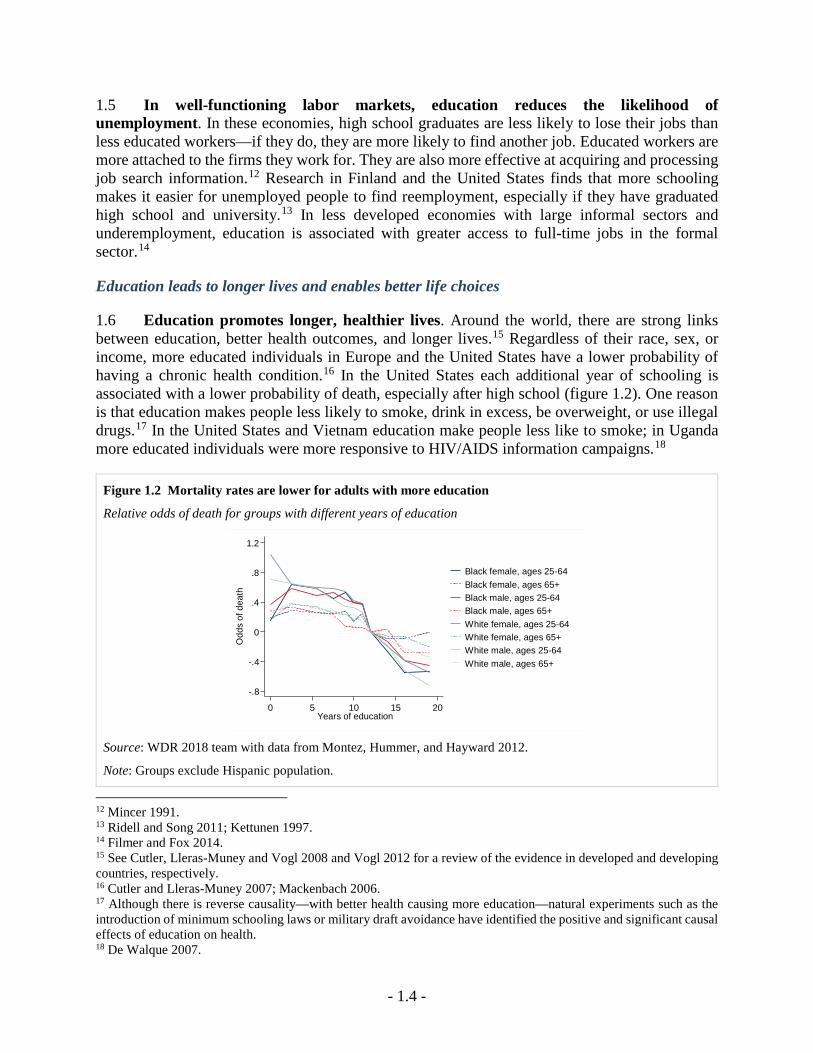
- 1.4 -
1.5 In well-functioning labor markets, education reduces the likelihood of unemployment. In these economies, high school graduates are less likely to lose their jobs than less educated workers—if they do, they are more likely to find another job. Educated workers are more attached to the firms they work for. They are also more effective at acquiring and processing job search information.12 Research in Finland and the United States finds that more schooling makes it easier for unemployed people to find reemployment, especially if they have graduated high school and university.13 In less developed economies with large informal sectors and underemployment, education is associated with greater access to full-time jobs in the formal sector.14
Education leads to longer lives and enables better life choices
1.6 Education promotes longer, healthier lives. Around the world, there are strong links between education, better health outcomes, and longer lives.15 Regardless of their race, sex, or income, more educated individuals in Europe and the United States have a lower probability of having a chronic health condition.16 In the United States each additional year of schooling is associated with a lower probability of death, especially after high school (figure 1.2). One reason is that education makes people less likely to smoke, drink in excess, be overweight, or use illegal drugs.17 In the United States and Vietnam education make people less like to smoke; in Uganda more educated individuals were more responsive to HIV/AIDS information campaigns.18
Figure 1.2 Mortality rates are lower for adults with more education
Relative odds of death for groups with different years of education
Source: WDR 2018 team with data from Montez, Hummer, and Hayward 2012.
Note: Groups exclude Hispanic population.
12 Mincer 1991. 13 Ridell and Song 2011; Kettunen 1997. 14 Filmer and Fox 2014. 15 See Cutler, Lleras-Muney and Vogl 2008 and Vogl 2012 for a review of the evidence in developed and developing countries, respectively. 16 Cutler and Lleras-Muney 2007; Mackenbach 2006. 17 Although there is reverse causality—with better health causing more education—natural experiments such as the introduction of minimum schooling laws or military draft avoidance have identified the positive and significant causal effects of education on health. 18 De Walque 2007.
-.8
-.4
0
.4
.8
1.2
Odd
s of
dea
th
0 5 10 15 20Years of education
Black female, ages 25-64Black female, ages 65+Black male, ages 25-64Black male, ages 65+White female, ages 25-64White female, ages 65+White male, ages 25-64White male, ages 65+
- 1.5 -
1.7 Educated individuals have more control over the life they want to pursue—often called “agency.” Increased agency manifests as a reduction in risky behaviors, higher life satisfaction, and greater happiness. Across 57 countries at all income levels, only 1 in 10 university graduates felt that they had little or no control over their lives. 19 When the U.K. and U.S. extended compulsory schooling, people who received more education were less likely to report being unhappy later in life.20 The positive relationship between education and agency is partly mediated by the positive effect of education on income, but there seems to be an independent effect too: the effects on crime or fertility, for example, are not only contingent on income.
1.8 Educated individuals are less prone to commit crimes. Schooling reduces most types of crime committed by adults,21 as well as crime during late adolescence.22 Among 16- and 17-year-olds in the United Kingdom, school dropouts are three times more likely to commit crimes than those who have stayed in school; this gap remains well into the early 20s. In Sweden, the U.K., and the U.S., completing high school makes youth less likely to commit crimes, and education is linked with lower crime elsewhere—as in Mexico, where high school dropouts were more caught up in the violence of the war on drugs.23
1.9 Education reduces teen pregnancy and increases the control that women have over the size of their families. Schooling reduces teenage pregnancy indirectly by increasing girls’ aspirations, empowerment, and agency. An additional year of schooling—induced by a change in compulsory schooling laws, allowing research to isolate the causal effects—reduced teenage fertility by 0.37 children per woman in Turkey.24 School subsidies reduced teen school dropout and pregnancy in Brazil, Colombia, Kenya, Malawi, and Peru.25 More generally, women with more schooling have lower fertility rates. In Brazil increased schooling among young women explains 40–80 percent of the decline in the fertility rate that began in the late 1960s.26 When school coverage expanded in Nigeria, each additional year of female schooling reduced fertility by at least 0.26 births per woman.27 One reason for this is that educated women earn more, making it costlier for them to leave the labor market.28 Education also increases women’s use of contraception, increases their role in family decisions on fertility, and makes them more aware of tradeoffs in having children.29
19 The World Values Survey 2010-2014 (wave 6) covered 57 developed and developing economies with a sample of 90.000 individuals surveyed. The nationally representative samples measure people’s beliefs, values and motivations and socio economic data. Estimations include average weights and consolidated categories for analysis (education level and scaled responses). 20 Oreopoulos 2007. 21 Lochner 2004; Lochner and Moretti 2004. 22 Cullen, Jacob and Levitt 2006; Deming 2009. 23 Anderson 2014; Machin, Marie and Vujić 2011; Hjalmarsson, Holmlund and Lindquist 2015; De Hoyos Navarro and others 2016. At least two possible mechanisms could explain why education reduces crime. First, because education increases potential earnings, it also drives up the opportunity costs of crime. Second, more schooling may reduce crime simply by reducing the time available to them to commit crimes; some US data supports this “incapacitation effect” (Anderson 2014). 24 Güneş 2016. 25 Duflo, Dupas and Kremer 2014; Azevedo and others 2012; Baird and others 2010. 26 Lam, Sedlacek and Duryea 2016. 27 Osili and Long 2008. 28 Becker, Cinnirella and Woessmann 2013. 29 Lavy and Zablotsky 2011.
- 1.6 -
The benefits of education are long-lasting
1.10 Education can stop poverty in families. Incomes of parents and their kids are highly correlated: Income inequality persists, and poverty is transmitted from one generation to the next. 30 But improving education gives poor children a boost: in the United States the children of households that moved to a (one standard deviation) better neighborhood had incomes as adults 10 percent higher, partly because the move improved learning.31
1.11 Better-educated mothers raise healthier and more educated children. Women’s education is linked to many health benefits for their children, from higher immunization to better nutrition to lower mortality.32 Improvements in women’s education have been linked to better health outcomes for their children in many countries, including Brazil, Nepal, Pakistan, and Senegal.33 Parental schooling robustly predicts higher educational attainment for children, even after controlling for other factors. And children’s ability to benefit from education is shaped by their parents’ education. In the United States each additional year of mother’s schooling increases children’s math test scores by 0.1 standard deviation and significantly reduces behavioral problems.34 In Pakistan children whose mothers have even a single year of education spend an extra hour studying at home a day.35
1.12 Education’s benefits are especially apparent in changing environments. Individuals with stronger skills can take better advantage of new technologies and adapt to changing work. Indeed, experts on technological change have long argued that the more volatile is the state of technology, the more productive education is.36 Returns to primary schooling in India increased during the Green Revolution, with more educated farmers diffusing new technologies.37 More generally, globalization and advances in technology are putting a premium on education and skills—both cognitive and socioemotional skills (see Spotlight). New skills facilitate the adoption of technologies and promote innovation,38 with general skills enabling individuals to adapt to economic changes that occur over their lifetimes.39 When the North American Free Trade Agreement (NAFTA) increased labor productivity in Mexico, the benefits were concentrated among more skilled workers in the richer northern states.40 In general, returns to education are higher in economically free countries with institutions that allow individuals to adjust to shocks and market forces.41
30 Solon 1999. 31 Chetty, Hendren and Katz 2016. 32 Thomas, Strauss and Henriques 1990; Allendorf 2007; Welch 1970; Schultz 1975. 33 World Bank 2011. 34 Carneiro, Meghir and Parey 2013. 35 Andrabi, Das and Khwaja 2012; Dumas and Lambert 2011. 36 Nelson and Phelps 1966; Griliches 1969. 37 Foster and Rosenzweig 1996. 38 Aghion and others 2009b. 39 Hanushek and others 2017. 40 Hanson 2004; Hanson 2007. 41 King, Montenegro and Orazem 2012.
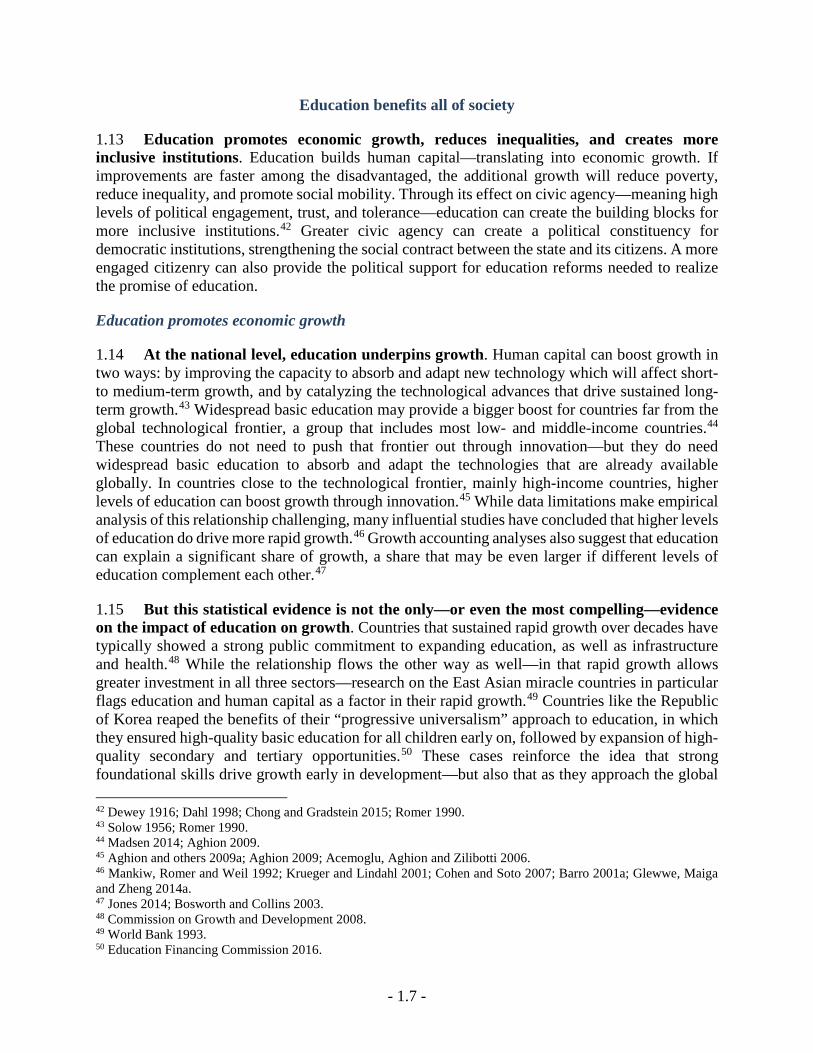
- 1.7 -
Education benefits all of society
1.13 Education promotes economic growth, reduces inequalities, and creates more inclusive institutions. Education builds human capital—translating into economic growth. If improvements are faster among the disadvantaged, the additional growth will reduce poverty, reduce inequality, and promote social mobility. Through its effect on civic agency—meaning high levels of political engagement, trust, and tolerance—education can create the building blocks for more inclusive institutions.42 Greater civic agency can create a political constituency for democratic institutions, strengthening the social contract between the state and its citizens. A more engaged citizenry can also provide the political support for education reforms needed to realize the promise of education.
Education promotes economic growth
1.14 At the national level, education underpins growth. Human capital can boost growth in two ways: by improving the capacity to absorb and adapt new technology which will affect short- to medium-term growth, and by catalyzing the technological advances that drive sustained long-term growth.43 Widespread basic education may provide a bigger boost for countries far from the global technological frontier, a group that includes most low- and middle-income countries.44 These countries do not need to push that frontier out through innovation—but they do need widespread basic education to absorb and adapt the technologies that are already available globally. In countries close to the technological frontier, mainly high-income countries, higher levels of education can boost growth through innovation.45 While data limitations make empirical analysis of this relationship challenging, many influential studies have concluded that higher levels of education do drive more rapid growth.46 Growth accounting analyses also suggest that education can explain a significant share of growth, a share that may be even larger if different levels of education complement each other.47
1.15 But this statistical evidence is not the only—or even the most compelling—evidence on the impact of education on growth. Countries that sustained rapid growth over decades have typically showed a strong public commitment to expanding education, as well as infrastructure and health.48 While the relationship flows the other way as well—in that rapid growth allows greater investment in all three sectors—research on the East Asian miracle countries in particular flags education and human capital as a factor in their rapid growth.49 Countries like the Republic of Korea reaped the benefits of their “progressive universalism” approach to education, in which they ensured high-quality basic education for all children early on, followed by expansion of high-quality secondary and tertiary opportunities.50 These cases reinforce the idea that strong foundational skills drive growth early in development—but also that as they approach the global 42 Dewey 1916; Dahl 1998; Chong and Gradstein 2015; Romer 1990. 43 Solow 1956; Romer 1990. 44 Madsen 2014; Aghion 2009. 45 Aghion and others 2009a; Aghion 2009; Acemoglu, Aghion and Zilibotti 2006. 46 Mankiw, Romer and Weil 1992; Krueger and Lindahl 2001; Cohen and Soto 2007; Barro 2001a; Glewwe, Maiga and Zheng 2014a. 47 Jones 2014; Bosworth and Collins 2003. 48 Commission on Growth and Development 2008. 49 World Bank 1993. 50 Education Financing Commission 2016.
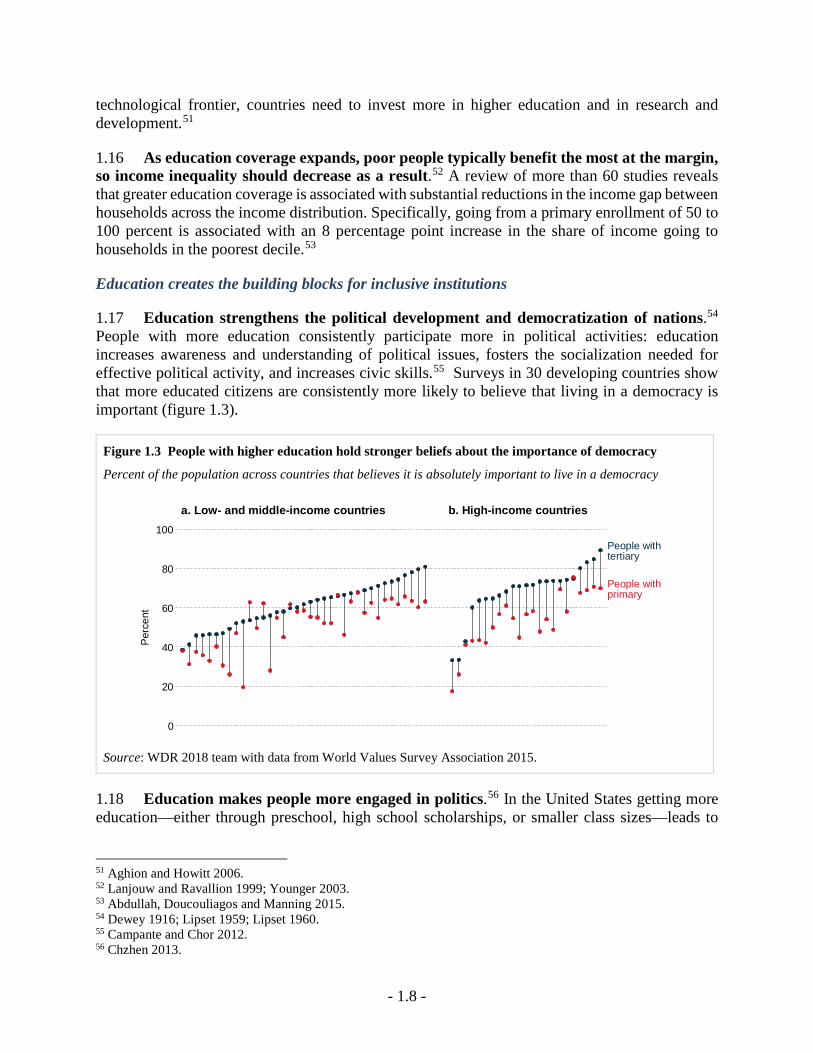
- 1.8 -
technological frontier, countries need to invest more in higher education and in research and development.51
1.16 As education coverage expands, poor people typically benefit the most at the margin, so income inequality should decrease as a result.52 A review of more than 60 studies reveals that greater education coverage is associated with substantial reductions in the income gap between households across the income distribution. Specifically, going from a primary enrollment of 50 to 100 percent is associated with an 8 percentage point increase in the share of income going to households in the poorest decile.53
Education creates the building blocks for inclusive institutions
1.17 Education strengthens the political development and democratization of nations.54 People with more education consistently participate more in political activities: education increases awareness and understanding of political issues, fosters the socialization needed for effective political activity, and increases civic skills.55 Surveys in 30 developing countries show that more educated citizens are consistently more likely to believe that living in a democracy is important (figure 1.3).
Figure 1.3 People with higher education hold stronger beliefs about the importance of democracy
Percent of the population across countries that believes it is absolutely important to live in a democracy
Source: WDR 2018 team with data from World Values Survey Association 2015.
1.18 Education makes people more engaged in politics.56 In the United States getting more education—either through preschool, high school scholarships, or smaller class sizes—leads to
51 Aghion and Howitt 2006. 52 Lanjouw and Ravallion 1999; Younger 2003. 53 Abdullah, Doucouliagos and Manning 2015. 54 Dewey 1916; Lipset 1959; Lipset 1960. 55 Campante and Chor 2012. 56 Chzhen 2013.
a. Low- and middle-income countries b. High-income countries
People withtertiary
People withprimary
0
20
40
60
80
100
Perc
ent
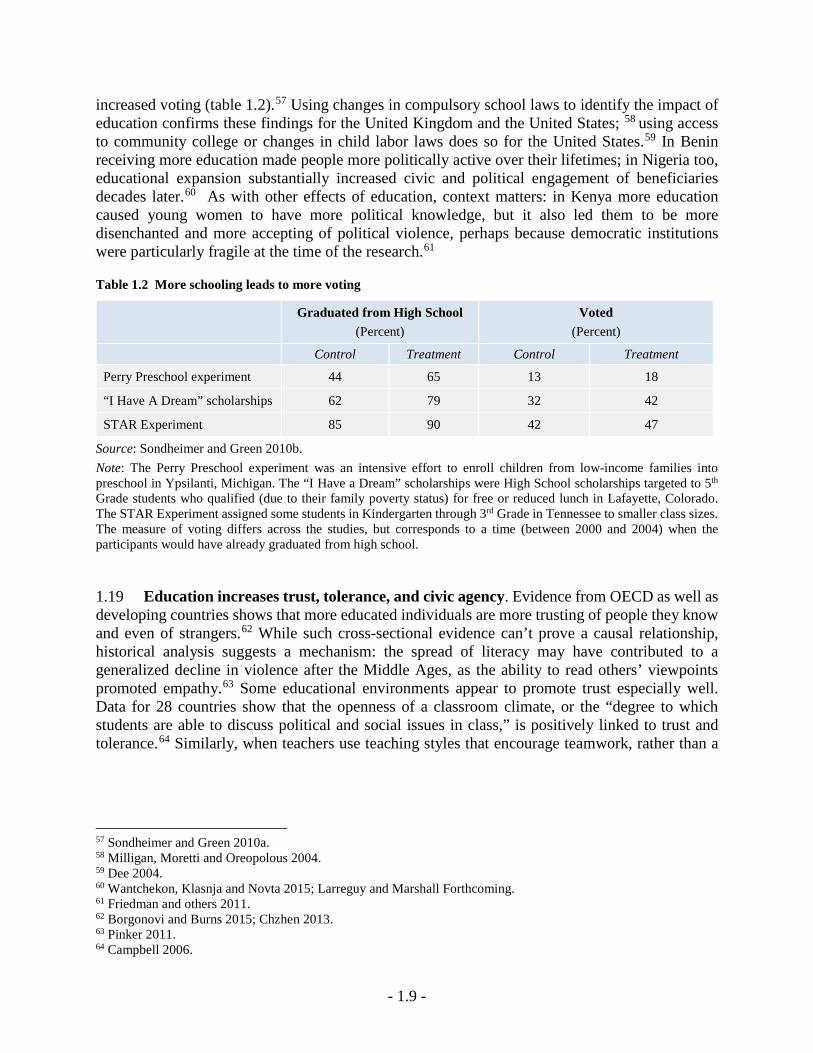
- 1.9 -
increased voting (table 1.2).57 Using changes in compulsory school laws to identify the impact of education confirms these findings for the United Kingdom and the United States; 58 using access to community college or changes in child labor laws does so for the United States.59 In Benin receiving more education made people more politically active over their lifetimes; in Nigeria too, educational expansion substantially increased civic and political engagement of beneficiaries decades later.60 As with other effects of education, context matters: in Kenya more education caused young women to have more political knowledge, but it also led them to be more disenchanted and more accepting of political violence, perhaps because democratic institutions were particularly fragile at the time of the research.61
Table 1.2 More schooling leads to more voting
Graduated from High School (Percent)
Voted (Percent)
Control Treatment Control Treatment
Perry Preschool experiment 44 65 13 18
“I Have A Dream” scholarships 62 79 32 42
STAR Experiment 85 90 42 47
Source: Sondheimer and Green 2010b. Note: The Perry Preschool experiment was an intensive effort to enroll children from low-income families into preschool in Ypsilanti, Michigan. The “I Have a Dream” scholarships were High School scholarships targeted to 5th Grade students who qualified (due to their family poverty status) for free or reduced lunch in Lafayette, Colorado. The STAR Experiment assigned some students in Kindergarten through 3rd Grade in Tennessee to smaller class sizes. The measure of voting differs across the studies, but corresponds to a time (between 2000 and 2004) when the participants would have already graduated from high school.
1.19 Education increases trust, tolerance, and civic agency. Evidence from OECD as well as developing countries shows that more educated individuals are more trusting of people they know and even of strangers.62 While such cross-sectional evidence can’t prove a causal relationship, historical analysis suggests a mechanism: the spread of literacy may have contributed to a generalized decline in violence after the Middle Ages, as the ability to read others’ viewpoints promoted empathy.63 Some educational environments appear to promote trust especially well. Data for 28 countries show that the openness of a classroom climate, or the “degree to which students are able to discuss political and social issues in class,” is positively linked to trust and tolerance.64 Similarly, when teachers use teaching styles that encourage teamwork, rather than a
57 Sondheimer and Green 2010a. 58 Milligan, Moretti and Oreopolous 2004. 59 Dee 2004. 60 Wantchekon, Klasnja and Novta 2015; Larreguy and Marshall Forthcoming. 61 Friedman and others 2011. 62 Borgonovi and Burns 2015; Chzhen 2013. 63 Pinker 2011. 64 Campbell 2006.
- 1.10 -
more top-down pedagogy, it appears to promote social capital: students are more likely to believe in the importance of civic life and the value of cooperation.65
1.20 Education makes institutions work better and improves public services. Educated parents are better able to leverage decision-making authority at the school level. In the Gambia a school-based management program improved student learning only when there was a high level of literacy in the village.66 A more educated population generally demands more transparent use of public resources, better service delivery, and government accountability. Recent cross-country research identifies citizen complaints as a primary mechanism: educated citizens complain more, inducing officials to behave better.67 Education also appears to improve dimensions of governance: countries that had achieved mass education by 1870 had lower corruption in 2010.68
1.21 Growth built on human capital, relative to other sources (such as natural resources), may also reduce incentives for conflict. There are three main ways.69 First, because human capital is difficult to appropriate, conquest of a well-educated population may be less rewarding than seizure of natural resources or even physical capital.70 Second, education raises the opportunity cost of fighting: it is easier to recruit people who have poor job prospects.71 Third, as discussed, education can promote tolerance and cooperation—reducing the propensity to turn to violence to resolve conflicts.72
Learning and the promise of education
1.22 There’s no question that education can be a powerful tool for individual and societal empowerment—but these benefits are not automatic. It’s not just that education can’t do it alone, in that much also has to go right in other sectors of the economy and society (box 1.2). Another problem is that if an education system is managed poorly, it can promote social bads instead of social goods. First, education can deepen cleavages between favored and disadvantaged groups. Young people from poor, rural, and otherwise disadvantaged households not only complete less schooling, but also learn much less while in school (see Part 2 of this Report). In such cases education does little to enhance social mobility. Second, leaders sometimes abuse education systems for political ends—in ways that reinforce autocracy or the social exclusion of certain groups.
Box 1.2 Education can’t do it alone
Economics, politics, and society shape education’s returns. Education systems do not function in a vacuum—they are part of broader economic, political, and social institutions. For instance, does a society uphold property rights? If not, then entrepreneurs are unlikely to invest in risky new ventures, reducing education returns for all. Are there regulations against fraud? If not, then those with education might find it more profitable to engage in socially unproductive but financially remunerative activities. Are women restricted from working outside the home? If yes, then the economic returns to education will be unavailable to them. These are all examples of how
65 Algan, Cahuc and Shleifer 2013. 66 Blimpo, Evans and Lahire 2015. 67 Botero, Ponce and Shleifer 2013. 68 Chong and others 2014. 69 de la Brière and others 2017. 70 Acemoglu and Wolitzky 2011. 71 Collier, Hoeffler and Rohner 2009. 72 Davies 2003.
- 1.11 -
formal or informal institutions influence education returns. In general, reliable institutions that implement the rule of law, reduce corruption, and protect property rights are associated with higher returns to human capital.73
Low demand for educated labor reduces the return to skills. Education returns depend on the interplay between demand and supply forces in the labor market. If the demand for educated labor is low relative to supply then returns to education will be low or declining.74 In urban China the returns to education rose from 4 percent a year of schooling in 1988 to 10 percent in 2001—most of which can be attributed to institutional reforms that increased the demand for skilled labor.75 More generally, shifts from planned to market economies have increased returns to human capital.76 Demand for educated labor is often suppressed when the investment climate is poor.77 This in turn determines demand for labor by private firms and, therefore, the returns to education.78
Countries incentivize the wrong things. Many educated youth in parts of the Middle East and North Africa queue for relatively unproductive jobs in already large public sectors.79 In several countries, political candidates compete in terms of their ability to offer patronage or public employment to their supporters.80 In several North African countries, for example, it was not uncommon in the past for governments to guarantee public employment opportunities for all university graduates, and the public sector remains the employer of a large share of wage earners.81.82 In such situations, individual returns from education might be high (for those who land public sector jobs), but the impact of education on growth will be low because improved cognitive skills are not applied productively.83
Discriminatory norms distort the benefits of education. Prevailing norms on ethnic or gender discrimination can strongly mediate returns to education for these groups. In many societies, social norms severely restrict women’s access to economic opportunities.84 Nearly 90 percent of women in Northern India (from the region of Uttar Pradesh) and Nigeria (of Hausa ethnicity) felt they needed their husband’s permission to work.85 In the Ethiopian capital, this share was at 28 percent, suggesting that urbanization and changing family structures can influence norms.
Such norms do not always operate through open discrimination. Labor market segregation along occupational and social lines is often covert. Occupational gender segregation is a strong feature of many labor markets across the world.86 In OECD countries, women dominate the service sector (83 percent of women, compared to 34 percent of men), while men are overrepresented in industry.87 In addition to horizontal segregation, women also face a “glass ceiling” or “vertical segregation” because they do not advance in their careers as fast or as far as men. In the OECD, just over one-third of managers were women in 2013, with small variations across countries.88 Labor market segregation may also exist along socioeconomic lines.89 In the 1960s and 1970s, during a period of rapid economic growth in Chile, education was significant in determining occupational attainment for the middle class. For the upper-class and the very poor, education was less important and intergenerational status
73 World Bank 2011. 74 Pritchett 2001. 75 Zhang and others 2005. 76 Nee and Matthews 1996. 77 World Bank 2012. 78 Besley and Burgess 2002; Djankov and others 2002; Botero and others 2003; Klapper, Laeven and Rajan 2004; Almeida and Carneiro 2005; Pagés and Micco 2007; Petrin and Sivadasan 2006; Haltiwanger, Scarpetta and Schweiger 2008. 79 Freeman and Schettkat 2005; Ngai and Pissarides 2007. 80 Sakai, Faleh and Dawod 2001; Lust-Okar 2009; Cammett 2009; Kao 2012. 81 Bteddini 2016; Ghafar 2016. 82 Portal 2006. 83 Pritchett 2001. 84 McNabb and Psacharopoulos 1981; Chiswick 1988; Goldin and Polachek 1987; World Bank 2011. 85 Munro and others 2011; Kebede and others 2013. 86 Hegewisch and Hartmann 2014. 87 OECD 2010. 88 OECD Gender Data Portal, www.oecd.org/gender/data/. 89 First described by Blau and Duncan 1967.
- 1.12 -
inheritance was much more likely.90 In Jamaica, a country with a rigid class structure, the massive expansion of educational opportunities at the secondary level did little to increase the permeability of social structure.91
The very people who are constrained by social norms may become complicit in perpetuating them. A study of newly admitted students in an elite American MBA program shows that single women reported lower desired compensation when they believed their classmates would see their responses. No such differences were observed for men or for women who were not single, suggesting that single women were reluctant to signal personality traits, like ambition, that are undesirable in the marriage market.92 Social norms can similarly operate to inhibit male access to opportunities. Case studies in Australia and Jamaica suggest that underachievement among boys is linked to notions of education being a “feminized” realm which clashes with expectations of “masculine” behaviors.93
When getting a job depends on informal institutions, education is less useful.94 In Kolkata, India, 40 percent of employees reported that they helped a friend or relative get a job with their current employer.95 Nearly 60 percent of enterprises surveyed in 14 countries in Sub-Saharan Africa report that their most recent position was filled through contacts with “family/friends.”96 This is also true in places where labor markets are segmented by kinship and socio-economic class.97 Informal networks can also be particularly important for certain sub-populations: for example among Mexican migrants in the United States.98
Source: WDR 2018 team.
1.23 Finally, schooling is not the same as learning. Education is an imprecise word, so it must be clearly defined. Schooling is the time that a student spends in classrooms, while learning is the outcome—what the student takes away from schooling. This distinction is crucial: around the world, many students learn little (figure 1.4). To be sure, many students learn something, even in settings facing huge challenges. And students enjoy benefits from education regardless of whether they are learning. When schools serve as oases of security in violent areas, or when participation in schooling keeps adolescent girls from becoming pregnant, these are real societal benefits. When graduates can use their degrees to open doors to employment, that opportunity changes their lives—even when the degree represents less learning than it should.
1.24 Intuitively, many of education’s benefits depend on the skills that students develop in school. As workers, people need a range of skills—cognitive, socioemotional, technical—to be productive and innovative. As parents, they need literacy to read to their children or to interpret medication labels, and numeracy to budget for their futures. As citizens, people need literacy, numeracy, as well as higher-order reasoning abilities to evaluate politicians’ promises. As community members, they need the sense of agency that comes from developing mastery. None of these capabilities flow automatically from simply attending school; all depend on learning while in school.
90 Farrell and Schiefelbein 1985. 91 Strudwick and Foster 1991. 92 Bursztyn, Fujiwara and Pallais 2017. 93 Jha and Kelleher 2006. 94 Granovetter 1995. 95 Beaman and Magruder 2012. 96 Filmer and Fox 2014. 97 Hendy 2015; Assaad 1997; Barsoum 2004. 98 Munshi 2003.
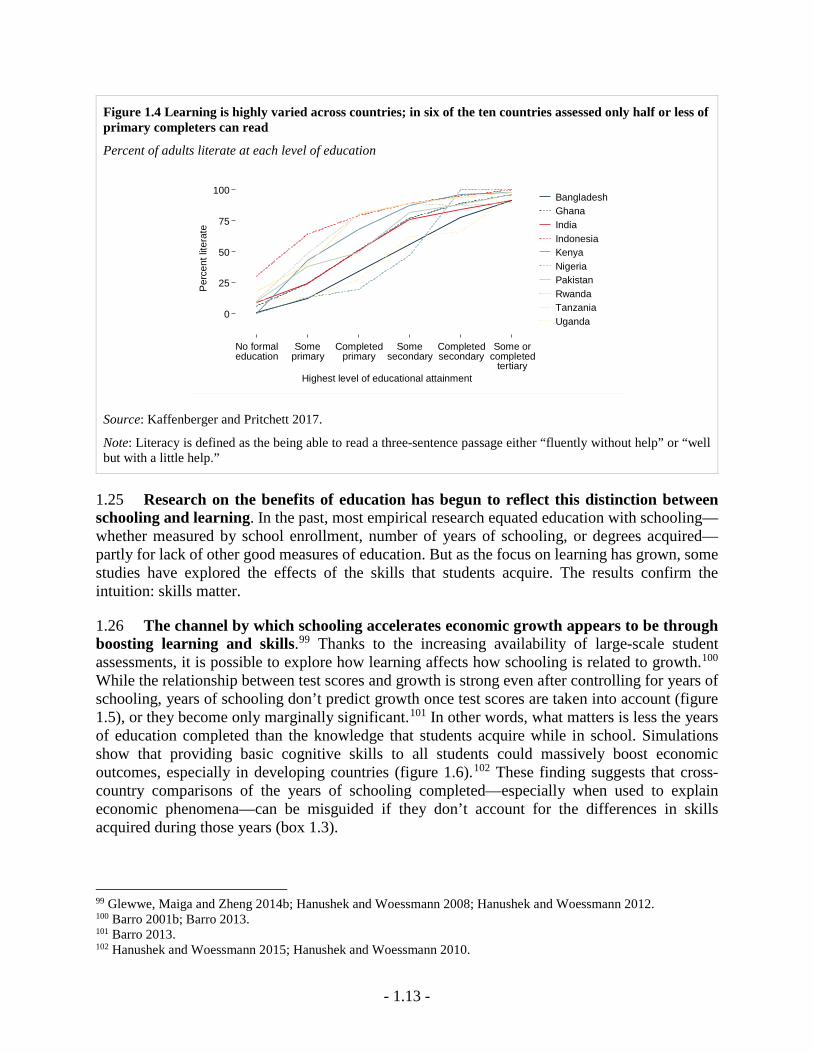
- 1.13 -
Figure 1.4 Learning is highly varied across countries; in six of the ten countries assessed only half or less of primary completers can read
Percent of adults literate at each level of education
Source: Kaffenberger and Pritchett 2017.
Note: Literacy is defined as the being able to read a three-sentence passage either “fluently without help” or “well but with a little help.”
1.25 Research on the benefits of education has begun to reflect this distinction between schooling and learning. In the past, most empirical research equated education with schooling—whether measured by school enrollment, number of years of schooling, or degrees acquired—partly for lack of other good measures of education. But as the focus on learning has grown, some studies have explored the effects of the skills that students acquire. The results confirm the intuition: skills matter.
1.26 The channel by which schooling accelerates economic growth appears to be through boosting learning and skills.99 Thanks to the increasing availability of large-scale student assessments, it is possible to explore how learning affects how schooling is related to growth.100 While the relationship between test scores and growth is strong even after controlling for years of schooling, years of schooling don’t predict growth once test scores are taken into account (figure 1.5), or they become only marginally significant.101 In other words, what matters is less the years of education completed than the knowledge that students acquire while in school. Simulations show that providing basic cognitive skills to all students could massively boost economic outcomes, especially in developing countries (figure 1.6).102 These finding suggests that cross-country comparisons of the years of schooling completed—especially when used to explain economic phenomena—can be misguided if they don’t account for the differences in skills acquired during those years (box 1.3).
99 Glewwe, Maiga and Zheng 2014b; Hanushek and Woessmann 2008; Hanushek and Woessmann 2012. 100 Barro 2001b; Barro 2013. 101 Barro 2013. 102 Hanushek and Woessmann 2015; Hanushek and Woessmann 2010.
No formaleducation
Someprimary
Completedprimary
Somesecondary
Completedsecondary
Some orcompleted
tertiary
0
25
50
75
100Pe
rcen
t lite
rate
Highest level of educational attainment
BangladeshGhanaIndiaIndonesiaKenyaNigeriaPakistanRwandaTanzaniaUganda
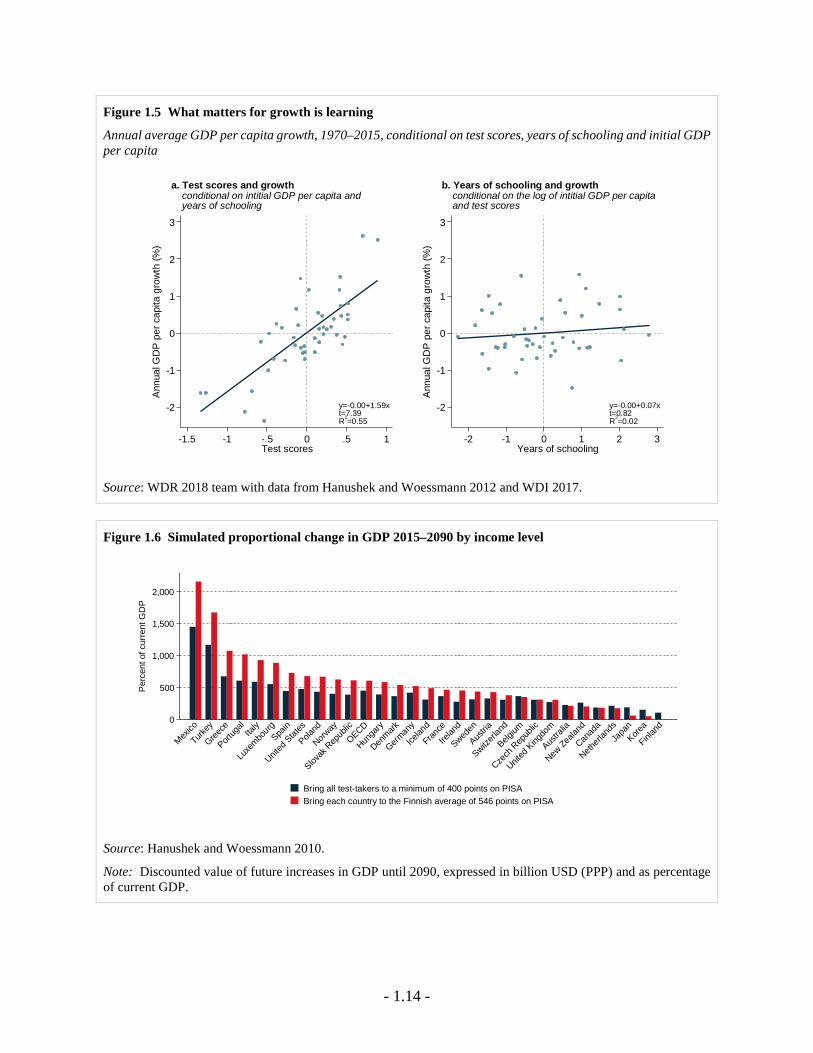
- 1.14 -
Figure 1.5 What matters for growth is learning
Annual average GDP per capita growth, 1970–2015, conditional on test scores, years of schooling and initial GDP per capita
Source: WDR 2018 team with data from Hanushek and Woessmann 2012 and WDI 2017.
Figure 1.6 Simulated proportional change in GDP 2015–2090 by income level
Source: Hanushek and Woessmann 2010.
Note: Discounted value of future increases in GDP until 2090, expressed in billion USD (PPP) and as percentage of current GDP.
-2
-1
0
1
2
3
Annu
al G
DP
per c
apita
gro
wth
(%)
-1.5 -1 -.5 0 .5 1Test scores
y=-0.00+1.59xt=7.39R2=0.55
conditional on intitial GDP per capita and years of schooling
a. Test scores and growth
-2
-1
0
1
2
3
Annu
al G
DP
per c
apita
gro
wth
(%)
-2 -1 0 1 2 3Years of schooling
y=-0.00+0.07xt=0.82R2=0.02
conditional on the log of intitial GDP per capita and test scores
b. Years of schooling and growth
0
500
1,000
1,500
2,000
Perc
ent o
f cur
rent
GD
P
Mexico
Turkey
Greece
Portug
alIta
ly
Luxe
mbourg
Spain
United
States
Poland
Norway
Slovak
Rep
ublic
OECD
Hunga
ry
Denmark
German
y
Icelan
d
France
Irelan
d
Sweden
Austria
Switzerl
and
Belgium
Czech
Rep
ublic
United
Kingdo
m
Austra
lia
New Ze
aland
Canad
a
Netherl
ands
Japa
nKore
a
Finlan
d
Bring all test-takers to a minimum of 400 points on PISABring each country to the Finnish average of 546 points on PISA
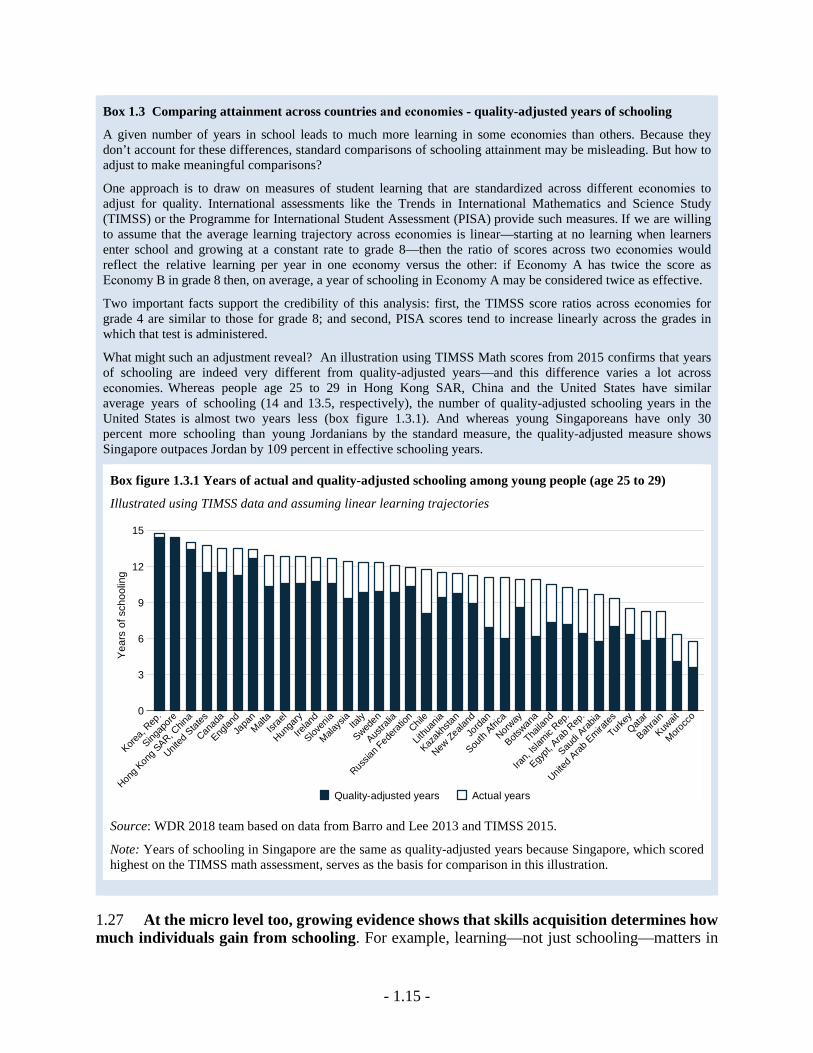
- 1.15 -
Box 1.3 Comparing attainment across countries and economies - quality-adjusted years of schooling
A given number of years in school leads to much more learning in some economies than others. Because they don’t account for these differences, standard comparisons of schooling attainment may be misleading. But how to adjust to make meaningful comparisons?
One approach is to draw on measures of student learning that are standardized across different economies to adjust for quality. International assessments like the Trends in International Mathematics and Science Study (TIMSS) or the Programme for International Student Assessment (PISA) provide such measures. If we are willing to assume that the average learning trajectory across economies is linear—starting at no learning when learners enter school and growing at a constant rate to grade 8—then the ratio of scores across two economies would reflect the relative learning per year in one economy versus the other: if Economy A has twice the score as Economy B in grade 8 then, on average, a year of schooling in Economy A may be considered twice as effective.
Two important facts support the credibility of this analysis: first, the TIMSS score ratios across economies for grade 4 are similar to those for grade 8; and second, PISA scores tend to increase linearly across the grades in which that test is administered.
What might such an adjustment reveal? An illustration using TIMSS Math scores from 2015 confirms that years of schooling are indeed very different from quality-adjusted years—and this difference varies a lot across economies. Whereas people age 25 to 29 in Hong Kong SAR, China and the United States have similar average years of schooling (14 and 13.5, respectively), the number of quality-adjusted schooling years in the United States is almost two years less (box figure 1.3.1). And whereas young Singaporeans have only 30 percent more schooling than young Jordanians by the standard measure, the quality-adjusted measure shows Singapore outpaces Jordan by 109 percent in effective schooling years.
Box figure 1.3.1 Years of actual and quality-adjusted schooling among young people (age 25 to 29)
Illustrated using TIMSS data and assuming linear learning trajectories
Source: WDR 2018 team based on data from Barro and Lee 2013 and TIMSS 2015.
Note: Years of schooling in Singapore are the same as quality-adjusted years because Singapore, which scored highest on the TIMSS math assessment, serves as the basis for comparison in this illustration.
1.27 At the micro level too, growing evidence shows that skills acquisition determines how much individuals gain from schooling. For example, learning—not just schooling—matters in
0
3
6
9
12
15
Year
s of
sch
oolin
g
Korea,
Rep.
Singap
ore
Hong K
ong S
AR, Chin
a
United
States
Canad
a
Englan
dJa
panMalt
aIsr
ael
Hunga
ry
Irelan
d
Sloven
ia
Malays
iaIta
ly
Sweden
Austra
lia
Russia
n Fed
eratio
nChil
e
Lithu
ania
Kazak
hstan
New Ze
aland
Jorda
n
South
Africa
Norway
Botswan
a
Thaila
nd
Iran,
Islam
ic Rep
.
Egypt,
Arab R
ep.
Saudi
Arabia
United
Arab Emira
tes
Turkey
Qatar
Bahrai
n
Kuwait
Morocc
o
Quality-adjusted years Actual years
- 1.16 -
how education affects earnings. Across 23 OECD countries, as well as in a number of other countries, simple measures of foundational skills such as numeracy and reading proficiency explain hourly earnings over and above the effect of years of schooling.103 These effects extend beyond the labor market. Across 10 low- and middle-income countries, schooling improved measures of financial behavior only when it was associated with increased reading ability.104 When people had acquired more schooling but not more literacy—which was common in these countries—financial behaviors did not change. Socioemotional skills matter as well: various measures have been shown to significantly predict earnings, over and above the effects of schooling and cognitive skills.105
1.28 Learning matters for health too. Numerous studies have documented the benefits of girls’ schooling on outcomes such as lower fertility or better child survival, but these do not typically distinguish between learning and schooling. But there are exceptions. In Morocco research showed that maternal education improved child health through its effects on mothers’ ability to acquire health knowledge.106 Globally, data from 48 developing countries show that learning is responsible for much of these gains. Each additional year of female primary schooling is associated with roughly six fewer deaths per 1,000 live births, but the effect is about two-thirds larger in the countries where schooling delivers the most learning (compared with the least).107
1.29 Even limited measures of skills explain a lot. The measures used in these studies are often narrow, capturing only simple numeracy or reading proficiency. Sometimes they are coarse: the 48-country study of the relationship of schooling and health, for example, uses as its measure of literacy whether a woman can read a single sentence such as “Parents love their children” or “Farming is hard work.” Yet even these highly imperfect skills measures have considerable predictive and explanatory power. If better measures of skills were available, skills would likely explain even more of the impacts of education—and the remaining role for the simple schooling measure (which typically retains predictive power in these analyses) would decrease further.
1.30 Learning promotes social mobility. The research on intergenerational social mobility in the United States cited above also investigated which educational mechanisms were responsible. One candidate is school quality based on inputs, such as school spending and class size, and these measures did have some predictive power. But learning outcomes turn out to be especially important: test scores of the community where a child lives (adjusted for the income of that community) are among the strongest predictors of social mobility later in life.108
1.31 This literature on the benefits of learning is still growing, with much more research needed. But both common sense and the emerging research literature make clear that if we care about the benefits of education, we should focus on whether students are learning, not just on how well schools are equipped or even how long students stay in school. Part 2 of this Report takes up this issue.
103 Hanushek and others 2015; Valerio and others 2016. 104 Kaffenberger and Pritchett 2017. 105 For OECD countries see Mueller and Plug 2006, Heineck and Anger 2010, and Heckman, Stixrud and Urzua 2006. For countries outside of the OECD see Díaz, Arias and Tudela 2012 and Valerio and others 2016. 106 Glewwe 1999. 107 Oye, Pritchett and Sandefur 2016. 108 Chetty and others 2014.
- 1.17 -
References
Abdullah, Abdul, Hristos Doucouliagos, and Elizabeth Manning. 2015. "Does Education Reduce Income Inequality? A Meta‐Regression Analysis." Journal of Economic Surveys: vol. 29, no 2, p. 301-16.
Acemoglu, Daron, Philippe Aghion, and Fabrizio Zilibotti. 2006. "Distance to Frontier, Selection, and Economic Growth." Journal of the European Economic association 4(1): 37-74.
Acemoglu, Daron, and Alexander Wolitzky. 2011. "The Economics of Labor Coercion." Econometrica 79(2): 555-600.
Aghion, Philippe. 2009. Growth and Education. World Bank.
Aghion, Philippe, Leah Boustan, Caroline Hoxby, and Jerome Vandenbussche. 2009a. "The Causal Impact of Education on Economic Growth: Evidence from Us." Unpublished paper.
Aghion, Philippe, and Peter Howitt. 2006. "Joseph Schumpeter Lecture Appropriate Growth Policy: A Unifying Framework." Journal of the European Economic Association 4(2‐3): 269-314.
Aghion, Phillippe, L Boustan, C Hoxby, and J Vandenbussche. 2009b. "The Causal Impact of Education on Economic Growth: Evidence from Us." Unpublished.
Algan, Yann, Pierre Cahuc, and Andrei Shleifer. 2013. "Teaching Practices and Social Capital." American Economic Journal: Applied Economics 5(3): 189-210.
Allen, Danielle. 2016. Education and Equality. University of Chicago Press.
Allendorf, Keera. 2007. "Do Women’s Land Rights Promote Empowerment and Child Health in Nepal?. ." World development: vol. 35, no 11, p. 1975-88.
Almeida, Rita, and Pedro Manuel Carneiro. 2005. "Enforcement of Regulation, Informal Labor and Firm Performance." IZA Discussion Paper (No. 1759).
Anderson, D Mark. 2014. "In School and out of Trouble? The Minimum Dropout Age and Juvenile Crime." Review of Economics and Statistics: vol. 96, no 2, p. 318-31.
Andrabi, Tahir, Jishnu Das, and Asim Ijaz Khwaja. 2012. "What Did You Do All Day? Maternal Education and Child Outcomes." Journal of Human Resources: vol. 47, no 4, p. 873-912.
Assaad, Ragui. 1997. "Kinship Ties, Social Networks, and Segmented Labor Markets: Evidence from the
Construction Sector in Egypt." Journal of Development Economics 52(1): 1-30.
Azevedo, Joao Pedro, Marta Favara, Sarah E Haddock, Luis F Lopez-Calva, Miriam Muller, and Elizaveta Perova. 2012. "Teenage Pregnancy and Opportunities in Latin America and the Caribbean : On Teenage Fertility Decisions, Poverty and Economic Achievement." Washington DC: World Bank.
Baird, Sarah, E Chirwa, C McIntosh, and B Ozler 2010. "The Short‐Term Impacts of a Schooling Conditional Cash Transfer Program on the Sexual Behavior of Young Women." Health Economics: vol. 19, no S1, p. 55-68.
Barro, Robert J. 2001a. "Human Capital and Growth." The American Economic Review 91(2): 12-17.
Barro, Robert J, and Jong Wha Lee. 2013. "A New Data Set of Educational Attainment in the World, 1950–2010." Journal of development economics 104: 184-98.
Barro, Robert J. 2001b. "Human Capital and Growth." The American Economic Review: vol. 91, no 2, p. 12-17.
———. 2013. "Education and Economic Growth." Annals of Economics and Finance: vol. 14, no 2, p. 301-28.
Barsoum, Ghada F. 2004. "The Employment Crisis of Female Graduates in Egypt: An Ethnographic Account."
Beaman, Lori, and Jeremy Magruder. 2012. "Who Gets the Job Referral? Evidence from a Social Networks Experiment." The American Economic Review 102(7): 3574-93.
Becker, Gary. 1964. Human Capital. New York: Columbia University Press.
Becker, Sashca O, Francesco Cinnirella, and Ludger Woessmann. 2013. "Does Women's Education Affect Fertility? Evidence from Pre-Demographic Transition Prussia." European Review of Economic History: vol. 17, no 1, p. 24-44.
Besley, Timothy J, and Robin Burgess. 2002. "Can Labour Regulation Hinder Economic Performance? Evidence from India." CEPR Discussion Paper (No. 3260).
Blau, Peter M, and Otis Dudley Duncan. 1967. "The American Occupational Structure."
Blimpo, Moussa P, David K Evans, and Nathalie Lahire. 2015. "Parental Human Capital and Effective School Management." World Bank Policy Research Working Paper 7238.
Borgonovi, Francesca, and Tracey Burns. 2015. "The Educational Roots of Trust." OECD Education Working Papers: No. 119.
- 1.18 -
Bosworth, Barry P., and Susan M. Collins. 2003. "The Empirics of Growth: An Update." Brookings Papers on Economic Activity 2: 113-79.
Botero, Juan Carlos, Simeon Djankov, Rafael La Porta, Florencio López de Silanes, and Andrei Shleifer. 2003. "The Regulation of Labor." NBER Working Paper (w9756).
Botero, Juan, Alejandro Ponce, and Andrei Shleifer. 2013. "Education, Complaints, and Accountability." The Journal of Law and Economics 56(4): 959-96.
Bteddini, Lida. 2016. "Public Employment and Governance in Middle East and North Africa." Washington, DC: The World Bank. http://documents.worldbank.org/curated/en/339381472236811833/Public-employment-and-governance-in-Middle-East-and-North-Africa.
Bursztyn, Leonardo, Thomas Fujiwara, and Amanda Pallais. 2017. "'Acting Wife': Marriage Market Incentives and Labor Market Investments." National Bureau of Economic Research.
Cammett, Melani. 2009. "Democracy, Lebanese-Style." Middle East Research and Information Project.
Campante, Filipe R, and Davin Chor. 2012. "Schooling, Political Participation, and the Economy." Review of Economics and Statistics: vol. 94, no 4, p. 841-59.
Campbell, David E. 2006. "What Is Education’s Impact on Civic and Social Engagement." In Measuring the effects of education on health and civic engagement: Proceedings of the Copenhagen symposium p. 25-126.
Carneiro, Pedro, Costas Meghir, and Matthias Parey. 2013. "Maternal Education, Home Environments, and the Development of Children and Adolescents." Journal of the European Economic Association 11(s1): 123-60.
Chetty, Raj, Nathaniel Hendren, and Lawrence F Katz. 2016. "The Effects of Exposure to Better Neighborhoods on Children: New Evidence from the Moving to Opportunity Experiment." The American Economic Review 106(4): 855-902.
Chetty, Raj, Nathaniel Hendren, Patrick Kline, and Emmanuel Saez. 2014. "Where Is the Land of Opportunity? The Geography of Intergenerational Mobility in the United States." Quarterly Journal of Economics 129 4: 1553-623.
Chiswick, Barry R. 1988. "Differences in Education and Earnings across Racial and Ethnic Groups: Tastes, Discrimination, and Investments in Child Quality." The Quarterly Journal of Economics: 571-97.
Chong, Alberto, and Gradstein, Mark. 2015. "On Education and Democratic Preferences." Economics & Politics 27(3): 362-88.
Chong, Alberto, Rafael La Porta, Florencia Lopez-de-Silanes, and Andrei Shleifer. 2014. "Letter Grading Government Efficiency." Journal of the European Economic Association 12 2: 277-99.
Chzhen, Yekaterina. 2013. "Tolerance of Diversity, Political Engagement, and Understanding of Democracy." Background paper prepared for the Education for All Global Monitoring Report.
Cohen, Daniel, and Marcelo Soto. 2007. "Growth and Human Capital: Good Data, Good Results." Journal of Economic Growth 12 1: 51-76.
Collier, Paul, Anke Hoeffler, and Dominic Rohner. 2009. "Beyond Greed and Grievance: Feasibility and Civil War." Oxford economic papers 61(1): 1-27.
Commission on Growth and Development. 2008. "The Growth Report: Strategies for Sustained Growth and Inclusive Development." Washington, DC: World Bank, on behalf of the Commission on Growth and Development.
Cullen, Julie Berry, Brian A Jacob, and Steven Levitt. 2006. "The Effect of School Choice on Participants: Evidence from Randomized Lotteries." Econometrica: vol. 74, no 5, p. 1191-230.
Cutler, David M, and Adriana Lleras-Muney. 2007. "Education and Health. Policy Brief# 9." National Poverty Center, University of Michigan.
Cutler, David M, Adriana Lleras-Muney, and Tom Vogl. 2008. "Socioeconomic Status and Health: Dimensions and Mechanisms." National Bureau of Economic Research: w14333.
Dahl, Robert A. 1998. "On Democracy." New Haven and London.
Davies, Lynn. 2003. Education and Conflict: Complexity and Chaos. Routledge.
De Hoyos Navarro, Rafael E, Carlos Gutierrez-Fierros, M Vargas, and J Vicente. 2016. "Idle Youth in Mexico: Trapped between the War on Drugs and Economic Crisis."
De Hoyos, Rafael, and Ricardo Estrada. 2017. Fortcoming.
de la Brière, Bénédicte, Deon Filmer, Dena Ringold, Dominic Rohner, Karelle Samuda, and Anastasiya Denisova. 2017. "From Mines and Wells to Well-Built Minds: Turning Sub-Saharan Africa’s Natural Resource Wealth into Human Capital." Directions in Development. Washington, DC: World Bank.
De Walque, Damien. 2007. "Does Education Affect Smoking Behaviors?: Evidence Using the Vietnam Draft
- 1.19 -
as an Instrument for College Education." Journal of health economics: vol. 26, no 5, p. 877-95.
Dee, Thomas. 2004. "Are There Civic Returns to Education?" Journal of Public Economics: 1697-720.
Deming, David J. 2009. "Early Childhood Intervention and Life-Cycle Skill Development: Evidence from Head Start." American Economic Journal: Applied Economics: vol. 1, no 3, p. 111-34.
Dewey, John. 1916. Democracy and Education: An Introduction to the Philosophy of Education. Macmillan.
Díaz, Juan José, Omar Arias, and David Vera Tudela. 2012. "Does Perseverance Pay as Much as Being Smart? The Returns to Cognitive and Non-Cognitive Skills in Urban Peru." Unpublished paper, World Bank, Washington, DC.
Djankov, Simeon, Rafael La Porta, Florencio Lopez-de-Silanes, and Andrei Shleifer. 2002. "The Regulation of Entry." Quarterly Journal of Economics: 1-37.
Duflo, Esther, Pascaline Dupas, and Michael Kremer. 2014. "Education, Hiv, and Early Fertility: Experimental Evidence from Kenya."
Dumas, Christelle, and Sylvie Lambert. 2011. "Educational Achievement and Socio-Economic Background: Causality and Mechanisms in Senegal." Journal of African Economies: vol. 20, no 1, p. 1-26.
Education Financing Commission. 2016. "The Learning Generation: Investing in Education for a Changing World." A report by the International Commission on Financing Global Education Opportunity,.
Farrell, Joseph P, and Ernesto Schiefelbein. 1985. "Education and Status Attainment in Chile: A Comparative Challenge to the Wisconsin Model of Status Attainment." Comparative Education Review 29(4): 490-506.
Filmer, Deon, and Louise Fox. 2014. Youth Employment in Sub-Saharan Africa. Washington, DC: World Bank Publications.
Foster, Andrew D, and Mark R Rosenzweig. 1996. "Technical Change and Human-Capital Returns and Investments: Evidence from the Green Revolution." The American economic review: p. 931-53.
Freeman, Richard B, and Ronald Schettkat. 2005. "Marketization of Household Production and the Eu–Us Gap in Work." Economic policy 20(41): 6-50.
Friedman, Willa, Michael Kremer, Edward Miguel, and Rebecca Thornton. 2011. "Education as Liberation?": National Bureau of Economic Research.
Ghafar, Adel Abdel. 2016. "Educated but Unemployed: The Challenge Facing Egypt’s Youth." Brookings Doha Center.
Glewwe, Paul. 1991. Schooling, Skills, and the Returns to Government Investment in Education: An Exploration Using Data from Ghana. Living Standards Measurement Study, Working Paper No. 76. ERIC.
———. 1999. "Why Does Mother's Schooling Raise Child Health in Developing Countries? Evidence from Morocco." Journal of human resources: 124-59.
Glewwe, Paul, Eugenie Maiga, and Haochi Zheng. 2014a. "The Contribution of Education to Economic Growth: A Review of the Evidence, with Special Attention and an Application to Sub-Saharan Africa." World Development 59: 379-93.
———. 2014b. "The Contribution of Education to Economic Growth: A Review of the Evidence, with Special Attention and an Application to Sub-Saharan Africa." World Development: vol. 59, p. 379-93.
Goldin, Claudia, and Solomon Polachek. 1987. "Residual Differences by Sex: Perspectives on the Gender Gap in Earnings." The American Economic Review 77(2): 143-51.
Granovetter, Mark. 1995. Getting a Job: A Study of Contacts and Careers. University of Chicago Press.
Griliches, Zvi. 1969. "Capital-Skill Complementarity." The review of Economics and Statistics: p. 465-68.
Güneş, Pinar Mine. 2016. "The Impact of Female Education on Teenage Fertility: Evidence from Turkey." The B.E. Journal of Economic Analysis & Policy: 259-88.
Haltiwanger, John, Stefano Scarpetta, and Helena Schweiger. 2008. "Assessing Job Flows across Countries: The Role of Industry, Firm Size and Regulations." National Bureau of Economic Research.
Hanson, Gordon. 2004. "Globalization, Labor Income, and Poverty in Mexico." Harrison.
———. 2007. "Globalization, Labor Income, and Poverty in Mexico ": Globalization and poverty.
Hanushek, Eric A, Guido Schwerdt, Simon Wiederhold, and Ludger Woessmann. 2015. "Returns to Skills around the World: Evidence from Piaac." European Economic Review 73: 103-30.
Hanushek, Eric A, Guido Schwerdt, Ludger Woessmann, and Lei Zhang. 2017. "General Education, Vocational Education, and Labor-Market Outcomes over the Lifecycle." Journal of Human Resources 52(1): 48-87.
- 1.20 -
Hanushek, Eric A, and Ludger Woessmann. 2008. "The Role of Cognitive Skills in Economic Development." Journal of economic literature: vol. 46, no 3, p. 607-68.
———. 2010. "The High Cost of Low Educational Performance: The Long-Run Economic Impact of Improving Pisa Outcomes." OECD Publishing.
———. 2012. "Do Better Schools Lead to More Growth? Cognitive Skills, Economic Outcomes, and Causation." Journal of Economic Growth: vol. 17, no 4, p. 267-321.
———. 2015. The Knowledge Capital of Nations: Education and the Economics of Growth. MIT Press.
Heckman, James J, John Eric Humphries, Greg Veramendi, and Sergio S Urzua. 2014. "Education, Health and Wages." National Bureau of Economic Research.
Heckman, James J, Jora Stixrud, and Sergio Urzua. 2006. "The Effects of Cognitive and Noncognitive Abilities on Labor Market Outcomes and Social Behavior." Journal of Labor Economics 24(3): 411-82.
Hegewisch, Ariane, and Heidi Hartmann. 2014. "Occupational Segregation and the Gender Wage Gap: A Job Half Done."
Heineck, Guido, and Silke Anger. 2010. "The Returns to Cognitive Abilities and Personality Traits in Germany." Labour Economics 17(3): 535-46.
Hendy, Rana. 2015. "Women’s Participation in the Egyptian Labor Market." In The Egyptian Labor Market in an Era of Revolution, edited by R. Assaad & C. Krafft, 147. Oxford: Oxford University Press.
Hjalmarsson, Randi, Helena Holmlund, and Matthew J Lindquist. 2015. "The Effect of Education on Criminal Convictions and Incarceration: Causal Evidence from Micro‐Data." The Economic Journal: 1290-326.
Jha, Jyotsna, and Fatimah Kelleher. 2006. Boys' Underachievement in Education: An Exploration in Selected Commonwealth Countries. Commonwealth of Learning, Vancouver.
Jones, Benjamin F. 2014. "The Human Capital Stock: A Generalized Approach." The American Economic Review 104(11): 3752-77.
Kaffenberger, Michelle, and Lant Pritchett. 2017. "The Impact of Education Versus the Impact of Schooling: Schooling, Reading Ability and Financial Behavior in 10 Countries." Background paper for the World Development Report 2018: World Bank, Washington, DC.
Kao, Kristen. 2012. "Jordan’s Ongoing Election Law Battle." SADA Analysis on Arab Reform.
Kebede, Bereket, Marcela Tarazona, Alistair Munro, and Arjan Verschoor. 2013. "Intra-Household Efficiency: An Experimental Study from Ethiopia." Journal of African Economies: ejt019.
Kettunen, Juha. 1997. "Education and Unemployment Duration." Economics of Education Review: vol. 16, no 2, p. 163-70.
King, Elizabeth M, Claudio E Montenegro, and Peter F Orazem. 2012. "Economic Freedom, Human Rights, and the Returns to Human Capital: An Evaluation of the Schultz Hypothesis." Economic development and cultural change 61(1): 39-72.
Klapper, Leora, Luc Laeven, and Raghuram Rajan. 2004. "Business Environment and Firm Entry: Evidence from International Data." National Bureau of Economic Research.
Krueger, Alan B., and Mikael Lindahl. 2001. "Education for Growth: Why and for Whom?" Journal of Economic Literature 39(4): 1101-36.
Lam, David, Guilherme Sedlacek, and Suzanne Duryea. 2016. "Increase in Women´ S Education and Fertility Decline in Brazil." Anais: 89-118.
Lanjouw, Peter, and Martin Ravallion. 1999. "Benefit Incidence, Public Spending Reforms, and the Timing of Program Capture." The World Bank Economic Review: 257-73.
Larreguy, Horacio A., and John Marshall. Forthcoming. "The Effect of Education on Civic and Political Engagement in Non-Consolidated Democracies: Evidence from Nigeria." Review of International Organizations.
Lavy, Victor, and Alexander Zablotsky. 2011. "Mother's Schooling and Fertility under Low Female Labor Force Participation: Evidence from a Natural Experiment." National Bureau of Economic Research: w16856.
Layard, Richard, and George Psacharopoulos. 1974. "The Screening Hypothesis and the Returns to Education." Journal of political economy: vol. 82, no 5, p. 985-98.
Lipset, Seimour Martin. 1959. "Some Social Requisites of Democracy: Economic Development and Political Legitimacy." American political science review 53(01): 69-105.
———. 1960. Political Man: The Social Basis of Modern Politics.
Lochner, Lance. 2004. "Education, Work, and Crime: A Human Capital Approach." International Economic Review 45(3): 811-43.
- 1.21 -
Lochner, Lance, and Enrico Moretti. 2004. "The Effect of Education on Crime: Evidence from Prison Inmates, Arrests, and Self-Reports." The American Economic Review 94(1): 155-89.
Lust-Okar, Ellen. 2009. "Legislative Elections in Hegemonic Authoritarian Regimes: Competitive Clientelism and Resistance to Democratization." Democratization by elections: A new mode of transition: 226-45.
Machin, Stephen, Olivier Marie, and Sunčica Vujić. 2011. "The Crime Reducing Effect of Education." The Economic Journal 121(552): 463-84.
Mackenbach, Johan P. 2006. Health Inequalities: Europe in Profile. Produced by COI for the Department of Health.
Madsen, Jakob B. 2014. "Human Capital and the World Technology Frontier." Review of Economics and Statistics 96(4): 676-92.
Mankiw, N. Gregory, David Romer, and David N. Weil. 1992. "A Contribution to the Empirics of Economic Growth." Quarterly Journal of Economics 107 2: 407-37.
McNabb, Robert, and George Psacharopoulos. 1981. "Racial Earnings Differentials in the Uk." Oxford Economic Papers 33(3): 413-25.
Milligan, Kevin, Enrico Moretti, and Philip Oreopolous. 2004. "Does Education Improve Citizenship? Evidence from the United States and the United Kingdom." Journal of public Economics: vol. 88, no 9, p. 1667-95.
Mincer, Jacob. 1991. "Education and Unemployment." National Bureau of Economic Research: w3838.
Moll, Peter G. 1998. "Primary Schooling, Cognitive Skills and Wages in South Africa." Economica 65 258: 263-84.
Montenegro, Claudio E, and Harry Patrinos. 2017. "Comparable Estimates of Returns to Schooling around the World."
Montez, Jennifer Karas, Robert A Hummer, and Mark D Hayward. 2012. "Educational Attainmentand Adult Mortality in the United States: A Systematic Analysis of Functional Form." Demography: vol. 49, no 1, p. 315-36.
Mueller, Gerrit, and Erik Plug. 2006. "Estimating the Effect of Personality on Male and Female Earnings." ILR Review 60(1): 3-22.
Munro, Alistair, Bereket Kebede, Marcela Tarazona-Gomez, and Arjan Verschoor. 2011. "The Lion’s Share: An Experimental Analysis of Polygamy in Northern Nigeria." Available at SSRN 1821283.
Munshi, Kaivan. 2003. "Networks in the Modern Economy: Mexican Migrants in the Us Labor Market." The Quarterly Journal of Economics: 549-99.
Nee, Victor, and Rebecca Matthews. 1996. "Market Transition and Societal Transformation in Reforming State Socialism." Annual Review of sociology: 401-35.
Nelson, Richard R, and Edmund S Phelps 1966. "Investment in Humans, Technological Diffusion, and Economic Growth." The American economic review 56(1/2): 69-75.
Ngai, L Rachel, and Christopher A Pissarides. 2007. "Structural Change in a Multisector Model of Growth." The American Economic Review 97(1): 429-43.
OECD. 2010. "A Family Affair: Intergenerational Social Mobility across Oecd Countries." In Economic Policy Reforms: Going for Growth, Paris: OECD Publishing.
Oreopoulos, Philip. 2007. "Do Dropouts Drop out Too Soon? Wealth, Health and Happiness from Compulsory Schooling." Journal of public Economics 91(11): 2213-29.
Osili, Una Okonkwo, and Bridget Terry Long. 2008. "Does Female Schooling Reduce Fertility? Evidence from Nigeria." Journal of development Economics 87(1): 57-75.
Oye, Mari, Lant Pritchett, and Justin Sandefur. 2016. "Girls’ Schooling Is Good, Girls’ Schooling with Learning Is Better."
Pagés, Carmen, and Alejandro Micco. 2007. "The Economic Effects of Employment Protection: Evidence from International Industry-Level Data." Inter-American Development Bank.
Petrin, Amil, and Jagadeesh Sivadasan. 2006. "Job Security Does Affect Economic Efficiency: Theory, a New Statistic, and Evidence from Chile." National Bureau of Economic Research.
Piketty, Thomas. 2014. Capital in the Twenty-First Century. Cambridge: The Belknap Press of Harvard University Press.
Pinker, Steven. 2011. The Better Angels of Our Nature: The Decline of Violence in History and Its Causes. Viking.
Portal, Egypt Data. 2006. "Egypt Census." 12/9/2016. http://egypt.opendataforafrica.org/EGSNS2006/egypt-census-2006.
Pritchett, Lant. 2001. "Where Has All the Education Gone?" The World Bank Economic Review 15(3): 367-91.
Ridell, Craig W, and Xueda Song. 2011. "The Impact of Education on Unemployment Incidence and Re-
- 1.22 -
Employment Success: Evidence from the Us Labour Market." Labour Economics: vol. 18, no 4, p. 453-63.
Romer, Paul M. 1990. "Endogenous Technological Change." Journal of political Economy 98(5, Part 2): S71-S102.
Sakai, K, Abdul-Jabar Faleh, and Hosham Dawod. 2001. "Tribalism and the State: Remarks on the Army, Cabinets, and the National Assembly, 1980–1990." In Tribes and Power: Nationalism and Ethnicity in the Middle East: 136-64.
Schultz , Theodore W. 1975. "The Value of the Ability to Deal with Disequilibria." Journal of economic literature: vol. 13, no 3, p. 827-46.
Sen, Amartya K. 1985. Commodities and Capabilities. Oxford: Elsevier Science Publishers.
———. 1999. Development as Freedom. Oxford: Oxford university Press.
———. 2004. "Capabilities, Lists and Public Reason: Continuing the Conversation." Feminist Economics: 77-80.
Solon, Gary. 1999. "Intergenerational Mobility in the Labor Market." In Handbook of Labor Economics, vol. 3, p. 1761-800.
Solow, Robert M. 1956. "A Contribution to the Theory of Economic Growth." The quarterly journal of economics: vol. 70, no 1, p. 65-94.
Sondheimer, Rachel M, and Donald P Green. 2010a. "Using Experiments to Estimate the Effects of Education on Voter Turnout." American Journal of Political Science: vol. 54, no 1, p. 174-89.
Sondheimer, Rachel Milstein, and Donald P Green. 2010b. "Using Experiments to Estimate the Effects of Education on Voter Turnout." American Journal of Political Science 54(1): 174-89.
Strudwick, Jeremy, and Philip Foster. 1991. "Origins and Destinations in Jamaica." International Journal of Educational Development 11(2): 149-59.
Thomas, Duncan, John Strauss, and Maria-Helena Henriques. 1990. "Child Survival, Height for Age and Household Characteristics in Brazil." Journal of Development Economics: vol. 33, no 2, p. 197-234.
UNESCO. 2007. "Universal Declaration of Human Rights."
———. 2016. "Global Education Monitoring Report: Education for People and Planet." Paris: UNESCO. http://unesdoc.unesco.org/images/0024/002457/245752e.pdf.
Valerio, Alexandria, Maria Laura Sanchez Puerta, Namrata Raman Tognatta, and Sebastian Monroy Taborda. 2016. "Are There Skills Payoffs in Low- and Middle-Income Countries? Empirical Evidence Using Step Data." The World Bank, Policy Research Working Paper Series: 7879.
Vogl, Tom S. 2012. "Education and Health in Developing Economies."
Wantchekon, Leonard, Marko Klasnja, and Natalija Novta. 2015. "Education and Human Capital Externalities: Evidence from Colonial Benin." Quarterly Journal of Economics 130 2: 703-57.
Welch, Finis. 1970. "Education in Production." Journal of political economy: vol. 78, no 1, p. 35-59.
World Bank. 1993. The East Asian Miracle: Economic Growth and Public Policy. World Bank Policy Research Report series. Oxford and New York: Oxford University Press.
———. 2011. "World Development Report 2012: Gender Equality and Development." Washington, DC: World Bank.
———. 2012. "World Development Report 2013: Jobs." Washington, DC: World Bank.
World Values Survey Association. 2015. "World Values Survey Wave 6 2010-2014 Official Aggregate V.20150418."
Younger, Stephen D. 2003. "Benefits on the Margin: Observations on Marginal Benefit Incidence." The World Bank Economic Review 17(1): 89-106.
Zhang, Junsen, Yaohui Zhao, Albert Park, and Xiaoqing Song. 2005. "Economic Returns to Schooling in Urban China, 1988 to 2001." Journal of Comparative Economics 33(4): 730-52.
Part II
The Learning Crisis

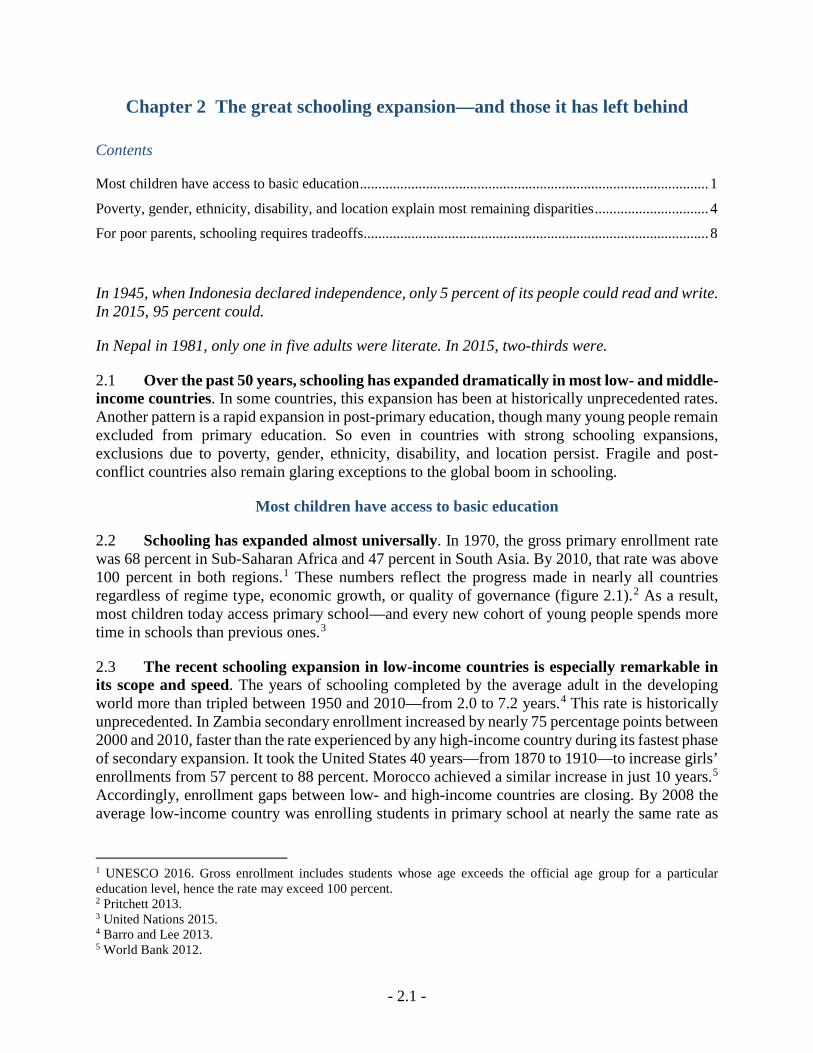
- 2.1 -
Chapter 2 The great schooling expansion—and those it has left behind
Contents
Most children have access to basic education ............................................................................................... 1
Poverty, gender, ethnicity, disability, and location explain most remaining disparities ............................... 4
For poor parents, schooling requires tradeoffs .............................................................................................. 8
In 1945, when Indonesia declared independence, only 5 percent of its people could read and write. In 2015, 95 percent could.
In Nepal in 1981, only one in five adults were literate. In 2015, two-thirds were.
2.1 Over the past 50 years, schooling has expanded dramatically in most low- and middle-income countries. In some countries, this expansion has been at historically unprecedented rates. Another pattern is a rapid expansion in post-primary education, though many young people remain excluded from primary education. So even in countries with strong schooling expansions, exclusions due to poverty, gender, ethnicity, disability, and location persist. Fragile and post-conflict countries also remain glaring exceptions to the global boom in schooling.
Most children have access to basic education
2.2 Schooling has expanded almost universally. In 1970, the gross primary enrollment rate was 68 percent in Sub-Saharan Africa and 47 percent in South Asia. By 2010, that rate was above 100 percent in both regions.1 These numbers reflect the progress made in nearly all countries regardless of regime type, economic growth, or quality of governance (figure 2.1).2 As a result, most children today access primary school—and every new cohort of young people spends more time in schools than previous ones.3
2.3 The recent schooling expansion in low-income countries is especially remarkable in its scope and speed. The years of schooling completed by the average adult in the developing world more than tripled between 1950 and 2010—from 2.0 to 7.2 years.4 This rate is historically unprecedented. In Zambia secondary enrollment increased by nearly 75 percentage points between 2000 and 2010, faster than the rate experienced by any high-income country during its fastest phase of secondary expansion. It took the United States 40 years—from 1870 to 1910—to increase girls’ enrollments from 57 percent to 88 percent. Morocco achieved a similar increase in just 10 years.5 Accordingly, enrollment gaps between low- and high-income countries are closing. By 2008 the average low-income country was enrolling students in primary school at nearly the same rate as
1 UNESCO 2016. Gross enrollment includes students whose age exceeds the official age group for a particular education level, hence the rate may exceed 100 percent. 2 Pritchett 2013. 3 United Nations 2015. 4 Barro and Lee 2013. 5 World Bank 2012.
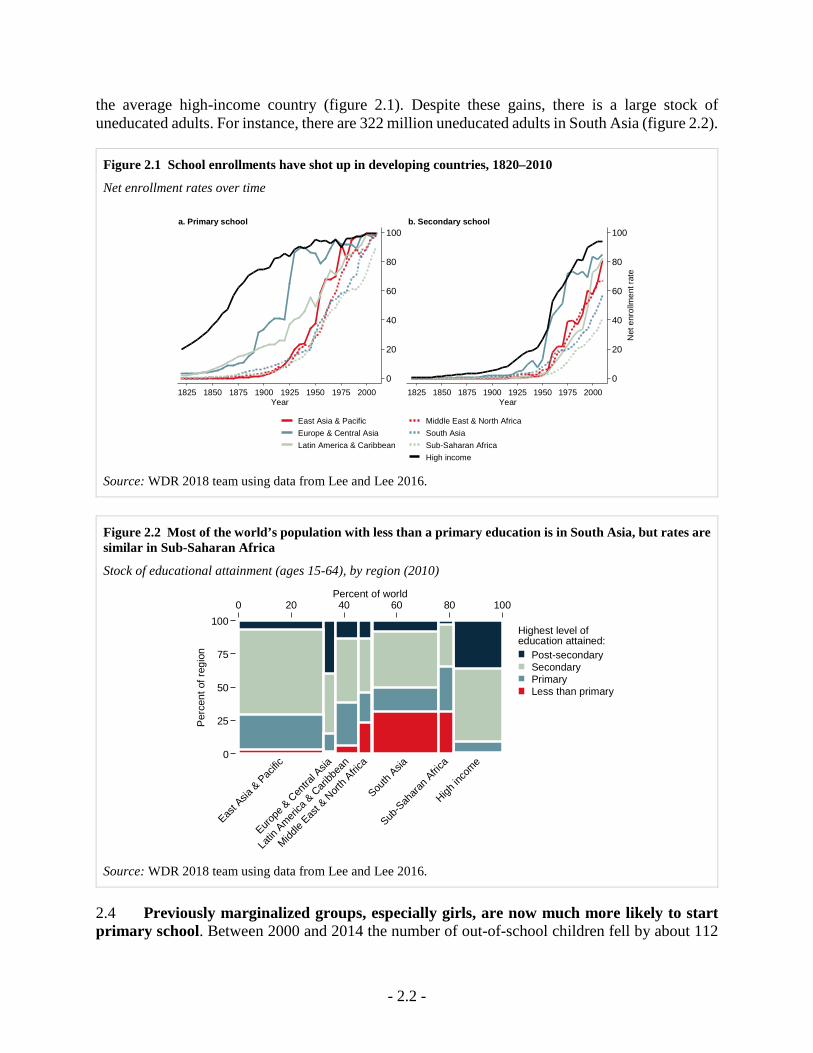
- 2.2 -
the average high-income country (figure 2.1). Despite these gains, there is a large stock of uneducated adults. For instance, there are 322 million uneducated adults in South Asia (figure 2.2).
Figure 2.1 School enrollments have shot up in developing countries, 1820–2010
Net enrollment rates over time
Source: WDR 2018 team using data from Lee and Lee 2016.
Figure 2.2 Most of the world’s population with less than a primary education is in South Asia, but rates are similar in Sub-Saharan Africa
Stock of educational attainment (ages 15-64), by region (2010)
Source: WDR 2018 team using data from Lee and Lee 2016.
2.4 Previously marginalized groups, especially girls, are now much more likely to start primary school. Between 2000 and 2014 the number of out-of-school children fell by about 112
0
20
40
60
80
100
1825 1850 1875 1900 1925 1950 1975 2000Year
a. Primary school
0
20
40
60
80
100
Net
enr
ollm
ent r
ate
1825 1850 1875 1900 1925 1950 1975 2000Year
b. Secondary school
East Asia & Pacific Europe & Central Asia Latin America & Caribbean
Middle East & North Africa South Asia Sub-Saharan Africa High income
0
25
50
75
100
Perc
ent o
f reg
ion
0 20 40 60 80 100Percent of world
East A
sia & Pac
ific
Europe
& Cen
tral A
sia
Latin
America
& Cari
bbea
n
Middle
East &
Nort
h Afric
a
South
Asia
Sub-S
ahara
n Afric
a
High in
come
Post-secondarySecondaryPrimaryLess than primary
Highest level ofeducation attained:
- 2.3 -
million.6 At the same time the share of girls enrolled in basic education reached a historic high.7 Between 1991 and 2008 the share of girls to boys in primary education in the developing world jumped from 84 to 96 percent.8 Indeed, girls outnumber boys in secondary schools in 45 developing countries.9 Yet gender parity has yet to be achieved with 62 million girls between 6 and 15 years still out of school—with the highest concentrations in South Asia and Sub-Saharan Africa.10 Though many girls start primary school, their likelihood of completing it remains low in some countries. By 2014, the primary enrollment rate of girls in low-income countries was at 78 percent, but their completion rate was only 63 percent.
Figure 2.3 National income is correlated with the gap between primary and lower-secondary completion rates
Distribution of completion rates across countries within country category, by level of schooling (latest available data)
Source: WDR 2018 team using data from UIS 2016.
Note: Geographic regions exclude high-income countries. The data presented are the latest available, by country, for the period 2010-2016. Completion rates include students whose age exceeds the official age group for a particular education level, hence the rate may exceed 100 percent.
6 UNICEF 2015. 7 UNESCO 2015. 8 World Bank 2011. 9 World Bank 2012. 10 World Bank 2016b.
25th 50th75thPercentile
East Asia & Pacific
Europe & Central Asia
High income (OECD)
High income (non-OECD)
Latin America & Caribbean
Low income
Lower middle income
Middle East & North Africa
South Asia
Sub-Saharan Africa
Upper middle income
World
East Asia & Pacific
Europe & Central Asia
High income (OECD)
High income (non-OECD)
Latin America & Caribbean
Low income
Lower middle income
Middle East & North Africa
South Asia
Sub-Saharan Africa
Upper middle income
World
0 20 40 60 80 100Distribution of completion rates
Primary schoolLower-secondary school
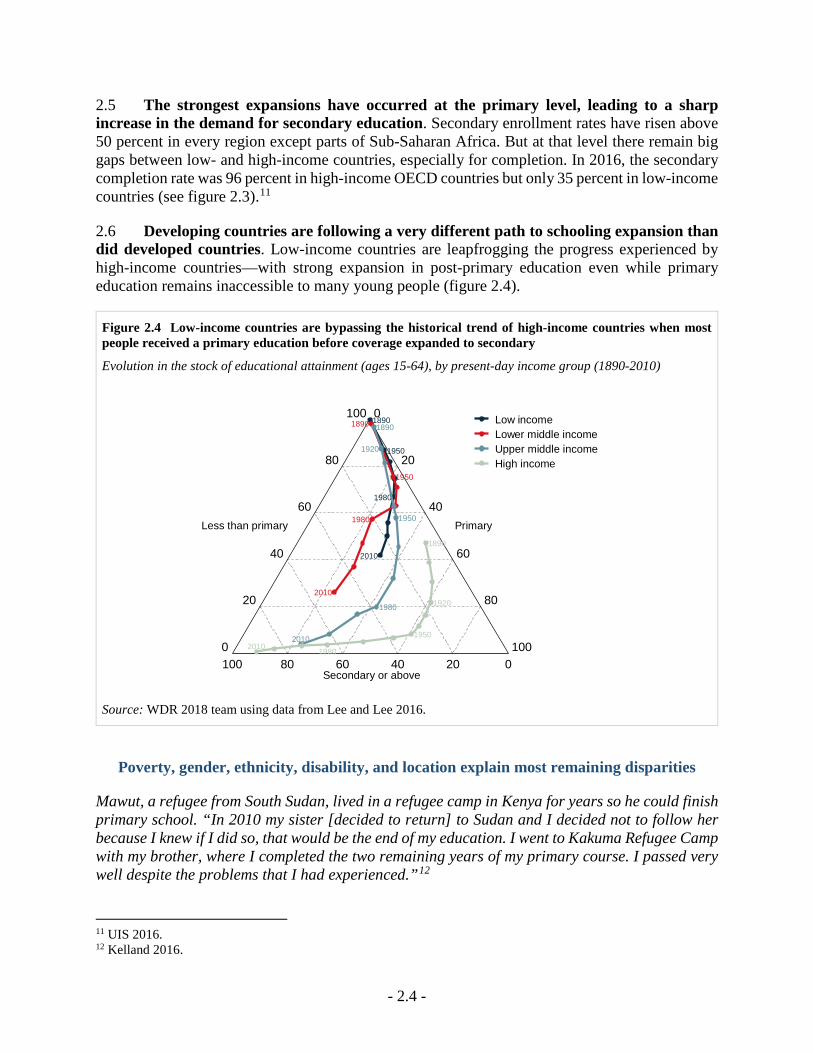
- 2.4 -
2.5 The strongest expansions have occurred at the primary level, leading to a sharp increase in the demand for secondary education. Secondary enrollment rates have risen above 50 percent in every region except parts of Sub-Saharan Africa. But at that level there remain big gaps between low- and high-income countries, especially for completion. In 2016, the secondary completion rate was 96 percent in high-income OECD countries but only 35 percent in low-income countries (see figure 2.3).11
2.6 Developing countries are following a very different path to schooling expansion than did developed countries. Low-income countries are leapfrogging the progress experienced by high-income countries—with strong expansion in post-primary education even while primary education remains inaccessible to many young people (figure 2.4).
Figure 2.4 Low-income countries are bypassing the historical trend of high-income countries when most people received a primary education before coverage expanded to secondary
Evolution in the stock of educational attainment (ages 15-64), by present-day income group (1890-2010)
Source: WDR 2018 team using data from Lee and Lee 2016.
Poverty, gender, ethnicity, disability, and location explain most remaining disparities
Mawut, a refugee from South Sudan, lived in a refugee camp in Kenya for years so he could finish primary school. “In 2010 my sister [decided to return] to Sudan and I decided not to follow her because I knew if I did so, that would be the end of my education. I went to Kakuma Refugee Camp with my brother, where I completed the two remaining years of my primary course. I passed very well despite the problems that I had experienced.”12
11 UIS 2016. 12 Kelland 2016.
0
20
40
60
80
100 0
20
40
60
80
100020406080100
Less than primary Primary
Secondary or above
1890
1950
1980
2010
1890
1950
1980
2010
1890
1920
1950
1980
2010
1890
1920
1950
19802010
Low incomeLower middle incomeUpper middle incomeHigh income
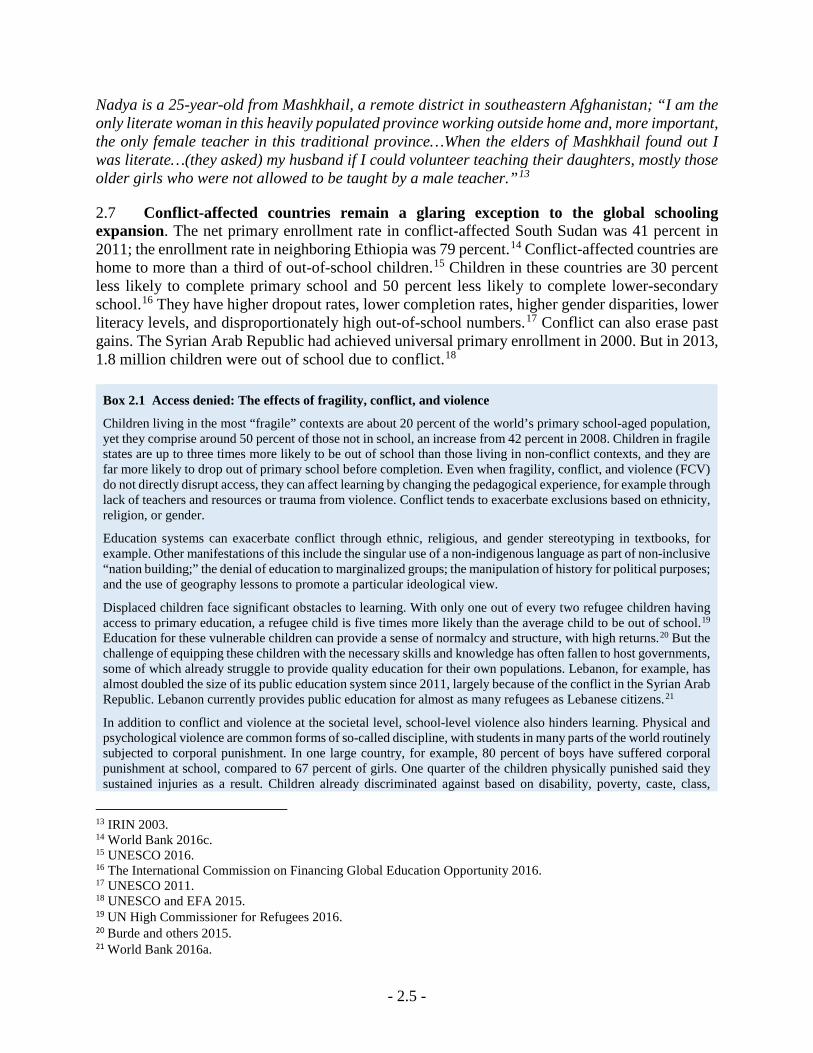
- 2.5 -
Nadya is a 25-year-old from Mashkhail, a remote district in southeastern Afghanistan; “I am the only literate woman in this heavily populated province working outside home and, more important, the only female teacher in this traditional province…When the elders of Mashkhail found out I was literate…(they asked) my husband if I could volunteer teaching their daughters, mostly those older girls who were not allowed to be taught by a male teacher.”13
2.7 Conflict-affected countries remain a glaring exception to the global schooling expansion. The net primary enrollment rate in conflict-affected South Sudan was 41 percent in 2011; the enrollment rate in neighboring Ethiopia was 79 percent.14 Conflict-affected countries are home to more than a third of out-of-school children.15 Children in these countries are 30 percent less likely to complete primary school and 50 percent less likely to complete lower-secondary school.16 They have higher dropout rates, lower completion rates, higher gender disparities, lower literacy levels, and disproportionately high out-of-school numbers.17 Conflict can also erase past gains. The Syrian Arab Republic had achieved universal primary enrollment in 2000. But in 2013, 1.8 million children were out of school due to conflict.18
Box 2.1 Access denied: The effects of fragility, conflict, and violence
Children living in the most “fragile” contexts are about 20 percent of the world’s primary school-aged population, yet they comprise around 50 percent of those not in school, an increase from 42 percent in 2008. Children in fragile states are up to three times more likely to be out of school than those living in non-conflict contexts, and they are far more likely to drop out of primary school before completion. Even when fragility, conflict, and violence (FCV) do not directly disrupt access, they can affect learning by changing the pedagogical experience, for example through lack of teachers and resources or trauma from violence. Conflict tends to exacerbate exclusions based on ethnicity, religion, or gender.
Education systems can exacerbate conflict through ethnic, religious, and gender stereotyping in textbooks, for example. Other manifestations of this include the singular use of a non-indigenous language as part of non-inclusive “nation building;” the denial of education to marginalized groups; the manipulation of history for political purposes; and the use of geography lessons to promote a particular ideological view.
Displaced children face significant obstacles to learning. With only one out of every two refugee children having access to primary education, a refugee child is five times more likely than the average child to be out of school.19 Education for these vulnerable children can provide a sense of normalcy and structure, with high returns.20 But the challenge of equipping these children with the necessary skills and knowledge has often fallen to host governments, some of which already struggle to provide quality education for their own populations. Lebanon, for example, has almost doubled the size of its public education system since 2011, largely because of the conflict in the Syrian Arab Republic. Lebanon currently provides public education for almost as many refugees as Lebanese citizens.21
In addition to conflict and violence at the societal level, school-level violence also hinders learning. Physical and psychological violence are common forms of so-called discipline, with students in many parts of the world routinely subjected to corporal punishment. In one large country, for example, 80 percent of boys have suffered corporal punishment at school, compared to 67 percent of girls. One quarter of the children physically punished said they sustained injuries as a result. Children already discriminated against based on disability, poverty, caste, class,
13 IRIN 2003. 14 World Bank 2016c. 15 UNESCO 2016. 16 The International Commission on Financing Global Education Opportunity 2016. 17 UNESCO 2011. 18 UNESCO and EFA 2015. 19 UN High Commissioner for Refugees 2016. 20 Burde and others 2015. 21 World Bank 2016a.
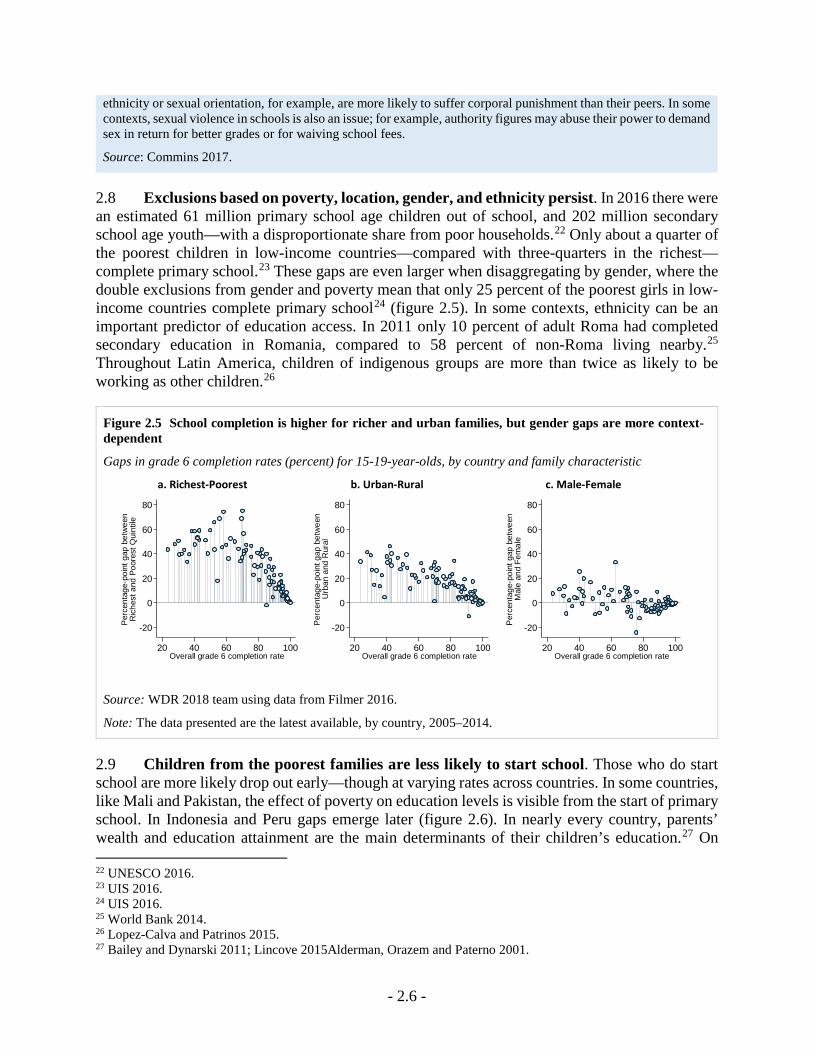
- 2.6 -
ethnicity or sexual orientation, for example, are more likely to suffer corporal punishment than their peers. In some contexts, sexual violence in schools is also an issue; for example, authority figures may abuse their power to demand sex in return for better grades or for waiving school fees.
Source: Commins 2017.
2.8 Exclusions based on poverty, location, gender, and ethnicity persist. In 2016 there were an estimated 61 million primary school age children out of school, and 202 million secondary school age youth—with a disproportionate share from poor households.22 Only about a quarter of the poorest children in low-income countries—compared with three-quarters in the richest—complete primary school.23 These gaps are even larger when disaggregating by gender, where the double exclusions from gender and poverty mean that only 25 percent of the poorest girls in low-income countries complete primary school24 (figure 2.5). In some contexts, ethnicity can be an important predictor of education access. In 2011 only 10 percent of adult Roma had completed secondary education in Romania, compared to 58 percent of non-Roma living nearby.25 Throughout Latin America, children of indigenous groups are more than twice as likely to be working as other children.26
Figure 2.5 School completion is higher for richer and urban families, but gender gaps are more context-dependent
Gaps in grade 6 completion rates (percent) for 15-19-year-olds, by country and family characteristic
a. Richest-Poorest b. Urban-Rural c. Male-Female
Source: WDR 2018 team using data from Filmer 2016.
Note: The data presented are the latest available, by country, 2005–2014.
2.9 Children from the poorest families are less likely to start school. Those who do start school are more likely drop out early—though at varying rates across countries. In some countries, like Mali and Pakistan, the effect of poverty on education levels is visible from the start of primary school. In Indonesia and Peru gaps emerge later (figure 2.6). In nearly every country, parents’ wealth and education attainment are the main determinants of their children’s education.27 On 22 UNESCO 2016. 23 UIS 2016. 24 UIS 2016. 25 World Bank 2014. 26 Lopez-Calva and Patrinos 2015. 27 Bailey and Dynarski 2011; Lincove 2015Alderman, Orazem and Paterno 2001.
-20
0
20
40
60
80
Perc
enta
ge-p
oint
gap
bet
wee
nR
iche
st a
nd P
oore
st Q
uint
ile
20 40 60 80 100Overall grade 6 completion rate
-20
0
20
40
60
80
Perc
enta
ge-p
oint
gap
bet
wee
nU
rban
and
Rur
al
20 40 60 80 100Overall grade 6 completion rate
-20
0
20
40
60
80Pe
rcen
tage
-poi
nt g
ap b
etw
een
Mal
e an
d Fe
mal
e
20 40 60 80 100Overall grade 6 completion rate
- 2.7 -
average, there is a 36-percentage point gap between the chances of children in the poorest and richest quintiles completing primary school in developing countries.28 Moreover, in 10 of 25 such countries for which data are available, wealth-related inequalities in primary completion rates are getting worse.29 The poorest people are the most affected by any marginal increase or contraction of public spending on education.30 So, not surprisingly, making school more affordable—both in terms of defraying direct costs and compensating for opportunity costs—increases school participation of children from poorer families.31
Figure 2.6 Multiple exclusions—girls from poor households often have the lowest rates of education attainment Percentage of youth (ages 15–19) who have completed each grade, by wealth quintile and gender (2012)
Source: WDR 2018 team with data from Demographic and Health Surveys Program 2012.
2.10 Globally, twice as many girls as boys never start school which results in lower school completion rates.32 Fewer than 1 in 20 poor, rural girls in Sub-Saharan Africa are on track to complete secondary school. Girls are seven times less likely than non-poor, urban boys to complete the same level of education. Even in regions where gender parity has been achieved at the primary level, like North Africa and West Asia, gender disparities in enrollment exist at the lower secondary school and become more pronounced in upper secondary school.33
2.11 Gender reinforces other disadvantages. Gender often compounds disadvantages related to socioeconomic status, ethnicity, location, religion, sexual orientation, disability, age, and race.34 Of the 61 million girls of primary and lower-secondary school age currently out of school, 70 percent are from excluded groups.35 For instance, many girls in Pakistan must cross caste and gender social boundaries to attend school. Low-caste girls in schools with high castes may experience stigma and face discrimination. Purdah, a practice of secluding women from men or strangers, also limits mobility and social interactions for all girls subjected to it. 36
28 The International Commission on Financing Global Education Opportunity 2016. 29 The International Commission on Financing Global Education Opportunity 2016. 30 Lanjouw and Ravallion 1999. 31 Kremer and Holla 2009Orazem and King 2007. 32 The International Commission on Financing Global Education Opportunity 2016. 33 UNESCO Institute for Statistics and Global Education Monitoring Report 2016 . 34 Kabeer 2015. 35 UNESCO Institute for Statistics and Global Education Monitoring Report 2016Lockheed and Lewis 2007. 36 World Bank 2015.
0
20
40
60
80
100
Perc
enta
ge
1 2 3 4 5 6 7 8 9Grade
Pakistan
0
20
40
60
80
100
1 2 3 4 5 6 7 8 9Grade
Mali
0
20
40
60
80
100
1 2 3 4 5 6 7 8 9Grade
Peru
0
20
40
60
80
100
1 2 3 4 5 6 7 8 9Grade
Indonesia
Richest quintile Middle quintile Poorest quintile Girls in the poorest quintile
- 2.8 -
2.12 Children with disabilities face substantial obstacles to education—and substantially lower participation in school.37 In Burkina Faso, having a disability increases the probability of a child never having attended school by 2.5 times.38 Even in countries with high overall primary school enrollments, children with disabilities are still significantly less likely to attend school. In the Republic of Moldova, 97 percent of children without disabilities between the ages of 7 and 15 years are enrolled in primary school, whereas only 58 percent of children with disabilities are in school.39 At the same time, quality education for children with disabilities has significant economic and social returns. Across 14 developing countries, each additional year of schooling for people with a disability decreased their probability of being in the poorest two quintiles by between 2 percent and 5 percent.40
For poor parents, schooling requires tradeoffs
2.13 Millions of poor parents make difficult choices about whether or not to educate their children. This cost-benefit assessment—where costs include both the direct cost of school and the opportunity cost of a child’s time outside it—determines their children’s enrollment, grade completion, and learning outcomes.41 In some contexts this calculus might even involve sending some—but not all—children to school. For instance, only about a quarter of rural households in Burkina Faso enroll all their children in school.42 Cutting the cost of schooling, therefore, significantly raises school participation by children from poorer families.43 The removal of direct costs to schooling through universal primary education in Uganda increased primary enrollment by over 60 percent and lowered cost-related dropouts by over 33 percentage points.44 In Malawi free primary education increase enrollment by half, favoring girls and poor people.45
2.14 For poor households, distance to the nearest school is a predictor of school participation. This is especially the case if social norms or safety concerns make it difficult for children—particularly girls—to travel far from home.46 In Indonesia each school built for every 1,000 children increased education by an average increase of 0.12 years.47 But school availability matters most when starting from a point of low availability—and school construction, by itself, can only do so much.48
2.15 Perceived returns, whether in the labor market or in realms such as the marriage “market,” often determine how willing poor parents are to send children to school.49 Thus the demand for education is likely to be lower if parents underestimate the returns of education.50 37 O’Keefe 2007. 38 Kobiané and Bougma 2009. 39 Mete 2008. 40 Filmer 2008. 41 Becker, DeGroot and Marschak 1964; Glewwe 2002; Behrman, Ross and Sabot 2008; Hanushek and Woessmann 2008; Pritchett 2013. 42 Akresh and others 2012. 43 Kremer and Holla 2009; Orazem and King 2007. 44 Deininger 2003. 45 Kattan and Burnett 2004. 46 Burde and Linden 2012. 47 Duflo 2001. 48 Filmer 2007. 49 Foster and Rosenzweig 2001; Nguyen 2008. 50 Murnane and Ganimian 2014; Banerjee and Duflo 2011.
- 2.9 -
Parents might also misunderstand how returns to education vary by level. If they believe that returns from secondary education are significantly higher than returns from primary, it might make more sense to focus on sending their brightest child to secondary school rather than sending all their children to primary school.51 In the face of extreme poverty and perceived low returns to schooling, poor people might restrict their overall aspirations for education.52
2.16 Parents’ perceptions about whether their children are learning affect their decisions about whether to continue education. In most low-income countries students who have to repeat grades or exceed the average age of their classmates by several years are more likely to drop out before completing primary school.53 In the Philippines, a child’s perceived educational ability is a key determinant of whether parents choose to keep him or her in school, or working instead.54 Similarly, adolescents in Burkina Faso are far more likely to be enrolled when they score high on an intelligence test, but much less likely if their sibling scores higher.55
2.17 Further, when parents perceive available education as being of low quality, it affects their choices about schooling.56 Although parental perceptions of school quality depend on a variety of factors—from the physical condition of the school to teacher punctuality—student learning outcomes are consistently cited as a critical aspect.57 Holding student ability and achievement constant, families in Egypt could differentiate schools by their quality of education—and students attending lower-quality schools were more likely to drop out.58 Indeed, parents seem willing to bypass lower-quality public schools in favor of higher-quality, more remote public ones, or better-quality private ones with higher fees.59
* * *
2.18 Worldwide, parents and students show incredible faith in the power of education. People everywhere know that education can transform lives—and the lives of their children. The rapid growth in schooling in poor rural areas around the world expresses this demand.60 Parents—including those who never attended—almost universally say they want their sons and daughters to complete school.61 The past 50 years have generated high hopes of strong returns to education and a great drive toward universal school enrollment. But much remains to be done. Achieving this promise means addressing gaps in school participation and ensuring that education leads to learning. As chapter 3 shows, the great schooling expansion has not translated into commensurate gains in learning. Attention must now shift to ensuring learning for all.
51 Banerjee and Duflo 2011. 52 Dalton, Ghosal and Mani 2016; Genicot and Ray 2014. 53 UNICEF 2015; Glick and Sahn 2010. 54 Bacolod and Ranjan 2008. 55 Akresh and others 2012. 56 Banerjee and others 2000; Hanushek and Woessmann 2008; Rivkin, Hanushek and Kain 2005. 57 Andrabi, Das and Khwaja 2008; Tooley and Dixon 2007; Alderman, Orazem and Paterno 2001; Orazem 2000. 58 Hanushek, Lavy and Hitomi 2006. 59 Gertler and Glewwe 1990; Andrabi, Das and Khwaja 2008. 60 Tooley and Dixon 2006. 61 Mukerji and Walton 2012.
- 2.10 -
References
Akresh, Richard, Emilie Bagby, Damien De Walque, and Harounan Kazianga. 2012. "Child Ability and Household Human Capital Investment Decisions in Burkina Faso." Economic Development and Cultural Change 61(1): 157-86.
Alderman, Harold, Peter F Orazem, and Elizabeth M Paterno. 2001. "School Quality, School Cost, and the Public/Private School Choices of Low-Income Households in Pakistan." Journal of Human Resources: 304-26.
Andrabi, Tahir, Jishnu Das, and Asim Ijaz Khwaja. 2008. "A Dime a Day: The Possibilities and Limits of Private Schooling in Pakistan." Comparative Education Review 52(3): 329-55.
Bacolod, Marigee P, and Priya Ranjan. 2008. "Why Children Work, Attend School, or Stay Idle: The Roles of Ability and Household Wealth." Economic Development and Cultural Change 56(4): 791-828.
Bailey, Martha J., and Susan M. Dynarski. 2011. "Inequality in Postsecondary Education." In Whither Opportunity?: Rising Inequality, Schools, and Children's Life Chances, edited by Greg J Duncan and Richard J Murnane, New York: Russell Sage Foundation.
Banerjee, Abhijit, and Esther Duflo. 2011. Poor Economics: A Radical Rethinking of the Way to Fight Global Poverty. PublicAffairs.
Banerjee, Abhijit, Suraj Jacob, Michael Kremer, Jenny Lanjouw, and Peter Lanjouw. 2000. "Promoting School Participation in Rural Rajasthan: Results from Some Prospective Trials." Unpublished manuscript, Massachusetts Institute of Technology.
Barro, Robert J, and Jong Wha Lee. 2013. "A New Data Set of Educational Attainment in the World, 1950–2010." Journal of development economics 104: 184-98.
Becker, Gordon M, Morris H DeGroot, and Jacob Marschak. 1964. "Measuring Utility by a Single‐Response Sequential Method." Behavioral science 9(3): 226-32.
Behrman, Jere R, David Ross, and Richard Sabot. 2008. "Improving Quality Versus Increasing the Quantity of Schooling: Estimates of Rates of Return from Rural Pakistan." Journal of Development Economics 85(1): 94-104.
Burde, Dana, Ozen Guven, Jo Kelcey, Heddy Lahmann, and Khaled Al-Abbadi. 2015. " What Works to Promote Children’s Educational Access, Quality of Learning, and Wellbeing in Crisis-Affected Contexts. Education
Rigorous Literature Review." Department for International Development.
Burde, Dana, and Leigh L Linden. 2012. "The Effect of Village-Based Schools: Evidence from a Randomized Controlled Trial in Afghanistan." National Bureau of Economic Research.
Dalton, Patricio S, Sayantan Ghosal, and Anandi Mani. 2016. "Poverty and Aspirations Failure." The Economic Journal 126(590): 165-88.
Deininger, Klaus. 2003. "Does Cost of Schooling Affect Enrollment by the Poor? Universal Primary Education in Uganda." Economics of Education review 22(3): 291-305.
Demographic and Health Surveys Program. 2012. "Education." http://dhsprogram.com/data/.
Duflo, Esther. 2001. "Schooling and Labor Market Consequences of School Construction in Indonesia: Evidence from an Unusual Policy Experiment." American Economic Review: 1-60.
Filmer, Deon. 2007. "If You Build It, Will They Come? School Availability and School Enrolment in 21 Poor Countries." Journal of Development Studies 43(5): 901-28.
———. 2008. "Disability, Poverty, and Schooling in Developing Countries: Results from 14 Household Surveys." The World Bank Economic Review 22(1): 141-63.
———. 2016. "Education Attainment and Enrollment around the World: An International Database."
Foster, Andrew D, and Mark R Rosenzweig. 2001. "Imperfect Commitment, Altruism, and the Family: Evidence from Transfer Behavior in Low-Income Rural Areas." Review of Economics and Statistics 83(3): 389-407.
Genicot, Garance, and Debraj Ray. 2014. "Aspirations and Inequality." National Bureau of Economic Research.
Gertler, Paul, and Paul Glewwe. 1990. "The Willingness to Pay for Education in Developing Countries: Evidence from Rural Peru." Journal of Public Economics 42(3): 251-75.
Glewwe, Paul. 2002. "Schools and Skills in Developing Countries: Education Policies and Socioeconomic Outcomes." Journal of Economic Literature 40(2): 436-82.
Glick, Peter, and David E Sahn. 2010. "Early Academic Performance, Grade Repetition, and School Attainment in Senegal: A Panel Data Analysis." World Bank Economic Review.
- 2.11 -
Hanushek, Eric A, Victor Lavy, and Kohtaro Hitomi. 2006. "Do Students Care About School Quality? Determinants of Dropout Behavior in Developing Countries." National Bureau of Economic Research.
Hanushek, Eric A, and Ludger Woessmann. 2008. "The Role of Cognitive Skills in Economic Development." Journal of Economic Literature 46(3): 607-68.
IRIN. 2003. "Interview with Nadya, Rural Teacher." IRIN.
Kabeer, Naila. 2015. "Tracking the Gender Politics of the Millennium Development Goals: Struggles for Interpretive Power in the International Development Agenda." Third World Quarterly 36(2): 377-95.
Kattan, Raja Bentaouet, and Nicholas Burnett. 2004. "User Fees in Primary Education." World Bank Education Advisory Service.
Kelland, Zoe. 2016. "4 Children Explain How Education Has Changed Their Lives." Global Citizen.
Kobiané, JF, and M Bougma. 2009. "Rgph 2006. Rapport D’analyse Du Thème Iv: Instruction, Alphabétisation Et Scolarisation." Ministère de l’économie et des finances, Ouagadougou, Burkina Faso.
Kremer, Michael, and Alaka Holla. 2009. "Improving Education in the Developing World: What Have We Learned from Randomized Evaluations?" Annual Review of Economics 1: 513.
Lanjouw, Peter, and Martin Ravallion. 1999. "Benefit Incidence, Public Spending Reforms, and the Timing of Program Capture." World Bank Economic Review 13: 257-74.
Lee, Jong-Wha, and Hanol Lee. 2016. "Human Capital in the Long Run." Journal of Development Economics.
Lincove, Jane Arnold. 2015. "Improving Identification of Demand-Side Obstacles to Schooling: Findings from Revealed and Stated Preference Models in Two Ssa Countries." World Development 66: 69-83.
Lockheed, ME, and MA Lewis. 2007. "Inexcusable Absence: Why 60 Million Girls Still Aren't in School and What to Do About It’." Center for Global Development, Washington, DC.
Lopez-Calva, Luis F, and Harry A Patrinos. 2015. "Exploring the Differential Impact of Public Interventions on Indigenous People: Lessons from Mexico's Conditional Cash Transfer Program." Journal of Human Development and Capabilities 16(3): 452-67.
Mete, Cem. 2008. Economic Implications of Chronic Illness and Disability in Eastern Europe and the Former Soviet Union. World Bank Publications.
Mukerji, Shobhini, and Michael Walton. 2012. "Learning the Right Lessons: Measurement, Experimentation and the Need to Turn India’s Right to Education Act Upside Down." Harvard Kennedy School.
Murnane, Richard J, and Alejandro Ganimian. 2014. "Improving Educational Outcomes in Developing Countries: Lessons from Rigorous Evaluations." NBER Working Paper (w20284).
Nguyen, Trang. 2008. "Information, Role Models and Perceived Returns to Education: Experimental Evidence from Madagascar." Unpublished manuscript.
O’Keefe, Philip. 2007. "People with Disabilities from India: From Commitments to Outcomes." Human Development Unit, South East Asia Region, The World Bank: 157.
Orazem, Peter F. 2000. "The Urban and Rural Fellowship School Experiments in Pakistan: Design, Evaluation, and Sustainability." Economics of Education Review 22(3): 265-74.
Orazem, Peter F, and Elizabeth M King. 2007. "Schooling in Developing Countries: The Roles of Supply, Demand and Government Policy." Handbook of Development Economics 4: 3475-559.
Pritchett, Lant. 2013. The Rebirth of Education: Schooling Ain't Learning. Washington, DC: Center for Global Development.
Rivkin, Steven G, Eric A Hanushek, and John F Kain. 2005. "Teachers, Schools, and Academic Achievement." Econometrica 73(2): 417-58.
The International Commission on Financing Global Education Opportunity. 2016. "The Learning Generation. Investing in Education for a Changing World.": The Education Commission.
Tooley, James, and Pauline Dixon. 2006. "‘De Facto’privatisation of Education and the Poor: Implications of a Study from Sub‐Saharan Africa and India." Compare 36(4): 443-62.
———. 2007. "Private Education for Low-Income Families: Results from a Global Research Project." Private schooling in less economically developed countries: Asian and African perspectives: 15-39.
UIS, UNESCO Institute for Statistics. 2016. "Education." 04/26/2017. http://data.uis.unesco.org/: UNESCO Institute for Statistics UIS.
UN High Commissioner for Refugees. 2016. "Missing Out: Refugee Education in Crisis." http://www.unhcr.org/57d9d01d0.
UNESCO. 2011. "The Hidden Crisis: Armed Conflict and Education." Paris: UNESCO.
- 2.12 -
———. 2015. "Education for All 2000-2015: Achievements and Challenges." Paris: UNESCO Publishing.
———. 2016. "Education for People and Planet: Creating Sustainable Futures for All." Paris: UNESCO Publishing.
UNESCO, and EFA. 2015. "A Growing Number of Children and Adolescents Are out of School as Aid Fails to Meet the Mark."
UNESCO Institute for Statistics and Global Education Monitoring Report. 2016. "Leaving No One Behind: How Far on the Way to Universal Primary and Secondary Education?" Policy Paper 27/Fact Sheet 37.
UNICEF, UNESCO Institute for Statistics (UIS) and. 2015. "Fixing the Broken Promise of Education for All: Findings from the Global Initiative on out-of-School Children." Montreal: UNESCO Institute for Statistics.
United Nations. 2015. "The Millennium Development Goals Report." New York: United Nations publication.
World Bank. 2011. "Learning for All: Investing in People’s Knowledge and Skills to Promote Development - World Bank Group Education Strategy 2020 Executive Summary." Washington, DC: World Bank.
———. 2012. "World Development Report 2012: Gender Equality and Development." Washington, DC: World Bank.
———. 2014. "Diagnostics and Policy Advice for Supporting Roma Inclusion in Romania." Washington DC: World Bank.
———. 2015. "World Development Report 2015: Mind, Society, and Behavior." Washington, DC: World Bank.
———. 2016a. "Lebanon - Support to Reaching All Children with Education (Race 2) Program for Results Project." Washington, D.C.: World Bank Group.
———. 2016b. "Reaching Girls, Transforming Lives." by Education Global Practice snapshot. Washington, D.C.: World Bank Group.
———. 2016c. World Development Indicators 2016. Washington, DC: World Bank.
- S1.1 -
Spotlight 1 The biology of learning
S1.1 Research has dramatically expanded our understanding of how the brain works—and hence how people learn. The brain is very malleable: it adapts to its surroundings. This phenomenon is called neuroplasticity, which means the ability to learn is dictated not only by genetic endowments, but also by how genes interact with experiences and environmental inputs. Genes govern when specific brain circuits are formed, but experiences can turn those genes on or off, as well as determine which neural connections—synapses—survive over the life cycle. Environmental inputs such as caregivers’ or teachers’ stimulation, or nutrition, or violence shape the architecture of the brain from the formative years on.1
S1.2 The brain is malleable throughout life, even if most brain development is completed by late adolescence or early adulthood. The fastest synaptic growth (hence malleability) occurs between the prenatal period and age 3 (one million new neural connections a second), then gradually slows.2 Because different parts of the brain develop at different times, and because neuroplasticity is highest during developmental stages, not all areas of the brain are equally malleable at the same time (figure S1.1). The periods of greatest plasticity, or “sensitive periods,” whose length varies widely by brain region, are characterized by an initial stage in which the brain develops far more synapses than it needs. That stage is followed by synaptic pruning in which, to maximize efficiency in brain functionality, neural connections used more often grow more permanent, while those used less are discarded to reach optimal levels of synapses (i.e., adult level of synapses in figure S1.1). 3 Because most sensitive periods take place early in life, a 3-year-old has, in total, far more brain synapses (about 1 quadrillion) than does an adult (100–500 trillion).
S1.3 The development of the distinct parts of the brain are interdependent, but have different sensitive periods. Neural circuits (series of synapses) form sequentially and cumulatively: Simpler networks develop first, more complex ones later. Just as with the construction of a house, the robustness of progressively more complex brain structures depends on the robustness of foundational ones. For instance, the development of increasingly complex skills and functions builds on circuits formed earlier: linguistic development relies on visual and auditory functions that are dependent on neural circuits lower in the hierarchy, which are most malleable earlier in life; neural circuits that support higher cognitive functions, most malleable until as late as adolescence, build on both sensorial stimuli as well as linguistic development.4 Moreover, physical, sensory-motor, cognitive, and socioemotional development is interdependent, constituting a web of dynamic links that ultimately determine a person’s ability to thrive. For example, higher levels of health promote learning; emotional security fosters child exploration which leads to learning; and higher self-regulation reduces health risks.5
1 Knudsen 2004. 2 Shonkoff and Phillips 2000. 3 Knudsen and others 2006. 4 Shonkoff 2009. 5 Knudsen and others 2006; Heckman 2007.
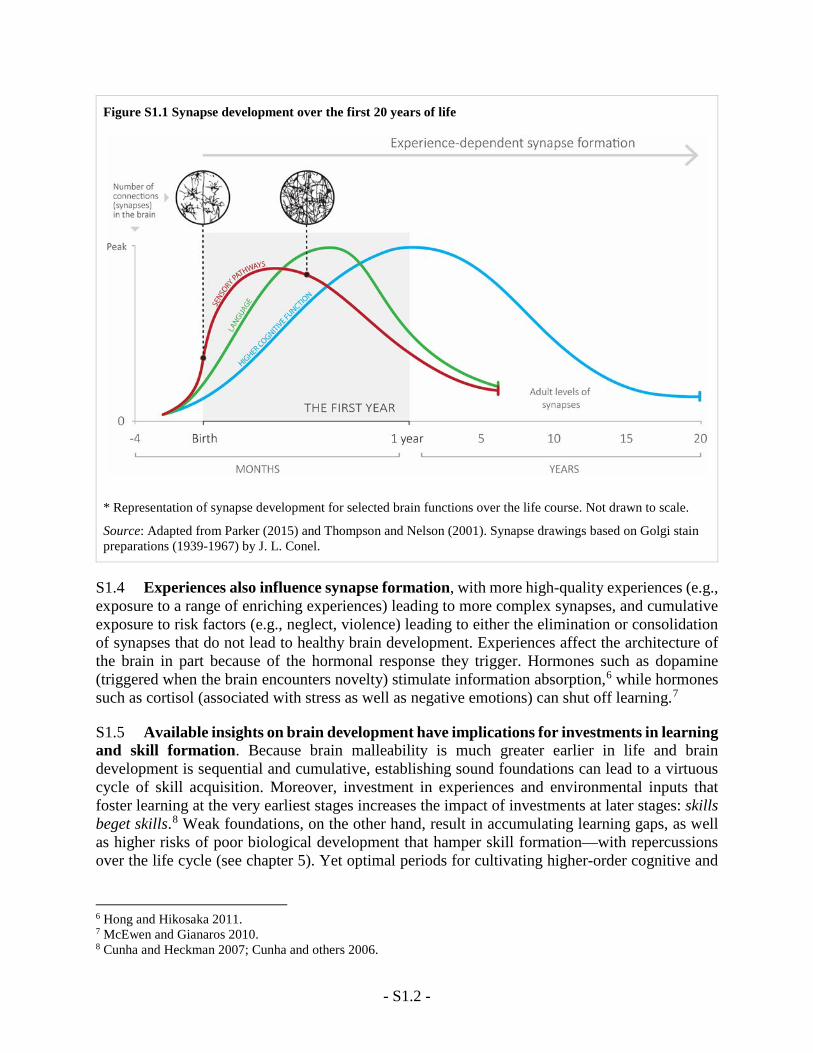
- S1.2 -
Figure S1.1 Synapse development over the first 20 years of life
* Representation of synapse development for selected brain functions over the life course. Not drawn to scale.
Source: Adapted from Parker (2015) and Thompson and Nelson (2001). Synapse drawings based on Golgi stain preparations (1939-1967) by J. L. Conel.
S1.4 Experiences also influence synapse formation, with more high-quality experiences (e.g., exposure to a range of enriching experiences) leading to more complex synapses, and cumulative exposure to risk factors (e.g., neglect, violence) leading to either the elimination or consolidation of synapses that do not lead to healthy brain development. Experiences affect the architecture of the brain in part because of the hormonal response they trigger. Hormones such as dopamine (triggered when the brain encounters novelty) stimulate information absorption,6 while hormones such as cortisol (associated with stress as well as negative emotions) can shut off learning.7
S1.5 Available insights on brain development have implications for investments in learning and skill formation. Because brain malleability is much greater earlier in life and brain development is sequential and cumulative, establishing sound foundations can lead to a virtuous cycle of skill acquisition. Moreover, investment in experiences and environmental inputs that foster learning at the very earliest stages increases the impact of investments at later stages: skills beget skills.8 Weak foundations, on the other hand, result in accumulating learning gaps, as well as higher risks of poor biological development that hamper skill formation—with repercussions over the life cycle (see chapter 5). Yet optimal periods for cultivating higher-order cognitive and
6 Hong and Hikosaka 2011. 7 McEwen and Gianaros 2010. 8 Cunha and Heckman 2007; Cunha and others 2006.
- S1.3 -
socioemotional skills occur throughout childhood, adolescence, and early adulthood;9 the brain’s ability to adapt to its environment, learn, and acquire new skills continues throughout life (i.e., experience-dependent synapse formation in figure S1.1). Thus investments in environmental inputs are needed well beyond early childhood to sustain learning along with skills development.
S1.6 Interventions to improve learning and skills should place a greater focus on the areas of the brain that are the most malleable over the life course. Children’s brains are most efficient at incorporating new information through exploration, play, and interactions with caring adults or peers. Given this receptivity, preschool programs should focus on building foundational skills through developmentally appropriate program structures that emphasize play and interaction.10 Though foundational cognitive skills become less malleable after age 10, some areas associated with socioemotional development remain highly malleable through early adulthood. Accordingly, interventions that aim to improve the school to work transition, as well as social inclusion for youth with weak foundational skills, may prove most effective when they place a strong emphasis on socioemotional skills.11
S1.7 In addition, teaching strategies can deeply influence how students approach challenges in and out of school. Because the brain thrives when exposed to novelty, incorporating enriching opportunities for learning along with exploration may lead to better learning outcomes. Finally, intense stress or sustained negative emotions, such as those associated with crises or acute deprivation, where multiple stressors coexist, interfere with the brain’s ability to learn, retain, and use information. Extended exposure to stressors is toxic for biological systems, particularly for developing brains (see spotlight 2 on the effects of poverty), which may impede disadvantaged children from flourishing in the classroom. Consequently, programs that increase the availability of protective factors to shelter children from stress (e.g., nurturing care from at least one meaningful relationship that teaches children how to cope) can improve not only schooling, but also overall life outcomes.
9 Guerra, Modecki and Cunningham 2014. 10 Whitebread and Bingham 2011. 11 Kautz and others 2014.
- S1.4 -
References
Cunha, Flavio, and James J. Heckman. 2007. "The Technology of Skill Formation." American Economic Review 97(2): 31-47.
Cunha, Flavio, James J. Heckman, Lance Lochner, and Dimitriy V. Masterov. 2006. "Interpreting the Evidence on Life Cycle Skill Formation." Handbook of the Economics of Education 1: 697-812.
Guerra, Nancy, Kathryn Modecki, and Wendy Cunningham. 2014. "Developing Social-Emotional Skills for the Labor Market: The Practice Model." World Bank Policy Research Working Paper (7123).
Heckman, James J. 2007. "The Economics, Technology, and Neuroscience of Human Capital Formation." Proceedings of the National Academy of Sciences 104(33): 13250-55.
Hong, Simon, and Okihide Hikosaka. 2011. "Dopamine-Mediated Learning and Switching in Cortico-Striatal Circuit Explain Behavioral Changes in Reinforcement Learning." Frontiers in behavioral neuroscience 5: 15.
Kautz, Tim, James J Heckman, Ron Diris, Bas Ter Weel, and Lex Borghans. 2014. "Fostering and Measuring Skills: Improving Cognitive and Non-Cognitive Skills to Promote Lifetime Success." National Bureau of Economic Research.
Knudsen, Eric I. 2004. "Sensitive Periods in the Development of the Brain and Behavior." Journal of Cognitive Neuroscience 16(8): 1412-25.
Knudsen, Eric I., James J. Heckman, Judy L. Cameron, and Jack P. Shankoff. 2006. "Economic, Neurobiological, and Behavioral Perspectives on Building America’s Future Workforce." Proceedings of the National Academy of Sciences 103(27): 10155-62.
McEwen, Bruce S, and Peter J Gianaros. 2010. "Central Role of the Brain in Stress and Adaptation: Links to Socioeconomic Status, Health, and Disease." Annals of the New York Academy of Sciences 1186(1): 190-222.
Parker, Lawson. 2015. "Neural Network." National Geographic.
Shonkoff, Jack. 2009. "In Brief: The Science of Early Childhood Development." Center on the Developing Child at Harvard University. Retrieved from: http://developingchild. harvard. edu/index. php/resources/multimedia/videos/inbrief_series.
Shonkoff, Jack P, and Deborah A Phillips. 2000. From Neurons to Neighborhoods: The Science of Early Childhood Development. National Academies Press.
Thompson, Ross A, and Charles A Nelson. 2001. "Developmental Science and the Media: Early Brain Development." American Psychologist 56(1): 5.
Whitebread, David, and Sue Bingham. 2011. "School Readiness: A Critical Review of Perspectives and Evidence." TACTYC occasional Paper 2.
- 3.1 -
Chapter 3 The many faces of the learning crisis
Contents
For too many, learning isn’t happening ........................................................................................................ 1
Poor children learn the least, which hurts them the most ............................................................................. 9
What is causing the learning crisis? ............................................................................................................ 11
Children do not arrive ready to learn ...................................................................................................... 11
Teachers often lack the needed skills and motivation ............................................................................. 13
School management skills are low .......................................................................................................... 17
School inputs have not kept pace ............................................................................................................ 19
Rabia Nura, a 16-year-old girl from Kano, Northern Nigeria, goes to school despite ever-present threats from Boko Haram. She is determined to become a doctor.1 But nearly 37 million African children will learn so little in school that they will not be much better off than kids who never attend school.2
3.1 The global schooling expansion hides another statistic—for millions, schooling is not producing enough learning. Learning outcomes in basic education are so low, in so many contexts, that the developing world is facing a learning crisis. In many low-income countries, learning levels are low in an absolute sense, while in many middle-income countries average learning levels remain far behind those in high-income countries. The learning crisis disproportionately affects children from poor households—who are far more likely to leave school without acquiring basic skills like literacy or numeracy. Ultimately, the learning crisis translates into severe shortcomings in the skills of the workforce.
For too many, learning isn’t happening
In South Africa 26 percent of 12-year-olds were enrolled in grade 6 but functionally illiterate; in Uganda that share was 45 percent.3
3.2 Globally, 125 million children are not acquiring functional literacy or numeracy, even after spending at least four years in school.4 In Malawi and Zambia more than 80 percent of students cannot read a single world by the end of grade 2.5 In Peru that share is 50 percent.6 A similar picture emerges for numeracy. In India less than 27 percent of students in grade 3 could
1 Smith 2014. 2 Fleet 2012. 3 Taylor and Spaull 2015. 4 UNESCO 2014. 5 Gove and Cvelich 2011. 6 Crouch 2006.
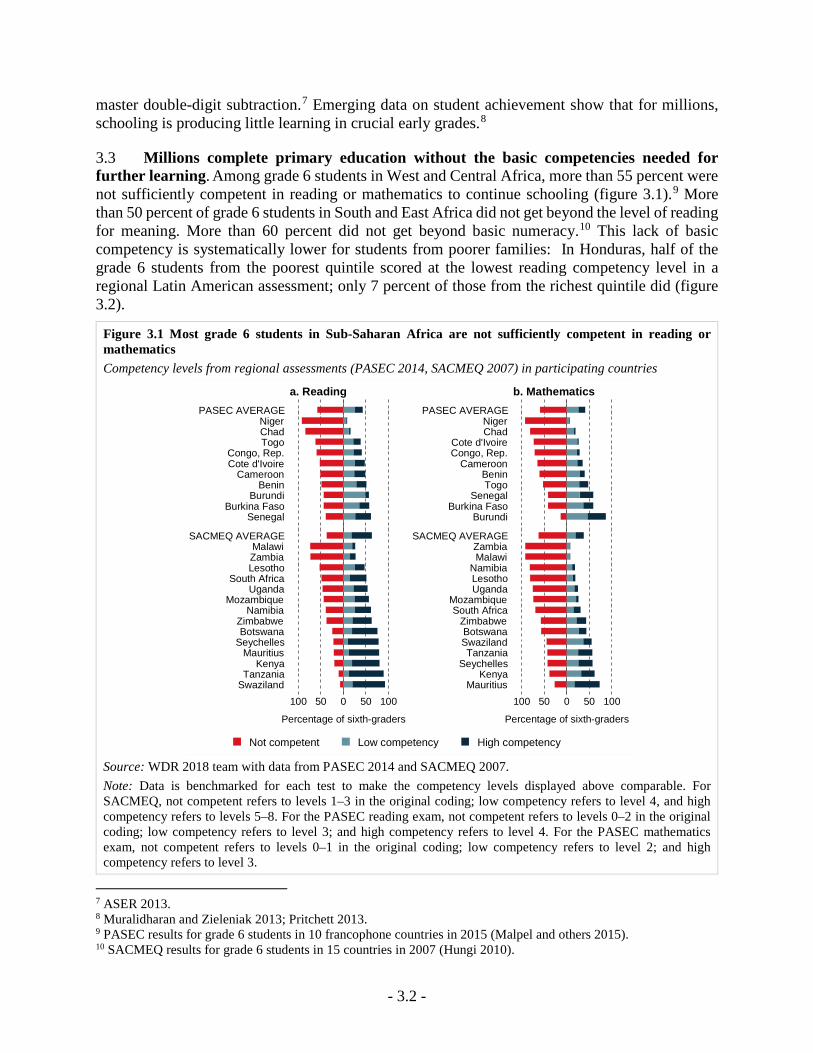
- 3.2 -
master double-digit subtraction.7 Emerging data on student achievement show that for millions, schooling is producing little learning in crucial early grades.8
3.3 Millions complete primary education without the basic competencies needed for further learning. Among grade 6 students in West and Central Africa, more than 55 percent were not sufficiently competent in reading or mathematics to continue schooling (figure 3.1).9 More than 50 percent of grade 6 students in South and East Africa did not get beyond the level of reading for meaning. More than 60 percent did not get beyond basic numeracy.10 This lack of basic competency is systematically lower for students from poorer families: In Honduras, half of the grade 6 students from the poorest quintile scored at the lowest reading competency level in a regional Latin American assessment; only 7 percent of those from the richest quintile did (figure 3.2).
Figure 3.1 Most grade 6 students in Sub-Saharan Africa are not sufficiently competent in reading or mathematics Competency levels from regional assessments (PASEC 2014, SACMEQ 2007) in participating countries
Source: WDR 2018 team with data from PASEC 2014 and SACMEQ 2007. Note: Data is benchmarked for each test to make the competency levels displayed above comparable. For SACMEQ, not competent refers to levels 1–3 in the original coding; low competency refers to level 4, and high competency refers to levels 5–8. For the PASEC reading exam, not competent refers to levels 0–2 in the original coding; low competency refers to level 3; and high competency refers to level 4. For the PASEC mathematics exam, not competent refers to levels 0–1 in the original coding; low competency refers to level 2; and high competency refers to level 3.
7 ASER 2013. 8 Muralidharan and Zieleniak 2013; Pritchett 2013. 9 PASEC results for grade 6 students in 10 francophone countries in 2015 (Malpel and others 2015). 10 SACMEQ results for grade 6 students in 15 countries in 2007 (Hungi 2010).
100 50 0 50 100
Percentage of sixth-graders
SwazilandTanzania
KenyaMauritius
SeychellesBotswana
ZimbabweNamibia
MozambiqueUganda
South AfricaLesothoZambiaMalawi
SACMEQ AVERAGE
SenegalBurkina Faso
BurundiBenin
CameroonCote d'IvoireCongo, Rep.
TogoChadNiger
PASEC AVERAGE
a. Reading
100 50 0 50 100
Percentage of sixth-graders
MauritiusKenya
SeychellesTanzania
SwazilandBotswana
ZimbabweSouth Africa
MozambiqueUgandaLesothoNamibia
MalawiZambia
SACMEQ AVERAGE
BurundiBurkina Faso
SenegalTogoBenin
CameroonCongo, Rep.Cote d'Ivoire
ChadNiger
PASEC AVERAGE
b. Mathematics
Not competent Low competency High competency
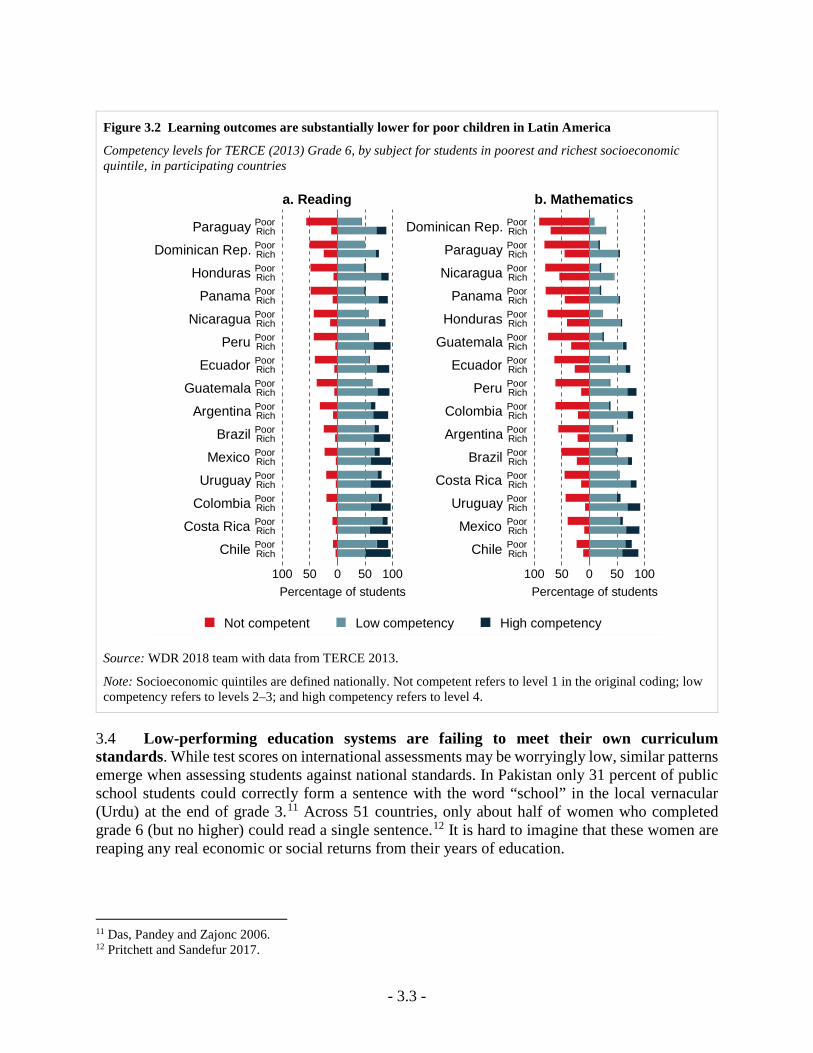
- 3.3 -
Figure 3.2 Learning outcomes are substantially lower for poor children in Latin America
Competency levels for TERCE (2013) Grade 6, by subject for students in poorest and richest socioeconomic quintile, in participating countries
Source: WDR 2018 team with data from TERCE 2013.
Note: Socioeconomic quintiles are defined nationally. Not competent refers to level 1 in the original coding; low competency refers to levels 2–3; and high competency refers to level 4.
3.4 Low-performing education systems are failing to meet their own curriculum standards. While test scores on international assessments may be worryingly low, similar patterns emerge when assessing students against national standards. In Pakistan only 31 percent of public school students could correctly form a sentence with the word “school” in the local vernacular (Urdu) at the end of grade 3.11 Across 51 countries, only about half of women who completed grade 6 (but no higher) could read a single sentence.12 It is hard to imagine that these women are reaping any real economic or social returns from their years of education.
11 Das, Pandey and Zajonc 2006. 12 Pritchett and Sandefur 2017.
100 50 0 50 100Percentage of students
ChileCosta Rica
ColombiaUruguay
MexicoBrazil
ArgentinaGuatemala
EcuadorPeru
NicaraguaPanama
HondurasDominican Rep.
Paraguay
RichPoorRichPoorRichPoorRichPoorRichPoorRichPoorRichPoorRichPoorRichPoorRichPoorRichPoorRichPoorRichPoorRichPoorRichPoor
a. Reading
100 50 0 50 100Percentage of students
ChileMexico
UruguayCosta Rica
BrazilArgentinaColombia
PeruEcuador
GuatemalaHonduras
PanamaNicaraguaParaguay
Dominican Rep.
RichPoorRichPoorRichPoorRichPoorRichPoorRichPoorRichPoorRichPoorRichPoorRichPoorRichPoorRichPoorRichPoorRichPoorRichPoor
b. Mathematics
Not competent Low competency High competency
- 3.4 -
Box 3.1 Those who cannot read by end of Grade 2 struggle to catch up
This is for two reasons.
First, learning is cumulative. Schooling systems around the world expect students to acquire foundational skills like reading by Grades 1 or 2. By Grade 3 students need to read to access their curriculum. Hence, students who master these foundational skills early are at an advantage—skills from early grades are strongly positively associated with later school performance.13 On the other hand, children who cannot read by Grade 3 fall behind and struggle to catch up, potentially irreparably.14
Second, classrooms do not offer struggling students a chance to catch up. In many contexts, the pace of classroom instruction is determined by the need to cover overambitious curriculum rather than student learning.15 This means teachers have no choice but to ignore students who are falling behind. In places like Kenya16 and India17 the curriculum has been designed for the elite. As a result, teachers and textbooks focus on advanced topics that are of little use in helping struggling students.18 These students fall progressively further behind—eventually falling so far behind that no learning takes place whatsoever.19
Source: WDR 2018 team.
3.5 These low learning levels are not an inevitable by-product of rapid education expansion. Starting in the 1950s, the Republic of Korea’s government focused on ensuring quality primary education for the vast majority of the population, before shifting to a similar emphasis in secondary and ultimately higher education. The success of this strategy shows that it is possible to ensure quality education even while expanding schooling rapidly. The key ingredient is a persistent emphasis on the needs of the poor and disadvantaged.20 Similarly, the more recent experience of Vietnam reinforces that lesson; it too has maintained education quality during rapid expansion by ensuring that disadvantaged students receive relatively equitable access to quality schooling.21
3.6 Even in middle-income countries, millions of students are lagging behind. In Brazil internationally comparable assessments reveal that more than three-quarters of youth are reaching the age of 15 without being able to perform at the lowest level of competence in PISA tests.22 Similarly, a third of students in Paraguay have only a basic grasp of reading skills (“reading for meaning”) by grade 6.23 These students are ill-equipped to participate in their economy and society.24 Across middle- and high-income countries, there are big differences in average student achievement. Some (Albania, Peru, Portugal) have made impressive progress in improving average student achievement relative to countries with similar income.25 Latvia outperforms several countries in Eastern Europe; Vietnam is a positive outlier in Southeast Asia. While it is not always possible to clearly isolate the factors responsible for system-wide improvements in student learning, a policy focus on education quality appears important. For instance, a major component 13 Glick and Sahn 2010. 14 Muralidharan and Zieleniak 2013. 15 Beatty and Pritchett 2012. 16 Glewwe, Kremer and Moulin 2009. 17 Banerjee and Duflo 2012. 18 Beatty and Pritchett 2012. 19 Beatty and Pritchett 2012. 20 Hong and Lee 2016. 21 Dang and Glewwe 2017. 22 Filmer, Hasan and Pritchett 2006. 23 UNESCO 2016b. 24 Filmer, Hasan and Pritchett 2006. 25 OECD 2016.
- 3.5 -
of Vietnam’s strong performance has been a convergence in school quality within the country. The share of schools that meet the national standards of quality has steadily increased over the past 25 years.26
3.7 Low student achievement in some middle-income countries relative to their economic competitors signals a failure to live up to their own expectations. The leading international assessments on literacy and numeracy show that the average student in low-income countries performs worse than 95 percent of the students in OECD countries—meaning that student would be singled out for remedial attention in a class in a wealthier country.27 In countries like Colombia, Indonesia, and Peru student performance at the 75th percentile on the Program for International Student Assessment (PISA) math test is barely above that at the 25th percentile of the OECD average—in Algeria, the Dominican Republic, Kosovo, and Tunisia it is below the 25th percentile of the OECD average (figure 3.3). The disparity between the average PISA score for Latin American countries and OECD countries is equivalent to over two full years of math education. Based on its rate of progress in average PISA scores from 2003 to 2015, it would take Brazil 263 years to reach the OECD reading average. This is especially problematic for middle-income countries trying to position themselves as important players in the global economic landscape.
3.8 The mapping between schooling and workforce skills varies dramatically across countries. For instance, while the working-age population in Colombia reaches basic literacy proficiency at the lower secondary level, that population in Bolivia needs six more years to attain even close to the same proficiency. Similarly, among 18- to 37-year-olds, in Nigeria only 19 percent of primary completers can read, while in Tanzania, 80 percent can.28
3.9 In some countries large proportions of “educated” working adults are effectively low-skilled. Nearly 80 percent of Ghana’s working-age population and over 60 percent of Kenya’s have just level 1 literacy or below. This means that their literacy proficiency is limited to understanding basic texts but not the ability to integrate, evaluate, or interpret information from a variety of text materials (figure 3.4).29 This contrasts with the average for high-income countries, where only 5 percent of the working-age population is at level 1 or below. Low literacy proficiency makes individuals poorly prepared for the labor market, further education, and on-the-job training. In rapidly modernizing labor markets, most quality jobs—and even job training—require individuals to show reading competency beyond minimum proficiency.30
26 Dang and Glewwe 2017. 27 Crouch and Gove, in press; which is based on Progress in International Reading Literacy Study [PIRLS] and Trends in International Mathematics and Science Study [TIMSS]. 28 Kaffenberger and Pritchett 2017. 29 The literacy skills proficiency construct covers a range of skills from the decoding of written words and sentences to the comprehension, interpretation, and evaluation of complex texts and takes into account workplace, personal, society, and community. To facilitate the interpretation of individual scores, described proficiency scales are available to articulate the requisite skills and knowledge needed to perform specific tasks along a 500-point scale. The tasks move progressively in complexity from level 0 to level 5. See ETS 2014; OECD 2016b. 30 Desjardins and Rubenson 2011; OECD 2016a.
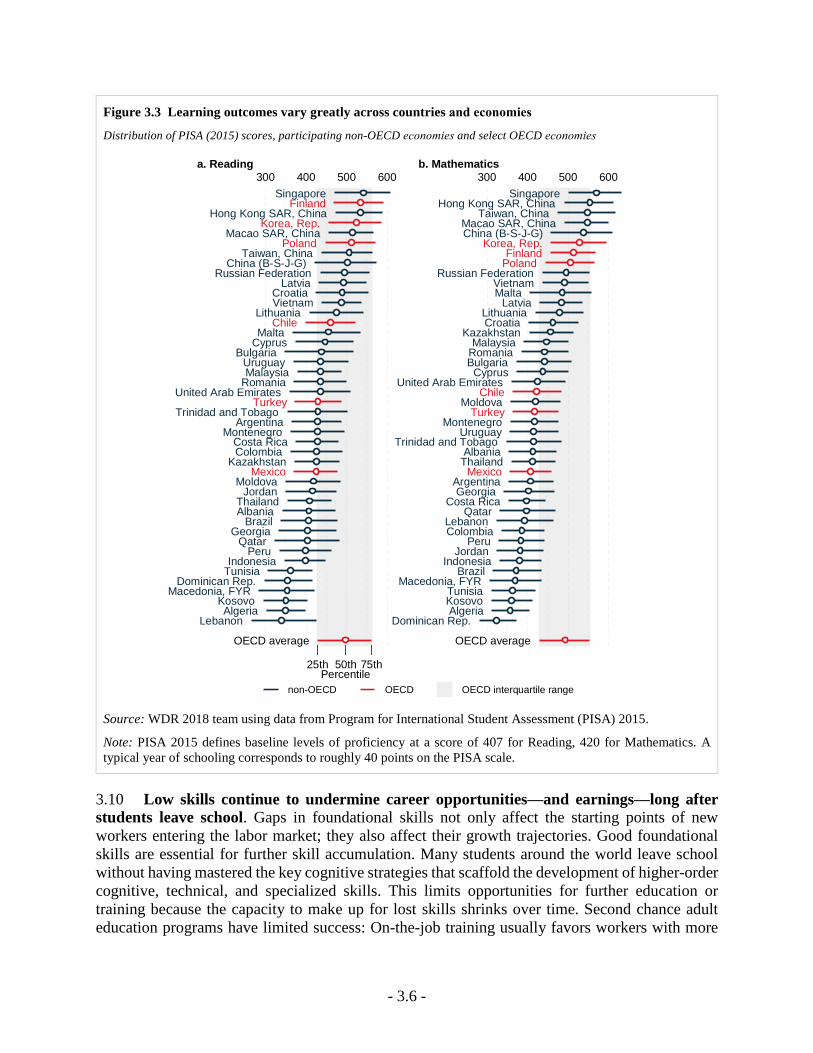
- 3.6 -
Figure 3.3 Learning outcomes vary greatly across countries and economies
Distribution of PISA (2015) scores, participating non-OECD economies and select OECD economies
Source: WDR 2018 team using data from Program for International Student Assessment (PISA) 2015.
Note: PISA 2015 defines baseline levels of proficiency at a score of 407 for Reading, 420 for Mathematics. A typical year of schooling corresponds to roughly 40 points on the PISA scale.
3.10 Low skills continue to undermine career opportunities—and earnings—long after students leave school. Gaps in foundational skills not only affect the starting points of new workers entering the labor market; they also affect their growth trajectories. Good foundational skills are essential for further skill accumulation. Many students around the world leave school without having mastered the key cognitive strategies that scaffold the development of higher-order cognitive, technical, and specialized skills. This limits opportunities for further education or training because the capacity to make up for lost skills shrinks over time. Second chance adult education programs have limited success: On-the-job training usually favors workers with more
Albania
Algeria
Argentina
Brazil
Bulgaria
Chile
China (B-S-J-G)
ColombiaCosta Rica
Croatia
Cyprus
Dominican Rep.
Finland
Georgia
Hong Kong SAR, China
Indonesia
Jordan
Kazakhstan
Korea, Rep.
Kosovo
Latvia
Lebanon
Lithuania
Macao SAR, China
Macedonia, FYR
Malaysia
Malta
MexicoMoldova
Montenegro
Peru
Poland
Qatar
Romania
Russian Federation
Singapore
Taiwan, China
Thailand
Trinidad and Tobago
Tunisia
TurkeyUnited Arab Emirates
Uruguay
Vietnam
Percentile25th 50th 75th
OECD average
300 400 500 600a. Reading
Albania
Algeria
Argentina
Brazil
Bulgaria
Chile
China (B-S-J-G)
Colombia
Costa Rica
Croatia
Cyprus
Dominican Rep.
Finland
Georgia
Hong Kong SAR, China
IndonesiaJordan
Kazakhstan
Korea, Rep.
Kosovo
Latvia
Lebanon
Lithuania
Macao SAR, China
Macedonia, FYR
Malaysia
Malta
Mexico
Moldova
Montenegro
Peru
Poland
Qatar
Romania
Russian Federation
Singapore
Taiwan, China
Thailand
Trinidad and Tobago
Tunisia
Turkey
United Arab Emirates
Uruguay
Vietnam
OECD average
300 400 500 600b. Mathematics
non-OECD OECD OECD interquartile range
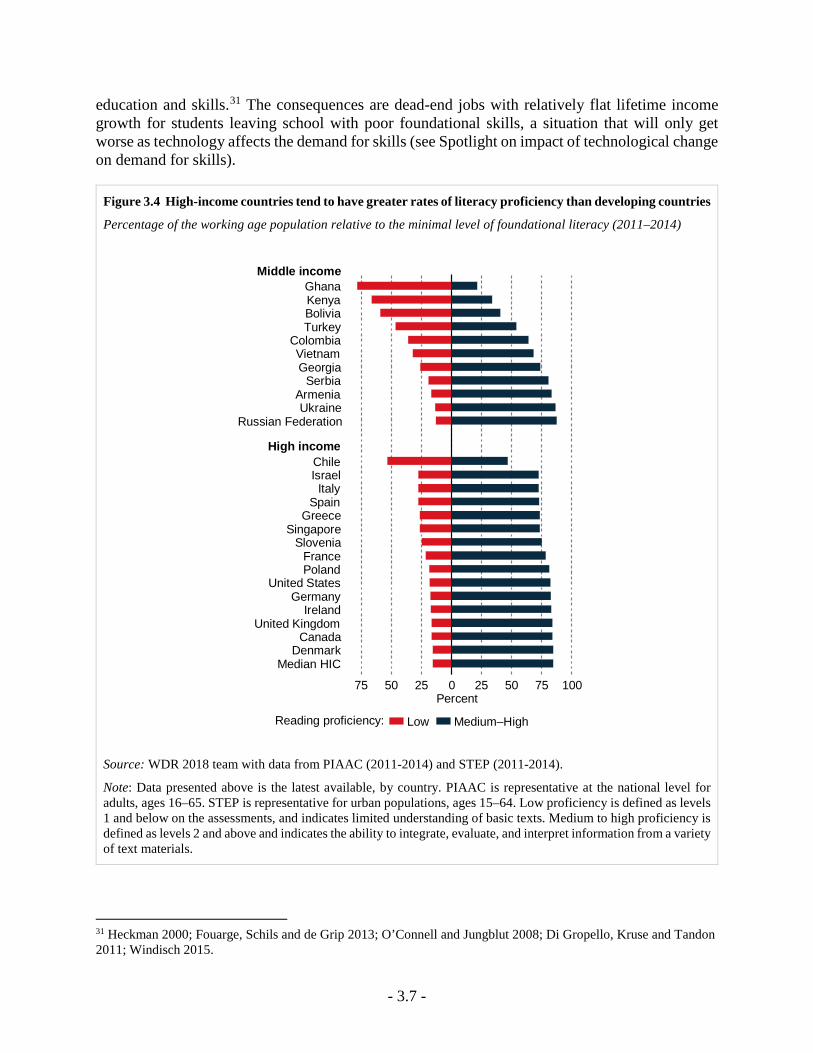
- 3.7 -
education and skills.31 The consequences are dead-end jobs with relatively flat lifetime income growth for students leaving school with poor foundational skills, a situation that will only get worse as technology affects the demand for skills (see Spotlight on impact of technological change on demand for skills).
Figure 3.4 High-income countries tend to have greater rates of literacy proficiency than developing countries
Percentage of the working age population relative to the minimal level of foundational literacy (2011–2014)
Source: WDR 2018 team with data from PIAAC (2011-2014) and STEP (2011-2014).
Note: Data presented above is the latest available, by country. PIAAC is representative at the national level for adults, ages 16–65. STEP is representative for urban populations, ages 15–64. Low proficiency is defined as levels 1 and below on the assessments, and indicates limited understanding of basic texts. Medium to high proficiency is defined as levels 2 and above and indicates the ability to integrate, evaluate, and interpret information from a variety of text materials.
31 Heckman 2000; Fouarge, Schils and de Grip 2013; O’Connell and Jungblut 2008; Di Gropello, Kruse and Tandon 2011; Windisch 2015.
75 50 25 0 25 50 75 100
Middle income
High income
Percent
Median HICDenmark
CanadaUnited Kingdom
IrelandGermany
United StatesPolandFrance
SloveniaSingapore
GreeceSpain
ItalyIsraelChile
Russian FederationUkraine
ArmeniaSerbia
GeorgiaVietnam
ColombiaTurkeyBoliviaKenyaGhana
Low Medium–HighReading proficiency:
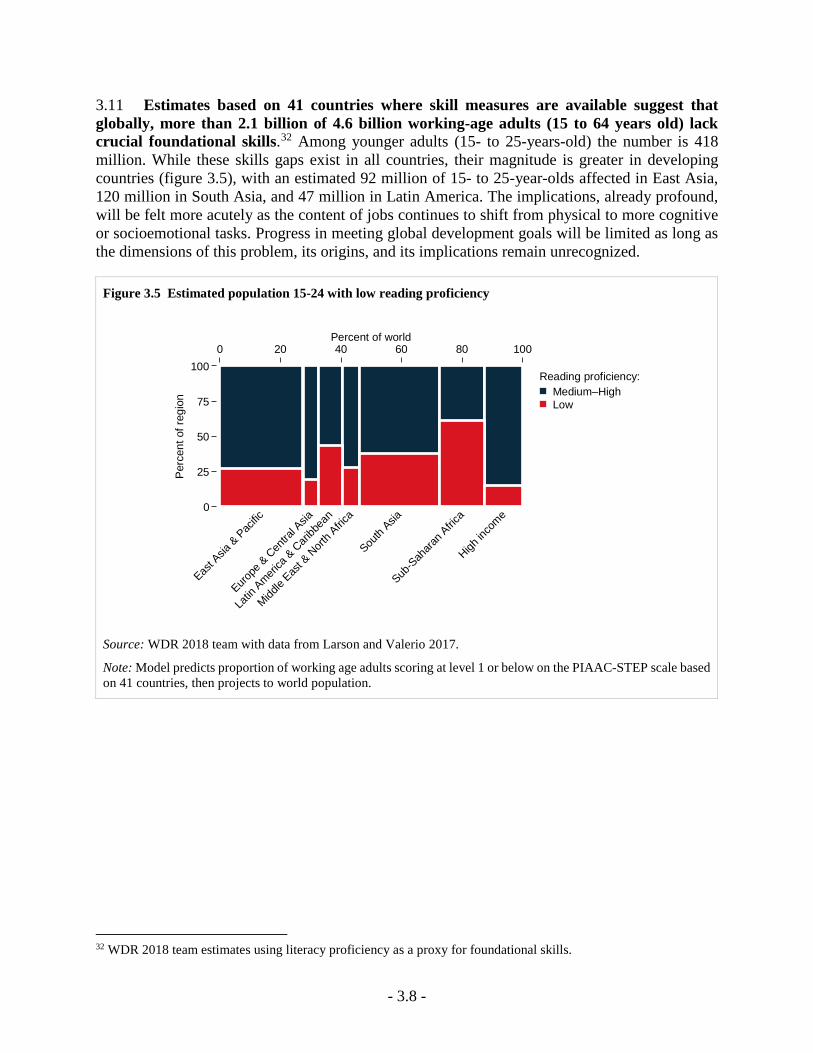
- 3.8 -
3.11 Estimates based on 41 countries where skill measures are available suggest that globally, more than 2.1 billion of 4.6 billion working-age adults (15 to 64 years old) lack crucial foundational skills.32 Among younger adults (15- to 25-years-old) the number is 418 million. While these skills gaps exist in all countries, their magnitude is greater in developing countries (figure 3.5), with an estimated 92 million of 15- to 25-year-olds affected in East Asia, 120 million in South Asia, and 47 million in Latin America. The implications, already profound, will be felt more acutely as the content of jobs continues to shift from physical to more cognitive or socioemotional tasks. Progress in meeting global development goals will be limited as long as the dimensions of this problem, its origins, and its implications remain unrecognized.
Figure 3.5 Estimated population 15-24 with low reading proficiency
Source: WDR 2018 team with data from Larson and Valerio 2017.
Note: Model predicts proportion of working age adults scoring at level 1 or below on the PIAAC-STEP scale based on 41 countries, then projects to world population.
32 WDR 2018 team estimates using literacy proficiency as a proxy for foundational skills.
0
25
50
75
100
Perc
ent o
f reg
ion
0 20 40 60 80 100Percent of world
East A
sia & Pac
ific
Europe
& Cen
tral A
sia
Latin
America
& Cari
bbea
n
Midd
le Eas
t & N
orth A
frica
South
Asia
Sub-S
ahara
n Afric
a
High
inco
me
Medium–High Low
Reading proficiency:
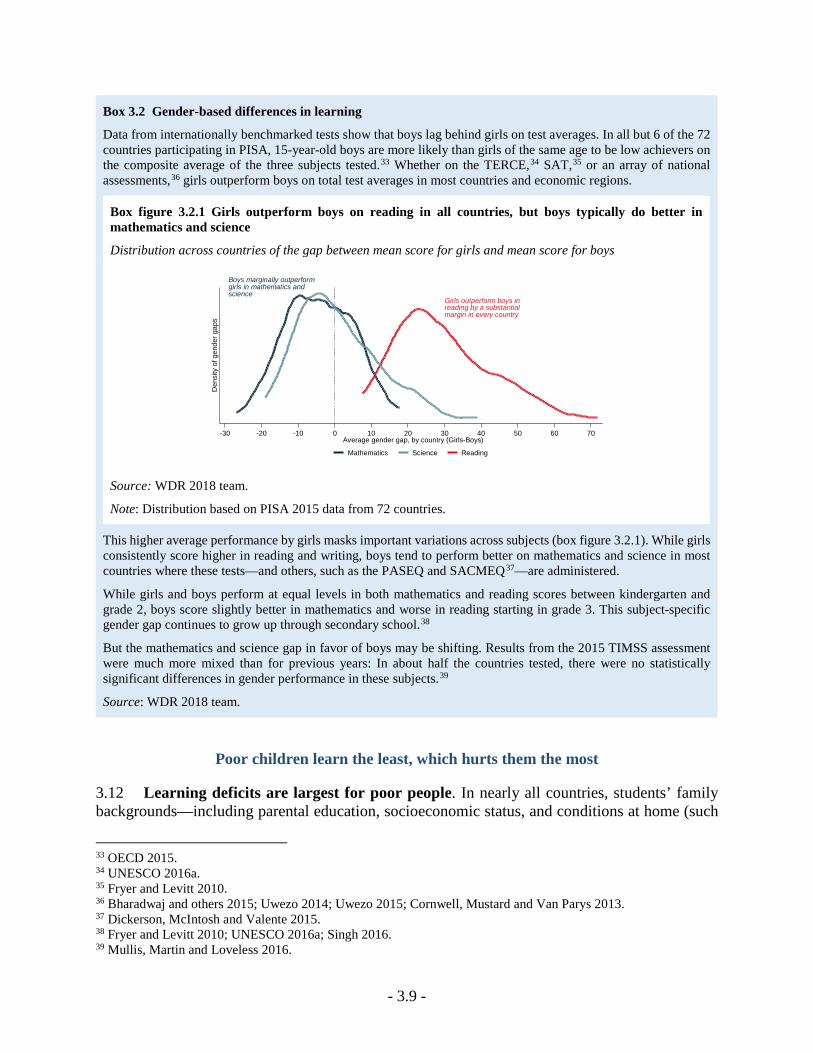
- 3.9 -
Box 3.2 Gender-based differences in learning
Data from internationally benchmarked tests show that boys lag behind girls on test averages. In all but 6 of the 72 countries participating in PISA, 15-year-old boys are more likely than girls of the same age to be low achievers on the composite average of the three subjects tested.33 Whether on the TERCE,34 SAT,35 or an array of national assessments,36 girls outperform boys on total test averages in most countries and economic regions.
Box figure 3.2.1 Girls outperform boys on reading in all countries, but boys typically do better in mathematics and science
Distribution across countries of the gap between mean score for girls and mean score for boys
Source: WDR 2018 team.
Note: Distribution based on PISA 2015 data from 72 countries.
This higher average performance by girls masks important variations across subjects (box figure 3.2.1). While girls consistently score higher in reading and writing, boys tend to perform better on mathematics and science in most countries where these tests—and others, such as the PASEQ and SACMEQ37—are administered.
While girls and boys perform at equal levels in both mathematics and reading scores between kindergarten and grade 2, boys score slightly better in mathematics and worse in reading starting in grade 3. This subject-specific gender gap continues to grow up through secondary school.38
But the mathematics and science gap in favor of boys may be shifting. Results from the 2015 TIMSS assessment were much more mixed than for previous years: In about half the countries tested, there were no statistically significant differences in gender performance in these subjects.39
Source: WDR 2018 team.
Poor children learn the least, which hurts them the most
3.12 Learning deficits are largest for poor people. In nearly all countries, students’ family backgrounds—including parental education, socioeconomic status, and conditions at home (such
33 OECD 2015. 34 UNESCO 2016a. 35 Fryer and Levitt 2010. 36 Bharadwaj and others 2015; Uwezo 2014; Uwezo 2015; Cornwell, Mustard and Van Parys 2013. 37 Dickerson, McIntosh and Valente 2015. 38 Fryer and Levitt 2010; UNESCO 2016a; Singh 2016. 39 Mullis, Martin and Loveless 2016.
Boys marginally outperformgirls in mathematics andscience
Girls outperform boys inreading by a substantialmargin in every country
Den
sity
of g
ende
r gap
s
-30 -20 -10 0 10 20 30 40 50 60 70Average gender gap, by country (Girls-Boys)
Mathematics Science Reading
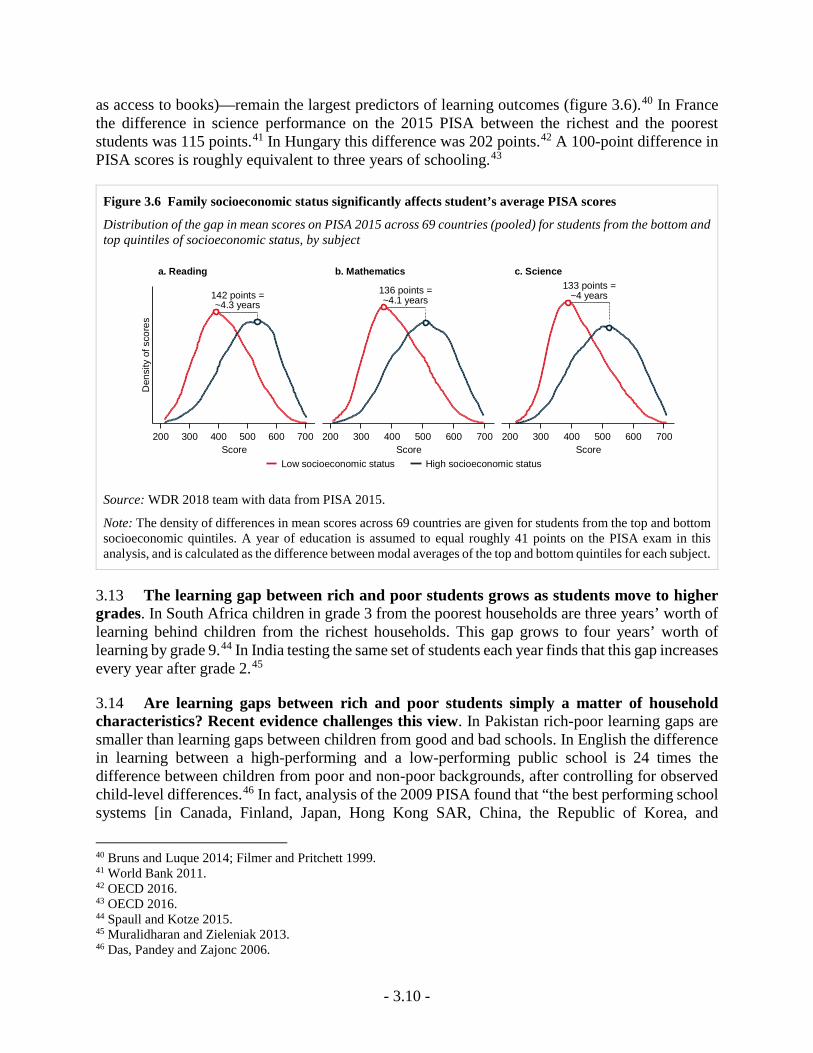
- 3.10 -
as access to books)—remain the largest predictors of learning outcomes (figure 3.6).40 In France the difference in science performance on the 2015 PISA between the richest and the poorest students was 115 points.41 In Hungary this difference was 202 points.42 A 100-point difference in PISA scores is roughly equivalent to three years of schooling.43
Figure 3.6 Family socioeconomic status significantly affects student’s average PISA scores
Distribution of the gap in mean scores on PISA 2015 across 69 countries (pooled) for students from the bottom and top quintiles of socioeconomic status, by subject
Source: WDR 2018 team with data from PISA 2015.
Note: The density of differences in mean scores across 69 countries are given for students from the top and bottom socioeconomic quintiles. A year of education is assumed to equal roughly 41 points on the PISA exam in this analysis, and is calculated as the difference between modal averages of the top and bottom quintiles for each subject.
3.13 The learning gap between rich and poor students grows as students move to higher grades. In South Africa children in grade 3 from the poorest households are three years’ worth of learning behind children from the richest households. This gap grows to four years’ worth of learning by grade 9.44 In India testing the same set of students each year finds that this gap increases every year after grade 2.45
3.14 Are learning gaps between rich and poor students simply a matter of household characteristics? Recent evidence challenges this view. In Pakistan rich-poor learning gaps are smaller than learning gaps between children from good and bad schools. In English the difference in learning between a high-performing and a low-performing public school is 24 times the difference between children from poor and non-poor backgrounds, after controlling for observed child-level differences.46 In fact, analysis of the 2009 PISA found that “the best performing school systems [in Canada, Finland, Japan, Hong Kong SAR, China, the Republic of Korea, and
40 Bruns and Luque 2014; Filmer and Pritchett 1999. 41 World Bank 2011. 42 OECD 2016. 43 OECD 2016. 44 Spaull and Kotze 2015. 45 Muralidharan and Zieleniak 2013. 46 Das, Pandey and Zajonc 2006.
142 points =~4.3 years
Den
sity
of s
core
s
200 300 400 500 600 700Score
a. Reading
136 points =~4.1 years
200 300 400 500 600 700Score
b. Mathematics133 points =
~4 years
200 300 400 500 600 700Score
c. Science
Low socioeconomic status High socioeconomic status
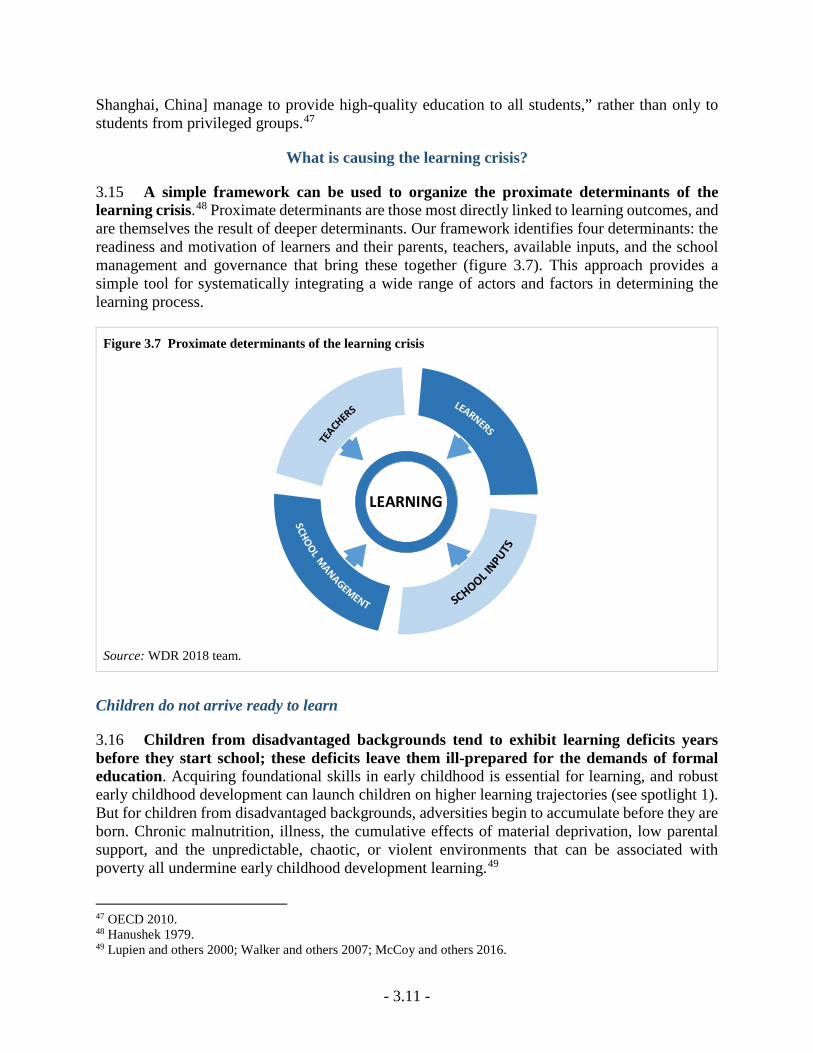
- 3.11 -
Shanghai, China] manage to provide high-quality education to all students,” rather than only to students from privileged groups.47
What is causing the learning crisis?
3.15 A simple framework can be used to organize the proximate determinants of the learning crisis.48 Proximate determinants are those most directly linked to learning outcomes, and are themselves the result of deeper determinants. Our framework identifies four determinants: the readiness and motivation of learners and their parents, teachers, available inputs, and the school management and governance that bring these together (figure 3.7). This approach provides a simple tool for systematically integrating a wide range of actors and factors in determining the learning process.
Figure 3.7 Proximate determinants of the learning crisis
Source: WDR 2018 team.
Children do not arrive ready to learn
3.16 Children from disadvantaged backgrounds tend to exhibit learning deficits years before they start school; these deficits leave them ill-prepared for the demands of formal education. Acquiring foundational skills in early childhood is essential for learning, and robust early childhood development can launch children on higher learning trajectories (see spotlight 1). But for children from disadvantaged backgrounds, adversities begin to accumulate before they are born. Chronic malnutrition, illness, the cumulative effects of material deprivation, low parental support, and the unpredictable, chaotic, or violent environments that can be associated with poverty all undermine early childhood development learning.49
47 OECD 2010. 48 Hanushek 1979. 49 Lupien and others 2000; Walker and others 2007; McCoy and others 2016.
LEARNING
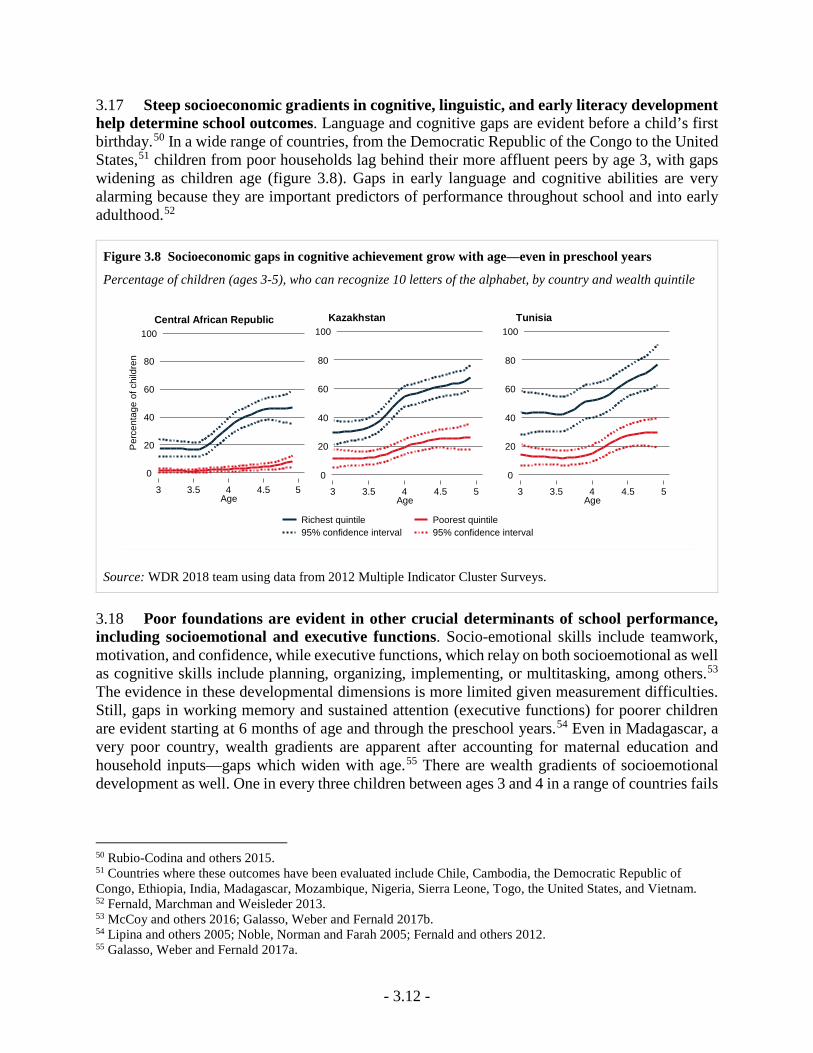
- 3.12 -
3.17 Steep socioeconomic gradients in cognitive, linguistic, and early literacy development help determine school outcomes. Language and cognitive gaps are evident before a child’s first birthday.50 In a wide range of countries, from the Democratic Republic of the Congo to the United States,51 children from poor households lag behind their more affluent peers by age 3, with gaps widening as children age (figure 3.8). Gaps in early language and cognitive abilities are very alarming because they are important predictors of performance throughout school and into early adulthood.52
Figure 3.8 Socioeconomic gaps in cognitive achievement grow with age—even in preschool years
Percentage of children (ages 3-5), who can recognize 10 letters of the alphabet, by country and wealth quintile
Source: WDR 2018 team using data from 2012 Multiple Indicator Cluster Surveys.
3.18 Poor foundations are evident in other crucial determinants of school performance, including socioemotional and executive functions. Socio-emotional skills include teamwork, motivation, and confidence, while executive functions, which relay on both socioemotional as well as cognitive skills include planning, organizing, implementing, or multitasking, among others.53 The evidence in these developmental dimensions is more limited given measurement difficulties. Still, gaps in working memory and sustained attention (executive functions) for poorer children are evident starting at 6 months of age and through the preschool years.54 Even in Madagascar, a very poor country, wealth gradients are apparent after accounting for maternal education and household inputs—gaps which widen with age.55 There are wealth gradients of socioemotional development as well. One in every three children between ages 3 and 4 in a range of countries fails
50 Rubio-Codina and others 2015. 51 Countries where these outcomes have been evaluated include Chile, Cambodia, the Democratic Republic of Congo, Ethiopia, India, Madagascar, Mozambique, Nigeria, Sierra Leone, Togo, the United States, and Vietnam. 52 Fernald, Marchman and Weisleder 2013. 53 McCoy and others 2016; Galasso, Weber and Fernald 2017b. 54 Lipina and others 2005; Noble, Norman and Farah 2005; Fernald and others 2012. 55 Galasso, Weber and Fernald 2017a.
0
20
40
60
80
100
Per
cent
age
of c
hild
ren
3 3.5 4 4.5 5Age
Central African Republic
0
20
40
60
80
100
3 3.5 4 4.5 5Age
Kazakhstan
0
20
40
60
80
100
3 3.5 4 4.5 5Age
Tunisia
Richest quintile Poorest quintile95% confidence interval 95% confidence interval
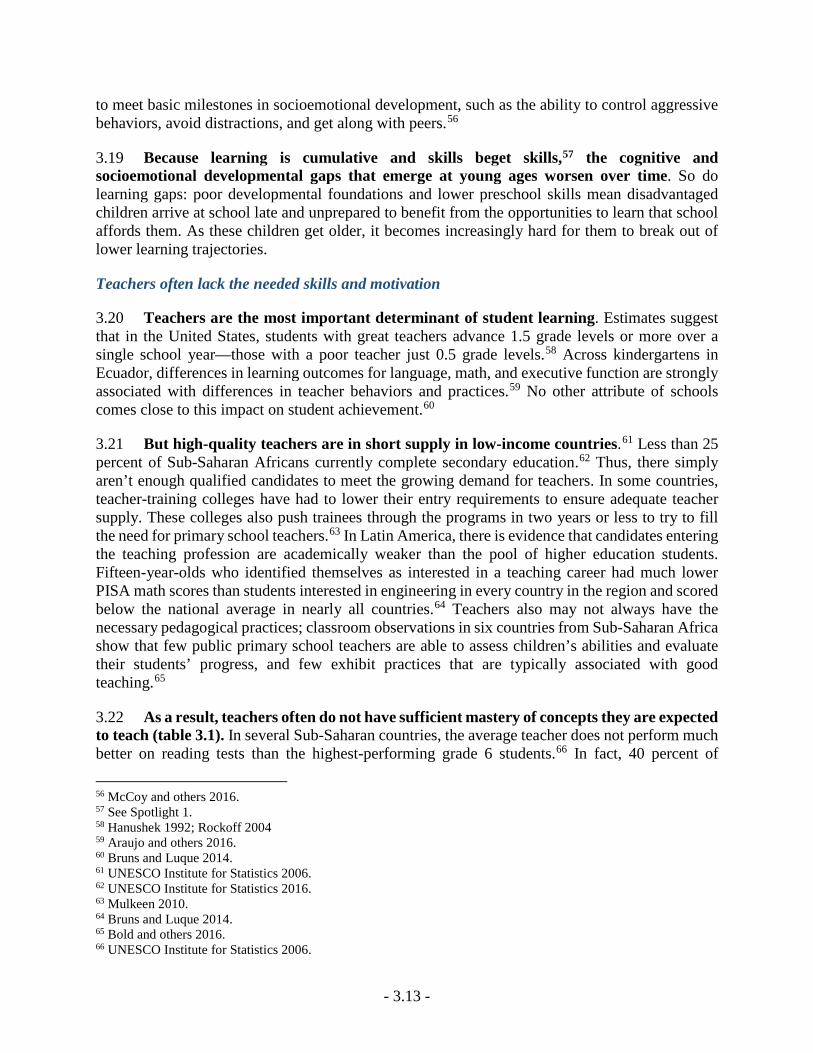
- 3.13 -
to meet basic milestones in socioemotional development, such as the ability to control aggressive behaviors, avoid distractions, and get along with peers.56
3.19 Because learning is cumulative and skills beget skills,57 the cognitive and socioemotional developmental gaps that emerge at young ages worsen over time. So do learning gaps: poor developmental foundations and lower preschool skills mean disadvantaged children arrive at school late and unprepared to benefit from the opportunities to learn that school affords them. As these children get older, it becomes increasingly hard for them to break out of lower learning trajectories.
Teachers often lack the needed skills and motivation
3.20 Teachers are the most important determinant of student learning. Estimates suggest that in the United States, students with great teachers advance 1.5 grade levels or more over a single school year—those with a poor teacher just 0.5 grade levels.58 Across kindergartens in Ecuador, differences in learning outcomes for language, math, and executive function are strongly associated with differences in teacher behaviors and practices.59 No other attribute of schools comes close to this impact on student achievement.60
3.21 But high-quality teachers are in short supply in low-income countries.61 Less than 25 percent of Sub-Saharan Africans currently complete secondary education.62 Thus, there simply aren’t enough qualified candidates to meet the growing demand for teachers. In some countries, teacher-training colleges have had to lower their entry requirements to ensure adequate teacher supply. These colleges also push trainees through the programs in two years or less to try to fill the need for primary school teachers.63 In Latin America, there is evidence that candidates entering the teaching profession are academically weaker than the pool of higher education students. Fifteen-year-olds who identified themselves as interested in a teaching career had much lower PISA math scores than students interested in engineering in every country in the region and scored below the national average in nearly all countries.64 Teachers also may not always have the necessary pedagogical practices; classroom observations in six countries from Sub-Saharan Africa show that few public primary school teachers are able to assess children’s abilities and evaluate their students’ progress, and few exhibit practices that are typically associated with good teaching.65
3.22 As a result, teachers often do not have sufficient mastery of concepts they are expected to teach (table 3.1). In several Sub-Saharan countries, the average teacher does not perform much better on reading tests than the highest-performing grade 6 students.66 In fact, 40 percent of 56 McCoy and others 2016. 57 See Spotlight 1. 58 Hanushek 1992; Rockoff 2004 59 Araujo and others 2016. 60 Bruns and Luque 2014. 61 UNESCO Institute for Statistics 2006. 62 UNESCO Institute for Statistics 2016. 63 Mulkeen 2010. 64 Bruns and Luque 2014. 65 Bold and others 2016. 66 UNESCO Institute for Statistics 2006.
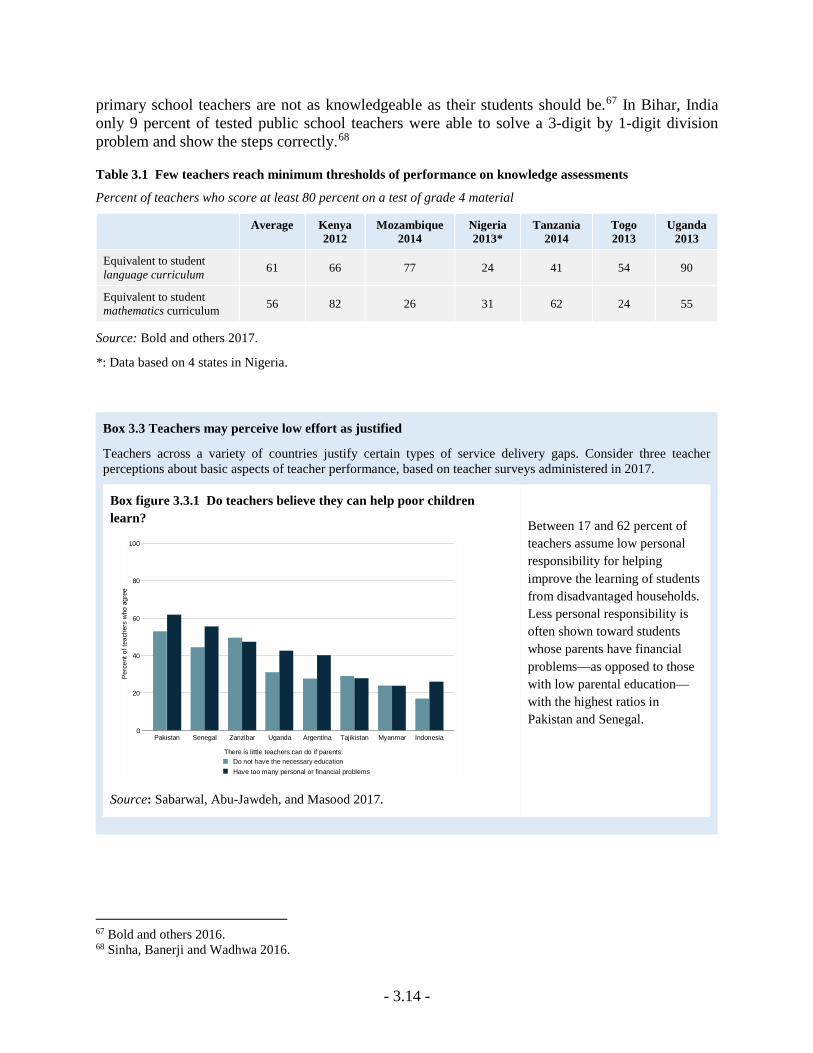
- 3.14 -
primary school teachers are not as knowledgeable as their students should be.67 In Bihar, India only 9 percent of tested public school teachers were able to solve a 3-digit by 1-digit division problem and show the steps correctly.68
Table 3.1 Few teachers reach minimum thresholds of performance on knowledge assessments
Percent of teachers who score at least 80 percent on a test of grade 4 material
Average Kenya 2012
Mozambique 2014
Nigeria 2013*
Tanzania 2014
Togo 2013
Uganda 2013
Equivalent to student language curriculum 61 66 77 24 41 54 90
Equivalent to student mathematics curriculum 56 82 26 31 62 24 55
Source: Bold and others 2017.
*: Data based on 4 states in Nigeria.
Box 3.3 Teachers may perceive low effort as justified
Teachers across a variety of countries justify certain types of service delivery gaps. Consider three teacher perceptions about basic aspects of teacher performance, based on teacher surveys administered in 2017.
Box figure 3.3.1 Do teachers believe they can help poor children learn?
Source: Sabarwal, Abu-Jawdeh, and Masood 2017.
Between 17 and 62 percent of teachers assume low personal responsibility for helping improve the learning of students from disadvantaged households. Less personal responsibility is often shown toward students whose parents have financial problems—as opposed to those with low parental education—with the highest ratios in Pakistan and Senegal.
67 Bold and others 2016. 68 Sinha, Banerji and Wadhwa 2016.
0
20
40
60
80
100
Perc
ent o
f tea
cher
s w
ho a
gree
Pakistan Senegal Zanzibar Uganda Argentina Tajikistan Myanmar Indonesia
Do not have the necessary educationHave too many personal or financial problems
There is little teachers can do if parents:
- 3.15 -
Box figure 3.3.2 Do teachers believe children who lag behind deserve additional effort?
Source: Sabarwal, Abu-Jawdeh, and Masood 2017.
Except in Argentina teachers consider well-performing students more deserving of attention than students who lag behind. This difference is especially pronounced in Tajikistan.
Box figure 3.3.3 Do teachers believe that their absence is acceptable?
Source: Sabarwal, Abu-Jawdeh, and Masood 2017.
In all the countries but Myanmar and Pakistan, large shares of teachers consider their absenteeism acceptable in certain cases. Aside from Argentina and Indonesia, teachers perceive absenteeism as most acceptable if it is for a community task.
Note: Responses are not mutually exclusive. Data are from public schools, except for Senegal (private and public schools) and Uganda (private schools).
3.23 Many developing countries suffer significant losses of instructional time (figure 3.9). Unannounced visits to primary schools in six countries found that in public schools, on average, about one teacher in five was absent on a typical school day.69 Even when teachers are present in school, they might not be teaching. In seven Sub-Saharan countries students receive only about 69 Chaudhury and others 2006.
0
20
40
60
80
100
Perc
ent o
f tea
cher
s w
ho a
gree
Indonesia Myanmar Argentina Uganda Tajikistan Zanzibar Senegal Pakistan
Are lagging behind in classAre performing well in class
Students deserve more attention if they:
0
20
40
60
80
100
Perc
ent o
f tea
cher
s w
ho a
gree
Argentina Tajikistan Senegal Zanzibar Uganda Indonesia Pakistan Myanmar
Complete the assigned curriculumLeave students with work to doDo something useful for the community
It is acceptable for teachers to be absent if they:
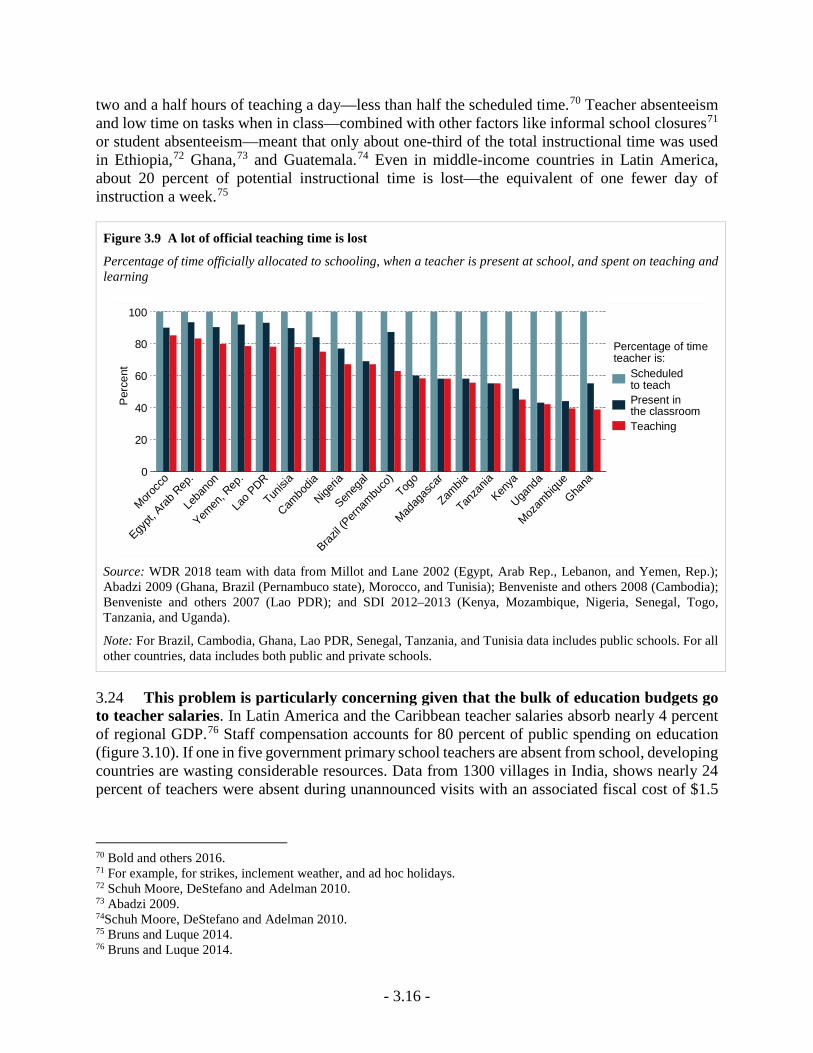
- 3.16 -
two and a half hours of teaching a day—less than half the scheduled time.70 Teacher absenteeism and low time on tasks when in class—combined with other factors like informal school closures71 or student absenteeism—meant that only about one-third of the total instructional time was used in Ethiopia,72 Ghana,73 and Guatemala.74 Even in middle-income countries in Latin America, about 20 percent of potential instructional time is lost—the equivalent of one fewer day of instruction a week.75
Figure 3.9 A lot of official teaching time is lost
Percentage of time officially allocated to schooling, when a teacher is present at school, and spent on teaching and learning
Source: WDR 2018 team with data from Millot and Lane 2002 (Egypt, Arab Rep., Lebanon, and Yemen, Rep.); Abadzi 2009 (Ghana, Brazil (Pernambuco state), Morocco, and Tunisia); Benveniste and others 2008 (Cambodia); Benveniste and others 2007 (Lao PDR); and SDI 2012–2013 (Kenya, Mozambique, Nigeria, Senegal, Togo, Tanzania, and Uganda).
Note: For Brazil, Cambodia, Ghana, Lao PDR, Senegal, Tanzania, and Tunisia data includes public schools. For all other countries, data includes both public and private schools.
3.24 This problem is particularly concerning given that the bulk of education budgets go to teacher salaries. In Latin America and the Caribbean teacher salaries absorb nearly 4 percent of regional GDP.76 Staff compensation accounts for 80 percent of public spending on education (figure 3.10). If one in five government primary school teachers are absent from school, developing countries are wasting considerable resources. Data from 1300 villages in India, shows nearly 24 percent of teachers were absent during unannounced visits with an associated fiscal cost of $1.5
70 Bold and others 2016. 71 For example, for strikes, inclement weather, and ad hoc holidays. 72 Schuh Moore, DeStefano and Adelman 2010. 73 Abadzi 2009. 74Schuh Moore, DeStefano and Adelman 2010. 75 Bruns and Luque 2014. 76 Bruns and Luque 2014.
0
20
40
60
80
100
Per
cent
Morocc
o
Egypt,
Arab R
ep.
Leba
non
Yemen
, Rep
.
Lao P
DR
Tunisia
Cambo
dia
Nigeria
Seneg
al
Brazil (
Pernam
buco
)Tog
o
Madag
asca
r
Zambia
Tanza
niaKen
ya
Ugand
a
Mozam
bique
Ghana
Scheduledto teachPresent inthe classroomTeaching
Percentage of timeteacher is:
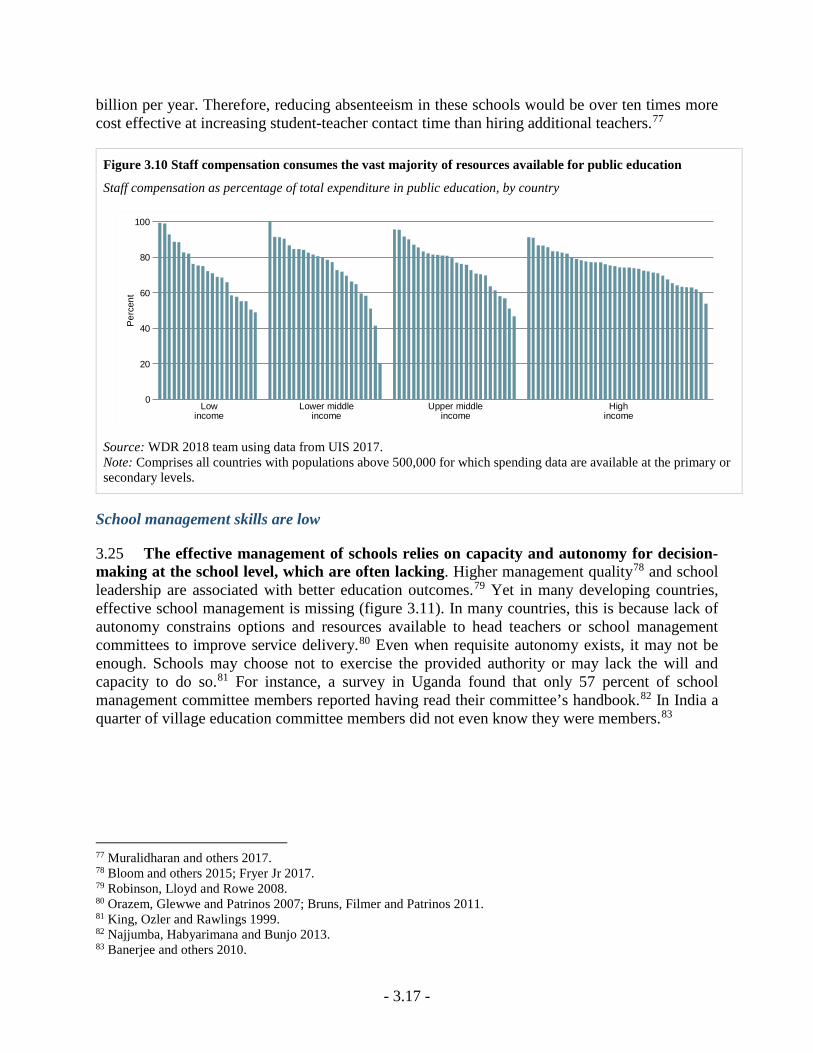
- 3.17 -
billion per year. Therefore, reducing absenteeism in these schools would be over ten times more cost effective at increasing student-teacher contact time than hiring additional teachers.77
Figure 3.10 Staff compensation consumes the vast majority of resources available for public education
Staff compensation as percentage of total expenditure in public education, by country
Source: WDR 2018 team using data from UIS 2017. Note: Comprises all countries with populations above 500,000 for which spending data are available at the primary or secondary levels.
School management skills are low
3.25 The effective management of schools relies on capacity and autonomy for decision-making at the school level, which are often lacking. Higher management quality78 and school leadership are associated with better education outcomes.79 Yet in many developing countries, effective school management is missing (figure 3.11). In many countries, this is because lack of autonomy constrains options and resources available to head teachers or school management committees to improve service delivery.80 Even when requisite autonomy exists, it may not be enough. Schools may choose not to exercise the provided authority or may lack the will and capacity to do so.81 For instance, a survey in Uganda found that only 57 percent of school management committee members reported having read their committee’s handbook.82 In India a quarter of village education committee members did not even know they were members.83
77 Muralidharan and others 2017. 78 Bloom and others 2015; Fryer Jr 2017. 79 Robinson, Lloyd and Rowe 2008. 80 Orazem, Glewwe and Patrinos 2007; Bruns, Filmer and Patrinos 2011. 81 King, Ozler and Rawlings 1999. 82 Najjumba, Habyarimana and Bunjo 2013. 83 Banerjee and others 2010.
Low income
Lower middle income
Upper middle income
High income
0
20
40
60
80
100
Perc
ent
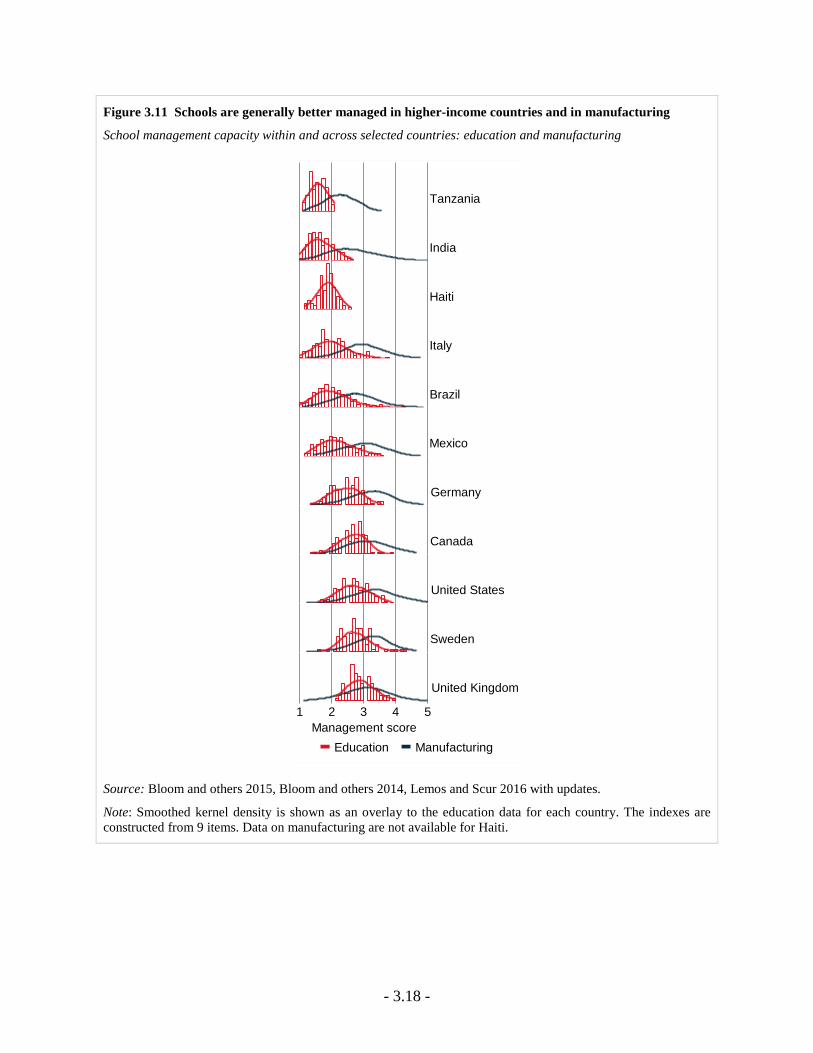
- 3.18 -
Figure 3.11 Schools are generally better managed in higher-income countries and in manufacturing
School management capacity within and across selected countries: education and manufacturing
Source: Bloom and others 2015, Bloom and others 2014, Lemos and Scur 2016 with updates.
Note: Smoothed kernel density is shown as an overlay to the education data for each country. The indexes are constructed from 9 items. Data on manufacturing are not available for Haiti.
Tanzania
India
Haiti
Italy
Brazil
Mexico
Germany
Canada
United States
Sweden
United Kingdom
1 2 3 4 5Management score
Education Manufacturing
- 3.19 -
School inputs have not kept pace
3.26 In many developing countries, the expansion of inputs has not kept pace with the explosion in enrollments. Governments have built classrooms and recruited teachers at unprecedented levels. However, in some contexts these efforts may have fallen short of enrollment increases, leading to a decline in per-capita input availability. In Malawi, between 2008 and 2015, as the gross enrollment rate in primary schools has increased from 131 to 146 percent,84 the average number of students per class has increased from 85 to 126.85 Uganda introduced Universal Primary Education in 1997: the 68 percent increase in primary school enrollment that followed increased the student to teacher ratio from 38:1 in 1996 to 80:1 in 1997 and the student to classroom ratio from 68:1 in 1996 to 105:1 in 1997.86
* * *
3.27 The learning crisis is real, but too often education systems operate as if it isn’t. Many policymakers do not realize how low learning levels are. Others do not acknowledge them or simply equate low learning with low resources. Still, there are reasons for optimism. Learning is increasingly in the spotlight. First, learning metrics are generating irrefutable evidence thereby creating pressure for action (see chapter 4).87 Second, new promising insights on how to address the learning crisis are becoming available. These are discussed in parts 3 and 4 of this Report.
84 Gross enrollment includes students whose age exceeds the official age group for a particular education level, hence the rate may exceed 100 percent. 85 Ministry of Education 2015; Ministry of Education 2008; World Bank 2016. 86 Kattan 2006. 87 The World Bank’s 2020 sector strategy and DFID’s 2010 strategy are learning for all, USAID’s strategy is opportunity through learning, and AusAid is also adopting learning goals.
- 3.20 -
References
Abadzi, Helen. 2009. "Instructional Time Loss in Developing Countries: Concepts, Measurement, and Implications." World Bank Research Observer 24(2): 267-90.
Araujo, M Caridad, Pedro Carneiro, Yyannú Cruz-Aguayo, and Norbert Schady. 2016. "Teacher Quality and Learning Outcomes in Kindergarten." The Quarterly Journal of Economics 131(3): 1415-53.
ASER. 2013. "Annual Status of Education Report (Rural)." New Delhi: ASER Centre.
Banerjee, Abhijit, and Esther Duflo. 2012. Poor Economics: A Radical Rethinking of the Way to Fight Global Poverty. New York: PublicAffairs.
Banerjee, Abhijit V, Rukmini Banerji, Esther Duflo, Rachel Glennerster, and Stuti Khemani. 2010. "Pitfalls of Participatory Programs: Evidence from a Randomized Evaluation in Education in India." American Economic Journal: Economic Policy 2(1): 1-30.
Beatty, Amanda, and Lant Pritchett. 2012. "From Schooling Goals to Learning Goals." Washington DC: Center for Global Development.
Bharadwaj, Prashant, Giacomo De Giorgi, David R Hansen, and Christopher Neilson. 2015. "The Gender Gap in Mathematics: Evidence from a Middle-Income Country." FRB of New York Working Paper No. FEDNSR721.
Bloom, Nicholas, Renata Lemos, Raffaella Sadun, Daniela Scur, and John Reenen. 2014. "Jeea‐Fbbva Lecture 2013: The New Empirical Economics of Management." Journal of the European Economic Association 12(4): 835-76.
Bloom, Nicholas, Renata Lemos, Raffaella Sadun, and John Van Reenen. 2015. "Does Management Matter in Schools?" The Economic Journal 125(584): 647-74.
Bold, T., D. Filmer, G. Martin, E. Molina, B. Stacy, C. Rockmore, J. Svensson, and W. Wane. 2016. "Getting inside the Black-Box of Schooling: What Do Teachers Know and Do? A Report Card from African Primary Schools." Working Paper, The World Bank.
Bruns, Barbara, Deon Filmer, and Harry Anthony Patrinos. 2011. Making Schools Work: New Evidence on Accountability Reforms. World Bank Publications.
Bruns, Barbara, and Javier Luque. 2014. Great Teachers: How to Raise Student Learning in Latin America and the Caribbean. World Bank Publications.
Chaudhury, Nazmul, Jeffrey Hammer, Michael Kremer, Karthik Muralidharan, and F Halsey Rogers. 2006.
"Missing in Action: Teacher and Health Worker Absence in Developing Countries." Journal of Economic Perspectives 20(1): 91-116.
Cornwell, Christopher, David B Mustard, and Jessica Van Parys. 2013. "Noncognitive Skills and the Gender Disparities in Test Scores and Teacher Assessments: Evidence from Primary School." Journal of Human Resources 48(1): 236-64.
Crouch, Luis. 2006. "Education Sector: Standards, Accountability, and Support." In A New Social Contract for Peru: An Agenda for Improving Education, Health Care, and the Social Safety Net, edited by Daniel Cotlear, 71-106. Washington DC: World Bank.
Dang, Hai-Anh H., and Paul W. Glewwe. 2017. "Well Begun, but Aiming Higher: A Review of Vietnam’s Education Trends in the Past 20 Years and Emerging Challenges." World Bank Background Paper. World Bank.
Das, Jishnu, Priyanka Pandey, and Tristan Zajonc. 2006. "Learning Levels and Gaps in Pakistan." World Bank Policy Research Working Paper (4067).
Desjardins, Richard, and Kjell Rubenson. 2011. "An Analysis of Skill Mismatch Using Direct Measures of Skills." OECD Education Working Papers. OECD Publishing.
Di Gropello, Emanuela, Aurelien Kruse, and Prateek Tandon. 2011. Skills for the Labor Market in Indonesia: Trends in Demand, Gaps, and Supply. World Bank Publications.
Dickerson, Andy, Steven McIntosh, and Christine Valente. 2015. "Do the Maths: An Analysis of the Gender Gap in Mathematics in Africa." Economics of Education Review 46: 1-22.
ETS. 2014. "A Guide to Understanding the Literacy Assessment of the Step Skills Measurement Surveys. ." World Bank(Washington, D.C.).
Fernald, Anne, Virginia A Marchman, and Adriana Weisleder. 2013. "Ses Differences in Language Processing Skill and Vocabulary Are Evident at 18 Months." Developmental science 16(2): 234-48.
Fernald, Lia CH, Patricia Kariger, Melissa Hidrobo, and Paul J Gertler. 2012. "Socioeconomic Gradients in Child Development in Very Young Children: Evidence from India, Indonesia, Peru, and Senegal." Proceedings of the National Academy of Sciences 109(Supplement 2): 17273-80.
Filmer, Deon, Amer Hasan, and Lant Pritchett. 2006. "A Millennium Learning Goal: Measuring Real Progress in Education." Center for Global Development Working Paper (97).
- 3.21 -
Filmer, Deon, and Lant Pritchett. 1999. "The Effect of Household Wealth on Educational Attainment: Evidence from 35 Countries." Population and Development Review 25(1): 85-120.
Fleet, Justin W. van. 2012. "Africa’s Education Crisis: In School but Not Learning."
Fouarge, Didier, Trudie Schils, and Andries de Grip. 2013. "Why Do Low-Educated Workers Invest Less in Further Training?" Applied Economics 45(18): 2587-601.
Fryer Jr, Roland G. 2017. "Management and Student Achievement: Evidence from a Randomized Field Experiment." National Bureau of Economic Research.
Fryer, Roland G, and Steven D Levitt. 2010. "An Empirical Analysis of the Gender Gap in Mathematics." American Economic Journal: Applied Economics 2(2): 210-40.
Galasso, Emanuela, Ann Weber, and Lia CH Fernald. 2017a. "Dynamics of Child Development: Analysis of a Longitudinal Cohort in a Very Low Income Country." The World Bank Economic Review.
———. 2017b. "Dynamics of Child Development: Analysis of a Longitudinal Cohort in a Very Low Income Country." The World Bank Economic Review: lhw065.
Glewwe, Paul, Michael Kremer, and Sylvie Moulin. 2009. "Many Children Left Behind? Textbooks and Test Scores in Kenya." American Economic Journal: Applied Economics 1(1): 112-35.
Glick, Peter, and David E Sahn. 2010. "Early Academic Performance, Grade Repetition, and School Attainment in Senegal: A Panel Data Analysis." World Bank Economic Review.
Gove, Amber, and Peter Cvelich. 2011. "Early Reading: Igniting Education for All." A report by the Early Grade Learning Community of Practice. Revised Edition. Research Triangle Park, NC: Research Triangle Institute.
Hanushek, Eric A. 1979. "Conceptual and Empirical Issues in the Estimation of Educational Production Functions." Journal of human Resources: 351-88.
———. 1992. "The Trade-Off between Child Quantity and Quality." Journal of political economy 100(1): 84-117.
Heckman, James J. 2000. "Policies to Foster Human Capital." Research in economics 54(1): 3-56.
Hong, Song-chang, and Ju-ho Lee. 2016. "Accumulating Human Capital for Sustainable Development in Korea." Background Paper for the Education Commission.
Hungi, N. 2010. "What Are the Levels and Trends in Grade Repetition." SACMEQ Policy Issues Series (3).
Kaffenberger, Michelle, and Lant Pritchett. 2017. "More School or More Learning? Evidence from Learning Profiles from the Financial Inclusion Insights Data." World Development Report Background Paper. Washington DC: World Bank.
Kattan, Raja Bentaouet. 2006. "Implementation of Free Basic Education Policy." Education Working Paper Series 7.
King, Elizabeth, Berk Ozler, and Laura Rawlings. 1999. "Nicaragua’s School Autonomy Reform: Fact or Fiction?" World Bank Working Paper Series on Impact Evaluation of Education Reforms 19.
Larson, Bradley, and Alexandria Valerio. 2017. "Estimating the Stock of Skills around the World: A Technical Note."
Lemos, Renata, and Daniela Scur. 2016. "Developing Management: An Expanded Evaluation Tool for Developing Countries." RISE Working Paper 16/007.
Lipina, Sebastián J, María I Martelli, Beatriz Vuelta, and Jorge A Colombo. 2005. "Performance on the a-Not-B Task of Argentinean Infants from Unsatisfied and Satisfied Basic Needs Homes." Interamerican Journal of Psychology 39(1): 49.
Lupien, Sonia J, Suzanne King, Michael J Meaney, and Bruce S McEwen. 2000. "Child’s Stress Hormone Levels Correlate with Mother’s Socioeconomic Status and Depressive State." Biological Psychiatry 48(10): 976-80.
Malpel, Jaques, Oswald Koussihouede, Vanessa Aye Sy, Labass Lamine Diallo, Priscilla Gomes, Moussa Hamani Ounteni, Hilaire Hounkpodote, Antoine Marivin, and Bassile Zavier Tankeu. 2015. "Pasec 2014: Education System Performance in Francophone Sub-Saharan Africa." Dakar: Programme d’Analyse des Systèmes Educatifs de la CONFEMEN.
McCoy, Dana Charles, Evan D Peet, Majid Ezzati, Goodarz Danaei, Maureen M Black, Christopher R Sudfeld, Wafaie Fawzi, and Günther Fink. 2016. "Early Childhood Developmental Status in Low-and Middle-Income Countries: National, Regional, and Global Prevalence Estimates Using Predictive Modeling." PLoS Med 13(6): e1002034.
Ministry of Education, Science and Technology. 2008. "Education Management Information System."
———. 2015. "Education Management Information System."
- 3.22 -
Mulkeen, Aidan. 2010. Teachers in Anglophone Africa: Issues in Teacher Supply, Training, and Management. World Bank Publications.
Mullis, Ina V.S., Michael O. Martin, and Tom Loveless. 2016. "20 Years of Timss International Trends in Mathematics and Science Achievement, Curriculum, and Instruction." Chestnut Hill, MA: TIMSS & PIRLS International Study Center, Lynch School of Education, Boston College and International Association for the Evaluation of Educational Achievement (IEA).
Muralidharan, Karthik, Jishnu Das, Alaka Holla, and Aakash Mohpal. 2017. "The Fiscal Cost of Weak Governance: Evidence from Teacher Absence in India." Journal of Public Economics 145: 116-35.
Muralidharan, Karthik, and Yendrick Zieleniak. 2013. "Measuring Learning Trajectories in Developing Countries with Longitudinal Data and Item Response Theory." UC San Diego.
Najjumba, Innocent Mulindwa, James Habyarimana, and Charles Lwanga Bunjo. 2013. Improving Learning in Uganda, Volume 3: School-Based Management: Policy and Functionality. World Bank Publications.
Noble, Kimberly G, M Frank Norman, and Martha J Farah. 2005. "Neurocognitive Correlates of Socioeconomic Status in Kindergarten Children." Developmental science 8(1): 74-87.
O’Connell, Philip J, and Jean-Marie Jungblut. 2008. "What Do We Know About Training at Work." Skill formation: Interdisciplinary and cross-national perspectives: 109-25.
OECD. 2010. "Pisa 2009 Results: What Students Know and Can Do – Student Performance in Reading, Mathematics and Science." Paris: OECD.
———. 2015. "The Abc of Gender Equality in Education: Aptitude, Behaviour, Confidence." PISA. Paris: OECD Publishing.
———. 2016. "Pisa 2015 Results (Volume 1): Excellence and Equity in Education." Paris: PISA.
———. 2016a. Skills Matter: Further Results from the Survey of Adult Skills. OECD Publishing.
———. 2016b. The Survey of Adult Skills Reader's Companion, Second Edition. OECD Publishing.
Orazem, Peter, Paul Glewwe, and Harry Patrinos. 2007. "The Benefits and Costs of Alternative Strategies to Improve Educational Outcomes." Iowa State University, Department of Economics Working Paper Series (07028).
Pritchett, Lant. 2013. The Rebirth of Education: Schooling Ain't Learning. Washington, DC: Center for Global Development.
Pritchett, Lant, and Justin Sandefur. 2017. "Girls’ Schooling and Women’s Literacy: Schooling Targets Alone Won’t Reach Learning Goals." Washington DC: Center for Global Development.
Robinson, Viviane MJ, Claire A Lloyd, and Kenneth J Rowe. 2008. "The Impact of Leadership on Student Outcomes: An Analysis of the Differential Effects of Leadership Types." Educational administration quarterly.
Rockoff, Jonah E. 2004. "The Impact of Individual Teachers on Student Achievement: Evidence from Panel Data." The American Economic Review 94(2): 247-52.
Rubio-Codina, Marta, Orazio Attanasio, Costas Meghir, Natalia Varela, and Sally Grantham-McGregor. 2015. "The Socioeconomic Gradient of Child Development: Cross-Sectional Evidence from Children 6–42 Months in Bogota." Journal of Human Resources 50(2): 464-83.
Sabarwal, Shwetlena, Malek Abu-Jawdeh, and Eema Masood. 2017. "Understanding Teacher Effort: Insights from Cross-Country Data on Teacher Perceptions." WDR 2018 Background Paper. Washington DC: World Bank.
Schuh Moore, A, J DeStefano, and E Adelman. 2010. "Opportunity to Learn and Early Grade Reading Fluency to Measure School Effectiveness in Ethiopia, Guatemala, Honduras, and Nepal." prepared for USAID/EQUIP2 Project. Washington: US Government Printing Office.
Singh, Abhijeet. 2016. "Starting Together, Growing Apart: Gender Gaps in Learning from Preschool to Adulthood in Four Developing Countries." 2016 APPAM International Conference. Appam.
Sinha, Shabnam, Rukmini Banerji, and Wilima Wadhwa. 2016. "Teacher Performance in Bihar, India: Implications for Education." Washington, DC: World Bank.
Smith, David. 2014. "Nigerian Schoolchildren Defiant in City That Defied Boko Haram." The Guardian.
Spaull, Nicholas, and Janeli Kotze. 2015. "Starting Behind and Staying Behind in South Africa: The Case of Insurmountable Learning Deficits in Mathematics." International Journal of Educational Development 41: 13-24.
Taylor, Stephen, and Nicholas Spaull. 2015. "Measuring Access to Learning over a Period of Increased Access to Schooling: The Case of Southern and Eastern Africa
- 3.23 -
since 2000." International Journal of Educational Development 41: 47-59.
UNESCO. 2014. "Teaching and Learning: Achieving Quality for All." Paris: UNESCO.
———. 2016a. "Gender Inequality in Learning Achievement in Primary Education. What Can Terce Tell Us?" Chile: United Nations Educational, Scientific and Cultural Organization and the Regional Office for Education in Latin America and the Caribbean.
———. 2016b. "Terce: Learning Achievements, 2015." Paris: UNESCO.
UNESCO Institute for Statistics. 2006. "Teachers and Educational Quality: Monitoring Global Needs for 2015." Montreal: UNESCO Institute for Statistics.
———. 2016. "Education." 04/26/2017. http://data.uis.unesco.org/: UNESCO Institute for Statistics UIS.
Uwezo. 2014. "Are Our Children Learning? Literacy and Numeracy in Kenya 2014." Nairobi: Twaweza East Africa.
———. 2015. "Are Our Children Learning? Five Stories on the State of Education in Uganda in 2015 and Beyond." Kampala: Twaweza East Africa.
Walker, Susan P, Theodore D Wachs, Julie Meeks Gardner, Betsy Lozoff, Gail A Wasserman, Ernesto Pollitt, Julie A Carter, and International Child Development Steering Group. 2007. "Child Development: Risk Factors for Adverse Outcomes in Developing Countries." Lancet 369(9556): 145-57.
Windisch, Hendrickje Catriona. 2015. "Adults with Low Literacy and Numeracy Skills."
World Bank. 2011. "Education Strategy 2020: Learning for All." Washington, DC: World Bank.
———. 2016. World Development Indicators 2016. Washington, DC: World Bank.

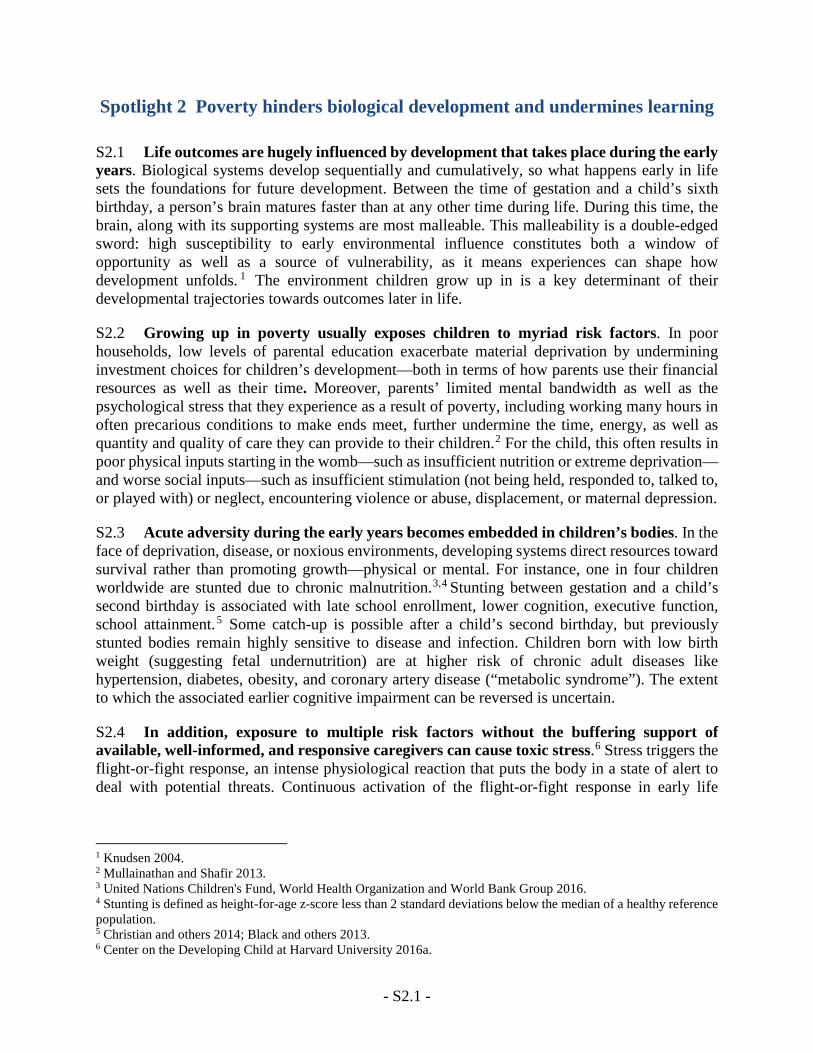
- S2.1 -
Spotlight 2 Poverty hinders biological development and undermines learning
S2.1 Life outcomes are hugely influenced by development that takes place during the early years. Biological systems develop sequentially and cumulatively, so what happens early in life sets the foundations for future development. Between the time of gestation and a child’s sixth birthday, a person’s brain matures faster than at any other time during life. During this time, the brain, along with its supporting systems are most malleable. This malleability is a double-edged sword: high susceptibility to early environmental influence constitutes both a window of opportunity as well as a source of vulnerability, as it means experiences can shape how development unfolds. 1 The environment children grow up in is a key determinant of their developmental trajectories towards outcomes later in life.
S2.2 Growing up in poverty usually exposes children to myriad risk factors. In poor households, low levels of parental education exacerbate material deprivation by undermining investment choices for children’s development—both in terms of how parents use their financial resources as well as their time. Moreover, parents’ limited mental bandwidth as well as the psychological stress that they experience as a result of poverty, including working many hours in often precarious conditions to make ends meet, further undermine the time, energy, as well as quantity and quality of care they can provide to their children.2 For the child, this often results in poor physical inputs starting in the womb—such as insufficient nutrition or extreme deprivation—and worse social inputs—such as insufficient stimulation (not being held, responded to, talked to, or played with) or neglect, encountering violence or abuse, displacement, or maternal depression.
S2.3 Acute adversity during the early years becomes embedded in children’s bodies. In the face of deprivation, disease, or noxious environments, developing systems direct resources toward survival rather than promoting growth—physical or mental. For instance, one in four children worldwide are stunted due to chronic malnutrition.3,4 Stunting between gestation and a child’s second birthday is associated with late school enrollment, lower cognition, executive function, school attainment.5 Some catch-up is possible after a child’s second birthday, but previously stunted bodies remain highly sensitive to disease and infection. Children born with low birth weight (suggesting fetal undernutrition) are at higher risk of chronic adult diseases like hypertension, diabetes, obesity, and coronary artery disease (“metabolic syndrome”). The extent to which the associated earlier cognitive impairment can be reversed is uncertain.
S2.4 In addition, exposure to multiple risk factors without the buffering support of available, well-informed, and responsive caregivers can cause toxic stress.6 Stress triggers the flight-or-fight response, an intense physiological reaction that puts the body in a state of alert to deal with potential threats. Continuous activation of the flight-or-fight response in early life
1 Knudsen 2004. 2 Mullainathan and Shafir 2013. 3 United Nations Children's Fund, World Health Organization and World Bank Group 2016. 4 Stunting is defined as height-for-age z-score less than 2 standard deviations below the median of a healthy reference population. 5 Christian and others 2014; Black and others 2013. 6 Center on the Developing Child at Harvard University 2016a.
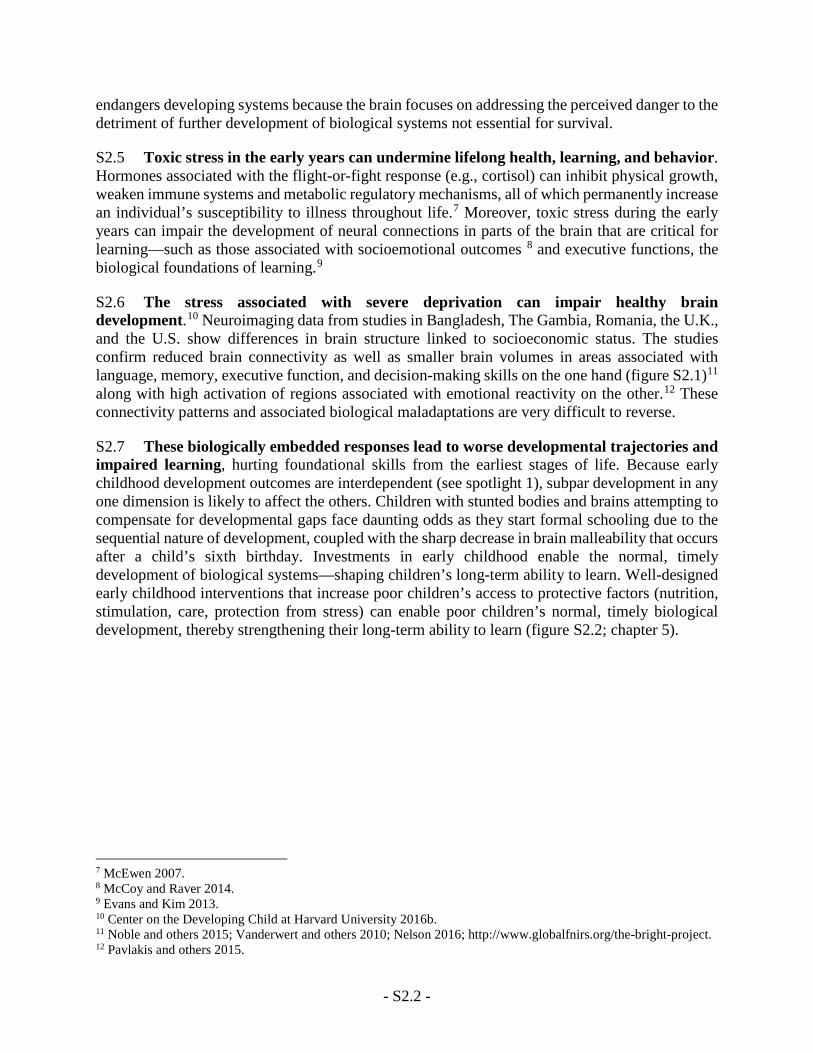
- S2.2 -
endangers developing systems because the brain focuses on addressing the perceived danger to the detriment of further development of biological systems not essential for survival.
S2.5 Toxic stress in the early years can undermine lifelong health, learning, and behavior. Hormones associated with the flight-or-fight response (e.g., cortisol) can inhibit physical growth, weaken immune systems and metabolic regulatory mechanisms, all of which permanently increase an individual’s susceptibility to illness throughout life.7 Moreover, toxic stress during the early years can impair the development of neural connections in parts of the brain that are critical for learning—such as those associated with socioemotional outcomes 8 and executive functions, the biological foundations of learning.9
S2.6 The stress associated with severe deprivation can impair healthy brain development.10 Neuroimaging data from studies in Bangladesh, The Gambia, Romania, the U.K., and the U.S. show differences in brain structure linked to socioeconomic status. The studies confirm reduced brain connectivity as well as smaller brain volumes in areas associated with language, memory, executive function, and decision-making skills on the one hand (figure S2.1)11 along with high activation of regions associated with emotional reactivity on the other.12 These connectivity patterns and associated biological maladaptations are very difficult to reverse.
S2.7 These biologically embedded responses lead to worse developmental trajectories and impaired learning, hurting foundational skills from the earliest stages of life. Because early childhood development outcomes are interdependent (see spotlight 1), subpar development in any one dimension is likely to affect the others. Children with stunted bodies and brains attempting to compensate for developmental gaps face daunting odds as they start formal schooling due to the sequential nature of development, coupled with the sharp decrease in brain malleability that occurs after a child’s sixth birthday. Investments in early childhood enable the normal, timely development of biological systems—shaping children’s long-term ability to learn. Well-designed early childhood interventions that increase poor children’s access to protective factors (nutrition, stimulation, care, protection from stress) can enable poor children’s normal, timely biological development, thereby strengthening their long-term ability to learn (figure S2.2; chapter 5).
7 McEwen 2007. 8 McCoy and Raver 2014. 9 Evans and Kim 2013. 10 Center on the Developing Child at Harvard University 2016b. 11 Noble and others 2015; Vanderwert and others 2010; Nelson 2016; http://www.globalfnirs.org/the-bright-project. 12 Pavlakis and others 2015.
- S2.3 -
Figure S2.1 Total white and gray matter in infants by stunting status
Source: Nelson and others (forthcoming). Note: Data obtained from 2–3-month-old infants using Magnetic Resonance Imaging (MRI) in Dhaka, Bangladesh. There are two groups: 18 infants who are stunted (malnourished) and 9 who are not stunted (not malnourished). The lower left (histograms) display (moving from left to right) the total amount of brain volume, the total amount of gray matter (gray matter refers to cell bodies and neural tissue that does not have any myelin), total amount of white matter (brain tissue, such as axons, that are coated with myelin, a fatty substance that facilitates more efficient neural processing), and finally, cerebral spinal fluid. Each of the four plots shows that the stunted infants have less overall brain tissue, less gray matter, less white matter and less CSF—the effects of malnutrition showing up in the brain as early as 2–3 months of age.
Figure S2.2 Different developmental trajectories as a function of exposure to risk and protective factors
Source: Walker and others (2011).
- S2.4 -
References
Black, Robert E, Cesar G Victora, Susan P Walker, Zulfiqar A Bhutta, Parul Christian, Mercedes De Onis, Majid Ezzati, Sally Grantham-McGregor, Joanne Katz, and Reynaldo Martorell. 2013. "Maternal and Child Undernutrition and Overweight in Low-Income and Middle-Income Countries." The lancet 382(9890): 427-51.
Center on the Developing Child at Harvard University. 2016a. "From Best Practices to Breakthrough Impacts: A Science-Based Approach to Building a More Promising Future for Young Children and Families." http://www.developingchild.harvard.edu.
———. 2016b. "From Best Practices to Breakthrough Impacts: A Science-Based Approach to Building a More Promising Future for Young Children and Families."
Christian, Parul, Laura E Murray-Kolb, James M Tielsch, Joanne Katz, Steven C LeClerq, and Subarna K Khatry. 2014. "Associations between Preterm Birth, Small-for-Gestational Age, and Neonatal Morbidity and Cognitive Function among School-Age Children in Nepal." BMC pediatrics 14(1): 1.
Evans, Gary W, and Pilyoung Kim. 2013. "Childhood Poverty, Chronic Stress, Self‐Regulation, and Coping." Child Development Perspectives 7(1): 43-48.
Knudsen, Eric I. 2004. "Sensitive Periods in the Development of the Brain and Behavior." Journal of Cognitive Neuroscience 16(8): 1412-25.
McCoy, Dana Charles, and C Cybele Raver. 2014. "Household Instability and Self-Regulation among Poor Children." Journal of Children and Poverty 20(2): 131-52.
McEwen, Bruce S. 2007. "Physiology and Neurobiology of Stress and Adaptation: Central Role of the Brain." Physiological Reviews 87(3): 973-04.
Mullainathan, Sendhil, and Eldar Shafir. 2013. Scarcity: Why Having Too Little Means So Much. Macmillan.
Nelson, Charles A. 2016. Brain Imaging as a Measure of Future Cognitive Outcomes.
Noble, Kimberly G, Suzanne M Houston, Natalie H Brito, Hauke Bartsch, Eric Kan, Joshua M Kuperman, Natacha Akshoomoff, David G Amaral, Cinnamon S Bloss, and Ondrej Libiger. 2015. "Family Income, Parental Education and Brain Structure in Children and Adolescents." Nature neuroscience 18(5): 773-78.
Pavlakis, Alexandra E, Kimberly Noble, Steven G Pavlakis, Noorjahan Ali, and Yitzchak Frank. 2015. "Brain Imaging and Electrophysiology Biomarkers: Is
There a Role in Poverty and Education Outcome Research?" Pediatric neurology 52(4): 383-88.
United Nations Children's Fund, World Health Organization, and World Bank Group. 2016. "Levels and Trends in Child Malnutrition Unicef/Who/World Bank Group Joint Child Malnutrition Estimates Key Findings of the 2016 Edition."
Vanderwert, Ross E, Peter J Marshall, Charles A Nelson III, Charles H Zeanah, and Nathan A Fox. 2010. "Timing of Intervention Affects Brain Electrical Activity in Children Exposed to Severe Psychosocial Neglect." PLoS One 5(7): e11415.
Walker, Susan P., Susan M. Chang, Marcos Vera-Hernández, and Sally M. Grantham-McGregor. 2011. "Early Childhood Stimulation Benefits Adult Competence and Reduces Violent Behavior." Pediatrics 127(5): 849-57.
- 4.1 -
Chapter 4 To take learning seriously, start by measuring it
Contents
The learning crisis is hidden—but measurement makes it visible ................................................................ 1
Measures for learning guide action ............................................................................................................... 3
Measures of learning spur action .................................................................................................................. 4
Prioritize based on country needs ................................................................................................................. 6
Can learning measures narrow our vision for education? ............................................................................. 7
Six tips for effective learning measures ........................................................................................................ 9
In December 2016 Queen Rania of Jordan posted on Facebook: “The results tell us about the fact of the drop in education quality, after releasing the 2015 results of the Trends in International Mathematics and Science Study [TIMSS]…We cannot ignore what is happening to our education, and we cannot afford the repercussions of not reforming it."1
4.1 Why does the learning crisis persist? How can children attend school for years but remain functionally illiterate? Why do actors in education systems not fix this? One big reason is that for many, the learning crisis is invisible. Education systems have little systematic information on who is learning and who is not. As a result, it is impossible to generate an impetus for action—let alone a plan.
4.2 To tackle the crisis, it is necessary—but not sufficient—to measure learning. Doing so requires that learning measures facilitate action, are adapted to country needs, and consist of a range of tools to meet the needs of the system, including needs at the classroom level.
The learning crisis is hidden—but measurement makes it visible
“Almost no low income countries have standardized (equated over time) national assessment systems to track learning and provide a feedback mechanism to national education policies and programs.”
—Birdsall and others 2016 (page 2)
4.3 To tackle the learning crisis, we need to shine light on it. Education systems routinely report on enrollment, but not learning. Because learning is missing from official education management data, it is missing from the agendas of politicians and bureaucrats. This is evident in how politicians often talk about education only in terms of inputs—number of schools, number of teachers, teacher salaries, school grants—but rarely in terms of actual learning. Missing data on learning allows governments to ignore or obscure the poor quality of education, especially for disadvantaged groups.
4.4 Without objective information on learning, parents may be unaware of the poor quality of education. This lack of awareness prevents them from demanding better services from 1 Jordan Times 2016.
- 4.2 -
schools and governments. In Kenya less than half of children in grade 4 could pass basic proficiency tests in literacy or numeracy, yet more than two-thirds of adults were broadly satisfied with the government’s performance in education.2 The realization that learning outcomes are poor may come only when children face poor labor market prospects, but by then it’s too late. If parents have no real information on how much their children are learning, how can they hold schools or governments accountable?
4.5 Without clear information on what students don’t know, how can schools improve instruction? Teachers may find it difficult to judge the extent to which students understand what is being taught. This is particularly true for low income countries, where teachers face large classrooms which mix students of very different abilities. For instance, a study from Delhi, India shows that the same grade may contain students whose achievement level spans the equivalent of 5 to 6 grades.3 In such contexts, learning measures provide timely feedback to teachers about which students may need additional support. More broadly, these measures provide school management with information about which areas need attention to improve instruction. If the information is shared with parents or students it can help them focus their own efforts to improve learning.
4.6 Yet concerted action is often derailed by concerns about possible ‘pitfalls’ around learning measures. These measures generate much debate—for instance, on the outsize impacts of international assessments on local policy, the limited use of national assessments for improving classroom practice, or the potential gaming of high-stakes testing.4 But measurement of learning is not shorthand for international testing such as the Program for International Student Assessment (PISA) or for the contentious accountability approach implemented through the U.S. No Child Left Behind policy. Instead, the term covers a range of assessments, including formative classroom assessments (box 4.1). Even in this form, metrics are complements not substitutes for careful context-specific analysis to determine how to improve learning.5
Box 4.1 Good learning measures illuminate all parts of the education system
Formative classroom assessments facilitate instruction by providing real-time feedback to support teaching and learning. This feedback allows teachers to identify struggling students, enabling them to adjust instruction to meet the learning needs of different students. They generate valuable feedback for teachers, students. and parents.
National assessments provide information on the overall education system by highlighting achievements along with challenges, such as inequalities. They are useful for education management, policy, as well as reform.
National examinations certify student achievement, with a focus on transparently selecting students for more advanced placements in the education system or jobs. Given their role in determining labor market outcomes, these examinations are “high stakes” for students. They significantly affect what is taught and how. These are critical for managing the flow of students through the system.
International assessments benchmark student performance by evaluating education systems across countries and over time using representative samples of children. There has also been a steady increase in the use of citizen-led assessments. These can be important for fostering public awareness, showing what’s possible, advocating for change, and informing research.
2 Gove and Cvelich 2011. 3 Muralidharan, Singh and Ganimian 2016. 4 Sellar and Lingard 2013; Eggen and Stobart 2015. 5 Carnoy and others 2016.
- 4.3 -
Measures for learning guide action
Testing in Rio de Janeiro, Brazil happens at two levels. First, every two years all students in grades 5 and 9 take a national test (the Prova Brasil) designed to assess public education. Second, students are tested at the end of each two-month curriculum block. These tests, given by municipal education departments, aim to provide quick feedback to teachers and principals—allowing schools and the broader system to provide more support to struggling students.6
4.6 Identifying learning gaps in the classroom is the first step to resolving them. In environments of low learning, there is often a gap between the level of students and the level at which classes are being taught.7 This might be because teachers are unaware of students’ levels. Fostering a culture of classroom-based assessments can address this problem. In Singapore students are given screening tests at the start of grade 1, which helps teachers identify those who require additional instruction learning to read.8
4.7 Identifying learning gaps in the system is the first step to resolving them. Learning measures help highlight where support is most needed. This has helped school districts and schools better target resources to improve service delivery. In Brazil national assessments have been widely adopted by states and municipalities to strengthen school performance.9 Learning measures have also guided big-banner education reforms. In Chile PISA’s reading framework guided national curriculum reform.10 Similarly, findings from SACMEQ I (1995–99) underpinned a review of Mauritius’s education master plan.11 In some cases, learning measures has been instrumental in making education reform data-driven. In Germany lower than expected results—especially for students from poorer backgrounds—in the 2000 PISA led to the development of more support for disadvantaged students, especially those from immigrant backgrounds.12
4.8 However, for learning measures to guide action effectively, they need to be used as a range of tools to serve different needs, from classroom practice to system management. Learning measures come in various forms, with different measures serving different purposes for different actors. These range from simple oral questions by a teacher to national assessments that help policymakers prioritize action (see box 4.1). In well-functioning systems these different tools complement one another to form a coherent whole.13
4.9 Policymakers should rely on a broad range of information, instead of any one measure. When a single measure becomes the sole basis for big policy triggers, corresponding stakes may become dangerously high. A striking example is the U.S. No Child Left Behind policy, enacted in 2001. This policy meant strong negative repercussions for schools that performed poorly in annual statewide-standardized tests. Though the policy led some poorly performing schools to improve, it also generated various strategic responses by teachers and school 6 McAleavy 2015. 7 Pritchett 2013. 8 OECD 2011. 9 Castro 2012. 10 Breakspear 2012. 11 Murimba 2005. 12 Ertl 2006. 13 Greaney and Kellaghan 2008.
- 4.4 -
administrators.14 These included reclassifying students as requiring special education, exempting certain students from testing, reallocating resources to students at the margin of passing, and suspending low-scoring students near test dates.15 Even with PISA, some studies have suggested that the performance in some countries (Argentina, Malaysia, Vietnam, Shanghai (China)) could be partly tied to (perhaps inadvertent) “selective samples” that may exclude some poorly performing schools or students.16
4.10 Yet education systems routinely underuse the information generated by learning measures—making for a lot of measurement with little action.17 This may be because findings are simply not communicated in a timely way to relevant audiences.18 But it may also be a credibility problem. If teachers or schools do not feel heard or acknowledged in a national assessment process, they will likely reject its findings. For instance, teachers are more likely to resist quantitative forms of evaluation when measures do not take into account context.19 This is particularly the case for learning measures disseminated as rankings, which are susceptible to being taken out of context. In some education systems such frictions are heightened by the use of technology, which increases questions about privacy and transparency. Approaches using technology also involve limited social interaction, which is associated with less impact.20
4.11 For measurement to guide action, it must be actionable. It must also need to be available to stakeholders. At the design stage, stakeholders need to ask themselves how learning data will be used. In Chile all students in grades 4 and 8 take the Sistema de Medición de la Calidad de la Educación (SIMCE) each year. The test identifies the 900 schools scoring in the lowest 10 percent on the tests in their proving, and the schools receive special resources. Hence the data are clearly linked to action. Many assessment systems measure outcomes too infrequently or too broadly to be of practical use. The most recent publicly available data from the Southern and Eastern African Consortium for Monitoring Educational Quality are for 2007. Another constraint is the lag between when data are collected and when they are made available, as well as how data are made available. Many ministries produce only hard copies of summary reports, which make them hard to use.
Measures of learning spur action
“Shock as 60 [percent] of Tanzania students fail national exam”
—The East African, 19 February 201321
In the United States since 2001, information on different schools’ performance on standardized tests has notably increased turnout in local school board elections.22
14 Dee and Jacob 2011. 15 Figlio and Getzler 2006; Jacob 2005; Berry Cullen and Reback 2006; Jennings and Beveridge 2009; Booher-Jennings 2005; Reback 2008; Neal and Schanzenbach 2010. 16 OECD 2016; Carnoy and others 2016; Glewwe, Lee and Vu 2017; Xu and Dronkers 2016. 17 Székely 2011. 18 Greaney and Kellaghan 2008. 19 Bellamy and Raab 2005; Dixon and others 2013. 20 Meijer 2009. 21 The Citizen 2013 . 22 Holbein 2016.
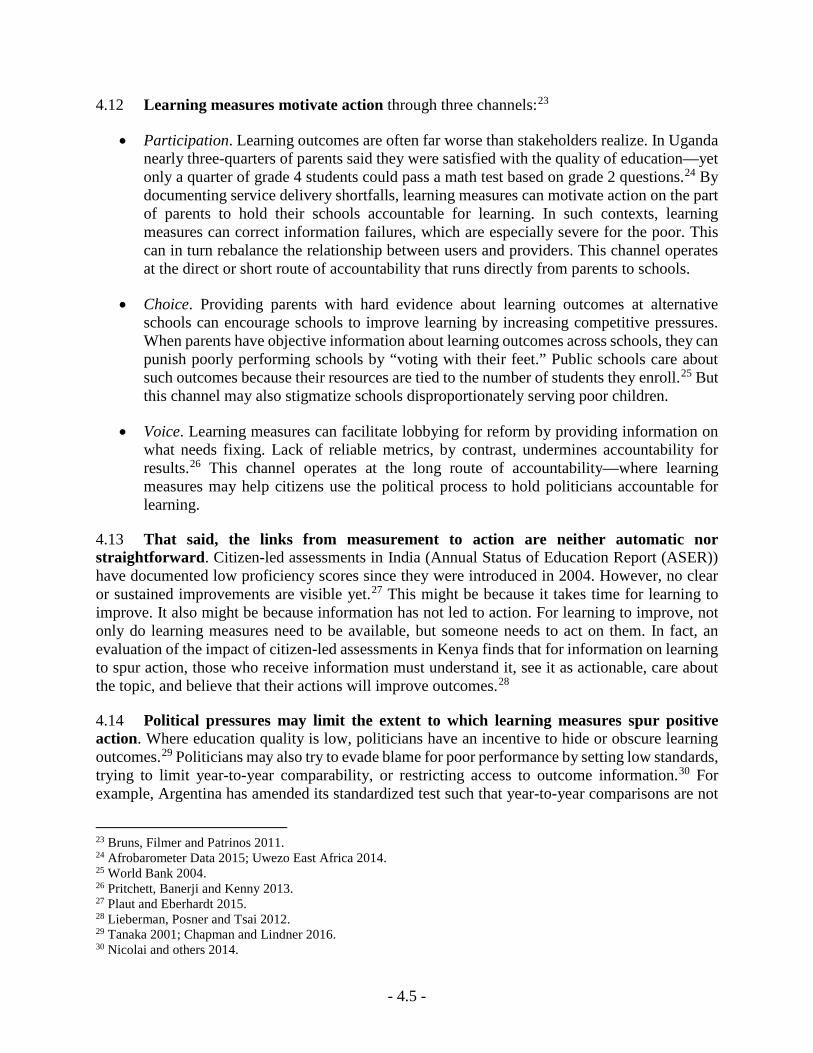
- 4.5 -
4.12 Learning measures motivate action through three channels:23
• Participation. Learning outcomes are often far worse than stakeholders realize. In Uganda nearly three-quarters of parents said they were satisfied with the quality of education—yet only a quarter of grade 4 students could pass a math test based on grade 2 questions.24 By documenting service delivery shortfalls, learning measures can motivate action on the part of parents to hold their schools accountable for learning. In such contexts, learning measures can correct information failures, which are especially severe for the poor. This can in turn rebalance the relationship between users and providers. This channel operates at the direct or short route of accountability that runs directly from parents to schools.
• Choice. Providing parents with hard evidence about learning outcomes at alternative schools can encourage schools to improve learning by increasing competitive pressures. When parents have objective information about learning outcomes across schools, they can punish poorly performing schools by “voting with their feet.” Public schools care about such outcomes because their resources are tied to the number of students they enroll.25 But this channel may also stigmatize schools disproportionately serving poor children.
• Voice. Learning measures can facilitate lobbying for reform by providing information on what needs fixing. Lack of reliable metrics, by contrast, undermines accountability for results.26 This channel operates at the long route of accountability—where learning measures may help citizens use the political process to hold politicians accountable for learning.
4.13 That said, the links from measurement to action are neither automatic nor straightforward. Citizen-led assessments in India (Annual Status of Education Report (ASER)) have documented low proficiency scores since they were introduced in 2004. However, no clear or sustained improvements are visible yet.27 This might be because it takes time for learning to improve. It also might be because information has not led to action. For learning to improve, not only do learning measures need to be available, but someone needs to act on them. In fact, an evaluation of the impact of citizen-led assessments in Kenya finds that for information on learning to spur action, those who receive information must understand it, see it as actionable, care about the topic, and believe that their actions will improve outcomes.28
4.14 Political pressures may limit the extent to which learning measures spur positive action. Where education quality is low, politicians have an incentive to hide or obscure learning outcomes.29 Politicians may also try to evade blame for poor performance by setting low standards, trying to limit year-to-year comparability, or restricting access to outcome information.30 For example, Argentina has amended its standardized test such that year-to-year comparisons are not
23 Bruns, Filmer and Patrinos 2011. 24 Afrobarometer Data 2015; Uwezo East Africa 2014. 25 World Bank 2004. 26 Pritchett, Banerji and Kenny 2013. 27 Plaut and Eberhardt 2015. 28 Lieberman, Posner and Tsai 2012. 29 Tanaka 2001; Chapman and Lindner 2016. 30 Nicolai and others 2014.
- 4.6 -
possible, decreased the frequency with which the test is administered, and delayed the publications of results by two years in order to obscure the poor performance of students.31 Teachers, too, might resist learning measures to minimize opportunities for blame.32 In Chile teacher training institutions have shown resistance to the national assessment.33 Assessments are also political because they can affect the flow of resources or prestige in an education system—as in the United States under the No Child Left Behind policy.34 Underlying politics can make student assessment systems particularly hard to reform; see part 4 of this Report.
4.15 When does measurement mobilize citizens to demand accountability for learning? Because, attention is limited, information is often ignored, especially if it is complex or provides unwelcome news.35 Therefore, for measurement to spur action, information must be available in an easily digestible way. But this in itself might not be enough. Learning measures can galvanize communities to hold their schools accountable for learning only when collective action problems are resolved.36 A participatory approach—where schools and communities have a say in what type of “learning metrics” are generated at the school level—is likely to work better for this.37 In addition, for citizens to be able to act on information, fear of reprisals must be low. Finally, for citizens to act on behalf of change, they must believe that their own individual actions can make a difference.38
4.16 At the central level, some efforts to benchmark country performance through international or regional assessments have managed to galvanize action because international comparisons make learning politically salient. Release of TIMSS or PISA rankings often trigger an intense media focus—bringing learning into political and economic debates.39 This often generates a momentum for government action—an effect known as “PISA shock”—unleashing targeted reforms. About half the countries participating in the OECD’s PISA assessments launched reforms because of the results.40 Learning measures also spur action by making learning a tangible goal. While the Millennium Development Goals (MDGs), which inspired efforts by governments and donors, focused on enrollment, the Sustainable Development Goals (SDGs) focus on learning.41 The success of the SDGs will depend on countries’ ability to track learning.
Prioritize based on country needs
4.17 When choosing which learning measures to invest in, policymakers must consider the context. If assessment systems are nascent, priority should be on fostering classroom assessment. Once that piece is in place, countries can develop relatively quick, sample-based, low-cost national assessments. When classroom and national assessments are established, much can be gained from 31 Ganimian 2015. 32 Fox 2007; Hood 2010; Worthy 2015. 33 Meckes and Carrasco 2006. 34 Benveniste 2002; Peterson and West 2003. 35 Loewenstein, Sunstein and Golman 2014. 36 Björkman and Svensson 2010. 37 Björkman and Svensson 2010; Barr and others 2012. 38 Lieberman, Posner and Tsai 2012; Barr and others 2012. 39 Michener and Ritter 2016. 40 Figazzolo 2009. 41 Fehling, Nelson and Venkatapuram 2013.
- 4.7 -
participating in regional or global assessments that enable performance benchmarking. The ultimate goal is to conceive of assessment systems in which different parts are aligned but serve different needs.
4.18 Not every student needs to be tested in national assessments. Sample-based assessments can accurately measure a system’s performance. While these still require capable administrators, such assessments are much less expensive than census-based assessments. They can also be administered more often. Schools participating in these assessments do not have to be identified. This helps lower the stakes—making the assessments less susceptible to perverse responses by teachers or schools.
4.19 Assessment systems should test students when effective remedial action remains possible. Across 121 countries in four regions, a third lack any reporting data on reading and mathematics proficiency levels for children at the end of primary school.42 Only half of countries surveyed produce data or participate in any regional or international tests to assess mathematics at the end of lower secondary school. Just under half assess reading (figure 4.1).
Figure 4.1 No internationally comparable data on learning are available for most children outside of high-income countries
Percent of children in countries that have reported mathematics and reading scores since 2000 for ASER, EGRA, LLECE, PASEC, PIRLS, PISA, SACMEQ, and TIMSS
Source: WDR 2018 team using data from Sandefur 2017.
Can learning measures narrow our vision for education?
4.20 Putting emphasis on learning measures does not mean ignoring other outcomes of education, such as physical, moral, civic, or artistic development. Indeed, focusing on learning—and on the educational quality that drives it—is more likely to crowd in these other desirable outcomes. Conditions that allow children to spend two or three years in school without learning to read a single word or to reach the end of primary school without learning two-digit subtraction are not conducive to reaching the higher goals of education. An experiment in Andhra Pradesh, India that rewarded teachers for gains in measured learning in math and language led to 42 UNESCO Institute for Statistics 2016.
0 20 40 60 80 100
World
Low income
Middle income
High income
Grades 2–3
0 20 40 60 80 100
World
Low income
Middle income
High income
Grades 4–6
0 20 40 60 80 100
World
Low income
Middle income
High income
Grades 8–10
Standardized regionalLLECE, PASEC, SACMEQ
Non-standardized regionalASER, EGRA
InternationalPIRLS, PISA, TIMSS NoneType of exam:
- 4.8 -
improved outcomes not just in those subjects, but also in science—even though there were no rewards for improvement in science.43 A study of 9th graders from the U.S. shows that behavioral factors had a positive correlation with test scores.44 Another U.S. study shows that teachers who improve test scores also improve broad outcomes into adulthood.45 Learning measures of key foundational subjects like language and mathematics are likely to be good proxies for whether education system is delivering on its broad promise.
4.21 That said, cognitive skills are not the only skills that matter. Socioemotional skills (sometimes called non-cognitive skills) such as grit, self-control, self-management, effective communication, prosocial behavior can be central to not just economic outcomes but life-outcomes more broadly.46 Evidence from high-income countries suggests that such skills strongly affect employment status, work experience, occupational choice, and wages.47 They also reduce risky behaviors like crime, violence, or drug use.48 For instance, a study from the U.K. finds that even after controlling for cognitive skills, socioemotional skills were important for predicting whether individuals stayed in school, obtained a degree, were employed, smoked, or were involved in a crime.49 Understanding of how to measure, along with how to influence these skills, is growing rapidly.50 Like cognitive skills, socioemotional skills develop early in life but are malleable.51 In fact, socioemotional skills help build cognitive skills and vice versa, with current skill levels dependent on investments made earlier in life.52
4.22 Lower-performing countries probably do not face the same sharp tradeoffs as do high-performing countries on the education frontier. Economists use the concept of the production possibilities frontier to understand how producers—or in this case, countries—make tradeoffs between production of different goods (figure 4.2). For example, in recent years many stakeholders in the Republic of Korea have argued that their high-performing education system places too much emphasis on test scores (shown in figure 4.2 as “measured learning”) and not enough on creativity or certain socioemotional skills like teamwork (“other outputs”). Implicitly, this Korean debate is about whether to try to move up and to the left on the frontier, in the direction from A toward B. But in the low-learning trap, represented by “low-performing country C” in the figure, there is so much slack that this OECD-driven debate is not relevant. Country C has an opportunity to improve on both measured learning we well as other education outputs at the same time.
43 Muralidharan and Sundararaman 2011. 44 Jackson 2016. 45 Chetty and others 2010 46 Heckman, Pinto and Savelyev 2013; Murnane and others 2001; Durlak and others 2011. 47 Heckman, Stixrud and Urzua 2006. 48 Durlak, Weissberg and Pachan 2010. 49 Carneiro, Crawford and Goodman 2007. 50 Heckman, Pinto and Savelyev 2013; Carneiro, Crawford and Goodman 2007 51 Heckman, Stixrud and Urzua 2006. 52 Cunha and Heckman 2007; Cunha and Heckman 2008.
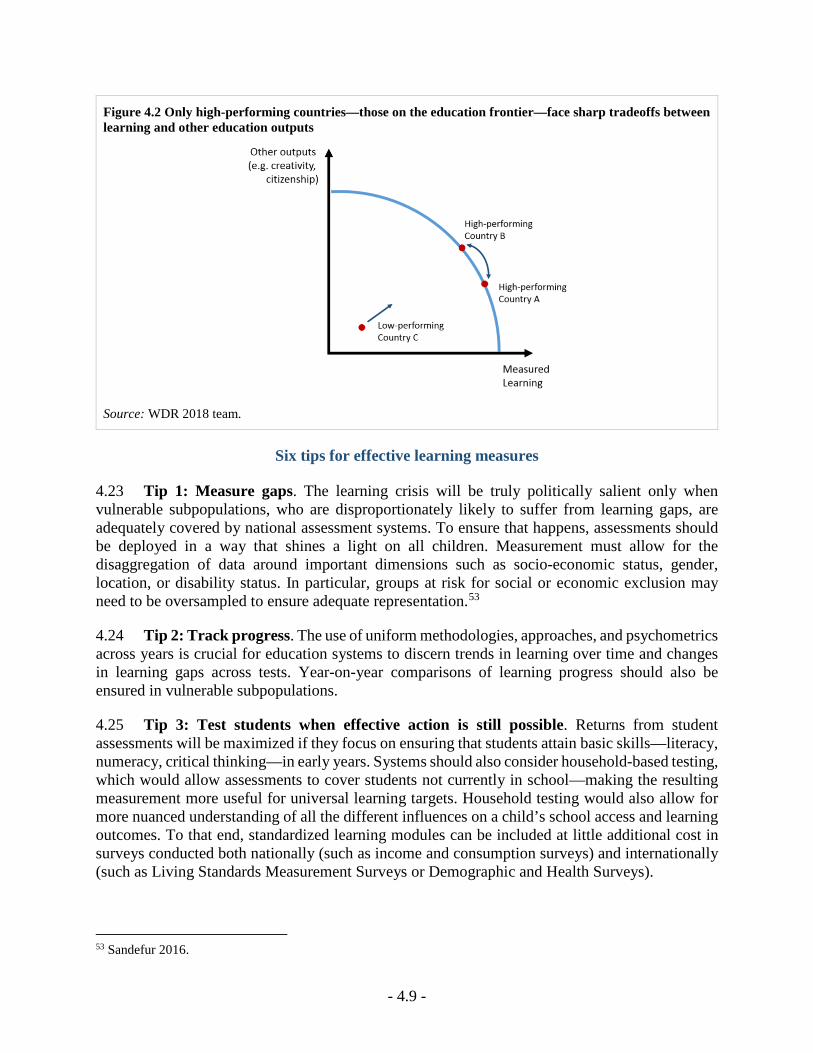
- 4.9 -
Figure 4.2 Only high-performing countries—those on the education frontier—face sharp tradeoffs between learning and other education outputs
Source: WDR 2018 team.
Six tips for effective learning measures
4.23 Tip 1: Measure gaps. The learning crisis will be truly politically salient only when vulnerable subpopulations, who are disproportionately likely to suffer from learning gaps, are adequately covered by national assessment systems. To ensure that happens, assessments should be deployed in a way that shines a light on all children. Measurement must allow for the disaggregation of data around important dimensions such as socio-economic status, gender, location, or disability status. In particular, groups at risk for social or economic exclusion may need to be oversampled to ensure adequate representation.53
4.24 Tip 2: Track progress. The use of uniform methodologies, approaches, and psychometrics across years is crucial for education systems to discern trends in learning over time and changes in learning gaps across tests. Year-on-year comparisons of learning progress should also be ensured in vulnerable subpopulations.
4.25 Tip 3: Test students when effective action is still possible. Returns from student assessments will be maximized if they focus on ensuring that students attain basic skills—literacy, numeracy, critical thinking—in early years. Systems should also consider household-based testing, which would allow assessments to cover students not currently in school—making the resulting measurement more useful for universal learning targets. Household testing would also allow for more nuanced understanding of all the different influences on a child’s school access and learning outcomes. To that end, standardized learning modules can be included at little additional cost in surveys conducted both nationally (such as income and consumption surveys) and internationally (such as Living Standards Measurement Surveys or Demographic and Health Surveys).
53 Sandefur 2016.
- 4.10 -
4.26 Tip 4: Balance the stakes. No single measure should be misused or overused. One way to avoid that outcome is to frame learning measures that guide policy as low-stakes diagnostic tools—not as one summary number that determines sanctions and rewards. Again, ‘learning metrics’ should be considered a system of tools, each with its own place and purpose.54
4.27 Tip 5: Good design is not enough—facilitate action. Learning measures should be explicitly used not just for tracking, but also for policymaking.55 One way to ensure that outcome is to devote resources (including effort) to timely distribution of understandable results to key stakeholders. Another factor relates to an open, collaborative process on instrument design. Student assessments developed with collaboration by various stakeholders are more likely to be considered valid and relevant at local levels.
4.28 Tip 6: Exploit global public goods on learning. Leveraging international assessments can yield high returns. For instance, there is considerable advantage to forging common links between international and regional assessments so that they can be put on the same scale. This not only increases harmonization between international assessments like PISA and TIMSS, it also allows for ties to national and citizen-led assessments—enabling meaningful global tracking (box 4.2). Researchers have tried to link various assessments after the fact, but these attempts face severe technical challenges.56 Ex-ante linking of measurements through common items is likely to prove much more technically sound and cost-effective.
Box 4.2 A global learning metric?
A global learning metric could help bring learning center stage, making it more salient. Such a metric would use an internationally comparable scale to consistently track progress and identify gaps across contexts. It would enable comparisons across children, households, schools, and locations.
Beyond its technical dividends, a global metric would motivate action and generate accountability for learning. By showing what’s possible, it could point to what countries should be aspiring to—and create pressure to meet those aspirations. By benchmarking learning gaps among disadvantaged groups, a global metric could also create pressures for social mobility within countries. Further, comparable learning data could increase the effectiveness of global research, international partnerships, and global aid for learning. Data could also help countries develop their capacity for analyzing results to drive policy.
To be sure, there are technical and political challenges to adopting a global metric. The first is how to generate a global consensus on the metric’s scope. There are clear tradeoffs between being more and less ambitious and comprehensive when developing assessments. A global metric would also require making choices about approach, target sample, and interpretation, which could prove controversial. In addition, challenges would arise with financing, implementation capacity, and political will. Many developing countries lack infrastructure for data collection, organization, analysis, and feedback to educators, parents, or communities. These are key inputs for making school systems effective and efficient to address inequalities in learning.
But most of these problems are surmountable. Global advocacy is generating sound technical recommendations on what a global metric could look like. There are no agreed standards of proficiency and no agreed tests to ensure that countries’ measures are comparable to each other and over time. Still, several global initiatives—such as the Global Alliance to Monitor Learning, the Assessment for Learning (A4L) initiative, and the Commission on Financing of Global Education—are generating momentum. Other challenges could be overcome through clear goals and quality thresholds. A global metric can succeed only if it is explicitly framed as a complement to national
54 Neal 2013. 55 Castro 2012. 56 Sandefur 2016; Altinok and Murseli 2007; Altinok, Diebolt and Demeulemeester 2014.
- 4.11 -
assessment systems—not a substitute. In fact, information from the global metric could be used to strengthen the capacity of national systems.
The political will needed for a global metric might be easier to mobilize if the needs of developing countries are prioritized and its advantages are clearly communicated. Estimates suggest that only 3 percent of official development assistance (ODA) for education is spent on global public goods such as data and research. For health that share is 20 percent.57 Returns from this effort could be enormous if they help focus attention on ensuring that students attain basic skills in early years.
Source: WDR 2018 team.
* * *
4.29 Education systems are unlikely to tackle the learning crisis unless it becomes clearly visible. This is only possible through well-designed learning measures. To be effective, ‘learning metrics’ must overcome two important challenges. First, ensuring that information leads to action. Second, minimizing the potential perverse impacts of learning measures. Alarm at the rise of a “testing” culture has dominated recent discourse. But in most low-learning contexts there is too little testing and, consequently, little accountability for learning.
57 Schäferhoff and Burnett 2016.
- 4.12 -
References
Afrobarometer Data, Uganda, Round 6, 2015 available at http://www.afrobarometer.org.
Altinok, Nadir, Claude Diebolt, and Jean-Luc Demeulemeester. 2014. "A New International Database on Education Quality: 1965–2010." Applied Economics 46(11): 1212-47.
Altinok, Nadir, and Hatidje Murseli. 2007. "International Database on Human Capital Quality." Economics Letters 96(2): 237-44.
Barr, Abigail, Frederick Mugisha, Pieter Serneels, and Andrew Zeitlin. 2012. "Information and Collective Action in Community-Based Monitoring of Schools: Field and Lab Experimental Evidence from Uganda." Unpublished paper, Georgetown University.
Bellamy, Christine, and Charles Raab. 2005. "Joined‐up Government and Privacy in the United Kingdom: Managing Tensions between Data Protection and Social Policy. Part Ii." Public Administration 83(2): 393-415.
Benveniste, Luis. 2002. "The Political Structuration of Assessment: Negotiating State Power and Legitimacy." Comparative Education Review 46(1): 89-118.
Berry Cullen, Julie, and Randall Reback. 2006. "Tinkering toward Accolades: School Gaming under a Performance Accountability System." In Improving School Accountability, 1-34. Emerald Group Publishing Limited.
Björkman, Martina, and Jakob Svensson. 2010. "When Is Community‐Based Monitoring Effective? Evidence from a Randomized Experiment in Primary Health in Uganda." Journal of the European Economic Association 8(2‐3): 571-81.
Booher-Jennings, Jennifer. 2005. "Below the Bubble:“Educational Triage” and the Texas Accountability System." American educational research journal 42(2): 231-68.
Breakspear, Simon. 2012. "The Policy Impact of Pisa: An Exploration of the Normative Effects of International Benchmarking in School System Performance." OECD Education Working Papers. OECD Publishing.
Bruns, Barbara, Deon Filmer, and Harry Anthony Patrinos. 2011. Making Schools Work: New Evidence on Accountability Reforms. Washington DC: World Bank Publications.
Carneiro, Pedro, Claire Crawford, and Alissa Goodman. 2007. "The Impact of Early Cognitive and
Non-Cognitive Skills on Later Outcomes." London: Centre for the Economics of Education.
Carnoy, Martin, Tatiana Khavenson, Prashant Loyalka, William H Schmidt, and Andrey Zakharov. 2016. "Revisiting the Relationship between International Assessment Outcomes and Educational Production: Evidence from a Longitudinal Pisa-Timss Sample." American Educational Research Journal 53(4): 1054-85.
Castro, Maria Helena Guimaraes de. 2012. " Developing the Enabling Context for Student Assessment in Brazil." Systems Approach for Better Education Results (SABER) student assessment working paper; no. 7. Washington, DC: World Bank.
Chapman, David W, and Samira Lindner. 2016. "Degrees of Integrity: The Threat of Corruption in Higher Education." Studies in Higher Education 41(2): 247-68.
Chetty, Raj, John N Friedman, Nathaniel Hilger, Emmanuel Saez, Diane Whitmore Schanzenbach, and Danny Yagan. 2010. "How Does Your Kindergarten Classroom Affect Your Earnings? Evidence from Project Star." National Bureau of Economic Research.
Cunha, Flavio, and James Heckman. 2007. "The Technology of Skill Formation." Institute for the Study of Labor Discussion Papers, No. 2550. http://nbn-resolving.de/urn:nbn:de:101:1-20080425464.
Cunha, Flavio, and James J Heckman. 2008. "Formulating, Identifying and Estimating the Technology of Cognitive and Noncognitive Skill Formation." Journal of human resources 43(4): 738-82.
Dee, Thomas S, and Brian Jacob. 2011. "The Impact of No Child Left Behind on Student Achievement." Journal of Policy Analysis and management 30(3): 418-46.
Dixon, Ruth, Christiane Arndt, Manuel Mullers, Jarmo Vakkuri, Kristiina Engblom‐Pelkkala, and Christopher Hood. 2013. "A Lever for Improvement or a Magnet for Blame? Press and Political Responses to International Educational Rankings in Four Eu Countries." Public Administration 91(2): 484-505.
Durlak, Joseph A, Roger P Weissberg, Allison B Dymnicki, Rebecca D Taylor, and Kriston B Schellinger. 2011. "The Impact of Enhancing Students’ Social and Emotional Learning: A Meta‐Analysis of School‐Based Universal Interventions." Child Development 82(1): 405-32.
Durlak, Joseph A, Roger P Weissberg, and Molly Pachan. 2010. "A Meta‐Analysis of after‐School Programs That Seek to Promote Personal and Social
- 4.13 -
Skills in Children and Adolescents." American Journal of Community Psychology 45(3-4): 294-309.
Eggen, Theo JHM, and Gordon Stobart. 2015. High-Stakes Testing in Education: Value, Fairness and Consequences. Routledge.
Ertl, Hubert. 2006. "Educational Standards and the Changing Discourse on Education: The Reception and Consequences of the Pisa Study in Germany." Oxford Review of Education 32(5): 619-34.
Fehling, Maya, Brett D Nelson, and Sridhar Venkatapuram. 2013. "Limitations of the Millennium Development Goals: A Literature Review." Global Public Health 8(10): 1109-22.
Figazzolo, Laura. 2009. "Impact of Pisa 2006 on the Education Policy Debate." Education International.
Figlio, David N, and Lawrence S Getzler. 2006. "Accountability, Ability and Disability: Gaming the System?" In Improving School Accountability, 35-49. Emerald Group Publishing Limited.
Fox, Jonathan. 2007. "The Uncertain Relationship between Transparency and Accountability." Development in practice 17(4-5): 663-71.
Ganimian, AJ. 2015. "El Termómetro Educativo: Informe Sobre El Desempeño De Argentina En Los Operativos Nacionales De Evaluación (One) 2005-2013." Buenos Aires: Proyecto Educar 2050.
Glewwe, Paul, Jongwook Lee, and Khoa Vu. 2017. "What Explains Vietnam’s Exceptional Performance in Education Relative to Other Countries? Analysis of the 2012 Pisa Data." University of Minnesota Working Paper.
Gove, Amber, and Peter Cvelich. 2011. "Early Reading: Igniting Education for All." A report by the Early Grade Learning Community of Practice. Revised Edition. Research Triangle Park, NC: Research Triangle Institute.
Greaney, Vincent, and Thomas Kellaghan. 2008. Assessing National Achievement Levels in Education. World Bank Publications.
Heckman, James J, Jora Stixrud, and Sergio Urzua. 2006. "The Effects of Cognitive and Noncognitive Abilities on Labor Market Outcomes and Social Behavior." Journal of Labor Economics 24(3): 411-82.
Heckman, James, Rodrigo Pinto, and Peter Savelyev. 2013. "Understanding the Mechanisms through Which an Influential Early Childhood Program Boosted Adult Outcomes." The American Economic Review 103(6): 2052-86.
Holbein, John. 2016. "Left Behind? Citizen Responsiveness to Government Performance Information." American Political Science Review 110(02): 353-68.
Hood, Christopher. 2010. The Blame Game: Spin, Bureaucracy, and Self-Preservation in Government. Princeton, NJ: Princeton University Press.
Jackson, C Kirabo. 2016. "What Do Test Scores Miss? The Importance of Teacher Effects on Non-Test Score Outcomes." National Bureau of Economic Research.
Jacob, Brian A. 2005. "Accountability, Incentives and Behavior: The Impact of High-Stakes Testing in the Chicago Public Schools." Journal of public Economics 89(5): 761-96.
Jennings, Jennifer L, and Andrew A Beveridge. 2009. "How Does Test Exemption Affect Schools’ and Students’ Academic Performance?" Educational Evaluation and Policy Analysis 31(2): 153-75.
Jordan Times. 2016. "‘Disappointing’ Test Results Challenge Jordan to Reform Education — Queen." The Jordan Times. 12/01/2016. http://jordantimes.com/news/local/disappointing%E2%80%99-test-results-challenge-jordan-reform-education-%E2%80%94-queen.
Lieberman, Evan S, Daniel N Posner, and Lily L Tsai. 2012. "Does Information Lead to More Active Citizenship." An Evaluation of the Impact of the Uwezo Initiative in Kenya.
Loewenstein, George, Cass R Sunstein, and Russell Golman. 2014. "Disclosure: Psychology Changes Everything." Annual Review of Economics 6(1): 391-419.
McAleavy, Alex Elwick and Tony. 2015. "Interesting Cities: Five Approaches to Urban School Reform." CfBT Education Trust.
Meckes, Lorena, and Rafael Carrasco. 2006. "Simce: Lessons from the Chilean Experience in National Assessment Systems of Learning Outcomes." World Bank Conference on Latin American Lessons in Promoting Education for All. Cartagena de Indias, Colombia.
Meijer, Albert. 2009. "Understanding Modern Transparency." International Review of Administrative Sciences 75(2): 255-69.
Michener, Gregory, and Otavio Ritter. 2016. "Comparing Resistance to Open Data Performance Measurement: Public Education in Brazil and the Uk." Public Administration 95(1): 4-21.
Muralidharan, Karthik, Abhijeet Singh, and Alejandro J Ganimian. 2016. "Disrupting Education?
- 4.14 -
Experimental Evidence on Technology-Aided Instruction in India." National Bureau of Economic Research.
Muralidharan, Karthik, and Venkatesh Sundararaman. 2011. "Teacher Performance Pay: Experimental Evidence from India." Journal of Political Economy 119(1): 39-77.
Murimba, Saul. 2005. "The Southern and Eastern Africa Consortium for Monitoring Educational Quality (Sacmeq): Mission, Approach and Projects." Prospects 35(1): 75-89.
Murnane, Richard J, John B Willett, M Jay Braatz, and Yves Duhaldeborde. 2001. "Do Different Dimensions of Male High School Students' Skills Predict Labor Market Success a Decade Later? Evidence from the Nlsy." Economics of Education Review 20(4): 311-20.
Neal, Derek. 2013. "The Consequences of Using One Assessment System to Pursue Two Objectives." The Journal of Economic Education 44(4): 339-52.
Neal, Derek, and Diane Whitmore Schanzenbach. 2010. "Left Behind by Design: Proficiency Counts and Test-Based Accountability." The Review of Economics and Statistics 92(2): 263-83.
Nicolai, S, L Wild, J Wales, S Hine, and J Engel. 2014. "Unbalanced Progress: What Political Dynamics Mean for Education Access and Quality." Development Progress Working Paper 5.
OECD. 2011. "Lessons from Pisa for the United States, Strong Performers and Successful Reformers in Education." OECD Publishing.
———. 2016. "Pisa 2015 Results (Volume 1): Excellence and Equity in Education." by PISA. Paris: OECD Publishing.
Peterson, Paul E, and Martin R West. 2003. No Child Left Behind?: The Politics and Practice of School Accountability. Brookings Institution Press.
Plaut, Daniel, and Molly Jamieson Eberhardt. 2015. "Bringing Learning to Light: The Role of Citizen-Led Assessments in Shifting the Education Agenda." Results for Development Institute.
Pritchett, Lant. 2013. The Rebirth of Education: Schooling Ain't Learning. Washington, DC: Center for Global Development.
Pritchett, Lant, Rukmini Banerji, and Charles Kenny. 2013. "Schooling Is Not Education! Using Assessment to Change the Politics of Non-Learning." Center for Global Development Report.
Reback, Randall. 2008. "Teaching to the Rating: School Accountability and the Distribution of Student
Achievement." Journal of Public Economics 92(5): 1394-415.
Sandefur, Justin. 2016. "Internationally Comparable Mathematics Scores for Fourteen African Countries." Working Paper 444.
———. 2017. "The Case for Global Standardized Testing." https://www.cgdev.org/blog/case-global-standardized-testing.
Schäferhoff, Marco, and Nicholas Burnett. 2016. "Rethinking the Financing and Architecture of Global Education." by SEEK Development (SEEK) and Results for Development (R4D). The International Commission on Financing Global Education Opportunity.
Sellar, Sam, and Bob Lingard. 2013. "The Oecd and Global Governance in Education." Journal of Education Policy 28(5): 710-25.
Székely, Miguel. 2011. "Toward Results-Based Social Policy Design and Implementation." Center for Global Development Working Paper No. 249.
Tanaka, Shinichiro. 2001. "Corruption in Education Sector Development: A Suggestion for Anticipatory Strategy." International Journal of Educational Management 15(4): 158-66.
The Citizen. 2013 "Shock as 60pc of Tanzania Students Fail National Exam." The East African.
UNESCO Institute for Statistics. 2016. "Laying the Foundation to Measure Sustainable Development Goal 4." Sustainable Development Data Digest. Montreal: UNESCO Institute for Statistics.
Uwezo East Africa. 2014. "Are Our Children Learning? Literacy and Numeracy across East Africa 2013." Uwezo East Africa at Twaweza: Uwezo East Africa
World Bank. 2004. "World Development Report 2004: Making Services Work for Poor People." Washington, DC: World Bank.
Worthy, Ben. 2015. "The Impact of Open Data in the Uk: Complex, Unpredictable, and Political." Public Administration 93(3): 788-805.
Xu, Duoduo, and Jaap Dronkers. 2016. "Migrant Children in Shanghai: A Research Note on the Pisa-Shanghai Controversy." Chinese Sociological Review 48(3): 271-95.
- S3.1 -
Spotlight 3 The multidimensionality of skills
S3.1 Having knowledge is not the same as being able to apply it.1 Having a skill means having is the ability to do something well. Knowing how a carburetor works doesn’t mean a person has the skill to fix one. Having a skill requires knowledge, but having knowledge does not necessarily imply having skills.2
Skills are multidimensional, dynamic, and interact
S3.2 Promoting a breadth of skills means “educating for a mastery of a wide range of competencies that will help mitigate the challenges posed by our changing world context.”3 This Report uses three broad categories of skills (figure S3.1).
• Cognitive skills refer to the “ability to understand complex ideas, to adapt effectively to the environment, to learn from experience, to engage in various forms of reasoning, to overcome obstacles by taking thought.”4 Cognitive skills are needed for learning, personal and professional development, as well as for developing other types of skills. They can be broken down into foundational skills—which include basic literacy and numeracy—and higher order skills—such as critical thinking, problem solving, oral and written communication, and adaptive learning.
• Socioemotional skills are the behaviors, attitudes, and values that an individual requires to “navigate interpersonal and social situations effectively” and “deal effectively and ethically with daily tasks and challenges.”5 Self-awareness, leadership, teamwork, self-control, and motivation are socioemotional skills.6 Sometimes referred to as non-cognitive skills, socioemotional skills include so-called personality traits which reflect enduring patterns in how individuals respond to various situations. Socioemotional work together with cognitive skills because they can be taught across disciplines, are transversal, and both are relevant to a broad range of occupations.
• Technical skills are the acquired knowledge, expertise and interactions needed by a worker for competent performance of the duties associated with a specific job. Technical skills require mastery of the knowledge, materials, tools, and technologies required to do a job.7
S3.3 Cognitive skills and socioemotional skills are reinforcing. Individuals with characteristics like drive, diligence, perseverance, or good social skills are more likely to apply themselves to acquiring cognitive skills and have positive relationships in their lives. Yet cognitive skills are distinct from socioemotional skills.8 Acquiring an early, solid base of both is critical
1 Schonfeld 2017. 2 For a discussion of alternative definitions of the term skills see Green 2011; Warhurst and others 2016. 3 Winthrop and McGivney 2016. 4 Neisser and others 1996. 5 Pierre and others 2014; Guerra, Modecki and Cunningham 2014; Cunningham, Acosta and Muller 2016. 6 John and DeFruyt 2015; Payton and others 2008; Durlak and others 2011; Kautz and others 2014; Duckworth and Yeager 2015. 7 Pierre and others 2014. 8 Kautz and others 2014.
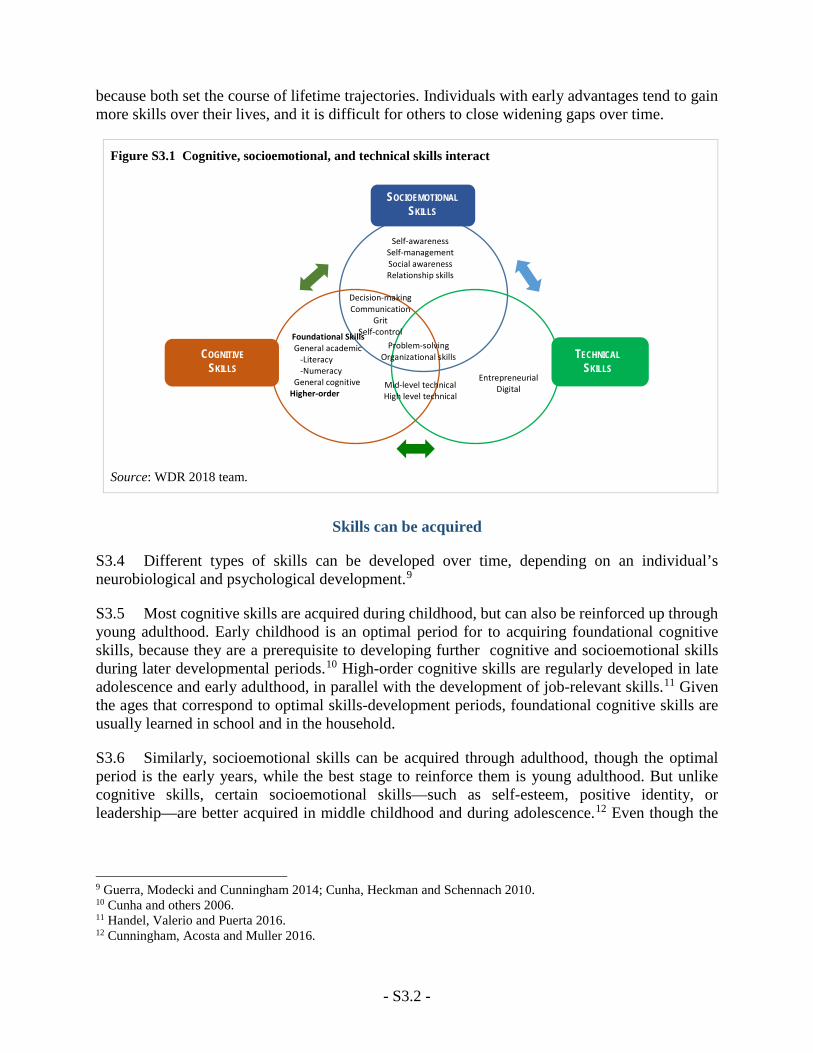
- S3.2 -
because both set the course of lifetime trajectories. Individuals with early advantages tend to gain more skills over their lives, and it is difficult for others to close widening gaps over time.
Figure S3.1 Cognitive, socioemotional, and technical skills interact
Source: WDR 2018 team.
Skills can be acquired
S3.4 Different types of skills can be developed over time, depending on an individual’s neurobiological and psychological development.9
S3.5 Most cognitive skills are acquired during childhood, but can also be reinforced up through young adulthood. Early childhood is an optimal period for to acquiring foundational cognitive skills, because they are a prerequisite to developing further cognitive and socioemotional skills during later developmental periods.10 High-order cognitive skills are regularly developed in late adolescence and early adulthood, in parallel with the development of job-relevant skills.11 Given the ages that correspond to optimal skills-development periods, foundational cognitive skills are usually learned in school and in the household.
S3.6 Similarly, socioemotional skills can be acquired through adulthood, though the optimal period is the early years, while the best stage to reinforce them is young adulthood. But unlike cognitive skills, certain socioemotional skills—such as self-esteem, positive identity, or leadership—are better acquired in middle childhood and during adolescence.12 Even though the
9 Guerra, Modecki and Cunningham 2014; Cunha, Heckman and Schennach 2010. 10 Cunha and others 2006. 11 Handel, Valerio and Puerta 2016. 12 Cunningham, Acosta and Muller 2016.
Self-awareness Self-management Social awareness Relationship skills
Decision-making Communication
Grit Self-control
Problem-solving Organizational skills
Foundational Skills General academic -Literacy -Numeracy General cognitive Higher-order
Mid-level technical High level technical
Entrepreneurial Digital
TECHNICAL SKILLS
COGNITIVE SKILLS
SOCIOEMOTIONAL SKILLS
- S3.3 -
neurobiological and psychosocial bases are already well established at this stage, socioemotional skills can also be learned well during young adulthood through new experiences.13
S3.7 Technical skills can be learned at ages and in settings that correspond to the fields of study or jobs that individuals choose. Thus these skills can be acquired though adulthood, in school and the workplace, as well as through specific training and education.14
13 Cunningham, Acosta and Muller 2016. 14 Handel and others 2016.
- S3.4 -
References
Cunha, Flavio, James J Heckman, Lance Lochner, and Dimitriy V Masterov. 2006. "Interpreting the Evidence on Life Cycle Skill Formation." Handbook of the Economics of Education 1: 697-812.
Cunha, Flavio, James J Heckman, and Susanne M Schennach. 2010. "Estimating the Technology of Cognitive and Noncognitive Skill Formation." Econometrica 78(3): 883-931.
Cunningham, Wendy, Pablo Acosta, and Noël Muller. 2016. Minds and Behaviors at Work: Boosting Socioemotional Skills for Latin America’s Workforce. World Bank Publications.
Duckworth, Angela L, and David Scott Yeager. 2015. "Measurement Matters Assessing Personal Qualities Other Than Cognitive Ability for Educational Purposes." Educational Researcher 44(4): 237-51.
Durlak, Joseph A, Roger P Weissberg, Allison B Dymnicki, Rebecca D Taylor, and Kriston B Schellinger. 2011. "The Impact of Enhancing Students’ Social and Emotional Learning: A Meta‐Analysis of School‐Based Universal Interventions." Child development 82(1): 405-32.
Green, Francis. 2011. "What Is Skill? An Inter-Disciplinary Synthesis." Centre for Learning and Life Changes in Knowledge Economies and Societies.
Guerra, Nancy, Kathryn Modecki, and Wendy Cunningham. 2014. "Developing Social-Emotional Skills for the Labor Market: The Practice Model."
Handel, Michael J, Alexandria Valerio, and Maria Laura Sánchez Puerta. 2016. "Accounting for Mismatch in Low-and Middle-Income Countries." World Bank Publications.
John, OP, and F DeFruyt. 2015. "Framework for the Longitudinal Study of Social and Emotional Skills in Cities." Paris: OECD.
Kautz, Tim, James J Heckman, Ron Diris, Bas Ter Weel, and Lex Borghans. 2014. "Fostering and Measuring Skills: Improving Cognitive and Non-Cognitive Skills to Promote Lifetime Success." National Bureau of Economic Research.
Neisser, Ulric, Gwyneth Boodoo, Thomas J Bouchard Jr, A Wade Boykin, Nathan Brody, Stephen J Ceci, Diane F Halpern, John C Loehlin, Robert Perloff, and Robert J Sternberg. 1996. "Intelligence: Knowns and Unknowns." American psychologist 51(2): 77.
Payton, John, Roger P Weissberg, Joseph A Durlak, Allison B Dymnicki, Rebecca D Taylor, Kriston B Schellinger, and Molly Pachan. 2008. "The Positive
Impact of Social and Emotional Learning for Kindergarten to Eighth-Grade Students: Findings from Three Scientific Reviews. Technical Report." Collaborative for Academic, Social, and Emotional Learning (NJ1).
Pierre, Gael, Maria Laura Sanchez-Puerta, Alexandria Valerio, and T Rajadel. 2014. "Step Skills Measurement Surveys: Innovative Tools for Assessing Skills." World Bank, Washington, DC.
Schonfeld, Manuel 2017. "Work Readiness Assessment Tools in Comparison. From Administration to Z-Scores. ." (Forthcoming) The Workd Banmk: Washington, D.C.
Warhurst, Chris, Chris Tilly, Mary Gatta, J Buchanan, D Finegold, K Mayhew, and C Warhurst. 2016. A New Social Construction of Skill. Oxford University Press Oxford.
Winthrop, Rebecca, and Eileen McGivney. 2016. "Skills for a Changing World: Advancing Quality Learning for Vibrant Societies." Washington, DC, The Brooking Institution, May.
Part III Innovations and Evidence for Learning

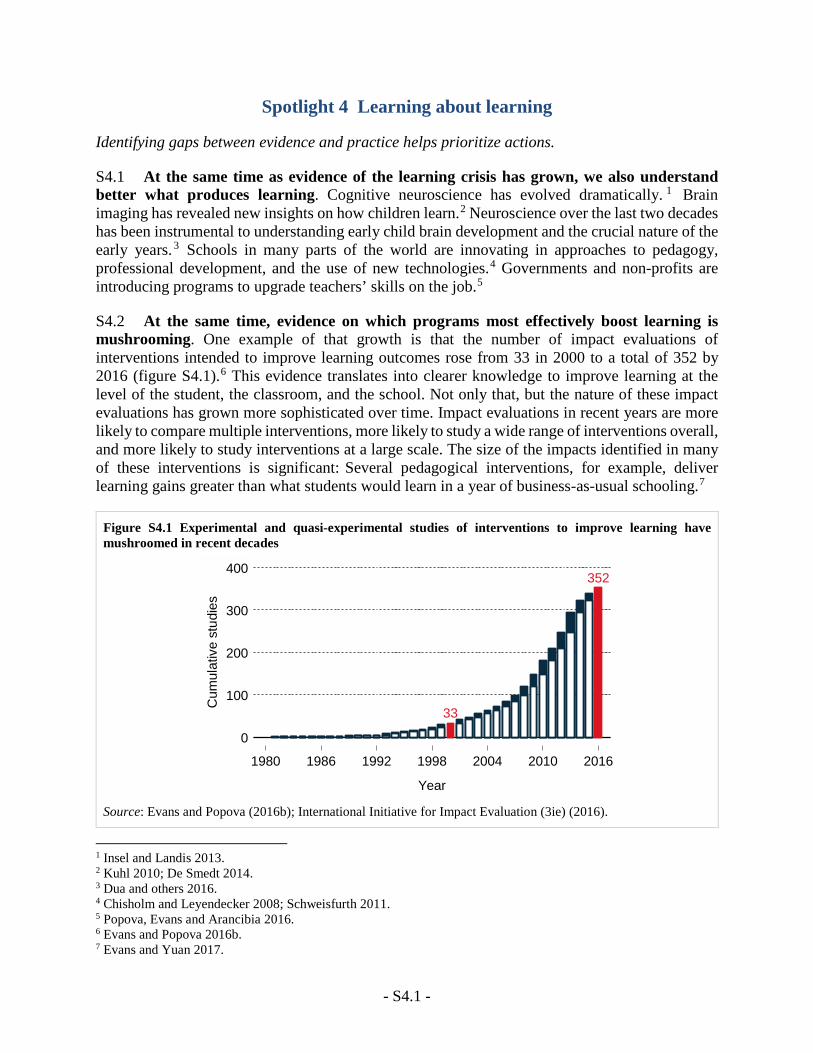
- S4.1 -
Spotlight 4 Learning about learning
Identifying gaps between evidence and practice helps prioritize actions.
S4.1 At the same time as evidence of the learning crisis has grown, we also understand better what produces learning. Cognitive neuroscience has evolved dramatically. 1 Brain imaging has revealed new insights on how children learn.2 Neuroscience over the last two decades has been instrumental to understanding early child brain development and the crucial nature of the early years. 3 Schools in many parts of the world are innovating in approaches to pedagogy, professional development, and the use of new technologies.4 Governments and non-profits are introducing programs to upgrade teachers’ skills on the job.5
S4.2 At the same time, evidence on which programs most effectively boost learning is mushrooming. One example of that growth is that the number of impact evaluations of interventions intended to improve learning outcomes rose from 33 in 2000 to a total of 352 by 2016 (figure S4.1).6 This evidence translates into clearer knowledge to improve learning at the level of the student, the classroom, and the school. Not only that, but the nature of these impact evaluations has grown more sophisticated over time. Impact evaluations in recent years are more likely to compare multiple interventions, more likely to study a wide range of interventions overall, and more likely to study interventions at a large scale. The size of the impacts identified in many of these interventions is significant: Several pedagogical interventions, for example, deliver learning gains greater than what students would learn in a year of business-as-usual schooling.7
Figure S4.1 Experimental and quasi-experimental studies of interventions to improve learning have mushroomed in recent decades
Source: Evans and Popova (2016b); International Initiative for Impact Evaluation (3ie) (2016).
1 Insel and Landis 2013. 2 Kuhl 2010; De Smedt 2014. 3 Dua and others 2016. 4 Chisholm and Leyendecker 2008; Schweisfurth 2011. 5 Popova, Evans and Arancibia 2016. 6 Evans and Popova 2016b. 7 Evans and Yuan 2017.
33
352
0
100
200
300
400
Cum
ulat
ive
stud
ies
1980 1986 1992 1998 2004 2010 2016
Year
- S4.2 -
Making better use of evidence
S4.3 Not all evidence is created equal. Evidence from many sources can be credible. Scientific evidence demonstrates the pathways of brain development and functioning. Social science evidence can effectively answer the question of what would have happened in the absence of a reform or intervention, often called the counterfactual. Randomized controlled trials or taking advantage of “natural experiments” are useful ways to determine such a counterfactual. Implementation science and case studies can provide a detailed picture of how an intervention or a phenomenon works. The best evidence of what improves learning draws from a range of methods.
S4.4 Even when an intervention has a positive impact, it may not work everywhere. Effects may differ when translating from one location to another or from a pilot study to a large-scale program. What works in Peru may not work in Burundi, as the education systems and societies are different. A common intervention which has been tested in a range of settings is to reduce class sizes. Increasing class size by 10 students reduced test scores by four times as much in Israel as it did in Kenya.8 A pilot intervention may allow for more controlled conditions than an at-scale intervention. In Kenya, an intervention to hire contract teachers was effective at a small scale, but when implemented at scale through government systems, salaries were delayed and ultimately the contract teachers were converted to civil servants.9 The scaled-up program no longer resembled the successful pilot, and the learning gains failed to materialize.
S4.5 Focus on principles rather than individual study results. To make sense of the evidence, policy makers can consider the likely principles behind effective programs rather than fixating on results (or “point estimates”) from individual studies. 10 For example, programs that provide financial incentives for teachers have had mixed effects. Rather than taking a simple average of the effects, a nuanced look reveals that these programs tend to work better when improving quality is relatively simple and within teachers’ control, by increasing teacher attendance or teaching time while at school.11
S4.6 Viewing evidence through models of human behavior is one way to focus on principles. This means examining patterns of results and using models to infer why results vary across settings. The first part of this involves nuanced synthesis, bringing together results of a range of studies and examining empirical patterns. The second part involves the use of theory—models of human behavior—to explain why some proposed solutions work and others do not, as well as why the same solution may work in one locale or time but not in another.
Producing learning is complex, but investments that change what takes place in the classroom are a good bet
S4.7 Many actors contribute to the learning process; each faces her own incentives. The direct inputs into the learning process include the choices made by the learners themselves, their parents, teachers, and other school leaders, interacting with available infrastructure and materials.
8 Pritchett and Sandefur 2013. 9 Duflo, Dupas and Kremer 2015; Bold and others 2016. 10 Muralidharan 2016. 11 Muralidharan and Sundararaman 2011.
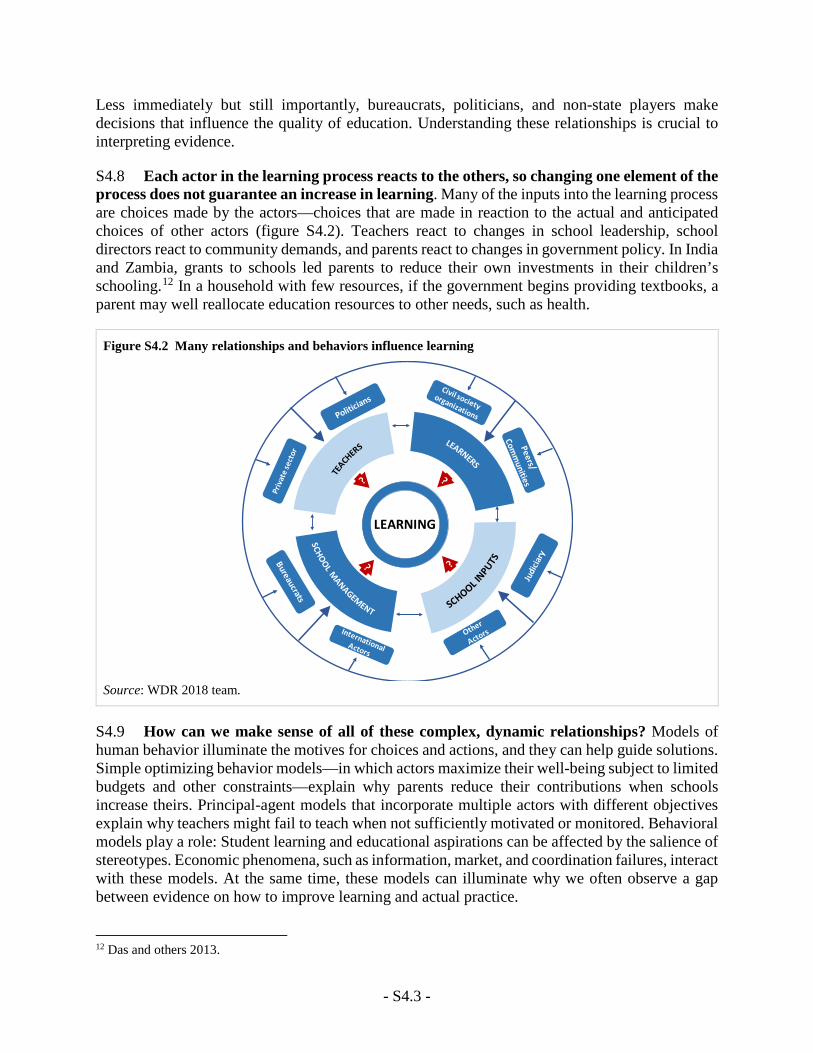
- S4.3 -
Less immediately but still importantly, bureaucrats, politicians, and non-state players make decisions that influence the quality of education. Understanding these relationships is crucial to interpreting evidence.
S4.8 Each actor in the learning process reacts to the others, so changing one element of the process does not guarantee an increase in learning. Many of the inputs into the learning process are choices made by the actors—choices that are made in reaction to the actual and anticipated choices of other actors (figure S4.2). Teachers react to changes in school leadership, school directors react to community demands, and parents react to changes in government policy. In India and Zambia, grants to schools led parents to reduce their own investments in their children’s schooling.12 In a household with few resources, if the government begins providing textbooks, a parent may well reallocate education resources to other needs, such as health.
Figure S4.2 Many relationships and behaviors influence learning
Source: WDR 2018 team.
S4.9 How can we make sense of all of these complex, dynamic relationships? Models of human behavior illuminate the motives for choices and actions, and they can help guide solutions. Simple optimizing behavior models—in which actors maximize their well-being subject to limited budgets and other constraints—explain why parents reduce their contributions when schools increase theirs. Principal-agent models that incorporate multiple actors with different objectives explain why teachers might fail to teach when not sufficiently motivated or monitored. Behavioral models play a role: Student learning and educational aspirations can be affected by the salience of stereotypes. Economic phenomena, such as information, market, and coordination failures, interact with these models. At the same time, these models can illuminate why we often observe a gap between evidence on how to improve learning and actual practice.
12 Das and others 2013.
LEARNING
- S4.4 -
Focus where the gaps between evidence and practice are largest
S4.10 Gaps between evidence and actual practice provide entry points to improve education. These gaps exist when evidence shows that certain approaches or interventions can improve outcomes, but the approaches used in practice are different. 13 For example, the accumulated research evidence demonstrates high returns to early child investments, yet families and governments in low-income environments invest relatively little in these. Evidence shows that certain types of teacher professional development deliver much higher learning gains than others, but outdated training methods persist.14 Because the gap between evidence and practice requires good information on what the evidence says as well as what current practice is, there are likely many opportunities for improvement yet to be discovered.
S4.11 Intuition and common sense are not enough. One fundamental lesson from the growing evidence base is that intuition is not always a trustworthy guide. It may miss the complexity of motivates and reactions in the real world, as can happen when teacher financial incentives induce cheating rather than increased effort,15 or when removal of a teacher incentive program that is ineffective on average actually leaves some learners worse off than before.16 Intuition may fail to capture the net effect of conflicting forces, as when separating students by ability simultaneously allows teachers to target teaching more specifically to the students’ level—which should increase their learning—but also distances them from their high-performing peers—which may decrease their learning.
S4.12 Knowledge about improving learning must take the costs as well as the benefits of learning interventions into account. A computer-assisted learning intervention in India increased learning more than employing contract teachers in Kenya, but hiring contract teachers was so much cheaper that it delivered a higher return on investment.17 The evidence base on costs is much thinner than that on benefits, with a tiny fraction of studies examining both costs and effectiveness. 18 But some programs have been evaluated on both effectiveness and cost effectiveness. 19 This evidence on costs—adapted to local contexts—should qualify policy recommendations.20
S4.13 The gap between evidence and practice signals promising places to start, rather than the end of learning how to improve learning. Interventions cannot simply be exported from one country to another. Indeed, at times the effectiveness of an apparently similar intervention can vary even within a country, depending on how the program is implemented. 21 The cost of implementation will also vary dramatically across contexts.22 But this does not mean that evidence from other contexts is without value. On the contrary, successes in other environments—coupled with a careful analysis of why the programs work—provide a starting point. Policy makers can draw on this evidence and experiment in their own policy environment.
13 Pakenham-Walsh 2004; Montagu and Goodman 2016. 14 Lauwerier and Akkari 2015. 15 Jacob and Levitt 2003; Glazerman, McKie and Carey 2009. 16 Glazerman, McKie and Carey 2009; Jinnai 2016. 17 Kremer, Brannen and Glennerster 2013. 18 McEwan 2015. 19 Kremer, Brannen and Glennerster 2013. 20 Evans and Popova 2016a. 21 Bold and others 2016; Kerwin and Thornton 2015. 22 Evans and Popova 2016a.
- S4.5 -
References
Bold, Tessa, Mwangi Kimenyi, Germano Mwabu, Alice Ng'ang'a, and Justin Sandefur. 2016. "Experimental Evidence on Scaling up Education Reforms in Kenya." Unpublished manuscript.
Chisholm, Linda, and Ramon Leyendecker. 2008. "Curriculum Reform in Post-1990s Sub-Saharan Africa." International Journal of Educational Development 28(2): 195-205.
Das, Jishnu, Stefan Dercon, James Habyarimana, Pramila Krishnan, Karthik Muralidharan, and Venkatesh Sundararaman. 2013. "School Inputs, Household Substitution, and Test Scores." American Economic Journal: Applied Economics 5(2): 29-57.
De Smedt, Bert. 2014. "Advances in the Use of Neuroscience Methods in Research on Learning and Instruction " Frontline Learning research 2(4): 7-14.
Dua, Tarun, Mark Tomlinson, Elizabeth Tablante, Pia Britto, Aisha Yousfzai, Bernadette Daelmans, and Gary L. Darmstadt. 2016. "Global Research Priorities to Accelerate Early Child Development in the Sustainable Development Era." The Lancet Global Health.
Duflo, Esther, Pascaline Dupas, and Michael Kremer. 2015. "School Governance, Teacher Incentives, and Pupil–Teacher Ratios: Experimental Evidence from Kenyan Primary Schools." Journal of Public Economics 123: 92-110.
Evans, David K, and Anna Popova. 2016a. "Cost-Effectiveness Analysis in Development: Accounting for Local Costs and Noisy Impacts." World Development 77: 262-76.
Evans, David K, and Fei Yuan. 2017. "Economic Returns to Interventions That Increased Learning." Working Paper, The World Bank.
Evans, David K., and Anna Popova. 2016b. "What Really Works to Improve Learning in Developing Countries? An Analysis of Divergent Findings in Systematic Reviews." World Bank Research Observer 31(2): 242-70.
Glazerman, Steven, Allison McKie, and Nancy Carey. 2009. "An Evaluation of the Teacher Advancement Program (Tap) in Chicago: Year One Impact Report. Final Report." Mathematica Policy Research, Inc.
Insel, Thomas R, and Story C Landis. 2013. "Twenty-Five Years of Progress: The View from Nimh and Ninds." Neuron 80(3): 561-67.
International Initiative for Impact Evaluation (3ie). 2016. "Impact Evaluation Repository."
Jacob, Brian A. , and Steven D. Levitt. 2003. "Rotten Apples: An Investigation of the Prevalence and Predictors of Teacher Cheating." Quarterly Journal of Economics 118(3): 843-78.
Jinnai, Yusuke. 2016. "To Introduce or Not to Introduce Monetary Bonuses: The Cost of Repealing Teacher Incentives." Economics and Management Series. International University of Japan. http://www.iuj.ac.jp/research/workingpapers/EMS_2016_08.pdf.
Kerwin, Jason T, and Rebecca Thornton. 2015. "Making the Grade: Understanding What Works for Teaching Literacy in Rural Uganda."
Kremer, Michael, Conner Brannen, and Rachel Glennerster. 2013. "The Challenge of Education and Learning in the Developing World." Science 340(6130): 297-300.
Kuhl, Patricia K. 2010. "Brain Mechanisms in Early Language Acquisition." Neuron 67(5): 713-27.
Lauwerier, Thibaut, and Abdeljalil Akkari. 2015. "Teachers and the Quality of Basic Education in Sub-Saharan Africa." Education Research and Foresight: Working Papers Series, 2015, no.11.
McEwan, Patrick J. 2015. "Improving Learning in Primary Schools of Developing Countries: A Meta-Analysis of Randomized Experiments " Review of Educational Research 85(3): 353-94.
Montagu, Dominic, and Catherine Goodman. 2016. "Prohibit, Constrain, Encourage, or Purchase: How Should We Engage with the Private Health-Care Sector?" The Lancet 388(10044): 613-21.
Muralidharan, Karthik. 2016. "Field Experiments in Education in Developing Countries " Unpublished manuscript.
Muralidharan, Karthik, and Venkatesh Sundararaman. 2011. "Teacher Performance Pay: Experimental Evidence from India." The Journal of Political Economy 119(1): 39-77.
Pakenham-Walsh, Neil. 2004. "Learning from One Another to Bridge the “Know-Do Gap”." BMJ 329(7475): 1189.
Popova, Anna, David K. Evans, and Violeta Arancibia. 2016. "Training Teachers on the Job: What Works and How to Measure It." World Bank Policy Research Working Paper 7834. http://documents.worldbank.org/curated/en/122031474915232609/Training-teachers-on-the-job-what-works-and-how-to-measure-it.
Pritchett, Lant, and Justin Sandefur. 2013. "Context Matters for Size: Why External Validity Claims and
- S4.6 -
Development Practice Do Not Mix." Journal of Globalization and Development 4(2): 161-98.
Schweisfurth, Michele. 2011. "Learner-Centred Education in Developing Country Contexts: From Solution to Problem?" International Journal of Educational Development 31(5): 425-32.
- 5.1 -
Chapter 5 There is no learning without prepared, motivated learners
Contents
Investing in their early years prepares learners for school ............................................................................ 3
Recognizing the dangers that poverty poses to children’s development and learning ............................. 3
Strengthening children’s ability to learn with well-designed interventions ............................................. 5
Bringing it all together .............................................................................................................................. 8
Providing demand-side support can get kids to school, but not necessarily to learn .................................... 8
Using remedial initiatives can prepare learners for further education and training .................................... 12
Remedial prevention programs can help low-performing students and keep them in school ................ 14
Second chance programs offer youth a way to return to education and obtain training ......................... 15
Post-secondary remedial education programs can help youth succeed in their programs of study ........ 16
Early investments make a major difference in preparing learners to thrive in the classroom. Gaps between evidence on good practice and what happens signal that it is essential to ensure children are prepared by providing early investments, getting them into school, and ensuring that their basic education prepares them for further skills training.
5.1 Schools cannot produce learning without prepared, present, motivated learners. Around the world, many children receive limited investments in their early years. Few young children have access to quality early learning opportunities that prepare them for first grade. The one in four children worldwide who are stunted cannot achieve their potential in school.1 Neither can the 263 million young people who do not make it to school at all. Among those who do attend, motivation will likely be low when the quality of education is low. Quality failures in basic education mean that learners who should be gaining advanced skills in tertiary education or technical training lack the preparation to do so. 2 Thus fundamental investments for primary education actually come before primary education; the same goes for skills training. In many cases the failures observed can be illuminated through models of human behavior, which also suggest solutions (table 5.1). A synthesis of the evidence in these areas lends itself to three key principles for improving learning for learners:
• To set children on high-development trajectories, foster cognitive and socioemotional development through early child nutrition, care, stimulation, and learning opportunities.
• To get children into school—an essential first step to learning—lower school costs, then use other tools to boost motivation for learning.
• To address the fact that so many youth leave basic education lacking skills, recognize that remediation often needs to be the first step in further education and training.
1 United Nations Children's Fund, World Health Organization and World Bank Group 2016. 2 Hungi 2010.
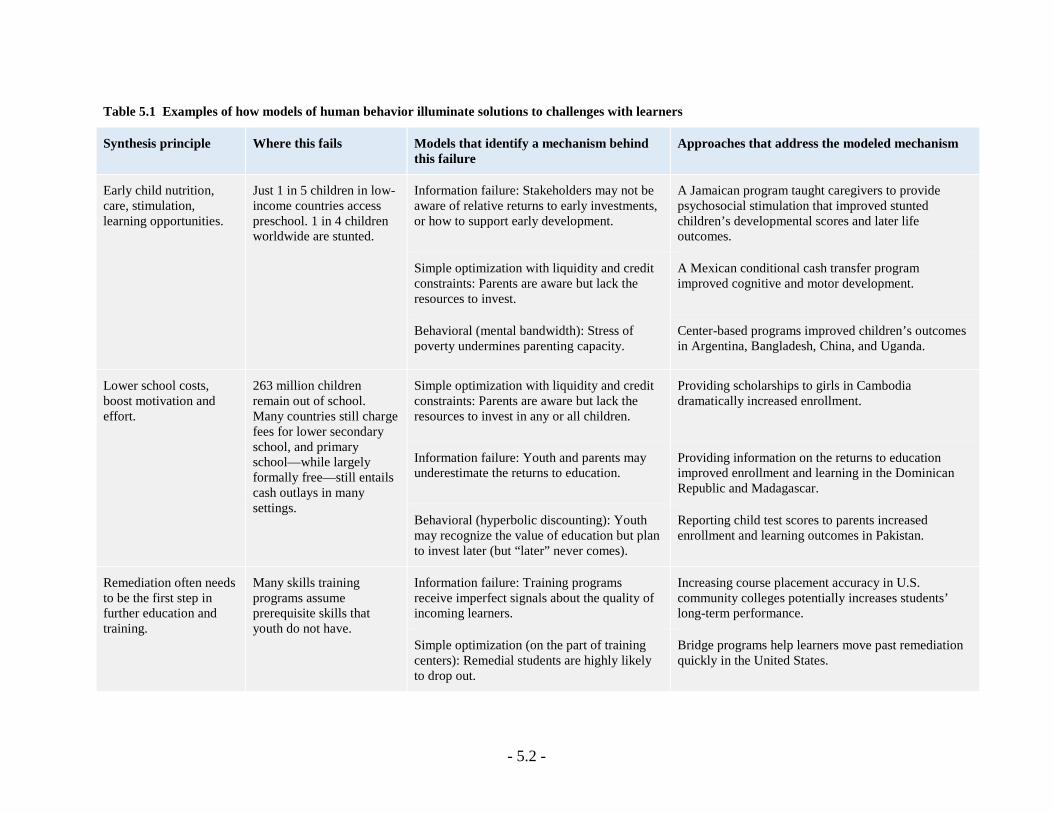
- 5.2 -
Table 5.1 Examples of how models of human behavior illuminate solutions to challenges with learners
Synthesis principle Where this fails Models that identify a mechanism behind this failure
Approaches that address the modeled mechanism
Early child nutrition, care, stimulation, learning opportunities.
Just 1 in 5 children in low-income countries access preschool. 1 in 4 children worldwide are stunted.
Information failure: Stakeholders may not be aware of relative returns to early investments, or how to support early development.
A Jamaican program taught caregivers to provide psychosocial stimulation that improved stunted children’s developmental scores and later life outcomes.
Simple optimization with liquidity and credit constraints: Parents are aware but lack the resources to invest.
A Mexican conditional cash transfer program improved cognitive and motor development.
Behavioral (mental bandwidth): Stress of poverty undermines parenting capacity.
Center-based programs improved children’s outcomes in Argentina, Bangladesh, China, and Uganda.
Lower school costs, boost motivation and effort.
263 million children remain out of school. Many countries still charge fees for lower secondary school, and primary school—while largely formally free—still entails cash outlays in many settings.
Simple optimization with liquidity and credit constraints: Parents are aware but lack the resources to invest in any or all children.
Providing scholarships to girls in Cambodia dramatically increased enrollment.
Information failure: Youth and parents may underestimate the returns to education.
Providing information on the returns to education improved enrollment and learning in the Dominican Republic and Madagascar.
Behavioral (hyperbolic discounting): Youth may recognize the value of education but plan to invest later (but “later” never comes).
Reporting child test scores to parents increased enrollment and learning outcomes in Pakistan.
Remediation often needs to be the first step in further education and training.
Many skills training programs assume prerequisite skills that youth do not have.
Information failure: Training programs receive imperfect signals about the quality of incoming learners.
Increasing course placement accuracy in U.S. community colleges potentially increases students’ long-term performance.
Simple optimization (on the part of training centers): Remedial students are highly likely to drop out.
Bridge programs help learners move past remediation quickly in the United States.
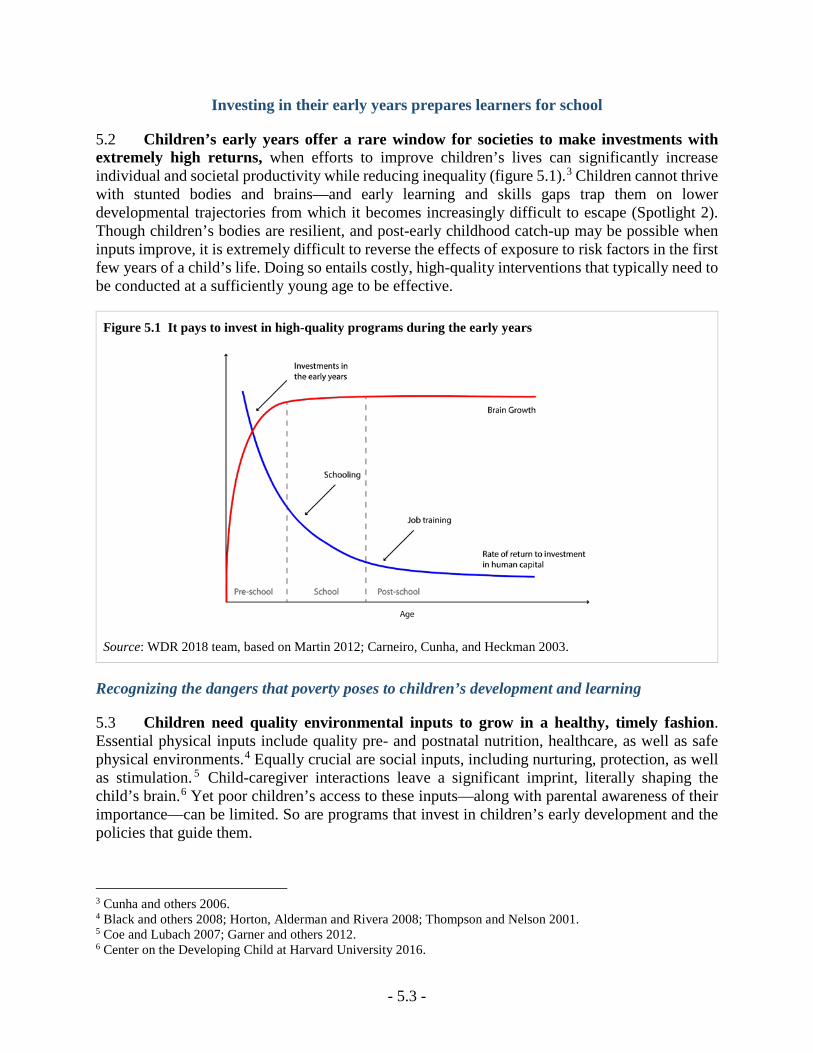
- 5.3 -
Investing in their early years prepares learners for school
5.2 Children’s early years offer a rare window for societies to make investments with extremely high returns, when efforts to improve children’s lives can significantly increase individual and societal productivity while reducing inequality (figure 5.1).3 Children cannot thrive with stunted bodies and brains—and early learning and skills gaps trap them on lower developmental trajectories from which it becomes increasingly difficult to escape (Spotlight 2). Though children’s bodies are resilient, and post-early childhood catch-up may be possible when inputs improve, it is extremely difficult to reverse the effects of exposure to risk factors in the first few years of a child’s life. Doing so entails costly, high-quality interventions that typically need to be conducted at a sufficiently young age to be effective.
Figure 5.1 It pays to invest in high-quality programs during the early years
Source: WDR 2018 team, based on Martin 2012; Carneiro, Cunha, and Heckman 2003.
Recognizing the dangers that poverty poses to children’s development and learning
5.3 Children need quality environmental inputs to grow in a healthy, timely fashion. Essential physical inputs include quality pre- and postnatal nutrition, healthcare, as well as safe physical environments.4 Equally crucial are social inputs, including nurturing, protection, as well as stimulation. 5 Child-caregiver interactions leave a significant imprint, literally shaping the child’s brain.6 Yet poor children’s access to these inputs—along with parental awareness of their importance—can be limited. So are programs that invest in children’s early development and the policies that guide them.
3 Cunha and others 2006. 4 Black and others 2008; Horton, Alderman and Rivera 2008; Thompson and Nelson 2001. 5 Coe and Lubach 2007; Garner and others 2012. 6 Center on the Developing Child at Harvard University 2016.
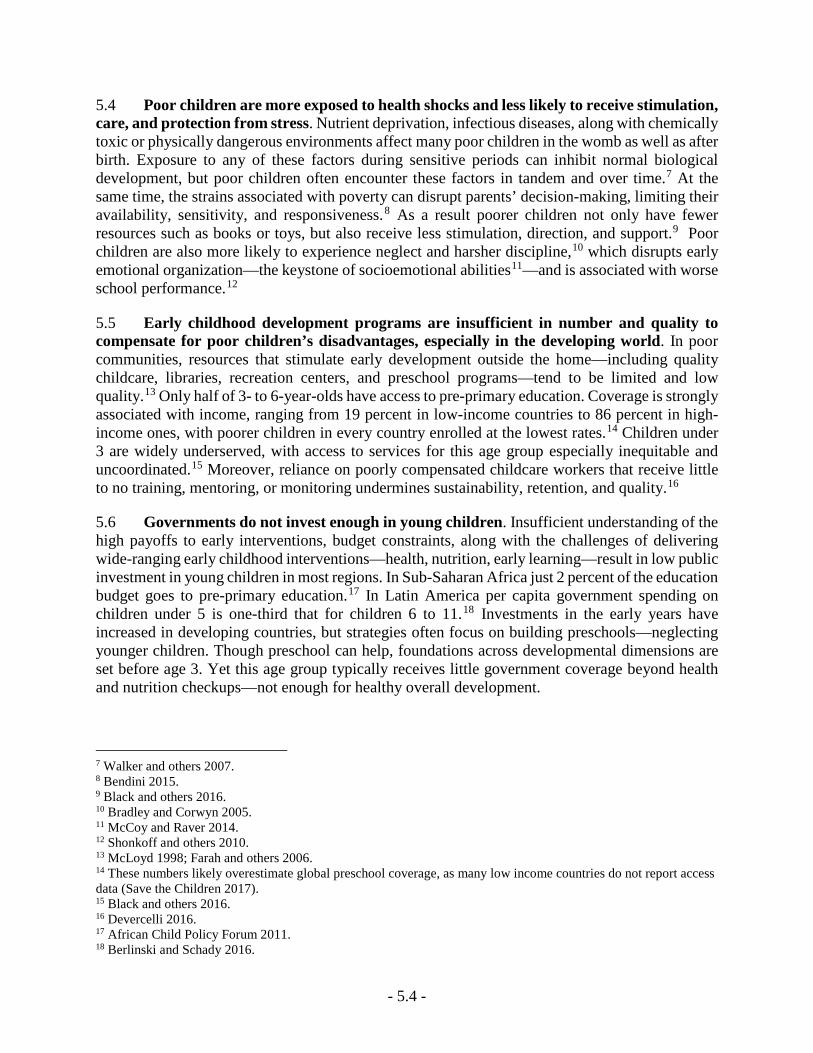
- 5.4 -
5.4 Poor children are more exposed to health shocks and less likely to receive stimulation, care, and protection from stress. Nutrient deprivation, infectious diseases, along with chemically toxic or physically dangerous environments affect many poor children in the womb as well as after birth. Exposure to any of these factors during sensitive periods can inhibit normal biological development, but poor children often encounter these factors in tandem and over time.7 At the same time, the strains associated with poverty can disrupt parents’ decision-making, limiting their availability, sensitivity, and responsiveness.8 As a result poorer children not only have fewer resources such as books or toys, but also receive less stimulation, direction, and support.9 Poor children are also more likely to experience neglect and harsher discipline,10 which disrupts early emotional organization—the keystone of socioemotional abilities11—and is associated with worse school performance.12
5.5 Early childhood development programs are insufficient in number and quality to compensate for poor children’s disadvantages, especially in the developing world. In poor communities, resources that stimulate early development outside the home—including quality childcare, libraries, recreation centers, and preschool programs—tend to be limited and low quality.13 Only half of 3- to 6-year-olds have access to pre-primary education. Coverage is strongly associated with income, ranging from 19 percent in low-income countries to 86 percent in high-income ones, with poorer children in every country enrolled at the lowest rates.14 Children under 3 are widely underserved, with access to services for this age group especially inequitable and uncoordinated.15 Moreover, reliance on poorly compensated childcare workers that receive little to no training, mentoring, or monitoring undermines sustainability, retention, and quality.16
5.6 Governments do not invest enough in young children. Insufficient understanding of the high payoffs to early interventions, budget constraints, along with the challenges of delivering wide-ranging early childhood interventions—health, nutrition, early learning—result in low public investment in young children in most regions. In Sub-Saharan Africa just 2 percent of the education budget goes to pre-primary education.17 In Latin America per capita government spending on children under 5 is one-third that for children 6 to 11.18 Investments in the early years have increased in developing countries, but strategies often focus on building preschools—neglecting younger children. Though preschool can help, foundations across developmental dimensions are set before age 3. Yet this age group typically receives little government coverage beyond health and nutrition checkups—not enough for healthy overall development.
7 Walker and others 2007. 8 Bendini 2015. 9 Black and others 2016. 10 Bradley and Corwyn 2005. 11 McCoy and Raver 2014. 12 Shonkoff and others 2010. 13 McLoyd 1998; Farah and others 2006. 14 These numbers likely overestimate global preschool coverage, as many low income countries do not report access data (Save the Children 2017). 15 Black and others 2016. 16 Devercelli 2016. 17 African Child Policy Forum 2011. 18 Berlinski and Schady 2016.
- 5.5 -
5.7 Early exposure to risks associated with poverty may prevent children from realizing the promise of education. Intense deprivation can result in poor developmental outcomes—including stunted growth and impaired brain development—that are difficult to address (figure 5.2; Spotlight 2). Children who have fallen behind in their physical, cognitive, linguistic, or socioemotional development are more likely to enter grade 1 late, score poorly in school, repeat grades, drop out before they complete primary school, experience poor health throughout their lives, engage in high-risk behavior (particularly in adolescence), be less productive, and have lower earnings.19 The scale of the problem is vast: nearly half of children under 5 in developing countries are stunted or live in extreme poverty,20 threatening their prospects of benefiting from the opportunities that education can provide.21
Figure 5.2 Brain structure and wiring by stunting status
The images illustrate two 2-3-month-old infants. The first’s growth was stunted by malnutrition (top image). The second’s was not (bottom image). The images were obtained in Dhaka, Bangladesh using Magnetic Resonance Imaging (MRI). The left side of the panel shows the left side of the head. Each gold line represents a fiber tract—the long, thin fibers (axons) in the brain that connect each other. What is apparent here is how much denser and more elaborate the connections are in the non-stunted infant. The colored images on the right side illustrate the same principles (neural connections) from a different orientation—a cross-section of the brain, from front to back.
Source: Nelson and others (forthcoming).
Strengthening children’s ability to learn with well-designed interventions
5.8 Effective early childhood interventions can significantly improve poor children’s ability to learn. In the United States at-risk children who participated in well-designed interventions—Perry Preschool, Abecedarian, the Nurse-Family Partnership—benefited well beyond their early years, with improved school performance, lifetime employment, income,
19 Naudeau 2011. 20 Black and others 2016. 21 This is likely an underestimate of the true number of young children who are at risk of not reaching their developmental potential given the multiple risk factors associated with poverty.
Never stunted growth representative infant
Stunted growth representative infant
- 5.6 -
overall welfare, as well as social integration. Such interventions have substantial potential in developing countries given their lower baselines. In Jamaica the Reach Up and Learn program, which promoted early child stimulation, led to lower crime rates, better mental health, and 25 percent higher earnings two decades later. There is consensus on what children need: nutrition, care, stimulation, nurturing, and protection. The evidence on when to implement programs is in line with biological evidence: prevention and early remediation are most cost-effective at specific points in development, as adjustments beyond sensitive periods are difficult, costly, and usually incomplete. But identifying the most effective approaches to improve poor children’s developmental outcomes has proven challenging given the enormous heterogeneity in interventions as well as contexts. Still, several approaches show promise.
5.9 Health and nutrition interventions during the first 1,000 days of life improve children’s development. 22 Programs that increase access to maternal health services before, during, and after giving birth improve maternal nutrition through diet, supplements, and fortification, reduce child mortality and instances of low birth weight, stunting, as well as early health problems.23 In isolation, nutritional interventions for children have only modest effects on height or stunting.24 But when combined with improved sanitation, along with access to child health services, nutritional interventions can yield significant benefits. 25 Breastfeeding and micronutrient supplements are associated with better health and greater cognitive ability, leading to better educational outcomes in developing countries.26 Deworming, iodine supplements, and immunizations have also led to major improvements in children’s ability to learn.27
5.10 Programs that build caregivers’ capacity to support healthy development can substantially improve children’s outcomes. Interventions include coaching caregivers at home on positive discipline as well as promoting increased frequency of quality interventions through nurturing, protection, and stimulating activities (storytelling, singing, playing with household objects). Such interventions have been delivered in diverse ways, including home visits, community meetings, and health check-ups. 28 The most effective programs have systematic training and curriculums, as well as opportunities for parents to practice and receive feedback.29 There is also an emerging generation of programs that incentivize parents through positive reinforcements, with indirect “nudges” when providing information is insufficient or when beliefs or norms are detrimental.30
5.11 Programs that provide cash or psychosocial support to caregivers complement interventions to improve parenting. Transfer programs can address acute material deprivation in households and improve developmental outcomes, particularly when provided alongside—or conditional on—prenatal care and child services. For example, conditional cash transfer (CCT) programs in Ecuador, Mexico, and Nicaragua have reduced stunting, improved cognitive
22 Starting at conception. 23 Bhutta and others 2013; Britto and others 2016. 24 Galasso and Wagstaff 2016. 25 Skoufias 2016; Galasso and Wagstaff 2016. 26 Horta, Loret de Mola and Victora 2015; Eilander and others 2009. 27 Galasso and Wagstaff 2016. 28 Currie and Almond 2011; Baker-Henningham and López Bóo 2010. 29 Aboud 2015; Britto and others 2016. 30 For a review, see World Bank 2014.
- 5.7 -
development, and promoted better parenting practices.31 In Mexico parenting support programs integrated with CCT programs improved child outcomes beyond the direct effects of the transfers. 32 Importantly, transfer programs can alleviate parental time and psychological constraints. In addition, interventions delivered by supervised, nonspecialist health or community workers to address acute maternal stress, depression, and anxiety have led to better cognitive development, more physical growth, less diarrhea, and higher immunizations rates.33
5.12 Center-based care can promote foundational skills. In countries from Ethiopia to the United States, high-quality center-based programs have shown substantial benefits in developing children’s language, cognitive, motor, and socioemotional skills.34 By contrast, attending a low-quality center-based program can be worse than attending none at all.35 The quality of child-caregiver interactions is a key determinant of such programs’ impact—as shown by Indonesia and Mozambique, which saw cognitive benefits for children 3–6 from a center-based approach that provided quality interactions and stimulation from trained caregivers with minimal infrastructure investments.36 Delivering quality center-based interventions is harder for children under 3 because they require costlier structural investments (e.g., lower child to staff ratios). Consequently, programs to build parenting capacity might be most cost-effective for children under 3 in resource-constrained environments or to reach marginalized populations.37
Box 5.1 Early childhood education: preparing young children for school
Preschool programs—targeting children age 3 to 6—can foster foundational skills and boost children’s ability to learn. Children who attend preschool have higher attendance and better achievement in primary school, are less likely to repeat, drop-out, or need remedial or special education, all highly beneficial to students, as well as education systems since efficiency is increased.38 In both rich and poor countries, the most disadvantaged children benefit most from quality early child education programs.39 But not all early child education programs are equally effective; overly academic and structured programs for children under 5 may undermine their cognitive and socio-emotional skills, as well as motivation to learn because young children learn best through exploration, play and interacting with others. 40 Key elements of programs that have led to strong pre-school outcomes include: (i) curriculums that foster crucial pre-academic abilities (emotional security, curiosity, language, self-regulation) through play; (ii) professional development plus coaching that enables teachers to effectively implement relevant curricula; and (iii) positive, engaging classrooms that promote children’s innate drive to learn.41 For early child education gains to be sustained, preschool programs’ content, budget, and capacity of providers should be integrated into formal education systems. In addition, the quality of subsequent learning environments in primary school is an important determinant of the long-term effects of preschool programs.42
31 Britto and others 2016, World Bank 2014. 32 Denboba and others 2014. 33 Rahman and others 2013. 34 Berlinski, Galiani and Gertler 2008; Engle and others 2011; Rao and others 2014; García and others 2016; Favara forthcoming . 35 Bouguen and others 2013; Rosero and Oosterbeek 2011. 36 Martinez, Naudeau and Pereira 2012; Nakajima and others 2016. 37 However, center-based care can have the important added benefit of easing labor force participation or further skills acquisition among parents, especially mothers. 38 Klees 2017. 39 Britto and others 2016. 40 Whitebread, Kuvalja and O'Connor 2016. 41 Phillips and others 2017. 42 Johnson and Jackson 2017.
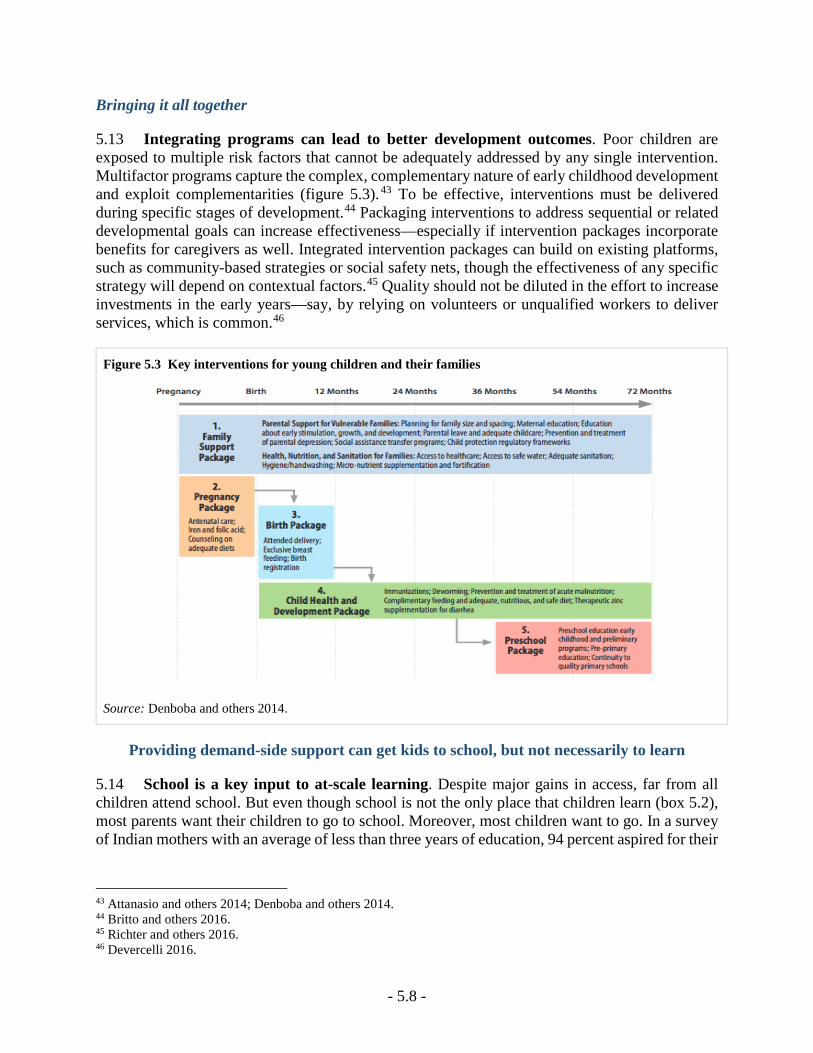
- 5.8 -
Bringing it all together
5.13 Integrating programs can lead to better development outcomes. Poor children are exposed to multiple risk factors that cannot be adequately addressed by any single intervention. Multifactor programs capture the complex, complementary nature of early childhood development and exploit complementarities (figure 5.3).43 To be effective, interventions must be delivered during specific stages of development.44 Packaging interventions to address sequential or related developmental goals can increase effectiveness—especially if intervention packages incorporate benefits for caregivers as well. Integrated intervention packages can build on existing platforms, such as community-based strategies or social safety nets, though the effectiveness of any specific strategy will depend on contextual factors.45 Quality should not be diluted in the effort to increase investments in the early years—say, by relying on volunteers or unqualified workers to deliver services, which is common.46
Figure 5.3 Key interventions for young children and their families
Source: Denboba and others 2014.
Providing demand-side support can get kids to school, but not necessarily to learn
5.14 School is a key input to at-scale learning. Despite major gains in access, far from all children attend school. But even though school is not the only place that children learn (box 5.2), most parents want their children to go to school. Moreover, most children want to go. In a survey of Indian mothers with an average of less than three years of education, 94 percent aspired for their
43 Attanasio and others 2014; Denboba and others 2014. 44 Britto and others 2016. 45 Richter and others 2016. 46 Devercelli 2016.
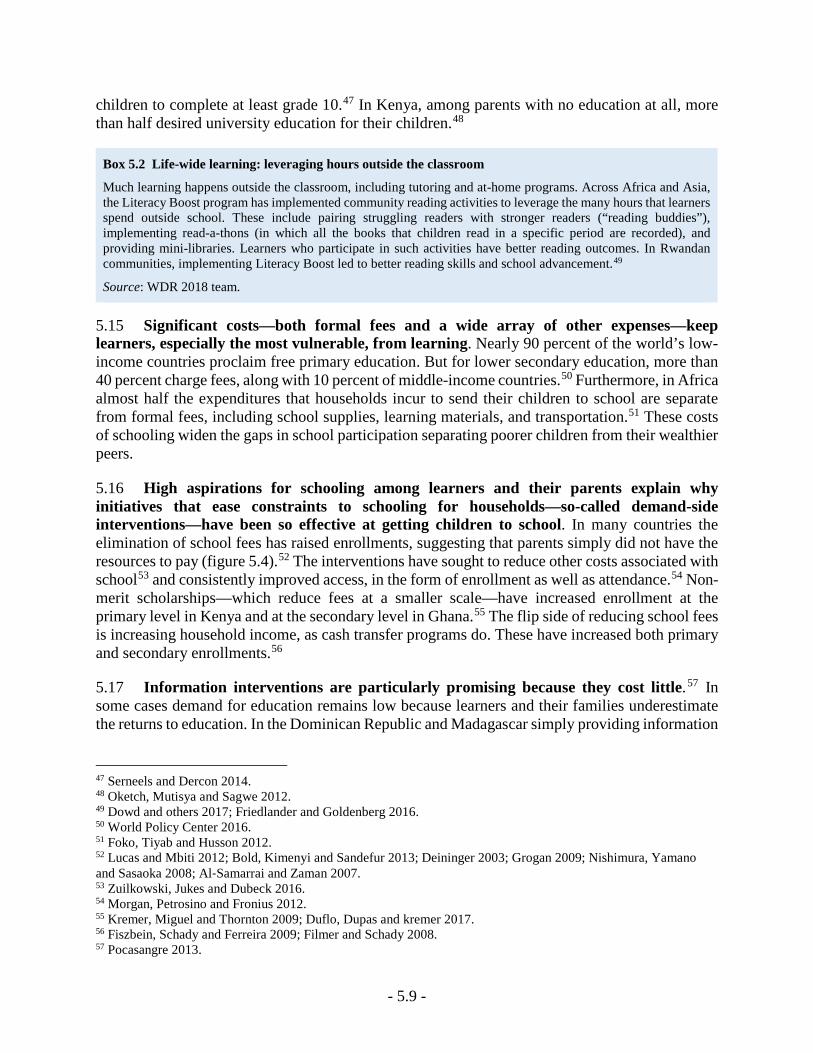
- 5.9 -
children to complete at least grade 10.47 In Kenya, among parents with no education at all, more than half desired university education for their children.48
Box 5.2 Life-wide learning: leveraging hours outside the classroom
Much learning happens outside the classroom, including tutoring and at-home programs. Across Africa and Asia, the Literacy Boost program has implemented community reading activities to leverage the many hours that learners spend outside school. These include pairing struggling readers with stronger readers (“reading buddies”), implementing read-a-thons (in which all the books that children read in a specific period are recorded), and providing mini-libraries. Learners who participate in such activities have better reading outcomes. In Rwandan communities, implementing Literacy Boost led to better reading skills and school advancement.49
Source: WDR 2018 team.
5.15 Significant costs—both formal fees and a wide array of other expenses—keep learners, especially the most vulnerable, from learning. Nearly 90 percent of the world’s low-income countries proclaim free primary education. But for lower secondary education, more than 40 percent charge fees, along with 10 percent of middle-income countries.50 Furthermore, in Africa almost half the expenditures that households incur to send their children to school are separate from formal fees, including school supplies, learning materials, and transportation.51 These costs of schooling widen the gaps in school participation separating poorer children from their wealthier peers.
5.16 High aspirations for schooling among learners and their parents explain why initiatives that ease constraints to schooling for households—so-called demand-side interventions—have been so effective at getting children to school. In many countries the elimination of school fees has raised enrollments, suggesting that parents simply did not have the resources to pay (figure 5.4).52 The interventions have sought to reduce other costs associated with school53 and consistently improved access, in the form of enrollment as well as attendance.54 Non-merit scholarships—which reduce fees at a smaller scale—have increased enrollment at the primary level in Kenya and at the secondary level in Ghana.55 The flip side of reducing school fees is increasing household income, as cash transfer programs do. These have increased both primary and secondary enrollments.56
5.17 Information interventions are particularly promising because they cost little. 57 In some cases demand for education remains low because learners and their families underestimate the returns to education. In the Dominican Republic and Madagascar simply providing information
47 Serneels and Dercon 2014. 48 Oketch, Mutisya and Sagwe 2012. 49 Dowd and others 2017; Friedlander and Goldenberg 2016. 50 World Policy Center 2016. 51 Foko, Tiyab and Husson 2012. 52 Lucas and Mbiti 2012; Bold, Kimenyi and Sandefur 2013; Deininger 2003; Grogan 2009; Nishimura, Yamano and Sasaoka 2008; Al‐Samarrai and Zaman 2007. 53 Zuilkowski, Jukes and Dubeck 2016. 54 Morgan, Petrosino and Fronius 2012. 55 Kremer, Miguel and Thornton 2009; Duflo, Dupas and kremer 2017. 56 Fiszbein, Schady and Ferreira 2009; Filmer and Schady 2008. 57 Pocasangre 2013.
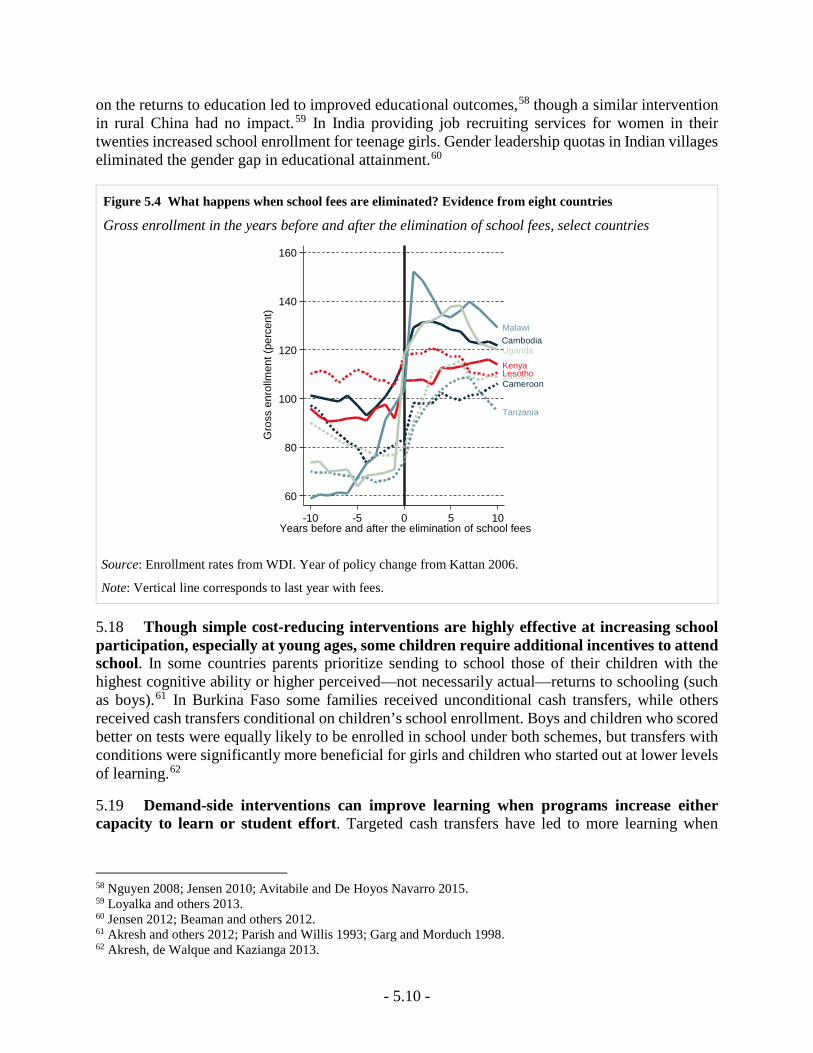
- 5.10 -
on the returns to education led to improved educational outcomes,58 though a similar intervention in rural China had no impact.59 In India providing job recruiting services for women in their twenties increased school enrollment for teenage girls. Gender leadership quotas in Indian villages eliminated the gender gap in educational attainment.60
Figure 5.4 What happens when school fees are eliminated? Evidence from eight countries
Gross enrollment in the years before and after the elimination of school fees, select countries
Source: Enrollment rates from WDI. Year of policy change from Kattan 2006.
Note: Vertical line corresponds to last year with fees.
5.18 Though simple cost-reducing interventions are highly effective at increasing school participation, especially at young ages, some children require additional incentives to attend school. In some countries parents prioritize sending to school those of their children with the highest cognitive ability or higher perceived—not necessarily actual—returns to schooling (such as boys).61 In Burkina Faso some families received unconditional cash transfers, while others received cash transfers conditional on children’s school enrollment. Boys and children who scored better on tests were equally likely to be enrolled in school under both schemes, but transfers with conditions were significantly more beneficial for girls and children who started out at lower levels of learning.62
5.19 Demand-side interventions can improve learning when programs increase either capacity to learn or student effort. Targeted cash transfers have led to more learning when
58 Nguyen 2008; Jensen 2010; Avitabile and De Hoyos Navarro 2015. 59 Loyalka and others 2013. 60 Jensen 2012; Beaman and others 2012. 61 Akresh and others 2012; Parish and Willis 1993; Garg and Morduch 1998. 62 Akresh, de Walque and Kazianga 2013.
Cambodia
Cameroon
KenyaLesotho
Malawi
Tanzania
Uganda
Zambia
60
80
100
120
140
160G
ross
enr
ollm
ent (
perc
ent)
-10 -5 0 5 10Years before and after the elimination of school fees
- 5.11 -
framed to induce more effort,63 as have some information interventions.64 Even in the context of the learning crisis, students learn more in school than out of it: there is a positive relationship between schooling and literacy (figure 5.5). Even comparing individuals with similar literacy and numeracy levels, those with more schooling have higher earnings—most likely due to other benefits of schooling, including improved socioemotional skills such as discipline.65 Getting learners into school is beneficial in its own right.
Figure 5.5 Women’s literacy by highest grade completed across 52 countries
Percent of women, ages 25–34, who can read all of a single sentence in their chosen language, selected countries
Source: WDR 2018 team with data from Sandefur, Oye, and Pritchett 2016.
Note: The average is calculated across 52 countries.
5.20 In addition to getting to school, learners must be motivated. One way to increase motivation is to ensure that their skills are rewarded, whether by the labor market that offers high returns or by a higher education system that admits students based on merit rather than connections. But perhaps the most immediate way to motivate learners is to provide relevant, quality education that reaches them at their level. In Kenya students dropping out of school say that their inability to perform well, rather than costs or parental pressures, caused them to leave.66 Some systems seek to further motivate students with merit-based scholarships or prizes. Such incentives have a direct, expected effect before they are awarded because students seek to qualify—whether for a direct financial prize, as in Benin67 and Mexico,68 or a scholarship for girls, as in Kenya.69 Direct financial incentives have been less successful in high-income countries,70 though alternate designs
63 Barrera-Osorio and Filmer 2013. 64 Nguyen 2008; Avitabile and De Hoyos Navarro 2015. 65 Valerio and others 2016. 66 Zuilkowski, Jukes and Dubeck 2016. 67 Blimpo 2014. 68 Behrman and others 2015. 69 Kremer, Miguel and Thornton 2009. 70 Fryer 2011.
Average
Bangladesh
Ethiopia
Nigeria
Peru
Rwanda
0
20
40
60
80
100
Lite
racy
(per
cent
)
0 2 4 6Highest grade completed
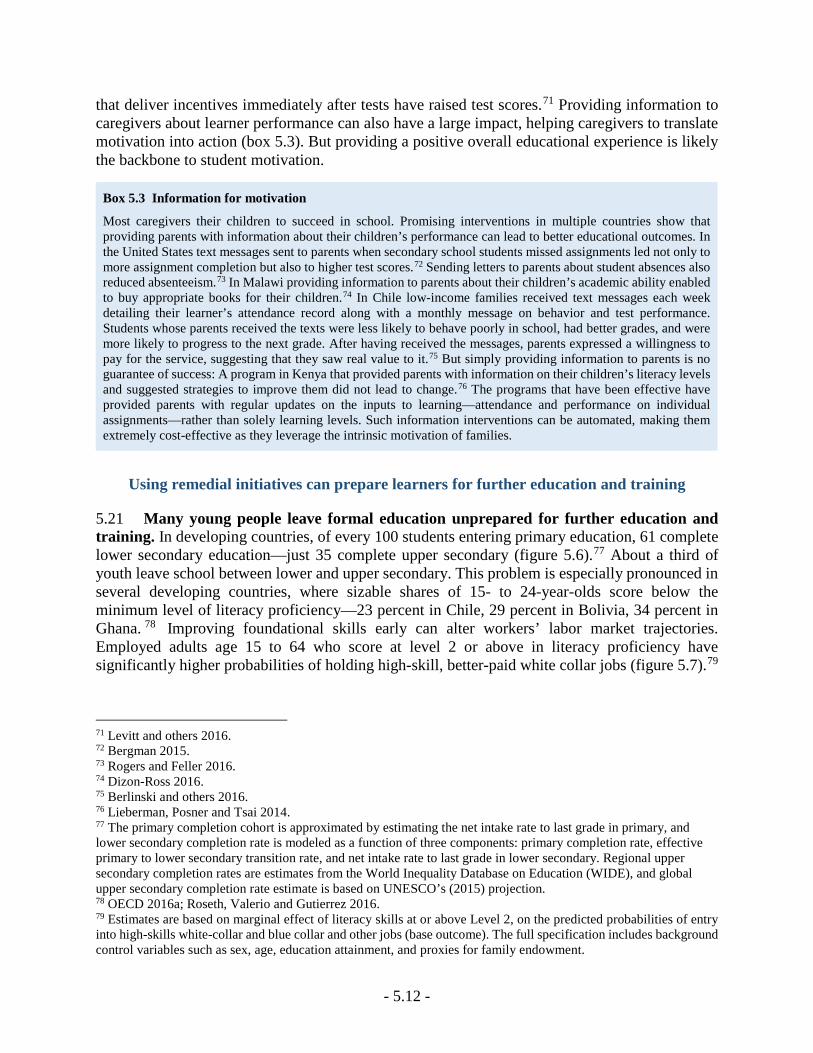
- 5.12 -
that deliver incentives immediately after tests have raised test scores.71 Providing information to caregivers about learner performance can also have a large impact, helping caregivers to translate motivation into action (box 5.3). But providing a positive overall educational experience is likely the backbone to student motivation.
Box 5.3 Information for motivation
Most caregivers their children to succeed in school. Promising interventions in multiple countries show that providing parents with information about their children’s performance can lead to better educational outcomes. In the United States text messages sent to parents when secondary school students missed assignments led not only to more assignment completion but also to higher test scores.72 Sending letters to parents about student absences also reduced absenteeism.73 In Malawi providing information to parents about their children’s academic ability enabled to buy appropriate books for their children.74 In Chile low-income families received text messages each week detailing their learner’s attendance record along with a monthly message on behavior and test performance. Students whose parents received the texts were less likely to behave poorly in school, had better grades, and were more likely to progress to the next grade. After having received the messages, parents expressed a willingness to pay for the service, suggesting that they saw real value to it.75 But simply providing information to parents is no guarantee of success: A program in Kenya that provided parents with information on their children’s literacy levels and suggested strategies to improve them did not lead to change.76 The programs that have been effective have provided parents with regular updates on the inputs to learning—attendance and performance on individual assignments—rather than solely learning levels. Such information interventions can be automated, making them extremely cost-effective as they leverage the intrinsic motivation of families.
Using remedial initiatives can prepare learners for further education and training
5.21 Many young people leave formal education unprepared for further education and training. In developing countries, of every 100 students entering primary education, 61 complete lower secondary education—just 35 complete upper secondary (figure 5.6).77 About a third of youth leave school between lower and upper secondary. This problem is especially pronounced in several developing countries, where sizable shares of 15- to 24-year-olds score below the minimum level of literacy proficiency—23 percent in Chile, 29 percent in Bolivia, 34 percent in Ghana. 78 Improving foundational skills early can alter workers’ labor market trajectories. Employed adults age 15 to 64 who score at level 2 or above in literacy proficiency have significantly higher probabilities of holding high-skill, better-paid white collar jobs (figure 5.7).79
71 Levitt and others 2016. 72 Bergman 2015. 73 Rogers and Feller 2016. 74 Dizon-Ross 2016. 75 Berlinski and others 2016. 76 Lieberman, Posner and Tsai 2014. 77 The primary completion cohort is approximated by estimating the net intake rate to last grade in primary, and lower secondary completion rate is modeled as a function of three components: primary completion rate, effective primary to lower secondary transition rate, and net intake rate to last grade in lower secondary. Regional upper secondary completion rates are estimates from the World Inequality Database on Education (WIDE), and global upper secondary completion rate estimate is based on UNESCO’s (2015) projection. 78 OECD 2016a; Roseth, Valerio and Gutierrez 2016. 79 Estimates are based on marginal effect of literacy skills at or above Level 2, on the predicted probabilities of entry into high-skills white-collar and blue collar and other jobs (base outcome). The full specification includes background control variables such as sex, age, education attainment, and proxies for family endowment.
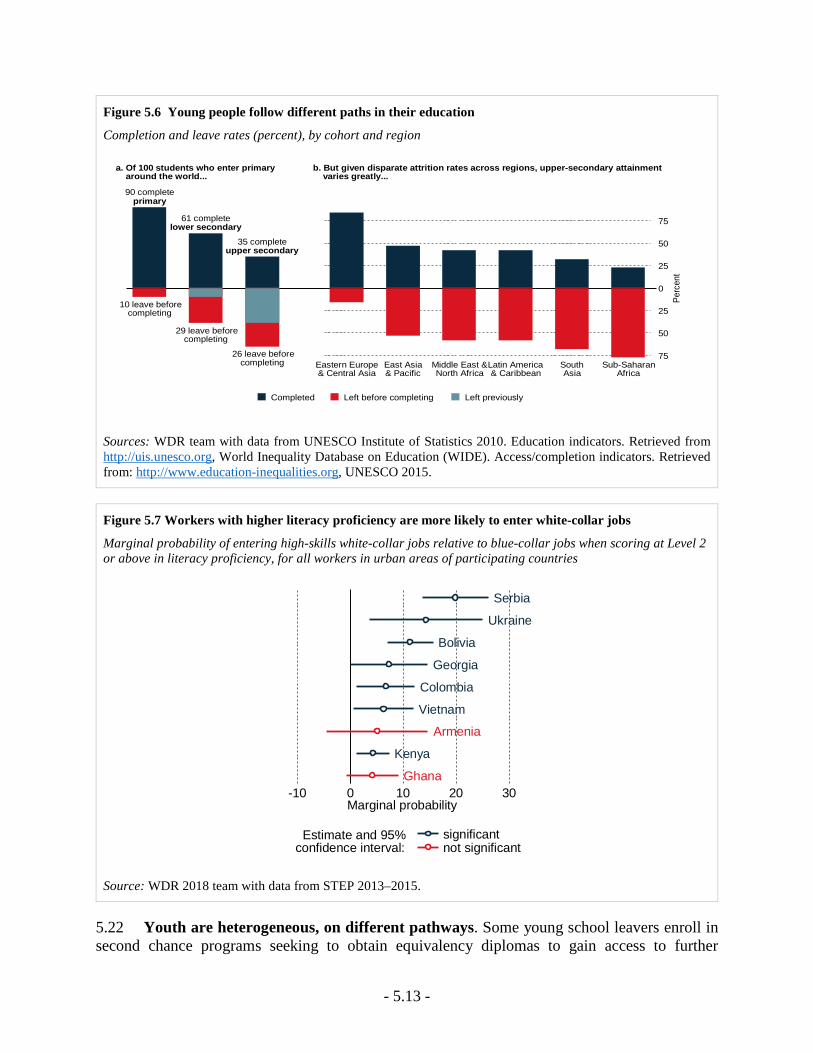
- 5.13 -
Figure 5.6 Young people follow different paths in their education
Completion and leave rates (percent), by cohort and region
Sources: WDR team with data from UNESCO Institute of Statistics 2010. Education indicators. Retrieved from http://uis.unesco.org, World Inequality Database on Education (WIDE). Access/completion indicators. Retrieved from: http://www.education-inequalities.org, UNESCO 2015.
Figure 5.7 Workers with higher literacy proficiency are more likely to enter white-collar jobs
Marginal probability of entering high-skills white-collar jobs relative to blue-collar jobs when scoring at Level 2 or above in literacy proficiency, for all workers in urban areas of participating countries
Source: WDR 2018 team with data from STEP 2013–2015.
5.22 Youth are heterogeneous, on different pathways. Some young school leavers enroll in second chance programs seeking to obtain equivalency diplomas to gain access to further
10 leave beforecompleting
29 leave beforecompleting
26 leave beforecompleting
90 completeprimary
61 completelower secondary
35 completeupper secondary
Eastern Europe& Central Asia
East Asia& Pacific
Middle East &North Africa
Latin America& Caribbean
SouthAsia
Sub-SaharanAfrica
a. Of 100 students who enter primary around the world...
b. But given disparate attrition rates across regions, upper-secondary attainment varies greatly...
75
50
25
0
25
50
75
Perc
ent
Completed Left before completing Left previously
Armenia
Ghana
Bolivia
Colombia
Georgia
Kenya
Serbia
Ukraine
Vietnam
-10 0 10 20 30Marginal probability
significantnot significant
Estimate and 95%confidence interval:
- 5.14 -
education or training.80 Others pursue remedial coursework to fulfill admission requirements for post-secondary education or training institutions.81 Another group—usually those with the most serious skills gaps—goes into unstable, low-wage, low-productivity jobs, while some youth remain out of both school and the labor force.82 It is difficult to reach all these young people. Motivating them to join second chance or remedial programs is not easy, especially if they have been out of the education system for some time. Many are uncertain about the benefits of remedial courses, and returning to school settings can stir up negative feelings. In Uganda early school leavers said they suffered from diminished self-worth, limited life opportunities, and social exclusion associated with early departure from formal education.83
5.23 Remedial programs can work—if they reach the right people using the right approach. Effective remedial education interventions meet young people where they are helping them transition into careers. Remedial programs are more likely to support students’ interests when they are short, relevant to students’ lives, delivered by experienced teachers, and part of a long-term plan for career growth.84 Evidence on remedial education models is mixed, with most coming from high-income countries. Three types of interventions prevail:
• Remedial prevention programs support academically weak students by strengthening their foundational skills and encouraging them to complete formal education.
• Second chance programs offer early school leavers, many of whom are low-skilled, an opportunity to reengage with education and training.
• Remedial coursework at the onset of post-secondary education and training increases young people’s chances of completing their programs of study.
Remedial prevention programs can help low-performing students and keep them in school
5.24 Remedial prevention programs can help at-risk youth prepare for rigorous academic work in further education or training.85 Three remedial prevention approaches show promise.86 The first offers support to primary and secondary students to stay in school and master foundational skills. Programs in India and Mexico City that offer additional instruction for disadvantaged students show positive impacts on foundational skills (especially in India).87 The second approach offers students early assessments of their academic standing, along with extra instruction to improve performance. An early assessment of a large program in California that supports academically at-risk students shows declining needs for remediation at later stages of education
80 Zachry and Schneider 2010. 81 Almeida, Johnson and Steinberg 2006; Hurst, Kelly and Princiotta 2004. 82 De Hoyos, Rogers and Székely 2016. 83 Windisch 2015; Black, Polidano and Tseng 2012; Tukundane and others 2014. 84 Post 2016. 85 “At-risk” students are defined here as having a higher propensity of dropping out of formal education or of not completing post-basic education and training programs. 86 The typology used is from a systematic review on remedial (developmental) education by Rutschow and Crary-Ross 2014; Zachry Rutschow and Schneider 2011; Wilson and Tanner-Smith 2013; Tukundane and others 2015. 87 Lakshminarayana and others 2013.
- 5.15 -
and training.88 The third approach gives secondary students the option of registering concurrently in post-secondary courses. Participants in such programs in the United States are less likely to require remediation and more likely to persist in tertiary education and improve academic outcomes.89
Second chance programs offer youth a way to return to education and obtain training
5.25 Second chance programs can enable school leavers to reengage in nontraditional learning environments, obtain secondary equivalency qualification, and enter job training.90 Second chance programs offer a learning experience that signals a level of achievement to participants, their families, and employers. In Australia and the United States, early school leavers are encouraged to enroll in programs that provide an equivalent to an upper secondary diploma.91 Though equivalency programs can deliver positive outcomes on employment, wages, and other education indicators—especially relative to individuals without equivalency credentials—such impacts are often smaller than those for individuals holding traditional educational credentials.92 Across interventions, socioemotional skills play an important role in student success; in some instances, skills like the ability to work towards long-term goals appear matter more than obtaining the equivalency certificate itself.
5.26 While demand for second chance programs is high and evidence is promising, keeping youth engaged in further education and training requires an integrated policy approach. There is demand for programs to reengage early school leavers in Sub-Saharan Africa, especially in low-income or conflict regions.93 But in practice, programs tend to be small, and few operate within a policy framework that integrates them into the education and training systems.94 For low-income students, who usually make-up a disproportionate number of early school leavers around the world, second chance programs like the Open Basic Programme in India can provide important pathways to educational opportunities. 95 In India, Indonesia, the Philippines, and Thailand, equivalency programs for youth improves students’ self-development, especially when programs were aligned with the formal education system.96 Similarly, second chance programs in Latin America and the Caribbean yield better results when they take into account the multidimensional needs of young people, connect students to pathways for further education and training opportunities, and provide support to help participants return to productive adulthood.97
88 Howell, Kurlaender and Grodsky 2010. 89 Karp and others 2008. 90 Jepsen, Mueser and Troske 2012. 91 De Witte and others 2013. 92 Tyler and Lofstrom 2009. 93 Inoue and others 2015. 94 Tukundane and others 2015. 95 UNESCO 2010. 96 UNESCO 2010. 97 Cunningham and others 2008.
- 5.16 -
Post-secondary remedial education programs can help youth succeed in their programs of study
5.27 Many students enrolling in post-secondary education and training are not prepared for the rigor of programs of study. In Chile and Mexico several post-secondary institutions offer remedial support to academically underprepared students, but impact evaluations of such interventions are rare.98 In the United States participation in post-secondary remedial education is widespread, at great cost to individuals and institutions.99 About 42 percent of incoming students in two-year institutions and 20 percent in four-year institutions enroll in remedial courses at an annual cost of $1–7 billion, depending on how the estimates are calculated. There are three main types of remedial programs: accelerated remedial approaches, contextualized instruction, and intensive student support.100 Recent developments in self-directed programs are opening new opportunities for youth to work independently to upgrade their skills, but evidence on their impacts is sparse.101
5.28 Accelerated programs reduce the time students spend on remedial coursework. Remedial education programs are often designed as a series of sequential courses that can take multiple semesters to complete, which often leads to student dropout.102 New remedial models addressing this problem include fast-track courses, self-paced modularized courses, and mainstreaming students directly into post-secondary courses while providing additional instructional support. In Indiana, the United States, a study of two fast-track programs finds participants achieve better course pass rates and fewer course withdrawals than students in longer remedial programs.103 Similarly, evidence on modularized and mainstreaming models show that participants increase post-secondary pass rates in math, completed more rigorous course requirements, and attempted tertiary courses at higher rates than nonparticipants.104
5.29 Contextualized instruction improves the effectiveness of remedial education instruction. Learners benefit most when they engage, interpret, and generate meaning from instructional content relevant to their background. 105 Contextualized instruction models are designed to reinforce foundational skills while emphasizing learners’ career aspirations.106 New approaches include contextualized vocational learning. An example of contextualized instruction that blends foundational skills upgrading
5.30 with occupational training is the I-BEST program in the state of Washington, in the United States. An evaluation of the program finds that participation had positive effects on student learning, including course credit accumulation, persistence in tertiary education, and earning
98 Micin and others 2015; Figueroa and others 2016; Cabrera 2016. 99 Scott-Clayton and Rodriguez 2014; Clotfelter and others 2015; Bailey 2009. 100 Bailey, Jaggars and Scott-Clayton 2013; Clotfelter and others 2015; Moss, Kelcey and Showers 2014; Scott-Clayton and Rodriguez 2014. 101 Zachry Rutschow and Schneider 2011. 102 Bailey 2009; Scott-Clayton and Rodriguez 2014. 103 Brown and Ternes 2009. 104 Epper and Baker 2009; Bassett 2009. 105 Boroch and others 2007. 106 Baker, Hope and Karandjeff 2009.
- 5.17 -
occupational certificates. 107 Learning community approaches, which emphasize multi-subject instruction, project-based work, and learner social interactions, also show promising results. In the United States, participation in these programs has a significantly positive relationship with level of course engagement, student and faculty interactions, as well as persistence into advanced courses.108
5.31 Intensive student support can provide an institutional safety net for at-risk youth. New approaches showing promising results include intensive tutoring with supplemental instruction, intensive advising, and student success courses. Intensive tutoring programs range from providing general academic counseling and tutoring to offering special skills training.109 Evaluations of programs offering sustained tutoring show improvements in course completion and academic standing.110 Intensive advising services that help students navigate course selection, develop career plans, and offer individual advice over multiple semesters, can lead them to make more frequent use of support services, complete remedial course work, and have higher retention rates a year after program completion.111
107 Jenkins, Zeidenberg and Kienzl 2009. 108 Visher and others 2010; Engstrom and Tinto 2008; Zhao and Kuh 2004. 109 Zachry Rutschow and Schneider 2011. 110 Zachry and Schneider 2008; Scrivener and others 2008. 111 Bahr 2008; Visher, Butcher and Cerna 2010.
- 5.18 -
References
Aboud, Frances; Yousafzai, Aisha 2015. "Global Health and Development in Early Childhood." Annual Review of Psychology 66: 433-57.
African Child Policy Forum. 2011. "The African Report on Child Wellbeing: Budgeting for Children. ." http://resourcecentre.savethechildren.se/sites/default/files/documents/3764.pdf.
Akresh, Richard, Emilie Bagby, Damien De Walque, and Harounan Kazianga. 2012. "Child Ability and Household Human Capital Investment Decisions in Burkina Faso." Economic Development and Cultural Change 61(1): 157-86.
Akresh, Richard, Damien de Walque, and Harounan Kazianga. 2013. "Cash Transfers and Child Schooling: Evidence from a Randomized Evaluation of the Role of Conditionality." Policy Research Working Paper. World Bank. http://documents.worldbank.org/curated/en/587731468005971189/pdf/wps6340.pdf.
Al‐Samarrai, Samer, and Hassan Zaman. 2007. "Abolishing School Fees in Malawi: The Impact on Education Access and Equity 1." Education Economics 15(3): 359-75.
Almeida, Cheryl, Cassius Johnson, and Adria Steinberg. 2006. "Making Good on a Promise: What Policymakers Can Do to Support the Educational Persistence of Dropouts. Double the Numbers: A Jobs for the Future Initiative." Jobs for the Future.
Attanasio, Orazio P., Camila Fernández, Emla OA Fitzsimons, Sally M. Grantham-McGregor, Costas Meghir, and Marta Rubio-Codina. 2014. "Using the Infrastructure of a Conditional Cash Transfer Programme to Deliver a Scalable Integrated Early Child Development Programme in Colombia: A Cluster Randomized Controlled Trial." British Medical Journal 349: g5785.
Avitabile, Ciro, and Rafael E. De Hoyos Navarro. 2015. "The Heterogeneous Effect of Information on Student Performance : Evidence from a Randomized Control Trial in Mexico." Policy Research Working Paper. World Bank. http://documents.worldbank.org/curated/en/467311468189270141/The-Heterogeneous-effect-of-information-on-student-performance-evidence-from-a-randomized-control-trial-in-Mexico.
Bahr, Peter Riley. 2008. "Cooling out in the Community College: What Is the Effect of Academic Advising on Students’ Chances of Success?" Research in Higher Education 49(8): 704-32.
Bailey, Thomas. 2009. "Challenge and Opportunity: Rethinking the Role and Function of Developmental Education in Community College." New Directions for Community Colleges 2009(145): 11-30.
Bailey, Thomas, Shanna Smith Jaggars, and Judith Scott-Clayton. 2013. "Commentary: Characterizing the Effectiveness of Developmental Education: A Response to Recent Criticism." Journal of Developmental Education 36(3): 18.
Baker-Henningham, Helen, and Florencia López Bóo. 2010. "Early Childhood Stimulation Interventions in Developing Countries: A Comprehensive Literature Review." Washington, DC: Inter-American Development Bank.
Baker, Elaine DeLott, Laura Hope, and Kelley Karandjeff. 2009. "Contextualized Teaching & Learning: A Faculty Primer. A Review of Literature and Faculty Practices with Implications for California Community College Practitioners." Academic Senate for California Community Colleges.
Barrera-Osorio, Felipe, and Deon Filmer. 2013. "Incentivizing Schooling for Learning: Evidence on the Impact of Alternative Targeting Approaches." World Bank Policy Research Working Paper (6541).
Bassett, Mary Jane. 2009. "Tennessee Board of Regents: Developmental Studies Redesign Initiative." Jackson State Community College~ Basic Math, Elementary Algebra. and Intermediate Algebra. Retrieved from< http:/lwwwthencat. org.
Beaman, Lori, Esther Duflo, Rohini Pande, and Petia Topalova. 2012. "Female Leadership Raises Aspirations and Educational Attainment for Girls: A Policy Experiment in India." science 335(6068): 582-86.
Behrman, Jere R, Susan W Parker, Petra E Todd, and Kenneth I Wolpin. 2015. "Aligning Learning Incentives of Students and Teachers: Results from a Social Experiment in Mexican High Schools." Journal of Political Economy 123(2): 325-64.
Bendini, Maria Magdalena. 2015. "The Effect of Stress on Developmental Trajectories: Empirical Evidence from Peru."
Bergman, Peter. 2015. "Parent-Child Information Frictions and Human Capital Investment: Evidence from a Field Experiment."
Berlinski, Samuel, Matias Busso, Taryn Dinkelman, and Claudia Martinez. 2016. "Reducing Parent-School Information Gaps and Improving Education Outcomes: Evidence from High Frequency Text Messaging in Chile." Unpublished Manuscript.
- 5.19 -
Berlinski, Samuel, Sebastian Galiani, and Paul Gertler. 2008. "The Effect of Preprimary Education on Primary School Performance." Journal of Public Economics 93(1): 219-34.
Berlinski, Samuel, and Norbert Schady. 2016. The Early Years: Child Well-Being and the Role of Public Policy. Springer.
Bhutta, Zulfiqar A, Jai K Das, Arjumand Rizvi, Michelle F Gaffey, Neff Walker, Susan Horton, Patrick Webb, Anna Lartey, Robert E Black, and The Lancet Nutrition Interventions Review Group. 2013. "Evidence-Based Interventions for Improvement of Maternal and Child Nutrition: What Can Be Done and at What Cost?" The Lancet 382(9890): 452-77.
Black, David, Cain Polidano, and Yi‐Ping Tseng. 2012. "The Re‐Engagement in Education of Early School Leavers." Economic Papers: A journal of applied economics and policy 31(2): 202-15.
Black, Maureen M, Susan P Walker, Lia CH Fernald, Christopher T Andersen, Ann M DiGirolamo, Chunling Lu, Dana C McCoy, Günther Fink, Yusra R Shawar, and Jeremy Shiffman. 2016. "Early Childhood Development Coming of Age: Science through the Life Course." The Lancet.
Black, Robert E, Lindsay H Allen, Zulfiqar A Bhutta, Laura E Caulfield, Mercedes De Onis, Majid Ezzati, Colin Mathers, Juan Rivera, Maternal, and Child Undernutrition Study Group. 2008. "Maternal and Child Undernutrition: Global and Regional Exposures and Health Consequences." The lancet 371(9608): 243-60.
Blimpo, Moussa P. 2014. "Team Incentives for Education in Developing Countries: A Randomized Field Experiment in Benin." American Economic Journal: Applied Economics 6(4): 90-109.
Bold, Tessa, Mwangi S Kimenyi, and Justin Sandefur. 2013. "Public and Private Provision of Education in Kenya." Journal of African Economies 22(suppl 2): ii39-ii56.
Boroch, Deborah, Jim Fillpot, Laura Hope, Robert Johnstone, Pamela Mery, Andreea Serban, Bruce Smith, and Robert S Gabriner. 2007. "Basic Skills as a Foundation for Student Success in California Community Colleges." Research and Planning Group for California Community Colleges (RP Group).
Bouguen, Adrien, Deon Filmer, Karen Macours, and Sophie Naudeau. 2013. "Impact Evaluation of Three Types of Early Childhood Development Interventions in Cambodia." World Bank Policy Research Working Paper (6540).
Bradley, Robert H, and Robert F Corwyn. 2005. "Caring for Children around the World: A View from Home."
International Journal of Behavioral Development 29(6): 468-78.
Britto, Pia R, Stephen J Lye, Kerrie Proulx, Aisha K Yousafzai, Stephen G Matthews, Tyler Vaivada, Rafael Perez-Escamilla, Nirmala Rao, Patrick Ip, and Lia CH Fernald. 2016. "Nurturing Care: Promoting Early Childhood Development." The Lancet.
Brown, R, and R Ternes. 2009. "Final Report to the Lilly Endowment Grant: Grant for Targeted and Accelerated Remediation." Indianapolis, IN: Ivy Tech.
Cabrera, Gabriela. 2016. "Programas De Apoyo a Transiciones Académicas Del Sistema Escolarizado En La Unam." Congresos CLABES.
Carneiro, Pedro, Flavio Cunha, and James J. Heckman. 2003. "Interpreting the Evidence of Family Infuence on Child Development." Paper presented at the The Economics of Early Childhood Development: Lessons for Economic Policy, Minneapolis, MN.
Center on the Developing Child at Harvard University. 2016. "From Best Practices to Breakthrough Impacts: A Science-Based Approach to Building a More Promising Future for Young Children and Families."
Clotfelter, Charles T, Helen F Ladd, Clara Muschkin, and Jacob L Vigdor. 2015. "Developmental Education in North Carolina Community Colleges." Educational Evaluation and Policy Analysis 37(3): 354-75.
Coe, Christopher L., and Gabrielle R. Lubach. 2007. Mother-Infant Interactions and the Development of Immunity from Conception through Weaning. Burlington, MA: Elsevier Academic Press.
Cunha, Flavio, James J. Heckman, Lance Lochner, and Dimitriy V. Masterov. 2006. "Interpreting the Evidence on Life Cycle Skill Formation." Handbook of the Economics of Education 1: 697-812.
Cunningham, W, L McGinnis, R Garcıa Verdú, C Tesliuc, and D Verner. 2008. "Youth at Risk in Latin America and the Caribbean: Understanding the Causes." Realizing the Potential‖, The World Bank: Washington, DC.
Currie, Janet, and Douglas Almond. 2011. "Human Capital Development before Age Five." Handbook of Labor Economics 4: 1315-486.
De Hoyos, RD, Halsey Rogers, and Miguel Székely. 2016. "Out of School and out of Work: Risk and Opportunities for Latin America's Ninis." Banco Mundial.
De Witte, Kristof, Sofie Cabus, Geert Thyssen, Wim Groot, and Henriëtte Maassen van den Brink. 2013. "A Critical Review of the Literature on School Dropout." Educational Research Review 10: 13-28.
- 5.20 -
Deininger, Klaus. 2003. "Does Cost of Schooling Affect Enrollment by the Poor? Universal Primary Education in Uganda." Economics of Education review 22(3): 291-305.
Denboba, Amina, Rebecca Sayre, Quentin Wodon, L. Rawlings, and J. Lombardi. 2014. "Investing in Young Children for High Returns." Washington, DC: The World Bank.
Devercelli, Amanda, R. Sayre, A. Denboba. 2016. "What Do We Know About Early Childhood Development Policies in Low and Middle Income Countries?".
Dizon-Ross, Rebecca. 2016. "Parents’ Beliefs and Children’s Education: Experimental Evidence from Malawi." Unpublished Manuscript, University of Chicago.
Dowd, Amy Jo, Elliott Friedlander, Christine Jonason, Jane Leer, Lisa Zook Sorensen, Jarrett Guajardo, Nikhit D'Sa, Clara Pava, and Lauren Pisani. 2017. "Lifewide Learning for Early Reading Development." New Directions for Child and Adolescent Development 2017(155): 31-49.
Duflo, Esther, Pascaline Dupas, and Michael kremer. 2017. "The Impact of Free Secondary Education: Experimental Evidence from Ghana." Unpublished manuscript.
Eilander, Ans, Tarun Gera, Harshpal S Sachdev, Catherine Transler, Henk CM van der Knaap, Frans J Kok, and Saskia JM Osendarp. 2009. "Multiple Micronutrient Supplementation for Improving Cognitive Performance in Children: Systematic Review of Randomized Controlled Trials." The American journal of clinical nutrition: ajcn. 28376.
Engle, Patrice L, Lia CH Fernald, Harold Alderman, Jere Behrman, Chloe O'Gara, Aisha Yousafzai, Meena Cabral de Mello, Melissa Hidrobo, Nurper Ulkuer, and Ilgi Ertem. 2011. "Strategies for Reducing Inequalities and Improving Developmental Outcomes for Young Children in Low-Income and Middle-Income Countries." The Lancet 378(9799): 1339-53.
Engstrom, Cathy McHugh, and Vincent Tinto. 2008. "Learning Better Together: The Impact of Learning Communities on the
Persistence of Low-Income Students." Opportunity Maters Volume 1.
Epper, Rhonda M, and Elaine D Baker. 2009. "Technology Solutions for Developmental Math: An Overview of Current and Emerging Practices." Journal of Developmental Education 26(2): 4-23.
Farah, Martha J., David M. Shera, Jessica H. Savage, Laura Betancourt, Joan M. Giannetta, Nancy L. Brodsky, Elsa K. Malmud, and Hallam Hurt. 2006. "Childhood
Poverty: Specific Associations with Neurocognitive Development." Brain Research 1110(1): 166-74.
Favara, Marta, M. Woodhead, J. Castro, G. Chang, P. Espinoza. forthcoming "Pre-School Education and Skills Development in Peru, Vietnam, Ethiopia and India: Evidence from Young Lives."
Figueroa, Lorna, Bernardita Maillard, Nelson Veliz, Samara Toledo, and Máximo González. 2016. "La Experiencia De Los Programas Propedéuticos Y Su Articulación Con La Escuela." Congresos CLABES.
Filmer, Deon, and Norbert Schady. 2008. "Getting Girls into School: Evidence from a Scholarship Program in Cambodia." Economic development and cultural change 56(3): 581-617.
Fiszbein, Ariel, Norbert Rüdiger Schady, and Francisco HG Ferreira. 2009. Conditional Cash Transfers: Reducing Present and Future Poverty. World Bank Publications.
Foko, Borel, Beifith Kouak Tiyab, and Guillaume Husson. 2012. "House Education Spending an Analytical and Comparative Perspective for 15 African Countries." Pôle de Dakar, UNESCO-BREDA.
Friedlander, Elliott, and Claude Goldenberg. 2016. "Literacy Boost in Rwanda: Impact Evaluation of a Two Year Randomized Control Trial " Standford, CA: Standford University
Fryer, Roland G. 2011. "Financial Incentives and Student Achievement: Evidence from Randomized Trials." The Quarterly Journal of Economics 126(4): 1755-98.
Galasso, Emanuela, and Adam Wagstaff. 2016. "The Economic Costs of Stunting and How to Reduce Them." World Bank Policy Research Note.
García, Jorge Luis, James J Heckman, Duncan Ermini Leaf, and María José Prados. 2016. "The Life-Cycle Benefits of an Influential Early Childhood Program." National Bureau of Economic Research.
Garg, Ashish, and Jonathan Morduch. 1998. "Sibling Rivalry and the Gender Gap: Evidence from Child Health Outcomes in Ghana." Journal of Population Economics 11(4): 471-93.
Garner, Andrew S., Jack P. Shonkoff, Benjamin S. Siegel, Mary I. Dobbins, Marian F. Earls, Laura McGuinn, John Pascoe, and David L. Wood. 2012. "Early Childhood Adversity, Toxic Stress, and the Role of the Pediatrician: Translating Developmental Science into Lifelong Health." Pediatrics 129(1): e224-e31.
Grogan, Louise. 2009. "Universal Primary Education and School Entry in Uganda." Journal of African Economies 18(2): 183-211.
- 5.21 -
Horta, Bernardo L, Christian Loret de Mola, and Cesar G Victora. 2015. "Breastfeeding and Intelligence: A Systematic Review and Meta‐Analysis." Acta paediatrica 104(S467): 14-19.
Horton, Sue, Harold Alderman, and Juan A Rivera. 2008. The Challenge of Hunger and Malnutrition. Copenhagen Consensus.
Howell, Jessica S, Michal Kurlaender, and Eric Grodsky. 2010. "Postsecondary Preparation and Remediation: Examining the Effect of the Early Assessment Program at California State University." Journal of Policy Analysis and Management 29(4): 726-48.
Hungi, N. 2010. "What Are the Levels and Trends in Grade Repetition." SACMEQ Policy Issues Series (3).
Hurst, David, Dana Kelly, and Daniel Princiotta. 2004. "Educational Attainment of High School Dropouts 8 Years Later. Issue Brief. Nces 2005-026." US Department of Education.
Inoue, Keiko, Emanuela Di Gropello, Yesim Sayin Taylor, and James Gresham. 2015. Out-of-School Youth in Sub-Saharan Africa: A Policy Perspective. World Bank Publications.
Jenkins, Davis, Matthew Zeidenberg, and Gregory Kienzl. 2009. "Educational Outcomes of I-Best, Washington State Community and Technical College System's Integrated Basic Education and Skills Training Program: Findings from a Multivariate Analysis. Ccrc Working Paper No. 16." Community College Research Center, Columbia University.
Jensen, Robert. 2010. "The (Perceived) Returns to Education and the Demand for Schooling." The Quarterly Journal of Economics 125(2): 515-48.
———. 2012. "Do Labor Market Opportunities Affect Young Women's Work and Family Decisions? Experimental Evidence from India." The Quarterly Journal of Economics: qjs002.
Jepsen, Christopher, Peter R Mueser, and Kenneth R Troske. 2012. "Labor-Market Returns to the Ged Using Regression Discontinuity Analysis."
Johnson, Rucker C, and C Kirabo Jackson. 2017. "Reducing Inequality through Dynamic Complementarity: Evidence from Head Start and Public School Spending." National Bureau of Economic Research.
Karp, Melinda Mechur, Juan Carlos Calcagno, Katherine L Hughes, Dong Wook Jeong, and Thomas Bailey. 2008. "Dual Enrollment Students in Florida and New York City: Postsecondary Outcomes. Ccrc Brief. Number 37." Community College Research Center, Columbia University.
Kattan, Raja Bentaouet. 2006. "Implementation of Free Basic Education Policy." Education Working Paper Series 7.
Klees, Steven J. 2017. "Education for People and Planet: Creating Sustainable Futures for All." UNIV CHICAGO PRESS 1427 E 60TH ST, CHICAGO, IL 60637-2954 USA.
Kremer, Michael, Edward Miguel, and Rebecca Thornton. 2009. "Incentives to Learn." The Review of Economics and Statistics 91(3): 437-56.
Lakshminarayana, Rashmi, Alex Eble, Preetha Bhakta, Chris Frost, Peter Boone, Diana Elbourne, and Vera Mann. 2013. "The Support to Rural India's Public Education System (Stripes) Trial: A Cluster Randomised Controlled Trial of Supplementary Teaching, Learning Material and Material Support." PloS one 8(7): e65775.
Levitt, Steven D, John A List, Susanne Neckermann, and Sally Sadoff. 2016. "The Behavioralist Goes to School: Leveraging Behavioral Economics to Improve Educational Performance." American Economic Journal: Economic Policy 8(4): 183-219.
Lieberman, Evan S, Daniel N Posner, and Lily L Tsai. 2014. "Does Information Lead to More Active Citizenship? Evidence from an Education Intervention in Rural Kenya." World Development 60: 69-83.
Loyalka, Prashant, Chengfang Liu, Yingquan Song, Hongmei Yi, Xiaoting Huang, Jianguo Wei, Linxiu Zhang, Yaojiang Shi, James Chu, and Scott Rozelle. 2013. "Can Information and Counseling Help Students from Poor Rural Areas Go to High School? Evidence from China." Journal of Comparative Economics 41(4): 1012-25.
Lucas, Adrienne M, and Isaac M Mbiti. 2012. "Access, Sorting, and Achievement: The Short-Run Effects of Free Primary Education in Kenya." American Economic Journal: Applied Economics 4(4): 226-53.
Martin, Paul. 2012. "La Proteccion a Los Mas Pequenos Tiene Una Muy Alta Tasa De Retorno."
Martinez, Sebastian, Sophie Naudeau, and Vitor Pereira. 2012. "The Promise of Preschool in Africa: A Randomized Impact Evaluation of Early Childhood Development in Rural Mozambique." Working Paper.: World Bank and Save the Children.
McCoy, Dana Charles, and C Cybele Raver. 2014. "Household Instability and Self-Regulation among Poor Children." Journal of Children and Poverty 20(2): 131-52.
McLoyd, Vonnie C. 1998. "Socioeconomic Disadvantage and Child Development." American Psychologist 53(2): 185.
- 5.22 -
Micin, Sonia, Natalia Farías, Beatriz Carreño, and Sergio Urzúa. 2015. "Beca Nivelación Académica: La Experiencia De Una Política Pública Aplicada En Una Universidad Chilena." Calidad en la educación (42): 189-208.
Morgan, Claire, Anthony Petrosino, and Trevor Fronius. 2012. "A Systematic Review of the Evidence of the Impact of Eliminating School User Fees in Low-Income Developing Countries " WestEd.
Moss, Brian G, Ben Kelcey, and Nancy Showers. 2014. "Does Classroom Composition Matter? College Classrooms as Moderators of Developmental Education Effectiveness." Community College Review 42(3): 201-20.
Nakajima, Nozomi, Amer Hasan, Haeil Jung, Sally Anne Brinkman, Menno Prasad Pradhan, and Angela Kinnell. 2016. "Investing in School Readiness: An Analysis of the Cost-Effectiveness of Early Childhood Education Pathways in Rural Indonesia." Policy Research Working Paper. World Bank.
Naudeau, Sophie. 2011. Investing in Young Children: An Early Childhood Development Guide for Policy Dialogue and Project Preparation. World Bank Publications.
Nguyen, Trang. 2008. "Information, Role Models and Perceived Returns to Education: Experimental Evidence from Madagascar." Economics Department. Massachusetts Institute of Technology.
Nishimura, Mikiko, Takashi Yamano, and Yuichi Sasaoka. 2008. "Impacts of the Universal Primary Education Policy on Educational Attainment and Private Costs in Rural Uganda." international Journal of Educational development 28(2): 161-75.
OECD. 2016a. Skills Matter: Further Results from the Survey of Adult Skills. OECD Publishing.
Oketch, Moses, Maurice Mutisya, and Jackline Sagwe. 2012. "Parental Aspirations for Their Children's Educational Attainment and the Realisation of Universal Primary Education (Upe) in Kenya: Evidence from Slum and Non-Slum Residences." International Journal of Educational Development 32(6): 764-72.
Parish, William L, and Robert J Willis. 1993. "Daughters, Education, and Family Budgets Taiwan Experiences" (refers to Taiwan, China). Journal of Human Resources: 863-98.
Phillips, Deborah A. , Mark W. Lipsey, Kenneth A. Dodge, Ron Haskins, Daphna Bassok, Margaret R. Burchinal, Greg J. Duncan, Mark Dynarski, Katherine A. Magnuson, and Christina Weiland. 2017. "TheCurrent State of Scientific Knowledge on Pre-Kindergarten Effects." Duke University and TheBrookings Institution
Pocasangre, Oscar. 2013. "Informing Future Choices " J-PAL Policy Briefcase.
Post, David. 2016. "Adult Literacy Benefits? New Opportunities for Research into Sustainable Development." International Review of Education 62(6): 751-70.
Rahman, Atif, Jane Fisher, Peter Bower, Stanley Luchters, Thach Tran, M Taghi Yasamy, Shekhar Saxena, and Waquas Waheed. 2013. "Interventions for Common Perinatal Mental Disorders in Women in Low-and Middle-Income Countries: A Systematic Review and Meta-Analysis." Bulletin of the World Health Organization 91(8): 593-601I.
Rao, Nirmala, Jin Sun, Jessie MS Wong, Brendan Weekes, Patrick Ip, Sheldon Shaeffer, Mary Young, Mark Bray, Eva Chen, and Diana Lee. 2014. "Early Childhood Development and Cognitive Development in Developing Countries." Department for International Development.
Richter, Linda M, Bernadette Daelmans, Joan Lombardi, Jody Heymann, Florencia Lopez Boo, Jere R Behrman, Chunling Lu, Jane E Lucas, Rafael Perez-Escamilla, and Tarun Dua. 2016. "Investing in the Foundation of Sustainable Development: Pathways to Scale up for Early Childhood Development." The Lancet.
Rogers, Todd, and Avi Feller. 2016. "Intervening through Influential Third Parties: Reducing Student Absences at Scale Via Parents."
Rosero, José, and Hessel Oosterbeek. 2011. "Trade-Offs between Different Early Childhood Interventions: Evidence from Ecuador." Tinbergen Institute Discussion Paper No. 102/3.
Roseth, Viviana V, Alexandria Valerio, and Marcela Gutierrez. 2016. "Education, Skills, and Labor Market Outcomes."
Rutschow, Elizabeth Zachry, and Shane Crary-Ross. 2014. "Beyond the Ged: Promising Models for Moving High School Dropouts to College." MDRC.
Sandefur, Justin, Mari Oye, and Lant Pritchett. 2016. "Girls' Schooling Is Good, Girls' Schooling with Learning Is Better." Background paper for the International Commission on Financing Global Education Opportunity.
Save the Children. 2017. "Windows into Early Learning and Development.": Save the Children International.
Scott-Clayton, Judith, and Olga Rodriguez. 2014. "Development, Discouragement, or Diversion? New Evidence on the Effects of College Remediation Policy." Education Finance and Policy.
Scrivener, Susan, Dan Bloom, Allen LeBlanc, Christina Paxson, Cecilia Elena Rouse, and Colleen Sommo. 2008.
- 5.23 -
"A Good Start: Two-Year Effects of a Freshmen Learning Community Program at Kingsborough Community College." MDRC.
Serneels, Pieter, and Stefan Dercon. 2014. "Aspirations, Poverty and Education: Evidence from India." Young Lives Working Paper 125.
Shonkoff, Jack, P Levitt, WT Boyce, J Cameron, G Duncan, NA Fox, and M Gunnar. 2010. "Persistent Fear and Anxiety Can Affect Young Children’s Learning and Development." National Scientific Council on the Developing Child. Harvard University. Working Paper (9).
Skoufias, Emmanuel. 2016. "Synergies in Child Nutrition: Interactions of Food Security, Health and Environment, and Child Care." World Bank Policy Research Working Paper (7794).
Thompson, Ross A, and Charles A Nelson. 2001. "Developmental Science and the Media: Early Brain Development." American Psychologist 56(1): 5.
Tukundane, Cuthbert, Alexander Minnaert, Jacques Zeelen, and Peter Kanyandago. 2015. "A Review of Enabling Factors in Support Intervention Programmes for Early School Leavers: What Are the Implications for Sub-Saharan Africa?" Children and Youth Services Review 52: 54-62.
Tukundane, Cuthbert, Jacques Zeelen, Alexander Minnaert, and Peter Kanyandago. 2014. "‘I Felt Very Bad, I Had Self-Rejection’: Narratives of Exclusion and Marginalisation among Early School Leavers in Uganda." Journal of Youth Studies 17(4): 475-91.
Tyler, John H, and Magnus Lofstrom. 2009. "Finishing High School: Alternative Pathways and Dropout Recovery." The future of children 19(1): 77-103.
UNESCO. 2010. "Achieving Efa through Equivalency Programmes in Asia-Pacific: A Regional Overview with Highlights from India, Indonesia, Thailand and the Philippines." Bangkok, Thailand: UNESCO Bangkok. .
United Nations Children's Fund, World Health Organization, and World Bank Group. 2016. "Levels and Trends in Child Malnutrition Unicef/Who/World Bank Group Joint Child Malnutrition Estimates Key Findings of the 2016 Edition."
Valerio, Alexandria, Maria Laura Sanchez Puerta, Namrata Tognatta, and Sebastian Monroy-Taborda. 2016. "Are There Skills Payoffs in Low-and Middle-Income Countries? Empirical Evidence Using Step Data."
Visher, Mary G, Kristin F Butcher, and Oscar S Cerna. 2010. "Math Students to Campus Services."
Visher, Mary G, Emily Schneider, Heather Wathington, and Herbert Collado. 2010. "Scaling up Learning
Communities: The Experience of Six Community Colleges." National Center for Postsecondary Research.
Walker, Susan P., Theodore D. Wachs, Julie Meeks Gardner, Betsy Lozoff, Gail A. Wasserman, Ernesto Pollitt, Julie A. Carter, and The International Child Development Steering Group. 2007. "Child Development: Risk Factors for Adverse Outcomes in Developing Countries." The Lancet 369(9556): 145-57.
Whitebread, David, Martina Kuvalja, and Aileen O'Connor. 2016. "Quality in Early Childhood Education: An International Review and Guide for Policy Makers " University of Cambridge
Wilson, Sandra Jo, and Emily E Tanner-Smith. 2013. "Dropout Prevention and Intervention Programs for Improving School Completion among School-Aged Children and Youth: A Systematic Review." Journal of the Society for Social Work and Research 4(4): 357-72.
Windisch, Hendrickje Catriona. 2015. "Adults with Low Literacy and Numeracy Skills."
World Bank. 2014. World Development Report 2015: Mind, Society, and Behavior. World Bank.
World Policy Center. 2016. "Is Education Tuition-Free?" http://www.worldpolicycenter.org/policies/is-education-tuition-free/is-beginning-secondary-education-tuition-free.
Zachry, Elizabeth M, and Emily Schneider. 2010. "Building Foundations for Student Readiness: A Review of Rigorous Research and Promising Trends in Developmental Education. An Ncpr Working Paper." National Center for Postsecondary Research.
Zachry, EM, and E Schneider. 2008. "Promising Instructional Reforms in Developmental Education: A Case Study of Three Achiev Ing the Dream Colleges. New York: Mdrc."
Zachry Rutschow, Elizabeth, and Emily Schneider. 2011. "Unlocking the Gate: What We Know About Improving Developmental Education."
Zhao, Chun-Mei, and George D Kuh. 2004. "Adding Value: Learning Communities and Student Engagement." Research in higher education 45(2): 115-38.
Zuilkowski, Stephanie Simmons, Matthew CH Jukes, and Margaret M Dubeck. 2016. "“I Failed, No Matter How Hard I Tried”: A Mixed-Methods Study of the Role of Achievement in Primary School Dropout in Rural Kenya." International Journal of Educational Development 50: 100-07.

- 6.1 -
Chapter 6 Teacher skills and motivation matter, yet many education systems act like they don’t
Contents
Most teacher training is ineffective, but some approaches work .................................................................. 3
Helping teachers teach to the level of the student has proven effective ....................................................... 5
Teacher motivation and incentives make a difference, even with few inputs ............................................... 8
For learners to learn, teachers have to teach. But many education systems make no effort to gauge teacher knowledge or to promote teacher motivation, nor do they have rewards or consequences for teacher effort or success. Much of current practice is ineffective, but some approaches work: teacher skills and motivation are the first place for improvement.
6.1 After prepared and motivated learners, equipped and motivated teachers are the most fundamental ingredient to learning. Teachers are also the largest budget item, with their salaries accounting for three-quarters of the education budget at the primary level in low- and middle-income countries. Yet many education systems put in classrooms teachers who have little mastery of the subjects they are to teach—especially in classrooms serving poor children.1 Once in place, most teachers take part in some professional development, but much of it is inconsistent and overly theoretical. Education systems often have few additional mechanisms to mentor and motivate teachers.2 Such failures can be illuminated through models of human behavior—which also point to solutions (table 6.1). A synthesis of the evidence in these areas lends itself to three principles key to achieving learning success through teachers:
• To be effective, teacher training needs to be individually targeted and repeated, with follow-up coaching—often around a specific pedagogical technique.
• To avoid learners falling behind to the point where they can’t catch up, teaching needs to be pitched at the level of the student.
• Increasing teacher motivation with incentives can increase learning if the incentivized actions are within teachers’ capacity and their absence has impeded learning.
1 World Bank 2013; Tandon and Fukao 2015; Al-Samarrai 2016. 2 Bruns and Luque 2015; Mulkeen 2010.
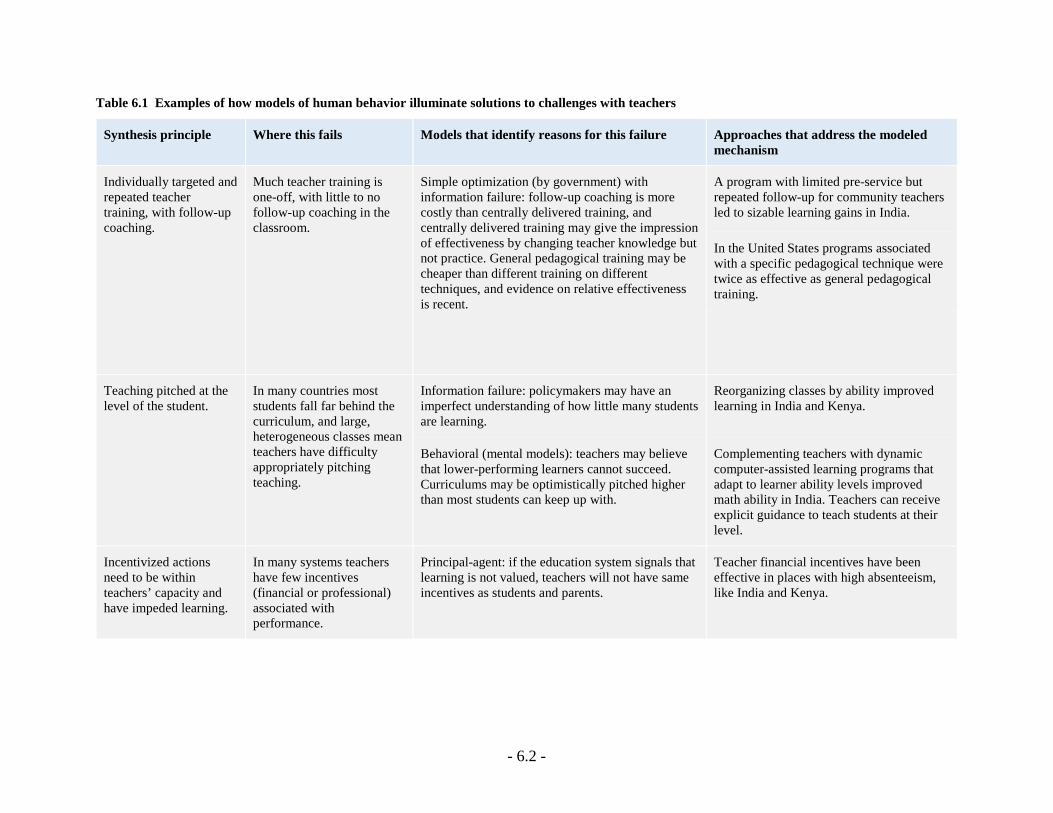
- 6.2 -
Table 6.1 Examples of how models of human behavior illuminate solutions to challenges with teachers
Synthesis principle Where this fails Models that identify reasons for this failure Approaches that address the modeled mechanism
Individually targeted and repeated teacher training, with follow-up coaching.
Much teacher training is one-off, with little to no follow-up coaching in the classroom.
Simple optimization (by government) with information failure: follow-up coaching is more costly than centrally delivered training, and centrally delivered training may give the impression of effectiveness by changing teacher knowledge but not practice. General pedagogical training may be cheaper than different training on different techniques, and evidence on relative effectiveness is recent.
A program with limited pre-service but repeated follow-up for community teachers led to sizable learning gains in India.
In the United States programs associated with a specific pedagogical technique were twice as effective as general pedagogical training.
Teaching pitched at the level of the student.
In many countries most students fall far behind the curriculum, and large, heterogeneous classes mean teachers have difficulty appropriately pitching teaching.
Information failure: policymakers may have an imperfect understanding of how little many students are learning.
Reorganizing classes by ability improved learning in India and Kenya.
Behavioral (mental models): teachers may believe that lower-performing learners cannot succeed. Curriculums may be optimistically pitched higher than most students can keep up with.
Complementing teachers with dynamic computer-assisted learning programs that adapt to learner ability levels improved math ability in India. Teachers can receive explicit guidance to teach students at their level.
Incentivized actions need to be within teachers’ capacity and have impeded learning.
In many systems teachers have few incentives (financial or professional) associated with performance.
Principal-agent: if the education system signals that learning is not valued, teachers will not have same incentives as students and parents.
Teacher financial incentives have been effective in places with high absenteeism, like India and Kenya.
- 6.3 -
Most teacher training is ineffective, but some approaches work
6.2 In-service professional development requires significant time and resources. A survey of 38 countries found that 91 percent of teachers had participated in professional development in the previous 12 months.3 Two-thirds of World Bank projects with an education component in the past decade had teacher professional development. Developing countries spend many millions a year to strengthen teachers.4
6.3 But a lot of teacher professional development goes unevaluated—and much may be ineffective. One team of teacher training experts in the United States characterized professional development there as “episodic, myopic, and often meaningless.”5 Teacher training in low- and middle-income countries is often short and of low quality.6 Countries often have many training programs happening at the same time—in some cases dozens—with little to show for it (box 6.1).
Box 6.1 The landscape of in-service teacher training
The quality of in-service teacher training varies dramatically across countries, but much of it does not align with practices associated with better student performance.7 One good practice of in-service teacher training involves follow-up visits to teachers’ classrooms to provide ongoing support. Among 100 teacher training programs across five regions, the median number of follow-up visits is less than one per teacher. Many in-service training programs evaluate their success based on teacher knowledge at the end of the training (50 percent)—far fewer seek to assess their impact on student learning (25 percent).8
6.4 Though pre-service teacher training is important in providing basic skills (box 6.2), evidence on teacher training credentials is mixed. Much of the limited evidence on teacher credentials comes from high-income countries, with a mix of no or extremely small effects.9 Simple associations across francophone Africa suggest a positive relationship between teacher preparation and student performance,10 but this could be driven by other factors, such as strategic placement of credentialed teachers in desirable areas. Though preparing teachers is crucial, the political economy challenges to providing it may be greater than for in-service training, and evidence is more limited. The same principles that lead to effective in-service training serve as useful starting points for improving pre-service training.
3 Strizek and others 2014. 4 Calderón 2014; Al-Samarrai 2016; World Bank Education Expenditure Database 2014. 5 Darling-Hammond and others 2009. 6 Lauwerier and Akkari 2015; Hammett 2008. 7 Popova, Evans and Arancibia 2016. 8 Popova, Breeding and Evans 2017. 9 Buddin and Zamarro 2009; Rivkin, Hanushek and Kain 2005; Aaronson, Barrow and Sander 2007; Goldhaber 2007. 10 Michaelowa 2001.
- 6.4 -
Box 6.2 What works in pre-service teacher training?
In New York City teachers who participated in teacher education programs that focused more on practical classroom work and on the curriculum of the first year produced significantly better results among first-year teachers.11 At the same time, systems that have introduced alternate routes to teachers—skipping regular pre-service education—such as Teach for America or recruiting community teachers, have not resulted in reduced learning for students. 12 This calls into question the value of pre-service training. But those programs often substitute pre-service education with more careful selection of teachers (as with Teach for America) or with more performance-oriented contracts (as with contracted community teachers). Thus pre-service education remains important for most education systems and will likely yield better results with more practical training.
6.5 Is there hope for in-service training or professional development? Decidedly yes. Experience from high-income countries show that practicality, specificity, and continuity are key to effective teacher professional development.13 Practicality means teachers are trained with concrete methods as opposed to theoretical constructs, and that the training is classroom based.14 Specificity means teacher training programs are most effective when they teach pedagogy specific to a subject area (say, how to effectively deliver a mathematics class). Continuity means teachers receive significant, continuous support—not one-off workshops.15
6.6 In teacher training programs, the inclusion of follow-up visits in school leads to higher learning gains. To bridge the gap between learning new methods in training and implementing them in practice, developing countries should make more use of follow-up visits where trainers observe and support teachers in the classroom.16 A range of programs with long-term teacher mentoring and coaching have shown sizable learning effects in Africa.17 In India a program that provided little initial training to teachers but then provided support throughout the year significantly increased both math and language ability, with the largest gains for those students who were performing poorly at the outset.18
6.7 Likewise, training associated with a specific pedagogical technique tends to be more effective. Across educational interventions in the United States, programs teaching a specific pedagogical method have more than twice the impact of programs focused on general pedagogy.19 Globally, specific guidance is crucial for low-skilled teachers, where incentives may induce greater effort but without any skill to support it.20 Sometimes, in settings where teachers have very limited skills and at low grades, this involves providing lesson plans with a high degree of scripting, providing concrete steps for teachers.21 Many countries will protest that high-quality in-service professional development—repeated, with follow-up visits in school, often around a specific technique—is beyond their budget to deliver at scale. But teachers will not learn without receiving
11 Boyd and others 2009. 12 Glazerman, Mayer and Decker 2006; Duflo, Dupas and Kremer 2015. 13 Popova, Evans and Arancibia 2016. 14 Walter and Briggs 2012. 15 Yoon and others 2007; Darling-Hammond and others 2009. 16 Popova, Evans and Arancibia 2016; Kraft and others 2016. 17 Conn 2014. 18 Banerjee and others 2007. 19 Fryer Jr 2017. 20 Ganimian and Murnane 2016. 21 Lucas and others 2014; Spratt, King and Bulat 2013; He, Linden and MacLeod 2008; He, Linden and MacLeod 2009.
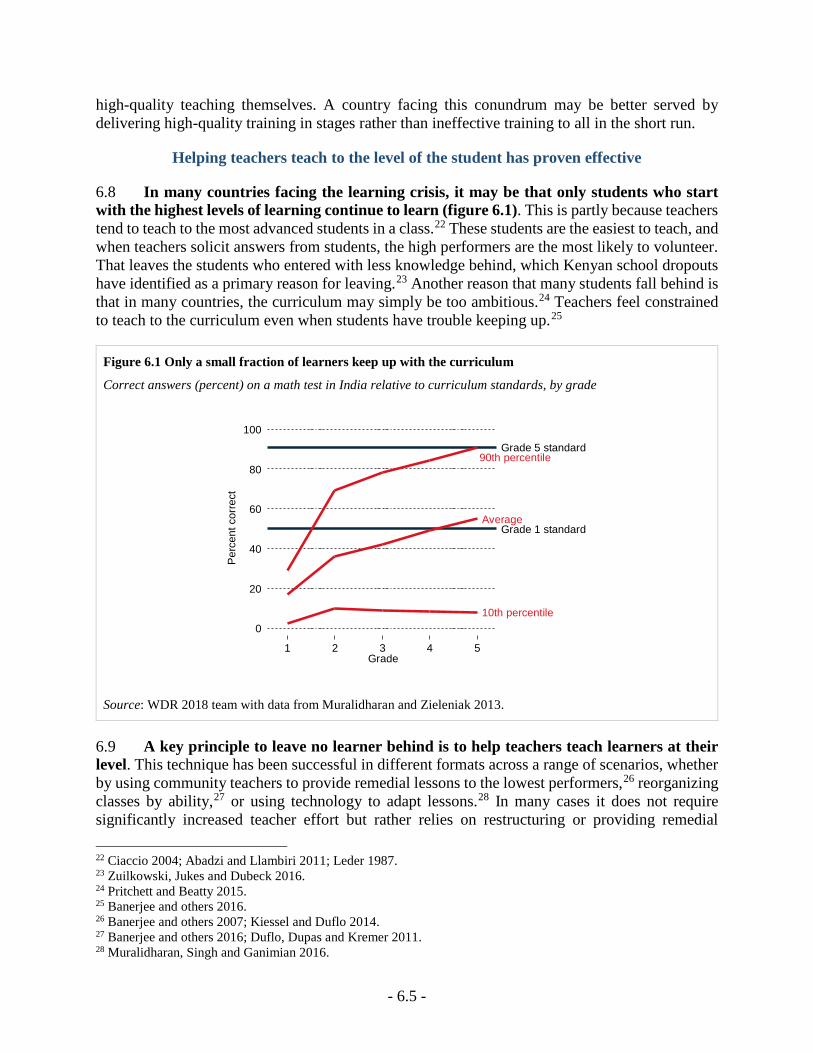
- 6.5 -
high-quality teaching themselves. A country facing this conundrum may be better served by delivering high-quality training in stages rather than ineffective training to all in the short run.
Helping teachers teach to the level of the student has proven effective
6.8 In many countries facing the learning crisis, it may be that only students who start with the highest levels of learning continue to learn (figure 6.1). This is partly because teachers tend to teach to the most advanced students in a class.22 These students are the easiest to teach, and when teachers solicit answers from students, the high performers are the most likely to volunteer. That leaves the students who entered with less knowledge behind, which Kenyan school dropouts have identified as a primary reason for leaving.23 Another reason that many students fall behind is that in many countries, the curriculum may simply be too ambitious.24 Teachers feel constrained to teach to the curriculum even when students have trouble keeping up.25
Figure 6.1 Only a small fraction of learners keep up with the curriculum
Correct answers (percent) on a math test in India relative to curriculum standards, by grade
Source: WDR 2018 team with data from Muralidharan and Zieleniak 2013.
6.9 A key principle to leave no learner behind is to help teachers teach learners at their level. This technique has been successful in different formats across a range of scenarios, whether by using community teachers to provide remedial lessons to the lowest performers,26 reorganizing classes by ability,27 or using technology to adapt lessons.28 In many cases it does not require significantly increased teacher effort but rather relies on restructuring or providing remedial 22 Ciaccio 2004; Abadzi and Llambiri 2011; Leder 1987. 23 Zuilkowski, Jukes and Dubeck 2016. 24 Pritchett and Beatty 2015. 25 Banerjee and others 2016. 26 Banerjee and others 2007; Kiessel and Duflo 2014. 27 Banerjee and others 2016; Duflo, Dupas and Kremer 2011. 28 Muralidharan, Singh and Ganimian 2016.
10th percentile
90th percentile
Average
Grade 5 standard
Grade 1 standard
0
20
40
60
80
100
Perc
ent c
orre
ct
1 2 3 4 5Grade
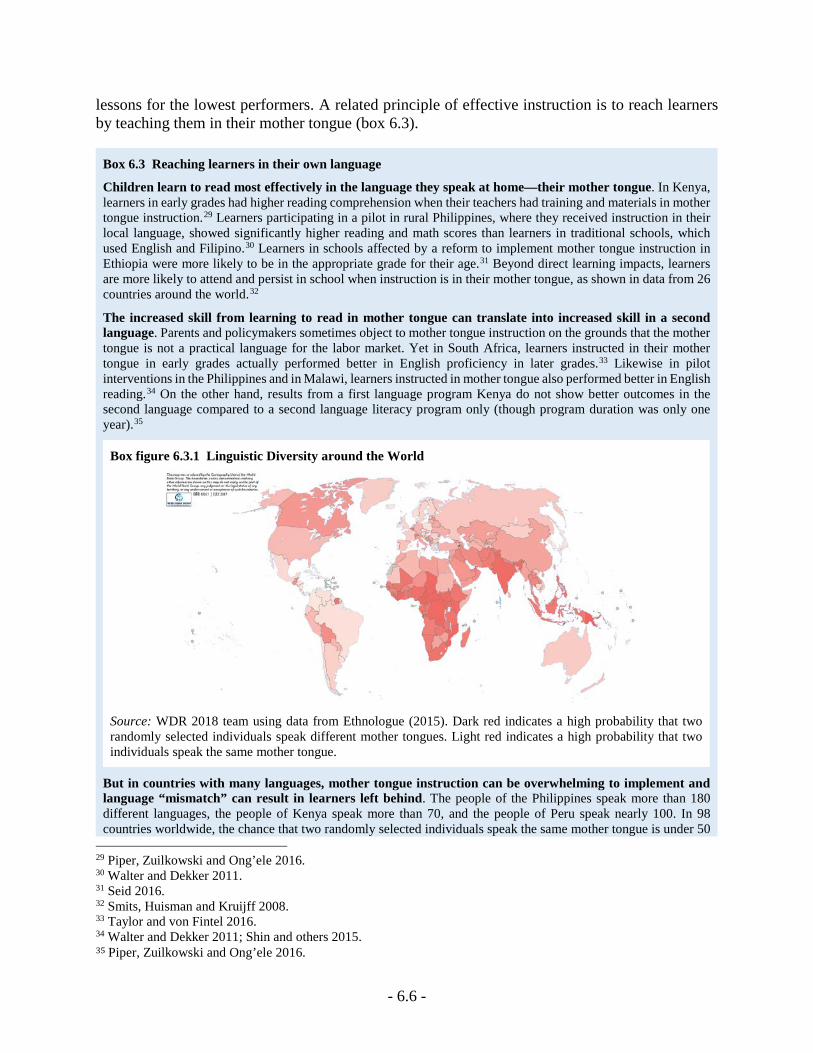
- 6.6 -
lessons for the lowest performers. A related principle of effective instruction is to reach learners by teaching them in their mother tongue (box 6.3).
Box 6.3 Reaching learners in their own language
Children learn to read most effectively in the language they speak at home—their mother tongue. In Kenya, learners in early grades had higher reading comprehension when their teachers had training and materials in mother tongue instruction.29 Learners participating in a pilot in rural Philippines, where they received instruction in their local language, showed significantly higher reading and math scores than learners in traditional schools, which used English and Filipino.30 Learners in schools affected by a reform to implement mother tongue instruction in Ethiopia were more likely to be in the appropriate grade for their age.31 Beyond direct learning impacts, learners are more likely to attend and persist in school when instruction is in their mother tongue, as shown in data from 26 countries around the world.32
The increased skill from learning to read in mother tongue can translate into increased skill in a second language. Parents and policymakers sometimes object to mother tongue instruction on the grounds that the mother tongue is not a practical language for the labor market. Yet in South Africa, learners instructed in their mother tongue in early grades actually performed better in English proficiency in later grades.33 Likewise in pilot interventions in the Philippines and in Malawi, learners instructed in mother tongue also performed better in English reading.34 On the other hand, results from a first language program Kenya do not show better outcomes in the second language compared to a second language literacy program only (though program duration was only one year).35
Box figure 6.3.1 Linguistic Diversity around the World
Source: WDR 2018 team using data from Ethnologue (2015). Dark red indicates a high probability that two randomly selected individuals speak different mother tongues. Light red indicates a high probability that two individuals speak the same mother tongue.
But in countries with many languages, mother tongue instruction can be overwhelming to implement and language “mismatch” can result in learners left behind. The people of the Philippines speak more than 180 different languages, the people of Kenya speak more than 70, and the people of Peru speak nearly 100. In 98 countries worldwide, the chance that two randomly selected individuals speak the same mother tongue is under 50
29 Piper, Zuilkowski and Ong’ele 2016. 30 Walter and Dekker 2011. 31 Seid 2016. 32 Smits, Huisman and Kruijff 2008. 33 Taylor and von Fintel 2016. 34 Walter and Dekker 2011; Shin and others 2015. 35 Piper, Zuilkowski and Ong’ele 2016.
- 6.7 -
percent (box figure 6.3.1).36 In communities with a dominant language group, the choice of that language for mother tongue instruction may marginalize minority children. Even in countries with few languages, teachers generally have little training in mother tongue instruction, and the materials available for mother tongue instruction may be limited and of lower quality than materials in the lingua franca.37 In communities with multiple mother tongues, schools may divide classes by mother tongue; but this can act as a form of segregation.38 Mother tongue instruction may present an unambiguous benefit for countries with a limited number of mother tongues, like Haiti or Burundi, although the initiative still involves a major investment in materials and teacher training. In more diverse locales, governments will need to weigh the gains and the costs associated with mother tongue instruction against competing investments in higher quality education overall, with better selected and better trained teachers who receive more support in reaching learners at their level, regardless of the language they speak.
6.10 Grouping students by ability may allow teachers to more effectively target teaching to the levels of students in their classes. The theoretical effects of ability grouping are mixed. Along with the positive effects of better-targeted teaching comes the adverse effect for lower-performing students of having lost their higher-performing peers into a different classroom. There are also critiques of ability grouping. In early grades in particular, student ability is not always easy to measure, so separating students by ability can put students on the wrong track. Teachers may lower effort when teaching the students in the lower performing group, and higher quality teachers may be assigned to the higher performing classes, since these may be easier to teach and seen as a reward.
6.11 In school systems with very low learning levels, ability grouping has had positive impacts for both lower- and higher-performing students. In Kenya grouping students into classes by ability led to improved outcomes across the board, with the highest impacts among learners with more motivated teachers.39 In India schools reorganized classes by group for just an hour a day and observed major gains in learning.40 Much of the rest of the evidence hails from the United States and—in studies that rely on a credible counterfactual—tracking either helps some students or at least has no adverse impact.41 In low-performing systems the lowest-performing students learn little to nothing (see figure 6.1), so allowing teachers to target pedagogy may have a positive net effect.
6.12 Another way to help teachers reach the level of the student is to help them conduct better diagnostics. In Liberia an intervention that taught teachers to better evaluate their students was effective—especially when combined with training and additional materials. So was a similar program in Malawi.42 In Singapore learners take screening tests at the beginning of first grade, and those who are behind in reading receive daily additional support.43 On the other hand, an intervention in India that merely provided formative evaluation was not effective, and neither was another program in India that provided diagnostic reports and written suggestions to improve.44 Clearly helping teachers to better understand their students’ level of ability is worthwhile, but if teachers lack the tools to respond effectively or the incentives to do so—since teaching students at multiple levels is challenging—then it may not be sufficient to help teachers to reach learners at 36 Ethnologue 2015. 37 RTI International 2015; Ong’uti, Aloka and Raburu 2016. 38 Metila, Pradilla and Williams 2016. 39 Duflo, Dupas and Kremer 2011; Cummins 2016. 40 Banerjee and others 2016. 41 Lefgren 2004; Zimmer 2003; Figlio and Page 2002. 42 Piper and Korda 2010; Bolyard 2003. 43 Schleicher 2011. 44 Duflo and others 2014; Aaronson, Barrow and Sander 2007; Muralidharan and Sundararaman 2010.
- 6.8 -
their level. The diagnostics can work where there is a system in place to follow up, as well as where teacher motivation is less of a binding constraint (box 6.4).
Box 6.4 Using diagnostic data to deliver better learning in Latin America
Mexico’s Colima state implemented a learning improvement program in low-performing public schools using student performance in a national exam. Each school was assigned a technical advisor who visited schools three times a month to train teachers on analyzing the test information as well as understanding the reasons for poor performance. Based on the analysis, the adviser—with school directors and teachers—developed a school-specific plan to address identified problems and provided follow-up support during the implementation of the plan. Student performance improved in both language and math, but only several months after the program was launched.45 A similar program in Argentina—distributing reports on the learning outcomes of students to public primary schools to inform teachers of the strengthens and weakness of their students—also increased learning. Students in those schools reported that their teachers were more active in interacting with students in their classrooms and were less likely to leave early.46
6.13 New technologies offer promising ways to help with teaching to the level of the student. Computer-assisted learning programs can permit students to go at their own pace or adjust the level of instruction based on an initial screening test.47 More advanced software can not only screen students initially but then dynamically adjust questions based on ongoing performance. Although overall evidence on computer-assisted instruction is markedly mixed, such a dynamic learning program among secondary school students in Delhi, India, led to striking gains in both mathematics and language.48 Teaching at the level of the student is not a novel idea, but a range of new evidence is showing how it can be implemented—even at scale—in developing countries.
Teacher motivation and incentives make a difference, even with few inputs
6.14 No amount of training or inputs can substitute for teacher motivation. High teacher absenteeism in many countries show that fostering effort is a serious challenge. Moreover, even when they are in school, teachers are often not in class teaching. Yet education systems in many countries neither reward teachers for performing well nor penalize them for performing poorly. Teachers need to be treated as professionals—and good professionals receive support and dignity, but are also held to high expectations. A system that does not pay attention to what its teachers are doing does not afford teachers the respect they merit (box 6.5).
Box 6.5 Would raising teacher salaries increase teacher motivation?
In many countries teachers are paid less than other, comparably educated professionals.49 Would raising their salaries lead to higher motivation and better performance? Indonesia doubled pay for certified teachers, using a randomized controlled trial to evaluate the impact. Doubling pay increased teacher satisfaction but had no effect on either measurable effort or student performance for existing teachers.50 While higher salaries could attract more capable candidates to the profession over time, raising salaries is no quick fix to the kind of motivation that translates into increased effort.
45 De Hoyos, Garcia-Moreno and Patrinos 2017. 46 De Hoyos Navarro, Ganimian and Holland 2016. 47 Banerjee and others 2007; Carrillo, Onofa and Ponce 2010. 48 Muralidharan, Singh and Ganimian 2016. 49 OECD 2016a; Mizala and Ñopo 2016. 50 De Ree and others 2015.
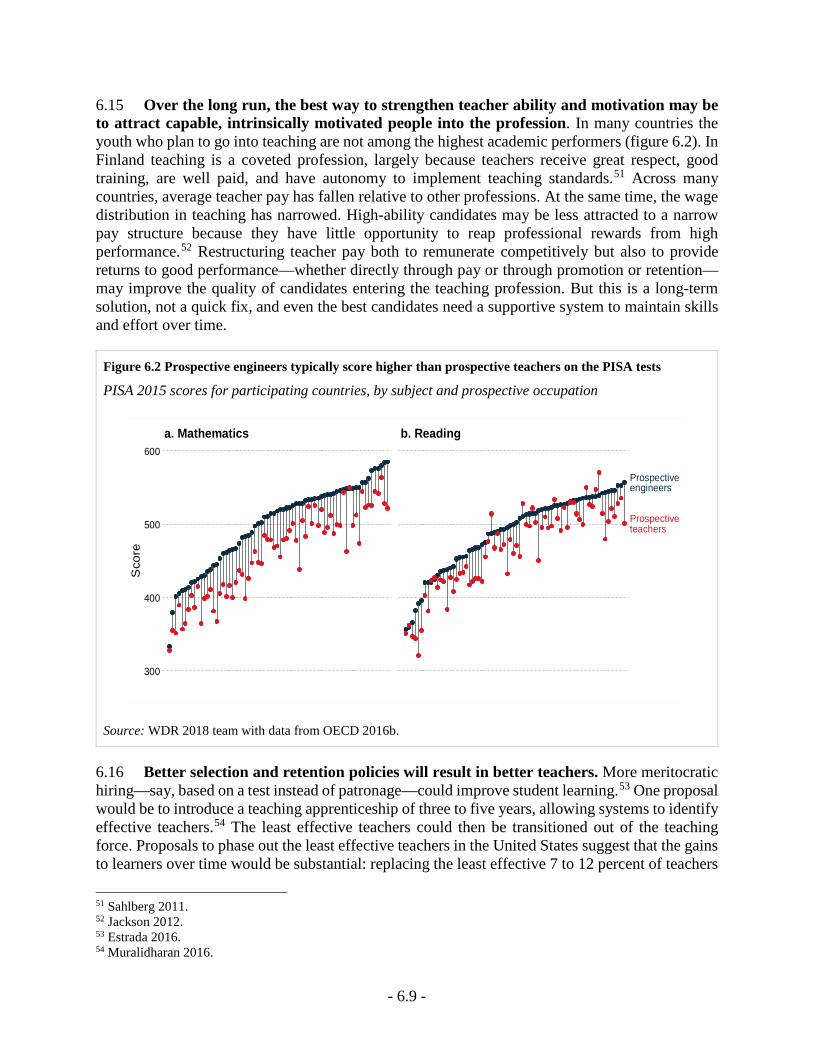
- 6.9 -
6.15 Over the long run, the best way to strengthen teacher ability and motivation may be to attract capable, intrinsically motivated people into the profession. In many countries the youth who plan to go into teaching are not among the highest academic performers (figure 6.2). In Finland teaching is a coveted profession, largely because teachers receive great respect, good training, are well paid, and have autonomy to implement teaching standards.51 Across many countries, average teacher pay has fallen relative to other professions. At the same time, the wage distribution in teaching has narrowed. High-ability candidates may be less attracted to a narrow pay structure because they have little opportunity to reap professional rewards from high performance.52 Restructuring teacher pay both to remunerate competitively but also to provide returns to good performance—whether directly through pay or through promotion or retention—may improve the quality of candidates entering the teaching profession. But this is a long-term solution, not a quick fix, and even the best candidates need a supportive system to maintain skills and effort over time.
Figure 6.2 Prospective engineers typically score higher than prospective teachers on the PISA tests
PISA 2015 scores for participating countries, by subject and prospective occupation
Source: WDR 2018 team with data from OECD 2016b.
6.16 Better selection and retention policies will result in better teachers. More meritocratic hiring—say, based on a test instead of patronage—could improve student learning.53 One proposal would be to introduce a teaching apprenticeship of three to five years, allowing systems to identify effective teachers.54 The least effective teachers could then be transitioned out of the teaching force. Proposals to phase out the least effective teachers in the United States suggest that the gains to learners over time would be substantial: replacing the least effective 7 to 12 percent of teachers
51 Sahlberg 2011. 52 Jackson 2012. 53 Estrada 2016. 54 Muralidharan 2016.
300
400
500
600
Sco
re
a. Mathematics
Prospective engineers
Prospective teachers
b. Reading
- 6.10 -
could bridge the gap between U.S. learner performance and that of Finland.55 Estimates of teacher value added in other countries are comparable, suggesting similarly large gains to improved teacher selection around the world.56
6.17 Systems need to build accountability to align incentives between teachers and others. Teachers have distinct incentives and information from students, parents, and administrators, and mental models and social expectations affect the decisions of all actors. In the absence of accountability to provide motivation, teachers may minimize their efforts even as learners and parents wish for them to exert more. In Argentina and Uganda, more than one-third of teachers surveyed do not see themselves as held responsible for their students’ learning; in Senegal, the share is more than half.57
6.18 Teacher motivation works through various behavioral mechanisms and comes in multiple forms.58 The fact that another person may observe their performance offers a form of professional motivation. So do evaluations, where teachers expect their performance to be assessed, with associated consequences.59 Financial incentives for successful teachers and firing of neglectful ones are just two important parts of a broader spectrum of accountability interventions. At the same time, teachers in many environments face multiple demands beyond teaching, as well as risks like late salaries and even physical danger (box 6.6). It can be tempting, in the face of data on high teacher absenteeism and low teacher skills, to blame teachers for many of the faults of education systems. But these systems often ask far more of teachers than teaching—and at times offer relatively little in return.60
6.19 Financial and nonfinancial incentives are one potential mechanism for teacher motivation. In Indian primary schools that provided teachers with incentives for higher reading and mathematics scores, students performed better.61 Students also scored higher in science and social studies, despite no financial incentives being offered in those areas. Other financial incentive programs had success in two districts of Kenya and elsewhere in India.62 In the United States, by contrast, teacher financial incentives did not affect test scores in several states.63 Large financial incentives for teachers did increase student learning in Washington, D.C..64 In Mexico and Tanzania teacher financial incentives were effective only in conjunction with another intervention.65 One interpretation of this scattered evidence is that financial incentives are most likely to be effective when there are straightforward actions that teachers can take to improve learning. In environments with high teacher absenteeism from school or—at school—from the classroom, it is likely to be clear to teachers that they can improve learning by simply coming to school and teaching. Alternatively, in environments like the United States, where teacher absenteeism is minimal, the specific actions that teachers should take to improve learning may be 55 Hanushek 2011. 56 Buhl-Wiggers and others 2017. 57 Sabarwal and Abu-Jawdeh 2017. 58 Gill, Lerner and Meosky 2016. 59 Lerner and Tetlock 1999. 60 Mizala and Ñopo 2016; OECD 2016a. 61 Muralidharan and Sundararaman 2011; Muralidharan 2012. 62 Glewwe, Ilias and Kremer 2010; Duflo, Hanna and Ryan 2012. 63 Fryer 2013 ; Springer and others 2010; Glazerman, McKie and Carey 2009. 64 Dee and Wyckoff 2015. 65 Behrman and others 2015; Mbiti and others 2016.
- 6.11 -
less obvious and less easy to implement. Nonfinancial incentives may include providing special recognition to successful teachers. The evidence of the effectiveness of these in education is limited, although there is suggestive evidence elsewhere: among health workers in Zambia, where a public display of worker success markedly improved performance.66
Box 6.6 One factor undermining teaching: poor working conditions
Analyses of the proximate causes of a lack of learning in low- and middle-income countries often point to teachers. Evidence suggests that in many countries, teachers are absent for startling numbers of school days and know insufficient amounts of the content they are to teach. True, students and other stakeholders want and deserve more from teachers—but teachers also deserve more from the systems that employ them. Over the past few decades the status of the teaching profession has declined across the world in terms of pay, respect, and working conditions.67 Due to the rapid expansion in access to education, teachers in developing countries often lead oversized, multigrade classes.68 The teacher shortage increases workloads and requires long working hours, sometimes including double shifts.69 Moreover, teachers often have duties outside classrooms, such as coordinating activities of parent-teacher associations, running extracurricular activities, and performing administrative tasks.70
Teachers in developing countries also face difficult working and living conditions. A lack of school infrastructure and equipment often handicaps their efforts.71 Many teachers take on other jobs to support themselves and their families.72 The situation is even worse for teachers in remote and rural areas, who have to travel long distances to work and collect their salary.73
Moreover, widely implemented curriculum reforms require teachers to equip students with new skills and employ better pedagogy, but often without providing sufficient training and supportive teaching materials.74 While teachers are expected to perform as professionals, many education systems fail to provide professional development opportunities and create a professional culture for teachers.75
6.20 Financial incentives can also create challenges. A student incentive program in Kenya led teachers to focus on teaching very specifically to the test, potentially neglecting more holistic learning. In a teacher incentive program in Mexican secondary schools, a significant portion of the identified increase in student learning was identified as a result of student cheating.76 In the United States teacher cheating rose strongly when incentives were increased.77 And when teacher incentive programs are removed, the results can also be adverse.78
6.21 With financial incentives, the devil is in the details. Incentives can be based on teacher inputs such as attendance or on outputs like student learning. They can be based on reaching an absolute level of achievement or on gains. They can be available to all who reach a goal, or they can be competitive across schools. They will vary in their size relative to teacher salaries. The
66 Ashraf, Bandiera and Jack 2014. 67 Keuren, Silova and McAllister 2015; Dolton and Marcenaro-Gutierrez 2011;Hammett 2008. 68 Lassibille and others 2016; Guajardo 2011; Ramachandran, Bhattacharjea and Sheshagiri 2008. 69 Ávalos and Valenzuela 2016; Urwick and Kisa 2014; Osei 2006; Liu and Onwuegbuzie 2012;Lassibille and others 2016; Luschei and Chudgar 2017. 70 Guajardo 2011; Liu and Onwuegbuzie 2012; Luschei and Chudgar 2017. 71 Urwick and Kisa 2014; Lassibille and others 2016; Alcázar and others 2006. 72 Urwick and Kisa 2014. 73 Lassibille and others 2016. 74 Peng and others 2014; Urwick and Kisa 2014. 75 Mooij 2008. 76 Behrman and others 2015. 77 Jacob and Levitt 2003. 78 Jinnai 2016; Visaria and others 2016.
- 6.12 -
evidence on these design elements is still limited, but they merit careful consideration—taking into account local institutions.
6.22 Likewise, the precise shape of a system’s overall incentive structure will vary by context. In some places financial incentives may be worth piloting. In others, increased community accountability may be effective. But mixed evidence on these interventions suggests a careful need to examine the context and to test programs locally. Still, in the end, no education system will be successful without building incentives for teacher effort into its structure, whether implicit or explicit.
* * *
6.23 Over time, systems perform best when they have teachers who are respected, prepared, selected based on merit, and supported in their work. Countries should work towards this objective. But in the short-run, there are actions that countries can take to strengthen the performance of teachers. They can improve the quality of professional development, shifting resources to the kinds of professional development that will change teacher performance in the classroom. They can support teachers in teaching to the level of the child. They can provide a professional structure so that teachers feel motivation to apply what they know. Teachers are a key to learners’ education: making them better in both the short- and the long-run is a good investment.
- 6.13 -
References
Aaronson, Daniel , Lisa Barrow, and William Sander. 2007. "Teachers and Student Achievement in the Chicago Public High Schools " Journal of Labor Economics 25(1): 95-135.
Abadzi, Helen, and Stavri Llambiri. 2011. "Selective Teacher Attention in Lower-Income Countries: A Phenomenon Linked to Dropout and Illiteracy?" Prospects 41(4): 491-506.
Al-Samarrai, Samer. 2016. "Assessing Basic Education Service Delivery in the Philippines : Public Education Expenditure Tracking and Quantitative Service Delivery Study." Washington, DC: World Bank Group. .
Alcázar, Lorena, F Halsey Rogers, Nazmul Chaudhury, Jeffrey Hammer, Michael Kremer, and Karthik Muralidharan. 2006. "Why Are Teachers Absent? Probing Service Delivery in Peruvian Primary Schools." International Journal of Educational Research 45(3): 117-36.
Ashraf, Nava, Oriana Bandiera, and B Kelsey Jack. 2014. "No Margin, No Mission? A Field Experiment on Incentives for Public Service Delivery." Journal of Public Economics 120: 1-17.
Ávalos, Beatrice, and Juan Pablo Valenzuela. 2016. "Education for All and Attrition/Retention of New Teachers: A Trajectory Study in Chile." International Journal of Educational Development 49: 279-90.
Banerjee, Abhijit, Rukmini Banerji, James Berry, Esther Duflo, Harini Kannan, Shobhini Mukerji, Marc Shotland, and Michael Walton. 2016. "Mainstreaming an Effective Intervention: Evidence Form Randomized Evaluations of "Teaching at the Right Level" in India." National Bureau of Economic Research Working Paper No. 22746.
Banerjee, Abhijit V., Shawn Cole, Esther Duflo, and Leigh Linden. 2007. "Remedying Education: Evidence from Two Randomized Experiments in India." The Quarterly Journal of Economics 122(3): 1235-64.
Behrman, Jere R, Susan W Parker, Petra E Todd, and Kenneth I Wolpin. 2015. "Aligning Learning Incentives of Students and Teachers: Results from a Social Experiment in Mexican High Schools." Journal of Political Economy 123(2): 325-64.
Bolyard, K.J. 2003. "Linking Continuous Assessment and Teacher Development: Evaluating a Model of Continuous Assessment for Primary Schools in Malawi." Educational Quality Improvement Program, USAID.
Boyd, Donald J, Pamela L Grossman, Hamilton Lankford, Susanna Loeb, and James Wyckoff. 2009. "Teacher Preparation and Student Achievement." Educational Evaluation and Policy Analysis 31(4): 416-40.
Bruns, Barbara, and Javier Luque. 2015. Great Teachers : How to Raise Student Learning in Latin America and the Caribbean. Washington DC: The World Bank.
Buddin, Richard, and Gema Zamarro. 2009. "Teacher Qualifications and Student Achievement in Urban Elementary Schools." Journal of Urban Economics 66(2): 103-15.
Buhl-Wiggers, Julie, Jason T Kerwin, Jeffrey A. Smith, and Rebecca Thornton. 2017. "The Impact of Teacher Effectiveness on Student Learning in Africa." Paper presented at the RISE Annual Conference 2017, http://www.riseprogramme.org/sites/www.riseprogramme.org/files/Buhl-Wiggers%20The%20Impact%20of%20Teacher%20Effectiveness%202017-04-30_0.pdf.
Calderón, David. 2014. "Invertir En La Formación Docente." Animal Político. http://www.animalpolitico.com/blogueros-aprender-es-mi-derecho/2014/11/13/invertir-en-la-formacion-docente/.
Carrillo, Paul, Mercedes Onofa, and Juan Ponce. 2010. "Information Technology and Student Achievement: Evidence from a Randomized Experiment in Ecuador " IDB Working Paper Series No. IDB-WP-223, Inter-American Development Bank.
Ciaccio, Joseph. 2004. Totally Positive Teaching. Association for Supervision and Curriculum Development (ASCD).
Conn, Katharine M. 2014. "Indentifying Effective Education Interventions in Sub-Saharan Africa: A Meta-Analysis of Rigorous Impact Evaluations." Economics and Education Columbia University.
Cummins, Joseph R. 2016. "Heterogeneous Treatment Effects in the Low Track: Revisiting the Kenyan Primary School Experiment." Economics of Education Review.
Darling-Hammond, Linda, Ruth Chung Wei, Alethea Andree, Nikole Richardson, and Stelios Orphanos. 2009. "Professional Learning in the Learning Profession: A Status Report on Teacher Development in the United States and Abroad." National Staff Development Council
De Hoyos Navarro, Rafael E, Alejandro Ganimian, and Peter A. Holland. 2016. "Teaching with the Test: Experimental Evidence on Diagnostic Feedback and Capacity-Building for Schools in Argentina." Working Paper.
- 6.14 -
De Hoyos, Rafael, Vicente A Garcia-Moreno, and Harry Anthony Patrinos. 2017. "The Impact of an Accountability Intervention with Diagnostic Feedback: Evidence from Mexico." Economics of Education Review 58: 123-40.
De Ree, Joppe, Karthik Muralidharan, Menno Pradhan, and Halsey Rogers. 2015. "Double for Nothing? Experimental Evidence on the Impact of an Unconditional Teacher Salary Increase on Student Performance in Indonesia." National Bureau of Economic Research Working Paper No. 21806.
Dee, Thomas S, and James Wyckoff. 2015. "Incentives, Selection, and Teacher Performance: Evidence from Impact." Journal of Policy Analysis and Management 34(2): 267-97.
Dolton, Peter, and Oscar Marcenaro-Gutierrez. 2011. "2013 Global Teacher Status Index." Varkey Foundation. https://www.varkeyfoundation.org/sites/default/files/documents/2013GlobalTeacherStatusIndex.pdf.
Duflo, Esther, James Berry, Shobhini Mukerji, and Marc Shotland. 2014. "A Wide Angle View of Learning: Evaluation of the Cce and Lep Programmes in Haryana, 3ie Grantee Final Report." International Initiative for Impact Evaluation (3ie).
Duflo, Esther, Pascaline Dupas, and Michael Kremer. 2011. "Peer Effects, Teacher Incentives, and the Impact of Tracking: Evidence from a Randomized Evaluation in Kenya." American Economic Review 101(5): 1739-74.
———. 2015. "School Governance, Teacher Incentives, and Pupil–Teacher Ratios: Experimental Evidence from Kenyan Primary Schools." Journal of Public Economics 123: 92-110.
Duflo, Esther, Rema Hanna, and Stephen P. Ryan. 2012. "Incentives Work: Getting Teachers to Come to School " American Economic Review 102(4): 1241-78.
Estrada, Ricardo. 2016. "Crony Education: Teacher Hiring and Rent Extraction " Working Paper.
Ethnologue. 2015. "Languages of the World, Eighteenth Edition ".
Figlio, David N, and Marianne E Page. 2002. "School Choice and the Distributional Effects of Ability Tracking: Does Separation Increase Inequality?" Journal of Urban Economics 51(3): 497-514.
Fryer Jr, Roland G. 2017. "The Production of Human Capital in Developed Countries: Evidence from 196 Randomized Field Experiments." Handbook of Economic Field Experiments 2: 95-322.
Fryer, Roland G. 2013 "Teacher Incentives and Student Achievement: Evidence from New York City Public Schools." Journal of Labor Economics 31(2): 374-427.
Ganimian, Alejandro, and Richard J. Murnane. 2016. "Improving Education in Developing Countries: Lessons from Rigorous Impact Evaluations." Review of Educational Research 86(3 ): 719-55.
Gill, Brian P., Jennifer S. Lerner, and Paul Meosky. 2016. "Reimagining Accountability in K–12 Education." Behavioral Science & Policy 2(1): 57-70.
Glazerman, Steven, Daniel Mayer, and Paul Decker. 2006. "Alternative Routes to Teaching: The Impacts of Teach for America on Student Achievement and Other Outcomes." Journal of Policy Analysis and Management 25(1): 75-96.
Glazerman, Steven, Allison McKie, and Nancy Carey. 2009. "An Evaluation of the Teacher Advancement Program (Tap) in Chicago: Year One Impact Report. Final Report." Mathematica Policy Research, Inc.
Glewwe, Paul, Nauman Ilias, and Michael Kremer. 2010. "Teacher Incentives " American Economic Journal: Applied Economics 2(3): 205-27.
Goldhaber, Dan 2007. "Everyone's Doing It, but What Does Teacher Testing Tell Us About Teacher Effectiveness? ." Journal of Human Resources 42(4): 765-94.
Guajardo, Jarret. 2011. "Teacher Motivation: Theoretical Framework, Situation Analysis of Save the Children Country Offices, and Recommended Strategies." Fairfield, CT: Save the Children.
Hammett, Daniel. 2008. "Disrespecting Teacher: The Decline in Social Standing of Teachers in Cape Town, South Africa." International Journal of Educational Development 28(3): 340-47.
Hanushek, Eric A. 2011. "Valuing Teachers." Education next 11(3).
He, Fang, Leigh L. Linden, and Margaret MacLeod. 2008. "How to Teach English in India: Testing the Relative Productivity of Instruction Methods within the Pratham English Language Education Program." Unpublished manuscript.
———. 2009. "A Better Way to Teach Children to Read? Evidence from a Randomized Controlled Trial " Working Paper, Columbia University
Jackson, C Kirabo. 2012. "Recruiting, Retaining, and Creating Quality Teachers." Nordic Economic Policy Review 3(1): 61-104.
Jacob, Brian A. , and Steven D. Levitt. 2003. "Rotten Apples: An Investigation of the Prevalence and
- 6.15 -
Predictors of Teacher Cheating." Quarterly Journal of Economics 118(3): 843-78.
Jinnai, Yusuke. 2016. "To Introduce or Not to Introduce Monetary Bonuses: The Cost of Repealing Teacher Incentives." Economics and Management Series. International University of Japan.
Keuren, Christine Harris-Van, Iveta Silova, and Suzanne McAllister. 2015. "The Evolution of the Status of the Teaching Profession (2000-2015) and the Impact on the Quality of Education in Developing Countries: Three Case Studies." Background paper prepared for the Education for All Global Monitoring Report 2015.
Kiessel, Jessica, and Annie Duflo. 2014. "Teacher Community Assistant Initiative Cost Effectiveness Report " Innovation for Poverty Action (IPA) brief.
Lassibille, Gérard, Carlos Gamero Buron, Gérard Lassibille, Carlos Gamero Buron, Gérard Lassibille, Carlos Gamero Buron, Gérard Lassibille, Gérard Lassibille, Carlos Gamero Buron, and Gérard Lassibille. 2016. "Job Satisfaction among Primary School Personnel in Madagascar." The Journal of Development Studies.
Lauwerier, Thibaut, and Abdeljalil Akkari. 2015. "Teachers and the Quality of Basic Education in Sub-Saharan Africa." Education Research and Foresight: Working Papers Series, 2015, no.11.
Leder, Gilah C. 1987. "Teacher Student Interaction: A Case Study." Educational Studies in Mathematics 18(3): 255-71.
Lefgren, Lars. 2004. "Educational Peer Effects and the Chicago Public Schools." Journal of urban Economics 56(2): 169-91.
Lerner, Jennifer S, and Philip E Tetlock. 1999. "Accounting for the Effects of Accountability." Psychological bulletin 125(2): 255.
Liu, Shujie, and Anthony J Onwuegbuzie. 2012. "Chinese Teachers’ Work Stress and Their Turnover Intention." International Journal of Educational Research 53: 160-70.
Lucas, Adrienne M., Patrick J. McEwan, Moses Ngware, and Moses Oketch. 2014. "Improving Early-Grade Literacy in East Africa: Experimental Evidence from Kenya and Uganda." Journal of Policy Analysis and Management 33(4): 950-76.
Luschei, Thomas F, and Amita Chudgar. 2017. "Supply-Side Explanations for Inequitable Teacher Distribution." In Teacher Distribution in Developing Countries, 87-107. Springer.
Mbiti, Isaac M., Karthik Muralidharan, M. Romero, Youdi Schipper, C. Manda, and Rakesh Rajani. 2016.
"Inputs, Incentives, and Complementarities in Primary Education: Experimental Evidence from Tanzania." Unpublished manuscript. University of California at San Diego, San Diego, CA. .
Metila, Romylyn A, Lea Angela S Pradilla, and Alan B Williams. 2016. "The Challenge of Implementing Mother Tongue Education in Linguistically Diverse Contexts: The Case of the Philippines." The Asia-Pacific Education Researcher 25(5-6): 781-89.
Michaelowa, Katharina. 2001. "Primary Education Quality in Francophone Sub-Saharan Africa: Determinants of Learning Achievement and Efficiency Considerations." World Development 29(10): 1699-716.
Mizala, Alejandra, and Hugo Ñopo. 2016. "Measuring the Relative Pay of School Teachers in Latin America 1997–2007." International Journal of Educational Development 47: 20-32.
Mooij, Jos. 2008. "Primary Education, Teachers’ Professionalism and Social Class About Motivation and Demotivation of Government School Teachers in India." International journal of educational development 28(5): 508-23.
Mulkeen, Aidan. 2010. Teachers in Anglophone Africa: Issues in Teacher Supply, Training, and Management. World Bank Publications.
Muralidharan, Karthik. 2012. "Long Term Effects of Teacher Performance Pay " Unpublished manuscript.
———. 2016. "A New Approach to Public Sector Hiring in India for Improved Service Delivery." Working Paper.
Muralidharan, Karthik, Abhijeet Singh, and Alejandro Ganimian. 2016. "Disrupting Education? Experimental Evidence on Technology-Aided Instruction in India." National Bureau of Economic Research Working Paper No.22923.
Muralidharan, Karthik, and Venkatesh Sundararaman. 2010. "The Impact of Diagnostic Feedback to Teachers on Student Learning: Experimental Evidence from India." The Economic Journal 120(546): F187-F203.
———. 2011. "Teacher Performance Pay: Experimental Evidence from India." The Journal of Political Economy 119(1): 39-77.
Muralidharan, Karthik, and Yendrick Zieleniak. 2013. "Measuring Learning Trajectories in Developing Countries with Longitudinal Data and Item Response Theory." Young Lives Conference. London.
OECD. 2016a. "Education at a Glance 2016: Oecd Indicators." OECD Publishing, Paris.
———. 2016b. "Pisa 2015 Data."
- 6.16 -
Ong’uti, Charles Onchiri, Peter JO Aloka, and Pamela Raburu. 2016. "Factors Affecting Teaching and Learning in Mother Tongue in Public Lower Primary Schools in Kenya." International Journal of Psychology and Behavioral Sciences 6(3): 161-66.
Osei, George M. 2006. "Teachers in Ghana: Issues of Training, Remuneration and Effectiveness." International Journal of Educational Development 26(1): 38-51.
Peng, Wen J, Elizabeth McNess, Sally Thomas, Xiang Rong Wu, Chong Zhang, Jian Zhong Li, and Hui Sheng Tian. 2014. "Emerging Perceptions of Teacher Quality and Teacher Development in China." International Journal of Educational Development 34: 77-89.
Piper, Benjamin, and Medina Korda. 2010. "Egra Plus: Liberia -- Program Evaluation Report." RTI International.
Piper, Benjamin, Stephanie S Zuilkowski, and Salome Ong’ele. 2016. "Implementing Mother Tongue Instruction in the Real World: Results from a Medium-Scale Randomized Controlled Trial in Kenya." Comparative Education Review 60(4): 776-807.
Popova, Anna, Mary E. Breeding, and David K Evans. 2017. "Global Landscape of in-Service Teacher Professional Development Programs: The Gap between Evidence and Practice. ." WDR 2018 Background Paper, The World Bank.
Popova, Anna, David K. Evans, and Violeta Arancibia. 2016. "Training Teachers on the Job: What Works and How to Measure It." World Bank Policy Research Working Paper 7834.
Pritchett, Lant, and Amanda Beatty. 2015. "Slow Down, You're Going Too Fast: Matching Curricula to Student Skill Levels." International Journal of Educational Development 40: 276-88.
Ramachandran, Vimala, Suman Bhattacharjea, and KM Sheshagiri. 2008. "Primary School Teachers: The Twists and Turns of Everyday Practice." Education Resource Unit, New Delhi and Azim Premji Foundation, Bengaluru.
Rivkin, Steven G. , Eric A. Hanushek, and John F. Kain. 2005. "Teachers, Schools and Academic Achievement " Econometrica 73(2): 417-58.
RTI International. 2015. "Survey of Children's Reading Materials in African Languages in Eleven Countries -- Final Report " Washington, DC: U.S. Agency for International Development
Sabarwal, Shwetlena, and Malek Abu-Jawdeh. 2017. "Understanding Teacher Effort: Insights from Cross-
Country Data on Teacher Perceptions." WDR 2018 Background Paper, The World Bank.
Sahlberg, Pasi. 2011. Finnish Lessons. Teachers College Press.
Schleicher, Andreas. 2011. "Lessons from Pisa for the United States, Strong Performers and Successful Reformers in Education." OECD Publishing.
Seid, Yared. 2016. "Does Learning in Mother Tongue Matter? Evidence from a Natural Experiment in Ethiopia." Economics of Education Review 55: 21-38.
Shin, Jaran, Misty Sailors, Nicola McClung, P David Pearson, James V Hoffman, and Margaret Chilimanjira. 2015. "The Case of Chichewa and English in Malawi: The Impact of First Language Reading and Writing on Learning English as a Second Language." Bilingual Research Journal 38(3): 255-74.
Smits, JPJM, AHM Huisman, and Karine Kruijff. 2008. "Home Language and Education in the Developing World." Background paper prepared for the Education for All Global Monitoring Report 2009.
Spratt, Jennifer, Simon King, and Jennae Bulat. 2013. "Independent Evaluation of the Effectiveness of Institut Pour L'education Populaire's "Read-Learn-Lead"(Rll) Program in Mali: Endline Report " RTI International
Springer, Matthew G. , Laura Hamilton, Daniel F. McCaffrey, Dale Ballou, Vi-Nhuan Le, Matthew Pepper, J.R. Lockwood, and Brian M. Stecher. 2010. "Teacher Pay for Performance: Experimental Evidence from the Project on Incentives in Teaching " National Center on Performance Incentives
Strizek, Gregory A. , Steve Tourkin, Ebru Erberber, and Patrick Gonzales. 2014. "Teaching and Learning International Survey (Talis) 2013: U.S. Technical Report (Nces 2015-010)." U.S. Department of Education. Washington, DC: National Center for Education Statistics
Tandon, Prateek, and Tsuyoshi Fukao. 2015. Educating the Next Generation: Improving Teacher Quality in Cambodia. World Bank Publications.
Taylor, Stephen, and Marisa von Fintel. 2016. "Estimating the Impact of Language of Instruction in South African Primary Schools: A Fixed Effects Approach." Economics of Education Review 50: 75-89.
Urwick, James, and Sarah Kisa. 2014. "Science Teacher Shortage and the Moonlighting Culture: The Pathology of the Teacher Labour Market in Uganda." International Journal of Educational Development 36: 72-80.
Visaria, Sujata, Rajeev Dehejia, Melody M Chao, and Anirban Mukhopadhyay. 2016. "Unintended Consequences of Rewards for Student Attendance:
- 6.17 -
Results from a Field Experiment in Indian Classrooms." Economics of Education Review 54: 173-84.
Walter, Catherine, and Jessica Briggs. 2012. "What Professional Development Makes the Most Difference to Teachers." A report sponsored by Oxford University Press. Retrieved on July 20: 2015.
Walter, Stephen L, and Diane E Dekker. 2011. "Mother Tongue Instruction in Lubuagan: A Case Study from the Philippines." International Review of Education 57(5-6): 667-83.
World Bank. 2013. "Service Delivery Indicators ".
World Bank Education Expenditure Database. 2014. "Teacher Training (% of Total Education Expenditure)."
Yoon, Kwang Suk, Teresa Duncan, Silvia Wen-Yu Lee, Beth Scarloss, and Kathy L Shapley. 2007. "Reviewing the Evidence on How Teacher Professional Development Affects Student Achievement. Issues & Answers. Rel 2007-No. 033." Regional Educational Laboratory Southwest (NJ1).
Zimmer, Ron. 2003. "A New Twist in the Educational Tracking Debate." Economics of Education Review 22(3): 307-15.
Zuilkowski, Stephanie Simmons, Matthew CH Jukes, and Margaret M Dubeck. 2016. "“I Failed, No Matter How Hard I Tried”: A Mixed-Methods Study of the Role of Achievement in Primary School Dropout in Rural Kenya." International Journal of Educational Development 50: 100-07.

- 7.1 -
Chapter 7 Everything else should strengthen the teacher-learner interaction
Contents
Technological interventions increase learning—but only if they enhance the teacher-learner relationship 2
Other inputs bring learners to school—but only promote learning if they improve teaching and learning . 5
School management is crucial, and involving communities can help overcome incentive problems and information failures—but only if communities have capacity ...................................................................... 6
Investments in school inputs and management should be guided by how well they improve the teacher-learner relationship. Many school inputs do not increase learning, so the gap between evidence and practice can sharpen focus on inputs that will.
7.1 Learners and teachers have a more productive learning relationship when complemented by other inputs. Countries around the world—from the lowest- to the highest-income—are seeking to incorporate technology into their classrooms and education systems. But technology is merely the most discussed of a range of inputs intended to complement the teacher-learner relationship, from pencils and textbooks in the hands of learners to the walls and roofs of school buildings. School management plays the same role in at least one way: it is most effective when it supports students learning from teachers. Yet technology—along with other physical inputs—often fails to complement the work that teachers and students do, and the potential of school leaders and community members often goes unrealized. This chapter lays out evidence for the most effective use of these complements in places where the gap with actual practice is largest. In many cases the failures observed can be illuminated through models of human behavior, which also point the way to solutions (table 7.1). A synthesis of the evidence in these areas lends itself to three principles key to success in achieving learning through school investments:
• Acknowledge that additional inputs—including new technology—increase learning when they complement rather than substitute for teachers.
• Ensure that information and communication technology (ICT) can be implemented in current systems; otherwise it will be ineffective.
• Recognize that school governance reform and community monitoring can increase learning only if they affect interaction between teachers and learners.
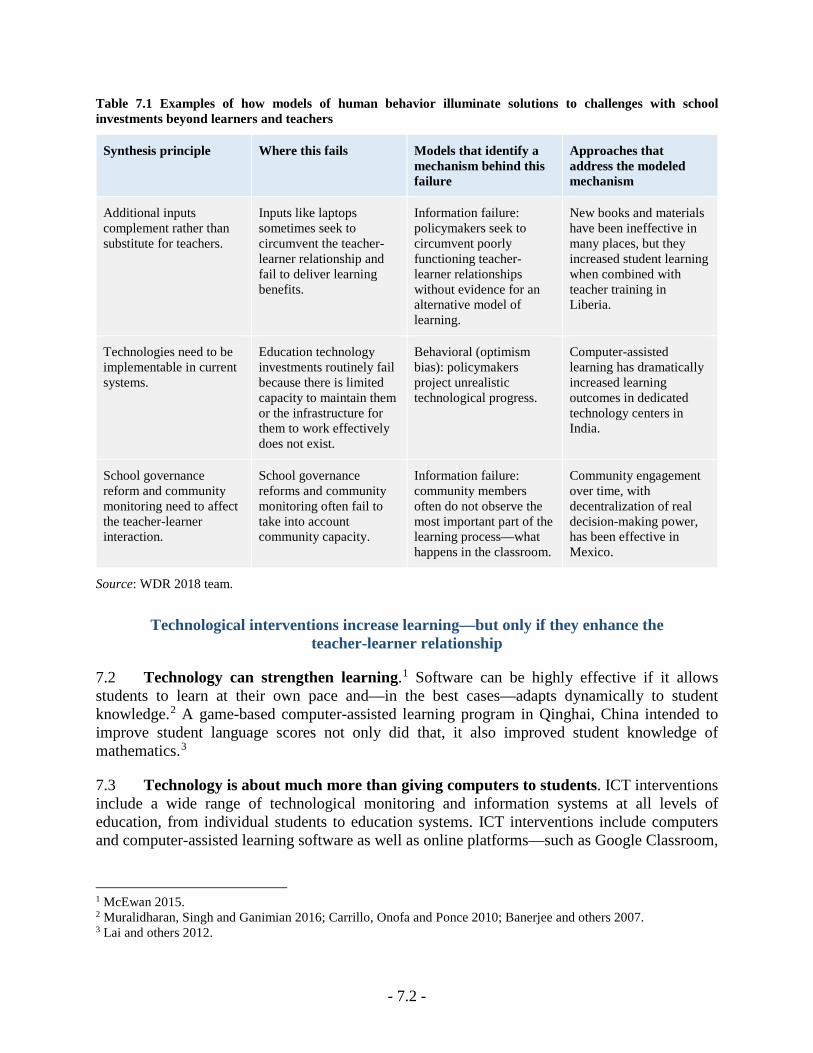
- 7.2 -
Table 7.1 Examples of how models of human behavior illuminate solutions to challenges with school investments beyond learners and teachers
Synthesis principle Where this fails Models that identify a mechanism behind this failure
Approaches that address the modeled mechanism
Additional inputs complement rather than substitute for teachers.
Inputs like laptops sometimes seek to circumvent the teacher-learner relationship and fail to deliver learning benefits.
Information failure: policymakers seek to circumvent poorly functioning teacher-learner relationships without evidence for an alternative model of learning.
New books and materials have been ineffective in many places, but they increased student learning when combined with teacher training in Liberia.
Technologies need to be implementable in current systems.
Education technology investments routinely fail because there is limited capacity to maintain them or the infrastructure for them to work effectively does not exist.
Behavioral (optimism bias): policymakers project unrealistic technological progress.
Computer-assisted learning has dramatically increased learning outcomes in dedicated technology centers in India.
School governance reform and community monitoring need to affect the teacher-learner interaction.
School governance reforms and community monitoring often fail to take into account community capacity.
Information failure: community members often do not observe the most important part of the learning process—what happens in the classroom.
Community engagement over time, with decentralization of real decision-making power, has been effective in Mexico.
Source: WDR 2018 team.
Technological interventions increase learning—but only if they enhance the teacher-learner relationship
7.2 Technology can strengthen learning.1 Software can be highly effective if it allows students to learn at their own pace and—in the best cases—adapts dynamically to student knowledge.2 A game-based computer-assisted learning program in Qinghai, China intended to improve student language scores not only did that, it also improved student knowledge of mathematics.3
7.3 Technology is about much more than giving computers to students. ICT interventions include a wide range of technological monitoring and information systems at all levels of education, from individual students to education systems. ICT interventions include computers and computer-assisted learning software as well as online platforms—such as Google Classroom,
1 McEwan 2015. 2 Muralidharan, Singh and Ganimian 2016; Carrillo, Onofa and Ponce 2010; Banerjee and others 2007. 3 Lai and others 2012.
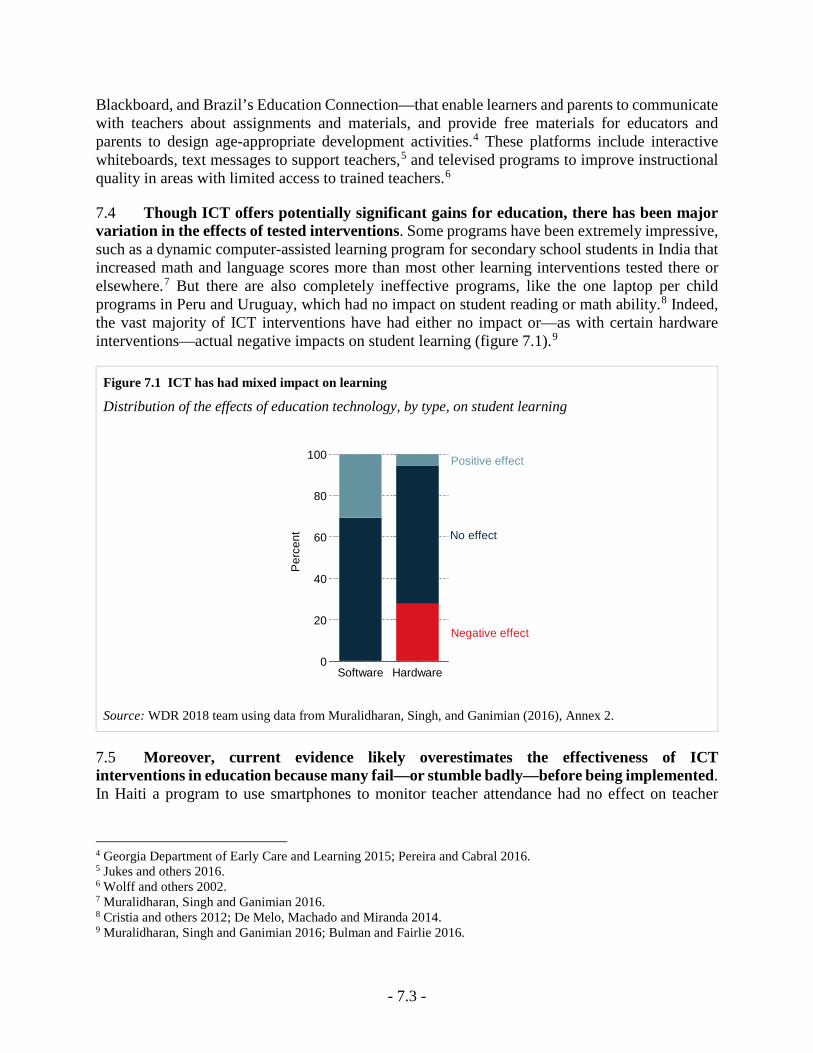
- 7.3 -
Blackboard, and Brazil’s Education Connection—that enable learners and parents to communicate with teachers about assignments and materials, and provide free materials for educators and parents to design age-appropriate development activities.4 These platforms include interactive whiteboards, text messages to support teachers,5 and televised programs to improve instructional quality in areas with limited access to trained teachers.6
7.4 Though ICT offers potentially significant gains for education, there has been major variation in the effects of tested interventions. Some programs have been extremely impressive, such as a dynamic computer-assisted learning program for secondary school students in India that increased math and language scores more than most other learning interventions tested there or elsewhere.7 But there are also completely ineffective programs, like the one laptop per child programs in Peru and Uruguay, which had no impact on student reading or math ability.8 Indeed, the vast majority of ICT interventions have had either no impact or—as with certain hardware interventions—actual negative impacts on student learning (figure 7.1).9
Figure 7.1 ICT has had mixed impact on learning
Distribution of the effects of education technology, by type, on student learning
Source: WDR 2018 team using data from Muralidharan, Singh, and Ganimian (2016), Annex 2.
7.5 Moreover, current evidence likely overestimates the effectiveness of ICT interventions in education because many fail—or stumble badly—before being implemented. In Haiti a program to use smartphones to monitor teacher attendance had no effect on teacher
4 Georgia Department of Early Care and Learning 2015; Pereira and Cabral 2016. 5 Jukes and others 2016. 6 Wolff and others 2002. 7 Muralidharan, Singh and Ganimian 2016. 8 Cristia and others 2012; De Melo, Machado and Miranda 2014. 9 Muralidharan, Singh and Ganimian 2016; Bulman and Fairlie 2016.
Negative effect
No effect
Positive effect
0
20
40
60
80
100
Per
cent
Software Hardware
- 7.4 -
attendance or student outcomes because implementation proved untenable.10 Brazil’s One Laptop per Child initiative in several states faced years of delays. And a year after the laptops made it to classrooms, more than 40 percent of teachers reported having never or rarely used them in classroom activities.11 Rich countries face the same challenges: beyond education, almost a fifth of public sector ICT projects in the United Kingdom have cost overruns of more than a quarter, and the typical project takes 24 percent longer than initially expected.12 It is crucial to focus on technologies that are truly feasible in existing systems. In rural areas, technology may be more attractive because of weak education systems, but at the same time those weak systems—with limited access to electricity or the internet—have the least capacity to support education technology interventions.
7.6 With such varied returns and so many challenges to implementation, why is there so much investment in education technology? Principal-agent relationships and behavioral biases likely both play a role. The principal-agent model is relevant because public officials may derive political returns from flashy technological interventions, independent of their utility to better learning. Thus their personal incentives (to make highly visible investments) may differ from the goals of students (to learn). Cognitive bias may also enter in, with individuals being unrealistically optimistic. There is a long history of overestimating the transformative nature of technology in schools, going back to Thomas Edison asserting in 1913 that, “Books will soon be obsolete in schools…Our school system will be completely changed in the next ten years.” He predicted that books would be entirely replaced by silent films.13 Half a century later, as computers gained traction, some scholars wondered if they might replace teachers at some point.14 Of course, schools in technology-rich environments do look different from those elsewhere: students might do their work on interactive displays rather than paper. But technology has for the most part not been particularly disruptive in education. The buildings, the processes of the school day, and the interactions between teachers and students are very similar to those of a century ago.15
7.7 Technologies that complement teachers work better than technologies that substitute for them. Many students in the world have poorly prepared teachers with limited training and motivation, and it can be tempting to try to use technology to circumvent teachers. Most attempts have failed, but technology that complements teachers offers more promise.16 Consider a computer-assisted learning program in India that was implemented in two ways. One approach pulled students out of regular classes to use computer-based math programs; in other words, the program substituted for regular class time. Students under that model performed significantly worse than students left with their regular teachers. In the other approach, where students used the program after school, there were sizable gains, especially for the most poorly performing
10 Adelman and others 2015 11 Lavinas and Veiga 2013. 12 Budzier and Flyvbjerg 2012. 13 Smith 1913. 14 Goodlad 1969; Bellissant 1970. 15 Pritchett 2013. 16 Snilstveit and others 2016.
- 7.5 -
students.17 Another example of technology that complements teachers is a series of prepared videos of high-quality lessons—such as Brazil’s Telecurso—that can be used in a classroom.
7.8 Technology holds some promise in fragile settings, such as times of war or epidemic, to maintain a connection to formal education. During the 2014–15 Ebola epidemic in Sierra Leone, schools shut down for eight months, but the government launched an emergency education program with lessons five days a week. A 30-minute lesson over the radio is unlikely to have a deep learning impact, but this kind of program may help keep children connected to learning.18 Sudan’s Can’t Wait to Learn program, which provides tablets loaded with learning games to out-of-school children, has shown positive learning impacts on mathematics and is now being tested on a large scale in areas receiving Syrian refugees.19 In places where teachers are unavailable, such approaches may be the best option.
7.9 Impacts on literacy and numeracy are not the only measures of success: technology can also provide digital skills. As more jobs require digital literacy, the opportunity to acquire those skills is an end in itself. Students with more access to computers at home have better computer skills.20 And though Peru’s One Laptop per Child program had no effect on academic achievement or cognitive skills, students did significantly improve their knowledge of how to use laptops.21 In such cases clarity of purpose is key. Obviously youth need computers to learn how to use them. But as tools for teaching reading and numeracy, evidence on their usefulness is mixed.
Other inputs bring learners to school—but only promote learning if they improve teaching and learning
7.10 Building schools can increase enrollment in places with few schools, especially for girls. In Afghanistan the provision of community-based schools in just over a dozen communities increased enrollment massively, effectively eliminating the gender gap in enrollment.22 A program to construct schools with modern amenities in Burkina Faso increased enrollment by a large margin, with the biggest impacts for girls. Even beyond building entire schools, building latrines—particularly gender-specific latrines—significantly increased enrollment of adolescent girls in India.23 But in places where learners have relatively easy access to schools, additional schools will be neither the most cost-effective way to raise access nor to improve learning.
7.11 Even in places lacking infrastructure, providing it does not necessarily improve learning. The Afghanistan and Burkina Faso experiences boosted learning, while India’s did not. Why? Constructing a school where children previously had no access directly alters the learning process, by creating a place to learn that did not exist before. Building latrines makes school a safe
17 Linden 2008. 18 Powers 2016. 19 War Child Holland 2016. 20 Kuhlemeier and Hemker 2007. 21 Beuermann and others 2015. 22 Burde and Linden 2013. 23 Adukia 2017.
- 7.6 -
space and so makes children and especially girls more able to be at school—but because it does not affect what happens in the classroom, it does not affect learning.
7.12 School feeding gets children to school but does not always improve learning. The most consistent impact of school-based meal programs has been to bring additional children to school, with examples from Burkina Faso, Kenya, and Peru.24 At school age, providing meals contributes less to brain development but could still increase learning through improved attention and energy. But if meals are offered during normal schooling hours, they reduce time on task. In Kenya and Peru meals took significant time away from the classroom. This leads to an ambiguous net effect. Measured learning outcomes are mixed, with positive impacts in Burkina Faso and Peru.
7.13 Similarly, simply increasing the materials available at schools does not improve learning if they do not improve teacher-learner interaction. An increase in textbook provision in Sierra Leone in 2008 did not result in those books being used in the classroom because administrators put most of the books in storage—potentially to hedge against potential future textbook shortfalls.25 Another textbook program, in Kenya, had no impact on learning, most likely because most students did not fully understand the language in which the books were written.26 Simply providing desktop computers to classrooms in Colombia—where they were not well integrated to the curriculum—likewise had no impact on learning.27 It seems obvious to say that to have an impact, resources have to be used. But many interventions that provide inputs fail exactly because insufficient thought is given to how they will be used. Infrastructure and other inputs are essential, but they only work when they serve the relationship between teaching and learning.28
School management is crucial, and involving communities can help overcome incentive problems and information failures—but only if communities have capacity
7.14 Schools with better management have better test scores.29 Schools vary significantly in management quality (figure 7.2), and school leadership plays a crucial role in school performance. Effective school leadership means school principals who are actively involved in helping teachers solve problems, including by providing instructional advice.30 It also means setting goals with teachers to prioritize and achieve high levels of learning. These factors are associated with the highest levels of student learning, and they confirm that effective school leadership improves the quality of teacher-learner interactions. A major school district in the United States improved student learning by training school principals in three sets of skills. First, principals learned to give feedback to teachers on lesson plans. Second, they learned to support teachers in regular learner assessments as well as to provide feedback on action plans to improve learner performance. Finally, they received training in classroom observation and in how to give feedback on teacher
24 Kazianga, De Walque and Alderman 2009; Vermeersch and Kremer 2005; Cueto and Chinen 2008. 25 Sabarwal, Evans and Marshak 2014. 26 Glewwe, Kremer and Moulin 2009. 27 Barrera-Osorio and Linden 2009. 28 Ganimian and Murnane 2016. 29 Bloom and others 2015. 30 Robinson, Lloyd and Rowe 2008; Waters, Marzano and McNulty 2003.
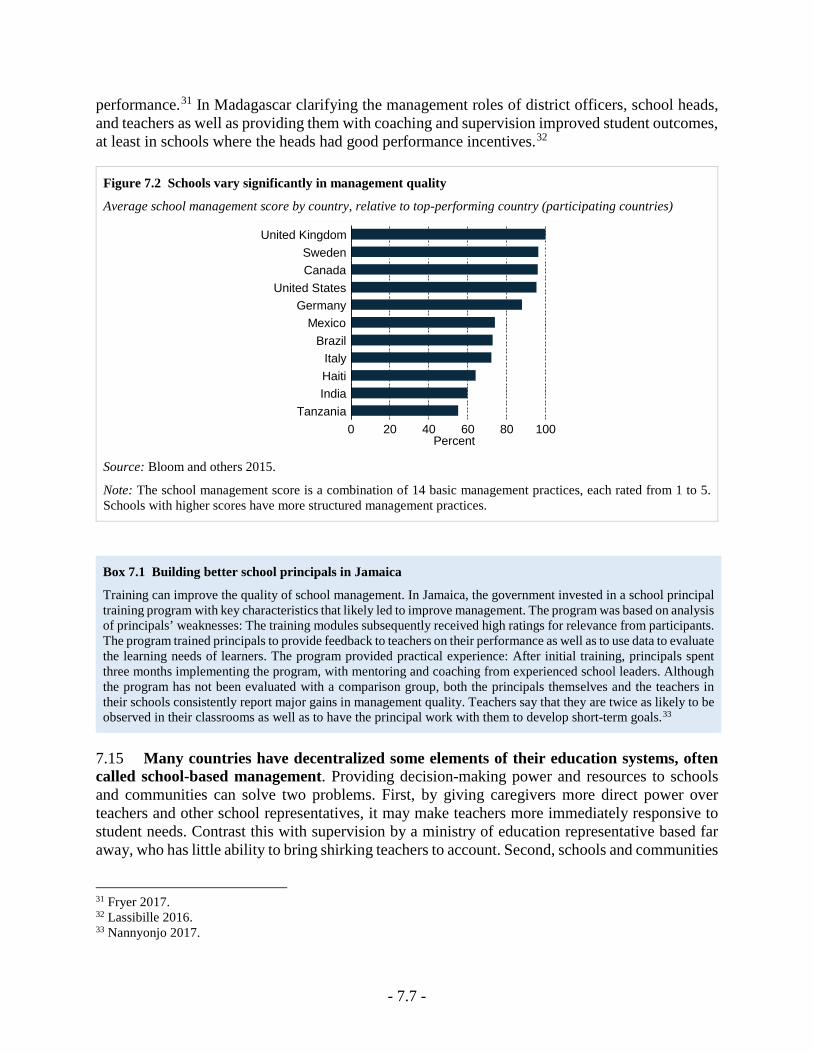
- 7.7 -
performance.31 In Madagascar clarifying the management roles of district officers, school heads, and teachers as well as providing them with coaching and supervision improved student outcomes, at least in schools where the heads had good performance incentives.32
Figure 7.2 Schools vary significantly in management quality
Average school management score by country, relative to top-performing country (participating countries)
Source: Bloom and others 2015.
Note: The school management score is a combination of 14 basic management practices, each rated from 1 to 5. Schools with higher scores have more structured management practices.
Box 7.1 Building better school principals in Jamaica
Training can improve the quality of school management. In Jamaica, the government invested in a school principal training program with key characteristics that likely led to improve management. The program was based on analysis of principals’ weaknesses: The training modules subsequently received high ratings for relevance from participants. The program trained principals to provide feedback to teachers on their performance as well as to use data to evaluate the learning needs of learners. The program provided practical experience: After initial training, principals spent three months implementing the program, with mentoring and coaching from experienced school leaders. Although the program has not been evaluated with a comparison group, both the principals themselves and the teachers in their schools consistently report major gains in management quality. Teachers say that they are twice as likely to be observed in their classrooms as well as to have the principal work with them to develop short-term goals.33
7.15 Many countries have decentralized some elements of their education systems, often called school-based management. Providing decision-making power and resources to schools and communities can solve two problems. First, by giving caregivers more direct power over teachers and other school representatives, it may make teachers more immediately responsive to student needs. Contrast this with supervision by a ministry of education representative based far away, who has little ability to bring shirking teachers to account. Second, schools and communities
31 Fryer 2017. 32 Lassibille 2016. 33 Nannyonjo 2017.
0 20 40 60 80 100Percent
TanzaniaIndiaHaitiItaly
BrazilMexico
GermanyUnited States
CanadaSweden
United Kingdom
- 7.8 -
may have better information about the needs of local schools, so providing them with discretionary resources means that they can more nimbly meet those needs.
7.16 School-based management programs improve learning when the community has capacity to make and implement smarter decisions.34 Data for 1 million students from 42 countries suggest that school autonomy is beneficial to student learning in high-income countries but detrimental in developing ones.35 At the micro level a school-based management intervention in the Gambia improved test scores only in communities with high literacy rates among parents.36 A similar result was identified in a school grant program in Niger.37 Several of these programs have not lasted more than a year or two, in some cases because the programs were pilots and in others because of unstable education policies. Without time for communities to learn how to effectively engage in school management, impacts on learning are unlikely. Because communities are more readily able to monitor school enrollment than learning, school-based management may increase access even in low-capacity communities, as happened in Burkina Faso.38
7.17 Community monitoring will not help learning if it does not affect what happens in classrooms. A range of interventions seek to increase community monitoring of schools by sharing information with parents. The structure of these programs varies, from the parents themselves collecting data on teacher attendance or school performance, to the education systems disseminating prepared data to parents, to attempts to make the information actionable, by supplementing information with facilitated meetings where parents and teachers can discuss grievances and lay out courses of action.39 But parents are rarely in the classroom, and even if they are, parents cannot necessarily identify good classroom practice. Growing evidence on these programs reveals mixed success.40 For example, a program provided report cards on school performance to community members in India, with no resulting increase in engagement by parents or in student learning.41
7.18 Successful community monitoring increases accountability through feedback loops between multiple stakeholders. Low-stakes accountability programs have improved student learning in Mexico, Pakistan, and Uganda.42 While the reasons some monitoring programs succeed and others fail may be multiple, successful programs—such as those in Mexico and Uganda—do not reach out to a single group, but rather share information explicitly with school leaders and teachers as well as communities and parents. (The Pakistan experiment is an exception, focusing only on parents.) Parents alone cannot enact accountability, and improved information in the hands of school officials helps. To improve learning, parents and communities need to harness increased information to hold teachers and schools more accountable.
34 Carr-Hill and others 2015. 35 Hanushek, Link and Woessmann 2013. 36 Blimpo, Evans and Lahire 2015. 37 Beasley and Huillery 2016. 38 Sawada and others 2016. 39 Read and Atinc 2016. 40 Cheng and Moses 2016; Read and Atinc 2016. 41 Banerjee and others 2010. 42 De Hoyos Navarro, Garcia Moreno and Patrinos 2015; Andrabi, Das and Khwaja 2015; Barr and others 2012.
- 7.9 -
7.19 School grant programs—where schools receive regular influxes of resources and more autonomy over budget allocations—are one type of school-based management program. In Haiti a program that provided schools with grants based on the number of students enrolled significantly increased enrollment.43 From this perspective, school grants can effectively deliver money to schools, and schools need money to function. But most programs that simply deliver grants to schools do not increase learning. Just distributing grants to schools—as in the Gambia, Indonesia, and Tanzania—had no effect on student learning.44 In Senegal observed impacts on learning only appeared for a subset of children and disappeared by the next year.45 Some school grant programs only increase learning outcomes when the grants are unanticipated. When parents knew the grants were coming, they reduced their own investments in education—not a recipe for long-term sustainability.46 By themselves, grants act much the same way as other interventions that simply increase resources in schools. There is no guarantee—and indeed, there seems to be no tendency—that they will improve learning.
7.20 But grants can be leveraged in the context of broader school-based management programs to improve school outcomes. In Tanzania grants alone had no impact on student learning, but grants combined with teacher incentives did improve learning; grants alone had little impact in Niger, but grants with training student learning and parent support for schools.47 Likewise, grants alone had no impact on learning in Indonesia, but they did improve learning when the program also linked school management committees to village councils, seeking to resolve the principal-agent problem.48 When grants are included in larger programs to encourage community school councils to engage in school management, the combination can improve learning.49
* * *
7.21 Whether an input is a physical item, like a tablet or textbook, or a process, like school management and leadership, it will improve learning if it directly improves the quality of teacher-learner interaction. Without that, more inputs will pile onto an ineffective process and fail to have the desired impact. But used strategically, inputs can work together with prepared learners and knowledgeable, motivated teachers to produce high levels of learning.
43 Adelman and Holland 2015. 44 Blimpo, Evans and Lahire 2015; Pradhan and others 2014; Mbiti and others 2016. 45 Carneiro and others 2015. 46 Das and others 2013. 47 Mbiti and others 2016; Kozuka 2017 . 48 Pradhan and others 2014. 49 Gertler, Patrinos and Rubio-Codina 2012; Santibañez, Abreu-Lastra and O’Donoghue 2014.
- 7.10 -
References Adelman, Melissa A. , and Peter Holland. 2015. "Increasing Access by Waiving Tuition: Evidence from Haiti " Policy Research Working Paper 7175, The World Bank.
Adelman, Melissa, Moussa P. Blimpo, David K. Evans, Atabanam Simbou, and Noah Yarrow. 2015. "Can Information Technology Improve School Effectiveness in Haiti? Evidence from a Field Experiment." Working Paper
Adukia, Anjali. 2017. "Sanitation and Education " American Economic Journal: Applied Economics 9(2): 23-59.
Andrabi, Tahi, Jishnu Das, and Asim Ijaz Khwaja. 2015. "Report Cards: The Impact of Providing School and Child Test Scores on Educational Markets." Policy Research Working Paper 7226, The World Bank.
Banerjee, Abhijit V, Rukmini Banerji, Esther Duflo, Rachel Glennerster, and Stuti Khemani. 2010. "Pitfalls of Participatory Programs: Evidence from a Randomized Evaluation in Education in India." American Economic Journal: Economic Policy 2(1): 1-30.
Banerjee, Abhijit V., Shawn Cole, Esther Duflo, and Leigh Linden. 2007. "Remedying Education: Evidence from Two Randomized Experiments in India." The Quarterly Journal of Economics 122(3): 1235-64.
Barr, Abigail, Frederick Mugisha, Pieter Serneels, and Andrew Zeitlin. 2012. "Information and Collective Action in Community-Based Monitoring of Schools: Field and Lab Experimental Evidence from Uganda." Unpublished manuscript. .
Barrera-Osorio, Felipe, and Leigh L Linden. 2009. "The Use and Misuse of Computers in Education: Evidence from a Randomized Experiment in Colombia." Policy Research Working Paper 4836, The World Bank.
Beasley, Elizabeth, and Elise Huillery. 2016. "Willing but Unable? Short-Term Experimental Evidence on Parent Empowerment and School Quality." The World Bank Economic Review: lhv064.
Bellissant, C. 1970. "Teaching and Learning Languages " Paper presented at the the World Conference on Computer Education, Amsterdam. https://stacks.stanford.edu/file/druid:jd969fg9400/jd969fg9400.pdf.
Beuermann, Diether W, Julian Cristia, Santiago Cueto, Ofer Malamud, and Yyannu Cruz-Aguayo. 2015. "One Laptop Per Child at Home: Short-Term Impacts from a Randomized Experiment in Peru." American Economic Journal: Applied Economics 7(2): 53-80.
Blimpo, Moussa Pouquinimpo, David K. Evans, and Nathalie Lahire. 2015. "Parental Human Capital and Effective School Management : Evidence from the Gambia " Policy Research Working Paper 7238, The World Bank.
Bloom, Nicholas, Renata Lemos, Raffaella Sadun, and John Van Reenen. 2015. "Does Management Matter in Schools?" The Economic Journal 125(584): 647-74.
Budzier, Alexander, and Bent Flyvbjerg. 2012. "Overspend? Late? Failure? What the Data Say About It Project Risk in the Public Sector." In Commonwealth Governance Handbook 2012/13: Democracy, Development and Public Administration, edited by Commonwealth Secretariat, London: Commonwealth Secretariat.
Bulman, George, and Robert W. Fairlie. 2016. "Technology and Education: Computers, Software, and the Internet." National Bureau of Economic Research Working Paper No.22237.
Burde, Dana, and Leigh L Linden. 2013. "Bringing Education to Afghan Girls: A Randomized Controlled Trial of Village-Based Schools." American Economic Journal: Applied Economics 5(3): 27-40.
Carneiro, Pedro, Oswald Koussihouèdé, Nathalie Lahire, Costas Meghir, and Corina Mommaerts. 2015. "Decentralizing Education Resources: School Grants in Senegal." National Bureau of Economic Research Working Paper No. 21063.
Carr-Hill, Roy, Caine Rolleston, Tejendra Pherali, Rebecca Schendel, Edwina Peart, and Emma Jones. 2015. "The Effects of School-Based Decision Making on Educational Outcomes in Low- and Middle-Income Contexts: A Systematic Review." London: International Initiative for Impact Evaluation (3ie).
Carrillo, Paul, Mercedes Onofa, and Juan Ponce. 2010. "Information Technology and Student Achievement: Evidence from a Randomized Experiment in Ecuador " IDB Working Paper Series No. IDB-WP-223, Inter-American Development Bank.
Cheng, Xuejiao Joy, and Kurt Moses. 2016. "Promoting Transparency through Information: A Global Review of School Report Cards." International Institute for Educational Planning.
Cristia, Julian, Pablo Ibarrarán, Santiago Cueto, Ana Santiago, and Eugenio Severín. 2012. "Technology and Child Development: Evidence from the One Laptop Per Child Program." IZA Discussion Paper Series No. 6401.
Cueto, Santiago, and Marjorie Chinen. 2008. "Educational Impact of a School Breakfast Programme in Rural Peru." International Journal of Educational Development 28(2): 132-48.
- 7.11 -
Das, Jishnu, Stefan Dercon, James Habyarimana, Pramila Krishnan, Karthik Muralidharan, and Venkatesh Sundararaman. 2013. "School Inputs, Household Substitution, and Test Scores." American Economic Journal: Applied Economics 5(2): 29-57.
De Hoyos Navarro, Rafael E., Vicente A. Garcia Moreno, and Harry Anthony Patrinos. 2015. "The Impact of an Accountability Intervention with Diagnostic Feedback: Evidence from Mexico." Policy Research Working Paper 7393, The World Bank.
De Melo, Gioia, Alina Machado, and Alfonso Miranda. 2014. "The Impact of a One Laptop Per Child Program on Learning: Evidence from Uruguay." IZA Discussion Paper Series No. 8489.
Fryer, Roland G. 2017. "Management and Student Achievement: Evidence from a Randomized Field Experiment." National Bureau of Economic Research Working Paper No. 23437.
Ganimian, Alejandro, and Richard J. Murnane. 2016. "Improving Education in Developing Countries: Lessons from Rigorous Impact Evaluations." Review of Educational Research 86(3 ): 719-55.
Georgia Department of Early Care and Learning. 2015. "Planning Educational Activities for Children (Peach)." http://www.peach.decal.ga.gov/app/.
Gertler, Paul J., Harry Anthony Patrinos, and Marta Rubio-Codina. 2012. "Empowering Parents to Improve Education: Evidence from Rural Mexico." Journal of Development Economics 99(1): 68-79.
Glewwe, Paul, Michael Kremer, and Sylvie Moulin. 2009. "Many Children Left Behind? Textbooks and Test Scores in Kenya." American Economic Journal: Applied Economics 1(1): 112-35.
Goodlad, JI. . 1969. "Computers and the Schools in Modern Society " Proceedings of the National Academy of Sciences of the United States of America 63(3): 595-603.
Hanushek, Eric A, Susanne Link, and Ludger Woessmann. 2013. "Does School Autonomy Make Sense Everywhere? Panel Estimates from Pisa." Journal of Development Economics 104: 212-32.
Jukes, Matthew CH, Elizabeth L Turner, Margaret Dubeck, Katherine E Halliday, Hellen N Inyega, Sharon Wolf, Stephanie Simmons Zuilkowski, and Simon J Brooker. 2016. "Improving Literacy Instruction in Kenya through Teacher Professional Development and Text Messages Support: A Cluster Randomized Trial." Journal of Research on Educational Effectiveness: 1-33.
Kazianga, Harounan, Damien De Walque, and Harold Alderman. 2009. "Educational and Health Impacts of
Two School Feeding Schemes: Evidence from a Randomized Trial in Rural Burkina Faso." Policy Research Working Paper 4976, The World Bank.
Kozuka, Eiji. 2017 "Enlightening Communities and Parents for Improving Student Learning : Evidence from Randomized Experiment in Niger " Working Paper, JICA Research Institute
Kuhlemeier, Hans, and Bas Hemker. 2007. "The Impact of Computer Use at Home on Students’ Internet Skills." Computers & Education 49(2): 460-80.
Lai, Fang, R Luo, L Zhang, X Huang, and S Rozelle. 2012. "Does Computer-Assisted Learning Improve Learning Outcomes?Evidence from a Randomized Experiment in Public Schools in Rural Minority Areas in Qinghai, China." Working Paper.
Lassibille, Gérard. 2016. "Improving the Management Style of School Principals: Results from a Randomized Trial." Education Economics 24(2): 121-41.
Lavinas, Lena, and Alinne Veiga. 2013. "Brazil's One Laptop Per Child Program: Impact Evaluation and Implementation Assessment." Cadernos de Pesquisa 43(149).
Linden, Leigh L. 2008. "Complement or Substitute?: The Effect of Technology on Student Achievement in India." Working Paper.
Mbiti, Isaac M., Karthik Muralidharan, M. Romero, Youdi Schipper, C. Manda, and Rakesh Rajani. 2016. "Inputs, Incentives, and Complementarities in Primary Education: Experimental Evidence from Tanzania." Unpublished manuscript. University of California at San Diego, San Diego, CA. .
McEwan, Patrick J. 2015. "Improving Learning in Primary Schools of Developing Countries: A Meta-Analysis of Randomized Experiments " Review of Educational Research 85(3): 353-94.
Muralidharan, Karthik, Abhijeet Singh, and Alejandro Ganimian. 2016. "Disrupting Education? Experimental Evidence on Technology-Aided Instruction in India." National Bureau of Economic Research Working Paper No.22923.
Nannyonjo, Harriet 2017. "Building Capacity of School Leaders: Strategies That Work - Jamaica's Experiene " Working Paper
Pereira, Lucia Helena Esteves, and Isabel Cabral. 2016. "Gestão Escolar: A Opinião Dos Profissionais De Educação Sobre O Sistema De Tecnologia Do Estado Do Rio De Janeiro."https://periodicos.ufsm.br/regae/article/view/14875.
Powers, Shawn. 2016. "The Impact of Ebola on Education in Sierra Leone " Education for Global
- 7.12 -
Development, The World Bank Blogs. http://blogs.worldbank.org/education/impact-ebola-education-sierra-leone.
Pradhan, Menno, Daniel Suryadarma, Amanda Beatty, Maisy Wong, Arya Gaduh, Armida Alisjahbana, and Rima Prama Artha. 2014. "Improving Educational Quality through Enhancing Community Participation: Results from a Randomized Field Experiment in Indonesia." American Economic Journal. Applied Economics 6(2): 105.
Pritchett, Lant. 2013. The Rebirth of Education: Schooling Ain't Learning. Washington, DC: Center for Global Development.
Read, Lindsay, and Tamar Manuelyan Atinc. 2016. "Information for Accountability: Transparency and Citizen Engagement for Improved Service Delivery in Education Systems." Brookings Institution.
Robinson, Viviane MJ, Claire A Lloyd, and Kenneth J Rowe. 2008. "The Impact of Leadership on Student Outcomes: An Analysis of the Differential Effects of Leadership Types." Educational administration quarterly.
Sabarwal, Shwetlena, David K. Evans, and Anastasia Marshak. 2014. "The Permanent Input Hypothesis: The Case of Textbooks and (No) Student Learning in Sierra Leone." Policy Research Working Paper Series 7021, The World Bank.
Santibañez, Lucrecia, Raúl Abreu-Lastra, and Jennifer L. O’Donoghue. 2014. "School Based Management Effects: Resources or Governance Change? Evidence from Mexico." Economics of Education Review 39: 97-109.
Sawada, Yasuyuki, Takeshi Aida, Andrew Griffen, Harounan Kazianga, Eiji Kozuka, Haruko Nogushi, and Yasuyuki Todo. 2016. "On the Role of Community Management in Correcting Market Failures of Rural Developing Areas: Evidence from a Randomized Field Experiment of Coges Project in Burkina Faso." Paper presented at the Agricultural and Applied Economics Association (AAEA) 2016 Annual Meeting Boston, Massachusetts. http://ageconsearch.umn.edu/bitstream/236323/2/SelectedPaper_9662.pdf.
Smith, Frederick James. 1913. "The Evolution of the Motion Picture: Vi-Looking into the Future with Thomas A. Edison." The New York Dramatic Mirror http://quoteinvestigator.com/2012/02/15/books-obsolete/.
Snilstveit, Birte, Jennifer Stevenson, Radhika Menon, Daniel Phillips, Emma Gallagher, Maisie Geleen, Hannah Jobse, Tanja Schmidt, and Emmanuel Jimenez.
2016. "The Impact of Education Programmes on Learning and School Participation in Low- and Middle-Income Countries: A Systematic Review Summary Report." Systematic Review Summaries (7).
Vermeersch, Christel, and Michael Kremer. 2005. "School Meals, Educational Achievement and School Competition: Evidence from a Randomized Evaluation." Policy Research Working Paper 3523, The World Bank.
War Child Holland. 2016. "Can't Wait to Learn." https://www.warchild.nl/sites/default/files/bijlagen/node_13537/27-2016/2016_6_pager_cant_wait_to_learn_english.pdf.
Waters, Tim, Robert J Marzano, and Brian McNulty. 2003. "Balanced Leadership: What 30 Years of Research Tells Us About the Effect of Leadership on Student Achievement. A Working Paper."
Wolff, Laurence, Claudio de Moura Castro, Juan Carlos Navarro, and Norma García. 2002. "Television for Secondary Education: Experience of Mexico and Brazil." In Technologies for Education: Potentials, Parameters, and Prospects, edited by Waddi D. Haddad and Alexandria Draxler, Paris: UNESCO.
- 8.1 -
Chapter 8 Teach job skills by linking training to jobs
Contents
Workplace training can help young people form skills, yet few benefit from it ........................................... 2
Short-term job training offers opportunities, but most programs fail to deliver ........................................... 4
Technical and vocational education and training can prepare young people for work, but early sorting can limit career growth ........................................................................................................................................ 5
Successful job training programs share several features ............................................................................... 6
Establishing partnerships before training is designed .............................................................................. 6
Combining classroom with workplace learning ....................................................................................... 7
Identifying capable teachers ..................................................................................................................... 8
Making student support services and comprehensive information available for decision-making .......... 9
After leaving school—whether as dropouts or graduates—many young people land in jobs with limited prospects. But training offers a way out. How can successful job skills training programs be replicated? And how can they made available, affordable, and effective for the many young job seekers moving from school to work?
8.1 Young people around the world face substantial challenges in their transition from school to work. Many young people, especially from disadvantaged backgrounds, leave formal education prematurely, lacking the foundational skills needed to succeed on the job—the learning crisis manifests itself in the labor market. As a result, many become unemployed or stuck in low-wage, unstable, informal sector jobs that offer few opportunities to strengthen their skills. But the same can happen even to secondary school graduates if they cannot fulfill labor market needs.
8.2 When young people leave formal education, they usually take one of three paths to employment. Some join the labor market without any further education or training. For them, workplace training is an important way to build skills. Others enroll in formal technical or vocational training programs1 that build skills required for specific fields or occupations of interest. These programs usually result in a formal qualification or an industry-recognized certification. Finally, a smaller group postpones looking for work or enrolling in further education and training. Three types of job training programs can help youth improve along these paths:
• Workplace training can benefit both workers and firms, yet is not widely available to young people.
• Short-term job training programs, which are often costly, have shown limited results, but careful program design could help improve outcomes.
1 Pre-employment job training programs can be grouped into (1) short-term programs, lasting less than six months, that focus on vocational subjects and (2) longer-term technical and vocational education and training (TVET) programs, lasting more than six months, that are mapped to formal education-system levels.
- 8.2 -
• Technical and vocational education and training (TVET) offers a viable path, but only when programs are designed in partnership with employers.
Workplace training can help young people form skills, yet few benefit from it
8.3 Workplace training deepens workers’ skills and raises firms’ productivity. 2 Workplace training can increase workers’ output by 10 percent or more,3 similar in magnitude to investments in physical capital.4 In Latin America and the Caribbean a 1 percent increase in the proportion of trained workers in large firms raised productivity by 0.7 percent. 5 In Mexico investments in training increased productivity and firm-level wages by 4–7 percent for manufacturing workers. 6 Similarly, returns were 7.7 percent in Malaysia and 4.5 percent in Thailand for workers holding a secondary education qualification or more.7 In Kenya and Zambia, workplace training is associated with a 20 percent increase in manufacturing workers’ wages.8
8.4 Despite the potential benefits for workers and firms, young workers rarely receive workplace training. In developing countries the percentage of working-age adults participating in work-related training ranges from 20 percent in urban Bolivia and Colombia to less than 10 percent in Lao People’s Democratic Republic and Vietnam.9 Training participation is even lower for young people with incomplete education, limited skills, or short employment tenure.10 In Peru fewer than one in five young workers receive training in the first year of their first job. 11 Employers’ decisions to invest in training are affected by the potential production improvements, worker turnover, and a firm’s overall management practices.12 Training participation is lower not just for young workers generally (figure 8.1a), but especially for young workers with limited literacy proficiency and education qualifications (figures 8.1b, c). Yet workplace training can be especially beneficial for young adults. A cross-country analysis of 38 workplace training studies finds an average wage increase of 7.2 percent for workers under 35, compared with 4.9 percent for workers over 35.13
8.5 High quality informal apprenticeships offer young people way to upgrade their skills in a workplace setting. In these schemes, learning takes place while working alongside an experienced craftsperson over a period of time.14 While available in many parts of the world,
2 Formal workplace training refers to supervised skills development activity that links knowledge gained in the workplace with firm business needs; see ILO 2011. Comparing across workplace models is difficult given the heterogeneity in design, implementation, and effectiveness of training schemes. See Haelermans and Borghans 2012; Dearden, Reed and Van Reenen 2006; Almeida, Behrman and Robalino 2012; Bassanini and others 2005; Almeida and Carneiro 2009; Blundell and others 1999; Acemoglu and Pischke 1996. 3 De Grip and Sauermann 2012. 4 Dearden, Reed and Van Reenen 2006; Konings and Vanormelingen 2015; Saraf 2017. 5 González-Velosa, Rosas and Flores 2016. 6 Lopez-Acevedo and Tan 2003. 7 Almeida and Faria 2014. 8 Rosholm, Nielsen and Dabalen 2007. 9 Roseth, Valerio and Gutierrez 2016. 10 Almeida and Aterido 2010; Sousounis and Bladen-Hovell 2010; Cabrales, Dolado and Mora 2014. 11 Cavero and Ruiz 2016. 12 Saraf 2017. 13 Haelermans and Borghans 2012. 14 ILO 2015b.
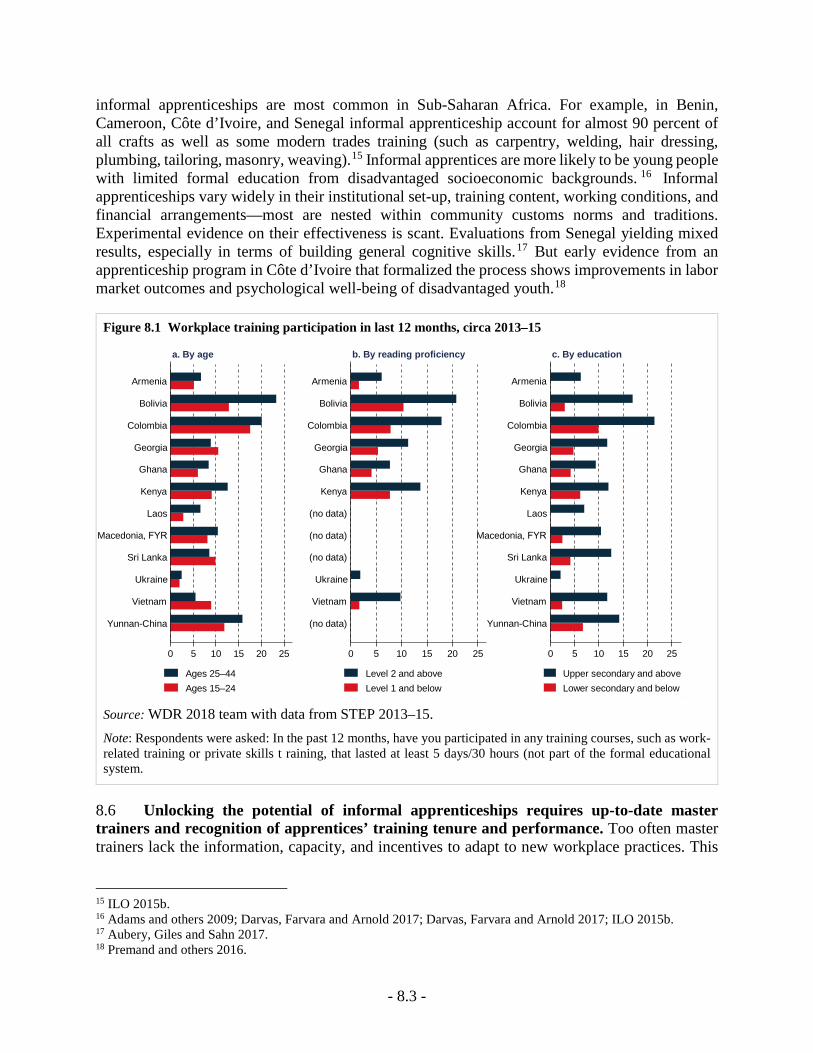
- 8.3 -
informal apprenticeships are most common in Sub-Saharan Africa. For example, in Benin, Cameroon, Côte d’Ivoire, and Senegal informal apprenticeship account for almost 90 percent of all crafts as well as some modern trades training (such as carpentry, welding, hair dressing, plumbing, tailoring, masonry, weaving).15 Informal apprentices are more likely to be young people with limited formal education from disadvantaged socioeconomic backgrounds. 16 Informal apprenticeships vary widely in their institutional set-up, training content, working conditions, and financial arrangements—most are nested within community customs norms and traditions. Experimental evidence on their effectiveness is scant. Evaluations from Senegal yielding mixed results, especially in terms of building general cognitive skills.17 But early evidence from an apprenticeship program in Côte d’Ivoire that formalized the process shows improvements in labor market outcomes and psychological well-being of disadvantaged youth.18
Figure 8.1 Workplace training participation in last 12 months, circa 2013–15
Source: WDR 2018 team with data from STEP 2013–15. Note: Respondents were asked: In the past 12 months, have you participated in any training courses, such as work-related training or private skills t raining, that lasted at least 5 days/30 hours (not part of the formal educational system.
8.6 Unlocking the potential of informal apprenticeships requires up-to-date master trainers and recognition of apprentices’ training tenure and performance. Too often master trainers lack the information, capacity, and incentives to adapt to new workplace practices. This
15 ILO 2015b. 16 Adams and others 2009; Darvas, Farvara and Arnold 2017; Darvas, Farvara and Arnold 2017; ILO 2015b. 17 Aubery, Giles and Sahn 2017. 18 Premand and others 2016.
0 5 10 15 20 25
Yunnan-China
Vietnam
Ukraine
Sri Lanka
Macedonia, FYR
Laos
Kenya
Ghana
Georgia
Colombia
Bolivia
Armenia
a. By age
Ages 25–44Ages 15–24
0 5 10 15 20 25
(no data)
Vietnam
Ukraine
(no data)
(no data)
(no data)
Kenya
Ghana
Georgia
Colombia
Bolivia
Armenia
b. By reading proficiency
Level 2 and aboveLevel 1 and below
0 5 10 15 20 25
Yunnan-China
Vietnam
Ukraine
Sri Lanka
Macedonia, FYR
Laos
Kenya
Ghana
Georgia
Colombia
Bolivia
Armenia
c. By education
Upper secondary and aboveLower secondary and below
- 8.4 -
can lead to apprentices learning obsolete workplace practices. 19 Also, since informal apprenticeships are rarely recognized by the formal training system they offer limited labor market mobility.20 One way to mitigate this issue is to integrate informal apprenticeships into the training system, allowing for skills reengagement with further education and training. In Malawi21 and Tanzania,22 for instance, competency-based skills certification offers a pathway for young workers to be acknowledged for their skills.
Short-term job training offers opportunities, but most programs fail to deliver
8.7 Many short-term job training programs do not meet labor market needs. Meta-analyses of programs from around the world find that less than a third have positive, significant results for employment and earnings.23 Though the estimated effects of short-term programs are relatively larger in developing countries, they remain small. Skills training that focuses on helping participants accumulate human capital needed to transition to labor markets can generate positive returns—but given their short duration and heterogeneous quality, it rarely exceeds the magnitude of the returns from completing formal education.24 An individual’s economic rationale for program participation is often tenuous because in some cases it costs up to 50 times the resulting monthly income gain, and 12 years to recover the investment.25
8.8 Some short-term job training programs show promising results for participants from disadvantaged backgrounds Short-term training interventions show some positive results when targeting disadvantaged groups, such as young women with low skills proficiency. In Uganda, the Empowerment and Livelihoods for Adolescents program targeted to young women shows encouraging results in improving graduate’s employment prospects. 26 Similarly, Nepal’s Adolescent Girls Employment Initiative increases nonfarm employment by 13–19 percentage points for participants.27 In the Dominican Republic, evaluations of Programa Juventud y Empleo, a skills training program that targets low-income, low-skilled out-of-school youth with less than secondary education increased both employment probability and earnings. 28 Results from interventions in Colombia, the Dominican Republic, Liberia, Nepal, and Peru identify promising approaches to improving young women’s aspirations, socioemotional skills, and labor market outcomes.29
8.9 Successful short-term job programs offer more than skills training. Programs that focus on developing multiple skills and that complement training with wrap-around services such as career guidance, mentoring, along with job search increase the odds of success.30 For instance,
19 ILO 2015b. 20 ILO 2015b. 21 Aggarwal and others 2010. 22 Nübler, Hofmann and Greiner 2009. 23 Kluve and others 2016; Mckenzie 2017. 24 Mckenzie 2017. 25 Mckenzie 2017; Blattman and Ralston 2015; Adoho and others 2014. 26 Bandiera and others 2014. 27 Chakravarty and others 2016. 28 Card and others 2011. 29 Fox and Kaul 2017. 30 Fares and Puerto 2009; Eichhorst and others 2012; Kluve and others 2016.
- 8.5 -
comprehensive training schemes that emphasize technical skills, life skills, and internships show positive effects in Kenya, Nepal, and Yemen.31 In Kenya, the Ninaweza program, which integrates ICT, life skills, internship training and job placement support for youth, shows positive impacts on employment and earnings. 32 Similarly, in Brazil, the Galpão Aplauso program improved outcomes through a combination of vocational, academic, and life skills training..33 In Nepal, the Employment Fund prioritizes comprehensive training programs for youth who are underemployed or unemployed.34
Technical and vocational education and training can prepare young people for work, but early sorting can limit career growth
8.10 Technical and vocational education and training (TVET) can yield wages on par with equivalent levels of general education. TVET Usually lasting from six months to three years, TVET can be delivered in the technical and vocational education streams of lower secondary, upper secondary, or tertiary.35 In Brazil workers with upper-secondary TVET earn wages about 10 percent higher than those with a general secondary education.36 In Indonesia returns to public TVET are positive and greater for women.37 But despite encouraging results, TVET programs in some developing countries remain a second-best alternative for young people, and program quality is often poor.
8.11 Putting students on a technical path too early can limit their career opportunities for a lifetime. Young people need to master reading, writing, numeracy, critical thinking, and problem-solving to participate meaningfully in technical education. They also need to be mature enough to express career preferences that might have long-term consequences. Countries that have delayed streaming into TVET show that such changes can lead to improvements. In Poland delaying vocational education by a year improved students’ academic performance.38 Problems with early tracking are exacerbated in systems that lack permeability between general and technical education, leaving technical graduates with limited opportunities to reengage in further education or training.39 Despite such concerns, most enrollment in TVET occurs at the onset of upper secondary school (figure 8.2). Of equal concern is that, in most regions, more young people are leaving formal education than continuing in either general education or TVET—a fact that underlines the importance of acquiring robust foundational skills early on as a basis for learning on the job and throughout life.
8.12 Developing narrow vocational skills can expedite workers’ transition into the labor force, but broader skills can help them adapt more easily to technological change. Evidence from advanced economies indicates that technical education conveys early advantages in the labor market, but the advantages dissipate over time. Some workers end up outdated in their occupation-
31 Fox 2017. 32 Azevedo, Davis and Charles 2013. 33 Calero and others 2014. 34 Chakravarty and others 2016. 35 See Tan and Nam 2012; and OECD 2014. 36 Almeida and others 2015. 37 Newhouse and Suryadarma 2011. 38 Jakubowski and others 2016. 39 Biavaschi and others 2012.
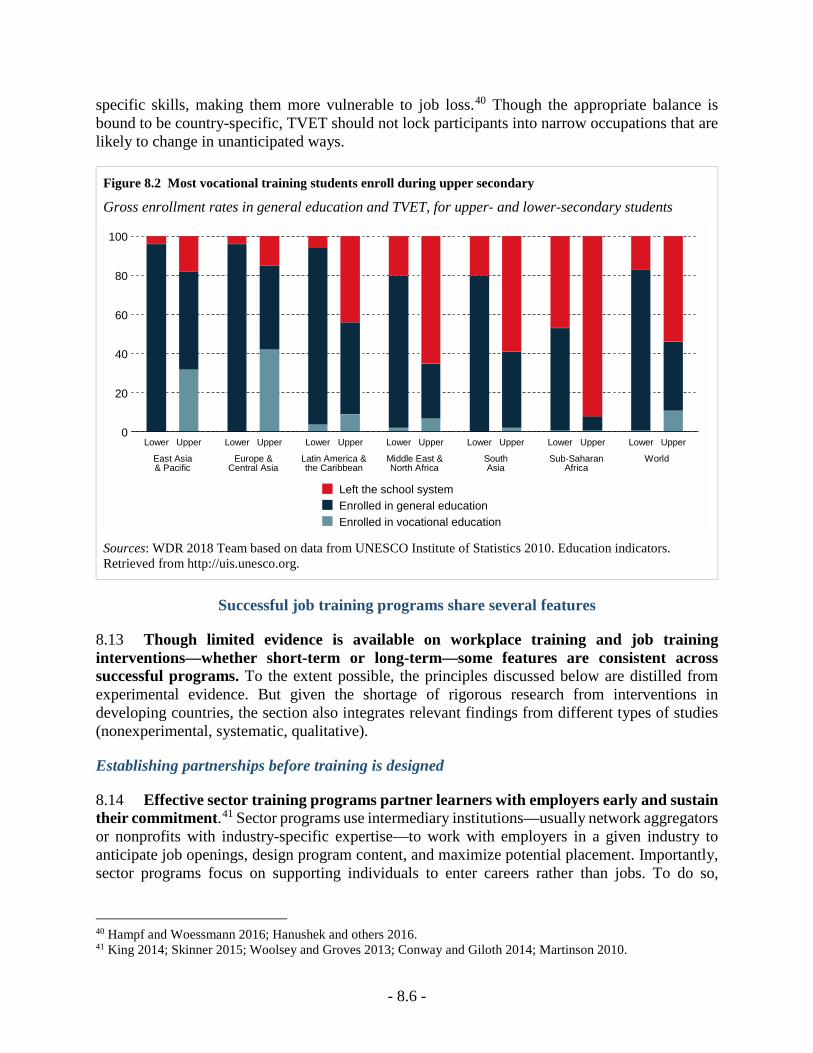
- 8.6 -
specific skills, making them more vulnerable to job loss.40 Though the appropriate balance is bound to be country-specific, TVET should not lock participants into narrow occupations that are likely to change in unanticipated ways.
Figure 8.2 Most vocational training students enroll during upper secondary
Gross enrollment rates in general education and TVET, for upper- and lower-secondary students
Sources: WDR 2018 Team based on data from UNESCO Institute of Statistics 2010. Education indicators. Retrieved from http://uis.unesco.org.
Successful job training programs share several features
8.13 Though limited evidence is available on workplace training and job training interventions—whether short-term or long-term—some features are consistent across successful programs. To the extent possible, the principles discussed below are distilled from experimental evidence. But given the shortage of rigorous research from interventions in developing countries, the section also integrates relevant findings from different types of studies (nonexperimental, systematic, qualitative).
Establishing partnerships before training is designed
8.14 Effective sector training programs partner learners with employers early and sustain their commitment.41 Sector programs use intermediary institutions—usually network aggregators or nonprofits with industry-specific expertise—to work with employers in a given industry to anticipate job openings, design program content, and maximize potential placement. Importantly, sector programs focus on supporting individuals to enter careers rather than jobs. To do so,
40 Hampf and Woessmann 2016; Hanushek and others 2016. 41 King 2014; Skinner 2015; Woolsey and Groves 2013; Conway and Giloth 2014; Martinson 2010.
0
20
40
60
80
100
East Asia& Pacific
Europe &Central Asia
Latin America &the Caribbean
Middle East &North Africa
SouthAsia
Sub-SaharanAfrica
World
Lower Upper Lower Upper Lower Upper Lower Upper Lower Upper Lower Upper Lower Upper
Left the school systemEnrolled in general educationEnrolled in vocational education
- 8.7 -
programs integrate information on career pathways to help participants identify needed credentials for an occupation that can be pursued to move from an entry-level job to a longer-term career.42 Success factors include having high-quality intermediaries and comprehensive recruitment services to generate good matches between prospective participants, programs of study, and targeted occupations.43
8.15 Sector training programs can improve labor market outcomes, raise productivity, and reduce employee turnover. Among three United States sector training programs—Wisconsin Regional Training Partnership (Milwaukee, WI), Jewish Vocational Service (Boston, MA), Per Scholas (New York City, NY) —in three states in the United States, participants saw 18 percent higher average earnings.44 Similarly, the Year Up program, which targets vulnerable youth in several states in the United States, shows high levels of completion, participation in internships, employment, and earnings.45 Finally, the Generation program—focusing on low-skilled youth in India, Kenya, Mexico, Spain, and the United States—has resulted in high job placement and employer satisfaction. 46 Other potential approaches to engage employers in training include entering into partnerships with multinational corporations, establishing national workforce development initiatives, as well as fostering private training provision through mechanisms such as training funds and tax incentives.47
Combining classroom with workplace learning
8.16 Formal apprenticeships are a common way to combine classroom with workplace learning. Apprentice programs can last from one to three years and take place at the secondary or post-secondary level or as an alternative to upper secondary education—giving students the opportunity to engage in industry-supervised workplace practices. 48 For programs targeting secondary students, special attention is required to ensure apprentices hone foundational skills as well as occupation-specific skills, to avoid overly narrow specialization. 49 Apprentices are typically paid a wage below the market wage.50 Good-practice apprenticeships offer structured training, a professional trainer to oversee the apprentice, a written contract that stipulates training arrangements, and an assessment to verify acquired skills.51 A strong partnership between the education system and industry is crucial to integrate firm resources, share risk burdens, develop industry-wide skill standards, and deliver apprenticeship training at scale.
8.17 Studies show positive results for firms, as well as for individuals who complete apprenticeships. 52 In the United States a study looking at secondary TVET, post-secondary TVET, and apprenticeship programs in the states of Virginia and Washington found positive gains
42 Bragg, Dresser and Smith 2012. 43 Maguire and others 2010; King 2014. 44 Maguire and others 2010. 45 Roder and Elliott 2011 46 Mourshed, Farrell and Barton 2012. 47 Dunbar 2013; Tan and others 2016. 48 Neumark and Rothstein 2006; Fazio, Fernández-Coto and Ripani 2016; Mieschbuehler and Hooley 2016. 49 OECD 2010. 50 Biavaschi and others 2012; Smith and Kemmis 2013. 51 Fazio, Fernández-Coto and Ripani 2016; Smith and Kemmis 2013; Cumsille 2016. 52 Dietrich, Pfeifer and Wenzelmann 2016; Lerman 2014; Hollenbeck 2008; Smith and Kemmis 2013.
- 8.8 -
from all three—especially apprenticeships.53 Studies in Canada, Germany, Switzerland, and the United States show that employers recover initial apprentice costs in the short to medium term.54 In Brazil a large apprenticeship program (Lei do Aprendiz) showed that apprenticeship graduates are more likely to find permanent, higher-paying jobs over time—particularly less-educated workers.55 In Malawi an innovative apprenticeship program targeted to young women broadened opportunities as assistant school teachers and generated gains in education, skills, and community standing.56
Identifying capable teachers
8.18 Successful approaches require capable teachers who understand job requirements and can tailor training accordingly. 57 Successful training programs require teachers with industry expertise to ensure content is aligned with job requirements. 58 Students’ gaps in foundational skills and lack of motivation intensify the complexity of trainers’ roles and responsibilities.59 The global shift toward competency-based standards in training, assessment, and certification amplifies the importance of capable, involved teachers. 60 A study from 10 polytechnics in Ghana highlights the importance of teachers’ ability to offer constructive feedback as students work through competency modules.61 However, there are still many instances where teachers are not aware of job requirements, especially when it comes to teaching using a competency-based skills approach. A study of teaching practices in technical vocational colleges in Malaysia highlights the difficulties that teachers face in moving from assessing student’s knowledge to assessing occupational and task-specific competency.62
8.19 Yet in many countries, structured professional support is not available to ensure that technical and vocational teachers remain current with curriculums and industry changes.63 A review of vocational education systems in 10 Middle Eastern and North African countries finds active experimentation with innovative models to build career structures that reflect common norms, values, and standards to professionalize technical and vocational teaching. Six of the ten countries have developed occupational standards for technical teachers to recognize career progression, though it is too early to tell whether or how the new standards are influencing student outcomes. 64 Other countries, such as Ethiopia and Lao People’s Democratic Republic, are experimenting with introducing standards and increasing the qualifications of the technical training
53 Hollenbeck 2008. 54 Lerman 2013; Lerman 2014. 55 Corseuil, Foguel and Gonzaga 2014. 56 Safford and others 2013. 57 Here teachers is broadly defined to include teachers (secondary education), instructors (post-secondary education), and trainers (workplace training). See Axmann and others 2015 and Stanley, Adubra and Chakroun 2014. 58 Biavaschi and others 2012; Grollmann 2008; Maclean and Lai 2011; Axmann and others 2015. 59 Hodge 2016. 60 ILO 2010; Guthrie and others 2009 Experimental studies evaluating the impact of different approaches to train and support the professional development of vocational teachers are extremely rare. 61 Boahin and Hofman 2014. 62 bt Ab Rahman and bin Ahmad 2014. 63 Axmann and others 2015. 64 OECD 2010; OECD 2014; Stanley, Adubra and Chakroun 2014.
- 8.9 -
instructors. But getting robust information on program effectiveness is difficult because most interventions are not evaluated for impact.65
Making student support services and comprehensive information available for decision-making
8.20 Career information is an important part of training programs—helping students identify opportunities, stay on course, and transition into a career. 66 Career information interventions are usually grouped into career education programs, which might include providing direction on coursework selection and career planning, usually provided on an individual basis.67 Career information can be especially useful for students who lack the family or social networks needed for meaningful direction. Since the early 2000s countries in the European Union have been experimenting with mechanisms to integrate career guidance with national lifelong learning strategies to align with the Lisbon Strategy and the strategic framework for European cooperation on education and training.
8.21 Still, evidence is limited on how career information initiatives affect students’ choices, training trajectories, and outcomes.68 Career guidance policies are a priority across 28 European countries, yet the scope and depth of programs vary substantially—highlighting the need for a well-articulated vision, cohesive strategy, and robust quality assurance mechanisms linked to funding. 69 Few OECD countries have program standards to monitor the quality of services, especially for programs delivered by private providers; this causes overreliance on staff qualifications as indicators of quality.70 Finally, although career guidance services are a feature of most technical and vocational programs in several Middle Eastern and North African countries, they are often delivered by instructors who lack appropriate qualifications and specialized training in career development and support.
* * *
8.22 Successful job training programs are typically based on strong ties with employers, with curriculums taught by instructors who have both industry experience and pedagogical expertise. These programs also tend to incorporate academic instruction with the technical curriculum, and they offer certifications that can be further built on; both features keep career paths open for graduates. While job training programs can yield positive returns, a key lesson is that trainees still need strong foundational skills—cognitive and socioemotional—before moving into specialized streams.
65 Soysouvanh 2013; Kingombe 2012; Gerds 2009. 66 Watts and Sultana 2004; Commission; 2004. 67 OECD 2010. 68 OECD 2010; Sultana and Watts 2008; Hooley 2014; Kluve and others 2016; Hooley and Dodd 2015. 69 Watts, Sultana and McCarthy 2010. 70 OECD and The European Commission 2004.
- 8.10 -
References
Acemoglu, Daron, and Jorn-Steffen Pischke. 1996. "Why Do Firms Train? Theory and Evidence." National bureau of economic research.
Adams, Arvil V, Harold Coulombe, Quentin Wodon, and Setarah Razmara. 2009. "Education, Skills, and Labor Market Outcomes in Ghana."
Adoho, Franck, Shubha Chakravarty, Dala T Korkoyah, Mattias KA Lundberg, and Afia Tasneem. 2014. "The Impact of an Adolescent Girls Employment Program: The Epag Project in Liberia."
Aggarwal, Ashwani, Christine Hofmann, Alexander Phiri, International Labour Organisation. Skills, Employability Department. ILO Decent Work Team for Southern, and Eastern Africa. 2010. "A Study on Informal Apprenticeship in Malawi." Geneva: International Labour Office.
Almeida, Rita, and Reyes Aterido. 2010. "Investment in Job Training: Why Are Smes Lagging So Much Behind?".
Almeida, Rita, Jere Behrman, and David Robalino. 2012. The Right Skills for the Job?: Rethinking Training Policies for Workers. World Bank Publications.
Almeida, Rita, and Pedro Carneiro. 2009. "The Return to Firm Investments in Human Capital." Labour economics 16(1): 97-106.
Almeida, Rita K, and Marta Faria. 2014. "The Wage Returns to on-the-Job Training: Evidence from Matched Employer-Employee Data." IZA Journal of Labor & Development 3(1): 1-33.
Almeida, Rita Kullberg, Leandro Anazawa, Naercio Menezes Filho, and Ligia Maria De Vasconcellos. 2015. "Investing in Technical&Vocational Education and Training: Does It Yield Large Economic Returns in Brazil?": The World Bank.
Aubery, F, J Giles, and D Sahn. 2017. "Do Apprenticeships Provide Skills Beyond the Master’s Trade? Evidence on Apprenticeships, Skills and the Transition to Work in Senegal." Working Paper.
Axmann, Michael, Amy Rhoades, Lee Nordstrum, Josee-Anne La Rue, and Michelle Byusa. 2015. "Vocational Teachers and Trainers in a Changing World: The Imperative of High-Quality Teacher Training Systems." International Labour Organization.
Azevedo, Thomaz Alvares de, Jeff Davis, and Munene Charles. 2013. "Testing What Works in Youth Employment: Evaluating Kenya's Ninaweza Program."
Bandiera, Oriana, Robin Burgess, Markus Goldstein, Niklas Buehren, Selim Gulesci, Imran Rasul, and Munshi Sulaiman. 2014. "Women’s Empowerment in Action: Evidence from a Randomized Control Trial in Africa."
Bassanini, Andrea, Alison L Booth, Giorgio Brunello, Maria De Paola, and Edwin Leuven. 2005. "Workplace Training in Europe."
Biavaschi, Costanza, Werner Eichhorst, Corrado Giulietti, Michael Jan Kendzia, Alexander Muravyev, Janneke Pieters, Núria Rodríguez-Planas, Ricarda Schmidl, and Klaus F Zimmermann. 2012. "Youth Unemployment and Vocational Training."
Blattman, Christopher, and Laura Ralston. 2015. "Generating Employment in Poor and Fragile States: Evidence from Labor Market and Entrepreneurship Programs." Available at SSRN.
Blundell, Richard, Lorraine Dearden, Costas Meghir, and Barbara Sianesi. 1999. "Human Capital Investment: The Returns from Education and Training to the Individual, the Firm and the Economy." Fiscal studies 20(1): 1-23.
Boahin, Peter, and WH Adriaan Hofman. 2014. "Perceived Effects of Competency-Based Training on the Acquisition of Professional Skills." International Journal of Educational Development 36: 81-89.
Bragg, Debra, Laura Dresser, and Whitney Smith. 2012. "Leveraging Workforce Development and Postsecondary Education for Low‐ Skilled, Low‐Income Workers: Lessons from the Shifting Gears Initiative." New Directions for Community Colleges 2012(157): 53-66.
bt Ab Rahman, Azmanirah, and Jamil bin Ahmad. 2014. "Assessment Practices for Competency Based Education and Training in Vocational College, Malaysia." Procedia-Social and Behavioral Sciences 112: 1070-76.
Cabrales, Antonio, Juan José Dolado, and Ricardo Mora. 2014. "Dual Labour Markets and (Lack of) on-the-Job Training: Piaac Evidence from Spain and Other Eu Countries."
Calero, Carla, Veronica Gonzales, Yuri Soares, Jochen Kluve, and Carlos Henrique Leite Corseuil. 2014. "Can Arts-Based Interventions Enhance Labor Market Outcomes among Youth?".
Card, David, Pablo Ibarrarán, Ferdinando Regalia, David Rosas-Shady, and Yuri Soares. 2011. "The Labor Market Impacts of Youth Training in the Dominican Republic." Journal of Labor Economics 29(2): 267-300.
- 8.11 -
Cavero, Denice, and Claudia Ruiz. 2016. Do Working Conditions in Young People's First Jobs Affect Their Employment Trajectories?: The Case of Peru. ILO.
Chakravarty, Shubha, Mattias KA Lundberg, Plamen Nikolov Danchev, and Juliane Zenker. 2016. "The Role of Training Programs for Youth Employment in Nepal: Impact Evaluation Report on the Employment Fund."
Commission;, OECD and The European. 2004. Career Guidance. OECD Publishing.
Conway, Maureen, and Robert P Giloth. 2014. Connecting People to Work: Workforce Intermediaries and Sector Strategies.
Corseuil, Carlos Henrique, Miguel Foguel, and Gustavo Gonzaga. 2014. "Apprenticeship as a Stepping Stone to Beter Jobs: Evidence from Brazilian Matched Employer-Employee Data."
Cumsille, Belén. 2016. "Educación Técnico Vocacional Secundaria: Beneficios Y Desafíos Para Los Sistemas Educativos."
Darvas, Peter , Marta Farvara, and Tamara Arnold. 2017. "Stepping up Skills in Urban Ghana: Snapshot of the Step Skills Measurement Survey. ." Washington, D.C.: International Bank for Reconstruction andDevelopment. The World Bank.
De Grip, Andries, and Jan Sauermann. 2012. "The Effects of Training on Own and Co ‐ Worker Productivity: Evidence from a Field Experiment." The Economic Journal 122(560): 376-99.
Dearden, Lorraine, Howard Reed, and John Van Reenen. 2006. "The Impact of Training on Productivity and Wages: Evidence from British Panel Data." Oxford bulletin of economics and statistics 68(4): 397-421.
Dietrich, Hans, Harald Pfeifer, and Felix Wenzelmann. 2016. "The More They Spend, the More I Earn? Firms’ Training Investments and Post-Training Wages of Apprentices." University of Zurich, Institute for Strategy and Business Economics (ISU).
Dunbar, Muriel. 2013. "Engaging the Private Sector in Skills Development." Health & Education Advice and Resource Team. Oxford Policy Management, Oxford, England.
Eichhorst, Werner, Núria Rodríguez-Planas, Ricarda Schmidl, and Klaus F Zimmermann. 2012. "A Roadmap to Vocational Education and Training Systems around the World."
Fares, Jean, and Olga Susana Puerto. 2009. Towards Comprehensive Training. World Bank.
Fazio, Maria Victoria, Raquel Fernández-Coto, and Laura Ripani. 2016. "Apprenticeships for the Xxi
Century: A Model for Latin America and the Caribbean?".
Fox, Louise M, and U. Kaul. 2017. "What Works for Youth Employment in Low-Income Countries?" ILO Youth Employment Review Paper. Geneva: ILO.
Fox, Louise M. 2017. "Youth Employment Trainng: Systematic Review " Working Paper Research Series (forthcoming) Washington, D.C.: International Bank for Reconstruction and Development. The World Bank.
Gerds, Peter. 2009. "Standards for Occupation-Directed Professional Development of Tvet Personnel in Developing Countries." In International Handbook of Education for the Changing World of Work, 1407-22. Springer.
González-Velosa, Carolina, David Rosas, and Roberto Flores. 2016. "On-the-Job Training in Latin America and the Caribbean: Recent Evidence." In Firm Innovation and Productivity in Latin America and the Caribbean, 137-66. Springer.
Grollmann, Philipp. 2008. "The Quality of Vocational Teachers: Teacher Education, Institutional Roles and Professional Reality." European Educational Research Journal 7(4): 535-47.
Guthrie, Hugh, Roger Harris, Michele Simons, and Tom Karmel. 2009. "Teaching for Technical and Vocational Education and Training (Tvet)." In International Handbook of Research on Teachers and Teaching, 851-63. Springer.
Haelermans, Carla, and Lex Borghans. 2012. "Wage Effects of on‐the‐Job Training: A Meta‐Analysis." British Journal of Industrial Relations 50(3): 502-28.
Hampf, Franziska, and Ludger Woessmann. 2016. "Vocational Vs. General Education and Employment over the Life-Cycle: New Evidence from Piaac."
Hanushek, Eric A, Guido Schwerdt, Ludger Woessmann, and Lei Zhang. 2016. "General Education, Vocational Education, and Labor-Market Outcomes over the Life-Cycle." Journal of Human Resources.
Hodge, Steven. 2016. "After Competency-Based Training: Deepening Critique, Imagining Alternatives." Taylor & Francis.
Hollenbeck, Kevin. 2008. "State Use of Workforce System Net Impact Estimates and Rates of Return."
Hooley, Tristram. 2014. "The Evidence Base on Lifelong Guidance: A Guide to Key Findings for Effective Policy and Practice."
Hooley, Tristram, and Vanessa Dodd. 2015. "The Economic Benefits of Career Guidance."
- 8.12 -
ILO. 2010. "Teachers and Trainers for the Future – Technical and Vocational Education and Training in a Changing World." Sectoral Activities Programme. Report for discussion at the Global Dialogue Forum on Vocational Education and Training Geneva, Switzerland.
———. 2015b. "Upgrading Informal Apprenticeship: A Resources Guide for Africa. ." Geneva, International Labour Office.
Jakubowski, Maciej, Harry Anthony Patrinos, Emilio Ernesto Porta, and Jerzy Wiśniewski. 2016. "The Effects of Delaying Tracking in Secondary School: Evidence from the 1999 Education Reform in Poland." Education Economics 24(6): 557-72.
King, Christopher T. 2014. "Sectoral Workforce and Related Strategies: What We Know... And What We Need to Know." Connecting People to Work: Workforce Intermediaries and Sectoral Strategies. New York: The American Assembly, Columbia University: 209-38.
Kingombe, Christian. 2012. "Lessons for Developing Countries from Experience with Technical and Vocational Education and Training." Economic Challenges and Policy Issues in Early Twenty-First-Century Sierra Leone.
Kluve, Jochen, Susana Puerto, David A Robalino, Jose Manuel Romero, Friederike Rother, Jonathan Stöterau, Felix Weidenkaff, and Marc Witte. 2016. "Do Youth Employment Programs Improve Labor Market Outcomes? A Systematic Review."
Konings, Jozef, and Stijn Vanormelingen. 2015. "The Impact of Training on Productivity and Wages: Firm-Level Evidence." Review of Economics and Statistics 97(2): 485-97.
Lerman, Robert. 2014. "Do Firms Benefit from Apprenticeship Investments?" IZA World of Labor.
Lerman, Robert I. 2013. "Skill Development in Middle Level Occupations: The Role of Apprenticeship Training." IZA Policy Paper.
Lopez-Acevedo, Gladys, and Hong Tan. 2003. "Mexico: In-Firm Training for the Knowledge Economy."
Maclean, Rupert, and Ada Lai. 2011. "Editorial: The Future of Technical and Vocational Education and Training: Global Challenges and Possibilities." Taylor & Francis.
Maguire, Sheila, Joshua Freely, Carol Clymer, Maureen Conway, and Deena Schwartz. 2010. "Tuning in to Local Labor Markets: Findings from the Sectoral Employment Impact Study." Public/Private Ventures.
Martinson, Karin. 2010. "Partnering with Employers to Promote Job Advancement for Low-Skill Individuals." National Institute for Literacy.
Mckenzie, David J. 2017. "How Effective Are Active Labor Market Policies in Developing Countries ? A Critical Review of Recent Evidence." Policy Research working paper. WPS 8011. Impact Evaluation series. Washington, D.C. : World Bank Group.
Mieschbuehler, Ruth, and Tristram Hooley. 2016. "World-Class Apprenticeship Standards: Report and Recommendations."
Mourshed, Mona, Diana Farrell, and Dominic Barton. 2012. "Education to Employment: Designing a System That Works." McKinsey Center for Government 18: 1-7.
Neumark, David, and Donna Rothstein. 2006. "School-to-Career Programs and Transitions to Employment and Higher Education." Economics of Education Review 25(4): 374-93.
Newhouse, David, and Daniel Suryadarma. 2011. "The Value of Vocational Education: High School Type and Labor Market Outcomes in Indonesia." The World Bank Economic Review 25(2): 296-322.
Nübler, Irmgard, Christine Hofmann, and Clemens Greiner. 2009. Understanding Informal Apprenticeship: Findings from Empirical Research in Tanzania. ILO.
OECD. 2010. Learning for Jobs. OECD Publishing.
———. 2014. Skills Beyond School. OECD Publishing.
OECD and The European Commission. 2004. Career Guidance. OECD Publishing.
Premand, P, A Marguerie, B Crépon, and M Bertrand. 2016. "Projet Emploi Jeune Et Développement Des Compétences (Pejedec) Evaluation D’impact Du Programme De Travaux À Haute Intensité De Main D’oeuvre (Thimo): Résultats Intermédiaires À Court Terme." Washington, D.C.: World Bank.
Roder, Anne, and Mark Elliott. 2011. "A Promising Start: Year Up’s Initial Impacts on Low-Income Young Adults’ Careers." New York: Economic Mobility Corporation.
Roseth, Viviana V, Alexandria Valerio, and Marcela Gutierrez. 2016. "Education, Skills, and Labor Market Outcomes."
Rosholm, Michael, Helena Skyt Nielsen, and Andrew Dabalen. 2007. "Evaluation of Training in African Enterprises." Journal of development economics 84(1): 310-29.
Safford, Kimberly, Deborah Cooper, Freda Wolfenden, and Joyce Chitsulo. 2013. "‘Give Courage to the Ladies’: Expansive Apprenticeship for Women in Rural Malawi."
- 8.13 -
Journal of Vocational Education & Training 65(2): 193-207.
Saraf, Priyam. 2017. "Returns, Barriers and Policy Outcomes to on-the-Job Training: Creating Gains for Workers, Firms and Society. ." Background Paper for the World Development Report 2018 The World Bank.
Skinner, Cynthia. 2015. "The Role of Business in Promoting Educational Attainment: A National Imperative." Committee For Economic Development of The Conference Board, Washington, District of Columbia.
Smith, Erica, and Ros Brennan Kemmis. 2013. Towards a Model Apprenticeship Framework: A Comparative Analysis of National Apprenticeship Systems. ILO.
Sousounis, Panos, and Robin Bladen-Hovell. 2010. "Persistence in the Determination of Work-Related Training Participation: Evidence from the Bhps, 1991–1997." Economics of Education Review 29(6): 1005-15.
Soysouvanh, Boualinh. 2013. "Development of Standards for Vocational Teachers at Bachelor Level in Lao Pdf." Online: http://www. tvet-online. asia/series/RaD_vol-2_Soysouvanh. pdf (retrieved 30.5. 2014).
Stanley, Julian, Edem Adubra, and Borhene Chakroun. 2014. "Technical and Vocational Teachers and Trainers in the Arab Region: A Review of Policies and Practices on Continuous Professional Development."
Sultana, Ronald G, and AG Watts. 2008. "Career Guidance in the Middle East and North Africa." International Journal for Educational and Vocational Guidance 8(1): 19-34.
Tan, Jee-Peng, Kiong Hock Lee, Ryan Flynn, Viviana V Roseth, and Yoo-Jeung Joy Nam. 2016. Workforce Development in Emerging Economies: Comparative Perspectives on Institutions, Praxis, and Policies. World Bank Publications.
Tan, Jee—Peng, and Yoo—JeungI Joy Nam. 2012. "Pre-Employment Technical and Vocational Education and Training: Fostering Relevance, Effectiveness, and Efficiency." The Right Skills for the Job?: Rethinking Training Policies for Workers: 67.
Watts, AG, Ronald G Sultana, and John McCarthy. 2010. "The Involvement of the European Union in Career Guidance Policy: A Brief History." International Journal for Educational and Vocational Guidance 10(2): 89-107.
Watts, Anthony Gordon, and Ronald G Sultana. 2004. "Career Guidance Policies in 37 Countries: Contrasts and Common Themes." International Journal for Educational and Vocational Guidance 4(2-3): 105-22.
Woolsey, Lindsey, and Garrett Groves. 2013. "State Sector Strategies Coming of Age: Implications for State Workforce Policymakers." National Governor's Association (NGA) Center for Best Practices. Available at: http://www. nga. org/cms/home/nga-center-forbest-practices/center-publications/page-ehsw-publications/col2-content/main-content-list/statesector-strategies-coming-o. html.

- S5.1 -
Spotlight 5 Technology is changing the world of work. What does that mean for learning?
S5.1 The nature of work is changing around the world. Within countries, jobs have been shifting across sectors—sometimes at a massive scale. In some cases, the shift is out of agriculture: In what are now high-income countries, people have shifted out of agriculture dramatically over the past half-century. In the Republic of Korea, the share of workers in farm jobs fell from 80 percent in 1950 to less than 7 percent in 2009. In Chile, farm workers fell from 30 percent to under 15 percent in the same period. In other cases, individuals are moving out of industrial production: In the United States, the share of workers in manufacturing halved.1 In low- and middle-income countries, the shift is ongoing. Across Sub-Saharan Africa, employment in agriculture is expected to drop nearly 10 percent this decade, with a large rise in people running small, household businesses.2
S5.2 Technology—including digital technology—is central to that change. Eighty-five percent of households worldwide now have access to electricity. Digital technologies penetrate most corners of the world, with one cell phone per household globally, and four in ten individuals connected to the internet.3 As the World Development Report 2016 lays out, “With rising computing power, combined with the connectivity and informational value of the internet, digital technologies are taking on more tasks.” This is particularly true for routine tasks that are easy to automate: A cashier’s job is easy to automate, but a teacher’s is not. Technology ultimately substitutes for some workers, like the cashier. Even for the workers whose jobs are not replaced, like hairdressers or surgeons, technology has varied effects. While it may leave the hairdresser relatively untouched, technology can make the surgeon dramatically more productive—with digital imaging, for example. So technology eliminates some jobs but increases the returns to others.4
S5.3 The impact of technology on jobs varies dramatically across countries. For rich countries, predictions range from dire (in which “robot overlords” take over most jobs) to the much more modest estimate that 9 percent of jobs in rich countries could currently be automated.5 For low-income countries, where technological penetration is much lower, the impact of technology on work will likely be more incremental (figure S5.1). Small-scale agriculture and household enterprises will not be automated in the near future, especially in countries like Nicaragua, where only 20 percent of the population has access to the internet, or Liberia, where less than 10 percent of the population has access to electricity.6 Those numbers will surely grow; greater access to technology will enable more poor nations and individuals to access those fields that see high returns to technological growth. But in the short run, technology will change the demand for skills much more in countries that have the infrastructure to support automation.
1 Handel 2012. 2 Fox and others 2013. 3 International Telecommunication Union 2016. 4 World Bank 2016. 5 Drum 2013; Arntz, Gregory and Zierahn 2016. 6 ITU 2016.
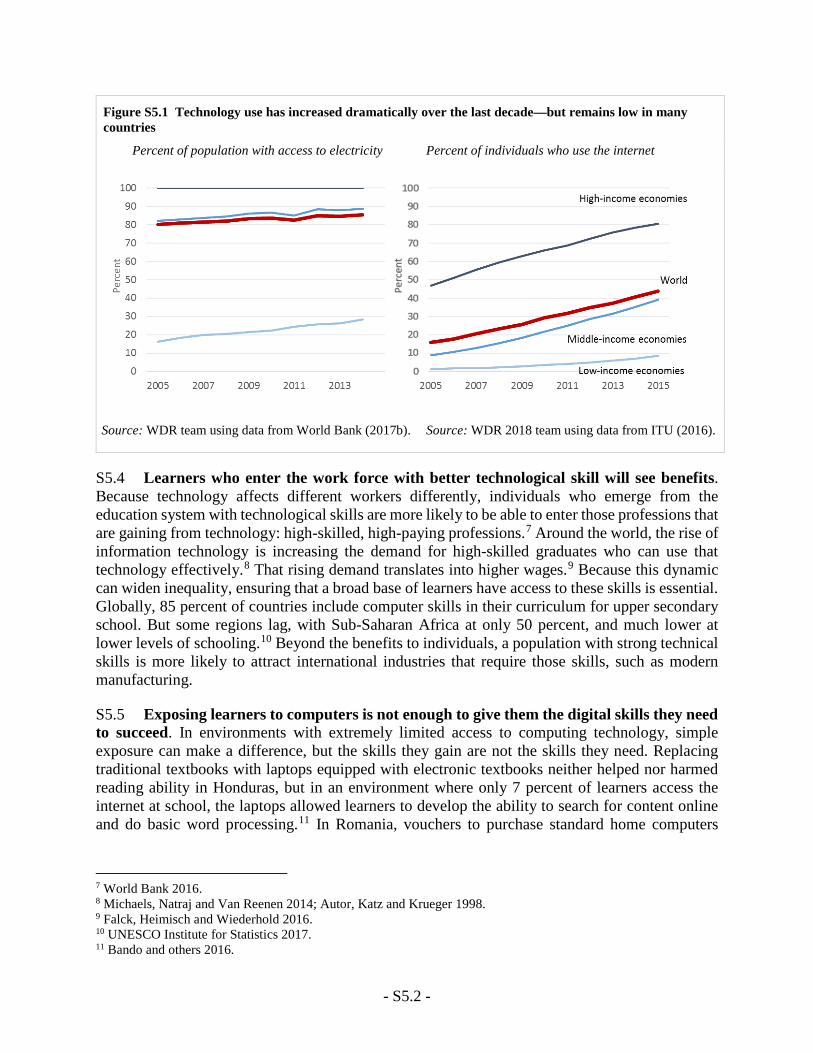
- S5.2 -
Figure S5.1 Technology use has increased dramatically over the last decade—but remains low in many countries
Percent of population with access to electricity Percent of individuals who use the internet
Source: WDR team using data from World Bank (2017b). Source: WDR 2018 team using data from ITU (2016).
S5.4 Learners who enter the work force with better technological skill will see benefits. Because technology affects different workers differently, individuals who emerge from the education system with technological skills are more likely to be able to enter those professions that are gaining from technology: high-skilled, high-paying professions.7 Around the world, the rise of information technology is increasing the demand for high-skilled graduates who can use that technology effectively.8 That rising demand translates into higher wages.9 Because this dynamic can widen inequality, ensuring that a broad base of learners have access to these skills is essential. Globally, 85 percent of countries include computer skills in their curriculum for upper secondary school. But some regions lag, with Sub-Saharan Africa at only 50 percent, and much lower at lower levels of schooling.10 Beyond the benefits to individuals, a population with strong technical skills is more likely to attract international industries that require those skills, such as modern manufacturing.
S5.5 Exposing learners to computers is not enough to give them the digital skills they need to succeed. In environments with extremely limited access to computing technology, simple exposure can make a difference, but the skills they gain are not the skills they need. Replacing traditional textbooks with laptops equipped with electronic textbooks neither helped nor harmed reading ability in Honduras, but in an environment where only 7 percent of learners access the internet at school, the laptops allowed learners to develop the ability to search for content online and do basic word processing.11 In Romania, vouchers to purchase standard home computers
7 World Bank 2016. 8 Michaels, Natraj and Van Reenen 2014; Autor, Katz and Krueger 1998. 9 Falck, Heimisch and Wiederhold 2016. 10 UNESCO Institute for Statistics 2017. 11 Bando and others 2016.
- S5.3 -
improved very basic general computing skills.12 But these skills that come from mere exposure may not be the skills needed to succeed in the marketplace. Distributing simple laptops for home use in Peru led learners to show higher competency on those laptops, but that did not translate to better skill on other, general-use operating systems (like Windows).13 Among high school learners in Chile, more than 90 percent used computers at school and two-thirds had access to computers at home. Although two-thirds of learners were able to search for information on-line, only half could organize information (e.g., arrange folders on the computer); less than one-third could produce information (e.g., writing an email with adequate content).14 Learners need structured training in computing skills if they are to reap the returns of the technological revolution.
S5.6 Learners entering the work force need better critical thinking and socioemotional skills. The ability to use technology is one way for learners to take advantage of technological advancement. But another is to excel at those skills that technology carries out less well. Those include higher-order cognitive skills and interpersonal, socioemotional skills.15 In the U.S., jobs that require high socioemotional skills are growing (such as nurses or social workers), and jobs that require high socioemotional skills along with high cognitive ability are growing the fastest (like financial managers).16 Education systems are beginning to learn to cultivate socioemotional skills in learners: Recent efforts in Turkey and Peru have resulted not only in better socioemotional ability but also better academic performance.17 It is not enough to train learners to use computers: To navigate a rapidly changing world, they have to interact effectively with others, think creatively, and solve problems.
S5.7 All of those skills that help learners succeed in rapidly changing economies are built on the same foundations of literacy and numeracy. In the twenty-first century, learners need technological skills, higher-order cognitive skills, and socioemotional skills. It may be tempting to divert resources from the development of foundational skills into these other skills which seem more novel and exciting. But these are complements to foundational skills, not substitutes—they can only be built on a solid foundation. Learners can search effectively for digital information or create digital content only if they have strong literacy skills. They can only program new on-line applications with confident numeracy skills. Socioemotional skills like grit, which are most malleable in childhood can be practiced and strengthened in the service of gaining strong foundational skills. Higher-order cognitive skills involve consuming information using literacy and numeracy skills and combining it in new ways. Innovations in developing twenty-first century skills are much needed, but they work best in conjunction with strong foundational abilities.
12 Malamud and Pop-Eleches 2011. 13 Beuermann and others 2015. 14 Claro and others 2012. 15 World Bank 2016. 16 Deming 2015. 17 Alan, Boneva and Ertac 2016; World Bank 2017a.
- S5.4 -
References
Alan, Sule, Teodora Boneva, and Seda Ertac. 2016. "Ever Failed, Try Again, Succeed Better: Results from a Randomized Educational Intervention on Grit."
Arntz, Melanie, Terry Gregory, and Ulrich Zierahn. 2016. "The Risk of Automation for Jobs in Oecd Countries: A Comparative Analysis." OECD Social, Employment, and Migration Working Papers (189): 0_1.
Autor, David H , Lawrence F Katz, and Alan B Krueger. 1998. "Computing Inequality: Have Computers Changed the Labor Market?" The Quarterly journal of economics 113(4): 1169-213.
Bando, Rosangela, Francisco Gallego, Paul Gertler, and Dario Romero. 2016. "Books or Laptops? The Cost-Effectiveness of Shifting from Printed to Digital Delivery of Educational Content." National Bureau of Economic Research. https://www.povertyactionlab.org/sites/default/files/publications/218_342_books_or_laptops_working_paper_paul_gertler_December2016.pdf.
Beuermann, Diether W, Julian Cristia, Santiago Cueto, Ofer Malamud, and Yyannu Cruz-Aguayo. 2015. "One Laptop Per Child at Home: Short-Term Impacts from a Randomized Experiment in Peru." American Economic Journal: Applied Economics 7(2): 53-80.
Claro, Magdalena, David D Preiss, Ernesto San MartíN, Ignacio Jara, J Enrique Hinostroza, Susana Valenzuela, Flavio Cortes, and Miguel Nussbaum. 2012. "Assessment of 21st Century Ict Skills in Chile: Test Design and Results from High School Level Students." Computers & Education 59(3): 1042-53.
Deming, David J. 2015. "The Growing Importance of Social Skills in the Labor Market." National Bureau of Economic Research. http://www.nber.org/papers/w21473.
Drum, Kevin 2013. "Welcome, Robot Overloads. Please Don't Fire Us? ." Mother Jones http://www.motherjones.com/media/2013/05/robots-artificial-intelligence-jobs-automation.
Falck, Oliver, Alexandra Heimisch, and Simon Wiederhold. 2016. "Returns to Ict Skills."
Fox, Louise, Cleary Haines, Jorge Huerta Munoz, and Alun H Thomas. 2013. "Africa's Got Work to Do: Employment Prospects in the New Century."
Handel, Michael J. 2012. "Trends in Job Skill Demands in Oecd Countries." OECD Social, Employment and Migration Working Papers, No. 143. OECD Publishing.
International Telecommunication Union. 2016. "Measuring the Information Society Report ".
http://www.itu.int/en/ITU-D/Statistics/Documents/publications/misr2016/MISR2016-w4.pdf.
ITU. 2016. "Itu World Telecommunication/Ict Indicators Database ".
Malamud, Ofer, and Cristian Pop-Eleches. 2011. "Home Computer Use and the Development of Human Capital." The Quarterly Journal of Economics 126(2): 987-1027.
Michaels, Guy, Ashwini Natraj, and John Van Reenen. 2014. "Has Ict Polarized Skill Demand? Evidence from Eleven Countries over Twenty-Five Years." Review of Economics and Statistics 96(1): 60-77.
UNESCO Institute for Statistics. 2017. "Uis Statistics: Curriculum and Ict in Education ".
World Bank. 2016. "World Development Report 2016: Digital Dividends " Washington, DC: World Bank.
———. 2017a. "Peru: If You Think You Can Get Smarter, You Will " http://www.worldbank.org/en/results/2017/04/25/peru-if-you-think-you-can-get-smarter-you-will?CID=POV_TT_Poverty_EN_EXT.
———. 2017b. "World Development Indicators ".
Part IV Making the System Work for Learning at Scale

- 9.1 -
Chapter 9 Education systems are misaligned with learning
Contents
Inconsistencies between major system elements impede learning................................................................ 3
Learning objectives and responsibilities ................................................................................................... 4
Information and metrics ............................................................................................................................ 5
Finance ...................................................................................................................................................... 5
Incentives .................................................................................................................................................. 6
Getting all parts of the system working together—coherence matters ..................................................... 7
Technical complexities make it hard to align education systems with learning ........................................... 8
Many goals and actors make education systems opaque .......................................................................... 9
Education systems are “sticky” ............................................................................................................... 12
Education systems often lack the implementation capacity to improve learning at scale....................... 13
In many countries education systems are insufficiently aligned with learning and get stuck in a low-learning, low-accountability, high-inequality equilibrium. These misalignments are partly driven by the technical complexities involved in managing systems that pursue many goals at the same time and involve many actors interacting in many ways. The limited implementation capacity of many government agencies responsible for managing education services compounds these challenges.
9.1 Kenya’s government discovered just how difficult it is to turn successful small-scale interventions into system-wide improvements in learning. In the late 2000s, even though access to primary schooling was high, many children failed to acquire even basic skills. The government argued that large classes, with overburdened teachers, lay behind these disappointing results. But a constrained education budget meant that hiring more civil service teachers to address these problems was not an option. Instead, in 2009 the government hired 18,000 temporary contract teachers. The new program shared many of the same features of an earlier trial by a nongovernmental organization that provided contract teachers to government schools.1 The trial reduced class sizes, improving learning outcomes for students taught by the new contract teachers. Moreover, these gains were achieved at a cost well below the alternative of hiring more civil service teachers.
9.2 But unlike the pilot intervention, the government program failed to deliver any improvements in learning. A combination of union resistance and lack of Ministry of Education capacity to manage contract teachers lay behind the lack of impact. The Kenyan teachers’ union successfully challenged the program in the courts because hiring teachers on a contract basis violated constitutional rights to equal pay for equal work. The ruling led to guarantees from the government to gradually absorb all contract teachers into the civil service and provide them with
1 Duflo and others 2015.
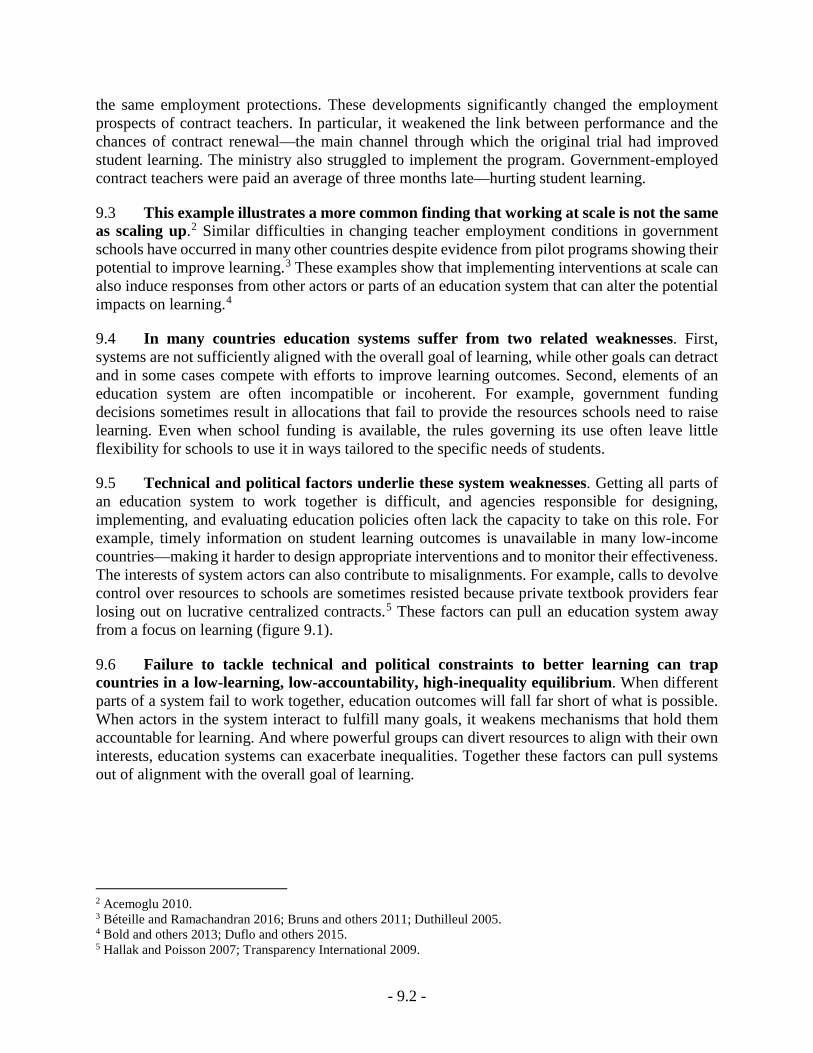
- 9.2 -
the same employment protections. These developments significantly changed the employment prospects of contract teachers. In particular, it weakened the link between performance and the chances of contract renewal—the main channel through which the original trial had improved student learning. The ministry also struggled to implement the program. Government-employed contract teachers were paid an average of three months late—hurting student learning.
9.3 This example illustrates a more common finding that working at scale is not the same as scaling up.2 Similar difficulties in changing teacher employment conditions in government schools have occurred in many other countries despite evidence from pilot programs showing their potential to improve learning.3 These examples show that implementing interventions at scale can also induce responses from other actors or parts of an education system that can alter the potential impacts on learning.4
9.4 In many countries education systems suffer from two related weaknesses. First, systems are not sufficiently aligned with the overall goal of learning, while other goals can detract and in some cases compete with efforts to improve learning outcomes. Second, elements of an education system are often incompatible or incoherent. For example, government funding decisions sometimes result in allocations that fail to provide the resources schools need to raise learning. Even when school funding is available, the rules governing its use often leave little flexibility for schools to use it in ways tailored to the specific needs of students.
9.5 Technical and political factors underlie these system weaknesses. Getting all parts of an education system to work together is difficult, and agencies responsible for designing, implementing, and evaluating education policies often lack the capacity to take on this role. For example, timely information on student learning outcomes is unavailable in many low-income countries—making it harder to design appropriate interventions and to monitor their effectiveness. The interests of system actors can also contribute to misalignments. For example, calls to devolve control over resources to schools are sometimes resisted because private textbook providers fear losing out on lucrative centralized contracts.5 These factors can pull an education system away from a focus on learning (figure 9.1).
9.6 Failure to tackle technical and political constraints to better learning can trap countries in a low-learning, low-accountability, high-inequality equilibrium. When different parts of a system fail to work together, education outcomes will fall far short of what is possible. When actors in the system interact to fulfill many goals, it weakens mechanisms that hold them accountable for learning. And where powerful groups can divert resources to align with their own interests, education systems can exacerbate inequalities. Together these factors can pull systems out of alignment with the overall goal of learning.
2 Acemoglu 2010. 3 Béteille and Ramachandran 2016; Bruns and others 2011; Duthilleul 2005. 4 Bold and others 2013; Duflo and others 2015. 5 Hallak and Poisson 2007; Transparency International 2009.
- 9.3 -
Figure 9.1 Technical and political barriers pull education systems away from a goal of learning
Source: WDR 2018 team.
Inconsistencies between major system elements impede learning
9.7 Taking a systems approach can help to identify the elements that are inconsistent or misaligned with learning (box 9.1). Though every education system faces its own challenges, misalignments tend to occur across four elements:
• Learning objectives and responsibilities. Clearly articulated learning goals are often missing. But even when they exist, the roles and responsibilities of different system actors in achieving them are unclear—resulting in limited accountability.
• Information and metrics. Accurate, credible information on learning is often unavailable. This can divert attention from learning and hinder monitoring and evaluation of interventions aimed at improving outcomes.
• Finance. Education funding is sometimes inadequate and often allocated in ways inconsistent with a goal of providing equitable learning opportunities.
• Incentives. The motivation and incentives of system actors are often only weakly linked to student learning.
LEARNING
- 9.4 -
Box 9.1 It’s all about (education) systems
What’s an education system?
An education system is a collection of “agents, institutions, actions and processes that affect the ‘educational status’ of citizens in the short and long run.”6 Education systems are made up of a large number of actors (teachers, parents, politicians, bureaucrats, civil society organizations) interacting with each other in different institutions (schools, ministry departments) for different reasons (developing curriculums, monitoring school performance, managing teachers). All these interactions are governed by rules, beliefs, and behavioral norms that affect how actors react and adapt to changes in the system. 7
Why is it useful to take a systems approach?
A systems approach tries to take into account the interactions between parts of an education system and understand how they work together to drive system outcomes rather than trying to understand specific elements in isolation.8 It can help assess whether different actors and subsystems align with education goals and shed light on the underlying drivers of system performance. For example, limited teacher capacity is often highlighted as a major cause of poor performance. But trials introducing contract teachers into schools have shown that they can deliver the same or better learning outcomes than government teachers despite lower levels of education, training, and pay.9 This suggests that some poor performance is driven not so much by a teacher’s individual capacity but by the organizational setting—incentives, accountability mechanisms, power relations—in which government teachers operate. A systems approach aims to identify these underlying factors so that policy design can tackle the deeper causes of poor performance.
A systems approach can also highlight where system elements are incoherent. But improvements focused on one part of the system often fail to improve outcomes because they are incompatible or incoherent with other parts of the system. For example, curriculum improvements may lead to little improvement in student learning because other parts of the system (such as assessment or teacher development) fail to adapt. Taking a systems view can help understand how changes in one part of the system affect other subsystems and support better alignment and ultimately better outcomes.10
A systems approach is also better suited to working with the complexity of education systems. The many objectives that education systems tend to pursue at the same time, coupled with the many different actors that these objectives work through, make it difficult to predict how different interventions will affect learning. Taking a systems approach shifts the focus away from interventions designed to address specific problems to a focus on the broader changes required to improve learning in a sustainable way.
Source: WDR 2018 team.
Learning objectives and responsibilities
9.8 Though most education systems highlight learning as a central goal, it often receives less prominence than other objectives. Looking beyond high-level policy documents often reveals the objectives that matter most in the day-to-day affairs of education agencies. Bangladesh has made progress in linking education sector objectives explicitly to government budgets; for example, budget documents link allocations to specific activities aimed to improve education outcomes. However, key performance indicators focus mostly on access and completion. Only one of the 12 indicators focuses on learning; moreover, that indicator tracks literacy rates in the
6 Moore 2015. 7 World Bank 2004. 8 Bowman and others 2015. 9 Bruns and others 2011. 10 Newman and others 2016.
- 9.5 -
population over age fifteen, which is insensitive to changes in school performance over the medium term.11
9.9 Even where learning is a clear goal, the way education systems are organized sometimes hampers performance. Because tasks are often fragmented across education departments and government agencies, it can be hard to identify who is accountable for outcomes. In Romania, responsibilities for textbook provision were split among four different agencies yet none of them were solely responsible for ensuring that the right books were provided to schools.12 Delivering early childhood development services typically requires coordination between several government agencies including health and education ministries. Managing these many agencies is challenging. In the early 1990s, inadequate funding and constant shifts in responsibility for early childhood development in Ghana resulted in inadequate stewardship of these services.13
Information and metrics
9.10 Information and knowledge systems are often unavailable to support the design and implementation of reforms. Education management information systems cover a wide range of indicators on service delivery, but in many countries they do not routinely include data on learning. India’s District Information System for Education is designed to provide report cards for districts, but of the 980 data points reported, none cover student learning.14 That can make it difficult for systems to track interventions to improve learning, for parents to demand better services from politicians or directly from schools, and for agencies to design effective policies to improve learning.
Finance
9.11 Public spending is not strongly correlated with learning. The link between spending and learning differs enormously even among countries at similar levels of economic development. In 2015 Peru spent 28 percent less per student than the Dominican Republic but had PISA mathematics scores that were more than half a standard deviation higher.15 More generally, cross-country correlations between public spending and learning levels are weak and statistically insignificant after controlling for income per capita. Moreover, for any given spending there are a wide range of outcomes. Even changes in public education spending over time sometimes result in unexpected outcomes. For example, Bulgaria’s PISA mathematics scores increased between 2009 and 2015 despite reductions in spending per student (figure 9.2). Public expenditure reviews and other studies reveal similar patterns across subnational administrations and even across schools.16
11 Government of Bangladesh 2005. 12 World Bank 2010. 13 World Bank 2015. 14 District Information System for Education (DISE) 2017. 15 OECD 2016 and UNESCO Institute of Statistics. 16 World Bank 2013; World Bank 2017; World Bank 2013.
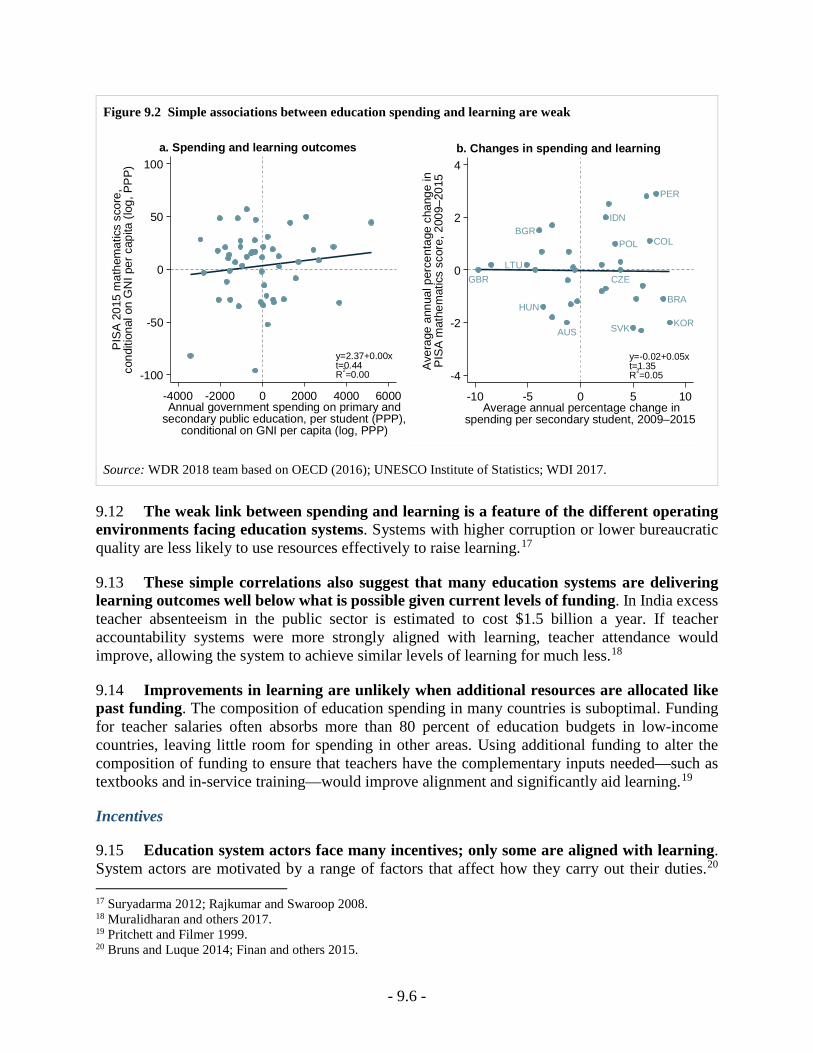
- 9.6 -
Figure 9.2 Simple associations between education spending and learning are weak
Source: WDR 2018 team based on OECD (2016); UNESCO Institute of Statistics; WDI 2017.
9.12 The weak link between spending and learning is a feature of the different operating environments facing education systems. Systems with higher corruption or lower bureaucratic quality are less likely to use resources effectively to raise learning.17
9.13 These simple correlations also suggest that many education systems are delivering learning outcomes well below what is possible given current levels of funding. In India excess teacher absenteeism in the public sector is estimated to cost $1.5 billion a year. If teacher accountability systems were more strongly aligned with learning, teacher attendance would improve, allowing the system to achieve similar levels of learning for much less.18
9.14 Improvements in learning are unlikely when additional resources are allocated like past funding. The composition of education spending in many countries is suboptimal. Funding for teacher salaries often absorbs more than 80 percent of education budgets in low-income countries, leaving little room for spending in other areas. Using additional funding to alter the composition of funding to ensure that teachers have the complementary inputs needed—such as textbooks and in-service training—would improve alignment and significantly aid learning.19
Incentives
9.15 Education system actors face many incentives; only some are aligned with learning. System actors are motivated by a range of factors that affect how they carry out their duties.20 17 Suryadarma 2012; Rajkumar and Swaroop 2008. 18 Muralidharan and others 2017. 19 Pritchett and Filmer 1999. 20 Bruns and Luque 2014; Finan and others 2015.
-100
-50
0
50
100
PISA
201
5 m
athe
mat
ics
scor
e,co
nditi
onal
on
GN
I per
cap
ita (l
og, P
PP)
-4000 -2000 0 2000 4000 6000Annual government spending on primary and
secondary public education, per student (PPP),conditional on GNI per capita (log, PPP)
y=2.37+0.00xt=0.44R2=0.00
a. Spending and learning outcomes
AUS
BRA
BGRCOL
CZE
HUN
IDN
KOR
LTU
PER
POL
SVK
GBR
-4
-2
0
2
4
Aver
age
annu
al p
erce
ntag
e ch
ange
inPI
SA m
athe
mat
ics
scor
e, 2
009–
2015
-10 -5 0 5 10Average annual percentage change in
spending per secondary student, 2009–2015
y=-0.02+0.05xt=1.35R2=0.05
b. Changes in spending and learning
- 9.7 -
Professional rewards—the social status afforded to their occupation, the ability to develop new competencies, intrinsic motivation—are all important factors driving behavior. Financial rewards and accountability mechanisms, such as feedback from parents or from managers, can also affect how system actors perform. Though some of these factors that motivate system actors are aligned with learning, some are not. For example, salaries and career progression are often largely determined by a combination of qualifications and experience despite these characteristics having only a weak relationship with learning.21 Even where countries have invested in mechanisms to evaluate teacher performance, these are often disconnected from decisions on professional development. Edo State in Nigeria has annual performance evaluations but they do not include decisions on teacher promotions, nor do they sanction or reward teachers for their performance.22
Getting all parts of the system working together—coherence matters
9.16 Ensuring that the parts of an education system work together is as important as ensuring alignment toward learning. Even if a country has prioritized student learning, established reasonable learning metrics, and aligned funding with incentives, it still needs to ensure that system elements are coherent (box 9.2). If a country adopts a new curriculum that places greater emphasis on active learning and creative thinking, the curriculum alone will not change much. Teachers need training so that they use more active learning methods, and they need to care enough to make the change: teaching to the new curriculum could be much more demanding than old methods that favor rote learning. Even if teachers are on board with curriculum reform, students and their families could weaken its effects if an unreformed examinations system creates misaligned incentives. In the Republic of Korea, efforts to introduce a more student-centered curriculum that encourages greater creativity have sometimes conflicted with pressure on students to pass all-important university entrance examinations.23
9.17 The need for coherence between different parts of an education system makes it risky to borrow from other countries. Education policymakers often scrutinize higher-performing systems to identify what they could borrow to improve learning outcomes in their systems. Indeed, the search for the secret ingredient behind Finland’s record of learning led in the 2000s to a swarm of visiting delegations in what has been dubbed “PISA tourism.” Finland’s system gives considerable autonomy to its well-educated teachers, who are able to tailor their teaching to the needs of their students. But lower-performing systems that simply import Finland’s teacher autonomy into their own contexts—contrary to the advice of Finnish educators who emphasize coherence—are likely to be disappointed. If teachers are poorly prepared, unmotivated, and loosely managed, then giving them greater autonomy will likely compound the problem. South Africa discovered this in the 1990s and 2000s, when it adopted a curriculum approach that set objectives but left implementation up to teachers. The approach failed in many schools, partly because it proved to be a poor fit for the capacity of teachers and the resources they had at their disposal.24 This example illustrates why alignment between different system elements and developing home-grown solutions are so important.
21 Glewwe and others 2011; Sclafani 2009. 22 World Bank 2015; REBOOT 2013. 23 King and Rogers 2014; Park 2016. 24 Chisholm and Leyendecker 2008; Todd and Mason 2005.
- 9.8 -
Technical complexities make it hard to align education systems with learning
9.18 Every day 23 million children—a fifth of the population—attends one of the 57,000 public elementary and high schools in the Philippines. When their parents are included, about two-thirds of Filipinos interact with the school system on a regular basis. The national government in Manila manages the system through a network of more than 200 division and 2,500 district education offices. These offices manage over 600,000 public school teachers, equivalent to more than 40 percent of the public sector workforce. Even routine tasks involve coordination between many parts of the system. For example, management of public school operational funds relies on student data from the central office. Once schools have their allocations, collecting and accounting for the use of funds results in issuing around 500,000 checks and generating as many spending reports each detailing many individual spending items. The monitoring of these financial flows alone puts significant strain on the system, despite accounting for less than 5 percent of government education spending.25
9.19 The multiple interactions that occur between system actors every day, the many goals that education systems pursue, and the way education agencies are organized make them hard to manage. Education systems are opaque because system actors pursue many objectives
25 World Bank 2016.
Box 9.2 Aligning all the ingredients for effective teaching in Shanghai
When 15-year-old students in Shanghai, China, outscored their peers in every other system in the 2012 PISA assessment, they sparked global interest in figuring out how Shanghai does it. One lesson is that coherence among key system elements, all aligned toward learning, has made the teacher workforce particularly effective.
1. Learning objectives and responsibilities. Learning standards lay out clearly the competencies that students are expected to master in each grade, setting clear expectations for teachers. Teachers are expected to translate these standards into detailed lesson plans, so that students can learn the curriculum effectively.
2. Information. Based on the learning standards, schools routinely assess student progress. Results of these assessments feed directly into the classroom: teachers use them to adjust lesson plans and schedule additional time for areas in which students are weak. Student assessments also provide an important input into a comprehensive system to monitor, evaluate, and support teachers.
3. Finance. The salary and benefits package for teachers in Shanghai is high compared to other parts of China, making it comparable with those of other professional occupations. Moreover, the salary scale allows high-performing and long-serving teachers to earn significantly more than new teachers. Adequate financing keeps teaching workloads relatively low, allowing teachers the time to develop and prepare lesson plans.
4. Motivation. Because of this attractive compensation package and the high societal respect for teachers, Shanghai can attract skilled, able candidates into the profession. Incentives—both monetary and non-monetary—encourage teachers to maintain high standards and continue improving their teaching skills. For example, high-performing teachers are recognized through the title of “model teacher”, and a small share of a teacher’s overall pay is based on performance. Teachers also have opportunities to act on these incentives, thanks to a well-established professional development system aligned with their needs. For example, school leaders draw on their close monitoring of teachers to develop targeted training plans for individual teachers.
No two education systems are alike, and attempting to exactly replicate Shanghai’s system of teacher management in other countries is unlikely to work. Still, the core principle likely applies anywhere: aligning the various parts of the system coherently toward learning pays off.
Source: Liang and others (2016).
- 9.9 -
simultaneously and often react to changes in policy unpredictably. Moreover, some of these goals are less visible and can make decision-making appear confused. Reforms to improve learning can take time to bear fruit, and it is often hard to attribute improvements to specific policies. This can make it hard to maintain support for some policy changes that are required to improve learning.
Many goals and actors make education systems opaque
9.20 Education systems typically have a range of goals, including equipping students with the skills needed for the labor market, advancing social equity, and teaching children the norms, beliefs, and histories of their community. But education systems can have other goals that are not always compatible with and can hamper efforts to improve learning. For example, politicians sometimes view education systems as a tool for rewarding their supporters with civil service jobs or impressing voters with school construction programs that are visible but not strategically planned. These goals can be misaligned with learning, leaving schools with buildings they cannot use and teachers who are not proficient.26 Where these objectives compete with others, it can seem that the overall education system and its actors are not aligned toward learning.
9.21 Managing and monitoring the system to raise learning are difficult. Teaching and learning in the classroom involve significant discretion for teachers. Teachers must use their professional assessment to tailor their teaching to the needs of their students. Teaching also involves regular, repeated interactions between students and teachers over a relatively long period. These characteristics—coupled with a dearth of information and metrics on student outcomes at the school level—make managing and monitoring learning difficult. When private schools, out of the direct control of the public system, are a major player, these challenges may be exacerbated (box 9.3).
9.22 Some things are easier to monitor.27 School building and cash transfer programs are highly visible and easily monitored investments to expand access. By contrast, investments to raise teacher competence or improve the curriculum are less visible—and monitoring their impact on student learning more difficult. Such challenges can sometimes lead education systems to focus more on improvements in access than on improvements in quality.28 Even when systems to monitor student learning is effective, it can sometimes lead to biases toward better-performing students, short-term test preparation, and a narrow focus on subjects or examinations that are explicitly monitored.29 In Kenya the introduction of performance incentives based on student test results led teachers to put more effort into preparing for tests directly linked to incentives. While student results improved in these tests, they did not register any gains in other examinations that covered similar subjects using different testing formats.30
9.23 The many actors and institutions in an education system make efforts to raise learning unpredictable.31 Learning is a complex process that is difficult to break down into simple linear relationships from cause to effect. The multiple interactions that characterize teaching and learning
26 Harding and Stasavage 2014; Wales and others 2016; Sacks and Pierskalla 2015. 27 Holmstrom and Milgrom 1991. 28 Harding and Stasavage 2014. 29 Jacob 2005. 30 Glewwe and others 2010. 31 Burns and Köster 2016; Snyder 2013.
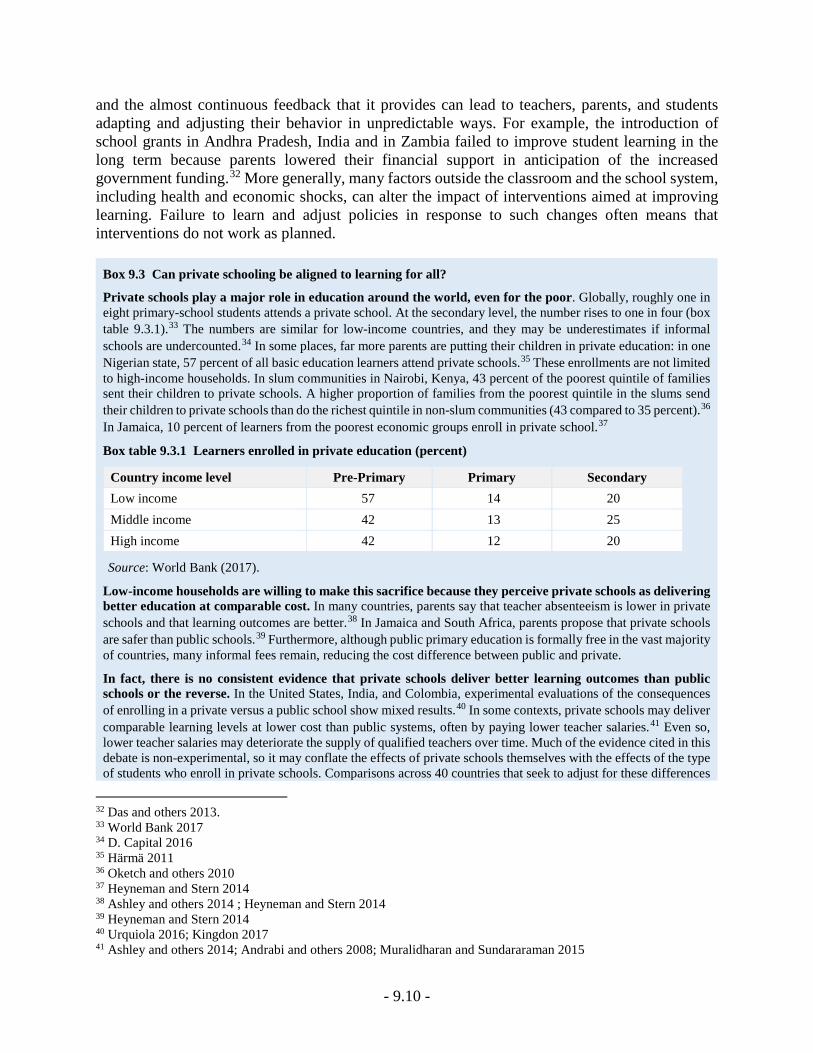
- 9.10 -
and the almost continuous feedback that it provides can lead to teachers, parents, and students adapting and adjusting their behavior in unpredictable ways. For example, the introduction of school grants in Andhra Pradesh, India and in Zambia failed to improve student learning in the long term because parents lowered their financial support in anticipation of the increased government funding.32 More generally, many factors outside the classroom and the school system, including health and economic shocks, can alter the impact of interventions aimed at improving learning. Failure to learn and adjust policies in response to such changes often means that interventions do not work as planned.
Box 9.3 Can private schooling be aligned to learning for all?
Private schools play a major role in education around the world, even for the poor. Globally, roughly one in eight primary-school students attends a private school. At the secondary level, the number rises to one in four (box table 9.3.1).33 The numbers are similar for low-income countries, and they may be underestimates if informal schools are undercounted.34 In some places, far more parents are putting their children in private education: in one Nigerian state, 57 percent of all basic education learners attend private schools.35 These enrollments are not limited to high-income households. In slum communities in Nairobi, Kenya, 43 percent of the poorest quintile of families sent their children to private schools. A higher proportion of families from the poorest quintile in the slums send their children to private schools than do the richest quintile in non-slum communities (43 compared to 35 percent).36 In Jamaica, 10 percent of learners from the poorest economic groups enroll in private school.37
Box table 9.3.1 Learners enrolled in private education (percent)
Country income level Pre-Primary Primary Secondary Low income 57 14 20 Middle income 42 13 25 High income 42 12 20
Source: World Bank (2017).
Low-income households are willing to make this sacrifice because they perceive private schools as delivering better education at comparable cost. In many countries, parents say that teacher absenteeism is lower in private schools and that learning outcomes are better.38 In Jamaica and South Africa, parents propose that private schools are safer than public schools.39 Furthermore, although public primary education is formally free in the vast majority of countries, many informal fees remain, reducing the cost difference between public and private.
In fact, there is no consistent evidence that private schools deliver better learning outcomes than public schools or the reverse. In the United States, India, and Colombia, experimental evaluations of the consequences of enrolling in a private versus a public school show mixed results.40 In some contexts, private schools may deliver comparable learning levels at lower cost than public systems, often by paying lower teacher salaries.41 Even so, lower teacher salaries may deteriorate the supply of qualified teachers over time. Much of the evidence cited in this debate is non-experimental, so it may conflate the effects of private schools themselves with the effects of the type of students who enroll in private schools. Comparisons across 40 countries that seek to adjust for these differences
32 Das and others 2013. 33 World Bank 2017 34 D. Capital 2016 35 Härmä 2011 36 Oketch and others 2010 37 Heyneman and Stern 2014 38 Ashley and others 2014 ; Heyneman and Stern 2014 39 Heyneman and Stern 2014 40 Urquiola 2016; Kingdon 2017 41 Ashley and others 2014; Andrabi and others 2008; Muralidharan and Sundararaman 2015
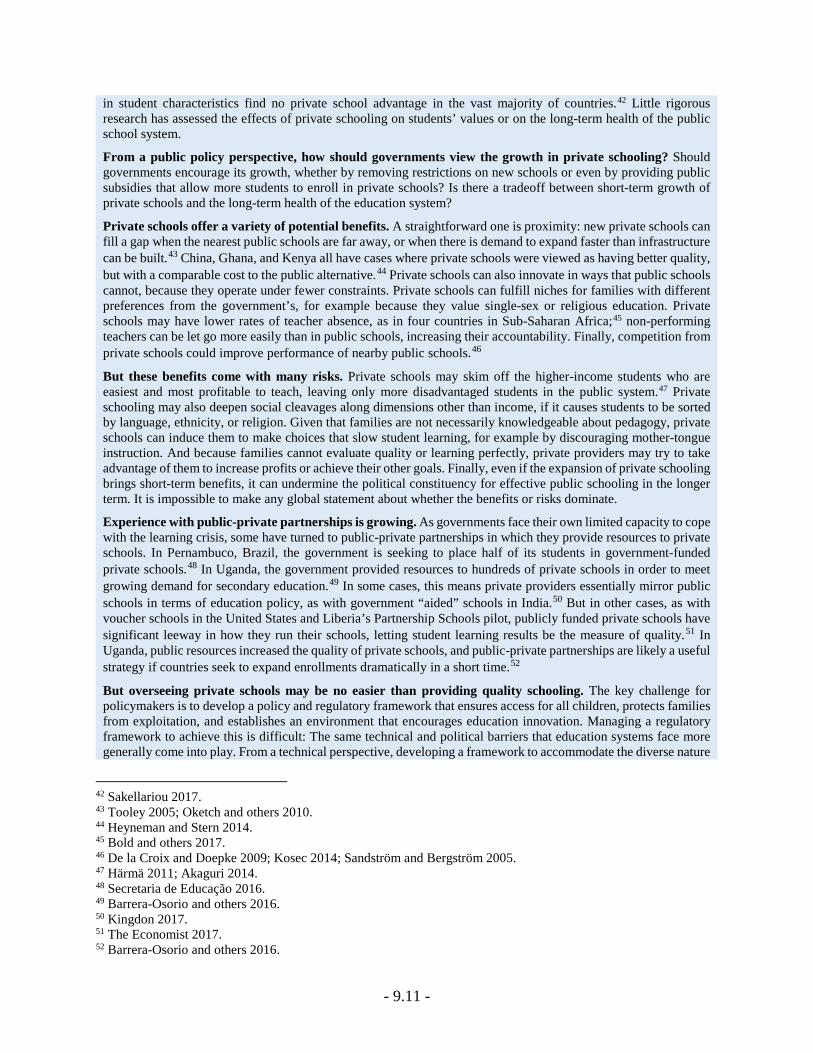
- 9.11 -
in student characteristics find no private school advantage in the vast majority of countries.42 Little rigorous research has assessed the effects of private schooling on students’ values or on the long-term health of the public school system.
From a public policy perspective, how should governments view the growth in private schooling? Should governments encourage its growth, whether by removing restrictions on new schools or even by providing public subsidies that allow more students to enroll in private schools? Is there a tradeoff between short-term growth of private schools and the long-term health of the education system?
Private schools offer a variety of potential benefits. A straightforward one is proximity: new private schools can fill a gap when the nearest public schools are far away, or when there is demand to expand faster than infrastructure can be built.43 China, Ghana, and Kenya all have cases where private schools were viewed as having better quality, but with a comparable cost to the public alternative.44 Private schools can also innovate in ways that public schools cannot, because they operate under fewer constraints. Private schools can fulfill niches for families with different preferences from the government’s, for example because they value single-sex or religious education. Private schools may have lower rates of teacher absence, as in four countries in Sub-Saharan Africa;45 non-performing teachers can be let go more easily than in public schools, increasing their accountability. Finally, competition from private schools could improve performance of nearby public schools.46
But these benefits come with many risks. Private schools may skim off the higher-income students who are easiest and most profitable to teach, leaving only more disadvantaged students in the public system.47 Private schooling may also deepen social cleavages along dimensions other than income, if it causes students to be sorted by language, ethnicity, or religion. Given that families are not necessarily knowledgeable about pedagogy, private schools can induce them to make choices that slow student learning, for example by discouraging mother-tongue instruction. And because families cannot evaluate quality or learning perfectly, private providers may try to take advantage of them to increase profits or achieve their other goals. Finally, even if the expansion of private schooling brings short-term benefits, it can undermine the political constituency for effective public schooling in the longer term. It is impossible to make any global statement about whether the benefits or risks dominate.
Experience with public-private partnerships is growing. As governments face their own limited capacity to cope with the learning crisis, some have turned to public-private partnerships in which they provide resources to private schools. In Pernambuco, Brazil, the government is seeking to place half of its students in government-funded private schools.48 In Uganda, the government provided resources to hundreds of private schools in order to meet growing demand for secondary education.49 In some cases, this means private providers essentially mirror public schools in terms of education policy, as with government “aided” schools in India.50 But in other cases, as with voucher schools in the United States and Liberia’s Partnership Schools pilot, publicly funded private schools have significant leeway in how they run their schools, letting student learning results be the measure of quality.51 In Uganda, public resources increased the quality of private schools, and public-private partnerships are likely a useful strategy if countries seek to expand enrollments dramatically in a short time.52
But overseeing private schools may be no easier than providing quality schooling. The key challenge for policymakers is to develop a policy and regulatory framework that ensures access for all children, protects families from exploitation, and establishes an environment that encourages education innovation. Managing a regulatory framework to achieve this is difficult: The same technical and political barriers that education systems face more generally come into play. From a technical perspective, developing a framework to accommodate the diverse nature
42 Sakellariou 2017. 43 Tooley 2005; Oketch and others 2010. 44 Heyneman and Stern 2014. 45 Bold and others 2017. 46 De la Croix and Doepke 2009; Kosec 2014; Sandström and Bergström 2005. 47 Härmä 2011; Akaguri 2014. 48 Secretaria de Educação 2016. 49 Barrera-Osorio and others 2016. 50 Kingdon 2017. 51 The Economist 2017. 52 Barrera-Osorio and others 2016.
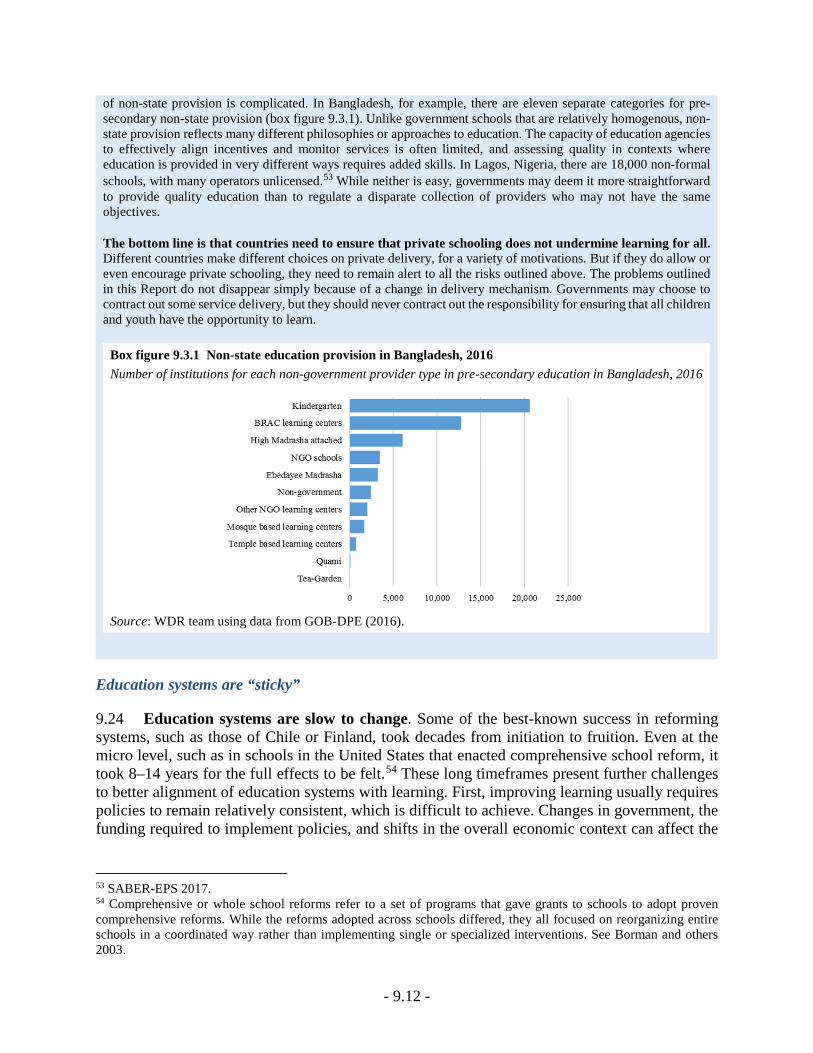
- 9.12 -
of non-state provision is complicated. In Bangladesh, for example, there are eleven separate categories for pre-secondary non-state provision (box figure 9.3.1). Unlike government schools that are relatively homogenous, non-state provision reflects many different philosophies or approaches to education. The capacity of education agencies to effectively align incentives and monitor services is often limited, and assessing quality in contexts where education is provided in very different ways requires added skills. In Lagos, Nigeria, there are 18,000 non-formal schools, with many operators unlicensed.53 While neither is easy, governments may deem it more straightforward to provide quality education than to regulate a disparate collection of providers who may not have the same objectives.
The bottom line is that countries need to ensure that private schooling does not undermine learning for all. Different countries make different choices on private delivery, for a variety of motivations. But if they do allow or even encourage private schooling, they need to remain alert to all the risks outlined above. The problems outlined in this Report do not disappear simply because of a change in delivery mechanism. Governments may choose to contract out some service delivery, but they should never contract out the responsibility for ensuring that all children and youth have the opportunity to learn.
Box figure 9.3.1 Non-state education provision in Bangladesh, 2016 Number of institutions for each non-government provider type in pre-secondary education in Bangladesh, 2016
Source: WDR team using data from GOB-DPE (2016).
Education systems are “sticky”
9.24 Education systems are slow to change. Some of the best-known success in reforming systems, such as those of Chile or Finland, took decades from initiation to fruition. Even at the micro level, such as in schools in the United States that enacted comprehensive school reform, it took 8–14 years for the full effects to be felt.54 These long timeframes present further challenges to better alignment of education systems with learning. First, improving learning usually requires policies to remain relatively consistent, which is difficult to achieve. Changes in government, the funding required to implement policies, and shifts in the overall economic context can affect the
53 SABER-EPS 2017. 54 Comprehensive or whole school reforms refer to a set of programs that gave grants to schools to adopt proven comprehensive reforms. While the reforms adopted across schools differed, they all focused on reorganizing entire schools in a coordinated way rather than implementing single or specialized interventions. See Borman and others 2003.
- 9.13 -
longevity of previous policy choices.55 This can be even more challenging when there is limited evidence to show they are leading to improvements in the short term. Second, evaluating programs and attributing improvements to specific interventions is made more difficult when their impacts only emerge in the long run.
Education systems often lack the implementation capacity to improve learning at scale
9.25 Opacity and stickiness make the challenges of technical alignment hard enough; these challenges are made more daunting by weaknesses in implementation capacity. Successful implementation depends upon effective leadership, coordination between education agencies, and implementation teams that are motivated, use resources efficiently, and can troubleshoot real-time—all of which are in short supply in many systems. Moreover, behavioral economics highlights many cognitive pitfalls that policymakers commonly face in complex operating environments. These include difficulty in evaluating policy effectiveness when faced with too many options; loss aversion, or the tendency to feel failures more intensely than successes, which makes policymakers wary of experimentation; biases that cause selective use of information to reinforce existing views; and relational bias, which makes it harder for officials with elite educational backgrounds to grasp the challenges of mass education.56
9.26 Education agencies often lack the capabilities needed to tackle these complexities.57 A recent assessment highlight how multi-tasking and fragmentation within education agencies can blur lines of accountability for learning. In Cyprus, the absence of a department for human resources and general administration meant that pedagogical departments had to manage these responsibilities, diverting time from developing programs and policies.58 Public expenditure and financial accountability assessments also highlight the low capacity in many developing countries in key areas. For example, only about half of the 72 low- and middle-income countries assessed since 2010 in these exercises had any system in place to ensure that resources intended for schools, health clinics, and other service delivery units reached the front lines.59
* * *
9.27 These technical challenges and lack of implementation capacity result in misaligned education systems. When countries are unable to overcome these technical challenges, their education systems deliver levels of learning far below what is possible. But tackling the technical barriers to better learning is only part of the battle. To break out of a low-learning equilibrium, countries must also address the political constraints that are often at the heart of these technical misalignments.
55 World Bank 2017. 56 Thaler and Sunstein 2008; World Bank 2015. 57 Pritchett and Woolcock 2004. 58 World Bank 2013; World Bank 2010. 59 Public Expenditure and Financial Accountability (PEFA) 2017.
- 9.14 -
References Acemoglu, Daron. 2010. "Theory, General Equilibrium, and Political Economy in Development Economics." The Journal of Economic Perspectives 24(3): 17-32.
Akaguri, Luke. 2014. "Fee-Free Public or Low-Fee Private Basic Education in Rural Ghana: How Does the Cost Influence the Choice of the Poor?" Compare: A Journal of Comparative and International Education 44(2): 140-61. http://www.tandfonline.com/doi/full/10.1080/03057925.2013.796816?src=recsys.
Andrabi, Tahir, Jishnu Das, and Asim Ijaz Khwaja. 2008. "A Dime a Day: The Possibilities and Limits of Private Schooling in Pakistan." Comparative Education Review 52(3): 329-55.
Ashley, Laura Day, Claire Mcloughlin, Monazza Aslam, Jakob Engel, Joseph Wales, Shenila Rawal, Richard Batley, Geeta Kingdon, Susan Nicolai, and P Rose. 2014. "The Role and Impact of Private Schools in Developing Countries." Rigorous Literature Review. https://www.odi.org/sites/odi.org.uk/files/odi-assets/publications-opinion-files/10145.pdf.
Barrera-Osorio, Felipe, De Galbert, Pierre Gaspard, James P Habyarimana, and Shwetlena Sabarwal. 2016. "Impact of Public-Private Partnerships on Private School Performance: Evidence from a Randomized Controlled Trial in Uganda." http://documents.worldbank.org/curated/en/470851480966927631/pdf/WPS7905.pdf.
Béteille, Tara, and Vimala Ramachandran. 2016. "Contract Teachers in India." Economic & Political Weekly 51(25): 41.
Bold, Tessa, Deon Filmer, Gayle Martin, Ezequiel Molina, Christophe Rockmore, Brian Stacy, Jakob Svensson, and Waly Wane. 2017. "What Do Teachers Know and Do? Does It Matter? Evidence from Primary Schools in Africa." WDR 2018 Background Paper, The World Bank. http://www.tessabold.com/uploads/7/0/1/0/70101685/wps7956.pdf.
Bold, Tessa, Mwangi Kimenyi, Germano Mwabu, A Ng'ang'a, and J Sandefur. 2013. "Scaling-up What Works: Experimental Evidence on External Validity in Kenyan Education." CSAE Working Paper Series. Oxford: Centre for the Study of African Economies, University of Oxford.
Borman, Geoffrey D, Gina M Hewes, Laura T Overman, and Shelly Brown. 2003. "Comprehensive School Reform and Achievement: A Meta-Analysis." Review of educational research 73(2): 125-230.
Bowman, Kimberly, John Chettleborough, Helen Jeans, James Whitehead, and Jo Rowlands. 2015. "Systems Thinking: An Introduction for Oxfam Programme Staff."
Bruns, B, D. Filmer, and H A Patrinos. 2011. Making Schools Work: New Evidence on Accountability Reforms. Washington D.C.: The World Bank.
Bruns, B, and J Luque. 2014. Great Teachers: How to Raise Student Learning in Latin America and the Caribbean. Washington, DC: World Bank.
Burns, T, and F Köster. 2016. "Governing Education in a Complex World." Paris: OECD. Retrieved April 27: 2016.
Chisholm, Linda, and Ramon Leyendecker. 2008. "Curriculum Reform in Post-1990s Sub-Saharan Africa." International Journal of Educational Development 28(2): 195-205. doi: http://doi.org/10.1016/j.ijedudev.2007.04.003.
D. Capital. 2016. "The Impact of Private Investment in Education in Sub-Saharan Africa: How Can Private Capital Shape Education across the Continent? ." http://www.dalberg.com/wp-content/uploads/2016/05/Private-investments-in-SSA-Education.pdf.
Das, J, S Dercon, J Habyarimana, P. Krishnan, K Muralidharan, and V Sundararaman. 2013. "School Inputs, Household Substitution and Test Scores." Applied Economics 5(2): 29-57.
De la Croix, David, and Matthias Doepke. 2009. "To Segregate or to Integrate: Education Politics and Democracy." The Review of Economic Studies 76(2): 597-628.
District Information System for Education (DISE). 2017. 12 April. http://udise.in/.
Duflo, Esther, Pascaline Dupas, and Michael Kremer. 2015. "School Governance, Teacher Incentives, and Pupil–Teacher Ratios: Experimental Evidence from Kenyan Primary Schools." Journal of Public Economics 123: 92-110.
Duthilleul, Yael. 2005. Lessons Learnt in the Use of Contract Teachers. International Institute for Educational Planning, UNESCO.
Finan, Frederico, Benjamin A Olken, and Rohini Pande. 2015. "The Personnel Economics of the State." National Bureau of Economic Research.
Glewwe, Paul, Nauman Ilias, and Michael Kremer. 2010. "Teacher Incentives." American Economic Journal: Applied Economics 2(3): 205-27.
Glewwe, Paul W, Eric A Hanushek, Sarah D Humpage, and Renato Ravina. 2011. "School Resources and
- 9.15 -
Educational Outcomes in Developing Countries: A Review of the Literature from 1990 to 2010." National Bureau of Economic Research.
GOB-DPE. 2016. "Annual Primary School Census ".
Government of Bangladesh. 2005. "Medium Term Budgetary Framework 2017-18 - 2019-2020." Dhaka: Ministry of Finance.
Hallak, J, and M Poisson. 2007. Corrupt Schools, Corrupt Universities: What Can Be Done? . Paris: International Institute for Educational Planning
Harding, Robin, and David Stasavage. 2014. "What Democracy Does (and Doesn’t Do) for Basic Services: School Fees, School Inputs, and African Elections." The Journal of Politics 76(01): 229-45.
Härmä, Joanna. 2011. "Low Cost Private Schooling in India: Is It Pro Poor and Equitable?" International Journal of Educational Development 31(4): 350-56. http://www.sciencedirect.com/science/article/pii/S0738059311000046.
Heyneman, Stephen P, and Jonathan MB Stern. 2014. "Low Cost Private Schools for the Poor: What Public Policy Is Appropriate?" International Journal of Educational Development 35: 3-15.
Holmstrom, Bengt, and Paul Milgrom. 1991. "Multitask Principal-Agent Analyses: Incentive Contracts, Asset Ownership, and Job Design." Journal of Law, Economics, & Organization 7: 24-52.
Jacob, Brian A. 2005. "Accountability, Incentives and Behavior: The Impact of High-Stakes Testing in the Chicago Public Schools." Journal of public Economics 89(5): 761-96.
King, Elizabeth, and Halsey Rogers. 2014. "Intelligence, Personality, and Creativity : Unleashing the Power of Intelligence and Personality Traits to Build a Creative and Innovative Economy." Washington, DC World Bank Group.
Kingdon, Geeta Gandhi. 2017. "The Private Schooling Phenomenon in India: A Review." IZA Discussion Paper Series No. 10612. http://ftp.iza.org/dp10612.pdf.
Kosec, Katrina. 2014. "Relying on the Private Sector: The Income Distribution and Public Investments in the Poor." Journal of Development Economics 107: 320-42. http://www.sciencedirect.com/science/article/pii/S0304387813001788.
Liang, Xiaoyan, Huma Kidwai, Minxuan Zhang, and Yinan Zhang. 2016. How Shanghai Does It: Insights and Lessons from the Highest-Ranking Education System in the World. World Bank Publications.
Moore, Mark. 2015. "Creating Efficient, Effective and Just Education Systems through Multi-Sector Strategies of Reform." Research on Improving Systems of Education (RISE) Working Paper 15/004.
Muralidharan, Karthik, Jishnu Das, Alaka Holla, and Aakash Mohpal. 2017. "The Fiscal Cost of Weak Governance: Evidence from Teacher Absence in India." Journal of Public Economics 145: 116-35.
Muralidharan, Karthik, and Venkatesh Sundararaman. 2015. "The Aggregate Effect of School Choice: Evidence from a Two-Stage Experiment in India." The Quarterly Journal of Economics 130(3): 1011-66. https://academic.oup.com/qje/article/130/3/1011/1931887/The-Aggregate-Effect-of-School-Choice-Evidence.
Newman, J, E King, and H Abdul-Hamid. 2016. "The Quallity of Education Systems and Education Outcomes." Background Paper for the Education Comission Report: The Learning Generation.
OECD. 2016. Pisa 2015 Results (Volume I). OECD Publishing. /content/book/9789264266490-en
http://dx.doi.org/10.1787/9789264266490-en.
Oketch, Moses, Maurice Mutisya, Moses Ngware, and Alex C Ezeh. 2010. "Why Are There Proportionately More Poor Pupils Enrolled in Non-State Schools in Urban Kenya in Spite of Fpe Policy?" International Journal of Educational Development 30(1): 23-32. http://www.sciencedirect.com/science/article/pii/S0738059309000984.
Park, R.K.E. 2016. "Preparing Students for South Korea's Creative Economy: The Success and Challenges of Educational Reform." Asia Pacific Foundation of Canada.
Pritchett, Lant, and Deon Filmer. 1999. "What Education Production Functions Really Show: A Positive Theory of Education Expenditures." Economics of Education Review 18(2): 223-39.
Pritchett, Lant, and Michael Woolcock. 2004. "Solutions When the Solution Is the Problem: Arraying the Disarray in Development." World Development 32(2): 191-212.
Public Expenditure and Financial Accountability (PEFA). 2017. "Public Expenditure and Financial Accountability Database."
Rajkumar, A.S, and V Swaroop. 2008. "Public Spending and Outcomes: Does Governance Matter?" Journal of Development Economics 86: 96-111.
REBOOT. 2013. "Addressing Teacher Absenteeism in Edo State."
SABER-EPS. 2017. "Saber-Engaging the Private Sector Program Brief."
- 9.16 -
Sacks, A, and J Pierskalla. 2015. "Personnel Politics: Elections, Clientelistic Competition, and Teacher Hiring in Indonesia."
Sakellariou, Chris. 2017. "Private or Public School Advantage? Evidence from 40 Countries Using Pisa 2012-Mathematics." Applied Economics 49(29): 2875-92. http://www.tandfonline.com/doi/full/10.1080/00036846.2016.1248361?scroll=top&needAccess=true.
Sandström, F Mikael, and Fredrik Bergström. 2005. "School Vouchers in Practice: Competition Will Not Hurt You." Journal of Public economics 89(2): 351-80. http://www.sciencedirect.com/science/article/pii/S0047272704000404.
Sclafani, Susan. 2009. Evaluating and Rewarding the Quality of Teachers: International Practices. OECD.
Secretaria de Educação. 2016. "Educação Integral." http://www.educacao.pe.gov.br/portal/?pag=1&men=70.
Snyder, Sean. 2013. The Simple, the Complicated, and the Complex: Educational Reform through the Lens of Complexity Theory.
Suryadarma, D. 2012. "How Corruption Diminishes the Effectiveness of Public Spending on Education in Indonesia." Bulletin of Indonesian Economic Studies 48(1): 85-100.
Thaler, Richard H, and Cass R Sunstein. 2008. Nudge: Improving Decisions About Health, Wealth, and Happiness. New Haven and London: Yale University Press.
The Economist. 2017. "Ashes to Classes: Liberia's Bold Experiment in School Reform " The Economist Feb 23 2017. http://www.economist.com/news/middle-east-and-africa/21717379-war-scorched-state-where-almost-nothing-works-tries-charter-schools-liberias.
Todd, Alexa, and Mark Mason. 2005. "Enhancing Learning in South African Schools: Strategies Beyond Outcomes-Based Education." International Journal of Educational Development 25(3): 221-35. doi: http://doi.org/10.1016/j.ijedudev.2004.08.003.
Tooley, J. 2005. "Private Schools for the Poor: Education Where No One Expects It " Education Next 5(4): 11. http://faculty.wcas.northwestern.edu/~mdo738/research/delaCroix_Doepke_ReStud_09.pdf.
Transparency International. 2009. "Corruption in the Education Sector."
Urquiola, M. 2016. "Competition among Schools: Traditional Public and Private Schools." Handbook of the Economics of Education.
http://www.columbia.edu/~msu2101/Urquiola(2016).pdf.
Wales, Joseph, Arran Magee, and Susan Nicolai. 2016. "How Does Political Context Shape Education Reforms and Their Success?".
World Bank. 2004. "World Development Report: Making Services Work for Poor People." Washington D.C: The World Bank.
———. 2010. "Romania Functional Review: Pre-University Education Sector." Washington, DC The World Bank.
———. 2013. "Analysis of Function and Structure of the Ministry of Education and Culture of the Republic of Cyprus." Washington, DC The World Bank.
———. 2013. " Belarus - Public Expenditure Review : Enhancing Public Services in Times of Austerity. Public Expenditure Review (Per). ." Washington DC: World Bank Group.
———. 2013. "Spending More or Spending Better: Improving Education Financing in Indonesia. Education Public Expenditure Review." Jakarta: The World Bank.
———. 2015. "Governance and Finance Analysis of the Basic Education Sector in Nigeria."
———. 2015. "World Bank Support to Early Childhood Development : An Independent Evaluation." Washington, D.C.: World Bank Group.
———. 2015. "World Development Report: Mind, Society, and Behavior." Washington D.C: The World Bank.
———. 2016. "Assessing Basic Education Service Delivery in the Philippines : Public Education Expenditure Tracking and Quantitative Service Delivery Study." Washington D.C.: The World Bank Group.
———. 2017. "Ukraine: Public Finance Review."
———. 2017. "World Development Indicators ".
———. 2017. "World Development Report 2017: Governance and the Law." Washington D.C: The World Bank.
- S6.1 -
Spotlight 6 Spending more or spending better—or both?
Good teachers, conducive learning environments, reliable assessment systems, and innovative learning technologies all cost money. And as more students progress further in school, the financing needs will rise. Yet more funding will lead to better learning only if the additional spending is used much better, with an intentional focus on learning outcomes.
Patterns of public education spending
S6.1 Decisions over how to allocate public spending inevitably require difficult tradeoffs. Governments continuously make decisions on how to spend scarce resources. For example, they need to weigh the costs and benefits of different spending decisions—both of which are typically estimated with large margins of error. Governments also have to weigh the short- and long-term benefits of different decisions. Should they spend more on urban infrastructure improvements to reduce air pollution in the future, or invest today in better primary health care services to treat respiratory infections?
S6.2 Spending on education is subject to this same calculus. Education’s many potential benefits for both individuals and societies (see chapter 1) make it a strong candidate for public support—with the obligation to provide equitable education often enshrined in law. Although the high returns to education mean that many students are willing to bear the costs themselves, there are strong rationales for public financing of at least some parts of the education system. First, a concern for fairness induces countries to subsidize education for children and youth from the poorest households, because their families may be unable or unwilling to finance their education. Second, because education has positive spillovers for others—as when it reduces the propensity to commit crime—individuals may underinvest in their own education, from society’s perspective. Third, governments want to use education to create shared values; delivering education directly, or at least financing it, gives them leverage to ensure this happens. But in all these cases, governments must weigh these benefits against the costs of investing in education rather than some other area—and they must decide how to spend within the education sector.
S6.3 Based on their spending patterns, countries are increasingly willing to invest in education. Whether because of these public-economics calculations or for other political reasons, countries have devoted an increasing share of their national income to education (see figure S6.1). In 2012, approximately two-thirds of countries that reported information on spending devoted over four percent of national income to public spending on education. Education also typically absorbs the largest single share of the government budget, averaging about 15 percent of the budget across low- and middle-income countries. There are still countries where the investment in education is low, indicating scope for further prioritizing it, but the aggregate trends suggest that governments recognize how important education is.
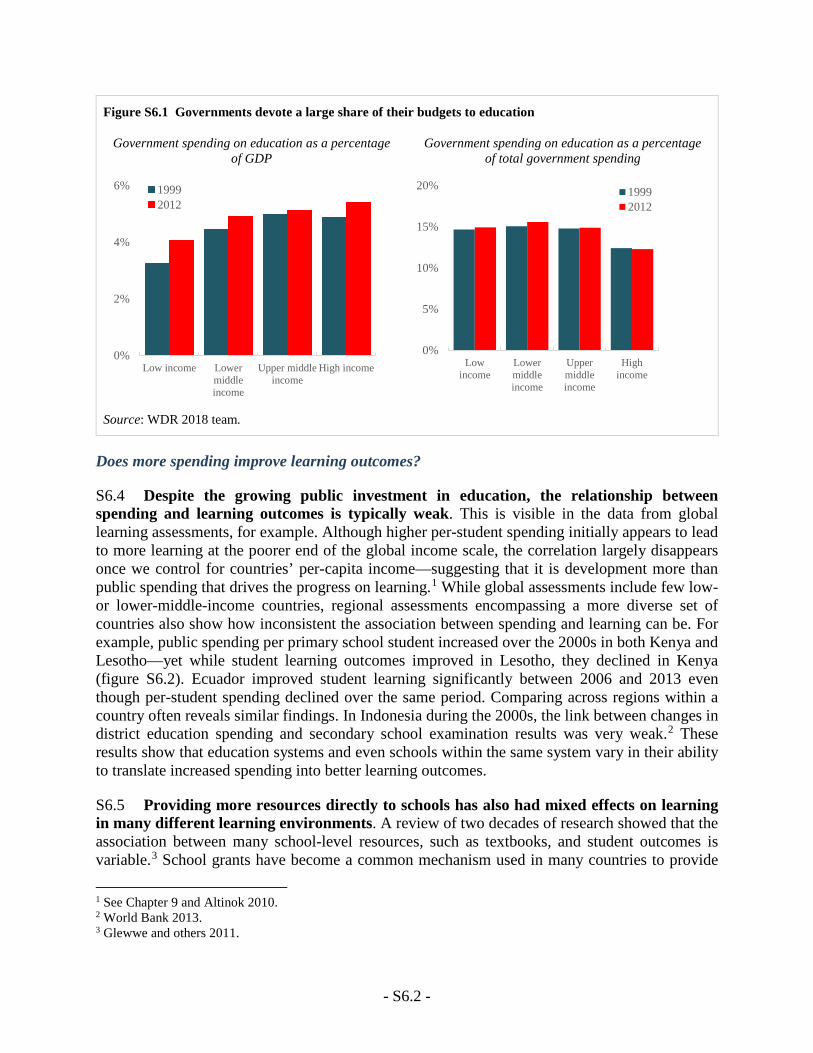
- S6.2 -
Figure S6.1 Governments devote a large share of their budgets to education
Government spending on education as a percentage of GDP
Government spending on education as a percentage of total government spending
Source: WDR 2018 team.
Does more spending improve learning outcomes?
S6.4 Despite the growing public investment in education, the relationship between spending and learning outcomes is typically weak. This is visible in the data from global learning assessments, for example. Although higher per-student spending initially appears to lead to more learning at the poorer end of the global income scale, the correlation largely disappears once we control for countries’ per-capita income—suggesting that it is development more than public spending that drives the progress on learning.1 While global assessments include few low- or lower-middle-income countries, regional assessments encompassing a more diverse set of countries also show how inconsistent the association between spending and learning can be. For example, public spending per primary school student increased over the 2000s in both Kenya and Lesotho—yet while student learning outcomes improved in Lesotho, they declined in Kenya (figure S6.2). Ecuador improved student learning significantly between 2006 and 2013 even though per-student spending declined over the same period. Comparing across regions within a country often reveals similar findings. In Indonesia during the 2000s, the link between changes in district education spending and secondary school examination results was very weak.2 These results show that education systems and even schools within the same system vary in their ability to translate increased spending into better learning outcomes.
S6.5 Providing more resources directly to schools has also had mixed effects on learning in many different learning environments. A review of two decades of research showed that the association between many school-level resources, such as textbooks, and student outcomes is variable.3 School grants have become a common mechanism used in many countries to provide 1 See Chapter 9 and Altinok 2010. 2 World Bank 2013. 3 Glewwe and others 2011.
0%
2%
4%
6%
Low income Lowermiddleincome
Upper middleincome
High income
19992012
0%
5%
10%
15%
20%
Lowincome
Lowermiddleincome
Uppermiddleincome
Highincome
19992012
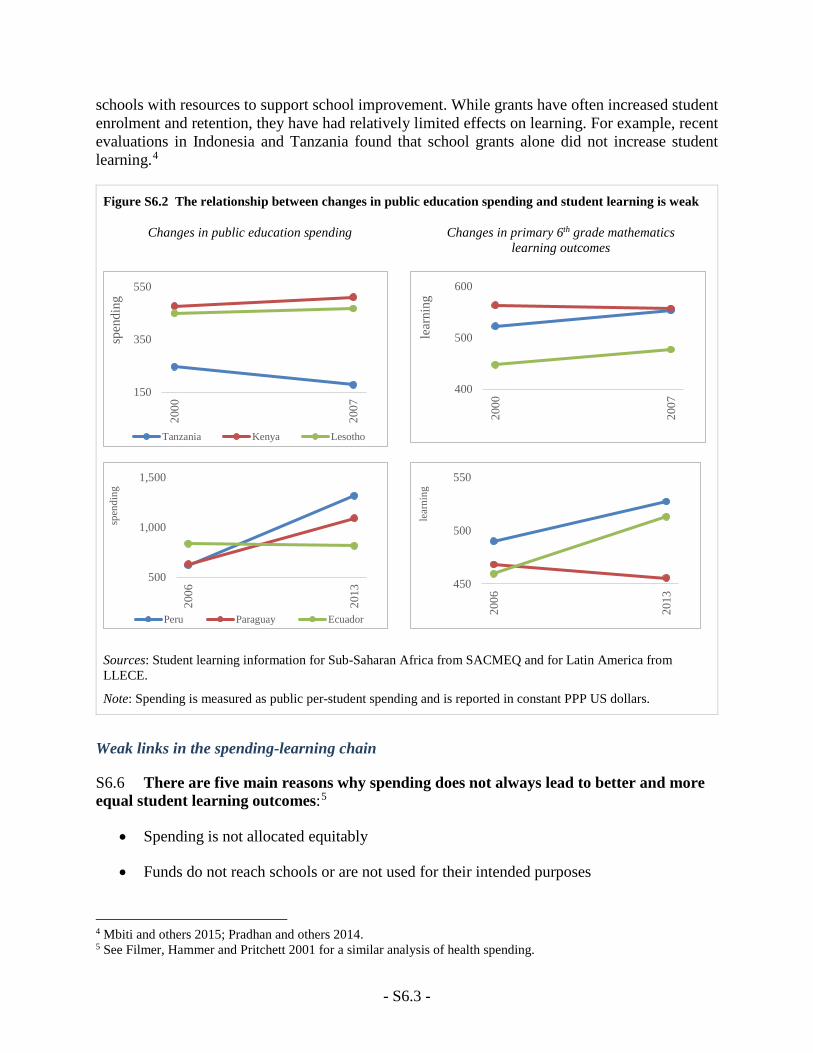
- S6.3 -
schools with resources to support school improvement. While grants have often increased student enrolment and retention, they have had relatively limited effects on learning. For example, recent evaluations in Indonesia and Tanzania found that school grants alone did not increase student learning.4
Figure S6.2 The relationship between changes in public education spending and student learning is weak
Changes in public education spending Changes in primary 6th grade mathematics learning outcomes
Sources: Student learning information for Sub-Saharan Africa from SACMEQ and for Latin America from LLECE.
Note: Spending is measured as public per-student spending and is reported in constant PPP US dollars.
Weak links in the spending-learning chain
S6.6 There are five main reasons why spending does not always lead to better and more equal student learning outcomes:5
• Spending is not allocated equitably
• Funds do not reach schools or are not used for their intended purposes
4 Mbiti and others 2015; Pradhan and others 2014. 5 See Filmer, Hammer and Pritchett 2001 for a similar analysis of health spending.
150
350
550
2000
2007
spen
ding
Tanzania Kenya Lesotho
400
500
600
2000
2007
lear
ning
500
1,000
1,500
2006
2013
spen
ding
Peru Paraguay Ecuador
450
500
55020
06
2013
lear
ning
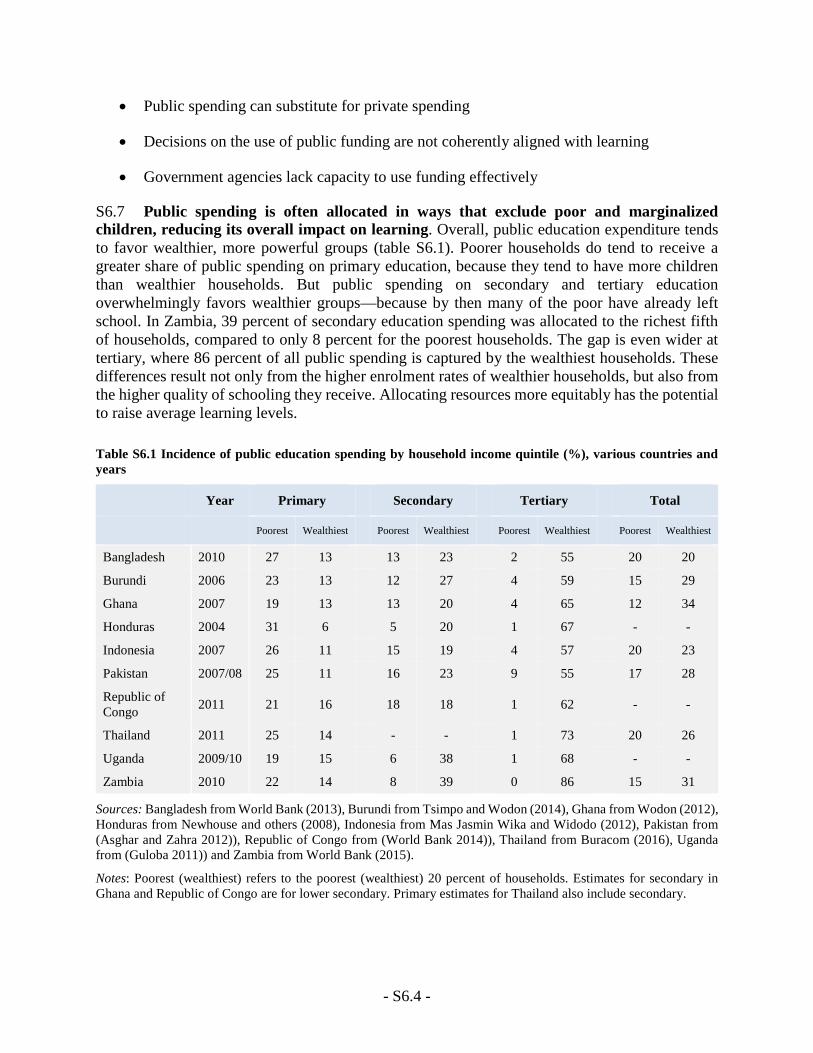
- S6.4 -
• Public spending can substitute for private spending
• Decisions on the use of public funding are not coherently aligned with learning
• Government agencies lack capacity to use funding effectively
S6.7 Public spending is often allocated in ways that exclude poor and marginalized children, reducing its overall impact on learning. Overall, public education expenditure tends to favor wealthier, more powerful groups (table S6.1). Poorer households do tend to receive a greater share of public spending on primary education, because they tend to have more children than wealthier households. But public spending on secondary and tertiary education overwhelmingly favors wealthier groups—because by then many of the poor have already left school. In Zambia, 39 percent of secondary education spending was allocated to the richest fifth of households, compared to only 8 percent for the poorest households. The gap is even wider at tertiary, where 86 percent of all public spending is captured by the wealthiest households. These differences result not only from the higher enrolment rates of wealthier households, but also from the higher quality of schooling they receive. Allocating resources more equitably has the potential to raise average learning levels.
Table S6.1 Incidence of public education spending by household income quintile (%), various countries and years
Year Primary Secondary Tertiary Total
Poorest Wealthiest Poorest Wealthiest Poorest Wealthiest Poorest Wealthiest
Bangladesh 2010 27 13 13 23 2 55 20 20
Burundi 2006 23 13 12 27 4 59 15 29
Ghana 2007 19 13 13 20 4 65 12 34
Honduras 2004 31 6 5 20 1 67 - -
Indonesia 2007 26 11 15 19 4 57 20 23
Pakistan 2007/08 25 11 16 23 9 55 17 28
Republic of Congo 2011 21 16 18 18 1 62 - -
Thailand 2011 25 14 - - 1 73 20 26
Uganda 2009/10 19 15 6 38 1 68 - -
Zambia 2010 22 14 8 39 0 86 15 31
Sources: Bangladesh from World Bank (2013), Burundi from Tsimpo and Wodon (2014), Ghana from Wodon (2012), Honduras from Newhouse and others (2008), Indonesia from Mas Jasmin Wika and Widodo (2012), Pakistan from (Asghar and Zahra 2012)), Republic of Congo from (World Bank 2014)), Thailand from Buracom (2016), Uganda from (Guloba 2011)) and Zambia from World Bank (2015).
Notes: Poorest (wealthiest) refers to the poorest (wealthiest) 20 percent of households. Estimates for secondary in Ghana and Republic of Congo are for lower secondary. Primary estimates for Thailand also include secondary.
- S6.5 -
S6.8 Public funds sometimes fail to reach schools or are not used as intended. In 2013/14, almost a third of school capitation grants failed to reach Zambian primary schools.6 In the Philippines, about a quarter of similar funds in 2013 were not delivered to elementary and high schools.7 In both cases, funds were diverted for other uses including to fund district-level operating costs. In the Philippines, schools that served poorer students received a smaller share of their total allocation than schools serving wealthier students. Even when resources are delivered to schools, they are sometimes not used. In Sierra Leone, a 2008 program successfully increased delivery of textbooks to schools—but the textbooks had no impact on learning, because they were stored as a hedge against future shortfalls rather than distributed to students.8
S6.9 Household spending can also affect the link between public spending and outcomes. Taking account of household spending on education can alter patterns of overall education across countries. Public education expenditure in Nepal as a percentage of GDP is much lower than government spending in Vietnam. However, when all public and private spending on education is taken into account, spending in Nepal is much higher.9 Households can also react to increases in public education spending by lowering their own contributions. For example, the introduction of school grants in India and Zambia had no effect on learning, because parents lowered their own financial support in anticipation of increased government funding.10
S6.10 Decisions on how to use public resources often lack a coherent alignment with learning. The evidence base on ways to improve learning is growing but the gap between the emerging principles and practice in many countries is wide. Furthermore, ensuring that the mix of inputs and interventions that are funded work together well is also important. Many education systems find this difficult. For example, sometimes more classrooms are built, but there are insufficient funds to hire the teachers necessary to use them. In other cases, teachers are present in classrooms, but a lack of learning materials makes teaching very difficult. Improving coherence is not just about the mix of inputs but is also about systems that manage these inputs. In Tanzania, grants given to schools were ineffective on their own, but combining grants with teacher incentives ensured that they were used effectively to raise student learning.11 In Indonesia, school grants improved learning only when they were combined with measures to link school committees with village authorities.12
S6.11 Government agencies responsible for managing education often lack capacity to use resources effectively. The Philippines has recently embarked on an ambitious education reform backed up with significant increases in public investment. A central element of the program has been the introduction of two additional years of secondary education. This has required the rehabilitation and expansion of school infrastructure to provide the necessary places for senior high school. Despite a nineteen-fold increase in the infrastructure budget between 2005 and 2015, lack of government capacity to manage such a massive school building program has meant that a
6 World Bank 2016. 7 World Bank 2016. 8 Sabarwal and others 2014. 9 IIEP 2016. 10 Das and others 2013. 11 Mbiti and others 2015. 12 Pradhan and others 2014.
- S6.6 -
large share of the resources remained unspent. In 2014, only 64 percent of the infrastructure budget was committed. And even where classrooms were built, school principals have been largely unsatisfied with their quality.13
Spending to improve learning
S6.12 Achieving education goals, whether national or global, will certainly require more spending in the coming decades. The Education Commission estimates that low- and middle-income countries will need to increase spending by 117 percent between 2015 and 2030 to get most children to complete primary and secondary education with minimum levels of learning, as the Sustainable Development Goals require.14 Reliably estimating such global costs is difficult, since doing so requires accurate information on many aspects of country systems that are often unavailable. It also requires making assumptions—for example, about the optimal class size—that, while valid for some countries, may not apply in others. Notwithstanding these difficulties, exercises of this kind offer useful information on what school expansion of reasonable quality might cost. They underline that even with greater efficiencies, it will be impossible to extend schooling for hundreds of millions of students without investing more in education.
S6.13 The key will be to use those additional resources in ways that improve learning, especially for disadvantaged children. Costing exercises are sometimes misinterpreted as implying that more spending is all that is needed. But because there is nothing inevitable about spending leading to better outcomes, spending better will also be essential—as the Education Commission emphasizes. When education is funded using resources diverted from other pressing public needs such as health or infrastructure, or funded through debt to be repaid by the next generation, it is crucial that spending be oriented toward what will improve learning for all. How to do this most effectively is the focus of this World Development Report.
S6.14 Spending more can be an important first step to spending better—but again, increasing spending alone is not sufficient to improve learning. The politics of education reform sometimes require compensating stakeholders who might lose out or spending more to lay the foundations for future reform. For example, addressing the low pay of teachers in Peru was an important prerequisite for introducing reforms, such as linking teacher career paths to performance, that underpinned Peru’s improvements in learning outcomes.15 However, in other cases strategies of this kind have worked less well. A 2006 education finance law in Argentina aimed at reversing declines in quality led to a tripling of education spending between 2003 and 2013. The new resources were used to increase teacher hiring, raise teacher pay, and improve school infrastructure. Despite these improvements in inputs, learning outcomes have improved only marginally in recent years and are still below 2003 levels.16 These experiences highlight the need to strengthen the links in the spending-learning chain if more spending is to lead to better learning outcomes.
13 World Bank 2016. 14 Only includes projected costs of primary and secondary education. See Table 3 of Education Commission 2016. 15 Bruns and Schneider 2016. 16 De Hoyos and others 2015.
- S6.7 -
References
Altinok, Nadir. 2010. "Do School Resources Increase School Quality?".
Asghar, Zahid, and Mudassar Zahra. 2012. "A Benefit Incidence Analysis of Public Spending on Education in Pakistan Using Pslm Data." The Lahore Journal of Economics 17(2): 111-36.
Bruns, B, and Ben Ross Schneider. 2016. "Managing the Politics of Quality Reforms in Education. Policy Lessons from Global Experience." Background paper. Washington DC: The Education Comission.
Buracom, Ponlapat. 2016. "The Distributional Effects of Social Spending in Thailand: Evidence from a New Database." Asian Politics & Policy 8(2): 263-79.
Das, J, S Dercon, J Habyarimana, P. Krishnan, K Muralidharan, and V Sundararaman. 2013. "School Inputs, Household Substitution and Test Scores." Applied Economics 5(2): 29-57.
De Hoyos, Rafael, Peter A Holland, and Sara Troiano. 2015. "Understanding the Trends in Learning Outcomes in Argentina, 2000 to 2012." The World Bank.
Education Commission. 2016. "The Learning Generation: Investing in Education for a Changing World."
Glewwe, Paul W, Eric A Hanushek, Sarah D Humpage, and Renato Ravina. 2011. "School Resources and Educational Outcomes in Developing Countries: A Review of the Literature from 1990 to 2010." National Bureau of Economic Research.
Guloba, Madina. 2011. "Public Expenditure in the Education Sector in Uganda: A Benefit Incidence Analysis (Phase 2)." Research Series No. 110. Kampala: Economic Policy Research Centre.
IIEP. 2016. "Who Pays for What in Education? The Real Costs Revealed through National Education Accounts."
Mas Jasmin Wika, Gek Sintha, and Tri Widodo. 2012. "Distribution of Government Spending on Education in Indonesia." University Library of Munich, Germany.
Mbiti, Isaac, Karthik Muralidharan, and Youdi Schipper. 2015. "Inputs, Incentives, and Complementarities in Primary Education: Experimental Evidence from Tanzania." process.
Newhouse, David Locke, Irene Yackovlev, and Mr Robert Gillingham. 2008. The Distributional Impact of Fiscal Policy in Honduras. International Monetary Fund.
Pradhan, Menno, Daniel Suryadarma, Amanda Beatty, Maisy Wong, Arya Gaduh, Armida Alisjahbana, and Rima Prama Artha. 2014. "Improving Educational Quality through Enhancing Community Participation: Results from a Randomized Field Experiment in Indonesia." American Economic Journal. Applied Economics 6(2): 105.
Sabarwal, Shwetlena, David K Evans, and Anastasia Marshak. 2014. "The Permanent Input Hypothesis: The Case of Textbooks and (No) Student Learning in Sierra Leone." World Bank Policy Research Working Paper (7021).
Tsimpo, Clarence, and Quentin Wodon. 2014. "Measuring the Benefit Incidence of Public Spending for Education in Burundi." UNESCO Institute for Statistics and UNICEF.
Wodon, Quentin. 2012. Improving the Targeting of Social Programs in Ghana. World Bank Publications.
World Bank. 2013. "Bangladesh Education Sector Review - Seeding Fertile Ground: Education That Works for Bangladesh." Washington D.C.: The World Bank Group.
———. 2013. "Spending More or Spending Better: Improving Education Financing in Indonesia. Education Public Expenditure Review." Jakarta: The World Bank.
———. 2014. "Republic of Congo: Enhancing Efficiency in Education and Health Public
Spending for Improved Quality Service Delivery for All." Washington, DC: World Bank Group.
———. 2015. "Education Public Expenditure Review in Zambia." Washington D.C.: World Bank.
———. 2016. "Assessing Basic Education Service Delivery in the Philippines : Public Education Expenditure Tracking and Quantitative Service Delivery Study." Washington D.C.: The World Bank Group.
———. 2016. "Education Sector Public Expenditure Tracking and Service Delivery Survey in Zambia."

- 10.1 -
Chapter 10 Unhealthy politics drives misalignments
Contents
Unhealthy politics can intensify misalignments in education systems ......................................................... 1
Multiple actors and interests: Pulling the system out of alignment at each step of the policy cycle ........... 5
Setting policy goals ................................................................................................................................... 5
Designing policies ..................................................................................................................................... 6
Implementing policies ............................................................................................................................... 6
Evaluating policies .................................................................................................................................... 7
Sustaining policy reforms ......................................................................................................................... 8
Trapped in low-accountability equilibriums ................................................................................................. 9
Unhealthy politics can intensify misalignments in education systems when the vested interests of stakeholders divert systems away from learning. This can happen at various stages—from setting policy goals to designing, implementing, evaluating, and sustaining reforms. Despite committed actors, education systems often remain trapped.
10.1 Education systems are complex. Aligning an education system’s goals, financing, and incentives with student learning is difficult for technical reasons. But there are also political reasons systems don’t prioritize student learning. Political impetus to fix misalignments can help achieve important educational objectives—as in Chile, England, and India (see chapter 11)—but unhealthy politics can make things worse. Too often education interventions, whether big reforms or day-to-day implementation, are compromised because powerful individuals or groups can make others act in ways that serve private interests rather than the collective good.1 Powerful actors frequently benefit from the status quo and devise mechanisms to preserve it, regardless of the impact on system performance. These mechanisms result in actors being trapped in low-learning equilibriums.
Unhealthy politics can intensify misalignments in education systems
10.2 Many education systems encounter political impediments and rent-seeking, making alignment much harder to achieve. Consider the following:
• Using computers to educate students requires difficult technical decisions on program design. But even when there is consensus on technical design, students may not benefit. For instance, in 1996–97 the superintendent of New York City’s District 29 rigged a $6 million contract, awarding it to a computer company affiliated with a politically connected property developer. In return the company gave the superintendent expensive gifts—while delivering archaic or nonfunctioning computers to students. Teachers had been counting
1 World Bank 2016.
- 10.2 -
on decent computers to help their students in math; without the computers, students lost out.2
• In 2009 Mexico’s federal government introduced a plan for competitive recruitment of teachers, whereby all candidates were required to take a test covering content knowledge, pedagogical mastery and ethics. Designing the tests was technically difficult. But the technical challenges paled next to the political impediments created by local affiliates of Mexico’s 1.4-million-member teacher union, the Sindicato Nacional de Trabajadores de la Educación (SNTE), who saw the opportunity for patronage-driven hiring vanish. Due to strong opposition from SNTE, the reform was diluted, made applicable only to a small pool of vacancies. Estimates suggest that up to 85 percent of hiring in 2010 was discretionary versus competitive. Recent evidence shows that the teachers hired through discretionary methods were much less effective at improving student learning than those hired competitively.3
• www.vyapam.nic.in is the site of the government-run professional examination board for Madhya Pradesh, India. Vyapam conducts large-scale entrance tests for admission into courses such as medicine and recruitment into state government jobs, such as the police. Designing entrance tests and ranking candidates is technically challenging: there can be more than 100,000 candidates. But rent-seeking undermined the goal of fair, transparent admissions. In 2013 an independent probe unearthed a multibillion-dollar scam where senior politicians and government officials had set up a system allowing unqualified candidates to pay bribes, often to middlemen, to get high rankings in entrance tests.4
10.3 Education systems involve many stakeholders with multiple, often contradictory, interests.5 Education systems are not just about students, teachers, or principals. They also involve politicians, bureaucrats, the judiciary, private players, and more. Participants linked to these institutions have a vested interest in how the system works, including its structure and funding. A textbook supplier may want to provide a quality product, but may also be concerned about profits. A politician might want to make teachers accountable, but also realizes the electoral risks of teacher opposition. A bureaucrat might support meritocratic admissions, but may also accept a “token of appreciation” for ensuring the admission of an acquaintance’s child to a desirable school. A parent might want to complain against a teacher, but worries that her child could suffer retaliation.
10.4 Vested interests are not confined to private or rent-seeking interests. Actors in education systems are often driven by their values or ideology, given the difficulty of defending or opposing policies when consequences are not immediately clear. Examples include a commitment to public schools versus choice, secular education versus religious, and accountability for test scores versus process. In addition, education systems can be used by dominant ethnic
2 Segal 2005. 3 Estrada 2016; Bruns and Luque 2014. 4 https://www.theguardian.com/world/2015/dec/17/the-mystery-of-indias-deadly-exam-scam; http://www.hindustantimes.com/bhopal/25-mystery-deaths-and-2-000-arrests-all-about-mp-s-vyapam-scam/story-Y3dLEQdkEsVyCwuPQXxaXI.html. 5 Grindle 2004; Moe and Wiborg 2017.
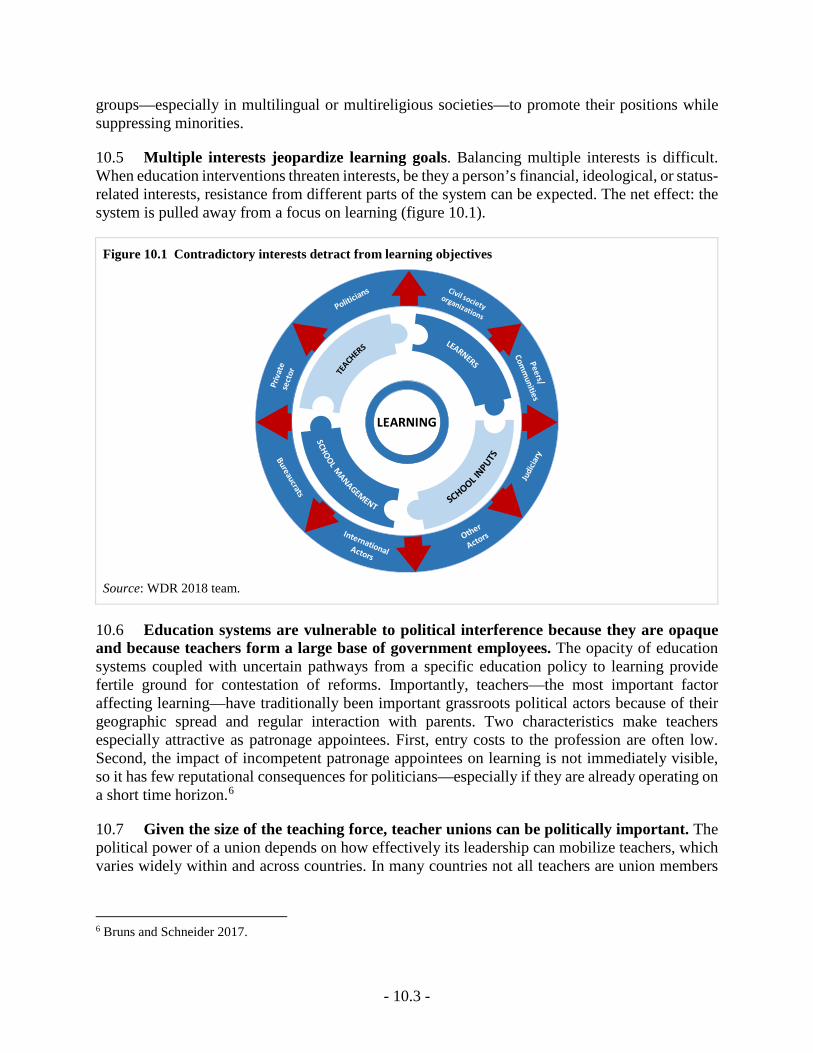
- 10.3 -
groups—especially in multilingual or multireligious societies—to promote their positions while suppressing minorities.
10.5 Multiple interests jeopardize learning goals. Balancing multiple interests is difficult. When education interventions threaten interests, be they a person’s financial, ideological, or status-related interests, resistance from different parts of the system can be expected. The net effect: the system is pulled away from a focus on learning (figure 10.1).
Figure 10.1 Contradictory interests detract from learning objectives
Source: WDR 2018 team.
10.6 Education systems are vulnerable to political interference because they are opaque and because teachers form a large base of government employees. The opacity of education systems coupled with uncertain pathways from a specific education policy to learning provide fertile ground for contestation of reforms. Importantly, teachers—the most important factor affecting learning—have traditionally been important grassroots political actors because of their geographic spread and regular interaction with parents. Two characteristics make teachers especially attractive as patronage appointees. First, entry costs to the profession are often low. Second, the impact of incompetent patronage appointees on learning is not immediately visible, so it has few reputational consequences for politicians—especially if they are already operating on a short time horizon.6
10.7 Given the size of the teaching force, teacher unions can be politically important. The political power of a union depends on how effectively its leadership can mobilize teachers, which varies widely within and across countries. In many countries not all teachers are union members
6 Bruns and Schneider 2017.
LEARNING
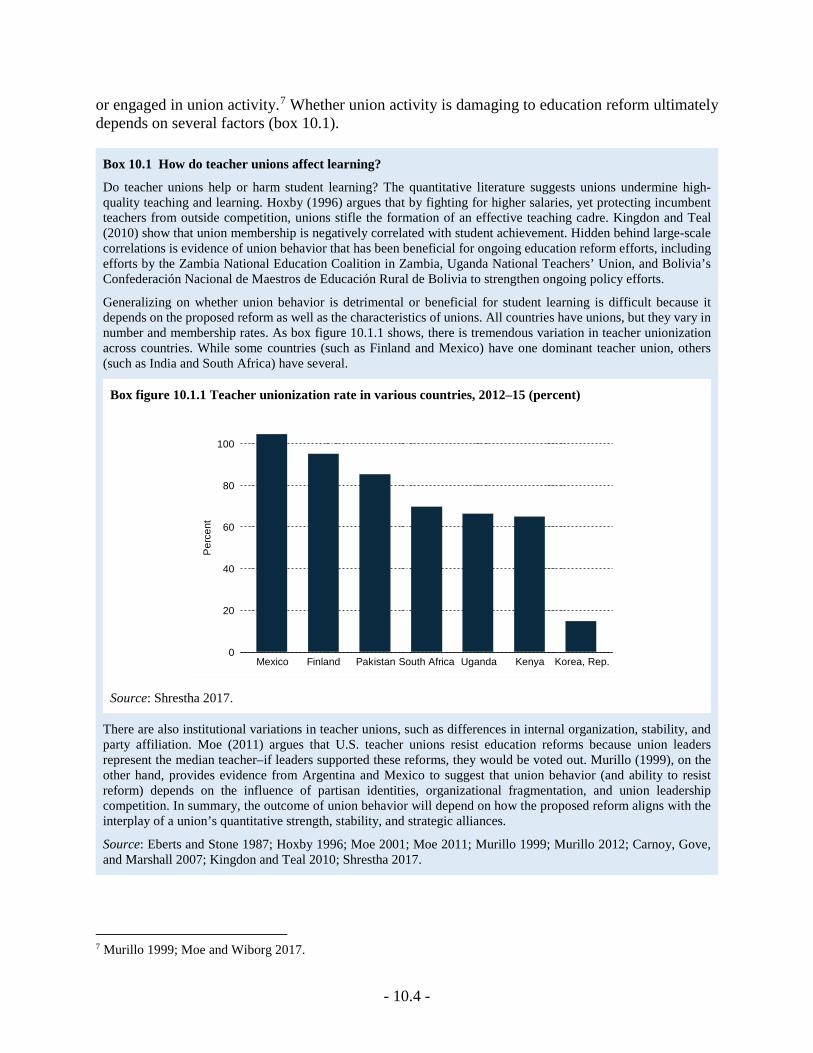
- 10.4 -
or engaged in union activity.7 Whether union activity is damaging to education reform ultimately depends on several factors (box 10.1).
Box 10.1 How do teacher unions affect learning?
Do teacher unions help or harm student learning? The quantitative literature suggests unions undermine high-quality teaching and learning. Hoxby (1996) argues that by fighting for higher salaries, yet protecting incumbent teachers from outside competition, unions stifle the formation of an effective teaching cadre. Kingdon and Teal (2010) show that union membership is negatively correlated with student achievement. Hidden behind large-scale correlations is evidence of union behavior that has been beneficial for ongoing education reform efforts, including efforts by the Zambia National Education Coalition in Zambia, Uganda National Teachers’ Union, and Bolivia’s Confederación Nacional de Maestros de Educación Rural de Bolivia to strengthen ongoing policy efforts.
Generalizing on whether union behavior is detrimental or beneficial for student learning is difficult because it depends on the proposed reform as well as the characteristics of unions. All countries have unions, but they vary in number and membership rates. As box figure 10.1.1 shows, there is tremendous variation in teacher unionization across countries. While some countries (such as Finland and Mexico) have one dominant teacher union, others (such as India and South Africa) have several.
Box figure 10.1.1 Teacher unionization rate in various countries, 2012–15 (percent)
Source: Shrestha 2017.
There are also institutional variations in teacher unions, such as differences in internal organization, stability, and party affiliation. Moe (2011) argues that U.S. teacher unions resist education reforms because union leaders represent the median teacher–if leaders supported these reforms, they would be voted out. Murillo (1999), on the other hand, provides evidence from Argentina and Mexico to suggest that union behavior (and ability to resist reform) depends on the influence of partisan identities, organizational fragmentation, and union leadership competition. In summary, the outcome of union behavior will depend on how the proposed reform aligns with the interplay of a union’s quantitative strength, stability, and strategic alliances.
Source: Eberts and Stone 1987; Hoxby 1996; Moe 2001; Moe 2011; Murillo 1999; Murillo 2012; Carnoy, Gove, and Marshall 2007; Kingdon and Teal 2010; Shrestha 2017.
7 Murillo 1999; Moe and Wiborg 2017.
0
20
40
60
80
100
Per
cent
Mexico Finland Pakistan South Africa Uganda Kenya Korea, Rep.
- 10.5 -
Multiple actors and interests: Pulling the system out of alignment at each step of the policy cycle
10.8 Personal interests influence reform at every step. Vested interests—teachers, principals, bureaucrats, politicians, parents, students, judiciary, civil society organizations, the private sector—are influential at every step of the education policy cycle. Broadly, these stages are: setting policy goals, designing policies, implementing policies, evaluating policies, and sustaining policy reforms. These problems are magnified in conflict settings (box 10.2).
Box 10.2 How politics can derail learning in conflict-affected states
Conflict-affected regions face important political economy constraints in developing their education systems. Violent conflict hampers learning in an immediate sense, when schools, students and teachers are targeted—and also over the long term, when income or national/regional security divert attention and resources from schools. The “security first” approach often hides the vested interests in the security sector—powerful military and political actors, as well as external political interests—with agendas that overshadow development.
Policy in politically weak or fragile conflict-affected states can be influenced by both external and internal power relations. External aid agencies are often handicapped by the difficulty of delivering in violent or insecure contexts. This often leads to an emphasis on generalized educational frameworks rather than context specific ones, given the challenge of engaging with local differences during violent conflict. Domestic considerations create challenges as well, such as decisions about the medium of instruction in schools. For instance, approaches that guarantee the right of all children to be educated in their ‘own’ language can be used by vested groups to segregate communities, as happened in Bosnia and Herzegovina in the 1990s. Political-economy challenges can also occur within healthy democracies with conflict regions. Insurgency-affected parts of Chhattisgarh, India have been isolated from the national education system. This affects implementation and sustainability in several ways, importantly through an overall lack of funding, payment delays and interruption of teachers’ pay. Reduced funding makes it easier to employ patronage hires, since less qualified and often uncertified teachers step in to replace trained teachers.
Source: Rose and Greeley 2006; Bensalah 2002; Novelli and others 2014; Shields and Rappleye 2008; Magill 2010; De Herdt, Titeca, and Wagemakers 2010; Mosselson, Wheaton, and Frisoli 2009.
Setting policy goals
10.9 In many cases, policy choices are not driven by their effectiveness in improving learning. More often, they are guided by the interests of powerful actors. Policies to hire teachers tend to be popular with politicians, teachers, and parents because they bring visible, immediate benefits. In a diverse range of countries (Cambodia, Colombia, Mozambique) policymakers have invested in building preschools instead of less visible but more effective process-oriented early childhood initiatives, such as programs to improve parent-child interactions. Until recently, it was much easier to unite elites around the need for mass education versus raising educational standards in schools in Bangladesh.8
10.10 It is much harder to adopt a policy goal that threatens or reconfigures jobs—as is true for most quality-enhancing education policies. For instance, an alternative to the politically popular policy of reducing class size would be teacher performance appraisal accompanied by tools to help teachers improve. Yet such reforms could expose poorly performing teachers, so they rarely reach the policy table. Other policies that threaten the elimination of teaching jobs include
8 Hossain and others 2017.
- 10.6 -
school consolidation or closing. Such policies have been difficult to implement because parental support for local schools has made it politically unfeasible to close small, high-cost rural schools.9 In Bulgaria school principals have been reluctant to let go of teachers despite declining school-age populations. In several countries strong teacher unions have prevented large-scale teacher redundancies.10
Designing policies
10.11 Decentralization policies delegate tasks instead of authority. Even when a policy’s goal is to improve student learning, its final design often reflects what powerful interests want, thereby defeating the goal of learning. Decentralization policies aim to increase policy responsiveness and accountability, but delegate accountability for results without the authority or resources to achieve them. In Pakistan the 18th Amendment promotes decentralization, but provincial governments depend on resource transfers from the federal government to fund operations, constraining what they can do.11 Decentralization reforms in other countries have faced similar problems.12 Limiting the power of lower units of government is no accident. Powerful local governments, being closer to the people, threaten the political power of more distant governments. At the same time, local governments may also be unwilling to assume greater responsibility or adopt national norms, for instance on the inclusion of marginalized groups.
Implementing policies
10.12 Policymakers may face little resistance when signing off on a policy, but implementation can be compromised if powerful interests are threatened. Policies designed to measure teacher performance have been particularly difficult to implement. In 2000 South Africa’s (then) Department of Education introduced the National Policy on Whole-School Evaluation to establish standardized instruments and procedures for monitoring school performance and establishing the support needs of schools.13 Though the policy was meant to be supportive, premised on building collaborations and mentorship, the South African Democratic Teachers’ Union—the country’s largest—remained opposed to it. Many of the union’s chapters blocked the adoption of the policy in schools in their area. A similar situation occurred in Mexico in 2012.14
10.13 Well-intentioned reforms may alter the legal entitlements of individuals, who understandably turn to the courts for redressal. But when that happens, reforms risk being stalled. In Peru unions resisted a new law on teacher evaluations by challenging its constitutionality.15 The court process delayed implementation of the first round of teacher evaluations. Though the court eventually upheld the law, for political reasons the union was given a major concession: the law applied only to newly hired teachers. Similarly, in 2002 teachers in
9 Forgy 2009. 10 Forgy 2009; Pepinsky, Pierskalla and Sacks 2017. 11 Dundar and others 2014. 12 Dundar and others 2014; Rosser and Fahmi 2016. 13 Taylor, Muller and Vinjevold 2003. 14 Bruns and Luque 2014. 15 Bruns and Luque 2014.
- 10.7 -
Andhra Pradesh, India stalled implementation of a policy on teacher transfers by filing a court case.16
10.14 Parents can also make it difficult to implement learning-focused policies. A common example pertains to parents helping children cheat on examinations, which makes it hard to measure student learning. In 2015 global media broadcast images of family members in Bihar, India handing cheat sheets to children inside a building taking exams.17 Perhaps parents are aware that their children have not learned much in school, making them uncompetitive against better-prepared or more affluent children. The problem is not limited to developing countries: Australia, the United Kingdom, and the United States have also seen scandals involving parents helping their children cheat.18
Evaluating policies
10.15 Indicators on the effectiveness of policies are chosen in a way that lets powerful groups off the hook. When a policy fails, actors such as front-line bureaucrats or principals may face repercussions regardless of whether failure was in their control. As a result, decisions on what to measure and track are less a reflection of what is valued by education systems and more a reflection of who is willing to be held accountable for what. India’s landmark Right to Education Act does not contain any measure of teacher effectiveness or student learning.19 Similarly, accreditation systems in higher education tend to focus on inputs (such as numbers of classrooms, amounts of equipment, or faculty-student ratios) instead of what students have learned and whether they are employed.20 Such an approach limits liability.
10.16 Data are easy to manipulate. Even when indicators track meaningful variables, data quality may be compromised. Data on outcomes can easily be gamed, with decisions on who collects data and how being often made using subjective criteria. Gaming can happen in several ways, including teachers misreporting student test scores, candidates hiring test-takers, parents facilitating cheating, and government officials encouraging teachers to modify test scores.21 In several countries comparisons of national enrollment data with household survey data find systematic discrepancies, with official statistics exaggerating progress.22
10.17 Even credible data can be misused. When Finland topped the PISA results in 2001, it came as a surprise. The country’s dominant teachers union used this finding to maintain the status quo in education, arguing that reforms were not needed in an already well-performing system.23 Although some reforms were subsequently introduced, change was limited, with unfortunate
16 Sharma and Ramachandran 2009. 17 Retrieved on January 11, 2017 from: http://www.cnn.com/2015/03/20/asia/india-cheating-parents-school-tests/ 18 Retrieved on April 17, 2017 from http://www.theaustralian.com.au/national-affairs/education/parents-and-tutors-are-helping-their-kids-cheat/news-story/ee9cbba022fbe122ea10f53017d243ee. 19 Government of India 2010. 20 Stevens and Kirst 2015. 21 Levitt and Dubner 2010; Jhingran 2016. 22 Sandefur and Glassman 2015. 23 Wiborg 2017.
- 10.8 -
consequences for Finland’s PISA record. Finland’s scores in PISA dropped in 2009, then even more in 2012—adding up to the largest decline for any Nordic country during that period.24
10.18 A subtler barrier to effective monitoring and evaluation is collecting mountains of data, but not in a format that facilitates decision-making. In India there are many efforts to collect data on indicators, creating the illusion of being actively engaged in data-driven decision-making to improve school quality.25 By the time data entry is completed, it is time for the next round of data collection. No serious analysis is conducted, nor is feedback provided to schools. Such instances devalue the importance of data in decision-making.
Sustaining policy reforms
10.19 Even when difficult reforms are implemented, they can be undone. Reversal can be incremental, with policymakers softening elements to appease specific groups. In the late 1990s the government of Madhya Pradesh, India started hiring teachers from the newly created shiksha karmi cadre, under which all new teachers were to be locally recruited and put on 10-month contracts. In response, teacher applicants filed court cases arguing that the policy violated their constitutional rights, which emphasize that no citizen can be ineligible for office based on criteria such as place of birth. Burdened with litigation and union pressure, the government redesigned the policy, making concessions on local recruitment and qualifications.26 Similarly, reforms pertaining to teacher career tracks introduced in 2009 in São Paulo, Brazil were gradually undone by 2011 under a new education minister.27
10.20 Reversal can also be sudden. In Ghana an Early Childhood Care and Development body was set up under the office of the president with high-level support. But a change in administration put the office under the Ministry of Gender, Children, and Social Protection, lowering the priority and visibility given to early childhood issues.28 In Venezuela decades of reforms that had created a strong higher education system were reversed when a new populist government set the goal of universalizing higher education. That effort, without prepared students, adequate faculty, or appropriate infrastructure, has weakened the system.29
10.21 These cases raise two important issues. First, why do parents and students have such limited voice in influencing vested interests that jeopardize quality-enhancing reforms? It could be that those most likely to benefit from reforms—like parents or students—are often poorly organized. Further, the immediate gains of a particular policy tend to be fuzzy. At the same time, the potential ramifications on their child of opposing a teacher or politician could be formidable. In contrast, those who stand to lose from reforms tend to be better aware of their losses and, in many case, better organized for collective action.30
24 Sahlgren 2015. 25 Jhingran 2016. 26 Sharma 1999. 27 Bruns and Luque 2014. 28 Independent Evaluation Group 2015. 29 Albornoz 2015. 30 Grindle 2004.
- 10.9 -
10.22 Second, not all teachers are interested only in jobs and salaries—and not all politicians or bureaucrats are attracted to patronage and clientilism. For every teacher, bureaucrat, politician, judge, or businessperson who jeopardizes learning, there are several who feel deeply accountable for student learning and act to strengthen education systems. Yet systems tend to gravitate to less effective equilibriums. Why?
Trapped in low-accountability equilibriums
10.23 The formal rules of the game reflect power asymmetries. When specific policy goals are chosen, when finance is allocated to certain tasks, when teachers unions bargain for concessions, preexisting power asymmetries and struggles are brought to the fore.
10.24 But such decisions also reveal the operations of informal contracts that determine which formal rules are chosen or followed. Unwritten codes of conduct derive from the values, expectations, and cultural norms in a social setting, and are important in determining the extent, nature, and strength of politics in that setting.31 In Indonesia, where older colleagues are treated with considerable courtesy, school mergers were often delayed informally until principals who stood to lose their jobs retired.32 In rural Rajasthan, India the norm is that female teachers do not directly pay bribes if they need a favor, such as facilitating a transfer. This does not mean female teachers fail to get the transfer they seek; they simply go through a male relative.33
10.25 The widespread operation of informal networks reveals an uneasy relationship with trust within systems. Unwritten codes of conduct between individuals can thrive only if there is sufficient trust between individuals. Each must trust that the other will behave as expected. Yet, as individuals cultivate personalized trust-based relationships, overall trust in the system suffers.34
10.26 As systems grow more complex and the number of actors and interactions increases, uncertainty multiplies. Trusting others becomes increasingly difficult. Creating reciprocal obligations helps manage the uncertainty.35 These obligations do not need to be spelled out; the social setting ensures they are understood. In Indonesia teachers were required to display “mono-loyalty” to the state and teach compulsory courses in the state ideology, Pancasila.36 If they did not, they knew they risked demotion or transfer to schools in unattractive areas. In SNTE-dominant parts of Mexico, teachers knew that if they did not support SNTE, they risked unfavorable transfers or being sidelined.
10.27 Reciprocal obligations complicate accountability. Power relations between entities and groups depend on context. One group may be more dependent on another—and therefore less powerful—in one context. But in another context, dependence patterns could reverse. In 2003, when teachers in Rajasthan threatened the ruling party with electoral sabotage, they were the powerful ones—with the ruling party dependent on them for victory. Concurrently, in another
31 Bailey 1969; Easton 1979; Greif 2007; North 1991. 32 Rosser and Fahmi 2016. 33 Béteille 2015. 34 Burns, Köster and Fuster 2016; Gambetta 1988. 35 Gouldner 1960. 36 Bjork 2006.
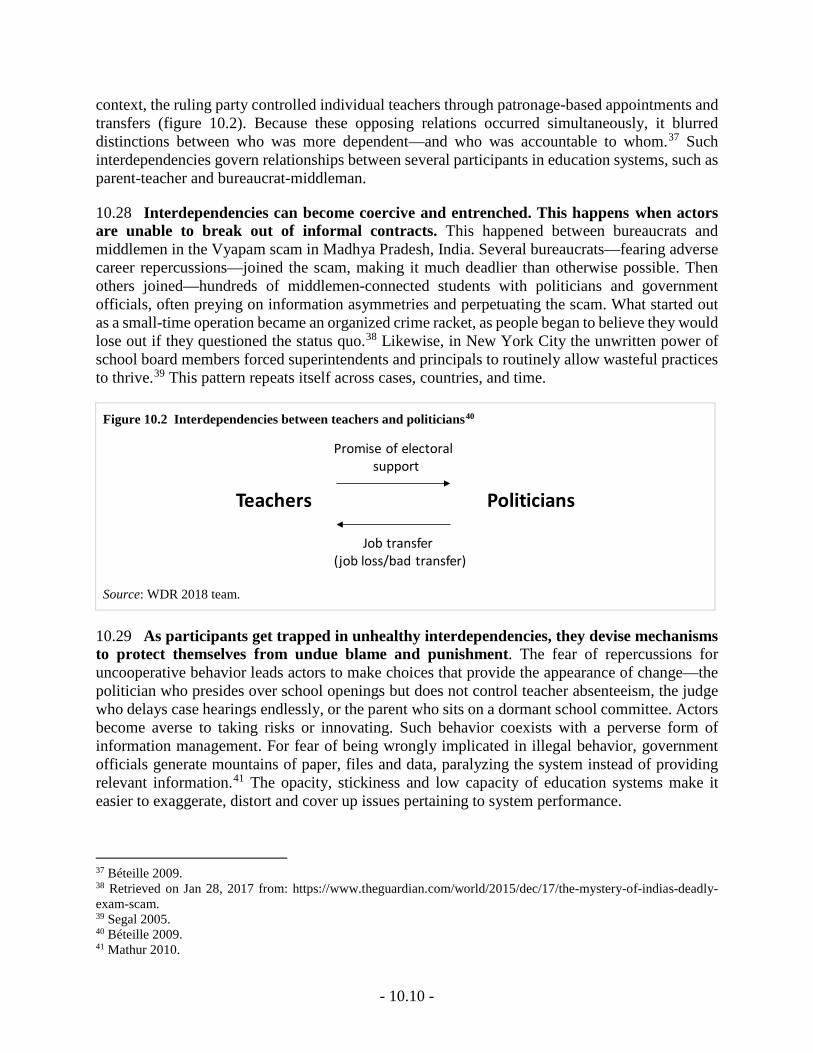
- 10.10 -
context, the ruling party controlled individual teachers through patronage-based appointments and transfers (figure 10.2). Because these opposing relations occurred simultaneously, it blurred distinctions between who was more dependent—and who was accountable to whom.37 Such interdependencies govern relationships between several participants in education systems, such as parent-teacher and bureaucrat-middleman.
10.28 Interdependencies can become coercive and entrenched. This happens when actors are unable to break out of informal contracts. This happened between bureaucrats and middlemen in the Vyapam scam in Madhya Pradesh, India. Several bureaucrats—fearing adverse career repercussions—joined the scam, making it much deadlier than otherwise possible. Then others joined—hundreds of middlemen-connected students with politicians and government officials, often preying on information asymmetries and perpetuating the scam. What started out as a small-time operation became an organized crime racket, as people began to believe they would lose out if they questioned the status quo.38 Likewise, in New York City the unwritten power of school board members forced superintendents and principals to routinely allow wasteful practices to thrive.39 This pattern repeats itself across cases, countries, and time.
Figure 10.2 Interdependencies between teachers and politicians40
Source: WDR 2018 team.
10.29 As participants get trapped in unhealthy interdependencies, they devise mechanisms to protect themselves from undue blame and punishment. The fear of repercussions for uncooperative behavior leads actors to make choices that provide the appearance of change—the politician who presides over school openings but does not control teacher absenteeism, the judge who delays case hearings endlessly, or the parent who sits on a dormant school committee. Actors become averse to taking risks or innovating. Such behavior coexists with a perverse form of information management. For fear of being wrongly implicated in illegal behavior, government officials generate mountains of paper, files and data, paralyzing the system instead of providing relevant information.41 The opacity, stickiness and low capacity of education systems make it easier to exaggerate, distort and cover up issues pertaining to system performance.
37 Béteille 2009. 38 Retrieved on Jan 28, 2017 from: https://www.theguardian.com/world/2015/dec/17/the-mystery-of-indias-deadly-exam-scam. 39 Segal 2005. 40 Béteille 2009. 41 Mathur 2010.
Teachers Politicians
Promise of electoral support
Job transfer (job loss/bad transfer)
- 10.11 -
10.30 Abdicating responsibility and avoiding blame erode an education system’s ability to function—perpetuating a low-accountability equilibrium. If a teacher, bureaucrat, judge, or politician does not cooperate with the status quo, they are likely to face considerable professional risk. The system leaves them little choice: they must conform. The problem is not limited to specific individuals, but arises from the multiple interests of actors, and underlying incentives in education systems. The accountability needed to ensure student learning becomes secondary.
10.31 This is the story of unhealthy politics.42 Healthy politics can generate the momentum for reform and deliver results for education outcomes.
42 Khemani and others 2016.
- 10.12 -
References
Albornoz, Orlando. 2015. "Recent Changes in Venezuelan Higher Education." International Higher Education (48).
Bailey, Frederick G. 1969. "Strategems and Spoils." A social anthropology of politics.
Bensalah, Kacem. 2002. "Guidelines for Education in Situations of Emergency and Crisis: Efa Strategic Planning." United Nations Educational, Scientific and Cultural Organization (UNESCO).
Béteille, Tara. 2009. Absenteeism, Transfers and Patronage: The Political Economy of Teacher Labor Markets in India. Stanford University.
———. 2015. "Fixers in India’s Teacher Labor Markets." Asian Survey 55(5): 942-68.
Bjork, Christopher. 2006. "Decentralisation in Education, Institutional Culture and Teacher Autonomy in Indonesia." In Decentralisation and Privatisation in Education, 133-50. Springer.
Bruns, Barbara, and Javier Luque. 2014. Great Teachers: How to Raise Student Learning in Latin America and the Caribbean. World Bank Publications.
Bruns, Barbara, and B Schneider. 2017. "Reforming Education Quality: Difficult Reforms Facing Disruptive Opponents." Paper presented at the Workshop on Political Economy of Education Reform, Mexico City, February 3-4, 2017.
Burns, T, F Köster, and M Fuster. 2016. Education Governance in Action. Paris: OECD.
Carnoy, Martin, Amber K Gove, and Jeffery H Marshall. 2007. Cuba's Academic Advantage: Why Students in Cuba Do Better in School. Stanford University Press.
De Herdt, Tom, Kristof Titeca, and Inge Wagemakers. 2010. "Making Investment in Education Part of the Peace Dividend in the Drc." Chronic Poverty Research Centre conference “Ten Years of War against Poverty,” Manchester, UK, September.
Dundar, Halil, Benoît Millot, Yevgeniya Savchenko, Harsha Aturupane, and Tilkaratne A Piyasiri. 2014. Building the Skills for Economic Growth and Competitiveness in Sri Lanka. World Bank Publications.
Easton, David. 1979. A Framework for Political Analysis. University of Chicago Press.
Eberts, Randall W, and Joe A Stone. 1987. "Teacher Unions and the Productivity of Public Schools." Industrial & Labor Relations Review 40(3): 354-63.
Estrada, Ricardo. 2016. "Crony Education: Teacher Hiring and Rent Extraction." European University Institute. https://docs.google.com/viewer?a=v&pid=sites&srcid=ZGVmYXVsdGRvbWFpbnxyaWNhcmRvYWVzdHJhZGFtYXJ0aW5lenxneDo2NDY5OTliNDZlZDAyNjlh.
Forgy, L. 2009. "Per Student Financing in Eca School Systems, No. 10250." Washington, DC: The World Bank.
Gambetta, Diego. 1988. "Trust: Making and Breaking Cooperative Relations."
Gouldner, Alvin W. 1960. "The Norm of Reciprocity: A Preliminary Statement." American sociological review: 161-78.
Government of India. 2010. "Right of Children to Free and Compulsory Education Act."
Greif, Avner. 2007. "The Path to Economic Development. Lessons from Medieval Trade." Cambridge: Cambridge University Press.
Grindle, Merilee Serrill. 2004. Despite the Odds: The Contentious Politics of Education Reform. Princeton University Press.
Hossain, Naomi, Mirza Hassan, Md Rahman, Khondokar Shakhawat Ali, and M Sajidul Islam. 2017. "The Problem with Teachers: The Political Settlement and Education Quality Reforms in Bangladesh."
Hoxby, Caroline Minter. 1996. "How Teachers' Unions Affect Education Production." The Quarterly Journal of Economics 111(3): 671-718.
Independent Evaluation Group. 2015. "World Bank Support to Early Childhood Development." Washington, DC: World Bank.
Jhingran, Dhir. 2016. "Data Collection Alone Cannot Improve Learning Outcomes in State-Run Schools." http://www.hindustantimes.com/analysis/data-collection-alone-cannot-improve-learning-outcomes-in-state-run-schools/story-xGSCZ8yXxMtElQ3qa8Cn4L.html.
Khemani, Stuti, Ernesto Dal Bó, Claudio Ferraz, Frederico S Finan, Corinne Louise Stephenson Johnson, Adesinaola Michael Odugbemi, Dikshya Thapa, and Scott David Abrahams. 2016. "Making Politics Work for Development : Harnessing Transparency and Citizen Engagement." Washington, D.C.: World Bank Group.
Kingdon, Geeta, and Francis Teal. 2010. "Teacher Unions, Teacher Pay and Student Performance in India: A Pupil Fixed Effects Approach." Journal of Development Economics 91(2): 278-88.
- 10.13 -
Levitt, Steven D, and Stephen J Dubner. 2010. Freakonomics. Sperling & Kupfer editori.
Magill, Clare. 2010. "Education and Fragility in Bosnia and Herzegovina." INEE and IIEP/UNESCO.
Mathur, Nayanika. 2010. "Paper Tiger?: The Everyday Life of the State in the Indian Himalaya." University of Cambridge.
Moe, Terry M. 2001. "Teachers Unions and the Public Schools." A primer on America’s schools: 151-83.
———. 2011. Special Interest: Teachers Unions and America's Public Schools. Brookings Institution Press.
Moe, Terry M, and Susanne Wiborg. 2017. The Comparative Politics of Education. Cambridge MA: Cambridge University Press.
Mosselson, Jacqueline, Wendy Wheaton, and Paul St John Frisoli. 2009. "Education and Fragility: A Synthesis of the Literature." Journal of Education for International Development 4(1): 1-17.
Murillo, M Victoria. 2012. "Teachers Unions and Public Education." Perspectives on Politics 10(01): 134-36.
Murillo, Maria Victoria. 1999. "Recovering Political Dynamics: Teachers' Unions and the Decentralization of Education in Argentina and Mexico." Latin American Politics and Society 41(1): 31-57.
North, Douglass С. 1991. "Institutions Stör." The Journal of Economic Perspectives 5(1): 97-112.
Novelli, Mario, Sean Higgins, Mehmet Ugur, and Oscar Valiente. 2014. "The Political Economy of Education Systems in Conflict-Affected Contexts: A Rigorous Literature Review."
Pepinsky, Thomas B, Jan H Pierskalla, and Audrey Sacks. 2017. "Bureaucracy and Service Delivery." Annual Review of Political Science 20(1).
Rose, Pauline, and Martin Greeley. 2006. "Education in Fragile States: Capturing Lessons and Identifying Good Practice." DAC Fragile States Group.
Rosser, Andrew J, and Mohamad Fahmi. 2016. "The Political Economy of Teacher Management in Decentralized Indonesia."
Sahlgren, GABRIEL HELLER. 2015. "Real Finnish Lessons." The True Story of an Education Superpower. London: Centre for Policy Studies.
Sandefur, Justin, and Amanda Glassman. 2015. "The Political Economy of Bad Data: Evidence from African Survey and Administrative Statistics." The Journal of Development Studies 51(2): 116-32.
Segal, Lydia G. 2005. Battling Corruption in America's Public Schools. Harvard University Press.
Sharma, Rashmi. 1999. "What Manner of Teacher: Some Lessons from Madhya Pradesh." Economic and Political Weekly: 1597-607.
Sharma, Rashmi, and Vimala Ramachandran. 2009. The Elementary Education System in India: Exploring Institutional Structures, Processes and Dynamics. Routledge.
Shields, Robin, and Jeremy Rappleye. 2008. "Differentiation, Development,(Dis) Integration: Education in Nepal's ‘People's War’." Research in Comparative and International Education 3(1): 91-102.
Shrestha, Unika. 2017. "Beyond Politics: The Role of Teachers’ Unions in Promoting Quality Education." Background Note for the World Development Report 2018.
Stevens, Mitchell, and Michael Kirst. 2015. Remaking College: The Changing Ecology of Higher Education. Stanford University Press.
Taylor, Nick, Johan Muller, and Penny Vinjevold. 2003. Getting Schools Working: Research and Systemic School Reform in South Africa. Pearson South Africa.
Wiborg, Susanne. 2017. "Teachers Unions in the Nordic Countries." The Comparative Politics of Education: 144.
World Bank. 2016. "World Development Report 2017: Governance and the Law." Washington, DC: World Bank.

- 11.1 -
Chapter 11 How to escape low-learning traps
Contents Improving information .................................................................................................................................. 2
Building coalitions and strengthening incentives ......................................................................................... 6
Encouraging innovation and agility ............................................................................................................ 11
How can external actors support initiatives to improve learning? .............................................................. 17
Tackling the technical and political constraints that misalign education systems requires action on three fronts: investing in better information on learning, building coalitions between policymakers, bureaucrats, teachers, and parents around more effective strategies to raise learning, and adopting a more iterative, adaptive approach to change. External actors can support action in each area—but the push for change must be driven by domestic actors, particularly central governments.
11.1 Since 1995 England has substantially improved the literacy and numeracy skills of primary school children with good political strategy and sound technical solutions.1 The proportion of students in grade 4 reaching the intermediate benchmark in the TIMSS assessment of mathematics shot from 54 percent in 1995 to 80 percent in 2015 (figure 11.1)—an achievement made by few other countries.2 Poor education outcomes became an important issue in the 1997 national elections; the new administration responded with a national strategy at the start of its term in 1998.3
11.2 At the heart of the reforms was a redesign of how teachers taught. The new strategy set clear targets nationally as well as for individual schools, based on regular, publicly available data on student achievement. The targets provided incentives for local education authorities, teachers, and principals. The government adjusted school inspections to reflect the new curriculum; it also strengthened the links between teacher performance and pay. A revamped professional development program, supported by local literacy consultants, helped teachers implement the new strategy. Local governments received substantial new funding for implementation. Literacy and numeracy hours, introduced as part of the new strategy, significantly improved early learning outcomes.4 The program has continued to evolve, with more support focused on disadvantaged learners.
11.3 Reforms that improve learning rely on good strategies—political and technical. This chapter draws lessons from both types of experiences to identify how opportunities for reform emerge and how politicians, bureaucrats, parents, and students can seize them. It focuses on three entry points for addressing systemic political and technical challenges: improving information,
1 Stannard and Huxford 2007; Cassen, McNally and Vignoles 2015; Tanner and others 2010. 2 Mullis and others 2016. 3 The numeracy strategy was introduced in 1999. 4 Evaluations of different aspects of the literacy and numeracy program are summarized in for example, Machin and McNally 2008; McNally 2015; Stannard and Huxford 2007.
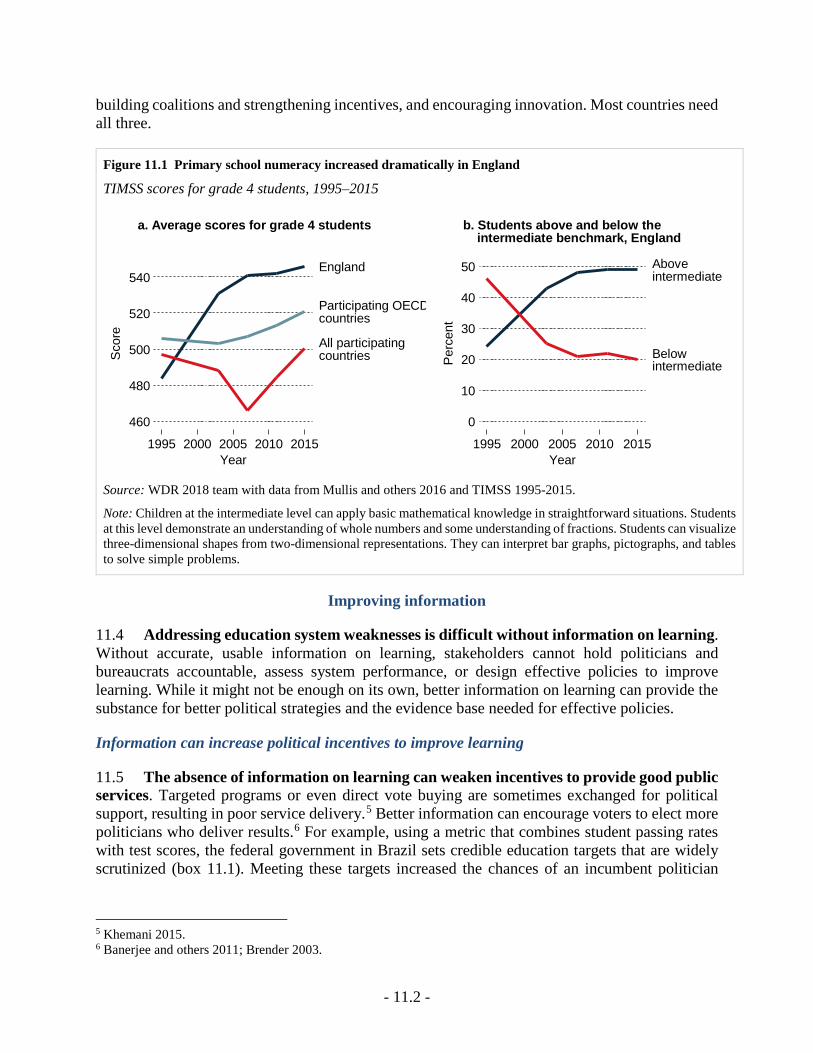
- 11.2 -
building coalitions and strengthening incentives, and encouraging innovation. Most countries need all three.
Figure 11.1 Primary school numeracy increased dramatically in England
TIMSS scores for grade 4 students, 1995–2015
Source: WDR 2018 team with data from Mullis and others 2016 and TIMSS 1995-2015.
Note: Children at the intermediate level can apply basic mathematical knowledge in straightforward situations. Students at this level demonstrate an understanding of whole numbers and some understanding of fractions. Students can visualize three-dimensional shapes from two-dimensional representations. They can interpret bar graphs, pictographs, and tables to solve simple problems.
Improving information
11.4 Addressing education system weaknesses is difficult without information on learning. Without accurate, usable information on learning, stakeholders cannot hold politicians and bureaucrats accountable, assess system performance, or design effective policies to improve learning. While it might not be enough on its own, better information on learning can provide the substance for better political strategies and the evidence base needed for effective policies.
Information can increase political incentives to improve learning
11.5 The absence of information on learning can weaken incentives to provide good public services. Targeted programs or even direct vote buying are sometimes exchanged for political support, resulting in poor service delivery.5 Better information can encourage voters to elect more politicians who deliver results.6 For example, using a metric that combines student passing rates with test scores, the federal government in Brazil sets credible education targets that are widely scrutinized (box 11.1). Meeting these targets increased the chances of an incumbent politician
5 Khemani 2015. 6 Banerjee and others 2011; Brender 2003.
England
Participating OECDcountries
All participatingcountries
460
480
500
520
540
Scor
e
1995 2000 2005 2010 2015Year
a. Average scores for grade 4 students
Aboveintermediate
Belowintermediate
0
10
20
30
40
50
Perc
ent
1995 2000 2005 2010 2015Year
b. Students above and below the intermediate benchmark, England
- 11.3 -
being reelected and of bureaucrats keeping their jobs.7 It also highlighted the value of providing information on learning for areas that correspond with political jurisdictions: because of the overlap, citizens can hold politicians accountable for progress on education targets. But information’s ability to shift incentives toward a greater focus on learning depends on the broader context. For example, better information in one sector is unlikely to disrupt patronage networks in countries where clientelism is entrenched across the political system.
Box 11.1 Using information to align incentives successfully with learning in Brazil
From 2000 to 2012, Brazil’s learning outcomes on OECD’s PISA assessment showed steady improvement, with gains in some subjects concentrated among poorer-performing students. Underlying this progress were reforms that strengthened accountability for system performance, reduced funding inequalities across Brazil’s diverse regions, and provided cash transfers to the neediest families. Improvements in information underpinned these reforms.
Better information made it much easier to hold education agencies accountable for learning. A state-level learning assessment introduced in 1995 was extended 10 years later to cover all fourth- and eighth-grade students. The central government combined assessment results with student promotion rates to create an index of basic education quality (Indice de Desenvolvimento de Desenvolvimento da Educacao Basica, or IDEB) for every school, municipality, state, and region in Brazil. Targets based on this index are used by system administrators at every level, as well as parents, to hold schools and local administrations accountable for learning.
Better information also raised the incentives for politicians to improve performance. Public awareness of the index is high, with the biannual release of IDEB scores generating extensive media coverage and debate. This not only places education high on the political agenda, but is also an important factor when citizens choose their local representatives.
Crucially, the government also used the index to target additional support to low-performing schools and introduce programs to motivate system actors. For example, schools receive bonuses based on annual improvements in IDEB scores, and evidence suggests this has contributed to better learning.
Sources: OECD (2016b); Toral (2016); Bruns, Evans, and Luque (2011); Ferraz and Bruns (2012).
Information can also improve incentives in schools
11.6 Information on school performance can make local education systems work better. Parents in many developing countries have limited information on the quality of local schools. In Pakistan providing parents with information on learning outcomes increased competition between schools: learning outcomes improved in both public and private schools, and private school fees were cut.8 Parents can also use information to put pressure on schools to raise standards.9 For example, the provision of report cards has strengthened accountability in some countries.10
Interventions of this kind work best where power relations between actors in an education system are not highly unequal or organized to support patronage networks, and where frontline service providers have autonomy to respond to community demands.11 When these factors prevent parents’ voices from being heard, it can encourage some, especially middle-class parents, to opt
7 Toral 2016; Dias and Ferraz 2017. 8 Andrabi, Das and Khwaja 2015. 9 Barr, Packard and Serra 2014. 10 Snilstveit and others 2015. 11 Grandvoinnet, Aslam and Raha 2015; Carr-Hill and others 2014.
- 11.4 -
out of the public education system—weakening pressure on governments to improve learning across the system.12
11.7 Information can also help ensure that resources go where they are intended. In the mid-1990s schools in Uganda received only around a quarter of their intended per student grant allocations. The government began to publish information on the timing and amount of transfers made to districts for school capitation grants so that schools could monitor local administrators. This increased the share of grant funding reaching schools by reducing capture of funding by district offices. Consistent with the feedback-loop story, schools in areas with better access to newspapers benefited the most.13
Good information is also vital for system monitoring, evaluation, and improvement
11.8 System managers require information to monitor and analyze system performance. School supervisors require information on student learning outcomes to identify and address poorly performing schools. Good research and evaluation also supports better implementation by enabling feedback loops. In the early 2000s Cambodia’s scholarship program aimed to improve education outcomes for disadvantaged students. An early evaluation showed the program improved attainment and narrowed gender gaps in enrolment, but failed to reach the poorest children or improve learning.14 In 2006, as a result of the findings, the government improved targeting of poorer children, then experimented with using the scholarships to encourage learning. Introducing merit-based criteria into student selection increased enrollment and improved learning, raising mathematics test scores by about 0.17 standard deviations.15
11.9 Research and evaluation can also build support for effective programs across political cycles. Oportunidades, Mexico’s conditional cash transfer program, has endured since 1997 despite political and economic change. Impact evaluations have provided solid evidence of how the program improved the lives of children, and were key to the decision to continue the program after a new government was elected in 2000.16
But many information and knowledge systems are not serving these purposes
11.10 Information needed to improve learning is absent in many countries. An assessment of capacity to monitor progress toward the Sustainable Development Goals found that in 121 countries, a third lacked data on learning outcomes at the end of primary, and a half had insufficient information at the end of lower secondary.17 Information systems in the education sector are often weak and rarely used for decision-making, planning, or implementation monitoring.
11.11 There are many barriers to using information to improve education outcomes. In Tanzania widely publicized results from citizen-led learning assessments influenced public perceptions of education and shifted the government’s focus toward learning (box 11.2). Yet such
12 World Bank 2017b; Banerjee and others 2010. 13 Reinikka and Svensson 2011. 14 Filmer and Schady 2009. 15 Barrera-Osorio and Filmer 2015. 16 UNDP 2011. 17 UNESCO-UIS 2016.
- 11.5 -
direct links between evidence and policy-making are often missing.18 Some evaluations take too long to inform decision-making; others fail to disentangle the complex factors behind low system performance. Even where usable information exists, government agencies may lack the incentives or capacity to use it well.19 Independence also matters: reliable, salient information can provide incentives for better performance, but biased media may protect the interests of particular groups at the expense of better public services. In Argentina between 1998 and 2007, newspapers that received government funding published fewer reports on corruption than did others.20
Box 11.2 Citizen-led assessments have raised awareness of the learning crisis in South Asia and Sub-Saharan Africa Citizen-led assessments are locally designed learning assessments that measure basic reading and mathematics competencies. Typically conducted by networks of civil society organizations, these test children whether they are in or out of school—something that conventional testing can’t do. Their goal is to increase awareness of learning outcomes and to encourage stakeholders to take action to improve learning. Citizen-led assessments have been conducted mainly in South Asia and Sub-Saharan Africa. For example, the Campaign for Popular Education (CAMPE)—a network of over a thousand non-governmental organizations, researchers, and educators in Bangladesh—started carrying out assessments of this kind in 1999.
Evaluations of these initiatives concluded that:
• These assessments have been more salient to the public than larger-scale, more complex national assessments, because the citizen-led assessments focus on a narrower set of basic competencies, starting with recognizing letters and numbers.
• Initiatives were successful at disseminating their results and raising awareness about the learning crisis. They also increased the focus on learning in government planning documents.
• While the assessment results have led to action in some cases, this was not always automatic. Over the short period that the Annual Status of Education Report (ASER) in India and Uwezo in Tanzania have been operating, their assessment results do not show any clear pattern of improvement in learning.21 In India, partnerships between some state governments and Pratham, an NGO that aims to improve education quality, have designed interventions to address the problems identified by the ASER assessment.
Sources: CAMPE (2000); Rath and others (2015); Results for Development Institute (2015).
11.12 Despite these hurdles, it is clear how information systems can be strengthened to improve learning (table 11.1). First, information needs to be credible, politically salient, and publicly available. Second, clear targets for progress on learning can strengthen incentives by providing measures of system performance. Third, meaningful information on learning needs to be aligned to political or decision-making power, so that the public can hold education decisionmakers more accountable and strengthen incentives to improve learning. Finally, information needs to be useable for policymakers, administrators, and other system actors—timely, accurate, policy relevant, sensitive to the policy cycle.
18 Rath and others 2015. 19 Sutcliffe and Court 2005. 20 Di Tella and Franceschelli 2011. 21 Uwezo means ‘capability’ in Kiswahili.
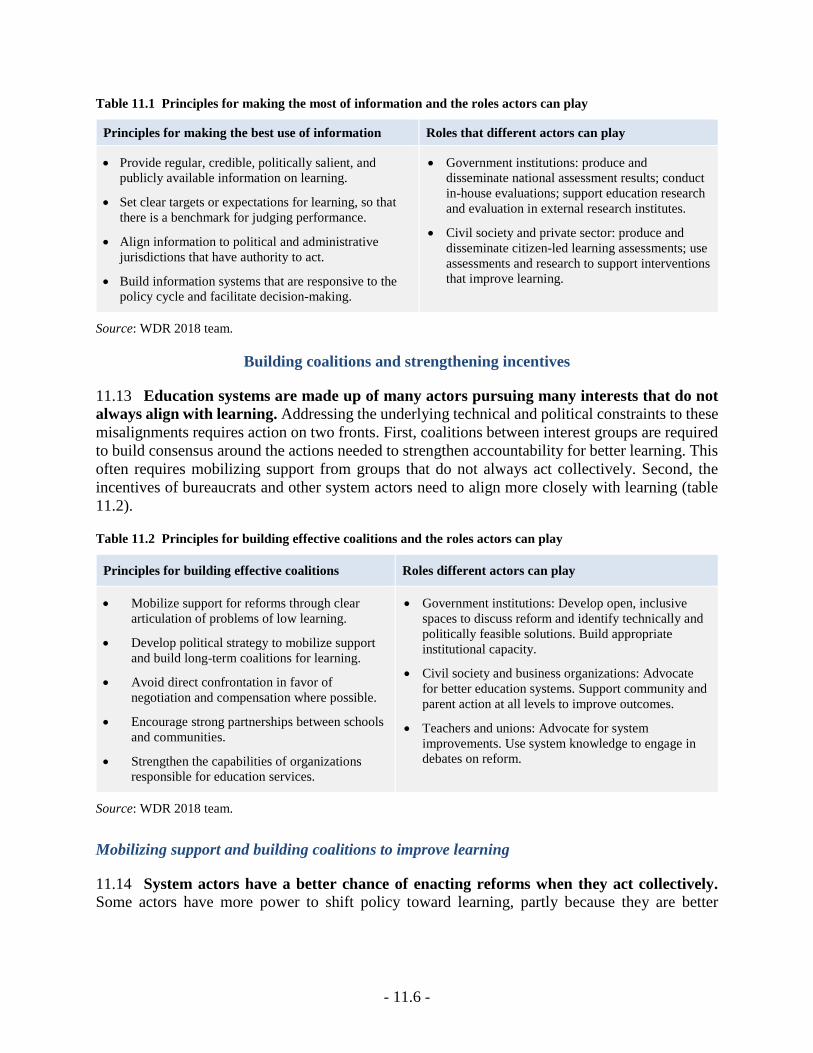
- 11.6 -
Table 11.1 Principles for making the most of information and the roles actors can play
Principles for making the best use of information Roles that different actors can play
• Provide regular, credible, politically salient, and publicly available information on learning.
• Set clear targets or expectations for learning, so that there is a benchmark for judging performance.
• Align information to political and administrative jurisdictions that have authority to act.
• Build information systems that are responsive to the policy cycle and facilitate decision-making.
• Government institutions: produce and disseminate national assessment results; conduct in-house evaluations; support education research and evaluation in external research institutes.
• Civil society and private sector: produce and disseminate citizen-led learning assessments; use assessments and research to support interventions that improve learning.
Source: WDR 2018 team.
Building coalitions and strengthening incentives
11.13 Education systems are made up of many actors pursuing many interests that do not always align with learning. Addressing the underlying technical and political constraints to these misalignments requires action on two fronts. First, coalitions between interest groups are required to build consensus around the actions needed to strengthen accountability for better learning. This often requires mobilizing support from groups that do not always act collectively. Second, the incentives of bureaucrats and other system actors need to align more closely with learning (table 11.2).
Table 11.2 Principles for building effective coalitions and the roles actors can play
Principles for building effective coalitions Roles different actors can play
• Mobilize support for reforms through clear articulation of problems of low learning.
• Develop political strategy to mobilize support and build long-term coalitions for learning.
• Avoid direct confrontation in favor of negotiation and compensation where possible.
• Encourage strong partnerships between schools and communities.
• Strengthen the capabilities of organizations responsible for education services.
• Government institutions: Develop open, inclusive spaces to discuss reform and identify technically and politically feasible solutions. Build appropriate institutional capacity.
• Civil society and business organizations: Advocate for better education systems. Support community and parent action at all levels to improve outcomes.
• Teachers and unions: Advocate for system improvements. Use system knowledge to engage in debates on reform.
Source: WDR 2018 team.
Mobilizing support and building coalitions to improve learning
11.14 System actors have a better chance of enacting reforms when they act collectively. Some actors have more power to shift policy toward learning, partly because they are better
- 11.7 -
organized.22 For example, in many countries teacher unions have a powerful voice in debates on reform whereas the collective voice of parents and students is often more muted.
11.15 Mobilizing support and building coalitions among a range of system actors has been an important tool for improving learning. Many countries have built support for proposed policy changes through wide-ranging consultations that try to bring together key interest groups.23 Peru’s Business Association for Education organized an information campaign that helped shift public opinion to support reforms that began in 2006. Government reformers used information on poor learning outcomes of the education system to mobilize public support for reforms to strengthen teacher accountability all of which led to sustained improvements in learning.24 Alliances between education stakeholders have also formed in some countries to realize the right to education through the legal system (box 11.3).
Box 11.3 Using the legal system to press for change
With more than 80 percent of national constitutions recognizing the right to education, courts have become an increasingly important arena to hold governments accountable for education policies and practices.
In recent years India and Indonesia have seen a significant increase in education rights litigation. Cases have included demands to ensure equal access to education, the fulfilment of minimum service standards, and ensuring that governments fulfill their spending obligations. Many of these cases have been successful. The Indian Supreme Court has consistently ruled in favor of upholding quotas for poor children in private schools, the High Court in Uttarakhand required the state government to adopt minimum qualification standards for teachers, and in Indonesia parents succeeded in enforcing constitutional provisions that obligated the government to spend 20 percent of its budget on education.
These cases have often been brought by individuals or small groups with NGO activists and teacher trade unions providing technical and financial support. An assessment of the impact of litigation of this kind in India and Indonesia found:
• The extent to which the legal system has been used to press for policy changes depends significantly on the nature of the court system, presence of support structures for legal mobilization, and the ideology of the courts.
• Using education rights litigation effectively is conditional on support from the judiciary, access to support to mobilize particularly from civil society groups, and broader political mobilization.
• Policy-oriented litigation has mainly served the interests of poor or marginalized groups—even though sections of the middle class were centrally involved in much of the litigation. Gains have largely come through better access to education, with successes often coming at the expense of quality education for the middle class.
• Litigation as a strategy for improving education outcomes has limitations. Often judgements need to be enforced by the same public officials who were the focus of the initial lawsuit. Even when judgements are implemented, they are more often about ensuring access than improving learning. Courts typically lack the necessary expertise on learning, especially where information on learning outcomes is scarce.
Source: Rosser and Joshi (forthcoming).
11.16 While mobilization efforts can be successful at balancing interests, they may be less successful at shifting the interests of those opposed to reforms. Education reform is a long process, and well-organized opposition can derail it, particularly during implementation. In Peru,
22 Corrales 1999. 23 Bruns and Schneider 2016; Corrales 1999. 24 Bruns and Luque 2014.

- 11.8 -
the government successfully mobilized public support to get reforms approved, but it was less successful at getting buy-in from teachers, which led to continued resistance from teacher unions during implementation. While the broad reform direction remained intact and learning improved, this experience also highlights a potential trade-off between managing the politics of reform and getting implementation right. When reformers have to devote effort to managing opposition, it can divert attention implementing well. Lack of buy-in from important groups prevents them from contributing to policy design and implementation, undermining sustainability of the reform.25
11.17 Building broadly based coalitions of stakeholders is important at all stages of the policy cycle. Malaysia created a performance delivery unit to lead comprehensive reforms in many sectors, including education. The unit uses “labs” that build coalitions of stakeholders and involve them in all stages of reform, from design to implementation.26 Stakeholders typically come together in the labs for six to nine weeks at the start of reforms to discuss priorities, agree on performance indicators, and develop implementation plans. During implementation, mini-labs bring stakeholders together to adjust plans. Programs introduced under the process are credited with increasing grade 3 literacy rates from 89 percent in 2009 to close to 100 percent in 2012. The approach has been exported to other countries including India, South Africa, and Tanzania (box 11.4).
Box 11.4 Using “labs” to build coalitions for learning
Rapidly deteriorating results on school-leaving examinations, together with other newly available information on poor system performance, motivated policymakers in Tanzania to launch the ambitious Big Results Now (BRN) program in education in 2013. BRN adopted a “service delivery” approach that was first introduced in the United Kingdom in the early 1990s and then adapted successfully in Malaysia.
At the heart of the approach was a six-week-long “lab” to identify priority reform areas and develop mutually agreed delivery plans. The lab brought together all the key system actors—government officials, academics, teacher unions, development partners, civil society organizations—at a level senior enough to ensure follow-through. Together, the lab participants developed nine key initiatives, developed step-by-step implementation, and assigned responsibilities for those steps.
The lab process made it possible to introduce a complex package of politically sensitive reforms. For example, the government started using monetary and non-monetary incentives to reward the most improved schools, along with accountability measures that used public examination results to rank schools. BRN also introduced, for the first time, a national sample-based assessment to measure early grade literacy and numeracy. Communication campaigns succeeded in generating very high levels of public awareness of BRN’s objectives nationwide.
While the program has been running for only three years, there are signs that it has begun to improve learning outcomes. The program has not been without its difficulties; for example, a recent review highlighted difficulties in coordination between government agencies responsible for education. But over the past few years, examination results have slowly improved, and primary-school students have made gains in early grade reading.
Sources: Sabarwal, Joshi, and Blackmon (forthcoming); Todd and Attfield (2017); World Bank (2017a).
11.18 Without efforts to build coalitions for learning, reforms are less likely to endure. The sustainability of reforms, even if evidence show they improve learning, is at risk when they are misunderstood or unpopular among system actors. In Poland, large-scale changes to the structure of the education system were introduced in 1999 as part of broader decentralization reforms. These
25 Bruns and Luque 2014; World Bank 2017b. 26 World Bank 2016; Sabel and Jordan 2015.
- 11.9 -
reforms have been credited with improving student learning outcomes significantly.27 At the outset, efforts to build a supporting coalition were only half-hearted—and even though evidence shows that they have improved learning, they have remained unpopular. The election of a new government in 2015 has led to heated debate to scrap key elements of the original reform.28 Building a coalition may require better communication strategies, or it may require adopting a reform design that is second-best technically but more feasible to implement.
11.19 A gradual, negotiated approach to reform may work better than confrontation. Where coalitions between system actors foster collaboration around shared goals, reforms are more likely to succeed. The history of reforms to improve teaching in Chile shows how negotiated reform can build strong coalitions for change (box 11.5). Since Chile’s return to democracy, successive governments have adjusted the working conditions of teachers to improve their welfare, while at the same time linking pay and career development more closely to performance. These changes have contributed to Chile’s steady improvement in international learning assessments.
11.20 Negotiations can also include strategies to compensate actors disadvantaged by reform. In some cases, disruptions brought about by improvements in system efficiency can negatively impact affected students: additional services to children affected by school closures can ease school consolidations.29 Elsewhere, dual-track reforms have protected system actors from negative impacts of reform. For example, pay-for-performance schemes in Peru were initially introduced voluntarily.
11.21 Compensating perceived losers can help get reforms approved, but comes with risks. In 2005, the Indonesian government introduced a comprehensive reform program aimed at raising the competencies of teachers. Teacher certification was the centerpiece of the reforms, with teachers required to pass a competency test in order to continue teaching.30 In exchange for these new obligations, the negotiated agreement provided certified teachers an additional monthly allowance as large as their base salary. But early in implementation, the requirements for certification were diluted, due to political pressures, so that teachers were no longer required to pass a competency test. The reform ended up having little impact on teacher competencies or student learning, but a major impact on public spending.31 In 2012, over 30 percent of the education budget went to certification allowances.
27 Jakubowski 2015; Jakubowski and others 2010. 28 Wojciuk 2017. 29 Beuchert and others 2016. 30 Chang and others 2013. 31 De Ree and others 2015.
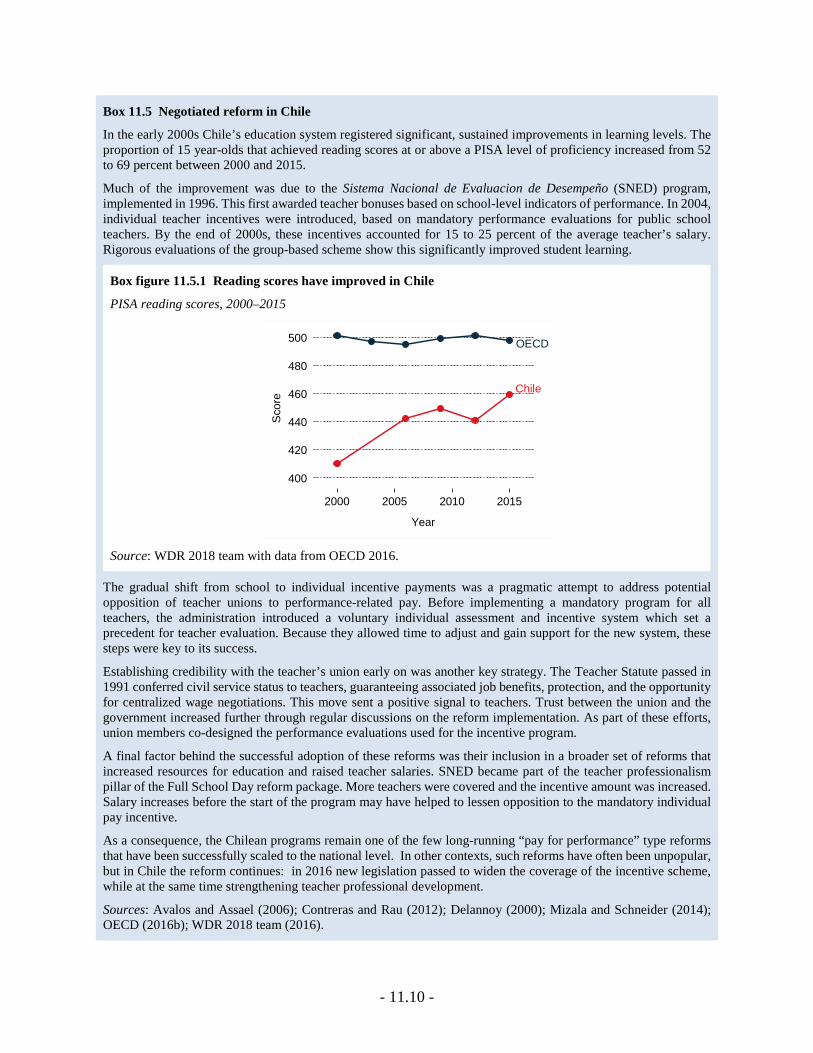
- 11.10 -
Box 11.5 Negotiated reform in Chile
In the early 2000s Chile’s education system registered significant, sustained improvements in learning levels. The proportion of 15 year-olds that achieved reading scores at or above a PISA level of proficiency increased from 52 to 69 percent between 2000 and 2015.
Much of the improvement was due to the Sistema Nacional de Evaluacion de Desempeño (SNED) program, implemented in 1996. This first awarded teacher bonuses based on school-level indicators of performance. In 2004, individual teacher incentives were introduced, based on mandatory performance evaluations for public school teachers. By the end of 2000s, these incentives accounted for 15 to 25 percent of the average teacher’s salary. Rigorous evaluations of the group-based scheme show this significantly improved student learning.
Box figure 11.5.1 Reading scores have improved in Chile
PISA reading scores, 2000–2015
Source: WDR 2018 team with data from OECD 2016.
The gradual shift from school to individual incentive payments was a pragmatic attempt to address potential opposition of teacher unions to performance-related pay. Before implementing a mandatory program for all teachers, the administration introduced a voluntary individual assessment and incentive system which set a precedent for teacher evaluation. Because they allowed time to adjust and gain support for the new system, these steps were key to its success.
Establishing credibility with the teacher’s union early on was another key strategy. The Teacher Statute passed in 1991 conferred civil service status to teachers, guaranteeing associated job benefits, protection, and the opportunity for centralized wage negotiations. This move sent a positive signal to teachers. Trust between the union and the government increased further through regular discussions on the reform implementation. As part of these efforts, union members co-designed the performance evaluations used for the incentive program.
A final factor behind the successful adoption of these reforms was their inclusion in a broader set of reforms that increased resources for education and raised teacher salaries. SNED became part of the teacher professionalism pillar of the Full School Day reform package. More teachers were covered and the incentive amount was increased. Salary increases before the start of the program may have helped to lessen opposition to the mandatory individual pay incentive.
As a consequence, the Chilean programs remain one of the few long-running “pay for performance” type reforms that have been successfully scaled to the national level. In other contexts, such reforms have often been unpopular, but in Chile the reform continues: in 2016 new legislation passed to widen the coverage of the incentive scheme, while at the same time strengthening teacher professional development.
Sources: Avalos and Assael (2006); Contreras and Rau (2012); Delannoy (2000); Mizala and Schneider (2014); OECD (2016b); WDR 2018 team (2016).
Chile
OECD
400
420
440
460
480
500
Scor
e
2000 2005 2010 2015
Year
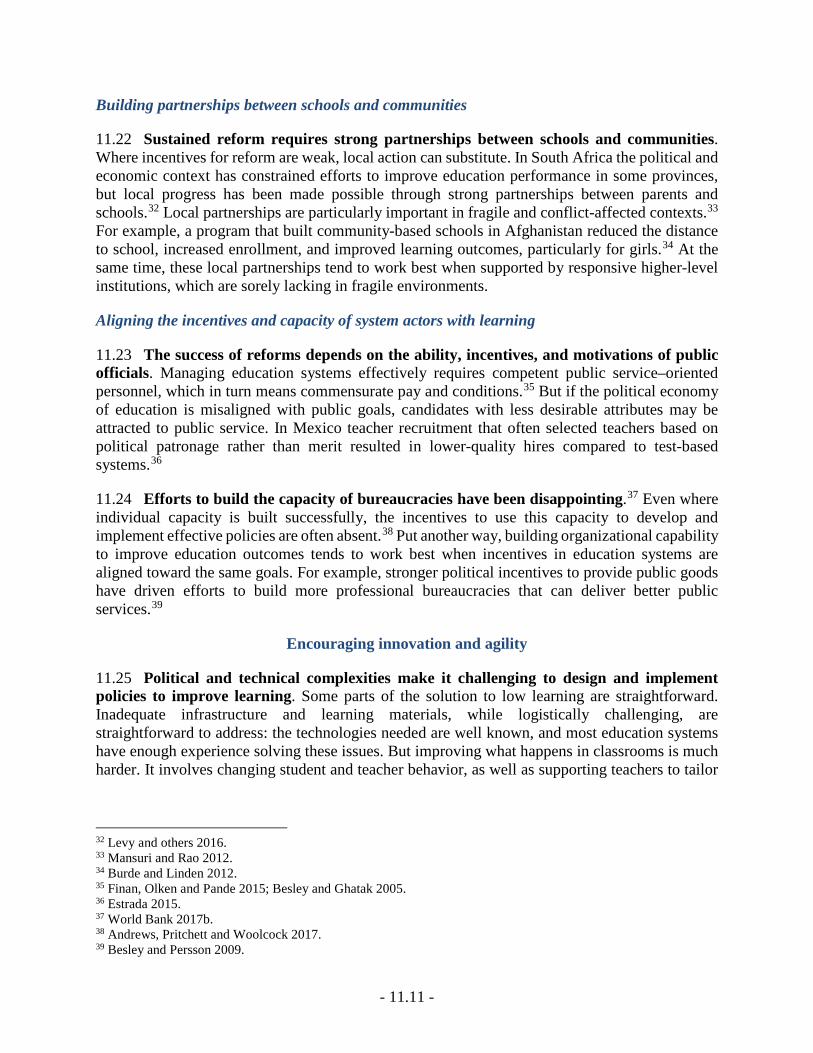
- 11.11 -
Building partnerships between schools and communities
11.22 Sustained reform requires strong partnerships between schools and communities. Where incentives for reform are weak, local action can substitute. In South Africa the political and economic context has constrained efforts to improve education performance in some provinces, but local progress has been made possible through strong partnerships between parents and schools.32 Local partnerships are particularly important in fragile and conflict-affected contexts.33 For example, a program that built community-based schools in Afghanistan reduced the distance to school, increased enrollment, and improved learning outcomes, particularly for girls.34 At the same time, these local partnerships tend to work best when supported by responsive higher-level institutions, which are sorely lacking in fragile environments.
Aligning the incentives and capacity of system actors with learning
11.23 The success of reforms depends on the ability, incentives, and motivations of public officials. Managing education systems effectively requires competent public service–oriented personnel, which in turn means commensurate pay and conditions.35 But if the political economy of education is misaligned with public goals, candidates with less desirable attributes may be attracted to public service. In Mexico teacher recruitment that often selected teachers based on political patronage rather than merit resulted in lower-quality hires compared to test-based systems.36
11.24 Efforts to build the capacity of bureaucracies have been disappointing.37 Even where individual capacity is built successfully, the incentives to use this capacity to develop and implement effective policies are often absent.38 Put another way, building organizational capability to improve education outcomes tends to work best when incentives in education systems are aligned toward the same goals. For example, stronger political incentives to provide public goods have driven efforts to build more professional bureaucracies that can deliver better public services.39
Encouraging innovation and agility
11.25 Political and technical complexities make it challenging to design and implement policies to improve learning. Some parts of the solution to low learning are straightforward. Inadequate infrastructure and learning materials, while logistically challenging, are straightforward to address: the technologies needed are well known, and most education systems have enough experience solving these issues. But improving what happens in classrooms is much harder. It involves changing student and teacher behavior, as well as supporting teachers to tailor
32 Levy and others 2016. 33 Mansuri and Rao 2012. 34 Burde and Linden 2012. 35 Finan, Olken and Pande 2015; Besley and Ghatak 2005. 36 Estrada 2015. 37 World Bank 2017b. 38 Andrews, Pritchett and Woolcock 2017. 39 Besley and Persson 2009.
- 11.12 -
their teaching to the needs of their students. Traditional approaches to reform in which pre-defined interventions are introduced with little room to adapt during implementation are rarely effective.
11.26 Learning reforms need a more agile approach, with room for adaptation.40 This is not the same as experimenting with different interventions in pilot projects. Instead, it means testing approaches at scale, in their political and economic contexts, with the capabilities of implementing agencies. A recent review of complex public management reforms, including in education, highlighted key elements of successful reforms.41 Successful reforms started out with a clear articulation of the problem, together with an initial set of potential solutions, then adopted solutions that emerged from experimentation during implementation (figure 11.2). Final interventions tended to be hybrids, drawing on local and global evidence.
Figure 11.2 Problem driven iterative adaptation
Source: Adapted from Andrews, Pritchett, and Woolcock 2017.
Searching for solutions to local problems
11.27 Well-performing parts of any education system can reveal technically and politically feasible approaches to improve learning. In Misiones Province, Argentina student dropout rates were high. But some schools bucked the trend: teachers agreed on informal learning contracts with parents instead of blaming them for poor student performance. Schools that adopted more constructive approaches to parent-teacher relations saw dropouts fall significantly.42 Schools approach challenges in different ways, so analysis of positive outliers could be useful for policy-making (box 11.6).
40 Andrews, Pritchett and Woolcock 2017. 41 Andrews 2015. 42 Green 2016; Pascale, Sternin and Sternin 2010.
- 11.13 -
11.28 Growing global knowledge provides a starting point for countries to develop interventions to strengthen learning. Local innovations may not be enough to close the learning gap between countries. Employing principles from growing global evidence can provide useful ideas for improving learning in specific contexts. A more iterative approach to system change can adapt interventions inspired by global experiences to local contexts.
Box 11.6 Learning lessons from high-performing schools in the West Bank and Gaza
The United Nations Relief and Works Agency (UNRWA) provides basic education services to over 300,000 refugees in the West Bank and Gaza. In the latest OECD PISA assessment, these schools outperformed public schools, delivering the equivalent of one year’s additional learning despite the lower socioeconomic status of UNRWA students and lower per student spending.43 Key factors for the performance gap include:
• Greater parental involvement in school activities and close partnership between schools, households, and refugee communities—contributing to a shared sense of purpose and collaborative mechanisms for monitoring and support.
• More effective teacher support systems. Teachers are trained using standards that clearly articulate what students should know and be able to do at each grade. While pre-service training is similar in UNRWA and public schools, UNRWA teachers complete a two-year training program in classroom instruction, resulting in teaching approaches that are better aligned with learning.
• Assessment and evaluation. UNRWA schools have more rigorous, frequent student assessments and teacher evaluations.
• Effective school leadership. The UNRWA invests in developing qualified principals who can support their teachers effectively.
Identifying lessons from high-performing schools is not always easy. Some factors such as school leadership that drive high performance may be idiosyncratic, making them hard to replicate. Drawing on large samples of schools can help identify more generalizable lessons.
Source: Abdul-Hamid and others 2016.
Integrating an iterative and adaptive approach to policymaking and implementation
11.29 Recent examples show how an iterative, adaptive approach can strengthen education systems and raise learning. In India a small experiment showed that grouping children by ability and using level-appropriate teaching alongside continuous assessment improved students’ reading abilities. Recognizing that a small-scale experiment was no guarantee of success in the government system, Pratham—the NGO responsible for the original evaluation—experimented with different approaches to level-appropriate teaching in government schools. This experimentation tested the assumptions of the original model and identified factors behind the earlier success. This experimentation yielded two approaches to implementation that could work at scale.44 Even in fragile states, where system capabilities are limited, iterative approaches like this have been successful at restoring essential education services (box 11.7).
11.30 Policymakers can test policies before introducing them more widely. Whole-system reforms are difficult to evaluate because they lack an appropriate counterfactual, making it difficult to trace the impacts of policy change and adapt strategies to raise learning. Small pilots can overcome these difficulties, but it is difficult to assess whether they will be effective without the
43 This comparison is for UNRWA schools and public schools in Jordan. 44 Banerjee and others 2016.
- 11.14 -
attention and nurturing that can occur in a pilot. As a middle way, China and other countries have tested new policies in specific regions.45 Policymakers first identify the main problems, then agree on solutions to experiment with. Then they develop proposals for experiments partly by analyzing solutions adopted in other countries to tackle similar issues, with different regions trying alternatives. Successful policies are then rolled out to other regions. Belgium and the Netherlands have adopted similar approaches.46
Box 11.7 Iterating and adapting to improve education services in Burundi
After a protracted civil war and long peace process in Burundi, a new government and new constitution in 2005 led to a renewed focus on public services. In education, many schools had been destroyed and management systems had collapsed. As the new government took office, primary net enrollment rates stood at just 56 percent, student-classroom ratios were 87:1, and 20 students shared a single mathematics textbook on average.
The government prioritized reducing the high student-textbook ratios and delays in delivery, as part of a broader rapid-results initiative that included three stages:
• Shaping phase. In this stage a reform team identified why there weren’t enough textbooks. To ensure practical solutions, the team comprised stakeholders from across the education system—including provincial education directors and parent-teacher associations.
• Implementation phase. Senior government officials gave the team authority to implement its new approach in a single province. As implementation progressed, the team regularly adjusted their action plan.
• Planning for sustainability. After reviewing the intervention’s performance, senior government officials decided how to scale the program up to other provinces.
The initiative far exceeded its targets. Textbook availability increased and average delivery times fell from over a year to 60 days. Its success led to similar initiatives to tackle teacher payroll problems, as well as many other service delivery problems beyond education.
Source: Campos, Randrianarivelo, and Winning 2015.
11.31 Giving stakeholders the authority and autonomy to adopt such approaches runs counter to how many education agencies operate. Closed systems limit the autonomy of system actors and judge performance based on compliance with formal rules over resource use, leaving little room for innovation. By contrast, more open systems that have a greater focus on outcomes are more likely to see greater innovation across the education system (table 11.3).47
45 Heilmann 2008. 46 Blanchenay 2016. 47 Andrews, Pritchett and Woolcock 2013.
- 11.15 -
Table 11.3 Principles for encouraging innovation at scale
Principles for encouraging innovation and agility in approaches to improve learning
Role different system actors can play
• Adopt a more iterative and adaptive approach to the design and implementation of policies.
• Identify promising solutions from within the education system as well as the global knowledge base.
• Establish information systems that provide rapid feedback to support implementation.
• Develop capability of education agencies, an enabling environment and appropriate autonomy to encourage innovation.
• Government institutions: develop enabling environment and incentives for innovation and a more iterative approach.
• Civil society and private sector providers: experiment with different approaches to improve learning.
Source: WDR 2018 team.
Good information systems and broadly based coalitions are also needed
11.32 The capacity to learn from the implementation of new innovations is vital. Information systems that provide rapid, regular, accurate feedback are crucial for more adaptive approaches to improving learning. Some countries are beginning to build these kind of capabilities into their education agencies. Peru’s MineduLAB, in the Ministry of Education, is a collaboration between government agencies and experienced researchers. 48 The lab introduces innovations directly into government schools, and information from ministry systems (rather than individual data collection exercises) must be used by researchers to evaluate the new programs. Results must also be available within the same academic year. In MineduLAB’s first year, innovations included providing more comparative information on school performance and introducing modules to encourage primary school students to adopt a growth mindset. The program is still new, but its approach is promising.
11.33 To be sustainable, these approaches need broad support. Though this iterative approach can help develop more effective strategies, it brings risks for actors in education systems. Politicians can face significant costs if experiments fail or divert resources away from more traditional activities. Students can also suffer if new approaches disrupt their schooling without improving it. Yet some risk-taking is vital if education systems are to improve learning; mobilizing stakeholder support and providing space for consultations from the outset can reduce the risks.
Education systems need to be agile to exploit critical moments
11.34 Politicians and education system managers also need to respond quickly when changes create opportunities to improve broad-based learning. This context changes infrequently—but when it does, it provides opportunities for significant changes in education policy. During the martial-law period of 1970s, government education spending in the Philippines fell below two percent of GDP. In the 1980s, the People’s Power Revolution restored democratic rule, ushering in a new government more responsive to demands for broader access to education.
48 J-PAL and Innovations for Poverty Action 2013.
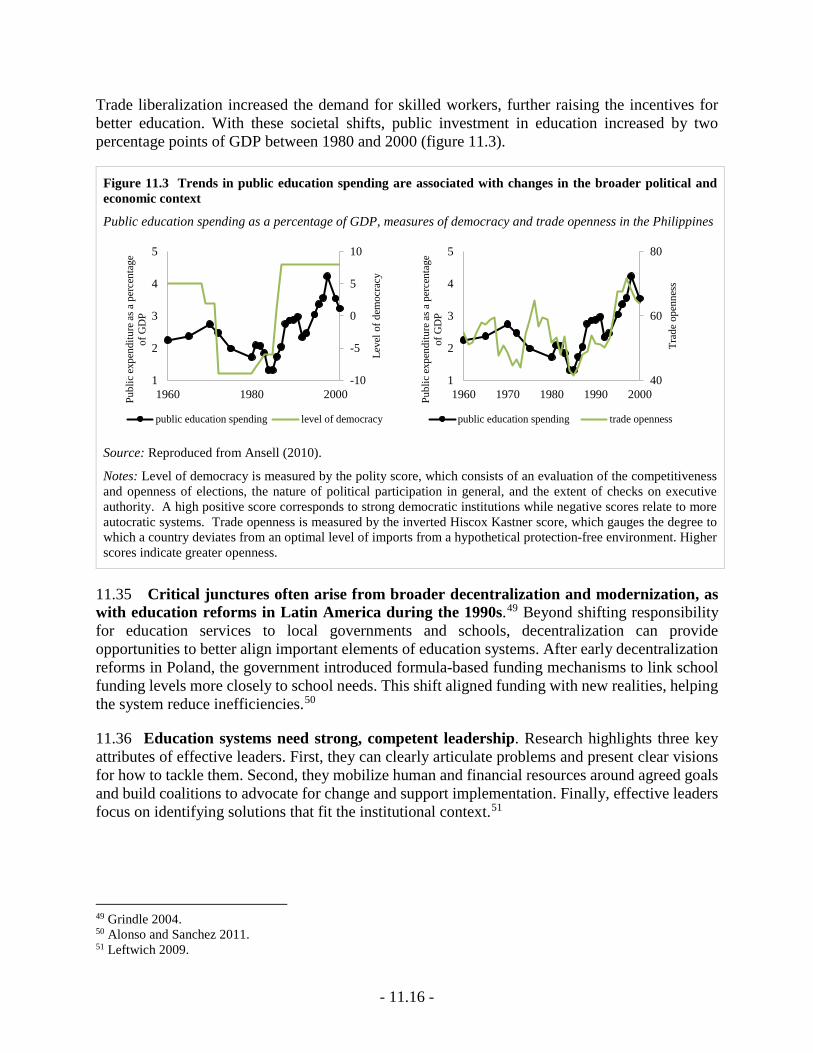
- 11.16 -
Trade liberalization increased the demand for skilled workers, further raising the incentives for better education. With these societal shifts, public investment in education increased by two percentage points of GDP between 1980 and 2000 (figure 11.3).
Figure 11.3 Trends in public education spending are associated with changes in the broader political and economic context
Public education spending as a percentage of GDP, measures of democracy and trade openness in the Philippines
Source: Reproduced from Ansell (2010).
Notes: Level of democracy is measured by the polity score, which consists of an evaluation of the competitiveness and openness of elections, the nature of political participation in general, and the extent of checks on executive authority. A high positive score corresponds to strong democratic institutions while negative scores relate to more autocratic systems. Trade openness is measured by the inverted Hiscox Kastner score, which gauges the degree to which a country deviates from an optimal level of imports from a hypothetical protection-free environment. Higher scores indicate greater openness.
11.35 Critical junctures often arise from broader decentralization and modernization, as with education reforms in Latin America during the 1990s.49 Beyond shifting responsibility for education services to local governments and schools, decentralization can provide opportunities to better align important elements of education systems. After early decentralization reforms in Poland, the government introduced formula-based funding mechanisms to link school funding levels more closely to school needs. This shift aligned funding with new realities, helping the system reduce inefficiencies.50
11.36 Education systems need strong, competent leadership. Research highlights three key attributes of effective leaders. First, they can clearly articulate problems and present clear visions for how to tackle them. Second, they mobilize human and financial resources around agreed goals and build coalitions to advocate for change and support implementation. Finally, effective leaders focus on identifying solutions that fit the institutional context.51
49 Grindle 2004. 50 Alonso and Sanchez 2011. 51 Leftwich 2009.
-10
-5
0
5
10
1
2
3
4
5
1960 1980 2000Le
vel o
f dem
ocra
cy
Publ
ic ex
pend
iture
as a
per
cent
age
of G
DP
public education spending level of democracy
40
60
80
1
2
3
4
5
1960 1970 1980 1990 2000
Trad
e op
enne
ss
Publ
ic ex
pend
iture
as a
per
cent
age
of G
DP
public education spending trade openness
- 11.17 -
How can external actors support initiatives to improve learning?
Support the creation of objective, politically salient information
11.37 Global education initiatives can improve political incentives for action. The Millennium Development Goals (MDGs) had some success at mobilizing international and domestic actors on development challenges. Though the global impact of the MDGs—specifically the education goal—is still being debated, the legitimacy that progress could give to weak or unstable governments was often a powerful incentive for change. Many countries introduced reforms to expand access in successful efforts to meet the MDGs. The Sustainable Development Goal indicators, which will include a set of comparable learning measures, could play a similar role by motivating countries to shift their focus from schooling to learning.
11.38 By supporting improvements in learning assessment, external actors can help shine a light on low learning levels and their causes. Regional and global assessments are an important tool, where external actors help developing countries participate. Such assessments can open up spaces for change and influence policy debates.52 Germany’s relatively poor results on PISA 2000—the “PISA shock”—led to a wide-ranging public debate on education, a series of reforms, and ultimately some improvement in scores. External actors can also help by supporting national assessment efforts, so that they can provide more politically salient information on learning. The READ program, a partnership between development partners, education practitioners, and low-income country governments, has helped countries strengthen their national assessments and supported their participation in international assessments.53
11.39 Beyond support to measure learning, external actors can also help build global knowledge on ways to diagnose system weaknesses and improve learning. This knowledge base has expanded rapidly, but adapting promising interventions to specific contexts are also required. External actors can fund research and encourage collaboration among practitioners, researchers, and government institutions to build capacity and locally relevant knowledge on effective ways to improve learning.
Encourage flexibility and support reform coalitions
11.40 External actors can also encourage inclusive reforms through project development activities, policy discussions, and support to other system actors. Though there has been much progress on the aid effectiveness agenda first agreed in the Paris Declaration in 2005, there is still significant room for improvement. A key aspect of this agenda is building inclusive reforms. But progress in this area has been slow. Across all sectors, only about half of countries were judged to have systems for meaningful dialogue with civil society organizations. Moreover, dialogue between the public and private sectors was judged to be difficult and rarely led to action.54 Tackling these issues is vital for the emergence of the coalitions needed to design and implement policies to tackle the learning crisis.
52 Devarajan and Khemani 2016. 53 Gardner and Clarke 2015. 54 OECD 2016a.
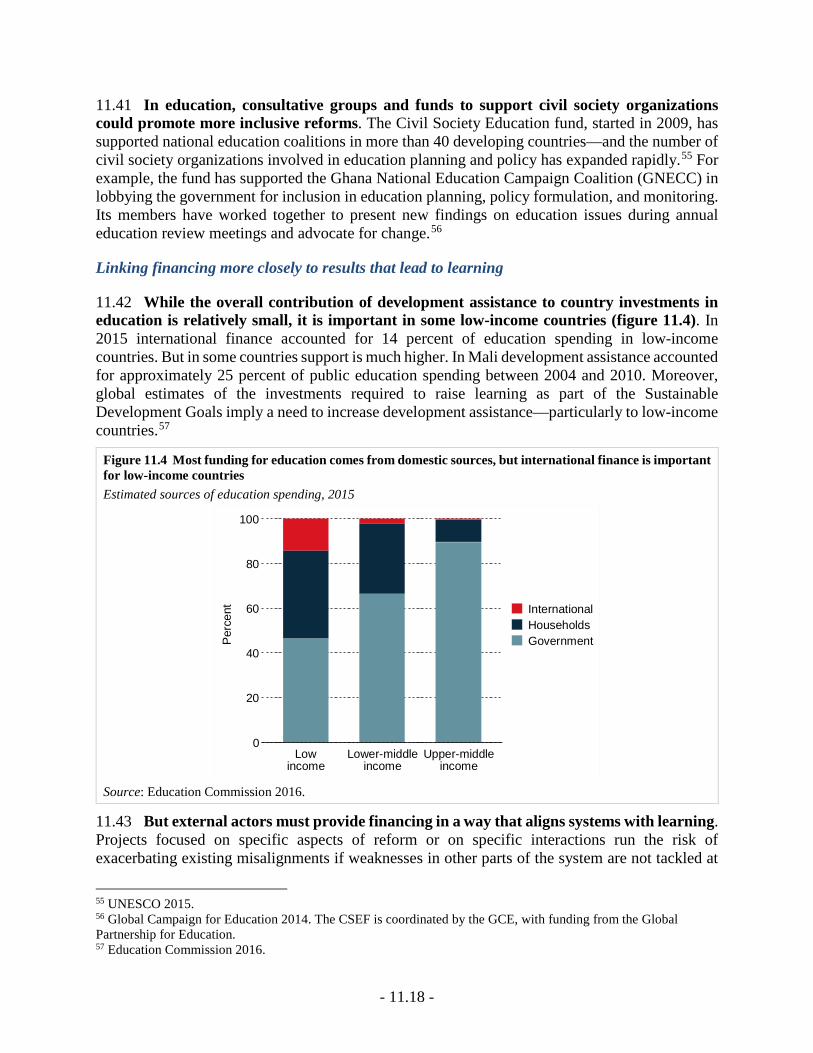
- 11.18 -
11.41 In education, consultative groups and funds to support civil society organizations could promote more inclusive reforms. The Civil Society Education fund, started in 2009, has supported national education coalitions in more than 40 developing countries—and the number of civil society organizations involved in education planning and policy has expanded rapidly.55 For example, the fund has supported the Ghana National Education Campaign Coalition (GNECC) in lobbying the government for inclusion in education planning, policy formulation, and monitoring. Its members have worked together to present new findings on education issues during annual education review meetings and advocate for change.56
Linking financing more closely to results that lead to learning
11.42 While the overall contribution of development assistance to country investments in education is relatively small, it is important in some low-income countries (figure 11.4). In 2015 international finance accounted for 14 percent of education spending in low-income countries. But in some countries support is much higher. In Mali development assistance accounted for approximately 25 percent of public education spending between 2004 and 2010. Moreover, global estimates of the investments required to raise learning as part of the Sustainable Development Goals imply a need to increase development assistance—particularly to low-income countries.57
Figure 11.4 Most funding for education comes from domestic sources, but international finance is important for low-income countries Estimated sources of education spending, 2015
Source: Education Commission 2016.
11.43 But external actors must provide financing in a way that aligns systems with learning. Projects focused on specific aspects of reform or on specific interactions run the risk of exacerbating existing misalignments if weaknesses in other parts of the system are not tackled at
55 UNESCO 2015. 56 Global Campaign for Education 2014. The CSEF is coordinated by the GCE, with funding from the Global Partnership for Education. 57 Education Commission 2016.
0
20
40
60
80
100
Perc
ent
Lowincome
Lower-middleincome
Upper-middleincome
InternationalHouseholdsGovernment
- 11.19 -
the same time. For example, projects that support professional development activities but are not aligned with career development incentives are likely to be less sustainable. External actors can support alignment by shifting the focus of systems toward learning by linking their financing to results rather than the provision of specific inputs or activities. 11.44 More development partners are using results-based financing in education. These approaches aim to align systems by linking financing to system results. They shift the focus from inputs toward performance. Some financing is linked directly to student achievement. For example, a U.K. program that supports the education system in Ethiopia provides an agreed amount for net increases in the number of students that pass the examination at the end of lower secondary education. The multidonor-financed Big Results Now in Education program in Tanzania links financing to student learning and intermediate outputs supporting improvements in education quality (see box 11.4). Such approaches are new, so their impact on system performance is unknown. But initial findings suggest that they have the potential to tackle system-level constraints and improve system performance.58
* * *
11.45 There is nothing inevitable about poor learning outcomes, whatever a country’s level of development. Some countries have used well-documented reforms to escape low-learning traps, successfully reorienting their systems toward learning. Others have achieved learning outcomes that far exceed what their development level would predict, indicating that they escaped the trap in the past. Although there is no single recipe for achieving broad-based learning, these cases identify three entry points to use as ingredients. First, deploy information and metrics to shine a light on the hidden exclusion of low learning. Second, build coalitions that can align incentives better toward learning, especially the learning of the most disadvantaged. Third, commit to innovation and agility, using feedback loops for continuous improvement. None of this is easy, but history shows that achieving education’s promise will depend on taking up the challenge.
58 Sabarwal, Joshi and Blackmon forthcoming.
- 11.20 -
References
Abdul-Hamid, Husein, H Patrinos, J Reyes, J Kelcey, and A Varela. 2016. "Learning in the Face of Adversity the Unrwa Education Program for Palestine Refugees." Washington, D.C.: The World Bank.
Alonso, J D, and A Sanchez, 2011. Reforming Education Finance in Transition Countries: Six Case Studies in Per Captita Financing Systems. The World Bank.
Andrabi, Tahir, Jishnu Das, and Asim Ijaz Khwaja. 2015. Report Cards: The Impact of Providing School and Child Test Scores on Educational Markets. Policy Reearch Working Paper No. 7226. Washington D.C. The World Bank.
Andrews, M J. 2015. "Explaining Positive Deviance in Public Sector Reforms in Development." World Development 74.
Andrews, Matt, Lant Pritchett, and Michael Woolcock. 2013. "Escaping Capability Traps through Problem Driven Iterative Adaptation (Pdia)." World Development 51: 234-44.
———. 2017. Building State Capability: Evidence, Analysis, Action. Oxford, UK: Oxford University Press.
Ansell, Ben W. 2010. From the Ballot to the Blackboard: The Redistributive Political Economy of Education. Cambridge University Press.
Avalos, Beatrice, and Jenny Assael. 2006. "Moving from Resistance to Agreement: The Case of the Chilean Teacher Performance Evaluation." International Journal of Educational Research 45(4): 254-66.
Banerjee, Abhijit, Rukmini Banerji, James Berry, Esther Duflo, Harini Kannan, Shobhini Mukerji, Marc Shotland, and Michael Walton. 2016. "Mainstreaming an Effective Intervention: Evidence from Randomized Eavluations of" Teaching at the Right Level" in India." CEPR Discussion Papers.
Banerjee, Abhijit, Selvan Kumar, Rohini Pande, and Felix Su. 2011. "Do Informed Voters Make Better Choices? Experimental Evidence from Urban India." Unpublished manuscript, Harvard university.
Banerjee, Abhijit V, Rukmini Banerji, Esther Duflo, Rachel Glennerster, and Stuti Khemani. 2010. "Pitfalls of Participatory Programs: Evidence from a Randomized Evaluation in Education in India." American Economic Journal: Economic Policy 2(1): 1-30.
Barr, Abigail, Truman Packard, and Danila Serra. 2014. "Participatory Accountability and Collective Action: Experimental Evidence from Albania." European Economic Review 68: 250-69.
Barrera-Osorio, Felipe, and Deon Filmer. 2015. "Incentivizing Schooling for Learning: Evidence on the Impact of Alternative Targeting Approaches." Journal of Human Resources.
Besley, Timothy, and Maitreesh Ghatak. 2005. "Competition and Incentives with Motivated Agents." The American economic review 95(3): 616-36.
Besley, Timothy, and Torsten Persson. 2009. "The Origins of State Capacity: Property Rights, Taxation, and Politics." American Economic Review 99(4): 1218-44.
Beuchert, Louise, Maria Knoth Humlum, Helena Skyt Nielsen, and Nina Smith. 2016. "The Short-Term Effects of School Consolidation on Student Achievement: Evidence of Disruption?".
Blanchenay, P. 2016. "Policy Experimenation in Complex Education Systems." In Governing Education in a Complex World, edited by T Burns and F Köster, Paris: OECD.
Brender, Adi. 2003. "The Effect of Fiscal Performance on Local Government Election Results in Israel: 1989–1998." Journal of Public Economics 87(9): 2187-205.
Bruns, B, and J Luque. 2014. Great Teachers: How to Raise Student Learning in Latin America and the Caribbean. Washington, DC: World Bank.
Bruns, B, and Ben Ross Schneider. 2016. "Managing the Politics of Quality Reforms in Education. Policy Lessons from Global Experience." Background paper. Washington DC: The Education Comission.
Bruns, Barbara, David Evans, and Javier Luque. 2011. Achieving World-Class Education in Brazil. publisher not identified.
Burde, Dana, and Leigh L Linden. 2012. "The Effect of Village-Based Schools: Evidence from a Randomized Controlled Trial in Afghanistan." National Bureau of Economic Research.
CAMPE. 2000. "Education Watch 1999. Hope Not Complacency: State of Primary Education in Bangladesh 1999." Dhaka: Campaign for Popular Education.
Campos, Jose Edgardo, B Randrianarivelo, and Kay Winning. 2015. "Escaping the “Capability Trap”: Turning “Small” Development into “Big” Development " International Public Management Review . 16(1): 99-131.
Carr-Hill, Roy, Caine Rolleston, Tejendra Pherali, and Rebecca Schendel. 2014. "The Effects of School-Based Decision Making on Educational Outcomes in Low-and Middle-Income Contexts: A Systematic Review."
- 11.21 -
Cassen, Robert, Sandra McNally, and Anna Vignoles. 2015. Making a Difference in Education: What the Evidence Says. Routledge.
Chang, M-C, S Shaeffer, S Al-Samarrai, A Ragatz, J. De Ree, and R Stevenson. 2013. Teacher Reform in Indonesia: The Role of Politics and Evidence in Policy Making.
Contreras, Dante, and Tomás Rau. 2012. "Tournament Incentives for Teachers: Evidence from a Scaled-up Intervention in Chile." Economic development and cultural change 61(1): 219-46.
Corrales, J. 1999. "The Politics of Education Reform: Bolstering the Supply and Demand; Overcoming Institutional Blocks." The Education Reform and Management Series: The World Bank.
De Ree, Joppe, Karthik Muralidharan, Menno Pradhan, and Halsey Rogers. 2015. "Double for Nothing? Experimental Evidence on the Impact of an Unconditional Teacher Salary Increase on Student Performance in Indonesia." National Bureau of Economic Research.
Delannoy, Françoise. 2000. Educational Reforms in Chile, 1980-1998: A Lesson in Pragmatism. The World Bank.
Devarajan, Shantayanan, and Stuti Khemani. 2016. "If Politics Is the Problem, How Can External Actors Be Part of the Solution?" World Bank Policy Research Working Paper (7761).
Di Tella, Rafael, and Ignacio Franceschelli. 2011. "Government Advertising and Media Coverage of Corruption Scandals." American Economic Journal: Applied Economics 3(4): 119-51.
Dias, M, and Claudio Ferraz. 2017. "Voting for Quality? The Impact of School Quality Information on Electoral Outcomes."
Education Commission. 2016. "The Learning Generation: Investing in Education for a Changing World."
Estrada, Ricardo. 2015. "Rules Rather Than Discretion: Teacher Hiring and Rent Extraction."
Ferraz, Claudio, and Barbara Bruns. 2012. "Paying Teachers to Perform: The Impact of Bonus Pay in Pernambuco, Brazil." Society for Research on Educational Effectiveness.
Filmer, Deon, and Norbert Schady. 2009. "School Enrollment, Selection and Test Scores." World Bank Policy Research Working Paper Series, Vol.
Finan, Frederico, Benjamin A Olken, and Rohini Pande. 2015. "The Personnel Economics of the State." National Bureau of Economic Research.
Gardner, E, and M Clarke. 2015. "Read Trust Fund Report 2008-2015." Washington D.C.: World Bank Group.
Global Campaign for Education. 2014. "Civil Society Advocacy: Good Practice Case Studies from Africa."
Grandvoinnet, Helene, Ghazia Aslam, and Shomikho Raha. 2015. Opening the Black Box: The Contextual Drivers of Social Accountability. World Bank Publications.
Green, Duncan. 2016. How Change Happens. Oxford: Oxford University Press.
Grindle, Merilee Serrill. 2004. Despite the Odds: The Contentious Politics of Education Reform. Princeton University Press.
Heilmann, Sebastian. 2008. "Policy Experimentation in China’s Economic Rise." Studies in Comparative International Development 43(1): 1-26.
J-PAL, and Innovations for Poverty Action. 2013. "Implementación Del Laboratorio De Innovación Costo-Efectiva De La Política Educativa: Minedulab."
Jakubowski, Maciej. 2015. "Opening up Opportunities: Education Reforms in Poland." IBS policy papers 1.
Jakubowski, Maciej, Harry A Patrinos, Emilio Ernesto Porta, and Jerzy Wisniewski. 2010. "The Impact of the 1999 Education Reform in Poland." World Bank Policy Research Working Paper Series, Vol.
Khemani, Stuti. 2015. "Buying Votes Versus Supplying Public Services: Political Incentives to under-Invest in Pro-Poor Policies." Journal of Development Economics 117: 84-93.
Leftwich, Adrian. 2009. "Bringing Agency Back In: Politics and Human Agency in Building Institutions and States." DLP Research Paper 6.
Levy, B, Robert Cameron, U Hoadley, and Vinothan Naidoo. 2016. "The Politics of Governance and Basic Education: A Tale of Two South African Provinces."
Machin, Stephen, and Sandra McNally. 2008. "The Literacy Hour." Journal of Public Economics 92(5): 1441-62.
Mansuri, Ghazala, and Vijayendra Rao. 2012. Localizing Development: Does Participation Work? : World Bank Publications.
McNally, Sandra. 2015. "Numeracy and Mathematics." In Making a Difference in Education: What the Evidence
- 11.22 -
Says, edited by Robert Cassen, Sandra McNally and A Vignoles, Abingdon, UK: Routledge.
Mizala, Alejandra, and Ben Ross Schneider. 2014. "Negotiating Education Reform: Teacher Evaluations and Incentives in Chile (1990–2010)." Governance 27(1): 87-109.
Mullis, I. V. S., M. O. Martin, P. Foy, and M. Hooper. 2016. "Timss 2015 International Results in Mathematics. Retrieved from Boston College, Timss & Pirls International Study ".
OECD. 2016a. "Making Development Co-Operation More Effective: 2016 Progress Report." Paris.
———. 2016b. Pisa 2015 Results (Volume I). OECD Publishing.
Pascale, Richard T, Jerry Sternin, and Monique Sternin. 2010. The Power of Positive Deviance: How Unlikely Innovators Solve the World's Toughest Problems. Harvard Business Press.
Rath, A, P Branch, D Kishekya, C Kihinga, T Smutylo, and K Rassmann. 2015. "Evaluation Twaweza: Tanzania 2009-2014." Project Services International.
Reinikka, Ritva, and Jakob Svensson. 2011. "The Power of Information in Public Services: Evidence from Education in Uganda." Journal of Public Economics 95(7): 956-66.
Results for Development Institute. 2015. "Bringing Learning to Light: The Role of Citizen-Led Assessments in Shifting the Education Agenda." Washington DC: Results for Development Institute.
Rosser, A, and A Joshi. forthcoming. "Using Courts to Realize Education Rights and Create Opportunities to Improve Learning." World Development Report 2018 Background Paper.
Sabarwal, S, A Joshi, and W Blackmon. forthcoming. "A Review of the World Bank's Results-Based Financing Mechanism Used for Tanzania's Big Results Now in Education Program: A Process Evaluation." Washington DC: World Bank.
Sabel, C, and L Jordan. 2015. "Doing, Learning, Being: Some Lessons Learned from Malaysia's National Transformation Program."
Snilstveit, B, J Stevenson, David Phillips, M Vojtkova, E Gallagher, T Schmidt, H Jobse, M Geelen, and M Pastorello. 2015. "Interventions for Improving Learning Outcomes and Access to Education in Low- and Middleincome Countries."
Stannard, John, and Laura Huxford. 2007. The Literacy Game: The Story of the National Literacy Strategy. Routledge.
Sutcliffe, S, and J Court. 2005. "Evidence-Based Policymaking: What Is It? How Does It Work? What Relevance for Developing Countries." Overseas Development Institute.
Tanner, E, A Brown, N Day, M Kotecha, N Law, G Morrell, O Turczuk, V Brown, A Collingwood, and H Chowdry. 2010. "Evaluation of Every Child a Reader (Ecar). Department of Education." Research Report DFE-RR114.
Todd, Robin, and I Attfield. 2017. "Big Results Now! In Tanzanian Education: Has the Delivery Approach Delivered?".
Toral, Guillermo. 2016. "When Are Local Governments and Bureaucrats Held Accountable for the Quality of Public Services? Evidence from Brazil's Education Sector."
UNDP. 2011. "Mexico: Scaling up Progresa/Oportunidades – Conditional Cash Transfer Programme."
UNESCO-UIS. 2016. "Laying the Foundation to Measure Sustainable Development Goal 4." Montreal: UNESCO Institute of Statistics.
UNESCO. 2015. "Civil Society Education Fund 2013-2014/15: Biannual Progress and Supervision Report."
WDR 2018 team. 2016. Case Study of Chile's Pay for Performance Reforms, 1995-2005. Forthcoming background note for the World Development Report 2018
Washington, D.C. World Bank.
Wojciuk, A. 2017. "Poland: A Notorious Case of Shock Therapy."
World Bank. 2016. "Driving Performance from the Center: Malaysia's Experience Wiht Pemandu."
———. 2017a. "Driving Performance from the Center: Malaysia’s Experience with Pemandu."
———. 2017b. "World Development Report 2017: Governance and the Law." Washington D.C: The World Bank.


