Embed Size (px)
Citation preview

Funct Integr Genomics (2006) 6: 235–249DOI 10.1007/s10142-005-0016-x
ORIGINAL PAPER
Siok Hwee Tan . Antonio Reverter . YongHong Wang .Keren A. Byrne . Sean M. McWilliam .Sigrid A. Lehnert
Gene expression profiling of bovine in vitroadipogenesis using a cDNA microarray
Received: 15 July 2005 / Revised: 4 October 2005 / Accepted: 8 October 2005 / Published online: 10 February 2006# Springer-Verlag 2006
Abstract The gene expression profile of bovine bone mar-row stromal cells undergoing adipogenesis was establishedusing a custom cDNA microarray. Cells that were treatedwith adipogenic stimulants and those that were not werecollected at each of the six time points, and gene expressiondifferences between the treated and untreated samples withineach time point were compared using a microarray. Sta-tistical analyses revealed that 158 genes showed a minimumfold change of 2 in at least one of the five post-differentiationtime points. These genes are involved in various cellularpathways and functions, including lipogenesis, glycolysis,cytoskeleton remodelling, extracellular matrix, transcriptionas well as various signalling pathways such as insulin, cal-cium andwingless signalling. The experiment also identified17 differentially expressed (DE) microarray elements withno assigned function. Quantitative real-time PCR was em-ployed to validate eight DE genes, and the PCR data werefound to reproduce the microarray data for these eight genes.Subsequent gene ontology annotation was able to provide aglobal overview of the molecular function of DE genesduring adipogenesis. This analysis was able to indicate theimportance of different gene categories at various stages ofadipogenic conversion, thereby providing further insightsinto the molecular changes during bovine adipogenesis.
Keywords Bovine . cDNA microarray . Adipogenesis .Gene expression
Introduction
In order to improve consumer perception of beef products,it is important to design appropriate breeding programs toproduce quality beef products at a competitive cost. Meatquality can be defined as the attractiveness of meat toconsumers (Wood et al. 1999), and it has important eco-nomic implications for livestock production (Novakofski2004). A number of attributes affect the quality of meat,and one of the most important factors includes eatingquality. One important component of eating quality is ten-derness, where tough meat is assessed as unacceptable(Wood et al. 1999). A contributing element towards thesensory appeal of meat is the amount, distribution and typeof fat.
Besides influencing meat tenderness, fat tissue also haseconomic effects towards production costs (Wood et al. 1999).The amount of feed required for lipid synthesis is highercompared to muscle production costs (Novakofski 2004). Inaddition, the deposition of fat in different locations can havelarge economic impacts. This is illustrated by the fact that thelaying down of fat within the muscle gives rise to a piece ofhighly valued marbled meat (Pethick et al. 2005), while thedeposition of fat in other areas such as the subcutaneous areacauses wastage, as this fat is normally discarded to meet thedemands of health-conscious consumers. Therefore, one ofthe desirable goals for livestock production is the ability tomanipulate the rate of fat deposition. To enable this aim to beachieved, more detailed knowledge of the molecular andcellular events around adipogenesis must first be gained toeventually facilitate this type of technology.
Recently, adult bone marrow stromal cells have beenshown to be a good source of mesenchymal stem cells thatare able to differentiate into a variety of cell types in vitroand in vivo (Pittenger et al. 1999). They therefore representa readily available pool of general progenitor cells that canbe easily obtained for cell differentiation studies. In this
Electronic Supplementary Material Supplementary Material isavailable in the online version of this article at http://dx.doi.org/10.1007/s10142-005-0016-x.
S. H. Tan (*) . A. Reverter . Y. Wang . K. A. Byrne .S. M. McWilliam . S. A. LehnertThe Cooperative Research Center for Cattle and Beef Quality,CSIRO Livestock Industries, Queensland Bioscience Precinct,306 Carmody Road,St. Lucia, Qld 4067, Australiae-mail: [email protected].: +61-7-32142458Fax: +61-7-32142480
S. H. TanThe Cooperative Research Center for Cattle and Beef Quality,Faculty of the Sciences, University of New England,Armidale, NSW 2351, Australia

study, a cDNA microarray constructed using bovine longis-simus dorsi muscle and subcutaneous fat tissues (Lehnert etal. 2004) was used to measure changes in the expression ofgenes during adipogenic conversion of bovine bone marrowstromal cells. During the differentiation, cells that weretreated with adipogenic stimulants and those that were notwere collected at six time points, and gene transcriptdifferences between treated and untreated cells within eachtime point were determined. This study identified a total of158 genes that showed differential expression. Gene ontol-ogy annotation was used to further determine the molecularfunction of the differentially expressed (DE) genes as well astheir distribution during the time-course of adipogenic celldifferentiation.
Materials and methods
Cell culture and differentiation
Bone marrow was extracted from the femur of a thirdtrimester bovine fetus using a syringe. The extract wastransferred immediately to a tissue culture flask containingRPMI 1640 (Invitrogen, Carlsbad, CA, USA) supplement-ed with 20% fetal calf serum, 200 units/ml of penicillin and200 μg/ml of streptomycin. The cells were allowed toadhere in a humidified incubator at 37°C with 5% CO2.Non-adherent cells were discarded after 1 day. Cells atpassage 7 were allowed to grow to confluence, and the adi-pogenic cocktail was added at confluence. The adipogenicinduction medium consists of 10 μg/ml of insulin (ICN,Costa Mesa, CA, USA), 0.5 mM of 3-isobutyl-1-methyl-xanthine (Sigma, St. Louis, MO, USA), 100 ng/μl ofdexamethasone (Sigma), 17 μM of biotin (Sigma) and20 μM of ciglitazone (Tocris, Ellisville, MO, USA) in 1:1DMEM/F-12 media (Invitrogen) supplemented with 10%fetal bovine serum (FBS), 200 units/ml of penicillin and200 μg/ml of streptomycin. Untreated cells were fed with1:1 DMEM/F-12 media supplemented with 10% FBS,200 units/ml of penicillin and 200 μg/ml of streptomycin. Inaddition, the media that were fed to the untreated cellscontained the same amount of solvents that were used todissolve the adipogenic stimulation chemicals that wereadded into the treated cells. Media were replaced every3 days. Treated and untreated samples were collected at 0 h,6 h, 24 h, 3 days, 6 days and 14 days post-differentiation.Phase contrast photomicrography as well as oil red O stain(Sen et al. 2001) were undertaken to detect the presence oflipid droplets. During each RNA collection, media wereremoved and the cells were detached from the flask using5 ml of TRIzol (Invitrogen).
Intracellular lipid droplets were measured after the cellswere stained with oil red O. A total of 30 lipid droplets thatstained positive were randomly selected using the photo-graphs taken for each treatment. A scale bar was photo-graphed at the same magnification as the cells and was usedas a standard to measure the size of the lipid droplets usingSigmaPlot software (Systat, Point Richmond, CA, USA).The size of 30 randomly selected lipid droplets in each of
the treatments was measured in square millimetres andaveraged to give the average size of lipid droplets pertreatment.
Total RNA extraction
Total RNA was isolated from the cells using TRIzol,according to the manufacturer’s instructions. Contaminat-ing genomic DNA was removed from all RNA samplesusing the RNase-Free DNase Set (Qiagen, Valencia, CA,USA), and DNase-treated total RNAwas purified using theRNeasy mini kit (Qiagen). The integrity and concentrationof purified RNA were assessed by 1× Tris–acetate–EDTA(TAE) agarose gel electrophoresis and spectrophotometryreadings at 260 and 280 nm.
Reverse-transcription PCR of wingless (WNT) 10B
A PCR reaction that consisted of 1× PCR buffer (FisherBiotec, Perth, Australia), 3 mM of MgCl2, 62.5 μM ofdNTPs, 0.2 pmol of WNT10B 001Fwd (5′ CAGTGGTGAGCAGGATCGAC 3′), 0.2 pmol of WNT10B Rev2 (5′AGGTTTTCAGTTACCACCTGACG 3′), 1.1 units of Tthpolymerase (Fisher Biotec) and 0.5 μl of undiluted cDNAwas made up in a total volume of 20 μl. The PCR wascarried out in an initial denaturation at 94°C for 1 min. Thiswas followed by 35 cycles of 94°C for 45 s, 60°C for 45 sand 72°C for 45 s, 1 cycle of 94°C for 1 min, 60°C for1 min and 72°C for 5 min. Ten microlitres of the ampliconwas electrophoresed on a 2% TAE agarose gel.
RNA amplification and microarray hybridization
Two micrograms of total RNA was amplified using theMessageAmp aRNA Kit (Ambion, Austin, TX, USA),according to the manufacturer’s instructions. Amplified anti-sense RNA (aRNA) was eluted using 50 μl of nuclease-freewater and subsequently quantified using the RNA 6000Assay on the 2100 bioanalyser (Agilent Technologies, PaloAlto, CA, USA).
Five micrograms of aRNA from each sample waslabelled and hybridized onto the microarray slide as de-scribed (Lehnert et al. 2004), with the exception of thepurification methods after first-strand cDNA synthesis andcDNA labelling. The microarray consists of a total of 9,600cattle probes, comprising cDNAs from the bovine skeletalmuscle and subcutaneous fat cDNA libraries, as well asMARC bovine EST libraries and oligonucleotide probes(Lehnert et al. 2004). After cDNA synthesis, the cDNAwaspurified using a modified QIAquick PCR purificationmethod (Qiagen; Hegde et al. 2000). The bound cDNAwaseluted using a total of 80 μl of phosphate elution buffer,and the eluant was concentrated using a SpeedVac (SavantInstruments, Holbrook, NY, USA) concentrator to a finalvolume of 4.5 μl. The cDNAwas labelled by incubating thecDNA and dye (Cy3 and Cy5 post-labelling reactive dye
236

pack, Amersham Biosciences, Piscataway, NJ, USA) in asolution of 0.05 M of Na2CO3 (pH 9.0) for 1 h at roomtemperature. The labelled cDNA was then purified usingthe Cyscribe GFX purification kit (Amersham Biosci-ences), according to the manufacturer’s instructions. Thepurified cDNA was eluted using 60 μl of elution buffer.The assessment of the integrity and labelling efficiency ofthe labelled cDNA targets, as well as the subsequentmicroarray hybridizations and washes, was carried out aspreviously described (Lehnert et al. 2004).
Experimental design and data analysis
A total of 15 slides were used in this analysis. In themicroarray hybridizations, direct comparisons were madebetween the treated and untreated cells within each of thesix time points. One dye swap was included at each of thetime points to measure the effect of dye bias. Threeadditional hybridizations were undertaken: a comparisonbetween untreated cells at time 0 (labelled with Cy5) anduntreated cells at 3 days (labelled with Cy3), a secondhybridization comparing treated cells at 14 days (labelledwith Cy5) with untreated cells at 6 h (labelled with Cy3), aswell as a ‘self–self’ hybridization, where the cell sample at0 h was labelled with both Cy3 and Cy5. Two criteria wereset for data acquisition:
(1) Signals were included if the foreground intensity wasgreater than the background intensity for both the redand green channels.
(2) Data used in subsequent analysis had to have acorrelation of mean to median of more than 0.85.
This ratio was measured by dividing the smallest of themean and median by the larger one (Tran et al. 2002).Intensity records were background-corrected and base 2log-transformed. The intensities obtained were analysed byfitting an ANOVA linear mixed model to achieve normal-ized data and estimate differential expression of genesduring adipogenic conversion. The mixed model used inthis study was as follows:
yijkvr ¼ �þ Ci þ Gj þ ðAGÞkj þ ðVGÞvj þ "ijkvr
where yijkvr is the measured intensity (background-corrected and base-2 logarithmic-transformed) from com-parison group i (defined as the group of those intensitiesoriginating from the same array slide, printing block anddye channel), gene j, array k, variety v (defined as cell line,treated or untreated, and time point, with six levels) andrepetition r. The effects in Ci were fitted as fixed and aimedat normalizing the data by accounting for systematiceffects. The random gene effect Gj contains the averagelevel of gene expression (averaged over the other factors).The random gene × array interaction effect in (AG)kjmodels the effects for each spot. The effect of interest is therandom interaction between genes and variety treatments,(VG)vj, because it captures differences from overall aver-
ages that are attributable to specific combination of varietyv and gene j. Finally, ɛijkvr is the random error term.
It was assumed that Gj, (AG)kj, (VG)vj and ɛijktr wereindependent with zero mean and variance between genes(σg
2), between genes within arrays (σkj2), between genes
within variety (σvj2) and within genes (σɛ
2), respectively.The restricted maximum likelihood (REML) estimates ofvariance components and best linear unbiased predictions(BLUP) were obtained using the VCE software (Groeneveldand Garcia-Cortes 1998).
At time t (t=6 h, 24 h, 3 days, 6 days and 14 days), thedifference in gene expression for gene j (j=1 to 5,418)under the treated condition compared with untreated con-dition is estimated by
dtj ¼ VGð Þ^ t
TREATED; j � VGð Þ^ t
UNTREATED; j
� �
� VGð Þ^ 0
TREATED; j � VGð Þ^ 0
UNTREATED; j
� �
Large positive and negative djt values are likely to belong
to genes whose expression is up- and down-regulated,respectively, due to the treatment. Similar to the statisticalapproach described (Reverter et al. 2003; Moser et al.2004), the goal here is to apply model-based cluster anal-ysis to the preprocessed gene expression levels in dj
t andinvestigate which genes will have relative levels far awayfrom the majority. DE genes were identified using theEMMIX software (McLachlan et al. 1999) for model-basedclustering using mixtures of normal distributions.
Sequencing and gene annotation
PCR products generated using M13 universal forward andreverse primers were sequenced using direct 5′ sequencingas previously described (Wang et al. 2001). Gene anno-tation of sequences was carried out by conductingBLASTN and BLASTX (Altschul et al. 1990) searchesagainst GenBank non-redundant and human referencesequence data sets at National Centre for BiotechnologyInformation (NCBI). In addition, BLASTN results werealso conducted against Interactive Bovine In Silico SNP(IBISS) database (Hawken et al. 2004). After annotatingthe sequence, gene ontology (Ashburner et al. 2000) as-signments for each of the genes were subsequently con-ducted using the Entrez Gene (http://www.ncbi.nlm.nih.gov/entrez/query.fcgi?db=gene) data sets at NCBI.
Quantitative real-time PCR
The eight genes that were chosen to validate the microarraydata using quantitative real-time PCR included CARP,CTGF, CRYAB, FABP4, SFRP4, SFRP5, SRPX as well asan unknown hypothetical protein MGC3047. Other thanthe hypothetical protein MGC3047, each of the real-time
237
PCR primer pairs contains an oligonucleotide that spansacross potential intron–exon boundaries. The intron–exonboundaries were predicted in IBISS by comparing thebovine contigs generated against the human reference se-quence. Standards were generated for each gene by cloningthe PCR products into pGEM-T Easy vector (Promega,Madison, WI, USA). The concentration of the plasmidDNA linearized with SacI was determined by spectropho-
tometry readings. The number of gene molecules wascalculated (Pfaffl et al. 2002), and the plasmid DNA wasused to generate standard template concentrations of 102–108 molecules/μl.
Two micrograms of total RNA was reverse-transcribedto first-strand cDNA using 250 ng of random primers and400 units of Superscript II (Invitrogen) in a total volume of60 μl, according to the instructions given by the man-
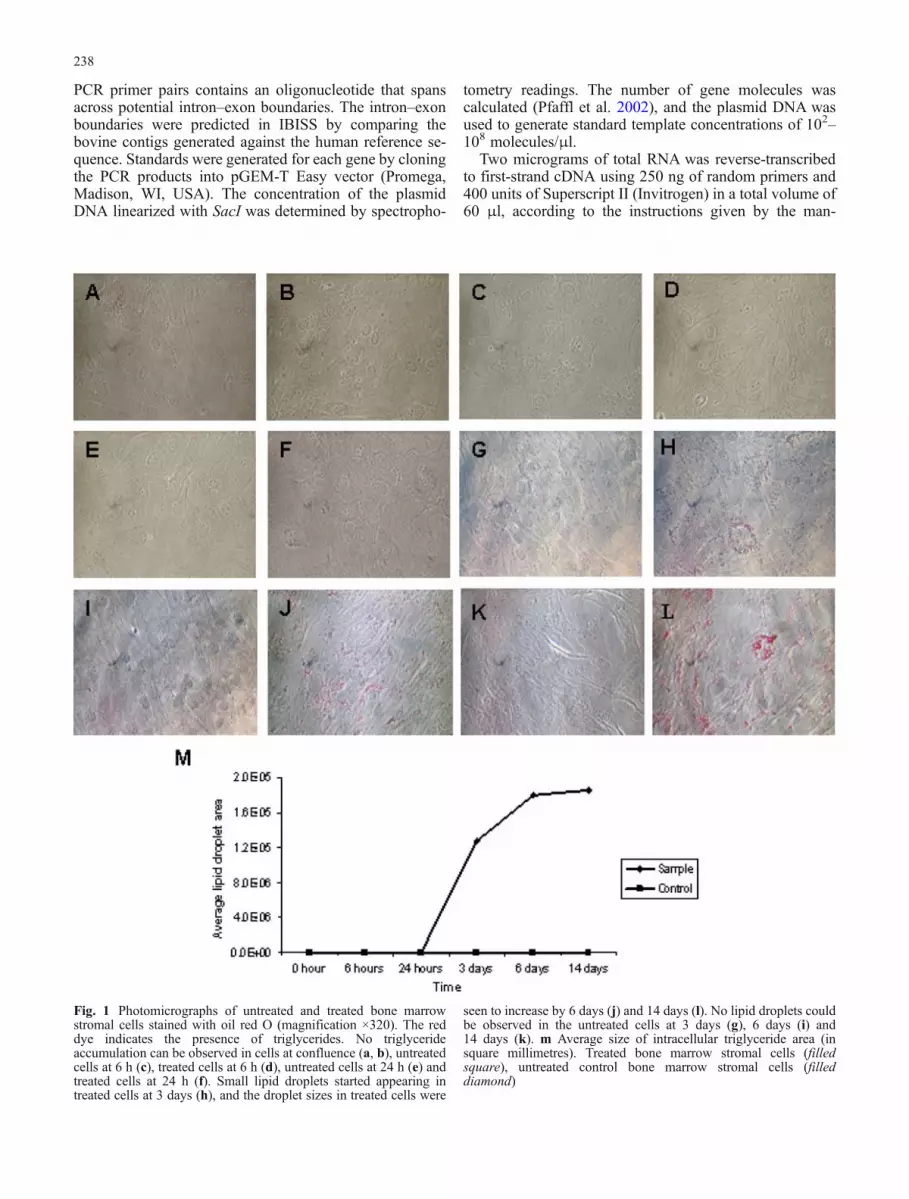
Fig. 1 Photomicrographs of untreated and treated bone marrowstromal cells stained with oil red O (magnification ×320). The reddye indicates the presence of triglycerides. No triglycerideaccumulation can be observed in cells at confluence (a, b), untreatedcells at 6 h (c), treated cells at 6 h (d), untreated cells at 24 h (e) andtreated cells at 24 h (f). Small lipid droplets started appearing intreated cells at 3 days (h), and the droplet sizes in treated cells were
seen to increase by 6 days (j) and 14 days (l). No lipid droplets couldbe observed in the untreated cells at 3 days (g), 6 days (i) and14 days (k). m Average size of intracellular triglyceride area (insquare millimetres). Treated bone marrow stromal cells (filledsquare), untreated control bone marrow stromal cells (filleddiamond)
238

ufacturer. Real-time PCR was conducted using 2.5 μl of 2×SYBR Green I Master Mix buffer (Applied Biosystems,Foster City, CA,USA), 1μl of undiluted cDNAand optimizedconcentrations of forward and reverse primers. The primersequences were designed to yield PCR product size of 150–250 bp. The forward and reverse primers for the eight genestested are as follows: CARP forward (5′ GACAGAACCTGTGGATGTGC 3′) and reverse (5′ ACGATTGCCAAATGTCCTTC 3′); CRYAB forward (5′ TCAGAGATGCGTCTGGAGAA 3′) and reverse (5′ TCCGGTATTTCCTGTGGAAC 3′); CTGF forward (5′ GAAAGGCAAAAAGTGCATCC3′) and reverse (5′TTCTTCATGACCTCCCCATC3′);FABP4 forward (5′ CGTGGG CTTTGCTACCAG 3′) andreverse (5′ TGGTTGATTTTCCATCCCAG 3′);MGC3047forward (5′ TCTTGGCGT CTGGGTCAG 3′) and reverse(5′ CTGGAGCAGGGTAAGCAGAG 3′); SFRP4 forward(5′ GATCTTCAAGT CCTCATCACCC 3′) and reverse (5′GCCTCTCT TCCCACTGTATGG 3′); SFRP5 forward (5′CCTCCAGTGACCAAGATCTGTG 3′) and reverse (5′ TTCTTCATGTGCAGCACGAG 3′); SRPX forward (5′ GCAGCTCAGGCTGTTGC 3′) and reverse (5′ TCAGGTGTTACAGGTCTGGC 3′). All PCR reactions were carriedout using primers with final concentration of 250 nM, withthe exception of MGC3047 and SFRP4, where 500 and200 nM of final primer concentration was used, respec-tively. Each sample reaction was carried out in four rep-licates, and reactions were run using ABI PRISM 7900HTSequence Detection System (SDS) software (version 2.1;Applied Biosystems) using cycling parameters recom-mended by the manufacturer. For each of the eight genesinvestigated, the SDS software (Applied Biosystems) wasused to plot standard curves of threshold cycle (CT) valuesagainst copy numbers using the linearized plasmid DNAstandards. The number of gene copies in each sample wasthen interpolated from the standard curve by using theaverage CT values for each of the replicates for each cDNAsample. When the number of gene copies in the treatedsample is more than the untreated sample at each timepoint, the fold change was calculated by dividing the re-sults for the treated sample by the untreated sample foreach of the time points. When the number of gene copiesin the untreated sample is greater compared to the treatedsample at each time point, the fold change was calculat-ed by dividing the results for the untreated sample bythe treated sample within each of the time points, follow-ed by the addition of a negative sign to signify a down-regulation.
Gene ontology distribution
For each of the DE genes, the corresponding human GeneIDwas uploaded into Genome Function INtegrated Discoverer(GFinder; Masseroli et al. 2004; http://www.medinfopoli.polimi.it/GFINDer/). GFinder is a web server that retrievesthe annotations for a list of genes and performs functionalcategorization of genes to subsequently present a tabularvisualization of the resulting gene functional classes. As themolecular roles of these DE genes are the core interests in
this thesis, the “molecular function” of the gene ontology(Ashburner et al. 2000), rather than “biological process” or“cellular component”, was used to investigate the functionsof these genes. The percentage of DE genes that belongs toeach molecular function across each time point was cal-culated for all DE genes, the up-regulated genes and thedown-regulated genes.
Results
Induction of adipogenesis in bovine bonemarrow stromal cells
Stromal cells isolated from the bone marrow in this exper-iment showed no visible lipid accumulation before induction.These cells were allowed to grow to confluence before theadipogenic induction medium was added. At confluence, nolipid droplets were seen in the cells (Fig. 1). Similar ob-servations were seen at 6 and 24 h post-differentiation. By3 days post-differentiation, small lipid droplets started ap-pearing in the treated cells. The lipid droplets were still visibleby 6 and 14 days post-differentiation. On the contrary, novisible lipid droplets can be seen in the untreated cells at any ofthe six collection time points. When the lipid droplet area wasmeasured, acceleration in the size of the lipid droplets in thetreated cells after 24 h of experimentation was observed(Fig. 1). The largest lipid droplets were detected at 14 dayspost-differentiation, while the most prominent change indroplet size occurred between 24 h and 3 days. At the end ofthe experiment, approximately 70% of the treated cells wereobserved to fully differentiate to adipocytes. No other cellmorphologies were observed throughout the experiment,suggesting that spontaneous differentiation of other cell typesdid not take place.
To assess the occurrence of adipogenesis at the mRNAlevel, the gene expression of WNT10B, a known inhibitorof adipogenesis (Ross et al. 2000), was measured duringthe differentiation process. Figure 2 shows that the ex-pression of WNT10B was markedly reduced during theadipogenic induction in the treated cells, and its expressionwas not detectable by 3 days post-induction. In contrast,the gene expression level did not decrease in the untreatedcells, and WNT10B could still be detected at 14 days post-differentiation.
Fig. 2 Determination of WNT10B expression using reverse-tran-scription PCR. Gene expression of WNT10B during adipogenicdifferentiation of bone marrow stromal cells was investigated. N Notemplate, negative control; P positive control (WNT10B plasmidDNA); − untreated cells on each sampling day; + treated cells oneach sampling day
239

DE genes during adipogenesis
The analysis of the microarray data involves the compar-ison of differences between treated and untreated cellswithin each of the time points, i.e. treated cells at time 1 vsuntreated cells at time 1. This pairwise comparison approachallows the differences between cells that are stimulated tobe compared directly against cells that did not undergo anytreatments. A total of 364 microarray elements representing158 genes were found to have a minimum fold change of 2in at least one of the five post-differentiation time pointsbetween the treated and untreated cells. Some of these DEgenes are presented in Table 1. The full table can be down-loaded from the supplementary material (SupplementaryTable S1). The genes are divided into nine functional groups.These groups include genes that are adipose-related, genesinvolved in RNA transcription and protein turnover, gly-colysis, energy metabolism, signalling, cytoskeleton, extra-cellular matrix (ECM), cell adhesion and immune response.Genes that cannot be classified into these categories aregrouped under ‘others’.
A total of five adipose-related genes were found to beDE in this experiment (Table 1). Most of these genes areinvolved in lipid metabolism. No differential expressionof adipose-related genes could be detected at 6 h post-differentiation. At 24 h post-differentiation, FABP4 and LEPwere found to be negatively regulated. From 3 days post-differentiation, genes in this category were positivelyregulated.
Twenty-six genes involved in RNA synthesis and proteinturnover, representing 31 microarray elements, were differ-entially regulated (Table 1). Two core adipogenic transcriptionfactors, C/EBPα and SREBF1, were found to be down- andup-regulated, respectively. NOTCH3 exhibited an interestingexpression trend, where it was firstly up-regulated by morethan 2-fold at 6 h post-differentiation and then down-regulatedby more than 10-fold at 24 h post-differentiation. Overall, themajority of the genes were down-regulated in this category.The largest number of positively regulated genes occurred at14 days post-differentiation, while the largest number ofdown-regulated genes was seen at 6 h. Genes involved inprotein turnover including EEF1A1 and EIF4EBP2 weredown-regulated at the start of the experiment, while genessuch as SUI1,RPS2 andRPL24were up-regulated after 3 dayspost-differentiation. Proteases such asCTSH,CTSK andCTSSwere negatively regulated in this experiment.
Ten glycolysis genes were found to be up-regulatedthroughout the whole experiment (Supplementary Table S1).All of these genes were consistently up-regulated duringadipogenesis. Similar to glycolysis genes, most of the 10genes associated with energy homeostasis were found to bepositively regulated in this experiment (SupplementaryTable S1).
A total of 22 signalling genes were also found to be DEin this experiment (Table 1). Most of the genes in thiscategory were positively regulated. The DE genes includecalcium signalling genes such as CALM1 and ANXA1. Inaddition, two genes associated with Wnt signalling (SFRP4and SFRP5) were also found to be up-regulated. Increased
transcript levels of insulin-like growth factor signallinggenes were found during the adipogenic conversion. Theseinclude IGFBP3, IGFBP4 and IGFBP5. Of these insulinsignalling genes, IGFBP5 exhibited the greatest increaseof about 20-fold difference at 14 days post-differentiation.Within these 22 signalling genes, only 6 were negativelyregulated. CARP was seen to have the largest down-regu-lation of 10-fold at 3 days post-differentiation.
The transformation of fibroblastic cells to spherical-shaped adipocytes involves drastic cell shape changes, inturn causing changes in cytoskeleton and ECM genes.These large cellular shape changes that occur during adipo-genesis are reflected in changes of 22 cytoskeleton and 10ECM genes (Table 1 and Supplementary Table S1). All thecytoskeleton genes showed a similar pattern. The cyto-skeleton genes that were found to be DE at 6 and 24 h post-differentiation were all negatively regulated. ACTB, TUBA1and SMPX were the only cytoskeletal genes found to be DEat 3 days post-differentiation, and they were both positivelyregulated at this time point. At 6 days post-differentiation,most of the DE genes were found to be up-regulated, whilemost of the DE genes at 14 days post-differentiation werenegatively regulated.
In this experiment, 10 ECM genes showed variable geneexpression patterns (Supplementary Table S1). COL5A3,CTGF, ELN, MGP, MMP11 and TIMP3 had an overalldecrease in gene expression pattern throughout the exper-iment. With the exception of COL5A3, a general increase incollagen gene expression could be detected in this experi-ment. Genes that were predominantly up-regulated includedtwo subtypes of collagen type I (COL1A1 and COL1A2),COL12A1 and HYAL1.
Only four genes associated with cell adhesion were foundto be DE in this experiment (Supplementary Table S1).Interestingly, these genes were only found to be DE at thebeginning (6 h) and end (14 days) of the experiment.
Forty-two DE genes did not fit into the nine categoriesmentioned above (Supplementary Table S1). These includegenes that do not have any known functions, for exampleDYSFIP1, JPH1 and SQSTM1. A large number of DEgenes in this category also corresponded to microarrayelements that could not be annotated with respect toputative identity or function using BLAST searches. Of the45 genes in this category, a total of 17 microarray elementseither matched to hypothetical proteins with no assignedfunctions or did not return statistically significant matchesfollowing BLAST searches.
Validation of microarray results using real-time PCR
To confirm the microarray data, eight genes that were foundto be DE in the microarray experiment were selected forvalidation using quantitative real-time PCR. These geneswereCARP,CTGF,CRYAB, FABP4, SFRP4, SFRP5, SRPXas well as an unknown hypothetical proteinMGC3047. Theabsolute quantification method (Tichopad et al. 2003) waschosen for this experiment, and for each of the eight genes,linearized plasmid DNAwas used to plot a standard curve
240

Table 1 Selected genes that are found to have an average fold change of more than 2 between treated and untreated cells in at least one ofthe five post-differentiation time points (P<0.001)
DE genes No. DEelements
GenBankAccession
6 h 24 h 3 days 6 days 14 days
Adipose-relatedAdipocyte differentiation-related protein (ADRP) 1 AW415544 – – 2.76 – –Fatty acid binding protein 4 (FABP4) 8 CF613998 – −2.45 – 2.26 –Leptin (LEP) 1 AW481140 – −2.77 – – –Microsomal glutathione S-transferase 3 (MGST3) 4 CF614210 – – – 2.34 2.73Stearoyl-CoA desaturase (SCD) 6 CF613991 – – – 3.73 4.07Transcription and protein turnoverAE binding protein 1 (AEBP1) 1 CF613740 – – – – −2.12Alpha B-crystallin (CRYAB) 4 CF615584 −2.92 −4.81 −4.10 −2.74 −4.48B-cell CLL/lymphoma 11A (zinc finger protein) (BCL11A) 1 CO729203 – −4.61 – −3.67 −3.94Cathepsin H (CTSH) 1 AW658708 – – – – −2.05Cathepsin K (CTSK) 1 CF614956 – – −3.27 −2.74 −3.54Cathepsin S (CTSS) 1 CF614539 – – – −2.35 –CCAAT/enhancer binding protein, alpha (C/EBPA) 1 BE749915 – – −2.38 – –Cold shock domain protein A (CSDA) 4 CF615315 – 2.04 – – –Delta sleep inducing peptide, immunoreactor (DSIPI) 1 CF615663 – 4.05 – 2.36 –DNA-damage-inducible transcript 3 (DDIT3) 1 BE755660 – – – – −2.25Eukaryotic translation elongation factor 1 alpha (EEF1A1) 1 CF614239 −2.14 – – – –Eukaryotic translation initiation factor 4E binding protein 2 (EIF4EBP2) 1 CF614271 −2.61 – – – –GLIS family zinc finger 2 (GLIS2) 1 CF615686 −2.03 – – – –Heat shock protein, alpha-crystallin-related, B6 (HSPB6) 1 CF615526 −2.32 – −2.95 – –Notch homolog 3 (NOTCH3) 1 AW417693 2.26 −10.26 – – –Protein inhibitor of activated STAT, 3 (PIAS3) 1 CF615636 – – – – −2.78Protein kinase H11 (H11) 2 CF615304 −2.19 −2.78 – – –Putative translation initiation factor (SUI1) 2 CF614223 – – – – 2.46Prothymosin, alpha (PTMA) 1 CF615675 – – – – 2.21Ribosomal protein L24 (RPL24) 1 CF615705 – – – – 2.26Ribosomal protein S2 (RPS2) 1 CF614209 – – 4.14 – –Ring finger protein 103 (RNF103) 2 CF615625 −3.44 – – – –Sterol regulatory element binding transcription factor 1 (SREBF1) 1 BE808588 – – 6.47 4.07 4.08SWI/SNF related, matrix associated, actin dependent regulator ofchromatin, subfamily E, member 1 (SMARCE1)
1 CF614245 – – – – −2.76
Ubiquitin A-52 residue ribosomal protein fusion product 1 (UBA52) 1 CF614262 −2.44 – – – –Ubiquitin protein ligase E3A (UBE3A) 1 CF614275 – – – – −2.03SignalingAdenylate cyclase 2 (ADCY2) 1 CF615444 – – – – 2.98Adenylyl cyclase-associated protein 1 (CAP1) 1 CF614221 – – – 2.40 –Annexin 1 (ANXA1) 1 BF706671 – – 2.27 2.23 –Annexin A5 (ANXA5) 1 CF614235 – – – 2.20 –Apelin (APLN) 1 CF614177 – 4.60 5.49 6.19 6.76Calmodulin 1 (CALM1) 3 CF615718 2.94 – 3.72 – –Cardiac ankyrin repeat protein (CARP) 2 CF615596 −7.11 −5.21 −10.68 −3.27 −4.21Chemokine (C-C motif) ligand 2 (CCL2) 2 CF615649 – 2.85 2.29 3.03 3.02Fibroblast growth factor receptor 3 (FGFR3) 1 CF615557 −2.64 – – – –Growth factor receptor-bound protein 10 (GRB10) 1 BE751172 4.02 – – – –Insulin-like growth factor binding protein 3 (IGFBP3) 1 BE682286 – 7.83 – 10.65 6.87Insulin-like growth factor binding protein 4 (IGFBP4) 1 AW669882 – 5.93 – 2.90 4.14Insulin-like growth factor binding protein 5 (IGFBP5) 5 BF076225 – 4.35 12.93 16.94 19.28
241

DE genes No. DEelements
GenBankAccession
6 h 24 h 3 days 6 days 14 days
Nephroblastoma expressed gene (NOV) 1 CF613608 – – 2.74 3.76 –Phosphatidylinositol 4-kinase, catalytic, beta polypeptide (PIK4CB) 1 CF762951 – −2.8 – 14.18 10.46Ras-related GTP binding C (RRAGC) 1 CF614175 – – – −3.58 –Ryanodine receptor 1 (RYR1) 1 CF614544 – – – – −3.94Sarcolipin (SLN) 2 CF615704 – – – – −2.65Secreted frizzled-related protein 4 (SFRP4) 1 CF615587 2.00 6.25 11.50 8.60 9.46Secreted frizzled-related protein 5 (SFRP5) 1 CF614181 – 3.27 10.59 10.20 9.94SNF-1 related kinase (SNRK) 1 CF614213 – – – 3.01 3.01SPARC related modular calcium binding 1 (SMOC1) 1 CF614269 – −2.34 −3.45 – –OthersATP-binding cassette, sub-family A (ABC1), member 1 (ABCA1) 1 CF614259 – – – −3.01 –Bridging integrator 1 (BIN1) 2 CF615701 – −7.55 – −5.32 −3.52Carbonic anhydrase XIV (CA14) 1 AW653854 – – – −3.27 −4.87CTD (carboxy-terminal domain, RNA polymerase II, polypeptide A)small phosphatase 2 (CTDSP2)
1 CF615113 3.32 – – 2.12
Dual specificity phosphatase (DUSP1) 1 CF615527 – – 3.33 2.88 –Dysferlin-interacting protein 1 (DYSFIP1) 2 CF615707 – – – −2.25 –Epithelial membrane protein 2 (EMP2) 1 CF615165 – – – −3.08 –Ferritin, heavy polypeptide 1 (FTH1) 1 CF615263 – −3.24 – – –FKSG44 gene (FKSG44) 1 CF614858 −2.27 – – – –Glutathione S-transferase A2 (GSTA2) 1 CF614277 – – – – −2.43Glutathione S-transferase M1 (GSTM1) 1 CF615688 – 2.00 – – –Glutathione S-transferase M3 (GSTM3) 1 CF615401 – – – −3.14 –Glycophorin C (GYPC) 2 CF615670 – – – −2.97 −4.15Junctophilin 1 (JPH1) 1 CF614338 – – – – −4.17KH domain containing, RNA binding, signal transduction associated 3(KHDRBS3)
1 AW660652 – – – – −2.19
Lysosomal-associated protein transmembrane 4 alpha (LAPTM4A) 1 CF614218 – – – – −2.03MGC3047 1 CF614199 – – −2.16 −3.92 –Mus musculus 11 days embryo whole body cDNA, RIKEN full-lengthenriched library, clone:2700092O18 product:hypothetical protein, fullinsert sequence
2 CF614205 – – – −2.40 −2.01
Myozenin 1 (MYOZ1) 2 CF615162 – – – −2.47 –Nuclear receptor binding factor 1 (CGI-63) 1 CF615684 – 3.73 – – –Osteoglycin (OGN) 2 CF614268 – – – – 3.49Prenylcysteine oxidase 1 (PCYOX1) 1 CF615627 – 2.93 – 2.04 5.87Sequestosome 1 (SQSTM1) 1 CF615591 – – −4.41 – −2.92Serine (or cysteine) proteinase inhibitor, clade E (nexin, plasminogenactivator inhibitor type 1), member 1 (SERPINE1)
2 CF614202 – – – 2.72 –
Sialyltransferase 8A (SIAT8A) 1 AW352908 – – −5.97 −6.46 −6.68Sulfotransferase family, cytosolic, 1A, phenol-preferring, member 1(SULT1A1)
1 CF614201 – 9.29 – 15.16 11.17
Superoxide dismutase 2 (SOD2) 1 CF615592 2.43 3.36 – – 2.94Thymosin, beta 10 (TMSB10) 1 CO729212 – – – 2.66 –Unknown EST 1 CF614984 – 2.68 – 2.09 3.63Unknown EST 1 CF614156 – −5.35 – −3.74 −5.89Unknown EST 1 CF614279 – – 2.89 – –Unknown EST 1 CF614252 – – – – 2.10Unknown EST 1 CF614247 – – – – 2.02Unknown EST 1 CF615645 – 2.99 – – –Unknown EST 1 CF615641 – – – – −3.53
Table 1 (continued)
242

to quantify absolute gene expression changes. The R2 for eachstandard curve was greater than 0.99. As shown in Fig. 3,change in direction of differential expression between themicroarray and real-time PCR results for CARP, CRYAB,FABP4,MGC3047, SFRP4 and SFRP5 confirmed the accu-
racy of our microarray results. In addition, for CTGF andSRPX, expression that was measured by microarray wasonly found to be DE at one time point, i.e. 24 and 6 h ofadipogenesis, respectively. While differential expressionsat these time points for these two genes were also detected
Fig. 3 Comparison of CARP,CRYAB, CTGF, FABP4,MGC3047, SFRP4, SFRP5 andSPRX gene expression patternbetween microarray and real-time PCR analysis. The x-axisindicates the six collection timepoints. The y-axis on the leftrepresents the fold change ob-tained in the microarray exper-iment, while the y-axis on theright represents the fold changeobtained in the real-time exper-iment. Fold change from mi-croarray (filled triangle), foldchange from real-time PCR(filled circle)
DE genes No. DEelements
GenBankAccession
6 h 24 h 3 days 6 days 14 days
Unknown EST 1 CF615712 – – – 2.07 –Unknown EST 1 CF615051 – – – – −3.08Unknown EST 1 CF615664 – – – – 2.70Unknown EST 1 CO729210 – −4.45 – – –Unknown EST 1 CF614153 2.42 – – – –Voltage-dependent anion channel 2 (VDAC2) 4 CF614288 – – 2.14 3.17 2.71
Numbers stated under the columns 6 h, 24 h, 3 days, 6 days and 14 days are average fold change. A negative numeral indicates a down-regulation (i.e. untreated greater than treated at that time point), while a positive numeral indicates an up-regulation (i.e. treatedgreater than untreated at that time point). ‘−’ indicates that no significant changes can be detected in the analysis
Table 1 (continued)
243

by real-time PCR amplification, differential expressions atall five post-induction time points were also detected.
Gene ontology analysis
To allow a global view of molecular changes duringcellular differentiation, the GFinder software was used toannotate genes with respect to molecular function. When
the distribution of the molecular function of all DE geneswas assessed (Fig. 4), genes with binding capacity werefound to exhibit the highest proportion at all time points.This was followed by genes with catalytic activities. Whenthese DE genes were categorized into those that were up-and down-regulated, a different distribution in the molec-ular function was observed (Figs. 5 and 6). Within the groupof up-regulated genes (Fig. 5), those with catalytic activitywere one of the most predominant group at all time points,with the exception of 6 h post-differentiation. Signalling
Fig. 4 Distribution of molecular functions of DE genes at each of the five post-differentiation time points
Fig. 5 Distribution of molecular functions of up-regulated genes at each of the five post-differentiation time points
244

genes were the most prevalent group of genes found up-regulated during early differentiation at 6 h, and they con-tinued to be one of the predominant groups of genes at othertime points. However, the percentage of signalling genes thatare up-regulated was observed to decline from 6 h to 14 dayspost-differentiation. The number of signalling genes that weredown-regulated (Fig. 6) was significantly lower than thosethat were up-regulated (13 vs 34 genes).
Genes with binding properties contributed the highestproportion of down-regulated genes at all time points (Fig. 6).While the catalytic genes were also among one of the morepredominantly down-regulated genes, more genes from thisfunctional group were found in the up-regulated than thedown-regulated category (32 vs 75 genes).
Discussion
Bone marrow stromal cells have been viewed as one of themajor sources of progenitor cells in an adult animal, ter-minally differentiating to many cell types. They are used inthis study to examine the process of adipogenic differen-tiation. As they do not spontaneously differentiate, age-matched controls were set up. Visible lipid accumulationwas observed from 3 days post-differentiation, suggestingthat triglyceride synthesis commences around this time. Anincrease in the size of the lipid droplets up to 14 dayssuggests that rapid accumulation continues to occur even at2 weeks of differentiation. When the expression ofWNT10B, a known adipogenic inhibitor and a gene thatis highly expressed in preadipocytes (Ross et al. 2000) wasmeasured, a decline was observed in treated cells. On thecontrary,WNT10B remains detectable in the control cells at
all time points. These results show that Wnt signallingplays a role during bovine adipogenesis. In addition, it alsoreveals that these cells behave similarly to preadipocytecell models such as 3T3-L1 and are suitable to use for thestudy of bovine adipogenesis.
The cDNA microarray was used to assess changes ingene expression levels during adipogenic conversion. Inorder to facilitate a better understanding of the biologicalphenomena involved, the 158 DE genes were classifiedinto different groups. Of these genes, 5 were classified asadipogenic genes. Even though a general up-regulation wasobserved in genes in this category, two puzzling resultswere observed. FABP4 and LEP were negatively regulatedat 24 h. This contradicts published microarray resultsobtained from 3T3-L1 adipogenesis studies (Burton et al.2004; Hansen et al. 2004). A possible reason for thisdiscrepancy could be that genes involved in fatty acidbinding are not required prior to lipid accumulation. Fattyacid binding proteins are required for the transportation offatty acids (Hertzel and Bernlohr 2000), and their decline atthis time point is possibly due to the absence of lipid at thistime point. It should also be noted that the cells used in thisstudy are different from 3T3-L1, and they are speculatedto be cells at earlier developmental stages and hence takelonger to accumulate lipid. Therefore, the initial down-reg-ulation we observed could be a characteristic of uncom-mitted cells. Even though a decrease in gene expression wasseen at 24 h for FABP4, this gene was subsequently up-reg-ulated at 6 days post-differentiation, a time point wheretriglycerides were visible. This result was later confirmed byreal-time PCR (Fig. 3).
Similarly, the decline of LEP at 24 h was also un-expected. While it is possible that this discrepancy is due to
Fig. 6 Distribution of molecular functions of down-regulated genes at each of the five post-differentiation time points
245

the absence of triglyceride in the cells at this time point, analternative explanation could be the impact of ciglitazone[a thiazolidinedione (TZD)] which was included in the adi-pogenic stimulation media. TZDs are agonists of PPARγ,a core adipogenic transcription factor. Even though TZDspositively affect adipogenesis, they have some unusual im-pacts on adipocyte-related genes. Previous in vitro (Kallenand Lazar 1996) and in vivo (Pearson et al. 1996) studieshave shown that TZDs can down-regulate LEP in 3T3-L1preadipocyte and rats, respectively.
One other unusual effect of TZD is the down-regulationof PPARγ (Perrey et al. 2001; Rosenbaum and Greenberg1998). While the exact reason for this effect is not known,a possible reason could be because PPARγ is subjected toa regulatory feedback mechanism that limits the level ofPPARγ once the ‘adipogenic threshold’ has been reached(Camp et al. 1999). While PPARγ itself was not found DEin this experiment, it is know to affect a number of othertranscription factors including C/EBPα and NOTCH3. Thesegenes were found to be down-regulated at 3 days and 24 h,respectively. Interestingly, the expression pattern of othertranscription factors such as AEBP1, DDIT3 and SREBF1coincides with previous published results on 3T3-L1 celldifferentiation (He et al. 1995; Batchvarova et al. 1995;Kim and Spiegelman 1996). Therefore, these results couldbe an indication of a slightly different gene control in bo-vine adipogenesis. However, further work will need to bedone to test this hypothesis.
The transformation of fibroblastic cells to adipocytesrequires acetyl-CoA as the primary building block. Glycol-ysis is the major biochemical pathway for the conversion ofglucose to pyruvate, which is then subsequently oxidized toacetyl-CoA. Up-regulation of genes involved in the gly-colytic pathway suggests that the differentiating cells arecontinually providing substrate for fatty acid synthesis. Thisobservation coincides with the fact that the intracellularlipid droplets continue to grow in size even at 2 weeks ofdifferentiation (Fig. 1).
Intracellular signalling plays a vital role in all cellularprocesses. WNT10B significantly changed when analysedinitially by reverse-transcription PCR, providing an initialindication of a significant role of the Wnt signalling path-way in our cell culture differentiation. This was latercorroborated by the microarray data, where an up-regula-tion of the Wnt binding proteins SFRP4 and SFRP5 wasobserved. IGF-1 signalling was the other pathway that wassignificantly regulated. The IGFBPs regulate the amount ofIGF-1 available to the cells. In this study, IGFBP3, IGFBP4and IGFBP5 were observed to increase during adipogen-esis, indicating the importance of these binding proteins inregulating IGF-1 signalling. The importance of IGFBPsduring bovine adipogenesis may also be demonstrated bythe negative regulation of several families of cathepsin.Cathepsins are known to cleave IGFBPs, to prevent themfrom binding to IGF-1 (Claussen et al. 1997). The negativeregulation of these proteases could indicate that the main-tenance of the integrity of these binding proteins is impor-tant towards the regulation of this pathway during bovineadipogenic differentiation.
Calcium is often a key molecule in intracellular signal-ling, and the effects of intracellular calcium on adipocytedifferentiation have been reported. A number of studies havedemonstrated that increases in intracellular calcium con-centration during the early phase of human and 3T3-L1preadipocyte differentiation act to potently inhibit adipo-genesis (Miller et al. 1996; Ntambi and Takova 1996; Shiet al. 2000). However, the effects of calcium on this processmay be complex because increases in calcium in humanpreadipocytes during the later stages of differentiation andin Ob1774 cells seem to enhance the expression of adipo-cyte markers (Shi et al. 2000; Vassaux et al. 1992). Thesedistinctions show that different cells have variations in thesignalling cascades that control adipogenesis. In this study,the process of lipogenesis in bovine cells is accompaniedby increased calcium signalling, as reflected by the positiveregulation of calcium signalling genes CALM1 and ANXA1(Table 1).
One of the major advantages of microarrays is the po-tential to discover novel genes associated with any biolog-ical system of interest (Schena et al. 1995). In this study, atotal of 17 DE microarray elements identified in this exper-iment could not be annotated. As the cDNA clones used forthe microarray probes were from the 3′ region of the tran-script, some of the unidentified ESTs could represent 3′untranslated regions of known transcripts. These regions areless conserved between species and therefore less likely toreturn a good database matches. Further sequence data willbe required to find out if these are indeed novel and un-known bovine genes.
The use of the same microarray slide across differentexperiments allows direct association of gene expressiondata from diverse studies (Reverter et al. 2004). The mi-croarray slide that was used in this study was also used tocompare gene expression differences between the longis-simus dorsi muscle of two breeds of cattle (Wang et al.2005). The two breeds of cattle used the studies were theJapanese Black, which accumulates large amounts of intra-muscular fat, and the Holstein, which has very low levels ofintramuscular fat. A total of 24 genes were found to be DEin this breed comparison experiment. As expected, manygenes that were preferentially expressed in the JapaneseBlack were involved in lipid metabolism (such as FABP4and SCD). These genes were also found to be modulated inthis study (Table 1). Interestingly, with the exception ofSREBF1, other important transcription factors involved inadipogenesis, such as C/EBPα, were not found to be DE inthe breed comparison studies. This could possibly be due totheir low and undetectable expression levels in the muscletissue of the animals. Other than genes involved in lipidmetabolism, CARP was one other gene also found to be DEin both the breed comparison and adipogenesis studies.This gene was negatively modulated during adipogenesis(Table 1) but was up-regulated in the Japanese Black mus-cle (Wang et al. 2005). This suggests that CARP could havea specific role in the muscle of the Japanese Black animaland therefore could be a potential candidate for further func-tional studies. As demonstrated here, the comparison of re-sults from different microarray experiments allows further
246

insights into the roles of the genes. In addition, the use of aplatform that allows large-scale gene expression studiesenables comparisons to be carried out simultaneously onmore genes.
To validate the microarray results, quantitative real-timePCR was used to measure the transcript levels of eightgenes. FABP4 was elected as one of the candidate genes tovalidate the microarray data as the down-regulation at 24 hwas unexpected and therefore requires further verification.SRPX was chosen as another gene for the study as it is oneof the EST sequences that were deposited from a cDNAlibrary constructed from a bovine adipose cell line (GenBankaccession number AV615699, Takasuga et al. 2001). MGC3047 is an unknown EST that was selected for this screen-ing process. SFRP4 and SFRP5 were picked to enable fur-ther studies in the Wnt signalling pathway, which has beenshown in this case to be regulated during adipogenic con-version of bovine bone marrow cells. CARP, CTGF andCRYAB were chosen for further studies as they have alsobeen shown to be regulated in other animal experimentsinvolving breed comparison (Wang et al. 2005), hence theirroles in different biological experimentation is of greatinterest. The absolute quantification of gene transcripts inthe cell samples using known amounts of exogenous stan-dards was chosen over relative quantification as the lattermethod requires normalization against a stably expressedreference gene. In this study, the drastic cellular transfor-mations during adipogenesis have caused differential ex-pression of a number of some of the genes commonly usedas housekeeping genes, such as GAPD and ACTB (Supple-mentary Table S1). These observations are in accordancewith other publications, where reference genes were foundto be differentially regulated in various experimental manip-ulations and also in different tissues (Glare et al. 2002;Hamalainen et al. 2001; Lee et al. 2002; Radonic et al. 2004;Steele et al. 2002; Suzuki et al. 2000).
When the data arising from microarray and real-timePCRwere compared, concordance in the direction of changebetween the two data sets was observed. However, themagnitude of the differential gene expression between themicroarray and real-time PCR data is different for CARP,SFRP4 and SFRP5. This observation was also seen in otherpublished reports (Herceg et al. 2003; Weiss et al. 2004). Inaddition, for some of the genes, even though differentialexpression was not detected in some time points, differen-tial regulation can be observed when quantified with real-time PCR. Similar observations were also seen in otherstudies (Weiner et al. 2003) where genes that were notfound to be significantly regulated in the microarray experi-ment displayed differential expression when analysed byreal-time PCR.
Importantly, in this study, the direction of change could beconfirmed in instances where the fold changes found bymicroarray are small. It has been reported that a fold changeof 2–4 gives rise to inaccurate data and that these DE genescannot be accepted without further validation (Rajeevan etal. 2001). In this study, FABP4 microarray data showed a
maximum fold change of less than 3-fold. However, the geneexpression pattern was confirmed by real-time PCR. Takentogether, these results suggest that the real-time PCR assaysand the methods used for microarray experimentation andanalysis were robust and reliable. This is especially impor-tant since it confers confidence to the remaining data set.In addition, the real-time PCR assays were performed onunamplified total RNA, while the microarray data werederived from amplified RNA. Similarities in the gene ex-pression pattern derived from these different RNA sourcesfurther suggested that the RNA amplification has notaffected the proportional representation of transcripts in theRNA populations.
By grouping the DE genes at each time point accordingto molecular function, some global trends in the geneticcontrol of adipogenesis can be observed. It should howeverbe noted that the cDNA microarray used in this study doesnot cover the entire bovine genome. Therefore, the resultsarising from this analysis represent a large-scale transcrip-tome screen, and they do not provide universal coverage ofthe bovine genome.
Genes with binding properties and catalytic activitiescontributed the highest proportion of DE genes. The analysissuggests that genes in these groups play a significant roleduring the whole course of bovine adipogenesis. It is un-surprising to find a large constitution of genes with bindingproperties as these molecular functions are required fortranscriptional activation and cell signalling to occur. Geneswith binding properties are highly represented in both up-and down-regulated genes, suggesting they need to bepositively and negatively regulated during adipogenesis. Onthe contrary, genes with catalytic activity were mostly up-regulated, as they consist mainly of enzymatic genes forbiochemical pathways and mitochondrial respiration in-volved in lipid synthesis. One other interesting observation isthe fact that other than genes with no known molecularfunctions, only four classes of genes were up-regulated at6 h. Signalling genes contributed the highest proportionamong these four groups, underlining the significance of theearly activation of a large number of signalling pathways.The percentage of signalling genes that was up-regulatedsteadily decreased after 6 h, implying that the most criticaltime point for signalling pathways takes place before lipidaccumulation.
In conclusion, we have demonstrated the use of a bovinecDNA microarray to gain molecular insights into globalgene expression changes during bovine adipogenesis. Wehave identified a large number of DE genes, and the ma-jority of gene expression changes are consistent with theexisting knowledge. A number of DE genes have not beenpreviously described in this context, and these could befurther pursued using bovine preadipocyte cells from fattissues to discover their roles in different fat regions. Geneontology classification of differentially regulated genes hasalso allowed unique insights towards the complex physi-ological process during bovine adipose differentiation.
247

Acknowledgements This research was supported by the Coopera-tive Research Center for Cattle and Beef Quality and its corepartners: The University of New England, NSWAgriculture, CSIROand Queensland Department of Primary Industries, as well as byMeat and Livestock Australia (BSC.010). The authors are grateful toDrs. Ross Tellam and James Kijas for their critical comments and toDr. Nicholas Hudson for his help with the use of SigmaPlot.
References
Altschul SF, Gish W, Miller W, Myers EW, Lipman DJ (1990) Basiclocal alignment search tool. J Mol Biol 215:403–410
Ashburner M, Ball CA, Blake JA, Botstein D, Butler H, Cherry JM,Davis AP, Dolinski K, Dwight SS, Eppig JT, Harris MA, HillDP, Issel-Tarver L, Kasarskis A, Lewis S, Matese JC,Richardson JE, Ringwald M, Rubin GM, Sherlock G (2000)Gene ontology: tool for the unification of biology. The GeneOntology Consortium. Nat Genet 25:25–29
Batchvarova N, Wang XZ, Ron D (1995) Inhibition of adipogenesisby the stress-induced protein CHOP (Gadd153). EMBO J 14:4654–4661
Burton GR, Nagarajan R, Peterson CA, McGehee RE Jr (2004)Microarray analysis of differentiation-specific gene expressionduring 3T3-L1 adipogenesis. Gene 329:167–185
Camp HS, Tafuri SR, Leff T (1999) c-Jun N-terminal kinasephosphorylates peroxisome proliferator-activated receptor-gamma1 and negatively regulates its transcriptional activity.Endocrinology 140:392–397
Claussen M, Kubler B, Wendland M, Neifer K, Schmidt B, Zapf J,Braulke T (1997) Proteolysis of insulin-like growth factors(IGF) and IGF binding proteins by cathepsin D. Endocrinology138:3797–3803
Glare EM, Divjak M, Bailey MJ, Walters EH (2002) beta-Actin andGAPDH housekeeping gene expression in asthmatic airways isvariable and not suitable for normalizing mRNA levels. Thorax57:765–770
Groeneveld E, Garcia-Cortes LA (1998) VCE 4.0, a (co)variancecomponents package for frequentists and Bayesians. Proc 6thWorld Congr Genet Livest Prod, Armidale, NSW, Australia27:455–458
Hamalainen HK, Tubman JC, Vikman S, Kyrola T, Ylikoski E,Warrington JA, Lahesmaa R (2001) Identification and valida-tion of endogenous reference genes for expression profiling ofT helper cell differentiation by quantitative real-time RT-PCR.Anal Biochem 299:63–70
Hansen C, Fu A, Li C, Dixon WT, Christopherson R, Moore SS(2004) Global gene expression patterns spanning 3T3-L1preadipocyte differentiation. Can J Anim Sci 84:367–376
Hawken RJ, Barris WC, McWilliam SM, Dalrymple BP (2004) AnInteractive Bovine In Silico SNP database (IBISS). MammGenome 15:819–827
He GP, Muise A, Li AW, Ro HS (1995) A eukaryotic transcriptionalrepressor with carboxypeptidase activity. Nature 378:92–96
Hegde P, Qi R, Abernathy K, Gay C, Dharap S, Gaspard R, Earle-Hughes J, Snesrud E, Lee N, Quackenbush J (2000) A conciseguide to cDNA microarray analysis—II. Biotechniques29:548–562
Herceg Z, Li H, Cuenin C, Shukla V, Radolf M, Steinlein P,Wang ZQ(2003) Genome-wide analysis of gene expression regulated bythe HAT cofactor Trrap in conditional knockout cells. NucleicAcids Res 31:7011–7023
Hertzel AV, Bernlohr DA (2000) The mammalian fatty acid-bindingprotein multigene family: molecular and genetic insights intofunction. Trends Endocrinol Metab 11:175–180
Kallen CB, Lazar MA (1996) Antidiabetic thiazolidinediones inhibitleptin (ob) gene expression in 3T3-L1 adipocytes. Proc NatlAcad Sci U S A 93:5793–5796
Kim JB, Spiegelman BM (1996) ADD1/SREBP1 promotes adipo-cyte differentiation and gene expression linked to fatty acidmetabolism. Genes Dev 10:1096–1107
Lee PD, Sladek R, Greenwood CM, Hudson TJ (2002) Controlgenes and variability: absence of ubiquitous reference tran-scripts in diverse mammalian expression studies. Genome Res12:292–297
Lehnert SA, Byrne KA, Wang YH (2004) Development andapplication of a bovine cDNAmicroarray for expression profilingof muscle and adipose tissue. Aust J Exp Agric 44:1127–1133
Masseroli M, Martucci D, Pinciroli F (2004) GFINDer: GenomeFunction INtegrated Discoverer through dynamic annotation,statistical analysis, and mining. Nucleic Acids Res 32:W293–W300
McLachlan GJ, Peel D, Basford KE, Adams P (1999) The EMMIXsoftware for the fitting of mixtures of normal and t-components.J Stat Softw 4:2
Miller CW, Casimir DA, Ntambi JM (1996) The mechanism ofinhibition of 3T3-L1 preadipocyte differentiation by prosta-glandin F2alpha. Endocrinology 137:5641–5650
Moser RJ, Reverter A, Kerr CA, Beh KJ, Lehnert SA (2004) Amixed-model approach for the analysis of cDNA microarraygene expression data from extreme-performing pigs afterinfection with Actinobacillus pleuropneumoniae. J Anim Sci82:1261–1271
Novakofski J (2004) Adipogenesis: usefulness of in vitro and invivo experimental models. J Anim Sci 82:905–915
Ntambi JM, Takova T (1996) Role of Ca2+ in the early stages ofmurine adipocyte differentiation as evidenced by calciummobilizing agents. Differentiation 60:151–158
Pearson SL, Cawthorne MA, Clapham JC, Dunmore SJ, Holmes SD,Moore GB, Smith SA, Tadayyon M (1996) The thiazolidine-dione insulin sensitiser, BRL 49653, increases the expression ofPPAR-gamma and aP2 in adipose tissue of high-fat-fed rats.Biochem Biophys Res Commun 229:752–757
Perrey S, Ishibashi S, Yahagi N, Osuga J, Tozawa R, Yagyu H,Ohashi K, Gotoda T, Harada K, Chen Z, Iizuka Y, Shionoiri F,Yamada N (2001) Thiazolidinedione- and tumor necrosis factoralpha-induced downregulation of peroxisome proliferator-activated receptor gamma mRNA in differentiated 3T3-L1adipocytes. Metabolism 50:36–40
Pethick DW, Fergusson DM, Gardner GE, Hocquette JF, Thompson JM,Warner R (2005) Muscle metabolism in relation to genotypic andenvironmental influences on consumer defined quality of red meat.In: Hocquette JF, Gigli S (eds) Indicators of milk and beef quality.European Association of Animal Production, vol 112. WageningenAcademic Publishers, Wageningen, The Netherlands
Pfaffl MW, Georgieva TM, Georgiev IP, Ontsouka E, Hageleit M,Blum JW (2002) Real-time RT-PCR quantification of insulin-like growth factor (IGF)-1, IGF-1 receptor, IGF-2, IGF-2receptor, insulin receptor, growth hormone receptor, IGF-binding proteins 1, 2 and 3 in the bovine species. Domest AnimEndocrinol 22:91–102
Pittenger MF, Mackay AM, Beck SC, Jaiswal RK, Douglas R,Mosca JD, Moorman MA, Simonetti DW, Craig S, MarshakDR (1999) Multilineage potential of adult human mesenchymalstem cells. Science 284:143–147
Radonic A, Thulke S, Mackay IM, Landt O, Siegert W, Nitsche A(2004) Guideline to reference gene selection for quantitativereal-time PCR. Biochem Biophys Res Commun 313:856–862
Rajeevan MS, Ranamukhaarachchi DG, Vernon SD, Unger ER(2001) Use of real-time quantitative PCR to validate the resultsof cDNA array and differential display PCR technologies.Methods 25:443–451
Reverter A, Byrne KA, Bruce HL, Wang YH, Dalrymple BP,Lehnert SA (2003) A mixture model-based cluster analysis ofDNA microarray gene expression data on Brahman andBrahman composite steers fed high-, medium-, and low-qualitydiets. J Anim Sci 81:1900–1910
Reverter A, Wang YH, Byrne KA, Tan SH, Harper GS, Lehnert SA(2004) Joint analysis of multiple cDNA microarray studies viamultivariate mixed models applied to genetic improvement ofbeef cattle. J Anim Sci 82:3430–3439
248
Rosenbaum SE, Greenberg AS (1998) The short- and long-termeffects of tumor necrosis factor-alpha and BRL 49653 onperoxisome proliferator-activated receptor (PPAR)gamma2gene expression and other adipocyte genes. Mol Endocrinol12:1150–1160
Ross SE, Hemati N, Longo KA, Bennett CN, Lucas PC, Erickson RL,MacDougald OA (2000) Inhibition of adipogenesis by Wntsignaling. Science 289:950–953
Schena M, Shalon D, Davis RW, Brown PO (1995) Quantitativemonitoring of gene expression patterns with a complementaryDNA microarray. Science 270:467–470
Sen A, Lea-Currie YR, Sujkowska D, Franklin DM, Wilkison WO,Halvorsen YD, Gimble JM (2001) Adipogenic potential ofhuman adipose derived stromal cells from multiple donors isheterogeneous. J Cell Biochem 81:312–319
Shi H, Halvorsen YD, Ellis PN, Wilkison WO, Zemel MB (2000)Role of intracellular calcium in human adipocyte differentia-tion. Physiol Genomics 3:75–82
Steele BK, Meyers C, Ozbun MA (2002) Variable expression ofsome “housekeeping” genes during human keratinocyte differ-entiation. Anal Biochem 307:341–347
Suzuki T, Higgins PJ, Crawford DR (2000) Control selection forRNA quantitation. Biotechniques 29:332–337
Takasuga A, Hirotsune S, Itoh R, Jitohzono A, Suzuki H, Aso H,Sugimoto. Y (2001) Establishment of a high throughput ESTsequencing system using poly(A) tail-removed cDNA librariesand determination of 36,000 bovine ESTs. Nucleic Acids Res29:E108
Tichopad A, Pfaffl MW, Didier A (2003) Tissue-specific expressionpattern of bovine prion gene: quantification using real-time RT-PCR. Mol Cell Probes 17:5–10
Tran PH, Peiffer DA, Shin Y, Meek LM, Brody JP, Cho KW (2002)Microarray optimizations: increasing spot accuracy and auto-mated identification of true microarray signals. Nucleic AcidsRes 30:e54
Vassaux G, Gaillard D, Ailhaud G, Negrel R (1992) Prostacyclin is aspecific effector of adipose cell differentiation. Its dual role as acAMP- and Ca(2+)-elevating agent. J Biol Chem 267:11092–11097
Wang YH, McWilliam SM, Barendse W, Kata SR, Womack JE,Moore SS, Lehnert SA (2001) Mapping of 12 bovine ribosomalprotein genes using a bovine radiation hybrid panel. AnimGenet 32:269–273
Wang YH, Byrne KA, Reverter A, Harper GS, Taniguchi M,McWilliam SM, Mannen H, Oyama K, Lehnert SA (2005)Transcriptional profiling of skeletal muscle tissue from twobreeds of cattle. Mamm Genome 16:201–210
Weiner J, Zimmerman CU, Gohlmann HW, Herrmann R (2003)Transcription profiles of the bacterium Mycoplasma pneumo-niae grown at different temperatures. Nucleic Acids Res31:6306–6320
Weiss DJ, Evanson OA, Deng M, Abrahamsen MS (2004)Sequential patterns of gene expression by bovine monocyte-derived macrophages associated with ingestion of mycobacte-rial organisms. Microb Pathog 37:215–224
Wood JD, Enser M, Fisher AV, Nute GR, Richardson RI, Sheard PR(1999) Manipulating meat quality and composition. Proc NutrSoc 58:363–370
249


