Embed Size (px)
Citation preview
2952 Current Medicinal Chemistry, 2009, 16, 2952-2964
0929-8673/09 $55.00+.00 © 2009 Bentham Science Publishers Ltd.
Novel Insights into Adipogenesis from Omics Data
Andreas Prokesch§,1, Hubert Hackl§,1, Robab Hakim-Weber2, Stefan R. Bornstein2 and Zlatko Trajanoski*,1
1Institute for Genomics and Bioinformatics, Graz University of Technology, Graz, Austria 2Department of Internal Medicine, Technical University Dresden, Dresden, Germany
Abstract: Obesity, the excess accumulation of adipose tissue, is one of the most pressing health problems in both the Western world and in developing countries. Adipose tissue growth results from two processes: the increase in number of adipocytes (hyperplasia) that develop from precursor cells, and the growth of individual fat cells (hypertrophy) due to in-corporation of triglycerides. Adipogenesis, the process of fat cell development, has been extensively studied using various cell and animal models. While these studies pointed out a number of key factors involved in adipogenesis, the list of mo-lecular components is far from complete.
The advance of high-throughput technologies has sparked many experimental studies aimed at the identification of novel molecular components regulating adipogenesis. This paper examines the results of recent studies on adipogenesis using high-throughput technologies. Specifically, it provides an overview of studies employing microarrays for gene expression profiling and studies using gel based and non-gel based proteomics as well as a chromatin immunoprecipitation followed by microarray analysis (ChIP-chip) or sequencing (ChIP-seq). Due to the maturity of the technology, the bulk of the avail-able data was generated using microarrays. Therefore these data sets were not only reviewed but also underwent meta analysis.
The review also shows that large-scale omics technologies in conjunction with sophisticated bioinformatics analyses can provide not only a list of novel players, but also a global view on biological processes and molecular networks. Finally, developing technologies and computational challenges associated with the data analyses are highlighted, and an outlook on the questions not previously addressed is provided.
Keywords: Adipogenesis, obesity, gene-expression profiling, proteomics, genome-wide location analysis, data integration.
INTRODUCTION
Since the cloning of the obese gene in 1994 [1] and the subsequent functional characterization of its product, leptin, it has become increasingly evident that adipose tissue is a key organ in the regulation of the body’s energy homeostasis rather than a passive storage of fat. Adipocytes in white adi-pose tissue (WAT) have been shown to secrete cytokines and, as more recently published, lipid signals such as C16:1n7-palmitoleate in response to the nutritional status of the organism [2]. These adipocytokines and lipokines com-municate with other metabolically active tissues, such as liver, muscle, and the gut, to equilibrate metabolites throughout the body [3]. Perturbations of these communica-tions can lead to disturbances in the regulation of whole body energy homeostasis. In particular, increased WAT mass (especially in visceral depots) is associated with insulin-resistance, which is a major cause of diabetes, hypertension and cardiovascular disease [4,5]. These obesity-related dis-orders are major health and economic concerns for the mod-ern society, including not only the western societies but also rapidly developing countries such as China [6] and India [7]. The development of WAT is the result of two processes: the increase in number of adipocytes (hyperplasia) that develop from precursor cells, and the growth of individual fat cells (hypertrophy) due to incorporation of triglycerides. As re-cently shown by Spalding et al. total body fat mass in
*Address correspondence to this author at the Institute for Genomics and Bionformatics, Graz University of Technology, Petersgasse 14, 8010 Graz, Austria; Tel: +43 316 873 5332; Fax: +43 316 873 5340; E-mail: [email protected] §Authors contributed equally.
humans is determined by adipocyte number and size [8]. Interestingly, it could be shown that the total number of adi-pocytes increases only in childhood and adolescence, while staying constant in adulthood [8]. By measuring 14C incorpo-rated in DNA during cold war atomic bomb testing, this study estimated the annual turnover of fat (replacement of lost cells with new adipocytes derived from precursor cells) in adults to be ~10% [8]. These results, along with others, emphasize the importance of the process of adipogenesis and circumstantiate the need for comprehensive understanding of this process at a molecular level.
The development of fat cells is a process that can be modeled in cell culture. The mouse pre-adipocyte cell line 3T3-L1 is a readily-available, well-described model for the adipocyte differentiation process (Fig. 1). Upon defined hormonal induction 3T3-L1 cells can be induced to undergo adipogenesis to a point where nearly all cells are filled with lipid droplets and can respond to physiological signals (e.g. glucose uptake upon insulin treatment or cAMP activation and lipolysis via -adrenergic stimuli). Other mouse cell lines are also suitable for modeling adipogenesis in vitro(e.g. 3T3-F442A, NIH-3T3 and OP9 [9]) as are primary cells derived from mouse embryo fibroblasts (MEFs) or mesen-chymal stem cells (for example, isolated from bone marrow stroma). Human cell culture models are primarily obtained from bone-marrow biopsies or from adipose tissue liposuc-tions [10]. Both human [11] and mouse [12] embryonic stem cells can also be coaxed into an adipogenic differentiation pathway. These in vitro models have been utilized for more than 40 years to discover the molecular players involved in adipogenesis. Countless biochemical studies have been per-formed to define the transcriptional events governed by the two master regulators of adipogenesis [13]: Peroxisome pro-
Novel Insights into Adipogenesis from Omics Data Current Medicinal Chemistry, 2009 Vol. 16, No. 23 2953
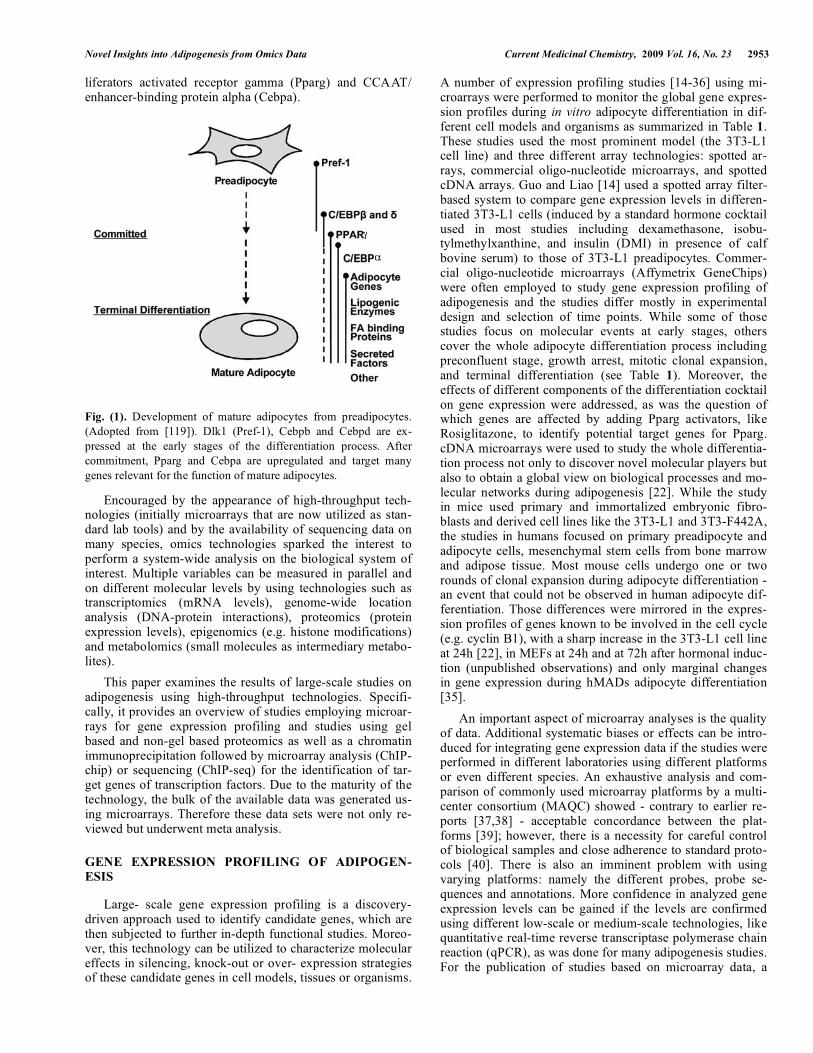
liferators activated receptor gamma (Pparg) and CCAAT/ enhancer-binding protein alpha (Cebpa).
Fig. (1). Development of mature adipocytes from preadipocytes. (Adopted from [119]). Dlk1 (Pref-1), Cebpb and Cebpd are ex-pressed at the early stages of the differentiation process. After commitment, Pparg and Cebpa are upregulated and target many genes relevant for the function of mature adipocytes.
Encouraged by the appearance of high-throughput tech-nologies (initially microarrays that are now utilized as stan-dard lab tools) and by the availability of sequencing data on many species, omics technologies sparked the interest to perform a system-wide analysis on the biological system of interest. Multiple variables can be measured in parallel and on different molecular levels by using technologies such as transcriptomics (mRNA levels), genome-wide location analysis (DNA-protein interactions), proteomics (protein expression levels), epigenomics (e.g. histone modifications) and metabolomics (small molecules as intermediary metabo-lites).
This paper examines the results of large-scale studies on adipogenesis using high-throughput technologies. Specifi-cally, it provides an overview of studies employing microar-rays for gene expression profiling and studies using gel based and non-gel based proteomics as well as a chromatin immunoprecipitation followed by microarray analysis (ChIP-chip) or sequencing (ChIP-seq) for the identification of tar-get genes of transcription factors. Due to the maturity of the technology, the bulk of the available data was generated us-ing microarrays. Therefore these data sets were not only re-viewed but underwent meta analysis.
GENE EXPRESSION PROFILING OF ADIPOGEN-ESIS
Large- scale gene expression profiling is a discovery- driven approach used to identify candidate genes, which are then subjected to further in-depth functional studies. Moreo-ver, this technology can be utilized to characterize molecular effects in silencing, knock-out or over- expression strategies of these candidate genes in cell models, tissues or organisms.
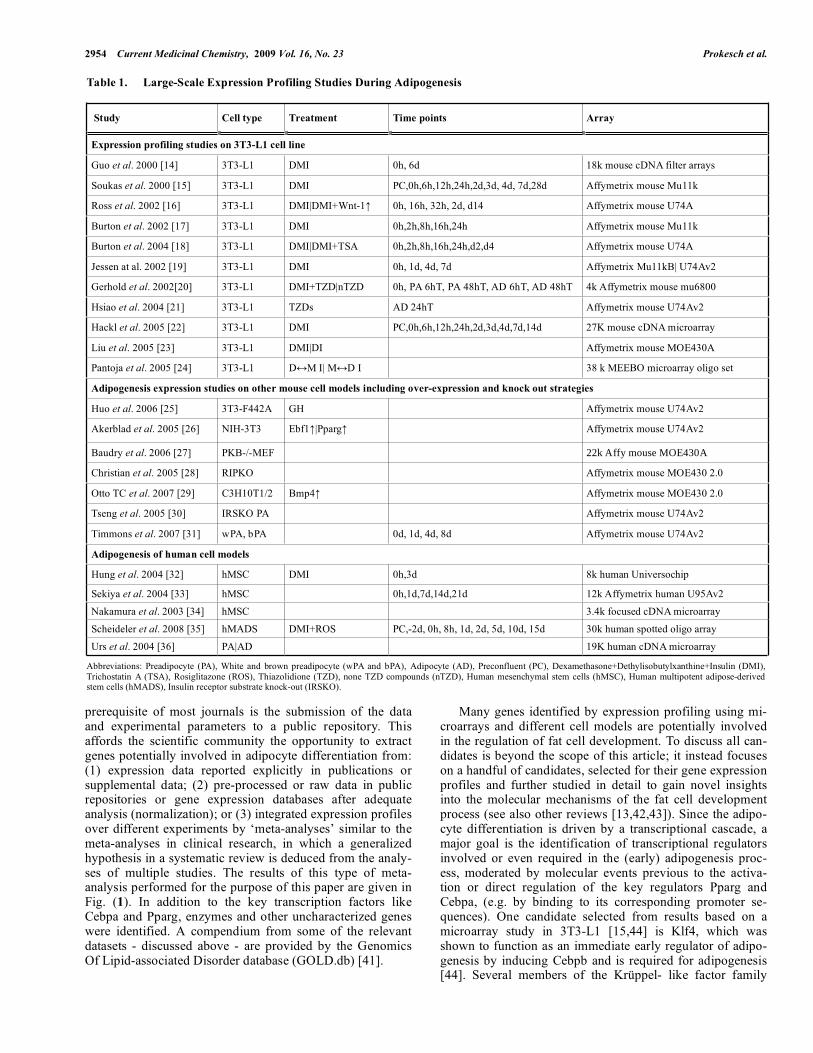
A number of expression profiling studies [14-36] using mi-croarrays were performed to monitor the global gene expres-sion profiles during in vitro adipocyte differentiation in dif-ferent cell models and organisms as summarized in Table 1.These studies used the most prominent model (the 3T3-L1 cell line) and three different array technologies: spotted ar-rays, commercial oligo-nucleotide microarrays, and spotted cDNA arrays. Guo and Liao [14] used a spotted array filter-based system to compare gene expression levels in differen-tiated 3T3-L1 cells (induced by a standard hormone cocktail used in most studies including dexamethasone, isobu-tylmethylxanthine, and insulin (DMI) in presence of calf bovine serum) to those of 3T3-L1 preadipocytes. Commer-cial oligo-nucleotide microarrays (Affymetrix GeneChips) were often employed to study gene expression profiling of adipogenesis and the studies differ mostly in experimental design and selection of time points. While some of those studies focus on molecular events at early stages, others cover the whole adipocyte differentiation process including preconfluent stage, growth arrest, mitotic clonal expansion, and terminal differentiation (see Table 1). Moreover, the effects of different components of the differentiation cocktail on gene expression were addressed, as was the question of which genes are affected by adding Pparg activators, like Rosiglitazone, to identify potential target genes for Pparg. cDNA microarrays were used to study the whole differentia-tion process not only to discover novel molecular players but also to obtain a global view on biological processes and mo-lecular networks during adipogenesis [22]. While the study in mice used primary and immortalized embryonic fibro-blasts and derived cell lines like the 3T3-L1 and 3T3-F442A, the studies in humans focused on primary preadipocyte and adipocyte cells, mesenchymal stem cells from bone marrow and adipose tissue. Most mouse cells undergo one or two rounds of clonal expansion during adipocyte differentiation - an event that could not be observed in human adipocyte dif-ferentiation. Those differences were mirrored in the expres-sion profiles of genes known to be involved in the cell cycle (e.g. cyclin B1), with a sharp increase in the 3T3-L1 cell line at 24h [22], in MEFs at 24h and at 72h after hormonal induc-tion (unpublished observations) and only marginal changes in gene expression during hMADs adipocyte differentiation [35].
An important aspect of microarray analyses is the quality of data. Additional systematic biases or effects can be intro-duced for integrating gene expression data if the studies were performed in different laboratories using different platforms or even different species. An exhaustive analysis and com-parison of commonly used microarray platforms by a multi-center consortium (MAQC) showed - contrary to earlier re-ports [37,38] - acceptable concordance between the plat-forms [39]; however, there is a necessity for careful control of biological samples and close adherence to standard proto-cols [40]. There is also an imminent problem with using varying platforms: namely the different probes, probe se-quences and annotations. More confidence in analyzed gene expression levels can be gained if the levels are confirmed using different low-scale or medium-scale technologies, like quantitative real-time reverse transcriptase polymerase chain reaction (qPCR), as was done for many adipogenesis studies. For the publication of studies based on microarray data, a
2954 Current Medicinal Chemistry, 2009 Vol. 16, No. 23 Prokesch et al.
prerequisite of most journals is the submission of the data and experimental parameters to a public repository. This affords the scientific community the opportunity to extract genes potentially involved in adipocyte differentiation from: (1) expression data reported explicitly in publications or supplemental data; (2) pre-processed or raw data in public repositories or gene expression databases after adequate analysis (normalization); or (3) integrated expression profiles over different experiments by ‘meta-analyses’ similar to the meta-analyses in clinical research, in which a generalized hypothesis in a systematic review is deduced from the analy-ses of multiple studies. The results of this type of meta-analysis performed for the purpose of this paper are given in Fig. (1). In addition to the key transcription factors like Cebpa and Pparg, enzymes and other uncharacterized genes were identified. A compendium from some of the relevant datasets - discussed above - are provided by the Genomics Of Lipid-associated Disorder database (GOLD.db) [41].
Many genes identified by expression profiling using mi-croarrays and different cell models are potentially involved in the regulation of fat cell development. To discuss all can-didates is beyond the scope of this article; it instead focuses on a handful of candidates, selected for their gene expression profiles and further studied in detail to gain novel insights into the molecular mechanisms of the fat cell development process (see also other reviews [13,42,43]). Since the adipo-cyte differentiation is driven by a transcriptional cascade, a major goal is the identification of transcriptional regulators involved or even required in the (early) adipogenesis proc-ess, moderated by molecular events previous to the activa-tion or direct regulation of the key regulators Pparg and Cebpa, (e.g. by binding to its corresponding promoter se-quences). One candidate selected from results based on a microarray study in 3T3-L1 [15,44] is Klf4, which was shown to function as an immediate early regulator of adipo-genesis by inducing Cebpb and is required for adipogenesis [44]. Several members of the Krüppel- like factor family
Table 1. Large-Scale Expression Profiling Studies During Adipogenesis
Study Cell type Treatment Time points Array
Expression profiling studies on 3T3-L1 cell line
Guo et al. 2000 [14] 3T3-L1 DMI 0h, 6d 18k mouse cDNA filter arrays
Soukas et al. 2000 [15] 3T3-L1 DMI PC,0h,6h,12h,24h,2d,3d, 4d, 7d,28d Affymetrix mouse Mu11k
Ross et al. 2002 [16] 3T3-L1 DMI|DMI+Wnt-1 0h, 16h, 32h, 2d, d14 Affymetrix mouse U74A
Burton et al. 2002 [17] 3T3-L1 DMI 0h,2h,8h,16h,24h Affymetrix mouse Mu11k
Burton et al. 2004 [18] 3T3-L1 DMI|DMI+TSA 0h,2h,8h,16h,24h,d2,d4 Affymetrix mouse U74A
Jessen at al. 2002 [19] 3T3-L1 DMI 0h, 1d, 4d, 7d Affymetrix Mu11kB| U74Av2
Gerhold et al. 2002[20] 3T3-L1 DMI+TZD|nTZD 0h, PA 6hT, PA 48hT, AD 6hT, AD 48hT 4k Affymetrix mouse mu6800
Hsiao et al. 2004 [21] 3T3-L1 TZDs AD 24hT Affymetrix mouse U74Av2
Hackl et al. 2005 [22] 3T3-L1 DMI PC,0h,6h,12h,24h,2d,3d,4d,7d,14d 27K mouse cDNA microarray
Liu et al. 2005 [23] 3T3-L1 DMI|DI Affymetrix mouse MOE430A
Pantoja et al. 2005 [24] 3T3-L1 D M I| M D I 38 k MEEBO microarray oligo set
Adipogenesis expression studies on other mouse cell models including over-expression and knock out strategies
Huo et al. 2006 [25] 3T3-F442A GH Affymetrix mouse U74Av2
Akerblad et al. 2005 [26] NIH-3T3 Ebf1 |Pparg Affymetrix mouse U74Av2
Baudry et al. 2006 [27] PKB-/-MEF 22k Affy mouse MOE430A
Christian et al. 2005 [28] RIPKO Affymetrix mouse MOE430 2.0
Otto TC et al. 2007 [29] C3H10T1/2 Bmp4 Affymetrix mouse MOE430 2.0
Tseng et al. 2005 [30] IRSKO PA Affymetrix mouse U74Av2
Timmons et al. 2007 [31] wPA, bPA 0d, 1d, 4d, 8d Affymetrix mouse U74Av2
Adipogenesis of human cell models
Hung et al. 2004 [32] hMSC DMI 0h,3d 8k human Universochip
Sekiya et al. 2004 [33] hMSC 0h,1d,7d,14d,21d 12k Affymetrix human U95Av2
Nakamura et al. 2003 [34] hMSC 3.4k focused cDNA microarray
Scheideler et al. 2008 [35] hMADS DMI+ROS PC,-2d, 0h, 8h, 1d, 2d, 5d, 10d, 15d 30k human spotted oligo array
Urs et al. 2004 [36] PA|AD 19K human cDNA microarray
Abbreviations: Preadipocyte (PA), White and brown preadipocyte (wPA and bPA), Adipocyte (AD), Preconfluent (PC), Dexamethasone+Dethylisobutylxanthine+Insulin (DMI), Trichostatin A (TSA), Rosiglitazone (ROS), Thiazolidione (TZD), none TZD compounds (nTZD), Human mesenchymal stem cells (hMSC), Human multipotent adipose-derived stem cells (hMADS), Insulin receptor substrate knock-out (IRSKO).
Novel Insights into Adipogenesis from Omics Data Current Medicinal Chemistry, 2009 Vol. 16, No. 23 2955
have previously been implicated in adipogenesis: Klf6 [45] and Klf15 [46] have both been shown to promote adipogene-sis and Klf5 [47] is necessary for adipocyte differentiation and acts by transactivating Pparg. Targeted disruption of the Klf3 gene reveals a role in adipogenesis and Klf2 inhibits Pparg expression and adipogenesis [48]. Expression profiles of Klf9 are modulated during 3T3-L1 adipocyte differentia-tion (see e.g. [22]); however, a regulatory function has yet to be confirmed. Induction of Klf9 in NIH3T3 cells could not induce differentiation into adipocytes [46]. All of these fac-tors are thought to function by recruiting different coactiva-tors or repressors [13]. Expression levels from different re-analyzed experiments for the Klfs and other candidates (de-scribed below) are summarized as heat maps in Fig. (1). An-other candidate from these microarray results is the zinc fin-ger-containing transcription factor Egr2 (Krox20). The ex-pression of Egr2 is activated very early after induction and stimulates adipogenesis at least in part through activating Cebpb by binding to its promoter [49]. The (orphan) nuclear receptor Nr4a1 (Nur77) is also known as an immediate early gene as indicated in the expression profiles of several adipo-genesis studies. Overexpression of Nr4a1 blocks adipogene-sis in 3T3-L1 cells ([50] and unpublished observation from this lab), whereas Nr4a1 might not be required for adipo-genesis according to contradictory results with Nr4a1 knock down by siRNA in 3T3-L1 cells [51,52]. Nr4a1 could be involved in the mitotic clonal expansion [52] and the other NR4A family members also have pleiotropic physiological roles including energy metabolism such as regulation of lipolysis in skeletal muscle cells [53] and hepatic glu-coneogenesis [54]. Another nuclear hormone receptor in-volved in adipogenesis is Nr1h3 (LXRalpha). A broader role of Nr1h3 in regulation of metabolism in adipocytes was sug-gested and the effects of Wnt–signaling in adipocyte differ-entiation were studied in a timed series microarray experi-ments of 3T3-L1 cells and retroviral infected 3T3-L1 cells encoding Wnt1 [16]. It is known that liver X receptors (LXRs) regulate cholesterol and fatty acid metabolism in liver tissue and macrophages. Recently it was also shown that activated Nr1h3 stimulate adipocyte differentiation through induction of Pparg expression but it is not required for adipocyte differentiation [55]. A nuclear receptor gene expression atlas during the differentiation of 3T3-L1 cells, assessed using qPCR, also showed the importance of other nuclear receptors such as the Nr2f2 (COUP-TF2) in adipo-genesis [35,56,57]. The role of Ebf1 (O/E-1), a helix-loop-helix transcription factor, was studied in adipocytes with microarray analysis of Ebf1 over-expression in NIH-3T3 cells [26]. Further experiments helped place Ebf1 within the known transcriptional cascade of adipogenesis [58]. By the year 2000, it was shown that Gata2 and Gata3 are specifi-cally expressed in adipocyte precursors and their down-regulation sets the stage for terminal differentiation [59]. This type of expression profile could be confirmed later on with microarray experiments. A role for transcriptional coregulators in the control of energy homeostasis could be shown by knock-out of the co-repressor Nrip1 (RIP140) in adipocytes [28].
Microarray analyses reveal not only transcription factors but also enzymes as important regulators for adipogenesis. Xanthine dehydrogenase (Xdh, XOR) could be identified as
a novel regulator of adipogenesis and Pparg activity and as essential for the regulation of fat accretion [60]. In this analysis, emphasis was given to genes whose expression was limited to the first 24 hours after initiation of differentiation and candidate genes were ranked based on an algorithm modeling the complexity of each gene-expression pro-file[60]. Loss of function of Stearoyl-CoA desaturase (Scd1) - a central lipogenic enzyme catalyzing the synthesis of monounsaturated fatty acids - protects mice against adipos-ity. While another family member with the similar amino acid sequence Scd2 is required for Pparg expression and adipogenesis in cultured 3T3-L1 cells, Scd1 is not. Enzymes for fatty acid desaturation as well as factors for fatty acid elongation are differentially expressed during adipocyte dif-ferentiation like Elovl6 [22]. Recently, the enzyme adipose triglyceride lipase Pnpla2 (ATGL), which catalyzes the ini-tial step in triglyceride hydrolysis, was discovered [61] and confirmed by microarrays [22]. A microarray study on the differential transcriptional modulation of biological proc-esses in Pnpla2 deficient mice was subsequently published [62].
In summary, the advantages of using a microarray screening process to gain novel mechanistic insights in adi-pogenesis are three-fold. First, as described above, novel characterized candidate genes could be identified based on their expression profiles and confirmed by further functional studies. Second, also not characterized genes with modulated expression profile can be detected. The RIKEN mouse gene encyclopedia project is a systematic approach to determine the full coding potential of the mouse genome and involves collection and sequencing of full-length complementary DNAs and physical mapping of the corresponding genes to the mouse genome [63]. The annotation of many genes is based on this RIKEN approach (see Refseq [64] or FANTOM [65]) and cDNA arrays in particular (typical EST length ~1-1.5 kbp) provide the opportunity to study tran-scripts with high sequence similarity to those RIKEN genes and to elucidate new genes involved in the molecular mechanisms of adipocyte differentiation. Finally, large-scale gene expression profiling including the study of many tran-scripts makes it possible to obtain a global view on biologi-cal processes and molecular networks during adipogenesis.
PROTEOMICS
The maturity of the microarray technology and the focus on the delineation of the transcriptional program of adipo-genesis resulted in >20 studies conducted using this ap-proach. In contrast, there are only a handful of published studies using proteomic approaches for identifying proteins during the differentiation of 3T3-L1 adipocytes. This is partly due to the complexity of the proteome with estimated >1.000.000 individual species and partly due to the limita-tions of the available technologies. Neither gel-based nor non gel-based techniques can currently detect molecules at the required sensitivity range of several orders of magnitude. Hence, the published studies report only a fraction of the adipocyte proteome and secretome (entire complement of secreted proteins).
Protein profiling during adipogenesis was performed with gel-based approaches using two-dimensional gel elec-
2956 Current Medicinal Chemistry, 2009 Vol. 16, No. 23 Prokesch et al.
trophoreses for separation and subsequent MALDI-TOF/MS (Matrix-assisted laser desorption/ionization – time of flight/mass spectrometry) for protein identification [66-70] as well as a non gel-based method using LC-MS/MS (liquid chromatography coupled with tandem mass spectrometry) [71]. The gel-based studies used either mouse 3T3-L1 mod-els [67,68,70] or human mesenchymal stem cells [66,69] and reported between 8 and 2000 protein species whereas a non gel-based study [71] identified approximately 3300 proteins. The analysis of the depth and coverage of the 3T3-L1 adipo-cyte proteome compared to the liver organelle proteome map and to six mouse tissues showed that two-thirds of the pro-teins overlapped [71]. These proteins are candidates for the “core proteome” whereas around 1000 proteins were adipo-cyte specific. By comparing microarray data with the pro-teomic data, about 28% (2182 microarray probes out of the 7656) could be mapped to the identified proteome. However, further conformation in tissues samples as well as characteri-zation of the candidates in a functional assay has not yet been performed.
It has become evident in recent years that fat tissue is an organ secreting large number of molecules including signal-ing metabolites, chemokines, and hormones. Two recent studies [72,73] addressed this issue and profiled the adipo-cyte secretome. In addition to a number of previously re-ported secreted factors like adipsin or adipocyte comple-ment-related protein 30 kDa, four novel molecules were identified in the study by Kratchmarova et al: Pigment epi-thelium-derived factor (Serpinf1) secreted in preadipocytes, hippocampal cholinergic neurostimulating peptide (Pebp1), neutrophil gelatinase-associated lipocalin (Lcn2), and hapto-globin (Hp) in mature adipocytes. In another gel-based study using human cells, 170 individual proteins were detected [73]. Comparison of these data with reported secretomes showed varying similarities ranging between 4% (3T3-L1 secretome) and 49% (human lysates), reflecting the meth-odological and technical differences in proteomic studies.
CHROMATIN IMMUNOPRECIPITATION (CHIP) TO DISCOVER TARGETS OF ADIPOGENESIS-RELE-VANT TRANSCRIPTION FACTORS
Chromatin immunoprecipitation (ChIP) is a method for assessing direct DNA-protein interaction between transcrip-tion factors and their respective binding sites [74]. Immuno-precipitation with an antibody directed against the transcrip-tion factor of interest is performed on a nuclear extract of cross-linked chromatin. The read-out of such an experiment can be generated using gel electrophoresis after PCR ampli-fication or with qPCR using primers specific to promoter regions of putative or known target genes. This approach was taken in many studies for detecting binding of adipo-genic transcription factors to promoters of single genes. For example, in 3T3-L1 cells during adipogenesis, physical bind-ing was shown for Pparg in the Cat [75], Lipe [76], and G0s2 [77] promoter and for Cebpa in the Cd36 [78] promoter, in the Dgat2 [79] promoter and in promoters of several adi-pokines (Resistin, adiponectin and leptin) [80]. Alternatively, hybridization of labeled immunoprecipitated samples to a microarray containing probes that represent a selection of regulatory segments or that are tiling the whole genome
makes this method amenable to high-throughput analysis. The latter method is known as ChIP-chip [81,82]. More re-cently, next-generation sequencing technology was applied to sequence the DNA fragments obtained from a ChIP ex-periment (ChIP-seq). Despite the advantage of obtaining direct binding information from ChIP studies it cannot auto-matically be inferred that this binding is functional, i.e. it yields to expression of the target genes. This can be partly explained by the fact that transcription of many genes de-pends on the synergistic action of several transcription fac-tors. It is therefore essential to combine such binding data with transcriptomics data to ensure that binding to a target region also leads to an effect on the mRNA level [83].
Up to date five studies have been published that employ ChIP-chip [84,85], ChIP-seq [86,87], or both technologies [88] during adipogenesis, all performed with 3T3-L1 cells. One report, by Nakachi et al. [84], integrates gene expres-sion data with ChIP-chip data (obtained from promoter chips) and computational binding site predictions to identify Pparg target genes during adipogenesis in 3T3-L1 cells. Us-ing an antibody that recognizes both Pparg isoforms (Pparg1 and Pparg2) they could report 167 Pparg-bound genes, in-cluding 20 genes that are bound by Pparg and are upregu-lated during adipogenesis. Five of those 20 genes - two bona fide target genes (Cfd, Fabp4) and three novel target genes (Tmem143, Hp, 1100001G20Rik) - were confirmed as acti-vated by Pparg by means of luciferase assays in NIH 3T3 cells [84].
A more comprehensive and unbiased approach is the use of whole-genome tiling arrays as reported by Lefterova et al.[85]. Mature adipocytes (d10) were subjected to ChIP using antibodies against Pparg, Rxra, Cebpa and Cebpb. Several surprising outcomes were revealed in this study. First, 5299 identified Pparg-bound regions were located mainly in distal intergenic regions (more than 1kbp away from 5’ or 3’ ends of genes; 52%) and in introns (32%). This might explain the relatively low number of identified Pparg-bound promoters in the Nakachi study where microarrays with probes only covering the proximal promoter regions were used. Second, Rxra (the major heterodimerization partner of Pparg) binding sites were found in proximity to a randomly selected set of Pparg binding sites in 98% of the observed cases. Third, bio-informatics analyses predicted a high degree of potential C/EBP binding sites in the vicinity of Pparg binding sites. Subsequent ChIP-chip experiments with a Cebpa antibody identified 16,760 Cebpa binding sites with a genomic loca-tion distribution similar to Pparg. Sixty-three percent of the Pparg binding sites (3,350) overlap with Cebpa binding (de-fined by at least 1 bp overlap between the 1,000bp-long bound regions). Fourth, more than 60% of upregulated genes (from gene expression data) contained binding sites of both Pparg and Cebpa within 50kb of their upstream regions. And fifth, ChIP-chip for Cebpa and Cebpb using a custom array containing Pparg binding regions showed nearly identical binding profiles (99.1%), pointing to functional promoter occupancy of Cebpb in late adipogenesis and its redundancy with Cebpa. This was further strengthened by the fact that only silencing of both factors lead to a decrease in expres-sion of some target genes. However, when Pparg is silenced in addition the decrease in target gene expression is even
Novel Insights into Adipogenesis from Omics Data Current Medicinal Chemistry, 2009 Vol. 16, No. 23 2957
more pronounced, thus presenting strong evidence for the synergistic adipogenic action of these three factors.
Simultaneously, a ChIP-seq study on Pparg and Rxra binding during 3T3-L1 adipogenesis was published [86]. At day six of adipogenesis 5236 Pparg:Rxr heterodimer binding sites were reported. This number, as well as the genomic distribution pattern of the binding sites (>50% found in in-tergenic regions), is in good concordance to the study from Lefterova et al. [85]. However, an additional value is the assessment of Pparg and Rxr binding at several time points during adipogenesis (d0, d1, d2, d3, d4, d6). This experimen-tal design revealed that heterodimer composition changes during the course of adipogenesis with many Rxr binding sites in early time points having no respective Pparg binding sites. This suggests that in early adipogenesis Rxr has other binding partners as was shown for Ppard [86]. Another inter-esting outcome of this time series experiment is that >94% of Pparg binding sites at day zero to day four are to be detected at day six. Finally, determining genome-wide RNA polym-erase II occupancy as a measure for transcriptional activity showed that Pparg:Rxr binding sites are particularly enriched in the vicinity of upregulated genes.
Another study was employing ChIP followed by pair end-tagging (PET) sequencing technology to identify 7821 Pparg and Rxr binding sites [87]. Combining this binding data with gene expression (expression profiles of differenti-ated and Pparg-silenced 3T3-L1 cells) and validation studies (ChIP-qPCR) yielded 75 high-confidence Pparg:Rxr target genes. Four out of six tested binding elements showed sub-stantially increased luciferase activity when cloned in front of a reporter construct, indicating that they are potent tran-scriptional activation elements. Further, in an siRNA screen designed to knock-down 20 putative Pparg:Rxr target genes, six could be shown to impair lipid accumulation when si-lenced. For a list of validated Pparg:Rxr targets emerging from this study see Table 2.
Finally, Wakabayashi et al. [88] arrived at a similar global view of Pparg:Rxra binding in 3T3-L1 cells like the afore-mentioned genome-wide location studies. To take their work one step further, however, they focused on a group of SET domain proteins that were identified by their ChIP-chip experiments. These proteins are known to catalyze methyla-tion of histones on lysin residues. In particular, generating an H4K20me1 modification map across the genome (using ChIP-seq) they could show that Setd8 regulates the expres-sion of Pparg and some of its target genes through H4K20 mono-methylation. Thus, in this study a link between tran-scriptional regulation and epigenetic modulation, as well as the positive feedback loop between these processes, is pre-sented.
One pressing question emerging from these and other ge-nome-wide location studies is, if and how binding sites that are far away from 5’ ends of genes (up to several 10kb) can confer transcriptional activation. In an elegant study Tomura et al. used the example of the Resistin promoter and showed functional relevance of a region that is ~8.8kb upstream of the transcription start site and contains three Cebp and one Pparg binding sites [89]. Still it is not clear by which mecha-nism this long-range interactions between distant binding sites and the transcription start sites can occur in living cells.
These genome-wide location studies are of great interest and provide a high-confidence part list of the adipogenic process. Unfortunately, a direct comparison of these studies is not possible due to the different protocols, antibodies, plat-forms, and technologies used and because of non-standardized bioinformatics analyses.
MEDIUM-SCALE METHODS APPLIED TO ADIPOG-ENESIS
In addition to the described omics technologies, three other medium-scale methods were employed to characterize the process of fat cell development and to identify new can-didates in this process: RNAi-screens, DNase I hypersensi-tivity (Table 2), and a chemical biology approach.
In one report, short interfering RNA-based screens were conducted in 3T3-L1 cells using insulin-stimulated glucose uptake (a functional characteristic of mature adipocytes) as a read-out. By minituarizing the procedure it was possible to perform 30-50 gene silencings per week [90]. As reported in a series of publications this approach lead to a characteriza-tion of required proteins (summarized in [91]) and to a de-termination of essential kinases [92] in the insulin pathway of mature adipocytes. Further, this RNA interference screen yielded a number of novel players during adipogenesis, such as Cidec [93], Scd2 [94] and Nrip1 [95]. In the studies on Scd2 and Nrip1 Affymetrix GeneChip analysis was per-formed on differentiated 3T3-L1 cells transfected with either scrambled or siRNA constructs to elucidate the pathways affected by the silencing of these genes and to place them in the transcriptional cascade.
Another “top-down” approach for identifying as yet un-known players in adipogenesis was the use of high-throughput DNase I hypersensitivity analysis in conjunction with a computational strategy to identify differentiation-dependent cis- and trans-acting factors. The principle of DNase I hypersensitivity assays is that regulatory genomic elements (e.g. promoters, enhancers) are more accessible to digestion by nucleases than to sites of inactive chromatin [96]. The digested DNA can then be subjected to measure-ment using southern blotting or qPCR. In their studies, Rosen and colleagues used 268 pre-selected primer pairs mapped to upstream regions of 27 adipogenesis-relevant genes and performed qPCR on DNase I digested nuclei de-rived from 3T3-L1 cells prior to and seven days after differ-entiation induction. The identified DNase hypersensitive sites were then computationally analyzed to yield overrepre-sented sequence motifs [97]. One of the highest scoring mo-tifs was a binding site for the interferon regulatory factor (Irf) family. Consequently, all nine known Irfs were tested for their expression in adipose tissue and during 3T3-L1 dif-ferentiation, and for their binding to the predicted cis ele-ments. Finally, some Irfs were shown to be potent inhibitors of adipogenesis [97]. Another candidate that emerged from this approach was the nuclear receptor Nr2f2 (COUP-TFII: which was linked to the antiadipogenic hedgehog pathway (acting downstream, by interaction with Gata factors) and could be placed upstream of Cebpa, having an inhibitory effect on its promoter [57]. Both, the Irf and the Nr2f2, stud-ies prove the utility of this (semi) high-throughput approach and highlight its advantage over ChIP-chip studies, which
2958 Current Medicinal Chemistry, 2009 Vol. 16, No. 23 Prokesch et al.
require knowledge of an involved transcription factor and thereby, have reduced potential in the discovery of new tran-scription factors.
To this end, endeavors are underway to take DNase I hy-persensitivity assays to the genome-wide level by combining this technique with hybridization to tiling arrays [98,99] or with massive parallel sequencing [100]. Providing a DNase hypersensitivity map of adipogenesis will be helpful for the adipogenesis community and, in combination with other om-ics strategies, will broaden our knowledge on the transcrip-tional landscape during fat cell development.
In a chemical biology approach over 500 compounds from a small-molecule library (BIOMOL) were screened for activator and repressor activities using a 3T3-F442A reporter cell line, that stably expressed luciferase under the control of the adipocyte differentiation-dependent aP2 promoter [101]. Besides known and unknown adipogenesis inhibitors includ-ing various retinoids, prostaglandin F and the kinase inhibi-tor PP1, two positive regulatory compounds, namely harmine and RG14620, were identified by this high-throughput screen. Harmine was selected for further studies and could be determined in this context as cell-type-specific regulator of Pparg expression that mimics the effects of Pparg agonists in-vitro (3T3-F442A, 3T3-L1) and in diabetic mice. Further analyses, however, showed that harmine is not a ligand of Pparg, rather acts via a mechanism that involve the inhibition of the Wnt signaling pathway [101]. A structure-function analysis of harmine derivates indicate that the effect on adi-pogenesis is with one exception limited to harmine. This phenotypic screening of adipocytes is not only a promising approach to the discovery of novel anti-diabetic small mole-cules with a distinct mechanism of action and side-effect profile, but also to reveal biological processes and factors, which are targeted by these compounds and control the adi-pogenesis process.
INFERRING FUNCTION AND MECHANISMS FROM LARGE-SCALE DATA BY COMPUTATIONAL BIOL-OGY
Following data generation in omics studies, data preproc-essing and normalization is required to extract the data points
above the noise level and to submit these data to statistical analyses for the identification of differentially expressed or modulated genes/proteins across samples or experiments. Once the candidate genes are identified, major efforts are directed towards functional validation [102]. The starting point is usually a list of candidates to elicit the biological meaning and the molecular mechanisms mirrored in the ac-tivity of the genes. Usually the first step in such analyses is to group genes based on their similarity in expression pat-terns in several groups. For this purpose a number of differ-ent unsupervised clustering methods can be applied (hierar-chical clustering, k-means clustering, self organizing maps, principal component analyses) based on appropriate meas-ures indicating the similarity (or distance). Next, in order to obtain the function of the candidate genes Gene Ontology (GO) terms are applied [103]. The GO project provides a controlled vocabulary for describing gene and gene product attributes in any organism in three independent hierarchies: biological process, molecular function, and cellular compo-nent. In case of a very common GO term, a high number of genes from the dataset (or cluster) mapping to this GO term, does not necessarily indicate that it is specific to this dataset or cluster. To overcome this drawback, statistical signifi-cance is assigned by using Fisher’s exact test or hypergeo-metric test to proof each GO term within the dataset against the occurrence within all genes (e.g. Refseq database or all elements on the array). This approach could be also applied to other entities like domains, pathways, regulatory sequence motifs (including predicted response elements for transcrip-tion factors or target motifs for microRNAs), and gene sets (as within the gene set enrichment analysis (GSEA) [104]). A systematic presentation and analysis of these data in a bio-logical context can be achieved by mapping expression pro-files of genes or proteins simultaneously onto major, cur-rently available regulatory, metabolic and cellular pathways (KEGG, Biocarta, GenMAPP) as for example implemented in the PathwayExplorer [105].
In the case of uncharacterized genes, de novo functional annotation can be performed on a sequence segment/domain-wise basis. For this purpose several prediction tools need to be integrated and the results can be mapped subsequentlyonto known pathways, possible cellular roles, and subcellular
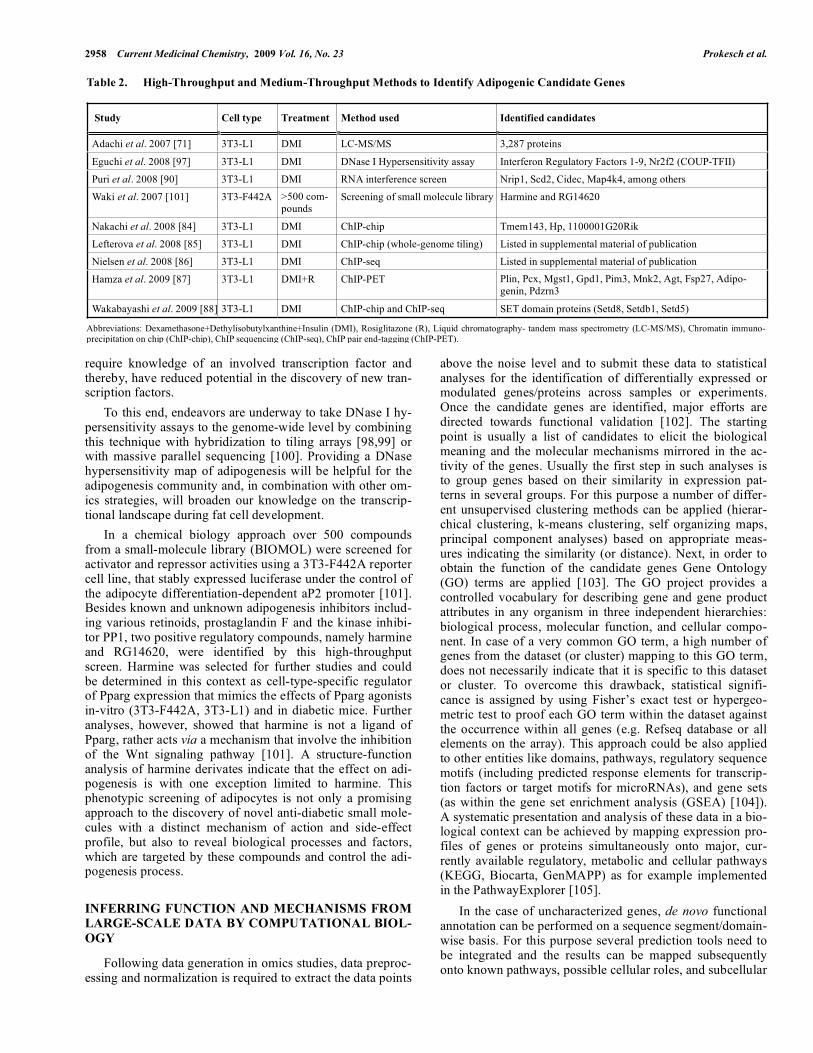
Table 2. High-Throughput and Medium-Throughput Methods to Identify Adipogenic Candidate Genes
Study Cell type Treatment Method used Identified candidates
Adachi et al. 2007 [71] 3T3-L1 DMI LC-MS/MS 3,287 proteins
Eguchi et al. 2008 [97] 3T3-L1 DMI DNase I Hypersensitivity assay Interferon Regulatory Factors 1-9, Nr2f2 (COUP-TFII)
Puri et al. 2008 [90] 3T3-L1 DMI RNA interference screen Nrip1, Scd2, Cidec, Map4k4, among others
Waki et al. 2007 [101] 3T3-F442A >500 com-pounds
Screening of small molecule library Harmine and RG14620
Nakachi et al. 2008 [84] 3T3-L1 DMI ChIP-chip Tmem143, Hp, 1100001G20Rik
Lefterova et al. 2008 [85] 3T3-L1 DMI ChIP-chip (whole-genome tiling) Listed in supplemental material of publication
Nielsen et al. 2008 [86] 3T3-L1 DMI ChIP-seq Listed in supplemental material of publication
Hamza et al. 2009 [87] 3T3-L1 DMI+R ChIP-PET Plin, Pcx, Mgst1, Gpd1, Pim3, Mnk2, Agt, Fsp27, Adipo-genin, Pdzrn3
Wakabayashi et al. 2009 [88] 3T3-L1 DMI ChIP-chip and ChIP-seq SET domain proteins (Setd8, Setdb1, Setd5)
Abbreviations: Dexamethasone+Dethylisobutylxanthine+Insulin (DMI), Rosiglitazone (R), Liquid chromatography- tandem mass spectrometry (LC-MS/MS), Chromatin immuno-precipitation on chip (ChIP-chip), ChIP sequencing (ChIP-seq), ChIP pair end-tagging (ChIP-PET).
Novel Insights into Adipogenesis from Omics Data Current Medicinal Chemistry, 2009 Vol. 16, No. 23 2959
localizations [22]. Using this approach for DNA microarrays, however, requires finding similar transcript sequences and corresponding protein sequence in selected databases based on the probe sequences (ESTs). Moreover, a major challenge for these computational approaches is not only the construc-tion of (weighted-) gene co-expression networks [106] but also the inference of gene regulatory networks based on se-quence, ChIP-chip, and gene expression data and the ulti-mate integration of the heterogeneous datasets.
DISCUSSION AND OUTLOOK
Experimental studies using microarrays and proteomics technologies to investigate adipogenesis identified a large and confident set of candidate molecules and putative drug targets in adipocytes. A fraction of these were subsequently characterized in functional studies and not only provided novel mechanistic insights, but also pinpointed target mole-cules for therapeutic intervention. For example, a recent mi-croarray profiling study identified and validated adipogenic factors including Nr1h3 (LXRalpha) and phospholipid trans-fer protein (Pltp) as well as candidates for the delicate bal-ance between adipocytes and osteoblasts in bone marrow [35]. One of the candidates, oxytocin receptor (Otr), was subsequently verified in preclinical and clinical studies showing that oxytocin administration holds promise as a potential therapy for osteoporosis [107].
Omics technologies enabled for the first time a compre-hensive assessment of the various molecular species in a cell and sparked a number of studies. The choice of a specific technology to address certain biological questions has to be weighted depending on several technological, scientific, and economic parameters. Currently, microarrays are widely used due to the maturity of the technology, robustness of the instruments, the relative inexpensiveness, the inherent sensi-tivity, and the availability of bioinformatics solutions to manage and analyze the data. In other studies, measurement of RNA levels might not be sufficient and proteomics ex-periments may be required. In contrast to microarrays, the proteomics technologies (MALDI-TOF or LC-MS/MS) are not as sensitive, less complete (only a fraction of the pro-teome is detectable), and generate a wealth of data, which is difficult to manage and analyze. Hence, currently only a handful of labs are able to apply high-throughput proteomics technologies and deal with the data.
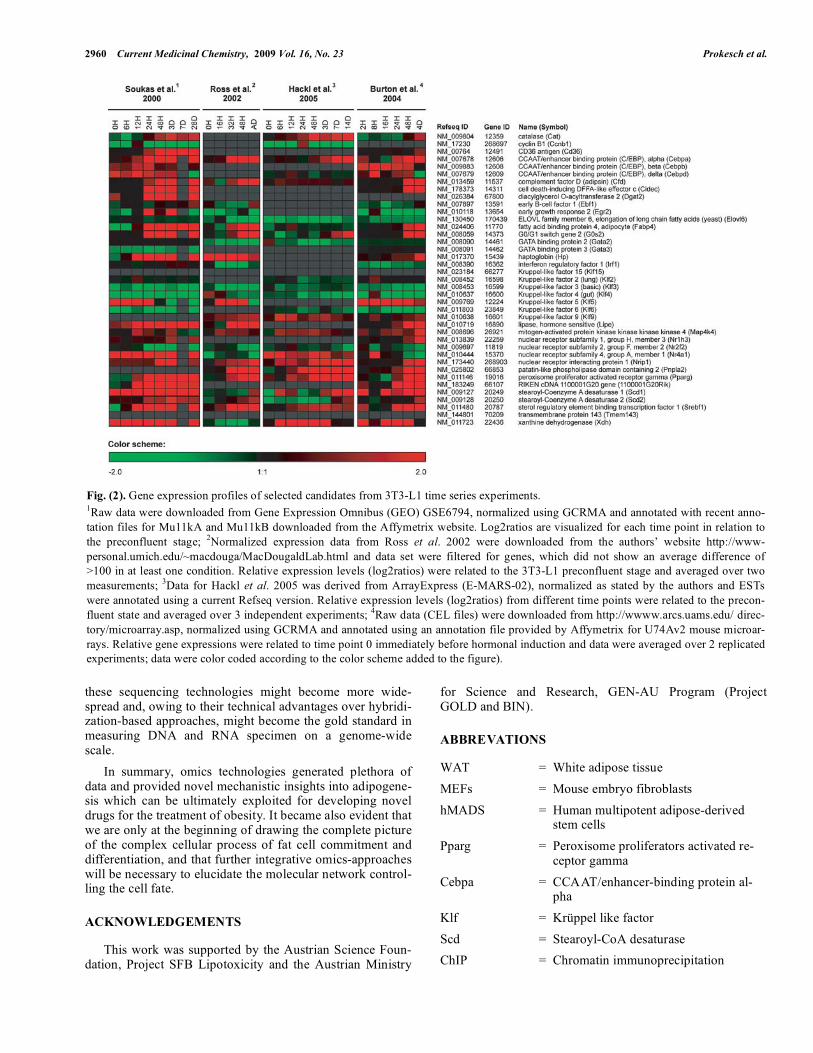
Large-scale experiments are prone to low or absent quan-titative measurements of molecules. For the identification of enriched or differentially regulated biological processes a moderate number of spurious detections is tolerable. For example based on the gene expression profiles from several microarray studies, candidate genes shown in Fig. (2) that are relevant for adipogenesis were not detected by any (e.g. Klf15) or only by some (e.g. Pnpla2) of the presented stud-ies. This demonstrates that integration of several datasets and meta-analysis is instrumental. Another issue is the consis-tency or inconsistency of gene expression data. The confi-dence of the selected candidates for further functional studies is increasing if there are consistent results over several stud-ies. This applies even more to a situation, where the analysis is based on studies from different platforms, technologies or omics-data. For instance haptoglobin (Hp) was differentially
expressed in adipocytes versus preadipocytes [15,16,18,85], was identified as Pparg target [84], as well as Cebpa target [85], and was identified as secreted protein by a proteomics study [72]. It should be noted that the generation of large-scale data is connected with high costs, different degrees of complexity and experimental issues (e.g. instrumental effort for proteomics studies or validation of protocols and antibod-ies for detection of protein-DNA binding studies). The major advantage comes with the high number of detected mole-cules and the possibility to perform combined analyses.
Integrating data from various different omics technolo-gies enables us to draw a broader picture of a cells behavior and of the implication of certain (experimental) treatments or environmental signals. This will ultimately lead to systems biology, an emerging interdisciplinary study field that fo-cuses on the complex interactions in biological systems [108]. One goal of systems biology is to understand how genome-encoded parts interact to produce quantitative phe-notypes. Systems biology has the power to transform the way biology and medicinal chemistry has been viewed clas-sically by way of dealing with biological entities on the sys-temic level rather than focusing on a system which is sim-plistically reduced to a small number of parts. Although so far major discoveries were made mostly with microbial sys-tems, this approach will be of substantial interest also for mammalian systems. However, the integration of diverse omics data sets poses major challenges to researchers (in particular bioinformaticians) and computational infrastruc-tures [109]. Further, it demands standards that make data sets from different sources (labs, platforms, technologies) reli-able, comparable, and, ultimately, amenable for integration on a broad scale [110]. In this context it will be inevitable to apply mathematical modeling in order to interpret the flood of data. Mathematical modeling is an important addition to the toolbox of molecular techniques and it will be important to train biologists and medicinal chemists so they can use these methods much like any other wet lab method.
All afore mentioned fields are under constant develop-ment, inevitably spawning major breakthroughs that make systems biology and its applications more and more palpa-ble. As an example, next-generation sequencing technologies - also known as high-throughput sequencing, deep sequenc-ing or third generation sequencing (available platforms: Solexa (Illumina), 454 (Roche) and SOLiD (ABI)) - are about to shift omics strategies that rely on hybridization on microarrays to sequencing of the molecule under question [111,112]. In the case of transcriptomics several recent pub-lications proved the utility of the RNA-seq technology to assess (m)RNA levels in different applications, highlighting its advantages over array-based methods, namely: higher signal-to-background-ratio, lower detection limit, unbiased measurements, unambiguous assignment of measured se-quences, and quantitative linearity over a broader range [111,113-115]. For genome-wide location analysis next-generation sequencing was employed successfully to se-quence DNA material from chromatin immunoprecipitation experiments having the advantage of an unbiased detection of transcription factor binding in the whole genome, not only in promoter regions spotted on promoter arrays [86,87,116-118]. If throughput and quality increase and prices per se-quencing read decrease as predicted (the “$1000 genome”)
2960 Current Medicinal Chemistry, 2009 Vol. 16, No. 23 Prokesch et al.
these sequencing technologies might become more wide-spread and, owing to their technical advantages over hybridi-zation-based approaches, might become the gold standard in measuring DNA and RNA specimen on a genome-wide scale.
In summary, omics technologies generated plethora of data and provided novel mechanistic insights into adipogene-sis which can be ultimately exploited for developing novel drugs for the treatment of obesity. It became also evident that we are only at the beginning of drawing the complete picture of the complex cellular process of fat cell commitment and differentiation, and that further integrative omics-approaches will be necessary to elucidate the molecular network control-ling the cell fate.
ACKNOWLEDGEMENTS
This work was supported by the Austrian Science Foun-dation, Project SFB Lipotoxicity and the Austrian Ministry
for Science and Research, GEN-AU Program (Project GOLD and BIN).
ABBREVATIONS
WAT = White adipose tissue MEFs = Mouse embryo fibroblasts hMADS = Human multipotent adipose-derived
stem cells Pparg = Peroxisome proliferators activated re-
ceptor gamma Cebpa = CCAAT/enhancer-binding protein al-
pha Klf = Krüppel like factor Scd = Stearoyl-CoA desaturase ChIP = Chromatin immunoprecipitation
Fig. (2). Gene expression profiles of selected candidates from 3T3-L1 time series experiments. 1Raw data were downloaded from Gene Expression Omnibus (GEO) GSE6794, normalized using GCRMA and annotated with recent anno-tation files for Mu11kA and Mu11kB downloaded from the Affymetrix website. Log2ratios are visualized for each time point in relation to the preconfluent stage; 2Normalized expression data from Ross et al. 2002 were downloaded from the authors’ website http://www-personal.umich.edu/~macdouga/MacDougaldLab.html and data set were filtered for genes, which did not show an average difference of>100 in at least one condition. Relative expression levels (log2ratios) were related to the 3T3-L1 preconfluent stage and averaged over two measurements; 3Data for Hackl et al. 2005 was derived from ArrayExpress (E-MARS-02), normalized as stated by the authors and ESTs were annotated using a current Refseq version. Relative expression levels (log2ratios) from different time points were related to the precon-fluent state and averaged over 3 independent experiments; 4Raw data (CEL files) were downloaded from http://wwww.arcs.uams.edu/ direc-tory/microarray.asp, normalized using GCRMA and annotated using an annotation file provided by Affymetrix for U74Av2 mouse microar-rays. Relative gene expressions were related to time point 0 immediately before hormonal induction and data were averaged over 2 replicated experiments; data were color coded according to the color scheme added to the figure).
Novel Insights into Adipogenesis from Omics Data Current Medicinal Chemistry, 2009 Vol. 16, No. 23 2961
MALDI-TOF/MS = Matrix-assisted laser desorp-tion/ionization – time of flight/mass spectrometry
LC-MS/MS = Liquid chromatography - Tandem mass spectrometry
DMI = Dexamethasone, isobutylmethylxan-thine, and insulin
qPCR = Quantitative real-time reverse tran-scriptase polymerase chain reaction
GO = Gene Ontology GSEA = Gene set enrichment analysis
REFERENCES
[1] Zhang, Y.; Proenca, R.; Maffei, M.; Barone, M.; Leopold, L.; Friedman, J.M. Positional cloning of the mouse obese gene and its human homologue. Nature, 1994, 372, 425-432.
[2] Cao, H.; Gerhold, K.; Mayers, J.R.; Wiest, M.M.; Watkins, S.M.; Hotamisligil, G.S. Identification of a lipokine, a lipid hormone linking adipose tissue to systemic metabolism. Cell, 2008, 134,933-944.
[3] Rosen, E.D.; Spiegelman, B.M. Adipocytes as regulators of energy balance and glucose homeostasis. Nature, 2006, 444, 847-853.
[4] Kahn, S.E.; Hull, R.L.; Utzschneider, K.M. Mechanisms linking obesity to insulin resistance and type 2 diabetes. Nature, 2006, 444,840-846.
[5] Guilherme, A.; Virbasius, J.V.; Puri, V.; Czech, M.P. Adipocyte dysfunctions linking obesity to insulin resistance and type 2 diabe-tes. Nat. Rev. Mol. Cell Biol., 2008, 9, 367-377.
[6] Wu, Y. Overweight and obesity in China. BMJ, 2006, 333, 362-363.
[7] Hossain, P.; Kawar, B.; El Nahas, M. Obesity and diabetes in the developing world--a growing challenge. N. Engl. J. Med., 2007,356, 213-215.
[8] Spalding, K.L.; Arner, E.; Westermark, P.O.; Bernard, S.; Buchholz, B.A.; Bergmann, O.; Blomqvist, L.; Hoffstedt, J.; Nas-lund, E.; Britton, T.; Concha, H.; Hassan, M.; Ryden, M.; Frisen, J.; Arner, P. Dynamics of fat cell turnover in humans. Nature,2008, 453, 783-787.
[9] Wolins, N.E.; Quaynor, B.K.; Skinner, J.R.; Tzekov, A.; Park, C.; Choi, K.; Bickel, P.E. OP9 mouse stromal cells rapidly differentiate into adipocytes: characterization of a useful new model of adipo-genesis. J. Lipid Res., 2006, 47, 450-460.
[10] Rodriguez, A.M.; Elabd, C.; Delteil, F.; Astier, J.; Vernochet, C.; Saint-Marc, P.; Guesnet, J.; Guezennec, A.; Amri, E.Z.; Dani, C.; Ailhaud, G. Adipocyte differentiation of multipotent cells estab-lished from human adipose tissue. Biochem. Biophys. Res. Com-mun., 2004, 315, 255-263.
[11] Xiong, C.; Xie, C.Q.; Zhang, L.; Zhang, J.; Xu, K.; Fu, M.; Thompson, W.E.; Yang, L.J.; Chen, Y.E. Derivation of adipocytes from human embryonic stem cells. Stem Cells Dev., 2005, 14, 671-675.
[12] Dani, C.; Smith, A.G.; Dessolin, S.; Leroy, P.; Staccini, L.; Vil-lageois, P.; Darimont, C.; Ailhaud, G. Differentiation of embryonic stem cells into adipocytes in vitro. J. Cell Sci., 1997, 110 ( Pt 11),1279-1285.
[13] Farmer, S.R. Transcriptional control of adipocyte formation. Cell Metab, 2006, 4, 263-273.
[14] Guo, X.; Liao, K. Analysis of gene expression profile during 3T3-L1 preadipocyte differentiation. Gene, 2000, 251, 45-53.
[15] Soukas, A.; Socci, N.D.; Saatkamp, B.D.; Novelli, S.; Friedman, J.M. Distinct transcriptional profiles of adipogenesis in vivo and in vitro. J. Biol. Chem., 2001, 276, 34167-34174.
[16] Ross, S.E.; Erickson, R.L.; Gerin, I.; DeRose, P.M.; Bajnok, L.; Longo, K.A.; Misek, D.E.; Kuick, R.; Hanash, S.M.; Atkins, K.B.; Andresen, S.M.; Nebb, H.I.; Madsen, L.; Kristiansen, K.; MacDou-gald, O.A. Microarray analyses during adipogenesis: understanding the effects of Wnt signaling on adipogenesis and the roles of liver
X receptor alpha in adipocyte metabolism. Mol. Cell Biol., 2002,22, 5989-5999.
[17] Burton, G.R.; Guan, Y.; Nagarajan, R.; McGehee, R.E., Jr. Mi-croarray analysis of gene expression during early adipocyte differ-entiation. Gene, 2002, 293, 21-31.
[18] Burton, G.R.; Nagarajan, R.; Peterson, C.A.; McGehee, R.E., Jr. Microarray analysis of differentiation-specific gene expression dur-ing 3T3-L1 adipogenesis. Gene, 2004, 329, 167-185.
[19] Jessen, B.A.; Stevens, G.J. Expression profiling during adipocyte differentiation of 3T3-L1 fibroblasts. Gene, 2002, 299, 95-100.
[20] Gerhold, D.L.; Liu, F.; Jiang, G.; Li, Z.; Xu, J.; Lu, M.; Sachs, J.R.; Bagchi, A.; Fridman, A.; Holder, D.J.; Doebber, T.W.; Berger, J.; Elbrecht, A.; Moller, D.E.; Zhang, B.B. Gene expression profile of adipocyte differentiation and its regulation by peroxisome prolif-erator-activated receptor-gamma agonists. Endocrinology, 2002,143, 2106-2118.
[21] Hsiao, A.; Worrall, D.S.; Olefsky, J.M.; Subramaniam, S. Vari-ance-modeled posterior inference of microarray data: detecting gene-expression changes in 3T3-L1 adipocytes. Bioinformatics,2004, 20, 3108-3127.
[22] Hackl, H.; Burkard, T.R.; Sturn, A.; Rubio, R.; Schleiffer, A.; Tian, S.; Quackenbush, J.; Eisenhaber, F.; Trajanoski, Z. Molecular processes during fat cell development revealed by gene expression profiling and functional annotation. Genome Biol., 2005, 6, R108.
[23] Liu, J.; Deyoung, S.M.; Zhang, M.; Zhang, M.; Cheng, A.; Saltiel, A.R. Changes in integrin expression during adipocyte differentia-tion. Cell Metab., 2005, 2, 165-177.
[24] Pantoja, C.; Huff, J.T.; Yamamoto, K.R. Glucocorticoid signaling defines a novel commitment state during adipogenesis in vitro.Mol. Biol. Cell, 2008, 19, 4032-41.
[25] Huo, J.S.; McEachin, R.C.; Cui, T.X.; Duggal, N.K.; Hai, T.; States, D.J.; Schwartz, J. Profiles of growth hormone (GH)-regulated genes reveal time-dependent responses and identify a mechanism for regulation of activating transcription factor 3 by GH. J. Biol. Chem., 2006, 281, 4132-4141.
[26] Akerblad, P.; Mansson, R.; Lagergren, A.; Westerlund, S.; Basta, B.; Lind, U.; Thelin, A.; Gisler, R.; Liberg, D.; Nelander, S.; Bam-berg, K.; Sigvardsson, M. Gene expression analysis suggests that EBF-1 and PPARgamma2 induce adipogenesis of NIH-3T3 cells with similar efficiency and kinetics. Physiol. Genom., 2005, 23,206-216.
[27] Baudry, A.; Yang, Z.Z.; Hemmings, B.A. PKBalpha is required for adipose differentiation of mouse embryonic fibroblasts. J. Cell Sci.,2006, 119, 889-897.
[28] Christian, M.; Kiskinis, E.; Debevec, D.; Leonardsson, G.; White, R.; Parker, M.G. RIP140-targeted repression of gene expression in adipocytes. Mol. Cell Biol., 2005, 25, 9383-9391.
[29] Otto, T.C.; Bowers, R.R.; Lane, M.D. BMP-4 treatment of C3H10T1/2 stem cells blocks expression of MMP-3 and MMP-13. Biochem. Biophys. Res. Commun., 2007, 353, 1097-1104.
[30] Tseng, Y.H.; Butte, A.J.; Kokkotou, E.; Yechoor, V.K.; Taniguchi, C.M.; Kriauciunas, K.M.; Cypess, A.M.; Niinobe, M.; Yoshikawa, K.; Patti, M.E.; Kahn, C.R. Prediction of preadipocyte differentia-tion by gene expression reveals role of insulin receptor substrates and necdin. Nat. Cell Biol., 2005, 7, 601-611.
[31] Timmons, J.A.; Wennmalm, K.; Larsson, O.; Walden, T.B.; Lass-mann, T.; Petrovic, N.; Hamilton, D.L.; Gimeno, R.E.; Wahlestedt, C.; Baar, K.; Nedergaard, J.; Cannon, B. Myogenic gene expression signature establishes that brown and white adipocytes originate from distinct cell lineages. Proc. Natl. Acad. Sci. U.S.A., 2007, 104,4401-4406.
[32] Hung, S.C.; Chang, C.F.; Ma, H.L.; Chen, T.H.; Low-Tone, H.L. Gene expression profiles of early adipogenesis in human mesen-chymal stem cells. Gene, 2004, 340, 141-150.
[33] Sekiya, I.; Larson, B.L.; Vuoristo, J.T.; Cui, J.G.; Prockop, D.J. Adipogenic differentiation of human adult stem cells from bone marrow stroma (MSCs). J. Bone Miner. Res., 2004, 19, 256-264.
[34] Nakamura, T.; Shiojima, S.; Hirai, Y.; Iwama, T.; Tsuruzoe, N.; Hirasawa, A.; Katsuma, S.; Tsujimoto, G. Temporal gene expres-sion changes during adipogenesis in human mesenchymal stem cells. Biochem. Biophys. Res. Commun., 2003, 303, 306-312.
[35] Scheideler, M.; Elabd, C.; Zargossi, L.E.; Chielini, C.; Hackl, H.; Sanchez-Cabo, F. Comparative transcriptomics of human multipo-
2962 Current Medicinal Chemistry, 2009 Vol. 16, No. 23 Prokesch et al.
tent stem cells during adipogenesis and osteoblastogenesis. BMC Genomics, 2008, 9, 340.
[36] Urs, S.; Smith, C.; Campbell, B.; Saxton, A.M.; Taylor, J.; Zhang, B.; Snoddy, J.; Jones, V.B.; Moustaid-Moussa, N. Gene expression profiling in human preadipocytes and adipocytes by microarray analysis. J. Nutr., 2004, 134, 762-770.
[37] Tan, P.K.; Downey, T.J.; Spitznagel, E.L., Jr.; Xu, P.; Fu, D.; Dimitrov, D.S.; Lempicki, R.A.; Raaka, B.M.; Cam, M.C. Evalua-tion of gene expression measurements from commercial microarray platforms. Nucleic Acids Res., 2003, 31, 5676-5684.
[38] Severgnini, M.; Bicciato, S.; Mangano, E.; Scarlatti, F.; Mezzelani, A.; Mattioli, M.; Ghidoni, R.; Peano, C.; Bonnal, R.; Viti, F.; Milanesi, L.; De Bellis, G.; Battaglia, C. Strategies for comparing gene expression profiles from different microarray platforms: ap-plication to a case-control experiment. Anal. Biochem., 2006, 353,43-56.
[39] Shi, L.; Reid, L.H.; Jones, W.D.; Shippy, R.; Warrington, J.A.; Baker, S.C.; Collins, P.J.; de Longueville, F.; Kawasaki, E.S.; Lee, K.Y.; Luo, Y.; Sun, Y.A.; Willey, J.C.; Setterquist, R.A.; Fischer, G.M.; Tong, W.; Dragan, Y.P.; Dix, D.J.; Frueh, F.W.; Goodsaid, F.M.; Herman, D.; Jensen, R.V.; Johnson, C.D.; Lobenhofer, E.K.; Puri, R.K.; Schrf, U.; Thierry-Mieg, J.; Wang, C.; Wilson, M.; Wolber, P.K.; Zhang, L.; Amur, S.; Bao, W.; Barbacioru, C.C.; Lu-cas, A.B.; Bertholet, V.; Boysen, C.; Bromley, B.; Brown, D.; Brunner, A.; Canales, R.; Cao, X.M.; Cebula, T.A.; Chen, J.J.; Cheng, J.; Chu, T.M.; Chudin, E.; Corson, J.; Corton, J.C.; Croner, L.J.; Davies, C.; Davison, T.S.; Delenstarr, G.; Deng, X.; Dorris, D.; Eklund, A.C.; Fan, X.H.; Fang, H.; Fulmer-Smentek, S.; Fus-coe, J.C.; Gallagher, K.; Ge, W.; Guo, L.; Guo, X.; Hager, J.; Haje, P.K.; Han, J.; Han, T.; Harbottle, H.C.; Harris, S.C.; Hatchwell, E.; Hauser, C.A.; Hester, S.; Hong, H.; Hurban, P.; Jackson, S.A.; Ji, H.; Knight, C.R.; Kuo, W.P.; LeClerc, J.E.; Levy, S.; Li, Q.Z.; Liu, C.; Liu, Y.; Lombardi, M.J.; Ma, Y.; Magnuson, S.R.; Maqsodi, B.; McDaniel, T.; Mei, N.; Myklebost, O.; Ning, B.; Novoradovskaya, N.; Orr, M.S.; Osborn, T.W.; Papallo, A.; Patterson, T.A.; Perkins, R.G.; Peters, E.H.; Peterson, R.; Philips, K.L.; Pine, P.S.; Pusztai, L.; Qian, F.; Ren, H.; Rosen, M.; Rosenzweig, B.A.; Samaha, R.R.; Schena, M.; Schroth, G.P.; Shchegrova, S.; Smith, D.D.; Staedtler, F.; Su, Z.; Sun, H.; Szallasi, Z.; Tezak, Z.; Thierry-Mieg, D.; Thompson, K.L.; Tikhonova, I.; Turpaz, Y.; Vallanat, B.; Van, C.; Walker, S.J.; Wang, S.J.; Wang, Y.; Wolfinger, R.; Wong, A.; Wu, J.; Xiao, C.; Xie, Q.; Xu, J.; Yang, W.; Zhang, L.; Zhong, S.; Zong, Y.; Slikker, W., Jr. The MicroArray Quality Control (MAQC) pro-ject shows inter- and intraplatform reproducibility of gene expres-sion measurements. Nat. Biotechnol., 2006, 24, 1151-1161.
[40] Cahan, P.; Rovegno, F.; Mooney, D.; Newman, J.C.; St, L.; McCaffrey, T.A. Meta-analysis of microarray results: challenges, opportunities, and recommendations for standardization. Gene,2007, 401, 12-18.
[41] Hackl, H.; Maurer, M.; Mlecnik, B.; Hartler, J.; Stocker, G.; Miranda-Saavedra, D.; Trajanoski, Z. GOLD.db: genomics of lipid-associated disorders database. BMC Genom., 2004, 5, 93.
[42] Rosen, E.D.; MacDougald, O.A. Adipocyte differentiation from the inside out. Nat. Rev. Mol. Cell Biol., 2006, 7, 885-896.
[43] Burton, G.R.; McGehee, R.E., Jr. Identification of candidate genes involved in the regulation of adipocyte differentiation using mi-croarray-based gene expression profiling. Nutrition, 2004, 20, 109-114.
[44] Birsoy, K.; Chen, Z.; Friedman, J. Transcriptional regulation of adipogenesis by KLF4. Cell Metab., 2008, 7, 339-347.
[45] Li, D.; Yea, S.; Li, S.; Chen, Z.; Narla, G.; Banck, M.; Laborda, J.; Tan, S.; Friedman, J.M.; Friedman, S.L.; Walsh, M.J. Kruppel-like factor-6 promotes preadipocyte differentiation through histone deacetylase 3-dependent repression of DLK1. J. Biol. Chem., 2005,280, 26941-26952.
[46] Mori, T.; Sakaue, H.; Iguchi, H.; Gomi, H.; Okada, Y.; Takashima, Y.; Nakamura, K.; Nakamura, T.; Yamauchi, T.; Kubota, N.; Kad-owaki, T.; Matsuki, Y.; Ogawa, W.; Hiramatsu, R.; Kasuga, M. Role of Kruppel-like factor 15 (KLF15) in transcriptional regula-tion of adipogenesis. J. Biol. Chem., 2005, 280, 12867-12875.
[47] Oishi, Y.; Manabe, I.; Tobe, K.; Tsushima, K.; Shindo, T.; Fujiu, K.; Nishimura, G.; Maemura, K.; Yamauchi, T.; Kubota, N.; Su-zuki, R.; Kitamura, T.; Akira, S.; Kadowaki, T.; Nagai, R. Kruppel-
like transcription factor KLF5 is a key regulator of adipocyte dif-ferentiation. Cell Metab., 2005, 1, 27-39.
[48] Banerjee, S.S.; Feinberg, M.W.; Watanabe, M.; Gray, S.; Haspel, R.L.; Denkinger, D.J.; Kawahara, R.; Hauner, H.; Jain, M.K. The Kruppel-like factor KLF2 inhibits peroxisome proliferator-activated receptor-gamma expression and adipogenesis. J. Biol. Chem., 2003, 278, 2581-2584.
[49] Chen, Z.; Torrens, J.I.; Anand, A.; Spiegelman, B.M.; Friedman, J.M. Krox20 stimulates adipogenesis via C/EBPbeta-dependent and -independent mechanisms. Cell Metab., 2005, 1, 93-106.
[50] Chao, L.C.; Bensinger, S.J.; Villanueva, C.J.; Wroblewski, K.; Tontonoz, P. Inhibition of adipocyte differentiation by Nur77, Nurr1, and Nor1. Mol. Endocrinol., 2008, 22, 2596-2608.
[51] Au, W.S.; Payne, V.A.; O'Rahilly, S.; Rochford, J.J. The NR4A family of orphan nuclear receptors are not required for adipogene-sis. Int. J. Obes. (Lond), 2008, 32, 388-392.
[52] Fumoto, T.; Yamaguchi, T.; Hirose, F.; Osumi, T. Orphan nuclear receptor Nur77 accelerates the initial phase of adipocyte differen-tiation in 3T3-L1 cells by promoting mitotic clonal expansion. J. Biochem., 2007, 141, 181-192.
[53] Maxwell, M.A.; Cleasby, M.E.; Harding, A.; Stark, A.; Cooney, G.J.; Muscat, G.E. Nur77 regulates lipolysis in skeletal muscle cells. Evidence for cross-talk between the beta-adrenergic and an orphan nuclear hormone receptor pathway. J. Biol. Chem., 2005,280, 12573-12584.
[54] Pei, L.; Waki, H.; Vaitheesvaran, B.; Wilpitz, D.C.; Kurland, I.J.; Tontonoz, P. NR4A orphan nuclear receptors are transcriptional regulators of hepatic glucose metabolism. Nat. Med., 2006, 12,1048-1055.
[55] Seo, J.B.; Moon, H.M.; Kim, W.S.; Lee, Y.S.; Jeong, H.W.; Yoo, E.J.; Ham, J.; Kang, H.; Park, M.G.; Steffensen, K.R.; Stulnig, T.M.; Gustafsson, J.A.; Park, S.D.; Kim, J.B. Activated liver X re-ceptors stimulate adipocyte differentiation through induction of peroxisome proliferator-activated receptor gamma expression. Mol. Cell Biol., 2004, 24, 3430-3444.
[56] Fu, M.; Sun, T.; Bookout, A.L.; Downes, M.; Yu, R.T.; Evans, R.M.; Mangelsdorf, D.J. A Nuclear Receptor Atlas: 3T3-L1 adipo-genesis. Mol. Endocrinol., 2005, 19, 2437-2450.
[57] Xu, Z.; Yu, S.; Hsu, C.H.; Eguchi, J.; Rosen, E.D. The orphan nuclear receptor chicken ovalbumin upstream promoter-transcription factor II is a critical regulator of adipogenesis. Proc. Natl. Acad. Sci. U.S.A., 2008, 105, 2421-2426.
[58] Jimenez, M.A.; Akerblad, P.; Sigvardsson, M.; Rosen, E.D. Critical role for Ebf1 and Ebf2 in the adipogenic transcriptional cascade. Mol. Cell Biol., 2007, 27, 743-757.
[59] Tong, Q.; Dalgin, G.; Xu, H.; Ting, C.N.; Leiden, J.M.; Hotamis-ligil, G.S. Function of GATA transcription factors in preadipocyte-adipocyte transition. Science, 2000, 290, 134-138.
[60] Cheung, K.J.; Tzameli, I.; Pissios, P.; Rovira, I.; Gavrilova, O.; Ohtsubo, T.; Chen, Z.; Finkel, T.; Flier, J.S.; Friedman, J.M. Xan-thine oxidoreductase is a regulator of adipogenesis and PPAR-gamma activity. Cell Metab., 2007, 5, 115-128.
[61] Zimmermann, R.; Strauss, J.G.; Haemmerle, G.; Schoiswohl, G.; Birner-Gruenberger, R.; Riederer, M.; Lass, A.; Neuberger, G.; Eisenhaber, F.; Hermetter, A.; Zechner, R. Fat mobilization in adi-pose tissue is promoted by adipose triglyceride lipase. Science,2004, 306, 1383-1386.
[62] Pinent, M.; Hackl, H.; Burkard, T.R.; Prokesch, A.; Papak, C.; Scheideler, M.; Hammerle, G.; Zechner, R.; Trajanoski, Z.; Strauss, J.G. Differential transcriptional modulation of biological processes in adipocyte triglyceride lipase and hormone-sensitive lipase-deficient mice. Genomics, 2008, 92, 26-32.
[63] Okazaki, Y.; Furuno, M.; Kasukawa, T.; Adachi, J.; Bono, H.; Kondo, S.; Nikaido, I.; Osato, N.; Saito, R.; Suzuki, H.; Yamanaka, I.; Kiyosawa, H.; Yagi, K.; Tomaru, Y.; Hasegawa, Y.; Nogami, A.; Schonbach, C.; Gojobori, T.; Baldarelli, R.; Hill, D.P.; Bult, C.; Hume, D.A.; Quackenbush, J.; Schriml, L.M.; Kanapin, A.; Ma-tsuda, H.; Batalov, S.; Beisel, K.W.; Blake, J.A.; Bradt, D.; Brusic, V.; Chothia, C.; Corbani, L.E.; Cousins, S.; Dalla, E.; Dragani, T.A.; Fletcher, C.F.; Forrest, A.; Frazer, K.S.; Gaasterland, T.; Gariboldi, M.; Gissi, C.; Godzik, A.; Gough, J.; Grimmond, S.; Gustincich, S.; Hirokawa, N.; Jackson, I.J.; Jarvis, E.D.; Kanai, A.; Kawaji, H.; Kawasawa, Y.; Kedzierski, R.M.; King, B.L.; Kona-gaya, A.; Kurochkin, I.V.; Lee, Y.; Lenhard, B.; Lyons, P.A.; Ma-
Novel Insights into Adipogenesis from Omics Data Current Medicinal Chemistry, 2009 Vol. 16, No. 23 2963
glott, D.R.; Maltais, L.; Marchionni, L.; McKenzie, L.; Miki, H.; Nagashima, T.; Numata, K.; Okido, T.; Pavan, W.J.; Pertea, G.; Pe-sole, G.; Petrovsky, N.; Pillai, R.; Pontius, J.U.; Qi, D.; Ramachandran, S.; Ravasi, T.; Reed, J.C.; Reed, D.J.; Reid, J.; Ring, B.Z.; Ringwald, M.; Sandelin, A.; Schneider, C.; Semple, C.A.; Setou, M.; Shimada, K.; Sultana, R.; Takenaka, Y.; Taylor, M.S.; Teasdale, R.D.; Tomita, M.; Verardo, R.; Wagner, L.; Wahlestedt, C.; Wang, Y.; Watanabe, Y.; Wells, C.; Wilming, L.G.; Wynshaw-Boris, A.; Yanagisawa, M.; Yang, I.; Yang, L.; Yuan, Z.; Zavolan, M.; Zhu, Y.; Zimmer, A.; Carninci, P.; Hayatsu, N.; Hirozane-Kishikawa, T.; Konno, H.; Nakamura, M.; Sakazume, N.; Sato, K.; Shiraki, T.; Waki, K.; Kawai, J.; Aizawa, K.; Ara-kawa, T.; Fukuda, S.; Hara, A.; Hashizume, W.; Imotani, K.; Ishii, Y.; Itoh, M.; Kagawa, I.; Miyazaki, A.; Sakai, K.; Sasaki, D.; Shi-bata, K.; Shinagawa, A.; Yasunishi, A.; Yoshino, M.; Waterston, R.; Lander, E.S.; Rogers, J.; Birney, E.; Hayashizaki, Y. Analysis of the mouse transcriptome based on functional annotation of 60,770 full-length cDNAs. Nature, 2002, 420, 563-573.
[64] Pruitt, K.D.; Tatusova, T.; Maglott, D.R. NCBI reference se-quences (RefSeq): a curated non-redundant sequence database of genomes, transcripts and proteins. Nucleic Acids Res., 2007, 35,D61-D65.
[65] Kawai, J.; Shinagawa, A.; Shibata, K.; Yoshino, M.; Itoh, M.; Ishii, Y.; Arakawa, T.; Hara, A.; Fukunishi, Y.; Konno, H.; Adachi, J.; Fukuda, S.; Aizawa, K.; Izawa, M.; Nishi, K.; Kiyosawa, H.; Kondo, S.; Yamanaka, I.; Saito, T.; Okazaki, Y.; Gojobori, T.; Bono, H.; Kasukawa, T.; Saito, R.; Kadota, K.; Matsuda, H.; Ash-burner, M.; Batalov, S.; Casavant, T.; Fleischmann, W.; Gaaster-land, T.; Gissi, C.; King, B.; Kochiwa, H.; Kuehl, P.; Lewis, S.; Matsuo, Y.; Nikaido, I.; Pesole, G.; Quackenbush, J.; Schriml, L.M.; Staubli, F.; Suzuki, R.; Tomita, M.; Wagner, L.; Washio, T.; Sakai, K.; Okido, T.; Furuno, M.; Aono, H.; Baldarelli, R.; Barsh, G.; Blake, J.; Boffelli, D.; Bojunga, N.; Carninci, P.; de Bonaldo, M.F.; Brownstein, M.J.; Bult, C.; Fletcher, C.; Fujita, M.; Gari-boldi, M.; Gustincich, S.; Hill, D.; Hofmann, M.; Hume, D.A.; Kamiya, M.; Lee, N.H.; Lyons, P.; Marchionni, L.; Mashima, J.; Mazzarelli, J.; Mombaerts, P.; Nordone, P.; Ring, B.; Ringwald, M.; Rodriguez, I.; Sakamoto, N.; Sasaki, H.; Sato, K.; Schonbach, C.; Seya, T.; Shibata, Y.; Storch, K.F.; Suzuki, H.; Toyo-oka, K.; Wang, K.H.; Weitz, C.; Whittaker, C.; Wilming, L.; Wynshaw-Boris, A.; Yoshida, K.; Hasegawa, Y.; Kawaji, H.; Kohtsuki, S.; Hayashizaki, Y. Functional annotation of a full-length mouse cDNA collection. Nature, 2001, 409, 685-690.
[66] Lee, H.K.; Lee, B.H.; Park, S.A.; Kim, C.W. The proteomic analy-sis of an adipocyte differentiated from human mesenchymal stem cells using two-dimensional gel electrophoresis. Proteomics, 2006,6, 1223-1229.
[67] Rahman, A.; Kumar, S.G.; Kim, S.W.; Hwang, H.J.; Baek, Y.M.; Lee, S.H.; Hwang, H.S.; Shon, Y.H.; Nam, K.S.; Yun, J.W. Pro-teomic analysis for inhibitory effect of chitosan oligosaccharides on 3T3-L1 adipocyte differentiation. Proteomics, 2008, 8, 569-581.
[68] Choi, K.L.; Wang, Y.; Tse, C.A.; Lam, K.S.; Cooper, G.J.; Xu, A. Proteomic analysis of adipocyte differentiation: Evidence that al-pha2 macroglobulin is involved in the adipose conversion of 3T3 L1 preadipocytes. Proteomics, 2004, 4, 1840-1848.
[69] Jeong, J.A.; Ko, K.M.; Park, H.S.; Lee, J.; Jang, C.; Jeon, C.J.; Koh, G.Y.; Kim, H. Membrane proteomic analysis of human mes-enchymal stromal cells during adipogenesis. Proteomics, 2007, 7,4181-4191.
[70] Welsh, G.I.; Griffiths, M.R.; Webster, K.J.; Page, M.J.; Tavare, J.M. Proteome analysis of adipogenesis. Proteomics, 2004, 4,1042-1051.
[71] Adachi, J.; Kumar, C.; Zhang, Y.; Mann, M. In-depth analysis of the adipocyte proteome by mass spectrometry and bioinformatics. Mol. Cell Proteom., 2007, 6, 1257-1273.
[72] Kratchmarova, I.; Kalume, D.E.; Blagoev, B.; Scherer, P.E.; Pod-telejnikov, A.V.; Molina, H.; Bickel, P.E.; Andersen, J.S.; Fernan-dez, M.M.; Bunkenborg, J.; Roepstorff, P.; Kristiansen, K.; Lodish, H.F.; Mann, M.; Pandey, A. A proteomic approach for identifica-tion of secreted proteins during the differentiation of 3T3-L1 preadipocytes to adipocytes. Mol. Cell Proteom., 2002, 1, 213-222.
[73] Zvonic, S.; Lefevre, M.; Kilroy, G.; Floyd, Z.E.; DeLany, J.P.; Kheterpal, I.; Gravois, A.; Dow, R.; White, A.; Wu, X.; Gimble, J.M. Secretome of primary cultures of human adipose-derived stem
cells: modulation of serpins by adipogenesis. Mol. Cell Proteom.,2007, 6, 18-28.
[74] Weinmann, A.S.; Farnham, P.J. Identification of unknown target genes of human transcription factors using chromatin immunopre-cipitation. Methods, 2002, 26, 37-47.
[75] Okuno, Y.; Matsuda, M.; Kobayashi, H.; Morita, K.; Suzuki, E.; Fukuhara, A.; Komuro, R.; Shimabukuro, M.; Shimomura, I. Adi-pose expression of catalase is regulated via a novel remote PPAR-gamma-responsive region. Biochem. Biophys. Res. Commun., 2008,366, 698-704.
[76] Yajima, H.; Kobayashi, Y.; Kanaya, T.; Horino, Y. Identification of peroxisome-proliferator responsive element in the mouse HSL gene. Biochem. Biophys. Res. Commun., 2007, 352, 526-531.
[77] Zandbergen, F.; Mandard, S.; Escher, P.; Tan, N.S.; Patsouris, D.; Jatkoe, T.; Rojas-Caro, S.; Madore, S.; Wahli, W.; Tafuri, S.; Mul-ler, M.; Kersten, S. The G0/G1 switch gene 2 is a novel PPAR tar-get gene. Biochem. J., 2005, 392, 313-324.
[78] Qiao, L.; Zou, C.; Shao, P.; Schaack, J.; Johnson, P.F.; Shao, J. Transcriptional regulation of fatty acid translocase/CD36 expres-sion by CCAAT/enhancer-binding protein alpha. J. Biol. Chem.,2008, 283, 8788-8795.
[79] Payne, V.A.; Au, W.S.; Gray, S.L.; Nora, E.D.; Rahman, S.M.; Sanders, R.; Hadaschik, D.; Friedman, J.E.; O'Rahilly, S.; Rochford, J.J. Sequential regulation of diacylglycerol acyltrans-ferase 2 expression by CAAT/enhancer-binding protein beta (C/EBPbeta) and C/EBPalpha during adipogenesis. J. Biol. Chem.,2007, 282, 21005-21014.
[80] Salma, N.; Xiao, H.; Imbalzano, A.N. Temporal recruitment of CCAAT/enhancer-binding proteins to early and late adipogenic promoters in vivo. J. Mol. Endocrinol., 2006, 36, 139-151.
[81] Buck, M.J.; Lieb, J.D. ChIP-chip: considerations for the design, analysis, and application of genome-wide chromatin immunopre-cipitation experiments. Genomics, 2004, 83, 349-360.
[82] Shannon, M.F.; Rao, S. Transcription. Of chips and ChIPs. Science,2002, 296, 666-669.
[83] Holstege, F.C.; Clevers, H. Transcription factor target practice. Cell, 2006, 124, 21-23.
[84] Nakachi, Y.; Yagi, K.; Nikaido, I.; Bono, H.; Tonouchi, M.; Schonbach, C.; Okazaki, Y. Identification of novel PPARgamma target genes by integrated analysis of ChIP-on-chip and microarray expression data during adipocyte differentiation. Biochem. Biophys. Res. Commun., 2008, 372, 362-366.
[85] Lefterova, M.I.; Zhang, Y.; Steger, D.J.; Schupp, M.; Schug, J.; Cristancho, A.; Feng, D.; Zhuo, D.; Stoeckert, C.J., Jr.; Liu, X.S.; Lazar, M.A. PPARgamma and C/EBP factors orchestrate adipocyte biology via adjacent binding on a genome-wide scale. Genes Dev.,2008, 22, 2941-2952.
[86] Nielsen, R.; Pedersen, T.A.; Hagenbeek, D.; Moulos, P.; Siersbaek, R.; Megens, E.; Denissov, S.; Borgesen, M.; Francoijs, K.J.; Man-drup, S.; Stunnenberg, H.G. Genome-wide profiling of PPAR-gamma:RXR and RNA polymerase II occupancy reveals temporal activation of distinct metabolic pathways and changes in RXR di-mer composition during adipogenesis. Genes Dev., 2008, 22, 2953-2967.
[87] Hamza, M.S.; Pott, S.; Vega, V.B.; Thomsen, J.S.; Kandhadayar, G.S.; Ng, P.W.; Chiu, K.P.; Pettersson, S.; Wei, C.L.; Ruan, Y.; Liu, E.T. De-novo identification of PPARgamma/RXR binding sites and direct targets during adipogenesis. PLoS ONE, 2009, 4,e4907.
[88] Wakabayashi, K.I.; Okamura, M.; Tsutsumi, S.; Nishikawa, N.; Tanaka, T.; Sakakibara, I.; Kitakami, J.I.; Ihara, S.; Hashimoto, Y.; Hamakubo, T.; Kodama, T.; Aburatani, H.; Sakai, J. PPAR {gamma}/RXR{alpha} heterodimer targets gene of histone modifi-cation enzyme PR-Set7/Setd8 and regulates adipogenesis through a positive feedback loop. Mol. Cell Biol., 2009, [Epub ahead of print].
[89] Tomaru, T.; Steger, D.J.; Lefterova, M.I.; Schupp, M.; Lazar, M.A. Adipocyte-specific expression of murine resistin is mediated by synergism between peroxisome proliferator-activated receptor gamma and CCAAT/enhancer-binding proteins. J. Biol. Chem.,2009, 284, 6116-6125.
[90] Puri, V.; Virbasius, J.V.; Guilherme, A.; Czech, M.P. RNAi screens reveal novel metabolic regulators: RIP140, MAP4k4 and
2964 Current Medicinal Chemistry, 2009 Vol. 16, No. 23 Prokesch et al.
the lipid droplet associated fat specific protein (FSP) 27. Acta Physiol (Oxf), 2008, 192, 103-115.
[91] Zhou, Q.L.; Park, J.G.; Jiang, Z.Y.; Holik, J.J.; Mitra, P.; Semiz, S.; Guilherme, A.; Powelka, A.M.; Tang, X.; Virbasius, J.; Czech, M.P. Analysis of insulin signalling by RNAi-based gene silencing. Biochem. Soc. Trans., 2004, 32, 817-821.
[92] Tang, X.; Guilherme, A.; Chakladar, A.; Powelka, A.M.; Konda, S.; Virbasius, J.V.; Nicoloro, S.M.; Straubhaar, J.; Czech, M.P. An RNA interference-based screen identifies MAP4K4/NIK as a nega-tive regulator of PPARgamma, adipogenesis, and insulin-responsive hexose transport. Proc. Natl. Acad. Sci. U.S.A., 2006,103, 2087-2092.
[93] Puri, V.; Konda, S.; Ranjit, S.; Aouadi, M.; Chawla, A.; Chouinard, M.; Chakladar, A.; Czech, M.P. Fat-specific protein 27, a novel lipid droplet protein that enhances triglyceride storage. J. Biol. Chem., 2007, 282, 34213-34218.
[94] Christianson, J.L.; Nicoloro, S.; Straubhaar, J.; Czech, M.P. Stearoyl-CoA desaturase 2 is required for peroxisome proliferator-activated receptor gamma expression and adipogenesis in cultured 3T3-L1 cells. J. Biol. Chem., 2008, 283, 2906-2916.
[95] Powelka, A.M.; Seth, A.; Virbasius, J.V.; Kiskinis, E.; Nicoloro, S.M.; Guilherme, A.; Tang, X.; Straubhaar, J.; Cherniack, A.D.; Parker, M.G.; Czech, M.P. Suppression of oxidative metabolism and mitochondrial biogenesis by the transcriptional corepressor RIP140 in mouse adipocytes. J. Clin. Invest., 2006, 116, 125-136.
[96] de la Torre, J.; Sumner, A.T. Analysis of chromosomes with re-striction endonucleases and DNase hypersensitivity. Methods Mol. Biol., 1994, 29, 123-139.
[97] Eguchi, J.; Yan, Q.W.; Schones, D.E.; Kamal, M.; Hsu, C.H.; Zhang, M.Q.; Crawford, G.E.; Rosen, E.D. Interferon regulatory factors are transcriptional regulators of adipogenesis. Cell Metab.,2008, 7, 86-94.
[98] Crawford, G.E.; Davis, S.; Scacheri, P.C.; Renaud, G.; Halawi, M.J.; Erdos, M.R.; Green, R.; Meltzer, P.S.; Wolfsberg, T.G.; Collins, F.S. DNase-chip: a high-resolution method to identify DNase I hypersensitive sites using tiled microarrays. Nat. Methods,2006, 3, 503-509.
[99] Sabo, P.J.; Kuehn, M.S.; Thurman, R.; Johnson, B.E.; Johnson, E.M.; Cao, H.; Yu, M.; Rosenzweig, E.; Goldy, J.; Haydock, A.; Weaver, M.; Shafer, A.; Lee, K.; Neri, F.; Humbert, R.; Singer, M.A.; Richmond, T.A.; Dorschner, M.O.; McArthur, M.; Hawrylycz, M.; Green, R.D.; Navas, P.A.; Noble, W.S.; Stamatoy-annopoulos, J.A. Genome-scale mapping of DNase I sensitivity in vivo using tiling DNA microarrays. Nat. Methods, 2006, 3, 511-518.
[100] Crawford, G.E.; Holt, I.E.; Whittle, J.; Webb, B.D.; Tai, D.; Davis, S.; Margulies, E.H.; Chen, Y.; Bernat, J.A.; Ginsburg, D.; Zhou, D.; Luo, S.; Vasicek, T.J.; Daly, M.J.; Wolfsberg, T.G.; Collins, F.S. Genome-wide mapping of DNase hypersensitive sites using massively parallel signature sequencing (MPSS). Genome Res.,2006, 16, 123-131.
[101] Waki, H.; Park, K.W.; Mitro, N.; Pei, L.; Damoiseaux, R.; Wilpitz, D.C.; Reue, K.; Saez, E.; Tontonoz, P. The small molecule harmine is an antidiabetic cell-type-specific regulator of PPARgamma ex-pression. Cell Metab., 2007, 5, 357-370.
[102] Quackenbush, J. Computational approaches to analysis of DNA microarray data. Yearb. Med. Inform., 2006, 1, 91-103.
[103] Ashburner, M.; Ball, C.A.; Blake, J.A.; Botstein, D.; Butler, H.; Cherry, J.M.; Davis, A.P.; Dolinski, K.; Dwight, S.S.; Eppig, J.T.; Harris, M.A.; Hill, D.P.; Issel-Tarver, L.; Kasarskis, A.; Lewis, S.; Matese, J.C.; Richardson, J.E.; Ringwald, M.; Rubin, G.M.; Sher-lock, G. Gene ontology: tool for the unification of biology. The gene ontology consortium. Nat. Genet., 2000, 25, 25-29.
[104] Subramanian, A.; Tamayo, P.; Mootha, V.K.; Mukherjee, S.; Ebert, B.L.; Gillette, M.A.; Paulovich, A.; Pomeroy, S.L.; Golub, T.R.; Lander, E.S.; Mesirov, J.P. Gene set enrichment analysis: a knowl-
edge-based approach for interpreting genome-wide expression pro-files. Proc. Natl. Acad. Sci. U.S.A., 2005, 102, 15545-15550.
[105] Mlecnik, B.; Scheideler, M.; Hackl, H.; Hartler, J.; Sanchez-Cabo, F.; Trajanoski, Z. PathwayExplorer: web service for visualizing high-throughput expression data on biological pathways. Nucleic Acids Res., 2005, 33, W633-W637.
[106] Henegar, C.; Tordjman, J.; Achard, V.; Lacasa, D.; Cremer, I.; Guerre-Millo, M.; Poitou, C.; Basdevant, A.; Stich, V.; Viguerie, N.; Langin, D.; Bedossa, P.; Zucker, J.D.; Clement, K. Adipose tis-sue transcriptomic signature highlights the pathological relevance of extracellular matrix in human obesity. Genome Biol., 2008, 9,R14.
[107] Elabd, C.; Basillais, A.; Beaupied, H.; Breuil, V.; Wagner, N.; Scheideler, M.; Zaragosi, L.E.; Massiera, F.; Lemichez, E.; Traja-noski, Z.; Carle, G.; Euller-Ziegler, L.; Ailhaud, G.; Benhamou, C.L.; Dani, C.; Amri, E.Z. Oxytocin controls differentiation of hu-man mesenchymal stem cells and reverses osteoporosis. Stem Cells,2008, 26, 2399-2407.
[108] Kitano, H. Systems biology: a brief overview. Science, 2002, 295,1662-1664.
[109] Stein, L.D. Towards a cyberinfrastructure for the biological sci-ences: progress, visions and challenges. Nat. Rev. Genet., 2008, 9,678-688.
[110] Hucka, M.; Finney, A.; Bornstein, B.J.; Keating, S.M.; Shapiro, B.E.; Matthews, J.; Kovitz, B.L.; Schilstra, M.J.; Funahashi, A.; Doyle, J.C.; Kitano, H. Evolving a lingua franca and associated software infrastructure for computational systems biology: the Sys-tems Biology Markup Language (SBML) project. Syst. Biol. (Stevenage), 2004, 1, 41-53.
[111] Shendure, J. The beginning of the end for microarrays? Nat. Meth-ods, 2008, 5, 585-587.
[112] Schuster, S.C. Next-generation sequencing transforms today's biology. Nat. Methods, 2008, 5, 16-18.
[113] Mortazavi, A.; Williams, B.A.; McCue, K.; Schaeffer, L.; Wold, B. Mapping and quantifying mammalian transcriptomes by RNA-Seq. Nat. Methods, 2008, 5, 621-628.
[114] Cloonan, N.; Forrest, A.R.; Kolle, G.; Gardiner, B.B.; Faulkner, G.J.; Brown, M.K.; Taylor, D.F.; Steptoe, A.L.; Wani, S.; Bethel, G.; Robertson, A.J.; Perkins, A.C.; Bruce, S.J.; Lee, C.C.; Ranade, S.S.; Peckham, H.E.; Manning, J.M.; McKernan, K.J.; Grimmond, S.M. Stem cell transcriptome profiling via massive-scale mRNA sequencing. Nat. Methods, 2008, 5, 613-619.
[115] Wilhelm, B.T.; Marguerat, S.; Watt, S.; Schubert, F.; Wood, V.; Goodhead, I.; Penkett, C.J.; Rogers, J.; Bahler, J. Dynamic reper-toire of a eukaryotic transcriptome surveyed at single-nucleotide resolution. Nature, 2008, 453, 1239-1243.
[116] Marson, A.; Levine, S.S.; Cole, M.F.; Frampton, G.M.; Brambrink, T.; Johnstone, S.; Guenther, M.G.; Johnston, W.K.; Wernig, M.; Newman, J.; Calabrese, J.M.; Dennis, L.M.; Volkert, T.L.; Gupta, S.; Love, J.; Hannett, N.; Sharp, P.A.; Bartel, D.P.; Jaenisch, R.; Young, R.A. Connecting microRNA genes to the core transcrip-tional regulatory circuitry of embryonic stem cells. Cell, 2008, 134,521-533.
[117] Wederell, E.D.; Bilenky, M.; Cullum, R.; Thiessen, N.; Dagpinar, M.; Delaney, A.; Varhol, R.; Zhao, Y.; Zeng, T.; Bernier, B.; Ing-ham, M.; Hirst, M.; Robertson, G.; Marra, M.A.; Jones, S.; Hoodless, P.A. Global analysis of in vivo Foxa2-binding sites in mouse adult liver using massively parallel sequencing. Nucleic Ac-ids Res., 2008, 36, 4549-4564.
[118] Kim, J.; Bhinge, A.A.; Morgan, X.C.; Iyer, V.R. Mapping DNA-protein interactions in large genomes by sequence tag analysis of genomic enrichment. Nat. Methods, 2005, 2, 47-53.
[119] Gregoire, F.M.; Smas, C.M.; Sul, H.S. Understanding adipocyte differentiation. Physiol Rev., 1998, 78, 783-809.
Received: February 21, 2009 Revised: May 15, 2009 Accepted: May 16, 2009


