Embed Size (px)
Citation preview
7) 372–379www.elsevier.com/locate/ygeno
Genomics 90 (200
SAGE tag based cDNA microarray analysis during larval to pupaldevelopment and isolation of novel cDNAs in Bombyx mori
Yong Zhang a, Jianhua Huang a, Shihai Jia a, Wenbin Liu a, Muwang Li b, Sibao Wang a,Xuexia Miao a, Huasheng Xiao c, Yongping Huang a,⁎
a Institute of Plant Physiology and Ecology, Shanghai Institutes for Biological Sciences, Chinese Academy of Sciences,300 Fenglin Road, Shanghai 200032, People’s Republic of China
b Sericultural Research Institute, Chinese Academy of Agricultural Sciences, Zhenjiang 212018, People’s Republic of Chinac National Engineering Center for Biochips at Shanghai, 151 Libing Road, Zhangjiang Hi-Tech Park, Pudong, Shanghai 201203, People’s Republic of China
Received 24 January 2007; accepted 14 May 2007Available online 20 June 2007
Abstract
Many genes act together during the complex process of insect larval and pupal development. 20-Hydroxyecdysone interacts with juvenilehormone to control insect growth and development and then activates several transcription factors, i.e., Broad, E74, and E75, and, subsequently,the late target genes. To investigate this phenomenon, we used serial analysis of gene expression (SAGE) tag-based cDNA microarray analysis tomonitor the global gene expression profile during larval development and larva–pupa metamorphosis of the silkworm Bombyx mori. Of the 330clones that were dotted to the chip, 267 were obtained by generating longer cDNA fragments from SAGE tags for gene identification, and theothers were obtained from SAGE tag-matched genes or expressed sequence tags from public databases. According to the gene expression profile,the genes were classified into 12 clusters using a self-organizing map analysis. The results were partially confirmed using real-time reversetranscription–polymerase chain reaction. We obtained 22 full-length cDNAs using rapid amplification of 5′ cDNA ends, of which eight geneswere novel in the silkworm. Our results indicated that use of a cDNA microarray based on SAGE tags is effective for identifying and examiningsome low-expression genes associated with insect development.© 2007 Elsevier Inc. All rights reserved.
Keywords: Bombyx mori; cDNA; gene expression; GLGI; SAGE; microarray; silkworm
Insects are the most widely distributed and successful animalclass in the world. Rapid propagation and complicated meta-morphosis are the pivotal reasons for this success. Because ofmetamorphosis, insects can survive either high-heat or below-freezing environmental conditions. During molting and meta-morphosis, diverse morphological, physiological, biochemical,and molecular events result in distinct developmental changessuch as cellular proliferation, programmed cell death, tissueremodeling, and cell migration [1]. For example, larval tissuessuch as the gut, salivary gland [2], silk gland [3], and larval-specific muscles undergo programmed cell death and subse-
⁎ Corresponding author. Fax: +86 21 54924047.E-mail address: [email protected] (Y. Huang).
0888-7543/$ - see front matter © 2007 Elsevier Inc. All rights reserved.doi:10.1016/j.ygeno.2007.05.005
quent histolysis. The imaginal discs undergo physical restruc-turing and differentiation to form rudimentary adult appendagessuch as wings, legs, eyes, and antennae. Insect molting andmetamorphosis are under the control of hormones secreted fromspecific organs, such as the brain, prothoracic glands, andcorpora allata [4]. Two major hormones, 20-hydroxyecdysone(20E) and the sesquiterpenoid juvenile hormone (JH), areresponsible for insect growth and development, and the balanceof these two hormones defines the outcome of each develop-mental transition [5].
To date, a series of genes related to insect development andmetamorphosis has been cloned and investigated. Extensivestudies over the past decade have demonstrated that 20E exertsgene regulatory effects via a nuclear hormone receptor that is aheterodimer of the ecdysone receptor (EcR) and Ultraspiracle
373Y. Zhang et al. / Genomics 90 (2007) 372–379
(USP) [6]. After binding to 20E, the EcR–USP complex dif-ferentially activates several early response genes, i.e., Broad[7], E74 [8], and E75 [9], and, subsequently, the late targetgenes. The genes involved in JH synthesis [10] and JH meta-bolism [11–13] and other related genes have also beenstudied, elucidating the importance of the upstream portion ofhormone-regulated metamorphosis. However, insect moltingand metamorphosis comprise an integrated set of develop-mental processes controlled by a transcriptional hierarchy thatcoordinates the action of hundreds of genes [1]. Relativelyfew target genes have been identified, and it remains unclearhow these genes propagate the hormonal signals to direct theappropriate growth and development of the organism [14]. Inaddition to these hormones and their receptors, many genes ofunknown function are involved in the control and executionof metamorphosis.
The generation of vast amounts of DNA sequence informa-tion, coupled with advances in technologies developed for theexperimental use of such information, allows the description ofbiological processes from a global genetic perspective [1]. Thetechnology of cDNA microarray or DNA chip allows themonitoring of the expression of hundreds to thousands of genessimultaneously and provides a format for identifying genes aswell as changes in their activity [15,16]. Several researchershave used cDNA microarrays to study the metamorphosis ofinsects. White et al. [1] reported the microarray analysis of geneexpression patterns in Drosophila as it undergoes the transitionfrom larva to pupa. Using DNA oligonucleotide microarrays,Butler et al. [17] discovered genes with highly restrictedexpression patterns in the Drosophilawing disc. The expression
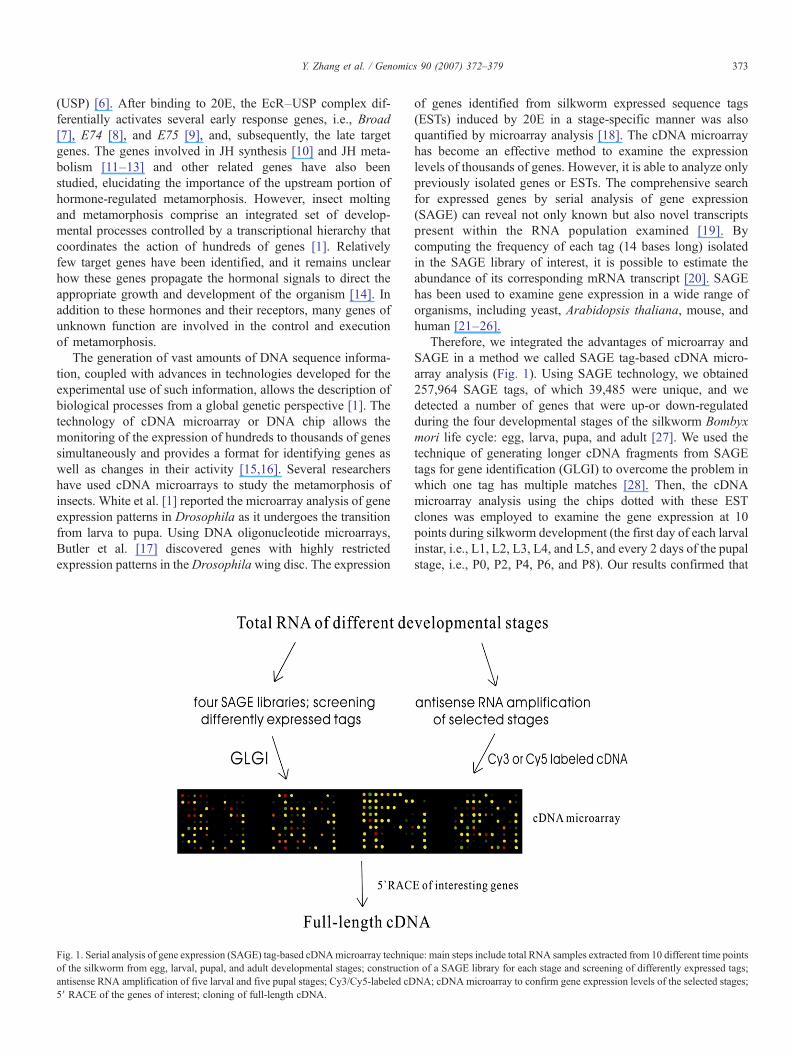
Fig. 1. Serial analysis of gene expression (SAGE) tag-based cDNAmicroarray techniqof the silkworm from egg, larval, pupal, and adult developmental stages; constructioantisense RNA amplification of five larval and five pupal stages; Cy3/Cy5-labeled cD5′ RACE of the genes of interest; cloning of full-length cDNA.
of genes identified from silkworm expressed sequence tags(ESTs) induced by 20E in a stage-specific manner was alsoquantified by microarray analysis [18]. The cDNA microarrayhas become an effective method to examine the expressionlevels of thousands of genes. However, it is able to analyze onlypreviously isolated genes or ESTs. The comprehensive searchfor expressed genes by serial analysis of gene expression(SAGE) can reveal not only known but also novel transcriptspresent within the RNA population examined [19]. Bycomputing the frequency of each tag (14 bases long) isolatedin the SAGE library of interest, it is possible to estimate theabundance of its corresponding mRNA transcript [20]. SAGEhas been used to examine gene expression in a wide range oforganisms, including yeast, Arabidopsis thaliana, mouse, andhuman [21–26].
Therefore, we integrated the advantages of microarray andSAGE in a method we called SAGE tag-based cDNA micro-array analysis (Fig. 1). Using SAGE technology, we obtained257,964 SAGE tags, of which 39,485 were unique, and wedetected a number of genes that were up-or down-regulatedduring the four developmental stages of the silkworm Bombyxmori life cycle: egg, larva, pupa, and adult [27]. We used thetechnique of generating longer cDNA fragments from SAGEtags for gene identification (GLGI) to overcome the problem inwhich one tag has multiple matches [28]. Then, the cDNAmicroarray analysis using the chips dotted with these ESTclones was employed to examine the gene expression at 10points during silkworm development (the first day of each larvalinstar, i.e., L1, L2, L3, L4, and L5, and every 2 days of the pupalstage, i.e., P0, P2, P4, P6, and P8). Our results confirmed that
ue: main steps include total RNA samples extracted from 10 different time pointsn of a SAGE library for each stage and screening of differently expressed tags;NA; cDNA microarray to confirm gene expression levels of the selected stages;
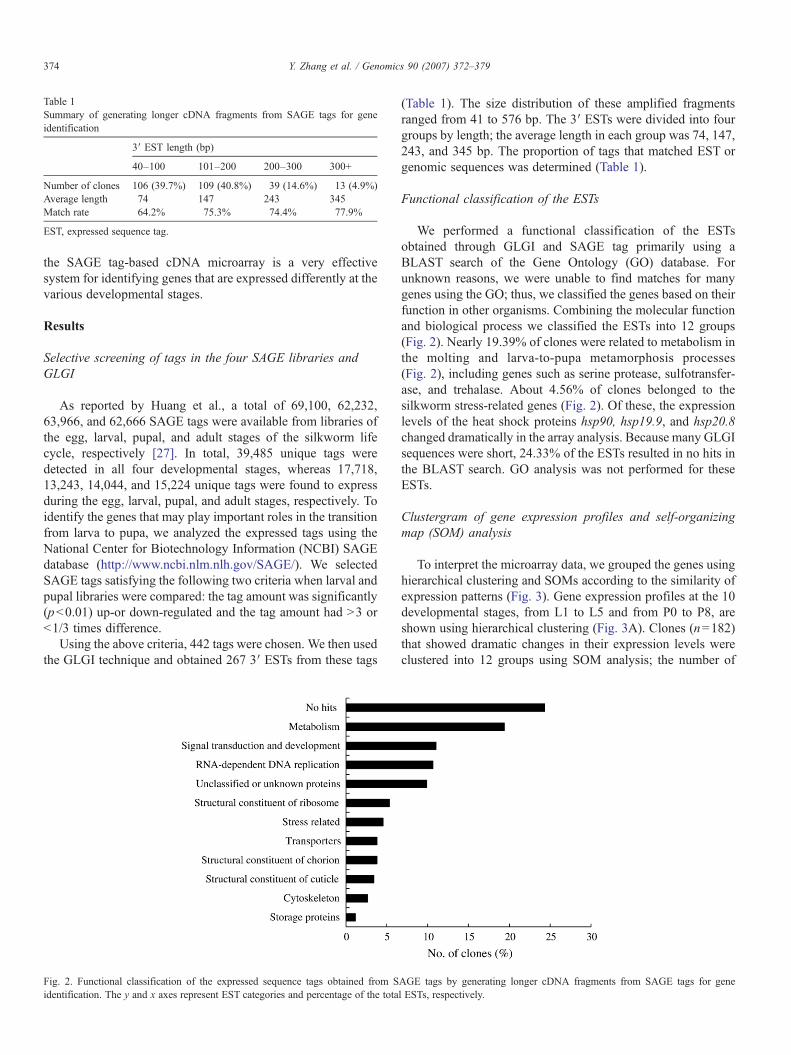
Table 1Summary of generating longer cDNA fragments from SAGE tags for geneidentification
3′ EST length (bp)
40–100 101–200 200–300 300+
Number of clones 106 (39.7%) 109 (40.8%) 39 (14.6%) 13 (4.9%)Average length 74 147 243 345Match rate 64.2% 75.3% 74.4% 77.9%
EST, expressed sequence tag.
374 Y. Zhang et al. / Genomics 90 (2007) 372–379
the SAGE tag-based cDNA microarray is a very effectivesystem for identifying genes that are expressed differently at thevarious developmental stages.
Results
Selective screening of tags in the four SAGE libraries andGLGI
As reported by Huang et al., a total of 69,100, 62,232,63,966, and 62,666 SAGE tags were available from libraries ofthe egg, larval, pupal, and adult stages of the silkworm lifecycle, respectively [27]. In total, 39,485 unique tags weredetected in all four developmental stages, whereas 17,718,13,243, 14,044, and 15,224 unique tags were found to expressduring the egg, larval, pupal, and adult stages, respectively. Toidentify the genes that may play important roles in the transitionfrom larva to pupa, we analyzed the expressed tags using theNational Center for Biotechnology Information (NCBI) SAGEdatabase (http://www.ncbi.nlm.nlh.gov/SAGE/). We selectedSAGE tags satisfying the following two criteria when larval andpupal libraries were compared: the tag amount was significantly(pb0.01) up-or down-regulated and the tag amount had N3 orb1/3 times difference.
Using the above criteria, 442 tags were chosen. We then usedthe GLGI technique and obtained 267 3′ ESTs from these tags
Fig. 2. Functional classification of the expressed sequence tags obtained from Sidentification. The y and x axes represent EST categories and percentage of the tota
(Table 1). The size distribution of these amplified fragmentsranged from 41 to 576 bp. The 3′ ESTs were divided into fourgroups by length; the average length in each group was 74, 147,243, and 345 bp. The proportion of tags that matched EST orgenomic sequences was determined (Table 1).
Functional classification of the ESTs
We performed a functional classification of the ESTsobtained through GLGI and SAGE tag primarily using aBLAST search of the Gene Ontology (GO) database. Forunknown reasons, we were unable to find matches for manygenes using the GO; thus, we classified the genes based on theirfunction in other organisms. Combining the molecular functionand biological process we classified the ESTs into 12 groups(Fig. 2). Nearly 19.39% of clones were related to metabolism inthe molting and larva-to-pupa metamorphosis processes(Fig. 2), including genes such as serine protease, sulfotransfer-ase, and trehalase. About 4.56% of clones belonged to thesilkworm stress-related genes (Fig. 2). Of these, the expressionlevels of the heat shock proteins hsp90, hsp19.9, and hsp20.8changed dramatically in the array analysis. Because many GLGIsequences were short, 24.33% of the ESTs resulted in no hits inthe BLAST search. GO analysis was not performed for theseESTs.
Clustergram of gene expression profiles and self-organizingmap (SOM) analysis
To interpret the microarray data, we grouped the genes usinghierarchical clustering and SOMs according to the similarity ofexpression patterns (Fig. 3). Gene expression profiles at the 10developmental stages, from L1 to L5 and from P0 to P8, areshown using hierarchical clustering (Fig. 3A). Clones (n=182)that showed dramatic changes in their expression levels wereclustered into 12 groups using SOM analysis; the number of
AGE tags by generating longer cDNA fragments from SAGE tags for genel ESTs, respectively.
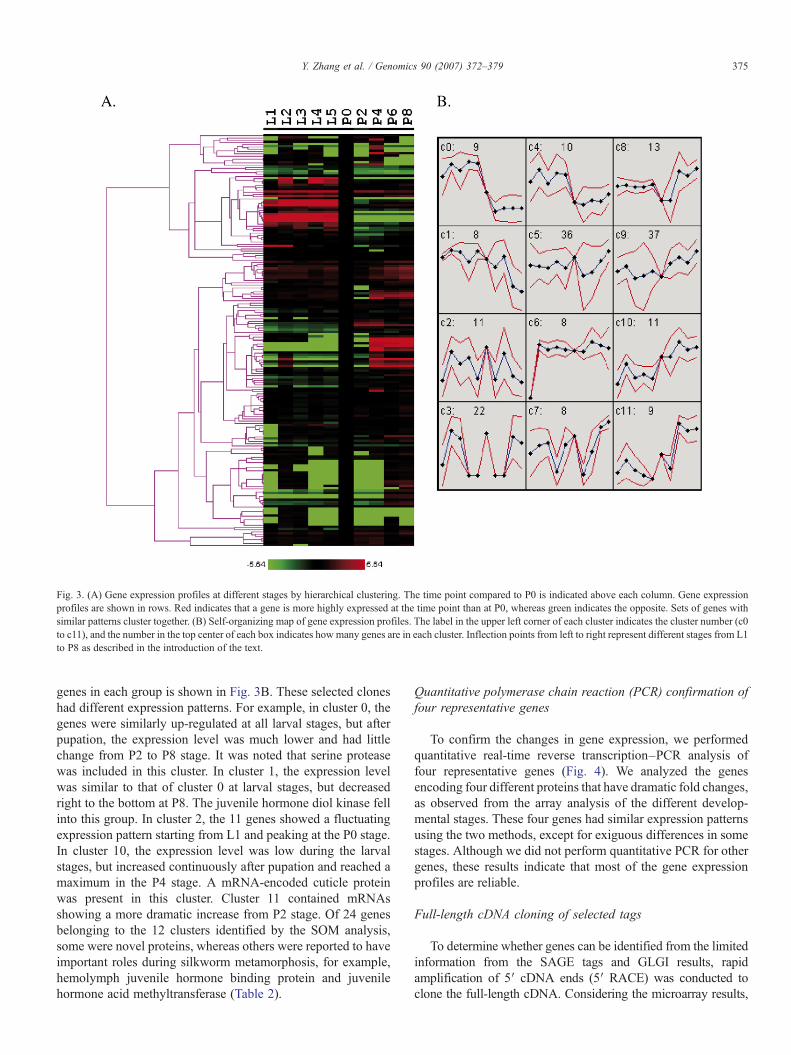
Fig. 3. (A) Gene expression profiles at different stages by hierarchical clustering. The time point compared to P0 is indicated above each column. Gene expressionprofiles are shown in rows. Red indicates that a gene is more highly expressed at the time point than at P0, whereas green indicates the opposite. Sets of genes withsimilar patterns cluster together. (B) Self-organizing map of gene expression profiles. The label in the upper left corner of each cluster indicates the cluster number (c0to c11), and the number in the top center of each box indicates how many genes are in each cluster. Inflection points from left to right represent different stages from L1to P8 as described in the introduction of the text.
375Y. Zhang et al. / Genomics 90 (2007) 372–379
genes in each group is shown in Fig. 3B. These selected cloneshad different expression patterns. For example, in cluster 0, thegenes were similarly up-regulated at all larval stages, but afterpupation, the expression level was much lower and had littlechange from P2 to P8 stage. It was noted that serine proteasewas included in this cluster. In cluster 1, the expression levelwas similar to that of cluster 0 at larval stages, but decreasedright to the bottom at P8. The juvenile hormone diol kinase fellinto this group. In cluster 2, the 11 genes showed a fluctuatingexpression pattern starting from L1 and peaking at the P0 stage.In cluster 10, the expression level was low during the larvalstages, but increased continuously after pupation and reached amaximum in the P4 stage. A mRNA-encoded cuticle proteinwas present in this cluster. Cluster 11 contained mRNAsshowing a more dramatic increase from P2 stage. Of 24 genesbelonging to the 12 clusters identified by the SOM analysis,some were novel proteins, whereas others were reported to haveimportant roles during silkworm metamorphosis, for example,hemolymph juvenile hormone binding protein and juvenilehormone acid methyltransferase (Table 2).
Quantitative polymerase chain reaction (PCR) confirmation offour representative genes
To confirm the changes in gene expression, we performedquantitative real-time reverse transcription–PCR analysis offour representative genes (Fig. 4). We analyzed the genesencoding four different proteins that have dramatic fold changes,as observed from the array analysis of the different develop-mental stages. These four genes had similar expression patternsusing the two methods, except for exiguous differences in somestages. Although we did not perform quantitative PCR for othergenes, these results indicate that most of the gene expressionprofiles are reliable.
Full-length cDNA cloning of selected tags
To determine whether genes can be identified from the limitedinformation from the SAGE tags and GLGI results, rapidamplification of 5′ cDNA ends (5′ RACE) was conducted toclone the full-length cDNA. Considering the microarray results,
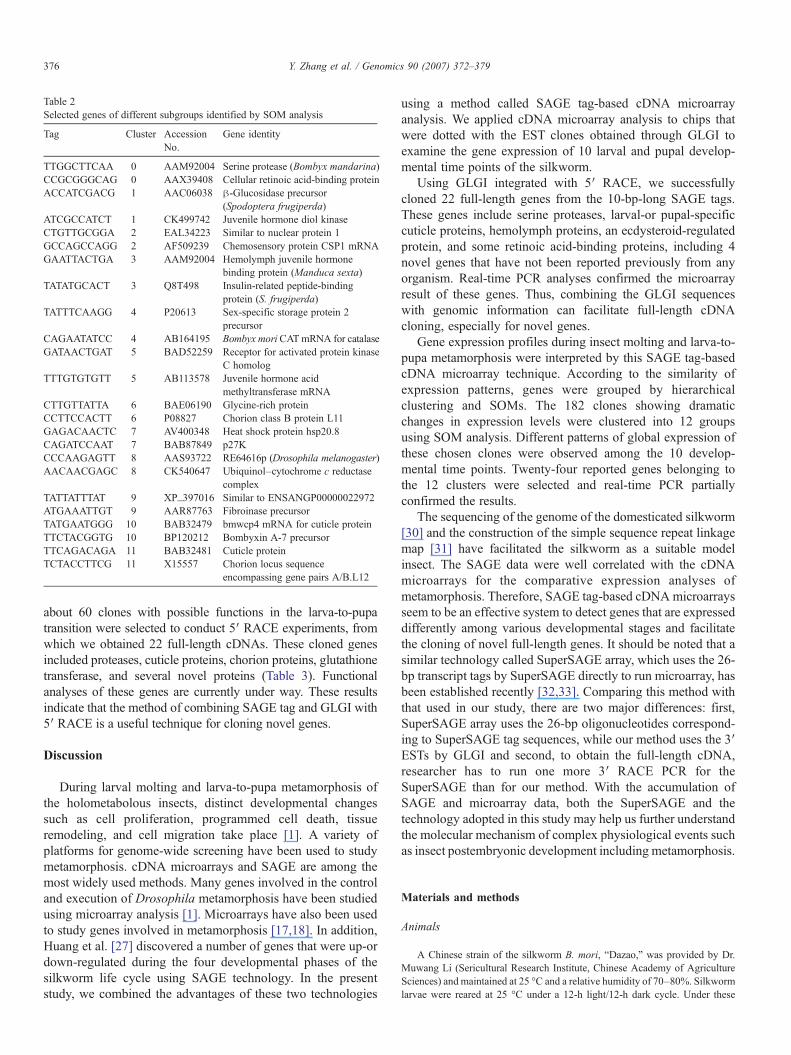
Table 2Selected genes of different subgroups identified by SOM analysis
Tag Cluster AccessionNo.
Gene identity
TTGGCTTCAA 0 AAM92004 Serine protease (Bombyx mandarina)CCGCGGGCAG 0 AAX39408 Cellular retinoic acid-binding proteinACCATCGACG 1 AAC06038 β-Glucosidase precursor
(Spodoptera frugiperda)ATCGCCATCT 1 CK499742 Juvenile hormone diol kinaseCTGTTGCGGA 2 EAL34223 Similar to nuclear protein 1GCCAGCCAGG 2 AF509239 Chemosensory protein CSP1 mRNAGAATTACTGA 3 AAM92004 Hemolymph juvenile hormone
binding protein (Manduca sexta)TATATGCACT 3 Q8T498 Insulin-related peptide-binding
protein (S. frugiperda)TATTTCAAGG 4 P20613 Sex-specific storage protein 2
precursorCAGAATATCC 4 AB164195 Bombyx moriCATmRNA for catalaseGATAACTGAT 5 BAD52259 Receptor for activated protein kinase
C homologTTTGTGTGTT 5 AB113578 Juvenile hormone acid
methyltransferase mRNACTTGTTATTA 6 BAE06190 Glycine-rich proteinCCTTCCACTT 6 P08827 Chorion class B protein L11GAGACAACTC 7 AV400348 Heat shock protein hsp20.8CAGATCCAAT 7 BAB87849 p27KCCCAAGAGTT 8 AAS93722 RE64616p (Drosophila melanogaster)AACAACGAGC 8 CK540647 Ubiquinol–cytochrome c reductase
complexTATTATTTAT 9 XP_397016 Similar to ENSANGP00000022972ATGAAATTGT 9 AAR87763 Fibroinase precursorTATGAATGGG 10 BAB32479 bmwcp4 mRNA for cuticle proteinTTCTACGGTG 10 BP120212 Bombyxin A-7 precursorTTCAGACAGA 11 BAB32481 Cuticle proteinTCTACCTTCG 11 X15557 Chorion locus sequence
encompassing gene pairs A/B.L12
376 Y. Zhang et al. / Genomics 90 (2007) 372–379
about 60 clones with possible functions in the larva-to-pupatransition were selected to conduct 5′ RACE experiments, fromwhich we obtained 22 full-length cDNAs. These cloned genesincluded proteases, cuticle proteins, chorion proteins, glutathionetransferase, and several novel proteins (Table 3). Functionalanalyses of these genes are currently under way. These resultsindicate that the method of combining SAGE tag and GLGI with5′ RACE is a useful technique for cloning novel genes.
Discussion
During larval molting and larva-to-pupa metamorphosis ofthe holometabolous insects, distinct developmental changessuch as cell proliferation, programmed cell death, tissueremodeling, and cell migration take place [1]. A variety ofplatforms for genome-wide screening have been used to studymetamorphosis. cDNA microarrays and SAGE are among themost widely used methods. Many genes involved in the controland execution of Drosophila metamorphosis have been studiedusing microarray analysis [1]. Microarrays have also been usedto study genes involved in metamorphosis [17,18]. In addition,Huang et al. [27] discovered a number of genes that were up-ordown-regulated during the four developmental phases of thesilkworm life cycle using SAGE technology. In the presentstudy, we combined the advantages of these two technologies
using a method called SAGE tag-based cDNA microarrayanalysis. We applied cDNA microarray analysis to chips thatwere dotted with the EST clones obtained through GLGI toexamine the gene expression of 10 larval and pupal develop-mental time points of the silkworm.
Using GLGI integrated with 5′ RACE, we successfullycloned 22 full-length genes from the 10-bp-long SAGE tags.These genes include serine proteases, larval-or pupal-specificcuticle proteins, hemolymph proteins, an ecdysteroid-regulatedprotein, and some retinoic acid-binding proteins, including 4novel genes that have not been reported previously from anyorganism. Real-time PCR analyses confirmed the microarrayresult of these genes. Thus, combining the GLGI sequenceswith genomic information can facilitate full-length cDNAcloning, especially for novel genes.
Gene expression profiles during insect molting and larva-to-pupa metamorphosis were interpreted by this SAGE tag-basedcDNA microarray technique. According to the similarity ofexpression patterns, genes were grouped by hierarchicalclustering and SOMs. The 182 clones showing dramaticchanges in expression levels were clustered into 12 groupsusing SOM analysis. Different patterns of global expression ofthese chosen clones were observed among the 10 develop-mental time points. Twenty-four reported genes belonging tothe 12 clusters were selected and real-time PCR partiallyconfirmed the results.
The sequencing of the genome of the domesticated silkworm[30] and the construction of the simple sequence repeat linkagemap [31] have facilitated the silkworm as a suitable modelinsect. The SAGE data were well correlated with the cDNAmicroarrays for the comparative expression analyses ofmetamorphosis. Therefore, SAGE tag-based cDNAmicroarraysseem to be an effective system to detect genes that are expresseddifferently among various developmental stages and facilitatethe cloning of novel full-length genes. It should be noted that asimilar technology called SuperSAGE array, which uses the 26-bp transcript tags by SuperSAGE directly to run microarray, hasbeen established recently [32,33]. Comparing this method withthat used in our study, there are two major differences: first,SuperSAGE array uses the 26-bp oligonucleotides correspond-ing to SuperSAGE tag sequences, while our method uses the 3′ESTs by GLGI and second, to obtain the full-length cDNA,researcher has to run one more 3′ RACE PCR for theSuperSAGE than for our method. With the accumulation ofSAGE and microarray data, both the SuperSAGE and thetechnology adopted in this study may help us further understandthe molecular mechanism of complex physiological events suchas insect postembryonic development including metamorphosis.
Materials and methods
Animals
A Chinese strain of the silkworm B. mori, “Dazao,” was provided by Dr.Muwang Li (Sericultural Research Institute, Chinese Academy of AgricultureSciences) and maintained at 25 °C and a relative humidity of 70–80%. Silkwormlarvae were reared at 25 °C under a 12-h light/12-h dark cycle. Under these
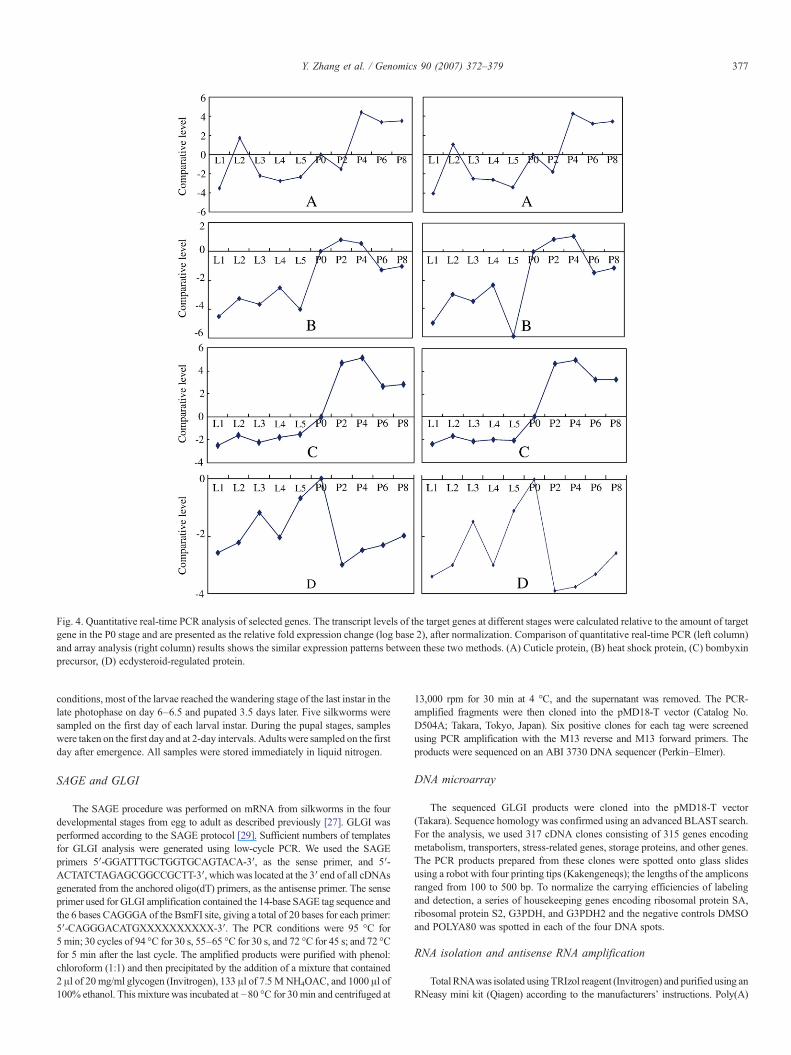
Fig. 4. Quantitative real-time PCR analysis of selected genes. The transcript levels of the target genes at different stages were calculated relative to the amount of targetgene in the P0 stage and are presented as the relative fold expression change (log base 2), after normalization. Comparison of quantitative real-time PCR (left column)and array analysis (right column) results shows the similar expression patterns between these two methods. (A) Cuticle protein, (B) heat shock protein, (C) bombyxinprecursor, (D) ecdysteroid-regulated protein.
377Y. Zhang et al. / Genomics 90 (2007) 372–379
conditions, most of the larvae reached the wandering stage of the last instar in thelate photophase on day 6–6.5 and pupated 3.5 days later. Five silkworms weresampled on the first day of each larval instar. During the pupal stages, sampleswere taken on the first day and at 2-day intervals. Adults were sampled on the firstday after emergence. All samples were stored immediately in liquid nitrogen.
SAGE and GLGI
The SAGE procedure was performed on mRNA from silkworms in the fourdevelopmental stages from egg to adult as described previously [27]. GLGI wasperformed according to the SAGE protocol [29]. Sufficient numbers of templatesfor GLGI analysis were generated using low-cycle PCR. We used the SAGEprimers 5′-GGATTTGCTGGTGCAGTACA-3′, as the sense primer, and 5′-ACTATCTAGAGCGGCCGCTT-3′, which was located at the 3′ end of all cDNAsgenerated from the anchored oligo(dT) primers, as the antisense primer. The senseprimer used for GLGI amplification contained the 14-base SAGE tag sequence andthe 6 bases CAGGGA of the BsmFI site, giving a total of 20 bases for each primer:5′-CAGGGACATGXXXXXXXXXX-3′. The PCR conditions were 95 °C for5 min; 30 cycles of 94 °C for 30 s, 55–65 °C for 30 s, and 72 °C for 45 s; and 72 °Cfor 5 min after the last cycle. The amplified products were purified with phenol:chloroform (1:1) and then precipitated by the addition of a mixture that contained2 μl of 20 mg/ml glycogen (Invitrogen), 133 μl of 7.5 MNH4OAC, and 1000 μl of100% ethanol. This mixture was incubated at −80 °C for 30min and centrifuged at
13,000 rpm for 30 min at 4 °C, and the supernatant was removed. The PCR-amplified fragments were then cloned into the pMD18-T vector (Catalog No.D504A; Takara, Tokyo, Japan). Six positive clones for each tag were screenedusing PCR amplification with the M13 reverse and M13 forward primers. Theproducts were sequenced on an ABI 3730 DNA sequencer (Perkin–Elmer).
DNA microarray
The sequenced GLGI products were cloned into the pMD18-T vector(Takara). Sequence homology was confirmed using an advanced BLASTsearch.For the analysis, we used 317 cDNA clones consisting of 315 genes encodingmetabolism, transporters, stress-related genes, storage proteins, and other genes.The PCR products prepared from these clones were spotted onto glass slidesusing a robot with four printing tips (Kakengeneqs); the lengths of the ampliconsranged from 100 to 500 bp. To normalize the carrying efficiencies of labelingand detection, a series of housekeeping genes encoding ribosomal protein SA,ribosomal protein S2, G3PDH, and G3PDH2 and the negative controls DMSOand POLYA80 was spotted in each of the four DNA spots.
RNA isolation and antisense RNA amplification
Total RNAwas isolated using TRIzol reagent (Invitrogen) and purified using anRNeasy mini kit (Qiagen) according to the manufacturers’ instructions. Poly(A)
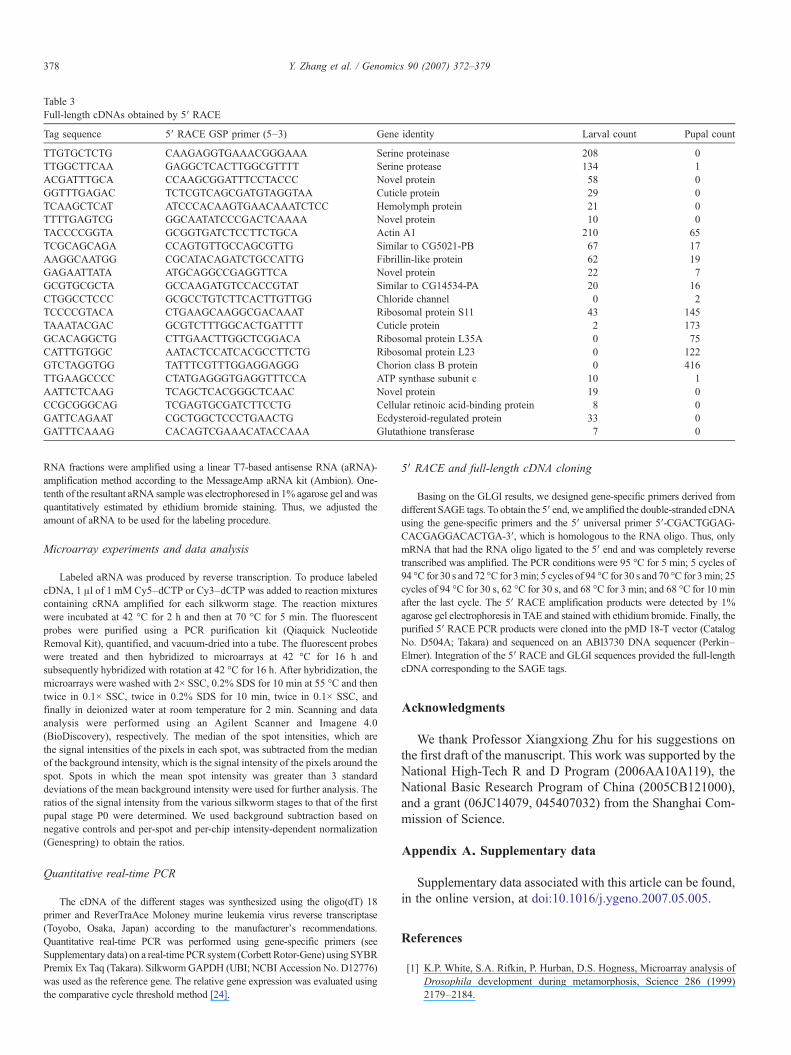
Table 3Full-length cDNAs obtained by 5′ RACE
Tag sequence 5′ RACE GSP primer (5–3) Gene identity Larval count Pupal count
TTGTGCTCTG CAAGAGGTGAAACGGGAAA Serine proteinase 208 0TTGGCTTCAA GAGGCTCACTTGGCGTTTT Serine protease 134 1ACGATTTGCA CCAAGCGGATTTCCTACCC Novel protein 58 0GGTTTGAGAC TCTCGTCAGCGATGTAGGTAA Cuticle protein 29 0TCAAGCTCAT ATCCCACAAGTGAACAAATCTCC Hemolymph protein 21 0TTTTGAGTCG GGCAATATCCCGACTCAAAA Novel protein 10 0TACCCCGGTA GCGGTGATCTCCTTCTGCA Actin A1 210 65TCGCAGCAGA CCAGTGTTGCCAGCGTTG Similar to CG5021-PB 67 17AAGGCAATGG CGCATACAGATCTGCCATTG Fibrillin-like protein 62 19GAGAATTATA ATGCAGGCCGAGGTTCA Novel protein 22 7GCGTGCGCTA GCCAAGATGTCCACCGTAT Similar to CG14534-PA 20 16CTGGCCTCCC GCGCCTGTCTTCACTTGTTGG Chloride channel 0 2TCCCCGTACA CTGAAGCAAGGCGACAAAT Ribosomal protein S11 43 145TAAATACGAC GCGTCTTTGGCACTGATTTT Cuticle protein 2 173GCACAGGCTG CTTGAACTTGGCTCGGACA Ribosomal protein L35A 0 75CATTTGTGGC AATACTCCATCACGCCTTCTG Ribosomal protein L23 0 122GTCTAGGTGG TATTTCGTTTGGAGGAGGG Chorion class B protein 0 416TTGAAGCCCC CTATGAGGGTGAGGTTTCCA ATP synthase subunit c 10 1AATTCTCAAG TCAGCTCACGGGCTCAAC Novel protein 19 0CCGCGGGCAG TCGAGTGCGATCTTCCTG Cellular retinoic acid-binding protein 8 0GATTCAGAAT CGCTGGCTCCCTGAACTG Ecdysteroid-regulated protein 33 0GATTTCAAAG CACAGTCGAAACATACCAAA Glutathione transferase 7 0
378 Y. Zhang et al. / Genomics 90 (2007) 372–379
RNA fractions were amplified using a linear T7-based antisense RNA (aRNA)-amplification method according to the MessageAmp aRNA kit (Ambion). One-tenth of the resultant aRNA sample was electrophoresed in 1% agarose gel andwasquantitatively estimated by ethidium bromide staining. Thus, we adjusted theamount of aRNA to be used for the labeling procedure.
Microarray experiments and data analysis
Labeled aRNA was produced by reverse transcription. To produce labeledcDNA, 1 μl of 1 mM Cy5–dCTP or Cy3–dCTP was added to reaction mixturescontaining cRNA amplified for each silkworm stage. The reaction mixtureswere incubated at 42 °C for 2 h and then at 70 °C for 5 min. The fluorescentprobes were purified using a PCR purification kit (Qiaquick NucleotideRemoval Kit), quantified, and vacuum-dried into a tube. The fluorescent probeswere treated and then hybridized to microarrays at 42 °C for 16 h andsubsequently hybridized with rotation at 42 °C for 16 h. After hybridization, themicroarrays were washed with 2× SSC, 0.2% SDS for 10 min at 55 °C and thentwice in 0.1× SSC, twice in 0.2% SDS for 10 min, twice in 0.1× SSC, andfinally in deionized water at room temperature for 2 min. Scanning and dataanalysis were performed using an Agilent Scanner and Imagene 4.0(BioDiscovery), respectively. The median of the spot intensities, which arethe signal intensities of the pixels in each spot, was subtracted from the medianof the background intensity, which is the signal intensity of the pixels around thespot. Spots in which the mean spot intensity was greater than 3 standarddeviations of the mean background intensity were used for further analysis. Theratios of the signal intensity from the various silkworm stages to that of the firstpupal stage P0 were determined. We used background subtraction based onnegative controls and per-spot and per-chip intensity-dependent normalization(Genespring) to obtain the ratios.
Quantitative real-time PCR
The cDNA of the different stages was synthesized using the oligo(dT) 18primer and ReverTraAce Moloney murine leukemia virus reverse transcriptase(Toyobo, Osaka, Japan) according to the manufacturer’s recommendations.Quantitative real-time PCR was performed using gene-specific primers (seeSupplementary data) on a real-time PCR system (Corbett Rotor-Gene) using SYBRPremix Ex Taq (Takara). SilkwormGAPDH (UBI; NCBI Accession No. D12776)was used as the reference gene. The relative gene expression was evaluated usingthe comparative cycle threshold method [24].
5′ RACE and full-length cDNA cloning
Basing on the GLGI results, we designed gene-specific primers derived fromdifferent SAGE tags. To obtain the 5′ end, we amplified the double-stranded cDNAusing the gene-specific primers and the 5′ universal primer 5′-CGACTGGAG-CACGAGGACACTGA-3′, which is homologous to the RNA oligo. Thus, onlymRNA that had the RNA oligo ligated to the 5′ end and was completely reversetranscribed was amplified. The PCR conditions were 95 °C for 5 min; 5 cycles of94 °C for 30 s and 72 °C for 3min; 5 cycles of 94 °C for 30 s and 70 °C for 3min; 25cycles of 94 °C for 30 s, 62 °C for 30 s, and 68 °C for 3 min; and 68 °C for 10 minafter the last cycle. The 5′ RACE amplification products were detected by 1%agarose gel electrophoresis in TAE and stained with ethidium bromide. Finally, thepurified 5′ RACE PCR products were cloned into the pMD 18-T vector (CatalogNo. D504A; Takara) and sequenced on an ABI3730 DNA sequencer (Perkin–Elmer). Integration of the 5′ RACE and GLGI sequences provided the full-lengthcDNA corresponding to the SAGE tags.
Acknowledgments
We thank Professor Xiangxiong Zhu for his suggestions onthe first draft of the manuscript. This work was supported by theNational High-Tech R and D Program (2006AA10A119), theNational Basic Research Program of China (2005CB121000),and a grant (06JC14079, 045407032) from the Shanghai Com-mission of Science.
Appendix A. Supplementary data
Supplementary data associated with this article can be found,in the online version, at doi:10.1016/j.ygeno.2007.05.005.
References
[1] K.P. White, S.A. Rifkin, P. Hurban, D.S. Hogness, Microarray analysis ofDrosophila development during metamorphosis, Science 286 (1999)2179–2184.
379Y. Zhang et al. / Genomics 90 (2007) 372–379
[2] C.R. Simon, J.C. de Almeida, Programmed cell death in Bradysia hygida(Diptera, Sciaridae) salivary glands presents apoptotic features, Genesis 40(2004) 22–31.
[3] S. Tsuzuki, M. Iwami, S. Sakurai, Ecdysteroid-inducible genes in theprogrammed cell death during insect metamorphosis, Insect Biochem.Mol. Biol. 31 (2001) 321–331.
[4] S. Nagata, H. Kataoka, A. Suzuki, Silk moth neuropeptide hormones:prothoracicotropic hormone and others, Ann. N. Y. Acad. Sci. 1040 (2005)38–52.
[5] E.B. Dubrovsky, Hormonal cross talk in insect development, TrendsEndocrinol. Metab. 16 (2005) 6–11.
[6] M.R. Koelle, et al., The Drosophila EcR gene encodes an ecdysonereceptor, a new member of the steroid receptor superfamily, Cell 67 (1991)59–77.
[7] P.S. Guay, G.M. Guild, The ecdysone-induced puffing cascade in Droso-phila salivary glands: a Broad-Complex early gene regulates intermoltand late gene transcription, Genetics 129 (1991) 169–175.
[8] K.C. Burtisa, C.S. Thummel, C.W. Jonesa, F.D. Karimb, D.S. Hogness,The Drosophila 74EF early puff contains E74, a complex ecdysone-inducible gene that encodes two ets-related proteins, Cell 61 (1990) 85–99.
[9] W.A. Segraves, D.S. Hogness, The E75 ecdysone-inducible gene res-ponsible for the 75B early puff in Drosophila encodes two new membersof the steroid receptor superfamily, Genes Dev. 4 (1990) 204–219.
[10] X. Bellés, D. Martín, M.D. Piulachs, The mevalonate pathway and thesynthesis of juvenile hormone in insects, Annu. Rev. Entomol. 50 (2005)181–199.
[11] R.A. Maxwell, W.H. Welch, D.A. Schooley, Juvenile hormone diol kinase.I. Purification, characterization, and substrate specificity of juvenilehormone-selective diol kinase from Manduca sexta, J. Biol. Chem. 277(2002) 21874–21881.
[12] Q.R. Zhang, W.H. Xu, F.S. Chen, S. Li, Molecular and biochemicalcharacterization of juvenile hormone epoxide hydrolase from the silk-worm, Bombyx mori, Insect Biochem. Mol. Biol. 35 (2005) 153–164.
[13] S. Li, Q.R. Zhang, W.H. Xu, D.A. Schooley, Juvenile hormone diol kinase,a calcium-binding protein with kinase activity, from the silkworm, Bombyxmori, Insect Biochem. Mol. Biol. 35 (2005) 1235–1248.
[14] C.S. Thummel, Flies on steroids—Drosophila metamorphosis and themechanisms of steroid hormone action, Trends Genet. 12 (1996) 306–310.
[15] M. Schena, D. Shalon, R.W. Davis, P.O. Brown, Quantitative monitoringof gene expression patterns with a complementary DNA microarray,Science 270 (1995) 467–470.
[16] D. Shalon, S. Smith, P.O. Brown, A DNAmicroarray system for analyzing
complex DNA samples using two-color fluorescent probe hybridization,Genome Res. 6 (1996) 639–645.
[17] M.J. Butler, et al., Discovery of genes with highly restricted expressionpatterns in the Drosophila wing disc using DNA oligonucleotidemicroarrays, Development 130 (2003) 659–670.
[18] H. Kawasaki, et al., Change in the expressed gene patterns of the wing discduring the metamorphosis of Bombyx mori, Gene 343 (2004) 133–142.
[19] V.E. Velculescu, L. Zhang, B. Vogelstein, K.W. Kinzler, Serial analysis ofgene expression, Science 270 (1995) 484–487.
[20] S.L. Madden, E.A. Galella, J. Zhu, A.H. Bertelsen, G.A. Beaudry, SAGEtranscript profiles for p53-dependent growth regulation, Oncogene 15(1997) 1079–1085.
[21] V.E. Velculescu, et al., Characterization of the yeast transcriptome, Cell 88(1997) 243–251.
[22] J.Y. Lee, D.H. Lee, Use of serial analysis of gene expression technology toreveal changes in gene expression in Arabidopsis pollen undergoing coldstress, Plant Physiol. 132 (2003) 517–529.
[23] P. Divina, J. Forejt, The mouse SAGE site: database of public mouseSAGE libraries, Nucleic Acids Res. 32 (2004) D482–D483.
[24] B. Virlon, et al., Serial microanalysis of renal transcriptomes, Proc. Natl.Acad. Sci. USA 96 (1999) 15286–15291.
[25] A. Lal, et al., A public database for gene expression in human cancers,Cancer Res. 59 (1999) 5403–5407.
[26] S. Saha, et al., Using the transcriptome to annotate the genome, Nat.Biotechnol. 20 (2002) 508–512.
[27] J.H. Huang, et al., Serial analysis of gene expression in the silkworm,Bombyx mori, Genomics 86 (2005) 233–241.
[28] J.J. Chen, J.D. Rowley, S.M. Wang, Generation of longer cDNA fragmentsfrom serial analysis of gene expression tags for gene identification, Proc.Natl. Acad. Sci. USA 97 (2000) 349–353.
[29] L. Zhang, et al., Gene expression profiles in normal and cancer cells,Science 276 (1997) 1268–1272.
[30] Q.Y. Xia, A draft sequence for the genome of the domesticated silkworm(Bombyx mori), Science 306 (2004) 1937–1940.
[31] X.X. Miao, et al., Simple sequence repeat-based consensus linkage mapof Bombyx mori, Proc. Natl. Acad. Sci. USA 102 (2005) 16303–16308.
[32] H. Matsumura, et al., Gene expression analysis of plant host–pathogeninteractions by SuperSAGE, Proc. Natl. Acad. Sci. USA 100 (2003)15718–15723.
[33] H. Matsumura, et al., SuperSAGE array: the direct use of 26-base-pair transcript tags in oligonucleotide arrays, Nat. Methods 3 (2006)469–474.


