Embed Size (px)
Citation preview

Freight Market Intelligence A Better Way to Control Transportation Costs
March 29, 2012
CHAINalytics
2
Today’s Speakers
Rob Hair Sr. Director, Global Transportation
Processes & Systems
Rodney Noble Sr. Director, Carrier Operations &
Procurement
Gary Girotti Vice President, Transportation
Practice CHAINalytics
Fabrizio Brasca Vice President, Global Logistics
Michael Levans Group Editorial Director, Supply
Chain Group
Moderator
3
Agenda
Introduction to Chainalytics’ Freight Market Intelligence
Consortium
Overview of PepsiCo’s Transportation Procurement Model
How Freight Market Intelligence Enhances PepsiCo’s
Procurement Process
Discussion
4
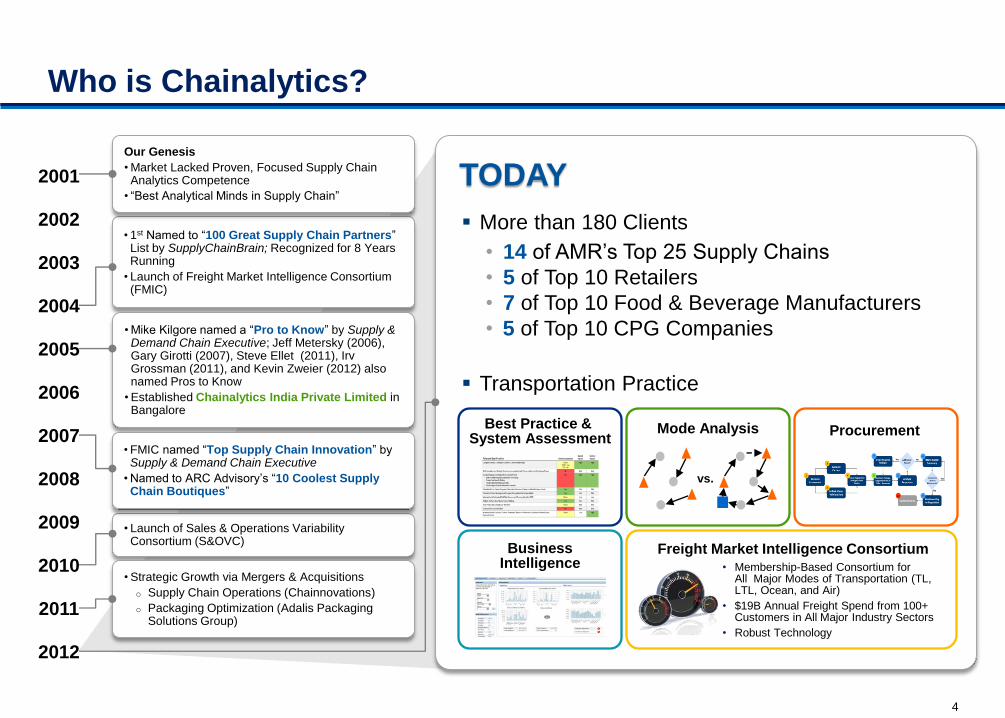
Who is Chainalytics?
More than 180 Clients
• 14 of AMR’s Top 25 Supply Chains
• 5 of Top 10 Retailers
• 7 of Top 10 Food & Beverage Manufacturers
• 5 of Top 10 CPG Companies
Transportation Practice
TODAY
• 1st Named to “100 Great Supply Chain Partners” List by SupplyChainBrain; Recognized for 8 Years Running
• Launch of Freight Market Intelligence Consortium (FMIC)
Our Genesis
• Market Lacked Proven, Focused Supply Chain Analytics Competence
• “Best Analytical Minds in Supply Chain”
• Launch of Sales & Operations Variability Consortium (S&OVC)
• Mike Kilgore named a “Pro to Know” by Supply & Demand Chain Executive; Jeff Metersky (2006), Gary Girotti (2007), Steve Ellet (2011), Irv Grossman (2011), and Kevin Zweier (2012) also named Pros to Know
• Established Chainalytics India Private Limited in Bangalore
• Strategic Growth via Mergers & Acquisitions
o Supply Chain Operations (Chainnovations)
o Packaging Optimization (Adalis Packaging Solutions Group)
• FMIC named “Top Supply Chain Innovation” by Supply & Demand Chain Executive
• Named to ARC Advisory’s “10 Coolest Supply Chain Boutiques”
2001
2002
2003
2004
2005
2006
2007
2009
2010
2011
2008
2012
Procurement Mode Analysis
vs.
Best Practice & System Assessment
Business Intelligence • Membership-Based Consortium for
All Major Modes of Transportation (TL, LTL, Ocean, and Air)
• $19B Annual Freight Spend from 100+ Customers in All Major Industry Sectors
• Robust Technology
Freight Market Intelligence Consortium
5
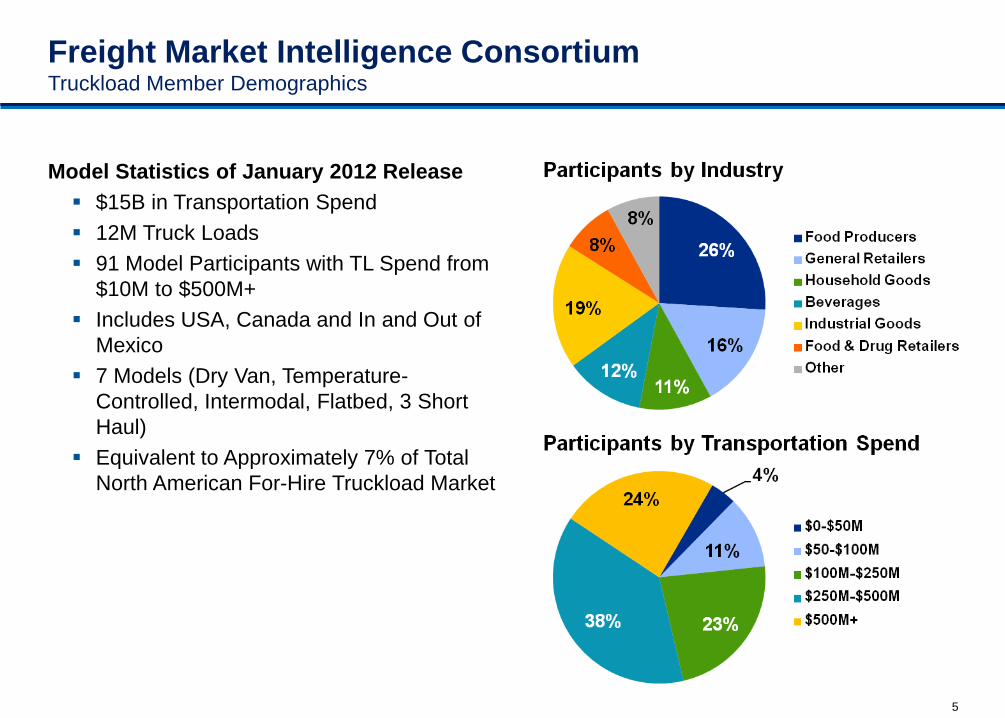
Freight Market Intelligence Consortium Truckload Member Demographics
Model Statistics of January 2012 Release
$15B in Transportation Spend
12M Truck Loads
91 Model Participants with TL Spend from
$10M to $500M+
Includes USA, Canada and In and Out of
Mexico
7 Models (Dry Van, Temperature-
Controlled, Intermodal, Flatbed, 3 Short
Haul)
Equivalent to Approximately 7% of Total
North American For-Hire Truckload Market
6
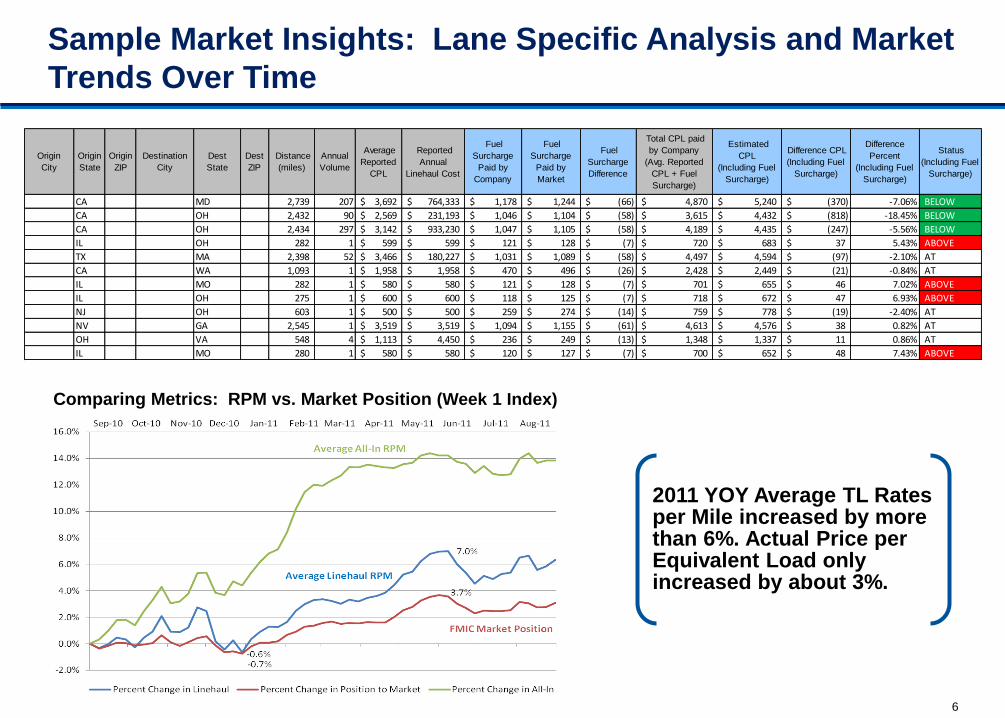
Sample Market Insights: Lane Specific Analysis and Market
Trends Over Time
2011 YOY Average TL Rates per Mile increased by more than 6%. Actual Price per Equivalent Load only increased by about 3%.
Comparing Metrics: RPM vs. Market Position (Week 1 Index)
Origin
City
Origin
State
Origin
ZIP
Destination
City
Dest
State
Dest
ZIP
Distance
(miles)
Annual
Volume
Average
Reported
CPL
Reported
Annual
Linehaul Cost
Fuel
Surcharge
Paid by
Company
Fuel
Surcharge
Paid by
Market
Fuel
Surcharge
Difference
Total CPL paid
by Company
(Avg. Reported
CPL + Fuel
Surcharge)
Estimated
CPL
(Including Fuel
Surcharge)
Difference CPL
(Including Fuel
Surcharge)
Difference
Percent
(Including Fuel
Surcharge)
Status
(Including Fuel
Surcharge)
CA MD 2,739 207 3,692$ 764,333$ 1,178$ 1,244$ (66)$ 4,870$ 5,240$ (370)$ -7.06% BELOW
CA OH 2,432 90 2,569$ 231,193$ 1,046$ 1,104$ (58)$ 3,615$ 4,432$ (818)$ -18.45% BELOW
CA OH 2,434 297 3,142$ 933,230$ 1,047$ 1,105$ (58)$ 4,189$ 4,435$ (247)$ -5.56% BELOW
IL OH 282 1 599$ 599$ 121$ 128$ (7)$ 720$ 683$ 37$ 5.43% ABOVE
TX MA 2,398 52 3,466$ 180,227$ 1,031$ 1,089$ (58)$ 4,497$ 4,594$ (97)$ -2.10% AT
CA WA 1,093 1 1,958$ 1,958$ 470$ 496$ (26)$ 2,428$ 2,449$ (21)$ -0.84% AT
IL MO 282 1 580$ 580$ 121$ 128$ (7)$ 701$ 655$ 46$ 7.02% ABOVE
IL OH 275 1 600$ 600$ 118$ 125$ (7)$ 718$ 672$ 47$ 6.93% ABOVE
NJ OH 603 1 500$ 500$ 259$ 274$ (14)$ 759$ 778$ (19)$ -2.40% AT
NV GA 2,545 1 3,519$ 3,519$ 1,094$ 1,155$ (61)$ 4,613$ 4,576$ 38$ 0.82% AT
OH VA 548 4 1,113$ 4,450$ 236$ 249$ (13)$ 1,348$ 1,337$ 11$ 0.86% AT
IL MO 280 1 580$ 580$ 120$ 127$ (7)$ 700$ 652$ 48$ 7.43% ABOVE
7
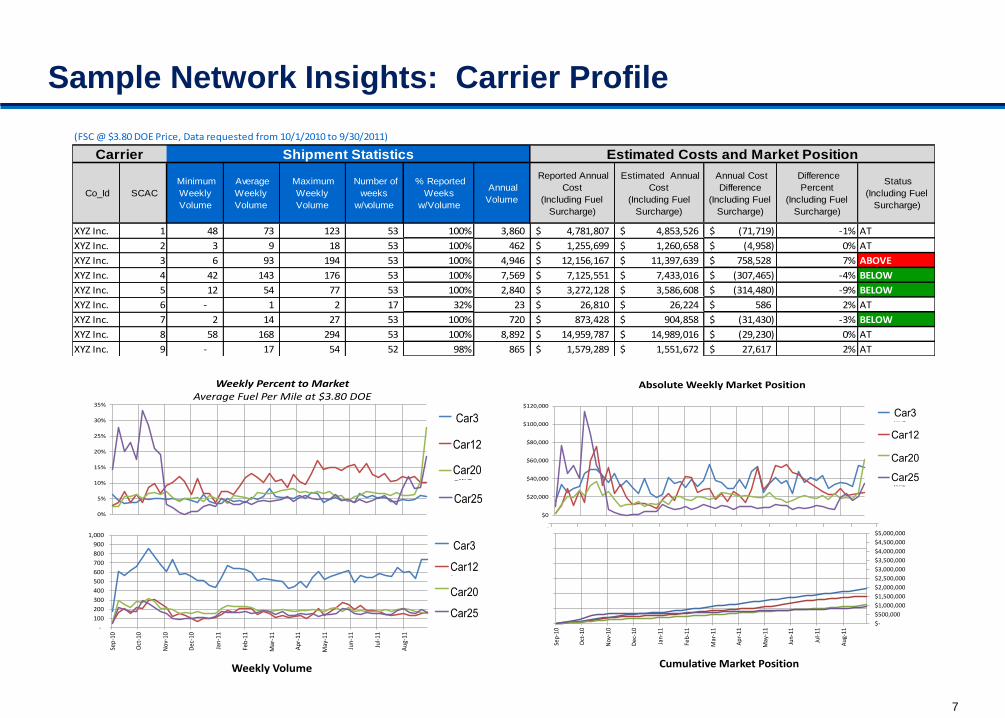
Sample Network Insights: Carrier Profile XYZ Inc.
(FSC @ $3.80 DOE Price, Data requested from 10/1/2010 to 9/30/2011)
Co_Id SCAC
Minimum
Weekly
Volume
Average
Weekly
Volume
Maximum
Weekly
Volume
Number of
weeks
w/volume
% Reported
Weeks
w/Volume
Annual
Volume
Reported Annual
Cost
(Including Fuel
Surcharge)
Estimated Annual
Cost
(Including Fuel
Surcharge)
Annual Cost
Difference
(Including Fuel
Surcharge)
Difference
Percent
(Including Fuel
Surcharge)
Status
(Including Fuel
Surcharge)
XYZ Inc. 1 48 73 123 53 100% 3,860 4,781,807$ 4,853,526$ (71,719)$ -1% AT
XYZ Inc. 2 3 9 18 53 100% 462 1,255,699$ 1,260,658$ (4,958)$ 0% AT
XYZ Inc. 3 6 93 194 53 100% 4,946 12,156,167$ 11,397,639$ 758,528$ 7% ABOVE
XYZ Inc. 4 42 143 176 53 100% 7,569 7,125,551$ 7,433,016$ (307,465)$ -4% BELOW
XYZ Inc. 5 12 54 77 53 100% 2,840 3,272,128$ 3,586,608$ (314,480)$ -9% BELOW
XYZ Inc. 6 - 1 2 17 32% 23 26,810$ 26,224$ 586$ 2% AT
XYZ Inc. 7 2 14 27 53 100% 720 873,428$ 904,858$ (31,430)$ -3% BELOW
XYZ Inc. 8 58 168 294 53 100% 8,892 14,959,787$ 14,989,016$ (29,230)$ 0% AT
XYZ Inc. 9 - 17 54 52 98% 865 1,579,289$ 1,551,672$ 27,617$ 2% AT
XYZ Inc. 10 1 12 20 53 100% 635 599,163$ 689,347$ (90,185)$ -13% BELOW
XYZ Inc. 11 28 68 97 53 100% 3,585 4,910,758$ 5,062,026$ (151,268)$ -3% BELOW
XYZ Inc. 12 - 14 54 46 87% 627 1,311,745$ 1,043,715$ 268,030$ 26% ABOVE
XYZ Inc. 13 1 14 26 53 100% 730 513,450$ 546,610$ (33,160)$ -6% BELOW
XYZ Inc. 14 143 492 665 53 100% 26,059 30,249,440$ 31,149,423$ (899,983)$ -3% BELOW
XYZ Inc. 15 41 126 186 53 100% 6,661 12,957,732$ 13,458,719$ (500,988)$ -4% BELOW
XYZ Inc. 16 4 23 47 53 100% 1,216 1,998,122$ 2,163,900$ (165,778)$ -8% BELOW
XYZ Inc. 17 10 37 66 53 100% 1,968 2,381,559$ 2,380,354$ 1,205$ 0% AT
XYZ Inc. 18 9 66 146 53 100% 3,475 4,763,127$ 4,999,324$ (236,197)$ -5% BELOW
XYZ Inc. 19 11 37 53 53 100% 1,960 3,085,733$ 2,715,967$ 369,765$ 14% ABOVE
Carrier Shipment Statistics Estimated Costs and Market Position
2011- Annual Truckload Model 2
Carrier Report
0%
5%
10%
15%
20%
25%
30%
35%
Weekly Percent to MarketAverage Fuel Per Mile at $3.80 DOE
TNTI_WAL
RTS_WAL
GRDN_WAL
EPES_WAL
Car3
Car12
Car20
Car25
-
100
200
300
400
500
600
700
800
900
1,000
Sep
-10
Oct
-10
No
v-10
Dec
-10
Jan-
11
Feb
-11
Mar
-11
Ap
r-11
May
-11
Jun
-11
Jul-
11
Au
g-11
Weekly Volume
TNTI_WAL
RTS_WAL
GRDN_WAL
EPES_WALCar25
Car3
Car12
Car20
$0
$20,000
$40,000
$60,000
$80,000
$100,000
$120,000
Absolute Weekly Market Position
TNTI_WAL
RTS_WAL
GRDN_WAL
EPES_WALCar25
Car3
Car12
Car20
$-
$500,000
$1,000,000
$1,500,000
$2,000,000
$2,500,000
$3,000,000
$3,500,000
$4,000,000
$4,500,000
$5,000,000
0
0.2
0.4
0.6
0.8
1
1.2
Sep
-10
Oct
-10
No
v-10
Dec
-10
Jan-
11
Feb
-11
Mar
-11
Ap
r-11
May
-11
Jun
-11
Jul-
11
Au
g-11
Cumulative Market Position
XYZ Inc.
(FSC @ $3.80 DOE Price, Data requested from 10/1/2010 to 9/30/2011)
Co_Id SCAC
Minimum
Weekly
Volume
Average
Weekly
Volume
Maximum
Weekly
Volume
Number of
weeks
w/volume
% Reported
Weeks
w/Volume
Annual
Volume
Reported Annual
Cost
(Including Fuel
Surcharge)
Estimated Annual
Cost
(Including Fuel
Surcharge)
Annual Cost
Difference
(Including Fuel
Surcharge)
Difference
Percent
(Including Fuel
Surcharge)
Status
(Including Fuel
Surcharge)
XYZ Inc. 1 48 73 123 53 100% 3,860 4,781,807$ 4,853,526$ (71,719)$ -1% AT
XYZ Inc. 2 3 9 18 53 100% 462 1,255,699$ 1,260,658$ (4,958)$ 0% AT
XYZ Inc. 3 6 93 194 53 100% 4,946 12,156,167$ 11,397,639$ 758,528$ 7% ABOVE
XYZ Inc. 4 42 143 176 53 100% 7,569 7,125,551$ 7,433,016$ (307,465)$ -4% BELOW
XYZ Inc. 5 12 54 77 53 100% 2,840 3,272,128$ 3,586,608$ (314,480)$ -9% BELOW
XYZ Inc. 6 - 1 2 17 32% 23 26,810$ 26,224$ 586$ 2% AT
XYZ Inc. 7 2 14 27 53 100% 720 873,428$ 904,858$ (31,430)$ -3% BELOW
XYZ Inc. 8 58 168 294 53 100% 8,892 14,959,787$ 14,989,016$ (29,230)$ 0% AT
XYZ Inc. 9 - 17 54 52 98% 865 1,579,289$ 1,551,672$ 27,617$ 2% AT
XYZ Inc. 10 1 12 20 53 100% 635 599,163$ 689,347$ (90,185)$ -13% BELOW
XYZ Inc. 11 28 68 97 53 100% 3,585 4,910,758$ 5,062,026$ (151,268)$ -3% BELOW
XYZ Inc. 12 - 14 54 46 87% 627 1,311,745$ 1,043,715$ 268,030$ 26% ABOVE
XYZ Inc. 13 1 14 26 53 100% 730 513,450$ 546,610$ (33,160)$ -6% BELOW
XYZ Inc. 14 143 492 665 53 100% 26,059 30,249,440$ 31,149,423$ (899,983)$ -3% BELOW
XYZ Inc. 15 41 126 186 53 100% 6,661 12,957,732$ 13,458,719$ (500,988)$ -4% BELOW
XYZ Inc. 16 4 23 47 53 100% 1,216 1,998,122$ 2,163,900$ (165,778)$ -8% BELOW
XYZ Inc. 17 10 37 66 53 100% 1,968 2,381,559$ 2,380,354$ 1,205$ 0% AT
XYZ Inc. 18 9 66 146 53 100% 3,475 4,763,127$ 4,999,324$ (236,197)$ -5% BELOW
XYZ Inc. 19 11 37 53 53 100% 1,960 3,085,733$ 2,715,967$ 369,765$ 14% ABOVE
Carrier Shipment Statistics Estimated Costs and Market Position
2011- Annual Truckload Model 2
Carrier Report
0%
5%
10%
15%
20%
25%
30%
35%
Weekly Percent to MarketAverage Fuel Per Mile at $3.80 DOE
TNTI_WAL
RTS_WAL
GRDN_WAL
EPES_WAL
Car3
Car12
Car20
Car25
-
100
200
300
400
500
600
700
800
900
1,000
Sep-
10
Oct
-10
Nov
-10
Dec
-10
Jan-
11
Feb-
11
Mar
-11
Apr
-11
May
-11
Jun-
11
Jul-1
1
Aug
-11
Weekly Volume
TNTI_WAL
RTS_WAL
GRDN_WAL
EPES_WALCar25
Car3
Car12
Car20
$0
$20,000
$40,000
$60,000
$80,000
$100,000
$120,000
Absolute Weekly Market Position
TNTI_WAL
RTS_WAL
GRDN_WAL
EPES_WALCar25
Car3
Car12
Car20
$-
$500,000
$1,000,000
$1,500,000
$2,000,000
$2,500,000
$3,000,000
$3,500,000
$4,000,000
$4,500,000
$5,000,000
0
0.2
0.4
0.6
0.8
1
1.2
Sep-
10
Oct
-10
Nov
-10
Dec
-10
Jan-
11
Feb-
11
Mar
-11
Apr
-11
May
-11
Jun-
11
Jul-1
1
Aug
-11
Cumulative Market Position
XYZ Inc.
(FSC @ $3.80 DOE Price, Data requested from 10/1/2010 to 9/30/2011)
Co_Id SCAC
Minimum
Weekly
Volume
Average
Weekly
Volume
Maximum
Weekly
Volume
Number of
weeks
w/volume
% Reported
Weeks
w/Volume
Annual
Volume
Reported Annual
Cost
(Including Fuel
Surcharge)
Estimated Annual
Cost
(Including Fuel
Surcharge)
Annual Cost
Difference
(Including Fuel
Surcharge)
Difference
Percent
(Including Fuel
Surcharge)
Status
(Including Fuel
Surcharge)
XYZ Inc. 1 48 73 123 53 100% 3,860 4,781,807$ 4,853,526$ (71,719)$ -1% AT
XYZ Inc. 2 3 9 18 53 100% 462 1,255,699$ 1,260,658$ (4,958)$ 0% AT
XYZ Inc. 3 6 93 194 53 100% 4,946 12,156,167$ 11,397,639$ 758,528$ 7% ABOVE
XYZ Inc. 4 42 143 176 53 100% 7,569 7,125,551$ 7,433,016$ (307,465)$ -4% BELOW
XYZ Inc. 5 12 54 77 53 100% 2,840 3,272,128$ 3,586,608$ (314,480)$ -9% BELOW
XYZ Inc. 6 - 1 2 17 32% 23 26,810$ 26,224$ 586$ 2% AT
XYZ Inc. 7 2 14 27 53 100% 720 873,428$ 904,858$ (31,430)$ -3% BELOW
XYZ Inc. 8 58 168 294 53 100% 8,892 14,959,787$ 14,989,016$ (29,230)$ 0% AT
XYZ Inc. 9 - 17 54 52 98% 865 1,579,289$ 1,551,672$ 27,617$ 2% AT
XYZ Inc. 10 1 12 20 53 100% 635 599,163$ 689,347$ (90,185)$ -13% BELOW
XYZ Inc. 11 28 68 97 53 100% 3,585 4,910,758$ 5,062,026$ (151,268)$ -3% BELOW
XYZ Inc. 12 - 14 54 46 87% 627 1,311,745$ 1,043,715$ 268,030$ 26% ABOVE
XYZ Inc. 13 1 14 26 53 100% 730 513,450$ 546,610$ (33,160)$ -6% BELOW
XYZ Inc. 14 143 492 665 53 100% 26,059 30,249,440$ 31,149,423$ (899,983)$ -3% BELOW
XYZ Inc. 15 41 126 186 53 100% 6,661 12,957,732$ 13,458,719$ (500,988)$ -4% BELOW
XYZ Inc. 16 4 23 47 53 100% 1,216 1,998,122$ 2,163,900$ (165,778)$ -8% BELOW
XYZ Inc. 17 10 37 66 53 100% 1,968 2,381,559$ 2,380,354$ 1,205$ 0% AT
XYZ Inc. 18 9 66 146 53 100% 3,475 4,763,127$ 4,999,324$ (236,197)$ -5% BELOW
XYZ Inc. 19 11 37 53 53 100% 1,960 3,085,733$ 2,715,967$ 369,765$ 14% ABOVE
Carrier Shipment Statistics Estimated Costs and Market Position
2011- Annual Truckload Model 2
Carrier Report
0%
5%
10%
15%
20%
25%
30%
35%
Weekly Percent to MarketAverage Fuel Per Mile at $3.80 DOE
TNTI_WAL
RTS_WAL
GRDN_WAL
EPES_WAL
Car3
Car12
Car20
Car25
-
100
200
300
400
500
600
700
800
900
1,000
Sep
-10
Oct
-10
No
v-10
Dec
-10
Jan-
11
Feb
-11
Mar
-11
Ap
r-11
May
-11
Jun
-11
Jul-
11
Au
g-11
Weekly Volume
TNTI_WAL
RTS_WAL
GRDN_WAL
EPES_WALCar25
Car3
Car12
Car20
$0
$20,000
$40,000
$60,000
$80,000
$100,000
$120,000
Absolute Weekly Market Position
TNTI_WAL
RTS_WAL
GRDN_WAL
EPES_WALCar25
Car3
Car12
Car20
$-
$500,000
$1,000,000
$1,500,000
$2,000,000
$2,500,000
$3,000,000
$3,500,000
$4,000,000
$4,500,000
$5,000,000
0
0.2
0.4
0.6
0.8
1
1.2
Sep
-10
Oct
-10
No
v-10
Dec
-10
Jan-
11
Feb
-11
Mar
-11
Ap
r-11
May
-11
Jun
-11
Jul-
11
Au
g-11
Cumulative Market Position
8
Overview of PepsiCo’s Transportation Procurement Model
9
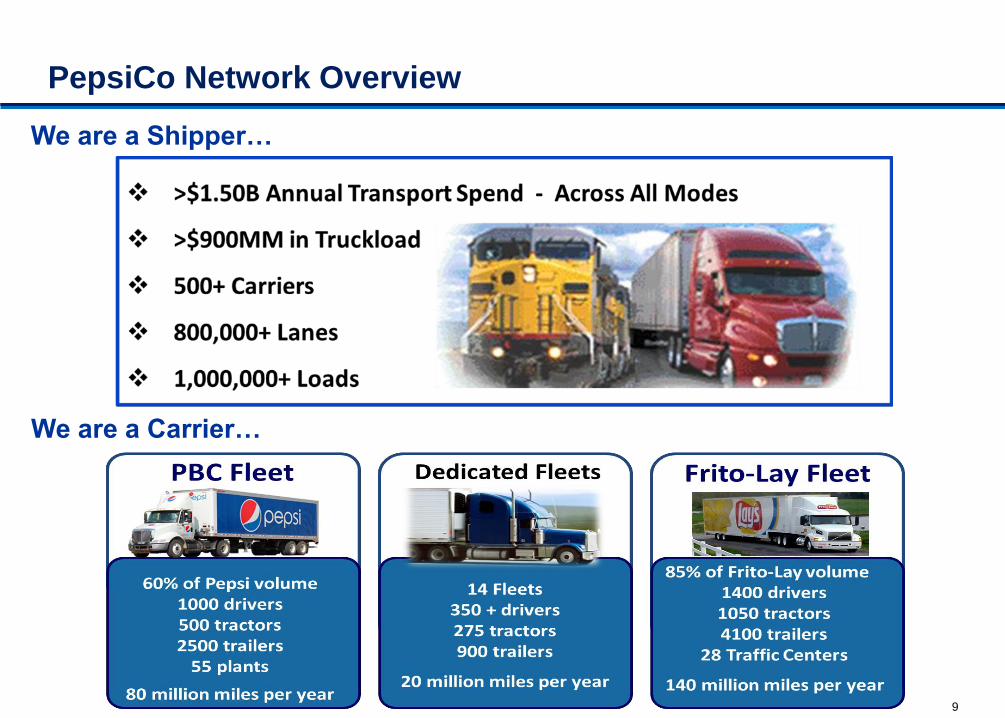
PepsiCo Network Overview
We are a Shipper…
We are a Carrier…
10
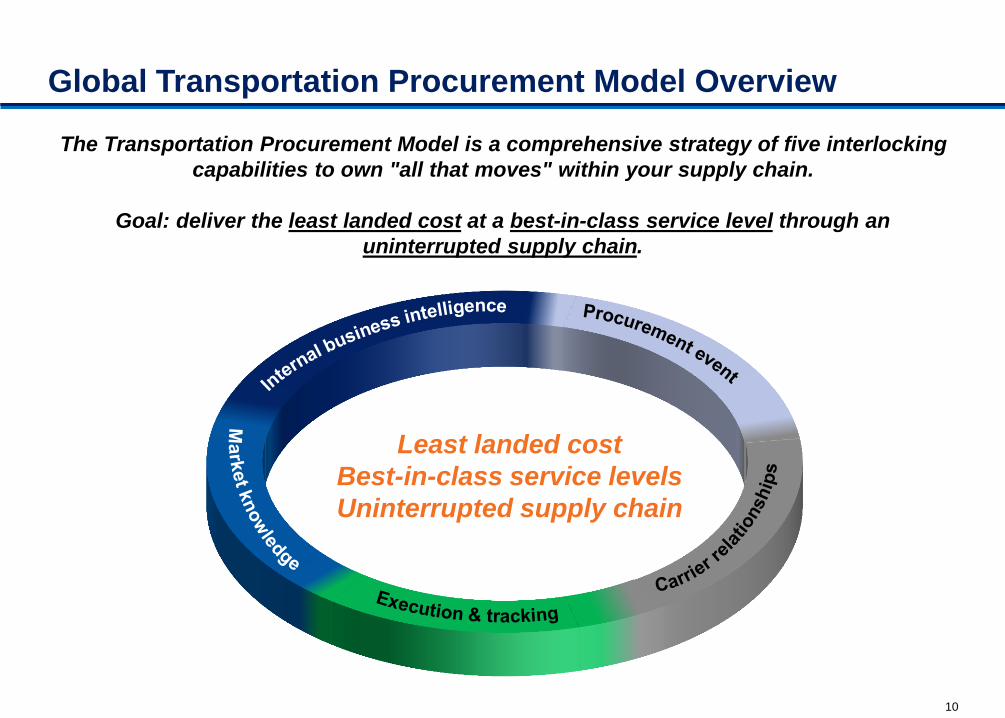
Global Transportation Procurement Model Overview
Least landed cost
Best-in-class service levels
Uninterrupted supply chain
The Transportation Procurement Model is a comprehensive strategy of five interlocking
capabilities to own "all that moves" within your supply chain.
Goal: deliver the least landed cost at a best-in-class service level through an
uninterrupted supply chain.
11
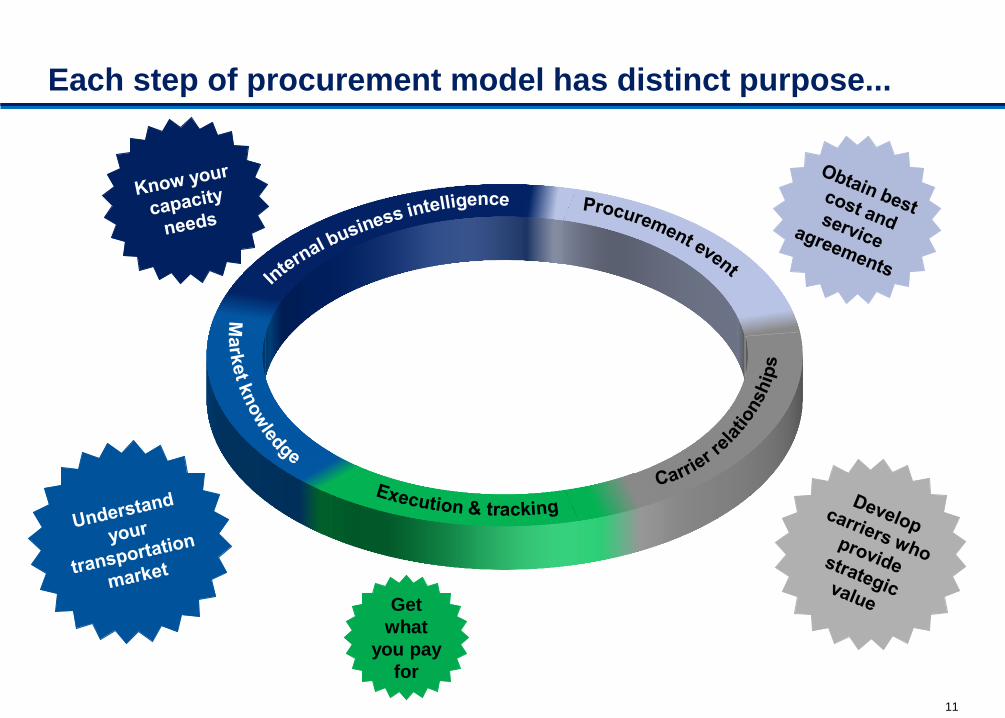
Each step of procurement model has distinct purpose...
Get
what
you pay
for
12
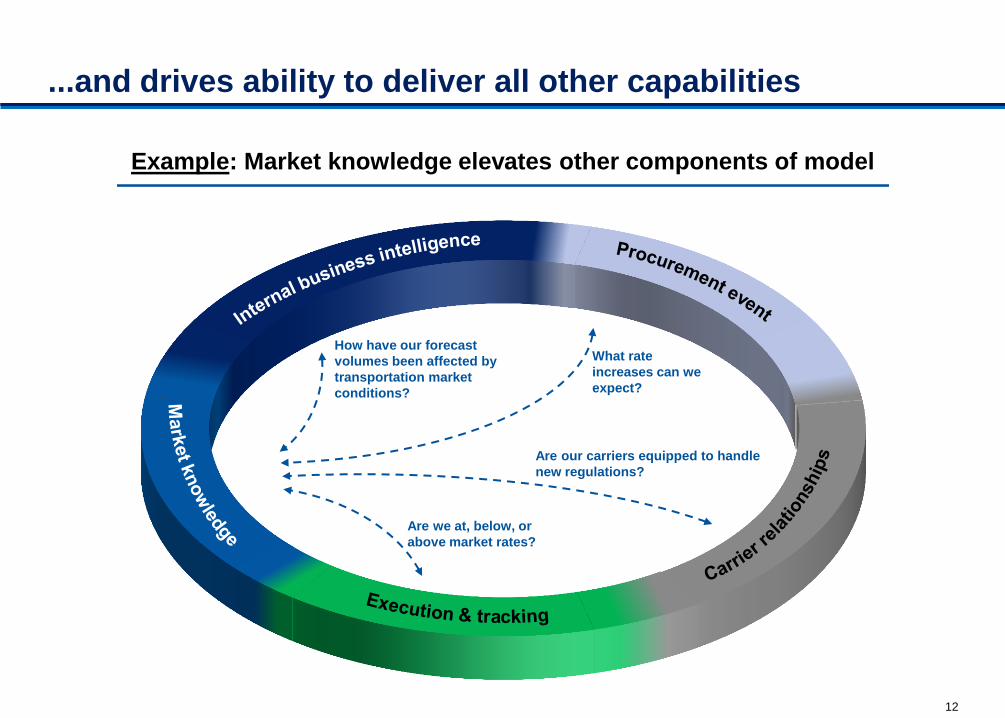
...and drives ability to deliver all other capabilities
How have our forecast
volumes been affected by
transportation market
conditions?
What rate
increases can we
expect?
Are our carriers equipped to handle
new regulations?
Are we at, below, or
above market rates?
Example: Market knowledge elevates other components of model
13
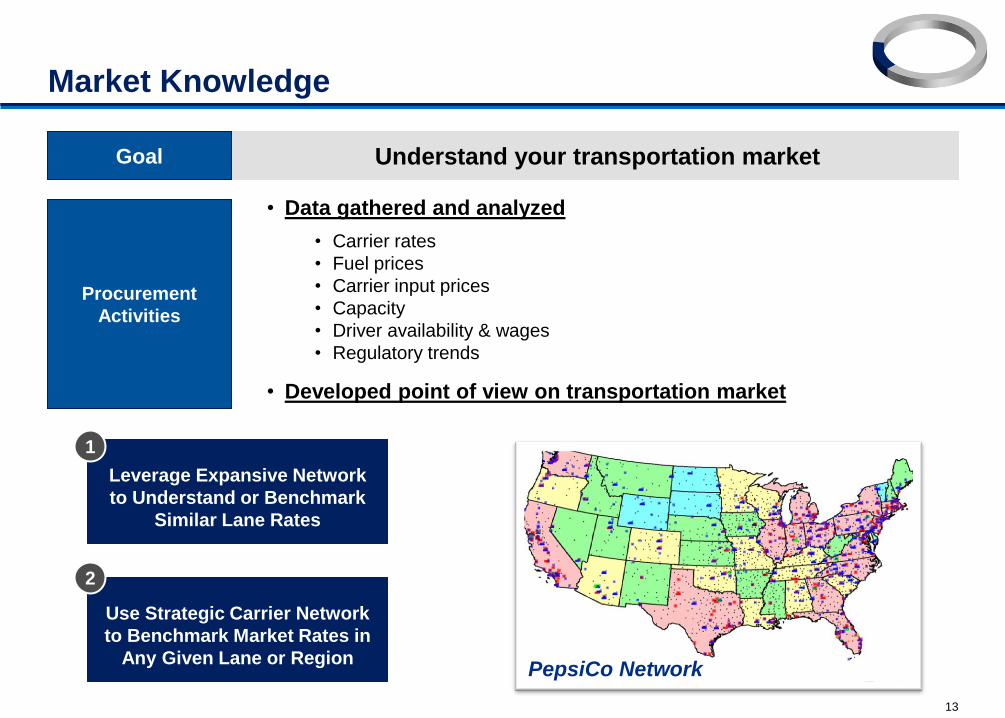
Market Knowledge
Understand your transportation market Goal
Procurement
Activities
• Data gathered and analyzed
• Carrier rates
• Fuel prices
• Carrier input prices
• Capacity
• Driver availability & wages
• Regulatory trends
• Developed point of view on transportation market
Leverage Expansive Network
to Understand or Benchmark
Similar Lane Rates
Use Strategic Carrier Network
to Benchmark Market Rates in
Any Given Lane or Region
1
2
PepsiCo Network
14
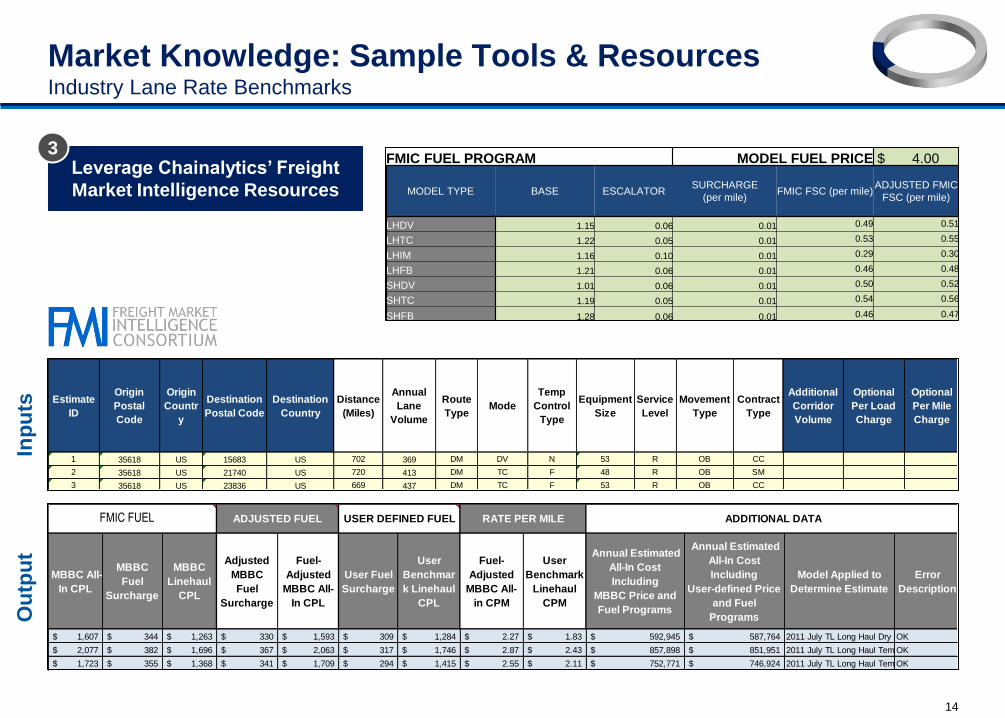
Market Knowledge: Sample Tools & Resources Industry Lane Rate Benchmarks
Leverage Chainalytics’ Freight
Market Intelligence Resources
3
FMIC BATCH UPLOAD TEMPLATE
FOR TRUCKLOAD SHIPPERS
FMIC FUEL PROGRAM MODEL FUEL PRICE $ 4.00
MODEL TYPE BASE ESCALATORSURCHARGE
(per mile)FMIC FSC (per mile)
ADJUSTED FMIC
FSC (per mile)
LHDV 1.15 0.06 0.01 0.49 0.51
LHTC 1.22 0.05 0.01 0.53 0.55
LHIM 1.16 0.10 0.01 0.29 0.30
LHFB 1.21 0.06 0.01 0.46 0.48
SHDV 1.01 0.06 0.01 0.50 0.52
SHTC 1.19 0.05 0.01 0.54 0.56
SHFB 1.28 0.06 0.01 0.46 0.47
USER DEFINED FUEL PROGRAM CURRENT FUEL PRICE $ 4.10
MODEL TYPE
DISTANCE or
PERCENTAGE
BASED?
BASE ESCALATOR SURCHARGE FSC RATE
LHDV 0.00
LHTC 0.00
LHIM 0.00
LHFB 0.00
SHDV 0.00
SHTC 0.00
SHFB 0.00
Estimate
ID
Origin
Postal
Code
Origin
Countr
y
Destination
Postal Code
Destination
Country
Distance
(Miles)
Annual
Lane
Volume
Route
TypeMode
Temp
Control
Type
Equipment
Size
Service
Level
Movement
Type
Contract
Type
Additional
Corridor
Volume
Optional
Per Load
Charge
Optional
Per Mile
Charge
1 35618 US 15683 US 702 369 DM DV N 53 R OB CC
2 35618 US 21740 US 720 413 DM TC F 48 R OB SM
3 35618 US 23836 US 669 437 DM TC F 53 R OB CC
4 35618 US 30439 US 400 508 DM DV N 53 R IB CC
5 35618 US 36750 US 152 348 DM DV N 53 X OB CC
6 35618 US 42101 US 195 352 MS DV N 53 R OB CC
7 35618 US 46320 US 547 504 DM DV N 53 R OB CC
Inp
uts
MBBC All-
In CPL
MBBC
Fuel
Surcharge
MBBC
Linehaul
CPL
Adjusted
MBBC
Fuel
Surcharge
Fuel-
Adjusted
MBBC All-
In CPL
User Fuel
Surcharge
User
Benchmar
k Linehaul
CPL
Fuel-
Adjusted
MBBC All-
in CPM
User
Benchmark
Linehaul
CPM
Annual Estimated
All-In Cost
Including
MBBC Price and
Fuel Programs
Annual Estimated
All-In Cost
Including
User-defined Price
and Fuel
Programs
Model Applied to
Determine Estimate
Error
Description
1,607$ 344$ 1,263$ 330$ 1,593$ 309$ 1,284$ 2.27$ 1.83$ 592,945$ 587,764$ 2011 July TL Long Haul Dry VanOK
2,077$ 382$ 1,696$ 367$ 2,063$ 317$ 1,746$ 2.87$ 2.43$ 857,898$ 851,951$ 2011 July TL Long Haul Temperature ControlledOK
1,723$ 355$ 1,368$ 341$ 1,709$ 294$ 1,415$ 2.55$ 2.11$ 752,771$ 746,924$ 2011 July TL Long Haul Temperature ControlledOK
890$ 196$ 694$ 188$ 882$ 176$ 706$ 2.21$ 1.77$ 452,230$ 448,166$ 2011 July TL Long Haul Dry VanOK
534$ 76$ 458$ 73$ 531$ -$ 531$ 3.49$ 3.49$ 185,819$ 184,761$ 2011 July TL Short Haul Dry VanOK
585$ 98$ 487$ 94$ 581$ -$ 581$ 2.98$ 2.98$ 205,763$ 204,390$ 2011 July TL Short Haul Dry VanOK
997$ 268$ 729$ 257$ 986$ 241$ 745$ 1.80$ 1.36$ 502,363$ 496,850$ 2011 July TL Long Haul Dry VanOK
MBBC FUEL ADJUSTED FUEL USER DEFINED FUEL RATE PER MILE ADDITIONAL DATAFMIC FUEL
Ou
tpu
t
15
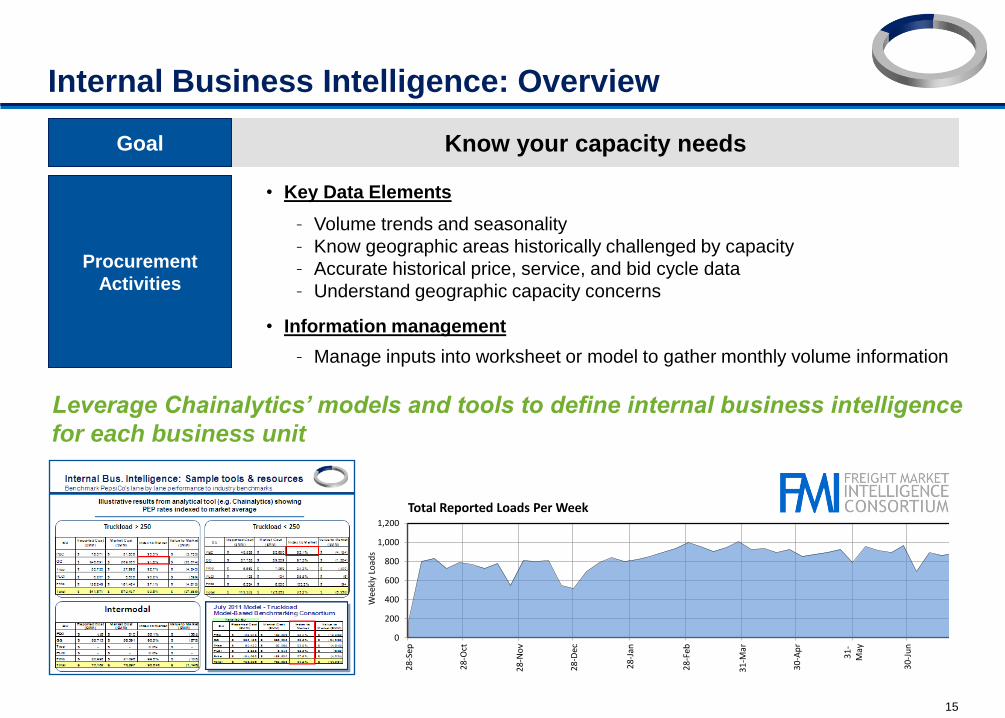
Internal Business Intelligence: Overview
Procurement
Activities
• Key Data Elements
– Volume trends and seasonality
– Know geographic areas historically challenged by capacity
– Accurate historical price, service, and bid cycle data
– Understand geographic capacity concerns
• Information management
– Manage inputs into worksheet or model to gather monthly volume information
Leverage Chainalytics’ models and tools to define internal business intelligence
for each business unit
Goal Know your capacity needs
0
200
400
600
800
1,000
1,200
28
-Sep
28
-Oct
28
-No
v
28
-Dec
28
-Jan
28
-Feb
31
-Mar
30
-Ap
r
31
-M
ay
30
-Ju
n
31
-Ju
l
31
-Au
g
Wee
kly
Load
s
Total Reported Loads Per Week
0
200
400
600
800
1,000
1,200
28
-Sep
28
-Oct
28
-No
v
28
-Dec
28
-Jan
28
-Feb
31
-Mar
30
-Ap
r
31
-M
ay
30
-Ju
n
31
-Ju
l
31
-Au
g
Wee
kly
Load
s
Total Reported Loads Per Week
16
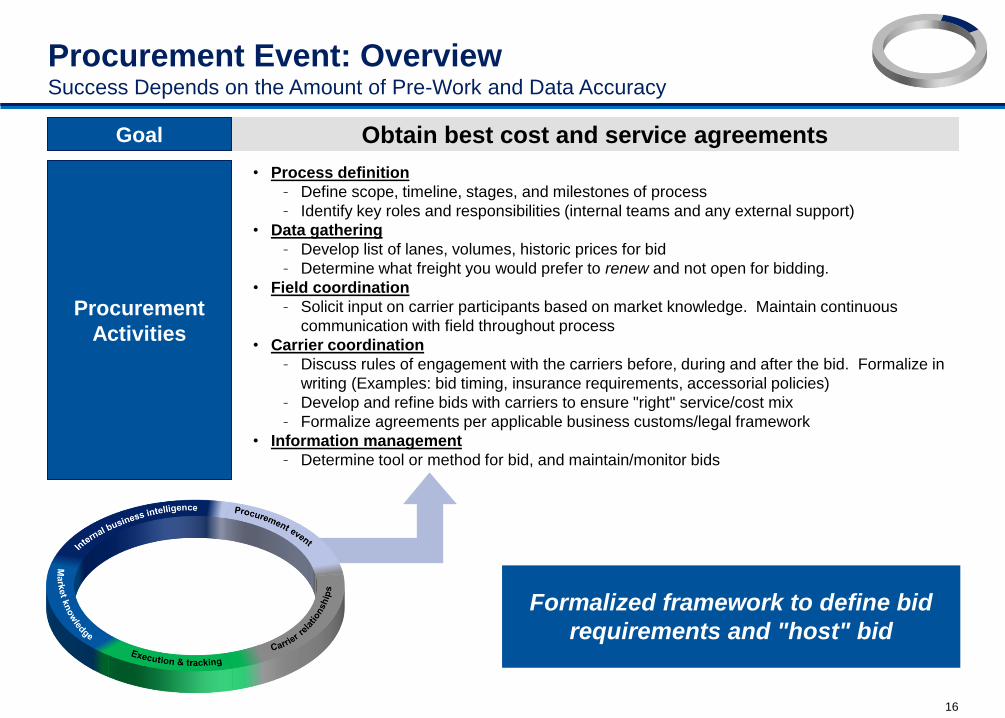
Obtain best cost and service agreements
Procurement Event: Overview Success Depends on the Amount of Pre-Work and Data Accuracy
Procurement
Activities
• Process definition
– Define scope, timeline, stages, and milestones of process
– Identify key roles and responsibilities (internal teams and any external support)
• Data gathering
– Develop list of lanes, volumes, historic prices for bid
– Determine what freight you would prefer to renew and not open for bidding.
• Field coordination
– Solicit input on carrier participants based on market knowledge. Maintain continuous
communication with field throughout process
• Carrier coordination
– Discuss rules of engagement with the carriers before, during and after the bid. Formalize in
writing (Examples: bid timing, insurance requirements, accessorial policies)
– Develop and refine bids with carriers to ensure "right" service/cost mix
– Formalize agreements per applicable business customs/legal framework
• Information management
– Determine tool or method for bid, and maintain/monitor bids
Goal
Formalized framework to define bid
requirements and "host" bid
17
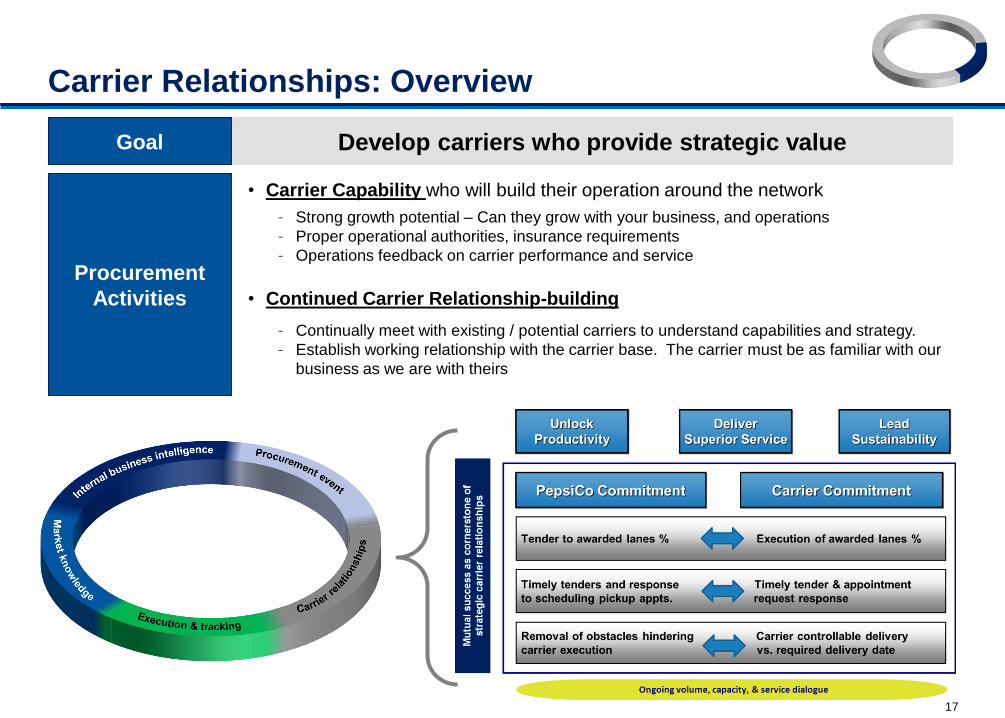
Carrier Relationships: Overview
Develop carriers who provide strategic value
Procurement
Activities
• Carrier Capability who will build their operation around the network
– Strong growth potential – Can they grow with your business, and operations
– Proper operational authorities, insurance requirements
– Operations feedback on carrier performance and service
• Continued Carrier Relationship-building
– Continually meet with existing / potential carriers to understand capabilities and strategy.
– Establish working relationship with the carrier base. The carrier must be as familiar with our
business as we are with theirs
Goal
18
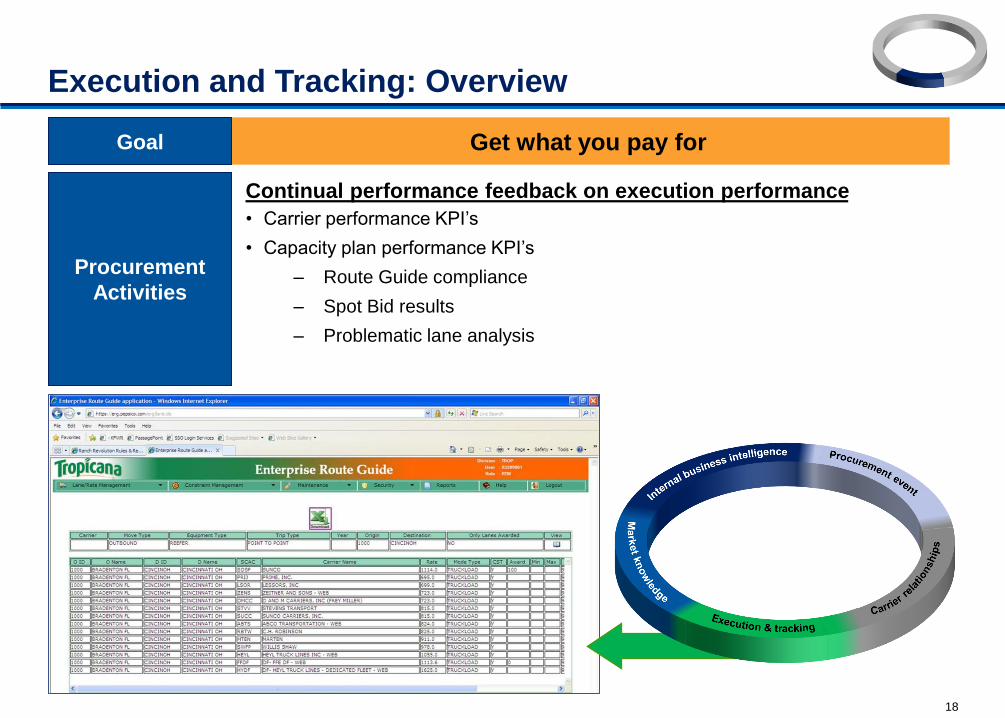
Execution and Tracking: Overview
Get what you pay for Goal
Procurement
Activities
Continual performance feedback on execution performance
• Carrier performance KPI’s
• Capacity plan performance KPI’s
– Route Guide compliance
– Spot Bid results
– Problematic lane analysis

19
Discussion
20
Discussion
Rob Hair Sr. Director, Global Transportation
Processes & Systems
Rodney Noble Sr. Director, Carrier Operations &
Procurement
Gary Girotti Vice President, Transportation
Practice CHAINalytics
Fabrizio Brasca Vice President, Global Logistics
Michael Levans Group Editorial Director, Supply
Chain Group
Moderator