Embed Size (px)
Citation preview

FINAL REPORT
TA-7987 (REG)
Core Environment Program and Biodiversity Conservation Corridors Initiative in the
Greater Mekong Subregion, Phase 2 – Green Freight Project Implementation – Lao and
Viet Nam
Report realized on behalf of ADB
Jürg M. Grütter, 01/09/2016

FINAL REPORT GREEN FREIGHT PROGRAM GRUTTER CONSULTING
2
MODULES
The reports within the ADB Green Freight Project are divided into four modules being Green Freight
Technologies (GFTs), Eco Drive, Logistics Measures and Monitoring of implemented options. Within
each module reports include an upfront technology assessment, a report on the pilot phase as well as
a report on the full implementation level. The FINAL REPORT corresponds to the Impact Monitoring
report D2.
MODULE A
GREEN FREIGHT TECHNOLOGIES
Report 1: Potential of GFTs
Report 2: Pilot Implementation
GFTs
Report 3: Financing
Mechanism GFTs
Report 4: Full Implementation
GFTs
MODULE B
ECO DRIVE
Report 1: Potential of Eco
Drive
Report 2: Pilot Implementation
Eco Drive
Report 3: Curriculum Eco
Drive
Report 4: Full Implementation
Eco Drive
MODULE C
LOGISTICS MEASURES
Report 1: Potential of
Logistics Measures
Report 2: Pilot Implementation
Logistics Measures
MODULE D
IMPACT MONITORING
Report 1: Monitoring Scheme GF Measures
Report 2: Impact
Monitoring Report / FINAL
REPORT

FINAL REPORT GREEN FREIGHT PROGRAM GRUTTER CONSULTING
3
Abbreviations
AC Air Conditioning ADB Asian Development Bank ASIF Avoid, Shift, Improve, Fuels BAU Business as Usual BC Black Carbon CAI Clean Air Asia CAPEX Capital Expenditures CCAC Climate and Clean Air Coalition CDM Clean Development Mechanism COR Coefficient of Resistance CSS cascade Sierra Solutions CTF Climate Technology Fund DPF Diesel Particle Filtre EF Emission Factor EPA Environmental Protection Agency ESCO Energy Service Company IRR Financial Internal Rate of Return GCF Green Climate Fund GDP Gross Domestic Product GEF Global Environment Facility GF Green Freight GFA Green Freight Asia GFP Green Freight Project GFT Green Freight Technology GHG Greenhouse Gas GMS Greater Mekong Subregion GPO Group Purchasing Organization GPS Global Positioning System GVW Gross Vehicle Weight HDV Heavy Duty Vehicle HP Horse Power IEA International Energy Agency INDC Intended Nationally Determined Contribution IPCC Intergovernmental Panel on Climate Change LIFFA Laos International Freight Forwarder Association LRR Low Rolling Resistance MOT Ministry of Transport NAMA Nationally Appropriate Mitigation Action NCV Net Calorific Value OPEX Operating Expenditures PM Particle Matter QA Quality Assurance RRC Rolling resistance Coefficient SFC Specific Fuel Consumption SME Small and Medium Sized Enterprise TKM ton-kilometre TTW Tank-to-Wheel UNEP United Nations Environment Program UNFCCC United Nations Framework Convention on Climate Change

FINAL REPORT GREEN FREIGHT PROGRAM GRUTTER CONSULTING
4
VCS Verified Carbon Standard WACC Weighted Average Capital Cost WBCSD World Business Council on Sustainable Development WRI World Resources Institute WTW Well-to-Wheel

FINAL REPORT GREEN FREIGHT PROGRAM GRUTTER CONSULTING
5
Contents
Summary ................................................................................................................................................. 7
1. Introduction ......................................................................................................................................... 9
2. Program Brief .................................................................................................................................... 10
2.1. Background ................................................................................................................................. 10
2.2. Objectives ................................................................................................................................... 10
2.3. Tasks ........................................................................................................................................... 10
2.4. Timeline ...................................................................................................................................... 11
2.5. Organization ............................................................................................................................... 12
3. Green Freight Instruments ................................................................................................................ 13
3.1. Introduction ................................................................................................................................ 13
3.2. Green Freight Technologies ....................................................................................................... 13
3.2.1. Introduction ......................................................................................................................... 13
3.2.2. Aerodynamics ...................................................................................................................... 14
3.2.3. Tires ..................................................................................................................................... 15
3.2.4. Other Technologies ............................................................................................................. 17
3.2.5. Previous Experience with GFTs in Viet Nam and Lao PDR .................................................. 17
3.2.6. GFTs Implemented .............................................................................................................. 18
3.3. Eco Drive ..................................................................................................................................... 19
3.3.1. Concept of Eco Drive ........................................................................................................... 19
3.3.2. Previous Experience with Eco Drive in Viet Nam and Lao PDR ........................................... 20
3.3.3. Eco Drive Curriculum ........................................................................................................... 20
3.3.4. Activities and Trainings Realized ......................................................................................... 21
3.4. Logistics Improvements .............................................................................................................. 22
3.4.1. Overview of International Experiences with Logistics Measures ........................................ 22
3.4.2. Logistics in Viet Nam and Lao PDR ...................................................................................... 23
3.4.3. Green Freight Label ............................................................................................................. 27
3.5. Summary Implementations ........................................................................................................ 28
4. Monitoring Approach ........................................................................................................................ 29
5. Implementation Results .................................................................................................................... 31

FINAL REPORT GREEN FREIGHT PROGRAM GRUTTER CONSULTING
6
6. GHG and Economic Impact ................................................................................................................ 33
6.1. GHG Impact ................................................................................................................................ 33
6.2. Financial Impact and GHG Abatement Costs ............................................................................. 34
6.2.1. Introduction ......................................................................................................................... 34
6.2.2. Cost Structure Viet Nam ...................................................................................................... 34
6.2.3. Cost Structure Lao PDR ........................................................................................................ 35
6.2.4. Financial Impact of GF Measures ........................................................................................ 37
6.2.5. CO2 Marginal Abatement Costs ........................................................................................... 38
6.3. Financial Structuring Possibilities ............................................................................................... 39
6.3.1. ESCO .................................................................................................................................... 39
6.3.2. Group Purchasing ................................................................................................................ 39
6.3.3. International Experience with Financing GFTs .................................................................... 40
6.3.4. Climate Finance ................................................................................................................... 42
7. Steps Forward .................................................................................................................................... 44
7.1. Potential Viet Nam ..................................................................................................................... 44
7.2. Potential Lao PDR ....................................................................................................................... 45
7.3. Potential Measures and Approaches ......................................................................................... 47
8. Implementation Experience .............................................................................................................. 49
References ............................................................................................................................................. 53

FINAL REPORT GREEN FREIGHT PROGRAM GRUTTER CONSULTING
7
Summary
1. The Green Freight Program was implemented by ADB in Viet Nam, Lao PDR and Thailand from
01/2015 to 08/2016. Implementation in Viet Nam and Lao PDR to which this report relates was realized
by Grütter Consulting.
2. The overall objective of the program is to foster low carbon sustainable freight transport.
3. GF instruments implemented are Green Freight Technologies, Eco Drive and Logistics solutions.
Table 1: Summary of GF Implementation Actions
Activity Viet Nam Lao PDR
Aerodynamic equipment 11 trucks 11 trucks
Efficient Tires 15 trucks 12 trucks and 3 buses
Fuel Audit Tool 20 companies 20 companies
Eco Drive training instructors 15 instructors 15 instructors
Eco Drive training drivers 100 drivers 100 drivers
Workshops 2 workshops with 90 participants 2 workshops with 72 participants
Brochures 3 brochures 3 brochures
Reports 12 technical reports
4. Implementation results:
Efficient tires reduce fuel consumption by 4-6%;
Aerodynamic devices reduce fuel consumption by 2-3%;
1 bar higher tire inflation reduces fuel consumption by 2%;
Eco Drive reduces fuel consumption by 3-6% (lower impact over time);
Combined measures reduce fuel consumption and GHG emissions by 10-13% representing per
truck per annum 7-9 tCO2 for Lao PDR and 11-15 tCO2 for Viet Nam.
5. The economics are:
Efficient tires require an incremental investment of 900 USD per truck with a payback time of
12-13 months;
Aerodynamic devices require an investment of 900-1,000 USD per truck with a payback time
of 2-3 years;
Eco Drive requires an investment of around 150 USD and has a payback time of 3-6 months;
Combined the measures require an additional investment of 2,000 USD, with a payback time
of 1 year and a FIRR of >90%.
Measures are profitable but encounter barriers like lack of reliability and visibility of savings, additional
investment, and drivers being paid a fixed amount for fuel and therefore lack of interest of the truck
owner to invest in energy saving devices.
6. The proposed steps forward are:
Include Eco Drive in the compulsory curricula for driver training.
Establish national regulations concerning Coefficient of Resistance of tires, such as e.g. in the
EU.

FINAL REPORT GREEN FREIGHT PROGRAM GRUTTER CONSULTING
8
For other GFTs such as aerodynamic devices, low-carbon trucks and fuels as well as other
measures implement a GF climate finance fund coupled with technical assistance and
dissemination of best practices.
Other measures which could be explored include the usage of larger trucks, improving traffic
fluidity and the establishment of fuel consumption standards for new trucks.
7. Main project implementation experiences include:
Local driving circumstances are very important and experiences from other countries are only
partially valid.
Low technology availability can result in significant additional GFT costs.
The majority model used for “fuel management” by trucking companies in both countries is to
pay drivers a fixed allowance for fuel based on the trip realized. Therefore, companies are not
very interested in fuel saving technologies.
The program has produced impact data of value also for other GF interventions.
The monitoring approach based on comparison before-after has proven to be the most reliable
approach.

FINAL REPORT GREEN FREIGHT PROGRAM GRUTTER CONSULTING
9
1. Introduction The Green Freight Program is implemented by ADB in Viet Nam, Lao PDR and Thailand with start
January 2015 and termination August 2016. The project management and implementation in Viet Nam
and Lao PDR was realized by Grütter Consulting. The following report therefore only relates to the
activities and results of Viet Nam and Lao PDR.
The objective of the Green Freight (GF) component of the ADB project is to reduce Greenhouse Gas
(GHG) freight emissions. Therefore, the impact monitoring of measures follows this objective and
provides information on GHG reduction of measures implemented. The project focus is on measures
to reduce truck emissions i.e. with the framework of ASIF (Avoid, Shift, Improve and Fuels) the focus is
on “Improve”.
Figure 1: Options to Reduce GHG Emissions in Freight
Source: Grütter Consulting
The structure of this report includes the following parts:
Chapter 2: Program objectives, activities, institutions involved and outputs
Chapter 3: Green Freight Instruments;
Chapter 4: Monitoring approach;
Chapter 5: Implementation results;
Chapter 6: Environmental, financial and economic impact;
Chapter 7: Steps forward;
Chapter 8: Implementation experience.

FINAL REPORT GREEN FREIGHT PROGRAM GRUTTER CONSULTING
10
2. Program Brief
2.1. Background
The Green Freight Program (GFP) is part of Core Environment Program and Biodiversity Conservation
Corridors Initiative administered by ADB and overseen by the environment ministries of the six
countries which form the Working Group on Environment. The program aims to achieve an
environmentally friendly and climate resilient Greater Mekong Subregion (GMS). Economic corridors
are being developed across the GMS to improve transport connectivity, facilitate trade and economic
development and boost regional cooperation. With initial road transport corridors almost complete,
there is an increasing realization that the competitiveness of these corridors needs to be improved by
increasing resource use efficiency and by reducing their impact on ecosystems and the environment.
Increased traffic and development along these corridors is likely to result in increased greenhouse gas
emissions and environmental changes. These need to be carefully managed to ensure environmental
sustainability.
Fuel costs are one of the main factors defining high logistics costs in Viet Nam, Lao PDR and Thailand.
The regional Green Freight Initiative consists of three national pilot projects in Lao PDR, Thailand and
Viet Nam testing green freight / low carbon interventions for freight operators as a way of reducing
fuel consumption and fuel costs.
The activities in Thailand are implemented by the Federation of Thai Industries whilst Grütter
Consulting has been entrusted by ADB for the project implementation in Viet Nam and Lao PDR.
2.2. Objectives
The overall objective of the program is to reduce the carbon footprint of freight transport across the
GMS Economic Corridors. Low carbon sustainable freight transport shall be fostered in Lao PDR and
Viet Nam.
The objective of the assignment or the GFP is to test a decentralized model to deploy green freight
interventions among SMEs engaged in road freight in Lao PDR and Viet Nam. Based on results of pilot
interventions recommendations are provided how these could be scaled up.
Beyond the objective or target of the project itself this assignment shall also result in some common
goods which allow green freight projects also in other countries and regions to prosper.
2.3. Tasks
The following table contrasts planned and realized outputs of the program.

FINAL REPORT GREEN FREIGHT PROGRAM GRUTTER CONSULTING
11
Table 2: Planned and Realized Outputs of GFP
Component Planned Output1 Realized Output
1. Green Freight Technologies (GFT)
1.1. Report on GFTs with country list of potential GFTs
Report A1: Potential of GFTs
1.2. Guidelines for monitoring GFT impact Report D1: Monitoring Scheme GF Measures
1.3. Report on GFTs incl. results of 3 pilot GFTs
Report A2: Pilot Implementation GFTs
1.4. Report on Financing plan for GFTs Report A3: Financing Mechanism GFTs
1.5. Workshop report on green financing Workshop report on GFTs and Finance
1.6. Technical material on GFTs produced Brochure GFTs
1.7. Fuel conservation plan in 10 companies and GFTs implemented in 20 companies
Fuel conservation plan in 20 companies per country; GFTs implemented in 26 trucks/companies per country
1.8. Report on impact of GFTs Report A4: Full Implementation GFTs
2. Driver Training Eco Drive
2.1. Report on Eco Drive experience Report B1: Potential of Eco Drive
2.2. Guidelines for monitoring Eco Drive impact
Report D1: Monitoring Scheme GF Measures
2.3. Pilot test Eco Drive in 3 companies Report B2: Pilot Implementation Eco Drive
2.4. Draft standard driver training program with training material for drivers and for trainers
Report B3: Curriculum Eco Drive
2.5. Report on Driver Training seminars: Train 100 drivers and 10 trainers
Report B4: Full Implementation Eco Drive 15 instructors trained per country 100 drivers trained per country
2.6. Report on potential integration of Eco Drive in national driving and licensing regulations
2.7. Guidelines for QA Eco Drive program
2.8. Report on impact of Eco Drive and dissemination strategy
3. Logistics management incl. reduction of empty backhaul
3.1. Report on empty backhaul incl. identification of potential solutions
Report C1: Potential of Logistics Measures
3.2. Guidelines for monitoring the impact of logistics management solutions
Report D1: Monitoring Scheme GF Measures
3.3. Report on solutions to reduce empty backhaul incl. pilot test in 3 company’s logistics solutions Report C2: Pilot Implementation
Logistics Measures 3.4. Report on impact of logistics management solutions and dissemination strategy
2.4. Timeline
All activities should have been realized by July 2016. Implementations had been finished by 30.6.2016,
however final reports were only produced until end of August 2016 due to awaiting monitoring results
of technology implementations. Technology implementations had been behind schedule, especially in
Lao PDR due to late disbursement of funds by ADB2.
1 Based on Inception Report Table 1 2 Funding request was realized 12/2015 and funds where received by the consultant as of 05/2016

2.5. Organization
Figure 2: Institutional Set-Up

3. Green Freight Instruments
3.1. Introduction
The project focuses on road based freight transport. GHG reductions with mode shift, economic and
fiscal instruments or industrial policies to change production and transport structures are therefore
not part of this report. The focus is also on long-haul road transport which has some distinct features
from short-haul transport e.g. technologies which can be used or logistics solutions.
Green Freight (GF) instruments included in this report and applied by the project are Green Freight
Technologies (GFTs), Eco Drive and Logistics solutions.
3.2. Green Freight Technologies
3.2.1. Introduction
Around 60% of the power produced by a truck is lost within the engine. The remaining 40% is used to
move the vehicle down the road and to power auxiliary equipment like air-conditioning (AC). The figure
below gives an indication of what this energy is used for based on a long-haul combination truck
travelling on a flat road under highway conditions with an average speed of more than 80km/h.
Figure 3: Components of Energy Use in Long-Haul Trucks under Highway Conditions
Source: Grütter based on US DOE, 2006
The figure gives an indication of main energy loss areas which can be tackled with retrofit devices
being:
Aerodynamics;
Rolling resistance i.e. tires/wheels;
Auxiliary loads;
Engine losses.
Engine + Drivetrain Losses
60%
Rolling Resistance
15%
Aerodynamic Losses 20%
Auxiliary Loads 5%

FINAL REPORT GREEN FREIGHT PROGRAM GRUTTER CONSULTING
14
Engine losses are basically tackled with engine design and therefore with new trucks and not with
retrofit technologies.
3.2.2. Aerodynamics
Aerodynamic drag or wind resistance is a retarding force on a vehicle. Basically the power or amount
of energy required to overcome the aerodynamic drag is affected by the effective frontal surface of
the vehicle, the shape of the vehicle and the vehicle traveling speed. The power required to overcome
aerodynamic drag increases as a function of the cube of vehicle speed thus making speed a critical
parameter for determination of potential improvements due to reduction of aerodynamic drag. Main
retrofit technologies available to reduce aerodynamic drag available for trucks and trailers are shown
in the following figure.
Figure 4: Aerodynamic Technologies
Source: Department for Transport UK, Freight Best Practice Case Study, 2010
① Cab roof fairings or deflectors: These components change the shape of the cab roof and direct the
air flow smoothly over the top of the truck cab;
② Air dam: This is a downward extension of the trucks front bumper;
③ Cab extension: Side fairings and side extenders modify the shape of the side of the cabs;
④⑤ Trailer side skirts including rear quarter panel;
⑥ Roof tapering; this can include trailer boat tails;
⑦ Front fairings and nose cones for trailers;
The following figure shows the relation between the importance of aerodynamics relative to the trip
profile and average speed clearly. The aerodynamic losses are basically important with flat roads and
at speeds of 70 km/h and higher. With hilly roads at low speeds on the other hand aerodynamics

FINAL REPORT GREEN FREIGHT PROGRAM GRUTTER CONSULTING
15
becomes irrelevant. At intermediate speeds of around 55 km/h the energy used for aerodynamic
resistance is only around 10%.
Figure 5: Energy Usage of 40t Truck for Different Road and Speed Configurations (% of Fuel Usage)
Source: W. Appel, Nutzfahrzeugtechnik, 2013, Figure 2.2; see also comparable relations between speed and aerodynamic losses in National Research Council Canada, Technical Report Review of Aerodynamic Drag Reduction Devices for Heavy Trucks and Buses, 2012, Table 2
Following general conclusions concerning the potential application of aerodynamic devices are
therefore drawn:
Aerodynamic devices are useful for trucks operating under medium to high speed conditions
with a minimum average speed of 55 km/h. Basic truck improvements including cab deflector
and cab extensions are feasible at this speed.
For trucks operating at a higher speed (average speed of 80 km/h and higher) a more
integrated aerodynamic package can be made with truck and trailer improvements including
side skirts, and trailer front fairings.
3.2.3. Tires
The rolling resistance is directly correlated with the Coefficient of Resistance (COR) of the tire and the
vehicle mass. The rolling resistance related fuel efficiency per km is widely speed-independent. Tires
for drive axles in general have a higher COR than steer and trailer tires due to higher grip requirements
leading to a certain trade-off with reducing resistance.
Following main technologies exist to reduce rolling resistance:
Low rolling resistance tires;
Wide based tires;
Optimum tire pressure.
0%
10%
20%
30%
40%
50%
60%
70%
80%
90%
100%
flat highway, speed70 km/h
inter-urban road,speed 55km/h
hilly road
acceleration and gradientresistance
rolling resistance
air resistance

FINAL REPORT GREEN FREIGHT PROGRAM GRUTTER CONSULTING
16
Low rolling resistance (LRR) tires use different tire blends (e.g. adding silica to rubber materials) and
modify the tire body. They have a COR or Rolling Resistance Coefficient (RRC) which is around 10%
lower than a conventional tire. LRR tires are installed basically on the non-steering wheels of the
tractor and trailer. Within the EU regulations exist which specify minimum requirements for COR. The
current requirements are a maximum of 8.0 kg/t for tires sold after 1.11.2016 and maximum 6.5 kg/t
for new type approvals of tires (for tires sold this value will be enforced from 1.11.2020 onwards). The
EU also introduced a standardised tire label including energy efficiency based on the COR, wet grip and
noise, effective as from the year 2012.
Single wide-based tires can be used on non-steering truck and trailer axles, albeit being more common
on trailer axles. Wide-based tires have less sidewalls whose deformation is a large contributor to rolling
resistance. Single wide based tires not only have less rolling resistance but also weight around 80 kg
less per axle than dual tires i.e. this can result in a weight reduction of around ¼ t for a truck. A problem
is that trucks cannot continue to drive if a wide-based tire blows out whilst they can continue driving
a short distance with a dual tire. Also replacement of single wide-based tires during trips might cause
2 types of difficulties:
The heavy weight and the size of wide-sized tires requires 2 persons for tire changing. Trucks
driven by single persons could have difficulties in this context.
Repair shops, especially in Developing Countries, will lack wide tires in their offer and might
not even have the equipment to repair such. Thus as minimum 2 spare wide tires need to be
taken along.
Additionally, single wide-based tires require an investment in new wheels and vehicle adaptation.
Tire pressure influences fuel usage. Every 10 psi of under-inflation represents approximately 1%
penalty in fuel economy with the largest difference on trailer axles (see figure below)3.
Figure 6: Truck Tire Inflation versus Fuel Efficiency
Source: Cummins MPG Guide based on Goodyear
3 Cummins MPG Guide

FINAL REPORT GREEN FREIGHT PROGRAM GRUTTER CONSULTING
17
3.2.4. Other Technologies
Idling reduction technologies are an important aspect especially in long-haul sleeper trucks with
cabins equipped with multiple equipment as used e.g. in North America. Idling occurs when delivering
goods but to a large extent is related to equipment used in cabs including heating, AC and electricity
for a variety of applications such as TV, microwave, laptop etc. Options to reduce fuel usage include
advanced truck stop electrification, auxiliary power units and automatic shut-down/start up systems.
Long-haul trucks without sophisticated sleeper cabs including heating/AC and multiple electric devices
will only profit marginally from anti-idling devices.
Synthetic base lubricants exhibit less thickening at low temperatures. Thickening oil increases fuel
consumption. This makes synthetic oils more fuel efficient at lower ambient temperatures. The fuel
efficiency gain is thereby in the order of 1% but less in long-haul operations which operate at constant
high temperatures.
Predictive cruise control, on-board telematics and the usage of GPS can help to identify the shortest
and most convenient routes thus reducing distance and avoiding congestion. Predictive cruise control
also identifies upcoming gradients and informs the driver of optimum gear change and acceleration /
braking. On-board telematics support drivers and enhance driver-follow-up.
3.2.5. Previous Experience with GFTs in Viet Nam and Lao PDR
Viet Nam
Lane separated highways are not common in Viet Nam resulting in multiple intersections and
constantly changing speeds. However various highways are currently under construction, e.g. Hanoi to
Haiphong. Maximum permitted speed for trucks is currently 60 km/h and driving conditions do not
allow for significantly higher speeds. The low driving speeds result in limited effects of aerodynamic
devices. A random visual counting survey conducted on the route Hanoi-Haiphong revealed that
around 70% of all large trucks already had basic truck aerodynamic equipment installed (cab roof
fairing plus cab extension). In medium sized trucks (3-4 axles with a GVW of 24-32 t) however only
around 30% had such equipment installed. The widespread usage of aerodynamic truck devices is due
to acquiring basically used US trucks and new Chinese trucks, both of which have such equipment
already installed. Aerodynamic equipment on trailers including nose cones and side skirts are non-
existent. Aerodynamic equipment can be bought in the Vietnamese market based on domestic
production or importing original equipment from China or Thailand.
Low rolling resistance tires only have a marginal market share in Viet Nam and are only sold by very
few tire dealers. The main market for LRR tires has been for long-distance buses whilst in trucks they
are only used in singular cases and on some axles (truck but not trailer wheels). Wide-based tires are
currently not allowed in Viet Nam. Automatic tire inflation systems or tire pressure indication systems
are not used in Viet Nam and also no such equipment is currently available in the Vietnamese market.
Long-haul trucks are not equipped with many electronic devices like US trucks making idling reduction
technologies of little sense.

FINAL REPORT GREEN FREIGHT PROGRAM GRUTTER CONSULTING
18
Lao PDR
In Lao PDR road conditions on main arteries are in general paved roads which are however suffering
severe deterioration. Curvy roads in mountainous conditions are common. The maximum allowed
speed limit for trucks and buses is 90 km/h. Drive speeds however tend to be lower due to road
conditions. Most long haul trucks are equipped with basic aerodynamic equipment (cab deflector).
Trailer aerodynamic equipment is not observed. 2nd hand aerodynamic equipment can be bought in
the country adapted to the individual truck.
Concerning tires the situation in Lao PDR is comparable to Viet Nam: usage of tube tires is common;
different tire brands, tire wear and patterns on the same truck; non-usage of low-rolling resistance
tires and non-usage of wide-tires which would also require a permit as they are currently not allowed.
The mining company Phu Bia (PanAust company) has made trial runs with wide-based tires of Michelin.
However, the company has rejected using such tires in the future due basically to the issue that with
a blow-up the truck must be stopped and cannot continue to drive.
3.2.6. GFTs Implemented
GFTs implemented and tested in both countries within the GFP are:
Cab roof deflector as aerodynamic device;
LRR on all wheels:
Manual tire-inflation.
10-15 trucks were equipped in each country with aerodynamic devices and another 10-15 trucks with
full sets of LRRs.
Photo 1: Aerodynamic Devices Installed
Due to low average driving speeds in both countries more advanced aerodynamic equipment does not
make sense. The table below shows that the average driving speed for both countries was in the range
of 40km/h for long-haul trucks i.e. the impact of aerodynamic devices is limited.

FINAL REPORT GREEN FREIGHT PROGRAM GRUTTER CONSULTING
19
Table 3: Average Circulating Speed Long-Haul Trucks, 2016
Viet Nam Lao PDR
Average speed in km/h 37 40
Lower and upper 95% confidence interval 36 / 38 36 / 44
Source: Measurement based on GPS with over 2,000 data points over a period of 6 months, multiple routes and trucks; Grütter Consulting
LRRs used were Michelin and Bridgestone US-SmartWay certified LRRs. For tire inflation manual
procedures were used inflating tires 1bar higher than usual. Automatic tire inflation equipment is
costly and not available in both countries. Idling devices as well as other GFTs were not used due to
limited applicability and potential in Viet Nam and Laos.
Photo 2: LRR Tires Installed
3.3. Eco Drive
3.3.1. Concept of Eco Drive
Eco Drive refers to a smarter and more fuel-efficient driving style adopting driving techniques that get
the most out of modern vehicles and engines. Eco Drive tactics include accelerating slowly, cruising at
more moderate speeds, avoiding sudden braking, idling less, as well as selecting routes that allow more
of this sort of driving. Eco Drive is not only an easy and cost-efficient way to reduce fuel consumption
but is also an attitude and respect for society as a whole. Eco Drive has been promoted since various
decades in many countries worldwide with the goal of reducing fuel consumption with a safe driving
style. Eco Drive as a government policy is in place in various countries of Europe, the US, Japan and
Korea. International organizations such as the International Energy Agency (IEA) or The United Nations
Environmental Program (UNEP) today also promote Eco Drive which has become a global effort.
The major benefits identified for applying Eco Drive are:
Environmental impact (reduced GHG emissions and local pollutants);
Economic benefits due to reduced fuel consumption and lower maintenance costs;
Lower accident rate and less stressful driving;
Eco Drive as an instrument to demonstrate the social and environmental responsibility of a
company.

FINAL REPORT GREEN FREIGHT PROGRAM GRUTTER CONSULTING
20
Important factors to ensure a sustainable impact of Eco Drive include fuel consumption monitoring,
regular repetition of core messages and updating of information (e.g. for new vehicle technologies).
Major obstacles identified for widespread application of Eco Drive include:
Eco Drive has the image of driving slowly;
The benefits of Eco Drive are not recognized by all stakeholders i.e. low awareness as well as
low motivation and interest resulting in low demand for training courses;
Influencing drive-styles and habits is difficult;
Despite its popularity, there is poor and inconsistent research evidence regarding the effects of Eco
Drive on both fuel consumption and emissions. Wahlberg states for example: “The claims regarding
the Eco-drive benefits were mainly made by educators and bureaucrats, and lack scientific backing”.
Eco Drive is difficult to turn into a driving habit as it is dependent on the driving situation such as traffic,
environment and personal motivations. The impact of Eco Drive is potentially dependent on the driving
circumstance (urban, highway), driver background (professional or amateur drivers) and on the vehicle
category (bus, truck, taxi, passenger cars, motorcycles). Mostly data has been reported for passenger
cars.
3.3.2. Previous Experience with Eco Drive in Viet Nam and Lao PDR
Viet Nam
Various and regular trainings for Eco Drive in passenger cars, taxis and light duty vehicles have been
realized e.g. through the University of Transport Technology of the Ministry of Transport (MOT).
Swisscontact, in cooperation with Clean Air Asia (CAI), organized some years ago Eco Drive trainings
for around 100 garbage truck drivers in Hanoi measuring the impact however only during the training
course itself. Nippon Japan as well as Hino have also realized Eco Drive training with a focus on light
duty truck drivers without ex-post impact measurement.
Lao PDR
Some companies have been trained on Eco Drive e.g. the Vientiane Capital State Bus Enterprise trained
drivers on Eco Drive under a Japanese program and Phu Bia mining has realized training internally for
their truck drivers with an Australian instructor. Phu Bia has a truck simulator for trainings. No reports
are available on monitoring of impacts of driver training.
3.3.3. Eco Drive Curriculum
Based on experience with an initial Eco Drive course for truck drivers a Curriculum for Eco Drive was
developed4 and discussed in workshops in Viet Nam and Lao PDR. Thereafter, the curriculum was
applied in various training courses in both countries with around 100 truck drivers being trained in Eco
Drive5.
The curriculum includes a theoretical and a practical part:
4 See for details Report 3 5 In Lao PDR also long-haul bus drivers were trained

FINAL REPORT GREEN FREIGHT PROGRAM GRUTTER CONSULTING
21
Theoretical part: This includes motivating the driver, explaining reasons why Eco Drive is good,
explaining what needs to be done and why, and demonstrating the results of changing the
driving style.
Practical experience: This includes test-driving either on a simulator or with actual trucks. The
instructor thereby gives the driver tips on how to improve his Eco Drive skills. Ideal is if a first
test-drive can be realized prior the theoretical course and another test-drive after the course.
The 4 golden rules of Eco Drive are promoted:
1. Check your vehicle prior driving; The most relevant checks for low fuel consumption prior
driving are tire pressure, cargo and aerodynamics;
2. Up-shift as early as you can and use high gears;
3. Drive defensively running at constant speed;
4. Effectively utilize the engine brake and retarders.
3.3.4. Activities and Trainings Realized
Basically two types of trainings were realized:
Capacity building of trainers of driving schools on Eco Drive on the curriculum developed. This was realized in 2015 through a training workshop realized with 15 trainers in each country.
Training of 100 truck drivers in Viet Nam and 100 truck and bus drivers in Lao PDR in various courses during 2015 and 2016 using the developed curriculum. In all trainings all drivers performed trips on a standardized route prior course with precise fuel consumption measurement and just after the course measuring again the performance. The run after the course included feedback and recommendations of the instructor whilst the run prior course the driver had to drive as usual without assistance.
Photo 3: Training Courses Lao PDR and Vietnam

FINAL REPORT GREEN FREIGHT PROGRAM GRUTTER CONSULTING
22
3.4. Logistics Improvements
3.4.1. Overview of International Experiences with Logistics Measures
Logistics measures in the context of the GFP are such which reduce GHG emissions, even if this is not
the primary objective. Such measures avoid trips, reduce trip distances or increase trip efficiency. A
core indicator is thereby the increase of the average load factor6. The trend towards just-in-time
production and narrower delivery time windows have resulted in shipping of smaller quantities of
goods and lower load factors. Also demands on speed and guaranteed delivery times make shipping
aggregation problematic resulting in reduced load factors. Figures in Europe for example show average
load factors of loaded vehicles in the year 2012 of only 56% and a ratio of empty trips of 24% resulting
in an average overall load factor of around 43%7. In the US the National Private Truck Council estimates
an empty load percentage of 28% i.e. a similar figure as in Europe. Reasons to under-loading next to a
focus on speed and delivery times are specialized logistical requirements of freight consignments (e.g.
refrigeration requirement, fuels etc.), inherent asymmetries in distributional networks (e.g. round
wood transporting from forests to sawmills), and changes in production and consumption patterns
such as reduced stock warehousing.
Potential logistics solutions include8:
Drop-and-Hook: “Drop” refers to delivering a trailer and dropping it at the customer or
destination site while “hook” refers to immediately hooking up a loaded trailer to the next
destination. This approach shall reduce empty trips. The core motivation for “drop-and-hook”
is however on reducing time in which the driver and the truck is not used thus being able to
potentially reduce logistics costs9. Drop and hook itself will not provide for more matching
6 Important is in this context that the average load factor should not be trip but tkm based e.g. a 40t truck driving 500km with 50% of load is another truck of 40t with 70% of load driving a 50km trip result in a 60% average load factor of trips but only 52% load factor based on tkm 7 See A. Leshchynskyy, Under-utilisation of road freight vehicle capacity, 2013 8 See also CAI, design of Green Freight China Program: Review of Freight Logistics Solutions, 2011 9 The reduced driver and truck cost has to be compared with the increased cost for trailers.

FINAL REPORT GREEN FREIGHT PROGRAM GRUTTER CONSULTING
23
loads. Its chance to work will be much higher if tractor and trailer owner for small companies
(one truck one driver) are separate and if a high degree of standardization exists.
Online freight marketplaces: Online freight marketplaces include spot market logistics
platforms and freight exchange platforms. Basically logistics platforms attempt to match
carrier availability with loads. Such platforms are today basically internet-based and often offer
other services next to match-making such as vehicle positioning or cargo tagging.
Freight Consolidation Centres: These are distribution centres, situated generally close to a
town centre, shopping mall or construction sites, at which part loads are consolidated and
from which a lower number of consolidated loads are delivered to the target area. A
consolidation centre often tends to have multiple objectives, but the most common aims are
associated with reducing congestion, traffic disruption and vehicle emissions within the
primary urban area that the consolidation centre serves. Some monitored experience of
freight consolidation centres however also shows the limitations especially concerning
financial sustainability as well as their GHG impact10. Consolidation centres are basically an
instrument of reducing urban freight transport issues. Experience with such centres has been
mixed and financial sustainability is problematic. Their incidence in long-haul transport is
marginal and total emission reductions are limited.
Freight company consortia’s: This is an association between usually small and medium carriers
or distributors to pool their resources and strengths in order to win and manage larger and
more lucrative logistics contracts. Main features of such consortia’s include integrated fleet
management (truck and load tracking), information sharing, facilities sharing and profit
sharing. Collaborative efforts can be “vertical” or “horizontal”. Vertical alliances are between
trading partners at different levels within a single supply chain. Horizontal collaboration occurs
between separate supply chains in an attempt to share risks and rewards thus leading to a
greater competitive advantage and business performance than would be achieved by the
involved actors individually. Consortia’s have the potential of increasing load factors and thus
reducing emissions. Overall such collaborative efforts will require considerable levels of
mutual trust between involved partners. The role of a 3rd party or government in promoting
such consortia’s seems to be limited.
3.4.2. Logistics in Viet Nam and Lao PDR
Viet Nam
In transport, the road sector is the dominant mode in terms of freight transportation in Viet Nam. Viet
Nam has about 600 and 800 logistics service providers with a number around 1,000 just for freight
forwarders11. A large number are small enterprises with limited staff (15 to 30). Many of the freight
forwarders limit their activities to customs clearing and simple shipment orders. There is intense
competition between these small operations as they are capable of only getting a small share of the
market (20%). The big share of the market goes to larger firms, which are either joint ventures with
global logistics players or Vietnamese agents of international firms.
10 See Scott Wilson, Freight Consolidation Centre Study, 2010 and M. Panero et.al., Urban Distribution Centers, 2011 11 See VITRANSS 2, 2010

FINAL REPORT GREEN FREIGHT PROGRAM GRUTTER CONSULTING
24
To get an updated picture of actual load factors of long-haul trucks a roadside survey was realized
December 2015 on the Phap Van toll-booth located on the national highway connecting the North and
South provinces of Viet Nam. Trucks with a Gross Vehicle Weight (GVW) of more than 10 tons were
surveyed randomly in both directions. The following table shows the main results of the load factor
study.
Table 4: Results Load Factor Study Viet Nam 2015
Parameter South-North North-South Average
Median trip distance12 121 km 111 km 116 km
Median GVW 32 tons 32 tons 32 tons
Average load factor unweighted13 59% 54% 56%
Average load factor based on tkm14 71% 67% 69%
Average empty backhaul unweighted 36% 34% 35%
Average empty backhaul based on tkm 27% 25% 26%
Source: Grütter Consulting
To estimate a realistic improvement potential of load factor changes the following table gives an
indication of share of tkm and the determinant empty load factor as well as average tkm weighted
load factor per good.
Table 5: Baseline Load Factor and Improvement Potential per Good, Viet Nam 2015
Parameter Relevant empty backhaul factor15
Relevant average tkm weighted load
factor16
Improvement potential
Container transport
18% 78% Empty backhaul is relatively low and the load factor is high. Therefore, the improvement potential is considered as marginal.
Miscellaneous goods
32% 60% The empty backhaul and the average load factor are at a moderate level. A moderate improvement potential is thus identified.
Cement / building material
37% 51% The empty backhaul is relatively high and the average load factor low. The improvement potential is high but the commodity only represents a small fraction of total tkm.
The commodities which represent a large fraction of tkm (container and miscellaneous goods) have
only a limited improvement potential as trucks are in fact already well loaded and with a low empty
backhaul rate. In the area of cement and building material the improvement potential is higher but
this only represents a relatively small fraction of the tkm driven for long –haul truck transport. The
improvement potential for match-making platforms is therefore considered as limited. This coincides
also with an assessment made in the UK after analysing disaggregated data in a specific sector17.
12 the median is taken as very long trips influence average trip distances 13 not weighted according to trip distance or tkm 14 load factor weighted based on tkm 15 in case of asymmetric goods flows i.e. asymmetric load factors N-S and S-N the lower empty backhaul value is taken as this value can be improved realistically whilst the value in the other direction is influenced basically through the asymmetric goods flow. 16 idem to empty backhaul; the higher of the average load factors is taken as the improvement potential is determined through the path/direction where goods primarily flow. 17 A. McKinnon, The potential for reducing empty running by trucks: a retrospective analysis, 2006

FINAL REPORT GREEN FREIGHT PROGRAM GRUTTER CONSULTING
25
Internet-based logistics platforms in general have the problem that shippers have the added burden
of trusting cargo to a carrier or broker they are often not familiar with. Risks include non-compliance
of delivery times, damaged or stolen products, loss of products and non-compliance with other
contractual obligations as demanded by the shipper. For truckers on the other hand the risk is of
default on the side of the shipper e.g. not paying for the services rendered or not paying timely or
other contractual defaults. Many businesses therefore share trepidation about using these services
and their caution is well-founded because pitfalls do exist. Most of these pitfalls can be overcome by
financial services including insurance coverage as well as third party retaining of fees. These
instruments are however hardly if at all developed in Viet Nam thus making usage of platforms a
matter of trust for both Parties. Many trading platforms therefore use ratings (for both sides of the
deal) to eliminate fraudulent or low-quality participants and to allow parties to make an informed
choice with whom to engage in business. However, such systems require time and large brokerage
volumes to arrive at sound and reliable rating levels, making start-ups complicated. The non-existence
of instruments to reduce the risk of platforms in Viet Nam make Internet-based logistics platforms at
the current stage little attractive compared to traditional brokerage services of 3L logistics companies.
This combined with the relatively low improvement potential concerning load factors results in the
conclusion that it is currently not worthwhile to invest resources in such a platform. Also at least 3
platforms already exist in Viet Nam which offer these services18 – however they do not seem to be
widely used.
Lao PDR Based on the Ministry of Public Work and Transport total nearly 4 million tons of goods or 330 million
tkm are transported in Laos PDR. The modal split of transport goods in Laos PDR is road and inland
waterway as no rail transport exists. Based on a GMS transport study realized by ADB (2006) and
confirmed by JICA based on the Lao Statistical Yearbook (2008) the road sector is dominant in terms
of tkm with around 2/3rd against 1/3rd inland waterway.
Logistics companies in Vientiane are mostly private forwarding and trucking companies whilst in the
provinces logistics companies are basically owner-drivers. The Lao International Freight Forwarder
Association (LIFFA) is the largest umbrella organization of logistics companies in the country.
To get an updated indication of actual load factors of long-haul trucks a roadside survey was realized
December 2015 on the national highway road No. 13 at km 85. This highway connects the Provinces
from the Northwest with other Provinces in Laos PDR. Trucks with a GVW of more than 10 tons were
surveyed randomly in both directions. Peak hours of truck movement was between 5 and 8 am and 5-
7 pm. The following table shows the main results of the load factor study.
18 www.vietnamtrucking.vn/trang-chu/10/san-van-tai/, www.vitransportal.com/trang-chu/, www.vinatrucking.com

FINAL REPORT GREEN FREIGHT PROGRAM GRUTTER CONSULTING
26
Table 6: Results Load Factor Study Laos PDR 2015
Parameter South-North North-South Average
Median trip distance19 560 km 440 km 520 km
Median GVW 48 tons 36 tons 42 tons
Average load factor unweighted20 59% 50% 55%
Average load factor based on tkm21 65% 45% 55%
Average empty backhaul unweighted 29% 44% 37%
Average empty backhaul based on tkm 25% 50% 38%
Source: Grütter Consulting
The following table gives an indication of the realistic potential of load factor improvements.
Table 7: Baseline Load Factor and Improvement Potential per Commodity, Laos PDR 2015
Parameter Relevant empty backhaul factor22
Relevant average tkm weighted load factor23
Improvement potential
Mining products 53% 72% This represents around 30% of tkm transported. Empty backhaul is high but related to the commodity. It is not considered as feasible to receive significant loads for the same origin-destinations using mining trucks. Therefore, the improvement potential is considered as marginal
Miscellaneous goods
19% 56% This represents around 20% of tkm transported. The empty backhaul is at a low level. The average load factor is at a moderate level with a significant level of partial loads. A low to moderate improvement potential is thus identified.
Cement / building material
30% 46% This represents around 25% of tkm transported. The empty backhaul is moderate S-N and very high N-S due to asymmetric good flows. Also some partial loads are being realized S-N. A moderate improvement potential exists, however the issue in this commodity is basically of asymmetric flows.
Liquids 11% 88% This represents around 10% of tkm transported. The empty backhaul is very low and the load factor is very high. No improvement potential is identified.
For around 50% of goods transported no or only a marginal improvement potential is identified due to
the commodities transported (minerals, liquids) and asymmetric goods flows. For around 50% of goods
a low to moderate potential has been identified.
Therefore, similar to Viet Nam the potential for a match-making platform are deemed to be limited.
19 the median is taken as very long trips influence average trip distances 20 not weighted according to trip distance or tkm 21 load factor weighted based on tkm 22 in case of asymmetric goods flows i.e. asymmetric load factors N-S and S-N the lower empty backhaul value is taken as this value can be improved realistically whilst the value in the other direction is influenced basically through the asymmetric goods flow. 23 idem to empty backhaul; the higher of the average load factors is taken as the improvement potential is determined through the path/direction where goods primarily flow.

FINAL REPORT GREEN FREIGHT PROGRAM GRUTTER CONSULTING
27
3.4.3. Green Freight Label
A GF label is considered as interesting instrument to promote low-carbon freight due to the following:
GF labels require appropriate monitoring of company performance including fuel usage. This
results in good quality data of actual performance levels and allows companies to track
improvements.
GF labels require companies to implement GF technologies or improvements such as Eco
Drive courses for their drivers. This ensures that companies actually invest in and implement
GF measures.
GF labels are attractive for companies as they improve their competitive position allowing to
increase their market share, get a larger customer base or increase prices. This again allows
to invest in GF technologies.
The label used by the GFP is the Green Freight Label given by Green Freight Asia (GFA)24 which values
the environmental performance of the company. The label can be taken as proxy for a reliable
company with internal controls and with a good environmental performance.
GFA is an industry led program incorporated in Singapore as a non-profit organization. It is a member
driven organization, mainly of shippers and carriers and provides for a clear and simple definition and
recognition of Green Road Freight Transport. The GFA label comprises four distinct tiers of recognition
and has as participating companies e.g. Heineken, HP, IKEA, DHL, UPS, Lenovo etc.
Figure 7: GFA Label Tiers
The criteria to get the label is basically, next to being member and paying a membership fee a sound
data management which takes account of the number of trucks, fuel type, and emission standard as
minimum (tier 1) plus fuel consumption, distance driven and freight volume for tier 2. Tier 3 asks for
GHG tracking and tier 4 for a public GHG commitment. The environmental commitment for tier 1 is
that all trucks are included in a regular maintenance program. For the following tiers there are basically
the criteria on usage of fuel saving technologies (e.g. Low Rolling Resistance Tires) and of drivers
trained in Eco Drive asking for an ever increasing amount of technologies and trained drivers when
moving from tier 2 to tier 4.
2 companies in Viet Nam and 1 company in Lao PDR were supported by the project to get the label
(those in Viet Nam a 2-leaf label and the company in Lao PDR a 1 leaf label).
24 website http://www.greenfreightasia.org/

FINAL REPORT GREEN FREIGHT PROGRAM GRUTTER CONSULTING
28
3.5. Summary Implementations
The following table summarizes implementation actions realized in the two countries.
Table 8: Summary of GF Implementation Actions
Activity Viet Nam Lao PDR
Aerodynamic equipment 11 trucks 11 trucks
LRRs 15 trucks 12 trucks and 3 buses
Fuel Audit Tool 20 companies 20 companies
Eco Drive training instructors 15 instructors 15 instructors
Eco Drive training drivers 100 drivers 100 drivers
Workshops 2 workshops with 90 participants 2 workshops with 72 participants
Brochures 3 brochures 3 brochures
Reports 12 technical reports
FINAL REPORT GREEN FREIGHT PROGRAM GRUTTER CONSULTING
29
4. Monitoring Approach
GFTs and Eco Drive have potential impacts on the efficiency of trucks whilst improved load factors have
an impact on the efficiency of moving goods. The monitoring is therefore not a general monitoring of
freight efficiency (as this would also include mode switch measures) nor does it monitor avoidance or
reduction of freight trips. This clarification is important due to its implications on parameters to be
used.
The monitoring focuses on direct emissions sources and not on indirect or leakage25 emissions.
However, the emission factor for diesel will be presented with and without leakage emissions which
are in this case upstream emissions (well-to-tank emissions caused by the extraction, transport and
refinery of petroleum products). The fuel upstream emissions are explicitly stated as latter represent
an important source of emissions. Also Black Carbon (BC) emissions are estimated based on the
average Euro standard of trucks used per country.
The GHG included in monitoring is CO2. CH4 emissions are marginal in liquid fuel combustion of vehicles
and gaseous trucks are not used in a significant share for long-haul heavy-duty operations. N2O
emissions are marginal for vehicular emissions26. BC is transformed to GHG equivalent for GWP100.
The three identified methodological approaches (see Report “Impact Monitoring”) for GFTs are:
1. Before-after comparison where the fuel efficiency of the truck prior technology installation is
compared with the fuel consumption after technology installation.
2. Control-group approach where the fuel efficiency of the project truck is compared to the fuel
efficiency of a comparable reference truck.
3. Controlled test-run where the fuel efficiency before and after equipment installation is
measured based on a realizing a controlled test-run.
All three methods were applied. In each country for each technology a pilot test run was performed
based on a controlled test-run with controlled conditions. Already in the pilot phase all involved project
trucks have been monitored 1-6 months prior implementation. Each truck installed with a GFT was
driven under controlled circumstances with and without GFT. For more than 20 trucks per country a
before-after comparison was made with data of minimum 1 month before and 1 month after installing
the GFT and for 6 trucks measurements were made 6 months prior and 6 months after GFT installation.
25 Leakage is defined as impacts not under direct control of the project but which can be attributed to the projects activities. 26 See e.g. CDM approved methodology ACM0016

FINAL REPORT GREEN FREIGHT PROGRAM GRUTTER CONSULTING
30
Figure 8: Monitoring Approach
Source: Grütter Consulting
Core parameters monitored are fuel consumption and distance driven. Weight measurement was
made to ensure that average loads were comparable prior/after (calculation based on tkm). Speed
measurements were also made to ensure comparable speeds prior and after installing GFTs and
compared to reference trucks. Reference trucks were identical trucks in terms of GVW, brand and
make, year, Euro standard and operating company. Fuel consumption was measured with fuel-flow
measurement equipment and fuel station invoices. The parameter distance driven and driving speed
was based on GPS whilst freight tonnage was based on loading papers.
Figure 9: Fuel Monitoring Device

FINAL REPORT GREEN FREIGHT PROGRAM GRUTTER CONSULTING
31
5. Implementation Results
Implementation results are shown for the GFTs applied (aerodynamics, LRRs, increased tire pressure)
as well as for Eco Drive. Workshops, reports and implementation of the Green Freight Label are
basically enabling measures and therefore not included. GHG reductions are proportional to fuel
savings and are quantified in the next chapter which looks at the financial and economic impact.
The following figure shows the overall average fuel savings for both countries whilst the table shows
detailed results.
Figure 10: Fuel Savings of Green Freight Activities (average Viet Nam and Lao PDR in % of reduced fuel consumption per km)
Source: Grütter Consulting
Eco Drive and LRRs result in around 4-5% fuel savings whilst aerodynamic devices and tire inflation
achieve around 2% savings. Combined an improvement of 13% is possible.
Table 9: Implementation Results in % of Fuel Savings
Measure Viet Nam Lao PDR
Tire inflation Average: 3.1% Average: 1.5%
Efficient tires (LRRs) Average: 5.6% STDEV: 0.03 Upper and lower boundary 95% Confidence Interval: 2.4% to 8.9%
Average: 4.2% STDEV: 0.04 Upper and lower boundary 95% Confidence Interval: 1.6% to 6.7%
Aerodynamic devices
Average: 1.5% STDEV: 0.01 Upper and lower boundary 95% Confidence Interval: 0.4% to 2.7%
Average: 3.2% STDEV: 0.03 Upper and lower boundary 95% Confidence Interval: 0.9% to 5.4%
Eco Drive short run Average: 7.6% STDEV: 0.06 Upper and lower boundary 95% Confidence Interval: 4.8% to 10.4%
Average: 3.1% STDEV: 0.03 Upper and lower boundary 95% Confidence Interval: 1.6% to 4.6%
Eco Drive long run Average: 5.8% Average: n.a.
Source: Grütter Consulting
FINAL REPORT GREEN FREIGHT PROGRAM GRUTTER CONSULTING
32
Differences in results between the two countries exist, albeit not of large scale.
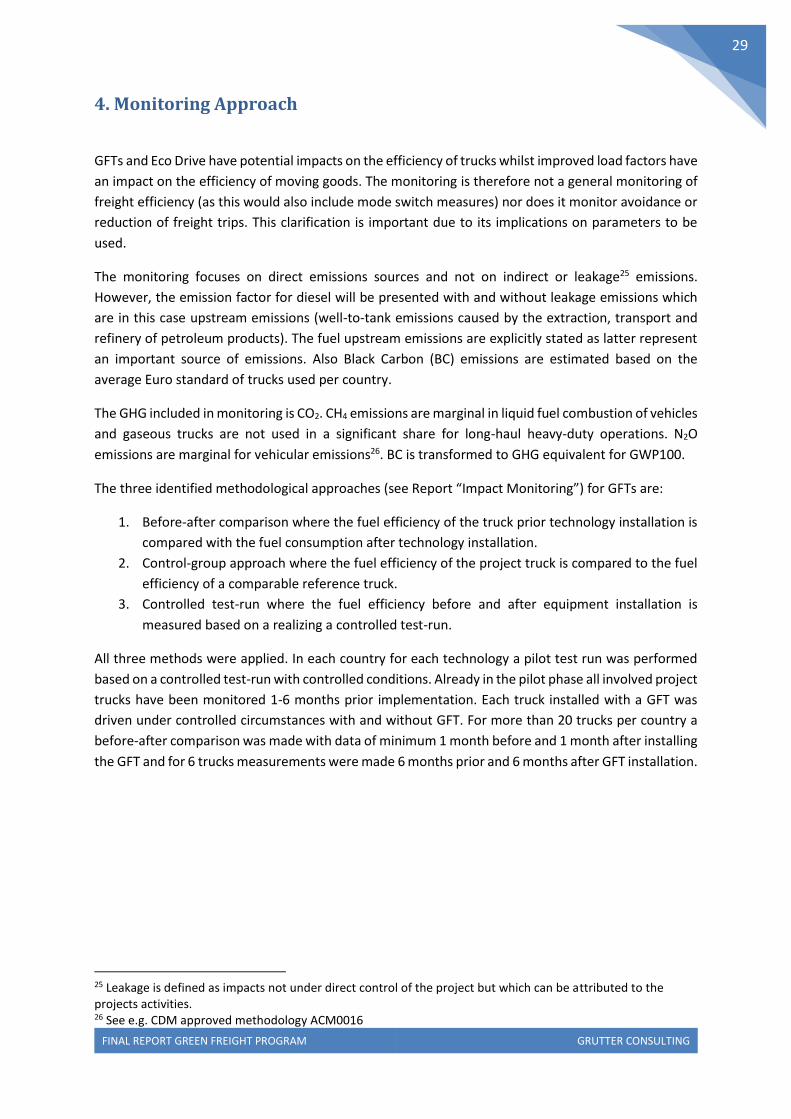
In the case of Eco Drive improvements change considerably over time as can be seen from the
following figure showing results with average improvement 1 to 6 months after the course. This
indicates the need of refresher courses as well as of constant incentives and supervision e.g. through
telemetric equipment.
Figure 11: Eco Drive Results Over Time
Source: Grütter Consulting
0%
2%
4%
6%
8%
10%
12%
1 2 3 4 5
fuel
sav
ings
months after training

FINAL REPORT GREEN FREIGHT PROGRAM GRUTTER CONSULTING
33
6. GHG and Economic Impact
6.1. GHG Impact
The GHG impact is determined at two levels:
Tank-to-Wheel (TTW) emissions based on fuel consumption, the Net Calorific Value (NCV) and
the CO2 Emission factor (EFCO2) of the fuel used following IPCC procedures. The following table
shows the key parameters used for this calculation.
Table 10: Parameters to Determine TTW GHG Emissions (Long-Haul HDVs)
Parameter Value Viet Nam Value Lao PDR Data Source
Specific fuel consumption
37 l/100km 48 l/100km Monitoring of >50 trucks during various months
NCV of diesel 43 MJ/kg IPCC, 2006, table 1.2
EFCO2 of diesel 74.1 gCO2/MJ IPCC, 2006, table 1.4
Average GVW 44 tons 35 tons Monitoring of >50 trucks during various months
Average net tons 22 tons 14 tons Viet Nam: 12t truck weight; 69% average tkm weighted load factor Lao PDR: 9t truck weight; 55% average tkm weighted load factor
Annual mileage 90,000km 50,000km Records companies
Well-to-Wheel (WTW) emissions including the GHG impact of Black Carbon (BC) based on the
key parameters as included in the following table.
Table 11: Parameters to determine WTW and BC Emissions (based on Euro III HDVs > 32t GVW)
Parameter Value Viet Nam and Lao PDR
Data Source
PM2.5 emissions 0.151 g/km EEA, COPERT, 2014, Table 3-21 (Tier 2 method)
BC carbon fraction of PM2.5
70% EEA, COPERT, 2014, Table A.4.02 (Tier 3 method)
GWP BC 900 Bond, 2014 and World Bank, 2014
Upstream factor diesel
25% JRC-Study 22%, CEC 23%, US DOE GREET 25%, NRC GHGenius 29%; average value taken
GHG emissions are expressed in gCO2/km, gCO2/tkm and tCO2 per annum per truck based on average
mileage per country. The following table shows calculated values.
Table 12: GHG Emissions Long-Haul Trucks Viet Nam and Lao PDR
Parameter Viet Nam Lao PDR
Emissions in gCO2/km TTW 995 gCO2/km 1,291 gCO2/km
Emissions in gCO2/km WTW incl. BC 1,339 gCO2/km 1,709 gCO2/km
Emissions in gCO2/tkm TTW 45 gCO2/tkm 92 gCO2/tkm
Emissions in gCO2/tkm WTW incl. BC 61 gCO2/tkm 122 gCO2/tkm
Emissions per truck per annum TTW 90 tCO2 65 tCO2
Emissions per truck per annum WTW incl. BC 121 tCO2 85 tCO2
Fuel usage is in absolute and even more per ton far higher in Lao PDR than in Viet Nam due to roads
and driving conditions (many hilly roads). GHG emissions per truck in absolute terms are however
higher in Viet Nam due to significantly higher annual mileage of trucks in Viet Nam.

FINAL REPORT GREEN FREIGHT PROGRAM GRUTTER CONSULTING
34
The following table shows the GHG impact per annum per country per measure.
Table 13: GHG Impact per Truck per Annum
Parameter Viet Nam Lao PDR
TTW WTW incl. BC TTW WTW incl. BC
Aerodynamic equipment 1.3 tCO2 1.8 tCO2 2.1 tCO2 2.7 tCO2
Efficient Tires (LRRs) 5.0 tCO2 6.7 tCO2 2.7 tCO2 3.6 tCO2
Tire Inflation (+1 Bar) 2.8 tCO2 3.7 tCO2 1.0 tCO2 1.3 tCO2
Eco Drive 2.8 tCO2 3.7 tCO2 1.0 tCO2 1.3 tCO2
Combined 11.4 tCO2 15.3 tCO2 6.5 tCO2 8.6 tCO2
Source: Grütter Consulting
Combined each truck can save in Viet Nam 11 to 15 tCO2e (TTW or WTW incl. BC approach) and in Lao
PDR 7 to 9 tCO2e representing 10-13% of GHG emissions of long-haul trucks.
6.2. Financial Impact and GHG Abatement Costs
6.2.1. Introduction
The financial impact of GF measures is calculated and the marginal abatement costs per tCO2 are
calculated. The profitability of measures at company level is thereby determined.
6.2.2. Cost Structure Viet Nam
The following table shows core parameters for a long-haul trucking company based on data collected
from various companies based on input market prices and performance reports of trucks.
Table 14: Core Parameters Trucking Costs Viet Nam, 2016
ID Parameter Value
1 Investment cost of new truck (Chinese) 1.8 Billion VND
2 Lifespan new Chinese truck 15 years
3 Investment cost used truck (US, 6-year old) 1 Billion VND
4 Remaining life-span used US truck 12 years
5 Fuel cost 12,000 VND/l
6 Maintenance cost per month 10 M VND/m
7 Annual repair cost 50 M VND/a
8 Annual vehicle tax 20 M VND/a
9 Other taxes and informal facilitation payments per month 7 M VND/m
10 Road toll fee per km for national highways27 3,500 VND/km
11 Truck insurance cost per annum 20 M VND/a
12 Driver salary incl. social benefits per month 15 M VND/m
13 Auxiliary driver salary incl. social benefits per month 6 M VND/m
14 Weighted Average Capital Cost WACC28 8.5%
15 Exchange rate USD-VND (Interbank rate) 1:22,000
Source: compiled by Grütter Consulting
27 average rate for various routes 28 Based on 15.6% cost of equity (UNFCCC, EB 85 Annex 12, CDM Methodological Tool Investment Analysis Version 6.0, 2015; rate for transport sector Vietnam); 6.5% cost of debt (SBV rate valid as of 01/2016; see http://www.tradingeconomics.com/vietnam/interest-rate); 22% tax rate (Deloitte, 2015); 30% equity and 70% debt finance

FINAL REPORT GREEN FREIGHT PROGRAM GRUTTER CONSULTING
35
The following table shows the operational cost structure of trucking companies in Viet Nam excluding
overhead and profits.
Table 15: Operational Cost Components of Trucking in Viet Nam (excl. toll fees), 2016
Parameter in VND/km in USD/km
Truck Investment (annualized, average of new/used truck) 1,961 0.09
Fuel 4,440 0.20
Salary Drivers 2,800 0.13
Tires 1,886 0.09
Maintenance & Repair 1,889 0.09
Insurance, Tax 1,378 0.06
Total cost per km 14,353 0.65
Total cost per net-tkm 652 0.03
Source: calculation by Grütter Consulting
The total cost per km and net-tkm does not include toll fees charged on highways. If using purely
highways these amount to another 3,500 VND/km (0.16 USD/km) equivalent to another 250 VND per
net-tkm (0.01 USD/net-tkm).
The following figure shows the cost share per component.
Figure 12: Cost Components Trucks Viet Nam (excl. toll fees), 2016
Source: calculation by Grütter Consulting
The largest cost component is fuel with around 1/3rd of total costs. This is followed by salaries with
19% and truck investment, maintenance & repairs, tires, insurance & taxes which all have a comparable
share.
6.2.3. Cost Structure Lao PDR
The following table shows core parameters for a long-haul trucking company in Lao PDR based on data
collected from various companies and performance reports of trucks.
Truck investment
14%
Fuel31%
Salary19%
Tires13%
Maintenance, repairs
13%
Insurance, taxes, facilitation
10%
FINAL REPORT GREEN FREIGHT PROGRAM GRUTTER CONSULTING
36
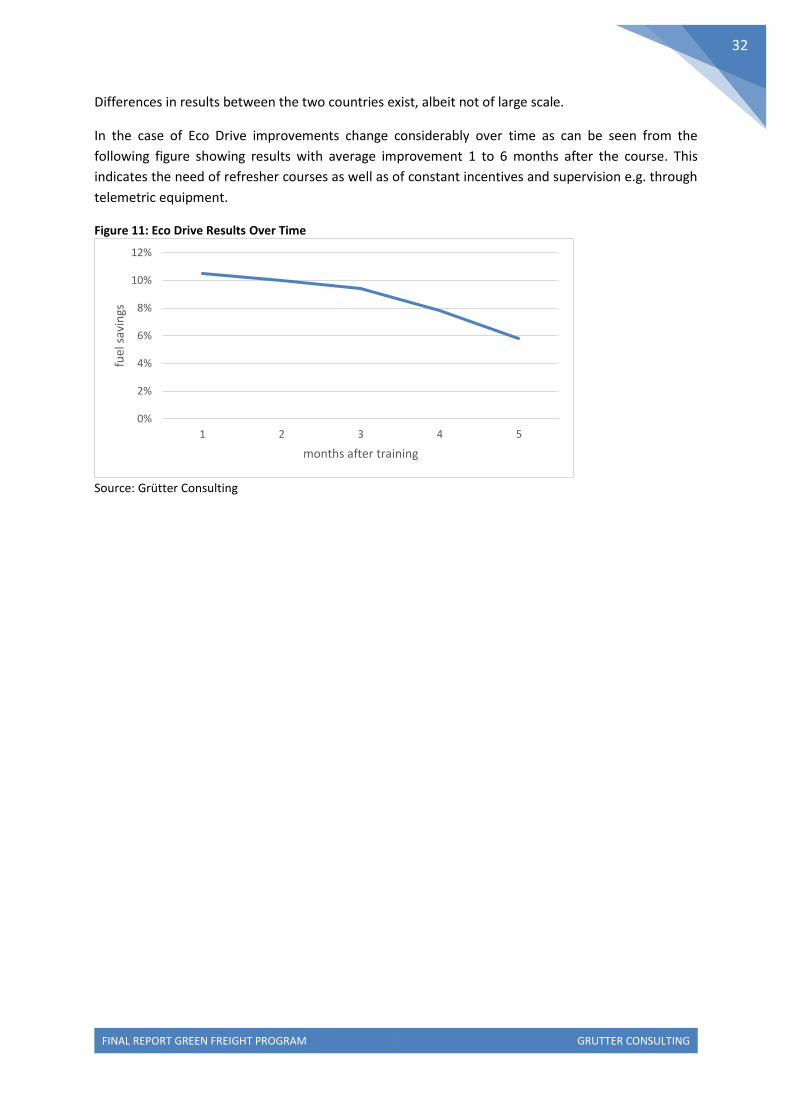
Table 16: Core Parameters Trucking Costs Lao PDR, 2016
ID Parameter Value
1 Investment cost of new truck (Chinese) 570 Million KIP
2 Lifespan new Chinese truck 15 years
3 Investment cost used truck (Japanese, 5-year old) 340 Million KIP
4 Remaining life-span used truck 10 years
5 Annual distance driven 50,000 km
6 Gross vehicle weight (GVW) 35 tons
7 Average load factor (freight tons)29 14 tons
8 Number of tires (8 axles) 22 tires
9 Lifespan of tire (Chinese tire)30 70,000 km
10 Cost per tire (Chinese tire) 2.2 M KIP
11 Specific fuel consumption 48 l/100km
12 Fuel cost 6,600 KIP/l
13 Maintenance cost per month 4 M KIP/m
14 Annual repair cost 48 M KIP/a
15 Annual vehicle tax 30 M KIP/a
16 Truck insurance cost per annum 4 M KIP/a
17 Driver salary incl. social benefits per month 2 M KIP/m
18 Auxiliary driver salary incl. social benefits p.m. 0.8 M KIP/m
19 WACC31 8.5%
20 Exchange rate USD: KIP (Interbank rate) 1:8,000
Source: compiled by Grütter Consulting
The following table shows the operational cost structure of trucking companies in Lao PDR excluding
overheads and profits.
Table 17: Operational Cost Components of Trucking in Lao PDR, 2016
Parameter in KIP/km in USD/km
Truck investment (annualized, average of new/used truck) 1,205 0.15
Fuel 3,168 0.40
Salary drivers 672 0.08
Tires 691 0.09
Maintenance, repairs 1,920 0.24
Insurance, taxes 680 0.09
Total cost per km 8,336 1.04
Total cost per net-tkm 595 0.07
Source: calculation by Grütter Consulting
The following figure shows the cost share per component.
29 37t net payload; 50% empty load factor 30 largest market share 31 Assumed same as for Viet Nam

FINAL REPORT GREEN FREIGHT PROGRAM GRUTTER CONSULTING
37
Figure 13: Cost Components Trucks Lao PDR, 2016
Source: calculation by Grütter Consulting The largest cost component is fuel with around 1/3rd of total costs. This is followed by salaries with
19% and truck investment, maintenance & repairs, tires, insurance & taxes which all have a comparable
share.
6.2.4. Financial Impact of GF Measures
The cost-benefit of the following GF measures is assessed for long-haul trucks:
Installation of a cab-roof deflector (aerodynamic device);
Usage of Low-Rolling Resistance Tires (LRRs);
Driver training on Eco Drive;
Package of measures including also increased tire inflation.
Table 18: Profitability of GF Measures32
Measure / Parameter Viet Nam Lao PDR
Aerodynamic Device
1. Incremental CAPEX per truck USD 1,000 USD 900
2. Savings OPEX per truck USD 1,360 USD 3,170
3. Payback time 3.5 years 1.5 years
4. FIRR 35% 245%
LRRs
1. Incremental CAPEX per truck USD 880.- USD 880
2. Annual Savings OPEX per truck USD 1,130 USD 1,660
3. Payback time 10 months 13 months
4. FIRR 28% 89%
32 Based on cost structures and impact as recorded per country

FINAL REPORT GREEN FREIGHT PROGRAM GRUTTER CONSULTING
38
Eco Drive
1. Incremental CAPEX33 per annum per truck USD 150 USD 150
2. Annual Savings OPEX per truck USD 560 USD 297
3. Payback time 3 months 6 months
4. FIRR34 275% 98%
Combined Measures
1. Incremental CAPEX per truck USD 2,030 USD 1,930
2. Annual Savings OPEX per truck USD 2,300 USD 1,990
3. Payback time 1 year 1 year
4. FIRR 98% 90%
Each individual measure has a high FIRR and a short payback time. However, companies have to realize
additional incremental investments and fuel savings are not visible, especially if no high-quality
monitoring is in place. Therefore, companies are reluctant to invest in these technologies.
6.2.5. CO2 Marginal Abatement Costs
The marginal abatement cost (MAC) for each measure as well as for the full package is negative as all
measures have a profitable FIRR which is significantly above the WACC. The MAC in Viet Nam combined
is -400 USD per tCO2 avoided and in Lao PDR -600 USD per tCO2 avoided35. This is not surprising
considering the high FIRR of investments.
However various barriers apply which also form the reasons why the measures have not proliferated
(in absence of pre-installed cab roof deflectors):
GFTs have performance risks which result in financial risks making them potentially non-
profitable. These performance risks are basically the actual fuel savings and the life-span or
durability of LRRs.
Availability of low-cost efficient tires is in general not given. Only high quality brands such as
Michelin or Bridgestone offer LRRs. These are however high price brands. The majority of truck
tires used are however low cost brands or re-treaded tires. The absolute price difference
between a commonly used tire and a LRR is therefore significant (around double) due primarily
to brand differences (the average difference between same brand LRR and conventional tire
is only 40-50 USD per tire). This limits the application of LRRs due to limited market availability.
Also in many countries truckers still use tube tires whilst LRR tires are basically for tubeless
tires requiring an additional investment in rims. Tube tires are preferred by many truckers as
they are cheaper and allow for overloading with less potential of blow-outs.
The majority model used for “fuel management” by trucking companies in both countries is to
pay drivers a fixed allowance for fuel based on the trip realized36. This avoids fuel stealing or
haggling with drivers. The down-point is that reliable fuel consumption data lacks and that
companies are not very interested in fuel saving technologies as they have to pay the
additional investment but the savings are pocketed by the driver. This creates a significant
33 Cost of course and day lost for work 34 Impact of course estimated at 12 months 35 Based on TTW GHG avoided using NPV with a WACC of 8.5% 36 In various trucks the driver dismantled the installed equipment for fuel measurement indicating that it hindered truck performance. The equipment has no incidence on truck performance but obviously the driver feared that knowledge over actual fuel consumption would result in reducing his payment for fuel.

FINAL REPORT GREEN FREIGHT PROGRAM GRUTTER CONSULTING
39
barrier for monitoring GF programs and for creating interest for implementing measures. This
situation might change in the future with more telematics included in trucks and with
electronic fuel payment. However, as of today, it constitutes a significant barrier towards
adoption of GFTs, especially of smaller and less organized companies.
6.3. Financial Structuring Possibilities
6.3.1. ESCO
Traditional Energy Service Company (ESCO) structures are deemed as not applicable for GFTs. The
majority of ESCOs follow the "Energy Performance Contracting" model where the ESCO guarantees a
specific level of energy savings and amounts in excess are shared with the ESCO. Terms, including the
split, are agreed at project start, based on project type, bargaining power, and financing. The non-
applicability of ESCOs to GFTs is due to the scale of measures involved and contractual issues. Next to
this energy savings in GFTs are very difficult to monitor and to relate precisely to the implemented GFT
as fuel usage depends on multiple factors many of which are external to the company. Also the impact
of GFTs is relatively small compared to total fuel usage and compared to average fluctuations between
trucks, routes, drivers and driving circumstance thus making it difficult to have an undisputed fuel
saving related to a specific device.
6.3.2. Group Purchasing
A cooperative or group purchasing organization (GPO) is an entity that is created to leverage the
purchasing power of a group of businesses to obtain discounts from vendors based on the collective
buying power of the GPO members. GPOs are either funded by administrative fees that are paid by
the vendors that GPOs oversee, by the buying members or by a combination of both of these methods.
Group purchasing is used in many industries to purchase raw materials and supplies - alone in the US
there are, based on the National Cooperative Business Association, around 250 purchasing
cooperatives.
The following table gives an indication of percentage savings per area of group purchasing schemes in
the US.
Table 19: Typical GPO Savings
Input Estimated Percentage Saving
Fuel 2%
Tires 3-10%
New Trucks 1%
Oils 5%
Fleet logistics, software 8-10%
Finance/factoring 2%
Source: Truckers B2B and LCAPP website and calculations by Grütter Consulting
The majority of discounts are in the 5% or lower range.
Group purchasing has been taken up by independent companies which focus on this service as profit
enterprise i.e. is not managed in general by trade and business associations. These organizations are
FINAL REPORT GREEN FREIGHT PROGRAM GRUTTER CONSULTING
40
increasingly competing in the market with virtual buyers groups formed by social media or others on
the Internet as well as through companies such as Amazon which can often offer similar discounts. It
is therefore questionable if the traditional group purchase approach on a sectoral base will survive or
if this will be taken over through virtual buyer associations or massive Internet-based trading
companies such as Amazon.
6.3.3. International Experience with Financing GFTs
In numerous countries GFTs have been financed at least partially with subsidies paid by the
government. As example small trucking companies in Chile received subsidies for acquiring
aerodynamic equipment paid for by the Chilean Energy Efficiency Agency. Another example are various
truck scrapping programs (e.g. in Mexico or Colombia) which subsidize early retirement of elder trucks
and their replacement with new and environmentally less polluting entities.
A slightly different approach discussed in detail in the following section was taken by Cascade Sierra
Solutions (CSS) in the US, by the Guangdong Green Freight Programme and in Switzerland. However,
all of these approaches have in common that they have grant finance involved related to pollution,
energy savings and/or the climate impact.
Cascade Sierra Solutions GF Financing
CSS founded in 2006 in the US served as a bridge between truck owners, banks and government
agencies to arrange low-interest loans or grants to truck owners to purchase “green” trucks or retrofit
GFTs. CSS used loan and grant capital provided for basically by government entities including primarily
the US-EPA and the US Department of Energy to leverage further private investments using the funds
as security to raise private capital at a ratio of up to 9:1. The bank has more confidence as the CSS
loan/grant part is at risk first. When recession hit the US a high number of trucking companies
defaulted on the loans to CSS and the entity had to wind down operations 2014.
The interesting element of CSS is using grant money to leverage private capital and bring in banks. This
increased considerably the scope and outreach of the program. Leverage of capital however also
entails leveraging risks. Not uncommon for revolving funds the default rates and risks were
systematically underestimated leading eventually to the collapse of the scheme.
Guangdong Green Freight Programme
The 14 MUSD Guangdong GFP is a World Bank / GEF supported demonstration program on energy
efficiency and emission reduction in the freight sector and has as one of three components GFTs (GFT
budget 10 MUSD). The financial mechanism is based on an ESCO. The technology providers are
introduced to transport companies as industrial ESCOs. The ESCOs take on the performance risk and
provide project-specific financing while holding the packages of GFTs on their balance sheets. The
World Bank grants are allocated as subsides totalling around 30% of the purchasing price of the GFT
to the ESCOs thus repaying the loans together with the savings from the technologies (see figure
below). Savings or performance data is collected and provided for by the South China University of
Technology. The individual ESCOs receive a loan of USD 100,000 from the Industrial Bank guaranteed
for by the World Bank. The guarantee is provided for by the World Bank as the probability of receiving
a non-guaranteed credit is considered as slim. The technology providers are thus able to provide

FINAL REPORT GREEN FREIGHT PROGRAM GRUTTER CONSULTING
41
trucking companies with a package of fuel-efficient solutions. For banks the process is simpler as they
only need to finance ESCOs and not individual trucking companies.
Figure 14: Financial Mechanism of GFP, Guangdong
Source: GIZ, Analysis of Climate Finance Policies and Innovative Finance Mechanisms in Guangdong, 2014
In practical implementation the approach has shown various limitations:
Without the World Bank guarantee, FIs would not have issued the ESCOs credits;
The leverage factor is marginal;
The fuel savings impact and the measurement of latter are disputed;
Monitored data is not transparent and unreliable;
Long time frame for applications and high complexity to receive subsidies and rewards;
Non-inclusion of SMEs although these form the backbone of logistics in China due to perceived
risk and lack of interest;
The approach uses the provision of financing of GFT rebates and performance-based payments,
without however having realized a sound monitoring protocol and structure. Performance levels and
payments are therefore disputed. Whilst theoretically the model operates with shared savings in
practice loans are simply repaid by companies plus by the subsidy received from the World Bank.
Swiss Climate-Based Finance Scheme
The Swiss scheme is based on a performance-based payment for GHG reduction. Companies can invest
in any GFT including tires, aerodynamic equipment, truck replacement or also Eco Drive which result
in reduced GHG emissions. The performance risk of equipment is thereby with the investor i.e. trucking
company. A GHG baseline in terms of CO2/tkm is established upfront, validated externally and
approved by the government. The baseline and benchmark is thereby for the entire fleet i.e. fleet
improvements are monitored. Monitoring based on an established monitoring protocol (includes
basically fuel consumption and distance driven) is realized by the company and uploaded on an
Internet-based platform. External verification of data is based on automated statistical control
mechanisms as well as randomized spot verifications. Payments are based on absolute GHG emission

FINAL REPORT GREEN FREIGHT PROGRAM GRUTTER CONSULTING
42
reductions over a specified time-period of on average 5 years. The company gets (paid) advisory
services on actions with a mitigation potential but remains free on which activities to implement and
also finances with own resources or with own credits mechanisms their implementation. The result-
based finance is based on GHG reductions relative to the benchmark/baseline. The GHG rights are
thereby transferred to the Swiss government respectively other emitters with caps within the Swiss
domestic carbon trading system.
Basically companies invested in fleet renewal, LRRs, wide-based tires, Eco Drive and few in advanced
aerodynamic systems. On average the GHG payment covered more than the total differential
investment for LRRs and significantly more than 50% of the investment cost e.g. of aerodynamic
devices or of wide-based tires37.
To reduce transaction costs companies were pulled together into groups of 10-15 companies which
received common consulting, validation and verification services thus reducing advisory and
management costs and allowing also small companies with only 3-5 trucks to participate. Companies
acquired individually GFTs i.e. no group-payment scheme was realized. Also companies receive
payment and credits based on their individual performance and not based on group performance. The
group scheme was basically set up to allow for interchange of experiences and for reducing costs of
verification and consulting services.
More than 100 trucking companies have been involved in this scheme in Switzerland since 2010.
6.3.4. Climate Finance
Various GFPs have been financed with the justification of climate change. This holds true of various
national initiatives (e.g. US EPA), the GEF/World Bank Guangdong GFP or the Mexican GFP co-financed
by the Climate Technology Fund (CTF, 50 MUSD) and the World Bank (50 MUSD). The CTF thereby used
as benchmark for interventions in this area a value of 20 USD/tCO238. However, this is not result-based
finance but based on ex-ante estimates of abatement costs.
No CDM (Clean Development Mechanism) or VCS (Verified Carbon Standard) project with GFTs has
been registered. However as previously mentioned a domestic Swiss program has included more than
100 trucking companies with result-based finance based on GHG emission reductions.
No Nationally Appropriate Mitigation Action (NAMA) has yet been funded or has been prepared for
freight. A unilateral NAMA in Colombia for the scrapping and replacement of trucks exists (it was
formulated as a NAMA to evidence Colombian commitment to climate change but the program was
already in operation prior NAMA formulation). In Mexico GIZ is preparing a NAMA for freight including
GFT measures.
Various windows exist for financing GFTs based on the climate impact including funds from multilateral
banks, the CTF, NAMAs as well as the Green Climate Fund (GCF) which has sustainable transport as
one of 4 core areas within mitigation projects. GHG reductions as well as the impact towards
sustainable development are thereby crucial. GF measures not only reduce fuel consumption but also
37 The payment per tCO2 offset was around 130 USD/tCO2 38 See Climate Investment Funds, CTF Investment Plan for Mexico: Phase II, 10/2013, p.52
FINAL REPORT GREEN FREIGHT PROGRAM GRUTTER CONSULTING
43
diesel exhaust ultrafine particles and Black Carbon. The Climate and Clean Air Coalition (CCAC) has for
example an initiative of “Reducing Black Carbon Emissions from Heavy Duty Diesel Vehicles and
Engines”39 as BC is a significant driver of climate change, especially in the short-term, and particle
emissions are a major air pollution problem. Diesel exhaust emissions are thereby a major factor of BC
emissions. A GFP therefore fits well within national and international strategies to combat climate
change and air pollution.
A financial structuring could be based around a Green Freight Fund which gives grants and technical
assistance to GF technologies and activities. Grant elements of such a fund could be phase out within
a period of 3-5 years. The structure for such a fund could be established within a NAMA with finance
e.g. from the GCF.
39 http://www.unep.org/ccac/Initiatives/ReducingEmissionsFromHeavyDutyDiesel/tabid/133573/Default.aspx
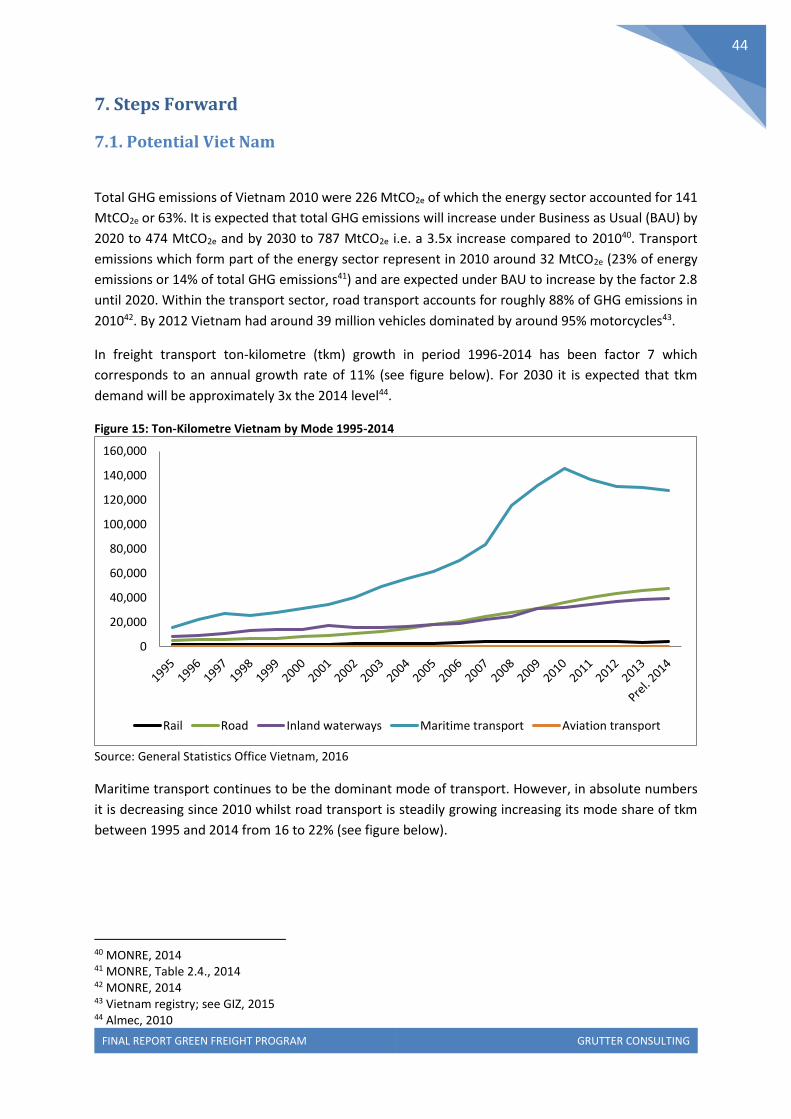
FINAL REPORT GREEN FREIGHT PROGRAM GRUTTER CONSULTING
44
7. Steps Forward
7.1. Potential Viet Nam
Total GHG emissions of Vietnam 2010 were 226 MtCO2e of which the energy sector accounted for 141
MtCO2e or 63%. It is expected that total GHG emissions will increase under Business as Usual (BAU) by
2020 to 474 MtCO2e and by 2030 to 787 MtCO2e i.e. a 3.5x increase compared to 201040. Transport
emissions which form part of the energy sector represent in 2010 around 32 MtCO2e (23% of energy
emissions or 14% of total GHG emissions41) and are expected under BAU to increase by the factor 2.8
until 2020. Within the transport sector, road transport accounts for roughly 88% of GHG emissions in
201042. By 2012 Vietnam had around 39 million vehicles dominated by around 95% motorcycles43.
In freight transport ton-kilometre (tkm) growth in period 1996-2014 has been factor 7 which
corresponds to an annual growth rate of 11% (see figure below). For 2030 it is expected that tkm
demand will be approximately 3x the 2014 level44.
Figure 15: Ton-Kilometre Vietnam by Mode 1995-2014
Source: General Statistics Office Vietnam, 2016
Maritime transport continues to be the dominant mode of transport. However, in absolute numbers
it is decreasing since 2010 whilst road transport is steadily growing increasing its mode share of tkm
between 1995 and 2014 from 16 to 22% (see figure below).
40 MONRE, 2014 41 MONRE, Table 2.4., 2014 42 MONRE, 2014 43 Vietnam registry; see GIZ, 2015 44 Almec, 2010
0
20,000
40,000
60,000
80,000
100,000
120,000
140,000
160,000
Rail Road Inland waterways Maritime transport Aviation transport

FINAL REPORT GREEN FREIGHT PROGRAM GRUTTER CONSULTING
45
Figure 16: Ton-Kilometre Mode Share 1995 and 2014
Source: General Statistics Office Vietnam, 2016
Considering only volume of freight, road transport dominates with 77% of all transported freight
volume45. Maritime transport has however a much higher average trip distance i.e. for long-distance
freight transport, the mode of choice in Vietnam remains maritime transport, also due to the long
coastal line of the country.
Vietnam’s Intended Nationally Determined Contribution (INDC) has as unconditional contribution a
reduction of GHG emissions compared to BAU by 2030 of 8% in which the emission intensity per unit
of GDP shall decline by 20% compared to 2010 levels46.
Within the INDC as example the implementation of vehicle maintenance is included as mitigation
option47.
The potential GHG impact of a GF program depends basically on the number of trucks participating in
the program. A low scenario (25% of trucks participating) and a high scenario (50% of trucks
participating) has been modelled. The following table shows the projected GHG reductions annually in
tCO2 by 2030.
Table 20: Annual Potential GHG Reductions of GFP by 2030 in tCO2e (WTW incl. BC)
Option Value (low to high)
Operational measures (technical options and Eco Drive) 600,000-1,200,000
Operational measures plus Diesel Particle Filter 900,000-1,800,000
Operational measures + DPF + increase of average GVW by 5t48 1,100,000-2,200,000
Source: All calculations by Grütter Consulting (tkm data based on road-based tkm projections of JICA)
7.2. Potential Lao PDR
According to Lao PDR Second National Communication, total GHG emissions in 2000 were 50 MtCO2eq,
of which the energy sector accounted for 2% of the total GHG emissions. Within the energy sector
45 GSO, 2016 46 Government of Vietnam, 2015 47 http://www4.unfccc.int/submissions/indc/Submission%20Pages/submissions.aspx 48 assuming constant average load factor per tkm
6%
16%
28%
50%
0%1995
2%
22%
18%58%
0% 2014
Rail
Road
Inlandwaterways
Maritimetransport
Aviationtransport

FINAL REPORT GREEN FREIGHT PROGRAM GRUTTER CONSULTING
46
transport is responsible for around 50% of emissions49. However, transport-related CO2 emissions are
increasing rapidly from around 650,000 tCO2 in 2001 to 2.2 million tCO2 in 201150. The major sources
of emission are from trucks and light commercial vehicles. This data also matches calculations based
on reported gasoline and diesel transport consumption values of 201451 which result in GHG transport
emissions for the year 2014 of 2.3 MtCO2. It is projected that transport sector emission will reach nearly
4 million tCO2 by 2020 and 6.3 MtCO2 in 2030.
Figure 17: Projected CO2 Emissions of the Transport Sector
Source: Almec, 2012
Road transport dominates the transport systems in Lao PDR. Road transport represents 95% of total
passenger-kilometres travelled and 88% of freight-kilometres travelled 52. Transport activities for both
passengers and freight have grown rapidly during 2005-2010. Freight transport has increased from 260
to 510 million tkm, which represents an almost double (97%) increase within 5 years.
In 2011, there were around 200,000 cars, 900,000 motorcycles and 26,000 other vehicles (trucks,
buses, trailers, three wheelers). In 2030, it is projected that the total number of motor vehicles in the
country will increase to almost 2 million vehicles53.
According to Lao PDR’s INDC (2015)54, the country intends to undertake a number of mitigation actions
to reduce its future emissions, subject to provision of international support. However, the INDC does
not provide any specific target.
The following table shows the potential GHG reductions of a GFP annually in tCO2 by 2030.
49 As electricity in Laos is generated almost 100% from hydropower, emission from energy generation is almost negligible. 50 Almec, 2012 51 Ministry of Energy and Mines, 2015 52 Almec, 2012 53 Almec, 2012. 54 MONRE, 2015

FINAL REPORT GREEN FREIGHT PROGRAM GRUTTER CONSULTING
47
Table 21: Annual Projected GHG Reductions of GFP by 2030 in tCO2e (WTW incl. BC)
Option Value (low to high)
Operational measures (technical options and Eco Drive) 8,000-17,000
Operational measures plus Diesel Particle Filter 11,000-22,000
Source: All calculations by Grütter Consulting
Emission reductions are thus in a relatively low range due to the limited number of trucks and freight movement in Lao PDR with around 20-20,000 tCO2e reduced per annum.
7.3. Potential Measures and Approaches
Implementation of efficiency measures which have a small and hardly felt impact but a clear additional
upfront cost are difficult to implement on a widespread base. In the following section strategies are
outlined which are considered to be the most promising to be able to reap the GHG and environmental
benefits as well as the financial advantages of GFTs.
For Eco Drive the path proposed is to include Eco drive components in the compulsory curricula for
driver training. This path is being followed in both countries due to active support of the project. A
curricula adapted to national circumstances and needs has been developed and the national
authorities are including core Eco drive elements in the curricula for driver training. This path has been
followed by many other countries worldwide with good success. Continuous feedback and an incentive
system or telematics are however required to reap the full potential of Eco Drive.
For LRRs the most promising pathway is considered to have national regulations concerning CORs of
tires. Within the EU regulations exist which specify minimum requirements for COR. The current
requirements are a maximum of 8.0 kg/t for tires sold after 1.11.2016 and maximum 6.5 kg/t for new
type approvals of tires (for tires sold this value will be enforced from 1.11.2020 onwards). The EU also
introduced a standardised tire label including energy efficiency based on the COR, wet grip and noise,
effective as from the year 2012. As first step an energy efficiency label comparable to the well-known
energy labels of consumer goods can be introduced, followed by compulsory or market based
performance standards for tires. This allows for a widespread market penetration of high-efficient tires
and is a cost-effective approach.
For other GFTs such as aerodynamic devices, Diesel Particle Filters (DPFs) to reduce PM and thereby
BC, usage of low-carbon trucks and fuels as well as other measures a GF climate finance fund could be
implemented which reduces upfront costs of such technologies based on their GHG impact thereby
increasing significantly the attractiveness of GFTs. Such a climate fund could be coupled with technical
assistance as well as dissemination of best practices. The fund could be financed on a non-
reimbursable manner through climate funds based on the social cost of carbon. Comparable funds
have been successful in the transportation industry e.g. in the promotion of low-carbon buses:
examples are the Green Bus Fund of the UK or Chinese funds for hybrid and electric units which could
be downsized or completely phased out after a short time and created a transformational impact in
promoting new technologies.
For logistics a possible pathway is the increased usage of telematics combined with carbon tracking
and the increased penetration of green logistics and low carbon transport resulting in a demand for

FINAL REPORT GREEN FREIGHT PROGRAM GRUTTER CONSULTING
48
improved logistics more sensitive towards GHG emissions. This can increase the attractiveness of
platforms and other means to increase the load factor of trucks.
Other measures which could also be explored further include the usage of larger trucks with more
payload thereby reducing GHG emissions per tkm and improving traffic fluidity thereby reducing stop
and go traffic and increasing the average speed of trucks. Also the establishment of fuel consumption
standards for new trucks, as introduced e.g. in the US, is a pathway worth exploring.

FINAL REPORT GREEN FREIGHT PROGRAM GRUTTER CONSULTING
49
8. Implementation Experience
The following points summarize the main project implementation experiences.
Localize the Project
Local driving circumstances, especially speed, are very important. Experiences from international,
especially US or European GF programs are only partially valid as speeds driven vary considerably
resulting in no impact of various GFTs e.g. most aerodynamic equipment (see figure below for average
speeds).
Figure 18: Average Driving Speeds Long-Haul Trucks Viet Nam and Lao PDR
Source: Grütter Consulting based on GPS measurements during various months Average driving speeds for long-haul trucks were in both countries around 40km/h whilst in the US the
average on high-ways is 90km/h55. The figure below shows the implications for any aerodynamic
equipment.
Figure 19: Power Required to Overcome Aerodynamic Drag at Different Speeds
Source: F. Browand, USC Viterbi, Reducing Aerodynamic Drag and Fuel Consumption, 2005
55http://www.statista.com/statistics/195100/average-operating-truck-speed-on-selected-us-interstate-
highways/
0
10
20
30
40
50
60
km/h

FINAL REPORT GREEN FREIGHT PROGRAM GRUTTER CONSULTING
50
Also idling fuel losses are very much higher in the US or Europe due to truck cabins equipped with
many devices and due to sleeping in cabins with AC whilst in Viet Nam or Lao PDR truck cabins are less
equipped, AC is not commonly used and often drivers do not sleep in cabins.
GF programs therefore need to be adapted to local circumstances.
Availability of Technologies
Availability of low-cost efficient tires is in general not given. Only high quality brands such as Michelin
or Bridgestone offer LRRs. These are however high price brands. The majority of truck tires used are
however low cost brands or re-treaded tires. The absolute price difference between a commonly used
tire and a LRR is therefore significant (around double) due primarily to brand differences (the average
difference between same brand LRR and conventional tire is only 40-50 USD per tire). This limits the
application of LRRs due to limited market availability. Also in many countries truckers still use tube
tires whilst LRR tires are basically for tubeless tires requiring an additional investment in rims. Tube
tires are preferred by many truckers as they are cheaper and allow for overloading with less potential
of blow-outs.
Low technology availability can result therefore in significant additional GFT costs.
Fuel Monitoring and Fuel Management by Companies
The majority model used for “fuel management” by trucking companies in both countries is to pay
drivers a fixed allowance for fuel based on the trip realized56. This avoids fuel stealing or haggling with
drivers. The down-point is that reliable fuel consumption data lacks and that companies are not very
interested in fuel saving technologies as they have to pay the additional investment but the savings
are pocketed by the driver. This creates a significant barrier for monitoring GF programs and for
creating interest for implementing measures. This situation might change in the future with more
telematics included in trucks and with electronic fuel payment. However, as of today it constitutes a
significant barrier towards monitoring and adoption of GFTs, especially of smaller and less organized
companies.
Load Measurement
Data on actual load factor per goods type and direction are important to identify promising logistics
improvement options. Empty backhaul numbers are often exaggerated and not put into context with
potentially asymmetric good flows thus overestimating improvement potentials. Again, international
bets practice needs to be contrasted with local circumstances and this involves collection of primary
data as latter is often not available to assess the current situation in a detailed manner.
Trucks lack telematics to monitor actual weight. Monitoring per tkm, which would be optimal for
tracking GHG efficiency, is therefore hardly possible. Data from companies and freight documents have
proven to be unreliable and not precise enough. Therefore, installation of weight in-motion equipment
which automatically weights truck tonnage would be advisable. Typically, such equipment reads
pressure and strain changes in the rig's air or mechanical suspension systems. Tiny sensors are
56 In various trucks the driver dismantled the installed equipment for fuel measurement indicating that it hindered truck performance. The equipment has no incidence on truck performance but obviously the driver feared that knowledge over actual fuel consumption would result in reducing his payment for fuel.

FINAL REPORT GREEN FREIGHT PROGRAM GRUTTER CONSULTING
51
mounted to the suspension of the tractor or trailer. Weight measurement accuracy is within 0.3 to 2%
of the gross vehicle weight.
Figure 20: Weight in-Motion Equipment
Source: http://www.truckweight.com/manuals.html
On the other hand, the experience has also been made that over various months, average load factors
remain fairly constant and therefore monitoring approaches using long enough periods and using only
data of fuel efficiency per kilometre are sufficiently reliable.
Usage of telematics which provide continuous data on actual load factors can be used for monitoring
as well as for logistics data (combined with freight papers to identify goods transported). However,
such equipment can be costly, is locally not available and companies have currently little incentive to
install such equipment (the major reason in some countries to install such equipment is for load
tracking and safety reasons i.e. to be advised of unplanned off-loading).
Measurement
Reliable and local data over the impact of GF measures is scarce. Measurements are either not made
at all, without adequate equipment, with a to small sample of units or with a faulty methodological
approach. As example US Smart Way is often used to project GF potentials thereby largely overstating
e.g. the impact of aerodynamic devices due to differing vehicle speeds and traffic circumstances.
Another example is Eco Drive where often the improvement values of training courses are taken which
are of limited value. The program has proven to be effective in designing and implementing a high-
quality GFT measurement system thereby producing local impact data of value also for other GF
interventions.
Monitoring
The monitoring approach based on comparison before-after has proven to be the most reliable
approach. The test-run can be very standardized. However, variations between routes, trucks, drivers
and driving circumstances make the result of just one test-run of little validity. The method of
comparing project with reference trucks is complex. Inherent differences (external to the technology
applied) exist between trucks (even of the same brand and make) and drivers. Therefore, such an
approach is only valid if measurements of both trucks are also made sufficient time before installing
any equipment to identify the difference of fuel consumption between both trucks already before. This

FINAL REPORT GREEN FREIGHT PROGRAM GRUTTER CONSULTING
52
approach allows to separate the external fuel usage difference from project induced differences (see
following graph as example). The most reliable approach is however considered to be the comparison
before-after. However, this requires sufficient time (best 3-6 months) of monitoring before installing
equipment and thereafter to filter out standard monthly variations.
Figure 21: Comparison Project and Reference Truck
Source: Grütter Consulting; example of two identical trucks; project truck equipped with aerodynamics The example in the figure above shows that if only a comparison had been made between the
reference and the project truck after installation of the equipment (months 2-7) there would have
been no measurable impact of the aerodynamic device. However, the truck where the aerodynamic
device was installed had in the months prior installation (summarized under “1” in the figure above) a
significantly higher fuel consumption than the reference truck. Therefore, an approach using reference
trucks needs to include a measurement already prior installation of equipment.
0
10
20
30
40
50
60
1 2 3 4 5 6 7
l/1
00
km
project truck LRR reference truck LRR
prior installation

FINAL REPORT GREEN FREIGHT PROGRAM GRUTTER CONSULTING
53
References
ADEMA, Freight Transport Action Forms, 2012
Almec Corp. et.al., The Comprehensive Study on Sustainable Development of the Transport System in Vietnam
VITRANSS 2, 2010
T. Anh Duong, MOT, Emission Mitigation and Sustainable Transport Policies in Viet Nam, 2013
W. Appel et.al., Nutzfahrzeugtechnik, 2013
Argonne National Laboratory, Analysis of Technology Options to Reduce the Fuel Consumption of Idling Trucks,
2000
J. Barkenbus, Eco-driving: An overlooked climate change initiative, Energy Policy 38 (2010), 762-769
Beusen, B. et. al., Using on-board logging devices to study the longer-term impact of an eco-driving course.
Transportation Research Part D: Transport and Environment, 14, 514-520, 2009
Bond et.al., Bounding the Role of Black Carbon in the Climate System: A Scientific Assessment. Journal of
Geophysical Research. doi:10.1002/jgrd.50171, 2013
Bond et. al, Historical Emissions of Black and Organic Carbon Aerosol from Energy-related Combustion, 1850-
2000. Global Biogeochemical Cycles 21 (2): GB2018, 2007
F. Bowand, Reducing Aerodynamic Drag and Fuel Consumption, USC Viterbi, 2005
M.J. Bradley & Assoc., Reducing Aerodynamic Drag and Rolling Resistance from Heavy-Duty Trucks: Summary
of Available Technologies and Applicability to Chinese Trucks, 2012
CAI-Asia, Guangdong Green Freight Demonstration Project Phase I Technology Demonstration Evaluation,
presentation by Lu Fu, 06/2014
CAI-Asia, Green Freight China Program: technology Verification Review for Freight Transport Sector, 2011
CAI-Asia, Design of Green Freight China Program: Program Design Report, 2011
CAI-Asia, Design of Green Freight China Program: Review of Freight Logistics Solutions, 2011
CAI-Asia, Guangzhou Green Trucks Pilot Project: technology Pilot Report for the World Bank “Truck GHG
Emission Reduction Pilot Project”, 2010
CAI, Driver Training Course Guangzhou, China 2009
California Energy Commission, Full Fuel Cycle Assessment Well to Tank Energy Inputs, Emissions, and Water
Impacts, 2007
Carbon War Room, Road Transport: Unlocking Fuel-Saving Technologies in Trucking and Fleets, 2012
Cascade Sierra Solutions, Annual Report 2010
H. Chaari et.al., Fuel Consumption Assessment in Delivery Torus to Develop Eco Driving Behaviour, Association
for European Transport and Contributors, 2012
Climate Investment Funds, CTF Investment Plan for Mexico: Phase II, 10/2013

FINAL REPORT GREEN FREIGHT PROGRAM GRUTTER CONSULTING
54
COPERT model; Corinair Emission Inventory Guidebook / EMEP/EEA Emission Inventory Guidebook 2013
updated 09/2014
Cummins MPG Guide, Secrets of Better Fuel Economy
Delphi, Assessment of Fuel Economy Technologies Medium- and Heavy-Duty Vehicles: An Overview of the
National Academies Studies, 2011
Department for Transport, Freight Best Practice Case Studies, 2010
DfT, Freight Consolidation Centre Study, 2010
N. Dong Phong, Vietnam Register, Vietnam Fuel Economy Initiative, 2013
Ecowill, Identification of potential benefits for relevant target groups and recommendations how to influence
target groups behavioural change in order to enhance ecodriving activity, 2010
Ecowill, Guidelines for delivering Short-Duration Ecodriving Training courses, 2011
Ecowill, Quality Control and Certification, 2011
Ecowill, Harmonised Ecodriving Curriculum for Driving School Education and Driver License Testing, 2012
Ecowill, Short Duration Training Handbook for Trainers, 2012
Ecowill, Ecodriving in Learner Driver Education Handbook for Driving Instructors, 2012
FORS, Idling gets you nowhere: a procurement guide for anti-idling technology
GIZ, Analysis of Climate Finance Policies and Innovative Finance Mechanisms in Guangdong, 2014
Government of Vietnam, Vietnam’s Intended Nationally Determined Contribution, 2015
D. Van Hiep et.al, Towards Sustainable Transportation through Introduction of Eco-Drive Management System
for Vehicle Fuel Efficiency, Proceedings of the Eastern Asia Society for Transportation Studies, Vol. 9, 2013
D. Hornung, et.al: Evaluation of the Eco-Drive‚ courses; in response to a commission from the Swiss Federal
Office of Energy, 2000
ICCT, The U.S. Supertruck Program, 2014
IFEU, GHG impact Assessment for Energy Labelling of Heavy-Duty Truck Tires and a related Phase-Out Scheme
in the European Union, 2015
IPCC, Guidelines for National GHG Inventories, 2006
J. James, Maintaining the Habit when Training is Over, Freight Best Practice, Department for Transport, UK,
2007
JICA, The comprehensive study on logistics system in Lao People’s Democratic Republic, 2011
Joint Research Centre (JRC) -EUCAR-CONCAWE collaboration, Well-to-Wheels Analysis of Future Automotive
Fuels and Powertrains in the European Context Version 3c, 2011 (used by EU RED)
A. McKinnon et.al., The potential for reducing empty running by trucks: a retrospective analysis

FINAL REPORT GREEN FREIGHT PROGRAM GRUTTER CONSULTING
55
Lao People’s Democratic Republic, Ministerial Decree on the Approval of Maximum Gross Weight of Truck,
26/09/2013
A. Leshchynskyy, Under-utilisation of road freight vehicle capacity, 2013
LLC, Assessment of Direct and Indirect GHG Emissions Associated with Petroleum Fuels, 2009
K. Lovejoy et.al, Policy Brief on the Impacts of Eco-driving Based on a Review of Empirical Literature, 2013
Jeff Major, Draft report: Country Summary and Priority Funding Model Lao PDR and Viet Nam and Concept
Note Green freight “ESCO”, 2014
C. Mantero et.al., Eco Drive in Large Fleet: City: Funchal; Project: CIVITA-MIMOSA; CIVITAS (Cleaner and better
transport in cities; an initiative co-financed by the EU), 2013
Ministry of Natural Resources and Environment, National Rio+20 Report for Lao PDR, 2012
Ministry of Natural Resources and Environment, Strategy on Climate Change Of the Lao PDR (SCC),
presentation at the side event “Toward the Establishment the Bilateral Offset Credit Mechanism (BOCM) –
Utilisation to Support the NAMA Implementation”, 2011
Ministry of Transport of Viet Nam, Circular on Driver Training, Driving Tests, and Issuance of Driving Licenses,
07/11/2012
MONRE, Technical Report: Vietnam’s Intended Nationally Determined Contribution, 2015
MONRE, The Initial Biennial Updated Report of Vietnam to the UNFCCC, 2014
MONRE and MOT, Towards Development of Strategic Directions for the Promotion of Environmentally
Sustainable Transport in Vietnam by 2020, 2012
MONRE, Vietnam’s Second National Communication to the UNFCCC, 2010
NACFE, Barriers to Increased Adoption of Fuel Efficiency Technologies in Freight Trucking, 2013
National Research Council Canada, Review of Aerodynamic Drag Reduction for Heavy Trucks and Buses
NESCCAF, Reducing Heavy-Duty Long Haul Combination Truck Fuel Consumption and CO2 Emissions, 2009
Öko-Institut e.V., Konventionelle und alternative Fahrzeugtechniken bei Pkw und schweren Nutzfahrzeugen –
Potenziale zur Minderung des Energieverbrauchs bis 2050, 2014
P. Paganelli et.al, Intelligent Cargo in Efficient and Sustainable Global Logistics Operations, 2012
M. Panero et.al., Urban Distribution Centers: A Means to Reducing Freight Vehicle Miles Travelled, 2011
QAED, Summary: Evaluation of Eco-Drive Training Courses, Zürich, 2004
A. Rakotonirqainy et.al., Research issues in Eco-driving, http://www-
esv.nhtsa.dot.gov/Proceedings/22/files/22ESV-000146.pdf
Ricardo, Review of Low Carbon Technologies for Heavy Goods Vehicles, 2009
Rocky Mountain Institute, Truck Efficiency and GHG Reduction Opportunities in the Canadian Truck Fleet
Scott Wilson Ltd, Freight Consolidation Centre Study, 2010
FINAL REPORT GREEN FREIGHT PROGRAM GRUTTER CONSULTING
56
Smart Freight Centre, State of Play: Green freight in Asia, 2014
H. Strömberg et.al., Comparative effects of eco-driving initiatives aimed at urban bus drivers - Results from a
field study, Transportation Research Part D, vol. 22, pp. 28-33, 2013
TIAX, Technologies to Improve Fuel Efficiency of Heavy Duty Trucks, 2006
TML, GHG-TransPoRD, Ranking of ,measures to reduce GHG emissions of transport: reduction potentials and
feasibility qualification, 2010
Union of Concerned Scientists, Big Rigs, Big Oil Savings: technologies to reduce heavy-duty track fuel use and
emissions
US DOE, 21st Century Truck Partnership, Roadmap and Technical White Papers, 2006
US DOE, GREET: The Greenhouse Gases, Regulated Emissions, and Energy Use in Transportation Model Version
GREET1 2012 rev2 http://greet.es.anl.gov/
US EPA, SmartWay Fuel Efficiency Test Protocol for Medium and Heavy Duty Vehicles, 2007
US EPA, Greenhouse Gas Emissions Standards and Fuel Efficiency Standards for Medium- and High-Duty
Engines and Vehicles, 2011
Vanner, Worksite Idle Reduction, 2014
VITRANSS 2, The Comprehensive Study on Sustainable Development of Transportation System in Vietnam,
2010 (prepared by Almec for JICA and MOT)
Wahlberg, Long-term effects of training in economical driving: Fuel consumption, accidents, driver acceleration
behavior and technical feedback, International Journal of Industrial Ergonomics 37 (2007), 333–343
WEF, Supply Chain Decarbonization, 2009
F. Wittmeier, Aerodynamische LKW, 2013
World Bank, Engaging the Private Sector in Transport and Logistics Planning and Policy Making; Options for
Vietnam, 2015
World Bank, Reducing Black Carbon Emissions from Diesel Vehicles: Impacts, Control Strategies, and Cost-
Benefit Analysis, 2014
World Bank, Efficient Logistics: A Key to Vietnam’s Competitiveness, 2014
World Bank, Trade Facilitation, Value Creation, and Competitiveness: Policy Implications for Vietnam’s
Economic Growth, 2013
World Bank, Vietnam Urbanization Review, 2011


