Embed Size (px)
Citation preview

i
Viet Nam’s rapid economic development in the last two decades has not been without cost to its natural resources. Water and air quality, for instance, have stagnated or deteriorated. The Government has since promulgated new legislation and embarked on programs and projects to address the adverse environmental impact of development. This national environmental performance assessment (EPA) report is the country’s first attempt to systematically document the effectiveness of these measures.
This EPA report is part of the National Performance Assessment and Subregional Strategic Environment Framework (SEF II) project spearheaded by the Asian Development Bank (ADB) and the United Nations Environment Programme (UNEP). The overall goal of SEF II is to promote sustainable Development in the Greater Mekong Subregion (GMS) by (i) helping individual governments to assess the progress of environmental management, (ii) promoting a continuous environment/development policy dialogue within the countries and the subregion, and (iii) encouraging greater accountability for better environmental management.
Based on extensive consultations with various stakeholders, seven environmental concerns were ranked as top priorities: inland water pollution, air pollution from mobile sources, inadequate solid waste management, forest resources, threats to biodiversity, threats to coastal zone, and climate change. These priority concerns were assessed according to the pressure-state-response (P-S-R) model, which identifies the principal sources of pressure (P) on the variable under assessment, the resulting state (S), and the responses (R) adopted to influence the pressure and state.
The report consists of three main parts. Part I assesses performance under the priority concerns chosen. Part II discusses the crosscutting development issues, i.e., those elements that affect overall environmental performance of the country without necessarily neatly falling under any one of the selected concerns. Part III draws overall conclusions and recommendations for the national EPA report. It contains a summary of where the country stands in terms of its current performance under the chosen concerns and what additional efforts are recommended for the next stage to improve the process.
Clearly, the report is of great national significance not just in enhancing local capacity for conducting EPAs but more importantly, in influencing decision making and future planning in the area of environment management and protection.
Dr. Truong Manh TienDirector GeneralEnvironment DepartmentMinistry of Natural Resources and Environment
Foreword
ii
The completion of the National Environmental Performance Assessment (EPA) Report for Viet Nam would not have been possible without the valuable inputs and assistance of many individuals. A core team of international and national consultants prepared the initial and final draft of the report under the aegis of the Environment Department, Ministry of Natural Resources and Environment (MONRE) led by Truong Manh Tien and Nguyen Van Tai, National Focal Point and National Coordinator, respectively. We wish to thank international consultants Ivan Ruzicka, Kumar Mohit, and Mike Comeau and national consultants Nguyen Duc Minh, Nguyen Tuan Anh, and Nguyen Nhat Huy for their very significant work on the report.
Acknowledgement is also given to the many people and institutions who participated in the various consultations and workshops organized during the preparation of the report and provided feedback. This includes an EPA technical review team consisting of representatives and experts from MONRE, the Ministry of Science and Technology, Ministry of Agriculture and Rural Development, Hanoi Economic University, and Viet Nam National University.
The project was made possible through financial and technical support from the Asian Development Bank (ADB), the Global Environment Facility (GEF), the United Nations Environment Programme (UNEP), Institute for Global Environmental Studies (IGES) of Japan, and the National Institute for Environmental Strategies (NIES) of Japan. A note of thanks is given to Masami Tsuji and Herath Gutanilake, both ADB staffs, who provided valuable insight and support throughout the process of preparing this report. We are also grateful to Dr. Kanyawat Sriyaraj of GMS Environment Operations Center and Ms. Rachel Salazer for reviewing and editing this report resepectively. Finally, kudos to the team from UNEP who ably coordinated the management of the entire project on Strategic Environmental Framework for the Greater Mekong Subregion (SEF II): Surendra Shrestha, Yuwaree In-na and Tin Aung Moe.
Acknowledgment
iii
Table of ContentsFOREWORD ii
ACKNOWLEDGMENT iii
EXECUTIVE SUMMARY iv
ACRONYMS AND ABBREVIATIONS vi
I. INTRODUCTION 1
II. MANAGEMENT OF PRIORITY CONCERNS 8
2.1 INLAND WATER POLLUTION 8
2.2 AIR POLLUTION FROM MOBILE SOURCE 13
2.3 INADEQUATE SOLID WASTE MANAGEMENT 18
2.4 FOREST RESOURCES 23
2.5 THREATS TO BIODIVERSITY 30
2.6 THREATS TO COASTAL ZONES 35
2.7 CLIMATE CHANGE 39
III. ENVIRONMENT AND ECONOMIC DEVELOPMENT 41
IV. CONCLUSIONS AND RECOMMENDATIONS 49
4.1 INLAND WATER POLLUTION 49
4.2 AIR POLLUTION FROM MOBILE SOURCE 51
4.3 INADEQUATE SOLID WASTE MANAGEMENT 52
4.4 FOREST RESOURCES 53
4.5 THREATS TO BIODIVERSITY 54
4.6 THREATS TO COASTAL ZONES 54
4.7 CLIMATE CHANGE 55
APPENDIX 1. TEMPLATE AND GUIDELINES 2. INLAND WATER POLLUTION FACT SHEETS 3. AIR POLLUTION FROM MOBILE SOURCES FACT SHEETS4. INADEQUATE SOLID WASTE MANAGEMENT FACT SHEETS5. FOREST RESOURCES FACT SHEETS 6. THREATS TO BIODIVERSITY FACT SHEETS7. THREATS TO COASTAL ZONE FACT SHEETS8. CLIMATE CHANGE FACT SHEETS
iv
detailed yet simple and internally consistent regulatory provisions and efficient administration. Staff and financial resources available for effective implementation of environmental policies have consistently fallen short of what the intent of the policies would have required.
As to natural resource management, the forest cover has increased nationwide after years of decline. More work is required to assess the quality of this increased forest cover to relate it to variables such as biodiversity or soil conservation benefits. Coastal zone ecosystems have seen major changes linked to the rise of aquaculture and other developments leading to destruction of valuable coastal habitats like mangroves, sea grass and corals. There are indications of a gradual recovery of mangrove forest from the all-time lows recorded in 1995. Industrial and municipal issues continue to be dominated by the rising absolute volume of discharges and waste of all kinds, a situation where even improving percentages of waste recovery or disposal are not enough to reduce the absolute volumes discharged or left uncollected. As to global environmental concerns, Viet Nam has performed creditably with respect to protected areas. The compliance with formal obligations under United Nationas Framework Convention on Climate Change (UNFCCC) needs to be more firmly linked to efforts to increase domestic energy efficiency.
The EPA also identifies further research and data-collection needs to bridge the information gaps that have emerged in this study. Among other, a comprehensive water quality monitoring program under the aegis of the National Monitoring Network (NMN) should be undertaken for all the major rivers of Viet Nam with data collected on a regular basis at strategic locations. Similar data strengthening needs have been identified under other environmental concerns.
Executive SummarySince the launching of ‘doi moi’, the renovation policy, in 1986, Viet Nam has registered rapid advances in industrialization and economic growth in general. GDP growth rates averaged 7.5% throughout the 1990s. These achievements, however, have not been without cost as the natural environment—forests, biodiversity and coastal zones—came under additional pressure. Water and air quality and other parameters of urban environmental conditions have stagnated or deteriorated. Whilst the Government of Viet Nam (GOV) has promulgated new legislation and embarked on programs and projects to mitigate the environmental impact of urban and industrial expansion the effectiveness of these measures has been insufficiently discussed and probed. This environmental performance assessment (EPA) report is a first step towards systematically documenting the country’s performance under the most pressing environmental concerns. What is being assessed is the degree of success of all segments of the society, Government and non-government alike, in achieving performance targets contained in official strategic documents and plans.
Of the seven priority environmental concerns discussed in this report, Viet Nam has achieved notable progress in some and substantially less in others. Air and water quality, and waste management in particular have fallen short of targets and performance suffered from hesitant enforcement (e.g., in the case of wastewater pollution). Rising economic prosperity has seen a rapid increase in vehicle ownership in urban areas resulting in severe pollution from mobile sources. Poor regulatory, monitoring and enforcement framework has reduced the effectiveness of pollution control and management. GOV has promulgated sensible environmental laws and policies but has not always backed them up by
v
Strengthening of the regulatory framework along with budgetary and technical support to MONRE and DONREHs is critical to allow these agencies to perform their environmental management functions. Improved inter-agency coordination with sectoral ministries such as MARD, MOC and MPI is required to ensure that development projects are implemented in an environmentally sustainable manner.
vi
Acronyms and AbbreviationsDONREH Department of Natural Resources, Environment and Housing DCI Department of Culture and InformationEA Environmental AssessmentEIA Environmental Impact AssessmentEPA Environmental Performance AssessmentFDI Foreign Direct InvestmentFMAP Five Million ha Afforestation ProjectFIPI Forest Inventory and Planning InstituteGOV Government of Viet NamHCMC Ho Chi Minh CityLEP Law on Environmental ProtectionMARD Ministry of Agriculture and Rural DevelopmentMCI Ministry of Culture and InformationMONRE Ministry of Natural Resources and Environment (formerly MOSTE)MOSTE Ministry of Science Technology and Environment (former)MOST Ministry of Science and TechnologyMOET Ministry of Education and TrainingMOFI Ministry of FisheriesMOLISA Ministry of Labor, Invalids and Social Affairs MOI Ministry of IndustryMOND Ministry of National DefenseMPI Ministry of Planning and InvestmentNEA National Environment Agency (former)NMN National Monitoring NetworkNSEP National Strategy for Environmental ProtectionPPC People Provincial CommitteePM Particulate MatterODA Official Development Assistant SoE State of EnvironmentUNFCCC United Nations Framework Convention on Climate ChangeVEPA Vietnam Environment Protection Agency (after 2002)VSTI Vietnam Science and Technology Academy

vii
1
1
1 INTRODUCTION
1. Environmental performance assessment (EPA) is a systematic evaluation of the effectiveness of environmental management policies and protection measures in a defined administrative area (country, region, project, etc.) over a specific period. It builds on a pressure-state-response (P-S-R) model that links environmental ‘pressure’ factors to the state-of-the-environment variables under investigation and responses adopted to influence the outcomes. Supported by a purpose-built database, an EPA report draws a picture of principal environmental trends, assesses the degree of environmental managers’ success in achieving the set environmental targets and makes recommendations for improvement. In this way, EPA assists the process of policy adjustment and becomes a tool of public accountability. Furthermore, in the Greater Mekong Subregion (GMS) context, the preparation of EPA reports by each GMS member contributes to a shared understanding of environmental challenges and a greater comparability of underlying environmental trends.2. The present EPA report is the first of its kind to be written for Viet Nam. It examines developments under selected environment concerns over a period of time and the degree of success the national authorities have had in influencing environmental outcomes. The report is one of the six prepared to a similar format by each of the countries of the GMS. The Asian Development Bank (ADB), the Global Environment Facility (GEF), the United Nations Environment Program (UNEP), the Institute for Global Environmental
Studies (IGES) of Japan and National Institute for Environmental Studies (NIES) of Japan have provided financial and technical support for the National Performance Assessment and a Strategic Environmental Framework for the Greater Mekong Subregion (“SEF II”) Project under which the EPA reports were formulated.3. The report was prepared with the contribution of the following organizations and individuals:
Ministry of Natural Resources and Environment (MONRE) coordinators including: • Dr. Truong Manh Tien • Dr. Nguyen Van Tai • Mr. Nguyen Hoang Duc
National consultants and support staff including: • Dr. Nguyen Duc Minh - National consultant on environmental issues • Mr. Nguyen Nhat Huy - National consultant on environmental database • Mr. Nguyen Tuan Anh – Research Fellow - Research Center for Energy and Environment
4. EPA technical team reviewers included: • Dr. Nguyen The Chinh, Faculty of
Environmental Economics, Hanoi Economic University
• Dr. Nguyen Trung Thang, Ministry of Natural Resources and Environment
• Mr. Hoang Viet Cuong, Productivity Center, Ministry of Science and Technology
VIET NAM NATIONAL ENVIRONMENTAL PERFORMANCE ASSESSMENT
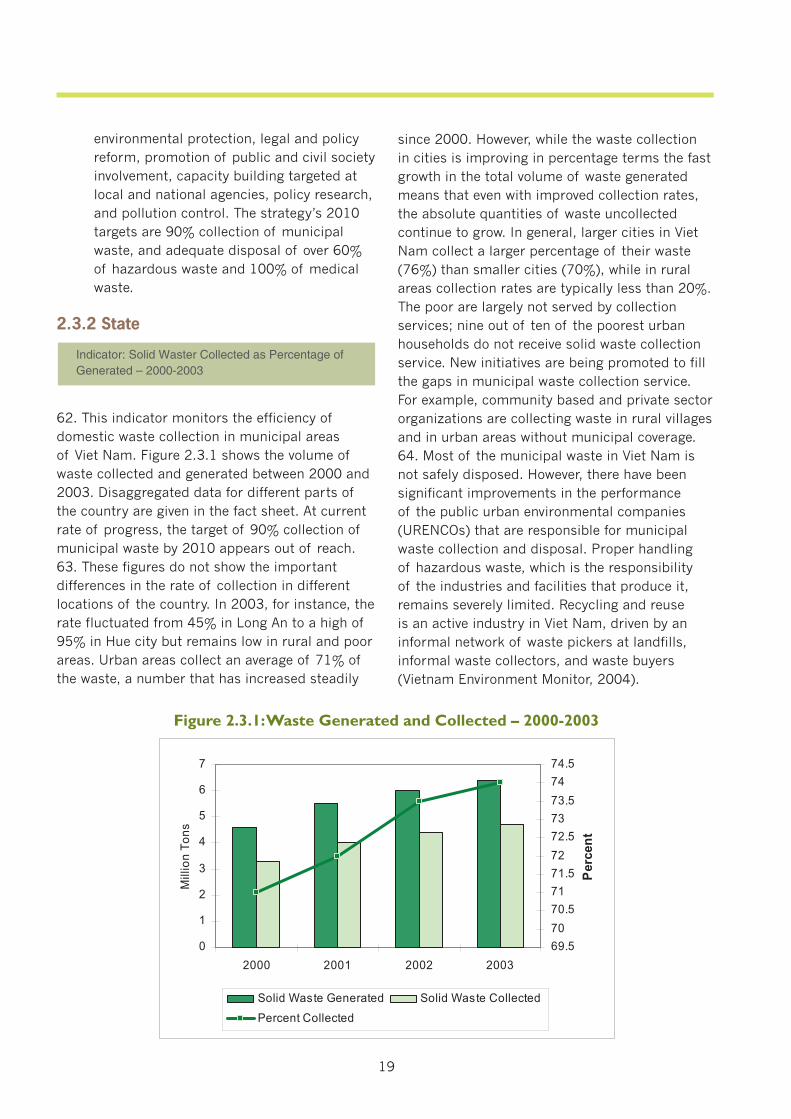
(EPA) REPORT
2
• Mr. Nguyen Huy Thang, Institute of Forestry Inventory and Planning, Ministry of Agriculture and Rural Development • Dr. Nguyen Xuan Hai, Soil Department, Viet Nam National University
5. The report was reviewed by the subregional expert group and international consultants and edited by Messrs. Mike Comeau, Mohit Kumar and Ivan Ruzicka.6. The process of selecting environmental priority concerns to be studied under the national EPA process was carried out in national workshops, held in September 2004 and January 2005, respectively. These workshops invited decision-makers from various national agencies, local nongovernment organizations (NGOs), and other stakeholders and members of the civil society with a stake in Viet Nam’s environmental protection.7. The First National Workshop identified seven (from a list of thirteen potential) environmental concerns viz., forest resources, land degradation, threats to coastal zones, threats to biodiversity, inland water pollution, pollution from mobile sources, and inadequate solid waste management. Through a process of consultation at the first national workshop and discussions held during the initial stages of the project, these seven issues were considered as priority concerns that required immediate attention. Subsequently, climate change was also adopted as an environmental concern given its global significance and the importance of reporting on actual performance to GEF, a key partner to the SEF II Project. The selection of the concerns tested the conditions for a meaningful assessment of performance such as availability of appropriate data, and presence of a clearly defined policy target or objective against which performance under the chosen concern can be assessed. 8. It was also agreed that other concerns that were not included at this stage of the EPA would be evaluated in future EPA reports. During the preparation of the EPA report, it was learnt that ‘land degradation’ was not supported by sufficient time series data to assess performance, and land degradation was excluded from the current stage of EPA reporting despite its intuitive importance.
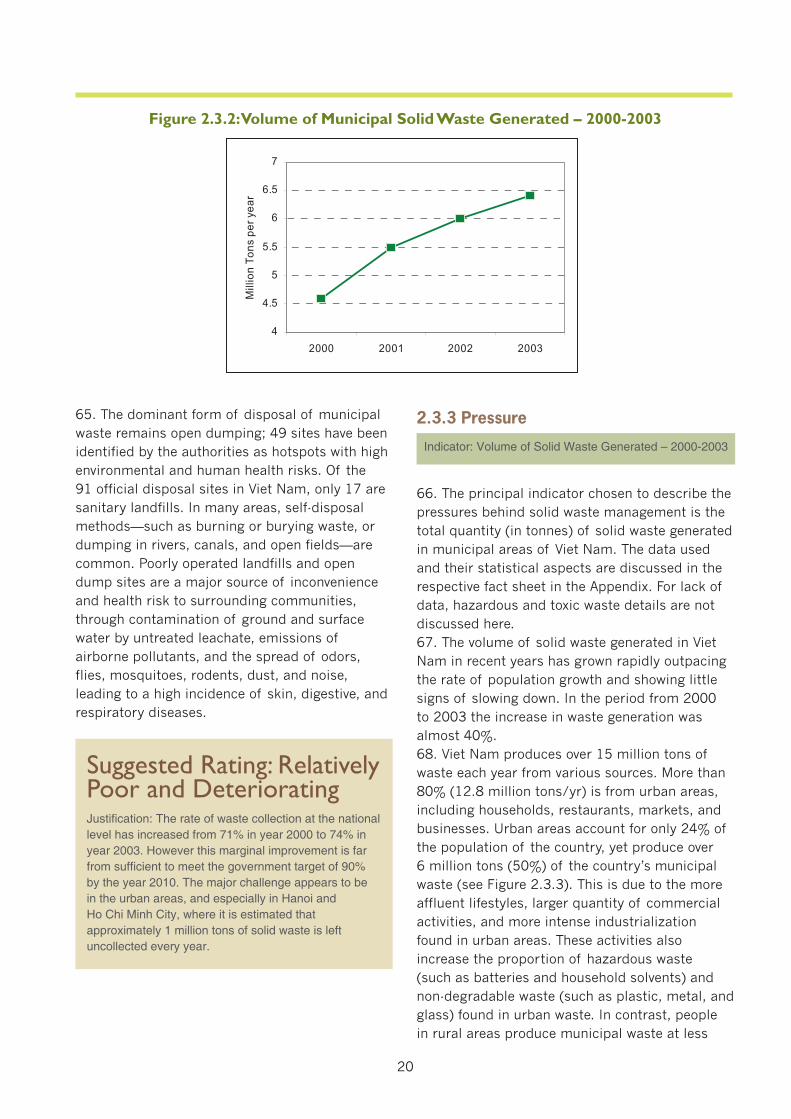
9. This EPA report is organized in three parts: • Part I assesses performance under the priority concerns selected. “Performance” is understood as an assessment of the observed outcomes against the targets set under that particular concern. The assessment is based on a Pressure-State-Response (P-S- R) mode that logically links the sources of environmental problems (the “pressure” factors) to the resulting “state” of the environmental concern, and the policy and institutional “responses” intended to influence the pressure factors, and through them, move the “state” towards the targets set. The most telling of the P, S, and R factors are chosen as environmental indicators. Their past trends and interplay are analyzed to say how effective the responses have been in improving the “state”. A rating structure developed for the purpose is used to evaluate the performance.
• Part II discusses the cross-cutting development issues, i.e., those elements that affect overall environmental performance of the country without necessarily neatly falling under any one of the selected concerns • Part III draws overall conclusions and recommendations for the national EPA report. It contains a summary of where the country stands in terms of its current performance under the chosen concerns and what additional efforts are recommended for the next stage to improve the process. • The Annex provides the statistical information (organized in the form of “fact sheets”) that supports the analysis in Part I and III of the EPA report.
The Assessment Method Used: The P-S-R model10. The P, S and R indicators’ values are the raw material of the EPA. The statistical background of each indicator is summarized in the form of indicator “fact sheets” and these are attached to the report to give the reader an opportunity to judge the underlying basis of the assessment.
3
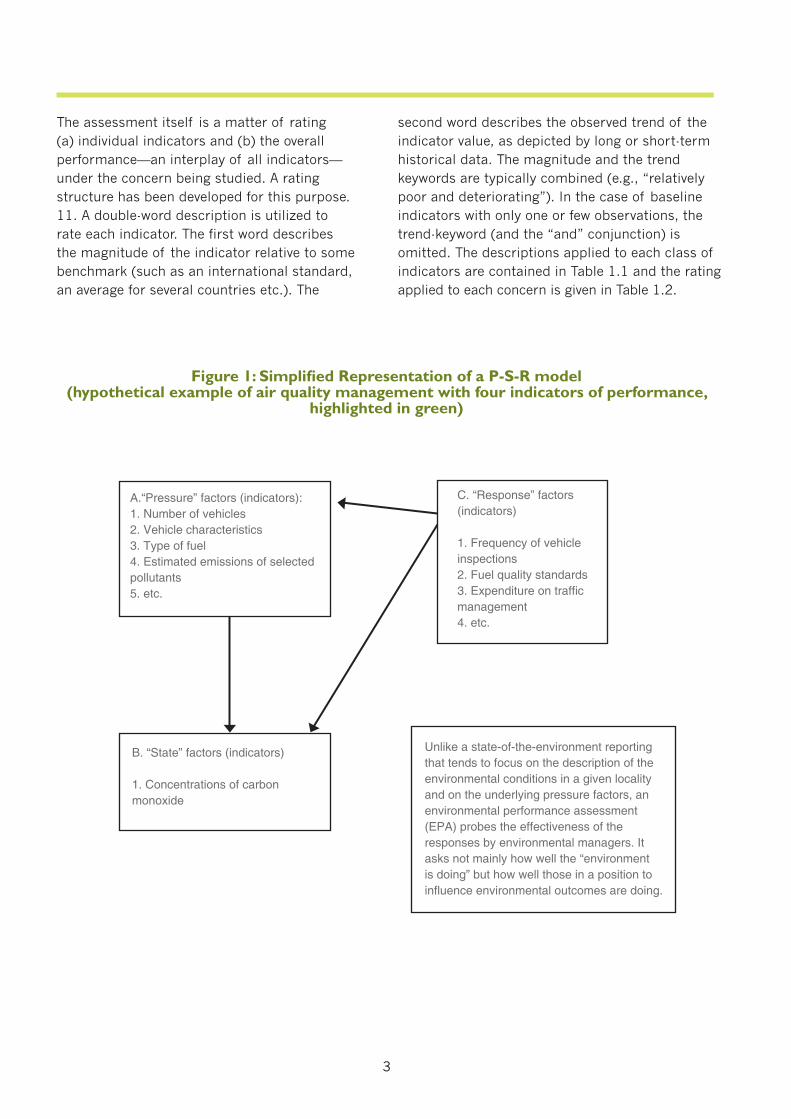
Figure 1: Simplifi ed Representation of a P-S-R model (hypothetical example of air quality management with four indicators of performance,
highlighted in green)
A.“Pressure” factors (indicators):1. Number of vehicles2. Vehicle characteristics3. Type of fuel4. Estimated emissions of selected pollutants5. etc.
B. “State” factors (indicators)
1. Concentrations of carbon monoxide
Unlike a state-of-the-environment reporting that tends to focus on the description of the environmental conditions in a given locality and on the underlying pressure factors, an environmental performance assessment (EPA) probes the effectiveness of the responses by environmental managers. It asks not mainly how well the “environment is doing” but how well those in a position to infl uence environmental outcomes are doing.
C. “Response” factors (indicators)
1. Frequency of vehicle inspections2. Fuel quality standards3. Expenditure on traffi c management4. etc.
The assessment itself is a matter of rating (a) individual indicators and (b) the overall performance—an interplay of all indicators—under the concern being studied. A rating structure has been developed for this purpose.11. A double-word description is utilized to rate each indicator. The first word describes the magnitude of the indicator relative to some benchmark (such as an international standard, an average for several countries etc.). The
second word describes the observed trend of the indicator value, as depicted by long or short-term historical data. The magnitude and the trend keywords are typically combined (e.g., “relatively poor and deteriorating”). In the case of baseline indicators with only one or few observations, the trend-keyword (and the “and” conjunction) is omitted. The descriptions applied to each class of indicators are contained in Table 1.1 and the rating applied to each concern is given in Table 1.2.
4
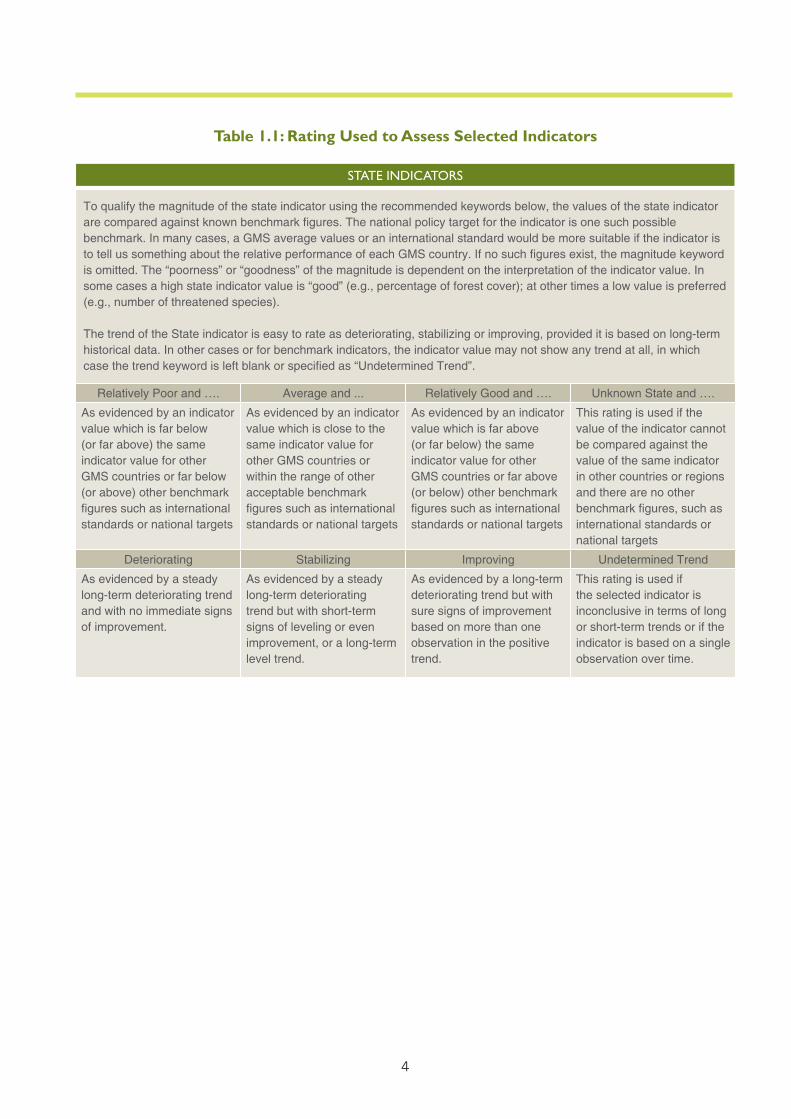
Table 1.1: Rating Used to Assess Selected Indicators
STATE INDICATORS
To qualify the magnitude of the state indicator using the recommended keywords below, the values of the state indicator are compared against known benchmark fi gures. The national policy target for the indicator is one such possible benchmark. In many cases, a GMS average values or an international standard would be more suitable if the indicator is to tell us something about the relative performance of each GMS country. If no such fi gures exist, the magnitude keyword is omitted. The “poorness” or “goodness” of the magnitude is dependent on the interpretation of the indicator value. In some cases a high state indicator value is “good” (e.g., percentage of forest cover); at other times a low value is preferred (e.g., number of threatened species).
The trend of the State indicator is easy to rate as deteriorating, stabilizing or improving, provided it is based on long-term historical data. In other cases or for benchmark indicators, the indicator value may not show any trend at all, in which case the trend keyword is left blank or specifi ed as “Undetermined Trend”.
Relatively Poor and …. Average and ... Relatively Good and …. Unknown State and ….
As evidenced by an indicator value which is far below (or far above) the same indicator value for other GMS countries or far below (or above) other benchmark fi gures such as international standards or national targets
As evidenced by an indicator value which is close to the same indicator value for other GMS countries or within the range of other acceptable benchmark fi gures such as international standards or national targets
As evidenced by an indicator value which is far above (or far below) the same indicator value for other GMS countries or far above (or below) other benchmark fi gures such as international standards or national targets
This rating is used if the value of the indicator cannot be compared against the value of the same indicator in other countries or regions and there are no other benchmark fi gures, such as international standards or national targets
Deteriorating Stabilizing Improving Undetermined Trend
As evidenced by a steady long-term deteriorating trend and with no immediate signs of improvement.
As evidenced by a steady long-term deteriorating trend but with short-term signs of leveling or even improvement, or a long-term level trend.
As evidenced by a long-term deteriorating trend but with sure signs of improvement based on more than one observation in the positive trend.
This rating is used if the selected indicator is inconclusive in terms of long or short-term trends or if the indicator is based on a single observation over time.
5
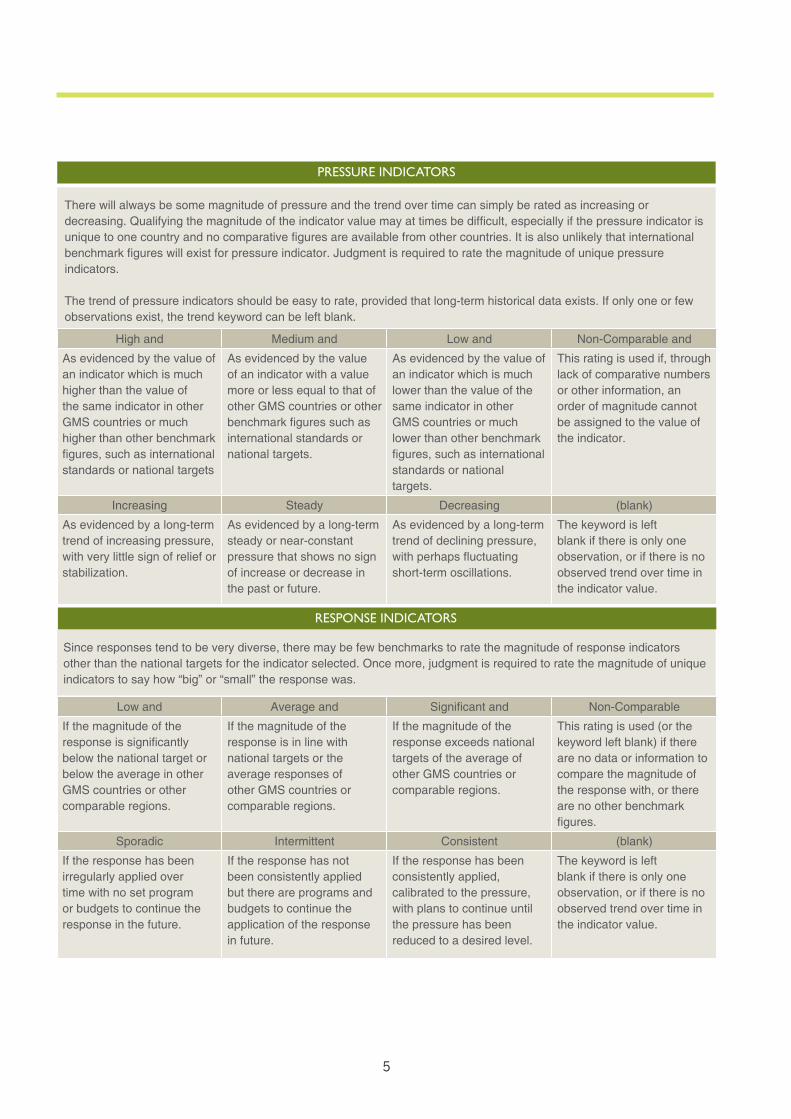
PRESSURE INDICATORS
There will always be some magnitude of pressure and the trend over time can simply be rated as increasing or decreasing. Qualifying the magnitude of the indicator value may at times be diffi cult, especially if the pressure indicator is unique to one country and no comparative fi gures are available from other countries. It is also unlikely that international benchmark fi gures will exist for pressure indicator. Judgment is required to rate the magnitude of unique pressure indicators.
The trend of pressure indicators should be easy to rate, provided that long-term historical data exists. If only one or few observations exist, the trend keyword can be left blank.
High and Medium and Low and Non-Comparable and
As evidenced by the value of an indicator which is much higher than the value of the same indicator in other GMS countries or much higher than other benchmark fi gures, such as international standards or national targets
As evidenced by the value of an indicator with a value more or less equal to that of other GMS countries or other benchmark fi gures such as international standards or national targets.
As evidenced by the value of an indicator which is much lower than the value of the same indicator in other GMS countries or much lower than other benchmark fi gures, such as international standards or national targets.
This rating is used if, through lack of comparative numbers or other information, an order of magnitude cannot be assigned to the value of the indicator.
Increasing Steady Decreasing (blank)
As evidenced by a long-term trend of increasing pressure, with very little sign of relief or stabilization.
As evidenced by a long-term steady or near-constant pressure that shows no sign of increase or decrease in the past or future.
As evidenced by a long-term trend of declining pressure, with perhaps fl uctuating short-term oscillations.
The keyword is left blank if there is only one observation, or if there is no observed trend over time in the indicator value.
RESPONSE INDICATORS
Since responses tend to be very diverse, there may be few benchmarks to rate the magnitude of response indicators other than the national targets for the indicator selected. Once more, judgment is required to rate the magnitude of unique indicators to say how “big” or “small” the response was.
Low and Average and Signifi cant and Non-Comparable
If the magnitude of the response is signifi cantly below the national target or below the average in other GMS countries or other comparable regions.
If the magnitude of the response is in line with national targets or the average responses of other GMS countries or comparable regions.
If the magnitude of the response exceeds national targets of the average of other GMS countries or comparable regions.
This rating is used (or the keyword left blank) if there are no data or information to compare the magnitude of the response with, or there are no other benchmark fi gures.
Sporadic Intermittent Consistent (blank)
If the response has been irregularly applied over time with no set program or budgets to continue the response in the future.
If the response has not been consistently applied but there are programs and budgets to continue the application of the response in future.
If the response has been consistently applied, calibrated to the pressure, with plans to continue until the pressure has been reduced to a desired level.
The keyword is left blank if there is only one observation, or if there is no observed trend over time in the indicator value.
6
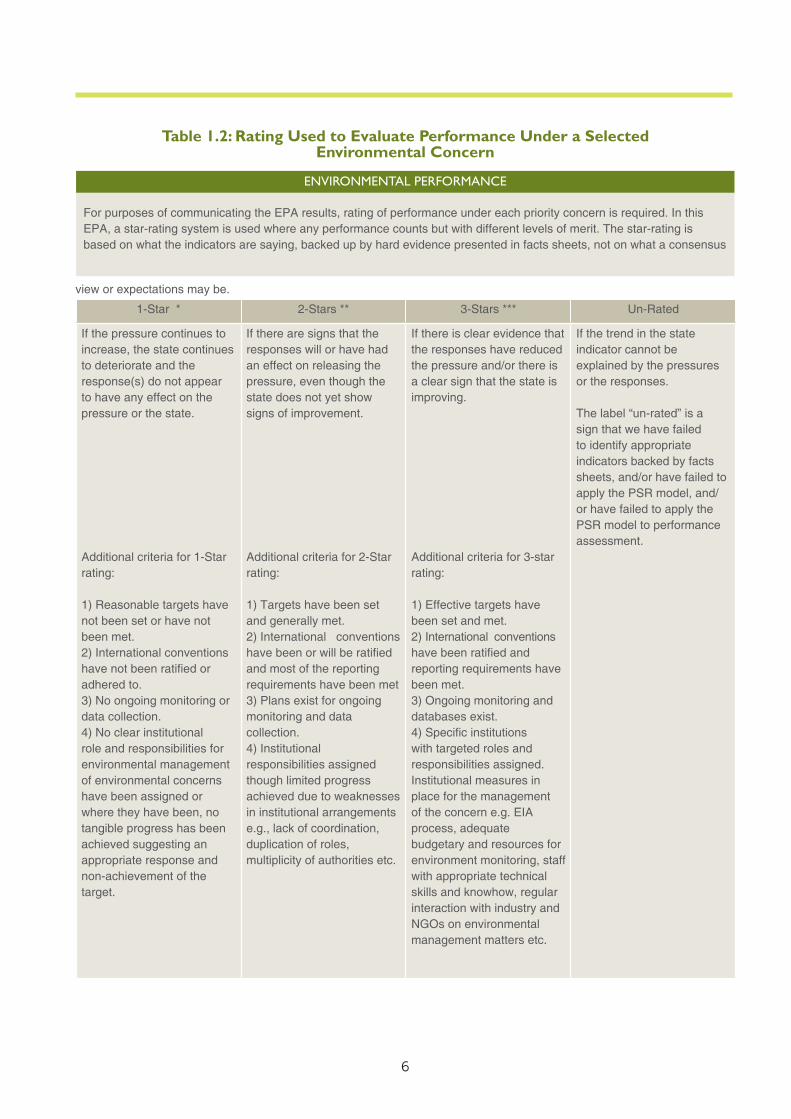
Table 1.2: Rating Used to Evaluate Performance Under a Selected Environmental Concern
ENVIRONMENTAL PERFORMANCE
For purposes of communicating the EPA results, rating of performance under each priority concern is required. In this EPA, a star-rating system is used where any performance counts but with different levels of merit. The star-rating is based on what the indicators are saying, backed up by hard evidence presented in facts sheets, not on what a consensus
view or expectations may be.
1-Star * 2-Stars ** 3-Stars *** Un-Rated
If the pressure continues to increase, the state continues to deteriorate and the response(s) do not appear to have any effect on the pressure or the state.
Additional criteria for 1-Star rating:
1) Reasonable targets have not been set or have not been met.2) International conventions have not been ratifi ed or adhered to.3) No ongoing monitoring or data collection.4) No clear institutional role and responsibilities for environmental management of environmental concerns have been assigned or where they have been, no tangible progress has been achieved suggesting an appropriate response and non-achievement of the target.
If there are signs that the responses will or have had an effect on releasing the pressure, even though the state does not yet show signs of improvement.
Additional criteria for 2-Star rating:
1) Targets have been set and generally met.2) International conventions have been or will be ratifi ed and most of the reporting requirements have been met3) Plans exist for ongoing monitoring and data collection.4) Institutional responsibilities assigned though limited progress achieved due to weaknesses in institutional arrangements e.g., lack of coordination, duplication of roles, multiplicity of authorities etc.
If there is clear evidence that the responses have reduced the pressure and/or there is a clear sign that the state is improving.
Additional criteria for 3-star rating:
1) Effective targets have been set and met.2) International conventions have been ratifi ed and reporting requirements have been met.3) Ongoing monitoring and databases exist.4) Specifi c institutions with targeted roles and responsibilities assigned. Institutional measures in place for the management of the concern e.g. EIA process, adequate budgetary and resources for environment monitoring, staff with appropriate technical skills and knowhow, regular interaction with industry and NGOs on environmental management matters etc.
If the trend in the state indicator cannot be explained by the pressures or the responses.
The label “un-rated” is a sign that we have failed to identify appropriate indicators backed by facts sheets, and/or have failed to apply the PSR model, and/or have failed to apply the PSR model to performance assessment.
7
12. Besides its potential usefulness for Viet Nam, the EPA reporting as developed under the SEF II Project offers wider benefits. The methods used here can be applied at different levels of analysis, not just at the national level (as in the present case). The commonality of approach to indicator selection, data presentation and their analysis facilitates subregional environmental assessments, one of the objectives of GMS environmental program that seeks to respond to trans-boundary environmental challenges in the Mekong Basin. Additionally at the local level, an EPA can be utilized as a project monitoring and evaluation tool or even a tool of assessing performance of a development initiative at a local (e.g., municipal) level.
13. Finally, the EPA process typically offers assessments of performance under concerns that are simultaneously local and global (such as threat to biodiversity in this report) and it therefore becomes a form of reporting to the bodies set up to help protect the global commons (e.g., most notably GEF). Last but not the least the report can assist the design of future country assistance programs by principal donor agencies active in Viet Nam.14. The EPA team wishes to thank the Government of Viet Nam and collaborating ministries and departments for making information available for undertaking this EPA exercise.
8
2 MANAGEMENT OF PRIORITY CONCERNS
1 BOD measures the amount of oxygen required or consumed for the microbiological decomposition (oxidation) of organic material in water.
2.1 Inland Water Pollution2.1.1 Context15. Viet Nam’s economy has grown rapidly in the last decade; the GDP has increased steadily by 5-7% per year and GDP per capita doubled from USD 200 p.a. in 1990 to USD 400 p.a. in 2000. This outcome is primarily a result of growing industrialization; with industrial output increasing at 12.9% p.a. on average during the period 1991-2002. The share of industry in GDP increased from 22.7% in 1990 to 38.6% in 2002. By 2005, some 110 industrial and processing zones had been established in 26 provinces.16. However, Viet Nam’s industrial sector is in the initial stages of development, with production still dominated by small-scale units utilizing technologically simpler processes with more waste and adverse environmental impacts than larger, more modern, facilities. Industrial wastewater is a serious pollution issue in many cities. In addition, urban population increased from 20% in 1990 to 25% in 2002 and usually outstripped the development of environment infrastructure.17. In Viet Nam, wastewater pollution data are still seriously incomplete. Monitoring of surface water quality has been undertaken only in big cities like Hanoi, Hue, Danang and Ho Chi Minh City. BOD and NH4 are the key parameters that are monitored. In time, other parameters such as COD, TSS and the heavy metals will need to
be monitored. National environmental standards including the water quality standards were formulated only in 1992.
2.1.2 State
Indicator: BOD5 Concentration in Selected Rivers - 1995-2002
18. This indicator attempts to track the water quality in some of the major rivers of Viet Nam; it is expressed as the amount of 5-day biological oxygen demand (BOD5)1 concentration, in milligrams per liter, over time. BOD5 was chosen because other parameters such as SS, TDS, pH, oil & grease that would help give a more rounded picture of surface water quality are incompletely monitored or not monitored at all for the time being.19. The principal objective of Viet Nam’s environmental protection policy was stated in the National Strategy for Environmental Protection to 2010 -2020. It is: “to halt pollution acceleration, remedy degraded areas and improve the environment quality and ensure sustainable development of the country; guaranteeing that all the people are entitled to live in the environment, landscapes and other environmental components with the good quality of air, land, and water measuring up to standards stipulated by the State”. For inland water pollution it translates
VIET NAM NATIONAL ENVIRONMENTAL PERFORMANCE ASSESSMENT
(EPA) REPORT
9
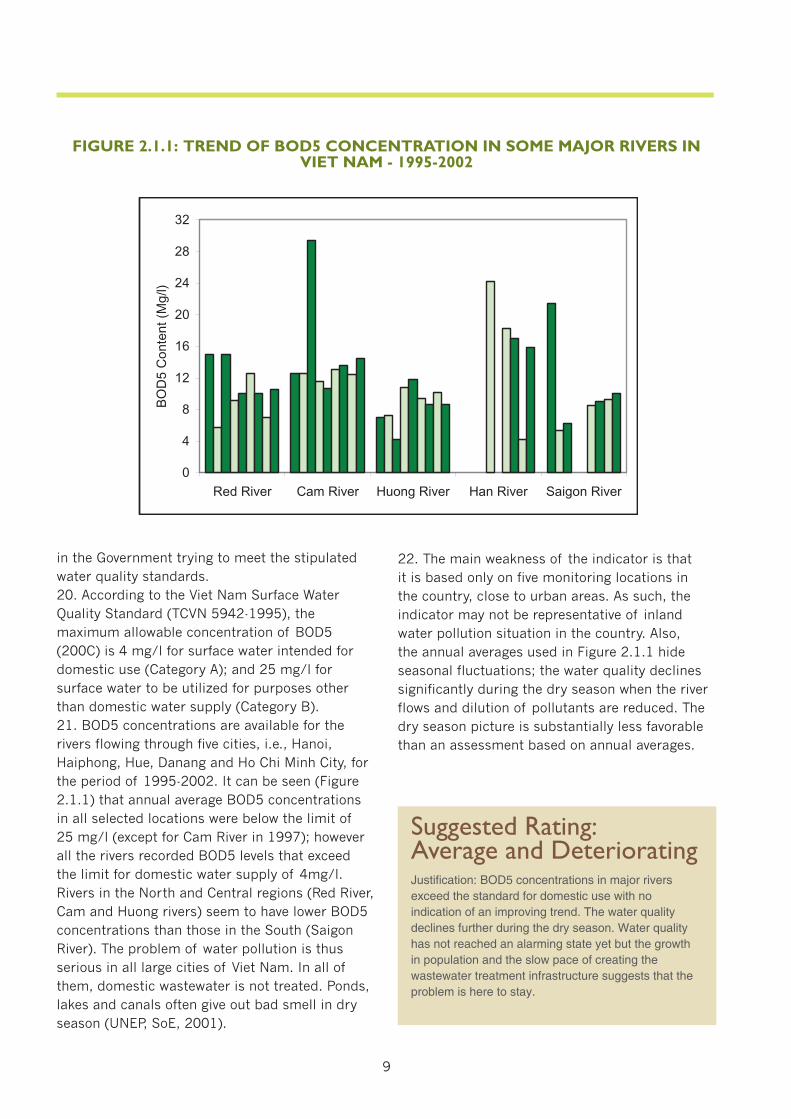
22. The main weakness of the indicator is that it is based only on five monitoring locations in the country, close to urban areas. As such, the indicator may not be representative of inland water pollution situation in the country. Also, the annual averages used in Figure 2.1.1 hide seasonal fluctuations; the water quality declines significantly during the dry season when the river flows and dilution of pollutants are reduced. The dry season picture is substantially less favorable than an assessment based on annual averages.
FIGURE 2.1.1: TREND OF BOD5 CONCENTRATION IN SOME MAJOR RIVERS IN VIET NAM - 1995-2002
Suggested Rating: Average and DeterioratingJustifi cation: BOD5 concentrations in major rivers exceed the standard for domestic use with no indication of an improving trend. The water quality declines further during the dry season. Water quality has not reached an alarming state yet but the growth in population and the slow pace of creating the wastewater treatment infrastructure suggests that the problem is here to stay.
0
4
8
12
16
20
24
28
32
Red River Cam River Huong River Han River Saigon River
BO
D5
Con
tent
(Mg/
l)
in the Government trying to meet the stipulated water quality standards. 20. According to the Viet Nam Surface Water Quality Standard (TCVN 5942-1995), the maximum allowable concentration of BOD5 (200C) is 4 mg/l for surface water intended for domestic use (Category A); and 25 mg/l for surface water to be utilized for purposes other than domestic water supply (Category B).21. BOD5 concentrations are available for the rivers flowing through five cities, i.e., Hanoi, Haiphong, Hue, Danang and Ho Chi Minh City, for the period of 1995-2002. It can be seen (Figure 2.1.1) that annual average BOD5 concentrations in all selected locations were below the limit of 25 mg/l (except for Cam River in 1997); however all the rivers recorded BOD5 levels that exceed the limit for domestic water supply of 4mg/l. Rivers in the North and Central regions (Red River, Cam and Huong rivers) seem to have lower BOD5 concentrations than those in the South (Saigon River). The problem of water pollution is thus serious in all large cities of Viet Nam. In all of them, domestic wastewater is not treated. Ponds, lakes and canals often give out bad smell in dry season (UNEP, SoE, 2001).
10
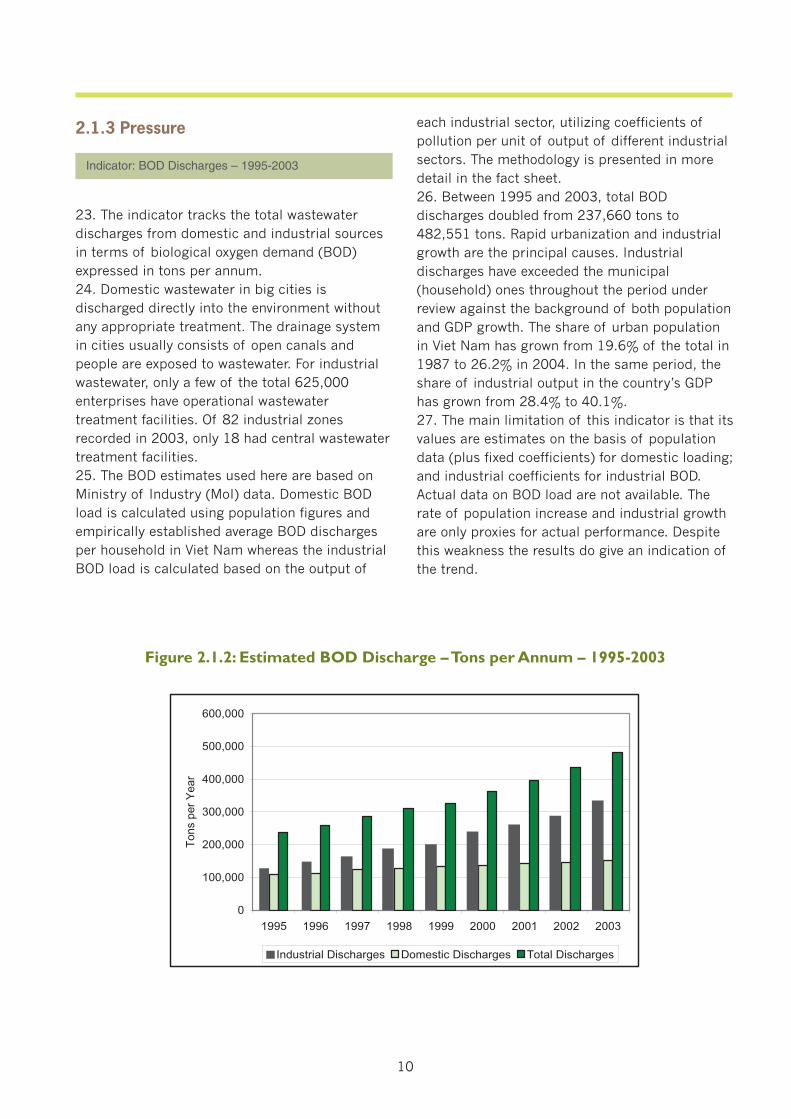
Figure 2.1.2: Estimated BOD Discharge – Tons per Annum – 1995-2003
23. The indicator tracks the total wastewater discharges from domestic and industrial sources in terms of biological oxygen demand (BOD) expressed in tons per annum. 24. Domestic wastewater in big cities is discharged directly into the environment without any appropriate treatment. The drainage system in cities usually consists of open canals and people are exposed to wastewater. For industrial wastewater, only a few of the total 625,000 enterprises have operational wastewater treatment facilities. Of 82 industrial zones recorded in 2003, only 18 had central wastewater treatment facilities.25. The BOD estimates used here are based on Ministry of Industry (MoI) data. Domestic BOD load is calculated using population figures and empirically established average BOD discharges per household in Viet Nam whereas the industrial BOD load is calculated based on the output of
Indicator: BOD Discharges – 1995-2003
each industrial sector, utilizing coefficients of pollution per unit of output of different industrial sectors. The methodology is presented in more detail in the fact sheet.26. Between 1995 and 2003, total BOD discharges doubled from 237,660 tons to 482,551 tons. Rapid urbanization and industrial growth are the principal causes. Industrial discharges have exceeded the municipal (household) ones throughout the period under review against the background of both population and GDP growth. The share of urban population in Viet Nam has grown from 19.6% of the total in 1987 to 26.2% in 2004. In the same period, the share of industrial output in the country’s GDP has grown from 28.4% to 40.1%. 27. The main limitation of this indicator is that its values are estimates on the basis of population data (plus fixed coefficients) for domestic loading; and industrial coefficients for industrial BOD. Actual data on BOD load are not available. The rate of population increase and industrial growth are only proxies for actual performance. Despite this weakness the results do give an indication of the trend.
2.1.3 Pressure
0
100,000
200,000
300,000
400,000
500,000
600,000
1995 1996 1997 1998 1999 2000 2001 2002 2003
Ton
spe
rY
ear
Industrial Discharges Domestic Discharges Total Discharges
11
Suggested Rating: Non-comparable and IncreasingJustifi cation: As would be expected, estimated total BOD discharges have increased as a result of growing population and industrial development.
2.1.4 Response
28. This indicator is based on the amount of wastewater discharge fees collected by MONRE from industrial enterprises. The fee was formally introduced in 2003 as an incentive for the enterprises to undertake wastewater treatment and a tool of generating revenue for the construction of treatment facilities and for other pollution control measures. For the time being the indicator is incomplete and its construction reflects the weaknesses in the application of the discharge fee policy. First, information about the totals collected are available for a single year
(2003) In 2003, the estimated fee collection was 42 billion VND (~2.6MUSD) of which 40% or 16.8 billion VND (~0.65 MUSD) was to be administered through the Vietnam Environment Protection Fund. The remainder of the amount was to be allocated to provinces/cities government units for development of environmental protection projects or facilities. However, it is not clear what the procedures for fee collection were and how fairly the system was applied. What is certain is that, overall, the fee could not have had any significant incentive effect. Based on the data in Table 2.1.2, the average amount of the discharge fee amounted to the equivalent of VND0.003 per m3. 29. MONRE’s discharge levy policy is enshrined in Decree No. 67/2003/ND-CP. If experience so far is any guide, the Ministry has been unable to enforce the policy. The lack of any supporting information concerning the functioning of the levy reinforces the view that the application of the policy has been haphazard at best. 30. In addition it is questionable whether MONRE and DONREHs have the capacity to utilize the proceeds of the discharge levy efficiently. The policy needs a thorough review, and the substantial experience from abroad, especially the People’s Republic of China (PRC), deserves to be studied and applied to local conditions.
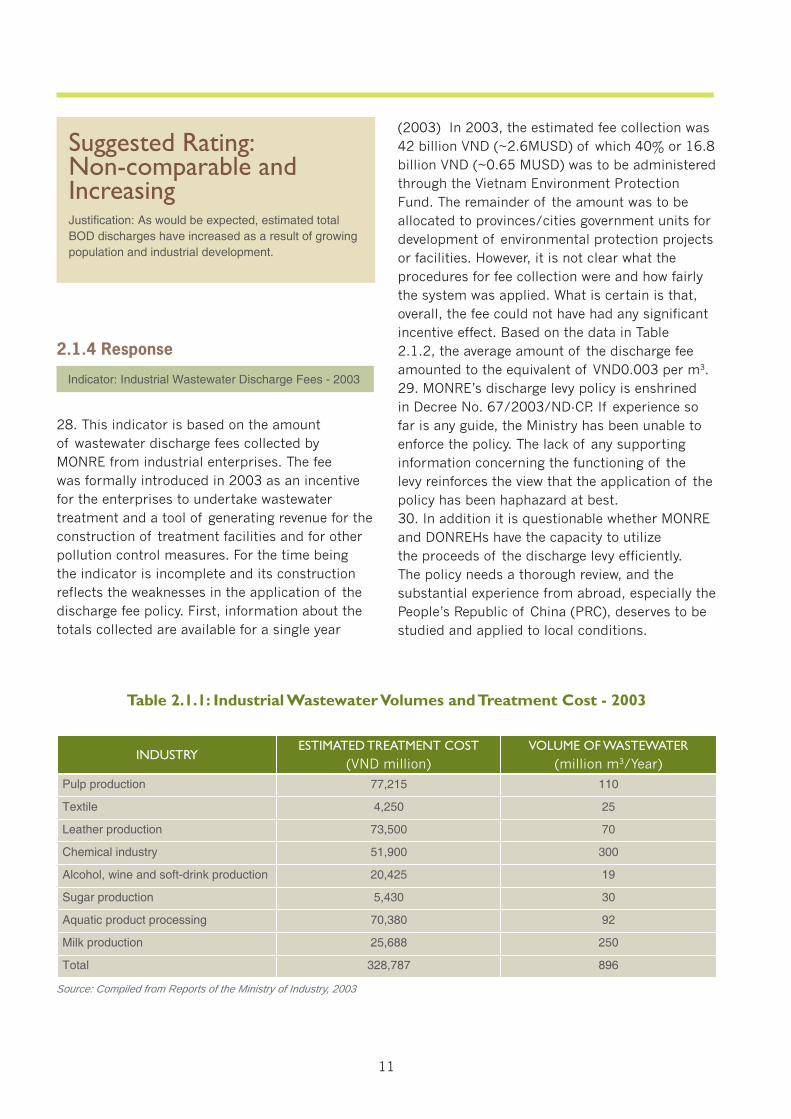
Table 2.1.1: Industrial Wastewater Volumes and Treatment Cost - 2003
Source: Compiled from Reports of the Ministry of Industry, 2003
INDUSTRY ESTIMATED TREATMENT COST
(VND million)VOLUME OF WASTEWATER
(million m3/Year)
Indicator: Industrial Wastewater Discharge Fees - 2003
Pulp production 77,215 110
Textile 4,250 25
Leather production 73,500 70
Chemical industry 51,900 300
Alcohol, wine and soft-drink production 20,425 19
Sugar production 5,430 30
Aquatic product processing 70,380 92
Milk production 25,688 250
Total 328,787 896
12
31. The introduction of discharge fee is not the only Government initiative designed to address the water pollution issues. Other policy initiatives or statements include, among others: • Decision 64/2003/QD-TTg, 2003 – addressing pollution from 4,295 most polluting establishments’ viz., industries, hospitals, landfills, and chemical factories. The policy targets the most serious 439 pollution hotspots for remedial action during 2003-07, and the remaining by 2012. The Decision complements Decision No. 67 (see above). Under it, owners of polluting facilities can get preferential funding from Vietnam Environment Protection Fund to finance pollution control facilities. • National Strategy for Environmental Protection with stated 2020 objectives as follows: (i) by 2020: 100% of urban centers, industrial parks and export- processing zones to be provided with centralized waste treatment systems; (ii) by 2010: 100% of newly constructed production units to adopt clean technologies or equipped with waste treatment facilities; 90% of domestic, industrial units’ solid wastes to be collected, and 60% of collected hazardous wastes and 100% of collected medical wastes to be treated; and (iii) rehabilitate 50% of heavily degraded canals, lakes, ponds and river corridors traversing cities nationwide. • Other specific targets are: by 2005 to ensure that 50% rural households are equipped with sanitary latrines; and 10% of “cottage villages” (communities usually specializing in a particular craft) are served by appropriate wastewater treatment. Importantly, all industrial estates
Suggested Rating: Low and SporadicJustifi cation: There is no consistency in the application of programs and policy from the government. Lack of fi nancial and institutional resources constrains effective enforcement of regulation and collection of the fee.
zones are to have wastewater treatment systems. More than 1000 enterprises in Ho Chi Minh City are to be relocated out of the city. No information is available for now on the progress in achieving the above targets.
2.1.5 Conclusions32. Whereas several programs and policies have been adopted by GOV, available information is insufficient to adequately assess their effectiveness. The first priority should be to help remedy this situation. The quality of inland waters is a subject too important not to be benefit from a wider and more searching review. The wastewater discharge fee policy is only one of several components that leave the public poorly informed about the way in which policies are being applied and about the implementation experience so far. As it is, the only safe conclusion that can be drawn is that urbanization and industrial growth continue to exacerbate the water pollution situation. 33. Not unreasonably, water quality monitoring efforts in Viet Nam have focused on urban areas that experience the heaviest burden of water pollution and concentration of discharges. However it would be wrong to acquiesce in the virtual absence of any data on pollution of inland waterways caused by agricultural runoff in a country where the use of agrochemicals is significant. Given the distinct dry and wet season of Viet Nam, attention to seasonal variations in the quality of surface water is also important. 34. Future work should widen both the area coverage of water monitoring and the range of parameters monitored to include also SS, TDS, oil & grease, pH, heavy metals etc., to provide a more balanced picture of the trends in water quality. Effective implementation of the discharge fee policy might be one way of financing the cost of improved monitoring. 35. A national database of all wastewater treatment facilities in the country including their capacity, and performance record does not exist. Its creation would be a major contribution to efforts to improve both the policy and practice.36. Both MONRE and its provincial arms (DONREHs) are relatively new organizations that have limited institutional experience and
13
financial resources to implement the pollution control policies in full. MONRE’s Department of Environment; National Committee on Clean Water Supply & Sanitation; Agency of Water Resources Management and other agencies concerned with water pollution management in Viet Nam would deserve to be better supported financially and technically. Reducing the serious underpricing of wastewater discharges could finance such support. MONRE should prepare a national water quality-monitoring program that would generate the data necessary for improved wastewater management (including the database of WWT facilities mentioned earlier on).37. Guidelines should be developed by MONRE and other relevant GOV agencies on the utilization of fees collected. These should include (i) criteria for and procedures for the collection of fees.; (ii) criteria for the allocation and distribution of collected funds; (iii) rules for monitoring of wastewater treatment facilities’ performance and (iv) the approach to be used to maintain a centralized database on the status of these facilities.
Suggested Rating: 1 Star Justifi cation: Inland water pollution shows no signs of improvement. Data to date do not make it possible to say if GOV policies are having any impact in arresting the situation; institutional arrangements for managing water pollution are weak and greater effort is required to effectively implement pollution control programs.
2.2 Air Pollution from Mobile Source2.2.1 Context38. The transformation of Viet Nam into a more industrialized and urbanized nation has been accompanied by an increase in the number of
ReferenceNational Strategy for Environmental Protection to 2010 with vision to 2020, pages 55-63 (objectives), 86-87 (measure on river basins), 118-119 (programs of the strategy on improvement of water environment).
Indicator: Concentration of SO2, NO2, PM and CO in Hanoi and Ho Chi Minh Cities – 1997-2002
factories, automobiles, motorcycles and other equipment that release atmospheric emissions. In particular, the number of motorcycles in Viet Nam has been increasing rapidly. In 2000 alone, an increase of 14.2% was observed, and the numbers are expected to continue to grow. Associated with this rapid increase in vehicles has been poor air quality in urban areas. Exposure to airborne pollutants can cause respiratory problems and other health related problems.39. The air pollution is serious in major cities in Viet Nam, especially Ho Chi Minh City and Hanoi, with motor vehicles the main reason. Among the pollutants, the levels of particulate matter are especially high. The specification of fuels used in these vehicles is a contributing cause. The vehicle population continues to grow rapidly, and vehicle ownership has been outpacing the growth in available road space, leading to congestion (and yet more pollution as a result). 40. Although the concentration of many other atmospheric pollutants such as sulphur dioxide (SO2), carbon monoxide (CO), and nitrogen oxides (NOx) are generally below the national standard, increased vehicle ownership is expected to test these limits in the near future. In specific locations or certain times of the day, the concentrations of these pollutants exceed the standard. The interpretation of the results is made difficult by a degree of inconsistency and different measurement basis (e.g., monthly averages, maximum daily readings etc.) across the data sets. Here, too, one of the priorities in Viet Nam is to upgrade and standardize air quality monitoring, data handling and reporting.
2.2.2 State41. This indicator is the concentration of regulated air borne pollutants (that include SO2, NO2, PM and CO) in Hanoi and Ho Chi Minh City, expressed in mg/m3. This is a commonly used indicator of ambient air quality.
14
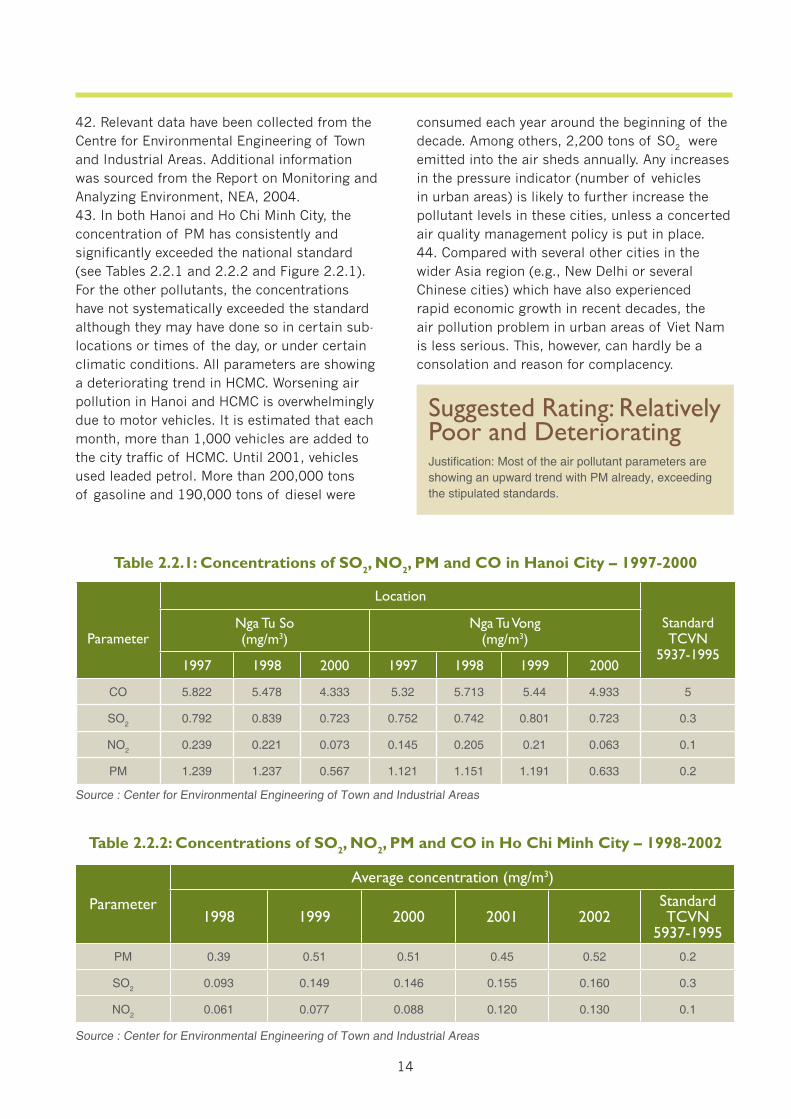
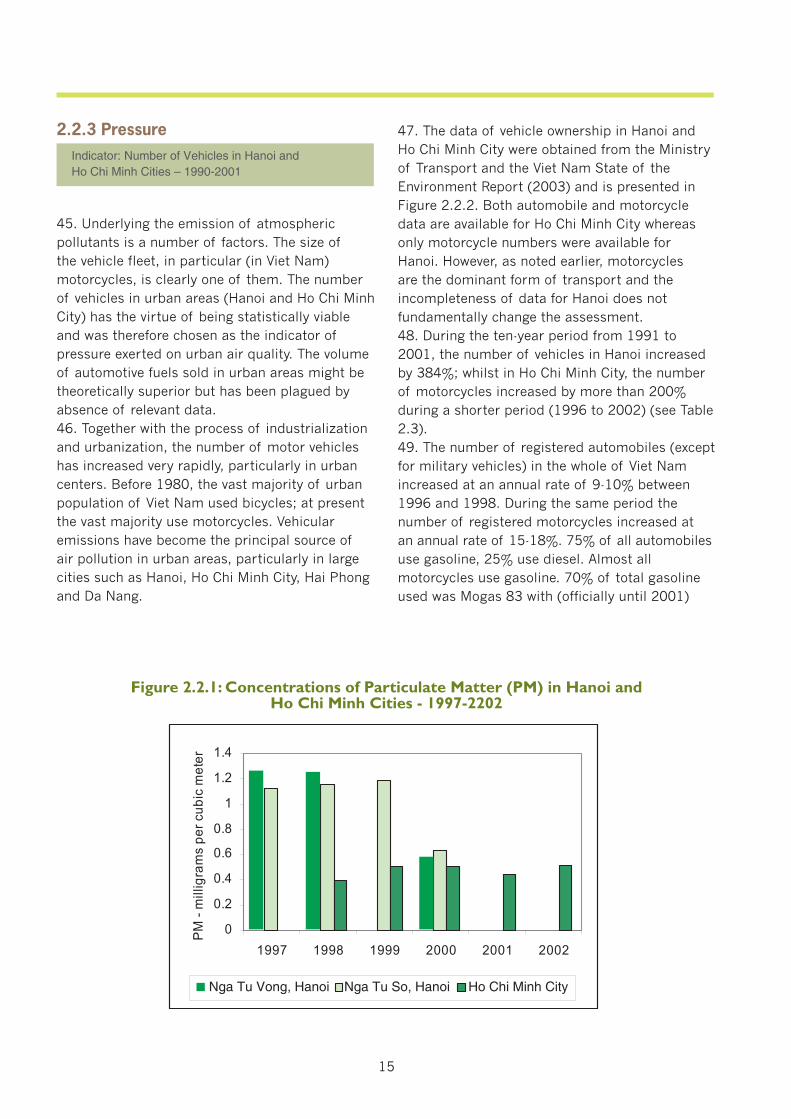
42. Relevant data have been collected from the Centre for Environmental Engineering of Town and Industrial Areas. Additional information was sourced from the Report on Monitoring and Analyzing Environment, NEA, 2004. 43. In both Hanoi and Ho Chi Minh City, the concentration of PM has consistently and significantly exceeded the national standard (see Tables 2.2.1 and 2.2.2 and Figure 2.2.1). For the other pollutants, the concentrations have not systematically exceeded the standard although they may have done so in certain sub-locations or times of the day, or under certain climatic conditions. All parameters are showing a deteriorating trend in HCMC. Worsening air pollution in Hanoi and HCMC is overwhelmingly due to motor vehicles. It is estimated that each month, more than 1,000 vehicles are added to the city traffic of HCMC. Until 2001, vehicles used leaded petrol. More than 200,000 tons of gasoline and 190,000 tons of diesel were
Table 2.2.1: Concentrations of SO2, NO2, PM and CO in Hanoi City – 1997-2000
Parameter
Location
StandardTCVN
5937-1995
Nga Tu So(mg/m3)
Nga Tu Vong (mg/m3)
1997 1998 2000 1997 1998 1999 2000
CO 5.822 5.478 4.333 5.32 5.713 5.44 4.933 5
SO2 0.792 0.839 0.723 0.752 0.742 0.801 0.723 0.3
NO2 0.239 0.221 0.073 0.145 0.205 0.21 0.063 0.1
PM 1.239 1.237 0.567 1.121 1.151 1.191 0.633 0.2
Source : Center for Environmental Engineering of Town and Industrial Areas
Table 2.2.2: Concentrations of SO2, NO2, PM and CO in Ho Chi Minh City – 1998-2002
Parameter
Average concentration (mg/m3)
1998 1999 2000 2001 2002StandardTCVN
5937-1995PM 0.39 0.51 0.51 0.45 0.52 0.2
SO2 0.093 0.149 0.146 0.155 0.160 0.3
NO2 0.061 0.077 0.088 0.120 0.130 0.1
Source : Center for Environmental Engineering of Town and Industrial Areas
consumed each year around the beginning of the decade. Among others, 2,200 tons of SO2 were emitted into the air sheds annually. Any increases in the pressure indicator (number of vehicles in urban areas) is likely to further increase the pollutant levels in these cities, unless a concerted air quality management policy is put in place.44. Compared with several other cities in the wider Asia region (e.g., New Delhi or several Chinese cities) which have also experienced rapid economic growth in recent decades, the air pollution problem in urban areas of Viet Nam is less serious. This, however, can hardly be a consolation and reason for complacency.
Suggested Rating: Relatively Poor and DeterioratingJustifi cation: Most of the air pollutant parameters are showing an upward trend with PM already, exceeding the stipulated standards.
15
2.2.3 Pressure
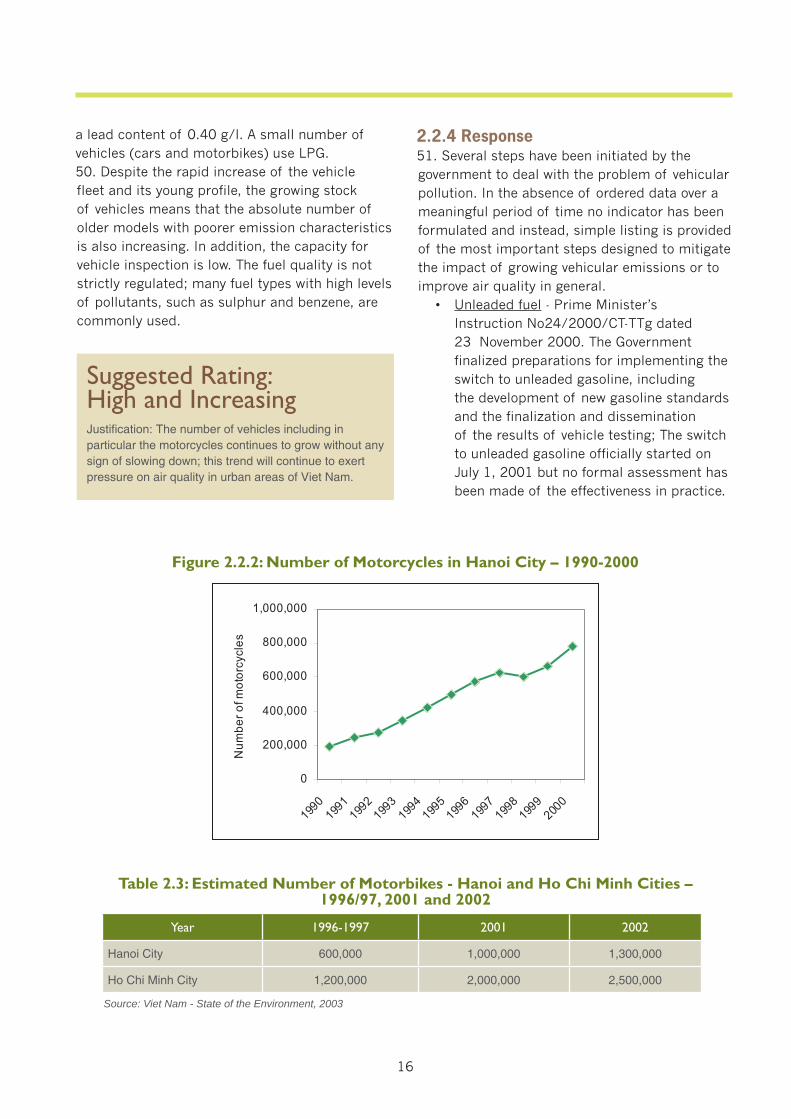
45. Underlying the emission of atmospheric pollutants is a number of factors. The size of the vehicle fleet, in particular (in Viet Nam) motorcycles, is clearly one of them. The number of vehicles in urban areas (Hanoi and Ho Chi Minh City) has the virtue of being statistically viable and was therefore chosen as the indicator of pressure exerted on urban air quality. The volume of automotive fuels sold in urban areas might be theoretically superior but has been plagued by absence of relevant data.46. Together with the process of industrialization and urbanization, the number of motor vehicles has increased very rapidly, particularly in urban centers. Before 1980, the vast majority of urban population of Viet Nam used bicycles; at present the vast majority use motorcycles. Vehicular emissions have become the principal source of air pollution in urban areas, particularly in large cities such as Hanoi, Ho Chi Minh City, Hai Phong and Da Nang.
47. The data of vehicle ownership in Hanoi and Ho Chi Minh City were obtained from the Ministry of Transport and the Viet Nam State of the Environment Report (2003) and is presented in Figure 2.2.2. Both automobile and motorcycle data are available for Ho Chi Minh City whereas only motorcycle numbers were available for Hanoi. However, as noted earlier, motorcycles are the dominant form of transport and the incompleteness of data for Hanoi does not fundamentally change the assessment.48. During the ten-year period from 1991 to 2001, the number of vehicles in Hanoi increased by 384%; whilst in Ho Chi Minh City, the number of motorcycles increased by more than 200% during a shorter period (1996 to 2002) (see Table 2.3). 49. The number of registered automobiles (except for military vehicles) in the whole of Viet Nam increased at an annual rate of 9-10% between 1996 and 1998. During the same period the number of registered motorcycles increased at an annual rate of 15-18%. 75% of all automobiles use gasoline, 25% use diesel. Almost all motorcycles use gasoline. 70% of total gasoline used was Mogas 83 with (officially until 2001)
Indicator: Number of Vehicles in Hanoi and Ho Chi Minh Cities – 1990-2001
Figure 2.2.1: Concentrations of Particulate Matter (PM) in Hanoi and Ho Chi Minh Cities - 1997-2202
g
0
0.2
0.4
0.6
0.8
1
1.2
1.4
1997 1998 1999 2000 2001 2002
PM
-mill
igra
ms
perc
ubic
met
er
Nga Tu Vong, Hanoi NgaTu So, Hanoi Ho Chi Ming CityNga Tu Vong, Hanoi Nga Tu So, Hanoi Ho Chi Minh City
16
a lead content of 0.40 g/l. A small number of vehicles (cars and motorbikes) use LPG.50. Despite the rapid increase of the vehicle fleet and its young profile, the growing stock of vehicles means that the absolute number of older models with poorer emission characteristics is also increasing. In addition, the capacity for vehicle inspection is low. The fuel quality is not strictly regulated; many fuel types with high levels of pollutants, such as sulphur and benzene, are commonly used.
Figure 2.2.2: Number of Motorcycles in Hanoi City – 1990-2000
0
200,000
400,000
600,000
800,000
1,000,000
1990
1991
1992
1993
1994
1995
1996
1997
1998
1999
2000
Nu
mbe
rofm
oto
rcyc
les
2.2.4 Response51. Several steps have been initiated by the government to deal with the problem of vehicular pollution. In the absence of ordered data over a meaningful period of time no indicator has been formulated and instead, simple listing is provided of the most important steps designed to mitigate the impact of growing vehicular emissions or to improve air quality in general. • Unleaded fuel - Prime Minister’s Instruction No24/2000/CT-TTg dated 23 November 2000. The Government finalized preparations for implementing the switch to unleaded gasoline, including the development of new gasoline standards and the finalization and dissemination of the results of vehicle testing; The switch to unleaded gasoline officially started on July 1, 2001 but no formal assessment has been made of the effectiveness in practice.
Table 2.3: Estimated Number of Motorbikes - Hanoi and Ho Chi Minh Cities – 1996/97, 2001 and 2002
Year 1996-1997 2001 2002
Hanoi City 600,000 1,000,000 1,300,000
Ho Chi Minh City 1,200,000 2,000,000 2,500,000
Source: Viet Nam - State of the Environment, 2003
Suggested Rating: High and IncreasingJustifi cation: The number of vehicles including in particular the motorcycles continues to grow without any sign of slowing down; this trend will continue to exert pressure on air quality in urban areas of Viet Nam.
17
• Regulatory steps. Several donors have supported revision of vehicle emission and fuel quality standards, The work is ongoing. • EIA requirement – GOV requires that EIA be undertaken for all projects to better assess and monitor the impact of development including encouraging use of clean technologies, including cleaner forms of combustion. • Energy efficient devices – Viet Nam’s energy policy stresses the need to improve the efficiency of energy use, especially in thermal power generation. It envisages wider use of liquefied gas and light oil at the expense of coal and heavy oil with high sulphur content. Use of biogas in rural areas, and renewable energy (wind, solar energy, geothermal energy, tidal energy).is also to be promoted. • Legal and policy instruments - The ‘National and Local Clean Air Act’ has been drafted by the NEA and Hanoi DONRE. Action Plan on Reducing Vehicle Emissions is under preparation • Air quality monitoring – As in many other countries, monitoring of air quality is recognized to be weak in Viet Nam. In a piecemeal fashion and with a combination of government and donor funding, the monitoring network has been expanded. The target for 2005 was (i) 10 automatic air-monitoring stations; (ii) 2 mobile air-monitoring stations and (iii) 2 environmental analytic laboratories in urban and industrial areas. • Use of public transport – At present, public transport is not developed in Viet Nam but the conditions for its introduction may be gradually emerging. With donor support, schemes to introduce bus or streetcar services parts of Hanoi and HCMC are being formulated.
Suggested Rating: Non-ComparableJustifi cation: In the absence of an indicator, refl ecting statistical and information gaps, the performance cannot be rated.
2.2.5 Conclusion52. Urban air quality has stagnated in Hanoi and been deteriorating in Ho Chi Minh City, the two locations most affected by the problems of air pollution. The situation in other urban locations is not well documented to draw conclusions. These outcomes have coexisted with a rapid increase in vehicle (especially motorcycle) ownership. In general, announcements of new initiatives have outstripped efforts to assess their effectiveness. 53. Most air quality parameters’ (PM, SO2, NO2) concentrations are showing an upward trend in Ho Chi Minh City including those of PM that exceed the national standards. The situation is less clear-cut in Hanoi. Available data on ambient quality hide localized, seasonal and temporal variability that translates into more frequent cases where ambient quality fails to meet the standards. 54. No government policy is in place to regulate the number of vehicles as one of possible approaches to influence air quality. Notable is the dearth of incentive-based approaches to managing air quality. The number of motorcycles is believed to have more than doubled in both Hanoi and HCMC during the period 1996 and 2002. However, the data on the structure of vehicle ownership and characteristics of the vehicle fleet are incomplete or inaccessible, hampering analysis. Updating vehicle registration records is one of the priorities. Initial steps are being taken to introduce public transport in Hanoi and Ho Chi Minh City. The effectiveness of the switch to unleaded fuel has not been formally evaluated55. Sporadic and inadequate vehicle emission monitoring is a well-known weakness, difficult to overcome quickly as Asian experience has amply demonstrated. Renewal of vehicle registration conditional on the vehicles complying with emission standards also remains a long-term objective for now. 56. Other, more broad-based initiatives targeting air quality, such as EIAs, promotion of clean technology and energy efficiency are all laudable but their effectiveness needs to researched and monitored.
18
59. The total volume of waste from the industrial sector was 2.6 million tons (17% of the total) in 2004. About 160,000 tons of waste per year (around 1% of the total) was hazardous waste (hazardous hospital waste, flammable and toxic substances, pesticides etc.). Some 80% of industrial solid waste comes from flagship economic areas and industrial zones of which Ho Chi Minh City and neighboring provinces account for about a half; the Red river delta and the Central North region for about a third. In addition, nearly 1,500 handicraft villages, most of which situated in the northern rural areas, annually produce around 0.8 million tons of non-hazardous industrial waste.60. The broad objectives of the Government relating to solid waste management are spelt out in Prime Minister’s Decision 199-TTg (1997) on the Solutions for Improving Waste Management in Urban Areas and Industrial Zones. They are to (i) eliminate unauthorized disposal of solid waste; (ii) improve waste collection; and (iii) improve the sorting of waste by polluters for reuse, recycling and treatment. 61. Additional targets for solid waste management were set in: • Strategy for the Management of
Solid Waste in Vietnamese Cities and Industrial Parks, 1999 – this strategy, the first in Viet Nam, outlines actions to be taken by local governments until the year 2020 to implement a comprehensive approach to waste management. The focus of the strategy is infrastructure development in urban areas and industrial zones. Key features include: legal reform, increased awareness and training, increased privatization and cost recovery, and use of appropriate and modern technologies and their application in Viet Nam. The lead agency is the Ministry of Construction and the collaborating agency is MONRE.
• National Strategy for Environmental Protection, 2003 – this strategy addresses overall environmental protection in the country until 2020. The main focus of the strategy is environmental management and capacity building. Key features include promotion of economic approaches to
Reference Hoang Duong Tung. 2004. Current situation of air pollution in Vietnam. NEA. Hanoi.
Suggested Rating: 1 StarJustifi cation: The state of air quality from mobile sources of pollution continues to deteriorate and pressure from growing number of vehicles continues to rise. Furthermore, no information exists on the effectiveness of the GOV policy and program responses to mitigate this growing problem.
2.3 Inadequate Solid Waste Management2.3.1 Context57. Growth in industrial and commercial activity in Viet Nam has resulted in greater volumes of waste generation. Viet Nam produces over 15 million tons of waste each year, most of which is not safely disposed, posing a significant threat to public health and the environment. At the same time, waste collection and re-cycling are important sources of livelihood, especially in the informal sector. The proper handling of waste—including reuse and recycling, collection, treatment and disposal—is crucial to reducing risk to public health and the environment, and to improving the quality of life.58. Viet Nam ended the year 2004 with the highest GDP growth rate (7.7%) since 1997. Along with economic growth, the amount of solid waste from households, industry and commercial establishments has increased rapidly. Over 15 million tons of solid wastes were discharged last year, 85% of which (equivalent to 12.8 million tons per year) came from households and non-industrial commercial establishments (“domestic waste”). Urban areas accounted for 24% of the total population in 2004, generating as much as 6 million tons of domestic solid waste, i.e., 45% of the country’s total. Average waste per capita per day in urban areas was 2.3 times higher than that in rural areas (0.7 kg and 0.3 kg, respectively). By 2010, municipal waste generation is projected to increase by over 60%, industrial waste by 50% and the volume of hazardous waste is expected to more than treble.
19
environmental protection, legal and policy reform, promotion of public and civil society involvement, capacity building targeted at local and national agencies, policy research, and pollution control. The strategy’s 2010 targets are 90% collection of municipal waste, and adequate disposal of over 60% of hazardous waste and 100% of medical waste.
2.3.2 State
62. This indicator monitors the efficiency of domestic waste collection in municipal areas of Viet Nam. Figure 2.3.1 shows the volume of waste collected and generated between 2000 and 2003. Disaggregated data for different parts of the country are given in the fact sheet. At current rate of progress, the target of 90% collection of municipal waste by 2010 appears out of reach.63. These figures do not show the important differences in the rate of collection in different locations of the country. In 2003, for instance, the rate fluctuated from 45% in Long An to a high of 95% in Hue city but remains low in rural and poor areas. Urban areas collect an average of 71% of the waste, a number that has increased steadily
Indicator: Solid Waster Collected as Percentage of Generated – 2000-2003
since 2000. However, while the waste collection in cities is improving in percentage terms the fast growth in the total volume of waste generated means that even with improved collection rates, the absolute quantities of waste uncollected continue to grow. In general, larger cities in Viet Nam collect a larger percentage of their waste (76%) than smaller cities (70%), while in rural areas collection rates are typically less than 20%. The poor are largely not served by collection services; nine out of ten of the poorest urban households do not receive solid waste collection service. New initiatives are being promoted to fill the gaps in municipal waste collection service. For example, community based and private sector organizations are collecting waste in rural villages and in urban areas without municipal coverage.64. Most of the municipal waste in Viet Nam is not safely disposed. However, there have been significant improvements in the performance of the public urban environmental companies (URENCOs) that are responsible for municipal waste collection and disposal. Proper handling of hazardous waste, which is the responsibility of the industries and facilities that produce it, remains severely limited. Recycling and reuse is an active industry in Viet Nam, driven by an informal network of waste pickers at landfills, informal waste collectors, and waste buyers (Vietnam Environment Monitor, 2004).
Figure 2.3.1: Waste Generated and Collected – 2000-2003
0
1
2
3
4
5
6
7
2000 2001 2002 2003
Mill
ion
Ton
s
69.5
70
70.5
71
71.5
72
72.5
73
73.5
74
74.5
Per
cen
t
Solid Waste Generated Solid Waste Collected
Percent Collected
20
2.3.3 Pressure
66. The principal indicator chosen to describe the pressures behind solid waste management is the total quantity (in tonnes) of solid waste generated in municipal areas of Viet Nam. The data used and their statistical aspects are discussed in the respective fact sheet in the Appendix. For lack of data, hazardous and toxic waste details are not discussed here.67. The volume of solid waste generated in Viet Nam in recent years has grown rapidly outpacing the rate of population growth and showing little signs of slowing down. In the period from 2000 to 2003 the increase in waste generation was almost 40%. 68. Viet Nam produces over 15 million tons of waste each year from various sources. More than 80% (12.8 million tons/yr) is from urban areas, including households, restaurants, markets, and businesses. Urban areas account for only 24% of the population of the country, yet produce over 6 million tons (50%) of the country’s municipal waste (see Figure 2.3.3). This is due to the more affluent lifestyles, larger quantity of commercial activities, and more intense industrialization found in urban areas. These activities also increase the proportion of hazardous waste (such as batteries and household solvents) and non-degradable waste (such as plastic, metal, and glass) found in urban waste. In contrast, people in rural areas produce municipal waste at less
Suggested Rating: Relatively Poor and DeterioratingJustifi cation: The rate of waste collection at the national level has increased from 71% in year 2000 to 74% in year 2003. However this marginal improvement is far from suffi cient to meet the government target of 90% by the year 2010. The major challenge appears to be in the urban areas, and especially in Hanoi and Ho Chi Minh City, where it is estimated that approximately 1 million tons of solid waste is left uncollected every year.
65. The dominant form of disposal of municipal waste remains open dumping; 49 sites have been identified by the authorities as hotspots with high environmental and human health risks. Of the 91 official disposal sites in Viet Nam, only 17 are sanitary landfills. In many areas, self-disposal methods—such as burning or burying waste, or dumping in rivers, canals, and open fields—are common. Poorly operated landfills and open dump sites are a major source of inconvenience and health risk to surrounding communities, through contamination of ground and surface water by untreated leachate, emissions of airborne pollutants, and the spread of odors, flies, mosquitoes, rodents, dust, and noise, leading to a high incidence of skin, digestive, and respiratory diseases.
Indicator: Volume of Solid Waste Generated – 2000-2003
Figure 2.3.2: Volume of Municipal Solid Waste Generated – 2000-2003
4
4.5
5
5.5
6
6.5
7
2000 2001 2002 2003
Mill
ion
Tons
per
year
21
than half of the rate of those in urban areas (0.3 kg/person/day vs. 0.7 kg/person/day), and most of the waste (99% of cultivation waste and 65% of domestic waste vs. 50% for urban domestic waste) is degradable organic waste.69. There are good reasons to expect this trend to continue. The current average per capita waste generated in Viet Nam is well below the levels in more affluent countries and, based on worldwide experience, likely to grow in line with improving living standards, and continuing urbanization. Present average real incomes in Viet Nam are approximately double of those of ten years ago. The urbanization process (24% of urban population now against 16% ten years ago) is expected to continue further adding to the total of solid waste generated. It is estimated that by 2010, the volume of domestic waste will go up by 60% over the current levels, industrial solid waste is expected to increase by 50% and hazardous waste discharges, mainly from industrial sources, are expected to triple.
Suggested Rating: High and IncreasingJustifi cation: Volume of solid waste generated continues to increase as a result of urban expansion and industrial growth.
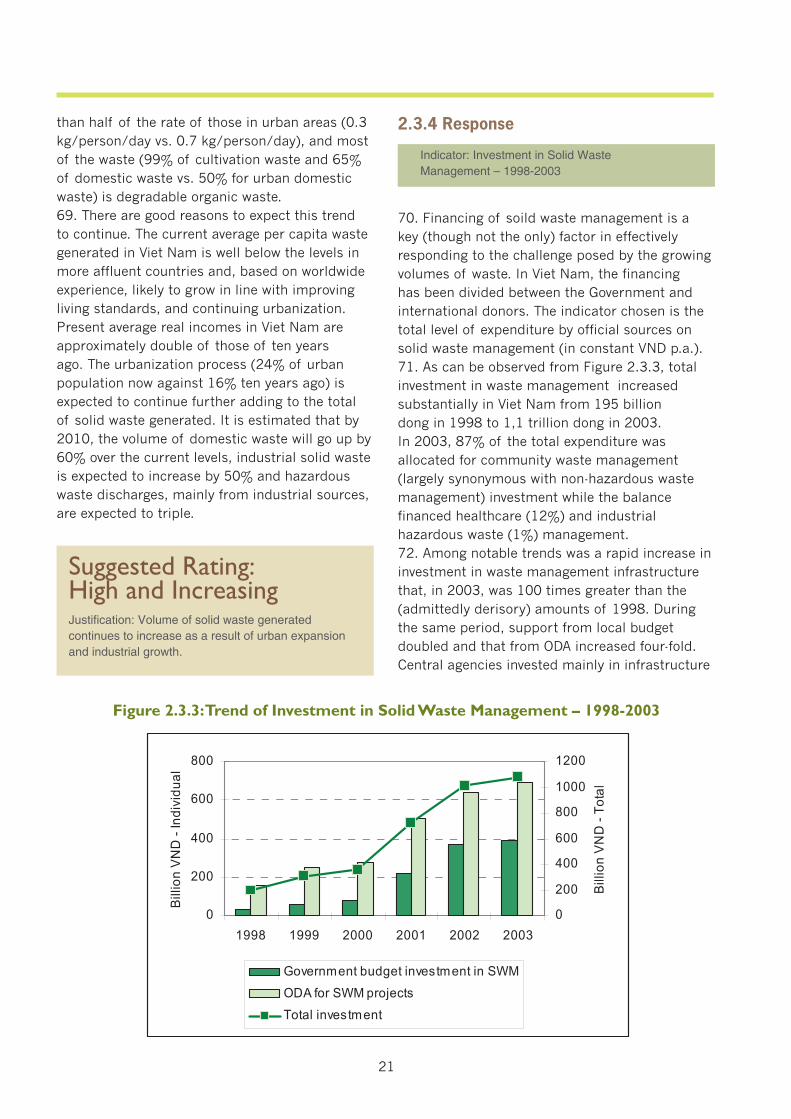
Indicator: Investment in Solid Waste Management – 1998-2003
Figure 2.3.3: Trend of Investment in Solid Waste Management – 1998-2003
0
200
400
600
800
1998 1999 2000 2001 2002 2003
Bill
ion
VN
D-I
ndi
vid
ual
0
200
400
600
800
1000
1200
Bill
ion
VN
D-T
otal
Government budget investment in SWM
ODA for SWM projects
Total investment
2.3.4 Response
70. Financing of soild waste management is a key (though not the only) factor in effectively responding to the challenge posed by the growing volumes of waste. In Viet Nam, the financing has been divided between the Government and international donors. The indicator chosen is the total level of expenditure by official sources on solid waste management (in constant VND p.a.).71. As can be observed from Figure 2.3.3, total investment in waste management increased substantially in Viet Nam from 195 billion dong in 1998 to 1,1 trillion dong in 2003. In 2003, 87% of the total expenditure was allocated for community waste management (largely synonymous with non-hazardous waste management) investment while the balance financed healthcare (12%) and industrial hazardous waste (1%) management. 72. Among notable trends was a rapid increase in investment in waste management infrastructure that, in 2003, was 100 times greater than the (admittedly derisory) amounts of 1998. During the same period, support from local budget doubled and that from ODA increased four-fold. Central agencies invested mainly in infrastructure
22
while local bodies focused on operation and maintenance expenses. Investment in solid waste management during the early part of the current decade accounted for 1.2-2.4% of the total State development spending. 73. The trend of increased investment is expected to continue. Between now and 2020, planned landfill development, closure of unsafe open dumps, and further investment in incinerators for hazardous healthcare waste are expected to cost between VND 30 trillion and 40 trillion. However, the sustainability of these investments is uncertain since, under current conditions, expenditure on operation and maintenance of solid waste collection and disposal systems is low (0.18% of GNP, or VND 160,000 per ton), and disposal fees furthermore cover only about 50% of the O&M expenditures. In 2003, central and local governments provided a subsidy of about VND 400 billion towards operating the system yet such amounts were believed to be still insufficient to ensure adequate performance.74. In many cities, improved cost recovery can be achieved through more effective fee collection and service agreements with the city’s departments. In other cities, it may be necessary to increase the fees, a measure that has met with resistance in many localities.75. Other responses and programs of the Gvernment included: • Introduction of new patterns of solid waste
collection and disposal. The principal among these is subcontracting of waste management to the private sector or cooperatives. Examples include village teams of waste collection and transport in Thai Binh; waste collection and transport cooperative in Thanh Cong, Hanoi; private enterprise involvement in Lang Son (Huy Hoang Ltd.) and Hanoi (Green Sun Co.), etc.
• Decision 64 by Prime Minister - rehabilitation or closure of selected landfills and creation of new safe dumpsites. The closure of the Ba Hoa landfill in Quy Nhon in compliance with Decision 64 is an example of this activity.
2.3.5 Conclusions76. Viet Nam’s solid waste management needs are substantial in relation to existing waste management infrastructure and the continued growth of urban areas and industrial development. Without undertaking further investments in effective handling, treatment, and disposal of waste, and ensuring adequate financing of the operation and maintenace of the system, the situation may quickly deteriorate.77. Viet Nam is only superficially on track for meeting its target for waste collection and management stipulated in the National Environment Protection Strategy. First, the progress has not been uniform. The performance in smaller towns, rural areas and urban peripheries is not satisfactory and is well below the national average of 71 per cent. Second, in a situation of rapidly increasing total amounts of waste, slow increases in the precentage of waste collected are not enough to reduce the totals left uncollected.78. There are questions about the quality of waste disposal being employed in terms of safety and impacts on public health. For now, no reliable estimates are available on the quality of disposal. No official rating is available of the state of different landfills beyond the declaration that 10 per cent of them are unsafe. No registers or records exist that would make it possible to say which landfills continue to accept hazardous and toxic waste and which do not. In the absence of such evidence, it is difficult to ascertain how many landfills contain hazardous and toxic waste. 79. The database relating to solid waste disposal is insufficient to adequately inform the public about the progress made. No systematic data on recycling rates exist in Viet Nam, surely a major weakness in the already weak data coverage of the problem. More work is therefore required to
Suggested Rating: Average and IntermittentJustifi cation: Whereas investment in solid waste management by the government and the donors has grown signifi cantly in the last decade, the sustainability of the improved service is questionable.
23
assess the state of existing landfills and develop a nationwide database on the state of disposal sites in Viet Nam.80. Whereas investment in soild waste management has grown; sustainable management of that investment remains a challenge. Greater attention should be paid to operation & maintenance of existing facilities and safe disposal of waste including hazardous and toxic waste.
ReferencesGOV. 1999, National Strategy of Solid Waste Management, HanoiGOV. 2003, National Strategy of Environmental Protection for the Period 2004-2020, Hanoi.World Bank. 2004, Viet Nam Environment Monitor.
Suggested Rating: 1 StarJustifi cation: A 1 star rating is suggested as the marginal progress in collection rates achieved during the last decade has been insuffi cient to reduce the total amounts of waste left uncollected, because of poor quality of waste disposal sites, and because of insuffi cient knowledge about several important parameters of waste management. Despite much increased fi nancing of solid waste management the sustainability of the waste management programs is in doubt under existing policies.
2.4 Forest Resources2.4.1 Context81. Viet Nam’s climatic, topographical and geomorphologic features explain the diversity of the country’s natural ecosystems including forest resources that are extensive, and abundant in species and vegetation types. Forest covered approximately 70% of the total land area at the turn of last century (Dai Nam Nhat Thong Chi) and about 42% in 1943 (Maurand), consisting mainly of little-disturbed natural forests. Though substantially diminished since then, Viet Nam had over 9 million ha (ha) of forests in 1980s (FIPI). The conditions of this resource has further changed since then and some of it is seriously degraded. Recent reforestation activities have contributed to a shift in the composition of the resource from native forest to forest
monocultures. Apart from the task of protecting existing forests, the government has set a target of 39% and 44% forest cover by 2005 and 2010 respectively. A large part of the responsibility for achiving those targets has been placed on about one million households involved in government reforestation programs.82. Several documents guide national policies on forestry. Key amongst these are: • The National Action Plan on Environment
and Sustainable Development 1991-2000, approved by Government in 1992
• Strategy for Environment Protection towards 2010 and 2020, approved by Government in 2003
• Strategy for Forest Development 2001-2010, approved by the Ministry of Agriculture and Rural Development in 2002
• Reforestation Program for Five Million Hectares 1998-2010, approved by the National Assembly and the Government in 1998.
83. Three forestland use categories are recognized in Viet Nam. • Special Use Forests form the basis of
protected areas and include national parks, nature reserves, environmental forests and cultural and historic sites.
• Protection Forests are designated for protection purposes including the protection of watersheds, sand fixing, coastal protection and environmental protection for urban and industrial areas.
• The remainder of the forest area is regarded as Production Forest.
2.4.2 State84. In line with globally accepted indicators of the state of forests and as utilized by the Food and Agriculture Organization of the United Nations (FAO) for global monitoring of tropical forests, forest cover, expressed as a percentage of the total forest area, was selected as the state indicator. By itself, forest cover provides only a partial picture of the state of the nation’s forest resources but it is generally accepted that a continuing decline of forest area signals unsustainable practices and environmental threats that extend well beyond the forests themselves.
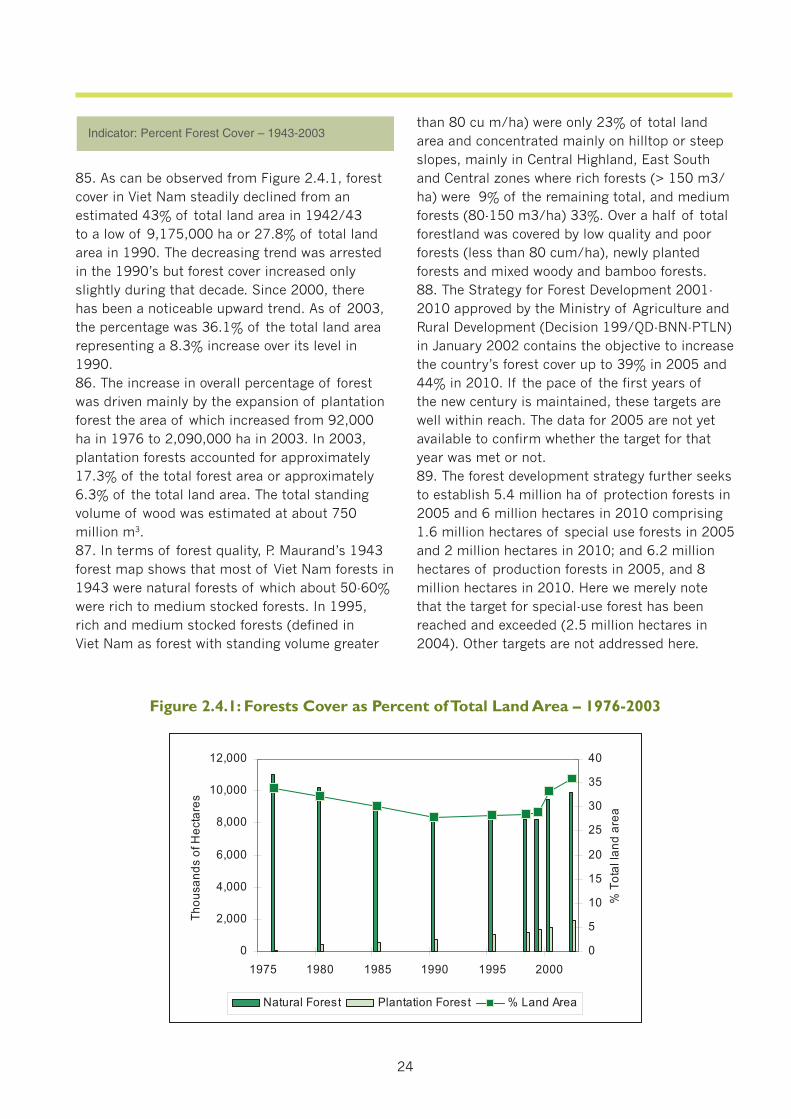
24
85. As can be observed from Figure 2.4.1, forest cover in Viet Nam steadily declined from an estimated 43% of total land area in 1942/43 to a low of 9,175,000 ha or 27.8% of total land area in 1990. The decreasing trend was arrested in the 1990’s but forest cover increased only slightly during that decade. Since 2000, there has been a noticeable upward trend. As of 2003, the percentage was 36.1% of the total land area representing a 8.3% increase over its level in 1990.86. The increase in overall percentage of forest was driven mainly by the expansion of plantation forest the area of which increased from 92,000 ha in 1976 to 2,090,000 ha in 2003. In 2003, plantation forests accounted for approximately 17.3% of the total forest area or approximately 6.3% of the total land area. The total standing volume of wood was estimated at about 750 million m3.87. In terms of forest quality, P. Maurand’s 1943 forest map shows that most of Viet Nam forests in 1943 were natural forests of which about 50-60% were rich to medium stocked forests. In 1995, rich and medium stocked forests (defined in Viet Nam as forest with standing volume greater
Indicator: Percent Forest Cover – 1943-2003
Figure 2.4.1: Forests Cover as Percent of Total Land Area – 1976-2003
0
2,000
4,000
6,000
8,000
10,000
12,000
1975 1980 1985 1990 1995 2000
Tho
usa
nds
ofH
ect
are
s
0
5
10
15
20
25
30
35
40
%To
tall
and
are
a
Natural Forest Plantation Forest % Land Area
than 80 cu m/ha) were only 23% of total land area and concentrated mainly on hilltop or steep slopes, mainly in Central Highland, East South and Central zones where rich forests (> 150 m3/ha) were 9% of the remaining total, and medium forests (80-150 m3/ha) 33%. Over a half of total forestland was covered by low quality and poor forests (less than 80 cum/ha), newly planted forests and mixed woody and bamboo forests. 88. The Strategy for Forest Development 2001-2010 approved by the Ministry of Agriculture and Rural Development (Decision 199/QD-BNN-PTLN) in January 2002 contains the objective to increase the country’s forest cover up to 39% in 2005 and 44% in 2010. If the pace of the first years of the new century is maintained, these targets are well within reach. The data for 2005 are not yet available to confirm whether the target for that year was met or not. 89. The forest development strategy further seeks to establish 5.4 million ha of protection forests in 2005 and 6 million hectares in 2010 comprising 1.6 million hectares of special use forests in 2005 and 2 million hectares in 2010; and 6.2 million hectares of production forests in 2005, and 8 million hectares in 2010. Here we merely note that the target for special-use forest has been reached and exceeded (2.5 million hectares in 2004). Other targets are not addressed here.
25
2.4.3 Pressure90. The pressures on forest resources in Viet Nam have been many and no single indicator can capture them all. The post-war reconstruction, the dramatic rise in population which depends on wood for fuel, the demand for more agricultural land, shifting cultivation in the upland areas, forest fires, conversion of forests to tree crops and unsustainable forest management practices have all had an impact on the forest and its conditionss.91. An indicator based on per capita fuelwood production developped earlier on in the assessment process for all GMS countries concluded that the per capita fuelwood production of Viet Nam had always been lower than that of other GMS countries and lagged the population growth: while the population of Viet Nam grew 2.5 times between 1960 to 2002 (from 34 million to 80 million people), fuelwood production inceased only 1.6 times and consumption per capita declined from 0.47 m3 to 0.33m3 per annum. Fuelwood consumption remains a source of pressure, especially with rising population, but this trend has been largely offset in Viet Nam by improved availability of alternative energies and better forest protection.92. Forest fires are perceived to be a major contributing factor and some 5 million hectares of forest are vulnerable to the risk of forest fires each year. Yet the total area destroyed by forest fires from 1995 to 2003 as recorded by the General Statistics Office only amounted to 57,300 hectares. 93. The net effect of converting forests to tree crops (rubber foremost among them) is partially captured by the state indicator which differentiates between plantation and natural forest. The data do not show the area of natural
Suggested Rating: Average and ImprovingJustifi cation: After a long period of decline, from 42% of total land area in 1943 to a low of 27.8% in 1990, the decline was subdued in the 1990’s and the trend reversed at the turn of the new millennium. In 2003, 36.1% of total land area was under forest, close to the target of 39% target set for the year 2005.
forest converted to plantations but they illustrate well the recent overall rise in the area of forest plantations.
94. The magnitude and effect of unsustainable forest management practices, or the over-exploitation of the resource, is best captured in an indicator fact sheet earlier developed for the Greater Mekong Subregion as a whole. It is based on FAO historical estimates of forest areas and wood removals but some of the figures have been replaced by in-country estimates. This indicator is expressed as the ratio of total annual roundwood production, in cubic meters, over the total forest area in thousands of hectares. 95. Roundwood production refers to all wood in the rough, whether destined for industrial or fuelwood uses. All wood felled or harvested from forests and trees outside the forest, with or without bark, round, split, roughly squared, or in other forms such as roots and stumps, is included. Wood that is harvested for charcoal production is also included. All wood production data refer to both coniferous and non-coniferous species.96. Total forest area includes both natural forests and plantations. Total forest area is defined as land with tree crown cover of more than 10% of the ground and area of more than 0.5 hectares. Tree height at maturity should exceed 5 meters. 97. The range of this indicator within GMS countries is between zero and 3,500 M3/1000 hectares. Global averages for the last 34 years are between 500 and 765 M3/1000 hectares. OECD countries as a whole are slightly above this global average but have remained under 1000 M3/1000 hectares over the last 34 years. 98. As can be observed from Figure 2.4.2, Viet Nam’s rate of wood removal was slightly above that of other GMS countries in the early 1960’s and rose at a rate comparable to that of other GMS countries in the 1970’s. In 1980’s however, as forest cover continued to decline, roundwood production continued to rise and the ratio of roundwood production over total forest area increased from 2,273 M3/1000 hectares in 1980 to 3,321 M3/1000 hectares in 1990. The
Indicator: Ratio of Roundwood Production Over Total Forest Area – 1961- 2000
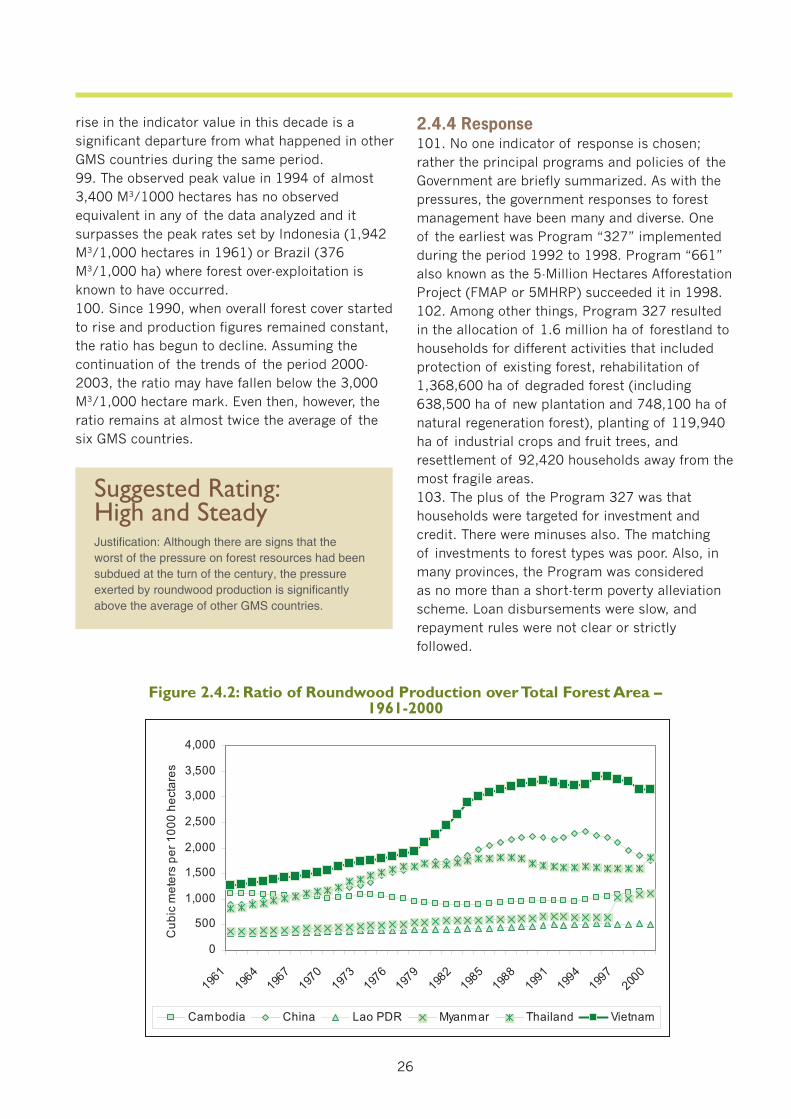
26
rise in the indicator value in this decade is a significant departure from what happened in other GMS countries during the same period.99. The observed peak value in 1994 of almost 3,400 M3/1000 hectares has no observed equivalent in any of the data analyzed and it surpasses the peak rates set by Indonesia (1,942 M3/1,000 hectares in 1961) or Brazil (376 M3/1,000 ha) where forest over-exploitation is known to have occurred. 100. Since 1990, when overall forest cover started to rise and production figures remained constant, the ratio has begun to decline. Assuming the continuation of the trends of the period 2000-2003, the ratio may have fallen below the 3,000 M3/1,000 hectare mark. Even then, however, the ratio remains at almost twice the average of the six GMS countries.
Figure 2.4.2: Ratio of Roundwood Production over Total Forest Area – 1961-2000
2.4.4 Response101. No one indicator of response is chosen; rather the principal programs and policies of the Government are briefly summarized. As with the pressures, the government responses to forest management have been many and diverse. One of the earliest was Program “327” implemented during the period 1992 to 1998. Program “661” also known as the 5-Million Hectares Afforestation Project (FMAP or 5MHRP) succeeded it in 1998.102. Among other things, Program 327 resulted in the allocation of 1.6 million ha of forestland to households for different activities that included protection of existing forest, rehabilitation of 1,368,600 ha of degraded forest (including 638,500 ha of new plantation and 748,100 ha of natural regeneration forest), planting of 119,940 ha of industrial crops and fruit trees, and resettlement of 92,420 households away from the most fragile areas.103. The plus of the Program 327 was that households were targeted for investment and credit. There were minuses also. The matching of investments to forest types was poor. Also, in many provinces, the Program was considered as no more than a short-term poverty alleviation scheme. Loan disbursements were slow, and repayment rules were not clear or strictly followed.
0
500
1,000
1,500
2,000
2,500
3,000
3,500
4,000
1961
1964
1967
1970
1973
1976
1979
1982
1985
1988
1991
1994
1997
2000
Cu
bic
me
ters
per
1000
hect
are
s
Cambodia China Lao PDR Myanmar Thailand Vietnam
Suggested Rating: High and SteadyJustifi cation: Although there are signs that the worst of the pressure on forest resources had been subdued at the turn of the century, the pressure exerted by roundwood production is signifi cantly above the average of other GMS countries.
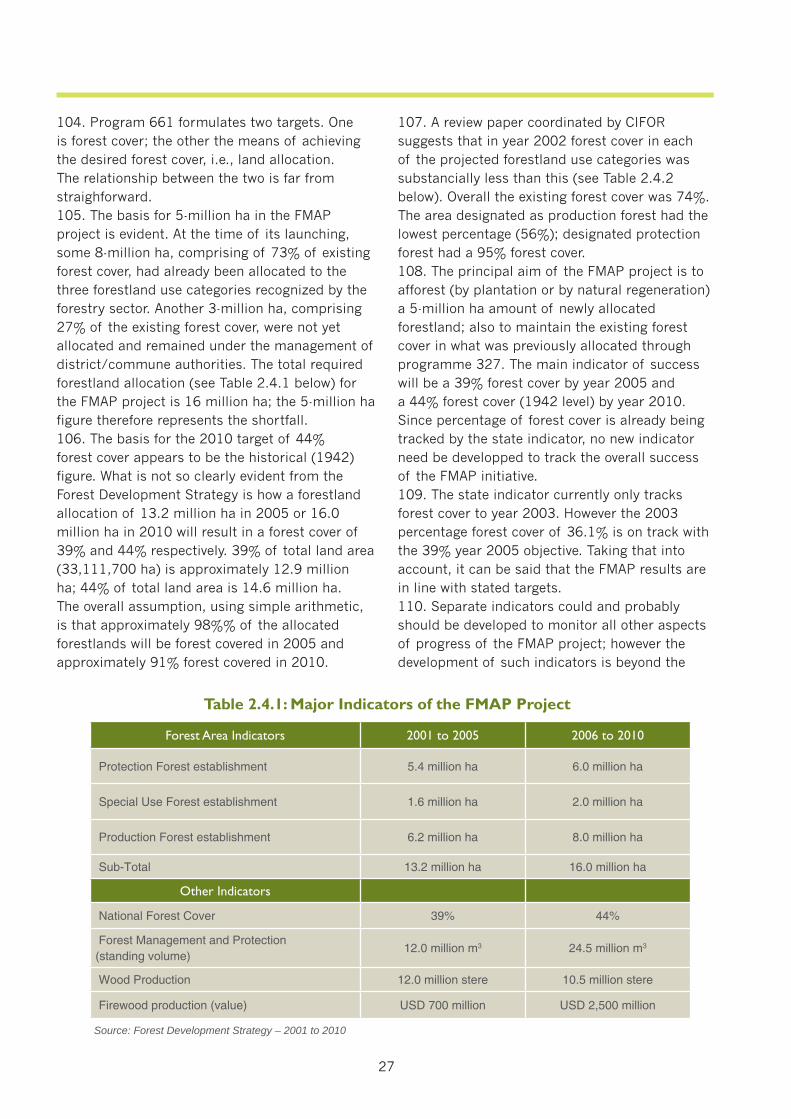
27
104. Program 661 formulates two targets. One is forest cover; the other the means of achieving the desired forest cover, i.e., land allocation. The relationship between the two is far from straighforward. 105. The basis for 5-million ha in the FMAP project is evident. At the time of its launching, some 8-million ha, comprising of 73% of existing forest cover, had already been allocated to the three forestland use categories recognized by the forestry sector. Another 3-million ha, comprising 27% of the existing forest cover, were not yet allocated and remained under the management of district/commune authorities. The total required forestland allocation (see Table 2.4.1 below) for the FMAP project is 16 million ha; the 5-million ha figure therefore represents the shortfall.106. The basis for the 2010 target of 44% forest cover appears to be the historical (1942) figure. What is not so clearly evident from the Forest Development Strategy is how a forestland allocation of 13.2 million ha in 2005 or 16.0 million ha in 2010 will result in a forest cover of 39% and 44% respectively. 39% of total land area (33,111,700 ha) is approximately 12.9 million ha; 44% of total land area is 14.6 million ha. The overall assumption, using simple arithmetic, is that approximately 98%% of the allocated forestlands will be forest covered in 2005 and approximately 91% forest covered in 2010.
107. A review paper coordinated by CIFOR suggests that in year 2002 forest cover in each of the projected forestland use categories was substancially less than this (see Table 2.4.2 below). Overall the existing forest cover was 74%. The area designated as production forest had the lowest percentage (56%); designated protection forest had a 95% forest cover.108. The principal aim of the FMAP project is to afforest (by plantation or by natural regeneration) a 5-million ha amount of newly allocated forestland; also to maintain the existing forest cover in what was previously allocated through programme 327. The main indicator of success will be a 39% forest cover by year 2005 and a 44% forest cover (1942 level) by year 2010. Since percentage of forest cover is already being tracked by the state indicator, no new indicator need be developped to track the overall success of the FMAP initiative.109. The state indicator currently only tracks forest cover to year 2003. However the 2003 percentage forest cover of 36.1% is on track with the 39% year 2005 objective. Taking that into account, it can be said that the FMAP results are in line with stated targets.110. Separate indicators could and probably should be developed to monitor all other aspects of progress of the FMAP project; however the development of such indicators is beyond the
Table 2.4.1: Major Indicators of the FMAP Project
Source: Forest Development Strategy – 2001 to 2010
Forest Area Indicators 2001 to 2005 2006 to 2010
Protection Forest establishment 5.4 million ha 6.0 million ha
Special Use Forest establishment 1.6 million ha 2.0 million ha
Production Forest establishment 6.2 million ha 8.0 million ha
Sub-Total 13.2 million ha 16.0 million ha
Other Indicators
National Forest Cover 39% 44%
Forest Management and Protection (standing volume)
12.0 million m3 24.5 million m3
Wood Production 12.0 million stere 10.5 million stere
Firewood production (value) USD 700 million USD 2,500 million
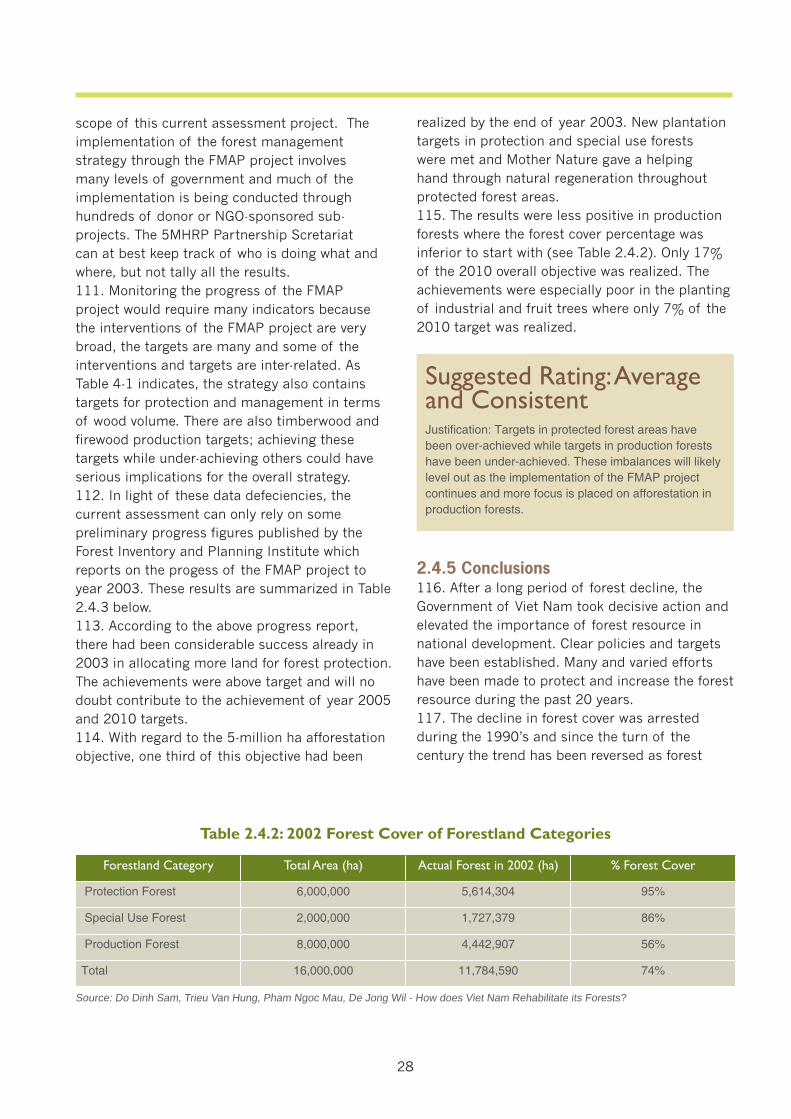
28
scope of this current assessment project. The implementation of the forest management strategy through the FMAP project involves many levels of government and much of the implementation is being conducted through hundreds of donor or NGO-sponsored sub-projects. The 5MHRP Partnership Scretariat can at best keep track of who is doing what and where, but not tally all the results.111. Monitoring the progress of the FMAP project would require many indicators because the interventions of the FMAP project are very broad, the targets are many and some of the interventions and targets are inter-related. As Table 4-1 indicates, the strategy also contains targets for protection and management in terms of wood volume. There are also timberwood and firewood production targets; achieving these targets while under-achieving others could have serious implications for the overall strategy.112. In light of these data defeciencies, the current assessment can only rely on some preliminary progress figures published by the Forest Inventory and Planning Institute which reports on the progess of the FMAP project to year 2003. These results are summarized in Table 2.4.3 below.113. According to the above progress report, there had been considerable success already in 2003 in allocating more land for forest protection. The achievements were above target and will no doubt contribute to the achievement of year 2005 and 2010 targets.114. With regard to the 5-million ha afforestation objective, one third of this objective had been
Table 2.4.2: 2002 Forest Cover of Forestland Categories
Forestland Category Total Area (ha) Actual Forest in 2002 (ha) % Forest Cover
Protection Forest 6,000,000 5,614,304 95%
Special Use Forest 2,000,000 1,727,379 86%
Production Forest 8,000,000 4,442,907 56%
Total 16,000,000 11,784,590 74%
realized by the end of year 2003. New plantation targets in protection and special use forests were met and Mother Nature gave a helping hand through natural regeneration throughout protected forest areas.115. The results were less positive in production forests where the forest cover percentage was inferior to start with (see Table 2.4.2). Only 17% of the 2010 overall objective was realized. The achievements were especially poor in the planting of industrial and fruit trees where only 7% of the 2010 target was realized.
2.4.5 Conclusions116. After a long period of forest decline, the Government of Viet Nam took decisive action and elevated the importance of forest resource in national development. Clear policies and targets have been established. Many and varied efforts have been made to protect and increase the forest resource during the past 20 years.117. The decline in forest cover was arrested during the 1990’s and since the turn of the century the trend has been reversed as forest
Source: Do Dinh Sam, Trieu Van Hung, Pham Ngoc Mau, De Jong Wil - How does Viet Nam Rehabilitate its Forests?
Suggested Rating: Average and ConsistentJustifi cation: Targets in protected forest areas have been over-achieved while targets in production forests have been under-achieved. These imbalances will likely level out as the implementation of the FMAP project continues and more focus is placed on afforestation in production forests.
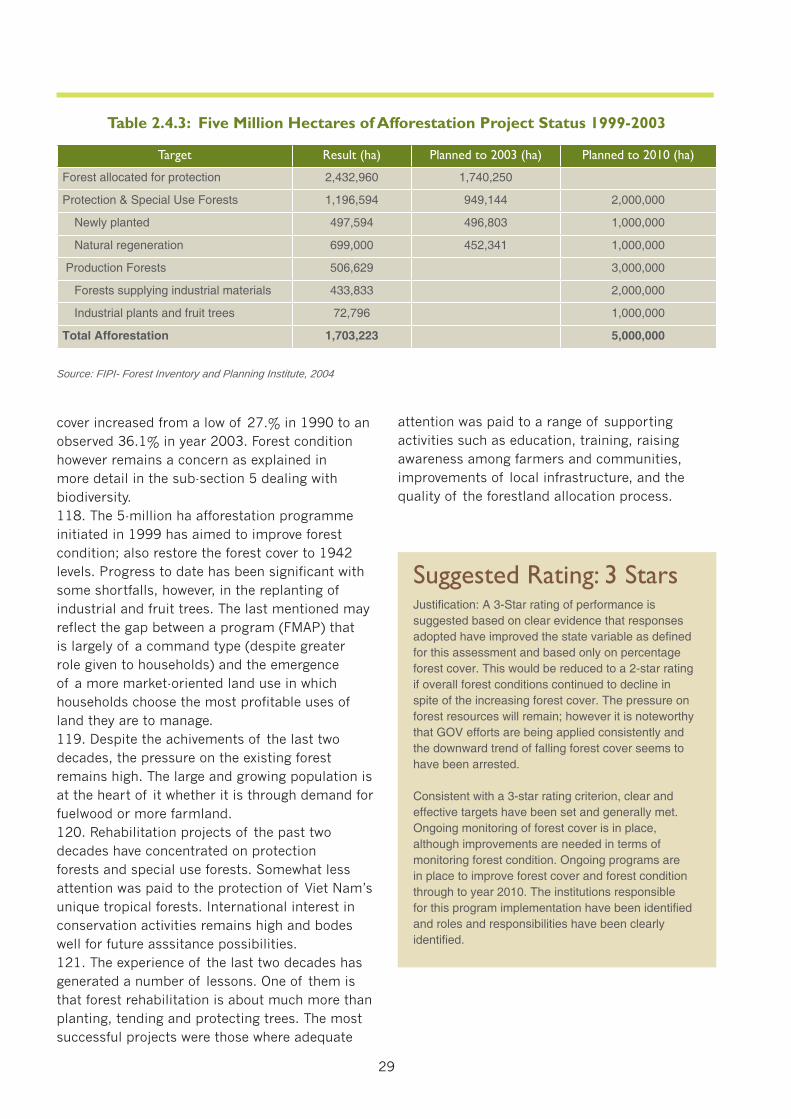
29
cover increased from a low of 27.% in 1990 to an observed 36.1% in year 2003. Forest condition however remains a concern as explained in more detail in the sub-section 5 dealing with biodiversity.118. The 5-million ha afforestation programme initiated in 1999 has aimed to improve forest condition; also restore the forest cover to 1942 levels. Progress to date has been significant with some shortfalls, however, in the replanting of industrial and fruit trees. The last mentioned may reflect the gap between a program (FMAP) that is largely of a command type (despite greater role given to households) and the emergence of a more market-oriented land use in which households choose the most profitable uses of land they are to manage. 119. Despite the achivements of the last two decades, the pressure on the existing forest remains high. The large and growing population is at the heart of it whether it is through demand for fuelwood or more farmland. 120. Rehabilitation projects of the past two decades have concentrated on protection forests and special use forests. Somewhat less attention was paid to the protection of Viet Nam’s unique tropical forests. International interest in conservation activities remains high and bodes well for future asssitance possibilities. 121. The experience of the last two decades has generated a number of lessons. One of them is that forest rehabilitation is about much more than planting, tending and protecting trees. The most successful projects were those where adequate
Table 2.4.3: Five Million Hectares of Afforestation Project Status 1999-2003
attention was paid to a range of supporting activities such as education, training, raising awareness among farmers and communities, improvements of local infrastructure, and the quality of the forestland allocation process.
Target Result (ha) Planned to 2003 (ha) Planned to 2010 (ha)
Forest allocated for protection 2,432,960 1,740,250
Protection & Special Use Forests 1,196,594 949,144 2,000,000
Newly planted 497,594 496,803 1,000,000
Natural regeneration 699,000 452,341 1,000,000
Production Forests 506,629 3,000,000
Forests supplying industrial materials 433,833 2,000,000
Industrial plants and fruit trees 72,796 1,000,000
Total Afforestation 1,703,223 5,000,000
Source: FIPI- Forest Inventory and Planning Institute, 2004
Suggested Rating: 3 StarsJustifi cation: A 3-Star rating of performance is suggested based on clear evidence that responses adopted have improved the state variable as defi ned for this assessment and based only on percentage forest cover. This would be reduced to a 2-star rating if overall forest conditions continued to decline in spite of the increasing forest cover. The pressure on forest resources will remain; however it is noteworthy that GOV efforts are being applied consistently and the downward trend of falling forest cover seems to have been arrested.
Consistent with a 3-star rating criterion, clear and effective targets have been set and generally met. Ongoing monitoring of forest cover is in place, although improvements are needed in terms of monitoring forest condition. Ongoing programs are in place to improve forest cover and forest condition through to year 2010. The institutions responsible for this program implementation have been identifi ed and roles and responsibilities have been clearly identifi ed.
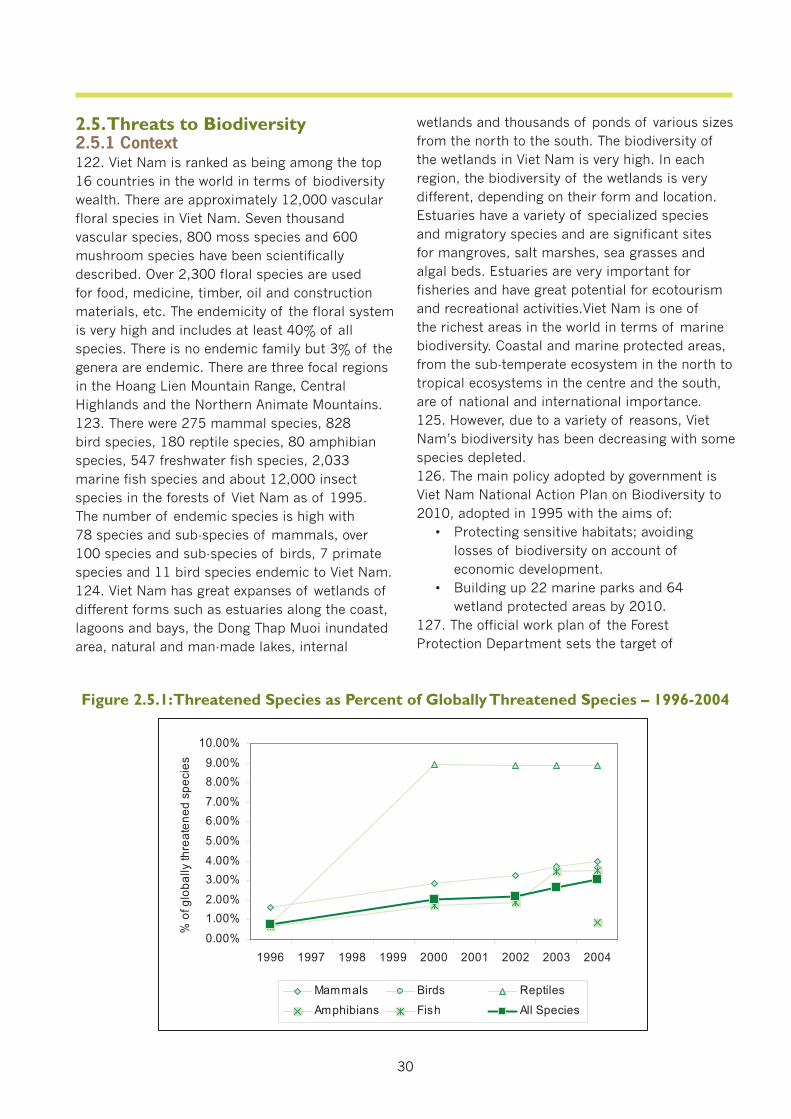
30
2.5. Threats to Biodiversity 2.5.1 Context122. Viet Nam is ranked as being among the top 16 countries in the world in terms of biodiversity wealth. There are approximately 12,000 vascular floral species in Viet Nam. Seven thousand vascular species, 800 moss species and 600 mushroom species have been scientifically described. Over 2,300 floral species are used for food, medicine, timber, oil and construction materials, etc. The endemicity of the floral system is very high and includes at least 40% of all species. There is no endemic family but 3% of the genera are endemic. There are three focal regions in the Hoang Lien Mountain Range, Central Highlands and the Northern Animate Mountains.123. There were 275 mammal species, 828 bird species, 180 reptile species, 80 amphibian species, 547 freshwater fish species, 2,033 marine fish species and about 12,000 insect species in the forests of Viet Nam as of 1995. The number of endemic species is high with 78 species and sub-species of mammals, over 100 species and sub-species of birds, 7 primate species and 11 bird species endemic to Viet Nam. 124. Viet Nam has great expanses of wetlands of different forms such as estuaries along the coast, lagoons and bays, the Dong Thap Muoi inundated area, natural and man-made lakes, internal
wetlands and thousands of ponds of various sizes from the north to the south. The biodiversity of the wetlands in Viet Nam is very high. In each region, the biodiversity of the wetlands is very different, depending on their form and location. Estuaries have a variety of specialized species and migratory species and are significant sites for mangroves, salt marshes, sea grasses and algal beds. Estuaries are very important for fisheries and have great potential for ecotourism and recreational activities.Viet Nam is one of the richest areas in the world in terms of marine biodiversity. Coastal and marine protected areas, from the sub-temperate ecosystem in the north to tropical ecosystems in the centre and the south, are of national and international importance.125. However, due to a variety of reasons, Viet Nam’s biodiversity has been decreasing with some species depleted. 126. The main policy adopted by government is Viet Nam National Action Plan on Biodiversity to 2010, adopted in 1995 with the aims of: • Protecting sensitive habitats; avoiding
losses of biodiversity on account of economic development.
• Building up 22 marine parks and 64 wetland protected areas by 2010.
127. The official work plan of the Forest Protection Department sets the target of
Figure 2.5.1: Threatened Species as Percent of Globally Threatened Species – 1996-2004
0.00%
1.00%
2.00%
3.00%
4.00%
5.00%
6.00%
7.00%
8.00%
9.00%
10.00%
1996 1997 1998 1999 2000 2001 2002 2003 2004
%of
glo
bally
thre
ate
ned
spe
cie
s
Mammals Birds Reptiles
Amphibians Fish All Species
31
Indicator: Threatened Species as Percent of Globally Threatened Species – 1996-2004
increasing protected areas to 2.6 million ha—equivalent to 8% of the total land area- by 2010, and increaing the number of protected areas from 17 in 2002 to 30 in 2010. 2.5.2 State128. As with most developing countries, Viet Nam is far from having completed an inventory of its biological resources and there are many conflicting figures on the number of existing species in both fauna and flora in the literature. Therefore a state indicator which is sensitive to both nationally threatened and globally threatened species is not feasible at this time.
129. The selected state indicator is therefore based on globally threatened species, as defined and monitored by the International Union for the Conservation of Nature (IUCN) in the “Red List of Threatened Species”. This standardized data source attempts to track all endangered species, regardless of origin, with a mapping to individual countries based on the range of the individual species. 130. This indicator tracks the number of threatened species over time. It is expressed as the percentage of the number of threatened species at the national level over the number of threatened species at the global level. Expressed as a percentage of globally threatened species, the resultant value is indicative of a country’s share of globally threatened species. 131. Threatened species are those defined by the IUCN as vulnerable, endangered or critically endangered in the “Red List of Threatened Species”. Extinct or lower risk (conservation dependent, near threatened or least concern) do not form part of this indicator. Species under consideration include mammals, birds, reptiles, amphibians and fish; plant and insect species, for which the process of evaluation has only just begun, are excluded from the indicator figures. Sub-indicator values are also given for mammals, birds, reptiles, amphibians and fish species.132. As can be observed from the final 2004 results in Figure 2.5.1, Viet Nam is a tentative sanctuary to approximately 3% of the globally
threatened wildlife species. This standing includes approximately 4% of globally threatened mammals, 3.6% of globally threatened birds, 8.9% of globally threatened reptiles, 0.9% of globally threatened amphibians and 3.5% of globally threatened fish.133. It is highlighted here that the rise in the share of globally threatened species from 0.75% in 1996 to 3.05% in 2004 is largely attributed to the progress of the evaluation work of IUCN and is not necessarily indicative of a trend of loss of biodiversity in Viet Nam during the period 1996 to 2004. The 0.75% value in 1996 is based on the first version of the IUCN RedBook, when some relevant mammal, reptile and fish species had been evaluated but at which time amphibians and birds were not yet part of the equation. The bulk of the relevant reptiles were not evaluated until year 2000 and relevant amphibians and birds were not evaluated until year 2004.Therefore the indicator value and the trend before 2004 has very little meaning.134. Subsequent to 2004 and now that the indicator value is inclusive of all threatened species tracked by this indicator, the future value of the indicator will be more indicative of the trend in the loss of biodiversity in Viet Nam. It is not expected to vary dramatically from the 2004 figures. It may artificially rise if new globally threatened species also have sanctuary in Viet Nam; it may artificially fall if new threatened species have sanctuary outside of Viet Nam. Some of this artificial oscillation can already be observed in the reptile species since year 2000. While the indicator serves well to measure Viet Nam’s share of the global priority, only changes in the status of individual species (as detailed in the relevant fact sheet) can be utilized to measure progress at the national level. Any future decrease in the level of endangerment of the listed species, or the removal of the species from the list, is indicative of progress in conserving biodiversity; any future increase in the level of endangerment will be a negative indication of progress.135. With regards to the degree of vulnerability of these threatened species, as of 2004, 84 species were listed as vulnerable, 50 as endangered and 24 as critically endangered. It is also observed that not all of Viet Nam’s share of the globally threatened species are endemic to Viet Nam and
32
therefore Viet Nam alone is not solely responsible for its 3% share of globally threatened species. However, 16 of the threatened species are endemic to Viet Nam and for another 6 threatened species, Viet Nam and one of its GMS neighbors share the responsibility. 136. While the overall intent of biodiversity conservation measures may be to reduce the number of threatened species specific to one country, target figures are seldom expressed in these terms. Targets in biodiversity conservation are normally expressed in terms of response, not as state variables. This is the case also in Viet Nam where the principal policy document, i.e., the 1995 Viet Nam National Action Plan on Biodiversity, sets the 2010 target as : • Protecting the sensitive habitat; avoiding the
loss of biodiversity on account of economic development; and
• Creating 22 marine parks and 64 wetland protected areas by 2010.
137. Other relevant policy is the Forest Protection Department’s plan to increase the protected areas to 2.6 million ha, equivalent to 8% of the total land area, by 2010.138. With the lack of specific targets upon which to evaluate the current state of biodiversity in Viet Nam, the value of the indicator can only be compared with the value of the same indicator in other GMS countries to obtain a comparative value. This comparative analysis has been completed in the related fact sheet with the conclusion that Viet Nam’s 3.1% share of the globally threatened species, as tracked by this indicator, is the highest amongst all GMS countries, including Yunnan Province.139. The state indicator analysis has also provided some insight as to what are the habitats of the threatened species in Viet Nam and what are the major threats to those threatened species. Forests were identified as the dominant habitat for approximately 35% of the threatened mammals, birds and amphibians but loss of wetlands and grasslands were equally important to threatened bird species. Therefore pressure indicators which attempt to track the loss of habitat are an appropriate choice.
Suggested Rating: Relatively Poor with No Observable TrendJustifi cation: Viet Nam’s 3.1% of globally threatened species is the highest amongst all GMS countries (including Yunnan Province) and well above the average (2.1%) of all GMS countries combined. Based on a comparison of this indicator with the indicator value of other GMS countries, it is concluded that the current state of biodiversity in Vietnam is relatively poor. Viet Nam is exceptionally rich in biodiversity but has not done a very good job protecting it. As previously highlighted, the rise of the indicator value from 0.75% in 1996 to 3.1% in 2004 is not indicative of the loss of biodiversity during such period. Therefore no observable past trend can be deduced from this indicator.
Indicator: Loss of Natural Forest Habitat – 1980-1998
2.5.3 Pressure140. Loss of forest cover has already been addressed under the forest resources concern and there is no need to repeat such indicator here. Instead, the loss of natural forests, which has been monitored by the Forestry Inventory and Planning Institute since 1980, has been selected as the pressure indicator.
141. This indicator attempts to track the loss of natural forests over time; it is expressed as the net amount, in thousands of hectares, of remaining natural forest over time. Natural forest area is defined by the Viet Nam Forestry Inventory and Planning Institute as un-disturbed forest in one of the following categories: (i) mountain forest (ii) mixed forest (iii) wetland forest (iv) wood forest or (v) mangrove forest.142. As can be observed from Figure 2.5.2, the natural forest area has declined from approximately 3.6 million ha in 1980 to approximately 2.5 million ha in 1998. This represents a loss of approximately 1.1 million ha over the 18-year period.143. The rate of decline accelerated during the period 1980 to 1990 and it appears to have been subdued somewhat during the period 1990 to 1998. However this is largely due to an increase in the mixed forest type that supports
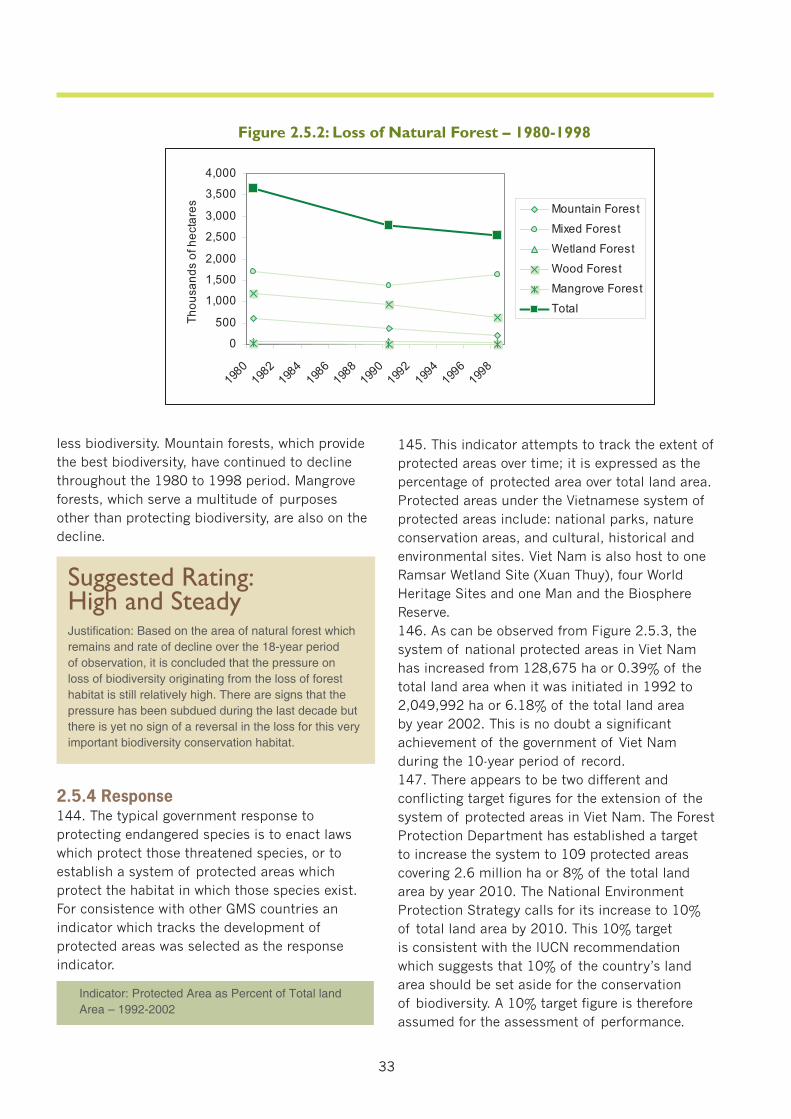
33
less biodiversity. Mountain forests, which provide the best biodiversity, have continued to decline throughout the 1980 to 1998 period. Mangrove forests, which serve a multitude of purposes other than protecting biodiversity, are also on the decline.
2.5.4 Response144. The typical government response to protecting endangered species is to enact laws which protect those threatened species, or to establish a system of protected areas which protect the habitat in which those species exist. For consistence with other GMS countries an indicator which tracks the development of protected areas was selected as the response indicator.
Figure 2.5.2: Loss of Natural Forest – 1980-1998
0
500
1,000
1,500
2,000
2,500
3,000
3,500
4,000
1980
1982
1984
1986
1988
1990
1992
1994
1996
1998
Thou
san
dsof
hect
are
s Mountain Forest
Mixed Forest
Wetland Forest
Wood Forest
Mangrove Forest
Total
Suggested Rating: High and Steady Justifi cation: Based on the area of natural forest which remains and rate of decline over the 18-year period of observation, it is concluded that the pressure on loss of biodiversity originating from the loss of forest habitat is still relatively high. There are signs that the pressure has been subdued during the last decade but there is yet no sign of a reversal in the loss for this very important biodiversity conservation habitat.
Indicator: Protected Area as Percent of Total land Area – 1992-2002
145. This indicator attempts to track the extent of protected areas over time; it is expressed as the percentage of protected area over total land area. Protected areas under the Vietnamese system of protected areas include: national parks, nature conservation areas, and cultural, historical and environmental sites. Viet Nam is also host to one Ramsar Wetland Site (Xuan Thuy), four World Heritage Sites and one Man and the Biosphere Reserve.146. As can be observed from Figure 2.5.3, the system of national protected areas in Viet Nam has increased from 128,675 ha or 0.39% of the total land area when it was initiated in 1992 to 2,049,992 ha or 6.18% of the total land area by year 2002. This is no doubt a significant achievement of the government of Viet Nam during the 10-year period of record.147. There appears to be two different and conflicting target figures for the extension of the system of protected areas in Viet Nam. The Forest Protection Department has established a target to increase the system to 109 protected areas covering 2.6 million ha or 8% of the total land area by year 2010. The National Environment Protection Strategy calls for its increase to 10% of total land area by 2010. This 10% target is consistent with the IUCN recommendation which suggests that 10% of the country’s land area should be set aside for the conservation of biodiversity. A 10% target figure is therefore assumed for the assessment of performance.
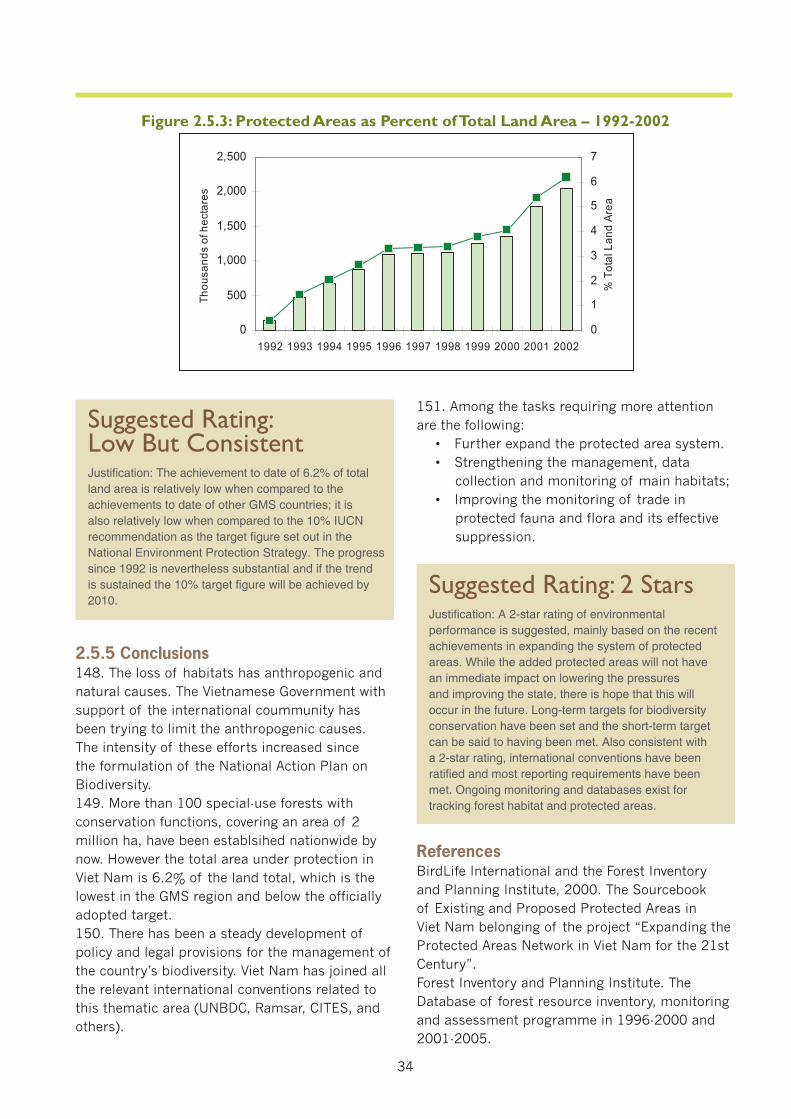
34
2.5.5 Conclusions 148. The loss of habitats has anthropogenic and natural causes. The Vietnamese Government with support of the international coummunity has been trying to limit the anthropogenic causes. The intensity of these efforts increased since the formulation of the National Action Plan on Biodiversity. 149. More than 100 special-use forests with conservation functions, covering an area of 2 million ha, have been establsihed nationwide by now. However the total area under protection in Viet Nam is 6.2% of the land total, which is the lowest in the GMS region and below the officially adopted target. 150. There has been a steady development of policy and legal provisions for the management of the country’s biodiversity. Viet Nam has joined all the relevant international conventions related to this thematic area (UNBDC, Ramsar, CITES, and others).
Suggested Rating: Low But ConsistentJustifi cation: The achievement to date of 6.2% of total land area is relatively low when compared to the achievements to date of other GMS countries; it is also relatively low when compared to the 10% IUCN recommendation as the target fi gure set out in the National Environment Protection Strategy. The progress since 1992 is nevertheless substantial and if the trend is sustained the 10% target fi gure will be achieved by 2010.
151. Among the tasks requiring more attention are the following: • Further expand the protected area system. • Strengthening the management, data
collection and monitoring of main habitats; • Improving the monitoring of trade in
protected fauna and flora and its effective suppression.
Suggested Rating: 2 StarsJustifi cation: A 2-star rating of environmental performance is suggested, mainly based on the recent achievements in expanding the system of protected areas. While the added protected areas will not have an immediate impact on lowering the pressures and improving the state, there is hope that this will occur in the future. Long-term targets for biodiversity conservation have been set and the short-term target can be said to having been met. Also consistent with a 2-star rating, international conventions have been ratifi ed and most reporting requirements have been met. Ongoing monitoring and databases exist for tracking forest habitat and protected areas.
ReferencesBirdLife International and the Forest Inventory and Planning Institute, 2000. The Sourcebook of Existing and Proposed Protected Areas in Viet Nam belonging of the project “Expanding the Protected Areas Network in Viet Nam for the 21st Century”. Forest Inventory and Planning Institute. The Database of forest resource inventory, monitoring and assessment programme in 1996-2000 and 2001-2005.
Figure 2.5.3: Protected Areas as Percent of Total Land Area – 1992-2002
0
500
1,000
1,500
2,000
2,500
1992 1993 1994 1995 1996 1997 1998 1999 2000 2001 2002
Thou
san
dsof
hect
are
s
0
1
2
3
4
5
6
7
%T
otal
Land
Are
a
35
poor sedimentation from rivers, and exposure to typhoons and floods offer less favourable conditions for growth in some of the regions that are most disaster prone. The mangroves’ direct benefits include wood as well as roof thatching material, medicinal plants and honey. Since 80-90% of all marine fisheries production in Viet Nam (660,000 tons p.a.) comes from coastal waters less than 30 meters deep, mangrove forests play an indirect but vital an role as breeding, feeding, and nursery grounds for commercially important aquatic organisms. Through their filtering function, mangroves lessen the impact of toxic substances on surface and ground water as well as soils. Furthermore, mangrove forests serve as buffer zones against typhoons, floods and salinity intrusion, help protect sea dikes and limit coastal abrasion (which reaches 10-25 meters per year on roughly 20% of Viet Nam’s vast coastline).
2.6.2 State
155. Area of mangrove forest was selected as indicator of the state of coastal zone in Viet Nam. Depletion of mangroves poses a serious threat to the long term sustainability of Viet Nam’s coastal ecosystem with impacts on biodiversity and abundance of marine resources as explained above. From Figure 2.6.1 it can be observed that by 1995, the area of mangroves had declined to a third of its size in 1943. 156. The surge in shrimp aquaculture emerges as one of the leading causes of mangrove forest loss. The growth has been the greatest in the Mekong (Cuu Long) Delta, Quang Ninh and Hai Phong provinces. Other causes of mangrove losses include conversion to agricultural and construction lands, war destruction, and fuelwood collection.157. Mangrove formations now cover over 170,000 ha. Various government and international assistance projects have project specific targets for mangrove plantation and rehabilitation.
Indicator: Area of Mangrove Forest – 1943-2001
Forest Resource and Environment Center - Forest Inventory and Planning Institute, 2004. A Report of the Fauna and Flora Forest Resources in Viet Nam. Unpublished document.Nguyen Chu Hoi et.al., 2001. Setting up the basic scientific for planning marine park systems in Viet Nam.
2.6. Threats to Coastal Zones2.6.1 Context152. Viet Nam has a long coastline of 3,260 kilometers. This provides it with abundant marine resources and biodiversity, and a valuable location for commercial and industrial activities and people’s livelihoods. Fisheries, aquaculture, port development, navigation, oil and gas exploration and coastal tourism are the major commercial activities that simultaneously create economic opportunities and threaten the coastal zone systems through marine pollution, uncontrolled waste disposal, and loss of mangroves, to mention only the most important.153. The richness of coastal waters is considerable. They contain more than 2,000 fish species. Of these, approximately 130 species are economically important. Additionally, there are more than 1,600 species of crustaceans and 2,500 species of mollusks with an annual allowable catch of 50,000-60,000 and 60,000-70,000 tons respectively. The rare and endangered species listed in the IUCN Red Book (2002) of Viet Nam include: 5 mammals, 6 waterfowls living in wetlands, 5 marine turtle species, 1 crocodile, 53 marine fish, 15 corals, 5 echinoderms, 1 horseshoe crab, 2 marine crabs, 6 shrimp, 6 species of Palinuridae family, and 26 mollusk species. The very diverse ecosystems that nurture these habitat include wetlands (with mangroves particularly important), coral reefs and sea grasses. 154. Mangrove forests provide a variety of benefits to the national economy. Extensive mangroves occur on Mekong Delta in the south and Red River Delta in the north. The southern estuaries of the Mekong and Dong Nai rivers are the most favorable for mangrove growth. The lower temperatures and poorer soils in the north have limited the height of trees. Although mangroves occur along the central coast, the narrow tidal flats in this region combined with
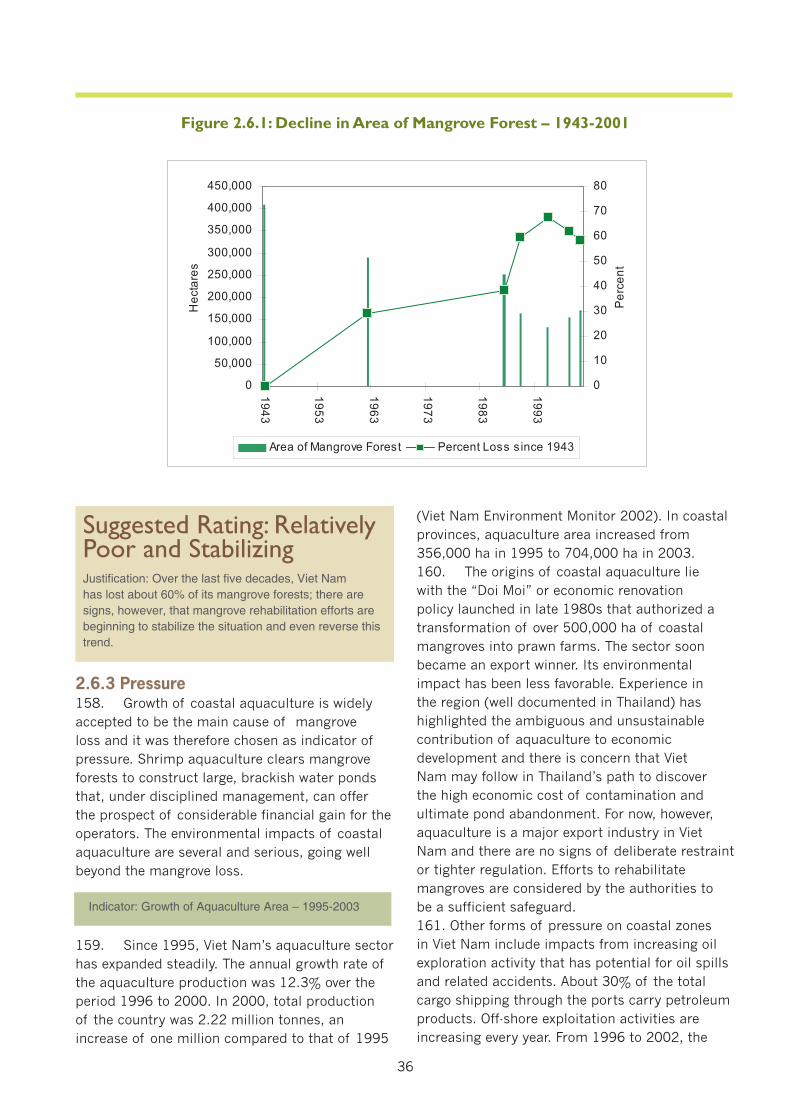
36
Figure 2.6.1: Decline in Area of Mangrove Forest – 1943-2001
0
50,000
100,000
150,000
200,000
250,000
300,000
350,000
400,000
450,000
194
3
195
3
196
3
197
3
198
3
199
3
Hec
tare
s
0
10
20
30
40
50
60
70
80
Pe
rcen
t
Area of Mangrove Forest Percent Loss since 1943
2.6.3 Pressure158. Growth of coastal aquaculture is widely accepted to be the main cause of mangrove loss and it was therefore chosen as indicator of pressure. Shrimp aquaculture clears mangrove forests to construct large, brackish water ponds that, under disciplined management, can offer the prospect of considerable financial gain for the operators. The environmental impacts of coastal aquaculture are several and serious, going well beyond the mangrove loss.
159. Since 1995, Viet Nam’s aquaculture sector has expanded steadily. The annual growth rate of the aquaculture production was 12.3% over the period 1996 to 2000. In 2000, total production of the country was 2.22 million tonnes, an increase of one million compared to that of 1995
Indicator: Growth of Aquaculture Area – 1995-2003
Suggested Rating: Relatively Poor and StabilizingJustifi cation: Over the last fi ve decades, Viet Nam has lost about 60% of its mangrove forests; there are signs, however, that mangrove rehabilitation efforts are beginning to stabilize the situation and even reverse this trend.
(Viet Nam Environment Monitor 2002). In coastal provinces, aquaculture area increased from 356,000 ha in 1995 to 704,000 ha in 2003.160. The origins of coastal aquaculture lie with the “Doi Moi” or economic renovation policy launched in late 1980s that authorized a transformation of over 500,000 ha of coastal mangroves into prawn farms. The sector soon became an export winner. Its environmental impact has been less favorable. Experience in the region (well documented in Thailand) has highlighted the ambiguous and unsustainable contribution of aquaculture to economic development and there is concern that Viet Nam may follow in Thailand’s path to discover the high economic cost of contamination and ultimate pond abandonment. For now, however, aquaculture is a major export industry in Viet Nam and there are no signs of deliberate restraint or tighter regulation. Efforts to rehabilitate mangroves are considered by the authorities to be a sufficient safeguard.161. Other forms of pressure on coastal zones in Viet Nam include impacts from increasing oil exploration activity that has potential for oil spills and related accidents. About 30% of the total cargo shipping through the ports carry petroleum products. Off-shore exploitation activities are increasing every year. From 1996 to 2002, the
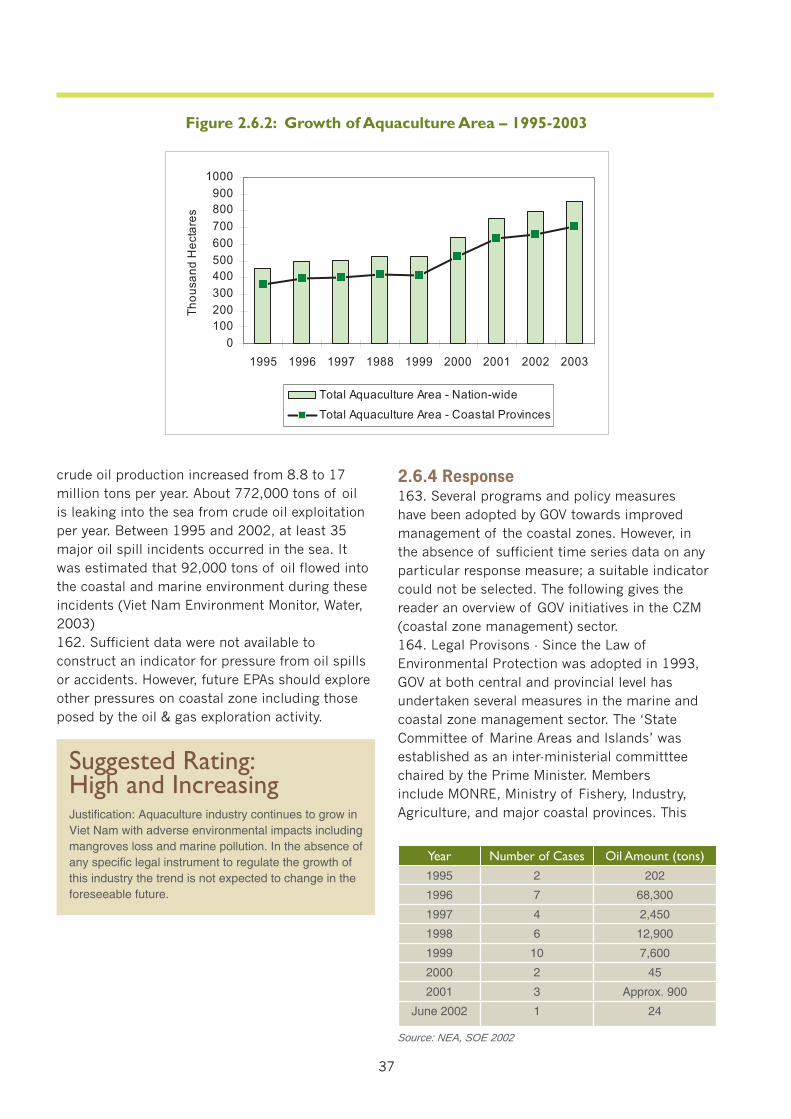
37
Figure 2.6.2: Growth of Aquaculture Area – 1995-2003
0100200300400500600700800900
1000
1995 1996 1997 1988 1999 2000 2001 2002 2003
Tho
usa
ndH
ect
are
s
Total Aquaculture Area - Nation-wide
Total Aquaculture Area - Coastal Provinces
Suggested Rating: High and IncreasingJustifi cation: Aquaculture industry continues to grow in Viet Nam with adverse environmental impacts including mangroves loss and marine pollution. In the absence of any specifi c legal instrument to regulate the growth of this industry the trend is not expected to change in the foreseeable future.
crude oil production increased from 8.8 to 17 million tons per year. About 772,000 tons of oil is leaking into the sea from crude oil exploitation per year. Between 1995 and 2002, at least 35 major oil spill incidents occurred in the sea. It was estimated that 92,000 tons of oil flowed into the coastal and marine environment during these incidents (Viet Nam Environment Monitor, Water, 2003) 162. Sufficient data were not available to construct an indicator for pressure from oil spills or accidents. However, future EPAs should explore other pressures on coastal zone including those posed by the oil & gas exploration activity.
2.6.4 Response163. Several programs and policy measures have been adopted by GOV towards improved management of the coastal zones. However, in the absence of sufficient time series data on any particular response measure; a suitable indicator could not be selected. The following gives the reader an overview of GOV initiatives in the CZM (coastal zone management) sector. 164. Legal Provisons - Since the Law of Environmental Protection was adopted in 1993, GOV at both central and provincial level has undertaken several measures in the marine and coastal zone management sector. The ‘State Committee of Marine Areas and Islands’ was established as an inter-ministerial committtee chaired by the Prime Minister. Members include MONRE, Ministry of Fishery, Industry, Agriculture, and major coastal provinces. This
Year Number of Cases Oil Amount (tons)1995 2 202
1996 7 68,300
1997 4 2,450
1998 6 12,900
1999 10 7,600
2000 2 45
2001 3 Approx. 900
June 2002 1 24
Source: NEA, SOE 2002
38
committee coordinates the functioning of various government units tasked with addressing coastal zone issues. In addition, laws and regulations specific to coastal and marine issues have been promulgated: these include (i) maritime law, (ii) marine production law, and (iii) oil and gas law. In addition, the Ordinance on Fisheries Resource Protection contains specific regulations on fish catch, methods, seasons, etc. to be enforced by the Department of Fisheries Resources Protection, which was established in 1993 under the Ministry of Fisheries (MoF).165. Institutional Initiatives/Marine Protected Areas - The Ministry of Forestry has the mandate and responsibility for nature reserves, national parks and other protected areas on land including mangrove areas. However, there is as yet no government department clearly authorized to manage Marine Protected Areas (MPAs) although the Ministry of Fisheries and the MONRE have both shown concern about the issue. Management of existing island reserves tends to be more focused on the terrestrial area since these are run by the Forestry Department and by MARD. The lack of a clearly identified responsible authority has been repeatedly identified as the major obstacle to marine conservation, and specifically to MPA viability (Biodiversity Action Plan Planning Committee, 1994 draft; Roop et al. 1994).166. The legal framework is taking shape slowly and several important legal instruments are still not in place, hampering implementation (of, for instance, the National Oil Spill Management Plan). Enforcement remains weak.167. Under-funding is a major constraint to effective coastal zone management, be it management of MPAs or undertaking simple marine surveys for improved knowledge of the state of coastal zones. In the case of MPAs, all protected areas are understaffed. Currently, no more than 685 permanent staff are charged with protecting and managing some 226,400 ha of coastal and marine environment in Viet Nam’s 20 existing coastal and marine protected areas.
2.6.5 Conclusions168. The rapid economic development of Viet Nam has brought both opportunities and threats to its coastal zones. The trade-offs are complex. The undoubted success of aquaculture
as an export earner and source of incomes, for instance, needs to be set against the cost of mangrove loss and aquaculture’s uncertain future. The growing prosperity of harbours, to give another example, co-exists with increasing contamination of coastal waters. 169. There are signs of progress in some areas. While it is the case that Viet Nam has lost approximately three quarters of its mangroves during the past half century there is evidence to suggest that the area of mangroves has stabilized and indeed, may have begun to increase. The GOV’s goal of restoring the mangrove cover to 80% of the cover in 1990 may have already been achieved (even if this achievement is partly devalued by the choice of the target, since the 1990s was the period of mangroves’ historical minimum (see Figure 2.6.1).170. Institutional and budgetary constraints undermine effective implementation of the mitigation programs in the coastal zone. Lack of coordination between GOV agencies, NGOs and other organizations engaged in the activities related to coastal zone slows down the management and mitigation efforts.
ReferencesThe Report on Environmental State of Aqua Production Branch, 2002Viet Nam: The Environment and Living, SIDA, National Political Publishers, 2004.
Suggested Rating: 1 StarJustifi cation: The ecosystems of coastal zones in Viet Nam are under serious threat from commercial development. Although Viet Nam has adopted several policies intended to protect the coastal zones and signed international conventions like the Ramseur and Marplot convention only a limited progress is evident in the coastal areas.
39
176. Based on that research and experience, a second inventory was conducted to form the basis of the First National Communication to the UNFCCC which included inventory figures for 1994 (the IPCC baseline year) as well as revised estimates for year 2000, 2010 and 2020.177. A third inventory was conducted by the National Climate Change Office with year 1998 and year 2002 inventory figures. This will form the basis for a Second National Communication to the UNFCCC which is currently in 4th draft. The indicator is based on a consolidation of these three inventory results, as reported in the draft 2nd communication document.178. These reports give data on emissions of the three key greenhouse gases with global warming potential, i.e., carbon dioxide (CO2), methane (CH4), nitrous oxide (N2O). Annual emissions of GHGs in metric tons were inventoried in five main sectors, i.e., energy, industrial processes, agriculture, land use change and forestry, and wastes. These were then converted into CO2 equivalents by using theses gases’ global warming potentials.179. As can be observed from Figure 2.7.1, total GHG emissions in CO2-equivalent were estimated at approximately 120,000 Gg’s in 1993 and are estimated to have risen to 145,000 Gg’s in year 2002.180. Until year 1998, the agricultural sector was the dominant source of GHG emissions, accounting for approximately 50% of all emissions in 1994. While emissions from this sector are estimated to have risen slightly in 1998, emissions from the energy sector have surpassed those of the agricultural sector by the turn of the century. In 2002, emissions from the energy sector accounted for approximately 46% of all national emissions.181. Emissions from waste were minimal in all inventory years. Emissions from industrial processes have been relatively small but are likely to increase in the future. Emissions from forestry and land use change (FLUC) were significant in 1993 but are estimated to become less significant as forest cover increases and becomes more of a sink of GHGs. As with most other GMS countries, emissions from the energy sector are expected to dominate in the future.
Indicator: National Greenhouse Gas Emissions – 1993-2002
2.7. Climate Change2.7.1 Context171. Viet Nam has been a participant in the international debate about climate change, its causes and possible consequences. In a country with a long coastline the prime concern has been a possible impact of global warming and sea level rise on the national shoreline zone as well as a possible effect on the seasonal patterns of rainfall. The principal consideration under this concern, however, is the extent to which Viet Nam has acted upon its undertakings under UNFCCC.172. Viet Nam signed the United Nations Framework Convention on Climate Change (UNFCCC) on 11/6/1992 and ratified it on 16/11/1994. The country also signed the Kyoto Protocol on global warming on 3/12/1998 and ratified it on 25/9/2002.
2.7.2 State173. The status of climate change is determined by factors that are overwhelmingly outside the control of Viet Nam or GMS authorities. In principle, a single report on climate changes is prepared for the whole world by Intergovernmental Panel on Climate Change (IPCC.) For that reason, this EPA report does not attempt to formulate a separate state indicator at national level.
2.7.3 Pressure
174. Under the IPCC standard, the quantity of greenhouse gas (GHG) emissions is taken as the indicator of pressure, i.e., the country’s contribution to global climate change. The three main greenhouse gases are carbon dioxide (CO2), methane (CH4) and nitrous oxide (N2O). As customary under UNFCCC reporting, the emissions are expressed in Gigagrams (Gg) of CO2 equivalent.175. By now, Viet Nam has undertaken three greenhouse gas inventories according to IPCC guidelines. The first was conducted as part of the Asia Least-Cost Greenhouse Gas Abatement Strategy (ALGAS) project and included a baseline inventory for 1993 as well as GHG estimates for 2000, 2010 and 2020.
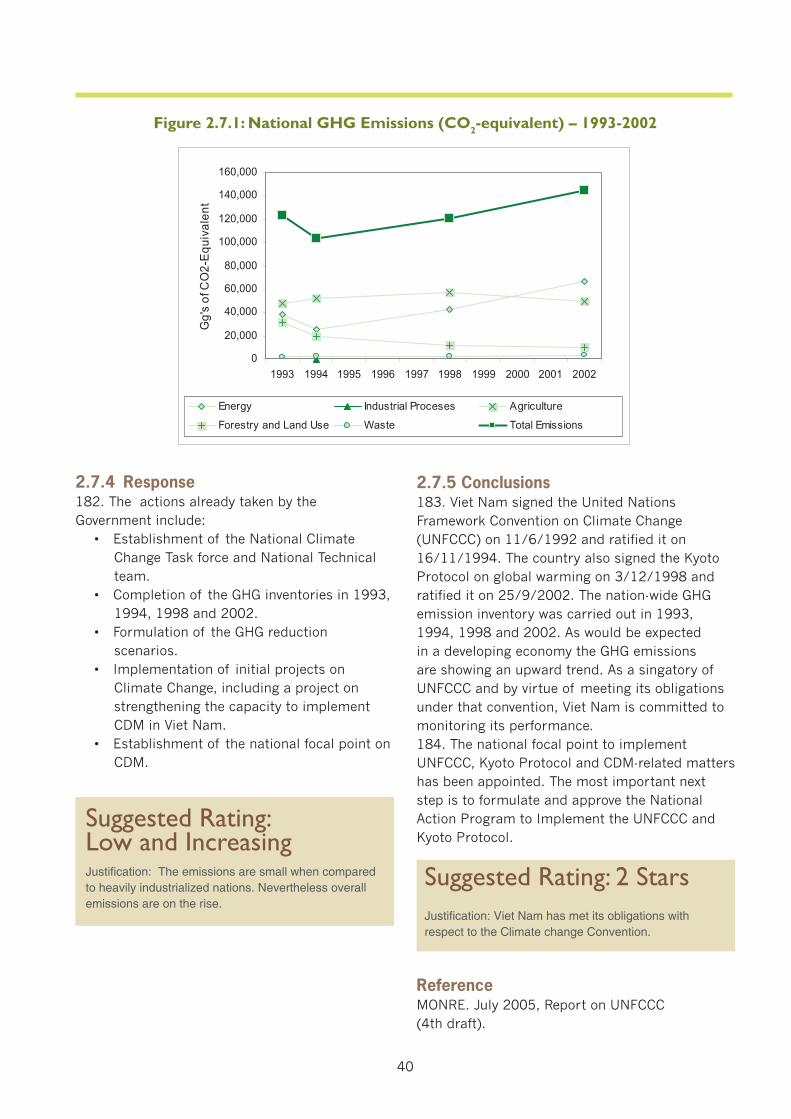
40
Figure 2.7.1: National GHG Emissions (CO2-equivalent) – 1993-2002
0
20,000
40,000
60,000
80,000
100,000
120,000
140,000
160,000
1993 1994 1995 1996 1997 1998 1999 2000 2001 2002
Gg
'so
fCO
2-E
qui
vale
nt
Energy Industrial Proceses Agriculture
Forestry and Land Use Waste Total Emissions
2.7.4 Response182. The actions already taken by the Government include: • Establishment of the National Climate
Change Task force and National Technical team.
• Completion of the GHG inventories in 1993, 1994, 1998 and 2002.
• Formulation of the GHG reduction scenarios.
• Implementation of initial projects on Climate Change, including a project on strengthening the capacity to implement CDM in Viet Nam.
• Establishment of the national focal point on CDM.
Suggested Rating: Low and Increasing Justifi cation: The emissions are small when compared to heavily industrialized nations. Nevertheless overall emissions are on the rise.
2.7.5 Conclusions183. Viet Nam signed the United Nations Framework Convention on Climate Change (UNFCCC) on 11/6/1992 and ratified it on 16/11/1994. The country also signed the Kyoto Protocol on global warming on 3/12/1998 and ratified it on 25/9/2002. The nation-wide GHG emission inventory was carried out in 1993, 1994, 1998 and 2002. As would be expected in a developing economy the GHG emissions are showing an upward trend. As a singatory of UNFCCC and by virtue of meeting its obligations under that convention, Viet Nam is committed to monitoring its performance. 184. The national focal point to implement UNFCCC, Kyoto Protocol and CDM-related matters has been appointed. The most important next step is to formulate and approve the National Action Program to Implement the UNFCCC and Kyoto Protocol.
ReferenceMONRE. July 2005, Report on UNFCCC (4th draft).
Suggested Rating: 2 StarsJustifi cation: Viet Nam has met its obligations with respect to the Climate change Convention.
41
185. The purpose of Part 3 is not to comprehensively review the existing institutional and legislative basis of environmental management in Viet Nam. Several summaries exist (including the Institutional Analysis prepared as part of the SEF II Project) and the reader is referred to them for details. Rather, the purpose is to identify those elements of the existing institutional framework that affect the performance of the national environmental management process.
3.1 Integration of Environmental Concerns in Economic Decisions186. In the 1980s2 the Government of Viet Nam embarked on “doi moi”, a program to guide a transition from rigid central planning to a mixed market economy. Viet Nam has since opened up its economy and substantially liberalized trade. The country has achieved strong economic growth but the same growth has created new challenges, not least in the area of environmental management. To take full advantage of the potential created by economic modernization while minimizing its the negative environmental side-effects it is necessary to adopt suitable environmental safeguard policies. The ongoing reform process, together with the fact that Viet Nam has a unique opportunity to learn from the experiences of its neighbors, creates a good
3 ENVIRONMENT AND ECONOMIC DEVELOPMENT
opportunity for the development and introduction of effective environmental management that integrate environmental considerations into the economic development mainstream.
3.2 Policy and Institutional Integration 187. On December 27, 1994, Viet Nam’s National Assembly approved the Law on Environmental Protection (LEP) that created a legal basis for a more systematic approach to pollution control, natural resources management and protection of ecological diversity. The LEP has 7 chapters and 55 articles. The Law contains general provisions and sets out the overall approach to preventing and remedying environmental pollution and degradation. It describes the responsibilities and duties of MOSTE (now MONRE) at central level and of the People’s Committees at provincial level (with DONREH). The LEP calls for international collaboration and makes provisions for implementation and for dealing with violation of the law. Other environmental legal initiatives include government decrees, ordinances, inter-ministerial circulars, guidelines and by-laws.188. MONRE has 3 departments that have environmental management reponsibilties: • the Environment Department tasked with
policy formulation, strategy and legal regulations for environmental protection,
2 In 1986 the VIth National Party Congress offi cially adopted the renovation policy (“Doi Moi”), however, it was only in 1989 that implementation of the policy started in earnest with such measures as infl ation control and trade liberalization.
VIET NAM NATIONAL ENVIRONMENTAL PERFORMANCE ASSESSMENT
(EPA) REPORT
42
• the Environmental Protection Department that oversees the implementation of policy, strategies and legal aspects of environmental protection, and
• the Department for Environmental Impact Assessment and Evaluation in charge of environmental assessment of investment projects.
189. In the provinces, the local counterpart of MONRE, the DONREHs are tasked with advising the provincial-level people’s committees about environmental management and protection. Other staff are assigned environmental duties at districts and commune levels. In addition, various development sector line ministries and agencies have staff in their organization that are responsible for looking after environmental management tasks associated with projects under their organizations.190. In 1993, the National Environment Agency (NEA) was established under MOSTE (now MONRE). By 1999 the NEA had 9 divisions with 79 staff. Environment Management Divisions usually with 2 to 5 employees were also established in every province/city under the Provincial Departments of Science, Technology & Environment. Several districts and provincial towns also have a cadre for environmental management. The functional units for environment management normally attached to the Department of Natural Resource & Environment have been established in some line ministries and economic sectors.191. Whilst MONRE plays a key role in the development and enforcement of environmental policies and regulations; line ministries’ role is also important. For instance, implementation of forest policy and related measures is in the purview of Ministry of Agriculture and Rural Development (MARD); management of urban solid sewage is under responsibility of Ministry of Construction (MOC); management of ecological diversity and agriculture is with MARD; management of coastal and marine ecological diversity, aquaculture are responsibility of Ministry of Fisheries; and air pollution management is responsibility of Ministry of Construction, etc. 192. This cross-sectoral nature of enviromental management requires pro-active collaboration
between policy makers at the central and state committee’s level and the line agency staff who are responsible for implementing policy decsions. Furthermore collaboration needs to exist at horizontal levels as well between various organizations that may have overlapping functions. As would be expected the multiplicity of authorities and overlapping tasks have not been fully ironed out and they complicate the environmental management.193. Other sectoral laws that have a bearing on the concerns discussed in this EPA include Forest Protection and Development Law (1991), and Land Law (1993). In addition, the National Strategy for Environmental Protection, 2001-2010 (NSEP) has been developed that focuses on prevention and minimization of negative impacts on environment, environmental recovery in seriously polluted areas, improvement of environmental quality, nature conservation and biodiversity protection. As part of the strategy, other programs have been developed to expand the legal and policy foundation of environmental management, apply economic instruments; and develop a network of environmental monitoring and analysis. 194. Integration of environmental concerns into economic decision-making is still not a part of the development paradigm in Viet Nam. Active cooperation between various development line agencies and MONRE remains an exception rather than the norm. Ministry of Planning & Investment (MPI) is the key agency that approves investment proposals in Viet Nam. It solicits opinions from various line agencies when submitting its recommendation to the Prime Minister’s office, including MONRE. This process does not always work smoothly and suffers from lack of coordinated approach and not always does each agency get a say. For larger projects of national importance a national appraisal committee has been formed that includes MONRE. 195. In terms of monitoring the environmental impacts of development, whereas EIA is a requirement for development projects, the process is not imposed very strictly. Project feasibility reports (FS) do not always include an appropriate EIA rather only a chapter devoted to environmental issues, hence eliminating a complete review of the environmental impacts
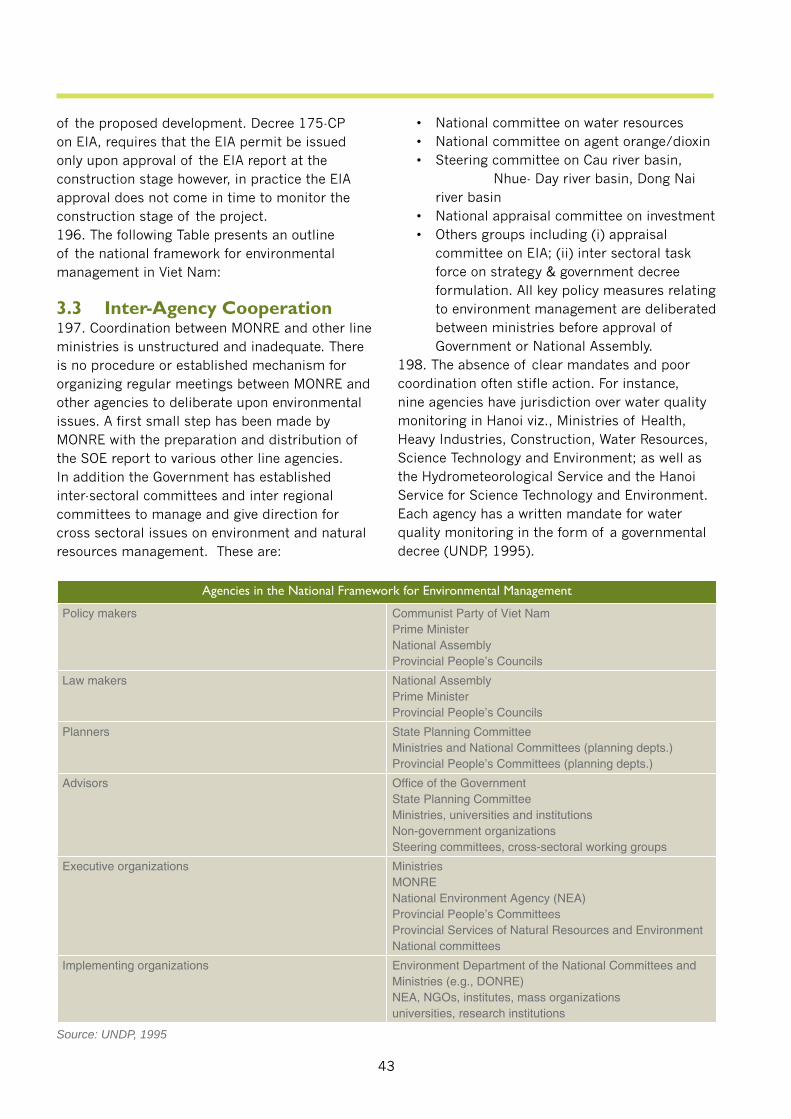
43
of the proposed development. Decree 175-CP on EIA, requires that the EIA permit be issued only upon approval of the EIA report at the construction stage however, in practice the EIA approval does not come in time to monitor the construction stage of the project.196. The following Table presents an outline of the national framework for environmental management in Viet Nam:
3.3 Inter-Agency Cooperation 197. Coordination between MONRE and other line ministries is unstructured and inadequate. There is no procedure or established mechanism for organizing regular meetings between MONRE and other agencies to deliberate upon environmental issues. A first small step has been made by MONRE with the preparation and distribution of the SOE report to various other line agencies. In addition the Government has established inter-sectoral committees and inter regional committees to manage and give direction for cross sectoral issues on environment and natural resources management. These are:
Agencies in the National Framework for Environmental Management
Policy makers Communist Party of Viet NamPrime MinisterNational AssemblyProvincial People’s Councils
Law makers
National AssemblyPrime MinisterProvincial People’s Councils
Planners State Planning CommitteeMinistries and National Committees (planning depts.)Provincial People’s Committees (planning depts.)
Advisors Offi ce of the GovernmentState Planning CommitteeMinistries, universities and institutionsNon-government organizationsSteering committees, cross-sectoral working groups
Executive organizations
MinistriesMONRENational Environment Agency (NEA)Provincial People’s CommitteesProvincial Services of Natural Resources and EnvironmentNational committees
Implementing organizations Environment Department of the National Committees and Ministries (e.g., DONRE)NEA, NGOs, institutes, mass organizationsuniversities, research institutions
• National committee on water resources • National committee on agent orange/dioxin • Steering committee on Cau river basin,
Nhue- Day river basin, Dong Nai river basin
• National appraisal committee on investment • Others groups including (i) appraisal
committee on EIA; (ii) inter sectoral task force on strategy & government decree formulation. All key policy measures relating to environment management are deliberated between ministries before approval of Government or National Assembly.
198. The absence of clear mandates and poor coordination often stifle action. For instance, nine agencies have jurisdiction over water quality monitoring in Hanoi viz., Ministries of Health, Heavy Industries, Construction, Water Resources, Science Technology and Environment; as well as the Hydrometeorological Service and the Hanoi Service for Science Technology and Environment. Each agency has a written mandate for water quality monitoring in the form of a governmental decree (UNDP, 1995).
Source: UNDP, 1995
44
3.4 Non Governmental Sector199. Until recently the economic and political situation in Viet Nam provided few opportunities for NGOs to be involved in environmental management. This situation is now changing. Not only are new organizations being formed outside of the state sector, it is also the case that many government organizations are being given greater autonomy.200. With the progress towards market economy the non-State production sector, especially the economic production sector viz. agricultire, industry and services are fast becoming active partners in enviromental management in Viet Nam. Another important sector is the academic and research sector. Many organizations in this sector have recently developed own sources of funding to supplement traditional government subsidies, in the process increasing their autonomy. Univeristy of Can Tho for instrance is one of the major institutions that is engaged in coastal zone management programs with assistance from international and bilateral programs. Many institutions that originally provided inputs only to government projects can now be considered as research and consulting organizations. 201. In addition, there are other professional organizations that are influential actors on the environmental stage. These include: the Lawyers Association, the Association of Geographers, the Mining Association, the Forestry Association, and the Association on Conservation of Nature and the Environment. All of these associations are members of the Viet Nam Union of Scientific and Technical Associations (VUSTA).
3.5 Process of Integrating Environment & Development202. EIA is the main tool of incorporating environmental concerns into investment planning. However, the EIA process in Viet Nam is still in its incipient stages and suffers from legislative and implementation bottlenecks. The provisions for the timing of EIA do not fit well with project development planning itself. According to Decree 52, EIA need not be undertaken until the project’s
feasibility and design stage; by that time, however, most of the project’s technical parameters are often fixed lessening the scope for EIA-inspired modifications.203. In addition to this, implementation of the EIA process especially at the review stage suffers from inadequate staffing and expertise; lack of monitoring and evaluation; poor coordination between MONRE and sector line agencies and units in the provinces; poor coverage of baseline information; insufficient integration of responsible ministries and agencies as well as superficial public participation. Strategic environmental assessment of development programs and policies is not common unless there is international funding for the initiative.
3.6 EPA Manager Institution204. Based on the experience of the preparation of the present document, the first EPA in Viet Nam, Department of Environment within MONRE is considered the logical candidate for conducting future EPAs. The Department has an established structure and necessary mandate within which the additional task of EPA can be accommodated. It is responsible for environmental reporting in MONRE. It works with environment specialists nation-wide and has the inter-organizational links both at central and provincial level through its other activities to forge a collaborative alliance for the conduct of EPA activities.
3.7 International Donor Assistance205. Viet Nam is the largest recipient of international donor assistance in the GMS including multilateral and bilateral assistance. Environmental policy setting and institutional strengthening have received considerable attention from the donors, in particular CIDA, SIDA and DANIDA. 206. The challenge remains in aligning donor pledges with national development priorities. This is closely related to effective donor aid management with support from GOV. Aid coordination and management is first and foremost the responsibility of the Government. The Government’s leadership in and commitment
45
to the development process and its specific interventions (“national ownership”) are essential to ensuring the effectiveness and sustainability of development efforts. In practical terms, the Government is best positioned to translate its overall development strategies and priorities into policies, frameworks, sectoral programs and plans, which will enable the ODA community to coherently channel their assistance. Donors in turn have a responsibility to encourage, advise and support the Government at its various levels, in the formulation of effective strategies, frameworks and plans. This type of Government-led interaction should help to minimize the adverse consequences of piece-meal and fragmented assistance or duplication, and pave the way for a more effective investment of ODA flows. This requires various initiatives and work is underway against most of these: • Enhanced the capacity of GOV to absorb
large amounts of ODA effectively through a program of strengthening of its ability to plan, coordinate and manage ODA at the central, provincial and sub-provincial levels, actively involving other sectors such as NGOs, academia and private sector in project implementation.
• Development of an effective framework for ODA in Viet Nam that streamlines the institutional responsibilities for project processing and approvals, counterpart arrangements etc.
• Development of national plans and strategies by GOV that makes it easier for the donor community to align their assistance portfolio with the national environment and development needs. The National Environmental Action Plan was prepared in this manner, i.e., based on a structured review involving GOV and the donors active in the environment sector.
3.8 Environmental Expenditure and Financing207. Data compiled by MPI (see Table 3.1.1) indicate that government environmental expenditure in Viet Nam in the second half of the
1990s fluctuated between 0.5% and 0.7% of the total government expenditure, or between 0.1% and 0.2% of the country’s GDP. The interpetation of these figures is not easy given that many categories of government expenditure (e.g., those on components of urban infrastructure, water management, etc.) have major environmental impacts without being classified as “environmental”. Official data tend to equate environmental expenditure with funds available to the official environmental regulator (in Viet Nam, MONRE) and thus tend to underestimate the amount of resources devoted to environmental improvement. There are other methodological reasons that lower the value of simple official figures of environmental expenditure. The official data typically ignore the expenditure made by enterprises for pollution control and they ignore expenditure made by households. To say that, based on official figures, environmental expenditure in Viet Nam is too low relative to other macroeconomic totals would be therefore too facile and might be considered self-serving. An adequate analysis of environmental financing in Viet Nam is yet to be made. 208. What can be said with more certainty is that economic growth as reflected in GDP outpaced official environmental expenditure during the period under review. This pattern seems common to the “tiger” economies of Asia during the last two decades. Whether such outcome in Viet Nam is a classical illustration of the “grow-first-clean-up-later” approach or an interpretation distorted by the methodological weaknesses of official environmental expenditure data cannot be established without careful analysis. 209. Such an analysis would need to take adequate account of the existence and function of environmental funds several of which have been established in Viet Nam, namely: • The National Environmental Fund; • Local environmental funds in Hanoi, Ho Chi Minh City, Danang and Baria
Vungtau province; and • Coal Sector Environmental Fund
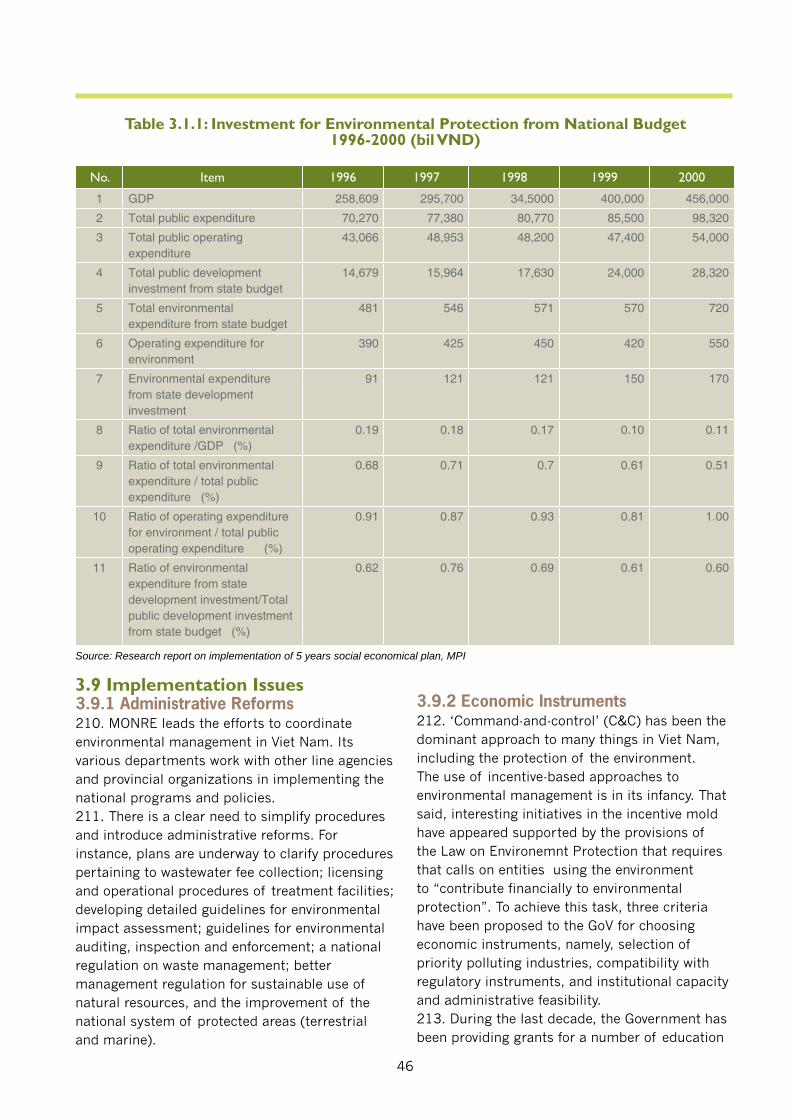
46
Table 3.1.1: Investment for Environmental Protection from National Budget 1996-2000 (bil VND)
No. Item 1996 1997 1998 1999 2000
1 GDP 258,609 295,700 34,5000 400,000 456,000
2 Total public expenditure 70,270 77,380 80,770 85,500 98,320
3 Total public operating expenditure
43,066 48,953 48,200 47,400 54,000
4 Total public development investment from state budget
14,679 15,964 17,630 24,000 28,320
5 Total environmental expenditure from state budget
481 546 571 570 720
6 Operating expenditure for environment
390 425 450 420 550
7 Environmental expenditure from state development investment
91 121 121 150 170
8 Ratio of total environmental expenditure /GDP (%)
0.19 0.18 0.17 0.10 0.11
9 Ratio of total environmental expenditure / total public expenditure (%)
0.68 0.71 0.7 0.61 0.51
10 Ratio of operating expenditure for environment / total public operating expenditure (%)
0.91 0.87 0.93 0.81 1.00
11 Ratio of environmental expenditure from state development investment/Total public development investment from state budget (%)
0.62 0.76 0.69 0.61 0.60
Source: Research report on implementation of 5 years social economical plan, MPI
3.9 Implementation Issues3.9.1 Administrative Reforms210. MONRE leads the efforts to coordinate environmental management in Viet Nam. Its various departments work with other line agencies and provincial organizations in implementing the national programs and policies. 211. There is a clear need to simplify procedures and introduce administrative reforms. For instance, plans are underway to clarify procedures pertaining to wastewater fee collection; licensing and operational procedures of treatment facilities; developing detailed guidelines for environmental impact assessment; guidelines for environmental auditing, inspection and enforcement; a national regulation on waste management; better management regulation for sustainable use of natural resources, and the improvement of the national system of protected areas (terrestrial and marine).
3.9.2 Economic Instruments 212. ‘Command-and-control’ (C&C) has been the dominant approach to many things in Viet Nam, including the protection of the environment. The use of incentive-based approaches to environmental management is in its infancy. That said, interesting initiatives in the incentive mold have appeared supported by the provisions of the Law on Environemnt Protection that requires that calls on entities using the environment to “contribute financially to environmental protection”. To achieve this task, three criteria have been proposed to the GoV for choosing economic instruments, namely, selection of priority polluting industries, compatibility with regulatory instruments, and institutional capacity and administrative feasibility.213. During the last decade, the Government has been providing grants for a number of education
47
and awareness raising programs. Several environment-oriented taxation measures have recently been considered for application (e.g., reduction of tax on import and/or installation of clean technology, use of differentiated resource extraction taxes on forest products and minerals, removal of subsidies on chemical fertilisers and pesticides, etc.). 214. Several funds have been created that act largely as environmental funds, such as funds for reforestation, and funds for coal mining and oil spill contingency. NEA is moving towards the establishment of a National Environmental (Reserve) Fund and is also preparing sectoral and provincial environmental funds. 215. NEA and most of provincial Departments (DONREHs) have been imposing penalties for violations against environmental law and regulations that share the characteristics of C&C and incentive-based instruments. The problem of defining property rights as an incentive for long-term and sustainable use of the environment and natural resources needs more attention and further development.
3.10 Environment and Civil Society216. Viet Nam lays siginificant importance on the role of community in environmental protection. The Communist Party of Viet Nam Central Committee’s directive No 36/ CT-TW dated 25 June 1998 states: “The environmental protection is the cause of all the party, the whole army, and the whole people”. The Decision No 256/2003/ QD –TTg dated 3 December 2003 of the Prime Minister approving the national strategy on environmental protection up to year 2010 and vision to 2020 has also pointed out: “The environmental protection is the task of the entire society, branches, all levels, organizations, communities and the whole people”. For instance organisations such as the Forestry Inventory and Planning Institute (FIPI), the Hanoi Economic University, Viet Nam National University and research departments of various national environemntal agencies have been instrumental in the prepartion of this EPA document. These agenices have nominated experts to the national EPA technical working group
3.10.1 Community Organizations217. Community based organizations have been increasingly gaining credibility in Viet Nam. These include social – vocational organization, 40 of which have been established in scientific and technological fields. The socio-political organizations namely Viet Nam Peasant’s Association, Viet Nam Women’s Union, have grassroot organizational linkages that are very effective in mobilzing public opinion for an environmental initiative. 218. Village convention has been voluntarily regulated and executed by local people with purpose of forest protection, rational forest’s resources exploitation, bio-diversification preservation for living generation and future ones. The environmental regulations on village conventions have importantly contributed to environmental protection in localities, intensifying people’s awareness of environmental protection in the village communities. For instance, by regulations set out by a group in Hop Thanh village, Xa Luong commune, Tuong Duong district, Nghe An province under buffer zone of Pu Mat national Park, are:” not to hunt gibbon, muntjae if they had been trapped, they would have been released”. Beside the village conventions, communities have still taken measures for environmental protection such as building network of environmental protection’s community to help forester’s activities.
3.10.2 Education and Awareness219. Raising public awareness and improving the quality of environmental education and training have long been among stated priorities of the GOV. The implementation of this objective has not been particularly efficient, however. Genuine public participation and the involvement of NGOs have been limited. 220. Environmental education is being introduced into the school curricula. GOV’s program “Bringing the contents on environmental protection in national education system” (Decison No 1363/QD-TTg (2001)) and Ministry of Education and Training’s “Policy and plan of action for environmental education in secondary schools in the 2001-2010 period” (Decision No 6621/QD-BGDT-KHCN (2002)) contain extensive provisions to this effect. After an introductory
48
phase during the period 2001-2005, the program is to be expanded nationwide. Progress has been slower than anticipated. 221. The mass media have started to play an active role in providing the public with useful environmental information but the task of wider dissemination and free exchange of information is still to be addressed. It is important to utilize the internet technology for wider dissemination of environmental information.
49
222. Since the adoption of the “renovation policy” in 1980s, Viet Nam has been shifting from a rigid centrally planned economy to a more mixed form of economic management. This transition has unleashed the entrepreneurial energy of the nation. Over the past 10 years, GDP growth has averaged at 7.5% p.a. However, the rapid economic advance has not been without risks and costs, the conditions of the country’s environment foremost among them. The significance of these threats cannot be underestimated in a country that continues to be predominantly rural with a resulting imperative to preserve the natural resource base. 223. Most of those in a position of official responsibility in Viet Nam are well aware of the need to strike a balance between economic growth and maintenace of environmental quality, and a large number of steps have been taken in an attempt to strike that balance. This EPA report is a first attempt to give a broad assessment of how successful the country has been. More than anything else, an attempt is being made to shift the nature of environmental reporting away from simple description of environmental trends towards trying to identify the main factors that lie behind the observed environmental outcomes. 224. The preceding sections of this report have discussed national performance under major enviromental policy concerns in Viet Nam and in particular the effectivenes of GOV programs in mitigating the environmental threats associated with rapid economic development. Among other
4 CONCLUSIONS AND RECOMMENDATIONS
things, the discussion identified substantial areas of uncertainty about both the outcomes and the reasons for them. 225. The section below summarizes the key findings and makes recommendations for improvement to the EPA process as well as suggesting technical, institutional and other steps that might improve environmental management in Viet Nam.
4.1 Inland Water Pollution 226. There is increasing evidence of pollution of Viet Nam’s inland water bodies. Although the quality of upstream river waters is generally good, downstream sections of major rivers are seriously polluted especially during the dry season. Urban population and industrial growth have outrun additions to the wastewater treatment capacity and total volume of untreated domestic and industrial wastewater has been increasing.
A. EPA Process and Data Gaps 1) Data gaps need to be addressed as a
matter of priority. A wider water quality sample is required; more locations close to other urban and industrial areas in the country need to be monitored for BOD5
and ammonia Nitrogen - NH4; to be able to present a more represenative picture of the state of national water quality.
2) Before the next EPA is conducted, monitoring data on parameters such as COD, DO, SS, TDS, heavy metals, NH4,
VIET NAM NATIONAL ENVIRONMENTAL PERFORMANCE ASSESSMENT
(EPA) REPORT
50
oil & grease should be collected for some locations for which BOD5 and NH4 are being monitored.
3) Information should be updated on ‘industrial wastewater fee’ for the response indicator. Last set of data was for 2003. This dataset should be updated on an annual basis and an attempt should be made to cover all industrial sectors. MONRE should stipulate clear guidelines for the use of the wastewater collection fee and should publish an update of activities undertaken with environment fund resources.
4) Also, in future EPAs, data on waterborne diseases should be collected so that a relationship can be established between water quality and public health impacts especially in the country’s pollution hot spots. ‘Incidence of water borne diseases’ should be considered as another state indicator.
B. Other Recommendations 5) Monitoring of water quality data should
be better institutionalized in Viet Nam. A comprehensive water quality monitoring program under the aegis of the National Monitoring Network (NMN) should be undertaken for all the major rivers of Viet Nam; with monitoring data collected on a regular basis at strategic locations in the major river basins. The Plan for ‘National Network of Monitoring Stations to Year 2010’ should be implemented soon; the plan calls for an expansion of the existing network of regional inland and coastal monitoring stations; laboratory facilities and local provincial level monitoring stations.
6) Enforcement - The political will and organizational capacity for enforcing the existing laws remains weak, and this is evident in the major rivers that traverse urban and industrial areas with high pollution levels. Reversing the declining trend in water quality remains a key challenge to public health. The economic intruments and performance disclosure approach must be explored, while at the same time effecting changes to the existing
command-and-control approach. Legal instruments stipulating fines and penalties for environmental violation should be investigated. For instance the provisions of Decree 67/2003/ND-CP on wastewater fee charge should be enforced more rigidly and more polluting enterprises should be asked to pay the fee.
7) EIA – all major development projects should pass through a rigourous EIA process such that the anticipated impacts to water quality during construction and operation of the facility can be known well in advance and appropriate mitigation measures undertaken. The challenge is to increase the capacity of implementing agencies to undertake EIA studies and to sufficiently implement environmental management plans so that EIA can be a tool for integrating environment into project planning and decisionmaking.
8) Legal tools - Important secondary legislation necessary to implement many of the water laws’ objectives needs to be developed. Also, In Viet Nam the water sector has no overall integrated strategy and action plan at the national or regional basin level. However, strategies and action plans exist for a number of the subsectors. The Law on Water Resources, approved in 1998, represents a major step toward integrated water resources management. But only partial progress has been made in implementing the reforms embodied in it. Little information exists on the status of the measures proposed under these regulation. Detailed guidelines need to be developed to monitor the effectiveness of the regulation and related measures and suitable amendments recommended to the proposed measures or regulation if they are found to be ineffective. In the absence of regular monitoring and enforcement of such regulatory tools; the effectiveness of such measures cannot be assessed. If the targets cannot be met in time, then some consideration of modifiying approaches/measures to make it more feasible would be necessary.
51
4.2 Air Pollution from Mobile Source227. The major cities in Viet Nam, especially Ho Chi Minh City and Hanoi, experience serious air pollution, with motor vehicles being the principal cause. The levels of particulate matter are especially high. Pollution controls on vehicles and the specifications on fuels are among the principal weaknesses, the phasing out of leaded gasoline after 2001, an important plus. Because the vehicle population and congestion in cities continue to grow it is expected that the pollution problem will get worse despite improving emission characteristics of newer vehicles. 228. Lack of appropriate technical and financial support constrains the implementation of a regular monitoring regime. In the absence of a sound database on pollutant concentrations appropriate program of abatement cannot be developed.
A. EPA Process and Data Gaps 1) Pollutant concentration dataset for CO, NO2,
SO2 and PM should be updated for Hanoi and Ho Chi Minh City; current dataset as avaialble for this EPA is only uptil 2002. Similarly the dataset for number of vehicles in Hanoi and Ho Chi Minh City needs to be updated.
2) For future EPAs data should be collected on ‘per capita volume of automotive fuel used’; and a pressure indicator developed from that dataset.
3) Suitable response indicator needs to be developed for next stage of EPA. Candidate response indicator includes ‘per cent of registered cars undergoing pollution inspection’.
4) The next stage of EPA should also attempt to correlate increase in vehicular traffic (pressure) to ‘incidents of respiratory disorder among urban population’ (state). In this relation further studies should be conducted to understand the characteristic of the airshed in relation to stationary and mobile sources, and the emission inventory for Hanoi and HCMC.
5) More studies on the effect of air pollution (the levels of particles, organic compounds (PAH) and other pollutants) on health are needed to ascertain the economic cost of air pollution.
B. Other Recommendations 6) Fuel – Major reduction of lead levels has
been achieved in many cities which adopted a gradual phase-out of leaded vehicles. In Bangkok, Thailand, after unleaded petrol was introduced in July 1991, the 1996 study of newborn babies showed that the lead level in the blood is one third of that before the introduction of unleaded petrol (Bangkok Post, 1996). In Viet Nam, the effectiveness of the July 2001 Prime Ministerial Decree on use of unleaded petrol should be studied and further recommendations made for improvement of the implementation process. Also, consideration should be given to the encouragement of the use and the gradual introduction of low sulfur diesel fuel. This will reduce the SO2 emissions from buses and utility vehicles that may be a small but growing segment of the vehicle stock in Viet Nam.
7) Enforcement – Set up standards for emission control of vehicles for registration and enforce the emission compliance of on-road vehicles. The introduction of catalytic converter for motor vehicle should also be considered3. Vehicles should be checked for emission compliance to be eligible for registration. The check should be done before the vehicle is registered or registration renewed.
8) Monitoring - Establish permanent air quality monitoring stations to assess the effectiveness of GOV initiatives. The design of the network and the type of pollutants to be measured are important element of the monitoring design. Permanent continuous monitoring stations also make it possible to establish the long term trend of air quaity.
3 One example of this measure is that of the Thai MOSTE and the Pollution Control Department (PCD) who together set up emission standards for cars in 1992 and for motorcycles in 1993. In 1995, all buses, 3-wheeled cars (tuk-tuk) and boats were tested for emission compliance before registration.
52
Gradually extend the network of permanent air quality monitoring stations to include other large cities (in addition to Hanoi and Ho Chi Minh City) like Danang, Can Tho etc.
9) Develop and provide daily information/forecast of air pollution level (or index) in large cities taking into account meteorological forecasts. Such a service is strongly positive for public health besides raising awareness of air pollution issues among the populace.
10)Transport planning to reduce the traffic congestion. A number of initiatives such as road widening, private build-operatate-transfer (BOT) schemes should be encouraged. High levels of nitrogen oxides and carbon monoxide at many traffic sites are due mainly to traffic congestion.
11)Use of Public Transport - At the moment, the provision of public transport, mainly by bus, is low. There is an increasing number of shared cars and small private buses. The demand for convenient transport in the city is increasing with increasing numbers of tourists. A scheme to expand the bus services in many parts of the city, especially along main traffic routes might ameliorate the traffic and air quality.
12)Airshed Study - Conduct studies to understand the characteristic of the airshed in relation to stationary and mobile sources, and the emission inventory for the urban areas of Viet Nam. The airshed studies involve the detailed understanding of the transport mechanism of the air due to meteorology and the emission inventory of both stationary and mobile sources. An airshed model then can be constructed to be used as a tool of selecting optimal control strategies.
13)Air Quality Management Plan - Formulate an effective air quality management plan based on the airshed studies and the economic implications of various control strategies.
4.3 Inadequate Solid Waste Management 229. Assessment in this EPA tells us that performance in solid waste management has been mixed. Whereas urban areas have seen improved collection rates; rural areas lag behind. In conditions of rapidly increasing total maounts of waste, improvements in collection rates were not sufficient to reduce the total volume of waste left uncollected. Furthermore, collection does not necessarily translate into safe disposal. Viet Nam produces 15 million tons of waste every year most of which is not safely dispsoed, posing a significant threat to public health and environment. This is particularly true of hazardous and toxic wastes.230. Given Viet Nam’s fast economic growth, the waste from households, industries, commercial enterprises, and hospitals is expected to increase rapidly over the next decade. Managing this waste is a major challenge—both because of its substantial cost and its large potential benefits to public health and the quality of life. It is also important for the lives of many Vietnamese who rely on informal waste collection and recycling activities for their livelihood.231. Viet Nam’s solid waste management needs are substantial in relation to existing handling and disposal infrastructure and the continued growth of urban areas and industrial development. It is essential to sustain the recent trend of increased investment in waste management while paying more attention to the sustainability of its financing.
A. EPA Process and Data Gaps 1) Data on waste collection should be updated
regularly (current EPA only presents information to 2003). Also, a sample of data from rural areas should be obtained to provide a more balanced picture of waste management in the country.
2) More information should be collected on disposal methods employed, the condition of landfills and open dump sites, leachate control, in particular at the ‘hot-spot’
53
locations that have been identified by GOV to have pose health risks. Data should also be collected on informal waste collection modes such as waste pickers at landfills, informal waste collectors, and waste buyers.
3) For ‘response’ indicator, further studies should be conducted to analyse the expenditure pattern of investment in solid waste management, both for GOV and ODA funds.
4) Better understanding is needed of the structure of waste disposal charges and the evolving policy on waste disposal charges payable by households in Viet Nam.
B. Other Recommendations 5) Safe Disposal – In addition to effective
collection systems; GOV should focus on safe disposal and treatment of collected waste. All open and controlled dump sites should progressively be phased out and replaced with sanitary and/or engineered landfills. A ‘national hazardous waste management strategy and plan’ should be developed.
6) Institutional Framework - URENCOs suffer from staffing and capital constraints; and do not have staff trained to deal with hazardous waste. Increased budgetary allocation should be made for URENCO and staff trained in hazardous waste management technologies.
7) Financing Priorities – A very large investment is required to meet the estimated expenditure target of VND 40 trillion by 2020 and much of this needs to be contributed by the users of waste collection services. Various forms of cost recovery need to be explored; including flat rates, fees combined with other service fees (water, electricity), and fees linked to ability-to-pay. Private sector participation and should be promoted and supported by policies and other economic incentives. Also, appropriate budget allocation needs to be made to operation and maintenance of solid waste management facilities.
8) Monitoring and Enforcement – improved monitoring of landfills and composting facilities needs to be undertaken; to ensure their technical and environmental performance.
9) Recycling and Reuse – Simple to use and inexpensive ways of waste recycling and reduction should be explored. Any recycling or reuse programs should be easy to implement schemes without requiring energy intensive equipment or processes so that no additional pollution and climate change impacts result.
4.4 Forest Resources 232. The Government of Viet Nam is keenly aware of the importance of forest resources. Clear policies and targets have been set. Several programs have been undertaken to protect and increase the forest resource during the past 20 years. Fuelwood extraction is regulated better than in the past, reducing the pressure on forests. However, some threats to the forests such as forest fires, localized overlogging, and shifting shifting cultivation remain. Success in stabilizing and increasing the forest cover may have come at the cost of reduced forest quality.
A. EPA Process and Data Gaps 1) Forest cover assessments should be made
separately for each of the three principal forestland use categories and not only for all categories combined.
2) Future forest cover assessments should attempt to assess the quality of the remaining forest; not only the quantity.
3) Monitoring of forest conditions within protected areas would be useful for the assessment of responses to threats to biodiversity.
4) The total wood extraction should be closely monitored, replacing FAO estimates in the current fact sheet with in-country figures.
5) Regular and consistent reporting of the FMAP or 5MHRP project progress needs to be put in place.
54
B. Other Recommendations 6) National programs like the 5-Million Hectare
Afforestation Program should be used as vehicles for greater community participation in forestry planning.
4.5 Threats to Biodiversity233. The IUCN Redlist of Threatened Species has provided the basis for a baseline state indicator and in the future can form the basis for the ongoing state of biodiversity monitoring in Viet Nam. However the Redlist by itself does not record the history of threatened species in Viet Nam and a system needs to be put in place for the annual update of the indicator and the recording of the history of threatened species in Viet Nam. And depending on how well the indicator serves in the future, further research may be required to develop alternative state indicators. In light of recent efforts to protect marine areas, a separate or combined indicator should be developed to monitor progress in marine protected areas.234. The threats to biodiversity are numerous and diverse and no single pressure indicator can capture the compound effect. Loss of habitat is the dominant cause but loss of forest habitat is not the only one. Hunting and gathering is also an important factor and a separate indicator should be developed to capture this pressure.235. On the response side, the total under the national system of protected areas will likely remain the principal indicator but the indicator needs to take into account the level of species-specific protection that these protected areas offer. The IUCN category is a starting point but this should be complemented by ongoing monitoring of the activities that take place within these protected areas, the change in vegetation cover, and the threatened status of the species that these protected areas aim to protect. Some of this work has already been initiated by BirdLife International through the online publication of the Viet Nam “Sourcebook”. Much like the IUCN Redlist, the ongoing support for the Sourcebook will be critical to ongoing monitoring of biodiversity in Viet Nam.236. Wetland areas and marine habitats demand additional efforts to ensure adequate levels of
protection. Additional wetland and marine areas should be included in the national protected area system with specified management and exploitation regimes.
A. EPA Process and Data Gaps 1) Using the 2004 indicator fact sheet as
baseline, establish an ongoing system which will monitor the change in individual species status on the IUCN Redlist and add or delete individual species from subsequent issues of the Redlist.
2) Develop a complementary state indicator and monitoring system for marine protected areas.
3) Develop long-term trends and monitoring of critical habitat loss.
4) Develop a response indicator and monitoring system based on species protected by law.
5) Institutionalize the ongoing publication and updating of the Viet Nam Sourcebook on Protected Areas.
6) Monitor and conduct research on other globally accepted indicators of biodiversity conservation.
B. Other Recommendations 7) Strictly enforce controls on trade in
protected fauna and flora species;
8) Periodically assess the experience of biodiversity management and conservation and disseminate the lessons and insights of scientists, managers, conservationists and local people.
4.6 Threats to Coastal Zones237. Viet Nam’s coastline has been under pressure from population growth and commercial activites that have included aquaculture, oil & gas exploration, tourism, fishing, transport and sea port development and others. Over the last 50 years, Viet Nam has lost about three quarters of its mangrove forest. The surge in shrimp farming emerges as the leading causes of mangrove forest loss that has been the greatest in the Mekong Delta, and Quang Ninh and Hai Phong provinces. Other causes of mangrove loss have included conversion to agriculture and housing, war destruction, and fuelwood production.
55
238. In Viet Nam, most sectoral economic activities in marine and coastal zones have paid insufficient attention to the social and environmental aspects of development. The co-operation among project management units, scientific organizations and non-government organizations on environmental management of coastal zone issues is weak. Coastal communities themselves need to be engaged more pro-actively in coastal resource management.
A. EPA Process and Data Gaps 1) To support future EPAs, it is recommended
that MONRE undertake studies to document the progress achieved in implementing the various policies and programs intended to safeguard the coastal zone eco-systems. An annual survey of all coastal provinces should be undertaken to assess the (i) changes in the area of mangroves, province by province; (ii) changes to the number of shrimp farms and/or aquaculture ponds; (iii) the use of pesticides in shrimp farming; (iv) the volume of aquaculture waste discharged into coastal waters and areas; (v) the development of marine ecotourism in and close to sensitive habitats.
2) Additional state and pressure indicators should be considered such as impact from oil spills, oil content of coastal waters, or number of oil spill incidents.
B. Other Recommendations 3) Develop and implement comprehensive
management plans for declared MPAs. Incorporate buffer zones for MPA management, especially for inhabited and heavily used sites. Utilize integrated coastal management (ICM) principles into MPA zoning, e.g., including a landscape approach from the watershed to the offshore.
4) Institutional framework – Clear delineation of authority is required for the management of marine protected areas. Staffing and financing constraints for management of marine protected areas should be better understood and addressed urgently.
5) Oil spill contingency plan should be rolled out.
6) Ways of recycling some of the aquaculture profits inot mangrove regeneration and protection should be explored.
7) Given that most oil spills accidents are related to commercial activities, private sector participation should be explored in oil reduction and spill prevention/management plans.
4.7 Climate Change239. Viet Nam signed the United Nations Framework Convention on Climate Change (UNFCCC) on 11/6/1992 and ratified it on 16/11/1994. The country also signed the Kyoto Protocol on global warming on 3/12/1998 and ratified it on 25/9/2002. The nation-wide GHG emission inventory was carried out in 1993,1994,1998. The national focal point to implement UNFCCC, KT and CDM was set up.
A. EPA Process and Data Gaps 1) Estimate/collect data on CO2 emissions
from sources not documented in this EPA e.g., waste combustion, vehicles and some industrial processes.
2) Reassess the GHG emisison data (CO2 equivalent) data in light of the current (2005 or later) economic conditions.
B. Other Recommendations 3) Formulate and approve the national action
program to implement the UNFCCC and Kyoto Protocol recommendations.
4) Strengthen the coordination among line ministries/agencies to bring into play their capacity for UNFCCC implementation.
5) Pay attention to renewable energy development, clean development mechanism and other cross-sectoral initiatives that have the potential of delivering multiple benefits besides GHG emission reduction, such as assessment of climate change impacts of biodiversity conservation policies etc.
6) Continue to support climate change awareness raising program and technology transfer.
56
VIET NAM NATIONAL ENVIRONMENTAL PERFORMANCE ASSESSMENT
(EPA) REPORT
FACT SHEET APPENDIX
VIET NAM
1. FACT SHEET TEMPLATE AND GUIDELINES
2. INLAND WATER POLLUTION FACT SHEETS
3. AIR POLLUTION FROM MOBILE SOURCES FACT SHEETS
4. INADEQUATE SOLID WASTE MANAGEMENT FACT SHEETS
5. FOREST RESOURCES FACT SHEETS
6. THREATS TO BIODIVERSITY FACT SHEETS
7. THREATS TO COASTAL ZONE FACT SHEETS
8. CLIMATE CHANGE FACT SHEETS
56
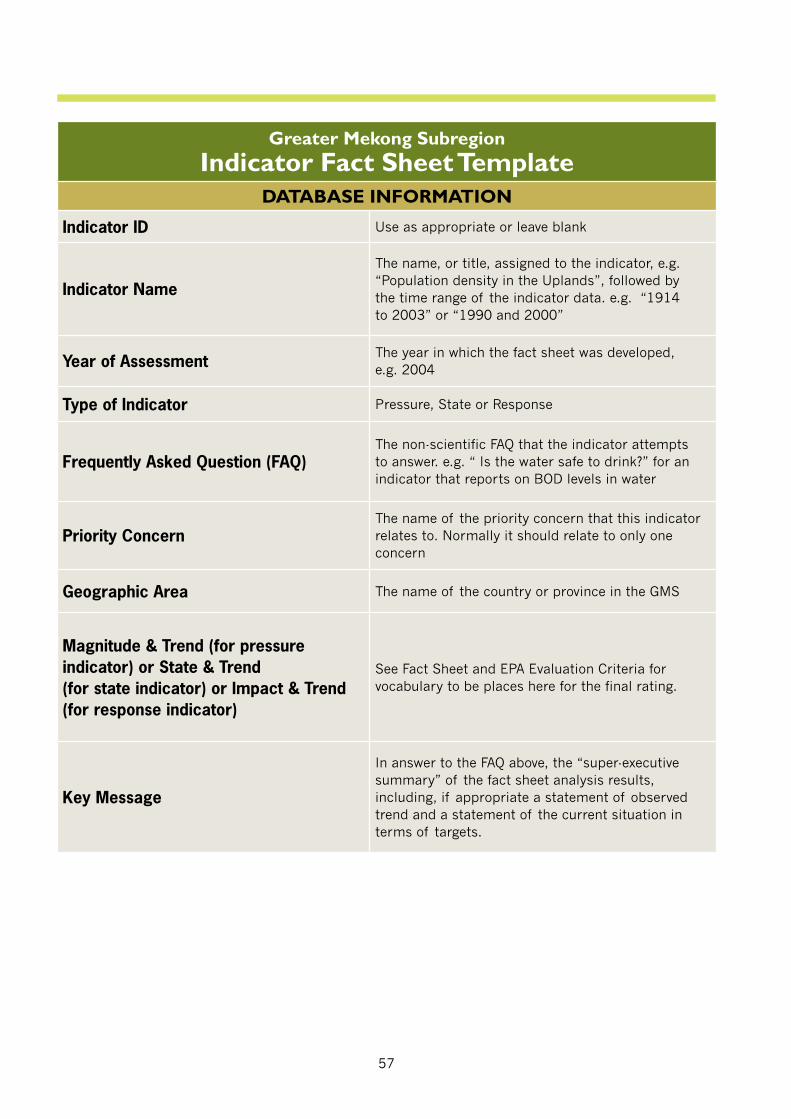
57
Greater Mekong SubregionIndicator Fact Sheet Template
DATABASE INFORMATION
Indicator ID Use as appropriate or leave blank
Indicator Name
The name, or title, assigned to the indicator, e.g. “Population density in the Uplands”, followed by the time range of the indicator data. e.g. “1914 to 2003” or “1990 and 2000”
Year of Assessment The year in which the fact sheet was developed, e.g. 2004
Type of Indicator Pressure, State or Response
Frequently Asked Question (FAQ)The non-scientific FAQ that the indicator attempts to answer. e.g. “ Is the water safe to drink?” for an indicator that reports on BOD levels in water
Priority ConcernThe name of the priority concern that this indicator relates to. Normally it should relate to only one concern
Geographic Area The name of the country or province in the GMS
Magnitude & Trend (for pressure indicator) or State & Trend (for state indicator) or Impact & Trend (for response indicator)
See Fact Sheet and EPA Evaluation Criteria for vocabulary to be places here for the final rating.
Key Message
In answer to the FAQ above, the “super-executive summary” of the fact sheet analysis results, including, if appropriate a statement of observed trend and a statement of the current situation in terms of targets.
58
TECHNICAL INFORMATION
A. Defi nition This section should define very precisely what “the indicator” is and in what units the indicator is expressed. It should also include a precise definition of the terms that make up the indicator.The section should start out with a generic statement such as“This indicator attempts to track the amount of…(give precise definition of what you are tracking) over… (usually time); it is expressed as…. (give the precise units of the indicator, both numerator and denominator).Follow this definition with the definition of other terms you have utilized for the definition of the indicator (e.g. define more precisely what “forest cover” means, what “expenditure” means, what “threatened species” means, etc.
B. Data SourceIf the data originates from a known information system, give the name of such information (e.g. FAOSTAT) along with the name of the organization which maintains such information system (e.g. FAO). If the data was taken from a publication, give the full reference of that publication. If the data was extracted from the Internet, give the generic name of the website homepage but do not include the URL. Otherwise specify where or from whom you obtained the data.
C. Geographic Area / Population CoverageIf the data covers the entire country or province, or if the data represents 100% of the population you are describing, then simply state so (e.g. “the data and the indicator is representative of … for the country as a whole”). Otherwise describe any gaps or restrictions on the geography (e.g. “excluding province X” or “only on agricultural soils’) or on the population (e.g. “only commercial fisheries” or “only reported cases”). If the data is only for a representative sample of the population (e.g. “only major rivers” or “only X cities”), then provide more details on the sub-sample (e.g. “Cities X and Y” or “X rivers with discharge greater than Y cms”.
D. Temporal CoverageIf the data represents a one-time measurement (e.g. land cover), state as precisely as you can the place in time when this measurement was taken (e.g. “represents ground condition in 1999”). If the data is expressed as a time series, given the start and end times along with an explanation of any gaps which may occur in the time series and/or how those gaps may have been filled in.
E. Methodology and Frequency of CoverageWhenever possible, describe the methodologies that the originator utilized to compile the datasets that you are utilizing ( e.g. “using un-supervised remote sensing classification on a Landsat-7 satellite image” or “using a 1km by 1km random stratified grid’). Comment on the frequency of measurement and/or update (e.g. “a one-time measurement from a project” or “based on year 2000 data which will be updated shortly”) and on the likelihood that the measurement will be repeated ( e.g. “maintained by a UN organization for the past four decades”).
F. Methodology of Data ManipulationThe focus here is on the manipulation that you may have made to the original data to get it into a form where it has become useful to you as an indicator; the focus is not on the methods that the originator utilized to obtain the data in the first place. Describe all the manipulations you have done on the original data, ensuring that enough detail is given so that others can repeat the methodology at a late data in time.
59
QUALITATIVE INFORMATION
A. Strength and Weakness (data level)Comment on the strengths and weaknesses of the data you have utilized, in relation to the phenomenon you were trying to measure. If the indicator is to show a trend over time, comment on the strengths (or weaknesses) of the data to show variance over time (present and future). Comment on any bias that is inherent with the data in respect of the phenomenon you are trying to measure.
B. Reliability, Accuracy, Robustness, Uncertainty (data level)Comment on the reliability of the data, especially in relation to whom or where you got it from; quote all endorsements that were made on the data during the review process. Quote any accuracy measures that were given or published with the original data (e.g. “according to IHO standards” or “according to national mapping standards”. Comment on the robustness of the data in terms of how it may have been used elsewhere and how it can still be applicable to the GMS subregion. State any assumptions you have made with the data and any relevant uncertainties.
C. Future Work Required (for data level and indicator level)If applicable, comment of how the data could be improved to better serve the purposes of the indicator, or how the indicator could be improved with additional or alternative sources of data.
SUPPORTING DATA TABLES, GRAPHS AND MAPS
The section should start with a graph (Figure 1) and a table (Table 1) which summarizes the value of the indicator over time. The graph will normally be re-produced in the EPA report, without the table. The table therefore should contain all the necessary data to re-produce the graph and, as much as possible, not too much else.The title of the graph and table should correspond to the name of the indicator. If the indicator is expressed as a time series, the x-axis of the graph should also be expressed as a time series. Add as many supplemental graphs and tables, or maps, as required to further expand on the indicator or to include non-indicator specific information that might supplement the fact sheet but make sure supplemental information is used and referenced in the final Analysis Section of the fact sheet.All graphs should be followed by the table with the data that was utilized to generate them. Graph titles and table titles should be placed outside the graph and table, as a bolded title on top of the figure or table. All tables should identify the source of the data in the last row of the table.Try and keep the graphs and maps to the minimum size, but with sufficient resolution and detail so as to portray the trend or spatial distributions that are being evaluated. Number each table and each graph (or map) so that they can be referenced in the evaluation text. Give the same number to the table and the corresponding graphic; if you generate more than one graphic from the same table, use alphabetical sub-numbering.
60
SUMMARY
A. Policy ReferenceThis section on policy reference may not apply to some pressure and state indicators and to some very specific response indicators where related policies and regulations cannot be inferred. In these cases, the entire section can be omitted. But for normal response indicators, the lack of policy or regulation should be noted and highlighted as a “gaps”.
1. Purpose: Comment on the purpose of the indicator and (i) what function it performs in terms of environment performance assessment i.e. what parameter it assesses and what resource it protects, (ii) what objective’s compliance it monitors and (iii) what potential corrective action (s) it requires.
2. Relevance to Environment Planning and Management: Comment on the broad/general importance of this indicator for assessing other related environmental issues eg. socio-economic relevance, link with any public health, quality of life related issues etc.
3. Linkage to Other Indicators:Give a list of other indicators this indicator is linked to i.e. what other indicator values this indicator directly or indirectly affects.
4. Targets: Give details on what targets have been set by the national environment agency or ministry for this indicator to comply with i.e. what are the quantifiable environmental standard this indicator has to comply with.
5. International Environment Treaties: If applicable, give the name, scope, status of implementation of the international environmental treaty(s) your country has signed for this indicator and give an update on the progress of its implementation. Otherwise state “None applicable”.
6. LawsIf applicable, name national laws that have some implication to the indicator. Otherwise leave out this sub-section.
B. AnalysisThis section is dedicated to the analysis of the indicator and the final rating of the results. The first paragraphs should be focused on the description of the observed results, as observed in the tables and graphs (e.g. “As can be observed from Table 1 and Figure 1”, describe the observed value and the observed trend of the indicator).State if the indicator values comply with the stipulated national target or standard and (in relevant cases) international standard. Comment on the size of the discrepancy between the two and its trend (can a reliable trend be established? Does it point to an underlying improvement or deterioration? Can the fluctuating values of the indicator be related to distinct policy interventions such as mitigation measures, changed pattern of economic incentives, or other corrective actions?). Say whether the results might be indicative of inappropriate or moving targets/standards rather than simply reflecting performance. Comment on the role, if any, of factors outside management control (climatic factors, natural disasters, etc.). Identify the factors most relevant to observed outcomes and specify key related indicators. Keep in mind the ultimate purpose of your effort, i.e. to review performance by environmental concerns and groups of concerns such review normally resting on several indicators rather than a single one. Analysis of a single indicator to be performed below is important but it is in combining it with the analysis of other indicators that policy insights are generated and performance assessment gains depth.The last paragraph of this analysis section should be focused on the justification of the indicator ranking, based on the vocabulary and guidelines given in “Fact sheet and EPA Evaluation Criteria”. The last sentence should highlight (in bold) the final ranking of the indicator results.
61
Greater Mekong SubregionIndicator Fact SheetDATABASE INFORMATION
Indicator ID
Indicator Name BOD5 Concentration in Selected Rivers – 1995 to 2002
Year of Assessment 2005
Type of Indicator State
Frequently Asked Question (FAQ) What is the state of water quality in major rivers of Viet Nam?
Priority Concern Inland Water Pollution
Geographic Area Viet Nam
State & Trend Average and Deteriorating
Key Message
In general, BOD5 concentrations in all five rivers monitored exceed the safe drinking limit of 5 mg/l; however it is below the threshold of 25 mg/l for other non-domestic uses. All these measurements were taken in major urban areas and may not be representative of water quality in other Vietnamese Rivers. The data do not show any obvious temporal or geographical trend.
62
TECHNICAL INFORMATION
A. Defi nitionThis indicator attempts to track the state of water quality in major Vietnamese rivers; it is expressed as the amount of 5-day Biological Oxygen Demand (BOD5) concentrations, in milligrams per liter, over time. BOD measures the amount of oxygen required or consumed for the microbiological decomposition (oxidation) of organic material in water. BOD5 is an approved standard of measuring water quality. The method consists of filling with sample, to overflowing, an airtight bottle of the specified size and incubating it at the specified temperature for 5 days. Dissolved oxygen is measured initially and after incubation, and the BOD is computed from the difference between initial and final Dissolved Oxygen (DO). Because the initial DO is determined shortly after the dilution is made, all oxygen uptake occurring after this measurement is included in the BOD measurement. The fact sheet also contains supplemental information on Suspended Solids (SS), BOD, Chemical Oxygen Demand (COD) and DO in selected lakes, rivers and canals but only for year 2003.
B. Data SourceThe data utilized for this indicator was extracted from the 2003 Report on the State of Water Environment. This report was compiled by National Environment Protection Agency (NEA), attached to Ministry of Natural Resources and Environment (MONRE). Supplemental information was extracted from the 2003 report on the State of Water Environment.
C. Geographic Area / Population CoverageThe indicator is based on water samples taken on five major rivers in Viet Nam. The sampling sites are located near major urban areas and the results may be biased by this, i.e. the indicator data may not be representative of the water quality of all rivers in Viet Nam.
D. Temporal CoverageThe indicator data is based on periodic samples taken throughout the years 1995 to 2002.
E. Methodology and Frequency of CoverageThe indicator data is based on monitoring undertaken by the National Environmental Protection Agency (NEA) through the period 1995 to 2002. More recent data could not be secured.
F. Methodology of Data ManipulationThe indicator data and the supplemental information have been taken directly from the cited sources.
63
QUALITATIVE INFORMATION
A. Strength and Weakness (data level)The main reason for the choice of this indicator is that it is based on ongoing monitoring programs of the NEA and that there are national targets directly associated with these targets. The main weakness of the indicator is that it is based only on five monitoring sites and that these sites are close to urban areas. As such, the indicator may be biased and most likely over-states the existing level of water pollution in other Vietnamese rivers.Another limitation of the indicator is that it provides robust but imprecise results. It gives a good comparison among samples, but does not give an exact measure of the concentration of any particular contaminant. It is important to follow laboratory procedures precisely to obtain consistent results. The five-day time frame to obtain results represents the main operational drawback of the indicator.
B. Reliability, Accuracy, Robustness, Uncertainty (data level)It is assumed that NEA follows international standards in measuring BOD5 concentrations and the reliability, accuracy and robustness of their measurements has not been specified nor questioned.
C. Future Work Required (for data level and indicator level)NEA should provide more recent data on these five sampling sites and the indicator should be updated on an annual basis. Similar data for other such sites or for monitoring sites away from urban areas would also be useful.
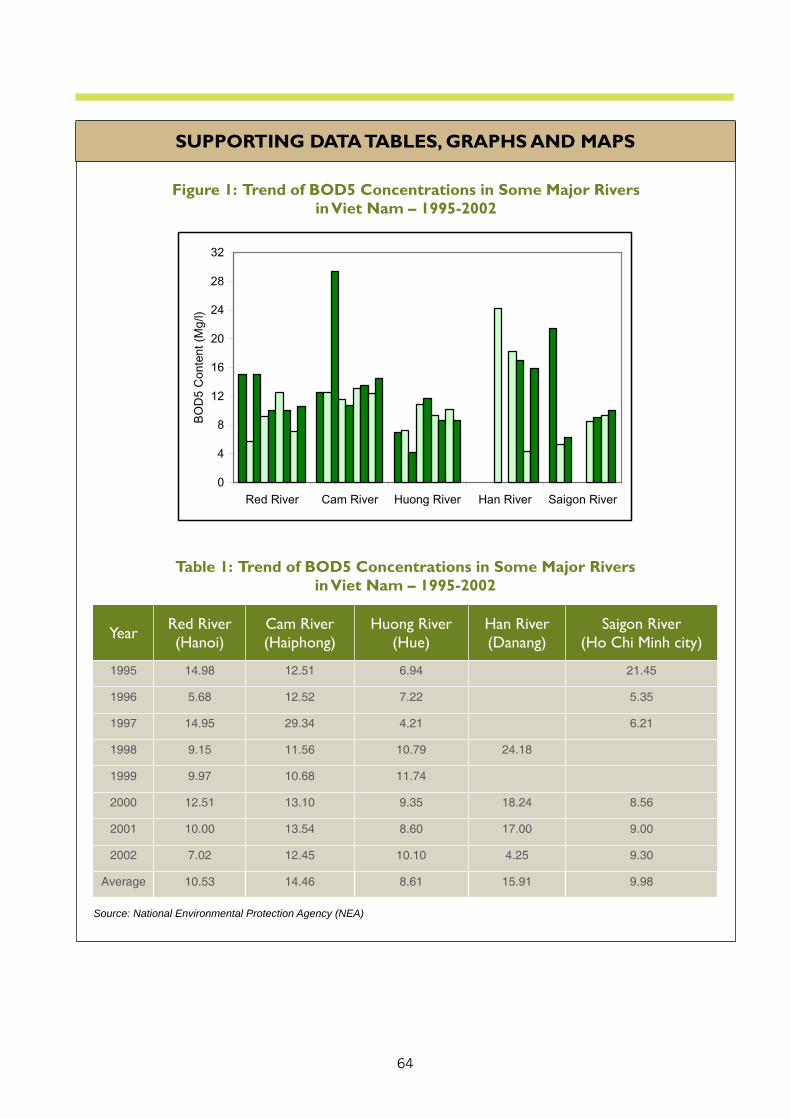
64
Source: National Environmental Protection Agency (NEA)
Year Red River (Hanoi)
Cam River (Haiphong)
Huong River (Hue)
Han River (Danang)
Saigon River (Ho Chi Minh city)
1995 14.98 12.51 6.94 21.45
1996 5.68 12.52 7.22 5.35
1997 14.95 29.34 4.21 6.21
1998 9.15 11.56 10.79 24.18
1999 9.97 10.68 11.74
2000 12.51 13.10 9.35 18.24 8.56
2001 10.00 13.54 8.60 17.00 9.00
2002 7.02 12.45 10.10 4.25 9.30
Average 10.53 14.46 8.61 15.91 9.98
SUPPORTING DATA TABLES, GRAPHS AND MAPS
Figure 1: Trend of BOD5 Concentrations in Some Major Rivers in Viet Nam – 1995-2002
Table 1: Trend of BOD5 Concentrations in Some Major Rivers in Viet Nam – 1995-2002
0
4
8
12
16
20
24
28
32
Red River Cam River Huong River Han River Saigon River
BO
D5
Con
tent
(Mg/
l)
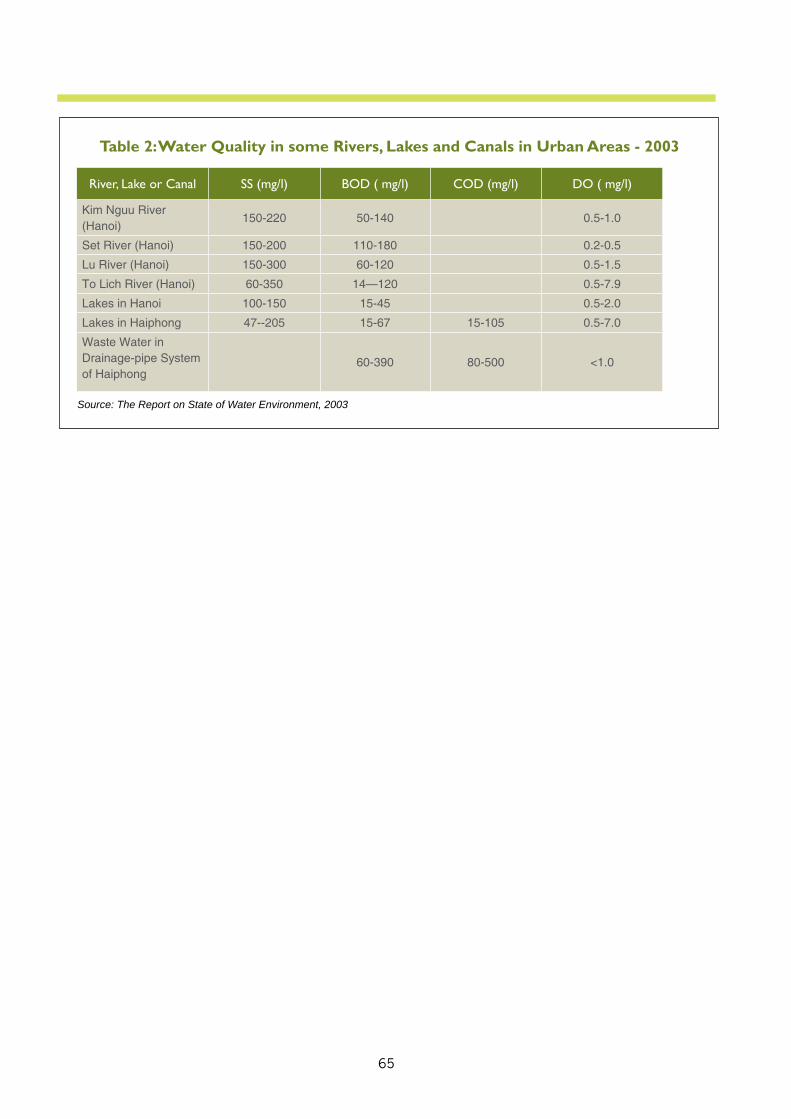
65
River, Lake or Canal SS (mg/l) BOD ( mg/l) COD (mg/l) DO ( mg/l)
Kim Nguu River (Hanoi)
150-220 50-140 0.5-1.0
Set River (Hanoi) 150-200 110-180 0.2-0.5
Lu River (Hanoi) 150-300 60-120 0.5-1.5
To Lich River (Hanoi) 60-350 14—120 0.5-7.9
Lakes in Hanoi 100-150 15-45 0.5-2.0
Lakes in Haiphong 47--205 15-67 15-105 0.5-7.0
Waste Water in Drainage-pipe System of Haiphong
60-390 80-500 <1.0
Table 2: Water Quality in some Rivers, Lakes and Canals in Urban Areas - 2003
Source: The Report on State of Water Environment, 2003
66
SUMMARY
A. Policy Reference1. Purpose: The purpose of this indicator is to assess the quality of water available to consumers in localities or communities for basic and commercial needs.
2. Relevance to Environment Planning and Management: Sustainable development is heavily dependant on suitable water availability for a variety of uses ranging from domestic to industrial supplies. Strict water quality standards have been established to protect users from health and other adverse consequences of poor water quality. The presence of BOD as an indicator of faecal contamination can restrict water use and development or necessitate expensive treatment. Ill health due to water quality problems can reduce work capability and affect children’s growth and education. It is, therefore, important to monitor organic pollution to identify areas posing a threat to health, to identify sources of contamination, to ensure adequate treatment, and provide information for decision making to enhance water sustainability.
3. Linkage to Other Indicators:Several indicators are directly linked to the concentration of organic material in freshwater. These measures include annual withdrawals of ground and surface water, domestic consumption of water per capita, concentration of faecal coliforms in freshwater, percent of population with adequate excreta disposal facilities, access to safe water, infant mortality rate, nutritional status of children, environmental protection expenditures as a percent of Gross Domestic Product, and expenditure on waste collection and treatment.
4. Targets: According to the Viet Nam Surface Water Quality Standard TCVN 5942-1995, the parameter limits and the maximum allowable concentration of BOD5 (20˚C) is less than 4 mg/l for surface water to be utilized for domestic water supply and less than 25 mg/l for surface water to be utilized for purposes other than domestic water supply. According to the same standards, the suspended solids limits are 20 and 80 mg/l, COD thresholds are <10 and < 35 and dissolved oxygen limits are set at 36 and 32, for domestic water supply and non domestic water supply respectively.
5. International Environment Treaties: The Resolution II and Plan of the United Nations Water Conference recommended governments reaffirm the commitment made at Habitat to “adopt programs with realistic standards for quality and quantity to provide water for rural and urban areas”. The goal of universal safe water coverage was reiterated at the World Summit for Children in 1990.
B. AnalysisAs can be observed from Figure 1 and Table 1, there are varied and fluctuating patterns of BOD5 concentrations in all five major rivers in Viet Nam, and no obvious trend over time. It can be noted however that all but one of the measurements on the Cam River are under the 25 mg/l threshold; also that all measurements are above the safe water supply threshold.Based on the average of annual figures (see Table 1) over the period of record, the Han River near Danang appears to be the most polluted in terms of BOD5 concentrations; the Huong River near Hue appears to be the least polluted. Based on other observations made in 2003 on selected rivers, lakes and canals near Hanoi and Haiphong (see Table 2) , Suspended Solids (SS) and Chemical Oxygen Demand (COD) levels in these areas are also above the safe drinking water limits. BOD5 concentration in some major rivers exceeds the standard for domestic use and is showing an upward trend. Whereas water quality has not reached an alarming state yet; growth in population and lack of adequate treatment facilities increase the likelihood of further deterioration in the absence of resolute countermeasures. Based on these observations and with no comparative figures other than the national standards, it is concluded that the state of water pollution in Viet Nam is average with deteriorating trend.
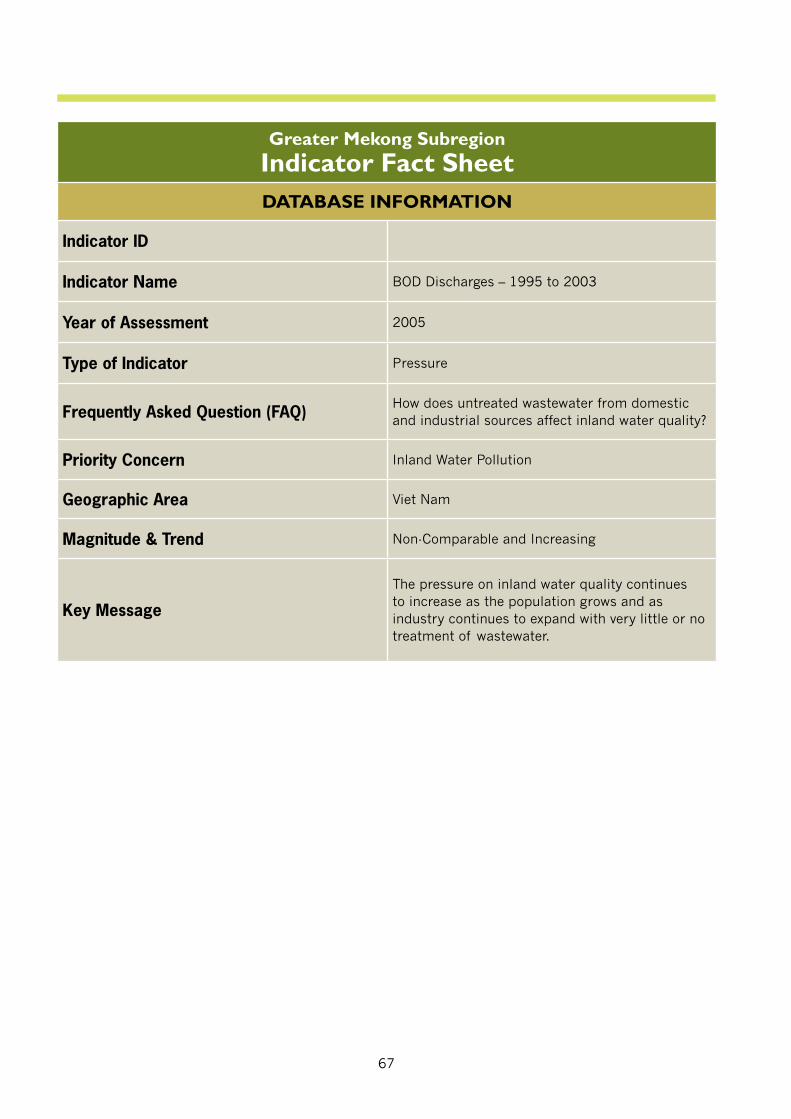
67
Greater Mekong SubregionIndicator Fact SheetDATABASE INFORMATION
Indicator ID
Indicator Name BOD Discharges – 1995 to 2003
Year of Assessment 2005
Type of Indicator Pressure
Frequently Asked Question (FAQ) How does untreated wastewater from domestic and industrial sources affect inland water quality?
Priority Concern Inland Water Pollution
Geographic Area Viet Nam
Magnitude & Trend Non-Comparable and Increasing
Key Message
The pressure on inland water quality continues to increase as the population grows and as industry continues to expand with very little or no treatment of wastewater.
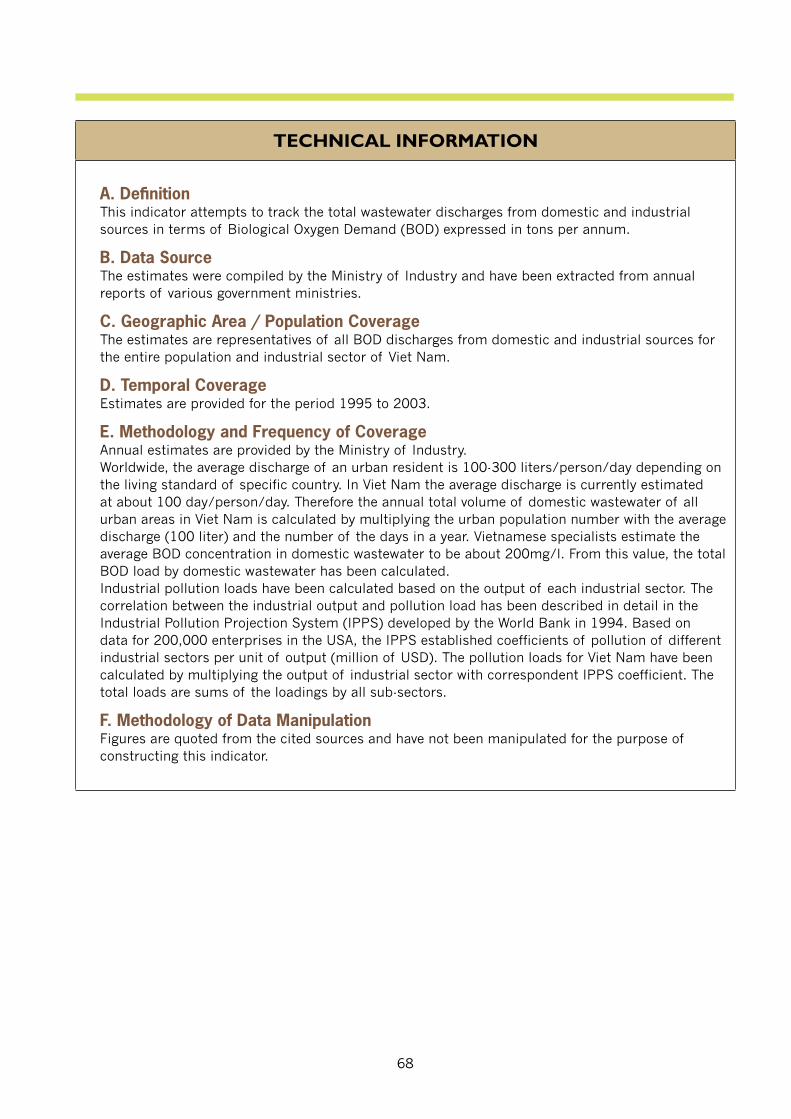
68
TECHNICAL INFORMATION
A. Defi nitionThis indicator attempts to track the total wastewater discharges from domestic and industrial sources in terms of Biological Oxygen Demand (BOD) expressed in tons per annum.
B. Data SourceThe estimates were compiled by the Ministry of Industry and have been extracted from annual reports of various government ministries.
C. Geographic Area / Population CoverageThe estimates are representatives of all BOD discharges from domestic and industrial sources for the entire population and industrial sector of Viet Nam.
D. Temporal CoverageEstimates are provided for the period 1995 to 2003.
E. Methodology and Frequency of CoverageAnnual estimates are provided by the Ministry of Industry.Worldwide, the average discharge of an urban resident is 100-300 liters/person/day depending on the living standard of specific country. In Viet Nam the average discharge is currently estimated at about 100 day/person/day. Therefore the annual total volume of domestic wastewater of all urban areas in Viet Nam is calculated by multiplying the urban population number with the average discharge (100 liter) and the number of the days in a year. Vietnamese specialists estimate the average BOD concentration in domestic wastewater to be about 200mg/l. From this value, the total BOD load by domestic wastewater has been calculated.Industrial pollution loads have been calculated based on the output of each industrial sector. The correlation between the industrial output and pollution load has been described in detail in the Industrial Pollution Projection System (IPPS) developed by the World Bank in 1994. Based on data for 200,000 enterprises in the USA, the IPPS established coefficients of pollution of different industrial sectors per unit of output (million of USD). The pollution loads for Viet Nam have been calculated by multiplying the output of industrial sector with correspondent IPPS coefficient. The total loads are sums of the loadings by all sub-sectors.
F. Methodology of Data ManipulationFigures are quoted from the cited sources and have not been manipulated for the purpose of constructing this indicator.
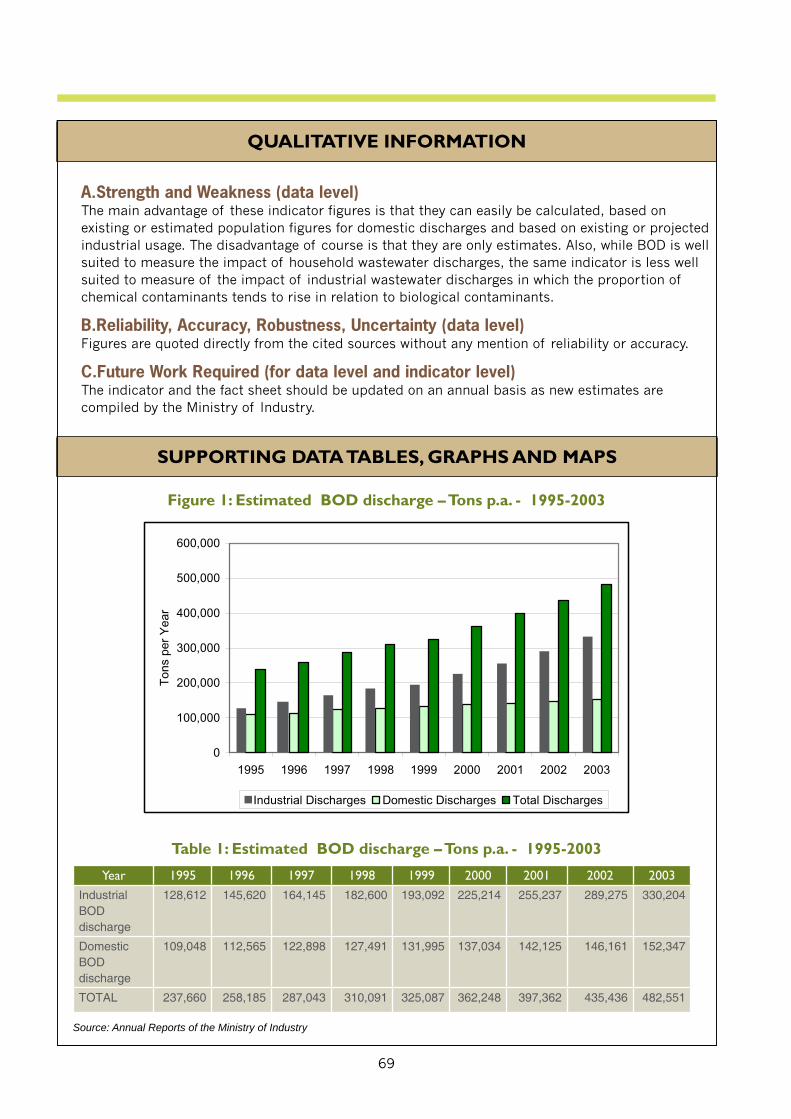
69
QUALITATIVE INFORMATION
A.Strength and Weakness (data level)The main advantage of these indicator figures is that they can easily be calculated, based on existing or estimated population figures for domestic discharges and based on existing or projected industrial usage. The disadvantage of course is that they are only estimates. Also, while BOD is well suited to measure the impact of household wastewater discharges, the same indicator is less well suited to measure of the impact of industrial wastewater discharges in which the proportion of chemical contaminants tends to rise in relation to biological contaminants.
B.Reliability, Accuracy, Robustness, Uncertainty (data level)Figures are quoted directly from the cited sources without any mention of reliability or accuracy.
C.Future Work Required (for data level and indicator level)The indicator and the fact sheet should be updated on an annual basis as new estimates are compiled by the Ministry of Industry.
Year 1995 1996 1997 1998 1999 2000 2001 2002 2003Industrial BOD discharge
128,612 145,620 164,145 182,600 193,092 225,214 255,237 289,275 330,204
Domestic BOD discharge
109,048 112,565 122,898 127,491 131,995 137,034 142,125 146,161 152,347
TOTAL 237,660 258,185 287,043 310,091 325,087 362,248 397,362 435,436 482,551
SUPPORTING DATA TABLES, GRAPHS AND MAPS
Figure 1: Estimated BOD discharge – Tons p.a. - 1995-2003
Table 1: Estimated BOD discharge – Tons p.a. - 1995-2003
Source: Annual Reports of the Ministry of Industry
0
100,000
200,000
300,000
400,000
500,000
600,000
1995 1996 1997 1998 1999 2000 2001 2002 2003
Ton
spe
rY
ear
Industrial Discharges Domestic Discharges Total Discharges
70
SUMMARY
A.Policy Reference1.Purpose: The purpose of this indicator is estimate the pressure on inland water pollution originating from various domestic and industrial sources.
2.Relevance to Environment Planning and Management: Sustainable development is heavily dependant on suitable water availability for a variety of uses ranging from domestic to industrial supplies. Strict water quality standards have been established to protect users from health and other adverse consequences of poor water quality. High BOD concentrations (typically correlated with faecal contamination) can restrict water use and development or necessitate expensive treatment. Ill health due to water quality problems can reduce work capability and affect children’s growth and education. It is, therefore, important to monitor organic pollution to identify areas posing a threat to health, to identify sources of contamination, to ensure adequate treatment, and provide information for decision making to enhance water sustainability.
3.Linkage to Other Indicators:This indicator is directly linked to the state indicator which attempts to track the monitored levels of BOD5 in some major rivers across Viet Nam.
4.Targets: There are no set targets for this indicator other than a general willingness by the government authorities to limit overall amount of BOD discharges 1995-2003.
B.AnalysisAs can be observed from Table 1 and Figure 1, estimates of annual BOD discharges from the industrial sector have increased from approx. 129,000 tons in 1995 to approx. 330,000 tons in 2003. Estimates of BOD discharges from domestic sources rose less quickly from 109,000 tons in 1995 to 152,000 tons in 2003. Overall estimates of annual BOD discharge almost doubled in the 9-year period. As would be expected, estimated total BOD discharges have increased as a result of growing population and industrial development. For lack of any other comparable figures from other GMS countries or other regions of the world, it is concluded that the magnitude of the pressure from BOD discharges is non-comparable but steadily increasing.
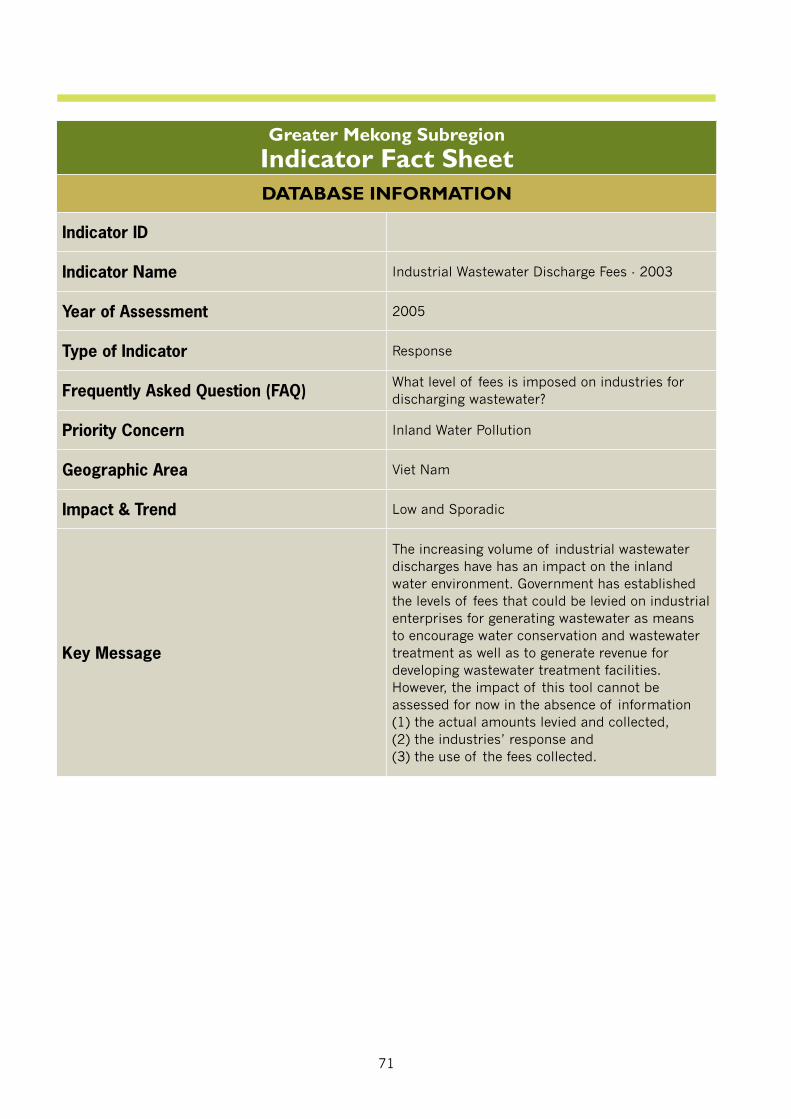
71
Greater Mekong SubregionIndicator Fact SheetDATABASE INFORMATION
Indicator ID
Indicator Name Industrial Wastewater Discharge Fees - 2003
Year of Assessment 2005
Type of Indicator Response
Frequently Asked Question (FAQ) What level of fees is imposed on industries for discharging wastewater?
Priority Concern Inland Water Pollution
Geographic Area Viet Nam
Impact & Trend Low and Sporadic
Key Message
The increasing volume of industrial wastewater discharges have has an impact on the inland water environment. Government has established the levels of fees that could be levied on industrial enterprises for generating wastewater as means to encourage water conservation and wastewater treatment as well as to generate revenue for developing wastewater treatment facilities. However, the impact of this tool cannot be assessed for now in the absence of information (1) the actual amounts levied and collected, (2) the industries’ response and (3) the use of the fees collected.
72
TECHNICAL INFORMATION
A.Defi nitionThe indicator attempts to track the financial commitment the government is willing to make to mitigating water pollution caused by the industrial sector.
B.Data SourceThe data was compiled from reports of The Ministry of Industry. This indicator tabulates the potential fees which could be collected by MONRE from various industrial enterprises as contribution towards development of treatment facilities and other environmental management initiatives.
C.Geographic Area / Population CoverageThe data and the indicator is representative of all wastewater treatment fees which could be collected from industrial sources for Viet Nam as a whole; it does not however included fees which could be collected from non-industrial sources (such as hospitals) or from domestic discharges.
D.Temporal CoverageOnly data for year 2003 was available at the time of the indicator development.
E.Methodology and Frequency of CoverageNot specified.
F.Methodology of Data ManipulationThe estimates are quoted exactly as published in annual reports of Ministry of Industry and have not been manipulated for the purpose of constructing this indicator.
QUALITATIVE INFORMATION
A.Strength and Weakness (data level)The main weakness of this indicator is that it is based on “potential” fees collected and not on actual fees collected. The fact that the estimates are only based on the industrial sector is secondary. The indicator is new and no trend can be established for now.
B.Reliability, Accuracy, Robustness, Uncertainty (data level)The estimates are quoted without any statement of reliability and accuracy. Presumably, the fees are estimates based on estimated volumes and a fixed pricing schedule.
C.Future Work Required (for data level and indicator level)To be useful as a response indicator, the figures of fees actually collected over time are indispensable. Estimates of the notional amounts of the levy have limited usefulness. As they exist at present, official figures obscure the understanding of the situation rather than adding to it. The meaning of the “estimated treatment cost” is not clear. Apart from establishing the actual amounts collected, future work should also provide more information about the financing of wastewater treatment facilities, in particular establish the extent to which industrial and household polluters (rather than the State, i.e.; taxpayer at large) are paying for wastewater treatment.
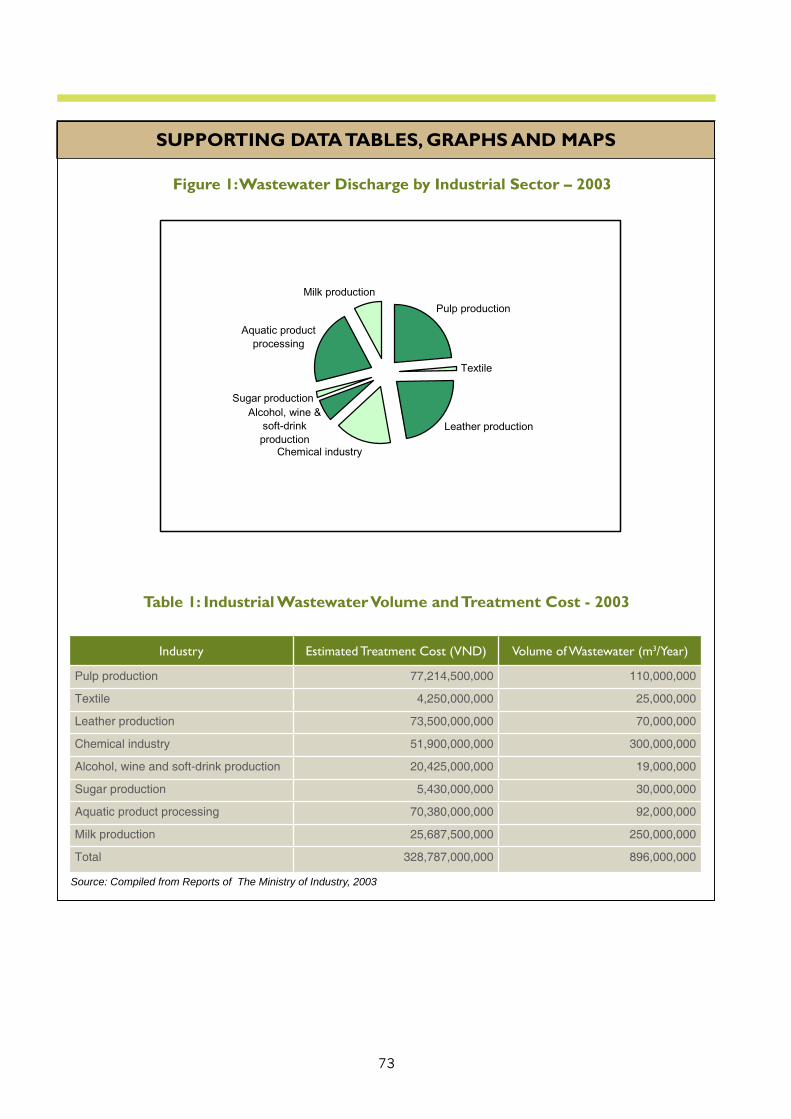
73
SUPPORTING DATA TABLES, GRAPHS AND MAPS
Figure 1: Wastewater Discharge by Industrial Sector – 2003
Industry Estimated Treatment Cost (VND) Volume of Wastewater (m3/Year)
Pulp production 77,214,500,000 110,000,000
Textile 4,250,000,000 25,000,000
Leather production 73,500,000,000 70,000,000
Chemical industry 51,900,000,000 300,000,000
Alcohol, wine and soft-drink production 20,425,000,000 19,000,000
Sugar production 5,430,000,000 30,000,000
Aquatic product processing 70,380,000,000 92,000,000
Milk production 25,687,500,000 250,000,000
Total 328,787,000,000 896,000,000
Table 1: Industrial Wastewater Volume and Treatment Cost - 2003
Source: Compiled from Reports of The Ministry of Industry, 2003
Pulp production
Textile
Leather production
Chemical industry
Alcohol, wine &soft-drinkproduction
Aquatic productprocessing
Milk production
Sugar production
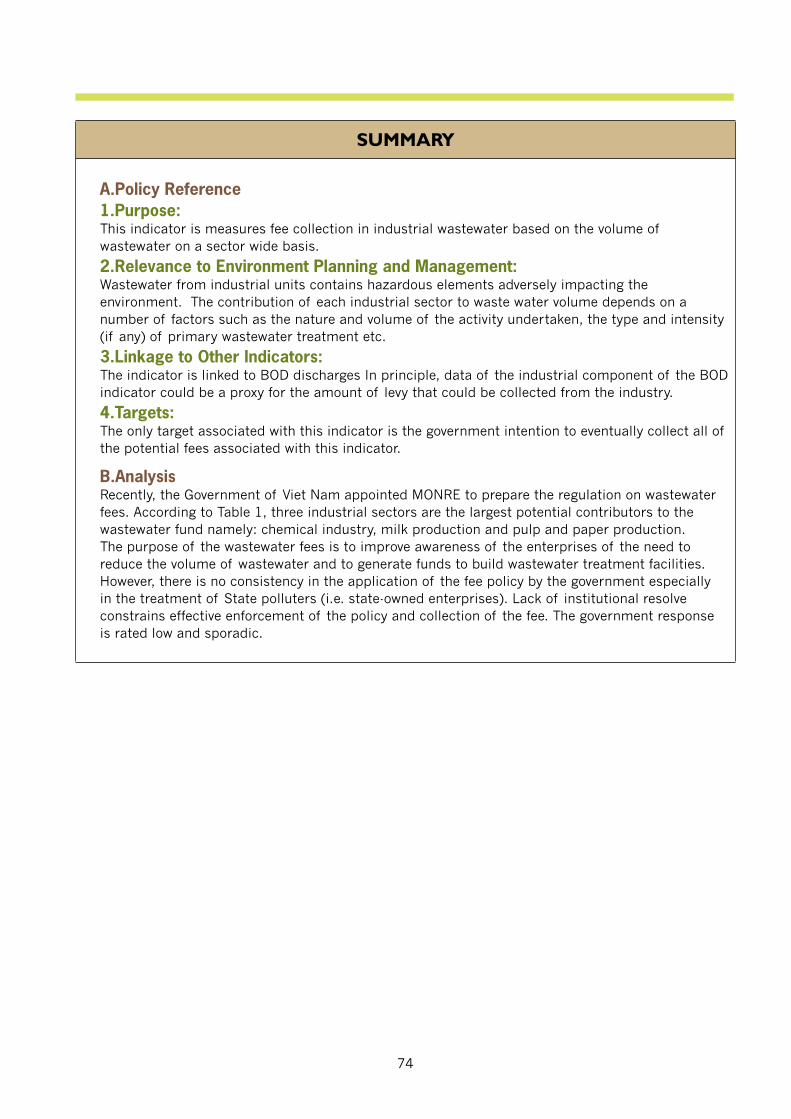
74
SUMMARY
A.Policy Reference1.Purpose: This indicator is measures fee collection in industrial wastewater based on the volume of wastewater on a sector wide basis.
2.Relevance to Environment Planning and Management: Wastewater from industrial units contains hazardous elements adversely impacting the environment. The contribution of each industrial sector to waste water volume depends on a number of factors such as the nature and volume of the activity undertaken, the type and intensity (if any) of primary wastewater treatment etc.
3.Linkage to Other Indicators:The indicator is linked to BOD discharges In principle, data of the industrial component of the BOD indicator could be a proxy for the amount of levy that could be collected from the industry.
4.Targets: The only target associated with this indicator is the government intention to eventually collect all of the potential fees associated with this indicator.
B.AnalysisRecently, the Government of Viet Nam appointed MONRE to prepare the regulation on wastewater fees. According to Table 1, three industrial sectors are the largest potential contributors to the wastewater fund namely: chemical industry, milk production and pulp and paper production.The purpose of the wastewater fees is to improve awareness of the enterprises of the need to reduce the volume of wastewater and to generate funds to build wastewater treatment facilities. However, there is no consistency in the application of the fee policy by the government especially in the treatment of State polluters (i.e. state-owned enterprises). Lack of institutional resolve constrains effective enforcement of the policy and collection of the fee. The government response is rated low and sporadic.
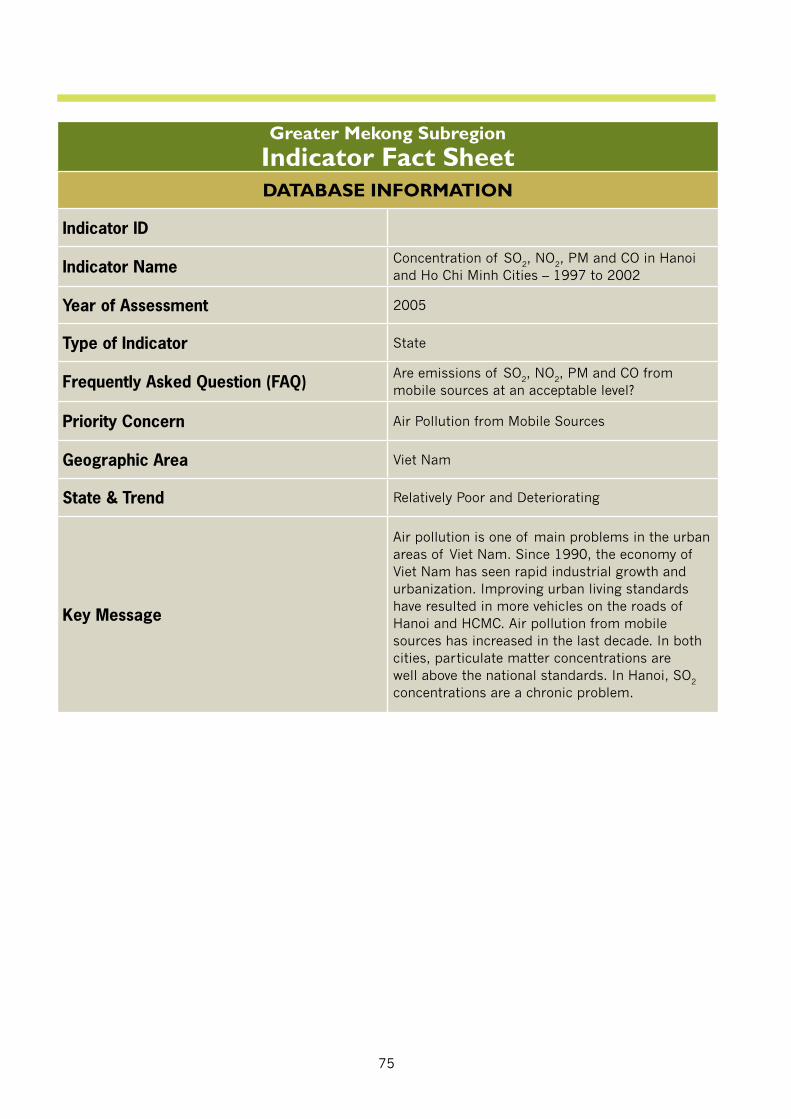
75
Greater Mekong SubregionIndicator Fact SheetDATABASE INFORMATION
Indicator ID
Indicator Name Concentration of SO2, NO2, PM and CO in Hanoi and Ho Chi Minh Cities – 1997 to 2002
Year of Assessment 2005
Type of Indicator State
Frequently Asked Question (FAQ) Are emissions of SO2, NO2, PM and CO from mobile sources at an acceptable level?
Priority Concern Air Pollution from Mobile Sources
Geographic Area Viet Nam
State & Trend Relatively Poor and Deteriorating
Key Message
Air pollution is one of main problems in the urban areas of Viet Nam. Since 1990, the economy of Viet Nam has seen rapid industrial growth and urbanization. Improving urban living standards have resulted in more vehicles on the roads of Hanoi and HCMC. Air pollution from mobile sources has increased in the last decade. In both cities, particulate matter concentrations are well above the national standards. In Hanoi, SO2 concentrations are a chronic problem.
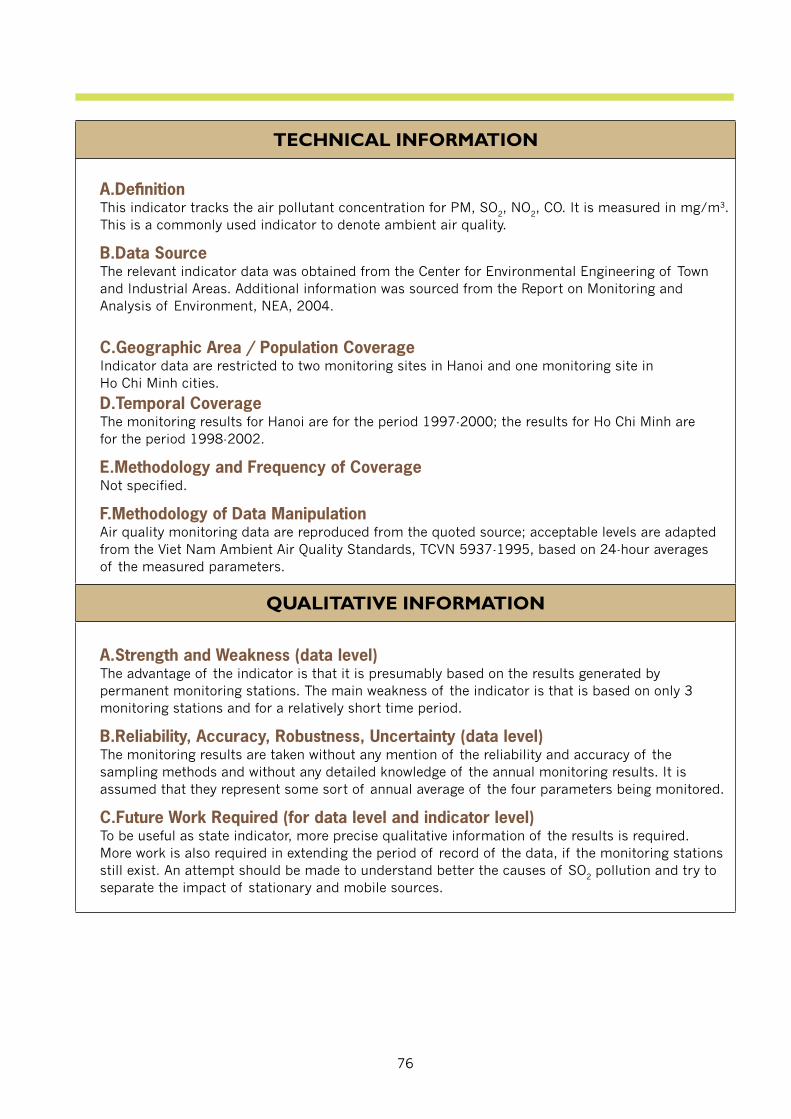
76
TECHNICAL INFORMATION
A.Defi nitionThis indicator tracks the air pollutant concentration for PM, SO2, NO2, CO. It is measured in mg/m3. This is a commonly used indicator to denote ambient air quality.
B.Data SourceThe relevant indicator data was obtained from the Center for Environmental Engineering of Town and Industrial Areas. Additional information was sourced from the Report on Monitoring and Analysis of Environment, NEA, 2004.
C.Geographic Area / Population CoverageIndicator data are restricted to two monitoring sites in Hanoi and one monitoring site in Ho Chi Minh cities.
D.Temporal CoverageThe monitoring results for Hanoi are for the period 1997-2000; the results for Ho Chi Minh are for the period 1998-2002.
E.Methodology and Frequency of CoverageNot specified.
F.Methodology of Data ManipulationAir quality monitoring data are reproduced from the quoted source; acceptable levels are adapted from the Viet Nam Ambient Air Quality Standards, TCVN 5937-1995, based on 24-hour averages of the measured parameters.
QUALITATIVE INFORMATION
A.Strength and Weakness (data level)The advantage of the indicator is that it is presumably based on the results generated by permanent monitoring stations. The main weakness of the indicator is that is based on only 3 monitoring stations and for a relatively short time period.
B.Reliability, Accuracy, Robustness, Uncertainty (data level)The monitoring results are taken without any mention of the reliability and accuracy of the sampling methods and without any detailed knowledge of the annual monitoring results. It is assumed that they represent some sort of annual average of the four parameters being monitored.
C.Future Work Required (for data level and indicator level)To be useful as state indicator, more precise qualitative information of the results is required. More work is also required in extending the period of record of the data, if the monitoring stations still exist. An attempt should be made to understand better the causes of SO2 pollution and try to separate the impact of stationary and mobile sources.
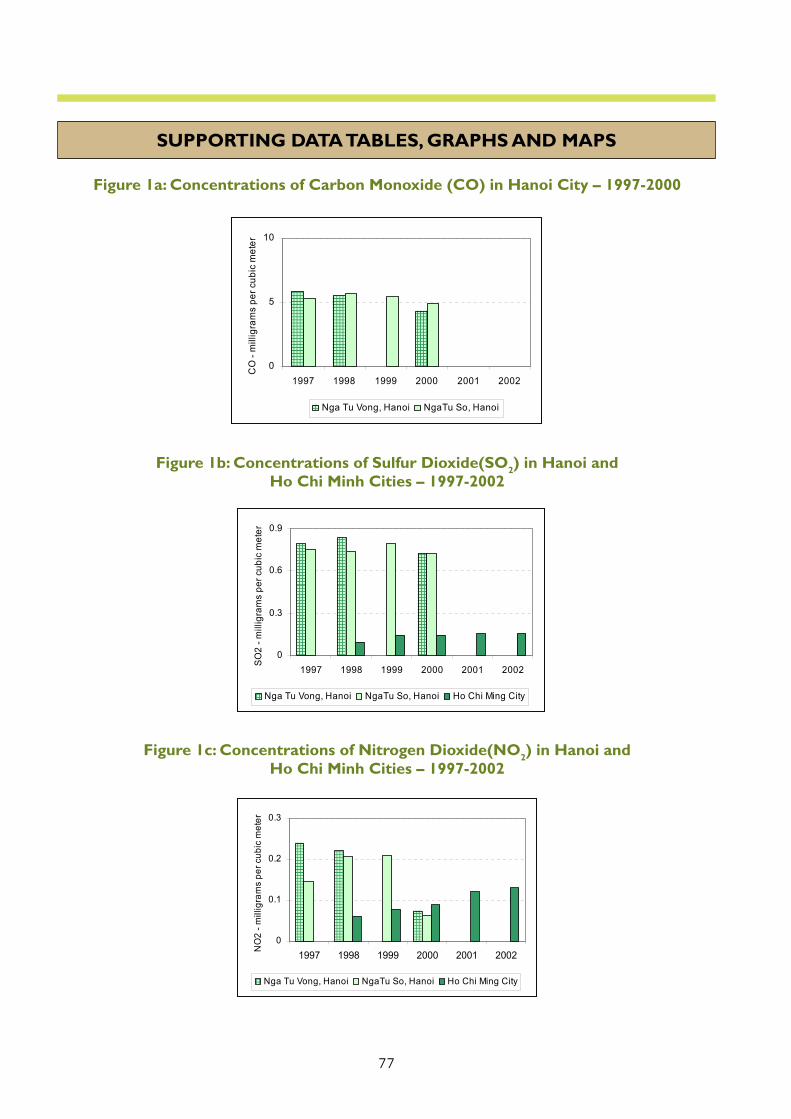
77
SUPPORTING DATA TABLES, GRAPHS AND MAPS
Figure 1a: Concentrations of Carbon Monoxide (CO) in Hanoi City – 1997-2000
Figure 1b: Concentrations of Sulfur Dioxide(SO2) in Hanoi and Ho Chi Minh Cities – 1997-2002
Figure 1c: Concentrations of Nitrogen Dioxide(NO2) in Hanoi and Ho Chi Minh Cities – 1997-2002
Ho Chi Minh City
0
5
10
1997 1998 1999 2000 2001 2002
CO
- m
illig
ram
s pe
r cub
ic m
eter
Nga Tu Vong, Hanoi NgaTu So, Hanoi
0
0.3
0.6
0.9
1997 1998 1999 2000 2001 2002
SO
2 - m
illig
ram
s pe
r cub
ic m
eter
Nga Tu Vong, Hanoi NgaTu So, Hanoi Ho Chi Ming City
0
0.1
0.2
0.3
1997 1998 1999 2000 2001 2002NO
2 - m
illig
ram
s pe
r cub
ic m
eter
Nga Tu Vong, Hanoi NgaTu So, Hanoi Ho Chi Ming City
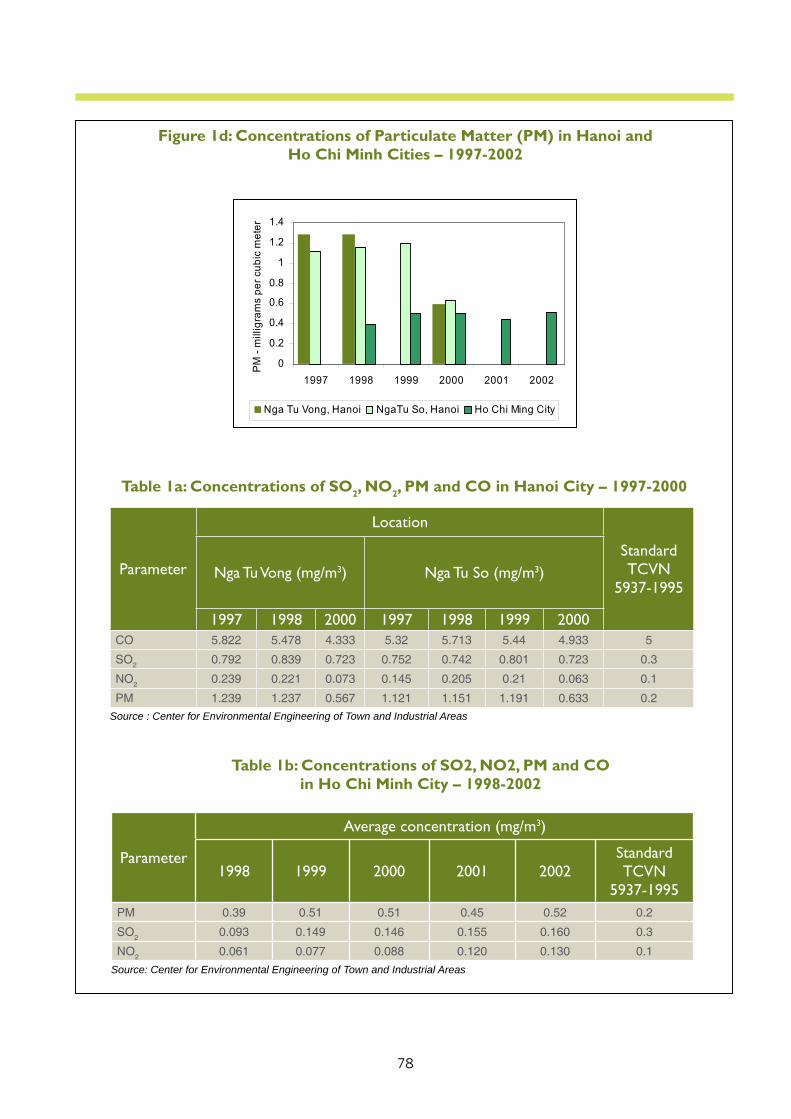
78
Figure 1d: Concentrations of Particulate Matter (PM) in Hanoi and Ho Chi Minh Cities – 1997-2002
Table 1a: Concentrations of SO2, NO2, PM and CO in Hanoi City – 1997-2000
Parameter
Location
StandardTCVN
5937-1995Nga Tu Vong (mg/m3) Nga Tu So (mg/m3)
1997 1998 2000 1997 1998 1999 2000CO 5.822 5.478 4.333 5.32 5.713 5.44 4.933 5
SO2 0.792 0.839 0.723 0.752 0.742 0.801 0.723 0.3
NO2 0.239 0.221 0.073 0.145 0.205 0.21 0.063 0.1
PM 1.239 1.237 0.567 1.121 1.151 1.191 0.633 0.2
Source : Center for Environmental Engineering of Town and Industrial Areas
Table 1b: Concentrations of SO2, NO2, PM and CO in Ho Chi Minh City – 1998-2002
Parameter
Average concentration (mg/m3)
1998 1999 2000 2001 2002StandardTCVN
5937-1995PM 0.39 0.51 0.51 0.45 0.52 0.2
SO2 0.093 0.149 0.146 0.155 0.160 0.3
NO2 0.061 0.077 0.088 0.120 0.130 0.1
Source: Center for Environmental Engineering of Town and Industrial Areas
0
0.2
0.4
0.6
0.8
1
1.2
1.4
1997 1998 1999 2000 2001 2002
PM
-mill
igra
ms
perc
ubic
met
er
Nga Tu Vong, Hanoi NgaTu So, Hanoi Ho Chi Ming City
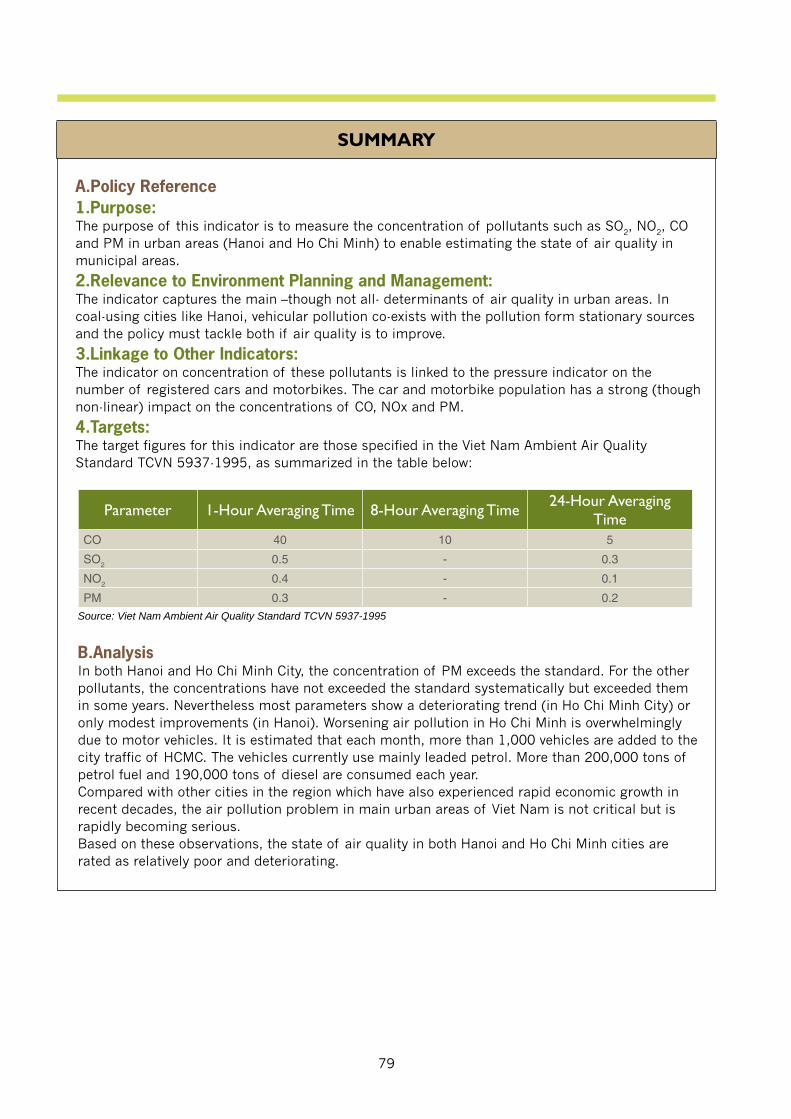
79
SUMMARY
A.Policy Reference1.Purpose: The purpose of this indicator is to measure the concentration of pollutants such as SO2, NO2, CO and PM in urban areas (Hanoi and Ho Chi Minh) to enable estimating the state of air quality in municipal areas.
2.Relevance to Environment Planning and Management: The indicator captures the main –though not all- determinants of air quality in urban areas. In coal-using cities like Hanoi, vehicular pollution co-exists with the pollution form stationary sources and the policy must tackle both if air quality is to improve.
3.Linkage to Other Indicators:The indicator on concentration of these pollutants is linked to the pressure indicator on the number of registered cars and motorbikes. The car and motorbike population has a strong (though non-linear) impact on the concentrations of CO, NOx and PM.
4.Targets: The target figures for this indicator are those specified in the Viet Nam Ambient Air Quality Standard TCVN 5937-1995, as summarized in the table below:
Parameter 1-Hour Averaging Time 8-Hour Averaging Time 24-Hour Averaging Time
CO 40 10 5
SO2 0.5 - 0.3
NO2 0.4 - 0.1
PM 0.3 - 0.2
Source: Viet Nam Ambient Air Quality Standard TCVN 5937-1995
B.AnalysisIn both Hanoi and Ho Chi Minh City, the concentration of PM exceeds the standard. For the other pollutants, the concentrations have not exceeded the standard systematically but exceeded them in some years. Nevertheless most parameters show a deteriorating trend (in Ho Chi Minh City) or only modest improvements (in Hanoi). Worsening air pollution in Ho Chi Minh is overwhelmingly due to motor vehicles. It is estimated that each month, more than 1,000 vehicles are added to the city traffic of HCMC. The vehicles currently use mainly leaded petrol. More than 200,000 tons of petrol fuel and 190,000 tons of diesel are consumed each year. Compared with other cities in the region which have also experienced rapid economic growth in recent decades, the air pollution problem in main urban areas of Viet Nam is not critical but is rapidly becoming serious.Based on these observations, the state of air quality in both Hanoi and Ho Chi Minh cities are rated as relatively poor and deteriorating.
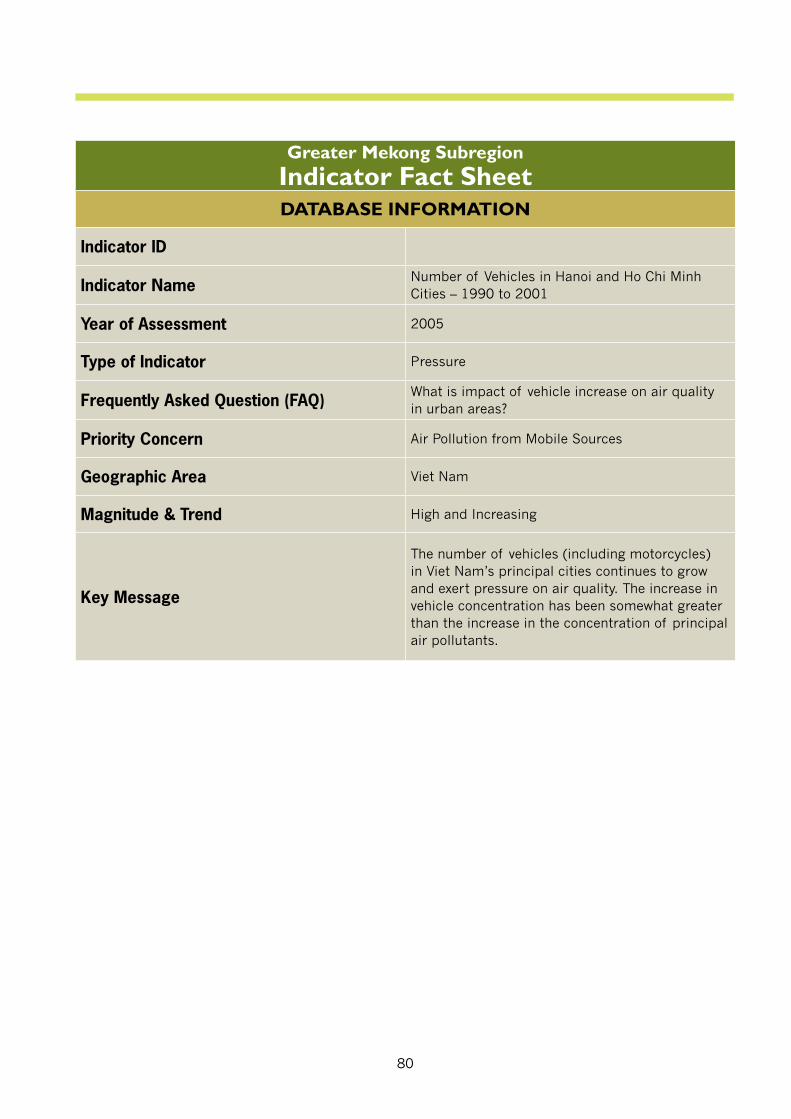
80
Greater Mekong SubregionIndicator Fact SheetDATABASE INFORMATION
Indicator ID
Indicator Name Number of Vehicles in Hanoi and Ho Chi Minh Cities – 1990 to 2001
Year of Assessment 2005
Type of Indicator Pressure
Frequently Asked Question (FAQ) What is impact of vehicle increase on air quality in urban areas?
Priority Concern Air Pollution from Mobile Sources
Geographic Area Viet Nam
Magnitude & Trend High and Increasing
Key Message
The number of vehicles (including motorcycles) in Viet Nam’s principal cities continues to grow and exert pressure on air quality. The increase in vehicle concentration has been somewhat greater than the increase in the concentration of principal air pollutants.
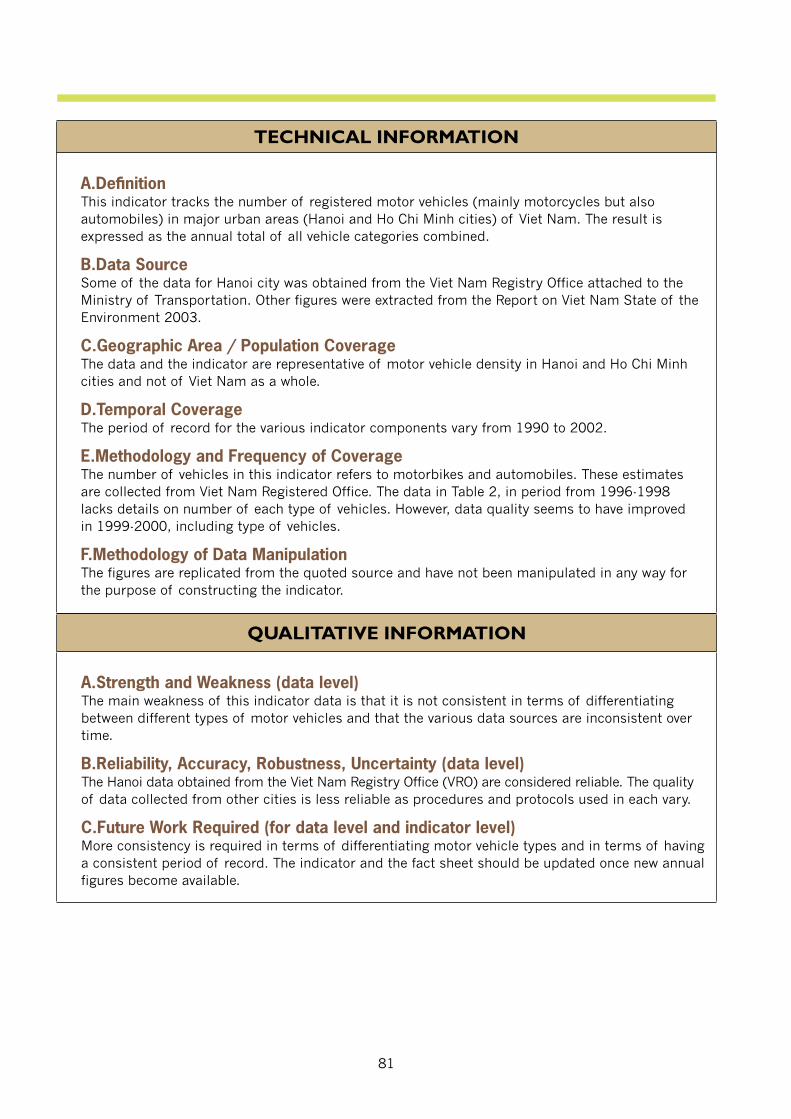
81
QUALITATIVE INFORMATION
A.Strength and Weakness (data level)The main weakness of this indicator data is that it is not consistent in terms of differentiating between different types of motor vehicles and that the various data sources are inconsistent over time.
B.Reliability, Accuracy, Robustness, Uncertainty (data level)The Hanoi data obtained from the Viet Nam Registry Office (VRO) are considered reliable. The quality of data collected from other cities is less reliable as procedures and protocols used in each vary.
C.Future Work Required (for data level and indicator level)More consistency is required in terms of differentiating motor vehicle types and in terms of having a consistent period of record. The indicator and the fact sheet should be updated once new annual figures become available.
TECHNICAL INFORMATION
A.Defi nitionThis indicator tracks the number of registered motor vehicles (mainly motorcycles but also automobiles) in major urban areas (Hanoi and Ho Chi Minh cities) of Viet Nam. The result is expressed as the annual total of all vehicle categories combined.
B.Data SourceSome of the data for Hanoi city was obtained from the Viet Nam Registry Office attached to the Ministry of Transportation. Other figures were extracted from the Report on Viet Nam State of the Environment 2003.
C.Geographic Area / Population CoverageThe data and the indicator are representative of motor vehicle density in Hanoi and Ho Chi Minh cities and not of Viet Nam as a whole.
D.Temporal CoverageThe period of record for the various indicator components vary from 1990 to 2002.
E.Methodology and Frequency of CoverageThe number of vehicles in this indicator refers to motorbikes and automobiles. These estimates are collected from Viet Nam Registered Office. The data in Table 2, in period from 1996-1998 lacks details on number of each type of vehicles. However, data quality seems to have improved in 1999-2000, including type of vehicles.
F.Methodology of Data ManipulationThe figures are replicated from the quoted source and have not been manipulated in any way for the purpose of constructing the indicator.
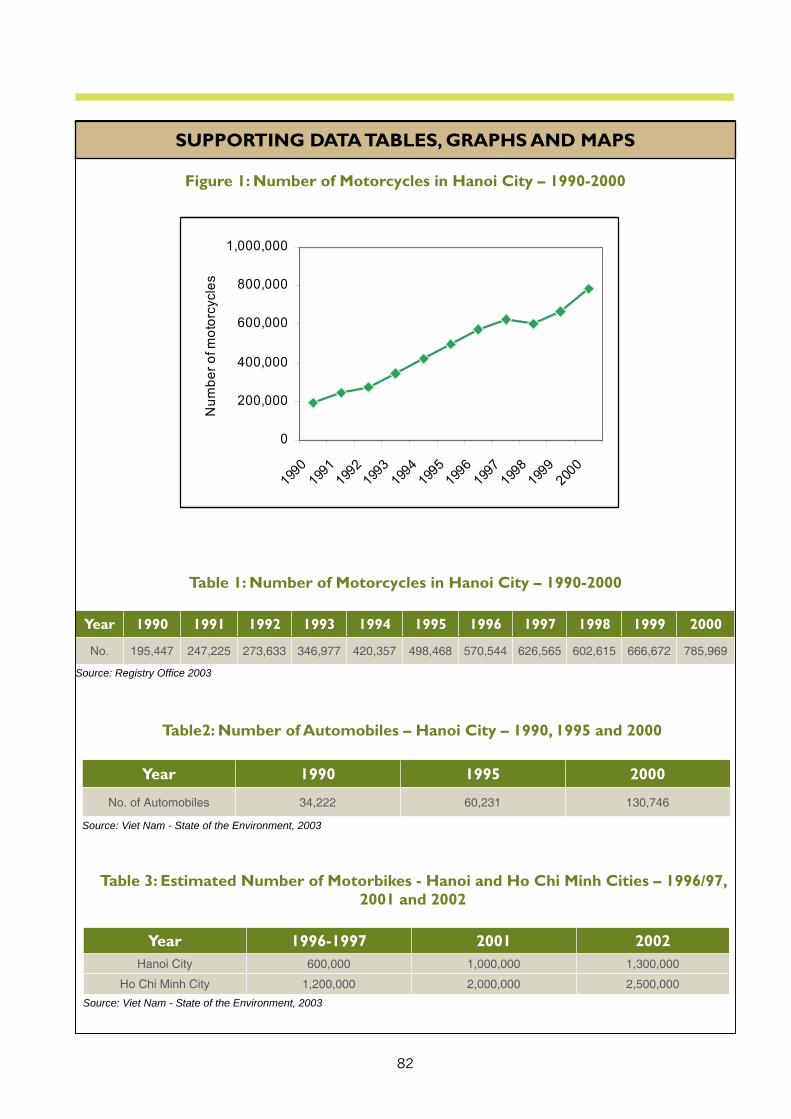
82
SUPPORTING DATA TABLES, GRAPHS AND MAPS
Figure 1: Number of Motorcycles in Hanoi City – 1990-2000
Table 1: Number of Motorcycles in Hanoi City – 1990-2000
Year 1990 1991 1992 1993 1994 1995 1996 1997 1998 1999 2000
No. 195,447 247,225 273,633 346,977 420,357 498,468 570,544 626,565 602,615 666,672 785,969
Source: Registry Offi ce 2003
Table2: Number of Automobiles – Hanoi City – 1990, 1995 and 2000
Year 1990 1995 2000
No. of Automobiles 34,222 60,231 130,746
Source: Viet Nam - State of the Environment, 2003
Table 3: Estimated Number of Motorbikes - Hanoi and Ho Chi Minh Cities – 1996/97, 2001 and 2002
Year 1996-1997 2001 2002Hanoi City 600,000 1,000,000 1,300,000
Ho Chi Minh City 1,200,000 2,000,000 2,500,000
Source: Viet Nam - State of the Environment, 2003
0
200,000
400,000
600,000
800,000
1,000,000
1990
1991
1992
1993
1994
1995
1996
1997
1998
1999
2000
Num
bero
fmot
orcy
cles
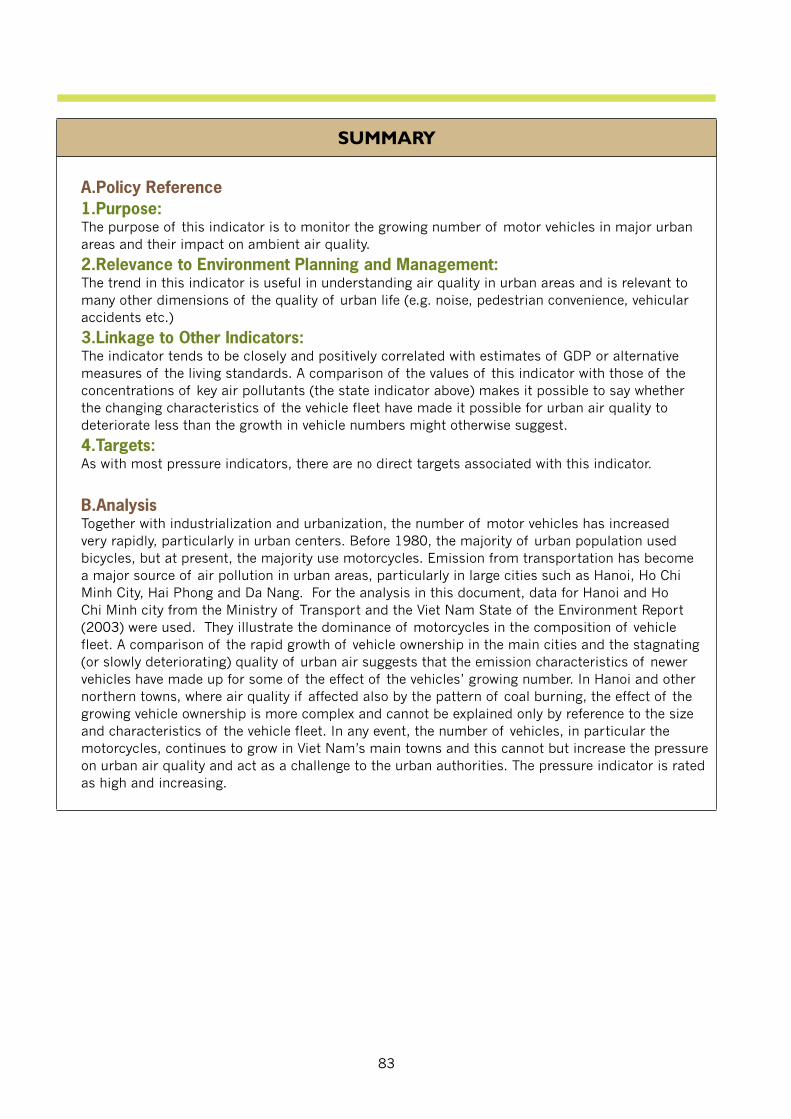
83
SUMMARY
A.Policy Reference1.Purpose: The purpose of this indicator is to monitor the growing number of motor vehicles in major urban areas and their impact on ambient air quality.
2.Relevance to Environment Planning and Management: The trend in this indicator is useful in understanding air quality in urban areas and is relevant to many other dimensions of the quality of urban life (e.g. noise, pedestrian convenience, vehicular accidents etc.)
3.Linkage to Other Indicators:The indicator tends to be closely and positively correlated with estimates of GDP or alternative measures of the living standards. A comparison of the values of this indicator with those of the concentrations of key air pollutants (the state indicator above) makes it possible to say whether the changing characteristics of the vehicle fleet have made it possible for urban air quality to deteriorate less than the growth in vehicle numbers might otherwise suggest.
4.Targets: As with most pressure indicators, there are no direct targets associated with this indicator.
B.AnalysisTogether with industrialization and urbanization, the number of motor vehicles has increased very rapidly, particularly in urban centers. Before 1980, the majority of urban population used bicycles, but at present, the majority use motorcycles. Emission from transportation has become a major source of air pollution in urban areas, particularly in large cities such as Hanoi, Ho Chi Minh City, Hai Phong and Da Nang. For the analysis in this document, data for Hanoi and Ho Chi Minh city from the Ministry of Transport and the Viet Nam State of the Environment Report (2003) were used. They illustrate the dominance of motorcycles in the composition of vehicle fleet. A comparison of the rapid growth of vehicle ownership in the main cities and the stagnating (or slowly deteriorating) quality of urban air suggests that the emission characteristics of newer vehicles have made up for some of the effect of the vehicles’ growing number. In Hanoi and other northern towns, where air quality if affected also by the pattern of coal burning, the effect of the growing vehicle ownership is more complex and cannot be explained only by reference to the size and characteristics of the vehicle fleet. In any event, the number of vehicles, in particular the motorcycles, continues to grow in Viet Nam’s main towns and this cannot but increase the pressure on urban air quality and act as a challenge to the urban authorities. The pressure indicator is rated as high and increasing.
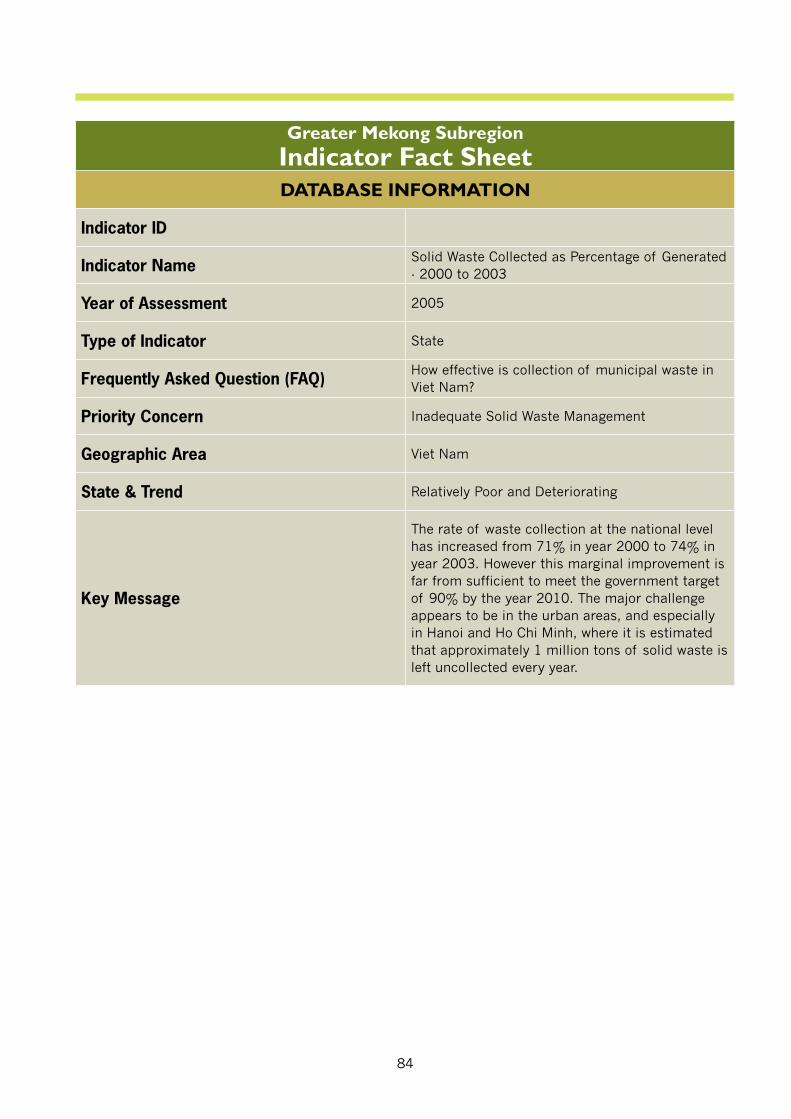
84
Greater Mekong SubregionIndicator Fact SheetDATABASE INFORMATION
Indicator ID
Indicator Name Solid Waste Collected as Percentage of Generated - 2000 to 2003
Year of Assessment 2005
Type of Indicator State
Frequently Asked Question (FAQ) How effective is collection of municipal waste in Viet Nam?
Priority Concern Inadequate Solid Waste Management
Geographic Area Viet Nam
State & Trend Relatively Poor and Deteriorating
Key Message
The rate of waste collection at the national level has increased from 71% in year 2000 to 74% in year 2003. However this marginal improvement is far from sufficient to meet the government target of 90% by the year 2010. The major challenge appears to be in the urban areas, and especially in Hanoi and Ho Chi Minh, where it is estimated that approximately 1 million tons of solid waste is left uncollected every year.
85
TECHNICAL INFORMATION
A.Defi nitionThis indicator tracks the amount of solid waste collected in relation to the amount which is generated. The indicator is expressed as the ratio between total waste collected and total waste generated in the major municipal areas of Viet Nam. The ratio gives an indication of the efficiency of the collection system in the municipal government and the urban environment company URENCO.
B.Data SourceThe data in this indicator was provided by Viet Nam Environment Monitor 2004 (VEM, 2004) consultant group (Dr. Tang The Cuong and colleagues) on collecting provincial data and compiling maps, supported by URENCOs, DoNREs, NISTPASS, VEPA. Hanoi, April 2004 (Revised in May 2004).
C.Geographic Area / Population CoverageThis indicator is representative of waste collection for most provinces and cities in Viet Nam.
D.Temporal CoverageData was provided from 1999 to 2003, but data before 2001 is not complete. Hence the period of record of the indicator is 2001 to 2003. Supplemental data on daily solid waste collection was only available for 2003.
E.Methodology and Frequency of CoverageNot specified.
F.Methodology of Data ManipulationThe figures were taken directly from the reports, which are compiled from URENCO, DoNRE, NISTPASS, VEPA records under the program Viet Nam Environment Monitor 2004 (VEM, 2004).
QUALITATIVE INFORMATION
A.Strength and Weakness (data level)The data was generated from records of URENCO and government agencies playing a regulatory role in solid waste management. However, limited data is available for rural areas of the country.
B.Reliability, Accuracy, Robustness, Uncertainty (data level)From 1999 to 2000, the data was not collected for the whole country; only for selected provinces. The estimates of the percentage or waste collected are therefore calculated for some provinces and cities only, normally major cities and larger provinces in Viet Nam.
C.Future Work Required (for data level and indicator level)In future it is desirable to create an information network between URENCOs and provincial DoNREs to exchange information on solid waste management to assist with data collection for the whole country.
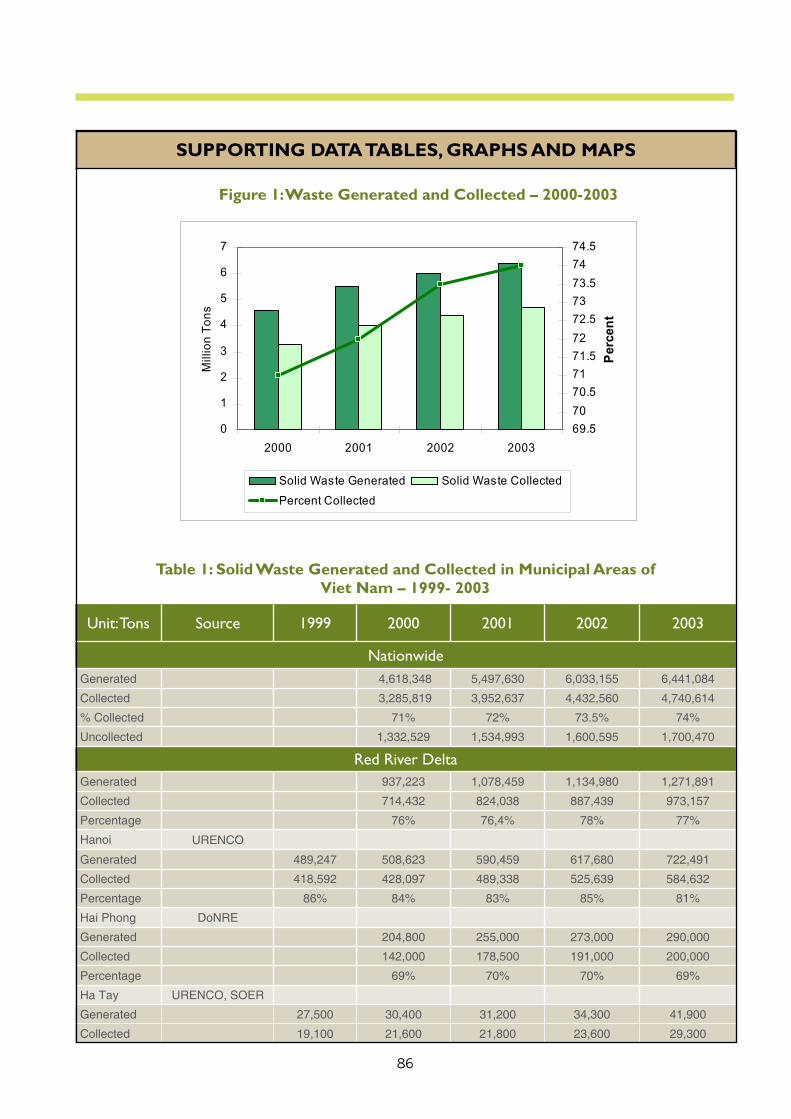
86
SUPPORTING DATA TABLES, GRAPHS AND MAPS
Figure 1: Waste Generated and Collected – 2000-2003
Unit: Tons Source 1999 2000 2001 2002 2003
NationwideGenerated 4,618,348 5,497,630 6,033,155 6,441,084
Collected 3,285,819 3,952,637 4,432,560 4,740,614
% Collected 71% 72% 73.5% 74%
Uncollected 1,332,529 1,534,993 1,600,595 1,700,470
Red River DeltaGenerated 937,223 1,078,459 1,134,980 1,271,891
Collected 714,432 824,038 887,439 973,157
Percentage 76% 76,4% 78% 77%
Hanoi URENCO
Generated 489,247 508,623 590,459 617,680 722,491
Collected 418,592 428,097 489,338 525,639 584,632
Percentage 86% 84% 83% 85% 81%
Hai Phong DoNRE
Generated 204,800 255,000 273,000 290,000
Collected 142,000 178,500 191,000 200,000
Percentage 69% 70% 70% 69%
Ha Tay URENCO, SOER
Generated 27,500 30,400 31,200 34,300 41,900
Collected 19,100 21,600 21,800 23,600 29,300
Table 1: Solid Waste Generated and Collected in Municipal Areas of Viet Nam – 1999- 2003
0
1
2
3
4
5
6
7
2000 2001 2002 2003
Mill
ion
Ton
s
69.5
70
70.5
71
71.5
72
72.5
73
73.5
74
74.5
Per
cen
t
Solid Waste Generated Solid Waste Collected
Percent Collected
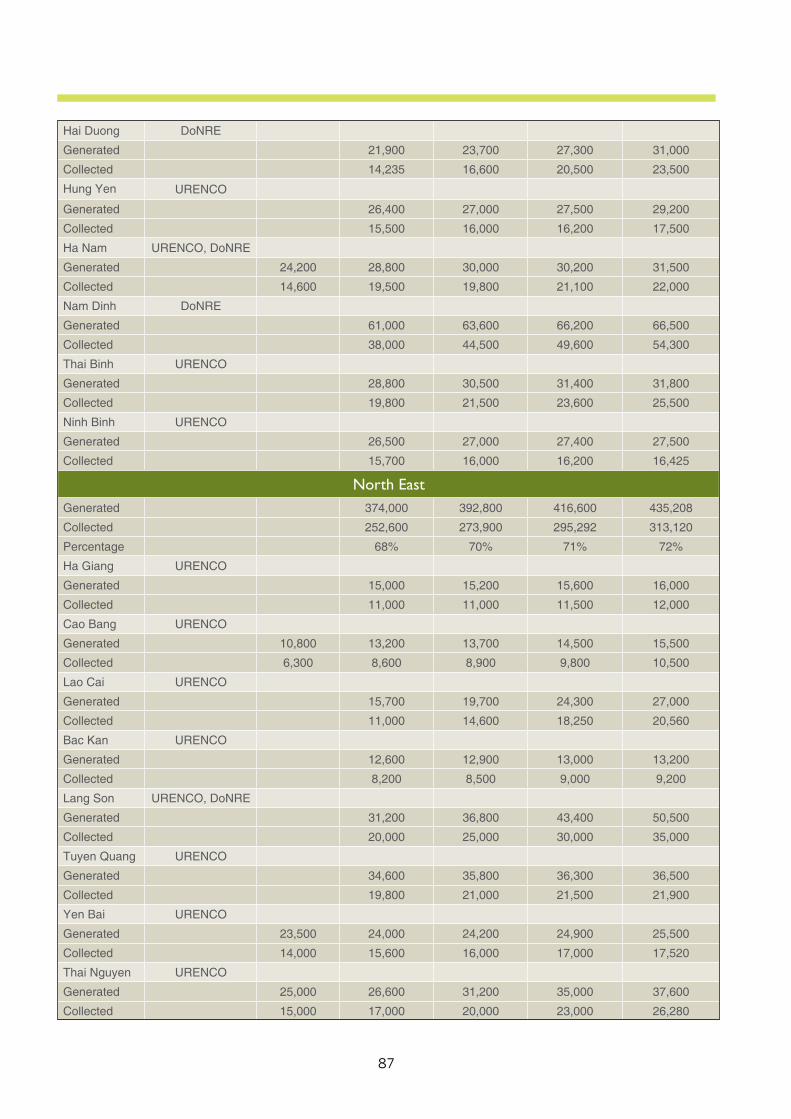
87
Hai Duong DoNRE
Generated 21,900 23,700 27,300 31,000
Collected 14,235 16,600 20,500 23,500
Hung Yen URENCO
Generated 26,400 27,000 27,500 29,200
Collected 15,500 16,000 16,200 17,500
Ha Nam URENCO, DoNRE
Generated 24,200 28,800 30,000 30,200 31,500
Collected 14,600 19,500 19,800 21,100 22,000
Nam Dinh DoNRE
Generated 61,000 63,600 66,200 66,500
Collected 38,000 44,500 49,600 54,300
Thai Binh URENCO
Generated 28,800 30,500 31,400 31,800
Collected 19,800 21,500 23,600 25,500
Ninh Binh URENCO
Generated 26,500 27,000 27,400 27,500
Collected 15,700 16,000 16,200 16,425
North EastGenerated 374,000 392,800 416,600 435,208
Collected 252,600 273,900 295,292 313,120
Percentage 68% 70% 71% 72%
Ha Giang URENCO
Generated 15,000 15,200 15,600 16,000
Collected 11,000 11,000 11,500 12,000
Cao Bang URENCO
Generated 10,800 13,200 13,700 14,500 15,500
Collected 6,300 8,600 8,900 9,800 10,500
Lao Cai URENCO
Generated 15,700 19,700 24,300 27,000
Collected 11,000 14,600 18,250 20,560
Bac Kan URENCO
Generated 12,600 12,900 13,000 13,200
Collected 8,200 8,500 9,000 9,200
Lang Son URENCO, DoNRE
Generated 31,200 36,800 43,400 50,500
Collected 20,000 25,000 30,000 35,000
Tuyen Quang URENCO
Generated 34,600 35,800 36,300 36,500
Collected 19,800 21,000 21,500 21,900
Yen Bai URENCO
Generated 23,500 24,000 24,200 24,900 25,500
Collected 14,000 15,600 16,000 17,000 17,520
Thai Nguyen URENCO
Generated 25,000 26,600 31,200 35,000 37,600
Collected 15,000 17,000 20,000 23,000 26,280
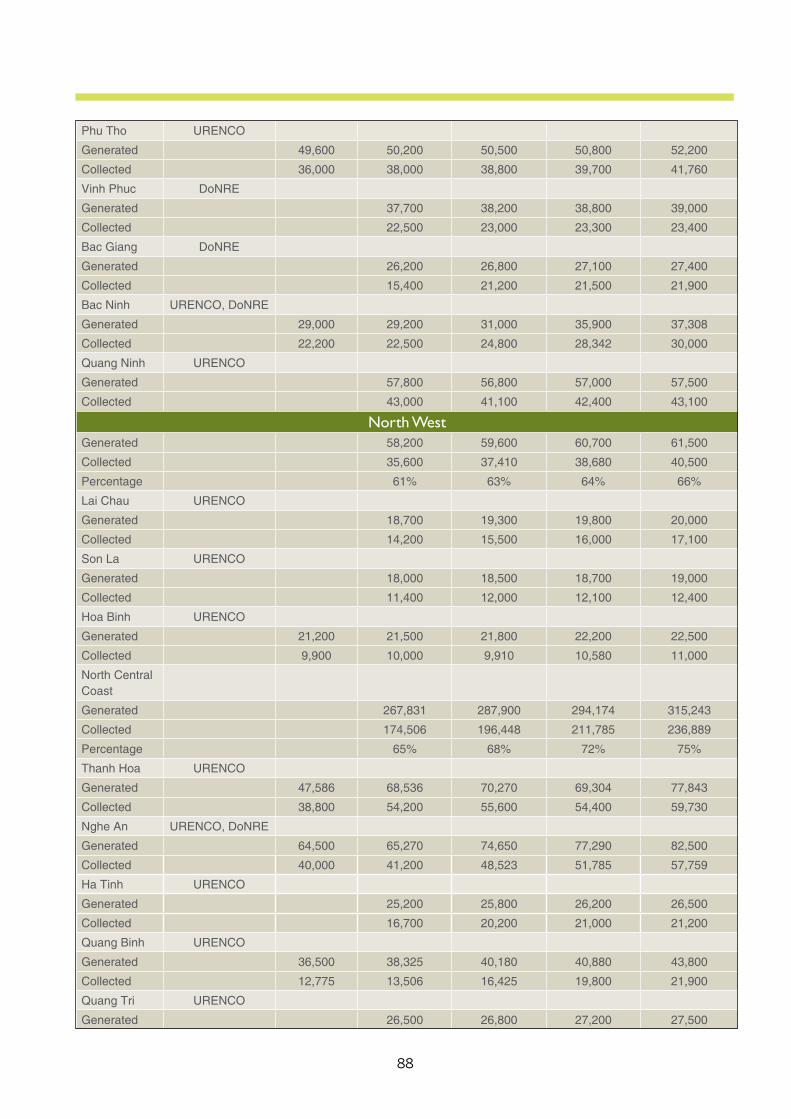
88
Phu Tho URENCO
Generated 49,600 50,200 50,500 50,800 52,200
Collected 36,000 38,000 38,800 39,700 41,760
Vinh Phuc DoNRE
Generated 37,700 38,200 38,800 39,000
Collected 22,500 23,000 23,300 23,400
Bac Giang DoNRE
Generated 26,200 26,800 27,100 27,400
Collected 15,400 21,200 21,500 21,900
Bac Ninh URENCO, DoNRE
Generated 29,000 29,200 31,000 35,900 37,308
Collected 22,200 22,500 24,800 28,342 30,000
Quang Ninh URENCO
Generated 57,800 56,800 57,000 57,500
Collected 43,000 41,100 42,400 43,100
North WestGenerated 58,200 59,600 60,700 61,500
Collected 35,600 37,410 38,680 40,500
Percentage 61% 63% 64% 66%
Lai Chau URENCO
Generated 18,700 19,300 19,800 20,000
Collected 14,200 15,500 16,000 17,100
Son La URENCO
Generated 18,000 18,500 18,700 19,000
Collected 11,400 12,000 12,100 12,400
Hoa Binh URENCO
Generated 21,200 21,500 21,800 22,200 22,500
Collected 9,900 10,000 9,910 10,580 11,000
North Central Coast
Generated 267,831 287,900 294,174 315,243
Collected 174,506 196,448 211,785 236,889
Percentage 65% 68% 72% 75%
Thanh Hoa URENCO
Generated 47,586 68,536 70,270 69,304 77,843
Collected 38,800 54,200 55,600 54,400 59,730
Nghe An URENCO, DoNRE
Generated 64,500 65,270 74,650 77,290 82,500
Collected 40,000 41,200 48,523 51,785 57,759
Ha Tinh URENCO
Generated 25,200 25,800 26,200 26,500
Collected 16,700 20,200 21,000 21,200
Quang Binh URENCO
Generated 36,500 38,325 40,180 40,880 43,800
Collected 12,775 13,506 16,425 19,800 21,900
Quang Tri URENCO
Generated 26,500 26,800 27,200 27,500
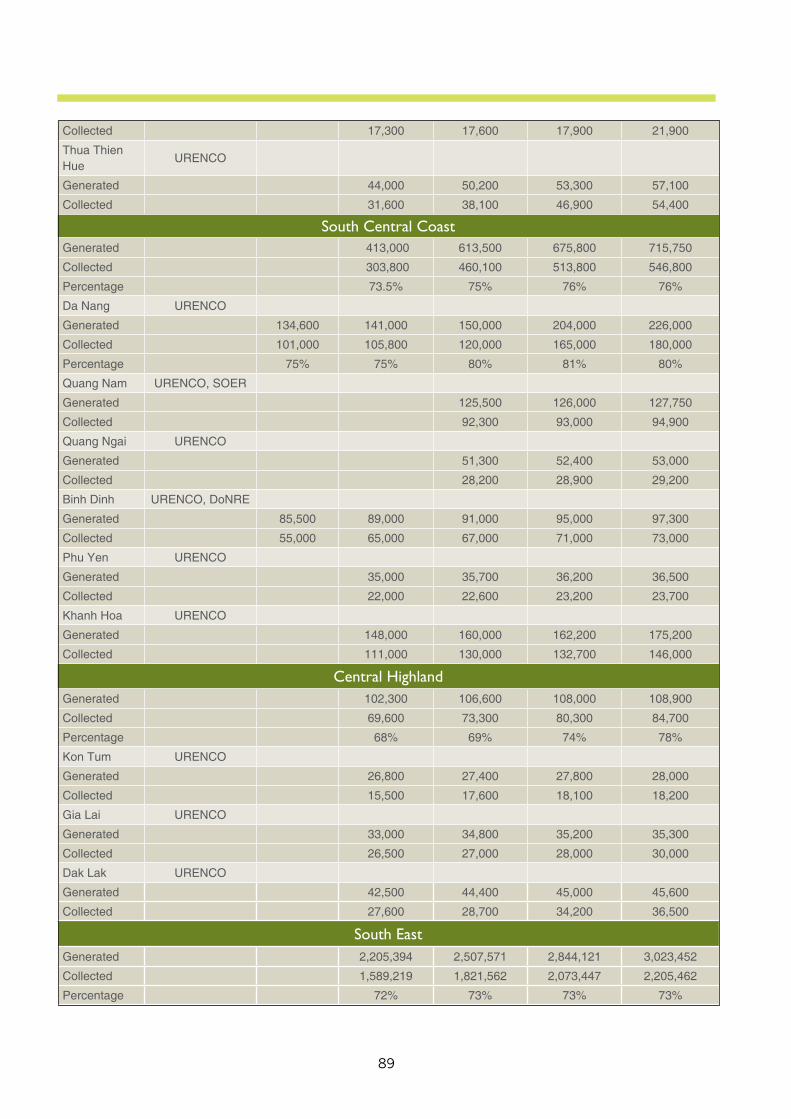
89
Collected 17,300 17,600 17,900 21,900
Thua Thien Hue
URENCO
Generated 44,000 50,200 53,300 57,100
Collected 31,600 38,100 46,900 54,400
South Central CoastGenerated 413,000 613,500 675,800 715,750
Collected 303,800 460,100 513,800 546,800
Percentage 73.5% 75% 76% 76%
Da Nang URENCO
Generated 134,600 141,000 150,000 204,000 226,000
Collected 101,000 105,800 120,000 165,000 180,000
Percentage 75% 75% 80% 81% 80%
Quang Nam URENCO, SOER
Generated 125,500 126,000 127,750
Collected 92,300 93,000 94,900
Quang Ngai URENCO
Generated 51,300 52,400 53,000
Collected 28,200 28,900 29,200
Binh Dinh URENCO, DoNRE
Generated 85,500 89,000 91,000 95,000 97,300
Collected 55,000 65,000 67,000 71,000 73,000
Phu Yen URENCO
Generated 35,000 35,700 36,200 36,500
Collected 22,000 22,600 23,200 23,700
Khanh Hoa URENCO
Generated 148,000 160,000 162,200 175,200
Collected 111,000 130,000 132,700 146,000
Central HighlandGenerated 102,300 106,600 108,000 108,900
Collected 69,600 73,300 80,300 84,700
Percentage 68% 69% 74% 78%
Kon Tum URENCO
Generated 26,800 27,400 27,800 28,000
Collected 15,500 17,600 18,100 18,200
Gia Lai URENCO
Generated 33,000 34,800 35,200 35,300
Collected 26,500 27,000 28,000 30,000
Dak Lak URENCO
Generated 42,500 44,400 45,000 45,600
Collected 27,600 28,700 34,200 36,500
South EastGenerated 2,205,394 2,507,571 2,844,121 3,023,452
Collected 1,589,219 1,821,562 2,073,447 2,205,462
Percentage 72% 73% 73% 73%
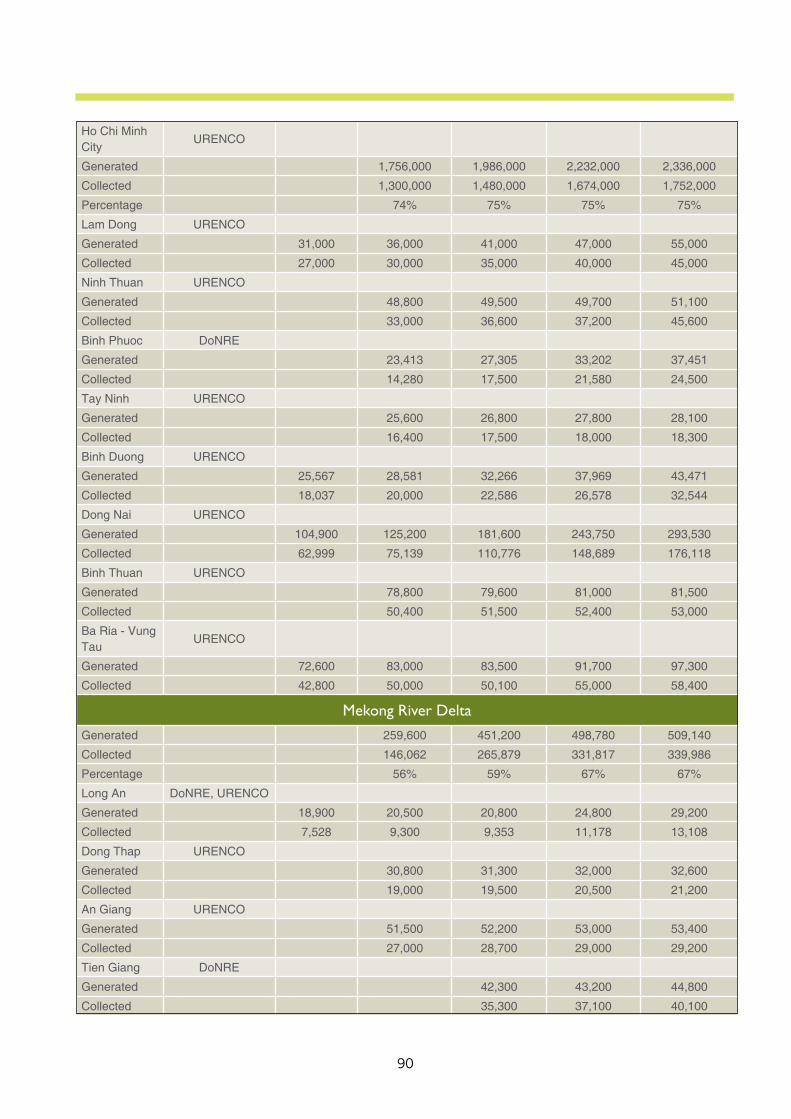
90
Ho Chi Minh City
URENCO
Generated 1,756,000 1,986,000 2,232,000 2,336,000
Collected 1,300,000 1,480,000 1,674,000 1,752,000
Percentage 74% 75% 75% 75%
Lam Dong URENCO
Generated 31,000 36,000 41,000 47,000 55,000
Collected 27,000 30,000 35,000 40,000 45,000
Ninh Thuan URENCO
Generated 48,800 49,500 49,700 51,100
Collected 33,000 36,600 37,200 45,600
Binh Phuoc DoNRE
Generated 23,413 27,305 33,202 37,451
Collected 14,280 17,500 21,580 24,500
Tay Ninh URENCO
Generated 25,600 26,800 27,800 28,100
Collected 16,400 17,500 18,000 18,300
Binh Duong URENCO
Generated 25,567 28,581 32,266 37,969 43,471
Collected 18,037 20,000 22,586 26,578 32,544
Dong Nai URENCO
Generated 104,900 125,200 181,600 243,750 293,530
Collected 62,999 75,139 110,776 148,689 176,118
Binh Thuan URENCO
Generated 78,800 79,600 81,000 81,500
Collected 50,400 51,500 52,400 53,000
Ba Ria - Vung Tau
URENCO
Generated 72,600 83,000 83,500 91,700 97,300
Collected 42,800 50,000 50,100 55,000 58,400
Mekong River DeltaGenerated 259,600 451,200 498,780 509,140
Collected 146,062 265,879 331,817 339,986
Percentage 56% 59% 67% 67%
Long An DoNRE, URENCO
Generated 18,900 20,500 20,800 24,800 29,200
Collected 7,528 9,300 9,353 11,178 13,108
Dong Thap URENCO
Generated 30,800 31,300 32,000 32,600
Collected 19,000 19,500 20,500 21,200
An Giang URENCO
Generated 51,500 52,200 53,000 53,400
Collected 27,000 28,700 29,000 29,200
Tien Giang DoNRE
Generated 42,300 43,200 44,800
Collected 35,300 37,100 40,100
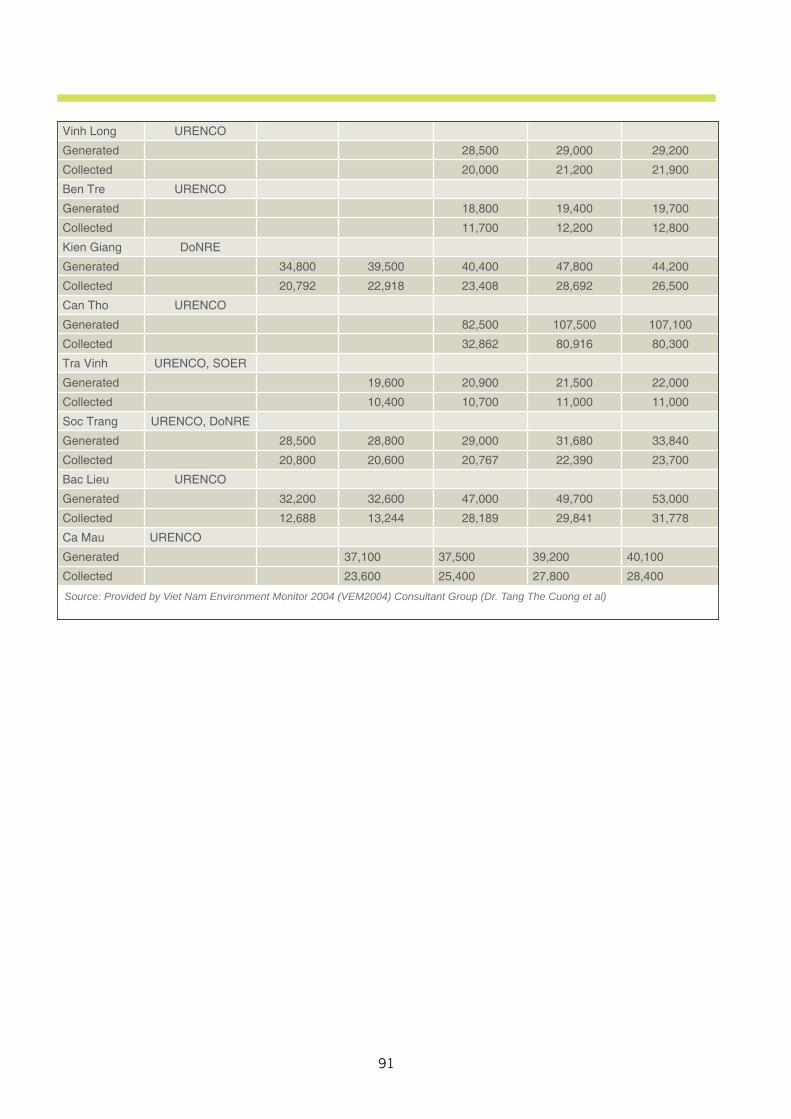
91
Vinh Long URENCO
Generated 28,500 29,000 29,200
Collected 20,000 21,200 21,900
Ben Tre URENCO
Generated 18,800 19,400 19,700
Collected 11,700 12,200 12,800
Kien Giang DoNRE
Generated 34,800 39,500 40,400 47,800 44,200
Collected 20,792 22,918 23,408 28,692 26,500
Can Tho URENCO
Generated 82,500 107,500 107,100
Collected 32,862 80,916 80,300
Tra Vinh URENCO, SOER
Generated 19,600 20,900 21,500 22,000
Collected 10,400 10,700 11,000 11,000
Soc Trang URENCO, DoNRE
Generated 28,500 28,800 29,000 31,680 33,840
Collected 20,800 20,600 20,767 22,390 23,700
Bac Lieu URENCO
Generated 32,200 32,600 47,000 49,700 53,000
Collected 12,688 13,244 28,189 29,841 31,778
Ca Mau URENCO
Generated 37,100 37,500 39,200 40,100
Collected 23,600 25,400 27,800 28,400
Source: Provided by Viet Nam Environment Monitor 2004 (VEM2004) Consultant Group (Dr. Tang The Cuong et al)
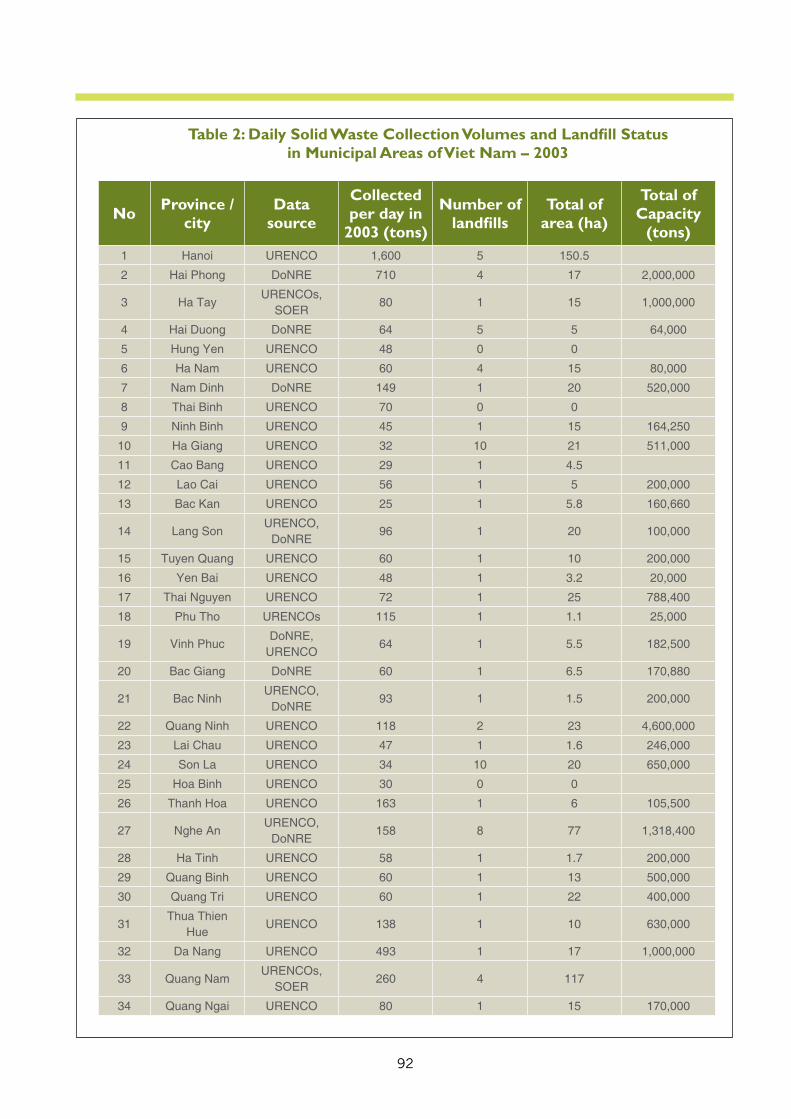
92
Table 2: Daily Solid Waste Collection Volumes and Landfi ll Status in Municipal Areas of Viet Nam – 2003
No Province / city
Data source
Collected per day in
2003 (tons)
Number of landfi lls
Total of area (ha)
Total of Capacity
(tons)1 Hanoi URENCO 1,600 5 150.5
2 Hai Phong DoNRE 710 4 17 2,000,000
3 Ha TayURENCOs,
SOER80 1 15 1,000,000
4 Hai Duong DoNRE 64 5 5 64,000
5 Hung Yen URENCO 48 0 0
6 Ha Nam URENCO 60 4 15 80,000
7 Nam Dinh DoNRE 149 1 20 520,000
8 Thai Binh URENCO 70 0 0
9 Ninh Binh URENCO 45 1 15 164,250
10 Ha Giang URENCO 32 10 21 511,000
11 Cao Bang URENCO 29 1 4.5
12 Lao Cai URENCO 56 1 5 200,000
13 Bac Kan URENCO 25 1 5.8 160,660
14 Lang SonURENCO,
DoNRE96 1 20 100,000
15 Tuyen Quang URENCO 60 1 10 200,000
16 Yen Bai URENCO 48 1 3.2 20,000
17 Thai Nguyen URENCO 72 1 25 788,400
18 Phu Tho URENCOs 115 1 1.1 25,000
19 Vinh PhucDoNRE,
URENCO64 1 5.5 182,500
20 Bac Giang DoNRE 60 1 6.5 170,880
21 Bac NinhURENCO,
DoNRE93 1 1.5 200,000
22 Quang Ninh URENCO 118 2 23 4,600,000
23 Lai Chau URENCO 47 1 1.6 246,000
24 Son La URENCO 34 10 20 650,000
25 Hoa Binh URENCO 30 0 0
26 Thanh Hoa URENCO 163 1 6 105,500
27 Nghe AnURENCO,
DoNRE158 8 77 1,318,400
28 Ha Tinh URENCO 58 1 1.7 200,000
29 Quang Binh URENCO 60 1 13 500,000
30 Quang Tri URENCO 60 1 22 400,000
31Thua Thien
HueURENCO 138 1 10 630,000
32 Da Nang URENCO 493 1 17 1,000,000
33 Quang NamURENCOs,
SOER260 4 117
34 Quang Ngai URENCO 80 1 15 170,000
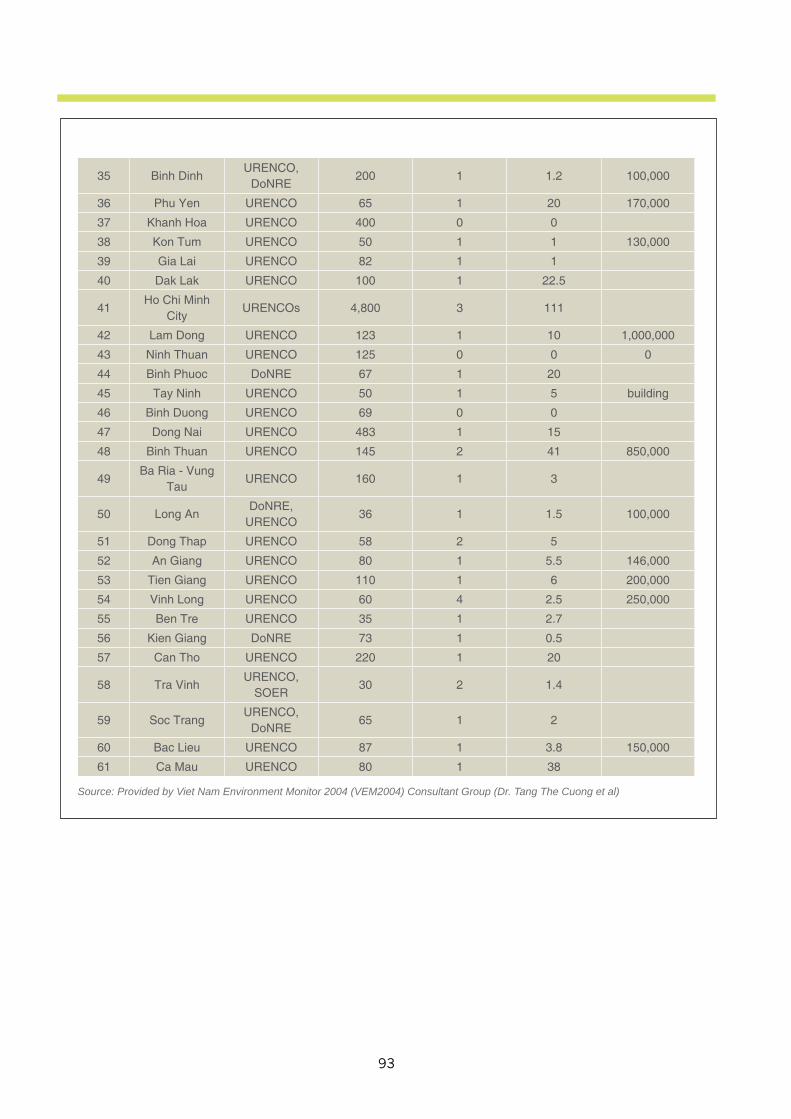
93
35 Binh DinhURENCO,
DoNRE200 1 1.2 100,000
36 Phu Yen URENCO 65 1 20 170,000
37 Khanh Hoa URENCO 400 0 0
38 Kon Tum URENCO 50 1 1 130,000
39 Gia Lai URENCO 82 1 1
40 Dak Lak URENCO 100 1 22.5
41Ho Chi Minh
CityURENCOs 4,800 3 111
42 Lam Dong URENCO 123 1 10 1,000,000
43 Ninh Thuan URENCO 125 0 0 0
44 Binh Phuoc DoNRE 67 1 20
45 Tay Ninh URENCO 50 1 5 building
46 Binh Duong URENCO 69 0 0
47 Dong Nai URENCO 483 1 15
48 Binh Thuan URENCO 145 2 41 850,000
49Ba Ria - Vung
TauURENCO 160 1 3
50 Long AnDoNRE,
URENCO36 1 1.5 100,000
51 Dong Thap URENCO 58 2 5
52 An Giang URENCO 80 1 5.5 146,000
53 Tien Giang URENCO 110 1 6 200,000
54 Vinh Long URENCO 60 4 2.5 250,000
55 Ben Tre URENCO 35 1 2.7
56 Kien Giang DoNRE 73 1 0.5
57 Can Tho URENCO 220 1 20
58 Tra VinhURENCO,
SOER30 2 1.4
59 Soc TrangURENCO,
DoNRE65 1 2
60 Bac Lieu URENCO 87 1 3.8 150,000
61 Ca Mau URENCO 80 1 38
Source: Provided by Viet Nam Environment Monitor 2004 (VEM2004) Consultant Group (Dr. Tang The Cuong et al)
94
SUMMARY
A.Policy Reference1.Purpose: The purpose of this indicator is to track the percentage of solid waste collected in municipal areas. It highlights the burden of uncollected waste in the environment.
2.Relevance to Environment Planning and Management: Solid waste management is an important part of civic environmental management and findings of this assessment can help formulate strategies for solid waste management in Viet Nam.
3.Linkage to Other Indicators:None specifically.
4.Targets: The National Strategy for Environmental Protection established a target of 90 per cent collection and disposal of solid waste by the year 2010.
B.AnalysisAs can be observed from Figure 1 and Table 1, there has been a small increase in the percentage of waste collected during the 4-year period of the indicator. The collection rate rose from 71% in 2000 to 74% in 2003, or by 3% over four years. At this rate of increase, the collection ratio will be less than 80% by year 2010 and well below the target set out by the latest National Strategy for Environmental Protection in 2003. What can also be observed from Table 1 is the increasing volume of waste which is not collected. This figure rose from 1.3 million tons in 2000 to 1.7 million tons in 2003. So while there appears to be an improvement in the collection rate, the amount generated also increases and the volume of uncollected waste increases.The collection rate varies from region to region and from province to province (see Table 2). The Mekong River Delta Region improved by 11% in the 4-year period but it remains one of the regions with the lowest collection ratio (67% in 2003). The lowest collection rate is in the North West region where it improved by 5% over the 4-year period (from 61% in 2000 to 66% in 2003). The best collection rate appears to be in the Central Highland region where it has improved from 68% in 2000 to 78% in 2003; the North Central region follows quite closely. The least amount of improvement over the 4-year period is in the Red River and South East regions (which include the cities of Hanoi and Ho Chi Mingh, respectively), where two thirds of the waste is generated and where the collection rate has only improved by one percentage point. These two regions also account for the bulk of the waste that is left uncollected (1.1 of 1.7 million tons in 2003). From an environmental perspective, all waste should be collected and properly disposed of. The 90% target set out in the 2003 National Strategy for Environmental Projection is therefore not unreasonable. Thailand’s target, for instance, is for 95% collection in urban areas and 90% in rural areas. And while there is an observed marginal improvement in the indicator value in the 4-year period, the rate of improvement not rapid enough to meet the 2010 target and it is doubtful that this target can be achieved. It is therefore concluded that, as of 2003, the state of solid waste management in Viet Nam in relatively poor (relative to the 90% target) and that the trend (based on the slow rate of improvement and the increasing amount of waste that is being left uncollected) is deteriorating. The sign of a true improvement in the state of waste management is when the amount of uncollected waste shows a decreasing trend.
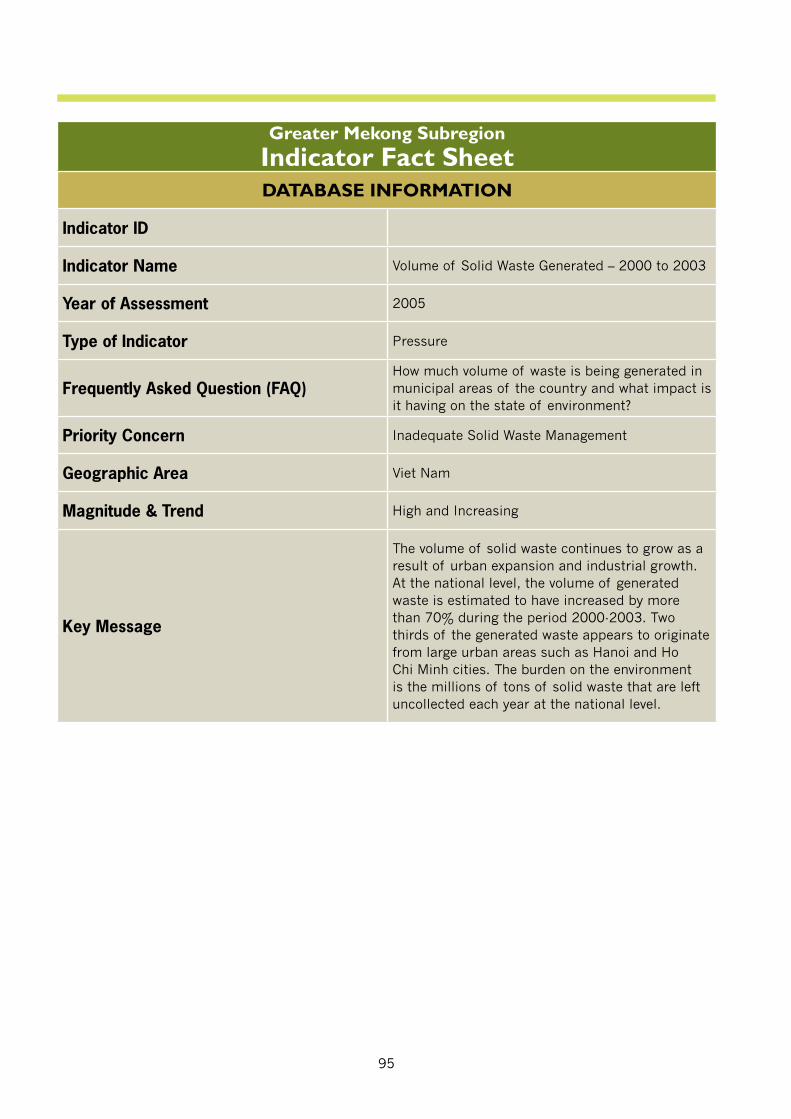
95
Greater Mekong SubregionIndicator Fact SheetDATABASE INFORMATION
Indicator ID
Indicator Name Volume of Solid Waste Generated – 2000 to 2003
Year of Assessment 2005
Type of Indicator Pressure
Frequently Asked Question (FAQ)How much volume of waste is being generated in municipal areas of the country and what impact is it having on the state of environment?
Priority Concern Inadequate Solid Waste Management
Geographic Area Viet Nam
Magnitude & Trend High and Increasing
Key Message
The volume of solid waste continues to grow as a result of urban expansion and industrial growth. At the national level, the volume of generated waste is estimated to have increased by more than 70% during the period 2000-2003. Two thirds of the generated waste appears to originate from large urban areas such as Hanoi and Ho Chi Minh cities. The burden on the environment is the millions of tons of solid waste that are left uncollected each year at the national level.
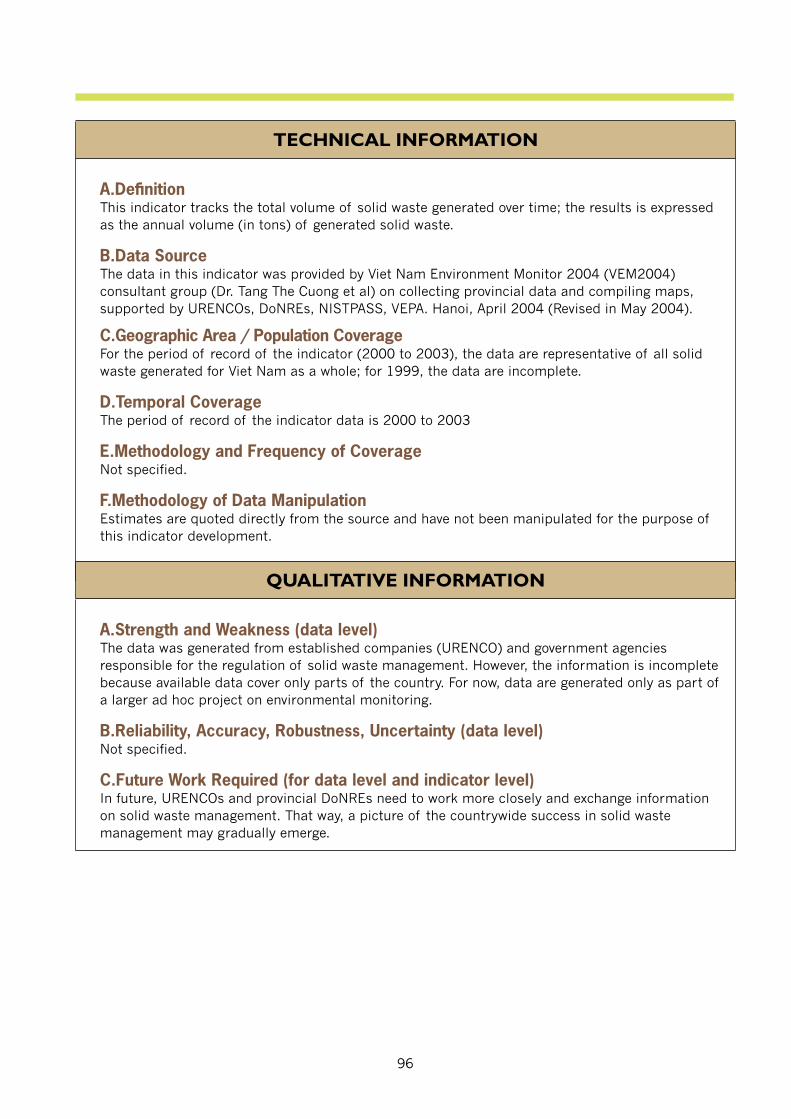
96
TECHNICAL INFORMATION
A.Defi nitionThis indicator tracks the total volume of solid waste generated over time; the results is expressed as the annual volume (in tons) of generated solid waste.
B.Data SourceThe data in this indicator was provided by Viet Nam Environment Monitor 2004 (VEM2004) consultant group (Dr. Tang The Cuong et al) on collecting provincial data and compiling maps, supported by URENCOs, DoNREs, NISTPASS, VEPA. Hanoi, April 2004 (Revised in May 2004).
C.Geographic Area / Population CoverageFor the period of record of the indicator (2000 to 2003), the data are representative of all solid waste generated for Viet Nam as a whole; for 1999, the data are incomplete.
D.Temporal CoverageThe period of record of the indicator data is 2000 to 2003
E.Methodology and Frequency of CoverageNot specified.
F.Methodology of Data ManipulationEstimates are quoted directly from the source and have not been manipulated for the purpose of this indicator development.
QUALITATIVE INFORMATION
A.Strength and Weakness (data level)The data was generated from established companies (URENCO) and government agencies responsible for the regulation of solid waste management. However, the information is incomplete because available data cover only parts of the country. For now, data are generated only as part of a larger ad hoc project on environmental monitoring.
B.Reliability, Accuracy, Robustness, Uncertainty (data level)Not specified.
C.Future Work Required (for data level and indicator level)In future, URENCOs and provincial DoNREs need to work more closely and exchange information on solid waste management. That way, a picture of the countrywide success in solid waste management may gradually emerge.
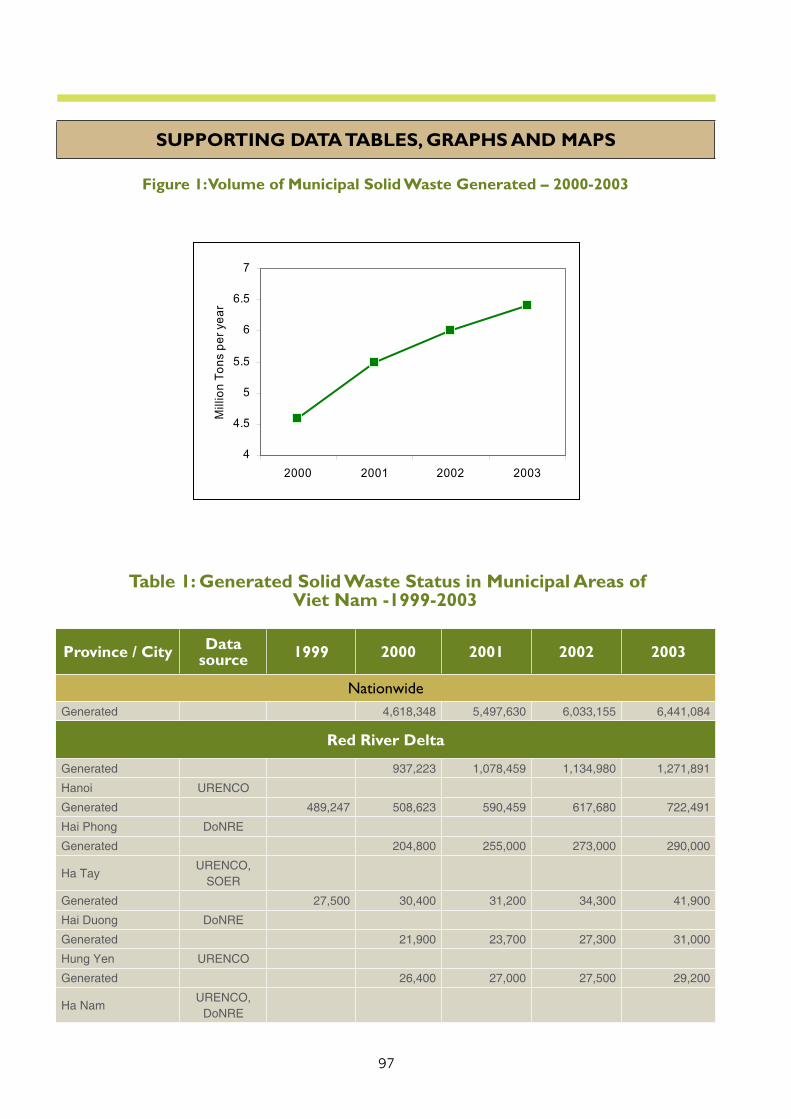
97
SUPPORTING DATA TABLES, GRAPHS AND MAPS
Figure 1: Volume of Municipal Solid Waste Generated – 2000-2003
Table 1: Generated Solid Waste Status in Municipal Areas of Viet Nam -1999-2003
Province / City Data source 1999 2000 2001 2002 2003
NationwideGenerated 4,618,348 5,497,630 6,033,155 6,441,084
Red River Delta
Generated 937,223 1,078,459 1,134,980 1,271,891
Hanoi URENCO
Generated 489,247 508,623 590,459 617,680 722,491
Hai Phong DoNRE
Generated 204,800 255,000 273,000 290,000
Ha TayURENCO,
SOER
Generated 27,500 30,400 31,200 34,300 41,900
Hai Duong DoNRE
Generated 21,900 23,700 27,300 31,000
Hung Yen URENCO
Generated 26,400 27,000 27,500 29,200
Ha NamURENCO,
DoNRE
4
4.5
5
5.5
6
6.5
7
2000 2001 2002 2003
Mill
ion
Tons
per
yea
r
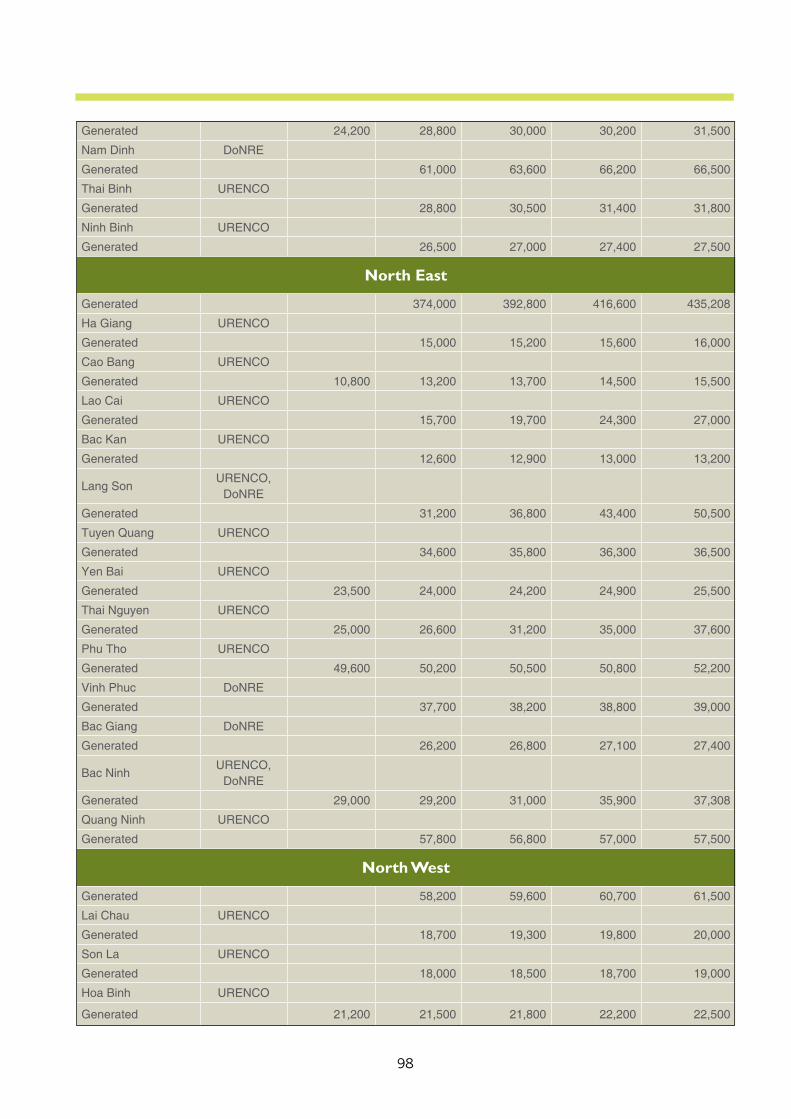
98
Generated 24,200 28,800 30,000 30,200 31,500
Nam Dinh DoNRE
Generated 61,000 63,600 66,200 66,500
Thai Binh URENCO
Generated 28,800 30,500 31,400 31,800
Ninh Binh URENCO
Generated 26,500 27,000 27,400 27,500
North East
Generated 374,000 392,800 416,600 435,208
Ha Giang URENCO
Generated 15,000 15,200 15,600 16,000
Cao Bang URENCO
Generated 10,800 13,200 13,700 14,500 15,500
Lao Cai URENCO
Generated 15,700 19,700 24,300 27,000
Bac Kan URENCO
Generated 12,600 12,900 13,000 13,200
Lang SonURENCO,
DoNRE
Generated 31,200 36,800 43,400 50,500
Tuyen Quang URENCO
Generated 34,600 35,800 36,300 36,500
Yen Bai URENCO
Generated 23,500 24,000 24,200 24,900 25,500
Thai Nguyen URENCO
Generated 25,000 26,600 31,200 35,000 37,600
Phu Tho URENCO
Generated 49,600 50,200 50,500 50,800 52,200
Vinh Phuc DoNRE
Generated 37,700 38,200 38,800 39,000
Bac Giang DoNRE
Generated 26,200 26,800 27,100 27,400
Bac NinhURENCO,
DoNRE
Generated 29,000 29,200 31,000 35,900 37,308
Quang Ninh URENCO
Generated 57,800 56,800 57,000 57,500
North West
Generated 58,200 59,600 60,700 61,500
Lai Chau URENCO
Generated 18,700 19,300 19,800 20,000
Son La URENCO
Generated 18,000 18,500 18,700 19,000
Hoa Binh URENCO
Generated 21,200 21,500 21,800 22,200 22,500
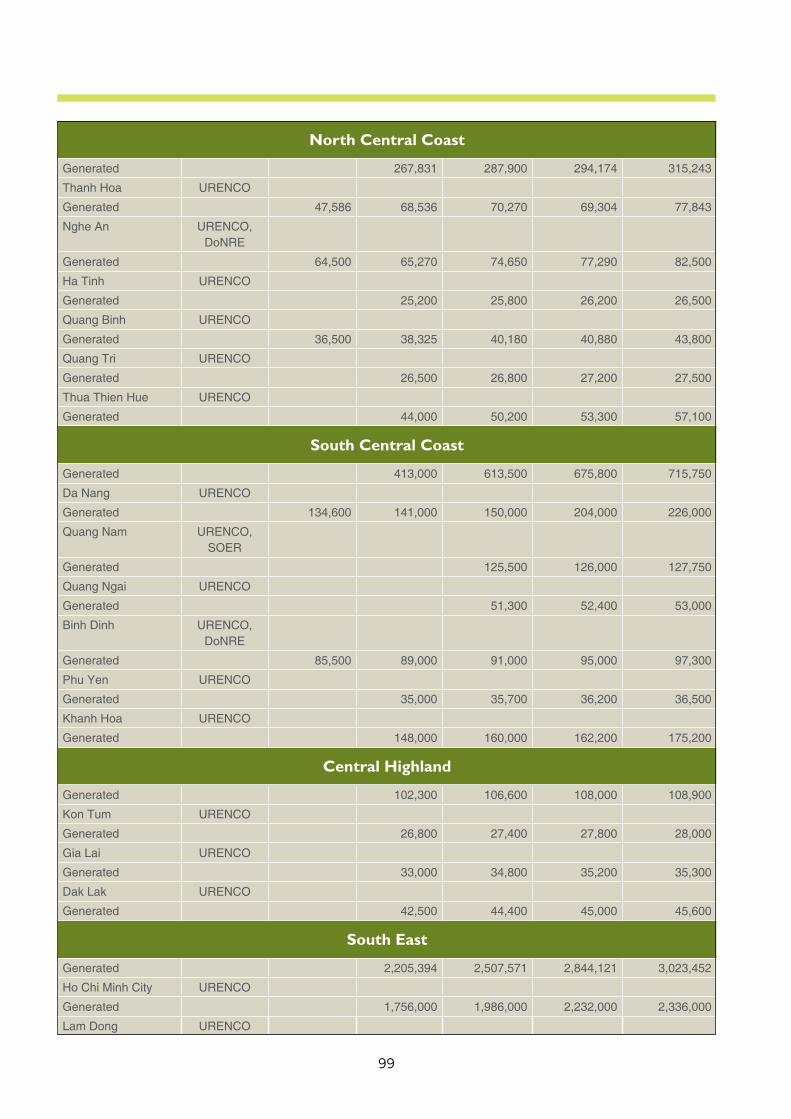
99
North Central Coast
Generated 267,831 287,900 294,174 315,243
Thanh Hoa URENCO
Generated 47,586 68,536 70,270 69,304 77,843
Nghe An URENCO, DoNRE
Generated 64,500 65,270 74,650 77,290 82,500
Ha Tinh URENCO
Generated 25,200 25,800 26,200 26,500
Quang Binh URENCO
Generated 36,500 38,325 40,180 40,880 43,800
Quang Tri URENCO
Generated 26,500 26,800 27,200 27,500
Thua Thien Hue URENCO
Generated 44,000 50,200 53,300 57,100
South Central Coast
Generated 413,000 613,500 675,800 715,750
Da Nang URENCO
Generated 134,600 141,000 150,000 204,000 226,000
Quang Nam URENCO, SOER
Generated 125,500 126,000 127,750
Quang Ngai URENCO
Generated 51,300 52,400 53,000
Binh Dinh URENCO, DoNRE
Generated 85,500 89,000 91,000 95,000 97,300
Phu Yen URENCO
Generated 35,000 35,700 36,200 36,500
Khanh Hoa URENCO
Generated 148,000 160,000 162,200 175,200
Central Highland
Generated 102,300 106,600 108,000 108,900
Kon Tum URENCO
Generated 26,800 27,400 27,800 28,000
Gia Lai URENCO
Generated 33,000 34,800 35,200 35,300
Dak Lak URENCO
Generated 42,500 44,400 45,000 45,600
South East
Generated 2,205,394 2,507,571 2,844,121 3,023,452
Ho Chi Minh City URENCO
Generated 1,756,000 1,986,000 2,232,000 2,336,000
Lam Dong URENCO
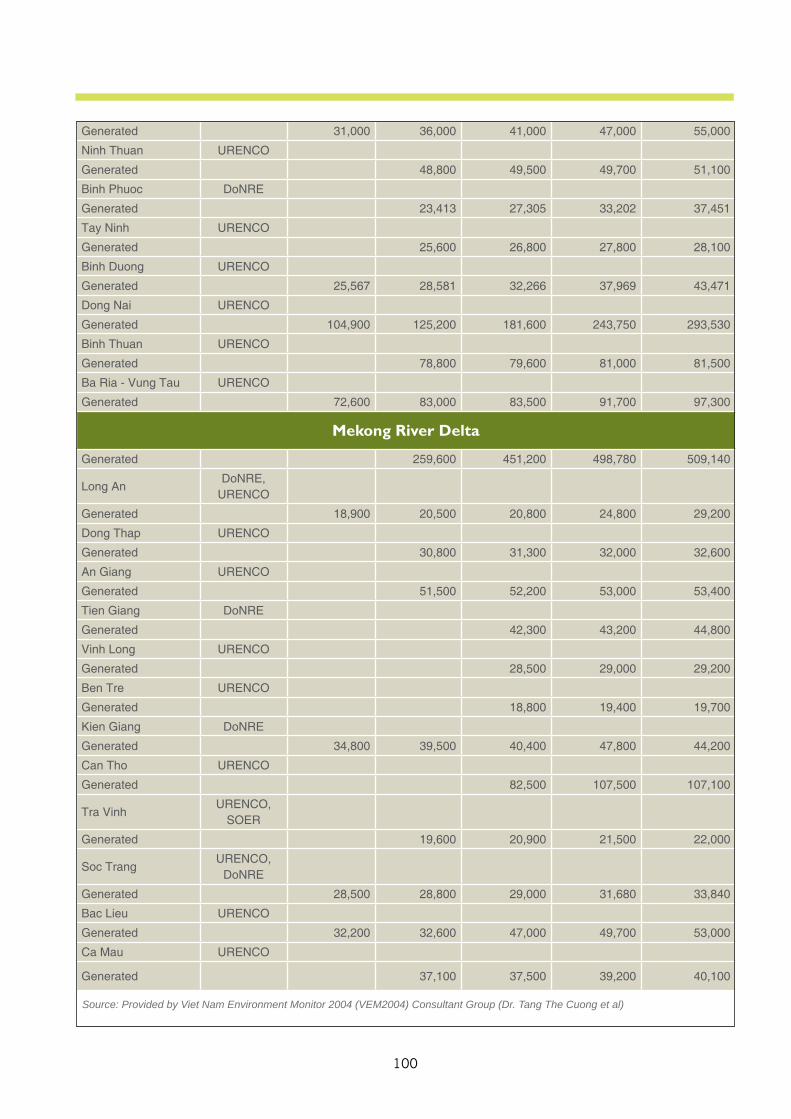
100
Generated 31,000 36,000 41,000 47,000 55,000
Ninh Thuan URENCO
Generated 48,800 49,500 49,700 51,100
Binh Phuoc DoNRE
Generated 23,413 27,305 33,202 37,451
Tay Ninh URENCO
Generated 25,600 26,800 27,800 28,100
Binh Duong URENCO
Generated 25,567 28,581 32,266 37,969 43,471
Dong Nai URENCO
Generated 104,900 125,200 181,600 243,750 293,530
Binh Thuan URENCO
Generated 78,800 79,600 81,000 81,500
Ba Ria - Vung Tau URENCO
Generated 72,600 83,000 83,500 91,700 97,300
Mekong River Delta
Generated 259,600 451,200 498,780 509,140
Long AnDoNRE,
URENCO
Generated 18,900 20,500 20,800 24,800 29,200
Dong Thap URENCO
Generated 30,800 31,300 32,000 32,600
An Giang URENCO
Generated 51,500 52,200 53,000 53,400
Tien Giang DoNRE
Generated 42,300 43,200 44,800
Vinh Long URENCO
Generated 28,500 29,000 29,200
Ben Tre URENCO
Generated 18,800 19,400 19,700
Kien Giang DoNRE
Generated 34,800 39,500 40,400 47,800 44,200
Can Tho URENCO
Generated 82,500 107,500 107,100
Tra VinhURENCO,
SOER
Generated 19,600 20,900 21,500 22,000
Soc TrangURENCO,
DoNRE
Generated 28,500 28,800 29,000 31,680 33,840
Bac Lieu URENCO
Generated 32,200 32,600 47,000 49,700 53,000
Ca Mau URENCO
Generated 37,100 37,500 39,200 40,100
Source: Provided by Viet Nam Environment Monitor 2004 (VEM2004) Consultant Group (Dr. Tang The Cuong et al)
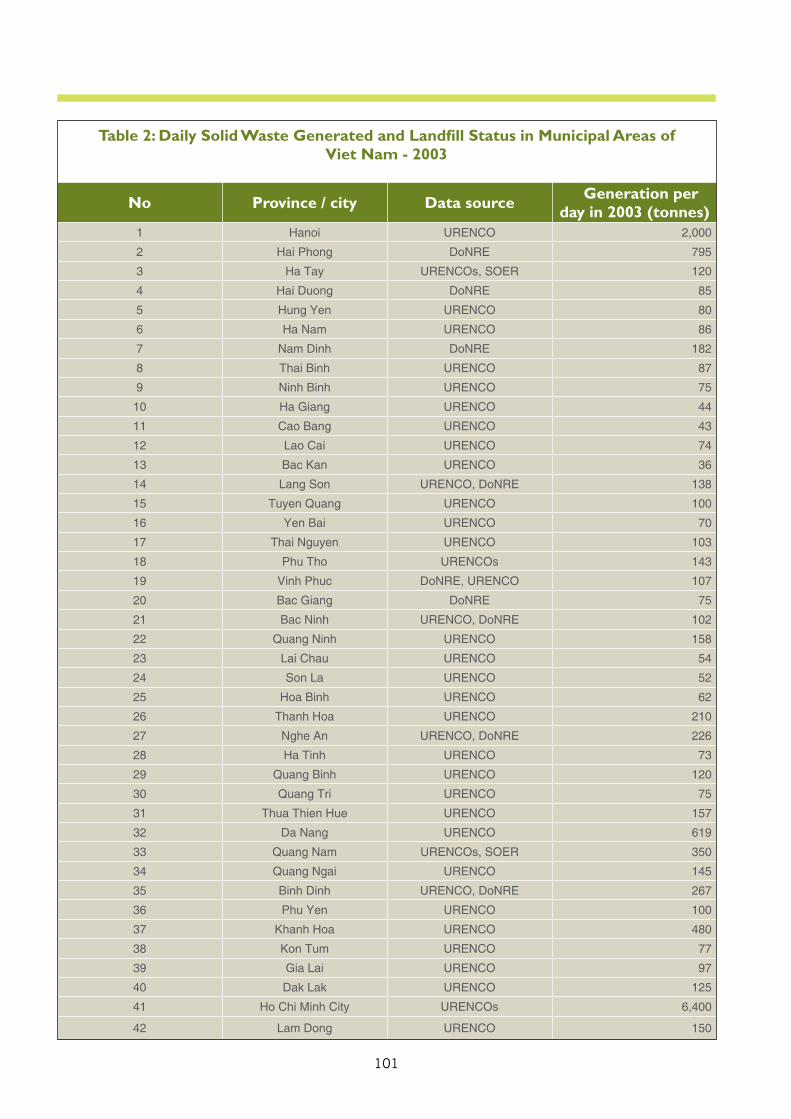
101
Table 2: Daily Solid Waste Generated and Landfi ll Status in Municipal Areas of Viet Nam - 2003
No Province / city Data source GGeneration per day in 2003 (tonnes)
1 Hanoi URENCO 2,000
2 Hai Phong DoNRE 795
3 Ha Tay URENCOs, SOER 120
4 Hai Duong DoNRE 85
5 Hung Yen URENCO 80
6 Ha Nam URENCO 86
7 Nam Dinh DoNRE 182
8 Thai Binh URENCO 87
9 Ninh Binh URENCO 75
10 Ha Giang URENCO 44
11 Cao Bang URENCO 43
12 Lao Cai URENCO 74
13 Bac Kan URENCO 36
14 Lang Son URENCO, DoNRE 138
15 Tuyen Quang URENCO 100
16 Yen Bai URENCO 70
17 Thai Nguyen URENCO 103
18 Phu Tho URENCOs 143
19 Vinh Phuc DoNRE, URENCO 107
20 Bac Giang DoNRE 75
21 Bac Ninh URENCO, DoNRE 102
22 Quang Ninh URENCO 158
23 Lai Chau URENCO 54
24 Son La URENCO 52
25 Hoa Binh URENCO 62
26 Thanh Hoa URENCO 210
27 Nghe An URENCO, DoNRE 226
28 Ha Tinh URENCO 73
29 Quang Binh URENCO 120
30 Quang Tri URENCO 75
31 Thua Thien Hue URENCO 157
32 Da Nang URENCO 619
33 Quang Nam URENCOs, SOER 350
34 Quang Ngai URENCO 145
35 Binh Dinh URENCO, DoNRE 267
36 Phu Yen URENCO 100
37 Khanh Hoa URENCO 480
38 Kon Tum URENCO 77
39 Gia Lai URENCO 97
40 Dak Lak URENCO 125
41 Ho Chi Minh City URENCOs 6,400
42 Lam Dong URENCO 150
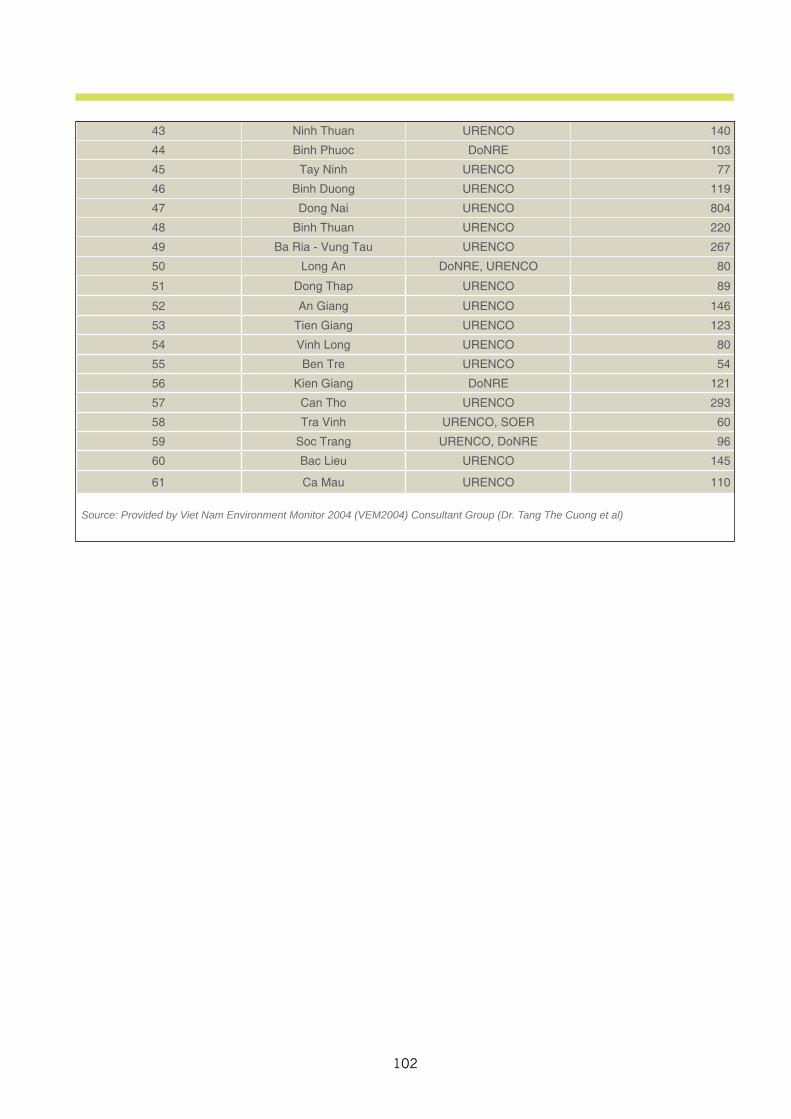
102
43 Ninh Thuan URENCO 140
44 Binh Phuoc DoNRE 103
45 Tay Ninh URENCO 77
46 Binh Duong URENCO 119
47 Dong Nai URENCO 804
48 Binh Thuan URENCO 220
49 Ba Ria - Vung Tau URENCO 267
50 Long An DoNRE, URENCO 80
51 Dong Thap URENCO 89
52 An Giang URENCO 146
53 Tien Giang URENCO 123
54 Vinh Long URENCO 80
55 Ben Tre URENCO 54
56 Kien Giang DoNRE 121
57 Can Tho URENCO 293
58 Tra Vinh URENCO, SOER 60
59 Soc Trang URENCO, DoNRE 96
60 Bac Lieu URENCO 145
61 Ca Mau URENCO 110
Source: Provided by Viet Nam Environment Monitor 2004 (VEM2004) Consultant Group (Dr. Tang The Cuong et al)
103
SUMMARY
A.Policy Reference1.Purpose: This indicator shows the changes in the amount of solid waste generated by municipal areas.
2.Relevance to Environment Planning and Management: Solid waste management is an important part of civic environmental management and findings of this assessment are valuable in formulating strategies for SWM in Viet Nam.
3.Linkage to Other Indicators:This indicator could be linked to the indicators on solid waste, industrial solid waste or medical solid waste in municipal areas.
4.Targets: None specific to this indicator.
B.AnalysisAs can be observed from Figure 1, the amount of solid waste generated at the national level has increased by approximately 72% over a 4-year period, from approximately 4.6 million tons per year in 2000 to about 6.4 million tons in year 2003. If the rate of generation is not subdued, it could reach 9 million tons by year 2010. As was observed in the related state indicator fact sheet, the rate of collection only improved by 3% during the period. And if the current trends continue and 80 per cent of solid waste is collected by 2010, that would still leave some 1.8 million tons of solid waste left uncollected every year. As can be observed from Tables 1 and 2, the Red River region which includes Hanoi and the South East region which includes Ho Chi Minh are the regions generating the largest volumes of waste and together, account for approximately two thirds of the waste generated at the national level..The volume of solid waste generated continues to increase as a result of urban expansion and industrial growth and there are good reasons to expect this trend to continue. The current average per capita waste generate rate in Viet Nam is well below the levels in more affluent countries and, based on worldwide experience, likely to grow in line with improving living standards, and continuing urbanization. Based on these observations, it is concluded that the pressure on waste management in Viet Nam is high and steadily increasing.

104
Greater Mekong SubregionIndicator Fact SheetDATABASE INFORMATION
Indicator ID
Indicator Name Investment in Solid Waste Management – 1998 to 2003
Year of Assessment 2005
Type of Indicator Response
Frequently Asked Question (FAQ) How much is spent on solid waste management in Viet Nam?
Priority Concern Inadequate Solid Waste Management
Geographic Area Viet Nam
Impact & Trend Average and Intermittent
Key Message
Financing of soild waste management is among key determinants of success in dealing with soild waste. Government and international donor assistance are chief sources of financial assistance in this sector. Government- and donor-financed investment in solid waste management has grown in recent years but the sustainability waste management efforts is not assured.
105
TECHNICAL INFORMATION
A.Defi nitionThis indicator attempts to track the government expenditures of solid waste management over time; the result is expressed as annual expenditures (in billion VND) by various sectors over time. The government expenditure is understood to include funds contributed by donors for the task of solid waste management.
B.Data SourceThe data was collected from the Urban Environmental Company (URENCO) and supplemented by data generated by the National University of Viet Nam.
C.Geographic Area / Population CoverageThe indicator data is representative of government expenditures on solid waste management for Viet Nam as a whole.
D.Temporal CoverageThe period of record for the indicator is 1998 to 2003.
E.Methodology and Frequency of CoverageNot specified.
F.Methodology of Data ManipulationFigures are quoted directly from the source without manipulation.
QUALITATIVE INFORMATION
A.Strength and Weakness (data level)Not specified.
B.Reliability, Accuracy, Robustness, Uncertainty (data level)Data estimates are considered reliable; however data on expenditure for landfill development has not been made available.
C.Future Work Required (for data level and indicator level)The indicator and the fact sheet should be updated on an annual basis as new expenditure figures become available.
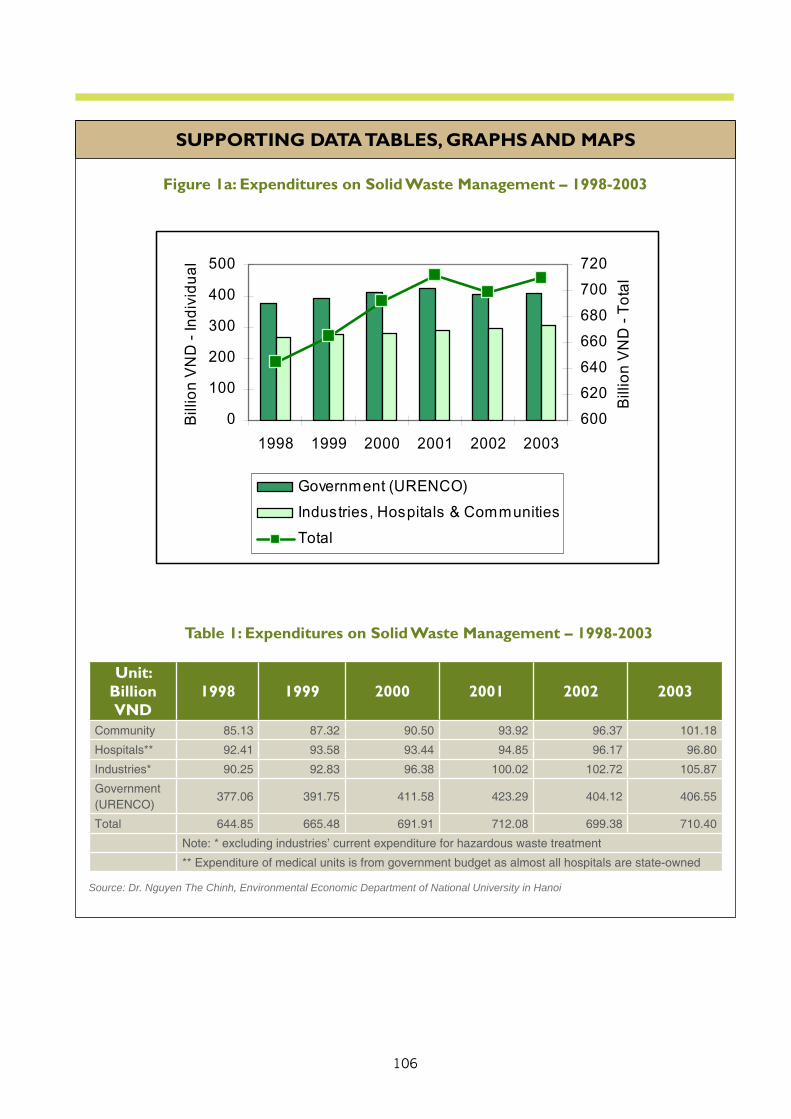
106
SUPPORTING DATA TABLES, GRAPHS AND MAPS
Figure 1a: Expenditures on Solid Waste Management – 1998-2003
Table 1: Expenditures on Solid Waste Management – 1998-2003
Unit: Billion VND
1998 1999 2000 2001 2002 2003
Community 85.13 87.32 90.50 93.92 96.37 101.18
Hospitals** 92.41 93.58 93.44 94.85 96.17 96.80
Industries* 90.25 92.83 96.38 100.02 102.72 105.87
Government (URENCO)
377.06 391.75 411.58 423.29 404.12 406.55
Total 644.85 665.48 691.91 712.08 699.38 710.40
Note: * excluding industries’ current expenditure for hazardous waste treatment
** Expenditure of medical units is from government budget as almost all hospitals are state-owned
Source: Dr. Nguyen The Chinh, Environmental Economic Department of National University in Hanoi
0
100
200
300
400
500
1998 1999 2000 2001 2002 2003
Bill
ion
VN
D-I
ndiv
idua
l
600
620
640
660
680
700
720
Bill
ion
VN
D-T
otal
Government (URENCO)
Industries, Hospitals & Communities
Total
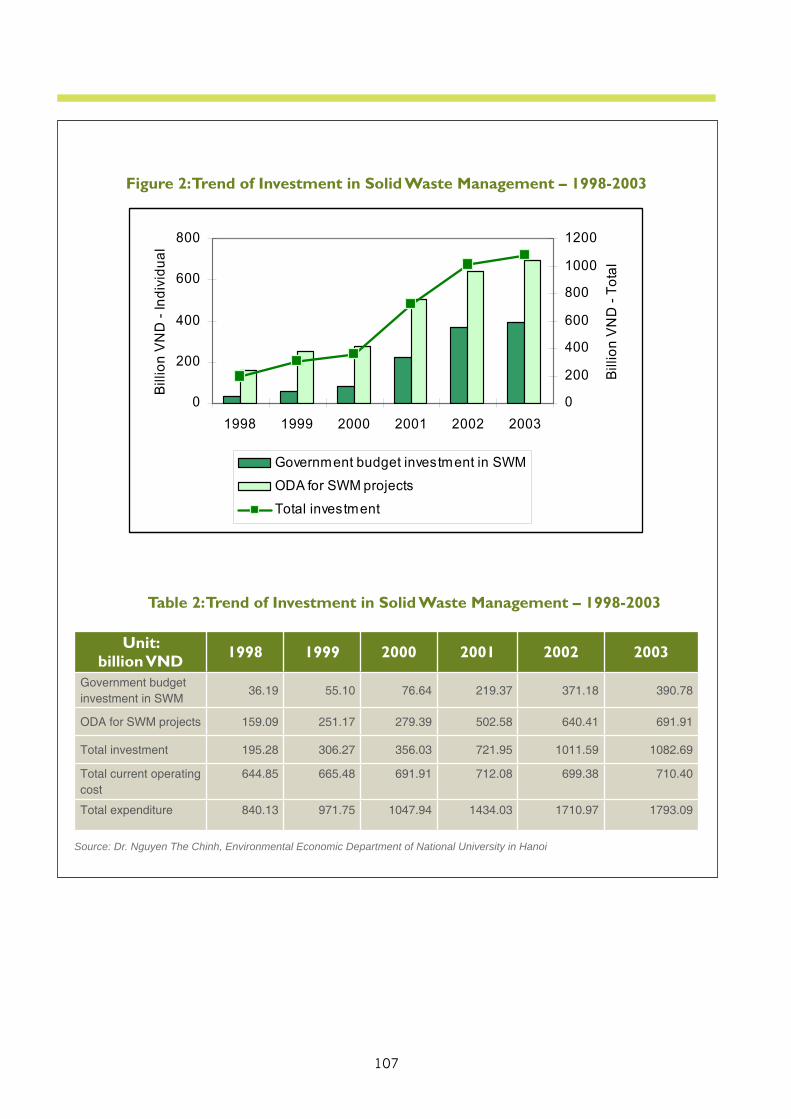
107
Figure 2: Trend of Investment in Solid Waste Management – 1998-2003
Table 2: Trend of Investment in Solid Waste Management – 1998-2003
Unit: billion VND 1998 1999 2000 2001 2002 2003
Government budget investment in SWM
36.19 55.10 76.64 219.37 371.18 390.78
ODA for SWM projects 159.09 251.17 279.39 502.58 640.41 691.91
Total investment 195.28 306.27 356.03 721.95 1011.59 1082.69
Total current operating cost
644.85 665.48 691.91 712.08 699.38 710.40
Total expenditure 840.13 971.75 1047.94 1434.03 1710.97 1793.09
Source: Dr. Nguyen The Chinh, Environmental Economic Department of National University in Hanoi
0
200
400
600
800
1998 1999 2000 2001 2002 2003
Bill
ion
VN
D-I
ndiv
idua
l
0
200
400
600
800
1000
1200
Bill
ion
VN
D-T
otal
Government budget investment in SWM
ODA for SWM projects
Total investment
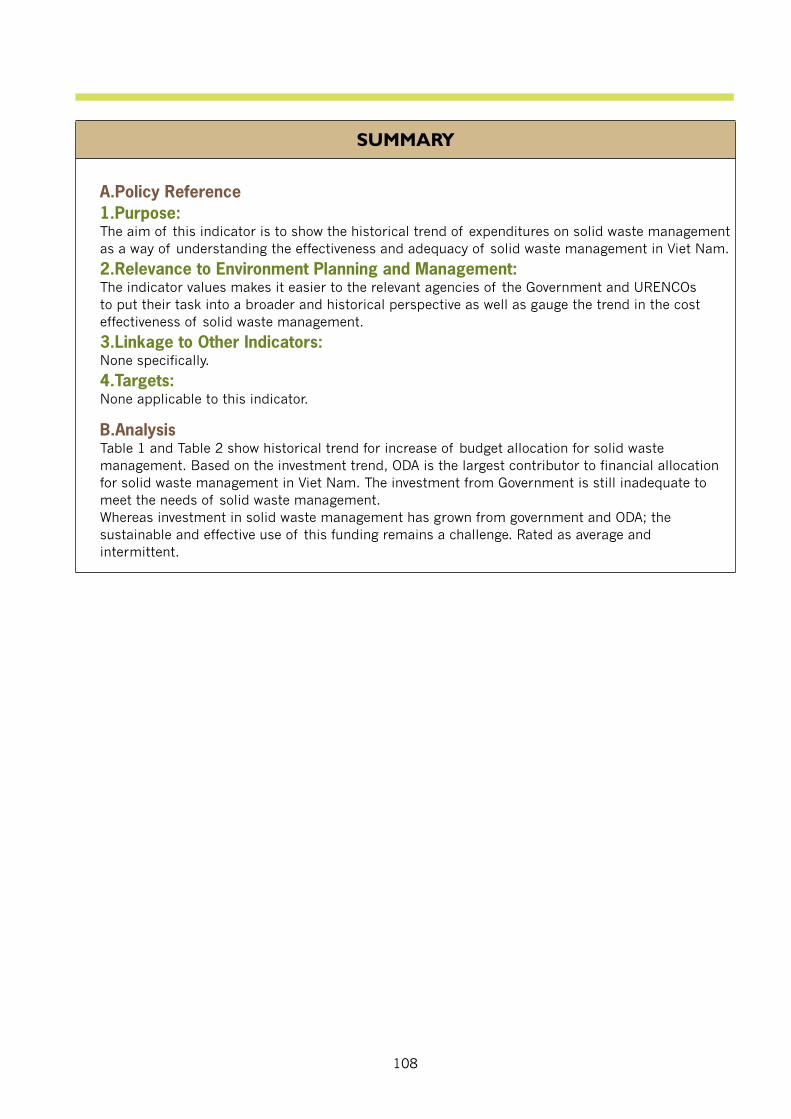
108
SUMMARY
A.Policy Reference1.Purpose: The aim of this indicator is to show the historical trend of expenditures on solid waste management as a way of understanding the effectiveness and adequacy of solid waste management in Viet Nam.
2.Relevance to Environment Planning and Management: The indicator values makes it easier to the relevant agencies of the Government and URENCOs to put their task into a broader and historical perspective as well as gauge the trend in the cost effectiveness of solid waste management.
3.Linkage to Other Indicators:None specifically.
4.Targets: None applicable to this indicator.
B.AnalysisTable 1 and Table 2 show historical trend for increase of budget allocation for solid waste management. Based on the investment trend, ODA is the largest contributor to financial allocation for solid waste management in Viet Nam. The investment from Government is still inadequate to meet the needs of solid waste management.Whereas investment in solid waste management has grown from government and ODA; the sustainable and effective use of this funding remains a challenge. Rated as average and intermittent.
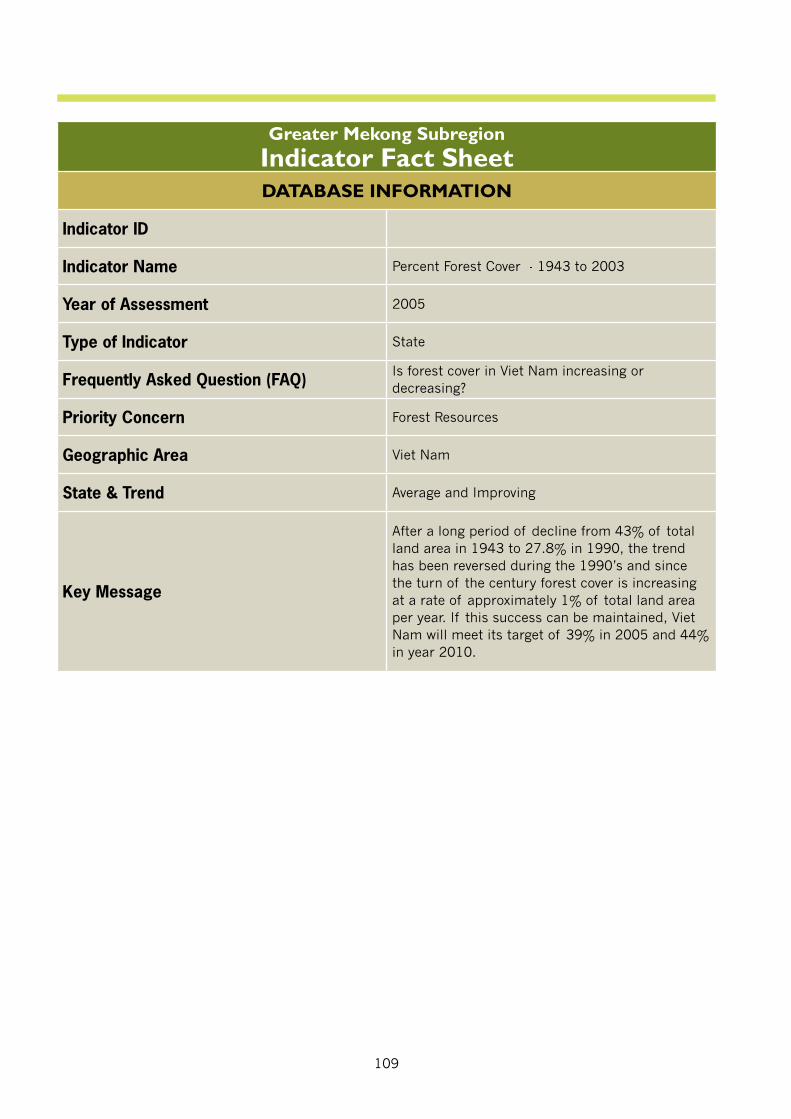
109
Greater Mekong SubregionIndicator Fact SheetDATABASE INFORMATION
Indicator ID
Indicator Name Percent Forest Cover - 1943 to 2003
Year of Assessment 2005
Type of Indicator State
Frequently Asked Question (FAQ) Is forest cover in Viet Nam increasing or decreasing?
Priority Concern Forest Resources
Geographic Area Viet Nam
State & Trend Average and Improving
Key Message
After a long period of decline from 43% of total land area in 1943 to 27.8% in 1990, the trend has been reversed during the 1990’s and since the turn of the century forest cover is increasing at a rate of approximately 1% of total land area per year. If this success can be maintained, Viet Nam will meet its target of 39% in 2005 and 44% in year 2010.
110
TECHNICAL INFORMATION
A.Defi nitionThis indicator attempts to track the amount of natural and plantation area over time. It is expressed as the percentage of total forest area (both natural and plantation) over total land area.
B.Data SourceThe data utilized for the construction of this indicator originates from the Forest Investment and Planning Institute (FIPI) which is attached to the Ministry of Agriculture and Rural Development (MARD).
C.Geographic Area / Population CoverageThe estimates of forest cover are representative of the country of Viet Nam as a whole, based on a total land area of 33,111,700 hectares.
D.Temporal CoverageEstimates of forest cover have been available ever five years since 1976. More recently, estimates are available on an annual basis.
E.Methodology and Frequency of CoverageThe estimates are continuously being updated by Viet Nam Forestry Investment and Planning Institute, attached to the MARD.
F.Methodology of Data ManipulationThe figures for both hectares and percent of total land area are quoted directly from FIPI. It is noted in Table 1 that the percentage figures are not all based on a total land area of 33,111,700 hectares.
QUALITATIVE INFORMATION
A.Strength and Weakness (data level)Normally, the percentage area figure does not give any indication on the quality of the forest, its ecosystem context, nor forest values or practices. The indicator does not provide information on the degradation of the forest resources in a country. The total forest area in a country might remain unchanged, but the quality of the forest can become degraded. Due to the definition used, the indicator covers a much-diversified range of forests ranging from open tree savanna to very dense tropical forests.The shortfall of this indicator has been partially addressed by adding a breakdown between natural and plantation forests. Also to illustrate regional variations in forest cover, a year 1999 snapshot is provided showing forest cover by eco-system.
B.Reliability, Accuracy, Robustness, Uncertainty (data level)The reliability and accuracy of the estimates have not been recorded by FIPI and the estimates originate from a variety of sources using a variety of estimation techniques. It can be assumed however that the more recent the estimates are, the more accurate and reliable they are.
C.Future Work Required (for data level and indicator level)The indicator and the fact sheet should be updated on an annual basis or as new estimates are compiled by the Forest Investment and Planning Institute.
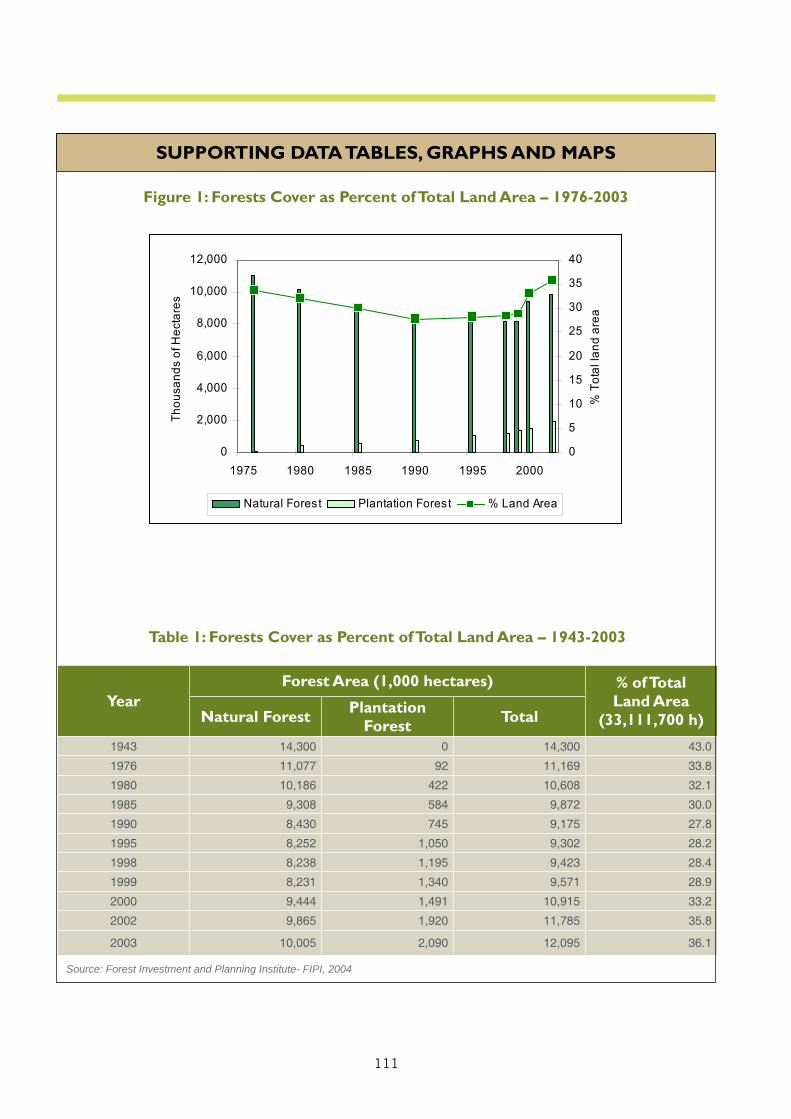
111
SUPPORTING DATA TABLES, GRAPHS AND MAPS
Figure 1: Forests Cover as Percent of Total Land Area – 1976-2003
Table 1: Forests Cover as Percent of Total Land Area – 1943-2003
YearForest Area (1,000 hectares) % of Total
Land Area (33,111,700 h)Natural Forest Plantation
Forest Total
1943 14,300 0 14,300 43.0
1976 11,077 92 11,169 33.8
1980 10,186 422 10,608 32.1
1985 9,308 584 9,872 30.0
1990 8,430 745 9,175 27.8
1995 8,252 1,050 9,302 28.2
1998 8,238 1,195 9,423 28.4
1999 8,231 1,340 9,571 28.9
2000 9,444 1,491 10,915 33.2
2002 9,865 1,920 11,785 35.8
2003 10,005 2,090 12,095 36.1
Source: Forest Investment and Planning Institute- FIPI, 2004
0
2,000
4,000
6,000
8,000
10,000
12,000
1975 1980 1985 1990 1995 2000
Tho
usa
nds
ofH
ect
are
s
0
5
10
15
20
25
30
35
40
%To
tall
and
are
a
Natural Forest Plantation Forest % Land Area
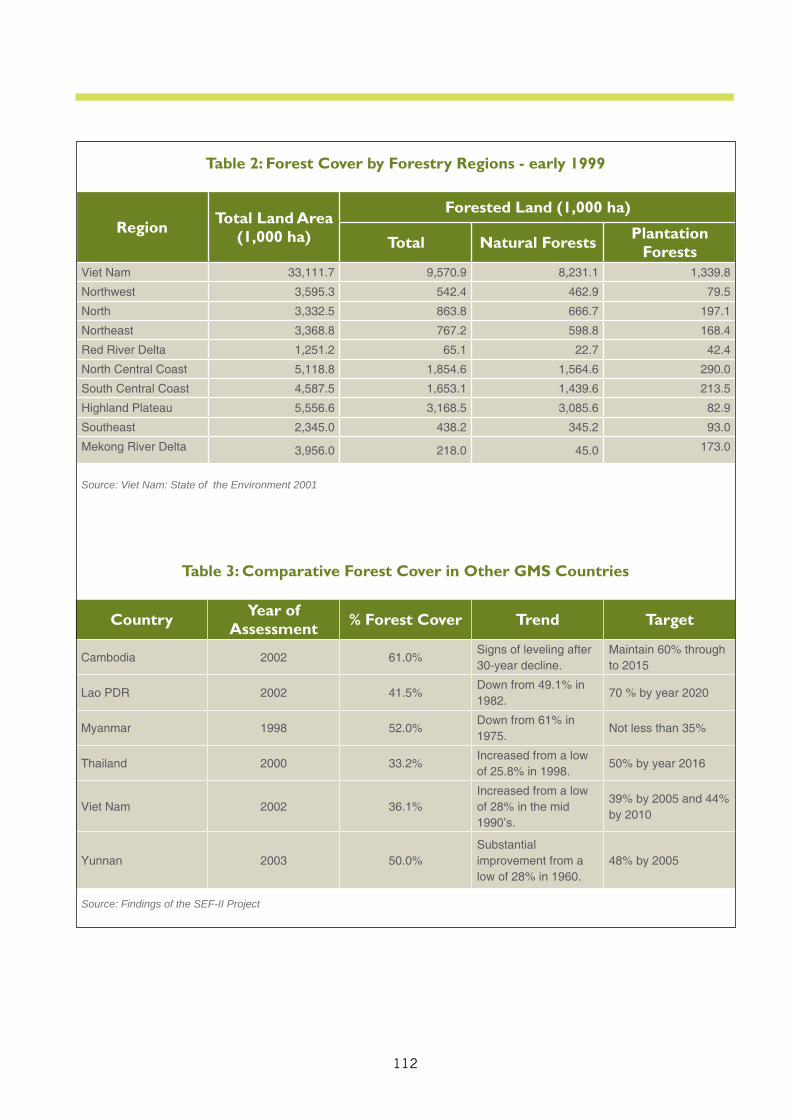
112
Table 2: Forest Cover by Forestry Regions - early 1999
Region Total Land Area(1,000 ha)
Forested Land (1,000 ha)
Total Natural Forests Plantation Forests
Viet Nam 33,111.7 9,570.9 8,231.1 1,339.8
Northwest 3,595.3 542.4 462.9 79.5
North 3,332.5 863.8 666.7 197.1
Northeast 3,368.8 767.2 598.8 168.4
Red River Delta 1,251.2 65.1 22.7 42.4
North Central Coast 5,118.8 1,854.6 1,564.6 290.0
South Central Coast 4,587.5 1,653.1 1,439.6 213.5
Highland Plateau 5,556.6 3,168.5 3,085.6 82.9
Southeast 2,345.0 438.2 345.2 93.0
Mekong River Delta 3,956.0 218.0 45.0 173.0
Source: Viet Nam: State of the Environment 2001
Table 3: Comparative Forest Cover in Other GMS Countries
Country Year of Assessment % Forest Cover Trend Target
Cambodia 2002 61.0%Signs of leveling after 30-year decline.
Maintain 60% through to 2015
Lao PDR 2002 41.5%Down from 49.1% in 1982.
70 % by year 2020
Myanmar 1998 52.0%Down from 61% in 1975.
Not less than 35%
Thailand 2000 33.2%Increased from a low of 25.8% in 1998.
50% by year 2016
Viet Nam 2002 36.1%Increased from a low of 28% in the mid 1990’s.
39% by 2005 and 44% by 2010
Yunnan 2003 50.0%Substantial improvement from a low of 28% in 1960.
48% by 2005
Source: Findings of the SEF-II Project
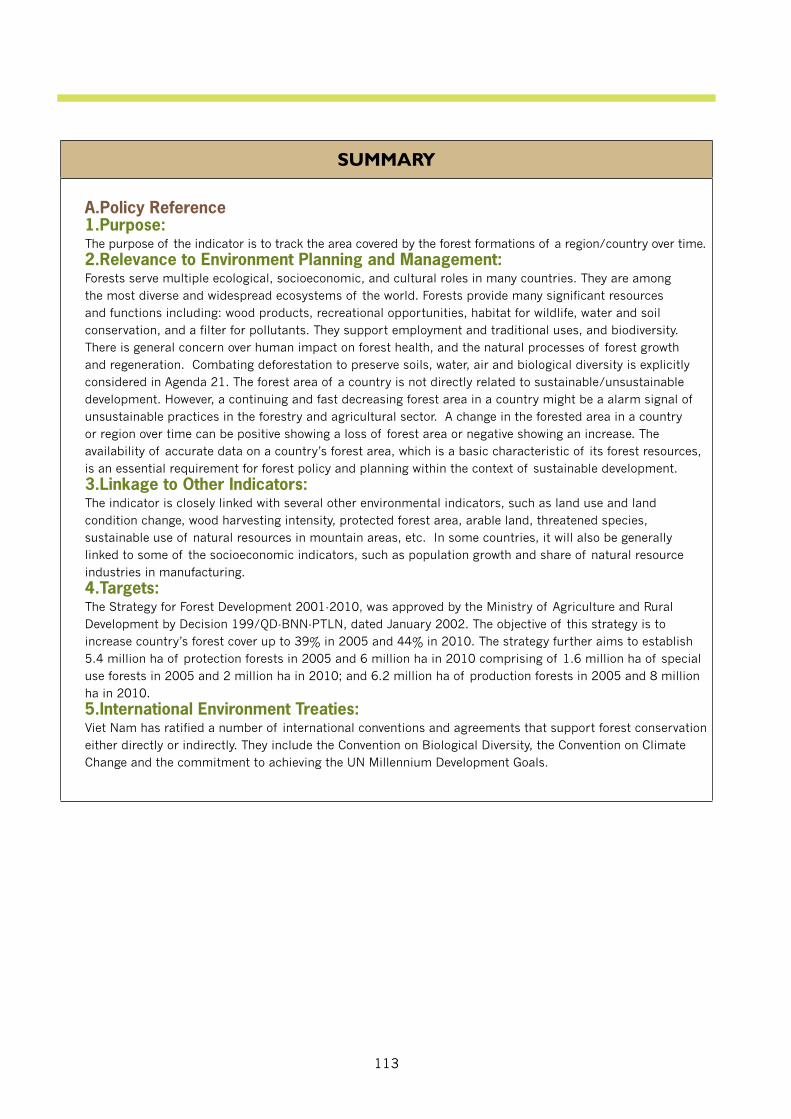
113
SUMMARY
A.Policy Reference1.Purpose: The purpose of the indicator is to track the area covered by the forest formations of a region/country over time.2.Relevance to Environment Planning and Management: Forests serve multiple ecological, socioeconomic, and cultural roles in many countries. They are among the most diverse and widespread ecosystems of the world. Forests provide many significant resources and functions including: wood products, recreational opportunities, habitat for wildlife, water and soil conservation, and a filter for pollutants. They support employment and traditional uses, and biodiversity. There is general concern over human impact on forest health, and the natural processes of forest growth and regeneration. Combating deforestation to preserve soils, water, air and biological diversity is explicitly considered in Agenda 21. The forest area of a country is not directly related to sustainable/unsustainable development. However, a continuing and fast decreasing forest area in a country might be a alarm signal of unsustainable practices in the forestry and agricultural sector. A change in the forested area in a country or region over time can be positive showing a loss of forest area or negative showing an increase. The availability of accurate data on a country’s forest area, which is a basic characteristic of its forest resources, is an essential requirement for forest policy and planning within the context of sustainable development.3.Linkage to Other Indicators:The indicator is closely linked with several other environmental indicators, such as land use and land condition change, wood harvesting intensity, protected forest area, arable land, threatened species, sustainable use of natural resources in mountain areas, etc. In some countries, it will also be generally linked to some of the socioeconomic indicators, such as population growth and share of natural resource industries in manufacturing.4.Targets: The Strategy for Forest Development 2001-2010, was approved by the Ministry of Agriculture and Rural Development by Decision 199/QD-BNN-PTLN, dated January 2002. The objective of this strategy is to increase country’s forest cover up to 39% in 2005 and 44% in 2010. The strategy further aims to establish 5.4 million ha of protection forests in 2005 and 6 million ha in 2010 comprising of 1.6 million ha of special use forests in 2005 and 2 million ha in 2010; and 6.2 million ha of production forests in 2005 and 8 million ha in 2010.5.International Environment Treaties: Viet Nam has ratified a number of international conventions and agreements that support forest conservation either directly or indirectly. They include the Convention on Biological Diversity, the Convention on Climate Change and the commitment to achieving the UN Millennium Development Goals.
114
SUMMARY
B.AnalysisAs can be observed from Figure 1 and Table 1, forest cover in Viet Nam has steadily declined from an estimated 43% of total land area in 1942/43 to a low of 9,175,000 hectares or 27.8% of total land area in 1990. The decreasing trend was subdued in the 1990’s although percent forest cover increased only slightly during the decade. Since year 2000 there is a noticeable positive and upward trend in the percentage forest cover. As of year 2003, this represents approximately 36.1% of the total land area or an 8.3% increase over what is was in year 1990. Natural forest area follows more or less the same growth patterns as that of total forest area. Plantation forest area on the other hand has increased from 92,000 hectares in 1976 to 2,090,000 hectares in 2003. As of 2003, plantation forests account for approximately 17.3% of the total forest area or approximately 6.3% of the total land area. Since year 2000, percent forest cover has increased from 33.2% to 36.1%, or approximately 1% per year. If this rate of increased can be maintained, the 2005 (39%) and 2010 (44%) targets will no doubt be achieved. Table 3 attempts to compare the current forest cover of Viet Nam with that of other GMS countries. As can be observed, Cambodia’s percentage forest cover is the highest amongst all GMS countries, followed by Myanmar and Yunnan province and Viet Nam is second lowest of the GMS countries in terms of existing forest cover. This comparison with other GMS countries however may not be appropriate for the purpose of rating the indicator results. Different countries aim for different percentage forest cover, normally based on the topographic characteristics of the country and no country is aiming for 100% forest cover. Based on this recent success and observed historical trends, it is concluded that the state of forest resources in Viet Nam is on average with stated targets with an improving trend over the past decade.
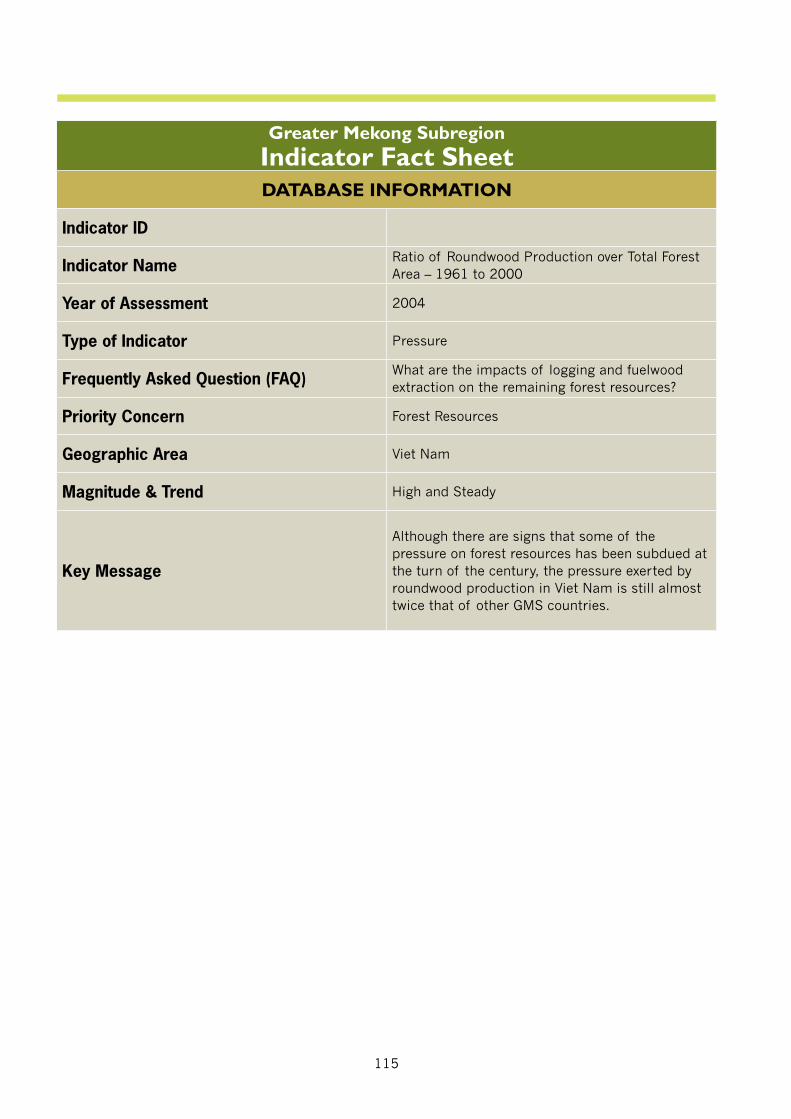
115
Greater Mekong SubregionIndicator Fact SheetDATABASE INFORMATION
Indicator ID
Indicator Name Ratio of Roundwood Production over Total Forest Area – 1961 to 2000
Year of Assessment 2004
Type of Indicator Pressure
Frequently Asked Question (FAQ) What are the impacts of logging and fuelwood extraction on the remaining forest resources?
Priority Concern Forest Resources
Geographic Area Viet Nam
Magnitude & Trend High and Steady
Key Message
Although there are signs that some of the pressure on forest resources has been subdued at the turn of the century, the pressure exerted by roundwood production in Viet Nam is still almost twice that of other GMS countries.
116
TECHNICAL INFORMATION
A.Defi nitionThis indicator is expressed as the ratio of total annual roundwood production, in cubic meters, over the total forest area in thousands of hectares. The indicator represents the total forest fellings per 1000 hectares of forested land.Although utilized here as a pressure indicator for forest resources in Viet Nam, the indicator and the fact sheet were originally developed as a GMS-wide indicator.
Roundwood production refers to all wood in the rough, whether destined for industrial or fuelwood uses. All wood felled or harvested from forests and trees outside the forest, with or without bark, round, split, roughly squared, or in other forms such as roots and stumps, is included. Wood that is harvested for charcoal production is also included. All wood production data refer to both coniferous and non-coniferous species.
Total forest area includes both natural forests and plantations. Total forest is defined as land with tree crown cover of more than 10 percent of the ground and area of more than 0.5 hectares. Tree height at maturity should exceed 5 meters.
B.Data SourceThe data utilized for this indicator originate from the Food and Agriculture Organization of the United Nations (FAO). The data for both roundwood production and land use were downloaded from the FAOSTAT database in December, 2004.Land cover statistics are based mainly on FAO estimates and may differ in recent years with more up-to-date information available from national inventories. Forest production statistics are based primarily on forest inventory information provided by national governments. In the case of the tropical region, inventory information is supplemented by a remote sensing survey. If only limited or out-dated inventory data are available, combination of linear projections and expert opinion techniques were applied to fill in data gaps.
C.Geographic Area / Population CoverageForest production statistics represent annual totals for the GMS country as a whole; figures for PRC are also for the country as a whole and not only for Yunnan province.
D.Temporal CoverageAt the time of download, forest production statistics were available for period 1961 to 2003; 2003 figures were highlighted as provisional. In the Land Use component of FAOSTAT, figures for forest and woodland are only available for the period 1961 to 1994. Year 2000 figures originate from the FAO Forest Resource Assessment. Estimates for the period 1995 to 1999 have been interpolated based on year 1994 and year 2000 estimates.
E.Methodology and Frequency of CoverageEstimates of roundwood production by individual countries are continuously being updated by FAO as an ongoing activity. The provisional figures for 2003 may change over time as new information is provided. It appears estimates for forest and woodland area will no longer be provided by FAOSTAT after 1994. The Forest Resource Assessment program may continue to provide estimate of forest area to 2010. Otherwise national figures can be substituted.
117
QUALITATIVE INFORMATION
A.Strength and Weakness (data level)In countries dominated by natural forest areas, the relative value of the indicator is indicative of the pressure of the logging industry on the remaining forest resources. It may be less indicative of this pressure if the country has a high proportion of plantation forest, as may be the case for PRC and Thailand.The indicator is not sensitive to and does not provide for forests under strict protection from logging operations. It nevertheless should be reduced to zero if all of the remaining forest becomes protected from all logging operations.
B.Reliability, Accuracy, Robustness, Uncertainty (data level)Most of the past figures for forest cover are based on FAO estimates; some countries may have better estimates in recent years based on satellite interpretation. Except for Cambodia and some of the most recent estimates, FAO statistics are largely based on annual production figures provided by individual countries. Using FAO as the source will ensure compatibility across different countries and can significantly reduce the workload in re-compiling the indicator for future years.
C.Future Work Required (for data level and indicator level)If this indicator is to be utilized by GMS countries to assess future performance, more accurate figures for forest cover should be substituted based on recent and future inventories. FAO will likely continue to be a good source for consistent and reliable estimates on annual roundwood production.The indicator could perhaps be improved by subtracting the area of forest under strict protection from logging operations.It may become necessary to subtract the fuelwood production from the overall roundwood production to derive a similar indicator which is targeted at the impact of commercial timber operations and independent of fuelwood production for which a separate per capita indicator has already been developed.
TECHNICAL INFORMATION
F.Methodology of Data ManipulationTo fill in the gap in land cover statistics between 1995 and 1999, year 1994 figures were interpolated to reach year 2000 figures using simple linear interpolation. The final annual indicator value was computed by dividing the total roundwood production, in cubic meters, by the total forest area of the corresponding year, in thousands of hectares. The result is therefore expressed in cubic meters per 1000 hectares of remaining forest area.
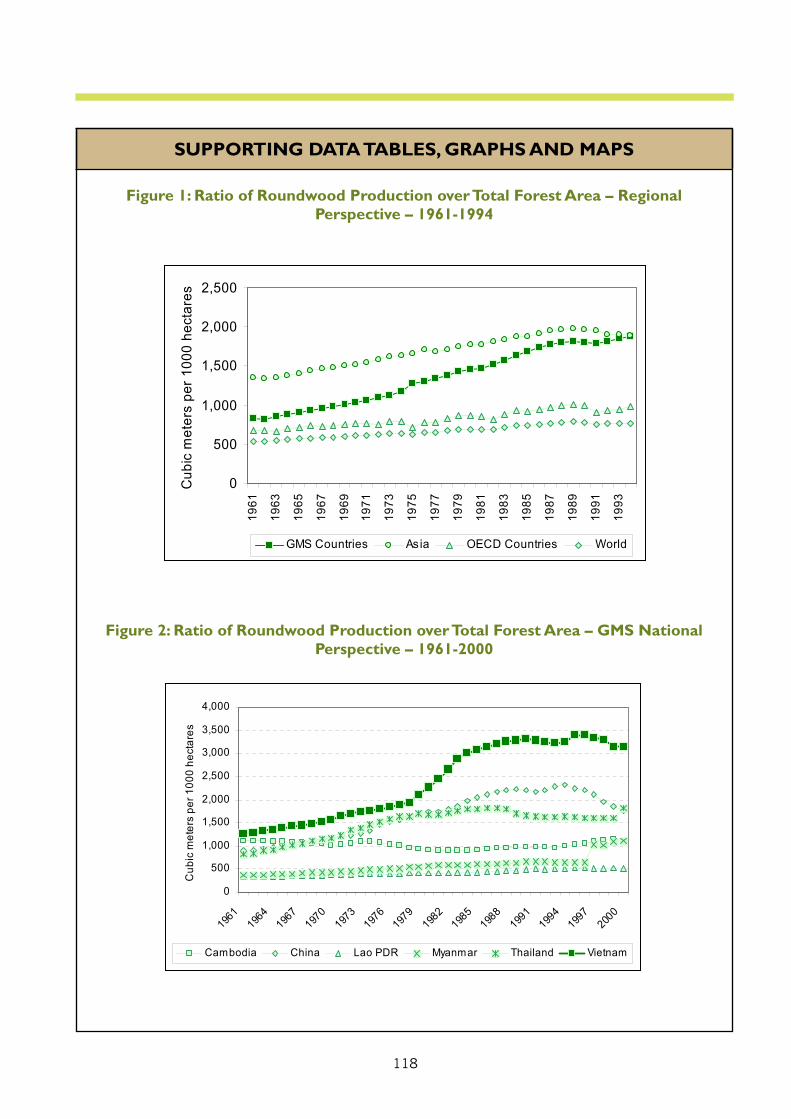
118
SUPPORTING DATA TABLES, GRAPHS AND MAPS
Figure 1: Ratio of Roundwood Production over Total Forest Area – Regional Perspective – 1961-1994
Figure 2: Ratio of Roundwood Production over Total Forest Area – GMS National Perspective – 1961-2000
0
500
1,000
1,500
2,000
2,500
1961
1963
1965
1967
1969
1971
1973
1975
1977
1979
1981
1983
1985
1987
1989
1991
1993
Cub
icm
eter
spe
r10
00he
ctar
es
GMS Countries Asia OECD Countries World
0
500
1,000
1,500
2,000
2,500
3,000
3,500
4,000
1961
1964
1967
1970
1973
1976
1979
1982
1985
1988
1991
1994
1997
2000
Cub
ic m
eter
s pe
r 100
0 he
ctar
es
Cambodia China Lao PDR Myanmar Thailand Vietnam
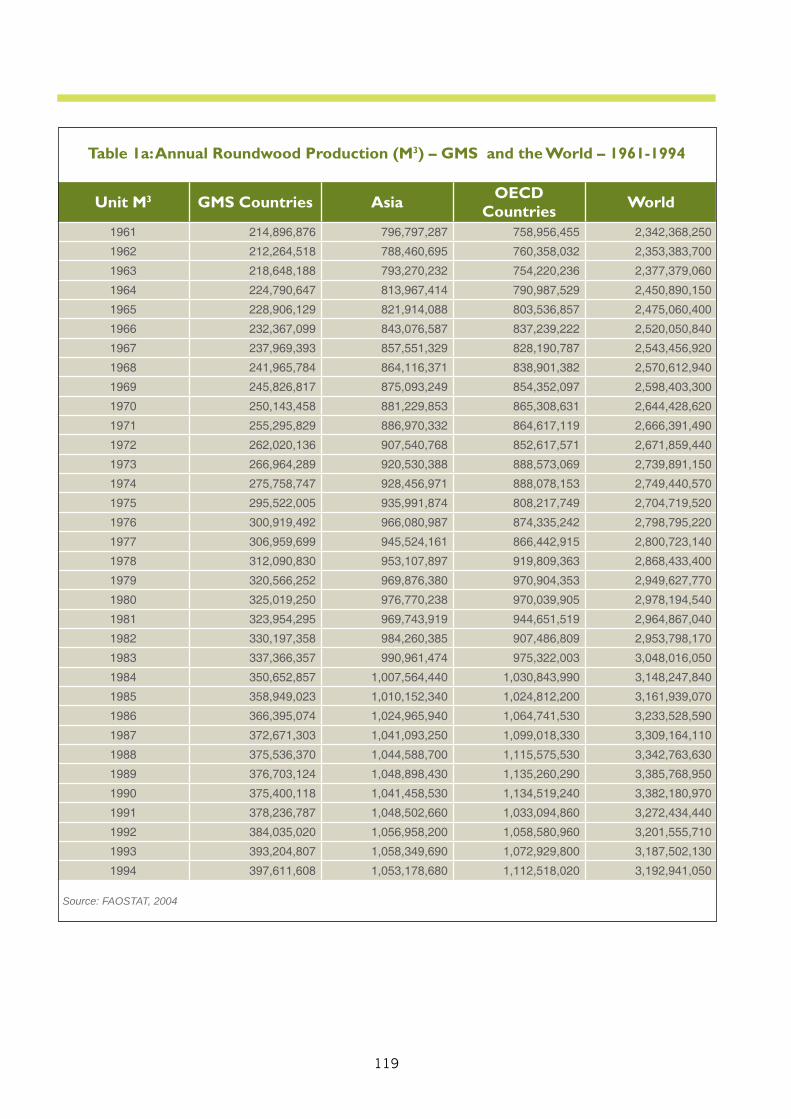
119
Table 1a: Annual Roundwood Production (M3) – GMS and the World – 1961-1994
Unit M3 GMS Countries Asia OECD Countries World
1961 214,896,876 796,797,287 758,956,455 2,342,368,250
1962 212,264,518 788,460,695 760,358,032 2,353,383,700
1963 218,648,188 793,270,232 754,220,236 2,377,379,060
1964 224,790,647 813,967,414 790,987,529 2,450,890,150
1965 228,906,129 821,914,088 803,536,857 2,475,060,400
1966 232,367,099 843,076,587 837,239,222 2,520,050,840
1967 237,969,393 857,551,329 828,190,787 2,543,456,920
1968 241,965,784 864,116,371 838,901,382 2,570,612,940
1969 245,826,817 875,093,249 854,352,097 2,598,403,300
1970 250,143,458 881,229,853 865,308,631 2,644,428,620
1971 255,295,829 886,970,332 864,617,119 2,666,391,490
1972 262,020,136 907,540,768 852,617,571 2,671,859,440
1973 266,964,289 920,530,388 888,573,069 2,739,891,150
1974 275,758,747 928,456,971 888,078,153 2,749,440,570
1975 295,522,005 935,991,874 808,217,749 2,704,719,520
1976 300,919,492 966,080,987 874,335,242 2,798,795,220
1977 306,959,699 945,524,161 866,442,915 2,800,723,140
1978 312,090,830 953,107,897 919,809,363 2,868,433,400
1979 320,566,252 969,876,380 970,904,353 2,949,627,770
1980 325,019,250 976,770,238 970,039,905 2,978,194,540
1981 323,954,295 969,743,919 944,651,519 2,964,867,040
1982 330,197,358 984,260,385 907,486,809 2,953,798,170
1983 337,366,357 990,961,474 975,322,003 3,048,016,050
1984 350,652,857 1,007,564,440 1,030,843,990 3,148,247,840
1985 358,949,023 1,010,152,340 1,024,812,200 3,161,939,070
1986 366,395,074 1,024,965,940 1,064,741,530 3,233,528,590
1987 372,671,303 1,041,093,250 1,099,018,330 3,309,164,110
1988 375,536,370 1,044,588,700 1,115,575,530 3,342,763,630
1989 376,703,124 1,048,898,430 1,135,260,290 3,385,768,950
1990 375,400,118 1,041,458,530 1,134,519,240 3,382,180,970
1991 378,236,787 1,048,502,660 1,033,094,860 3,272,434,440
1992 384,035,020 1,056,958,200 1,058,580,960 3,201,555,710
1993 393,204,807 1,058,349,690 1,072,929,800 3,187,502,130
1994 397,611,608 1,053,178,680 1,112,518,020 3,192,941,050
Source: FAOSTAT, 2004
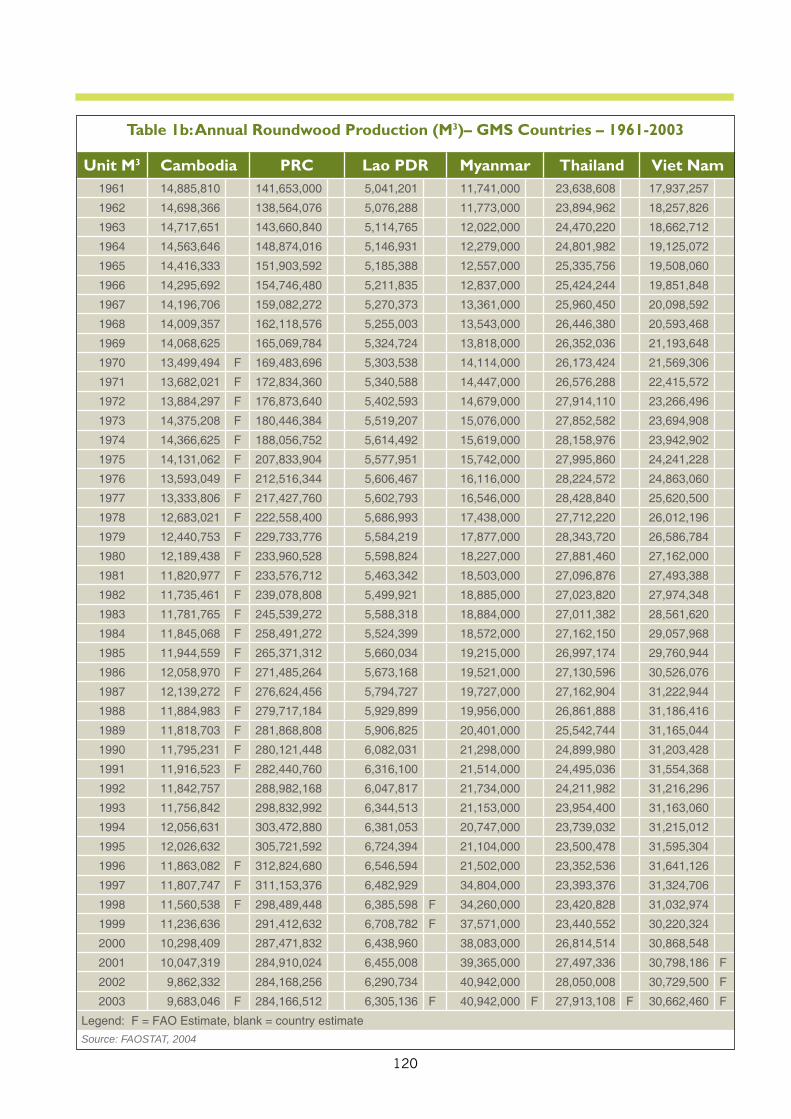
120
Table 1b: Annual Roundwood Production (M3)– GMS Countries – 1961-2003
Unit M3 Cambodia PRC Lao PDR Myanmar Thailand Viet Nam1961 14,885,810 141,653,000 5,041,201 11,741,000 23,638,608 17,937,257
1962 14,698,366 138,564,076 5,076,288 11,773,000 23,894,962 18,257,826
1963 14,717,651 143,660,840 5,114,765 12,022,000 24,470,220 18,662,712
1964 14,563,646 148,874,016 5,146,931 12,279,000 24,801,982 19,125,072
1965 14,416,333 151,903,592 5,185,388 12,557,000 25,335,756 19,508,060
1966 14,295,692 154,746,480 5,211,835 12,837,000 25,424,244 19,851,848
1967 14,196,706 159,082,272 5,270,373 13,361,000 25,960,450 20,098,592
1968 14,009,357 162,118,576 5,255,003 13,543,000 26,446,380 20,593,468
1969 14,068,625 165,069,784 5,324,724 13,818,000 26,352,036 21,193,648
1970 13,499,494 F 169,483,696 5,303,538 14,114,000 26,173,424 21,569,306
1971 13,682,021 F 172,834,360 5,340,588 14,447,000 26,576,288 22,415,572
1972 13,884,297 F 176,873,640 5,402,593 14,679,000 27,914,110 23,266,496
1973 14,375,208 F 180,446,384 5,519,207 15,076,000 27,852,582 23,694,908
1974 14,366,625 F 188,056,752 5,614,492 15,619,000 28,158,976 23,942,902
1975 14,131,062 F 207,833,904 5,577,951 15,742,000 27,995,860 24,241,228
1976 13,593,049 F 212,516,344 5,606,467 16,116,000 28,224,572 24,863,060
1977 13,333,806 F 217,427,760 5,602,793 16,546,000 28,428,840 25,620,500
1978 12,683,021 F 222,558,400 5,686,993 17,438,000 27,712,220 26,012,196
1979 12,440,753 F 229,733,776 5,584,219 17,877,000 28,343,720 26,586,784
1980 12,189,438 F 233,960,528 5,598,824 18,227,000 27,881,460 27,162,000
1981 11,820,977 F 233,576,712 5,463,342 18,503,000 27,096,876 27,493,388
1982 11,735,461 F 239,078,808 5,499,921 18,885,000 27,023,820 27,974,348
1983 11,781,765 F 245,539,272 5,588,318 18,884,000 27,011,382 28,561,620
1984 11,845,068 F 258,491,272 5,524,399 18,572,000 27,162,150 29,057,968
1985 11,944,559 F 265,371,312 5,660,034 19,215,000 26,997,174 29,760,944
1986 12,058,970 F 271,485,264 5,673,168 19,521,000 27,130,596 30,526,076
1987 12,139,272 F 276,624,456 5,794,727 19,727,000 27,162,904 31,222,944
1988 11,884,983 F 279,717,184 5,929,899 19,956,000 26,861,888 31,186,416
1989 11,818,703 F 281,868,808 5,906,825 20,401,000 25,542,744 31,165,044
1990 11,795,231 F 280,121,448 6,082,031 21,298,000 24,899,980 31,203,428
1991 11,916,523 F 282,440,760 6,316,100 21,514,000 24,495,036 31,554,368
1992 11,842,757 288,982,168 6,047,817 21,734,000 24,211,982 31,216,296
1993 11,756,842 298,832,992 6,344,513 21,153,000 23,954,400 31,163,060
1994 12,056,631 303,472,880 6,381,053 20,747,000 23,739,032 31,215,012
1995 12,026,632 305,721,592 6,724,394 21,104,000 23,500,478 31,595,304
1996 11,863,082 F 312,824,680 6,546,594 21,502,000 23,352,536 31,641,126
1997 11,807,747 F 311,153,376 6,482,929 34,804,000 23,393,376 31,324,706
1998 11,560,538 F 298,489,448 6,385,598 F 34,260,000 23,420,828 31,032,974
1999 11,236,636 291,412,632 6,708,782 F 37,571,000 23,440,552 30,220,324
2000 10,298,409 287,471,832 6,438,960 38,083,000 26,814,514 30,868,548
2001 10,047,319 284,910,024 6,455,008 39,365,000 27,497,336 30,798,186 F
2002 9,862,332 284,168,256 6,290,734 40,942,000 28,050,008 30,729,500 F
2003 9,683,046 F 284,166,512 6,305,136 F 40,942,000 F 27,913,108 F 30,662,460 F
Legend: F = FAO Estimate, blank = country estimate
Source: FAOSTAT, 2004
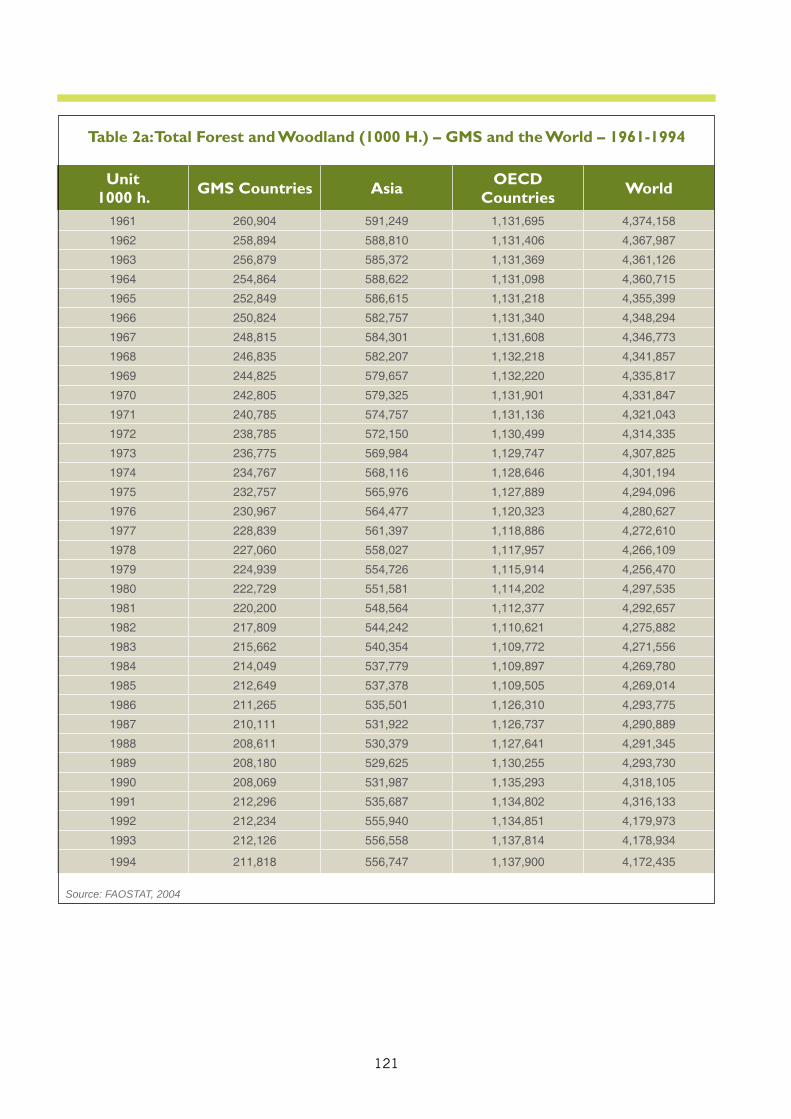
121
Table 2a: Total Forest and Woodland (1000 H.) – GMS and the World – 1961-1994
Unit1000 h. GMS Countries Asia OECD
Countries World
1961 260,904 591,249 1,131,695 4,374,158
1962 258,894 588,810 1,131,406 4,367,987
1963 256,879 585,372 1,131,369 4,361,126
1964 254,864 588,622 1,131,098 4,360,715
1965 252,849 586,615 1,131,218 4,355,399
1966 250,824 582,757 1,131,340 4,348,294
1967 248,815 584,301 1,131,608 4,346,773
1968 246,835 582,207 1,132,218 4,341,857
1969 244,825 579,657 1,132,220 4,335,817
1970 242,805 579,325 1,131,901 4,331,847
1971 240,785 574,757 1,131,136 4,321,043
1972 238,785 572,150 1,130,499 4,314,335
1973 236,775 569,984 1,129,747 4,307,825
1974 234,767 568,116 1,128,646 4,301,194
1975 232,757 565,976 1,127,889 4,294,096
1976 230,967 564,477 1,120,323 4,280,627
1977 228,839 561,397 1,118,886 4,272,610
1978 227,060 558,027 1,117,957 4,266,109
1979 224,939 554,726 1,115,914 4,256,470
1980 222,729 551,581 1,114,202 4,297,535
1981 220,200 548,564 1,112,377 4,292,657
1982 217,809 544,242 1,110,621 4,275,882
1983 215,662 540,354 1,109,772 4,271,556
1984 214,049 537,779 1,109,897 4,269,780
1985 212,649 537,378 1,109,505 4,269,014
1986 211,265 535,501 1,126,310 4,293,775
1987 210,111 531,922 1,126,737 4,290,889
1988 208,611 530,379 1,127,641 4,291,345
1989 208,180 529,625 1,130,255 4,293,730
1990 208,069 531,987 1,135,293 4,318,105
1991 212,296 535,687 1,134,802 4,316,133
1992 212,234 555,940 1,134,851 4,179,973
1993 212,126 556,558 1,137,814 4,178,934
1994 211,818 556,747 1,137,900 4,172,435
Source: FAOSTAT, 2004
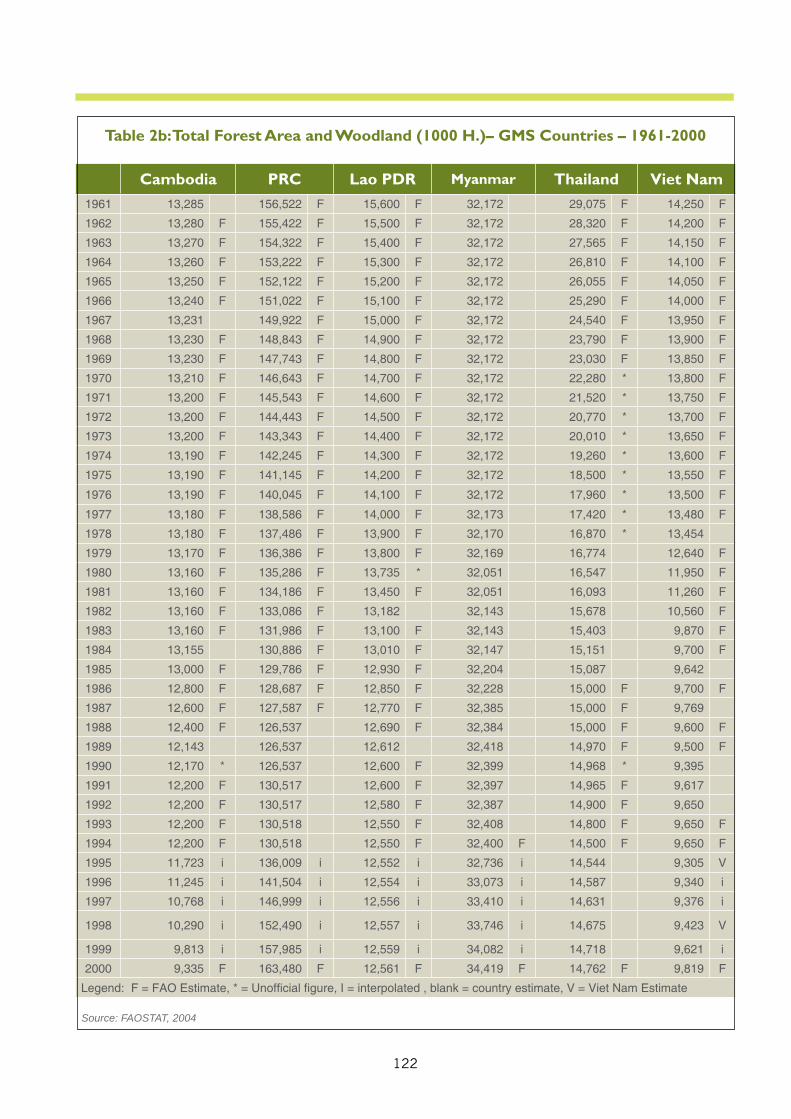
122
Table 2b: Total Forest Area and Woodland (1000 H.)– GMS Countries – 1961-2000
Cambodia PRC Lao PDR Myanmar Thailand Viet Nam1961 13,285 156,522 F 15,600 F 32,172 29,075 F 14,250 F
1962 13,280 F 155,422 F 15,500 F 32,172 28,320 F 14,200 F
1963 13,270 F 154,322 F 15,400 F 32,172 27,565 F 14,150 F
1964 13,260 F 153,222 F 15,300 F 32,172 26,810 F 14,100 F
1965 13,250 F 152,122 F 15,200 F 32,172 26,055 F 14,050 F
1966 13,240 F 151,022 F 15,100 F 32,172 25,290 F 14,000 F
1967 13,231 149,922 F 15,000 F 32,172 24,540 F 13,950 F
1968 13,230 F 148,843 F 14,900 F 32,172 23,790 F 13,900 F
1969 13,230 F 147,743 F 14,800 F 32,172 23,030 F 13,850 F
1970 13,210 F 146,643 F 14,700 F 32,172 22,280 * 13,800 F
1971 13,200 F 145,543 F 14,600 F 32,172 21,520 * 13,750 F
1972 13,200 F 144,443 F 14,500 F 32,172 20,770 * 13,700 F
1973 13,200 F 143,343 F 14,400 F 32,172 20,010 * 13,650 F
1974 13,190 F 142,245 F 14,300 F 32,172 19,260 * 13,600 F
1975 13,190 F 141,145 F 14,200 F 32,172 18,500 * 13,550 F
1976 13,190 F 140,045 F 14,100 F 32,172 17,960 * 13,500 F
1977 13,180 F 138,586 F 14,000 F 32,173 17,420 * 13,480 F
1978 13,180 F 137,486 F 13,900 F 32,170 16,870 * 13,454
1979 13,170 F 136,386 F 13,800 F 32,169 16,774 12,640 F
1980 13,160 F 135,286 F 13,735 * 32,051 16,547 11,950 F
1981 13,160 F 134,186 F 13,450 F 32,051 16,093 11,260 F
1982 13,160 F 133,086 F 13,182 32,143 15,678 10,560 F
1983 13,160 F 131,986 F 13,100 F 32,143 15,403 9,870 F
1984 13,155 130,886 F 13,010 F 32,147 15,151 9,700 F
1985 13,000 F 129,786 F 12,930 F 32,204 15,087 9,642
1986 12,800 F 128,687 F 12,850 F 32,228 15,000 F 9,700 F
1987 12,600 F 127,587 F 12,770 F 32,385 15,000 F 9,769
1988 12,400 F 126,537 12,690 F 32,384 15,000 F 9,600 F
1989 12,143 126,537 12,612 32,418 14,970 F 9,500 F
1990 12,170 * 126,537 12,600 F 32,399 14,968 * 9,395
1991 12,200 F 130,517 12,600 F 32,397 14,965 F 9,617
1992 12,200 F 130,517 12,580 F 32,387 14,900 F 9,650
1993 12,200 F 130,518 12,550 F 32,408 14,800 F 9,650 F
1994 12,200 F 130,518 12,550 F 32,400 F 14,500 F 9,650 F
1995 11,723 i 136,009 i 12,552 i 32,736 i 14,544 9,305 V
1996 11,245 i 141,504 i 12,554 i 33,073 i 14,587 9,340 i
1997 10,768 i 146,999 i 12,556 i 33,410 i 14,631 9,376 i
1998 10,290 i 152,490 i 12,557 i 33,746 i 14,675 9,423 V
1999 9,813 i 157,985 i 12,559 i 34,082 i 14,718 9,621 i
2000 9,335 F 163,480 F 12,561 F 34,419 F 14,762 F 9,819 F
Legend: F = FAO Estimate, * = Unoffi cial fi gure, I = interpolated , blank = country estimate, V = Viet Nam Estimate
Source: FAOSTAT, 2004
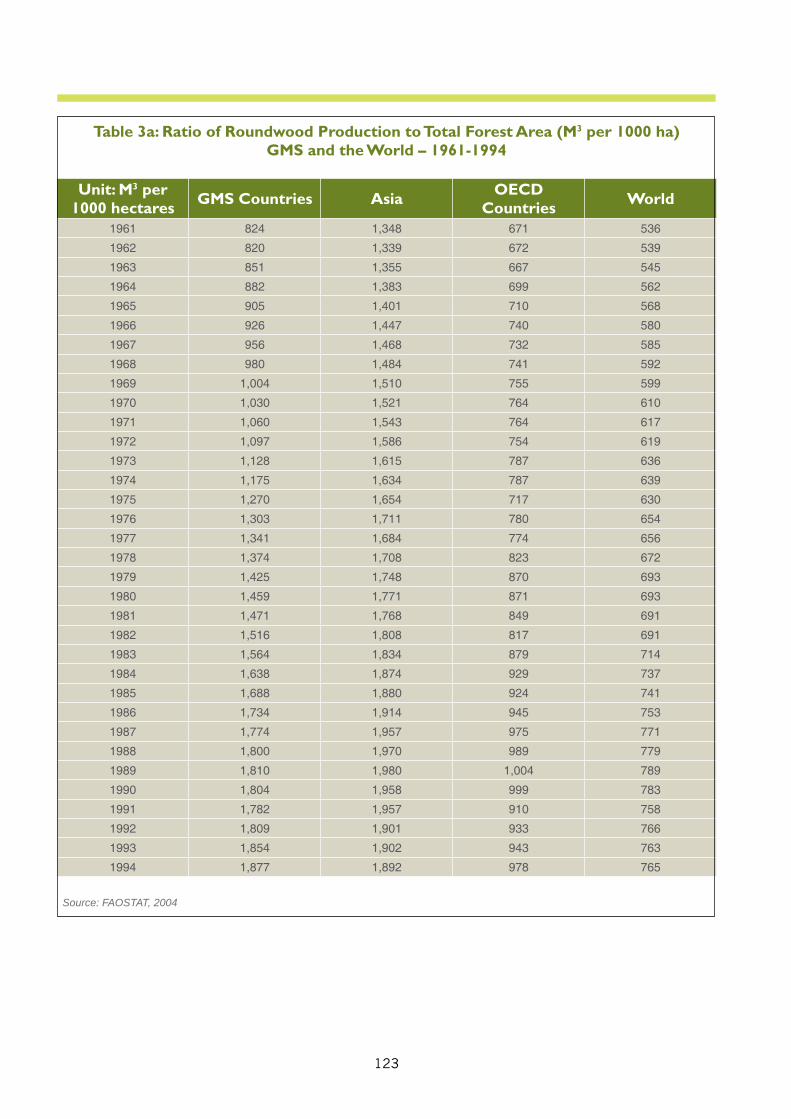
123
Table 3a: Ratio of Roundwood Production to Total Forest Area (M3 per 1000 ha)GMS and the World – 1961-1994
Unit: M3 per 1000 hectares GMS Countries Asia OECD
Countries World
1961 824 1,348 671 536
1962 820 1,339 672 539
1963 851 1,355 667 545
1964 882 1,383 699 562
1965 905 1,401 710 568
1966 926 1,447 740 580
1967 956 1,468 732 585
1968 980 1,484 741 592
1969 1,004 1,510 755 599
1970 1,030 1,521 764 610
1971 1,060 1,543 764 617
1972 1,097 1,586 754 619
1973 1,128 1,615 787 636
1974 1,175 1,634 787 639
1975 1,270 1,654 717 630
1976 1,303 1,711 780 654
1977 1,341 1,684 774 656
1978 1,374 1,708 823 672
1979 1,425 1,748 870 693
1980 1,459 1,771 871 693
1981 1,471 1,768 849 691
1982 1,516 1,808 817 691
1983 1,564 1,834 879 714
1984 1,638 1,874 929 737
1985 1,688 1,880 924 741
1986 1,734 1,914 945 753
1987 1,774 1,957 975 771
1988 1,800 1,970 989 779
1989 1,810 1,980 1,004 789
1990 1,804 1,958 999 783
1991 1,782 1,957 910 758
1992 1,809 1,901 933 766
1993 1,854 1,902 943 763
1994 1,877 1,892 978 765
Source: FAOSTAT, 2004
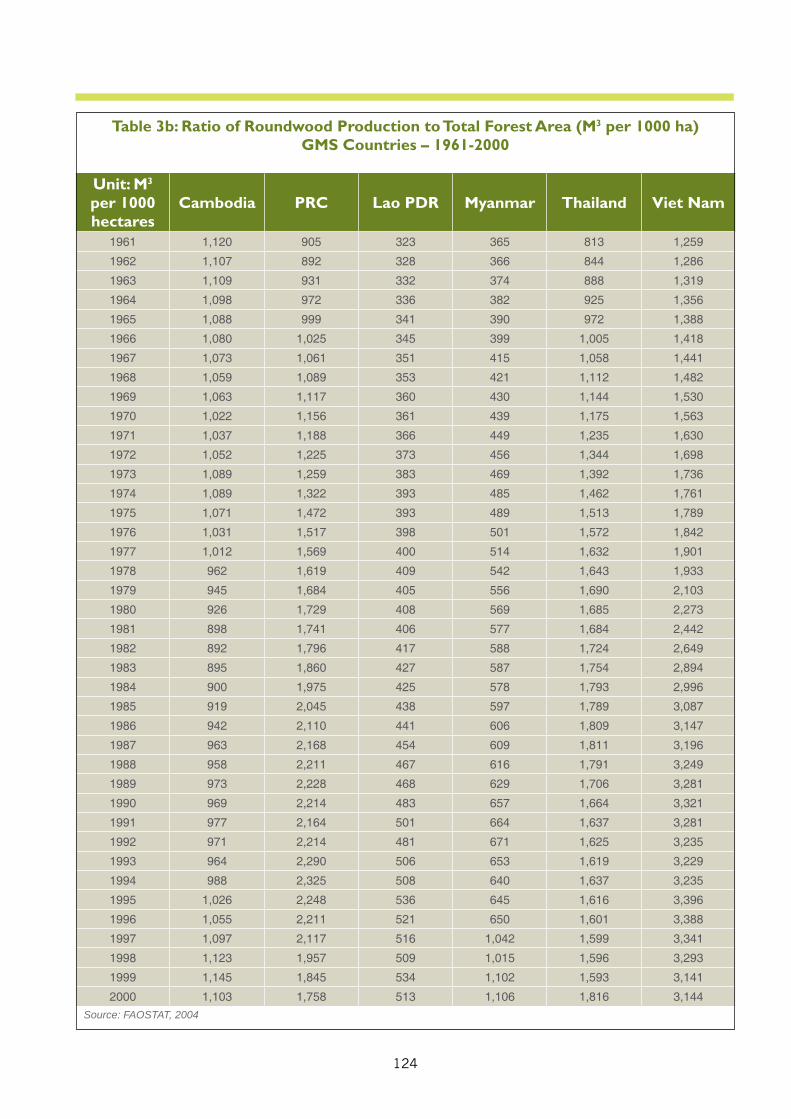
124
Table 3b: Ratio of Roundwood Production to Total Forest Area (M3 per 1000 ha)GMS Countries – 1961-2000
Unit: M3 per 1000 hectares
Cambodia PRC Lao PDR Myanmar Thailand Viet Nam
1961 1,120 905 323 365 813 1,259
1962 1,107 892 328 366 844 1,286
1963 1,109 931 332 374 888 1,319
1964 1,098 972 336 382 925 1,356
1965 1,088 999 341 390 972 1,388
1966 1,080 1,025 345 399 1,005 1,418
1967 1,073 1,061 351 415 1,058 1,441
1968 1,059 1,089 353 421 1,112 1,482
1969 1,063 1,117 360 430 1,144 1,530
1970 1,022 1,156 361 439 1,175 1,563
1971 1,037 1,188 366 449 1,235 1,630
1972 1,052 1,225 373 456 1,344 1,698
1973 1,089 1,259 383 469 1,392 1,736
1974 1,089 1,322 393 485 1,462 1,761
1975 1,071 1,472 393 489 1,513 1,789
1976 1,031 1,517 398 501 1,572 1,842
1977 1,012 1,569 400 514 1,632 1,901
1978 962 1,619 409 542 1,643 1,933
1979 945 1,684 405 556 1,690 2,103
1980 926 1,729 408 569 1,685 2,273
1981 898 1,741 406 577 1,684 2,442
1982 892 1,796 417 588 1,724 2,649
1983 895 1,860 427 587 1,754 2,894
1984 900 1,975 425 578 1,793 2,996
1985 919 2,045 438 597 1,789 3,087
1986 942 2,110 441 606 1,809 3,147
1987 963 2,168 454 609 1,811 3,196
1988 958 2,211 467 616 1,791 3,249
1989 973 2,228 468 629 1,706 3,281
1990 969 2,214 483 657 1,664 3,321
1991 977 2,164 501 664 1,637 3,281
1992 971 2,214 481 671 1,625 3,235
1993 964 2,290 506 653 1,619 3,229
1994 988 2,325 508 640 1,637 3,235
1995 1,026 2,248 536 645 1,616 3,396
1996 1,055 2,211 521 650 1,601 3,388
1997 1,097 2,117 516 1,042 1,599 3,341
1998 1,123 1,957 509 1,015 1,596 3,293
1999 1,145 1,845 534 1,102 1,593 3,141
2000 1,103 1,758 513 1,106 1,816 3,144
Source: FAOSTAT, 2004
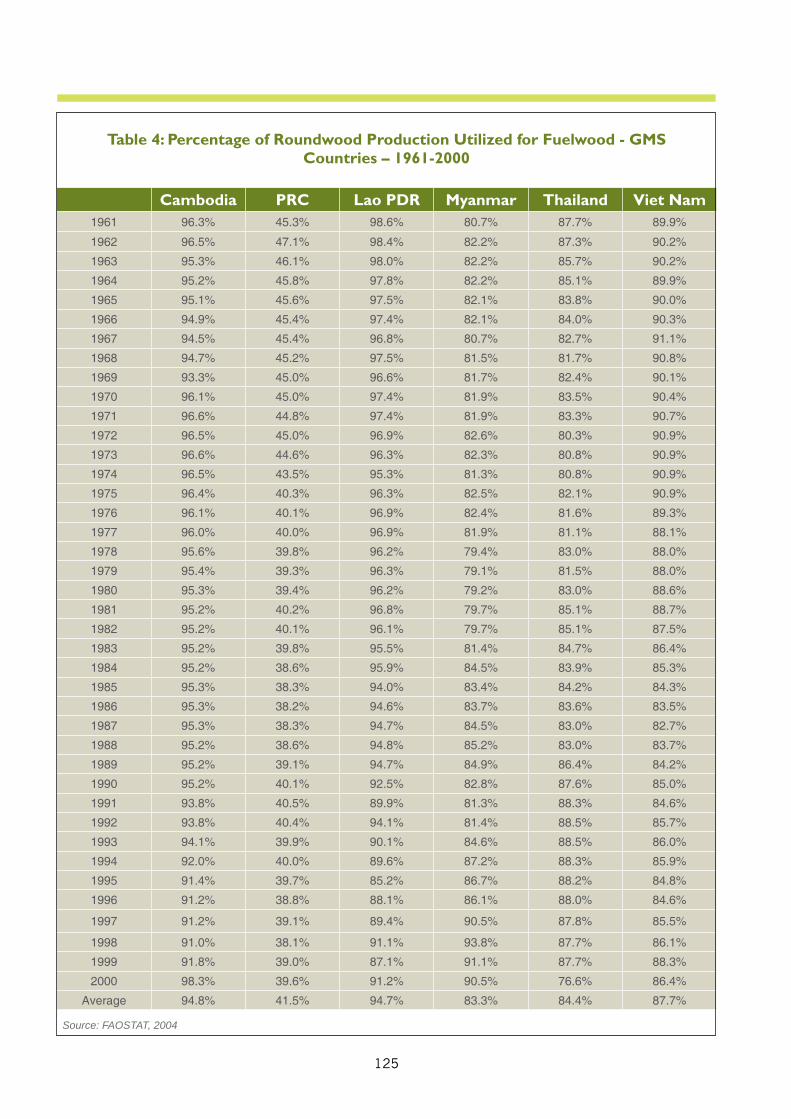
125
Table 4: Percentage of Roundwood Production Utilized for Fuelwood - GMS Countries – 1961-2000
Cambodia PRC Lao PDR Myanmar Thailand Viet Nam1961 96.3% 45.3% 98.6% 80.7% 87.7% 89.9%
1962 96.5% 47.1% 98.4% 82.2% 87.3% 90.2%
1963 95.3% 46.1% 98.0% 82.2% 85.7% 90.2%
1964 95.2% 45.8% 97.8% 82.2% 85.1% 89.9%
1965 95.1% 45.6% 97.5% 82.1% 83.8% 90.0%
1966 94.9% 45.4% 97.4% 82.1% 84.0% 90.3%
1967 94.5% 45.4% 96.8% 80.7% 82.7% 91.1%
1968 94.7% 45.2% 97.5% 81.5% 81.7% 90.8%
1969 93.3% 45.0% 96.6% 81.7% 82.4% 90.1%
1970 96.1% 45.0% 97.4% 81.9% 83.5% 90.4%
1971 96.6% 44.8% 97.4% 81.9% 83.3% 90.7%
1972 96.5% 45.0% 96.9% 82.6% 80.3% 90.9%
1973 96.6% 44.6% 96.3% 82.3% 80.8% 90.9%
1974 96.5% 43.5% 95.3% 81.3% 80.8% 90.9%
1975 96.4% 40.3% 96.3% 82.5% 82.1% 90.9%
1976 96.1% 40.1% 96.9% 82.4% 81.6% 89.3%
1977 96.0% 40.0% 96.9% 81.9% 81.1% 88.1%
1978 95.6% 39.8% 96.2% 79.4% 83.0% 88.0%
1979 95.4% 39.3% 96.3% 79.1% 81.5% 88.0%
1980 95.3% 39.4% 96.2% 79.2% 83.0% 88.6%
1981 95.2% 40.2% 96.8% 79.7% 85.1% 88.7%
1982 95.2% 40.1% 96.1% 79.7% 85.1% 87.5%
1983 95.2% 39.8% 95.5% 81.4% 84.7% 86.4%
1984 95.2% 38.6% 95.9% 84.5% 83.9% 85.3%
1985 95.3% 38.3% 94.0% 83.4% 84.2% 84.3%
1986 95.3% 38.2% 94.6% 83.7% 83.6% 83.5%
1987 95.3% 38.3% 94.7% 84.5% 83.0% 82.7%
1988 95.2% 38.6% 94.8% 85.2% 83.0% 83.7%
1989 95.2% 39.1% 94.7% 84.9% 86.4% 84.2%
1990 95.2% 40.1% 92.5% 82.8% 87.6% 85.0%
1991 93.8% 40.5% 89.9% 81.3% 88.3% 84.6%
1992 93.8% 40.4% 94.1% 81.4% 88.5% 85.7%
1993 94.1% 39.9% 90.1% 84.6% 88.5% 86.0%
1994 92.0% 40.0% 89.6% 87.2% 88.3% 85.9%
1995 91.4% 39.7% 85.2% 86.7% 88.2% 84.8%
1996 91.2% 38.8% 88.1% 86.1% 88.0% 84.6%
1997 91.2% 39.1% 89.4% 90.5% 87.8% 85.5%
1998 91.0% 38.1% 91.1% 93.8% 87.7% 86.1%
1999 91.8% 39.0% 87.1% 91.1% 87.7% 88.3%
2000 98.3% 39.6% 91.2% 90.5% 76.6% 86.4%
Average 94.8% 41.5% 94.7% 83.3% 84.4% 87.7%
Source: FAOSTAT, 2004
126
SUMMARY
A.Policy Reference1.Purpose: The purpose of this indicator is to measure the relative pressure of logging and fuelwood operations on the forest as a whole, regardless of protection status. It compares the total forest fellings as a ratio to the total remaining forest area.The United Nations have proposed a wood harvesting intensity indicator with a similar enumerator but with a much different denominator. The UN indicator proposes to make use of total annual productive forest increment as the denominator, hence comparing the total forest fellings as a percentage of net annual increment. The UN however admits that such denominator does not yet exist for most tropical natural forests and that more work is needed to develop such enumerator. Hence the substitution of total forest area for the development of this indicator.
2.Relevance to Environment Planning and Management: Unlike the proposed UN indicator which aims at assessing whether forests are being used within the limits of their actual productivity, this indicator is aimed at to measure the rate at which intensive logging and woodcutting activities destroy the overall forest cover. Maintaining or increasing the percentage forest cover is a high priority in most GMS countries; hence the appropriateness of this indicator which utilizes total forest area as the denominator.
3.Linkage to Other Indicators:This indicator is closely related to a separate indicator which measures the per capita fuelwood production in GMS countries. This indicator is based on total roundwood production and includes fuelwood and wood use for charcoal production along with wood used for commercial timber. Except for PRC (see Table 4), the majority of roundwood production in GMS countries is utilized for fuelwood and commercial timber operations have less of an impact on the overall forest resources.Fuelwood production in the related indicator is based on per capita production and not as a ratio to total forest area. During performance assessment, the two indicators can be used independently remembering that in some GMS countries it is the fuelwood production that has the highest impact on forest resources.
4.Targets: There are likely targets established for roundwood production in most GMS countries, based on principles of sustainable yield. There are also targets set in most GMS countries for percentage forest cover. But in general one would not expect a target to be set based on the value of this particular indicator. The absolute value of the indicator is not what is relevant. It is the historical trend of the indicator and its value relative compared to other countries or regions which is of importance.
5.International Environment Treaties: Many international agreements cover forests. Countries are supported to maintain or increase their forested areas, and discouraged to strongly reduce their forestlands. Specific forest agreements would include the Non-Legally Binding Authoritative Statement of Principles for a Global Consensus on the Management, Conservation and Sustainable Development of All Types of Forests [the Forest Principles of the United Nations Conference on Environment and Development (UNCED)]; and the International Tropical Timber Agreement. Many other international agreements deal with forests within the context of natural resources and environment conservation, for example Convention on International trade in Endangered Species (CITES), Convention on the Conservation of Wetlands of International Importance (Ramsar Convention), Convention on Biological Diversity, Convention on Climate Change, Convention to Combat Desertification. In addition, regional/ecoregional agreements on sustainable forest management have been established.
B.AnalysisGlobal/Regional Perspective Annual roundwood production figures for all six GMS countries as a whole are presented in Table 1a along with other world figures. As can be observed from this table, annual production has been on the rise globally while the total forest area continues to decline (Table 2a).This is not always the case within GMS as can be observed from Tables 1b and 2b. In Cambodia the production figures have actually declined and in Thailand they have remained relatively constant over the 40-year reporting period. And in PRC and Myanmar, the total forest cover area has increased during the same period.What is more important to observe is the ratio between the two
127
figures as a relative indicator of the rate of forest depletion. These results are presented in Tables 3a for the world and the GMS countries as a whole and in Table 3b for individual GMS countries. These results are expressed as the ration of roundwood production divided by the total remaining forest area, the cubic meters per 1000 ha of forest area. As can be observed from Figures 1 and 2, the range of this indicator within GMS countries and the world is somewhere between zero and 3500 m3/1000 ha. Global averages (Figure 1) for the last 34 years are somewhere between 500 and 765 m3/1000 ha. OECD countries as a whole are slightly above this global average but have remained under 1000 m3/1000 ha over the last 34 years. The indicator for Asia as a whole is almost twice that of OECD countries with a comparable rate of increase over the 34-year period. The rate of increase is more pronounced in GMS countries and the indicator value is now comparable to that of Asia as a whole.
GMS National PerspectiveFigure 2 presents the indicator results for individual GMS countries. Note that the scale at the left has now increased to 3500 m3/1000 ha and that the period of record has been extended to 2000.
Cambodia the ratio of roundwood production over total forest area has remained relatively constant while both the rate of production and the total forest area have declined. The average value of the indicator is around 1000 m3/1000 ha and this ratio is now very close to that of OECD countries as a whole. If the indicator is indicative of sustainable forestry, it could be said that Cambodia’s roundwood production is well synchronized with its existing forest resources.
PRC has started on the same footstep as all GMS countries as a whole, the indicator ratio has peaked in 1994 to a rate of 2325 m3/1000 ha but has since declined to a ratio which is representative of a six GMS countries as a whole. PRC has a relatively high proportion of plantation forests; the peak period may be the result of harvesting these plantation forests. In any case, the pattern of the indicator value change is not much different from the GMS countries as a whole. These represent the indicator values for PRC as a whole; the results of the indicator values could be totally different if only Yunnan province was considered.
Lao PDR indicator values are at the bottom of the scale, starting on the same footstep as Myanmar and ending near the 500 m3/1000 ha mark. The Laos production figures have not increased significantly over the past 40 years but neither has the decline in total forest area. It appears things are in balance in Lao PDR, on a smaller scale, as far as depletion of forest resource are concerned. If the indicator is indicative of an existing forest reserve surplus, then Myanmar may well have benefited from such. The annual production rate in Myanmar has increased almost four-fold since 1961 yet throughout this production they have managed to increase their total forest area. According to the data obtained, there was a sharp increase in the production figures between 1996 and 1997 (see Table 1b) resulting in a sudden jump of the indicator from the low Laos levels to the moderate levels of Cambodia and OECD countries. This same jump is evident in the fuelwood production estimates (see separate fact sheet on Per Capita Fuelwood Production); it may be the result of new methods to estimate fuelwood production.
Thailand is another one of those GMS countries with a long history of forest re-plantation and a relatively high proportion (almost one third) of plantation forest. The elevated value of the indicator over the 1500 m3/1000 ha mark may be substantiated by these plantation forests. But while the production figures have remained quite stable over time (see Table 1b), Thailand has lost nearly half its total forest area over the 40-year period of the indicator. The sustained production, it appears, has been at the cost of total forest destruction.While starting on a footstep only slightly above those of other GMS countries, the indicator value for Viet Nam is way above the normal value for other GMS countries and for Asia and the world as a whole. The observed peak value in 1994 of almost 3400 m3/1000 ha has no observed equivalent in any of the data analyzed and it surpasses any peak rate set by Indonesia (1942 m3/1000 ha in 1961) or Brazil (376 m3/1000 ha) where forest over-exploitation is known to have occurred. Hence if this indicator is indicative of forest resource over-exploitation, then Viet Nam may have suffered an era of such during the 1980’s and may well be suffering from the same as it enters the next millennium. According to the FAO figures, annual production has peaked in 1996 after a constant rise from 1961 figures while the total forest area has seen a steady decline. There are signs of recovery in the indicator value since 1996 but the overall indicator values remain above 3000 m3/1000 ha and well above the closing of all other GMS countries. Based on recent values of the indicator as compared to other GMS countries and the trend of the indicator over time, it is concluded that the pressure on the forest resources from roundwood production in Viet Nam remains high and steady.

128
Greater Mekong SubregionIndicator Fact SheetDATABASE INFORMATION
Indicator ID
Indicator Name Threatened Species as Percent of Globally Threatened Species – 1996 to 2004
Year of Assessment 2005
Type of Indicator State
Frequently Asked Question (FAQ) How seriously is wildlife biodiversity being depleted in Viet Nam?
Priority Concern Threats to Biodiversity
Geographic Area Viet Nam
State & Trend Relatively Poor with no Observable Trend
Key Message
As of the latest 2004 assessment, Viet Nam could be providing sanctuary to approximately 3.1% of the globally threatened species. This percentage is the highest of all GMS countries. The main focus for conservation effort should be on species that are endemic to Viet Nam, or endemic to Viet Nam plus some of its GMS neighbors.
129
TECHNICAL INFORMATION
A.Defi nitionThis indicator tracks the number of globally threatened species in Viet Nam over time. It is expressed as the percentage of the number of threatened species at the national level over the number of threatened species at the global level.Threatened species are those defined by the International Union for the Conservation of Nature (ICUN) as vulnerable, endangered or critically endangered in the “Red List of Threatened Species”. Extinct or lower risk (conservation dependent, near threatened or least concern) does not form part of this indicator. Species under consideration include mammals, birds, reptiles, amphibians and fish; plant and insect species, for which the process of evaluation has only just begun, are excluded from the indicator figures. Sub-indicator values are also given for mammals, birds, reptiles, amphibians and fish species.For more information on the criteria utilized to classify threatened species as critically endangered, endangered or vulnerable, see “Categories & Criteria” at www.iucnredlist.org.For more information on the species habitat definitions utilized in the IUCN Red List, see Major Habitats Authority File at www.iucnredlist.org.For more information on the major threats definition utilized in the IUCN Red List, see Major Threats Authority File at www.iucnredlist.org.
B.Data SourceAll data utilized to construct this indicator were extracted from the IUCN Red List on the Internet (see www.iucnredlist.org), in early 2005 but based on the 2004 online version of the IUCN Red List.
C.Geographic Area / Population CoverageFigures are representative of the country as a whole and are not differentiated by any other spatial sub-category. The indicator value is computed for the total number of threatened mammals, birds, reptiles, amphibians and fish species; sub-indicator values are also given for each later category of species.
D.Temporal CoverageFigures correspond to the contents of the 1996, 1998 (plants only), 2000, 2002, 2003 and 2004 IUCN Red Books.
E.Methodology and Frequency of CoverageThe IUCN Red List is continuously being updated and the equivalent of the paper IUCN Red Book is being produced on an annual basis. The IUCN online Red List (see www.iucnredlist.org) will be the most likely source for updating this indicator in the future.
F.Methodology of Data ManipulationAll the figures given in this fact sheet were either extracted from the online IUCN Red List database, through successive search criteria, or computed from the results of such searches.The search criterion for the online IUCN Red List is flexible; the flexibility also adds to the complexity. Two forms of search are available: simple search or expert search. For the compilation of this fact sheet, only the simple search menu was utilized since the expert search menu did not offer any added advantage.Except for plants which are not part of the indicator definition, all searches were made against the entire database using an exact phrase search for keyword “Mammals” or “Birds” or “Reptiles” or “Amphibians” or “Fish”. For plants, the search was made against the taxonomy database using the “Plantae” keyword. For plants, using a keyword of “plants” against the entire database resulted in fewer hits. Likewise, keywords of “mammalia”, “aves”, “reptilia”, etc. against the taxonomy database may lead to un-predictable results.For the purpose of reporting progress to date in the evaluation of potential threatened species (see Table 2), the Red List category of “All Evaluated (excluding Least Concern)” was utilized to report the number of evaluated species. For the purpose of reporting the overall number of threatened species, a mult iple selection of “CR-Critically Endangered” + “EN-Endangered” + “VU–Vulnerable” categories were selected. For the reporting of threatened species by Red List over time, multiple queries were conducted, with the above screening criteria and with the Red List assessment year criteria added.For the purpose of reporting threatened species by major habitat type or by major threat, the above threatened species criteria was applied against all years of the Red List year of assessment with the 1st level definition of the habitat or threat as additional search criteria.The calculation of ratios or percentages related to the downloaded figures should be obvious from the contents of the data tables. It is noted however that the percentage figure associated with the main indicator is based on the cumulative number of species added to the Red List, since 1996, and not just the annual figure.
130
QUALITATIVE INFORMATION
A.Strength and Weakness (data level)The IUCN Red Books, or the IUCN online Red List, is a relatively new instrument to measure the degree of biodiversity loss of a particular country or region. It was initiated in 1996 without plant species, updated with only plant species in 1998, updated in year 2000, skipped in 2001 and it is only since 2002 that it shows some degree of completeness and annual updating. This will improve in the next few years but the temporal trends which can be observed to 2004 are largely based of the level of effort that IUCN biologists have placed on certain species groups in certain years. The IUCN Red List is nevertheless the best source of consistent information of threatened species.For reasons stated above, the absolute number of threatened species that is placed on the Red List on an annual basis is not very indicative of the trends of biodiversity loss in a particular country or region. A cumulative number might be more indicative but the indicator demands a denominator so that the result can be compared with other countries or regions, and so that the indicator value is less biased by the progress of the work of the IUCN biologists.The annual ratio of (new) threatened species over the number of evaluated species was considered (see Table 2) but once again this indicator would be biased by the progress of the individual species assessments. Other denominators were considered, such as the annual number of threatened species over the cumulative number of threatened species for a particular country or region, but in the end the number of globally threatened species, or the number of known threatened species to date, was selected as the denominator.The number of globally threatened species as the denominator provides a neutral denominator for the purpose of comparing one country or region to the other; it is also self-adjusting in terms of the progress that IUCN is having in terms of identifying and mapping the (country) range of all threatened species. IUCN provides these totals including the 2004 assessment year in the statistics section of their homepage (see www.iucnredlist.org). The indicator value, somewhat representing the global responsibility that the specific country or region has to protect the enumerated species at the start of the assessment, may appear extreme at the start of the assessment period but may well be reduced as assessments for other countries or continents, for related species or species groups, continues. In other cases, it may increase as the assessment regime approaches non-evaluated species in the biome of specific countries or regions. The selected indicator value and denominator is far from being perfect, but at the time of this initial assessment it appears to be the one best suited (given the room for improvement as discussed in one of the following sub-sections).The main weakness of the indicator (as discussed in the Future Work Required section below, is that is does not give added weight to the threatened species that are endemic to the country or region being considered, or to the lesser concern for species that are globally threatened but abundant in one specific country or region.
131
B.Reliability, Accuracy, Robustness, Uncertainty (data level)As with all indicators that attempt to track and environmental phenomena over time, this indicator is subject to much international debate and peer review with respect to choice of indicator (based on data availability), reliability, accuracy, robustness and uncertainty.The reliability of the indicator, especially its denominator, is very much hinged on the future success of IUCN’s in getting a true global perspective database on threatened species. The accuracy (of IUCN) is not questioned and the future use of the indicator (given IUCN’s future perspective) appears quite robust. And as with all other indicators which attempt to reduce a complex phenomenon into a single variable, there is some level of uncertainty as to the appropriate (future) use of the indicator as new information sources emerge.One note is inserted here with respect to uncertainty and the targeting of one threatened species to a specific country. The IUCN online database sometimes targets one threatened species to a country with an implied level (a question (?) mark) of un-certainty. For the purpose of this indicator development and limited by the IUCN Red List query capability, these questionable cases have been included with country or region-specific tabulations.
C.Future Work Required (for data level and indicator level)The indicator value, with incremental annual figures, and especially the denominator, should be updated annually, provided IUCN provides such facility on an ongoing basis. It is expected the indicator value will converge to its intended purpose within less than half a decade, if not earlier. It is assumed that IUCN will provide updated global totals to serve as denominator in subsequent versions of this indicator.As was previously mentioned above in the discussion on strengths and weaknesses of the indicator, the indicator could be improved, given time and Internet access resources, in giving added weight to threatened species which are endemic to the country or region of concern, and less weight to species which are threatened but which have a larger geographic range. The current online search facility is not ideal for this kind of tabulation (depends on manual count of enumerated countries), but such a tabulation and weight ranking is not impossible.
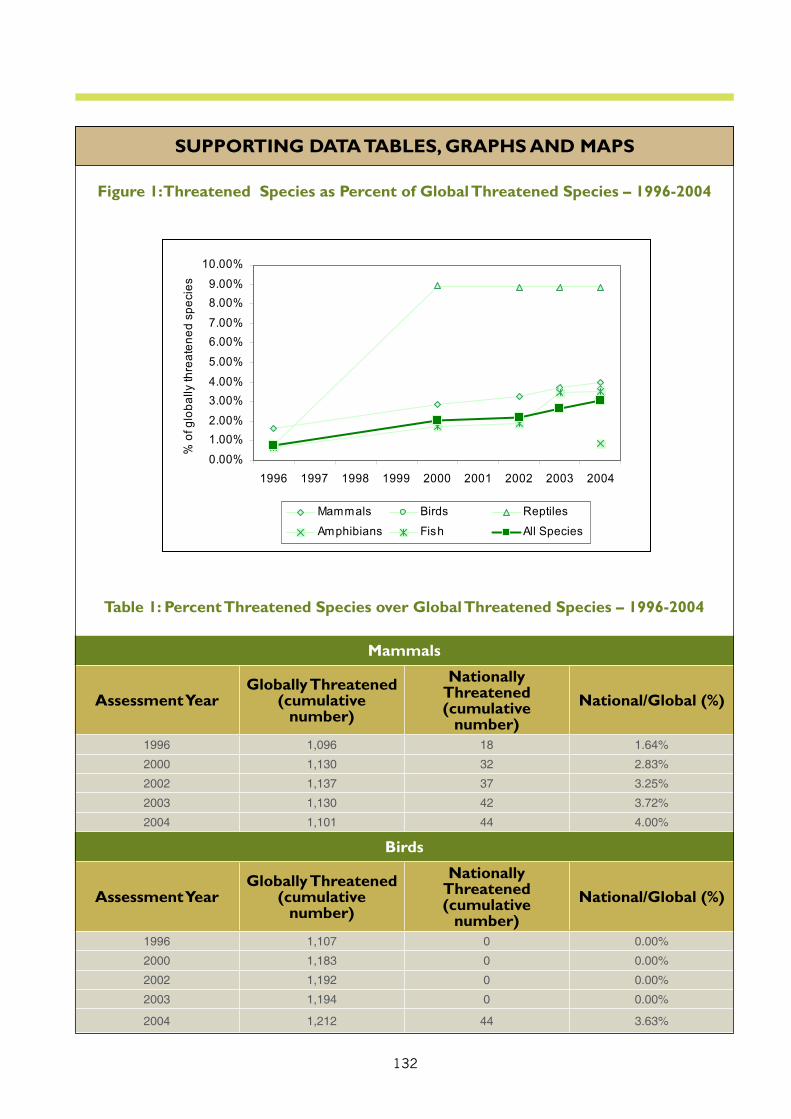
132
SUPPORTING DATA TABLES, GRAPHS AND MAPS
Figure 1: Threatened Species as Percent of Global Threatened Species – 1996-2004
Table 1: Percent Threatened Species over Global Threatened Species – 1996-2004
Mammals
Assessment YearGlobally Threatened
(cumulative number)
Nationally Threatened(cumulative
number)National/Global (%)
1996 1,096 18 1.64%
2000 1,130 32 2.83%
2002 1,137 37 3.25%
2003 1,130 42 3.72%
2004 1,101 44 4.00%
Birds
Assessment YearGlobally Threatened
(cumulative number)
Nationally Threatened(cumulative
number)National/Global (%)
1996 1,107 0 0.00%
2000 1,183 0 0.00%
2002 1,192 0 0.00%
2003 1,194 0 0.00%
2004 1,212 44 3.63%
0.00%
1.00%
2.00%
3.00%
4.00%
5.00%
6.00%
7.00%
8.00%
9.00%
10.00%
1996 1997 1998 1999 2000 2001 2002 2003 2004
%of
glo
bally
thre
ate
ned
spe
cie
s
Mammals Birds Reptiles
Amphibians Fish All Species
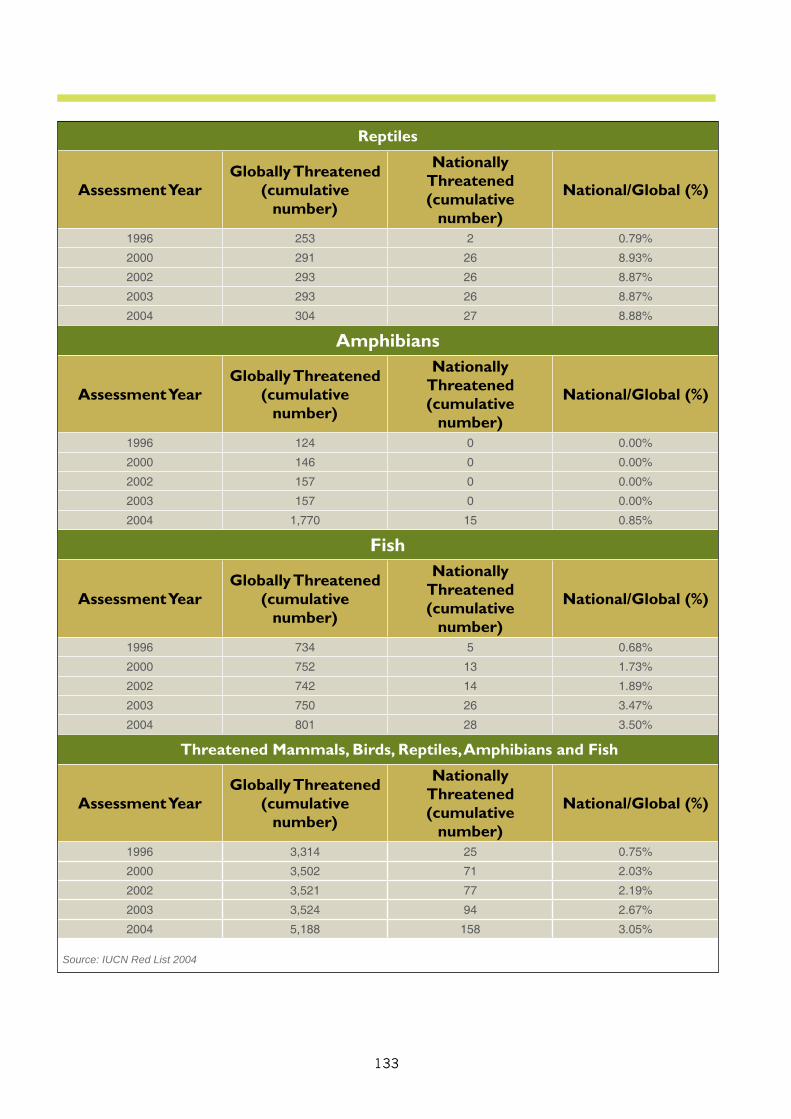
133
Reptiles
Assessment YearGlobally Threatened
(cumulative number)
Nationally Threatened(cumulative
number)
National/Global (%)
1996 253 2 0.79%
2000 291 26 8.93%
2002 293 26 8.87%
2003 293 26 8.87%
2004 304 27 8.88%
Amphibians
Assessment YearGlobally Threatened
(cumulative number)
Nationally Threatened(cumulative
number)
National/Global (%)
1996 124 0 0.00%
2000 146 0 0.00%
2002 157 0 0.00%
2003 157 0 0.00%
2004 1,770 15 0.85%
Fish
Assessment YearGlobally Threatened
(cumulative number)
Nationally Threatened(cumulative
number)
National/Global (%)
1996 734 5 0.68%
2000 752 13 1.73%
2002 742 14 1.89%
2003 750 26 3.47%
2004 801 28 3.50%
All Threatened Mammals, Birds, Reptiles, Amphibians and Fish
Assessment YearGlobally Threatened
(cumulative number)
Nationally Threatened(cumulative
number)
National/Global (%)
1996 3,314 25 0.75%
2000 3,502 71 2.03%
2002 3,521 77 2.19%
2003 3,524 94 2.67%
2004 5,188 158 3.05%
Source: IUCN Red List 2004
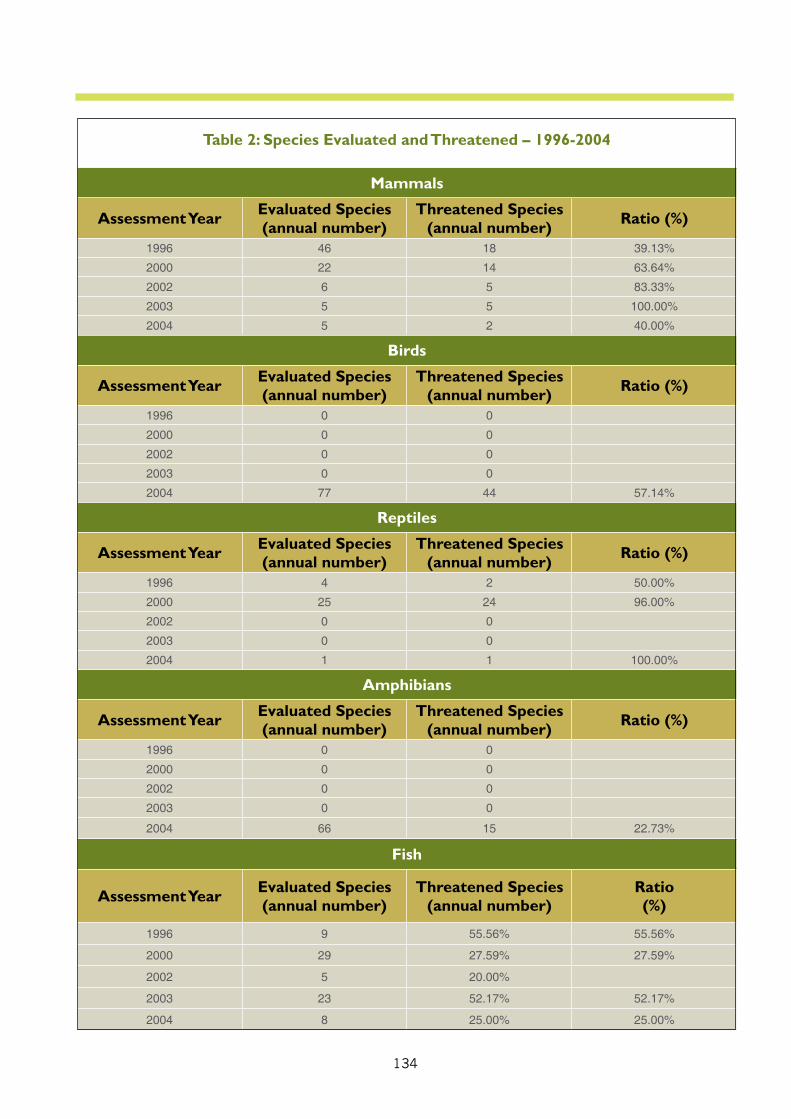
134
Table 2: Species Evaluated and Threatened – 1996-2004
Mammals
Assessment Year Evaluated Species(annual number)
Threatened Species(annual number) Ratio (%)
1996 46 18 39.13%
2000 22 14 63.64%
2002 6 5 83.33%
2003 5 5 100.00%
2004 5 2 40.00%
Birds
Assessment Year Evaluated Species(annual number)
Threatened Species(annual number) Ratio (%)
1996 0 0
2000 0 0
2002 0 0
2003 0 0
2004 77 44 57.14%
Reptiles
Assessment Year Evaluated Species(annual number)
Threatened Species(annual number) Ratio (%)
1996 4 2 50.00%
2000 25 24 96.00%
2002 0 0
2003 0 0
2004 1 1 100.00%
Amphibians
Assessment Year Evaluated Species(annual number)
Threatened Species(annual number) Ratio (%)
1996 0 0
2000 0 0
2002 0 0
2003 0 0
2004 66 15 22.73%
Fish
Assessment Year Evaluated Species(annual number)
Threatened Species(annual number)
Ratio(%)
1996 9 55.56% 55.56%
2000 29 27.59% 27.59%
2002 5 20.00%
2003 23 52.17% 52.17%
2004 8 25.00% 25.00%
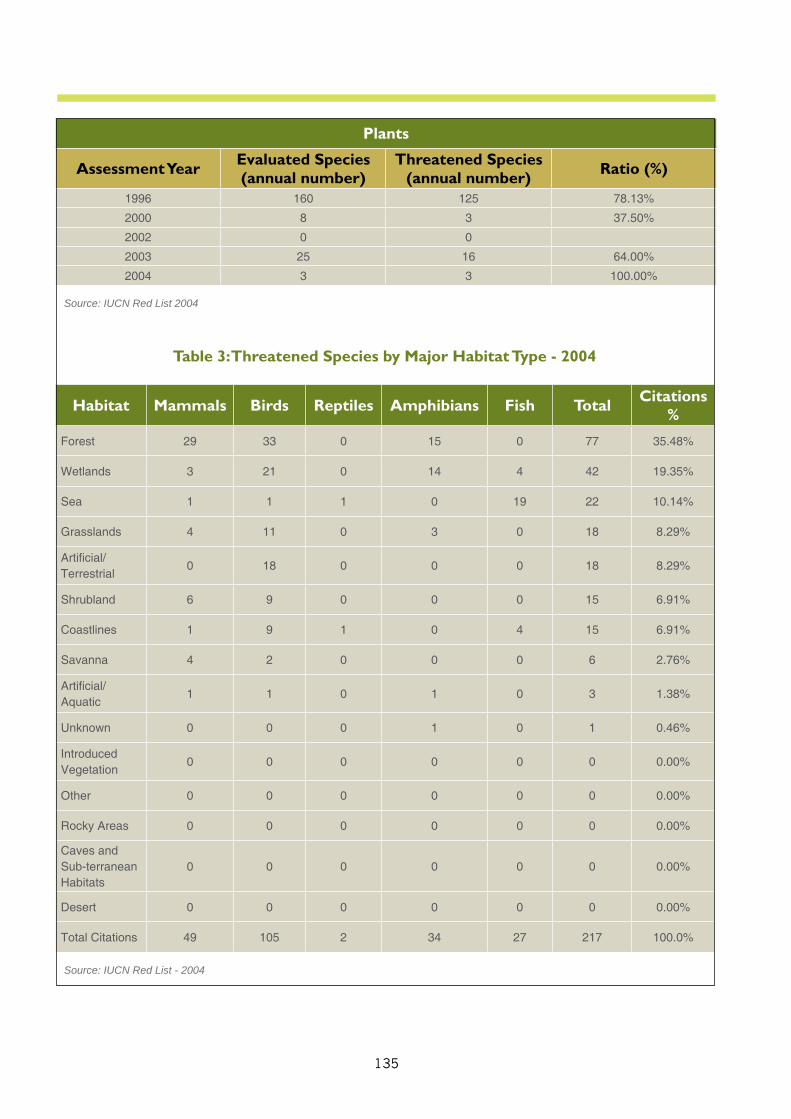
135
Plants
Assessment Year Evaluated Species(annual number)
Threatened Species(annual number) Ratio (%)
1996 160 125 78.13%
2000 8 3 37.50%
2002 0 0
2003 25 16 64.00%
2004 3 3 100.00%
Source: IUCN Red List 2004
Table 3: Threatened Species by Major Habitat Type - 2004
Habitat Mammals Birds Reptiles Amphibians Fish Total Citations %
Forest 29 33 0 15 0 77 35.48%
Wetlands 3 21 0 14 4 42 19.35%
Sea 1 1 1 0 19 22 10.14%
Grasslands 4 11 0 3 0 18 8.29%
Artifi cial/Terrestrial
0 18 0 0 0 18 8.29%
Shrubland 6 9 0 0 0 15 6.91%
Coastlines 1 9 1 0 4 15 6.91%
Savanna 4 2 0 0 0 6 2.76%
Artifi cial/Aquatic
1 1 0 1 0 3 1.38%
Unknown 0 0 0 1 0 1 0.46%
Introduced Vegetation
0 0 0 0 0 0 0.00%
Other 0 0 0 0 0 0 0.00%
Rocky Areas 0 0 0 0 0 0 0.00%
Caves and Sub-terranean Habitats
0 0 0 0 0 0 0.00%
Desert 0 0 0 0 0 0 0.00%
Total Citations 49 105 2 34 27 217 100.0%
Source: IUCN Red List - 2004
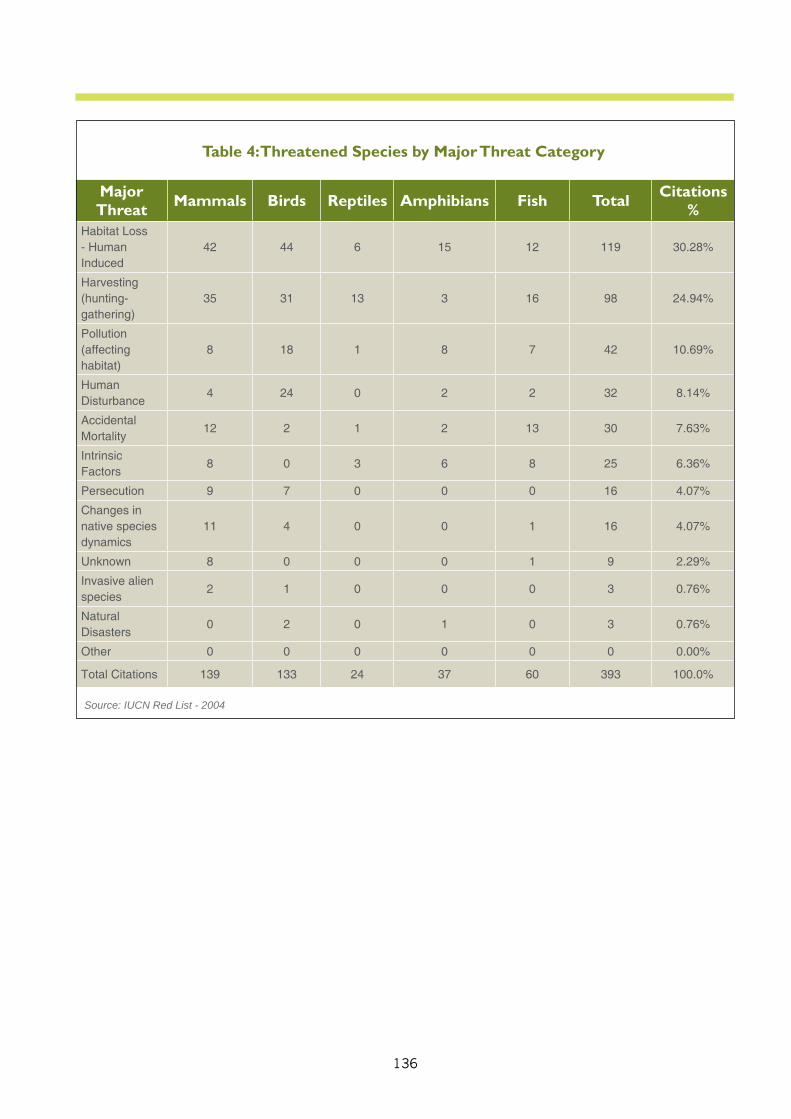
136
Table 4: Threatened Species by Major Threat Category
Major Threat Mammals Birds Reptiles Amphibians Fish Total Citations
%Habitat Loss - Human Induced
42 44 6 15 12 119 30.28%
Harvesting (hunting-gathering)
35 31 13 3 16 98 24.94%
Pollution (affecting habitat)
8 18 1 8 7 42 10.69%
Human Disturbance
4 24 0 2 2 32 8.14%
Accidental Mortality
12 2 1 2 13 30 7.63%
Intrinsic Factors
8 0 3 6 8 25 6.36%
Persecution 9 7 0 0 0 16 4.07%
Changes in native species dynamics
11 4 0 0 1 16 4.07%
Unknown 8 0 0 0 1 9 2.29%
Invasive alien species
2 1 0 0 0 3 0.76%
Natural Disasters
0 2 0 1 0 3 0.76%
Other 0 0 0 0 0 0 0.00%
Total Citations 139 133 24 37 60 393 100.0%
Source: IUCN Red List - 2004
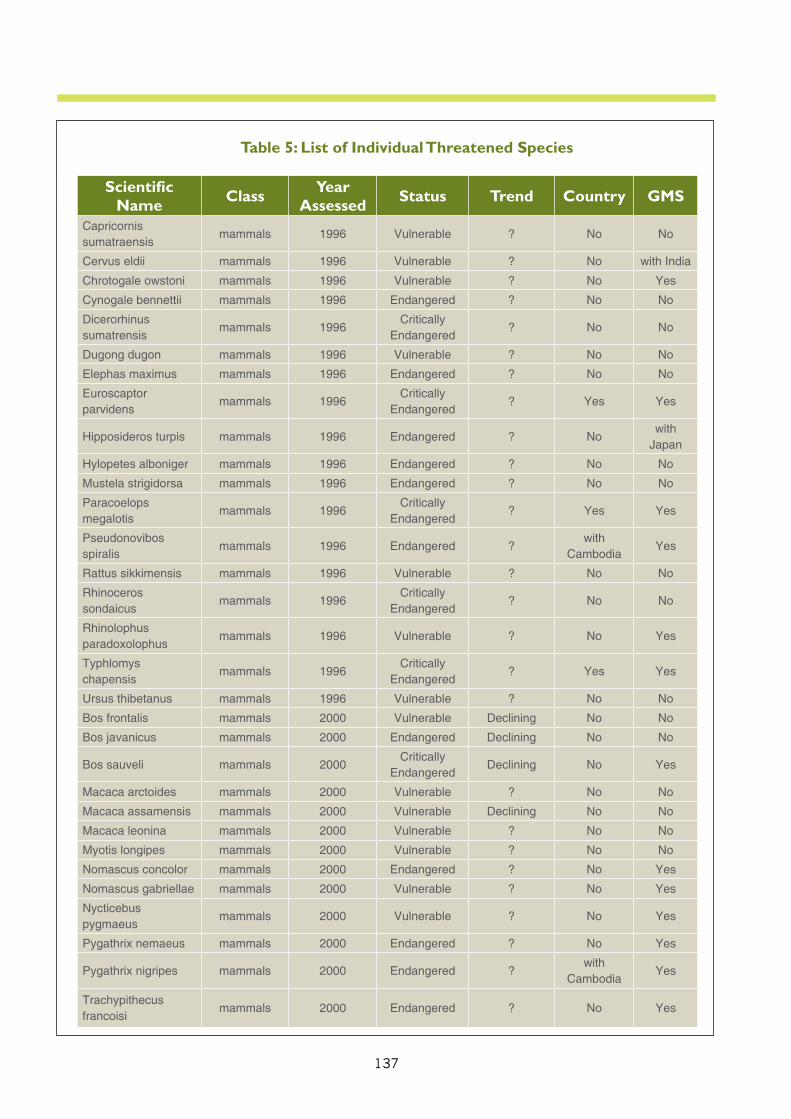
137
Table 5: List of Individual Threatened Species
Scientifi c Name Class Year
Assessed Status Trend Country GMS
Capricornis sumatraensis
mammals 1996 Vulnerable ? No No
Cervus eldii mammals 1996 Vulnerable ? No with India
Chrotogale owstoni mammals 1996 Vulnerable ? No Yes
Cynogale bennettii mammals 1996 Endangered ? No No
Dicerorhinus sumatrensis
mammals 1996Critically
Endangered? No No
Dugong dugon mammals 1996 Vulnerable ? No No
Elephas maximus mammals 1996 Endangered ? No No
Euroscaptor parvidens
mammals 1996Critically
Endangered? Yes Yes
Hipposideros turpis mammals 1996 Endangered ? Nowith
Japan
Hylopetes alboniger mammals 1996 Endangered ? No No
Mustela strigidorsa mammals 1996 Endangered ? No No
Paracoelops megalotis
mammals 1996Critically
Endangered? Yes Yes
Pseudonovibos spiralis
mammals 1996 Endangered ?with
CambodiaYes
Rattus sikkimensis mammals 1996 Vulnerable ? No No
Rhinoceros sondaicus
mammals 1996Critically
Endangered? No No
Rhinolophus paradoxolophus
mammals 1996 Vulnerable ? No Yes
Typhlomys chapensis
mammals 1996Critically
Endangered? Yes Yes
Ursus thibetanus mammals 1996 Vulnerable ? No No
Bos frontalis mammals 2000 Vulnerable Declining No No
Bos javanicus mammals 2000 Endangered Declining No No
Bos sauveli mammals 2000Critically
EndangeredDeclining No Yes
Macaca arctoides mammals 2000 Vulnerable ? No No
Macaca assamensis mammals 2000 Vulnerable Declining No No
Macaca leonina mammals 2000 Vulnerable ? No No
Myotis longipes mammals 2000 Vulnerable ? No No
Nomascus concolor mammals 2000 Endangered ? No Yes
Nomascus gabriellae mammals 2000 Vulnerable ? No Yes
Nycticebus pygmaeus
mammals 2000 Vulnerable ? No Yes
Pygathrix nemaeus mammals 2000 Endangered ? No Yes
Pygathrix nigripes mammals 2000 Endangered ?with
CambodiaYes
Trachypithecus francoisi
mammals 2000 Endangered ? No Yes
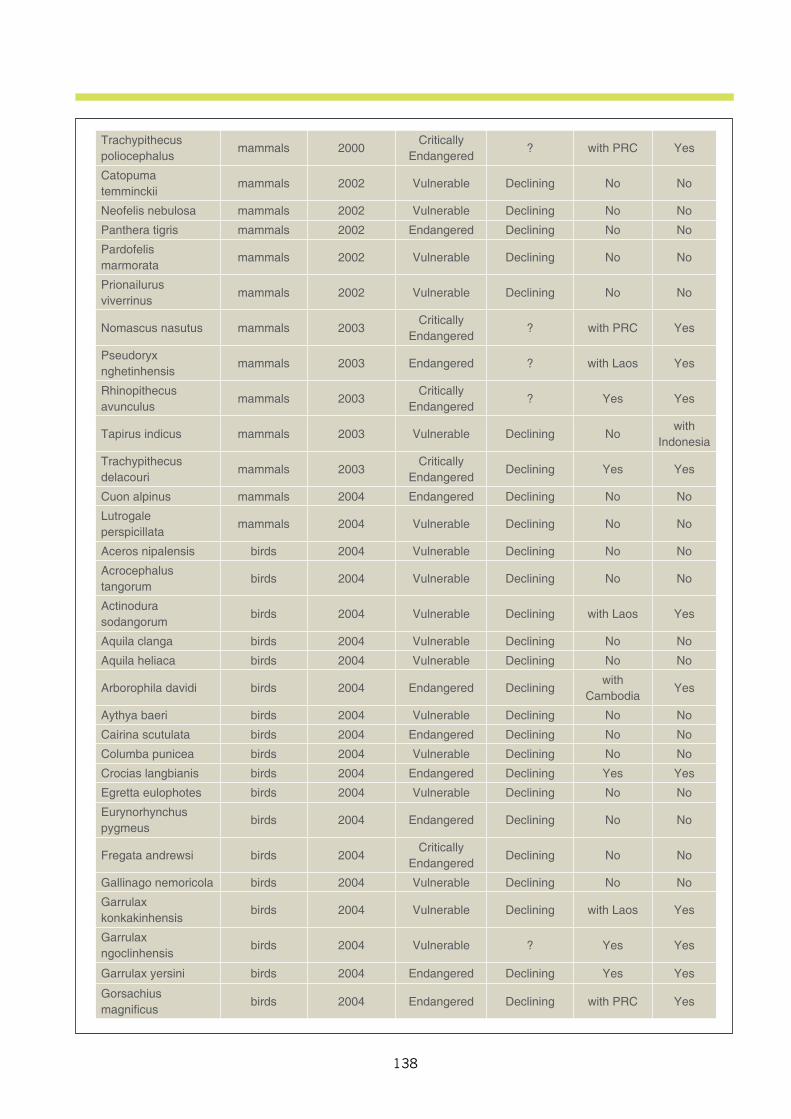
138
Trachypithecus poliocephalus
mammals 2000Critically
Endangered? with PRC Yes
Catopuma temminckii
mammals 2002 Vulnerable Declining No No
Neofelis nebulosa mammals 2002 Vulnerable Declining No No
Panthera tigris mammals 2002 Endangered Declining No No
Pardofelis marmorata
mammals 2002 Vulnerable Declining No No
Prionailurus viverrinus
mammals 2002 Vulnerable Declining No No
Nomascus nasutus mammals 2003Critically
Endangered? with PRC Yes
Pseudoryx nghetinhensis
mammals 2003 Endangered ? with Laos Yes
Rhinopithecus avunculus
mammals 2003Critically
Endangered? Yes Yes
Tapirus indicus mammals 2003 Vulnerable Declining Nowith
Indonesia
Trachypithecus delacouri
mammals 2003Critically
EndangeredDeclining Yes Yes
Cuon alpinus mammals 2004 Endangered Declining No No
Lutrogale perspicillata
mammals 2004 Vulnerable Declining No No
Aceros nipalensis birds 2004 Vulnerable Declining No No
Acrocephalus tangorum
birds 2004 Vulnerable Declining No No
Actinodura sodangorum
birds 2004 Vulnerable Declining with Laos Yes
Aquila clanga birds 2004 Vulnerable Declining No No
Aquila heliaca birds 2004 Vulnerable Declining No No
Arborophila davidi birds 2004 Endangered Decliningwith
CambodiaYes
Aythya baeri birds 2004 Vulnerable Declining No No
Cairina scutulata birds 2004 Endangered Declining No No
Columba punicea birds 2004 Vulnerable Declining No No
Crocias langbianis birds 2004 Endangered Declining Yes Yes
Egretta eulophotes birds 2004 Vulnerable Declining No No
Eurynorhynchus pygmeus
birds 2004 Endangered Declining No No
Fregata andrewsi birds 2004Critically
EndangeredDeclining No No
Gallinago nemoricola birds 2004 Vulnerable Declining No No
Garrulax konkakinhensis
birds 2004 Vulnerable Declining with Laos Yes
Garrulax ngoclinhensis
birds 2004 Vulnerable ? Yes Yes
Garrulax yersini birds 2004 Endangered Declining Yes Yes
Gorsachius magnifi cus
birds 2004 Endangered Declining with PRC Yes
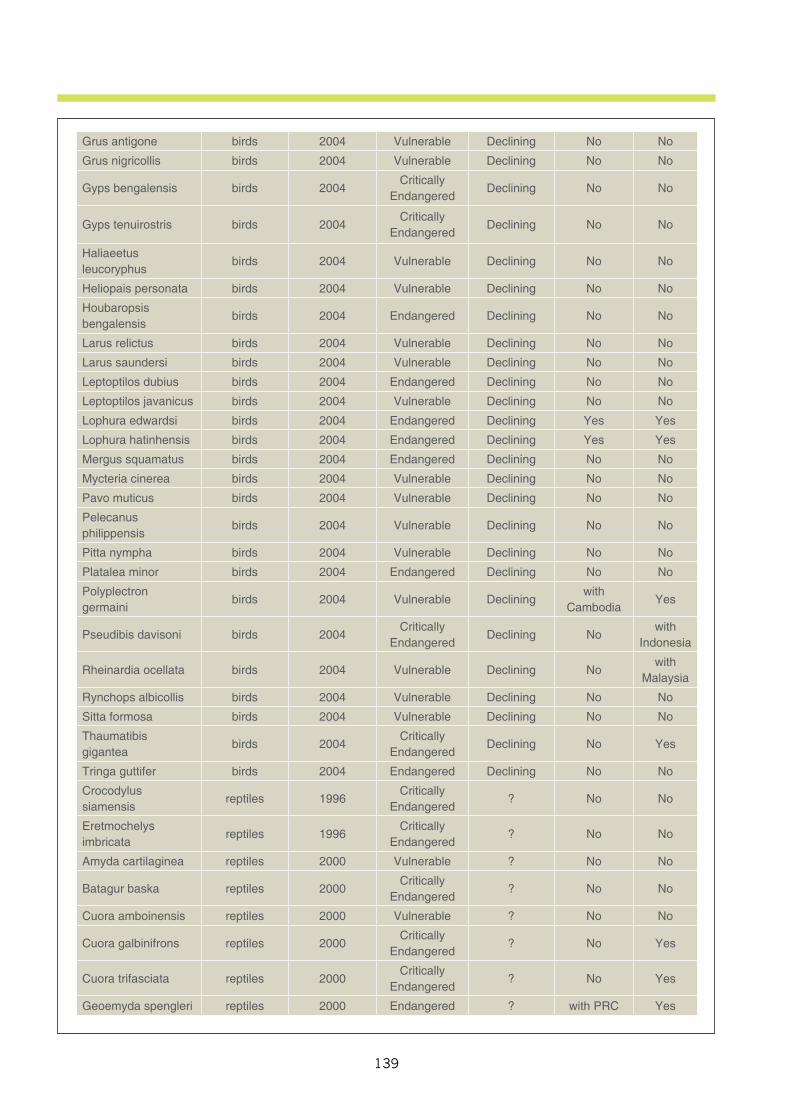
139
Grus antigone birds 2004 Vulnerable Declining No No
Grus nigricollis birds 2004 Vulnerable Declining No No
Gyps bengalensis birds 2004Critically
EndangeredDeclining No No
Gyps tenuirostris birds 2004Critically
EndangeredDeclining No No
Haliaeetus leucoryphus
birds 2004 Vulnerable Declining No No
Heliopais personata birds 2004 Vulnerable Declining No No
Houbaropsis bengalensis
birds 2004 Endangered Declining No No
Larus relictus birds 2004 Vulnerable Declining No No
Larus saundersi birds 2004 Vulnerable Declining No No
Leptoptilos dubius birds 2004 Endangered Declining No No
Leptoptilos javanicus birds 2004 Vulnerable Declining No No
Lophura edwardsi birds 2004 Endangered Declining Yes Yes
Lophura hatinhensis birds 2004 Endangered Declining Yes Yes
Mergus squamatus birds 2004 Endangered Declining No No
Mycteria cinerea birds 2004 Vulnerable Declining No No
Pavo muticus birds 2004 Vulnerable Declining No No
Pelecanus philippensis
birds 2004 Vulnerable Declining No No
Pitta nympha birds 2004 Vulnerable Declining No No
Platalea minor birds 2004 Endangered Declining No No
Polyplectron germaini
birds 2004 Vulnerable Decliningwith
CambodiaYes
Pseudibis davisoni birds 2004Critically
EndangeredDeclining No
with Indonesia
Rheinardia ocellata birds 2004 Vulnerable Declining Nowith
Malaysia
Rynchops albicollis birds 2004 Vulnerable Declining No No
Sitta formosa birds 2004 Vulnerable Declining No No
Thaumatibis gigantea
birds 2004Critically
EndangeredDeclining No Yes
Tringa guttifer birds 2004 Endangered Declining No No
Crocodylus siamensis
reptiles 1996Critically
Endangered? No No
Eretmochelys imbricata
reptiles 1996Critically
Endangered? No No
Amyda cartilaginea reptiles 2000 Vulnerable ? No No
Batagur baska reptiles 2000Critically
Endangered? No No
Cuora amboinensis reptiles 2000 Vulnerable ? No No
Cuora galbinifrons reptiles 2000Critically
Endangered? No Yes
Cuora trifasciata reptiles 2000Critically
Endangered? No Yes
Geoemyda spengleri reptiles 2000 Endangered ? with PRC Yes
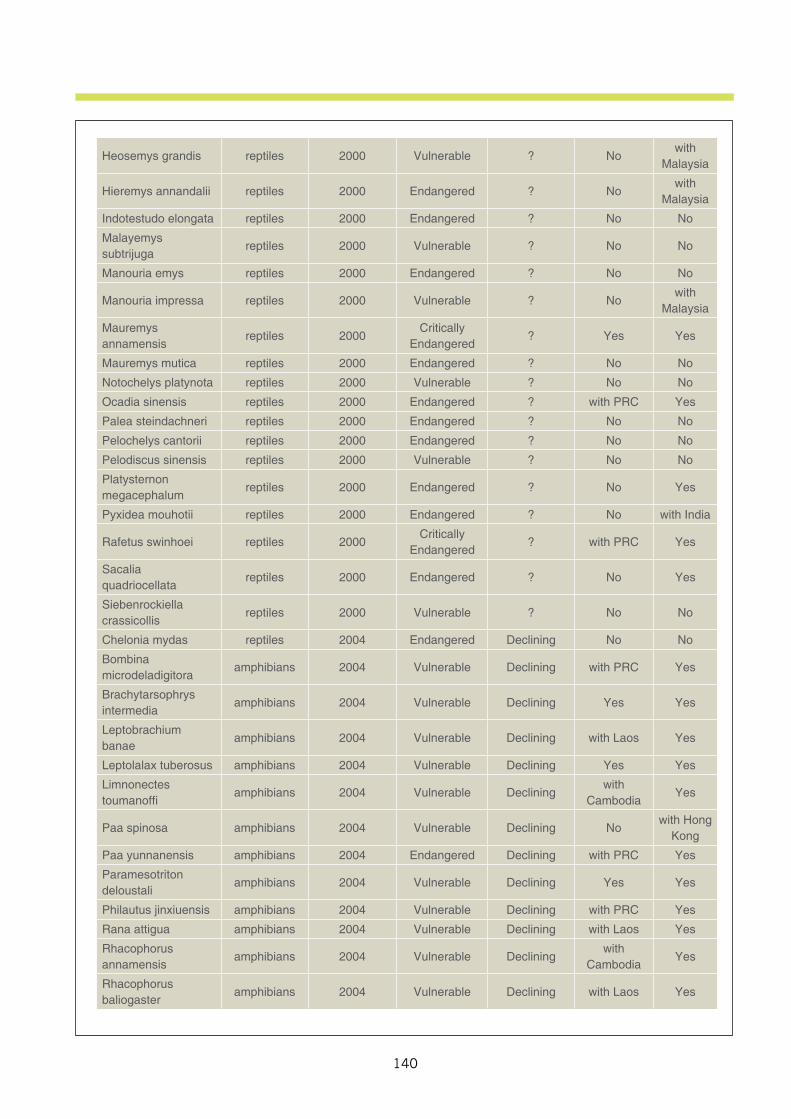
140
Heosemys grandis reptiles 2000 Vulnerable ? Nowith
Malaysia
Hieremys annandalii reptiles 2000 Endangered ? Nowith
Malaysia
Indotestudo elongata reptiles 2000 Endangered ? No No
Malayemys subtrijuga
reptiles 2000 Vulnerable ? No No
Manouria emys reptiles 2000 Endangered ? No No
Manouria impressa reptiles 2000 Vulnerable ? Nowith
Malaysia
Mauremys annamensis
reptiles 2000Critically
Endangered? Yes Yes
Mauremys mutica reptiles 2000 Endangered ? No No
Notochelys platynota reptiles 2000 Vulnerable ? No No
Ocadia sinensis reptiles 2000 Endangered ? with PRC Yes
Palea steindachneri reptiles 2000 Endangered ? No No
Pelochelys cantorii reptiles 2000 Endangered ? No No
Pelodiscus sinensis reptiles 2000 Vulnerable ? No No
Platysternon megacephalum
reptiles 2000 Endangered ? No Yes
Pyxidea mouhotii reptiles 2000 Endangered ? No with India
Rafetus swinhoei reptiles 2000Critically
Endangered? with PRC Yes
Sacalia quadriocellata
reptiles 2000 Endangered ? No Yes
Siebenrockiella crassicollis
reptiles 2000 Vulnerable ? No No
Chelonia mydas reptiles 2004 Endangered Declining No No
Bombina microdeladigitora
amphibians 2004 Vulnerable Declining with PRC Yes
Brachytarsophrys intermedia
amphibians 2004 Vulnerable Declining Yes Yes
Leptobrachium banae
amphibians 2004 Vulnerable Declining with Laos Yes
Leptolalax tuberosus amphibians 2004 Vulnerable Declining Yes Yes
Limnonectes toumanoffi
amphibians 2004 Vulnerable Decliningwith
CambodiaYes
Paa spinosa amphibians 2004 Vulnerable Declining Nowith Hong
Kong
Paa yunnanensis amphibians 2004 Endangered Declining with PRC Yes
Paramesotriton deloustali
amphibians 2004 Vulnerable Declining Yes Yes
Philautus jinxiuensis amphibians 2004 Vulnerable Declining with PRC Yes
Rana attigua amphibians 2004 Vulnerable Declining with Laos Yes
Rhacophorus annamensis
amphibians 2004 Vulnerable Decliningwith
CambodiaYes
Rhacophorus baliogaster
amphibians 2004 Vulnerable Declining with Laos Yes
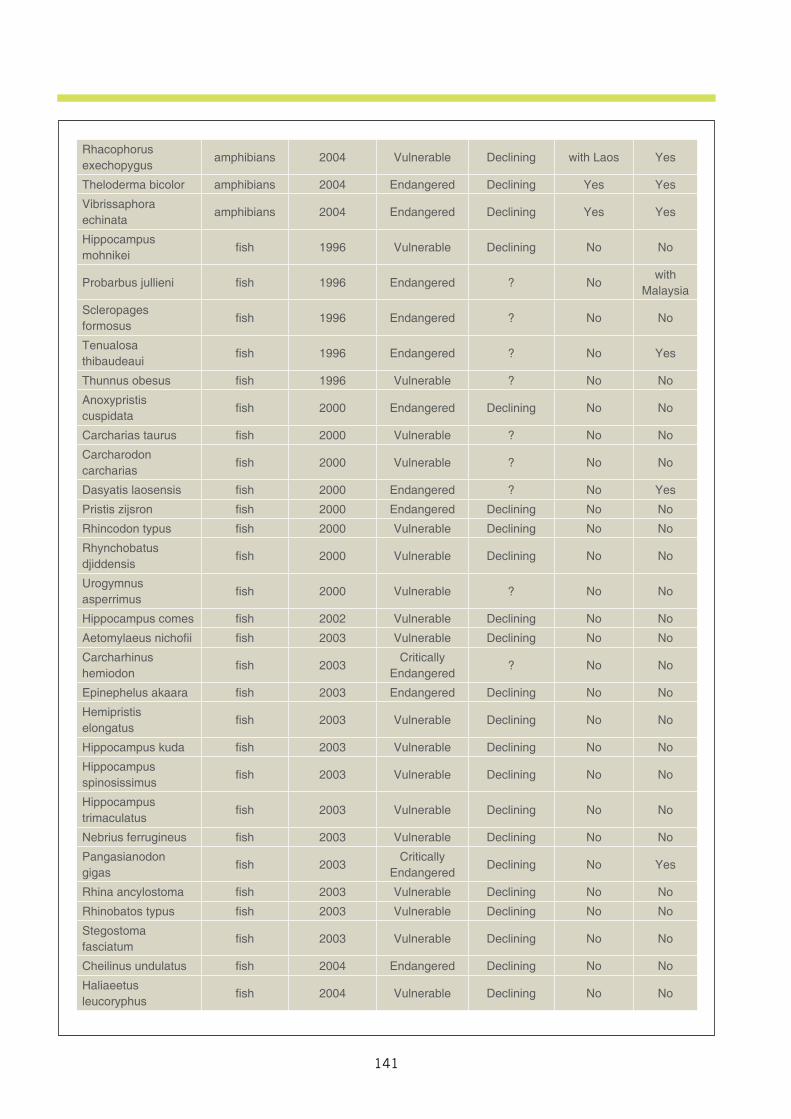
141
Rhacophorus exechopygus
amphibians 2004 Vulnerable Declining with Laos Yes
Theloderma bicolor amphibians 2004 Endangered Declining Yes Yes
Vibrissaphora echinata
amphibians 2004 Endangered Declining Yes Yes
Hippocampus mohnikei
fi sh 1996 Vulnerable Declining No No
Probarbus jullieni fi sh 1996 Endangered ? Nowith
Malaysia
Scleropages formosus
fi sh 1996 Endangered ? No No
Tenualosa thibaudeaui
fi sh 1996 Endangered ? No Yes
Thunnus obesus fi sh 1996 Vulnerable ? No No
Anoxypristis cuspidata
fi sh 2000 Endangered Declining No No
Carcharias taurus fi sh 2000 Vulnerable ? No No
Carcharodon carcharias
fi sh 2000 Vulnerable ? No No
Dasyatis laosensis fi sh 2000 Endangered ? No Yes
Pristis zijsron fi sh 2000 Endangered Declining No No
Rhincodon typus fi sh 2000 Vulnerable Declining No No
Rhynchobatus djiddensis
fi sh 2000 Vulnerable Declining No No
Urogymnus asperrimus
fi sh 2000 Vulnerable ? No No
Hippocampus comes fi sh 2002 Vulnerable Declining No No
Aetomylaeus nichofi i fi sh 2003 Vulnerable Declining No No
Carcharhinus hemiodon
fi sh 2003Critically
Endangered? No No
Epinephelus akaara fi sh 2003 Endangered Declining No No
Hemipristis elongatus
fi sh 2003 Vulnerable Declining No No
Hippocampus kuda fi sh 2003 Vulnerable Declining No No
Hippocampus spinosissimus
fi sh 2003 Vulnerable Declining No No
Hippocampus trimaculatus
fi sh 2003 Vulnerable Declining No No
Nebrius ferrugineus fi sh 2003 Vulnerable Declining No No
Pangasianodon gigas
fi sh 2003Critically
EndangeredDeclining No Yes
Rhina ancylostoma fi sh 2003 Vulnerable Declining No No
Rhinobatos typus fi sh 2003 Vulnerable Declining No No
Stegostoma fasciatum
fi sh 2003 Vulnerable Declining No No
Cheilinus undulatus fi sh 2004 Endangered Declining No No
Haliaeetus leucoryphus
fi sh 2004 Vulnerable Declining No No
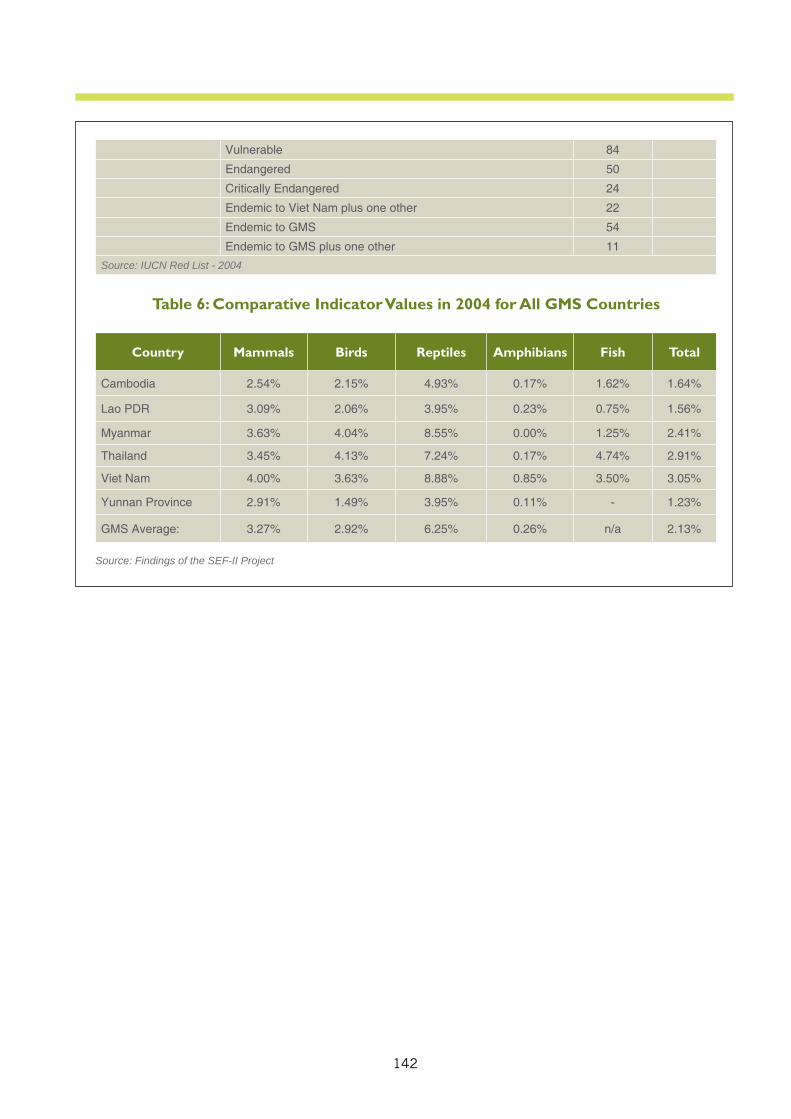
142
Vulnerable 84
Endangered 50
Critically Endangered 24
Endemic to Viet Nam plus one other 22
Endemic to GMS 54
Endemic to GMS plus one other 11
Source: IUCN Red List - 2004
Table 6: Comparative Indicator Values in 2004 for All GMS Countries
Country Mammals Birds Reptiles Amphibians Fish Total
Cambodia 2.54% 2.15% 4.93% 0.17% 1.62% 1.64%
Lao PDR 3.09% 2.06% 3.95% 0.23% 0.75% 1.56%
Myanmar 3.63% 4.04% 8.55% 0.00% 1.25% 2.41%
Thailand 3.45% 4.13% 7.24% 0.17% 4.74% 2.91%
Viet Nam 4.00% 3.63% 8.88% 0.85% 3.50% 3.05%
Yunnan Province 2.91% 1.49% 3.95% 0.11% - 1.23%
GMS Average: 3.27% 2.92% 6.25% 0.26% n/a 2.13%
Source: Findings of the SEF-II Project
143
SUMMARY
A.Policy Reference1.Purpose: The purpose of this indicator is to describe the maintenance of, or conversely, the loss of species diversity. It is understood that the smaller this number is for a specific country or region, the better the country or region is at the maintenance of species diversity. However the rise and fall of the indicator value over the years may or may not be indicative of the government responses within the country or region. Assessment of species outside the country or region leading to a rise in the denominator may result in the fall of the indicator value. Further assessments for species contained primarily within the country or region may temporarily inflate the value of the indicator.
2.Relevance to Environment Planning and Management: Maintenance of biodiversity is essential for ecosystem wellbeing. Species diversity is one of the three main levels of biodiversity, the others being ecosystem and genetic diversity.
3.Linkage to Other Indicators:This indicator is linked to other indicators that have implications for biodiversity. These include: protected area as a percent of total area, loss of designated habitat, protected species, etc.
4.Targets: No specific targets for this indicator value have been set by the Government of Viet Nam.
5.International Environment Treaties: For this indicator, the more relevant convention is the Convention on Biological Diversity (CBD) which Viet Nam ratified on 16/11/94. To date, it appears that Viet Nam has met most of the reporting requirements of this convention, at least as far as the first and second national reports are concerned.The other relevant convention is the Convention on International Trade of Endangered Species (CITES) which Viet Nam acceded to on 20/01/1994. Viet Nam has met the earlier reporting requirements of this convention but, at the time of this assessment was lacking behind in the submission of annual reports.
B.AnalysisAs can be observed from Figure 1 and Table 1, Viet Nam is a tentative sanctuary to approximately 3.1% of the globally threatened wildlife species. This standing includes approximately 4.0% of globally threatened mammals, 3.6% of globally threatened birds, 8.9% of globally threatened reptiles, 3.1% of globally threatened fish and less than 1% of globally threatened amphibians. As can be observed from Table 2, the rise in the share of globally threatened species from 0.75% in 1996 to 3.05% in 2004 is largely attributed to the progress of the evaluation work and is not necessarily indicative of a trend of loss of biodiversity. As can be observed from Table 2, the 0.75% value in 1996 is based on the first version of the IUCN Redbook at which time only 50% of the relevant mammals had been evaluated, few reptile and fish species had been evaluated and at which time amphibians and birds were not part of the equation. The relevant amphibians and birds were in fact not evaluated until 2004 and therefore the indicator value and trend before 2004 has very little meaning.
144
But now that the indicator value is inclusive of all threatened species types, the future value of the indicator will be more indicative of the trend in the loss of biodiversity in Viet Nam. It is not expected to vary dramatically from the 2004 figures. It may artificially rise if new globally threatened species also have sanctuary in Viet Nam; it may artificially fall if new threatened species have sanctuary outside of Viet Nam. While the indicator serves well to measure Viet Nam’s share of a global priority, only changes in the status of individual species (see Table 5) can be utilized to measure progress at the national level. Apart from the indicator value itself, the IUCN database of threatened species has also provided some insight as to what are the habitats of those species relevant to Viet Nam and what are the major threats to those threatened species. As can be observed from Table 3, forests are the dominant habitat for approximately 35% of the threatened mammals, birds and amphibians but loss of wetlands is also and important factor for birds and amphibians. Loss of sea habitat for fish species is also highlighted as a concern. Therefore societal responses which attempt to protect non-forest areas may be of equal importance and the last column of Table 3 might be a model for the ideal composition of protected areas in Viet Nam. Based on the same IUCN database, Table 4 provides some insight as to the major threats relevant to the threatened species in Viet Nam. Loss of habitat is the dominant threat for approximately 30% of the threatened species but harvesting is a close second at 25%. Therefore societal responses which deal with the hunting and gathering of these threatened species may be of equal importance as those societal responses which attempt to protect their habitats. Table 5 lists all of the currently threatened species which have sanctuary in Viet Nam along with their current 2004 standing on the IUCN Red List. As of 2004, 84 species were listed as vulnerable, 50 as endangered and 24 as critically endangered. Any future decrease in the level of endangerment of these species, or the removal of the species from this list, is indicative of progress in conserving biodiversity; any future increase in the level of endangerment will be a negative indication of progress. It can also be noted from Table 5 that not all of Viet Nam’s share of the globally threatened species are endemic to Viet Nam and therefore Viet Nam alone is not solely responsible for its 3.1% share of globally threatened species. However 16 of the threatened species are endemic to Viet Nam and for another 22 threatened species, Viet Nam and one of its GMS neighbors share the total responsibility. It can also be observed from Table 5 that 54 of Viet Nam’s current 158 threatened species are endemic to GMS countries. Table 6 provides the basis for comparing the current value of the indicator with other GMS countries, or with GMS countries as a whole. As can be observed from Table 6, Viet Nam’s 3.1% of globally threatened species is the highest amongst all GMS countries/provinces and well above the average of all GMS countries combined. Reptiles are the largest contribution to Viet Nam’s share of the threatened species, as is the case for all six GMS countries as a whole. Based on this comparison of this indicator with the indicator value of other GMS countries, it is concluded that the current state of biodiversity in Viet Nam is relatively poor, with no observable past trends and an expectation that the global share of Viet Nam’s threatened species will remain constant in the very near future.
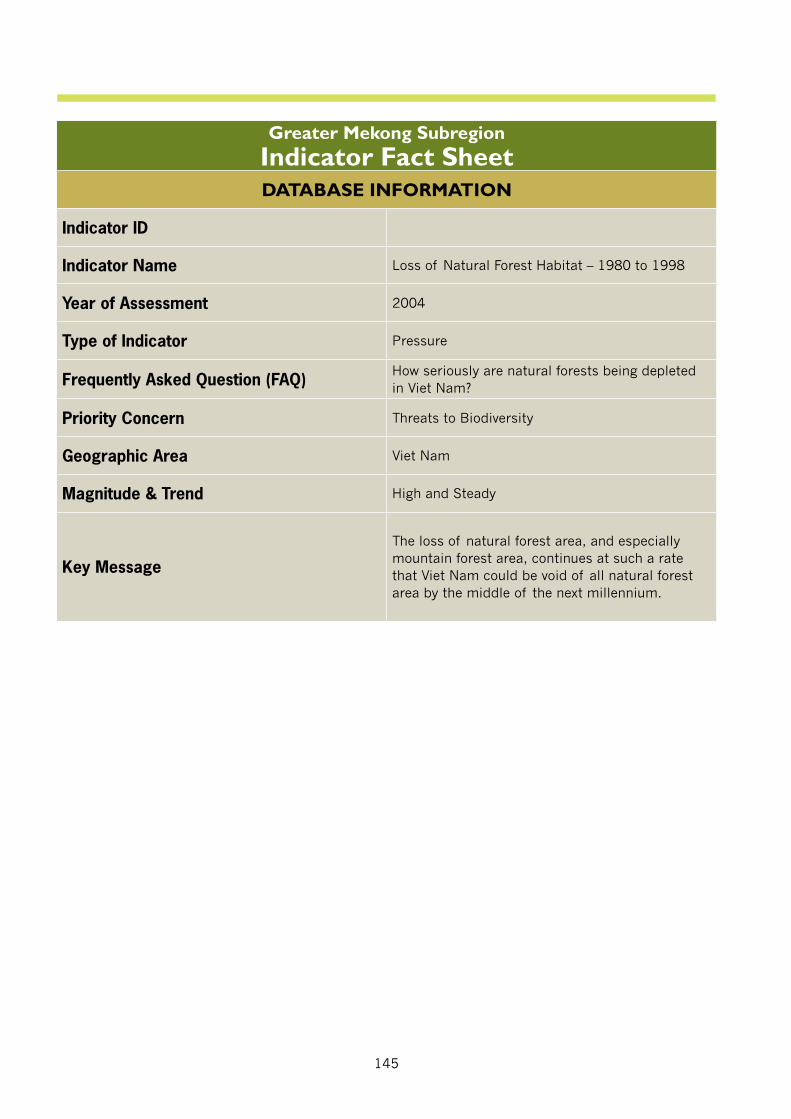
145
Greater Mekong SubregionIndicator Fact SheetDATABASE INFORMATION
Indicator ID
Indicator Name Loss of Natural Forest Habitat – 1980 to 1998
Year of Assessment 2004
Type of Indicator Pressure
Frequently Asked Question (FAQ) How seriously are natural forests being depleted in Viet Nam?
Priority Concern Threats to Biodiversity
Geographic Area Viet Nam
Magnitude & Trend High and Steady
Key Message
The loss of natural forest area, and especially mountain forest area, continues at such a rate that Viet Nam could be void of all natural forest area by the middle of the next millennium.
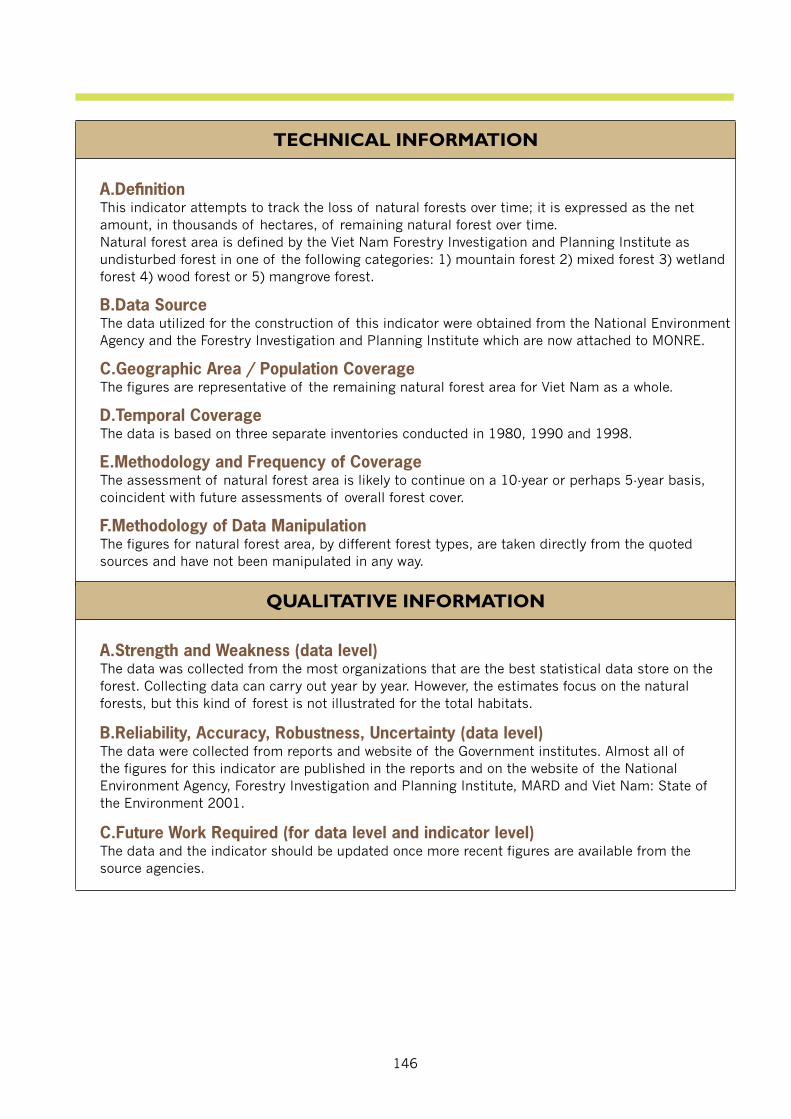
146
TECHNICAL INFORMATION
A.Defi nitionThis indicator attempts to track the loss of natural forests over time; it is expressed as the net amount, in thousands of hectares, of remaining natural forest over time.Natural forest area is defined by the Viet Nam Forestry Investigation and Planning Institute as undisturbed forest in one of the following categories: 1) mountain forest 2) mixed forest 3) wetland forest 4) wood forest or 5) mangrove forest.
B.Data SourceThe data utilized for the construction of this indicator were obtained from the National Environment Agency and the Forestry Investigation and Planning Institute which are now attached to MONRE.
C.Geographic Area / Population CoverageThe figures are representative of the remaining natural forest area for Viet Nam as a whole.
D.Temporal CoverageThe data is based on three separate inventories conducted in 1980, 1990 and 1998.
E.Methodology and Frequency of CoverageThe assessment of natural forest area is likely to continue on a 10-year or perhaps 5-year basis, coincident with future assessments of overall forest cover.
F.Methodology of Data ManipulationThe figures for natural forest area, by different forest types, are taken directly from the quoted sources and have not been manipulated in any way.
QUALITATIVE INFORMATION
A.Strength and Weakness (data level)The data was collected from the most organizations that are the best statistical data store on the forest. Collecting data can carry out year by year. However, the estimates focus on the natural forests, but this kind of forest is not illustrated for the total habitats.
B.Reliability, Accuracy, Robustness, Uncertainty (data level)The data were collected from reports and website of the Government institutes. Almost all of the figures for this indicator are published in the reports and on the website of the National Environment Agency, Forestry Investigation and Planning Institute, MARD and Viet Nam: State of the Environment 2001.
C.Future Work Required (for data level and indicator level)The data and the indicator should be updated once more recent figures are available from the source agencies.
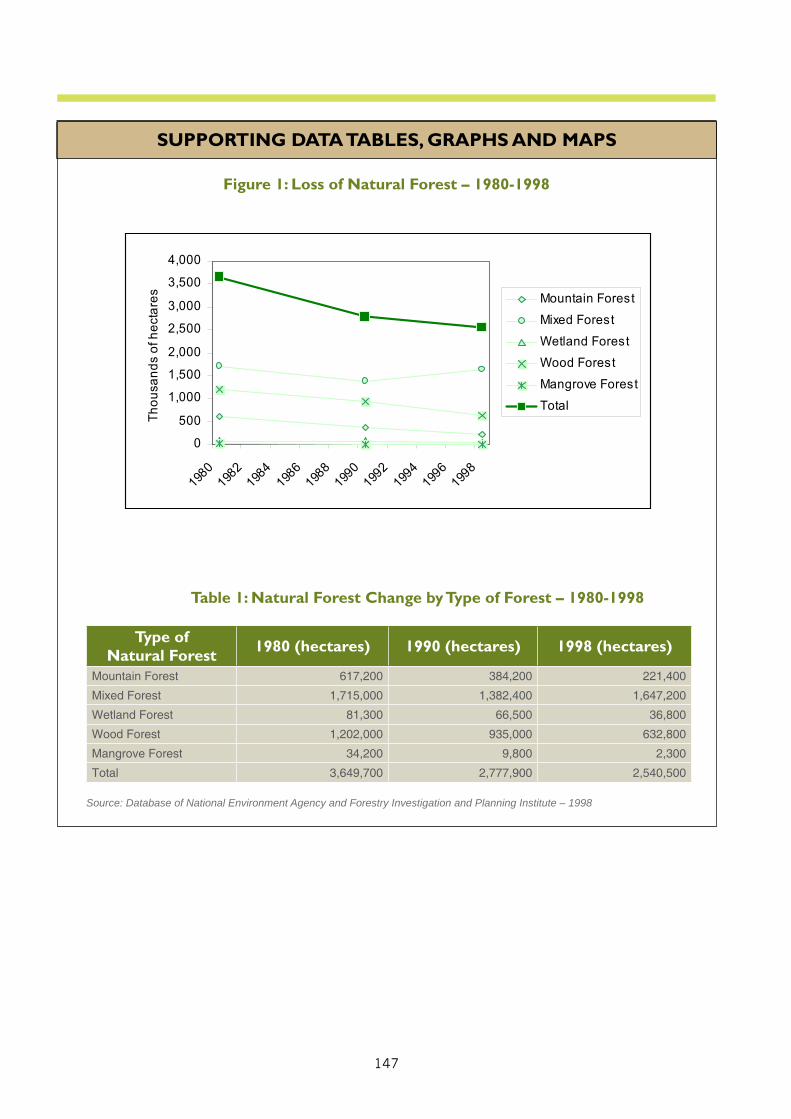
147
SUPPORTING DATA TABLES, GRAPHS AND MAPS
Figure 1: Loss of Natural Forest – 1980-1998
Table 1: Natural Forest Change by Type of Forest – 1980-1998
Type of Natural Forest 1980 (hectares) 1990 (hectares) 1998 (hectares)
Mountain Forest 617,200 384,200 221,400
Mixed Forest 1,715,000 1,382,400 1,647,200
Wetland Forest 81,300 66,500 36,800
Wood Forest 1,202,000 935,000 632,800
Mangrove Forest 34,200 9,800 2,300
Total 3,649,700 2,777,900 2,540,500
Source: Database of National Environment Agency and Forestry Investigation and Planning Institute – 1998
0
500
1,000
1,500
2,000
2,500
3,000
3,500
4,000
1980
1982
1984
1986
1988
1990
1992
1994
1996
1998
Thou
san
dsof
hect
ares Mountain Forest
Mixed Forest
Wetland Forest
Wood Forest
Mangrove Forest
Total
148
SUMMARY
A.Policy Reference1.Purpose: The purpose of this indicator is to track the decline of natural forest area over time, as an indicator of one of the major threats to existing threatened wildlife species.
2.Relevance to Environment Planning and Management: Forests serve multiple ecological, socioeconomic, and cultural roles in many countries. They are among the most diverse and widespread ecosystems of the world. Forests provide many significant resources and functions including: wood products, recreational opportunities, habitat for wildlife, water and soil conservation, and a filter for pollutants. They support employment and traditional uses, and biodiversity. There is general concern over human impact on forest health, and the natural processes of forest growth and regeneration.
3.Linkage to Other Indicators:The indicator may have linkages to the forest resources state indicator but the definition of “natural forest” is different from that utilized in that indicator.The choice of indicator also has some linkages to Tables 3 and 4 in the related state indicator fact sheet for this concern.
4.Targets: As with many pressure indicators, there are no government targets directly related to this indicator.
B.AnalysisAs can be observed from Figure 1 and Table 1, the natural forest area has declined from approximately 3.6 million hectares in 1980 to approximately 2.5 million hectares in 1998. This represents a loss of approximately 1.1 million hectares over the 18-year period. The rate of decline was accelerated during the period 1980 to 1990 and it appears to have been subdued somewhat during the period 1990 to 1998. However this is largely due to an increase in the mixed forest type which supports less biodiversity. Mountain forests, which provide the best biodiversity, have continued to decline throughout the 1980 to 1998 period. Mangrove forests, which serve a multitude of purposes other than protecting biodiversity, are also on the decline.Based on this continued loss of natural forest area and the observed trends, it is concluded that the pressure on the loss of biodiversity in Viet Nam is relatively high and steady.
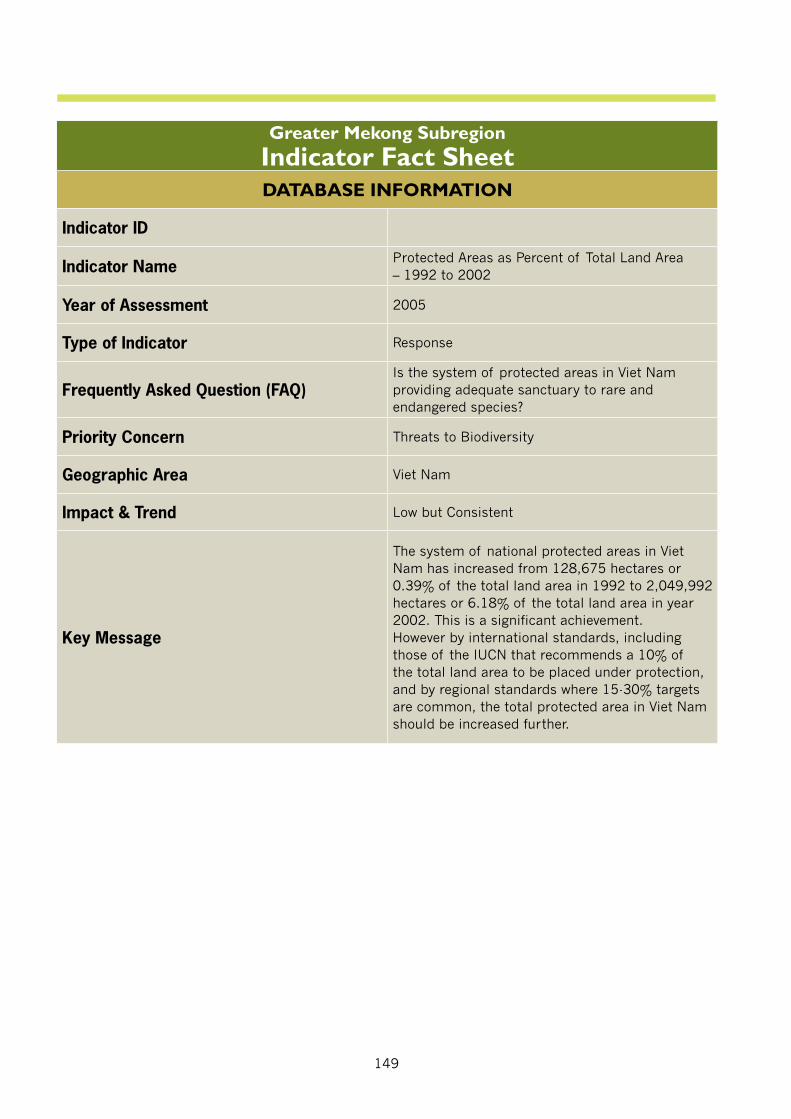
149
Greater Mekong SubregionIndicator Fact SheetDATABASE INFORMATION
Indicator ID
Indicator Name Protected Areas as Percent of Total Land Area – 1992 to 2002
Year of Assessment 2005
Type of Indicator Response
Frequently Asked Question (FAQ)Is the system of protected areas in Viet Nam providing adequate sanctuary to rare and endangered species?
Priority Concern Threats to Biodiversity
Geographic Area Viet Nam
Impact & Trend Low but Consistent
Key Message
The system of national protected areas in Viet Nam has increased from 128,675 hectares or 0.39% of the total land area in 1992 to 2,049,992 hectares or 6.18% of the total land area in year 2002. This is a significant achievement.However by international standards, including those of the IUCN that recommends a 10% of the total land area to be placed under protection, and by regional standards where 15-30% targets are common, the total protected area in Viet Nam should be increased further.
150
TECHNICAL INFORMATION
A.Defi nitionThis indicator attempts to track the extent of protected areas over time; it is expressed as the percentage of protected area over total land area.Protected areas under the Vietnamese system of protected areas include: national parks, nature conservation areas, and cultural, historical and environmental sites. Viet Nam is also host to one Ramsar Wetland Site (Xuan Thuy), four World Heritage Sites and one Man and the Biosphere Reserve.
B.Data SourceThe data utilized for the construction of this indicator originate from the Viet Nam Forest Protection Department and was extracted from Annex I of a report entitled “National Report on Protected Areas and Development” prepared jointly by the Ministry of Agriculture and Rural Development (MARD), the Ministry of Fisheries and the Ministry of Natural Resources and Environment.
C.Geographic Area / Population CoverageThe data is representative of all national recognized protected areas in Viet Nam. There may also exist locally established provincial and district protected areas but these are formally outside the national protected area system and do not form part of this indicator.
D.Temporal CoverageThe data as extracted from the publication is only valid to December, 2002, at which time the list of protected areas was under review by MARD. As a result of the review process, a number of nature reserves and cultural-historic-environmental sites may have been removed because of their degraded status or management by another ministry.
E.Methodology and Frequency of CoverageMARD may have more recent and more accurate data on protected areas but they were not consulted in the formulation of this preliminary baseline indicator fact sheet.
F.Methodology of Data ManipulationTable 2 was extracted directly from the cited report and the figures have not been manipulated in any way. IUCN categories were added according to the guidelines in the cited report.Table 1 was constructed from Table 2 using the “year decreed” as the basis for accumulating the total area by year. Some protected areas without a year of decree may have been left out of this computation. The percentage figures in Table 1 are based on a total land area of 33,169,000 hectares.
151
QUALITATIVE INFORMATION
A.Strength and Weakness (data level)As evidenced in Table 4 of the state indicator fact sheet for threats to biodiversity, loss of habitat is cited as the major threat to almost 30% of the threatened species, followed by hunting and gathering at 25%. Therefore a response indicator which captures the level of habitat protection is appropriate and could be complemented by one which attempts to track the level of protection given to individual species.However a response indicator that tracks only protected areas has two main weaknesses. First, it does not capture the quality of management, i.e. whether the areas are in fact protected from incompatible uses. Second, the indicator does not show how representative the protected areas are of the country’s ecological diversity.To overcome one the above weaknesses, the system of protected areas has been mapped to IUCN protection categories to give an indication of the level of protection which is associated with each of the protection categories in the Vietnamese system of protected areas ( see major headings in Table 2).
B.Reliability, Accuracy, Robustness, Uncertainty (data level)The figures are quoted from the cited report without any indication of the reliability, accuracy and uncertainty of the data. As previously mentioned, the figures are only valid to December, 2002.
C.Future Work Required (for data level and indicator level)The indicator and the fact sheet should be updated with more recent figures to reflect the current system of protected areas in Viet Nam.
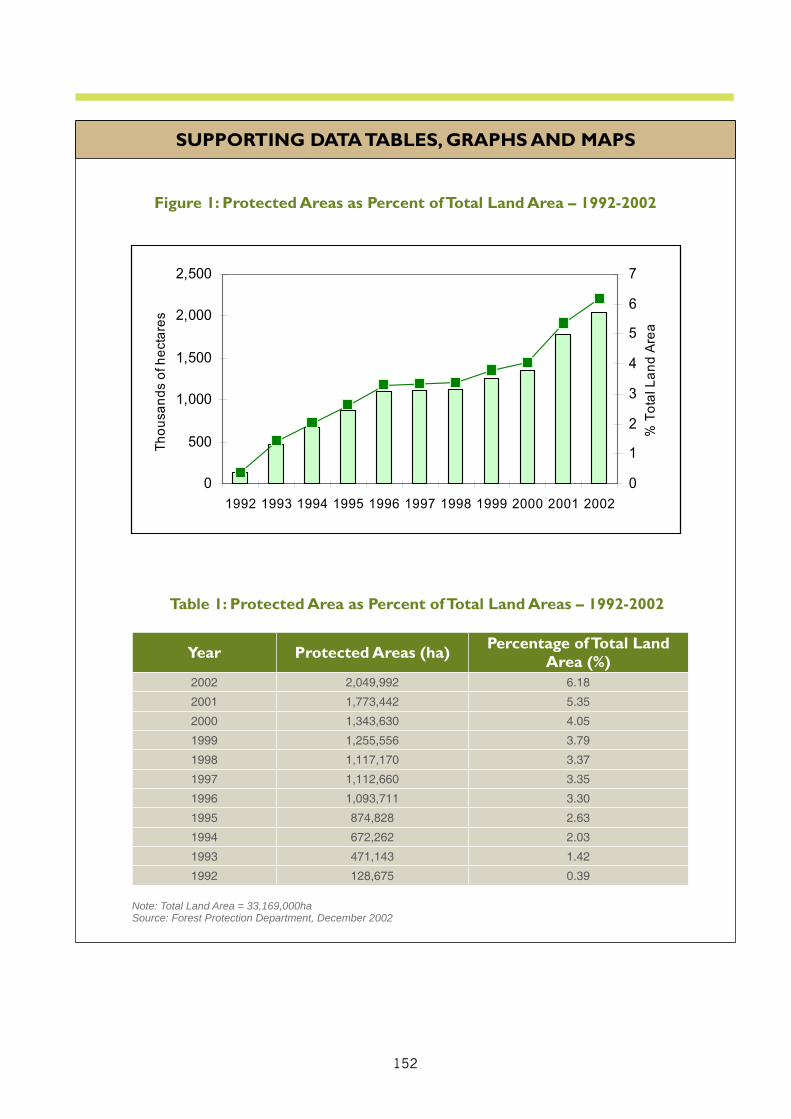
152
SUPPORTING DATA TABLES, GRAPHS AND MAPS
Figure 1: Protected Areas as Percent of Total Land Area – 1992-2002
Table 1: Protected Area as Percent of Total Land Areas – 1992-2002
Year Protected Areas (ha) Percentage of Total Land Area (%)
2002 2,049,992 6.18
2001 1,773,442 5.35
2000 1,343,630 4.05
1999 1,255,556 3.79
1998 1,117,170 3.37
1997 1,112,660 3.35
1996 1,093,711 3.30
1995 874,828 2.63
1994 672,262 2.03
1993 471,143 1.42
1992 128,675 0.39
Note: Total Land Area = 33,169,000haSource: Forest Protection Department, December 2002
0
500
1,000
1,500
2,000
2,500
1992 1993 1994 1995 1996 1997 1998 1999 2000 2001 2002
Tho
usan
dsof
hect
ares
0
1
2
3
4
5
6
7
%To
talL
and
Are
a
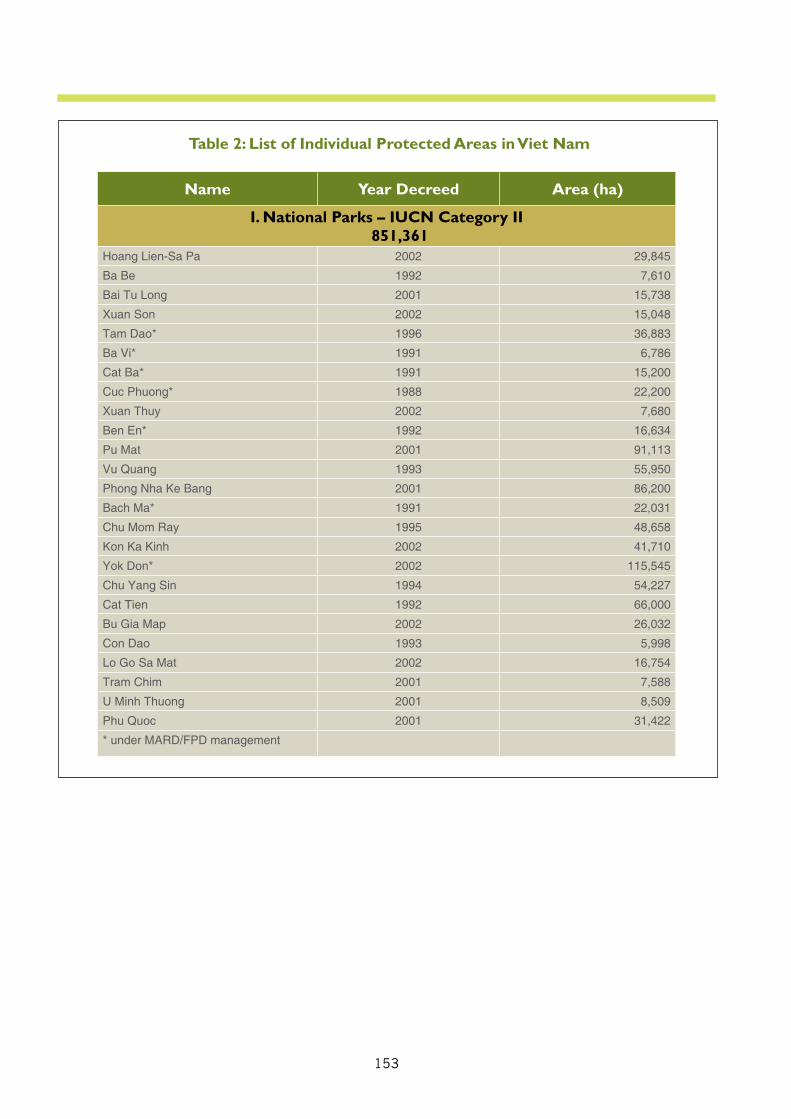
153
Table 2: List of Individual Protected Areas in Viet Nam
Name Year Decreed Area (ha)
I. National Parks – IUCN Category II 851,361
Hoang Lien-Sa Pa 2002 29,845
Ba Be 1992 7,610
Bai Tu Long 2001 15,738
Xuan Son 2002 15,048
Tam Dao* 1996 36,883
Ba Vi* 1991 6,786
Cat Ba* 1991 15,200
Cuc Phuong* 1988 22,200
Xuan Thuy 2002 7,680
Ben En* 1992 16,634
Pu Mat 2001 91,113
Vu Quang 1993 55,950
Phong Nha Ke Bang 2001 86,200
Bach Ma* 1991 22,031
Chu Mom Ray 1995 48,658
Kon Ka Kinh 2002 41,710
Yok Don* 2002 115,545
Chu Yang Sin 1994 54,227
Cat Tien 1992 66,000
Bu Gia Map 2002 26,032
Con Dao 1993 5,998
Lo Go Sa Mat 2002 16,754
Tram Chim 2001 7,588
U Minh Thuong 2001 8,509
Phu Quoc 2001 31,422
* under MARD/FPD management
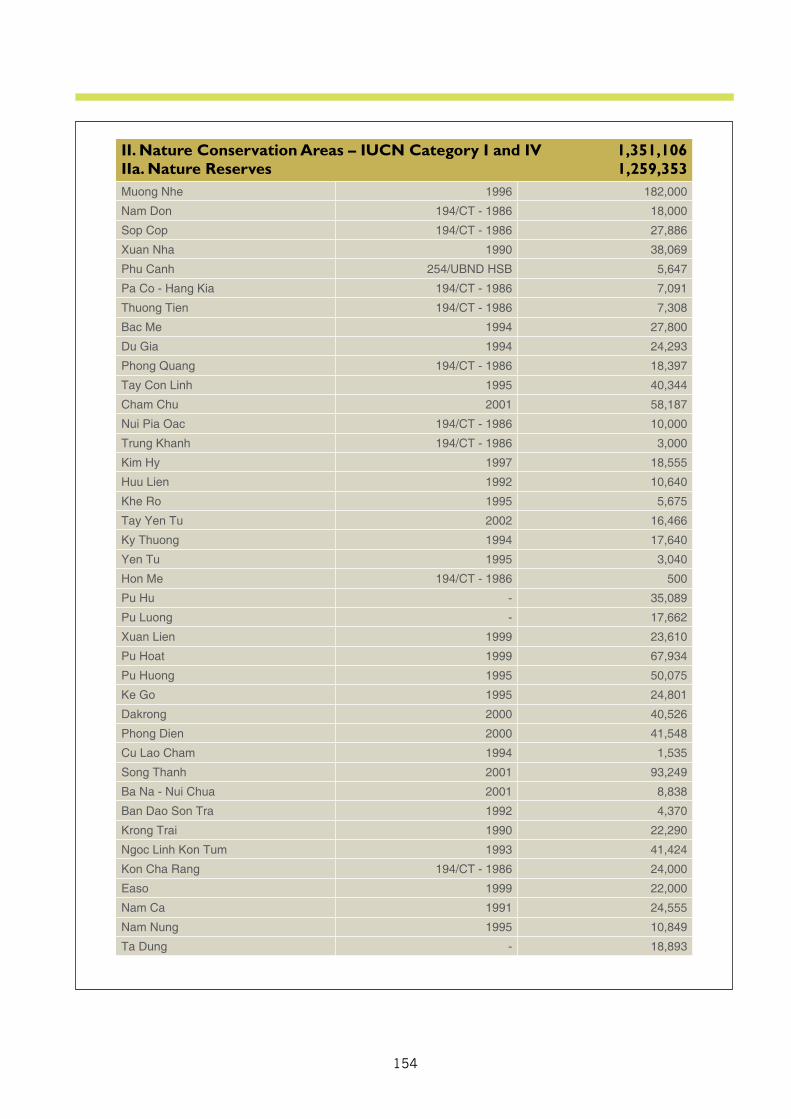
154
II. Nature Conservation Areas – IUCN Category I and IV 1,351,106IIa. Nature Reserves 1,259,353Muong Nhe 1996 182,000
Nam Don 194/CT - 1986 18,000
Sop Cop 194/CT - 1986 27,886
Xuan Nha 1990 38,069
Phu Canh 254/UBND HSB 5,647
Pa Co - Hang Kia 194/CT - 1986 7,091
Thuong Tien 194/CT - 1986 7,308
Bac Me 1994 27,800
Du Gia 1994 24,293
Phong Quang 194/CT - 1986 18,397
Tay Con Linh 1995 40,344
Cham Chu 2001 58,187
Nui Pia Oac 194/CT - 1986 10,000
Trung Khanh 194/CT - 1986 3,000
Kim Hy 1997 18,555
Huu Lien 1992 10,640
Khe Ro 1995 5,675
Tay Yen Tu 2002 16,466
Ky Thuong 1994 17,640
Yen Tu 1995 3,040
Hon Me 194/CT - 1986 500
Pu Hu - 35,089
Pu Luong - 17,662
Xuan Lien 1999 23,610
Pu Hoat 1999 67,934
Pu Huong 1995 50,075
Ke Go 1995 24,801
Dakrong 2000 40,526
Phong Dien 2000 41,548
Cu Lao Cham 1994 1,535
Song Thanh 2001 93,249
Ba Na - Nui Chua 2001 8,838
Ban Dao Son Tra 1992 4,370
Krong Trai 1990 22,290
Ngoc Linh Kon Tum 1993 41,424
Kon Cha Rang 194/CT - 1986 24,000
Easo 1999 22,000
Nam Ca 1991 24,555
Nam Nung 1995 10,849
Ta Dung - 18,893
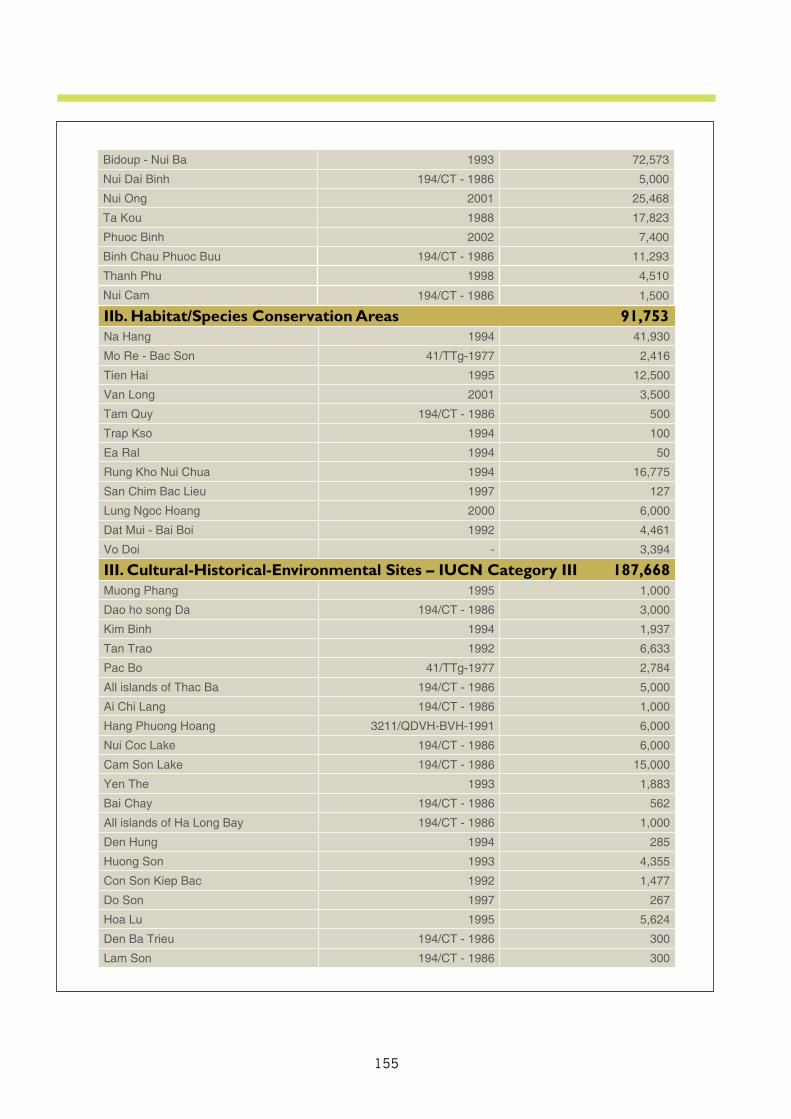
155
IIb. Habitat/Species Conservation Areas 91,753Na Hang 1994 41,930
Mo Re - Bac Son 41/TTg-1977 2,416
Tien Hai 1995 12,500
Van Long 2001 3,500
Tam Quy 194/CT - 1986 500
Trap Kso 1994 100
Ea Ral 1994 50
Rung Kho Nui Chua 1994 16,775
San Chim Bac Lieu 1997 127
Lung Ngoc Hoang 2000 6,000
Dat Mui - Bai Boi 1992 4,461
Vo Doi - 3,394
III. Cultural-Historical-Environmental Sites – IUCN Category III 187,668Muong Phang 1995 1,000
Dao ho song Da 194/CT - 1986 3,000
Kim Binh 1994 1,937
Tan Trao 1992 6,633
Pac Bo 41/TTg-1977 2,784
All islands of Thac Ba 194/CT - 1986 5,000
Ai Chi Lang 194/CT - 1986 1,000
Hang Phuong Hoang 3211/QDVH-BVH-1991 6,000
Nui Coc Lake 194/CT - 1986 6,000
Cam Son Lake 194/CT - 1986 15,000
Yen The 1993 1,883
Bai Chay 194/CT - 1986 562
All islands of Ha Long Bay 194/CT - 1986 1,000
Den Hung 1994 285
Huong Son 1993 4,355
Con Son Kiep Bac 1992 1,477
Do Son 1997 267
Hoa Lu 1995 5,624
Den Ba Trieu 194/CT - 1986 300
Lam Son 194/CT - 1986 300
Bidoup - Nui Ba 1993 72,573
Nui Dai Binh 194/CT - 1986 5,000
Nui Ong 2001 25,468
Ta Kou 1988 17,823
Phuoc Binh 2002 7,400
Binh Chau Phuoc Buu 194/CT - 1986 11,293
Thanh Phu 1998 4,510
Nui Cam 194/CT - 1986 1,500
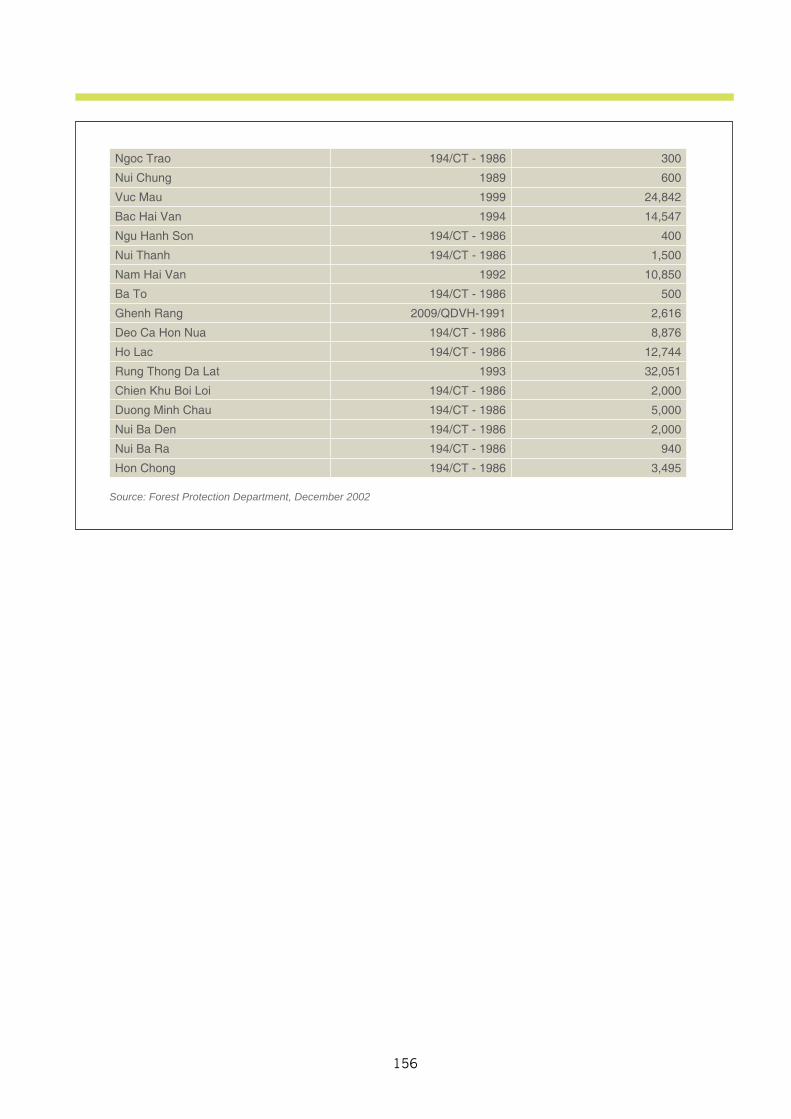
156
Ngoc Trao 194/CT - 1986 300
Nui Chung 1989 600
Vuc Mau 1999 24,842
Bac Hai Van 1994 14,547
Ngu Hanh Son 194/CT - 1986 400
Nui Thanh 194/CT - 1986 1,500
Nam Hai Van 1992 10,850
Ba To 194/CT - 1986 500
Ghenh Rang 2009/QDVH-1991 2,616
Deo Ca Hon Nua 194/CT - 1986 8,876
Ho Lac 194/CT - 1986 12,744
Rung Thong Da Lat 1993 32,051
Chien Khu Boi Loi 194/CT - 1986 2,000
Duong Minh Chau 194/CT - 1986 5,000
Nui Ba Den 194/CT - 1986 2,000
Nui Ba Ra 194/CT - 1986 940
Hon Chong 194/CT - 1986 3,495
Source: Forest Protection Department, December 2002

157
Figure 2: Population and Protected Areas in Viet Nam
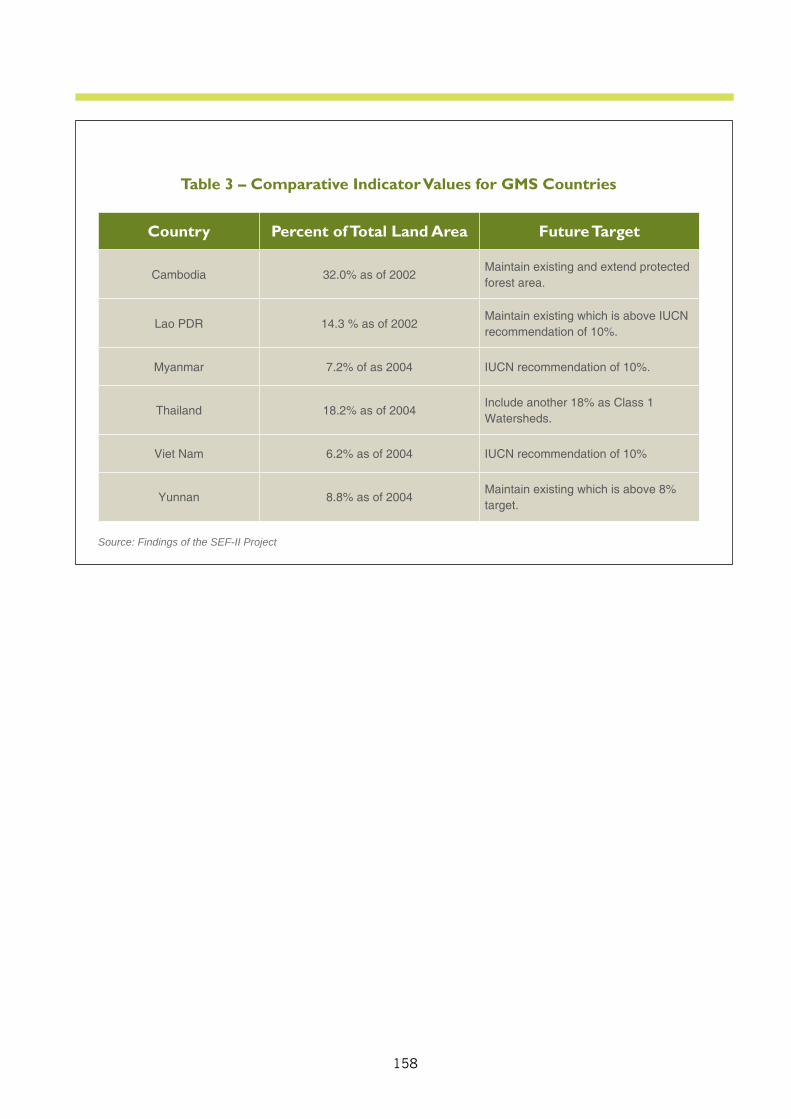
158
Table 3 – Comparative Indicator Values for GMS Countries
Country Percent of Total Land Area Future Target
Cambodia 32.0% as of 2002Maintain existing and extend protected forest area.
Lao PDR 14.3 % as of 2002Maintain existing which is above IUCN recommendation of 10%.
Myanmar 7.2% of as 2004 IUCN recommendation of 10%.
Thailand 18.2% as of 2004Include another 18% as Class 1 Watersheds.
Viet Nam 6.2% as of 2004 IUCN recommendation of 10%
Yunnan 8.8% as of 2004Maintain existing which is above 8% target.
Source: Findings of the SEF-II Project
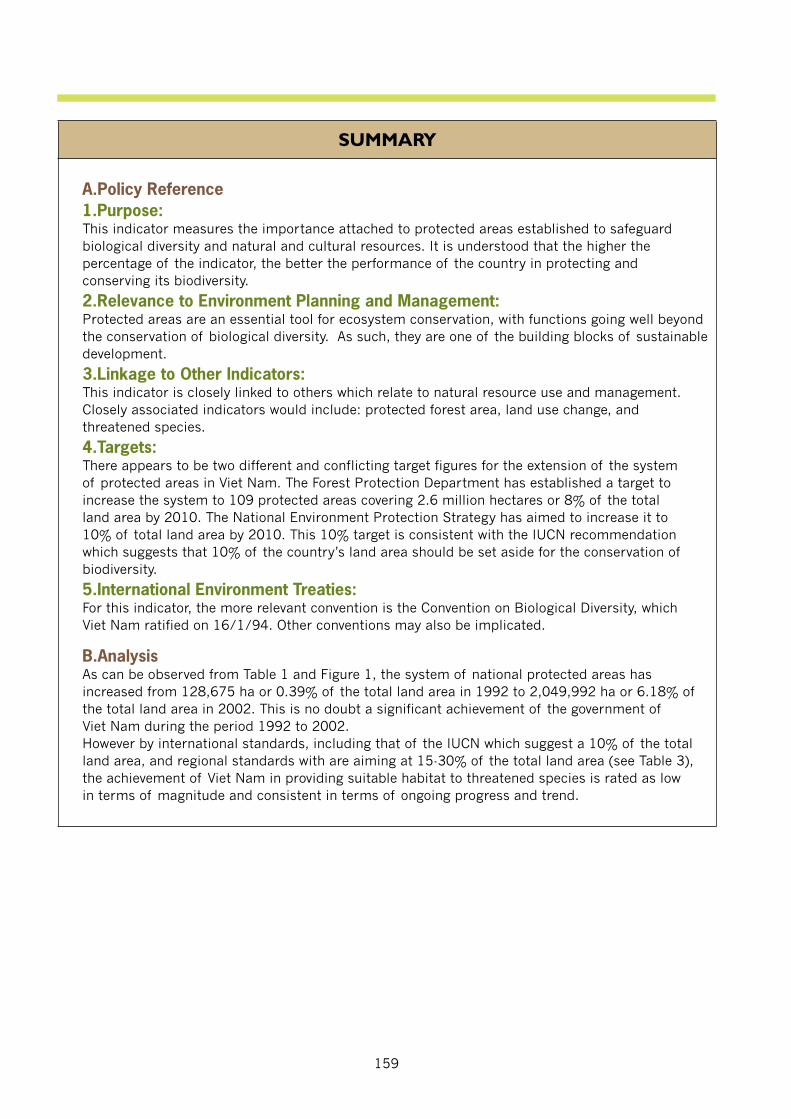
159
SUMMARY
A.Policy Reference1.Purpose: This indicator measures the importance attached to protected areas established to safeguard biological diversity and natural and cultural resources. It is understood that the higher the percentage of the indicator, the better the performance of the country in protecting and conserving its biodiversity.
2.Relevance to Environment Planning and Management: Protected areas are an essential tool for ecosystem conservation, with functions going well beyond the conservation of biological diversity. As such, they are one of the building blocks of sustainable development.
3.Linkage to Other Indicators:This indicator is closely linked to others which relate to natural resource use and management. Closely associated indicators would include: protected forest area, land use change, and threatened species.
4.Targets: There appears to be two different and conflicting target figures for the extension of the system of protected areas in Viet Nam. The Forest Protection Department has established a target to increase the system to 109 protected areas covering 2.6 million hectares or 8% of the total land area by 2010. The National Environment Protection Strategy has aimed to increase it to 10% of total land area by 2010. This 10% target is consistent with the IUCN recommendation which suggests that 10% of the country’s land area should be set aside for the conservation of biodiversity.
5.International Environment Treaties: For this indicator, the more relevant convention is the Convention on Biological Diversity, which Viet Nam ratified on 16/1/94. Other conventions may also be implicated.
B.AnalysisAs can be observed from Table 1 and Figure 1, the system of national protected areas has increased from 128,675 ha or 0.39% of the total land area in 1992 to 2,049,992 ha or 6.18% of the total land area in 2002. This is no doubt a significant achievement of the government of Viet Nam during the period 1992 to 2002.However by international standards, including that of the IUCN which suggest a 10% of the total land area, and regional standards with are aiming at 15-30% of the total land area (see Table 3), the achievement of Viet Nam in providing suitable habitat to threatened species is rated as low in terms of magnitude and consistent in terms of ongoing progress and trend.
160
Greater Mekong SubregionIndicator Fact SheetDATABASE INFORMATION
Indicator ID
Indicator Name Area of Mangrove Forest – 1943 to 2001
Year of Assessment 2005
Type of Indicator State
Frequently Asked Question (FAQ) Are mangroves being diminished as a result of developments in the coastal zone?
Priority Concern Threats to the Coastal Zone
Geographic Area Viet Nam
State & Trend Relatively Poor and Stabilizing
Key Message
Over the last five decades, Viet Nam has lost about 70 percent of its mangrove forests. Although the mangroves suffered severe losses over that period, signs of amelioration have appeared since 1995.
161
TECHNICAL INFORMATION
A.Defi nitionThis indicator tracks the area of mangroves forest over time; the result is expressed as the absolute area of remaining mangrove forest (in hectares) over time.
B.Data SourceThe data for this indicator has been collected from Report on State of Viet Nam Coastal Zone in 2004, prepared by Ministry of Nature and Environment of Viet Nam, submitted to the Viet Nam National Assembly.
C.Geographic Area / Population CoverageThe figures are representative of all mangrove forests in Viet Nam, and not necessarily only those in the coastal zone.
D.Temporal CoverageThe period of record for the indicator data is from 1943 to 2001 but only seven annual figures are provided.
E.Methodology and Frequency of CoverageThe data was extracted from the Report on State of Viet Nam Coastal Zone in 2004, prepared by Ministry of Nature and Environment of Viet Nam. The original figures were collected from various sources and in different years by different agencies, than collated by MONRE.
F.Methodology of Data ManipulationThe area figures are duplicated from the quoted source and have not been manipulated for the purpose of constructing this indicator. Percent loss since 1943 has been added for a better understanding of the historical trend.
QUALITATIVE INFORMATION
A.Strength and Weakness (data level)The figures, as published in the Report on State of Viet Nam Coastal Zone, is ideally suited as an indicator for the state of mangrove forests, especially because it illustrate the long-term trend. The main weakness at the moment is that there are not enough recent figures to better explain what appears to be a reversal in the long-term historical trends.
B.Reliability, Accuracy, Robustness, Uncertainty (data level)The figures are quoted without any statement of reliability and accuracy.
C.Future Work Required (for data level and indicator level)The indicator and the fact sheet should be updated as more recent or more accurate historical figures become available.
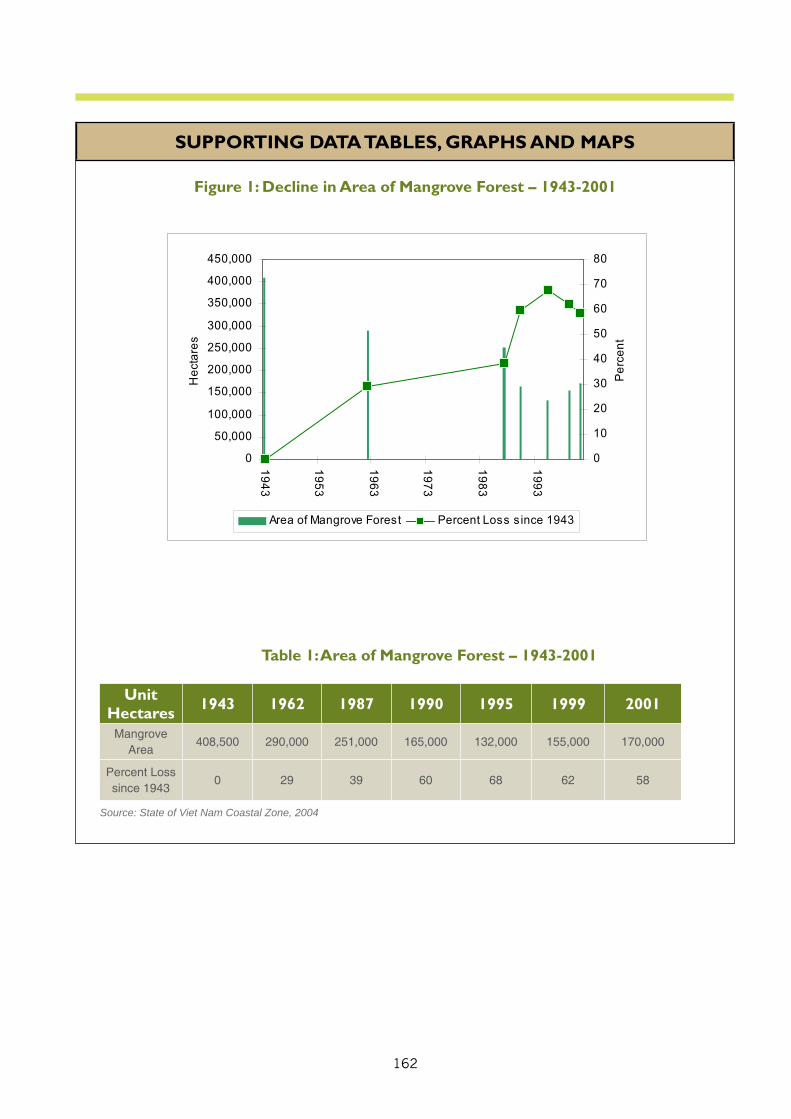
162
SUPPORTING DATA TABLES, GRAPHS AND MAPS
Figure 1: Decline in Area of Mangrove Forest – 1943-2001
Table 1: Area of Mangrove Forest – 1943-2001
Unit Hectares 1943 1962 1987 1990 1995 1999 2001
Mangrove Area
408,500 290,000 251,000 165,000 132,000 155,000 170,000
Percent Loss since 1943
0 29 39 60 68 62 58
Source: State of Viet Nam Coastal Zone, 2004
0
50,000
100,000
150,000
200,000
250,000
300,000
350,000
400,000
450,000
194
3
195
3
196
3
197
3
198
3
199
3
Hec
tare
s
0
10
20
30
40
50
60
70
80
Pe
rcen
t
Area of Mangrove Forest Percent Loss since 1943
163
SUMMARY
A.Policy Reference1.Purpose: The aim of this indicator is to assess the state of mangrove forest considered representative of the condition of coastal environments. Based on these estimates, authorities can develop a program to recover mangrove forest and assist with preservation of coastal zones in Viet Nam.
2.Relevance to Environment Planning and Management: Mangrove forests are and important habitat to many fish and bird species; they also play a vital role in protecting coastlines against natural disasters and in filtering inland water pollution.
3.Linkage to Other Indicators:This indicator may also be relevant to the protection of rare and endangered species since mangroves forests are an important habitat.
4.Targets: MONRE’s National Strategy for Environmental Protection (2010 - vision 2020) states the intention to “by 2010 … rehabilitate and increase the total mangrove forest area to 80% of the 1990 mangrove coverage”. Translating that target into figures, it corresponds to 132,000 hectares of mangrove forests by 2010, which happens to be equivalent to area of mangroves in 1995 and less than the area in 2001. The target and reality are poorly matched.
B.AnalysisLoss of mangroves seriously threatens the stability of the coastal zone in Viet Nam. Mangroves provide precious habitat to the coastal biodiversity of Viet Nam; as well as being a major source of household wood products. Mangroves are also critical to safeguarding the sanctity of the coastal shoreline by protecting it from typhoons and other coastal disturbances. The surge in shrimp farming emerges as one of the leading causes of mangrove forest destruction. Other causes of mangrove losses include conversion to agricultural and construction lands, war destruction, fuel wood collection.Table 1 and Figure 1 show the change in mangrove forest area over a fifty-year period in Viet Nam. Although the mangrove population has suffered severe losses over that period, there appears to be some amelioration of the situation after 1995. This is a result of several government- and donor-sponsored programs of mangrove rehabilitation.Over the last five decades, Viet Nam has lost about 70 percent of its mangrove forests. The situation deteriorated rapidly in the 1980s when government embarked on a “doi moi” reform program to partly move from a centrally planned economy. Initially unaccompanied by suitable safeguards, the policy initially resulted in poorly regulated industrial and commercial activities in the coastal areas. The situation seems to have improved after 1995. Rated as relatively poor and stabilizing.
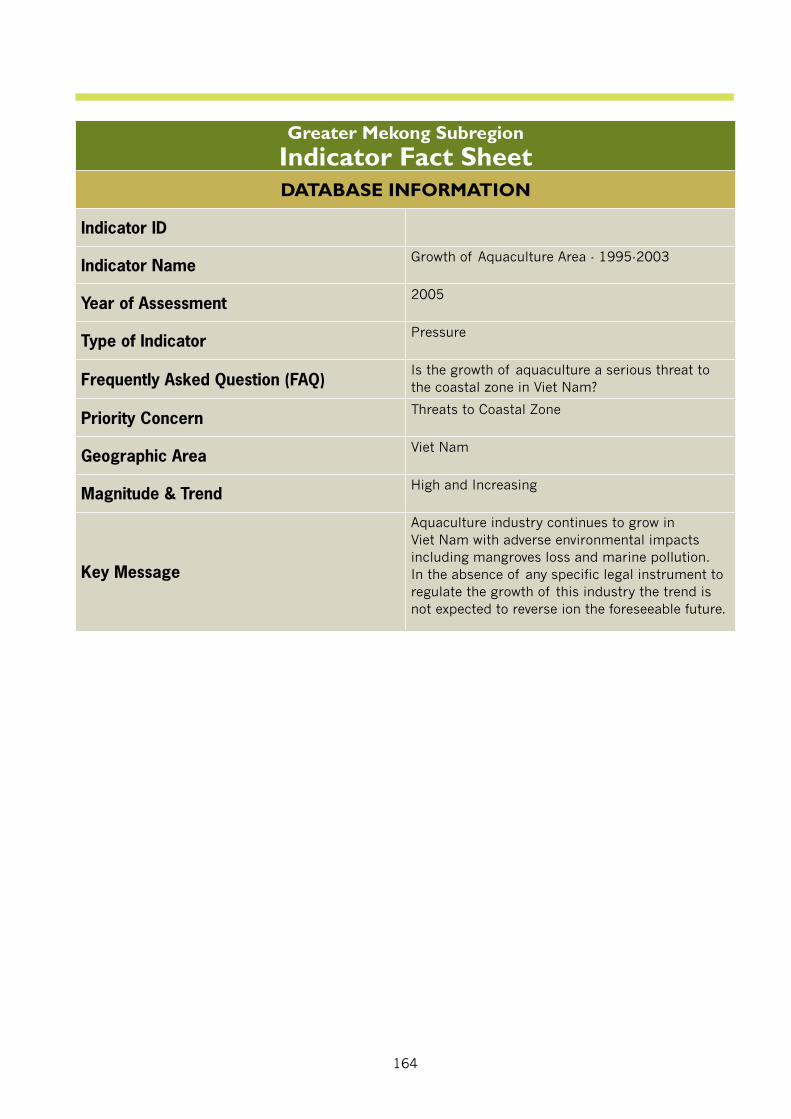
164
Greater Mekong SubregionIndicator Fact SheetDATABASE INFORMATION
Indicator ID
Indicator Name Growth of Aquaculture Area - 1995-2003
Year of Assessment 2005
Type of Indicator Pressure
Frequently Asked Question (FAQ)Is the growth of aquaculture a serious threat to the coastal zone in Viet Nam?
Priority Concern Threats to Coastal Zone
Geographic Area Viet Nam
Magnitude & Trend High and Increasing
Key Message
Aquaculture industry continues to grow in Viet Nam with adverse environmental impacts including mangroves loss and marine pollution. In the absence of any specific legal instrument to regulate the growth of this industry the trend is not expected to reverse ion the foreseeable future.
165
TECHNICAL INFORMATION
A.Defi nitionThis indicator attempts to track the growth of aquaculture within Viet Nam; it is expressed as the equivalent surface water area of aquaculture areas on an annual basis. Growth in aquaculture is the most important factor towards mangrove loss and the indicator so chosen attempts to map the growth in this activity.
B.Data SourceThe data utilized for the construction of this indicator originates from the General Statistics Office (GSO) of Viet Nam. The figures originate from annual reports of the Ministry of Fisheries. The GSO also publishes these figures by province however the provincial figures are not part of this indicator.
C.Geographic Area / Population CoverageThe original figures are representative of all aquaculture activities for the country as a whole, and not only that activity in the coastal zone. However aquaculture figures for non-coastal provinces have been excluded from this indicator. As such, the indicator is representative of all aquaculture activity in coastal provinces of Viet Nam.
D.Temporal CoverageFigures from the GSO were only available for the period 1995 to 2003.
E.Methodology and Frequency of CoverageThe GSO collects these and a variety of other related resource figures on an annual basis since 1995. It is assumed that the figures will be updated on an annual basis, as the information becomes available from the annual reports of the Ministry of Fisheries.
F.Methodology of Data ManipulationThe annual figures are quoted exactly as published (via the Internet) by the GSO and have not been manipulated in any way.
QUALITATIVE INFORMATION
A.Strength and Weakness (data level)The main advantage of this indicator is that it is constructed from readily available and published figures. The main weakness of the indicator data is that it includes all aquaculture activity at the provincial level, regardless of whether or not that activity occurs in the coastal zone.
B.Reliability, Accuracy, Robustness, Uncertainty (data level)The annual figures are quoted from the source without any statement of reliability and accuracy.
C.Future Work Required (for data level and indicator level)The indicator and the fact sheet should be updated on an annual basis as more recent figures become available from the GSO and the Ministry of Fisheries.
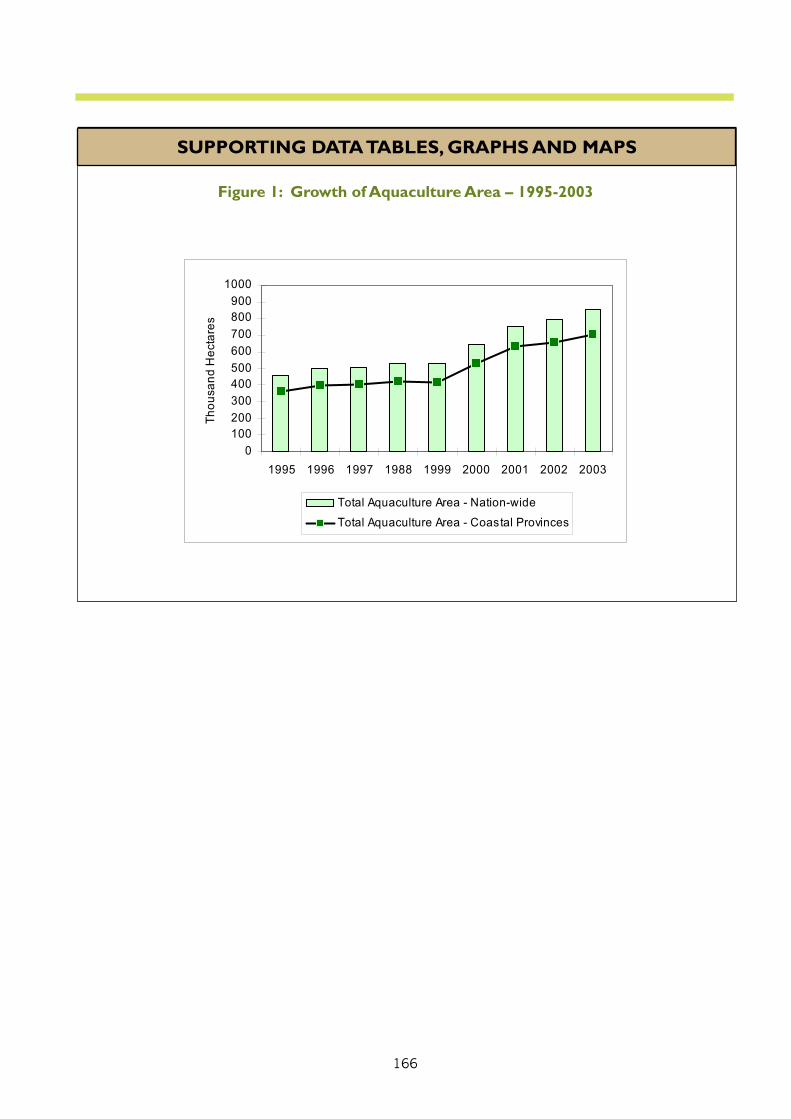
166
SUPPORTING DATA TABLES, GRAPHS AND MAPS
Figure 1: Growth of Aquaculture Area – 1995-2003
0100200300400500600700800900
1000
1995 1996 1997 1988 1999 2000 2001 2002 2003
Thou
san
dH
ect
are
s
Total Aquaculture Area - Nation-wide
Total Aquaculture Area - Coastal Provinces
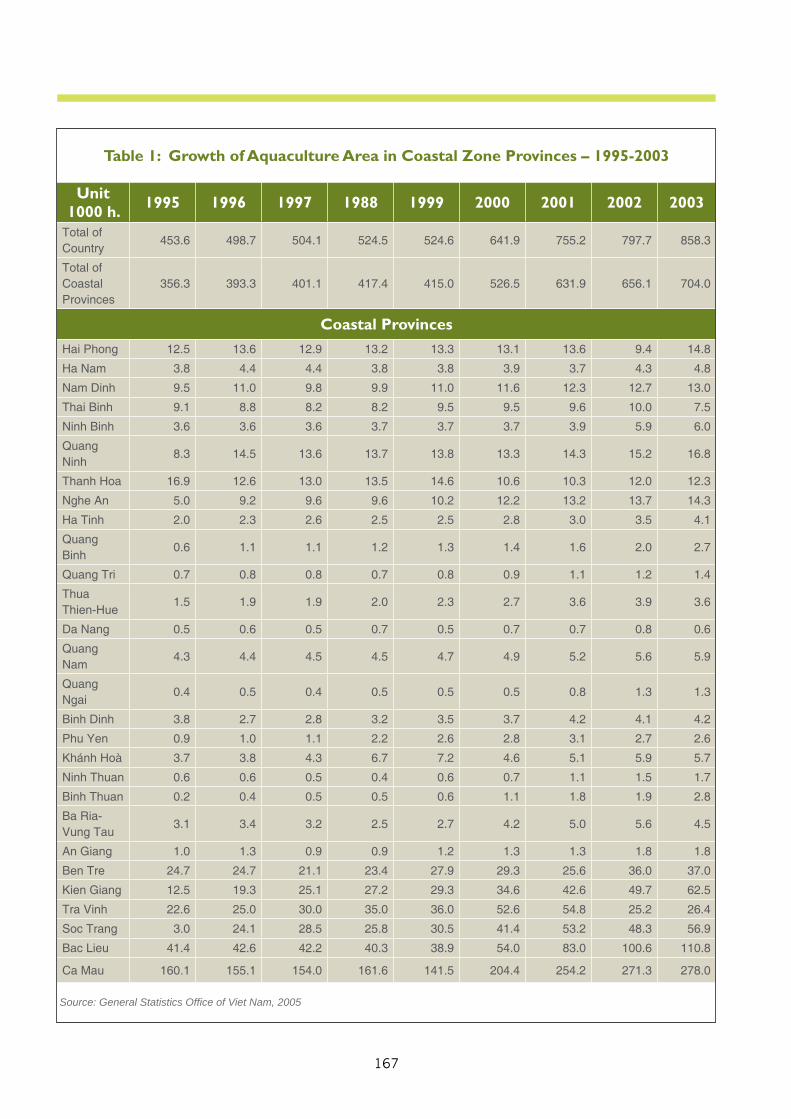
167
Unit 1000 h. 1995 1996 1997 1988 1999 2000 2001 2002 2003
Total of Country
453.6 498.7 504.1 524.5 524.6 641.9 755.2 797.7 858.3
Total of Coastal Provinces
356.3 393.3 401.1 417.4 415.0 526.5 631.9 656.1 704.0
Coastal ProvincesHai Phong 12.5 13.6 12.9 13.2 13.3 13.1 13.6 9.4 14.8
Ha Nam 3.8 4.4 4.4 3.8 3.8 3.9 3.7 4.3 4.8
Nam Dinh 9.5 11.0 9.8 9.9 11.0 11.6 12.3 12.7 13.0
Thai Binh 9.1 8.8 8.2 8.2 9.5 9.5 9.6 10.0 7.5
Ninh Binh 3.6 3.6 3.6 3.7 3.7 3.7 3.9 5.9 6.0
Quang Ninh
8.3 14.5 13.6 13.7 13.8 13.3 14.3 15.2 16.8
Thanh Hoa 16.9 12.6 13.0 13.5 14.6 10.6 10.3 12.0 12.3
Nghe An 5.0 9.2 9.6 9.6 10.2 12.2 13.2 13.7 14.3
Ha Tinh 2.0 2.3 2.6 2.5 2.5 2.8 3.0 3.5 4.1
Quang Binh
0.6 1.1 1.1 1.2 1.3 1.4 1.6 2.0 2.7
Quang Tri 0.7 0.8 0.8 0.7 0.8 0.9 1.1 1.2 1.4
Thua Thien-Hue
1.5 1.9 1.9 2.0 2.3 2.7 3.6 3.9 3.6
Da Nang 0.5 0.6 0.5 0.7 0.5 0.7 0.7 0.8 0.6
Quang Nam
4.3 4.4 4.5 4.5 4.7 4.9 5.2 5.6 5.9
Quang Ngai
0.4 0.5 0.4 0.5 0.5 0.5 0.8 1.3 1.3
Binh Dinh 3.8 2.7 2.8 3.2 3.5 3.7 4.2 4.1 4.2
Phu Yen 0.9 1.0 1.1 2.2 2.6 2.8 3.1 2.7 2.6
Khánh Hoà 3.7 3.8 4.3 6.7 7.2 4.6 5.1 5.9 5.7
Ninh Thuan 0.6 0.6 0.5 0.4 0.6 0.7 1.1 1.5 1.7
Binh Thuan 0.2 0.4 0.5 0.5 0.6 1.1 1.8 1.9 2.8
Ba Ria-Vung Tau
3.1 3.4 3.2 2.5 2.7 4.2 5.0 5.6 4.5
An Giang 1.0 1.3 0.9 0.9 1.2 1.3 1.3 1.8 1.8
Ben Tre 24.7 24.7 21.1 23.4 27.9 29.3 25.6 36.0 37.0
Kien Giang 12.5 19.3 25.1 27.2 29.3 34.6 42.6 49.7 62.5
Tra Vinh 22.6 25.0 30.0 35.0 36.0 52.6 54.8 25.2 26.4
Soc Trang 3.0 24.1 28.5 25.8 30.5 41.4 53.2 48.3 56.9
Bac Lieu 41.4 42.6 42.2 40.3 38.9 54.0 83.0 100.6 110.8
Ca Mau 160.1 155.1 154.0 161.6 141.5 204.4 254.2 271.3 278.0
Source: General Statistics Offi ce of Viet Nam, 2005
Table 1: Growth of Aquaculture Area in Coastal Zone Provinces – 1995-2003
168
SUMMARY
A.Policy Reference1.Purpose: The purpose of this indicator is to monitor the growth of aquaculture activity in the coastal zone and its impact on the coastal zone.
2.Relevance to Environment Planning and Management: Aquaculture activity is perceived to have a negative impact on the development of the coastal zone, especially where aquaculture activity destroys coastal mangroves.
3.Linkage to Other Indicators:None specifically.
4.Targets: As with most pressure indicators, there are no direct targets associated with this indicator and the purpose of the indicator is mainly to illustrate the trend. There may be government targets to increase the aquaculture area, based on economic development incentives, but there are likely no target figures to reduce the overall area based on environmental concerns.
B.AnalysisFigure 1 and Table 1 illustrate the growing trend of aquaculture activity in the coastal provinces of the country as well as aquaculture activity for the country as a whole. As can be observed, the total aquaculture area has increased more rapidly in recent years, from 524,600 hectares nationwide in 1999 to 858,300 hectares in year 2003. The trend is the same in coastal provinces as it is nationwide.Aquaculture industry continues to grow in Viet Nam with adverse environmental impacts including mangroves loss and marine pollution. In the absence of any specific legal instrument to regulate the growth of this industry the trend is not expected to reverse in the foreseeable future. Based on these observations and the indicator results, it is concluded that the pressure from aquaculture activity in the coastal zone is high with an ever-increasing trend.
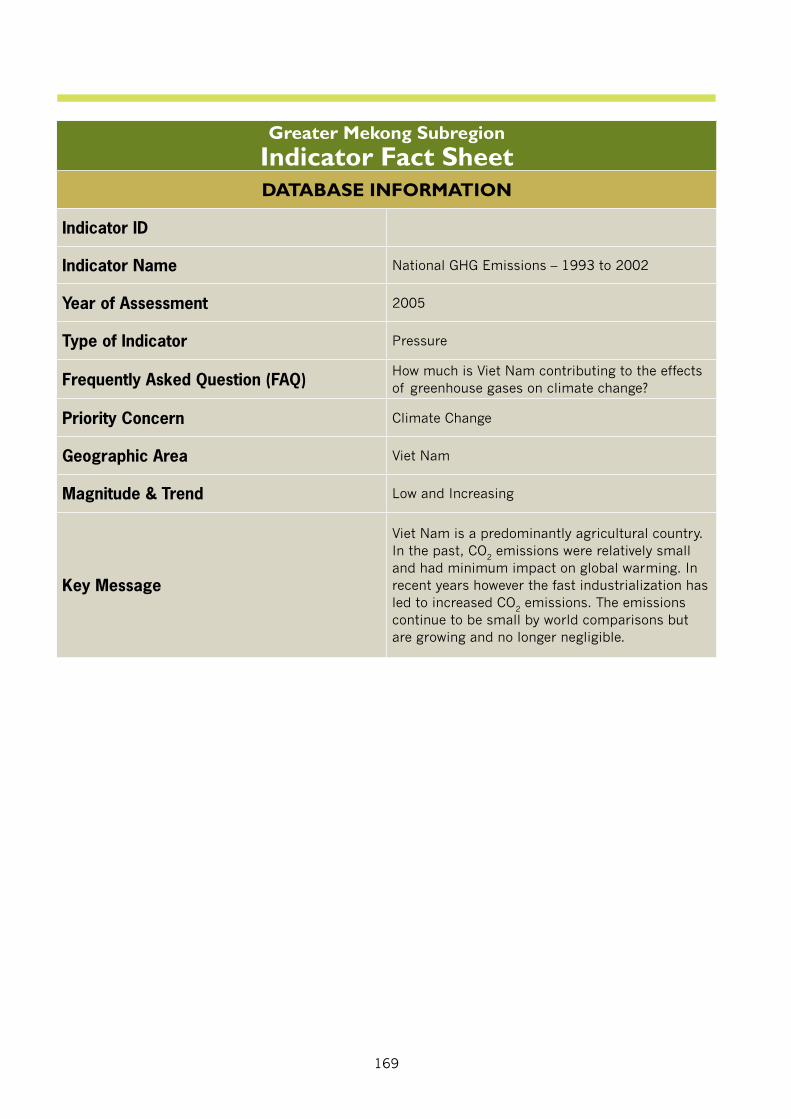
169
Greater Mekong SubregionIndicator Fact SheetDATABASE INFORMATION
Indicator ID
Indicator Name National GHG Emissions – 1993 to 2002
Year of Assessment 2005
Type of Indicator Pressure
Frequently Asked Question (FAQ) How much is Viet Nam contributing to the effects of greenhouse gases on climate change?
Priority Concern Climate Change
Geographic Area Viet Nam
Magnitude & Trend Low and Increasing
Key Message
Viet Nam is a predominantly agricultural country. In the past, CO2 emissions were relatively small and had minimum impact on global warming. In recent years however the fast industrialization has led to increased CO2 emissions. The emissions continue to be small by world comparisons but are growing and no longer negligible.
170
TECHNICAL INFORMATION
A.Defi nitionThis indicator tracks the amount of greenhouse gas (GHGs) emitted by various sectors of the country; it is expressed in terms of annual estimated gigagrams (Gg) of Carbon Dioxide (CO2) equivalent.
B.Data SourceThe data utilized for the construction of this indicator originate from the National Climate Change and Ozone Protection Office (NCCOP) within the Ministry of Natural Resources and Environment (MONRE). The data are a consolidation of three separate greenhouse gas inventories. The first inventory was conducted as part of the Asia Least-Cost Greenhouse Gas Abatement Strategy (ALGAS) project. Based on that research and experience, a second inventory was conducted to form the basis of the First National Communication to the United Nations Framework Convention on Climate Change (UNFCCC). The third and most recent inventory was conducted by the NCCOP.
C.Geographic Area / Population CoverageThe data and the estimates of CO2 emissions are representative of GHGs for the country as a whole.
D.Temporal CoverageThe ALGAS project provided inventory figures for 1993 as well as GHG projections for 2000, 2010 and 2020. The First National Communication to the UNFCCC provided inventory figures for 1994 (the IPCC baseline year) as well as revised projections for year 2000, 2010 and 2020. The latest work by the NCCOP provides inventory figures for 1998 and 2002.
E.Methodology and Frequency of CoverageThe estimates for GHG emissions are made according to latest 1996 Intergovernmental Panel on Climate Change (IPCC) guidelines. According to the Climate Change Convention, each non-Annex I party, of which Viet Nam is one, was required to submit an initial country communication within three years of entry into force of the Convention for that party. That initial communication was submitted to the UNFCCC in year 2003. There is no specific deadline for the submission of subsequent communication but a 2nd communication was in preparation within the NCCOP office in July, 2005.
F.Methodology of Data ManipulationThe figures for GHG emissions are quoted directly from the 4th draft report to the UNFCCC compiled by MONRE in July, 2005.Some of the resulting energy sector figures for 1993 may appear different from what previously reported in ALGAS reports. It is assumed that these revised figures are the further work of the NCCOP to improve the results of the ALGAS study.
171
QUALITATIVE INFORMATION
A.Strength and Weakness (data level)The main advantage of this indicator is that is it based on ongoing monitoring and work from the National Climate Change and Ozone Protection Office. There are known weaknesses in the figures but these are well documented in the reports submitted to the UNFCCC.
B.Reliability, Accuracy, Robustness, Uncertainty (data level)The data of this indicator for the years 1993-2002 are based on real inventory estimates; the data for the years 2010 and 2020 are future projections. The figures in this current fact sheet capture CO2 emissions from the most important contributing sectors but there still do not account for some other sources of emissions such as combustion of medicinal waste, transport vehicles etc. It is also noted that the estimates for 1994 do not include emissions from Industrial Processes and Waste, which occupied about 6.2% equal to 6.4 million tons, as later calculated by experts of MONRE.
C.Future Work Required (for data level and indicator level)The indicator and the fact sheet should be updated as new or revised figures become available from the National Climate Change and Ozone Protection Office. The next update will likely be coincident with the submission of the 2nd communication to the UNFCCC.
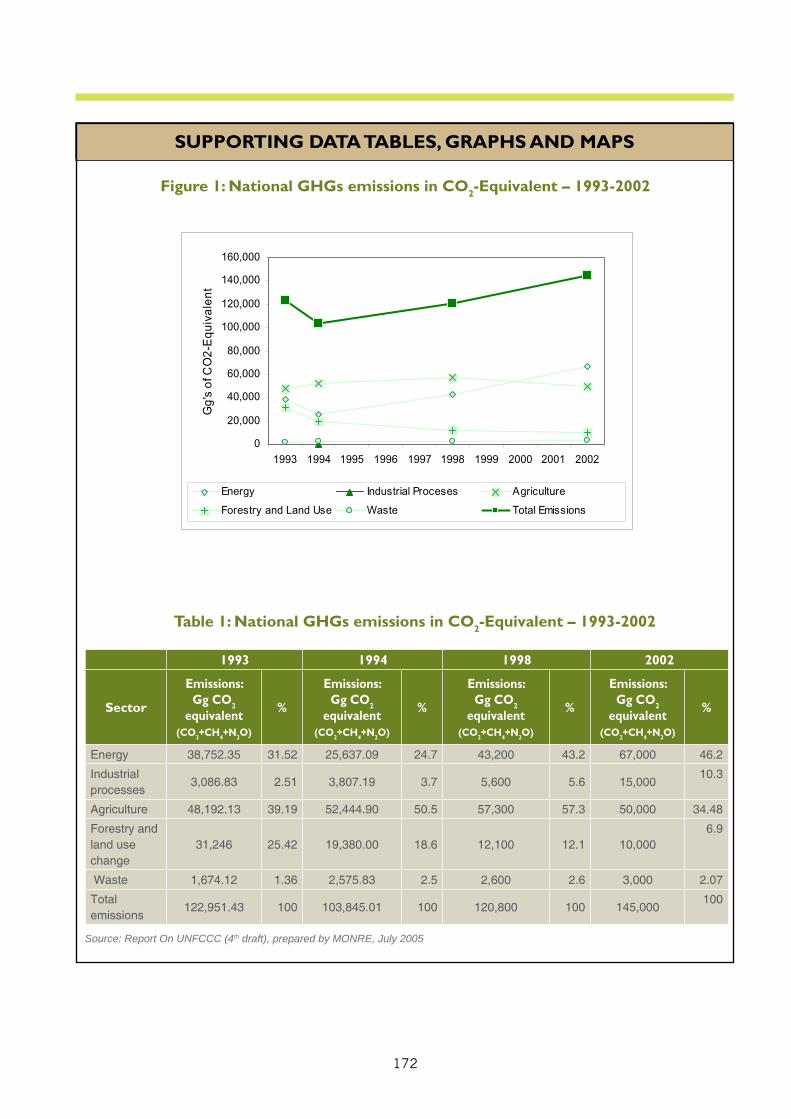
172
SUPPORTING DATA TABLES, GRAPHS AND MAPS
Figure 1: National GHGs emissions in CO2-Equivalent – 1993-2002
Table 1: National GHGs emissions in CO2-Equivalent – 1993-2002
1993 1994 1998 2002
Sector
Emissions:Gg CO2
equivalent (CO2+CH4+N2O)
%
Emissions:Gg CO2
equivalent (CO2+CH4+N2O)
%
Emissions:Gg CO2
equivalent (CO2+CH4+N2O)
%
Emissions:Gg CO2
equivalent (CO2+CH4+N2O)
%
Energy 38,752.35 31.52 25,637.09 24.7 43,200 43.2 67,000 46.2
Industrial processes
3,086.83 2.51 3,807.19 3.7 5,600 5.6 15,00010.3
Agriculture 48,192.13 39.19 52,444.90 50.5 57,300 57.3 50,000 34.48
Forestry and land use change
31,246 25.42 19,380.00 18.6 12,100 12.1 10,0006.9
Waste 1,674.12 1.36 2,575.83 2.5 2,600 2.6 3,000 2.07
Total emissions
122,951.43 100 103,845.01 100 120,800 100 145,000100
Source: Report On UNFCCC (4th draft), prepared by MONRE, July 2005
0
20,000
40,000
60,000
80,000
100,000
120,000
140,000
160,000
1993 1994 1995 1996 1997 1998 1999 2000 2001 2002
Gg
'so
fCO
2-E
qui
vale
nt
Energy Industrial Proceses Agriculture
Forestry and Land Use Waste Total Emissions
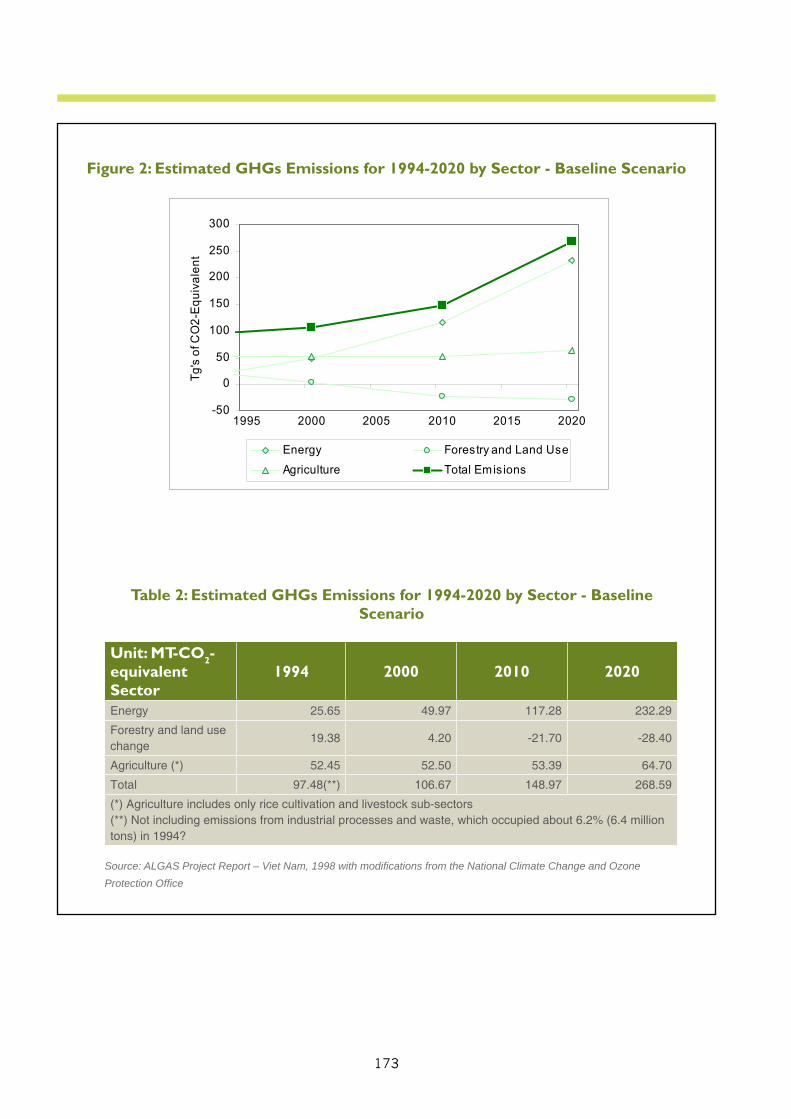
173
Figure 2: Estimated GHGs Emissions for 1994-2020 by Sector - Baseline Scenario
Table 2: Estimated GHGs Emissions for 1994-2020 by Sector - Baseline Scenario
Unit: MT-CO2-equivalentSector
1994 2000 2010 2020
Energy 25.65 49.97 117.28 232.29
Forestry and land use change
19.38 4.20 -21.70 -28.40
Agriculture (*) 52.45 52.50 53.39 64.70
Total 97.48(**) 106.67 148.97 268.59
(*) Agriculture includes only rice cultivation and livestock sub-sectors(**) Not including emissions from industrial processes and waste, which occupied about 6.2% (6.4 million tons) in 1994?
Source: ALGAS Project Report – Viet Nam, 1998 with modifi cations from the National Climate Change and Ozone Protection Offi ce
-50
0
50
100
150
200
250
300
1995 2000 2005 2010 2015 2020
Tg'
sof
CO
2-E
qui
vale
nt
Energy Forestry and Land Use
Agriculture Total Emis ions
174
SUMMARY
A.Policy Reference1.Purpose: The purpose of this indicator is to estimate the quantity of GHG emissions from five main sectors: energy, industrial processes, agriculture, land use change & forestry, and wastes. It is understood that the higher the amount of GHG emissions, the greater the country’s “contribution” to the global warming, i.e. the poorer the performance.
2.Relevance to Environment Planning and Management: Anthropogenic emissions have been identified as a source of climate change and are the main subject of UNFCC. The emissions are significantly influenced by the national energy consumption and production systems, the country’s industrial processes, its transportation system, its agricultural and forestry sectors and consumption patterns. Climate change is in part a result of increased concentration of GHGs in the atmosphere. Global warming due to anthropogenic emissions of GHGs may have no adverse effect on ecosystems if the increase in global temperature is within 0.1 ˚C per decade, with a maximum total warming of 2 ˚C above the pre-industrial situation. Given the increase in the atmospheric concentration of GHGs in recent years, the global temperature may increase more rapidly and randomly than ever before. Based on the research findings, the IPCC expects that the earth’s temperature could rise by between one and 3.5 ˚C by 2010, an average rate of warming probably higher than at any time in the last 10,000 years.
3.Linkage to Other Indicators:The indicator is closely linked to many other socioeconomic and environmental indicators for example GDP per capita, annual energy consumption per capita, environmental protection expenditure and expenditures on air pollution abatement.
4.Targets: There are no target figures specifically aimed at this indicator but in Viet Nam there is the requirement to comply with the strategy as set forth in The Viet Nam Environment Strategy 2004 aims to reduce the fuel and energy consumption, to invest in innovation technologies and in transport vehicles to minimize the volume of CO2 emissions.
5.International Environment Treaties: The relevant convention is the United Nations Framework Convention on Climate Change and the Kyoto Protocol with Viet Nam ratified on 16/11/94 and 25/09/02 respectively.
175
All signatories to the Convention are to designate a national focal point; Viet Nam has complied with this requirement. Each non-Annex I party was required to submit an initial country communication within three years of entry into force of the Convention for that party (or the availability of financial resources). The Initial Country Report was to include a 1994 baseline inventory of GHG along with projections to 2020. Viet Nam complied with that requirement in 2003. In due time and with no specific deadline, non-Annex I parties will be required to submit a second country communication. The National Climate Change and Ozone Protection Office for Viet Nam already on the 4th draft of such submission.As non-Annex I parties, GMS countries are not required to set targets for GHG emissions, nor are they required to submit to the secretariat national annual GHG inventories of anthropogenic emissions by sources and removals by sinks of greenhouse gases not controlled by the Montreal Protocol.
B.AnalysisAs can be observed from Figure 1 and Table 1, total GHG emissions in CO2-equivalent were estimated at approximately 120,000 Gg in 1993 and are estimated to have risen to 145,000 Gg in 2002.Until year 1998, the agricultural sector was the dominant source of GHG emissions, accounting for approximately 50% of all emissions in 1994. While emissions from this sector are estimated to rise slightly in 1998, emissions from the energy sector have likely surpassed those of the agricultural sector by the turn of the century (see Figure 2 and Table 2). In year 2002, emissions from the energy sector accounted for approximately 46% of all national emissions. Emissions from waste were minimal in all inventory years. Emissions from industrial processes are relatively small but may take on higher proportion in the future. Emissions from Forestry and Land Use Change (FLUC) were significant in 1993 but are estimated to become less significant as forest cover increases and become more of a sink of GHGs. As with most other GMS countries, emissions from the energy sector are expected to dominate in the future. As a non-Annex I party to the Convention, the UNFCCC rates Viet Nam’s contribution to global warming as being low. Based on observed trends and projections of this indicator and fact sheet, it is concluded that the pressure on global warming originating from Viet Nam is low and increasing.
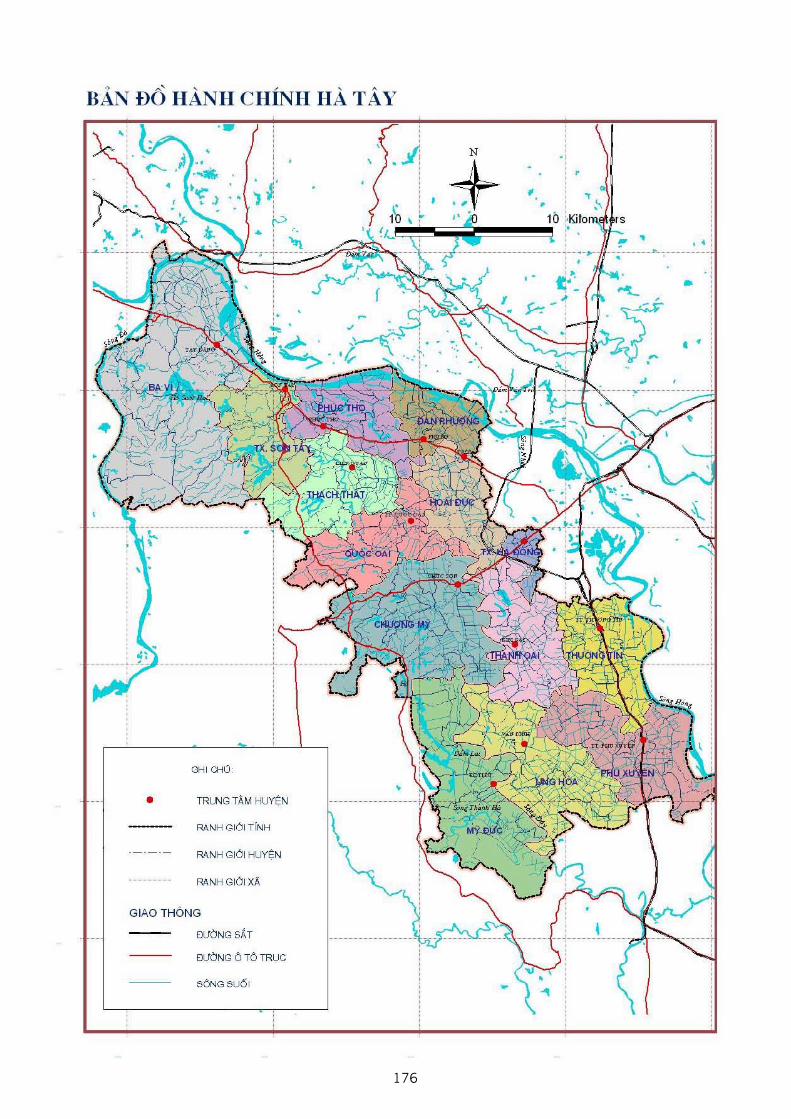
176
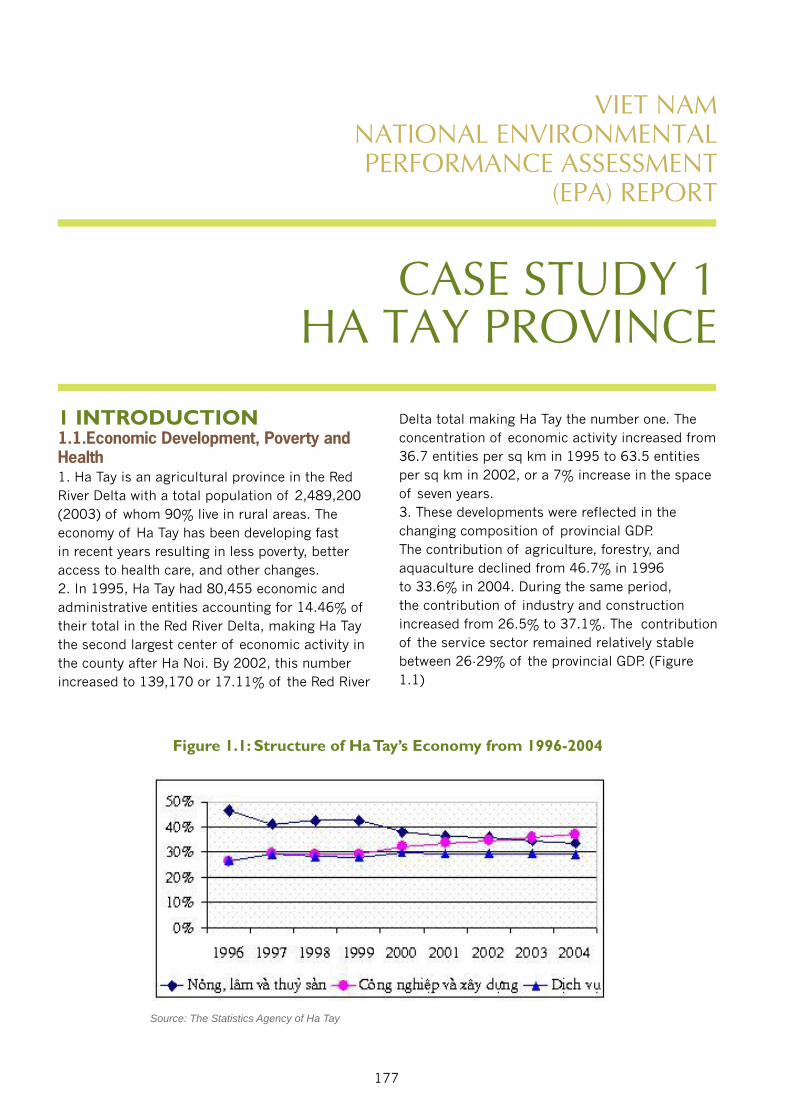
177
CASE STUDY 1 HA TAY PROVINCE
1 INTRODUCTION 1.1.Economic Development, Poverty and Health 1. Ha Tay is an agricultural province in the Red River Delta with a total population of 2,489,200 (2003) of whom 90% live in rural areas. The economy of Ha Tay has been developing fast in recent years resulting in less poverty, better access to health care, and other changes.2. In 1995, Ha Tay had 80,455 economic and administrative entities accounting for 14.46% of their total in the Red River Delta, making Ha Tay the second largest center of economic activity in the county after Ha Noi. By 2002, this number increased to 139,170 or 17.11% of the Red River
Delta total making Ha Tay the number one. The concentration of economic activity increased from 36.7 entities per sq km in 1995 to 63.5 entities per sq km in 2002, or a 7% increase in the space of seven years. 3. These developments were reflected in the changing composition of provincial GDP. The contribution of agriculture, forestry, and aquaculture declined from 46.7% in 1996 to 33.6% in 2004. During the same period, the contribution of industry and construction increased from 26.5% to 37.1%. The contribution of the service sector remained relatively stable between 26-29% of the provincial GDP. (Figure 1.1)
Figure 1.1: Structure of Ha Tay’s Economy from 1996-2004
Source: The Statistics Agency of Ha Tay
VIET NAM NATIONAL ENVIRONMENTAL PERFORMANCE ASSESSMENT
(EPA) REPORT
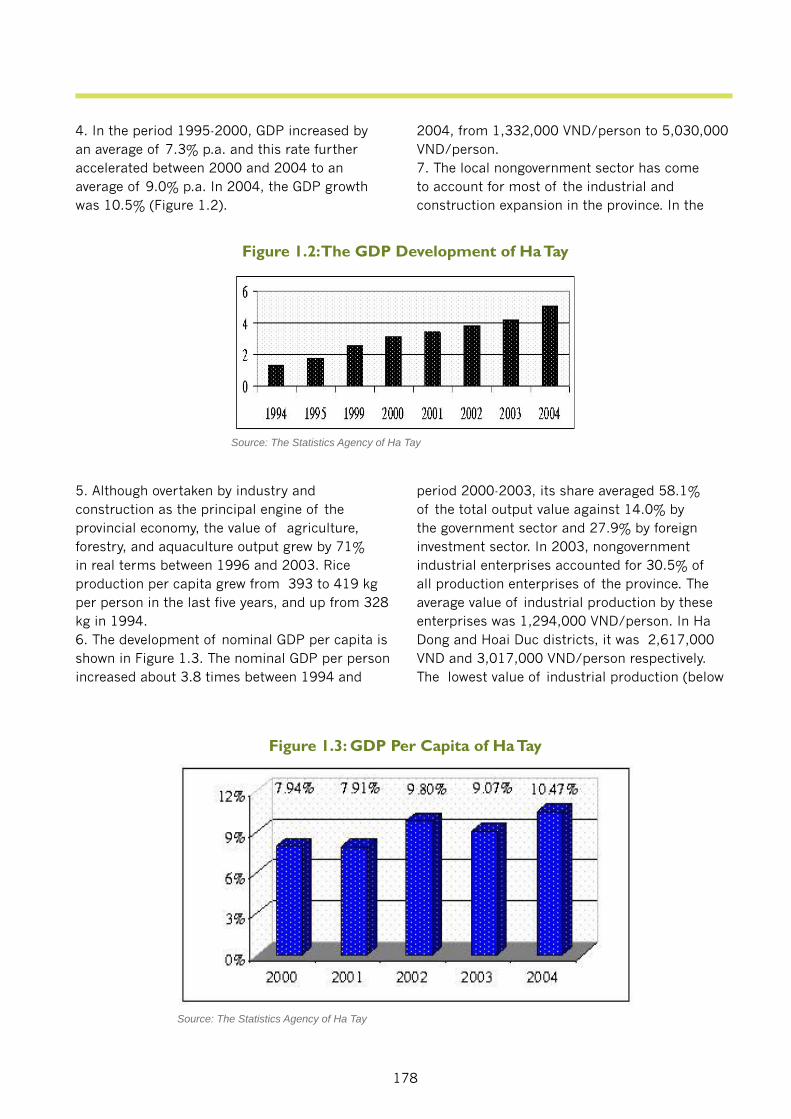
178
4. In the period 1995-2000, GDP increased by an average of 7.3% p.a. and this rate further accelerated between 2000 and 2004 to an average of 9.0% p.a. In 2004, the GDP growth was 10.5% (Figure 1.2).
5. Although overtaken by industry and construction as the principal engine of the provincial economy, the value of agriculture, forestry, and aquaculture output grew by 71% in real terms between 1996 and 2003. Rice production per capita grew from 393 to 419 kg per person in the last five years, and up from 328 kg in 1994. 6. The development of nominal GDP per capita is shown in Figure 1.3. The nominal GDP per person increased about 3.8 times between 1994 and
Figure 1.2: The GDP Development of Ha Tay
Source: The Statistics Agency of Ha Tay
Figure 1.3: GDP Per Capita of Ha Tay
2004, from 1,332,000 VND/person to 5,030,000 VND/person.7. The local nongovernment sector has come to account for most of the industrial and construction expansion in the province. In the
Source: The Statistics Agency of Ha Tay
period 2000-2003, its share averaged 58.1% of the total output value against 14.0% by the government sector and 27.9% by foreign investment sector. In 2003, nongovernment industrial enterprises accounted for 30.5% of all production enterprises of the province. The average value of industrial production by these enterprises was 1,294,000 VND/person. In Ha Dong and Hoai Duc districts, it was 2,617,000 VND and 3,017,000 VND/person respectively. The lowest value of industrial production (below
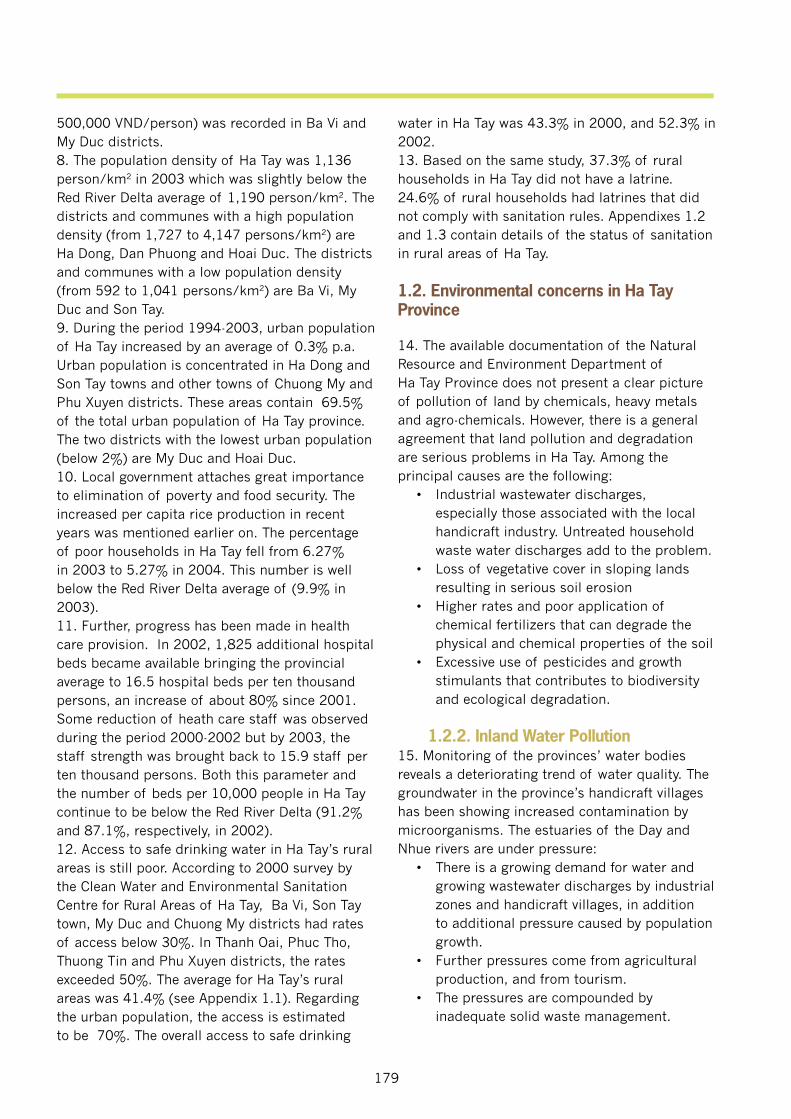
179
500,000 VND/person) was recorded in Ba Vi and My Duc districts.8. The population density of Ha Tay was 1,136 person/km2 in 2003 which was slightly below the Red River Delta average of 1,190 person/km2. The districts and communes with a high population density (from 1,727 to 4,147 persons/km2) are Ha Dong, Dan Phuong and Hoai Duc. The districts and communes with a low population density (from 592 to 1,041 persons/km2) are Ba Vi, My Duc and Son Tay.9. During the period 1994-2003, urban population of Ha Tay increased by an average of 0.3% p.a. Urban population is concentrated in Ha Dong and Son Tay towns and other towns of Chuong My and Phu Xuyen districts. These areas contain 69.5% of the total urban population of Ha Tay province. The two districts with the lowest urban population (below 2%) are My Duc and Hoai Duc.10. Local government attaches great importance to elimination of poverty and food security. The increased per capita rice production in recent years was mentioned earlier on. The percentage of poor households in Ha Tay fell from 6.27% in 2003 to 5.27% in 2004. This number is well below the Red River Delta average of (9.9% in 2003).11. Further, progress has been made in health care provision. In 2002, 1,825 additional hospital beds became available bringing the provincial average to 16.5 hospital beds per ten thousand persons, an increase of about 80% since 2001. Some reduction of heath care staff was observed during the period 2000-2002 but by 2003, the staff strength was brought back to 15.9 staff per ten thousand persons. Both this parameter and the number of beds per 10,000 people in Ha Tay continue to be below the Red River Delta (91.2% and 87.1%, respectively, in 2002). 12. Access to safe drinking water in Ha Tay’s rural areas is still poor. According to 2000 survey by the Clean Water and Environmental Sanitation Centre for Rural Areas of Ha Tay, Ba Vi, Son Tay town, My Duc and Chuong My districts had rates of access below 30%. In Thanh Oai, Phuc Tho, Thuong Tin and Phu Xuyen districts, the rates exceeded 50%. The average for Ha Tay’s rural areas was 41.4% (see Appendix 1.1). Regarding the urban population, the access is estimated to be 70%. The overall access to safe drinking
water in Ha Tay was 43.3% in 2000, and 52.3% in 2002.13. Based on the same study, 37.3% of rural households in Ha Tay did not have a latrine. 24.6% of rural households had latrines that did not comply with sanitation rules. Appendixes 1.2 and 1.3 contain details of the status of sanitation in rural areas of Ha Tay.
1.2. Environmental concerns in Ha Tay Province1.2.1. Land Degradation14. The available documentation of the Natural Resource and Environment Department of Ha Tay Province does not present a clear picture of pollution of land by chemicals, heavy metals and agro-chemicals. However, there is a general agreement that land pollution and degradation are serious problems in Ha Tay. Among the principal causes are the following: • Industrial wastewater discharges, especially those associated with the local handicraft industry. Untreated household waste water discharges add to the problem. • Loss of vegetative cover in sloping lands resulting in serious soil erosion • Higher rates and poor application of chemical fertilizers that can degrade the physical and chemical properties of the soil • Excessive use of pesticides and growth stimulants that contributes to biodiversity and ecological degradation.
1.2.2. Inland Water Pollution15. Monitoring of the provinces’ water bodies reveals a deteriorating trend of water quality. The groundwater in the province’s handicraft villages has been showing increased contamination by microorganisms. The estuaries of the Day and Nhue rivers are under pressure: • There is a growing demand for water and growing wastewater discharges by industrial zones and handicraft villages, in addition to additional pressure caused by population growth. • Further pressures come from agricultural production, and from tourism. • The pressures are compounded by inadequate solid waste management.
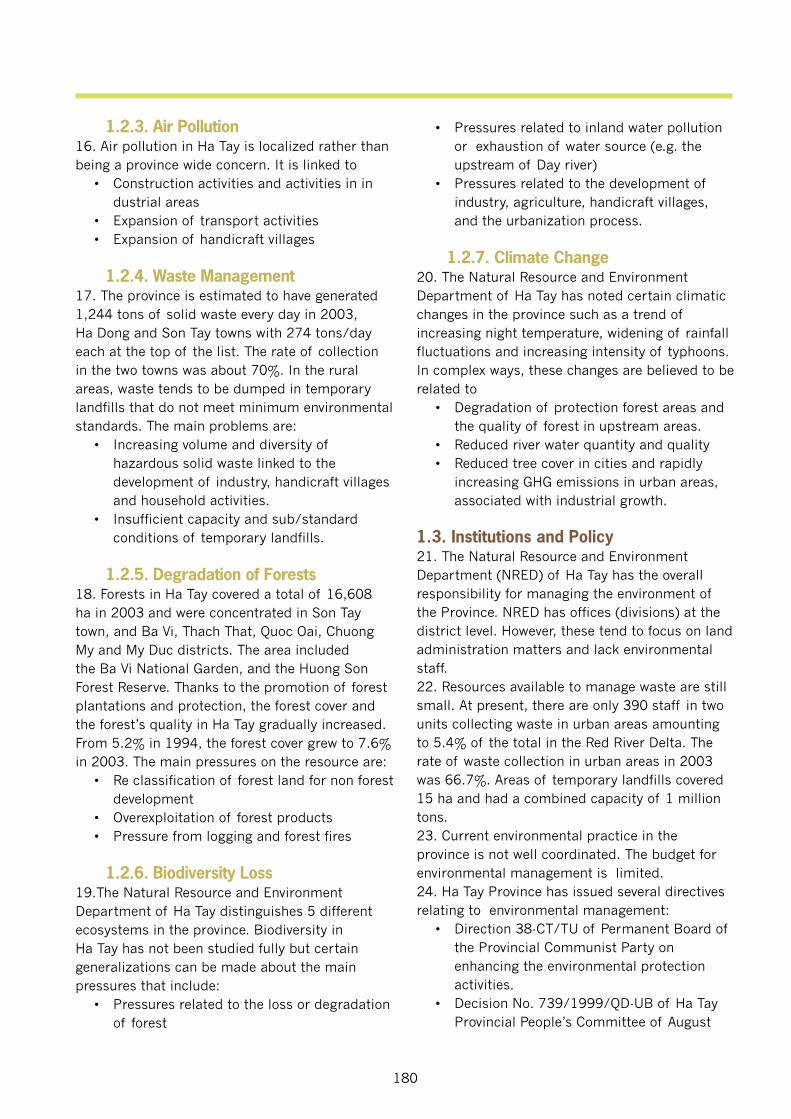
180
1.2.3. Air Pollution16. Air pollution in Ha Tay is localized rather than being a province wide concern. It is linked to • Construction activities and activities in in dustrial areas • Expansion of transport activities • Expansion of handicraft villages
1.2.4. Waste Management17. The province is estimated to have generated 1,244 tons of solid waste every day in 2003, Ha Dong and Son Tay towns with 274 tons/day each at the top of the list. The rate of collection in the two towns was about 70%. In the rural areas, waste tends to be dumped in temporary landfills that do not meet minimum environmental standards. The main problems are: • Increasing volume and diversity of hazardous solid waste linked to the development of industry, handicraft villages and household activities. • Insufficient capacity and sub/standard conditions of temporary landfills.
1.2.5. Degradation of Forests 18. Forests in Ha Tay covered a total of 16,608 ha in 2003 and were concentrated in Son Tay town, and Ba Vi, Thach That, Quoc Oai, Chuong My and My Duc districts. The area included the Ba Vi National Garden, and the Huong Son Forest Reserve. Thanks to the promotion of forest plantations and protection, the forest cover and the forest’s quality in Ha Tay gradually increased. From 5.2% in 1994, the forest cover grew to 7.6% in 2003. The main pressures on the resource are: • Re classification of forest land for non forest development • Overexploitation of forest products • Pressure from logging and forest fires
1.2.6. Biodiversity Loss19.The Natural Resource and Environment Department of Ha Tay distinguishes 5 different ecosystems in the province. Biodiversity in Ha Tay has not been studied fully but certain generalizations can be made about the main pressures that include: • Pressures related to the loss or degradation of forest
• Pressures related to inland water pollution or exhaustion of water source (e.g. the upstream of Day river) • Pressures related to the development of industry, agriculture, handicraft villages, and the urbanization process.
1.2.7. Climate Change20. The Natural Resource and Environment Department of Ha Tay has noted certain climatic changes in the province such as a trend of increasing night temperature, widening of rainfall fluctuations and increasing intensity of typhoons. In complex ways, these changes are believed to be related to • Degradation of protection forest areas and the quality of forest in upstream areas. • Reduced river water quantity and quality • Reduced tree cover in cities and rapidly increasing GHG emissions in urban areas, associated with industrial growth.
1.3. Institutions and Policy21. The Natural Resource and Environment Department (NRED) of Ha Tay has the overall responsibility for managing the environment of the Province. NRED has offices (divisions) at the district level. However, these tend to focus on land administration matters and lack environmental staff.22. Resources available to manage waste are still small. At present, there are only 390 staff in two units collecting waste in urban areas amounting to 5.4% of the total in the Red River Delta. The rate of waste collection in urban areas in 2003 was 66.7%. Areas of temporary landfills covered 15 ha and had a combined capacity of 1 million tons. 23. Current environmental practice in the province is not well coordinated. The budget for environmental management is limited.24. Ha Tay Province has issued several directives relating to environmental management: • Direction 38-CT/TU of Permanent Board of the Provincial Communist Party on enhancing the environmental protection activities. • Decision No. 739/1999/QD-UB of Ha Tay Provincial People’s Committee of August
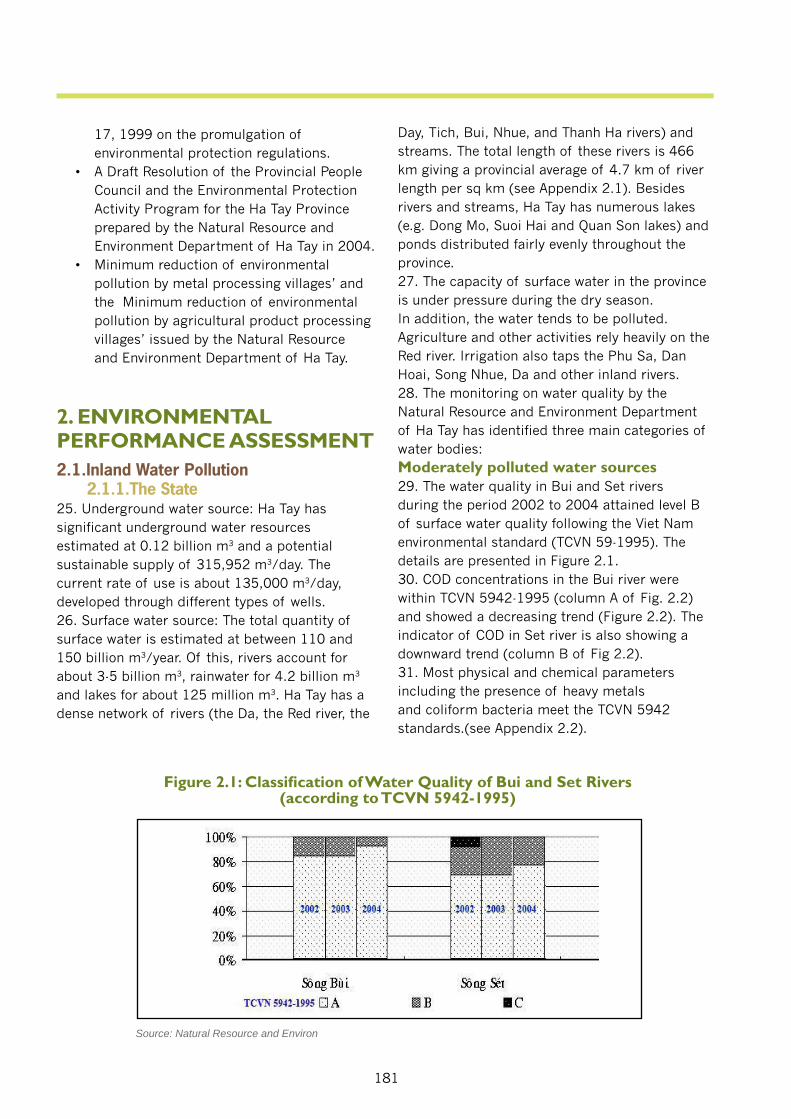
181
17, 1999 on the promulgation of environmental protection regulations. • A Draft Resolution of the Provincial People Council and the Environmental Protection Activity Program for the Ha Tay Province prepared by the Natural Resource and Environment Department of Ha Tay in 2004. • Minimum reduction of environmental pollution by metal processing villages’ and the Minimum reduction of environmental pollution by agricultural product processing villages’ issued by the Natural Resource and Environment Department of Ha Tay.
2. ENVIRONMENTAL PERFORMANCE ASSESSMENT 2.1.Inland Water Pollution
2.1.1.The State 25. Underground water source: Ha Tay has significant underground water resources estimated at 0.12 billion m3 and a potential sustainable supply of 315,952 m3/day. The current rate of use is about 135,000 m3/day, developed through different types of wells.26. Surface water source: The total quantity of surface water is estimated at between 110 and 150 billion m3/year. Of this, rivers account for about 3-5 billion m3, rainwater for 4.2 billion m3 and lakes for about 125 million m3. Ha Tay has a dense network of rivers (the Da, the Red river, the
Day, Tich, Bui, Nhue, and Thanh Ha rivers) and streams. The total length of these rivers is 466 km giving a provincial average of 4.7 km of river length per sq km (see Appendix 2.1). Besides rivers and streams, Ha Tay has numerous lakes (e.g. Dong Mo, Suoi Hai and Quan Son lakes) and ponds distributed fairly evenly throughout the province. 27. The capacity of surface water in the province is under pressure during the dry season. In addition, the water tends to be polluted. Agriculture and other activities rely heavily on the Red river. Irrigation also taps the Phu Sa, Dan Hoai, Song Nhue, Da and other inland rivers. 28. The monitoring on water quality by the Natural Resource and Environment Department of Ha Tay has identified three main categories of water bodies:Moderately polluted water sources29. The water quality in Bui and Set rivers during the period 2002 to 2004 attained level B of surface water quality following the Viet Nam environmental standard (TCVN 59-1995). The details are presented in Figure 2.1.30. COD concentrations in the Bui river were within TCVN 5942-1995 (column A of Fig. 2.2) and showed a decreasing trend (Figure 2.2). The indicator of COD in Set river is also showing a downward trend (column B of Fig 2.2).31. Most physical and chemical parameters including the presence of heavy metals and coliform bacteria meet the TCVN 5942 standards.(see Appendix 2.2).
Figure 2.1: Classifi cation of Water Quality of Bui and Set Rivers (according to TCVN 5942-1995)
Source: Natural Resource and Environ
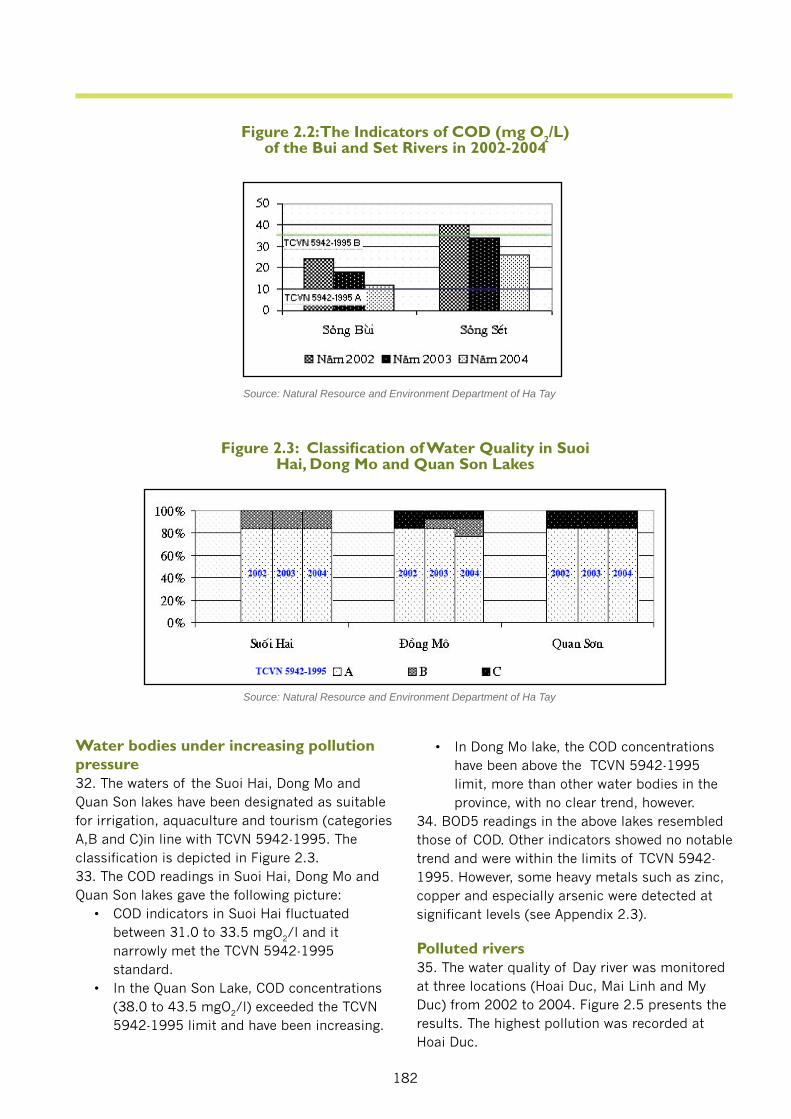
182
Water bodies under increasing pollution pressure32. The waters of the Suoi Hai, Dong Mo and Quan Son lakes have been designated as suitable for irrigation, aquaculture and tourism (categories A,B and C)in line with TCVN 5942-1995. The classification is depicted in Figure 2.3.33. The COD readings in Suoi Hai, Dong Mo and Quan Son lakes gave the following picture: • COD indicators in Suoi Hai fluctuated between 31.0 to 33.5 mgO2/l and it narrowly met the TCVN 5942-1995 standard. • In the Quan Son Lake, COD concentrations (38.0 to 43.5 mgO2/l) exceeded the TCVN 5942-1995 limit and have been increasing.
• In Dong Mo lake, the COD concentrations have been above the TCVN 5942-1995 limit, more than other water bodies in the province, with no clear trend, however. 34. BOD5 readings in the above lakes resembled those of COD. Other indicators showed no notable trend and were within the limits of TCVN 5942-1995. However, some heavy metals such as zinc, copper and especially arsenic were detected at significant levels (see Appendix 2.3).
Polluted rivers35. The water quality of Day river was monitored at three locations (Hoai Duc, Mai Linh and My Duc) from 2002 to 2004. Figure 2.5 presents the results. The highest pollution was recorded at Hoai Duc.
Figure 2.2: The Indicators of COD (mg O2/L) of the Bui and Set Rivers in 2002-2004
Source: Natural Resource and Environment Department of Ha Tay
Source: Natural Resource and Environment Department of Ha Tay
Figure 2.3: Classifi cation of Water Quality in Suoi Hai, Dong Mo and Quan Son Lakes
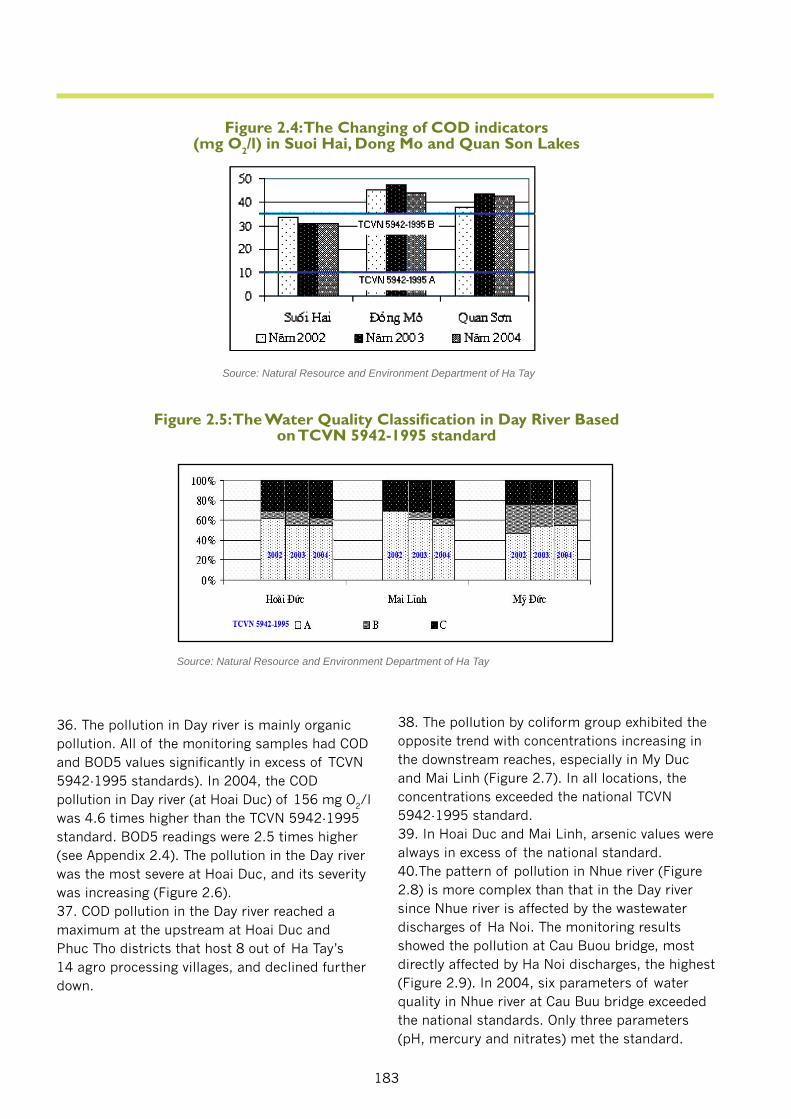
183
36. The pollution in Day river is mainly organic pollution. All of the monitoring samples had COD and BOD5 values significantly in excess of TCVN 5942-1995 standards). In 2004, the COD pollution in Day river (at Hoai Duc) of 156 mg O2/l was 4.6 times higher than the TCVN 5942-1995 standard. BOD5 readings were 2.5 times higher (see Appendix 2.4). The pollution in the Day river was the most severe at Hoai Duc, and its severity was increasing (Figure 2.6). 37. COD pollution in the Day river reached a maximum at the upstream at Hoai Duc and Phuc Tho districts that host 8 out of Ha Tay’s 14 agro processing villages, and declined further down.
Figure 2.4: The Changing of COD indicators (mg O2/l) in Suoi Hai, Dong Mo and Quan Son Lakes
Source: Natural Resource and Environment Department of Ha Tay
Figure 2.5: The Water Quality Classifi cation in Day River Based on TCVN 5942-1995 standard
Source: Natural Resource and Environment Department of Ha Tay
38. The pollution by coliform group exhibited the opposite trend with concentrations increasing in the downstream reaches, especially in My Duc and Mai Linh (Figure 2.7). In all locations, the concentrations exceeded the national TCVN 5942-1995 standard. 39. In Hoai Duc and Mai Linh, arsenic values were always in excess of the national standard.40.The pattern of pollution in Nhue river (Figure 2.8) is more complex than that in the Day river since Nhue river is affected by the wastewater discharges of Ha Noi. The monitoring results showed the pollution at Cau Buou bridge, most directly affected by Ha Noi discharges, the highest (Figure 2.9). In 2004, six parameters of water quality in Nhue river at Cau Buu bridge exceeded the national standards. Only three parameters (pH, mercury and nitrates) met the standard.
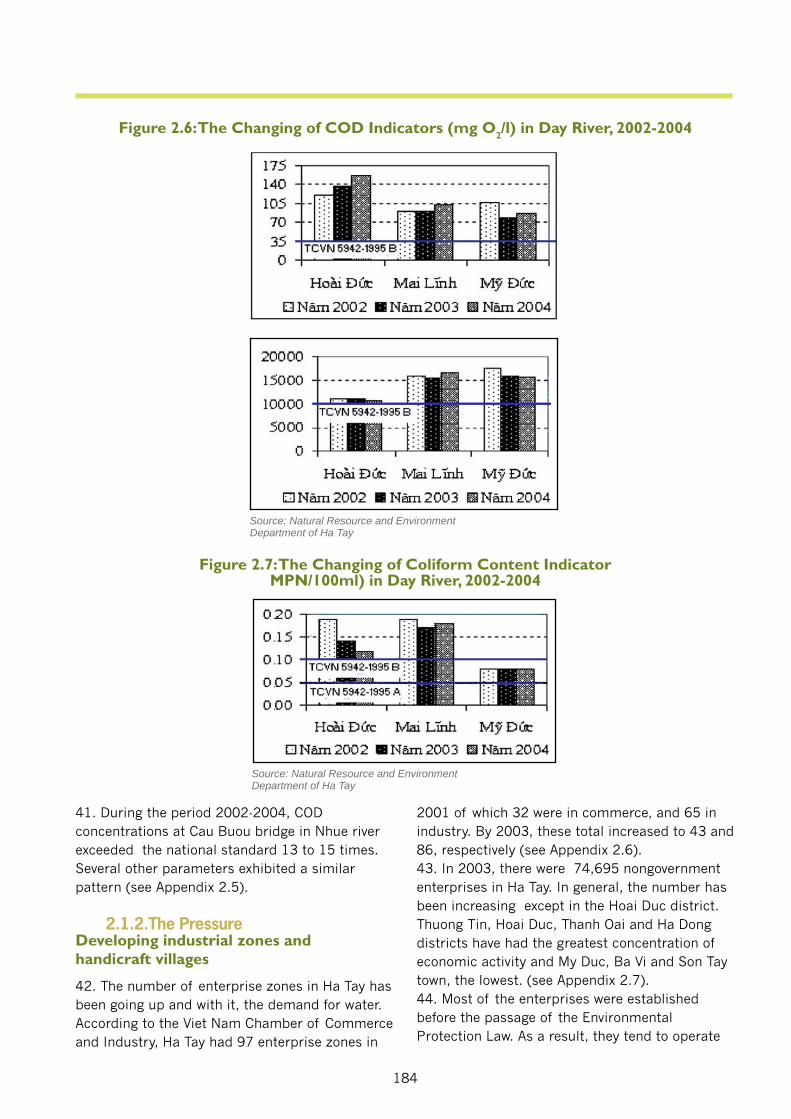
184
41. During the period 2002-2004, COD concentrations at Cau Buou bridge in Nhue river exceeded the national standard 13 to 15 times. Several other parameters exhibited a similar pattern (see Appendix 2.5).
2.1.2.The Pressure Developing industrial zones and handicraft villages
42. The number of enterprise zones in Ha Tay has been going up and with it, the demand for water. According to the Viet Nam Chamber of Commerce and Industry, Ha Tay had 97 enterprise zones in
2001 of which 32 were in commerce, and 65 in industry. By 2003, these total increased to 43 and 86, respectively (see Appendix 2.6).43. In 2003, there were 74,695 nongovernment enterprises in Ha Tay. In general, the number has been increasing except in the Hoai Duc district. Thuong Tin, Hoai Duc, Thanh Oai and Ha Dong districts have had the greatest concentration of economic activity and My Duc, Ba Vi and Son Tay town, the lowest. (see Appendix 2.7).44. Most of the enterprises were established before the passage of the Environmental Protection Law. As a result, they tend to operate
Source: Natural Resource and Environment Department of Ha Tay
Figure 2.6: The Changing of COD Indicators (mg O2/l) in Day River, 2002-2004
Figure 2.7: The Changing of Coliform Content Indicator MPN/100ml) in Day River, 2002-2004
Source: Natural Resource and Environment Department of Ha Tay
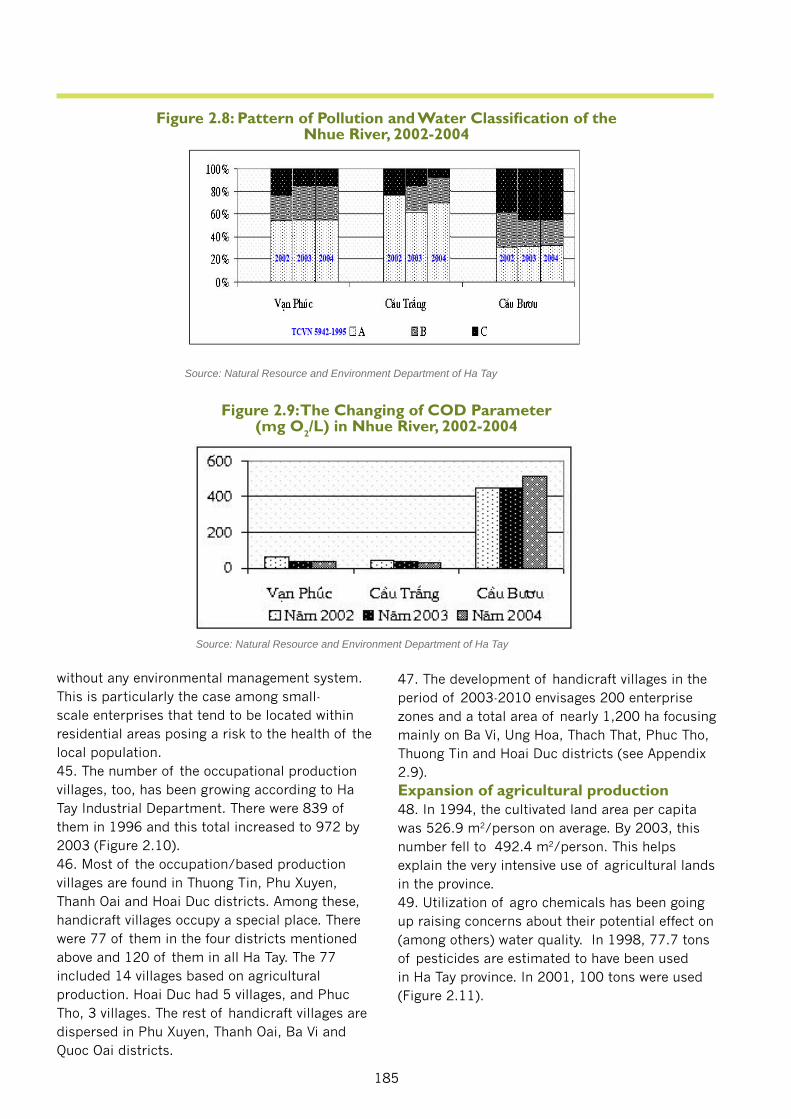
185
Figure 2.8: Pattern of Pollution and Water Classifi cation of the Nhue River, 2002-2004
Source: Natural Resource and Environment Department of Ha Tay
without any environmental management system. This is particularly the case among small-scale enterprises that tend to be located within residential areas posing a risk to the health of the local population.45. The number of the occupational production villages, too, has been growing according to Ha Tay Industrial Department. There were 839 of them in 1996 and this total increased to 972 by 2003 (Figure 2.10). 46. Most of the occupation/based production villages are found in Thuong Tin, Phu Xuyen, Thanh Oai and Hoai Duc districts. Among these, handicraft villages occupy a special place. There were 77 of them in the four districts mentioned above and 120 of them in all Ha Tay. The 77 included 14 villages based on agricultural production. Hoai Duc had 5 villages, and Phuc Tho, 3 villages. The rest of handicraft villages are dispersed in Phu Xuyen, Thanh Oai, Ba Vi and Quoc Oai districts.
47. The development of handicraft villages in the period of 2003-2010 envisages 200 enterprise zones and a total area of nearly 1,200 ha focusing mainly on Ba Vi, Ung Hoa, Thach That, Phuc Tho, Thuong Tin and Hoai Duc districts (see Appendix 2.9). Expansion of agricultural production 48. In 1994, the cultivated land area per capita was 526.9 m2/person on average. By 2003, this number fell to 492.4 m2/person. This helps explain the very intensive use of agricultural lands in the province. 49. Utilization of agro chemicals has been going up raising concerns about their potential effect on (among others) water quality. In 1998, 77.7 tons of pesticides are estimated to have been used in Ha Tay province. In 2001, 100 tons were used (Figure 2.11).
Source: Natural Resource and Environment Department of Ha Tay
Figure 2.9: The Changing of COD Parameter (mg O2/L) in Nhue River, 2002-2004
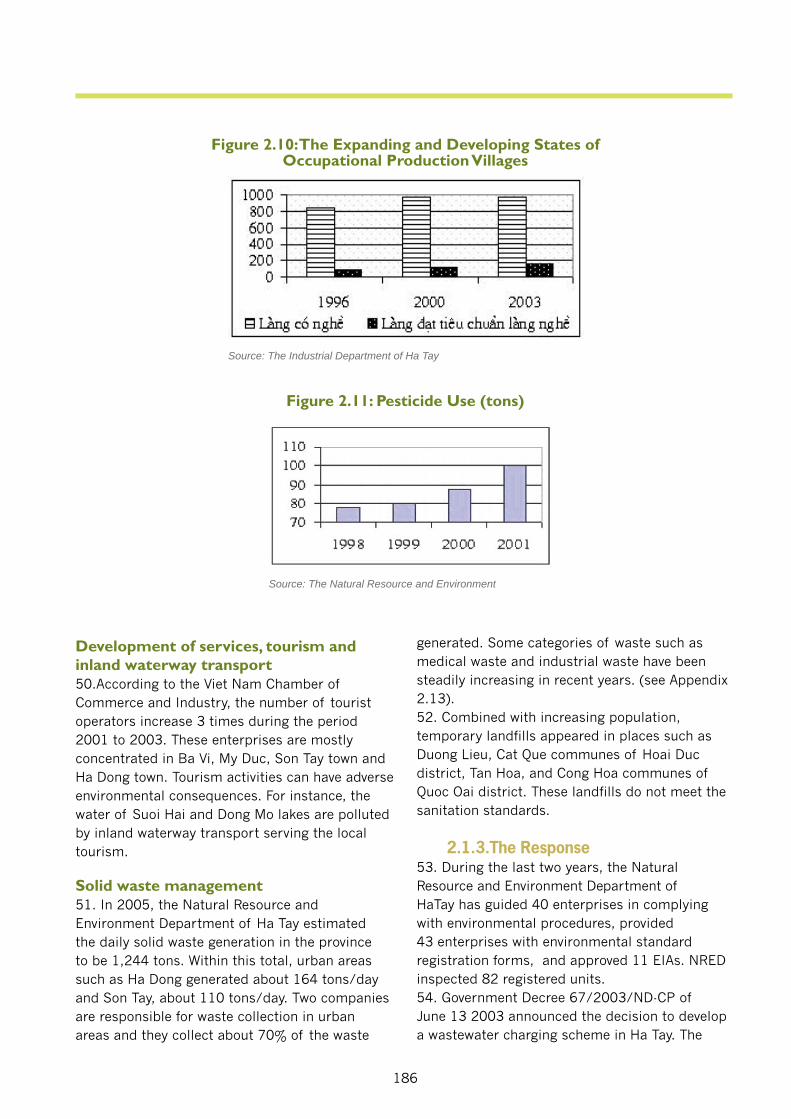
186
Development of services, tourism and inland waterway transport50.According to the Viet Nam Chamber of Commerce and Industry, the number of tourist operators increase 3 times during the period 2001 to 2003. These enterprises are mostly concentrated in Ba Vi, My Duc, Son Tay town and Ha Dong town. Tourism activities can have adverse environmental consequences. For instance, the water of Suoi Hai and Dong Mo lakes are polluted by inland waterway transport serving the local tourism.
Solid waste management 51. In 2005, the Natural Resource and Environment Department of Ha Tay estimated the daily solid waste generation in the province to be 1,244 tons. Within this total, urban areas such as Ha Dong generated about 164 tons/day and Son Tay, about 110 tons/day. Two companies are responsible for waste collection in urban areas and they collect about 70% of the waste
Figure 2.10: The Expanding and Developing States of Occupational Production Villages
Source: The Industrial Department of Ha Tay
generated. Some categories of waste such as medical waste and industrial waste have been steadily increasing in recent years. (see Appendix 2.13). 52. Combined with increasing population, temporary landfills appeared in places such as Duong Lieu, Cat Que communes of Hoai Duc district, Tan Hoa, and Cong Hoa communes of Quoc Oai district. These landfills do not meet the sanitation standards.
2.1.3.The Response 53. During the last two years, the Natural Resource and Environment Department of HaTay has guided 40 enterprises in complying with environmental procedures, provided 43 enterprises with environmental standard registration forms, and approved 11 EIAs. NRED inspected 82 registered units.54. Government Decree 67/2003/ND-CP of June 13 2003 announced the decision to develop a wastewater charging scheme in Ha Tay. The
Figure 2.11: Pesticide Use (tons)
Source: The Natural Resource and Environment
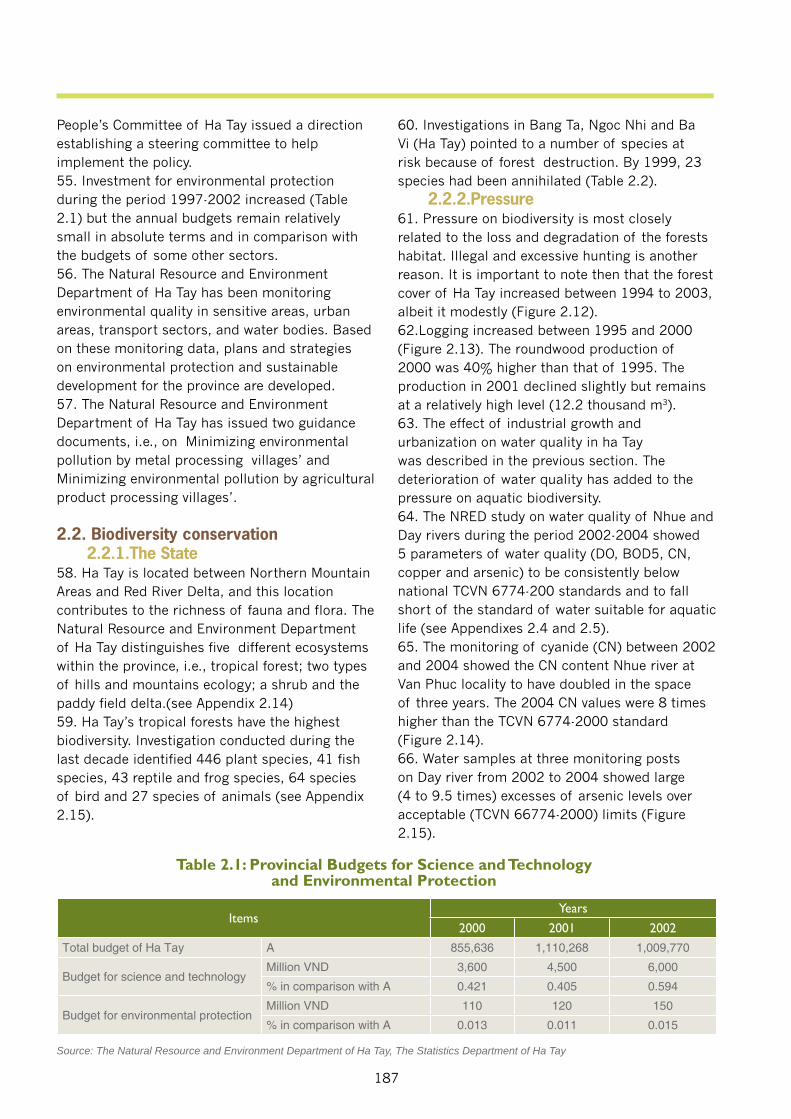
187
People’s Committee of Ha Tay issued a direction establishing a steering committee to help implement the policy.55. Investment for environmental protection during the period 1997-2002 increased (Table 2.1) but the annual budgets remain relatively small in absolute terms and in comparison with the budgets of some other sectors. 56. The Natural Resource and Environment Department of Ha Tay has been monitoring environmental quality in sensitive areas, urban areas, transport sectors, and water bodies. Based on these monitoring data, plans and strategies on environmental protection and sustainable development for the province are developed. 57. The Natural Resource and Environment Department of Ha Tay has issued two guidance documents, i.e., on Minimizing environmental pollution by metal processing villages’ and Minimizing environmental pollution by agricultural product processing villages’.
2.2. Biodiversity conservation2.2.1.The State
58. Ha Tay is located between Northern Mountain Areas and Red River Delta, and this location contributes to the richness of fauna and flora. The Natural Resource and Environment Department of Ha Tay distinguishes five different ecosystems within the province, i.e., tropical forest; two types of hills and mountains ecology; a shrub and the paddy field delta.(see Appendix 2.14)59. Ha Tay’s tropical forests have the highest biodiversity. Investigation conducted during the last decade identified 446 plant species, 41 fish species, 43 reptile and frog species, 64 species of bird and 27 species of animals (see Appendix 2.15).
60. Investigations in Bang Ta, Ngoc Nhi and Ba Vi (Ha Tay) pointed to a number of species at risk because of forest destruction. By 1999, 23 species had been annihilated (Table 2.2).
2.2.2.Pressure61. Pressure on biodiversity is most closely related to the loss and degradation of the forests habitat. Illegal and excessive hunting is another reason. It is important to note then that the forest cover of Ha Tay increased between 1994 to 2003, albeit it modestly (Figure 2.12). 62.Logging increased between 1995 and 2000 (Figure 2.13). The roundwood production of 2000 was 40% higher than that of 1995. The production in 2001 declined slightly but remains at a relatively high level (12.2 thousand m3). 63. The effect of industrial growth and urbanization on water quality in ha Tay was described in the previous section. The deterioration of water quality has added to the pressure on aquatic biodiversity.64. The NRED study on water quality of Nhue and Day rivers during the period 2002-2004 showed 5 parameters of water quality (DO, BOD5, CN, copper and arsenic) to be consistently below national TCVN 6774-200 standards and to fall short of the standard of water suitable for aquatic life (see Appendixes 2.4 and 2.5).65. The monitoring of cyanide (CN) between 2002 and 2004 showed the CN content Nhue river at Van Phuc locality to have doubled in the space of three years. The 2004 CN values were 8 times higher than the TCVN 6774-2000 standard (Figure 2.14). 66. Water samples at three monitoring posts on Day river from 2002 to 2004 showed large (4 to 9.5 times) excesses of arsenic levels over acceptable (TCVN 66774-2000) limits (Figure 2.15).
ItemsYears
2000 2001 2002Total budget of Ha Tay A 855,636 1,110,268 1,009,770
Budget for science and technology Million VND 3,600 4,500 6,000
% in comparison with A 0.421 0.405 0.594
Budget for environmental protection Million VND 110 120 150
% in comparison with A 0.013 0.011 0.015
Table 2.1: Provincial Budgets for Science and Technology and Environmental Protection
Source: The Natural Resource and Environment Department of Ha Tay, The Statistics Department of Ha Tay
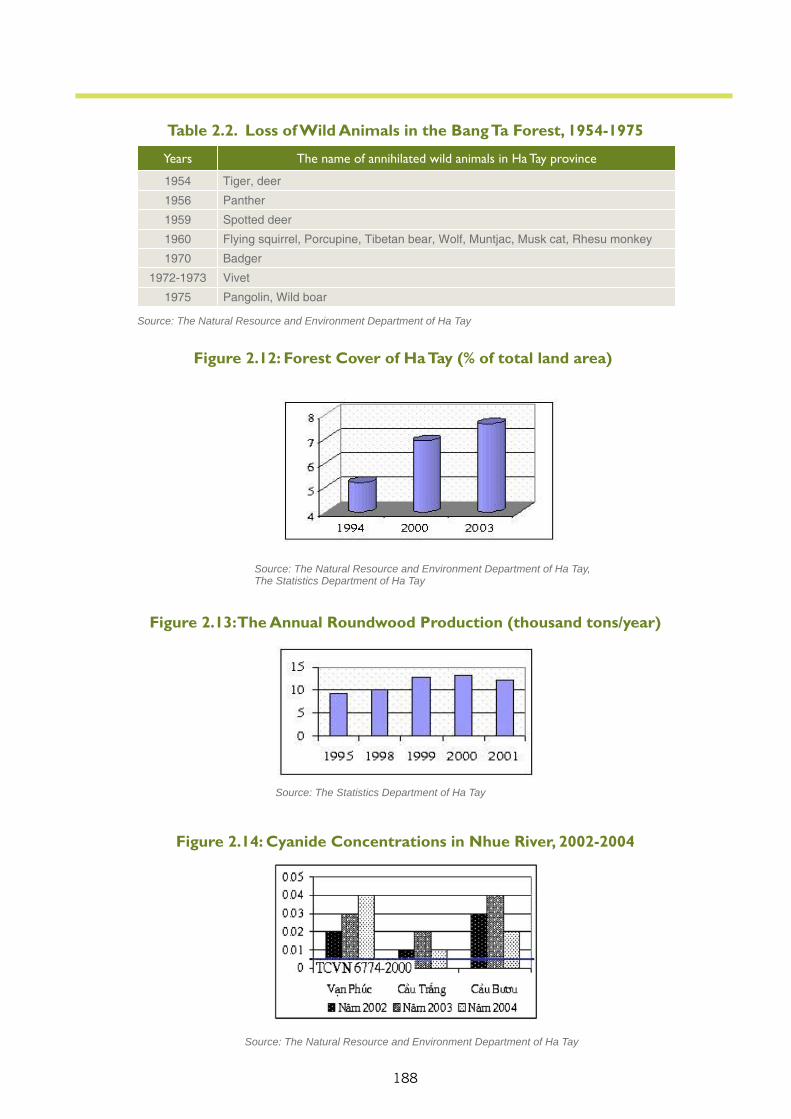
188
Years The name of annihilated wild animals in Ha Tay province
1954 Tiger, deer
1956 Panther
1959 Spotted deer
1960 Flying squirrel, Porcupine, Tibetan bear, Wolf, Muntjac, Musk cat, Rhesu monkey
1970 Badger
1972-1973 Vivet
1975 Pangolin, Wild boar
Source: The Natural Resource and Environment Department of Ha Tay
Table 2.2. Loss of Wild Animals in the Bang Ta Forest, 1954-1975
Source: The Natural Resource and Environment Department of Ha Tay, The Statistics Department of Ha Tay
Figure 2.12: Forest Cover of Ha Tay (% of total land area)
Source: The Statistics Department of Ha Tay
Figure 2.13: The Annual Roundwood Production (thousand tons/year)
Source: The Natural Resource and Environment Department of Ha Tay
Figure 2.14: Cyanide Concentrations in Nhue River, 2002-2004
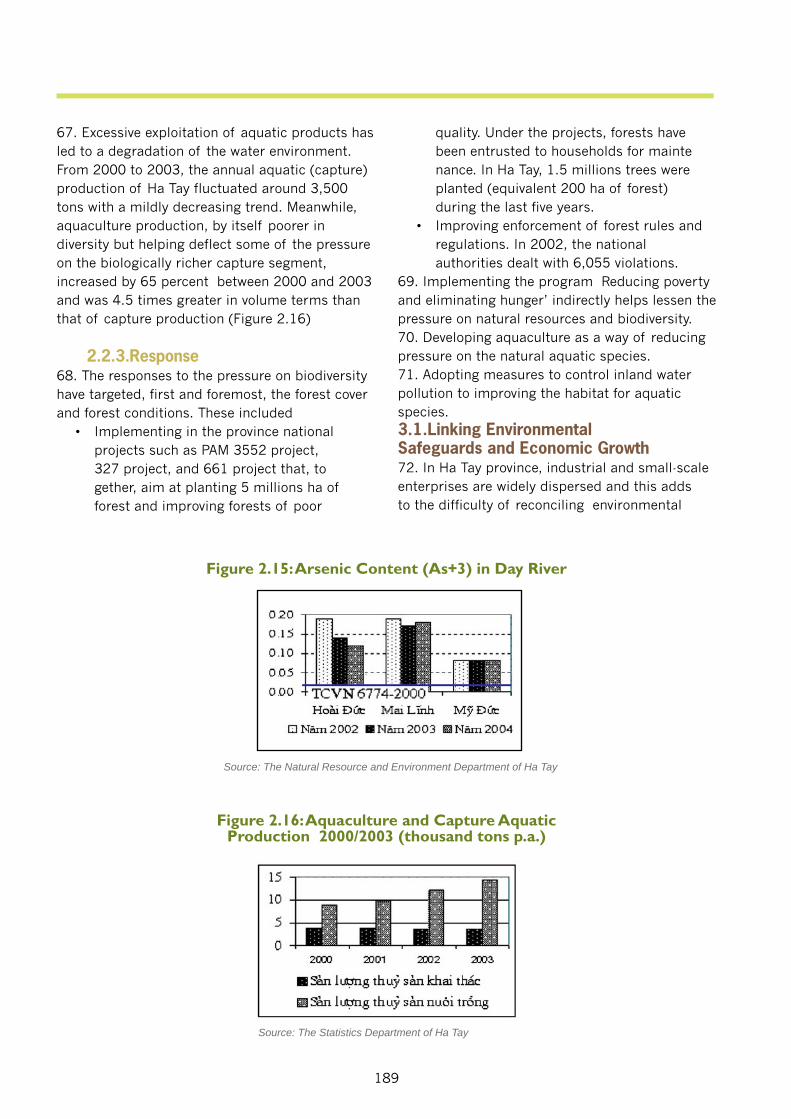
189
67. Excessive exploitation of aquatic products has led to a degradation of the water environment. From 2000 to 2003, the annual aquatic (capture) production of Ha Tay fluctuated around 3,500 tons with a mildly decreasing trend. Meanwhile, aquaculture production, by itself poorer in diversity but helping deflect some of the pressure on the biologically richer capture segment, increased by 65 percent between 2000 and 2003 and was 4.5 times greater in volume terms than that of capture production (Figure 2.16)
2.2.3.Response68. The responses to the pressure on biodiversity have targeted, first and foremost, the forest cover and forest conditions. These included • Implementing in the province national projects such as PAM 3552 project, 327 project, and 661 project that, to gether, aim at planting 5 millions ha of forest and improving forests of poor
Source: The Natural Resource and Environment Department of Ha Tay
Figure 2.15: Arsenic Content (As+3) in Day River
quality. Under the projects, forests have been entrusted to households for mainte nance. In Ha Tay, 1.5 millions trees were planted (equivalent 200 ha of forest) during the last five years. • Improving enforcement of forest rules and regulations. In 2002, the national authorities dealt with 6,055 violations.69. Implementing the program Reducing poverty and eliminating hunger’ indirectly helps lessen the pressure on natural resources and biodiversity.70. Developing aquaculture as a way of reducing pressure on the natural aquatic species.71. Adopting measures to control inland water pollution to improving the habitat for aquatic species. 3.1.Linking Environmental Safeguards and Economic Growth72. In Ha Tay province, industrial and small-scale enterprises are widely dispersed and this adds to the difficulty of reconciling environmental
Source: The Statistics Department of Ha Tay
Figure 2.16: Aquaculture and Capture Aquatic Production 2000/2003 (thousand tons p.a.)
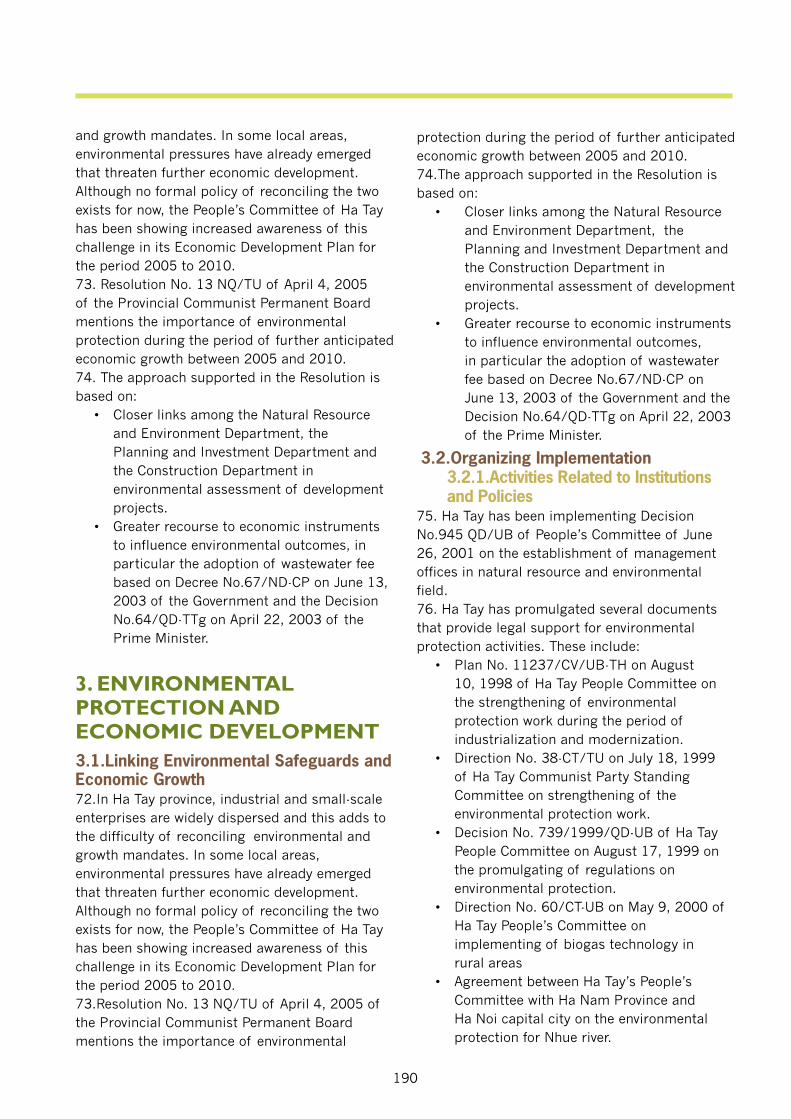
190
and growth mandates. In some local areas, environmental pressures have already emerged that threaten further economic development. Although no formal policy of reconciling the two exists for now, the People’s Committee of Ha Tay has been showing increased awareness of this challenge in its Economic Development Plan for the period 2005 to 2010. 73. Resolution No. 13 NQ/TU of April 4, 2005 of the Provincial Communist Permanent Board mentions the importance of environmental protection during the period of further anticipated economic growth between 2005 and 2010. 74. The approach supported in the Resolution is based on: • Closer links among the Natural Resource and Environment Department, the Planning and Investment Department and the Construction Department in environmental assessment of development projects. • Greater recourse to economic instruments to influence environmental outcomes, in particular the adoption of wastewater fee based on Decree No.67/ND-CP on June 13, 2003 of the Government and the Decision No.64/QD-TTg on April 22, 2003 of the Prime Minister.
3. ENVIRONMENTAL PROTECTION AND ECONOMIC DEVELOPMENT3.1.Linking Environmental Safeguards and Economic Growth72.In Ha Tay province, industrial and small-scale enterprises are widely dispersed and this adds to the difficulty of reconciling environmental and growth mandates. In some local areas, environmental pressures have already emerged that threaten further economic development. Although no formal policy of reconciling the two exists for now, the People’s Committee of Ha Tay has been showing increased awareness of this challenge in its Economic Development Plan for the period 2005 to 2010. 73.Resolution No. 13 NQ/TU of April 4, 2005 of the Provincial Communist Permanent Board mentions the importance of environmental
protection during the period of further anticipated economic growth between 2005 and 2010. 74.The approach supported in the Resolution is based on:
• Closer links among the Natural Resource and Environment Department, the Planning and Investment Department and the Construction Department in environmental assessment of development projects.• Greater recourse to economic instruments to influence environmental outcomes, in particular the adoption of wastewater fee based on Decree No.67/ND-CP on June 13, 2003 of the Government and the Decision No.64/QD-TTg on April 22, 2003 of the Prime Minister.
3.2.Organizing Implementation3.2.1.Activities Related to Institutions and Policies
75. Ha Tay has been implementing Decision No.945 QD/UB of People’s Committee of June 26, 2001 on the establishment of management offices in natural resource and environmental field. 76. Ha Tay has promulgated several documents that provide legal support for environmental protection activities. These include: • Plan No. 11237/CV/UB-TH on August 10, 1998 of Ha Tay People Committee on the strengthening of environmental protection work during the period of industrialization and modernization. • Direction No. 38-CT/TU on July 18, 1999 of Ha Tay Communist Party Standing Committee on strengthening of the environmental protection work. • Decision No. 739/1999/QD-UB of Ha Tay People Committee on August 17, 1999 on the promulgating of regulations on environmental protection. • Direction No. 60/CT-UB on May 9, 2000 of Ha Tay People’s Committee on implementing of biogas technology in rural areas • Agreement between Ha Tay’s People’s Committee with Ha Nam Province and Ha Noi capital city on the environmental protection for Nhue river.
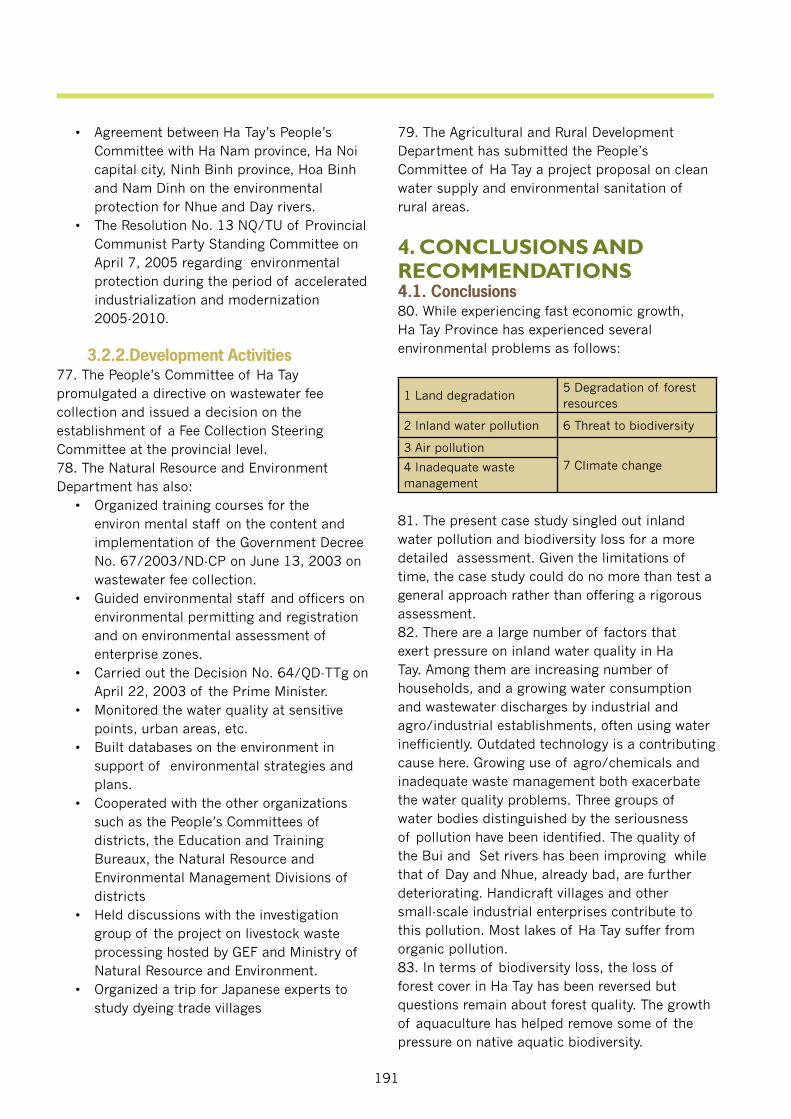
191
• Agreement between Ha Tay’s People’s Committee with Ha Nam province, Ha Noi capital city, Ninh Binh province, Hoa Binh and Nam Dinh on the environmental protection for Nhue and Day rivers. • The Resolution No. 13 NQ/TU of Provincial Communist Party Standing Committee on April 7, 2005 regarding environmental protection during the period of accelerated industrialization and modernization 2005-2010.
3.2.2.Development Activities 77. The People’s Committee of Ha Tay promulgated a directive on wastewater fee collection and issued a decision on the establishment of a Fee Collection Steering Committee at the provincial level. 78. The Natural Resource and Environment Department has also: • Organized training courses for the environ mental staff on the content and implementation of the Government Decree No. 67/2003/ND-CP on June 13, 2003 on wastewater fee collection. • Guided environmental staff and officers on environmental permitting and registration and on environmental assessment of enterprise zones. • Carried out the Decision No. 64/QD-TTg on April 22, 2003 of the Prime Minister. • Monitored the water quality at sensitive points, urban areas, etc. • Built databases on the environment in support of environmental strategies and plans. • Cooperated with the other organizations such as the People’s Committees of districts, the Education and Training Bureaux, the Natural Resource and Environmental Management Divisions of districts • Held discussions with the investigation group of the project on livestock waste processing hosted by GEF and Ministry of Natural Resource and Environment. • Organized a trip for Japanese experts to study dyeing trade villages
79. The Agricultural and Rural Development Department has submitted the People’s Committee of Ha Tay a project proposal on clean water supply and environmental sanitation of rural areas.
4. CONCLUSIONS AND RECOMMENDATIONS4.1. Conclusions 80. While experiencing fast economic growth, Ha Tay Province has experienced several environmental problems as follows:
1 Land degradation 5 Degradation of forest resources
2 Inland water pollution 6 Threat to biodiversity
3 Air pollution
7 Climate change4 Inadequate waste management
81. The present case study singled out inland water pollution and biodiversity loss for a more detailed assessment. Given the limitations of time, the case study could do no more than test a general approach rather than offering a rigorous assessment. 82. There are a large number of factors that exert pressure on inland water quality in Ha Tay. Among them are increasing number of households, and a growing water consumption and wastewater discharges by industrial and agro/industrial establishments, often using water inefficiently. Outdated technology is a contributing cause here. Growing use of agro/chemicals and inadequate waste management both exacerbate the water quality problems. Three groups of water bodies distinguished by the seriousness of pollution have been identified. The quality of the Bui and Set rivers has been improving while that of Day and Nhue, already bad, are further deteriorating. Handicraft villages and other small-scale industrial enterprises contribute to this pollution. Most lakes of Ha Tay suffer from organic pollution. 83. In terms of biodiversity loss, the loss of forest cover in Ha Tay has been reversed but questions remain about forest quality. The growth of aquaculture has helped remove some of the pressure on native aquatic biodiversity.
192
4.2. Institutional Recommendations84.The number of environmental staff in Ha Tay is very small, especially in the districts. Ha Tay province should formulate a plan for improved staffing and prepare a staff development program in the Natural Resource and Environment Department.85.The Province should continue its efforts at forming cross province bodies to manage the quality of water in the Nhue and Day rivers.
4.3.Policy Recommendations86.The People’s Committee of Ha Tay Province should formulate a document that more clearly explains how environmental protection activities can best complement the social development plan for the Province. The legal and regulatory framework for handicraft and other specialized villages is not in place yet. It is important to search for mechanisms that best protect the economic dynamism of these villages while mitigating the adverse environmental effects of their activities.87. Landfills and their conditions are among the weakest aspects of environmental management in Ha Tay. A policy of gradual improvement of these facilities should be formulated and the current situation and possible remedies more fully discussed with the public.
88. Modernization of industrial facilities is often the best way of cutting on industrial pollution discharges. Consider various economic incentives that would encourage adoption of clean technology. 89. Persevere with the implementation of wastewater fee policy.
4.4. Future EPAs90. Use the experience of this rough-and-dirty case study to assess the value and potential contribution of a province-based or district-based assessment of environmental performance. Consider in particular, the statistical demands of such a task. If the feedback is positive, formulate a provincial set of indicators building on the experience and approaches of the national EPA.91. Once improved, consider using a provincial EPA as a tool of communication with the local communities. Help the public understand better how their daily routine affects environmental outcomes in the locality, the district and the province. Using multi-media and consider some of the elements of EPA for inclusion into school curricula.
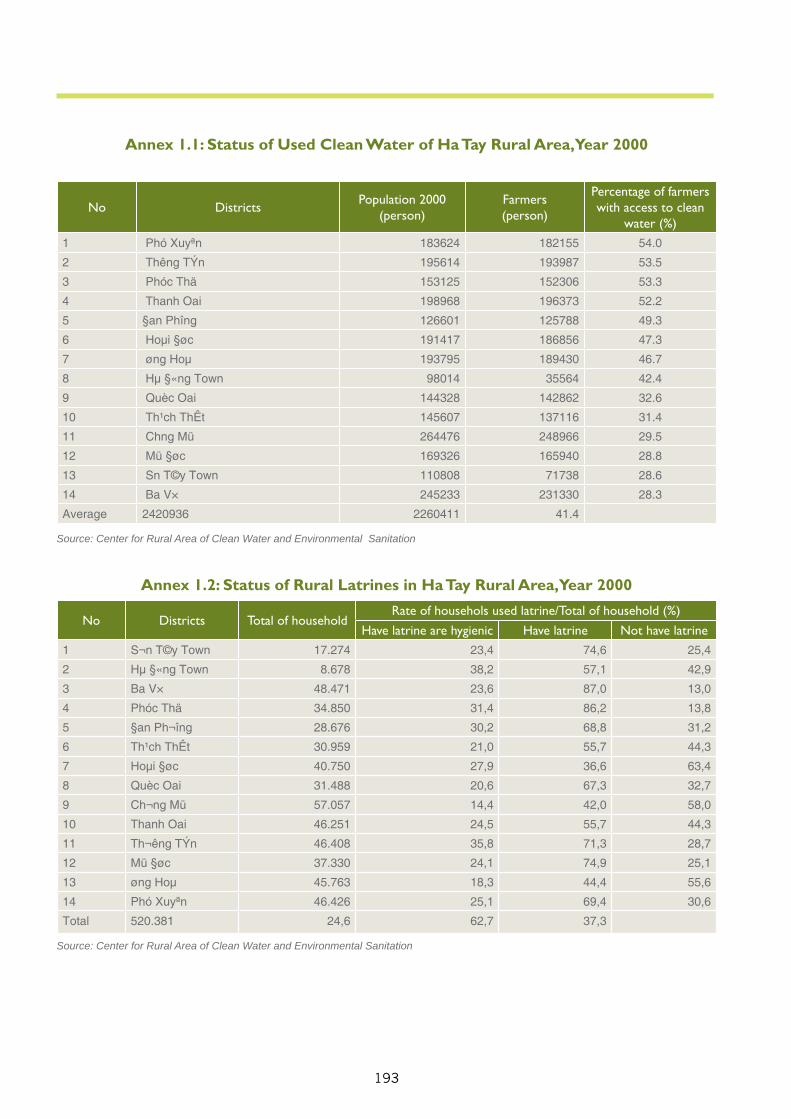
193
No Districts Population 2000(person)
Farmers(person)
Percentage of farmers with access to clean
water (%)1 Phó Xuyªn 183624 182155 54.0
2 Th êng TÝn 195614 193987 53.5
3 Phóc Thä 153125 152306 53.3
4 Thanh Oai 198968 196373 52.2
5 §an Ph îng 126601 125788 49.3
6 Hoμi §øc 191417 186856 47.3
7 øng Hoμ 193795 189430 46.7
8 Hμ §«ng Town 98014 35564 42.4
9 Quèc Oai 144328 142862 32.6
10 Th¹ch ThÊt 145607 137116 31.4
11 Ch ng Mü 264476 248966 29.5
12 Mü §øc 169326 165940 28.8
13 Sn T©y Town 110808 71738 28.6
14 Ba V× 245233 231330 28.3
Average 2420936 2260411 41.4
Annex 1.1: Status of Used Clean Water of Ha Tay Rural Area, Year 2000
Source: Center for Rural Area of Clean Water and Environmental Sanitation
No Districts Total of householdRate of househols used latrine/Total of household (%)
Have latrine are hygienic Have latrine Not have latrine1 S¬n T©y Town 17.274 23,4 74,6 25,4
2 Hμ §«ng Town 8.678 38,2 57,1 42,9
3 Ba V× 48.471 23,6 87,0 13,0
4 Phóc Thä 34.850 31,4 86,2 13,8
5 §an Ph ¬îng 28.676 30,2 68,8 31,2
6 Th¹ch ThÊt 30.959 21,0 55,7 44,3
7 Hoμi §øc 40.750 27,9 36,6 63,4
8 Quèc Oai 31.488 20,6 67,3 32,7
9 Ch ¬ng Mü 57.057 14,4 42,0 58,0
10 Thanh Oai 46.251 24,5 55,7 44,3
11 Th ¬êng TÝn 46.408 35,8 71,3 28,7
12 Mü §øc 37.330 24,1 74,9 25,1
13 øng Hoμ 45.763 18,3 44,4 55,6
14 Phó Xuyªn 46.426 25,1 69,4 30,6
Total 520.381 24,6 62,7 37,3
Source: Center for Rural Area of Clean Water and Environmental Sanitation
Annex 1.2: Status of Rural Latrines in Ha Tay Rural Area, Year 2000
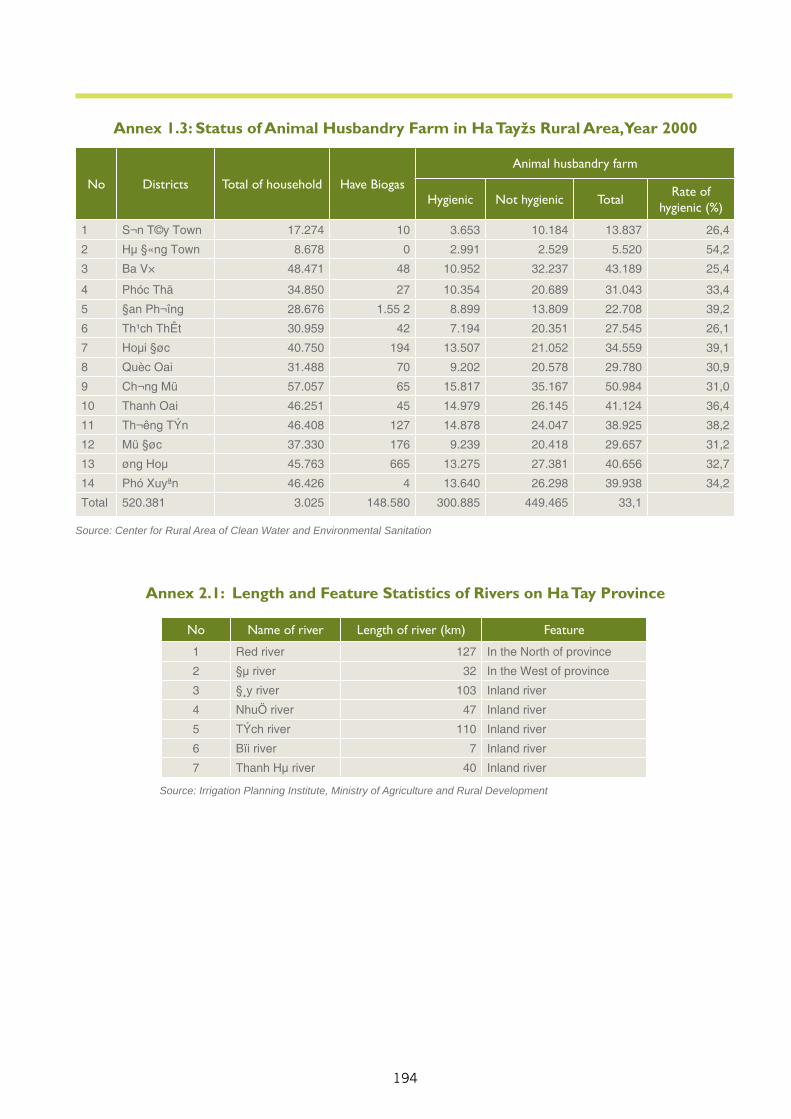
194
Annex 1.3: Status of Animal Husbandry Farm in Ha Tayžs Rural Area, Year 2000
Source: Center for Rural Area of Clean Water and Environmental Sanitation
No Districts Total of household Have Biogas
Animal husbandry farm
Hygienic Not hygienic Total Rate of hygienic (%)
1 S¬n T©y Town 17.274 10 3.653 10.184 13.837 26,4
2 Hμ §«ng Town 8.678 0 2.991 2.529 5.520 54,2
3 Ba V× 48.471 48 10.952 32.237 43.189 25,4
4 Phóc Thä 34.850 27 10.354 20.689 31.043 33,4
5 §an Ph ¬îng 28.676 1.55 2 8.899 13.809 22.708 39,2
6 Th¹ch ThÊt 30.959 42 7.194 20.351 27.545 26,1
7 Hoμi §øc 40.750 194 13.507 21.052 34.559 39,1
8 Quèc Oai 31.488 70 9.202 20.578 29.780 30,9
9 Ch ¬ng Mü 57.057 65 15.817 35.167 50.984 31,0
10 Thanh Oai 46.251 45 14.979 26.145 41.124 36,4
11 Th ¬êng TÝn 46.408 127 14.878 24.047 38.925 38,2
12 Mü §øc 37.330 176 9.239 20.418 29.657 31,2
13 øng Hoμ 45.763 665 13.275 27.381 40.656 32,7
14 Phó Xuyªn 46.426 4 13.640 26.298 39.938 34,2
Total 520.381 3.025 148.580 300.885 449.465 33,1
No Name of river Length of river (km) Feature
1 Red river 127 In the North of province
2 §μ river 32 In the West of province
3 §¸y river 103 Inland river
4 NhuÖ river 47 Inland river
5 TÝch river 110 Inland river
6 Bïi river 7 Inland river
7 Thanh Hμ river 40 Inland river
Source: Irrigation Planning Institute, Ministry of Agriculture and Rural Development
Annex 2.1: Length and Feature Statistics of Rivers on Ha Tay Province
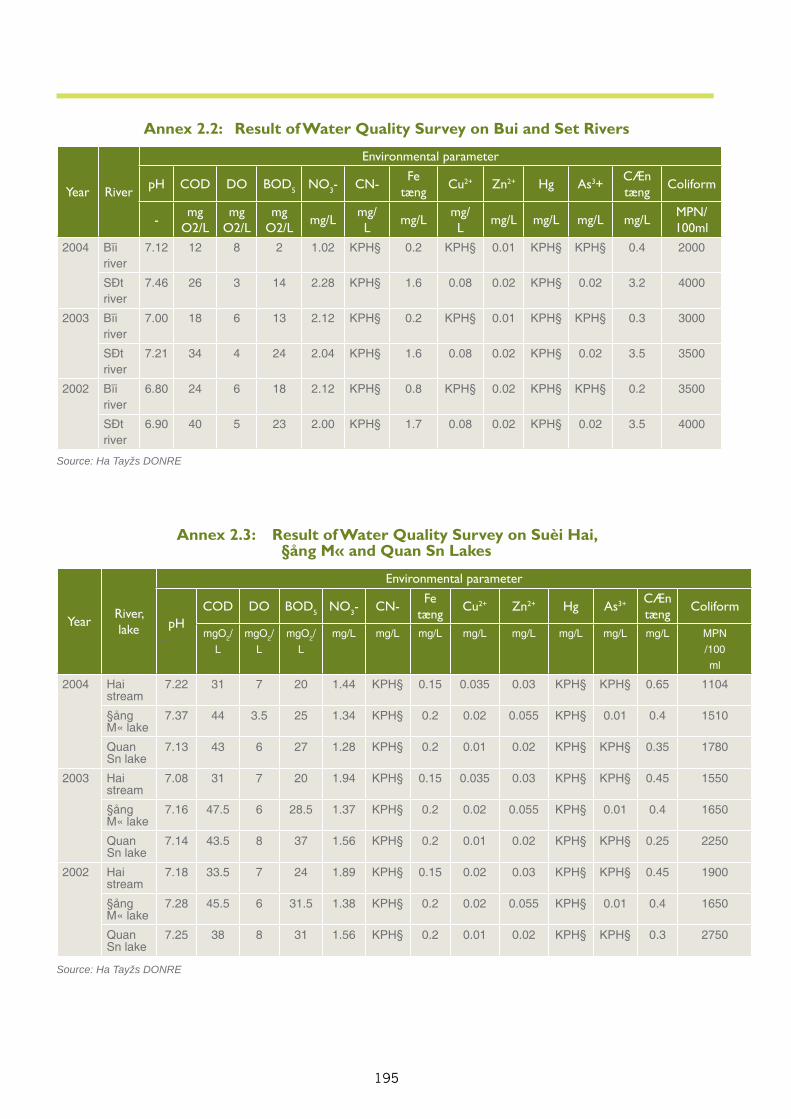
195
Annex 2.2: Result of Water Quality Survey on Bui and Set Rivers
Source: Ha Tayžs DONRE
Year River
Environmental parameter
pH COD DO BOD5 NO3- CN- Fe tæng Cu2+ Zn2+ Hg As3+ CÆn
tæng Coliform
- mgO2/L
mgO2/L
mgO2/L mg/L mg/
L mg/L mg/L mg/L mg/L mg/L mg/L MPN/
100ml2004 Bïi
river7.12 12 8 2 1.02 KPH§ 0.2 KPH§ 0.01 KPH§ KPH§ 0.4 2000
SÐtriver
7.46 26 3 14 2.28 KPH§ 1.6 0.08 0.02 KPH§ 0.02 3.2 4000
2003 Bïi river
7.00 18 6 13 2.12 KPH§ 0.2 KPH§ 0.01 KPH§ KPH§ 0.3 3000
SÐt river
7.21 34 4 24 2.04 KPH§ 1.6 0.08 0.02 KPH§ 0.02 3.5 3500
2002 Bïi river
6.80 24 6 18 2.12 KPH§ 0.8 KPH§ 0.02 KPH§ KPH§ 0.2 3500
SÐt river
6.90 40 5 23 2.00 KPH§ 1.7 0.08 0.02 KPH§ 0.02 3.5 4000
Year River, lake
Environmental parameter
pH-
COD DO BOD5 NO3- CN- Fe tæng Cu2+ Zn2+ Hg As3+ CÆn
tæng Coliform
mgO2/
L
mgO2/
L
mgO2/
L
mg/L mg/L mg/L mg/L mg/L mg/L mg/L mg/L MPN
/100
ml
2004 Hai stream
7.22 31 7 20 1.44 KPH§ 0.15 0.035 0.03 KPH§ KPH§ 0.65 1104
§ång M« lake
7.37 44 3.5 25 1.34 KPH§ 0.2 0.02 0.055 KPH§ 0.01 0.4 1510
Quan Sn lake
7.13 43 6 27 1.28 KPH§ 0.2 0.01 0.02 KPH§ KPH§ 0.35 1780
2003 Hai stream
7.08 31 7 20 1.94 KPH§ 0.15 0.035 0.03 KPH§ KPH§ 0.45 1550
§ång M« lake
7.16 47.5 6 28.5 1.37 KPH§ 0.2 0.02 0.055 KPH§ 0.01 0.4 1650
Quan Sn lake
7.14 43.5 8 37 1.56 KPH§ 0.2 0.01 0.02 KPH§ KPH§ 0.25 2250
2002 Hai stream
7.18 33.5 7 24 1.89 KPH§ 0.15 0.02 0.03 KPH§ KPH§ 0.45 1900
§ång M« lake
7.28 45.5 6 31.5 1.38 KPH§ 0.2 0.02 0.055 KPH§ 0.01 0.4 1650
Quan Sn lake
7.25 38 8 31 1.56 KPH§ 0.2 0.01 0.02 KPH§ KPH§ 0.3 2750
Annex 2.3: Result of Water Quality Survey on Suèi Hai, §ång M« and Quan Sn Lakes
Source: Ha Tayžs DONRE
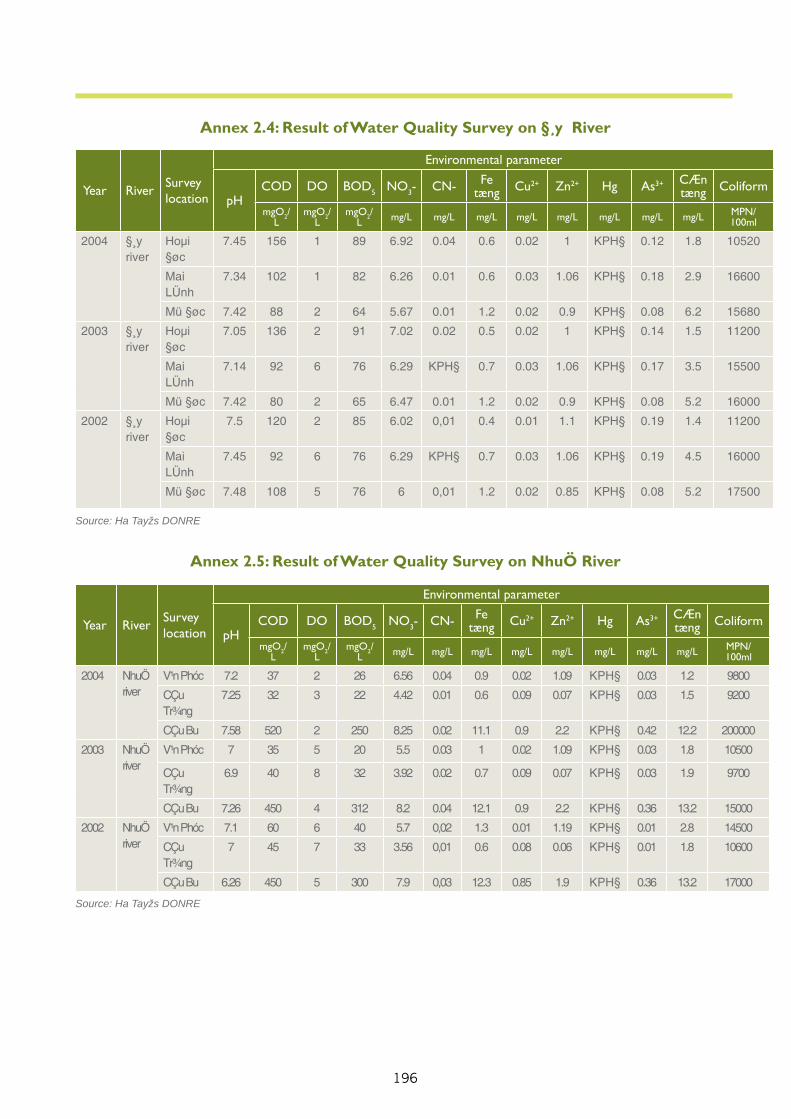
196
Year River Survey location
Environmental parameter
pHCOD DO BOD5 NO3- CN- Fe
tæng Cu2+ Zn2+ Hg As3+ CÆn tæng Coliform
mgO2/L
mgO2/L
mgO2/L mg/L mg/L mg/L mg/L mg/L mg/L mg/L mg/L MPN/
100ml
2004 §¸y river
Hoμi §øc
7.45 156 1 89 6.92 0.04 0.6 0.02 1 KPH§ 0.12 1.8 10520
Mai LÜnh
7.34 102 1 82 6.26 0.01 0.6 0.03 1.06 KPH§ 0.18 2.9 16600
Mü §øc 7.42 88 2 64 5.67 0.01 1.2 0.02 0.9 KPH§ 0.08 6.2 15680
2003 §¸y river
Hoμi §øc
7.05 136 2 91 7.02 0.02 0.5 0.02 1 KPH§ 0.14 1.5 11200
Mai LÜnh
7.14 92 6 76 6.29 KPH§ 0.7 0.03 1.06 KPH§ 0.17 3.5 15500
Mü §øc 7.42 80 2 65 6.47 0.01 1.2 0.02 0.9 KPH§ 0.08 5.2 16000
2002 §¸y river
Hoμi §øc
7.5 120 2 85 6.02 0,01 0.4 0.01 1.1 KPH§ 0.19 1.4 11200
Mai LÜnh
7.45 92 6 76 6.29 KPH§ 0.7 0.03 1.06 KPH§ 0.19 4.5 16000
Mü §øc 7.48 108 5 76 6 0,01 1.2 0.02 0.85 KPH§ 0.08 5.2 17500
Annex 2.4: Result of Water Quality Survey on §¸y River
Source: Ha Tayžs DONRE
Year River Survey location
Environmental parameter
pHCOD DO BOD5 NO3- CN- Fe
tæng Cu2+ Zn2+ Hg As3+ CÆn tæng Coliform
mgO2/L
mgO2/L
mgO2/L mg/L mg/L mg/L mg/L mg/L mg/L mg/L mg/L MPN/
100ml
2004 NhuÖ river
V¹n Phóc 7.2 37 2 26 6.56 0.04 0.9 0.02 1.09 KPH§ 0.03 1.2 9800
CÇu Tr¾ng
7.25 32 3 22 4.42 0.01 0.6 0.09 0.07 KPH§ 0.03 1.5 9200
CÇu B u 7.58 520 2 250 8.25 0.02 11.1 0.9 2.2 KPH§ 0.42 12.2 200000
2003 NhuÖ river
V¹n Phóc 7 35 5 20 5.5 0.03 1 0.02 1.09 KPH§ 0.03 1.8 10500
CÇu Tr¾ng
6.9 40 8 32 3.92 0.02 0.7 0.09 0.07 KPH§ 0.03 1.9 9700
CÇu B u 7.26 450 4 312 8.2 0.04 12.1 0.9 2.2 KPH§ 0.36 13.2 15000
2002 NhuÖ river
V¹n Phóc 7.1 60 6 40 5.7 0,02 1.3 0.01 1.19 KPH§ 0.01 2.8 14500
CÇu Tr¾ng
7 45 7 33 3.56 0,01 0.6 0.08 0.06 KPH§ 0.01 1.8 10600
CÇu B u 6.26 450 5 300 7.9 0,03 12.3 0.85 1.9 KPH§ 0.36 13.2 17000
Source: Ha Tayžs DONRE
Annex 2.5: Result of Water Quality Survey on NhuÖ River
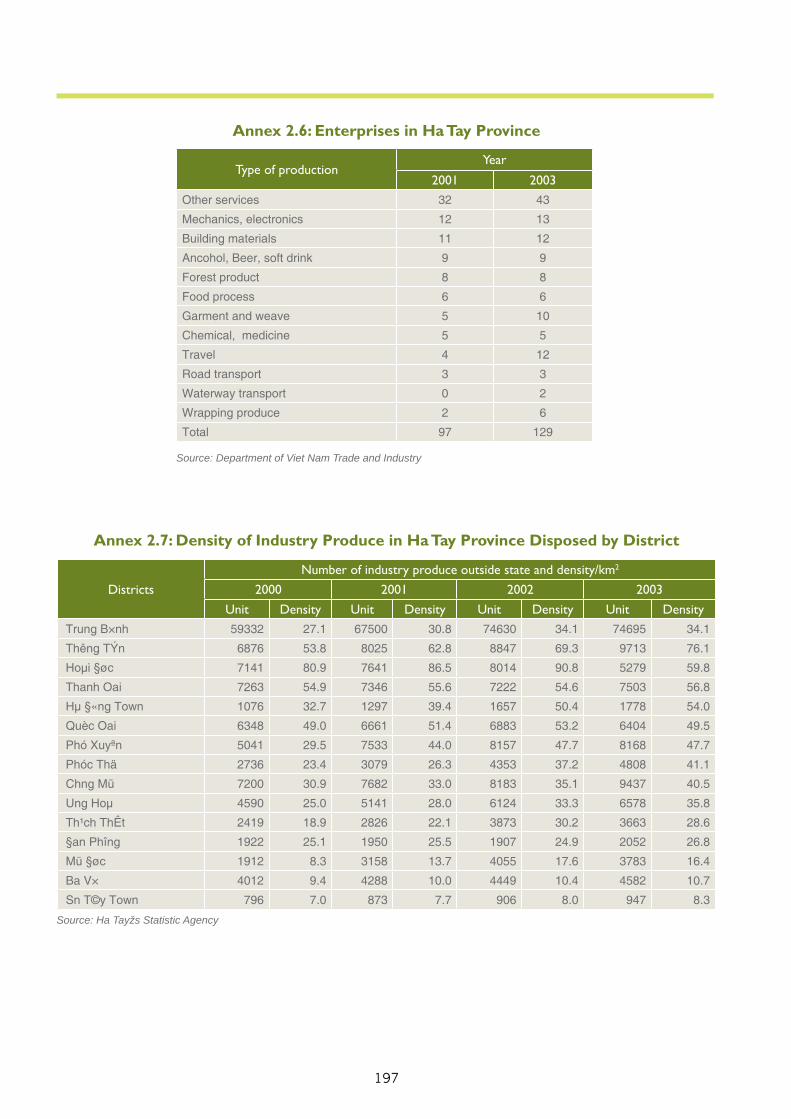
197
Type of productionYear
2001 2003Other services 32 43
Mechanics, electronics 12 13
Building materials 11 12
Ancohol, Beer, soft drink 9 9
Forest product 8 8
Food process 6 6
Garment and weave 5 10
Chemical, medicine 5 5
Travel 4 12
Road transport 3 3
Waterway transport 0 2
Wrapping produce 2 6
Total 97 129
Annex 2.6: Enterprises in Ha Tay Province
Source: Department of Viet Nam Trade and Industry
DistrictsNumber of industry produce outside state and density/km2
2000 2001 2002 2003Unit Density Unit Density Unit Density Unit Density
Trung B×nh 59332 27.1 67500 30.8 74630 34.1 74695 34.1
Th êng TÝn 6876 53.8 8025 62.8 8847 69.3 9713 76.1
Hoμi §øc 7141 80.9 7641 86.5 8014 90.8 5279 59.8
Thanh Oai 7263 54.9 7346 55.6 7222 54.6 7503 56.8
Hμ §«ng Town 1076 32.7 1297 39.4 1657 50.4 1778 54.0
Quèc Oai 6348 49.0 6661 51.4 6883 53.2 6404 49.5
Phó Xuyªn 5041 29.5 7533 44.0 8157 47.7 8168 47.7
Phóc Thä 2736 23.4 3079 26.3 4353 37.2 4808 41.1
Ch ng Mü 7200 30.9 7682 33.0 8183 35.1 9437 40.5
Ung Hoμ 4590 25.0 5141 28.0 6124 33.3 6578 35.8
Th¹ch ThÊt 2419 18.9 2826 22.1 3873 30.2 3663 28.6
§an Ph îng 1922 25.1 1950 25.5 1907 24.9 2052 26.8
Mü §øc 1912 8.3 3158 13.7 4055 17.6 3783 16.4
Ba V× 4012 9.4 4288 10.0 4449 10.4 4582 10.7
Sn T©y Town 796 7.0 873 7.7 906 8.0 947 8.3
Source: Ha Tayžs Statistic Agency
Annex 2.7: Density of Industry Produce in Ha Tay Province Disposed by District
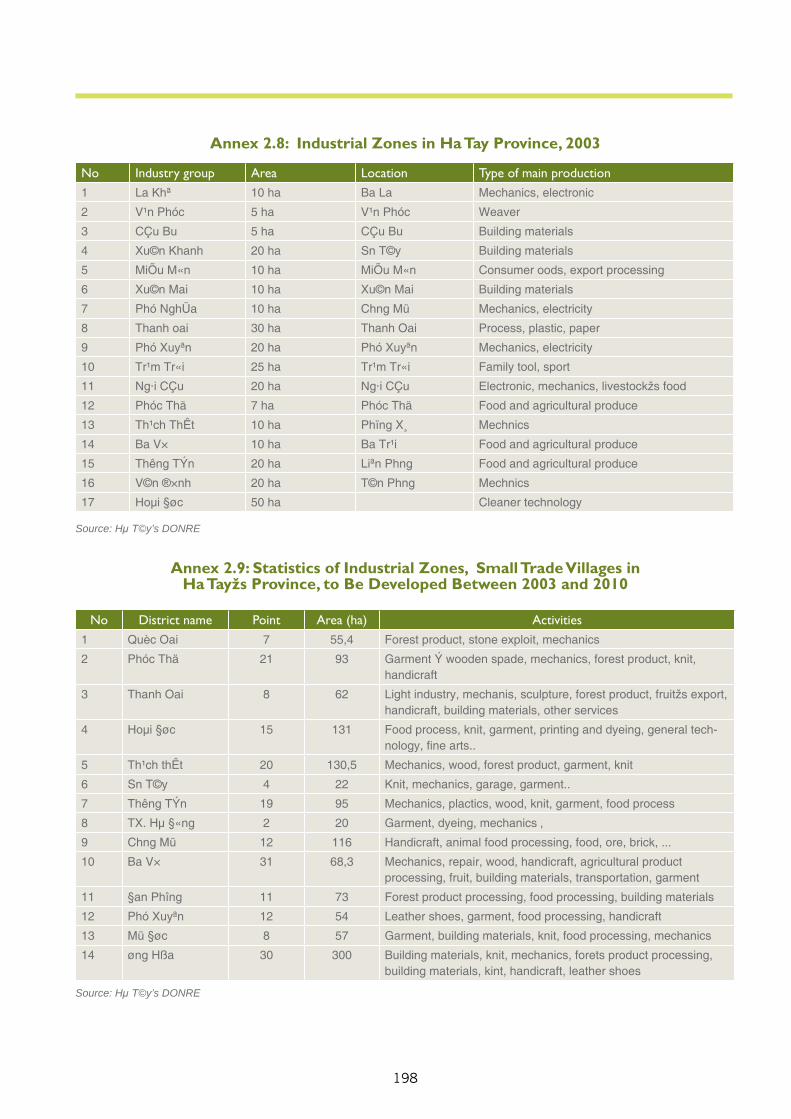
198
No Industry group Area Location Type of main production1 La Khª 10 ha Ba La Mechanics, electronic
2 V¹n Phóc 5 ha V¹n Phóc Weaver
3 CÇu B u 5 ha CÇu B u Building materials
4 Xu©n Khanh 20 ha Sn T©y Building materials
5 MiÕu M«n 10 ha MiÕu M«n Consumer oods, export processing
6 Xu©n Mai 10 ha Xu©n Mai Building materials
7 Phó NghÜa 10 ha Ch ng Mü Mechanics, electricity
8 Thanh oai 30 ha Thanh Oai Process, plastic, paper
9 Phó Xuyªn 20 ha Phó Xuyªn Mechanics, electricity
10 Tr¹m Tr«i 25 ha Tr¹m Tr«i Family tool, sport
11 Ng·i CÇu 20 ha Ng·i CÇu Electronic, mechanics, livestockžs food
12 Phóc Thä 7 ha Phóc Thä Food and agricultural produce
13 Th¹ch ThÊt 10 ha Phïng X¸ Mechnics
14 Ba V× 10 ha Ba Tr¹i Food and agricultural produce
15 Th êng TÝn 20 ha Liªn Ph ng Food and agricultural produce
16 V©n ®×nh 20 ha T©n Ph ng Mechnics
17 Hoμi §øc 50 ha Cleaner technology
Annex 2.8: Industrial Zones in Ha Tay Province, 2003
Source: Hμ T©y’s DONRE
No District name Point Area (ha) Activities1 Quèc Oai 7 55,4 Forest product, stone exploit, mechanics
2 Phóc Thä 21 93 Garment Ý wooden spade, mechanics, forest product, knit, handicraft
3 Thanh Oai 8 62 Light industry, mechanis, sculpture, forest product, fruitžs export, handicraft, building materials, other services
4 Hoμi §øc 15 131 Food process, knit, garment, printing and dyeing, general tech-nology, fi ne arts..
5 Th¹ch thÊt 20 130,5 Mechanics, wood, forest product, garment, knit
6 Sn T©y 4 22 Knit, mechanics, garage, garment..
7 Th êng TÝn 19 95 Mechanics, plactics, wood, knit, garment, food process
8 TX. Hμ §«ng 2 20 Garment, dyeing, mechanics ‚
9 Ch ng Mü 12 116 Handicraft, animal food processing, food, ore, brick, ...
10 Ba V× 31 68,3 Mechanics, repair, wood, handicraft, agricultural product processing, fruit, building materials, transportation, garment
11 §an Ph îng 11 73 Forest product processing, food processing, building materials
12 Phó Xuyªn 12 54 Leather shoes, garment, food processing, handicraft
13 Mü §øc 8 57 Garment, building materials, knit, food processing, mechanics
14 øng Hßa 30 300 Building materials, knit, mechanics, forets product processing, building materials, kint, handicraft, leather shoes
Annex 2.9: Statistics of Industrial Zones, Small Trade Villages in Ha Tayžs Province, to Be Developed Between 2003 and 2010
Source: Hμ T©y’s DONRE
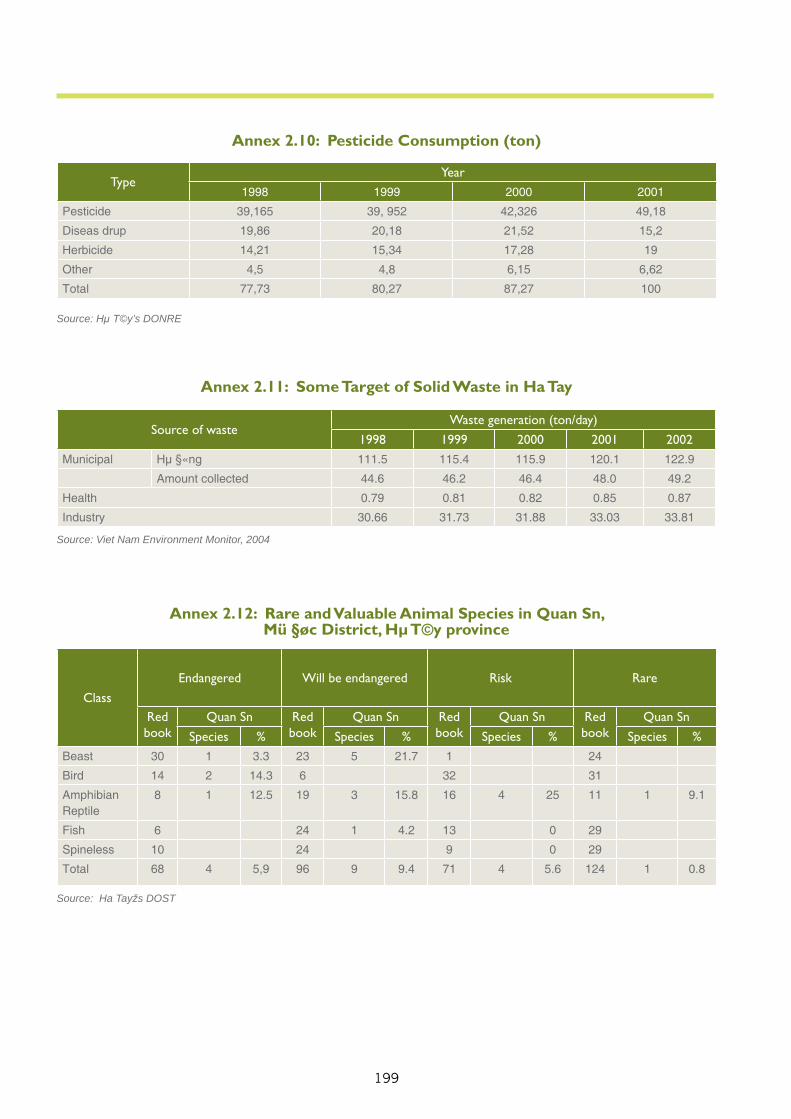
199
TypeYear
1998 1999 2000 2001
Pesticide 39,165 39, 952 42,326 49,18
Diseas drup 19,86 20,18 21,52 15,2
Herbicide 14,21 15,34 17,28 19
Other 4,5 4,8 6,15 6,62
Total 77,73 80,27 87,27 100
Source: Hμ T©y’s DONRE
Annex 2.10: Pesticide Consumption (ton)
Source of wasteWaste generation (ton/day)
1998 1999 2000 2001 2002Municipal Hμ §«ng 111.5 115.4 115.9 120.1 122.9
Amount collected 44.6 46.2 46.4 48.0 49.2
Health 0.79 0.81 0.82 0.85 0.87
Industry 30.66 31.73 31.88 33.03 33.81
Source: Ha Tayžs DOST
ClassEndangered Will be endangered Risk Rare
Red book
Quan Sn Red book
Quan Sn Red book
Quan Sn Red book
Quan SnSpecies % Species % Species % Species %
Beast 30 1 3.3 23 5 21.7 1 24
Bird 14 2 14.3 6 32 31
Amphibian Reptile
8 1 12.5 19 3 15.8 16 4 25 11 1 9.1
Fish 6 24 1 4.2 13 0 29
Spineless 10 24 9 0 29
Total 68 4 5,9 96 9 9.4 71 4 5.6 124 1 0.8
Annex 2.12: Rare and Valuable Animal Species in Quan Sn, Mü §øc District, Hμ T©y province
Annex 2.11: Some Target of Solid Waste in Ha Tay
Source: Viet Nam Environment Monitor, 2004
200
STATUS OF ENVIRONMENT IN THAI NGUYEN PROVINCE1.1. Socioeconomic Development1. Thai Nguyen province is located in the North-East mountainous region of Red River delta with a total population in 2003 of 1,085,872 including about 78% peasents. In recent years industrial and commercial activties have become a major contributor to the region’s economy rather than agruculture.2. In 1999, the contribution of industry to ecnomic growth was 29.17% increasing to 37.27% in 2004. Meanwhile, the contribution of agricultural sector fell from 35.8% to 26.6% in 2004. Average rate of GDP growth in the province was around 9% in the period 2000-2004. The per capita income had increased in 2002 to about 3,000,000 VND/capita/year. The number of poverty households also saw some reduction averaging at 6.06% in 2004. 3. The average population density of province is 307 persons/km2. The urban population of Thai Nguyen occupy 22.8% of total population. Most of urban population was concemtrated in Thai Nguyen City and Song Cong town. The population of Thai Nguyen City is the highest at about 162,000 equaling 70.7% the total urban population.4. In addition to economic development, Thai Nguyen province has also paid attention to community health care. At present, Thai Nguyen has 16 hospitals, 14 clinic departments, 175 medicinal stations, 2 child-bearing hospitals with total of 3,356 medicinal beds. The total health
CASE STUDY 2 THAI NGUYEN PROVINCE
care staff is 2,924 persons, in which 1,407 staff serving for health care at provincial level, 666 staff serving at district level and 815 staff working at commune level. The number of health care staff is 2.69 staff/1000 people and 3.09 medicinal beds/1000 people. 5. Access to safe drinking water is approx 46% in 2002 in rural areas, while 80% have that access in urban areas.
1.2. Status of Environmental Pollution in Thai Nguyen Province
1.2.1.Land Degradation6. More and more areas are being brought under cultivation. There is about 35,000ha equal to 78.45% of agricultural land under irrigation. Growth in agriculture has resulted in mounting pressure on natural resources. According to studies conducted by DONRE in Thai Nguyen, most of the cultivated land has undergone some form of degradation or other, such as lowered fertility levels, soil impoverishment, hardened soil surfaces and excess concentration of pesticides.7. Cau River and Cong River are the two main sources of inland water. Rivers and streams in the province have become polluted. Environmental monitoring stations in Cau and Cong rivers have recorded COD and BOD values at B level of surfacewater standards. Most pollution is a result of waste oil and lubricant discharges. Other common pollutants are NH4, Coliform. Chief casues of inland water pollution in Thai Nguyen are increased of mineral exploration and resultant pollution activities, wastewater from industrial
VIET NAM NATIONAL ENVIRONMENTAL PERFORMANCE ASSESSMENT
(EPA) REPORT
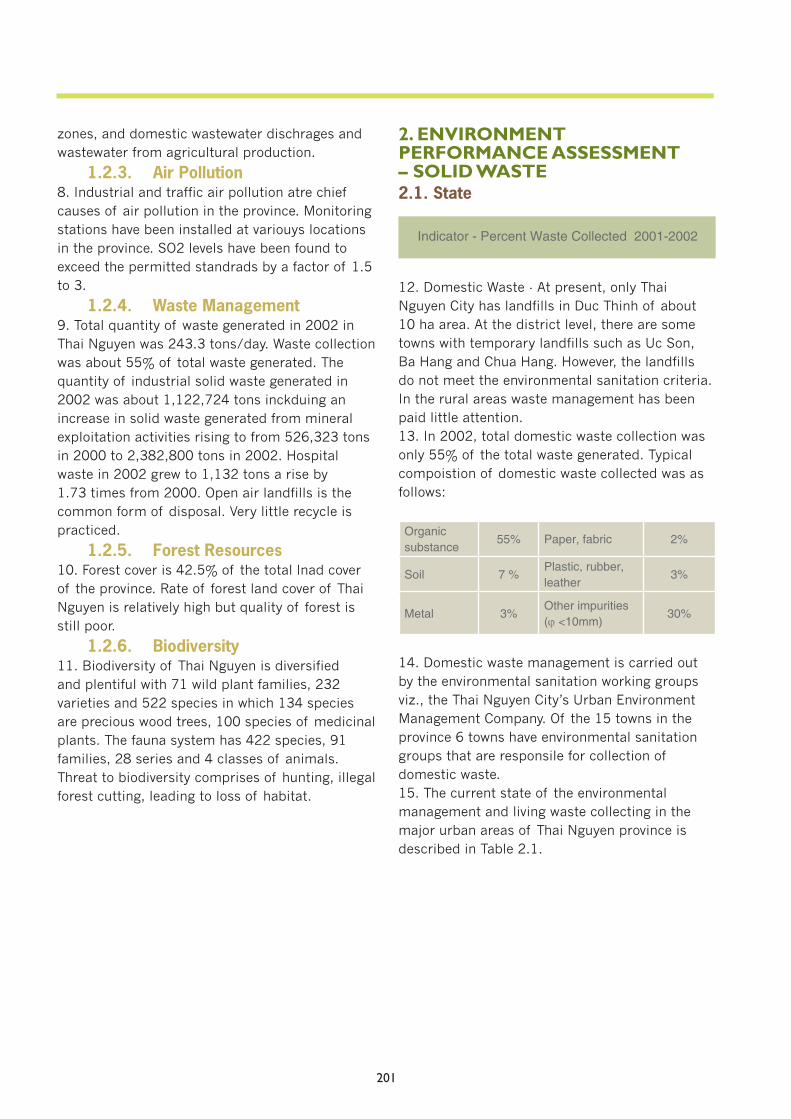
201
2. ENVIRONMENT PERFORMANCE ASSESSMENT – SOLID WASTE2.1. State
12. Domestic Waste - At present, only Thai Nguyen City has landfills in Duc Thinh of about 10 ha area. At the district level, there are some towns with temporary landfills such as Uc Son, Ba Hang and Chua Hang. However, the landfills do not meet the environmental sanitation criteria. In the rural areas waste management has been paid little attention. 13. In 2002, total domestic waste collection was only 55% of the total waste generated. Typical compoistion of domestic waste collected was as follows:
Organic substance
55% Paper, fabric 2%
Soil 7 %Plastic, rubber, leather
3%
Metal 3%Other impurities (ϕ <10mm)
30%
14. Domestic waste management is carried out by the environmental sanitation working groups viz., the Thai Nguyen City’s Urban Environment Management Company. Of the 15 towns in the province 6 towns have environmental sanitation groups that are responsile for collection of domestic waste.15. The current state of the environmental management and living waste collecting in the major urban areas of Thai Nguyen province is described in Table 2.1.
zones, and domestic wastewater dischrages and wastewater from agricultural production.
1.2.3. Air Pollution8. Industrial and traffic air pollution atre chief causes of air pollution in the province. Monitoring stations have been installed at variouys locations in the province. SO2 levels have been found to exceed the permitted standrads by a factor of 1.5 to 3.
1.2.4. Waste Management9. Total quantity of waste generated in 2002 in Thai Nguyen was 243.3 tons/day. Waste collection was about 55% of total waste generated. The quantity of industrial solid waste generated in 2002 was about 1,122,724 tons inckduing an increase in solid waste generated from mineral exploitation activities rising to from 526,323 tons in 2000 to 2,382,800 tons in 2002. Hospital waste in 2002 grew to 1,132 tons a rise by 1.73 times from 2000. Open air landfills is the common form of disposal. Very little recycle is practiced.
1.2.5. Forest Resources10. Forest cover is 42.5% of the total lnad cover of the province. Rate of forest land cover of Thai Nguyen is relatively high but quality of forest is still poor.
1.2.6. Biodiversity11. Biodiversity of Thai Nguyen is diversified and plentiful with 71 wild plant families, 232 varieties and 522 species in which 134 species are precious wood trees, 100 species of medicinal plants. The fauna system has 422 species, 91 families, 28 series and 4 classes of animals. Threat to biodiversity comprises of hunting, illegal forest cutting, leading to loss of habitat.
Indicator - Percent Waste Collected 2001-2002
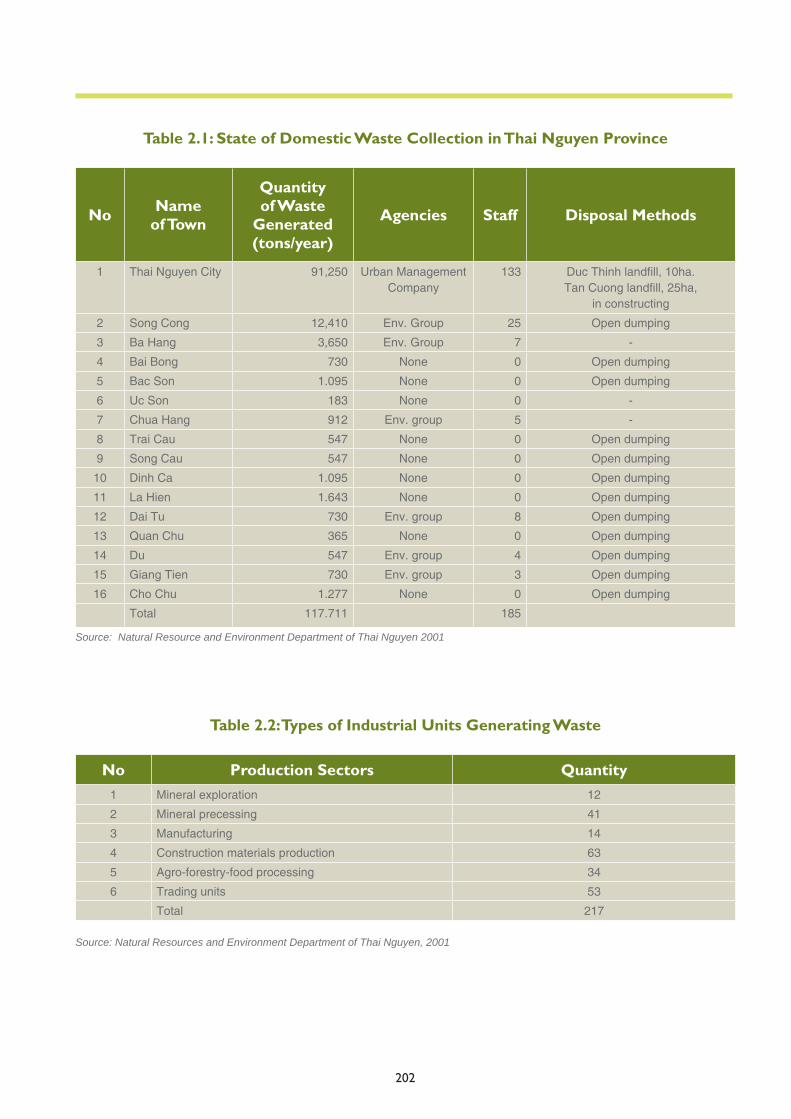
202
Table 2.1: State of Domestic Waste Collection in Thai Nguyen Province
No Name of Town
Quantity of Waste
Generated(tons/year)
Agencies Staff Disposal Methods
1 Thai Nguyen City 91,250 Urban Management Company
133 Duc Thinh landfi ll, 10ha. Tan Cuong landfi ll, 25ha,
in constructing
2 Song Cong 12,410 Env. Group 25 Open dumping
3 Ba Hang 3,650 Env. Group 7 -
4 Bai Bong 730 None 0 Open dumping
5 Bac Son 1.095 None 0 Open dumping
6 Uc Son 183 None 0 -
7 Chua Hang 912 Env. group 5 -
8 Trai Cau 547 None 0 Open dumping
9 Song Cau 547 None 0 Open dumping
10 Dinh Ca 1.095 None 0 Open dumping
11 La Hien 1.643 None 0 Open dumping
12 Dai Tu 730 Env. group 8 Open dumping
13 Quan Chu 365 None 0 Open dumping
14 Du 547 Env. group 4 Open dumping
15 Giang Tien 730 Env. group 3 Open dumping
16 Cho Chu 1.277 None 0 Open dumping
Total 117.711 185
Source: Natural Resource and Environment Department of Thai Nguyen 2001
Table 2.2: Types of Industrial Units Generating Waste
No Production Sectors Quantity1 Mineral exploration 12
2 Mineral precessing 41
3 Manufacturing 14
4 Construction materials production 63
5 Agro-forestry-food processing 34
6 Trading units 53
Total 217
Source: Natural Resources and Environment Department of Thai Nguyen, 2001
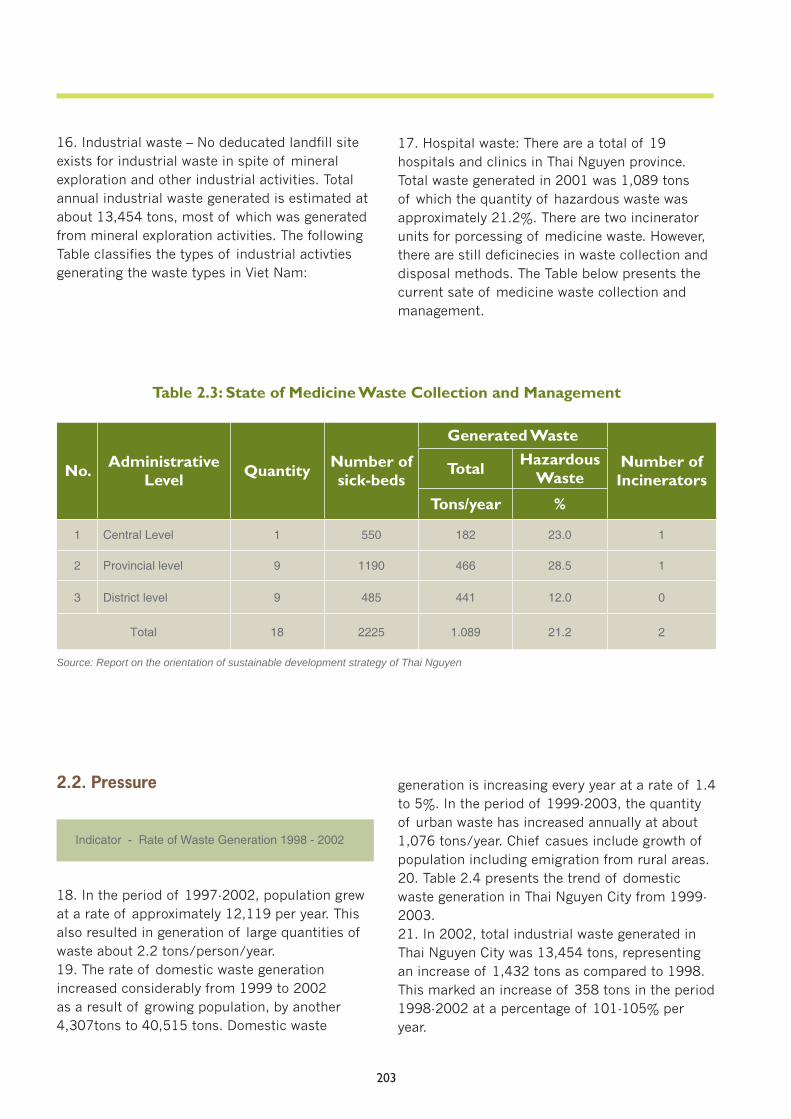
203
16. Industrial waste – No deducated landfill site exists for industrial waste in spite of mineral exploration and other industrial activities. Total annual industrial waste generated is estimated at about 13,454 tons, most of which was generated from mineral exploration activities. The following Table classifies the types of industrial activties generating the waste types in Viet Nam:
Table 2.3: State of Medicine Waste Collection and Management
No. Administrative Level Quantity Number of
sick-beds
Generated Waste
Number of Incinerators
Total Hazardous Waste
Tons/year %
1 Central Level 1 550 182 23.0 1
2 Provincial level 9 1190 466 28.5 1
3 District level 9 485 441 12.0 0
Total 18 2225 1.089 21.2 2
Source: Report on the orientation of sustainable development strategy of Thai Nguyen
2.2. Pressure
Indicator - Rate of Waste Generation 1998 - 2002
18. In the period of 1997-2002, population grew at a rate of approximately 12,119 per year. This also resulted in generation of large quantities of waste about 2.2 tons/person/year.19. The rate of domestic waste generation increased considerably from 1999 to 2002 as a result of growing population, by another 4,307tons to 40,515 tons. Domestic waste
generation is increasing every year at a rate of 1.4 to 5%. In the period of 1999-2003, the quantity of urban waste has increased annually at about 1,076 tons/year. Chief casues include growth of population including emigration from rural areas.20. Table 2.4 presents the trend of domestic waste generation in Thai Nguyen City from 1999-2003.21. In 2002, total industrial waste generated in Thai Nguyen City was 13,454 tons, representing an increase of 1,432 tons as compared to 1998. This marked an increase of 358 tons in the period 1998-2002 at a percentage of 101-105% per year.
17. Hospital waste: There are a total of 19 hospitals and clinics in Thai Nguyen province. Total waste generated in 2001 was 1,089 tons of which the quantity of hazardous waste was approximately 21.2%. There are two incinerator units for porcessing of medicine waste. However, there are still deficinecies in waste collection and disposal methods. The Table below presents the current sate of medicine waste collection and management.
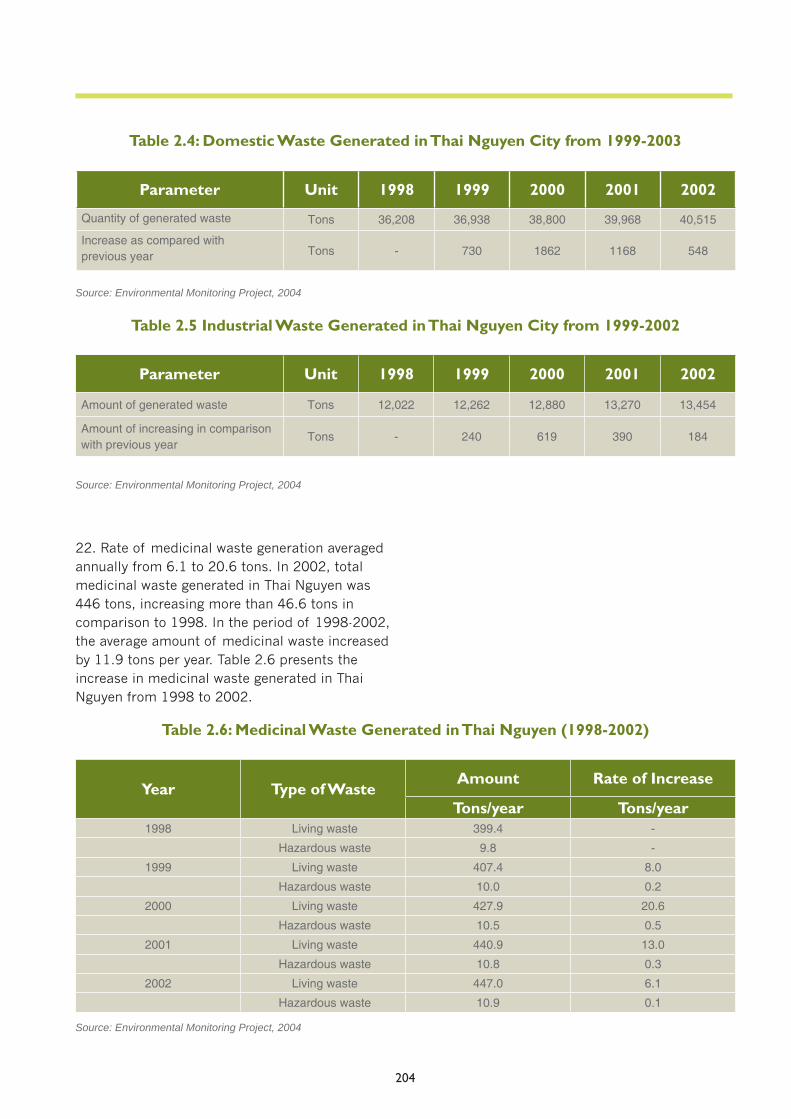
204
Table 2.4: Domestic Waste Generated in Thai Nguyen City from 1999-2003
Parameter Unit 1998 1999 2000 2001 2002
Quantity of generated waste Tons 36,208 36,938 38,800 39,968 40,515
Increase as compared with previous year Tons - 730 1862 1168 548
Source: Environmental Monitoring Project, 2004
Table 2.5 Industrial Waste Generated in Thai Nguyen City from 1999-2002
Parameter Unit 1998 1999 2000 2001 2002
Amount of generated waste Tons 12,022 12,262 12,880 13,270 13,454
Amount of increasing in comparison with previous year
Tons - 240 619 390 184
Source: Environmental Monitoring Project, 2004
22. Rate of medicinal waste generation averaged annually from 6.1 to 20.6 tons. In 2002, total medicinal waste generated in Thai Nguyen was 446 tons, increasing more than 46.6 tons in comparison to 1998. In the period of 1998-2002, the average amount of medicinal waste increased by 11.9 tons per year. Table 2.6 presents the increase in medicinal waste generated in Thai Nguyen from 1998 to 2002.
Table 2.6: Medicinal Waste Generated in Thai Nguyen (1998-2002)
Year Type of WasteAmount Rate of Increase
Tons/year Tons/year1998 Living waste 399.4 -
Hazardous waste 9.8 -
1999 Living waste 407.4 8.0
Hazardous waste 10.0 0.2
2000 Living waste 427.9 20.6
Hazardous waste 10.5 0.5
2001 Living waste 440.9 13.0
Hazardous waste 10.8 0.3
2002 Living waste 447.0 6.1
Hazardous waste 10.9 0.1
Source: Environmental Monitoring Project, 2004
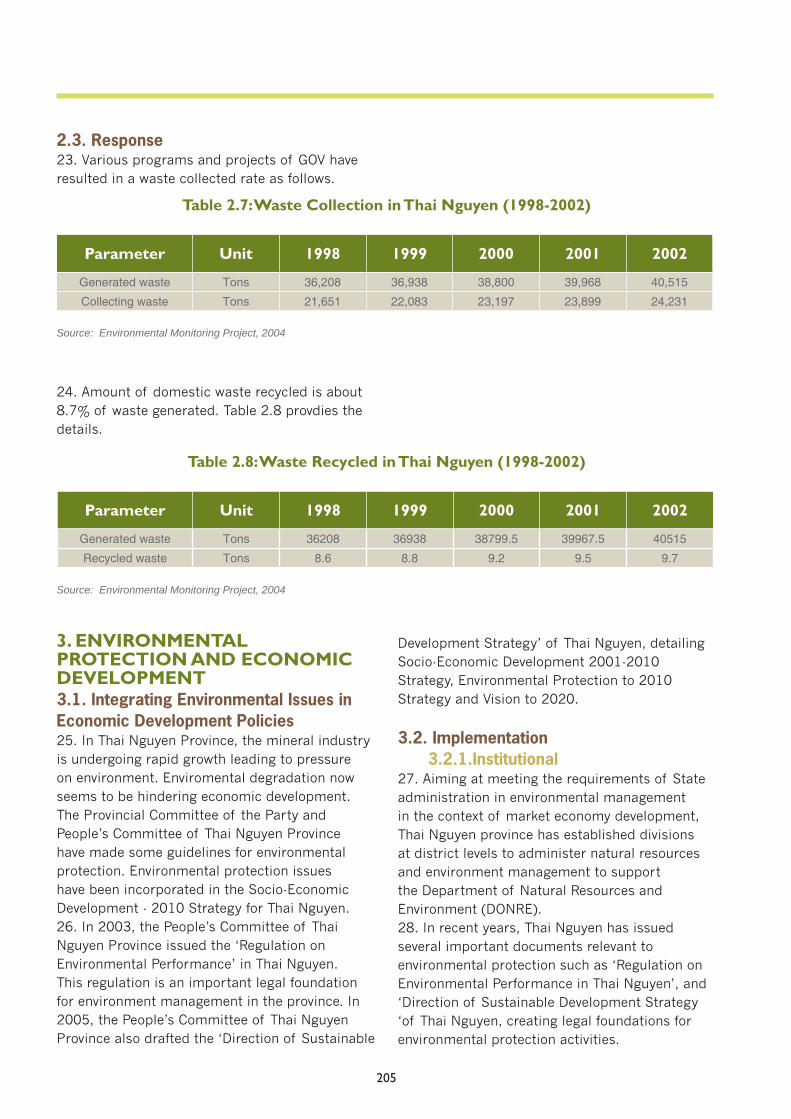
205
2.3. Response23. Various programs and projects of GOV have resulted in a waste collected rate as follows.
Table 2.7: Waste Collection in Thai Nguyen (1998-2002)
Parameter Unit 1998 1999 2000 2001 2002
Generated waste Tons 36,208 36,938 38,800 39,968 40,515
Collecting waste Tons 21,651 22,083 23,197 23,899 24,231
Source: Environmental Monitoring Project, 2004
24. Amount of domestic waste recycled is about 8.7% of waste generated. Table 2.8 provdies the details.
Table 2.8: Waste Recycled in Thai Nguyen (1998-2002)
Parameter Unit 1998 1999 2000 2001 2002
Generated waste Tons 36208 36938 38799.5 39967.5 40515
Recycled waste Tons 8.6 8.8 9.2 9.5 9.7
Source: Environmental Monitoring Project, 2004
3. ENVIRONMENTAL PROTECTION AND ECONOMIC DEVELOPMENT3.1. Integrating Environmental Issues in Economic Development Policies25. In Thai Nguyen Province, the mineral industry is undergoing rapid growth leading to pressure on environment. Enviromental degradation now seems to be hindering economic development. The Provincial Committee of the Party and People’s Committee of Thai Nguyen Province have made some guidelines for environmental protection. Environmental protection issues have been incorporated in the Socio-Economic Development - 2010 Strategy for Thai Nguyen.26. In 2003, the People’s Committee of Thai Nguyen Province issued the ‘Regulation on Environmental Performance’ in Thai Nguyen. This regulation is an important legal foundation for environment management in the province. In 2005, the People’s Committee of Thai Nguyen Province also drafted the ‘Direction of Sustainable
Development Strategy’ of Thai Nguyen, detailing Socio-Economic Development 2001-2010 Strategy, Environmental Protection to 2010 Strategy and Vision to 2020.
3.2. Implementation3.2.1.Institutional
27. Aiming at meeting the requirements of State administration in environmental management in the context of market economy development, Thai Nguyen province has established divisions at district levels to administer natural resources and environment management to support the Department of Natural Resources and Environment (DONRE).28. In recent years, Thai Nguyen has issued several important documents relevant to environmental protection such as ‘Regulation on Environmental Performance in Thai Nguyen’, and ‘Direction of Sustainable Development Strategy ‘of Thai Nguyen, creating legal foundations for environmental protection activities.
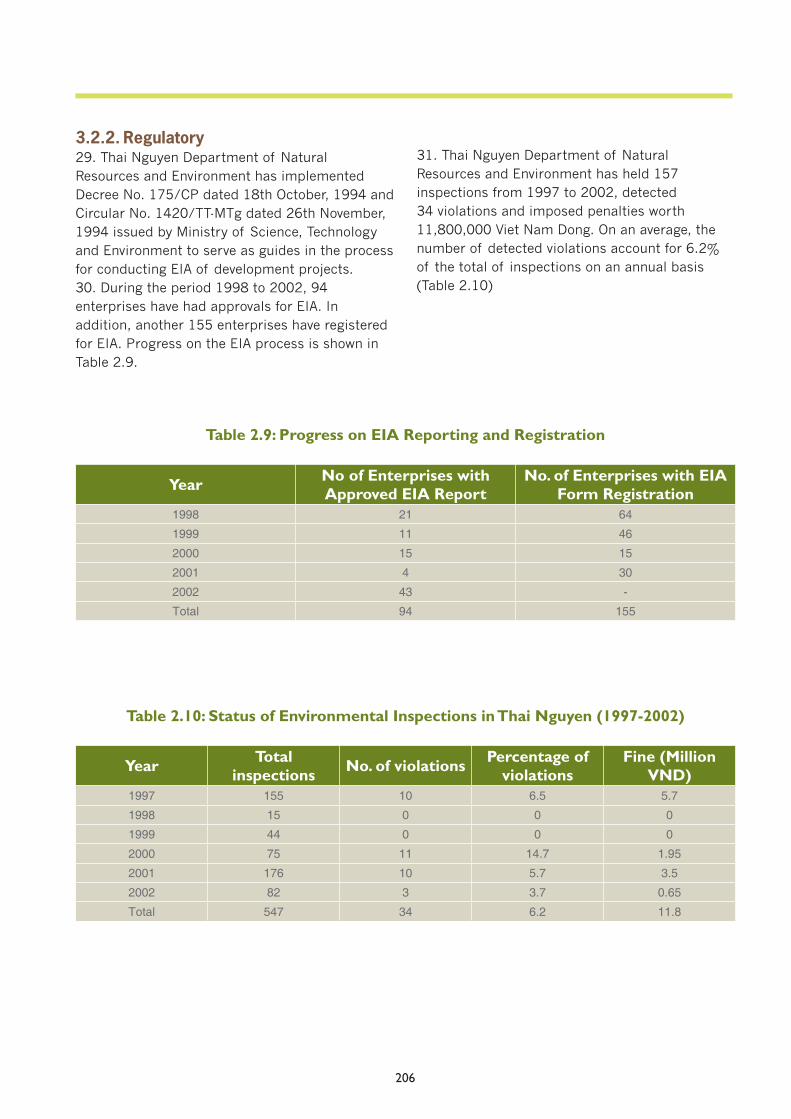
206
3.2.2. Regulatory29. Thai Nguyen Department of Natural Resources and Environment has implemented Decree No. 175/CP dated 18th October, 1994 and Circular No. 1420/TT-MTg dated 26th November, 1994 issued by Ministry of Science, Technology and Environment to serve as guides in the process for conducting EIA of development projects. 30. During the period 1998 to 2002, 94 enterprises have had approvals for EIA. In addition, another 155 enterprises have registered for EIA. Progress on the EIA process is shown in Table 2.9.
Table 2.9: Progress on EIA Reporting and Registration
Year No of Enterprises with Approved EIA Report
No. of Enterprises with EIA Form Registration
1998 21 64
1999 11 46
2000 15 15
2001 4 30
2002 43 -
Total 94 155
31. Thai Nguyen Department of Natural Resources and Environment has held 157 inspections from 1997 to 2002, detected 34 violations and imposed penalties worth 11,800,000 Viet Nam Dong. On an average, the number of detected violations account for 6.2% of the total of inspections on an annual basis (Table 2.10)
Table 2.10: Status of Environmental Inspections in Thai Nguyen (1997-2002)
Year Total inspections No. of violations Percentage of
violationsFine (Million
VND)1997 155 10 6.5 5.7
1998 15 0 0 0
1999 44 0 0 0
2000 75 11 14.7 1.95
2001 176 10 5.7 3.5
2002 82 3 3.7 0.65
Total 547 34 6.2 11.8
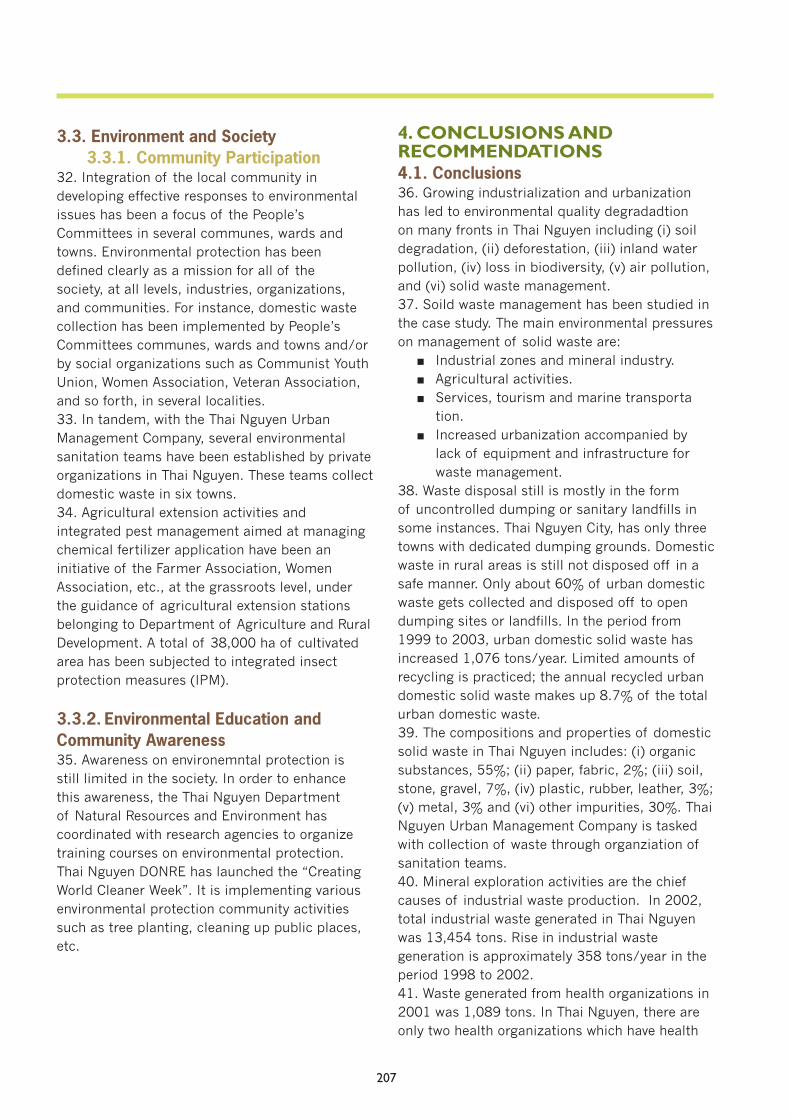
207
3.3. Environment and Society3.3.1. Community Participation
32. Integration of the local community in developing effective responses to environmental issues has been a focus of the People’s Committees in several communes, wards and towns. Environmental protection has been defined clearly as a mission for all of the society, at all levels, industries, organizations, and communities. For instance, domestic waste collection has been implemented by People’s Committees communes, wards and towns and/or by social organizations such as Communist Youth Union, Women Association, Veteran Association, and so forth, in several localities. 33. In tandem, with the Thai Nguyen Urban Management Company, several environmental sanitation teams have been established by private organizations in Thai Nguyen. These teams collect domestic waste in six towns. 34. Agricultural extension activities and integrated pest management aimed at managing chemical fertilizer application have been an initiative of the Farmer Association, Women Association, etc., at the grassroots level, under the guidance of agricultural extension stations belonging to Department of Agriculture and Rural Development. A total of 38,000 ha of cultivated area has been subjected to integrated insect protection measures (IPM).
3.3.2. Environmental Education and Community Awareness35. Awareness on environemntal protection is still limited in the society. In order to enhance this awareness, the Thai Nguyen Department of Natural Resources and Environment has coordinated with research agencies to organize training courses on environmental protection. Thai Nguyen DONRE has launched the “Creating World Cleaner Week”. It is implementing various environmental protection community activities such as tree planting, cleaning up public places, etc.
4. CONCLUSIONS AND RECOMMENDATIONS 4.1. Conclusions36. Growing industrialization and urbanization has led to environmental quality degradadtion on many fronts in Thai Nguyen including (i) soil degradation, (ii) deforestation, (iii) inland water pollution, (iv) loss in biodiversity, (v) air pollution, and (vi) solid waste management. 37. Soild waste management has been studied in the case study. The main environmental pressures on management of solid waste are:
Industrial zones and mineral industry.Agricultural activities.Services, tourism and marine transporta
tion.Increased urbanization accompanied by
lack of equipment and infrastructure for waste management.
38. Waste disposal still is mostly in the form of uncontrolled dumping or sanitary landfills in some instances. Thai Nguyen City, has only three towns with dedicated dumping grounds. Domestic waste in rural areas is still not disposed off in a safe manner. Only about 60% of urban domestic waste gets collected and disposed off to open dumping sites or landfills. In the period from 1999 to 2003, urban domestic solid waste has increased 1,076 tons/year. Limited amounts of recycling is practiced; the annual recycled urban domestic solid waste makes up 8.7% of the total urban domestic waste.39. The compositions and properties of domestic solid waste in Thai Nguyen includes: (i) organic substances, 55%; (ii) paper, fabric, 2%; (iii) soil, stone, gravel, 7%, (iv) plastic, rubber, leather, 3%; (v) metal, 3% and (vi) other impurities, 30%. Thai Nguyen Urban Management Company is tasked with collection of waste through organziation of sanitation teams.40. Mineral exploration activities are the chief causes of industrial waste production. In 2002, total industrial waste generated in Thai Nguyen was 13,454 tons. Rise in industrial waste generation is approximately 358 tons/year in the period 1998 to 2002. 41. Waste generated from health organizations in 2001 was 1,089 tons. In Thai Nguyen, there are only two health organizations which have health
■■■
■
208
waste incinerators, hence, limited facilities exist for management of hospital waste. Medicine waste generation increased at about 11.9 tons/year in the perido 1998 to 2002.
4.2. Recommendation on Institutional Framework42. Currently Thai Nguyen lacks appropriate institutions to effectively manage waste especially at district level. There is a need to strengthen the institutional framework for environmental management with increased staffing, equipment and material support, and budgetary allocation.43. At present there are only four organizations implementing research in environmental field. In order to strengthen environmental management capacity, Thai Nguyen should work towards implementing the recommendations of the circular No. 05/TTLT-BKHCNMT-TCCBCP dated 7th March, 2002 issued by the Ministry of Science, Technology and Environment and Government Official Committee on improvements required in the field of science and technology.44. Attention needs to be paid to training and sharing of environmental information with officials, creating a favorable information base for the officials to approach research methodologies as well as experiences in environmental management in the field.45. Platforms need to be developed creating favorable environment for individuals and communities to work collaboratively in assisting with environmental management initiatives.
4.3. Recommendations on Policy Framework46. Thai Nguyen People’s Committee should integrate environmental protection issues whilst preparing its socioeconmic development policies. Normative documents on environment should be completed, especially the Direction of Sustainable Development Strategy of Thai Nguyen and issued as soon as possible. 47. Soild waste management should be given priority in policy making with appropriate projects and programs on SWM. Incentives for private sector participation in waste treatment and management should also be provided.
48. Budget allocation for scientific research and technological development should be increased. At the same time, environmental fees and charges at various levels under ‘polluter pays principle’ should be set up, aiming to raise fees for environmental protection activities.49. Data management needs to be improved for environmental information in the province, information that is readily available in a user-friendly format for the industry, scientific reserach institutions and community at large.50. Communication on environmental protection through mass media at central and local levels should be strengthened to enhance people’s awareness on environmental issues. Besides that, environmental education should be introduced at primary and secondary schools.
References 1. Current situation of Thai Nguyen
Environment Report, 2004, Thai Nguyen Department of Natural Resources and Environment
2. Implementation of Socio-economic Development Plan 2004 and Direction and Missions in 2005 Report, Thai Nguyen People’s Committee
3. Draft of Direction of Sustainable Development Strategy of Thai Nguyen, 2005
4. Statistics Annual Publication 2003, General Department of Statistics
5. Statistics Annual Publication of Thai Nguyen 2003, Thai Nguyen Department of Statistics
6. Environmental Monitoring 2004 Project


![DISRUPTING HARM IN VIET NAM [SNAPSHOT]](https://img.dokumen.tips/doc/110x75/633d3ea7f990b5c206060214/disrupting-harm-in-viet-nam-snapshot.jpg)


![[xaydung360.vn]TRA THEP-NAM VIET](https://img.dokumen.tips/doc/110x75/63544355faec9f0e5f047a42/xaydung360vntra-thep-nam-viet.jpg)


