Embed Size (px)
Citation preview

Author version of paper published as: Carroll, Steven, Goonetilleke, Ashantha and Dawes, Les (2004) Framework for soil suitability evaluation for sewage effluent renovation. Environmental Geology 46(2): pp. 195-208 Copyright 2004 Springer-Verlag
FRAMEWORK FOR SOIL SUITABILITY EVALUATION FOR
SEWAGE EFFLUENT RENOVATION
STEVEN CARROLL, ASHANTHA GOONETILLEKE AND LES DAWES
School of Civil Engineering, Queensland University of Technology
1

Abstract Current methods of establishing suitable locations for onsite wastewater
treatment systems (OWTS) are inadequate, particularly in light of the numerous cases
of onsite system failure and the resulting adverse consequences. The development of a
soil suitability framework for assessing soil suitability for OWTS allows a more
practical means of assessment. The use of multivariate statistical analysis techniques,
including Principal Component Analysis (PCA) and multi-criteria decision aids of
PROMETHEE and GAIA, enabled the identification suitable soils for effluent
renovation. The outcome of the multivariate analysis, together with soil permeability
and drainage characteristics permitted the establishment of a framework for assessing
soil suitability based on three main soil functions: (1) the ability of the soil to provide
suitable effluent renovation, (2) the permeability of the soil, and (3) the soil’s
drainage characteristics. The developed framework was subsequently applied to the
research area, Gold Coast, Queensland, Australia, and the use of standard scoring
functions were utilised to provide a scoring system to signify which soils were more
suitable for effluent renovation processes. From the assessment, it was found that
Chromosol and Kurosol soils provided the highest level of effluent renovation, closely
followed by Ferrosol and Dermosol, Kandosol and Rudosol soil types. Tenosol and
Podosol soil types were found to have a significantly lower suitability, with Hydrosol
soils proving the least suitable for renovating effluent from OWTS.
Keywords: Effluent renovation, Onsite wastewater treatment, Risk, Soil suitability,
Queensland, Australia
Introduction
The poor performance of onsite wastewater treatment systems (OWTS) is common
and is of significant concern to regulatory authorities worldwide (Siegrist and others
2000). The consequences of exposure to inadequately treated effluent from onsite
systems include serious environmental and public health impacts (Cliver 2000, Gold
and Sims 2000). Approximately 17% of Australian households are currently serviced
by OWTS (O’Keefe 2001), with the most common form being the septic tank-
2

subsurface soil adsorption systems. Similar trends are evident in the United States
with over 25% of the population utilising onsite systems (Seigrist 2001). A typical
septic tank treatment system is depicted in Figure 1. The septic tank itself only
provides primary treatment of wastewater, with the final treatment and ultimate
disposal performed by the subsurface disposal trenches and surrounding soil.
Therefore the satisfactory performance of onsite wastewater treatment systems, in
particular septic systems, depends mainly on the underlying soil to renovate or
suitably remove or absorb effluent pollutants, and transmit the discharged effluent.
Though other forms of effluent disposal, such as mounds and evapotranspiration
systems are becoming more popular, subsurface disposal trenches remain the most
widely used approach. Additionally, even though secondary treatment systems, such
as aerobic wastewater treatment systems (AWTS) are becoming increasingly
common, septic tanks far outnumber them.
Septic tank
Distribution
Gravel or crushed rock
Effluent disposal
Unexcavated Effluent disposal
Figure 1 Typical setup of an onsite septic tank-soil adsorption system commonly adopted in Australia
Contamination of the surrounding environment due to poor OWTS performance is not
a recent issue. Numerous cases of contamination of groundwater and surface water
have been reported over the years (for example Hagedorn and others 1981; Harris
1995; Hoxley and Dudding 1994). Similarly, from a public health perspective,
numerous incidents of disease outbreaks have been traced back to poor treatment
performance of these systems (Cliver 2000). This is compounded by the fact that large
clusters of onsite systems will inevitably increase the severity of contamination
3

(Hampton and Yahner 1984; Paul and others 1997; Yates 1985). Due to the widely
recognised environmental and public health issues resulting from poor OWTS
performance, performance based standards and guidelines are commonly adopted for
system siting, design and management. Unfortunately, these performance based
standards do not necessarily achieve their intended objectives for two primary
reasons. Firstly, the influence of soil and site factors in effluent treatment are not
completely understood (Dawes and Goonetilleke 2003). Secondly, most standards and
codes commonly focus on individual systems, with little regard to the impact of
clustering of systems (US EPA 1997).
In determining site suitability for OWTS, understanding the soil’s ability to accept,
treat and dispose of discharged effluent is crucial. Due to its heterogeneous nature, the
assessment of a single soil parameter cannot provide a comprehensive overview of its
suitability for a particular purpose (Diack and Stott 2001). As an example, the simple
soil permeability test traditionally used as a means of assessment for effluent disposal,
will indicate the soil’s ability to absorb effluent, but will not show if the effluent will
undergo sufficient treatment prior to percolating into the groundwater. Therefore there
is a crucial need for more scientifically rigorous procedure for assessing soil
suitability for sewage effluent renovation through the removal of important pollutants.
The primary focus of the research undertaken was to develop methodology based on
physico-chemical data to evaluate the sewage effluent renovation ability of different
soil types. Multivariate analysis to define soil capability rankings, together with
permeability and drainage classifications were employed to develop a suitability
framework to assess three specific soil functions: (1) the ability of the soil to provide
suitable effluent renovation, (2) the permeability of the soil, and (3) the soil’s
drainage characteristics. Ranking of soil data is widely used for assessing soil quality
for agricultural purposes. As examples Diack and Stott (2001) and Karlen and others
(1994) have discussed methods for assessing soil quality and developing soil quality
indices. However, there has been very limited research undertaken on providing a
method for ranking soil suitability for effluent renovation. Khalil and others (2004)
have undertaken research in assessing soil suitability based on physico-chemical data
utilising multi-criteria decision aids for a number of sites in Southeast Queensland.
4

However, ranking was established for site locations rather than for soil type, which is
the main focus of this research.
Materials and methods
Project area
The project area encompassed the Gold Coast region, in Southeast of Queensland
State, Australia, covering approximately 1500 km2. The region currently has over
15,000 onsite wastewater treatment systems with a majority of them being
conventional septic tank-soil absorption systems. Large clusters of OWTS exist in
various locations, and their cumulative effect has become a major concern for the
region’s local government. This region is a major tourist destination, with significant
ecosystems such as, World Heritage sites, important water resources and Ramsar
wetland sites. Additionally, the region is one of the most rapidly urbanising areas in
Australia. Due to the escalating cost of infrastructure, onsite systems are the most
economical and accepted means of wastewater treatment within these areas. However,
the current performance of onsite systems throughout the study area is a concern. The
majority of onsite systems throughout the study area are low technology septic
systems. Several areas which have high failure rates due to inadequate soil conditions
and have subsequently moved away from subsurface disposal systems in favour of
more advance treatment systems such as AWTS have been identified by the local
authority.
Soil sample collection
The Gold Coast region has a variety of soil and landscape characteristics, ranging
from flat sandy coastal plains to steep mountainous terrain. The soil types throughout
the region were classified according to the Australian Soil Classification (Isbell 1996).
Soil descriptions for the fourteen soil types under the Australian Soil Classification
are described in Table 1. Soil classifications developed through the Soil Taxonomy
Order classification (NRCS 1999) are provided for comparison.
5

Physico-chemical data used for establishing the suitability of soil for effluent
renovation was collected from 28 sampling sites within the project area and
supplemented with data already available. Sampling sites were selected based on
areas that rated poorly in relation to the three specific criteria: (1) soil drainage, (2)
planning conditions related to minimum lot size specified in the Town Plan and (3)
environmental sensitivity or proximity to environmentally sensitive ecosystems such
as waterways, reservoirs and wetlands. Soil samples were collected from the B
horizon to a maximum depth of 1200 mm from each of the sampling sites. This was to
ensure the samples would be representative of the ‘zone of influence’ of a typical
subsurface treatment field. As subsurface disposal trenches are typically installed at a
depth of approximately 450 mm, the soil most predominant in renovating effluent is
the B horizon. Samples were obtained by hand auger, and approximately one
kilogram of the representative soil was collected, mixed thoroughly to obtain
homogeneous samples and sealed in marked plastic bags for transport back to the
laboratory.
6

Table 1: Soil definitions of soils classified under the Australian Soil Classification (Isbell 1996)
Australian Soil Classification
Connotation
Equivalent Soil Taxonomy Order
(NRCS 1999) Anthroposols ‘man-made’
soils Soils resulting from human activities, causing a profound modification to the soil material
Calcarosols calcareous throughout
Soils that are calcareous throughout the solum – or at least directly below the A1 horizon or to a depth of 0.2m if the A1 horizon is weakly developed.
Aridisols or Alfisols
Chromosols often brightly coloured
Soils with a clear and abrupt textural B horizon (abrupt increase in clay content) in which the major part1 of the upper 0.2m of the B2 horizon is strongly acidic.
Alfisols
Dermosols often with clay skins or ped faces
Soils with B2 horizon that have more developed structure than weak throughout major part1 of horizon Utisols
Ferrosols high iron content
Soils with B2 horizon in which the major part1 has free iron oxide content >5% Fe in fine earth fraction (<2mm). Oxisols
Hydrosols wet (saturated) soils
Soils that are saturated in the major part1 of the solum for at least 2-3months in most years (including tidal waters)
Ultisols or Inceptisols
Kandosols Soils that have, well developed B2 horizons in which major part1 is massive or has weak grade of structure and have a maximum clay content in B2 which exceeds 15%.
Alfisols or Ultisols2
Kurosols extremely acidic soils
Soils with a clear or abrupt textural B horizon and in which the major part of B2 horizon is strongly acidic
Alfisols or Ultisols2
Organosols dominated by organic material
Soils that have more than upper 0.4m of organic material within upper 0.8m or have organic materials extending from surface to a minimum depth of 0.1m that either directly overly rock, weathered rock or hard layers , in which the interstices are filled or partially filled with organic material.
Histols
Podosols podzols Soils that have Bs, Bhs or Bh horizons. Spodosols
Rudosols rudimentary soil development
Soils with negligible (rudimentary) pedilogical organisation apart form minimum development of A1 horizon or presence of less than 10% of B horizon material in fissures in parent rock. Soil is only weakly developed in A1 horizon with little or no texture or colour change with depth.
Entisols
Sodosols sodic soils Soils with clear or abrupt textural B horizon in which major part1 of upper 0.2m of B2 horizon is sodic (ESP >6%) and is not strongly sub-plastic.
Alfisols
Tenosols weakly developed soils
Soils with generally weak pedologic organisation apart from A horizon
Inceptisols or Entisols
Vertosols shrink-swell clays
Soils that have a clay texture or 35% more clay throughout solum except for thin surface crusty horizons and, unless too moist, have open cracks at some time in most years that are at least 5mm wide. Slickensides and/or lenticular peds are identifiable at some depth.
Vertisols
1 ‘Major part’ – requirement must be met over more than half the specified thickness. 2 Classification is dependent upon the quantities of base cations
Soil analysis
Soil samples were tested for pH, electrical conductivity (EC), chloride concentration
(Cl-), cation exchange capacity (CEC), organic content (%OC) and particle size
distribution (percent sand (%S) and percent clay (%C)). The soil parameter selection
was based on the suite of tests generally carried out in land resource evaluation
(Rayment and Higginson 1992). These tests have been developed through extensive
agricultural research and are designed to distinguish between deficient, adequate and
toxic availability of elements in soil and between degraded and non-degraded soil
conditions. Additionally, the CEC/Clay ratio (CCR) (Shaw and others 1998) was
7

calculated from the derived parameters. CCR provides an indication of the type of
clay present in the soil sample. Ratios < 0.2 represent kaolinite clays 0.3-0.5 indicate
illite clays and >0.8 indicate smectite clays. Values in between represent clays of
mixed mineralogy. Soil permeability and drainage characteristics, assessed using soil
particle size analysis and soil texture characteristics, were also assessed for each soil
sample. Although both describe a means by which water and effluent moves through
soil, permeability and drainage are two different characteristics that must be
addressed. For example, a soil having a high permeability may also possess poor
drainage, particularly in the case of hydrosols (permanently saturated soils). Similarly,
a soil with low permeability may have good drainage, depending on its location in the
soil catena.
The soil parameters selected for analysis also provided an indication of a soil’s ability
to provide suitable renovation of applied effluent, particularly in relation to the
removal of nutrients and pathogenic organisms. pH, EC and Cl- are good indicators of
effluent movement through the soil matrix. Typically, for soils in South East
Queensland, an increase in these parameters are generally observed where effluent has
been applied, thereby allowing the extent of effluent movement to be traced through
the soil. CEC and %OM are both influential in determining soil renovation ability.
Higher levels of both parameters can appreciably influence the renovation process
(Khalil and others 2004). In most soils, a higher amount of organic matter can
significantly increase the CEC. However, CEC is also dependent on the CEC/Clay
ratio and the amount of clay present in the soil, which in turn can affect the drainage
and permeability of the soil. As an example, smectite clays provide higher CEC
values, but due to their shrink/swell characteristics they have very low permeability
values.
The soil samples were air dried and ground to < 2mm. Parameters such as pH, EC, Cl-
and %OC were determined using the methods outlined by Rayment and Higginson
(1992). pH and EC were measured from a 1:5 soil:water suspension using a combined
pH/Conductivity meter. Chloride concentration (Cl-) was analysed by the ferric
thiocyanate colourmetric method (APHA 1999). Cation Exchange Capacity was
determined by the method outlined in Borden and Giese (2001), where all available
exchange sites are saturated with exchangeable ammonia and measured using the
8

ammonia selective electrode method. This included the available exchange sites
contained in the soil particles and the organic material. This is important as organics
provide significant adsorption and cation exchange ability in addition to the soil
particles, which therefore produces higher CEC levels. In fact, the CEC value of most
soils is highly influenced by the organic content, and high CEC values (>100 meq 100
g-1) are more likely resultant from the influence of the organics rather than the amount
or type of clay. Organosol soils are a typical example of this. Organic content (%OC)
was determined by the Walkey-Black method with the soil organic matter first
oxidised using 30% hydrogen peroxide and combusted at 1300˚C. Particle size
distribution (for %C and %S) was determined using a Malvern Mastersizer S particle
size analyser. CCR was calculated by dividing the CEC value by the %C (Shaw and
others 1998). As soil permeability (K) data was not available for most of the soil types
investigated, it was assessed based on the formula developed by Krumbien and Monk
(1943). This method calculates permeability from predetermined values of a soil’s
particle size distribution. Soil drainage classifications for the soil samples were
established using soil textural and particle size distribution data. This information was
used to classify the soil into appropriate drainage classifications as outlined by
(McDonald and others 1998).
Soil suitability framework
The results of the assessment of the soil’s ability for effluent renovation, together with
permeability and drainage characteristics, were integrated into a framework to assess
a site’s suitability for locating an onsite wastewater treatment system. To develop the
soil suitability framework, due consideration was given to the physical and chemical
characteristics of the various soil types. Multivariate data analysis including Principal
Component Analysis (PCA) and multi-criteria decision-making techniques of
PROMETHEE and GAIA, were used to evaluate the physico-chemical data of
collected soil samples. The resulting rankings, coupled with the permeability and
drainage characteristics, were used to establish the appropriate suitability rankings.
These ranking were determined by utilising standard scoring functions (SSF) based on
‘more is better’, ‘less is better’, or optimum functions as described by Karlen and
others (1994).
9
Data analysis
Soil data extracted from the resulting soil information consisted of 98 soil samples,
including the variables of %C, K, pH, EC, Cl-, CEC and CCR and %OC. A Principal
Component Analysis (PCA) was conducted on the data sets to determine which soil
types were highly correlated with each other and the selected variables. PCA was
performed using MATLAB 6.5 Release 13 (The Mathworks Inc 2002). The results
from the PCA analysis were used to structure the preference functions and threshold
information for use with the multi-criteria decision-aid methods of PROMETHEE and
GAIA, using Decision Lab 2000 v1.01 (Visual Decision Inc. 1999).
Principal Component Analysis
PCA is a multivariate statistical data analysis technique which reduces a set of raw
data into a number of principal components which retain the most variance within the
original data to identify possible patterns or clusters between objects and variables.
Detailed descriptions of PCA can be found elsewhere (Massart and others 1988,
Adams 1995; Kokot and others 1998), and therefore will not be discussed in detail in
this paper. PCA has been used extensively for various applications related to soil
characteristics or soil quality. As examples, Carlon and others (2001) used PCA and
Kriging techniques for the analysis of data in performing a risk-based characterisation
of soil at a contaminated industrial site. Vance and others (2003) used PCA to help in
classifying soil samples based on exchangeable sodium percentage and spontaneous
or mechanical dispersion.
All raw data used in the PCA analysis was subjected to pre-treatment to remove or
reduce extraneous sources of variation or ‘noise’ which may interfere in the analysis
(Adams 1995). Firstly, the raw data was log transformed to reduce data heterogeneity.
Following this, the transformed data was column-centered (column-means subtracted
from each element in their respective columns) and standardised (individual column
values divided by the column standard deviations). PCA was undertaken on the
transformed data to identify possible patterns or clusters. Correlations between
10

selected variables were also obtained allowing identification of the most important
parameters that should be considered when deciding site suitability for onsite
wastewater treatment.
PROMETHEE and GAIA
PROMETHEE and GAIA are multivariate decision aids that rank actions according to
specific criteria and thresholds. The details of PROMETHEE and GAIA are described
elsewhere (Visual Decision Inc. 1999; Keller and others 1991), and therefore only a
brief summary of the methods is provided here. The PROMETHEE method uses a
pair-wise comparison system in which each action (soil sample) is compared to all
other actions one-by-one defined by the preference functions, with thresholds and
weights adopted by the decision-maker (Visual Decision Inc. 1999). PROMETHEE
establishes preference flows (Φ) for each action and ranks these based on the
preference flows. Partial ranking (PROMETHEE I) utilises the Φ+ and Φ- preference
flows for ranking the actions. The positive flow, Φ+, determines the degree to which
each soil sample is preferred over other samples, with higher positive values receiving
a higher rank. The negative flow Φ- determines the degree to which other soil samples
are preferred over a particular sample. However, if samples have conflicting flows or
preferences, they are considered incomparable in the PROMETHEE I ranking (Visual
Decision Inc. 1999). The net flow Φ (Φ = Φ+ - Φ-), also called the Pi score, represents
the complete ranking (PROMETHEE II) of samples, with higher flow values ranked
more highly. Both PROMETHEE I and II rankings were analysed to establish which
soils were more suitable for effluent renovation.
GAIA provides a diagrammatic representation of the ranking methods of
PROMETHEE, utilising a PCA technique. PCA is applied to the net preference flows
(Φ), and a biplot or GAIA plane, of the first two PCs is developed. Although no initial
pre-treatment of data is needed to be undertaken, the preference functions established
by PROMETHEE act to normalise the data, thereby providing some pre-treatment of
the initial data. An additional feature of the GAIA plane is the incorporation of the Pi
decision axis. The orientation of the Pi axis emphasises which criteria and actions are
more dominant in the analysis (Visual Decision Inc. 1999).
11

To obtain suitable rankings for the soil data, specific preference functions and
threshold values need to be selected and identified for the analysis. Six different
preference functions are available in Decision Lab 2000 software. However, only the
v-shape and linear functions, as depicted in Figure 2 were found suitable for the
envisaged analysis. Both functions depend on two preference thresholds, an
indifference threshold Q, and preference threshold P. The Q threshold represents the
largest deviation considered as negligible (preference of 0) by the decision-maker.
The P threshold, on the other hand provides the smallest deviation considered as
decisive (preference of 1) (Visual Decision Inc. 1999). Table 2 depicts the variables
and the selected preference functions and thresholds used in the two analyses. For EC,
Cl- and CEC, a v-shape function was used as these variables only required a simple
linear ranking system, with higher values generally receiving a preference of 1. For
EC and Cl-, however, rankings were minimised for the analysis as lower values for
these parameters were considered more suitable. This was based on the fact that
higher EC and Cl- values in natural soil conditions would function poorly under
effluent application rather than soils with lower levels. Preference thresholds P, for
these variables were determined by subtracting the smallest data value from a
maximum threshold value considered as providing the highest level of performance.
As an example, a CEC value greater than 100 meq 100 g-1 was considered as
extremely high, and therefore a value larger than this was given a preference of 1.
%C, pH, %OC and CCR were ranked based on linear preference functions with upper
(P) and lower (Q) thresholds for these variables selected as described in Table 2. P
thresholds where established by the same means as for the v-shape functions. The Q
threshold, however, was taken as an appropriate level at which any difference below
the threshold was considered as negligible. As an example, a difference of 10% for
%C was considered as negligible, and therefore received a preference of 0. Finally, all
criteria were equally weighted to remove any bias towards a particular variable over
the remaining variables.
12

Figure 2 Preference Functions used for multivariate analysis (Visual Decision Inc,
1999) Table 2: Preference Functions, threshold values and general statistics used in PROMETHEE analysis
In the case of permeability, values used for the required preference thresholds were
focused specifically on the adsorption processes of the soil, with lower permeability
values considered more suitable by allowing more time for cation exchange processes
to take place (Hartmann and others 1998), and therefore a better renovation ability is
achieved. However, for a soil to renovate effluent, the effluent must be able to
percolate through the soil at a satisfactory rate, while still providing suitable time for
adsorption processes to occur. Therefore, values higher than 1m/day or lower than
0.001m/day were considered unsuitable for effluent renovation. The preference
thresholds, P and Q were set to ensure that K values exceeding these levels would
receive a preference of 0 while the remaining values in between these thresholds
would be ranked with higher values considered more suitable.
%C k pH EC Cl- CEC OC% CCR Function linear linear linear v-shape v-shape v-shape linear linear Min/Max Max Min Min Min Min Max Max Max P 50 1 3 1000 500 100 50 5 Q 10 0.001 0.1 1 1 1 10 0.2 Unit % m/day uS/cm mg/Kg meq/100g % Weight 1 1 1 1 1 1 1 1
V-Shape
0
1
Deviation
Pref
eren
ce D
egre
e
Linear
0
1
Deviation
Pref
eren
ce D
egre
e
13

Results and Discussion
PCA, PROMETHEE and GAIA
PCA was conducted using the variables of %C, K, pH, EC, Cl-, CEC and CCR and
%OC. Although %OC was initially included in the multivariate analysis, it was later
removed due to an analytical bias towards Organosol soil. Organosols by nature have
significantly high organic content, and as such the Organosol samples were observed
to retain most, if not all of the data variance associated with %OC in the initial
analysis. Therefore, to allow a more unbiased analysis between the Organosols and
the other parameters, %OC was removed. The PCA of the physico-chemical data set
resulted in 77.4% of the data variance being contained in the first three components.
Therefore, the first three PC’s were retained. This was based on the Scree test (Cattell
1966) which confirmed that the first three PC’s were significant as depicted in Figure
3, with the remaining components considered to only contribute ‘noise’ to the overall
data variance. Figure 4 provides a scores, loadings and biplot of the PCA analysis.
The scores plot provides a graphical representation of clusters of soils with similar
physico-chemical properties. The respective loadings or ‘weights’, and loadings plot
of the analysed soils provide an indication of the correlations between the different
variables. Table 3 gives the PC loadings for the seven variables. From these loadings,
the correlations between specific variables can be identified, and this is shown
graphically in the loadings plot in Figure 4b. Vectors situated closely together
represent variables that are highly correlated while orthogonal vectors represent
variables that are uncorrelated.
14

Significant PC’s Insignificant components (noise) or scree
Figure 3: Scree Plot for determining significant number components for PCA
analysis
The PCA analysis produced some typical results in relation to the correlations
between the variables and soil classifications. As shown in Figure 4a and 4c, the soils
with higher clay content retained positive scores on PC1, with sandier soils falling
directly opposite. Soils that retained a high CEC value fell positively on PC2,
consistent with the samples retaining higher EC and Cl- values. The permeability K,
of the soil is shown to be closely correlated with the %S negatively correlated with
%C. This is not surprising as the chlorides and other cations will adsorb to
exchangeable sites, increasing the level of exchangeable ions contained in the soil.
With high levels of salt ions in the soil (in this case chloride ions), it is evident that
the EC level will also increase.
15

Fig 4a
-4
-2
0
2
4
-4
-2
0
2
4
-4
-2
0
2
4
PC1 (37.9 %)
BrF1 BrF2 RKu1
RF3 RF1
BrD1
BS2
RS1 BS1
GS2 BKu4
BrD2
RF2
GS1
BrD5
SH2
BrD4 BrD3
GCh5
RK4
LR2
GKu1
RF5 HO1 RV2
BCh10YK1
YKu1
RCh3 YK8
RK5
BKu5
RK6
RF4
LR1
GKu3 BCh4 BCh1
RCh1
BCh12
RK1
IH1
GCh1
CR1 RK3 YK6 BCh2
YCh4
HR2
BKu1
BCh3 GCh4
BKu3
RCh4
RV1
YCh6 YCh1
BrKu1
RH1
BCh9
BrCh1
RK2 YK9 BrK2
YCh3
YK11
YK7
GD1 LR3
YK10
RCh2
YK4 YCh5
SP1
HR1
GCh2
YCh8
YK3
BCh8
BCh11
SH1
GKu2
BCh6
YCh7
YK5
GCh3 RK7 YK2
SP2
BCh7 BCh5
YCh2
B-LT1
BrCh2
CT3
LT1
PC2 (25 %)
B-OT1
B-OT2
PC
3 (
14.5
%)
-0.6
-0.3
0
0.3
0.6
-0.6
-0.3
0
0.3
0.6-0.6
-0.3
0
0.3
0.6
PC1 (37.9 %)
k %S
pH
CCR
Cl
EC
CEC
%C
PC2 (25 %)
PC
3 (
14.5
%)
(4)
(1)
(5)
(2) (3)
Fig. 4b
16

-0.6
-0.3
0
0.3
0.6
-0.6
-0.3
0
0.3
0.6-0.4
-0.2
0
0.2
0.4
0.6
PC1 (37.9 %)
%C
BCh6
GCh3
RV1 YCh3 RF5
BrCh1YK11 BKu3
RF4
YCh7
YCh2
RK2
YCh8
GCh2
RCh4
BrK2
BCh11
BCh12BCh8
YCh4
BCh5
GCh4
BCh7
GD1
BKu5
RV2
BrCh2
YK9
BCh2 BrD3 BCh1 LR3 YCh1
BCh10
YK4 BCh3 BCh9
GCh5 BrKu1RF1 RCh3
GS1
YCh5 YK3
RS1
B-OT2
BS2
YK6
BKu1 BKu4
BCh4
GS2
GKu2
GKu3
YK2 YK7
YK10
BrD4 BrF1 RF3 RF2
BrD2
BrF2
BS1
YK8 YK5 RK3 BrD1 RCh1 BrD5 RKu1 HO1 RK1
B-OT1
YKu1 RK4 CT3
GKu1
GCh1 B-LT1
pH
RK5 YCh6
YK1 RCh2
RH1 CR1
LR1
RK6
IH1 SP2 LR2
LT1 SP1
SH2
RK7
HR1
Cl
HR2
%S
SH1
k
EC
PC2 (25 %)
CEC
CCR
PC
3 (
14.5
%)
objectsvariables
Fig 4c
Figure 4: Results of PCA analysis for derived soil data; a) Scores plot of soil samples showing developed clusters, b) Loadings plot of analysed variables, and c) Biplot of PC1 versus PC2. Legend: (#) Developed Soil Clusters Notation: Final letter in soil notation refers to greater soil group as follows: (F) Ferrosol; (D) Dermosol; (S) Sodosol; (Ch) Chromosol; (K) Kandosol; (Ku) Kurosol; (R) Rudosol; (T) Tenosol; (P) Podosol; (H) Hydrosol; (O) Organosol; (V) Vertosol.
The PC loadings highlighted in Table 3 (shown in bold), shows that PC1 is closely
associated with the soil physical parameters of %S, %C, K, and to a lesser extent pH,
although %C is negatively correlated with these variables. The second component
PC2 however, is more closely associated with the chemical parameters of EC, Cl-,
CEC and CCR. The resulting biplot (Fig 4c) shows the relationship between particular
soil types and the variables analysed. Appropriately, %S is highly correlated with the
Tenosol group, as they possess the highest content of sand. Likewise, %C is
correlated with the Ferrosol, Dermosol, Vertosol, Sodosol groups. CCR is shown to
be highly correlated with the Hydrosol and Podosol groups. This is mainly due to
these soils having average CEC values and very low clay percentages, which in turn
provides large CCR values for these soils. However, as CCR is related to the clay
type, it is possible that the small percentage of clay contained in the Podosol and
17

Hydrosol soils are smectite-type clays which do have higher adsorption ability and
will therefore produce a higher CEC value. However, it would be more likely that
these soils retain a mixed clay mineralogy consisting of smectites and kaolinite clays.
Table 3: PC loadings from principal component analysis Variable PC1 PC2 PC3
%S 0.4932 -0.1107 -0.0253
%C -0.5493 0.0040 -0.0017
K 0.5493 -0.0475 -0.0470
pH 0.1743 -0.0249 -0.5215
EC -0.0374 0.4728 -0.3701
Cl- -0.0670 0.3389 -0.6170
CEC -0.0704 0.6195 0.3495 CCR 0.3345 0.5123 0.2919
The major outcome derived from the PCA analysis in relation to soil ability to
renovate effluent are the clusters developed between soils that retain similar
properties and characteristics, as depicted in the scores plot in Figure 4a. Major soil
clusters developed through the PCA analysis include: (1) Ferrosols, Dermosols and
Sodosols, (2) Chromosols and Vertosols, (3) Kandosols, Kurosols and Rudosols, (4)
Hydrosols and Podosols and (5) Tenosols. The Kandosol and Kurosol soils, however,
are widely scattered, having a much higher variance on PC2 than other soils. This is
primarily related to the varying content of clay generally present in these soils. The
organosol soil is closely related to the Kandosols, but as the %OC was not removed in
this analysis; the other physical and chemical characteristics associated with the soils
indicated that the organosol was similar to the Kandosol soil group. However, due to
the high CEC value of the organosol soil as a result of its high organic content, it is
shown to be highly correlated with CEC. The Chromosol soil group (cluster (4)) is
highly variable on PC2. This is related to the varying CEC levels and %C typically
common to this soil type. Chromosol soils are essentially identified by abrupt changes
in the amount of clay through the soil profile. The small grouping of Chromosol soils
on the bottom of the scores plot represents the Chromosol soils with very low CEC
values. Correlations between specific soil clusters and the variables can also be
identified in the biplot. CEC, EC and Cl- are highly correlated with clusters (1) and
18

(4), although the %C, which is highly correlated with clusters (1) and (2), does reduce
the correlation of CEC with these clusters to a minor extent.
From the PROMETHEE analysis, patterns or clusters in the ranking were identified,
and to a lesser extent these followed similar patterns as obtained through the PCA
analysis, although some minor variations were obvious. Variables that were found to
be correlated through the PCA analysis and utilised for the PROMETHEE analysis
also provided similar correlations. However, some differences are obvious, and these
are related to the preference functions and threshold values adopted. As an example,
permeability is shown to be highly correlated with %C, as it was minimised to
account for the fact that lesser permeable soils are considered to provide higher
renovation ability than very highly permeable soils. Therefore, from the ranking of the
soil data, specific soil types can be seen to function more appropriately in terms of
effluent renovation than others. Table 4 provides the partial and complete rankings
determined from the preference flows produced from the PROMETHEE analysis.
From the PROMETHEE II complete ranking (Φnet), and PROMETHEE I partial
ranking (Φ+ and Φ-), specific clusters of soils are shown to be more highly ranked
than others. Although the PROMETHEE II complete ranking provides a rank for each
soil sample, the partial ranking determined via PROMETHEE I provided more
beneficial results by highlighting clusters of soils that are similarly ranked as well as
soils which are considered not comparable with other soils.
The GAIA plot shown in Figure 5 provides a graphical representation of the various
clusters formed through the data analysis. The Pi axis shown in the GAIA plane
represents the direction of the more highly ranked soils, and therefore more suitable
soils for effluent renovation. Ferrosol and Dermosol soils are the most highly ranked,
and therefore they cluster closely towards the Pi axis. In contrast, the Tenosol group
clearly clusters in the opposite direction. The soil clusters identified through the
PROMETHEE analysis in order of their preference are as follows: (1) Ferrosols and
Dermosols; (2) Chromosols; (3) Kandosols, Kurosols and Rudosols; (4) Organosols;
(5) Vertosols and Sodosols; (6) Podosols and Tenosols; and (7) Hydrosols.
19
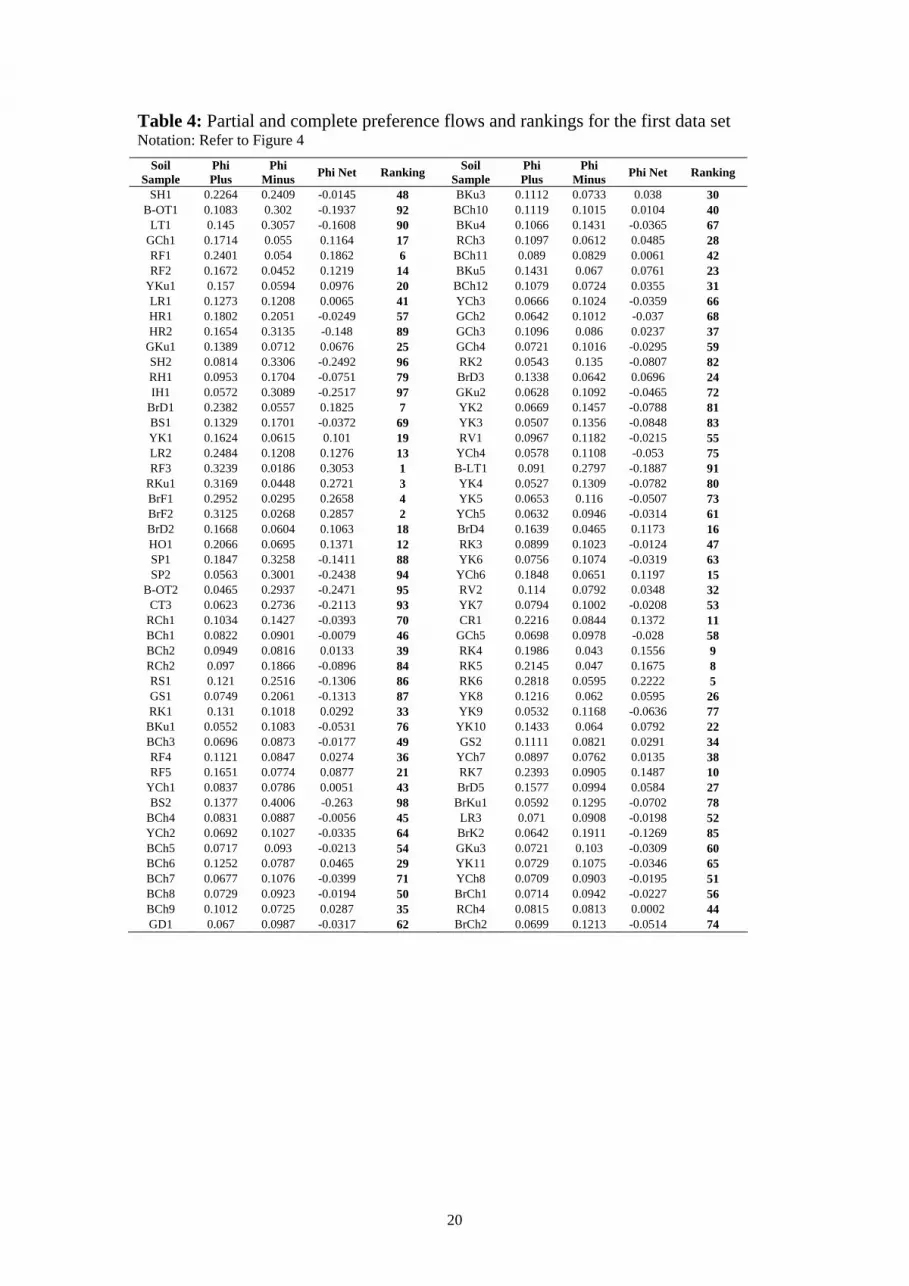
Table 4: Partial and complete preference flows and rankings for the first data set Notation: Refer to Figure 4
Soil Sample
Phi Plus
Phi Minus Phi Net Ranking Soil
Sample Phi Plus
Phi Minus Phi Net Ranking
SH1 0.2264 0.2409 -0.0145 48 BKu3 0.1112 0.0733 0.038 30 B-OT1 0.1083 0.302 -0.1937 92 BCh10 0.1119 0.1015 0.0104 40
LT1 0.145 0.3057 -0.1608 90 BKu4 0.1066 0.1431 -0.0365 67 GCh1 0.1714 0.055 0.1164 17 RCh3 0.1097 0.0612 0.0485 28 RF1 0.2401 0.054 0.1862 6 BCh11 0.089 0.0829 0.0061 42 RF2 0.1672 0.0452 0.1219 14 BKu5 0.1431 0.067 0.0761 23
YKu1 0.157 0.0594 0.0976 20 BCh12 0.1079 0.0724 0.0355 31 LR1 0.1273 0.1208 0.0065 41 YCh3 0.0666 0.1024 -0.0359 66 HR1 0.1802 0.2051 -0.0249 57 GCh2 0.0642 0.1012 -0.037 68 HR2 0.1654 0.3135 -0.148 89 GCh3 0.1096 0.086 0.0237 37
GKu1 0.1389 0.0712 0.0676 25 GCh4 0.0721 0.1016 -0.0295 59 SH2 0.0814 0.3306 -0.2492 96 RK2 0.0543 0.135 -0.0807 82 RH1 0.0953 0.1704 -0.0751 79 BrD3 0.1338 0.0642 0.0696 24 IH1 0.0572 0.3089 -0.2517 97 GKu2 0.0628 0.1092 -0.0465 72
BrD1 0.2382 0.0557 0.1825 7 YK2 0.0669 0.1457 -0.0788 81 BS1 0.1329 0.1701 -0.0372 69 YK3 0.0507 0.1356 -0.0848 83 YK1 0.1624 0.0615 0.101 19 RV1 0.0967 0.1182 -0.0215 55 LR2 0.2484 0.1208 0.1276 13 YCh4 0.0578 0.1108 -0.053 75 RF3 0.3239 0.0186 0.3053 1 B-LT1 0.091 0.2797 -0.1887 91
RKu1 0.3169 0.0448 0.2721 3 YK4 0.0527 0.1309 -0.0782 80 BrF1 0.2952 0.0295 0.2658 4 YK5 0.0653 0.116 -0.0507 73 BrF2 0.3125 0.0268 0.2857 2 YCh5 0.0632 0.0946 -0.0314 61 BrD2 0.1668 0.0604 0.1063 18 BrD4 0.1639 0.0465 0.1173 16 HO1 0.2066 0.0695 0.1371 12 RK3 0.0899 0.1023 -0.0124 47 SP1 0.1847 0.3258 -0.1411 88 YK6 0.0756 0.1074 -0.0319 63 SP2 0.0563 0.3001 -0.2438 94 YCh6 0.1848 0.0651 0.1197 15
B-OT2 0.0465 0.2937 -0.2471 95 RV2 0.114 0.0792 0.0348 32 CT3 0.0623 0.2736 -0.2113 93 YK7 0.0794 0.1002 -0.0208 53
RCh1 0.1034 0.1427 -0.0393 70 CR1 0.2216 0.0844 0.1372 11 BCh1 0.0822 0.0901 -0.0079 46 GCh5 0.0698 0.0978 -0.028 58 BCh2 0.0949 0.0816 0.0133 39 RK4 0.1986 0.043 0.1556 9 RCh2 0.097 0.1866 -0.0896 84 RK5 0.2145 0.047 0.1675 8 RS1 0.121 0.2516 -0.1306 86 RK6 0.2818 0.0595 0.2222 5 GS1 0.0749 0.2061 -0.1313 87 YK8 0.1216 0.062 0.0595 26 RK1 0.131 0.1018 0.0292 33 YK9 0.0532 0.1168 -0.0636 77 BKu1 0.0552 0.1083 -0.0531 76 YK10 0.1433 0.064 0.0792 22 BCh3 0.0696 0.0873 -0.0177 49 GS2 0.1111 0.0821 0.0291 34 RF4 0.1121 0.0847 0.0274 36 YCh7 0.0897 0.0762 0.0135 38 RF5 0.1651 0.0774 0.0877 21 RK7 0.2393 0.0905 0.1487 10
YCh1 0.0837 0.0786 0.0051 43 BrD5 0.1577 0.0994 0.0584 27 BS2 0.1377 0.4006 -0.263 98 BrKu1 0.0592 0.1295 -0.0702 78
BCh4 0.0831 0.0887 -0.0056 45 LR3 0.071 0.0908 -0.0198 52 YCh2 0.0692 0.1027 -0.0335 64 BrK2 0.0642 0.1911 -0.1269 85 BCh5 0.0717 0.093 -0.0213 54 GKu3 0.0721 0.103 -0.0309 60 BCh6 0.1252 0.0787 0.0465 29 YK11 0.0729 0.1075 -0.0346 65 BCh7 0.0677 0.1076 -0.0399 71 YCh8 0.0709 0.0903 -0.0195 51 BCh8 0.0729 0.0923 -0.0194 50 BrCh1 0.0714 0.0942 -0.0227 56 BCh9 0.1012 0.0725 0.0287 35 RCh4 0.0815 0.0813 0.0002 44 GD1 0.067 0.0987 -0.0317 62 BrCh2 0.0699 0.1213 -0.0514 74
20

Decision Stick Pi
(7)
(6)(2)
(4)
(1)
(3)
(5)
Figure 5: GAIA plot of PROMETHEE analysis highlighting seven major soil
clusters. Legend: ( ) Soil Samples; ( ) Analysed variables; (#) Developed soil
clusters; For soil notation refer to Figure 4
As the results of the PCA and PROMETHEE analysis provided similar patterns, a
ranking outlining which soil types perform best in regard to effluent renovation was
consequently established. From the multivariate analysis, Ferrosol and Dermosol soils
provided the most evidence of suitability for locating OWTS due to their high
renovation ability. This relates to their high CEC values and clay content, which
typically consist of smectite type clays (CCR >0.8) (Baker and Eldershaw 1993)
which are suitable by providing greater cation exchange and therefore contaminant
adsorption characteristics. As such, the suitability of a soil for renovating effluent is
mostly dependent on the CEC, which in turn relies on the type of clay (represented by
the CCR factor) as well as the organic content. This is shown through the PCA
analysis where CEC and %OC are highly correlated, with both showing some
correlation with the CCR value.
21

However, care must be taken in considering soil which retains high organics, such as
Organosols, as high levels of organic content can be water repulsive, thus reducing
the drainage ability (Harper and others 2000; Ferreira and others 2000). Chromosol
soils provide the next most significant ranking, due to the amount of clay available.
Kandosol, Kurosol and Rudosol soils also ranked quite high, although their
distribution on both PC1 and PC2 are fairly scattered. However, in assessing these
soils, the %C needs to be determined as these soils can have varying amounts of clay,
as shown by the large distribution around the %C variable. The most significant of
these soils, however, are the Kurosols. Kurosols are typically acidic soils, and
therefore have significant characteristics in relation to soils renovation ability. Due to
the lower soil pH arising from the acidic conditions, Kurosols can provide higher
CEC values as a result of the increase in aluminium and iron content (Edwards 1985).
This will largely depend on the percentage of clay in the soil, and those with higher
percentages will be more suitable. Podosol and Tenosol soils ranked significantly
lower than the other soils due to the relatively higher percentage of sand and
permeability rates. Therefore, these soils will act more like filters, filtering out larger
suspended matter, with the least ability for high levels of adsorption of mobile
effluent pollutants. Lastly, Hydrosol soils ranked lower than all other soil types. This
results from the permanent or seasonally saturated soil conditions typical of
Hydrosols. This not only increases the risk of contamination from OWTS, but also
increases desorption of already adsorbed pollutants.
Permeability and drainage
To classify permeability K, average values for each specific soil classification were
adopted as a generalised value to establish an initial suitability level for each soil. As
permeability is not only strongly related to soil characteristics, but also to site
conditions, it is difficult to provide a specific range of values for particular soil types.
Variations in soil conditions, such as cracks and animal burrows, soil depth and large
pores can significantly influence permeability, making it difficult to predict accurate
K values from one site to another. Table 5 presents the general statistics and
characteristics used for the permeability for each soil type based on available data.
Soil drainage classifications used for assessing soil suitability were adopted from
22

McDonald and others (1998). These were established for the respective soil
classifications based on soil texture and particle size distribution data.
Table 5: General statistic for permeability (K) classifications
Soil Type K mean m/day
K St. Dev. m/day
K max m/day
K min m/day
Ferrosol 8.386E-04 2.202E-03 7.980E-03 1.596E-05 Dermosol 1.339E-04 1.617E-04 5.229E-04 1.894E-05 Chromosol 4.495E-02 1.677E-01 1.322E+00 5.724E-05 Kandosol 8.782E-02 5.638E-01 3.870E+00 4.775E-05 Kurosol 4.061E-02 1.929E-01 1.059E+00 1.498E-05 Rudosol 1.066E-01 2.314E-01 7.861E-01 1.211E-03 Organosol 3.706E-04 3.161E-04 5.941E-04 1.471E-04 Sodosol 2.028E-03 5.766E-03 1.839E-02 2.620E-05 Vertosol 8.426E-05 6.538E-05 1.819E-04 4.405E-05 Podosol 1.046E+00 7.186E-01 2.037E+00 2.020E-02 Tenosol 4.819E+00 1.340E+00 5.905E+00 2.141E+00 Hydrosol 4.745E-01 7.098E-01 2.261E+00 3.868E-03
Soil suitability ranking
The established classifications for effluent renovation ability, permeability and
drainage formed the basis for developing the framework for determining the degree of
suitability of specific soils for sewage effluent renovation. The framework process has
been developed such that once the necessary information required is determined, the
suitability can be established by the use of standard scoring systems as described by
Karlen and others (1994). Figure 6 illustrates the framework developed. For the
different types of soil in the study region, a less is better function was adopted, where
each value is divided by the highest possible value such that the highest value will
receive a score of 1 (Andrews and others 2002). Similarly, a less is better scoring
function was adopted for the scoring of typical drainage characteristics according to
soil type. However, for permeability, the optimum function was adopted. This was in
view of the fact that lower soil permeability will provide better effluent renovation
processes than very highly permeable soils as more time is available for contact with
soil particles and therefore enhanced opportunities for cation exchanges to take place
(Hartmann and others 1998). Higher K values on the other hand, only allow sufficient
time for fast surface exchange processes to occur, resulting in reduced ability for
effluent renovation.
23

Soil Type Ability Criteria Ferrosol Dermosol 1 Soils with a high renovation ability due to high CEC values and clay
contents.
Chromosol 2 Soils with a good renovation ability due to medium CEC values. Percentage clay must be determined, as these soils can have highly variable percentages, with abrupt increases through the profile. Chromosol soils with small clay percentages will provide less renovation ability due to lower CEC, and may fall into lower categories.
Kandosol Kurosol Rudosol 3
Soils with medium renovation ability, generally due to slightly higher sand contents, but still retain a suitable CEC. Care must be taken with Rudosol soils to ensure there is adequate soil depth to provide sufficient renovation ability.
Organosol 4 Soils with high renovation ability, primarily due to organic content. However, high levels of organic material can repel water, lowering the drainage, and therefore renovation ability. Nutrient levels are also commonly high due to the organic material
Sodosol Vertosol 5 Soils with low renovation ability due to the sodic conditions causing soil dispersion (Sodosol) or extremely high plastic shrink/swell clays (Vertosol) that result in poor permeability and drainage ability.
Podosol Tenosol 6 Soils with poor renovation ability due to low CEC values and clay contents. Typically coarse grained sandy soils that have good drainage and permeability, resulting in poor exchange processes with effluent constituents.
Hydrosol 7 Soils with very poor renovation ability, with low CEC and clay content. Renovation ability is severely worsened due to shallow groundwater.
Permeability Suitability Criteria
Very Slow Ks < 0.005 m/day 3
Permeability of water vertically through soil horizon very slow. Usually a clay or silty clay texture. Very poorly suited for effluent renovation as water can not percolate through soil, therefore not providing adequate exchange ability between soil and discharged effluent.
Slow Ks = 0.005-0.05 m/day
1
Permeability of water is slow with vertical percolation taking a week or more to dissipate. Soil structure usually massive or moderate grade, with a clay or silty clay texture. Soil provide a moderate renovation ability, increasing as the permeability increases as a better exchange capacity (CEC) is available as water move more easily through soil. As such, higher permeability’s (up to 0.05m/day) will provide more suitable conditions for effluent renovation.
Moderate Ks = 0.05-0.5 m/day
2
Permeability of water is moderate only required a number of days to dissipate through the soil profile. Soil has a moderate structure with visible pores and channels. Soil permeability is suitable for effluent renovation, providing suitable time for exchange processes to occur reducing the amount of mobile contaminants. However, ability reduces as permeability increases, as higher permeability’s will provide only surface exchange sites as water passes more quickly, and not inter-aggregate sites.
High Ks > 0.5 m/day 3
Permeability of soil is high, requiring a few hours to allow water to permeate through the profile. Soil texture is usually sandy, with visible pores and cracks. Soil effluent renovation ability is significantly reduced as the permeability increases.
Drainage Suitability Criteria
Rapid 1 Water is drained rapidly, with water moving rapidly to underlying highly permeable material. Soils are coarse textured, or shallow or both. Soil only remains wet for several hours.
Well 2 Water is readily, but not rapidly drained from the soil. Excess water flows vertically with much resistance into underlying moderately permeable material. Soils have a medium texture and remain wet only for several days.
Moderate 3 Drainage of water is moderate, due to a low permeability, lack of gradient or a shallow water table, or a combination of these. Soil are typically coarse-textured and remain wet for approximately only one week
Imperfect 4 Water is drained only slowly, with soils remaining wet for several weeks. Soils may be mottled or possess rusty appearance.
Poor 5 Water is drained very slowly in relation to the supply. Soil horizons may be gleyed, mottled or possess rusty appearances. Soil remains wet for periods of months.
Very Poor 6 Drainage of water is so slow, that water table remains at or near the surface for most of the year.
Overall Soil Suitability for Effluent Renovation
24

Figure 6 Established framework for soil suitability for effluent renovation
The overall soil suitability scoring for the different soils types in the study area are
outlined in Table 6. From these results, Chromosol and Kurosol soils were found to be
more suitable for effluent renovation than the Ferrosol and Dermosol soils. However,
there was only a minor difference in suitability between the first six soil types,
following which a sharp decrease in overall renovation ability was evident. Hydrosol
and Vertosol soils were found to provide the worst overall suitability for effluent
renovation.
Table 6: Soil Suitability Rankings for Effluent Renovation
Soil Classification Soil Suitability Description Chromosols Kurosols 1 Good renovation ability with medium
permeability and well drained soils. Ferrosols Dermosols 2 Good renovation ability with poor to
medium permeability and well drained soil
Kandosols Rudosols 3
Medium renovation ability with medium to high permeability and moderately well drained soil
Podosols Tenosols 4
Low - medium renovation ability with high permeability and poor to moderately well drained soil
Organosols 5 Very good renovation ability with slow permeability and poorly drained soil
Vertosols Sodosols 6 Good renovation ability with slow to
medium permeability and poorly drained soil
Hydrosols 7 Low renovation ability with rapid permeability in permanently saturated conditions.
The most important aspect highlighted by the soil suitability framework is that a
soil’s ability to both renovate and adequately dispose of discharge effluent is
dependent on a number of factors that all need to be considered together.
Consequently, along with the soil’s ability for effluent renovation, both permeability
and drainage characteristics are also highly significant in determining soil suitability.
The permeability values used for assessing soil suitability in the study region with the
developed framework considers both rapid and very slowly permeable soils least
suitable in renovating wastewater. Accordingly, values higher than 1m/day and lower
than 0.001m/day were considered unsuitable and received a zero score. The optimum
value which was taken as the median value of the range between the extremes was
25

given a score of 1, with all other values scored on either a more is better or less is
better scenario. Both soil suitability and drainage were assessed using the more is
better scoring function.
Although the Ferrosol and Dermosol soils were found to be the most capable for
effluent renovation, their overall suitability can significantly reduce according to their
permeability and drainage classifications. Likewise, for the Chromosol soils, although
their renovation ability is slightly less, their overall rating was found to be more
suitable than all the other soils. These findings agree with research undertaken by
Dawes and Goonetilleke (2003) where it was found that Ferrosol, Dermosol and
Chromosol soils provided better treatment of effluent in relation to pollutant
attenuation and removal. However, care must be taken with Chromosol soils due to
the abrupt textural changes common of this soil type. Soils with high %C can create a
restrictive horizon, subsequently reducing infiltration through the soil causing effluent
to move laterally. Soils with a restrictive horizon less than 0.4m from the surface do
not provide adequate purification of effluent (Dawes and Goonetilleke 2003). This in
essence, underlies the need to ensure adequate assessment of the underlying soil
conditions before identifying a site as suitable for an OWTS.
Conclusions
The ranking of the various soil types provided a means of assessment of ability for
effluent renovation. These rankings, coupled with permeability and drainage soil
factors, have been employed to develop a soil suitability framework for siting and
designing OWTS. The use of PCA and the multi-criteria decision aids PROMETHEE
and GAIA, has enabled correlations between different soil types to be assessed and
therefore allowing clusters of soils with similar physico-chemical characteristics to be
identified. It is evident from the multivariate statistical analysis that a strong
correlation exists between CEC, %C and %OC, which are the primary parameters
shown to influence the effluent renovation ability of a soil. The permeability
characteristics of different soil types are also significant, as this influences not only
how rapidly the discharged effluent percolates through the soil matrix, but also has an
important role in the cation exchange and adsorption processes. Likewise, adequate
26

drainage is required for the soil to function as an effluent renovation media. From the
developed framework, it was found that although Ferrosol and Dermosol soils have
the highest renovation ability, the permeability and drainage characteristics reduced
their overall suitability. Chromosol soils were found to have the best overall
renovation ability, followed closely by the Ferrosol and Dermosol soils, and the
Kurosol, Kandosol and Rudosol soils. The sandy soils were found to have the least
ability, with Hydrosols having the least overall renovation ability. However, from the
assessment of the three major soil functions in relation to effluent renovation
suitability; (1) soil effluent renovation ability, (2) permeability and (3) drainage
characteristics, it can be concluded that these characteristics play a major role in the
overall suitability rankings. It is necessary for the assessment of site suitability to
consider the effects of these primary soil functions, and not predict the soils suitability
based on a single soil function.
Acknowledgements
The authors would like to thank Gold Coast City Council and Queensland University
of Technology for funding this research project.
References
Adams MJ (1995) Chemometrics in analytical spectroscopy. Springer Verlag, New
York
Andrews SS, Karlen DL, Mitchell JP (2002) A comparison of soil quality indexing
methods for vegetable production systems in North California. Agriculture
Ecosystems and Environment, 90: 25-45
APHA (1999) Standard methods for the examination of water and wastewater - 20th
Edition. American Public Health Association, American Water Works Association
and Water Environment Federation, Washington, DC
Baker DE, Eldershaw VJ (1993) Interpreting soil analyses - for agricultural land use
in Queensland. Division of Land Use and Fisheries, Department of Primary
Industries, Brisbane
Borden D, Giese RF (2001) Baseline studies of the clay minerals society source clays:
cation exchange capacity measurements by the ammonia-electrode method. Clays
and Clay Minerals, 49:(5) 444-45
27

Carlon C, Critto A, Marcomini A, Nathanail P (2001) Risk-based characterisation of
contaminated industrial site using multivariate and geostatistical tools.
Environmental Pollution, 111: 417-27
Cattell RB (1966) The scree test for the number of factors. Multivariate Behavioral
Research, 1: 245-76
Cliver DO (2000) Research needs in decentralised wastewater treatment and
management: fate and transport of pathogens. In: National Research Needs
Conference Proceedings: Risk-Based Decision Making for Onsite Wastewater
Treatment. EPRI, Palo Alto, CA, U.S. Environmental Protection Agency, National
Decentralized Water Resources Capacity Development Project, 1001446, pp. 1-31
Dawes L, Goonetilleke A (2003) An Investigation into the role of site and soil
characteristics in onsite sewage treatment. Environmental Geology, 44:(4) 467-77
Diack M, Stott DE (2001) Development of a soil quality index for the Chalmers silty
clay loam from midwest USA. In: Stott DE, Mohtar RH, Steinhardt GC (eds) 10th
International Soil Conservation Organisation Meeting, May 24-29 1999, Purdue
University, USDA-ARS National Soil Erosion Research Laboratory, pp. 550-55
Edwards DG (1985) Diagnosing toxicity, In: Identification of Soils and Interpretation
of Soil Data. ASSSI Qld Branch, Brisbane
Ferreira AJD, Coelho COA, Walsh RPD, Shakesby RA, Ceballos A, Doerr SH (2000)
Hydrological implications of soil water-repellency in eucalyptus globulus forests,
North-Central Portugal. Journal of Hydrology, 231-232: 165-77
Gold AJ, Sims JT (2000) Research needs in decentralized wastewater treatment and
management: a risk-based approach to nutrient contamination. In: National
Research Needs Conference Proceedings: Risk-Based Decision Making for Onsite
Wastewater Treatment. EPRI, Palo Alto, CA, U.S. Environmental Protection
Agency, National Decentralized Water Resources Capacity Development Project,
1001446, pp. 1-43
Hagedorn C, McCoy EL, Rahe TM (1981) The potential for ground water
contamination from septic tanks. Journal of Environmental Quality, 10:(1) 1-8
Hampton MJ, Yahner JE (1984) Cluster systems in a rural lake community. In:
Proceedings of the Fourth National Symposium on Individual and Small
Community Sewerage Systems, New Orleans, Louisiana, American Society of
Agricultural Engineers, pp. 165-68
28

Harper RJ, McKissock I, Gilkes RJ, Carter DJ, Blackwell PS (2000) A multivariate
framework for interpreting the effects of soil properties, soil management and
landuse on water repellency. Journal of Hydrology, 231-232: 371-83
Harris PJ (1995) Water quality impacts from on-site waste disposal systems to coastal
areas through groundwater discharge. Environmental Geology, 26:262-68
Hartmann A, Gräsle W, Horn R (1998) Cation exchange processes in structured soils
at various hydraulic properties. Soil and Tillage Research, 47: 67-72
Hoxley G, Dudding M (1994) Groundwater contamination by septic tank effluent:
two case studies in Victoria, Australia. In: Proceedings of the Conference Water
Down Under '94, Adelaide, Australia, pp. 145-52
Isbell RF (1996) The Australian Soil Classification. CSIRO Publishing, Collingwood,
Victoria, Australia
Karlen DL, Wollenhaupt NC, Erbach DC, Berry EC, Swan JB, Eash NS, Johdahl, JL
(1994) Crop residue effect on soil quality following 10-years of no-till corn. Soil
and Tillage Research, 31: 149-67
Keller HR, Massart DL, Brands JP (1991) Multicriteria decision making: a case study.
Chemometrics and Intelligent Laboratory Systems, 11: 175-89
Khalil WA, Goonetilleke A, Kokot S, Carroll S (2004) Use of chemometric methods
and multicriteria decision-making for site selection for sustainable on-site sewage
effluent disposal. Analytical Chimica Acta, 504: (1) 41-56
Kokot S, Grigg M, Panayiotou H, Dong Phuong T (1998) Data interpretation by some
common chemometrics methods. Electroanalysis, 10:(16) 1081-88
Krumbein WC, Monk GD (1943) Permeability as a function of the size parameters of
unconsolidated sand. Transaction of the American Institute of Mining,
Metallurgical and Petroleum Engineers, 151: 153-63
Massart DL, Vandeginste BGM, Deming SM, Michotte Y, Kaufman L (1988)
Chemometrics - a text book. Elsevier, Amsterdam
McDonald RC, Isbell RF, Speight JG, Walker J, Hopkins, MS (1998) Australian soil
and land survey - field handbook, 2nd Edition. Canberra, Australia
NRCS (1999) Soil taxonomy: a basic system of soil classification for making and
interpreting soil surveys - 2nd edition. Agriculture Handbook No.436, United
States Department of Agriculture, Natural Resources Conservation Service,
Washington, DC
29

O'Keefe N (2001) Accreditation of on-site wastewater treatment systems - installation
and maintenance personnel. In: Patterson RA, Jones MJ (eds), Proceedings of On-
Site '01 Conference: Advancing On-Site Wastewater Systems, Armidale, Lanfax
Laboratories, pp. 295-99
Paul JH, Rose JB, Jiang SC, Zhou X, Cochran P, Kellogg C, Kang JB, Griffin D,
Farrah SA, Lukasik J (1997) evidence for groundwater and surface marine water
contamination by waste disposal wells in the Florida Keys. Water Research, 31:(6)
1448-54
Rayment GE, Higginson FR (1992) Australian laboratory handbook of soil and water
chemical methods - Australian soil and land survey handbook. Inkata Press,
Sydney
Shaw RJ, Coughlan KJ, Bell LC (1998) Root zone sodicity, In: Summer ME, Naidu R
(eds), Sodic Soils: Distribution, Properties, Management and Environment
Consequences., Oxford University Press, New York
Siegrist RL (2001) Advancing the science and engineering of onsite wastewater
systems. Onsite Wastewater Treatment. In: Mancl K (ed) Proceedings of the Ninth
National Symposium on Individual and Small Community Sewage Systems, St
Josephs, MI, ASAE, pp. 1-10
Siegrist RL, Tyler EJ, Jenssen PD (2000) Design and performance of onsite
wastewater treatment soil adsorption systems. In: National Research Needs
Conference Proceedings: Risk-Based Decision Making for Onsite Wastewater
Treatment. EPRI, Palo Alto, CA, U.S. Environmental Protection Agency, National
Decentralized Water Resources Capacity Development Project, 1001446, pp. 1-48
The MathWorks Inc. (2002) MATLAB Ver6.5 Release 13, The MathWorks, Natick,
MA
US EPA (1997) Response to Congress on use of decentralized wastewater treatment
systems. United States Environmental Protection Agency, EPA 832-R-97-001b
Vance WH, McKenzie BM, Tisdall, JM (2003) The stability of soils used for
cropping in Northern Victoria and Southern New South Wales. Australian Journal
of Soil Research, 40:(4) 615-24
Visual Decision Inc. (1999) Decision Lab 2000 Executive Edition, Visual Decision
Inc., Montreal, Quebec, Canada
Yates MV, (1985) Septic tank density and ground-water contamination. Ground
Water, 31:(6) 884-89
30


